RESEARCH INCOME FOR BUSINESS AND MANAGEMENT: Analysis of HEIDI data 2010/2011-2013/2014 March 2016

Welcome message from author
This document is posted to help you gain knowledge. Please leave a comment to let me know what you think about it! Share it to your friends and learn new things together.
Transcript

RESEARCH INCOME FOR BUSINESS AND MANAGEMENT:
Analysis of HEIDI data 2010/2011-2013/2014 March 2016

1
Table of Contents Introduction………………………………………………………………………………………………………………………………….2
Total Research Income by source (UK, EU, Overseas): 2010/2011 to 2013/2014 ............................... 4
Comparison with other subject areas.................................................................................................. 10
Total Research Income by Regions ...................................................................................................... 12
Business Schools by Research Income ................................................................................................ 16
Research Income by Mission Group .................................................................................................... 19
Disclaimer: While Chartered ABS strives to make the information in this report as accurate as possible, the Chartered ABS makes no claims, or guarantees about the accuracy or completeness of the data obtained from HEIDI.

2
Introduction Over 130 British business schools currently educate over 380,000 students, and employ over 14,000 staff to do so. Over one in every four (27%) of social scientists in the UK are in the field of Business and Management studies. In the last decade the number of faculty in this field has grown, as has the number of students we teach, but this report shows that research funding for this important area of scholarship has fallen. Not only has research income for Business and Management studies declined by almost 8.5 percent in the past 4 years but, significantly, funding from the UK Government has declined by over 36 percent during this period. At the same time research funding from EU sources has increased markedly.
A strong Government policy emphasis on science and technology, innovation and productivity improvements as key drivers of economic growth has translated into increased research funding for STEM subjects. In particular, civil engineering and IT & computer science have benefitted from a 15 percent increase in research funding from 2010/11 to 2013/14.
But funding STEM subjects alone will not have the desired effect. The root causes of the UK’s productivity gap with OECD counterparts stem from a lack of investment (from public and private sectors) into management training, skills shortages and a structural failure to bridge STEM + management research and expertise. Invention is not innovation. Process, product and service innovation all rely on managerial, operational and organisational innovation. The commercialisation of our science and technology base and the growth of technology-based start-ups also require business and management research and expertise to shape technological developments.1
Moving beyond industry and business, the same applies to the ‘grand challenges’ we face nationally and globally. From low carbon futures to health and well-being, developments in science and technology only provide part of the answer. A deeper understanding of markets and pricing dynamics, new business models, consumer adoption patterns and a wide range of business and management related phenomena is needed to better-understand the true potential of different technological opportunities as they emerge. More research funding for Business and Management is needed to drive this.
This report highlights:
1. Declining research income for Business and Management… • Down overall by almost 8.5 percent between 2010/2011 and 2013/2014 • With a particularly marked decline in research funding from “UK central government
bodies/local authorities, health and hospital authorities”; by 36.13 percent, a drop of over £7.3 million from 2010/11 to 2013/14
• UK industry is also funding less research in this field (down over 35% in this period)
1 As outlined in the Innovation Task Force Report: “The Role of UK Business Schools in Driving Innovation in the Domestic Economy”, published by the Chartered Association of Business Schools (http://charteredabs.org/publications/). This features a range of impact case studies showing how business schools raise productivity and support the development of innovation-related capabilities in UK industry.

3
• A significant increase in the proportion of funding coming from EU sources
2. Greater regional concentration of research funding in London and the South-East • While all other regions experienced declines or little change, London and the South-East
increased their share of the Business and Management funding from 37 percent of all research income in 2010/11 to 40 percent in 2013/14
3. A concentration of research income in a small number of leading business schools • Five business schools secured almost 30 percent of the total (£198 million) in the period
2011/2012 to 2013/2014. • Ten business schools account for £88 million or 44 percent of the total research income
earned by all business schools in this period.

4
Total Research income by source (UK, EU, Overseas): 2010/11-2013/2014
In the financial year of 2013/2014, the total research income for the subject of business and management was £63.7 million. This represents the lowest level of total research income during the period between 2010/2011 and 2013/2014. The highest level of total research income was achieved in 2010/2011 and was of a value of £69.6 million. Overall, between 2010/2011 and 2013/2014 total research income decreased by 8.48%. (See Tables 1 and 2 and Figures 1 and 2)
Research income from BIS Research Councils and the learned societies, which represents one of the largest portions of research income, decreased only in the period 2011/2012 and 2012/2013 and the drop was of 3.4% and 5.6% respectively. This fall did not continue in the financial year 2013/2014, rather it increased by 4.9%. (See Table 2)
The sharpest drop in research income came from the source defined as “UK central government bodies/local authorities, health and hospital authorities”. The maximum level of income from this source was achieved in 2010/2011 and was for the sum of £20.4 million. The lowest level of income was £13 million and occurred in the period 2013/2014, which is equal to a drop of £7million in the four year period (See Table 1 and Figure 1). Overall, between 2010/2011 and 2013/2014 total research income from UK central government bodies/local authorities, health and hospital authorities” declined by 36.13%. (See Table 2 and Figure 2)
The second largest drop in research income occurred from the source classified as “UK industry, commerce and public corporations”. It reached a value of £9.9 million in 2010/11 and then dropped to £6.3 million by 2013/2014, which is equivalent to a decrease of 35.6%. (See Tables 1 and 2)
The most significant increase in income was from EU government bodies. The maximum level of income from this source was achieved in the financial year 2013/2014 and was of a value of £13 million. Overall, between 2010/2011 and 2013/2014 total research income from EU government bodies increased by 165.95%. (See Tables 1 and 2 and Figures 1 and 2)
The source of income classified as “Non-EU industry, commerce and public corporations” increased its revenue slightly. Income from this source was £610,000 in 2010/2011 and rose to £724,000 in 2013/2014.

5
Table 1
(Source: HEIDI data, analysis by max, min and range undertaken by Chartered ABS)
Table 2: Source of income for the subject of business and management: comparison of percentage income Increases/Decreases 2010/2011 - 2013/2014
Source of Income % difference between 2010/2011 and 2013/2014
BIS Research Councils, The Royal Society, British Academy and The Royal Society of Edinburgh -4.30%
UK and EU based charities (open competitive process and others) 17.87%
UK central government bodies/local authorities, health & hospital authorities -36.13%
UK industry, commerce and public corporations -35.67%
EU government bodies 21.55%
EU industry, commerce & public corporations 165.94%
EU other -0.33%
Non-EU industry, commerce & public corporations 21.97%
Non-EU other 54.03%
Other sources 73.61%
Total -8.48%
(Source: HEIDI data, analysis of % difference undertaken by Chartered ABS)
Source of Income 2010/11 2011/12 2012/13 2013/14 MAX MIN RangeBIS Research Councils, The Royal Society, British Academy and The Royal Society of Edinburgh 19,986 19,308 18,236 19,127 19,986 18,236 1,750UK-based charities (open competitive process) 2,405 2,881 2,776 2,609 2,881 2,405 476
UK-based charities (other) 938 977 1,123 973 1,123 938 185UK central government bodies/local authorities, health & hospital authorities 20,405 18,814 14,601 13,032 20,405 13,032 7,373UK industry, commerce and public corporations 9,900 9,426 8,884 6,369 9,900 6,369 3,531
EU government bodies 10,947 11,692 11,614 13,306 13,306 10,947 2,359EU-based charities (open competitive process) 74 30 14 105 105 14 91EU industry, commerce & public corporations 599 611 1,083 1,593 1,593 599 994EU other 908 1,029 791 905 1,029 791 238
Non-EU-based charities (open competitive process) 276 410 838 666 838 276 562Non-EU industry, commerce & public corporations 610 649 724 744 744 610 134Non-EU other 1,005 877 987 1,548 1,548 877 671
Other sources 1,588 2,429 3,137 2,757 3,137 1,588 1,549Total 69,641 69,133 64,808 63,734 69,641 63,734 5,907
HESA RESEARCH INCOME DATA 2010/2011 TO 2013/2014 (FY = 1 August - 31 July)
in (£000s)

6
Figure 1: Source of income for the subject of business and management: comparison of percentage income increases/decreases 2010/2011 - 2013/2014
(Source: HEIDI data, analysis by percentage of income increases/decreases undertaken by Chartered ABS)
-4.30%
17.87%
-36.13%-35.67%
21.55%
165%
-0.33%
21.97%
54.03%
73.61%
-8.48
Perc
enta
ge o
f inc
reas
es a
nd d
ecre
ases
in in
com
e
Research Income type
BIS Research Councils, The RoyalSociety, British Academy and TheRoyal Society of Edinburgh
UK and EU based charities (opencompetitive processs and others)
UK central government bodies/localauthorities, health & hospitalauthorities
UK industry, commerce and publiccorporations
EU government bodies
EU industry, commerce & publiccorporations
EU other
Non-EU industry, commerce & publiccorporations
Non-EU other
Other sources
Total

7
Figure 2
(Source: HEIDI data, representation of data as given in the chart undertaken by Chartered ABS)
0%
10%
20%
30%
40%
50%
60%
70%
80%
90%
100%
2010/11 2011/12 2012/13 2013/14
19,986 19,308 18,236 19,127
3,693 4,298 4,751 4,353
20,405 18,814 14,601 13,032
9,900 9,426
8,884 6,369
10,947 11,692
11,614 13,306
1,588 2,429 3,137 2,757
Research Income Data 2010/2011 to 2013/2014 (FY = 1 August - 31 July), in (£000)
Other sources
Non-EU other
Non-EU industry, commerce & publiccorporations
EU other
EU industry, commerce & publiccorporations
EU government bodies
UK industry, commerce and publiccorporations
UK central government bodies/localauthorities, health & hospitalauthorities
UK and EU based charities (opencompetitive processs and others)
BIS Research Councils, The RoyalSociety, British Academy and TheRoyal Society of Edinburgh

8
Table 3
(Source: HEIDI data, analysis of % differences by year undertaken by Chartered ABS)
9
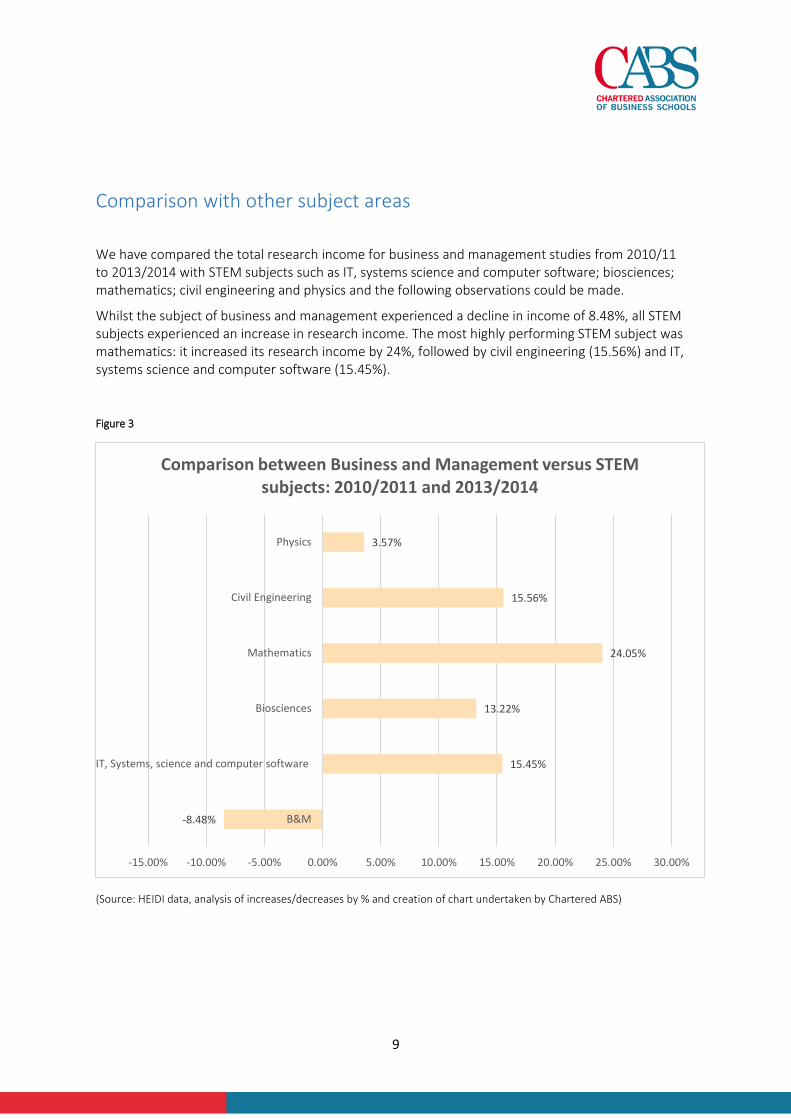
Comparison with other subject areas
We have compared the total research income for business and management studies from 2010/11 to 2013/2014 with STEM subjects such as IT, systems science and computer software; biosciences; mathematics; civil engineering and physics and the following observations could be made.
Whilst the subject of business and management experienced a decline in income of 8.48%, all STEM subjects experienced an increase in research income. The most highly performing STEM subject was mathematics: it increased its research income by 24%, followed by civil engineering (15.56%) and IT, systems science and computer software (15.45%).
Figure 3
(Source: HEIDI data, analysis of increases/decreases by % and creation of chart undertaken by Chartered ABS)
-8.48%
15.45%
13.22%
24.05%
15.56%
3.57%
-15.00% -10.00% -5.00% 0.00% 5.00% 10.00% 15.00% 20.00% 25.00% 30.00%
B&M
IT, Systems, science and computer software
Biosciences
Mathematics
Civil Engineering
Physics
Comparison between Business and Management versus STEM subjects: 2010/2011 and 2013/2014

10
Table 4: Comparison between the subject of Business and Management (B&M) and STEM subjects: increases or decreases between 2010/2011 and 2013/2014, figures in (£000)
2010/2011 2011/2012 2012/2013 2013/2014
% increases or decreases: 2010/2011 and 2013/2014
B&M 69,641 69,133 64,808 63,734 -8.48%
IT, Systems, science and computer software 130,385 125,602 134,541 150,535 15.45%
Biosciences 569,923 563,073 574,995 645,251 13.22%
Mathematics 77,914 83,927 88,019 96,650 24.05%
Civil Engineering 49,315 51,099 54,778 56,989 15.56%
Physics 275,350 267,783 279,854 285,189 3.57%
(Source: HEIDI data, analysis by % increases or decreases undertaken by Chartered ABS)
11
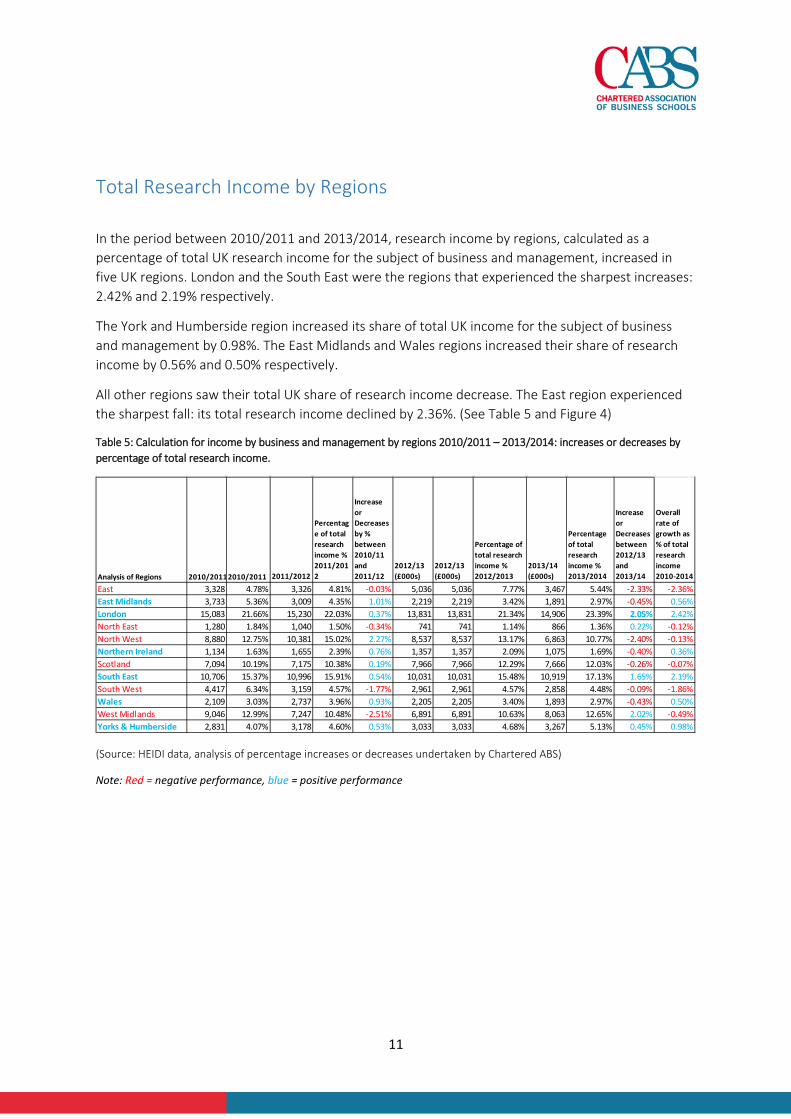
Total Research Income by Regions In the period between 2010/2011 and 2013/2014, research income by regions, calculated as a percentage of total UK research income for the subject of business and management, increased in five UK regions. London and the South East were the regions that experienced the sharpest increases: 2.42% and 2.19% respectively.
The York and Humberside region increased its share of total UK income for the subject of business and management by 0.98%. The East Midlands and Wales regions increased their share of research income by 0.56% and 0.50% respectively.
All other regions saw their total UK share of research income decrease. The East region experienced the sharpest fall: its total research income declined by 2.36%. (See Table 5 and Figure 4)
Table 5: Calculation for income by business and management by regions 2010/2011 – 2013/2014: increases or decreases by percentage of total research income.
(Source: HEIDI data, analysis of percentage increases or decreases undertaken by Chartered ABS)
Note: Red = negative performance, blue = positive performance
Analysis of Regions 2010/20112010/2011 2011/2012
Percentage of total research income % 2011/2012
Increase or Decreases by % between 2010/11 and 2011/12
2012/13 (£000s)
2012/13 (£000s)
Percentage of total research income % 2012/2013
2013/14 (£000s)
Percentage of total research income % 2013/2014
Increase or Decreases between 2012/13 and 2013/14
Overall rate of growth as % of total research income 2010-2014
East 3,328 4.78% 3,326 4.81% -0.03% 5,036 5,036 7.77% 3,467 5.44% -2.33% -2.36%East Midlands 3,733 5.36% 3,009 4.35% 1.01% 2,219 2,219 3.42% 1,891 2.97% -0.45% 0.56%London 15,083 21.66% 15,230 22.03% 0.37% 13,831 13,831 21.34% 14,906 23.39% 2.05% 2.42%North East 1,280 1.84% 1,040 1.50% -0.34% 741 741 1.14% 866 1.36% 0.22% -0.12%North West 8,880 12.75% 10,381 15.02% 2.27% 8,537 8,537 13.17% 6,863 10.77% -2.40% -0.13%Northern Ireland 1,134 1.63% 1,655 2.39% 0.76% 1,357 1,357 2.09% 1,075 1.69% -0.40% 0.36%Scotland 7,094 10.19% 7,175 10.38% 0.19% 7,966 7,966 12.29% 7,666 12.03% -0.26% -0.07%South East 10,706 15.37% 10,996 15.91% 0.54% 10,031 10,031 15.48% 10,919 17.13% 1.65% 2.19%South West 4,417 6.34% 3,159 4.57% -1.77% 2,961 2,961 4.57% 2,858 4.48% -0.09% -1.86%Wales 2,109 3.03% 2,737 3.96% 0.93% 2,205 2,205 3.40% 1,893 2.97% -0.43% 0.50%West Midlands 9,046 12.99% 7,247 10.48% -2.51% 6,891 6,891 10.63% 8,063 12.65% 2.02% -0.49%Yorks & Humberside 2,831 4.07% 3,178 4.60% 0.53% 3,033 3,033 4.68% 3,267 5.13% 0.45% 0.98%

12
Figure 4
(Source: HEIDI data, analysis of percentage increases and decreases undertaken by Chartered ABS)
If we compare total UK income for the subject of business and management by regions, in the period 2010/2011 with the period 2013/2014, London, the South East increased slightly their share of income. In 2010/2011 they had a combined share of 37% of total income. In 2013/2014, this had increased to 40%. In contrast, the North West, the North East, the East Midlands and the South West saw their share of total income decrease slightly.
-3.00% -2.00% -1.00% 0.00% 1.00% 2.00% 3.00%
EAST
EAST MIDLANDS
LONDON
NORTH EAST
NORTH WEST
NORTHERN IRELAND
SCOTLAND
SOUTH EAST
SOUTH WEST
WALES
WEST MIDLANDS
YORKS & HUMBERSIDE
Business and Management by Regions 2010/2011 - 2013/2014: increases or decreases
by percentage of total research income
Increase or Decreases between 2012/13 and 2013/14
Increase or Decreases between 2010/11 and 2011/12

13
Figure 5
(Source: HEIDI data, analysis of percentage by total research income undertaken by Chartered ABS)
East5% East Midlands
5%
London22%
North East2%
North West13%Northern Ireland
2%Scotland
10%
South East15%
South West6%
Wales3%
West Midlands13%
Yorks & Humberside4%
Overall Share of Total Research Income by Regions: 2010/2011
East
East Midlands
London
North East
North West
Northern Ireland
Scotland
South East
South West
Wales
West Midlands
Yorks & Humberside

14
Figure 6
(Source: HEIDI data, analysis of percentage by total research income undertaken by Chartered ABS)
East5% East Midlands
3%
London23%
North East1%
North West11%
Northern Ireland2%
Scotland12%
South East17%
South West5%
Wales3%
West Midlands13%
Yorks & Humberside5%
Overall Share of Total Research Income by Regions: 2013/2014
East
East Midlands
London
North East
North West
Northern Ireland
Scotland
South East
South West
Wales
West Midlands
Yorks & Humberside

15
Business Schools by Research Income Table 6 shows the performance of business schools according to research income by examining financial figures for a 3 year period - covering the reporting years 2011/2012, 2012/2013 and 2013/2014. In addition, we have ranked institutions by adding the total research income for these years.
Table 6
(Source: HEIDI data, sum analysis and ranking of data undertaken by Chartered ABS)
ValuesGreen: Above £4 million
Institutions
2011/12 Total Research Grants
and Contracts (£1000s)
2012/13 Total Research
Grants and Contracts
(£1000s)
2013/14 Total Research
Grants and Contracts
(£1000s)
Sum 2011-2014
1Imperial College of Science, Technology and Medicine 6,328 5,579 4,314 16,221
2 The University of Warwick 4,537 3,730 4,735 13,0023 The University of Manchester 4,465 4,048 2,877 11,3904 The University of Lancaster 3,322 3,364 3,160 9,8465 The University of Oxford 2,689 2,282 2,660 7,6316 The University of Strathclyde 2,099 2,216 2,529 6,8447 The University of Reading 2,113 2,219 2,211 6,5438 Cranfield University 2,896 1,892 1,000 5,788
9London School of Economics and Political Science 1,360 1,406 2,717 5,483
10 The University of Leeds 1,608 1,579 1,749 4,93611 Cardiff University 2,106 1,412 1,110 4,62812 The University of Stirling 1,437 1,469 1,664 4,57013 London Business School 1,463 1,464 1,577 4,50414 The University of Sussex 26 2,089 2,380 4,49515 Aston University 1,125 1,736 1,355 4,21616 The University of Cambridge 1,495 1,510 1,166 4,17117 The City University 1,108 1,363 1,688 4,15918 University of Nottingham 1,707 1,329 770 3,80619 The University of Exeter 1,099 1,213 1,145 3,457
Ranking of Business Schools by income above 3 million between 2011/12 & 2013/14

16
Research Funding Concentration: 2011/2012 to 2013/2014
Research funding is concentrated. In the reporting period 2011/2012 to 2013/2014, five business schools – Imperial College, Warwick, Manchester, Lancaster and Oxford – secured a total income of £58 million, which is equivalent to 29% of the total research income for all schools listed (see Figure 7). Within these 5 business schools, there are however some differences in performance. Imperial, the University of Warwick and the University of Manchester all managed to earn annual incomes of over £4 million for two out of these three years.
Figure 7: % of Total Research Income for the period 2011/2012 and 2013/2014 by top 5 business schools
Source: HEIDI data, Chartered ABS analysis of percentage of total income.
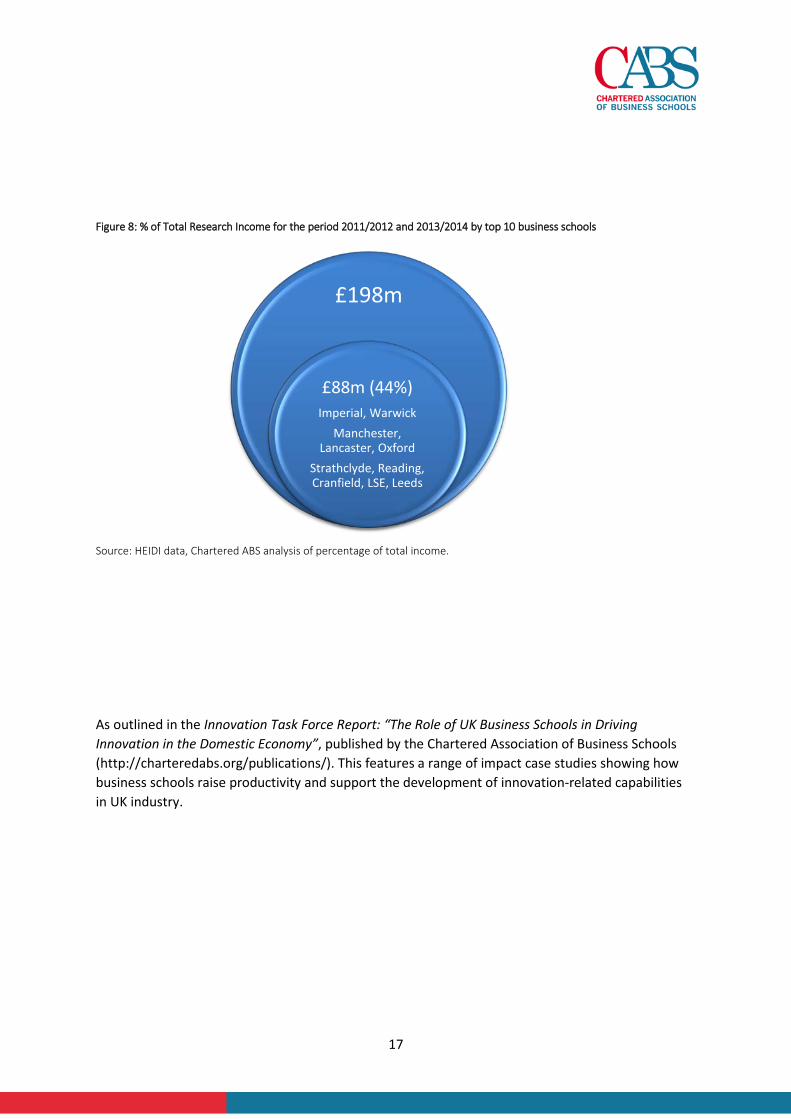
The top ten highest earning business schools listed in Figure 8, obtained a total income of approximately £88 million, which is equivalent to 44% of total research income. The top 20 highest earning business schools received a total research income of approximately £129 million, which is equivalent to 65% of total research income.
17
Figure 8: % of Total Research Income for the period 2011/2012 and 2013/2014 by top 10 business schools
98m Source: HEIDI data, Chartered ABS analysis of percentage of total income.
As outlined in the Innovation Task Force Report: “The Role of UK Business Schools in Driving Innovation in the Domestic Economy”, published by the Chartered Association of Business Schools (http://charteredabs.org/publications/). This features a range of impact case studies showing how business schools raise productivity and support the development of innovation-related capabilities in UK industry.
£198m
£88m (44%)Imperial, Warwick
Manchester, Lancaster, Oxford
Strathclyde, Reading, Cranfield, LSE, Leeds

18
Research Income by Mission Group Analysis of total research income for the period between 2011/2012 and 2013/2014 by business schools belonging to mission groups shows that there is a concentration of research income between the business schools belonging to the Russell Group and some business schools in universities that do not belong to any formal group at present.
In the four years under analysis, the business schools in the Russell Group obtained an income in excess of £90 million.
Another group of business schools in universities that are not affiliated to any mission group obtained an income in excess of £50 million. This group is composed of the following nine business schools.
• University of Lancaster; • University of Strathclyde; • University of Reading; • Cranfield University; • University of Stirling; • London Business School; • University of Sussex; • Aston University; • City University.
Data for the performance of this group is given in the table below (see Table 8 and 9, universities highlighted in red). Another group of non-affiliated universities obtained an income of £32m. The University Alliance Group achieved an income of £13m and the Million Plus group an income of £7m.2
2 The figures here provided exclude those business schools/departments of business and management with less than £20K income over the four year period under analysis.

19
Figure 9
(Source: HEIDI data, Chartered ABS analysis of total research income by mission group undertaken in-house)
Russell Group46%
University Alliance7%
Million + 4%
Non Affiliated (income over £4m)
26%
Non Affiliated (others)
17%
TOTAL RESEARCH INCOME BY MISSION GROUP (%) 2010/2011 TO 2013/2014

20
Table 7: Russell Group: Research Income from Business and Management (£000)
Russell Group: Institution 2011/12
2012/13
2013/14 Sum 2011-2014
Imperial College of Science, Technology and Medicine 6,328 5,579 4,314 16,221 The University of Warwick 4,537 3,730 4,735 13,002 The University of Manchester 4,465 4,048 2,877 11,390 The University of Oxford 2,689 2,282 2,660 7,631 London School of Economics and Political Science 1,360 1,406 2,717 5,483 The University of Leeds 1,608 1,579 1,749 4,936 Cardiff University 2,106 1,412 1,110 4,628 The University of Cambridge 1,495 1,510 1,166 4,171 University of Nottingham 1,707 1,329 770 3,806 The University of Exeter 1,099 1,213 1,145 3,457 King's College London 1,710 345 372 2,427 The University of Sheffield 610 479 902 1,991 The University of Birmingham 642 577 581 1,800 The University of Southampton 564 555 678 1,797 The University of Edinburgh 616 530 447 1,593 The Queen's University of Belfast 589 352 270 1,211 University of Durham 401 375 420 1,196 The University of Liverpool 493 301 296 1,090 The University of Glasgow 278 454 306 1,038 University of Newcastle-upon-Tyne 358 154 322 834 Queen Mary University of London 107 93 288 488 University College London 0 147 101 248 The University of York 26 -15 24 35
33,788 28,435 28,250 90,473
(Source: HEIDI data, sum analysis and ranking undertaken by Chartered ABS)

21
Table 8: University Alliance: Research Income from Business and Management (£000)
University Alliance: Institutions 2011/12
2012/13
2013/14 Sum 2011-2014
Coventry University 388 467 1,128 1,983 The University of Salford 1,518 136 198 1,852 University of the West of England, Bristol 576 519 644 1,739 The University of Greenwich 386 463 549 1,398 Kingston University 682 408 254 1,344 The Manchester Metropolitan University 369 445 143 957 Oxford Brookes University 387 205 129 721 University of Hertfordshire 255 168 242 665 The University of Portsmouth 370 198 85 653 University of Plymouth 157 202 264 623 The Nottingham Trent University 357 80 85 522 Sheffield Hallam University 180 146 69 395 The University of Lincoln 164 162 23 349 University of South Wales 79 142 94 315 The University of Huddersfield 17 192 65 274 Cardiff Metropolitan University 3 57 0 60 Teesside University 49 6 0 55 Liverpool John Moores University 28 20 4 52
5965 4016 3976 13,957
(Source: HEIDI data, sum analysis and ranking undertaken by Chartered ABS)

22
Table 9: Million +: Research Income from Business and Management (£000)
Institutions 2011/12 2012/13 L 2013/14 Sum 2011-
2014
Anglia Ruskin University 492 1,114 743 2,349 Middlesex University 758 618 465 1,841 Edinburgh Napier University 400 382 338 1,120 London South Bank University 361 114 55 530 University of Abertay Dundee 14 288 -1 301 London Metropolitan University 44 132 122 298 The University of the West of Scotland 85 102 99 286 Staffordshire University 110 72 11 193 Canterbury Christ Church University 14 48 105 167 The University of Sunderland 72 56 27 155 University of Cumbria 30 24 75 129 The University of East London 6 46 62 114 University of the Highlands and Islands 81 0 0 81 Southampton Solent University 9 54 11 74 University of Bedfordshire 13 20 7 40 Bath Spa University 9 23 0 32 The University of West London 24 4 0 28 The University of Bolton 20 0 0 20
2,542 3,097 2,119 7,758 (Source: HEIDI data, sum analysis and ranking undertaken by Chartered ABS)
Table 10
Sum of income of a group of business schools which do not belong to a mission group. Selection based on average income of over £4M
Income 2010/2011 to 2013/2014 in (£000)
The University of Lancaster 9,846 The University of Strathclyde 6,844 The University of Reading 6,543 Cranfield University 5,788 The University of Stirling 4,570 London Business School 4,504 The University of Sussex 4,495 Aston University 4,216 The City University 4,159 Total 50,965
(Source: HEIDI data, sum analysis and ranking undertaken by Chartered ABS)

23
40 Queen Street, London, EC4R 1DD Tel: 020 7236 7678 charteredabs.org
Related Documents