Houston’s office market closes out 2018 with positive net absorption Research & Forecast Report HOUSTON | OFFICE Q4 2018 Lisa Bridges Director of Market Research | Houston Houston’s office market continues to take baby steps towards filling vacant space emptied during the energy downturn. In Q4 2018, the market posted positive absorption of 1.9 million SF, a substantial increase from the negative 0.4 million SF of absorption recorded one year ago. Leasing activity remained steady over the quarter at 3.5M SF pushing the year-end total to 14M SF. Houston’s overall vacancy rate fell slightly from 20.6% to 20.0% over the quarter, but it is still well above Houston’s 5-year average vacancy rate of 16.4%. Construction activity decreased in Q4 2018 from 3.2M SF to 2.5M SF as several new buildings were delivered. HP’s and ABS’s new CityPlace buildings in The Woodlands submarket delivered during Q4 2018. Houston’s job growth increased by 3.7% over the year, according to recent data released by the US Bureau of Labor Statistics. The Houston MSA created 114,400 jobs (not seasonally adjusted) between November 2017 and November 2018, growing faster than the U.S. during the same time period. Employment sectors with the most substantial growth include support activities for mining which grew by 11.7% over the year, construction increased by 10.8% and durable goods manufacturing was up by 9.0% over the year. Summary Statistics Houston Office Market Q4 2017 Q3 2018 Q4 2018 Vacancy Rate 19.9% 20.6% 20.0% Net Absorption (Million Square Feet) -0.4 0.6 1.9 New Construction (Million Square Feet) 0.6 0.1 0.8 Under Construction (Million Square Feet) 2.0 3.2 2.5 Class A Vacancy Rate CBD Suburban 19.0% 22.2% 19.7% 22.7% 19.0% 21.7% Asking Rents Per Square Foot Per Year Houston Class A $35.08 $34.50 $34.43 CBD Class A $44.58 $45.28 $44.30 Suburban Class A $32.43 $31.37 $31.64 Market Indicators Relative to prior period Annual Change Quarterly Change Quarterly Forecast* VACANCY NET ABSORPTION NEW CONSTRUCTION UNDER CONSTRUCTION *Projected Share or view online at colliers.com/houston

Welcome message from author
This document is posted to help you gain knowledge. Please leave a comment to let me know what you think about it! Share it to your friends and learn new things together.
Transcript
Houston’s office market closes out 2018 with positive net absorption
Research & Forecast Report
HOUSTON | OFFICEQ4 2018
Lisa Bridges Director of Market Research | Houston
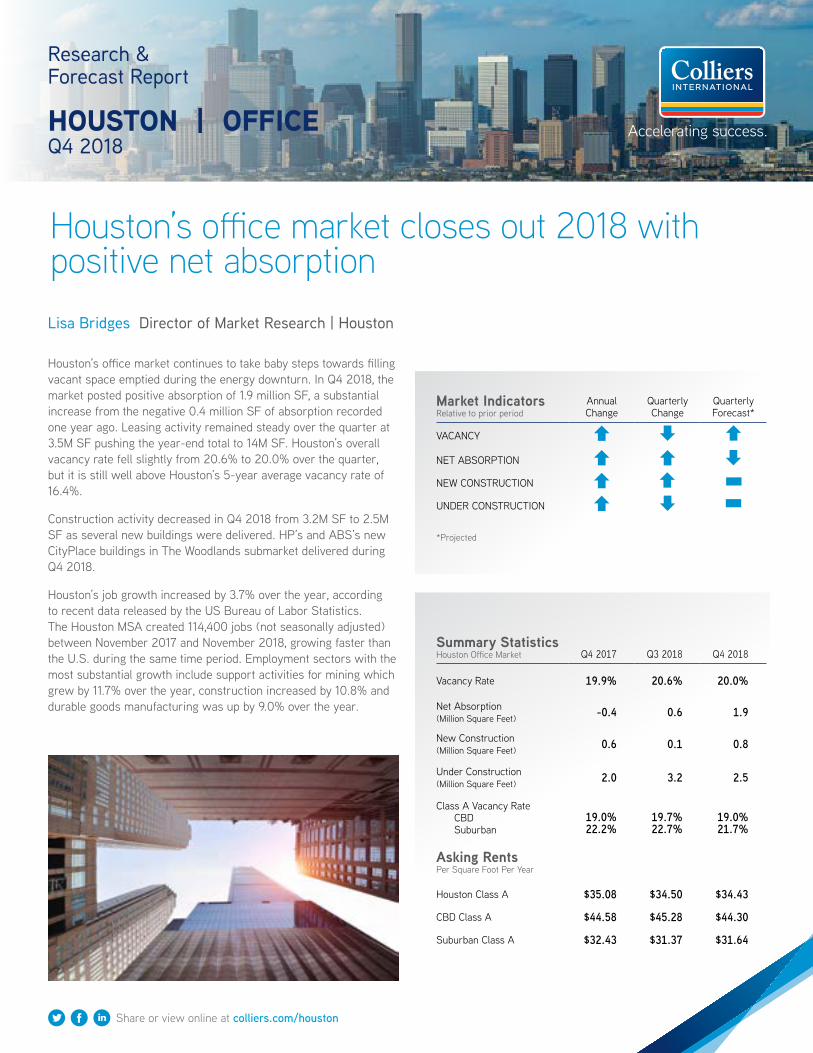
Houston’s office market continues to take baby steps towards filling vacant space emptied during the energy downturn. In Q4 2018, the market posted positive absorption of 1.9 million SF, a substantial increase from the negative 0.4 million SF of absorption recorded one year ago. Leasing activity remained steady over the quarter at 3.5M SF pushing the year-end total to 14M SF. Houston’s overall vacancy rate fell slightly from 20.6% to 20.0% over the quarter, but it is still well above Houston’s 5-year average vacancy rate of 16.4%.
Construction activity decreased in Q4 2018 from 3.2M SF to 2.5M SF as several new buildings were delivered. HP’s and ABS’s new CityPlace buildings in The Woodlands submarket delivered during Q4 2018.
Houston’s job growth increased by 3.7% over the year, according to recent data released by the US Bureau of Labor Statistics. The Houston MSA created 114,400 jobs (not seasonally adjusted) between November 2017 and November 2018, growing faster than the U.S. during the same time period. Employment sectors with the most substantial growth include support activities for mining which grew by 11.7% over the year, construction increased by 10.8% and durable goods manufacturing was up by 9.0% over the year.
Summary Statistics Houston Office Market Q4 2017 Q3 2018 Q4 2018
Vacancy Rate 19.9% 20.6% 20.0%
Net Absorption (Million Square Feet) -0.4 0.6 1.9
New Construction (Million Square Feet) 0.6 0.1 0.8
Under Construction (Million Square Feet) 2.0 3.2 2.5
Class A Vacancy Rate CBD Suburban
19.0%22.2%
19.7%22.7%
19.0%21.7%
Asking Rents Per Square Foot Per Year
Houston Class A $35.08 $34.50 $34.43
CBD Class A $44.58 $45.28 $44.30
Suburban Class A $32.43 $31.37 $31.64
Market IndicatorsRelative to prior period
AnnualChange
Quarterly Change
Quarterly Forecast*
VACANCY
NET ABSORPTION
NEW CONSTRUCTION
UNDER CONSTRUCTION
*Projected
Share or view online at colliers.com/houston
0.0%
5.0%
10.0%
15.0%
20.0%
25.0%
CBD Vacancy Suburban Vacancy
2 Houston Research & Forecast Report | Q4 2018 | Office | Colliers International
Vacancy & Availability
Houston’s citywide vacancy rate decreased 60 basis points from 20.6% to 20.0% over the quarter. The average suburban vacancy rate also decreased 60 basis points from 20.3% to 19.7%, and the average CBD vacancy rate fell 40 basis points from 21.7% to 21.3% between quarters.
The average Class A vacancy rate in the CBD dropped 70 basis points over the quarter from 19.7% to 19.0% and the average Class B vacancy rate in the CBD remained stable at 30.1%. The average suburban Class A vacancy rate decreased 100 basis points from 22.7% to 21.7% between quarters, while the average suburban Class B vacancy decreased 30 basis points from 18.7% to 18.4%.
Of the 1,734 existing office buildings in our survey, 79 buildings have 100,000 SF or more contiguous space available for lease or sublease. Of these, 26 buildings have 200,000 SF or more contiguous space available. Citywide, available sublease space decreased over the quarter from 8.9 million SF to 8.0 million SF. Available space differs from vacant space in that it includes space that is currently being marketed for lease but may be occupied with a future availability date. In contrast, vacant space is truly vacant and is immediately available.
Large Sublease Availabilities (Total available in building and/or complex)
BUILDING TENANT SUBMARKET SF5 Greenway Plaza Oxy Greenway Plaza 746,070
Four WestLake Park BP Katy Freeway 454,487
Energy Tower II KTI Corporation (Technip) Katy Freeway 297,919
NRG Tower Reliant Energy Retail CBD 262,325
One Shell Plaza Shell Oil CBD 252,075
Three WestLake Park Phillips 66 Katy Freeway 221,723
Hess Tower Hess Corporation CBD 215,887
1100 Louisiana Enbridge CBD 202,680
10777 Clay Rd AMEC Foster Wheeler Katy Freeway 189,285
Westway III GE Oil & Gas West Belt 182,004
1001 Louisiana St EP Energy Corporation CBD 124,600
Source: CoStar
0
2,000,000
4,000,000
6,000,000
8,000,000
10,000,000
12,000,000
14,000,000
Q32014
Q42014
Q12015
Q22015
Q32015
Q42015
Q12016
Q22016
Q32016
Q42016
Q12017
Q22017
Q32017
Q42017
Q12018
Q22018
Q32018
Q42018
Class A Class B Houston Total
Job Growth & Unemployment(not seasonally adjusted)
UNEMPLOYMENT 11/17 11/18
HOUSTON 4.4% 3.8%
TEXAS 3.8% 3.5%
U.S. 3.9% 3.5%
JOB GROWTHAnnual Change
# of Jobs Added
HOUSTON 3.7% 114.4K
TEXAS 3.9% 360.0K
U.S. 1.7% 2.5M
CBD vs. SuburbanCLASS A OFFICE VACANCY
$0.00
$5.00
$10.00
$15.00
$20.00
$25.00
$30.00
$35.00
$40.00
$45.00
$50.00
CBD Rents Suburban Rents
CLASS A OFFICE RENTS
HISTORICAL AVAILABLE SUBLEASE SPACE
AVAILABLE SUBLEASE SPACE - 125,000 SF OR GREATER
33 Houston Research & Forecast Report | Q4 2018 | Office | Colliers International
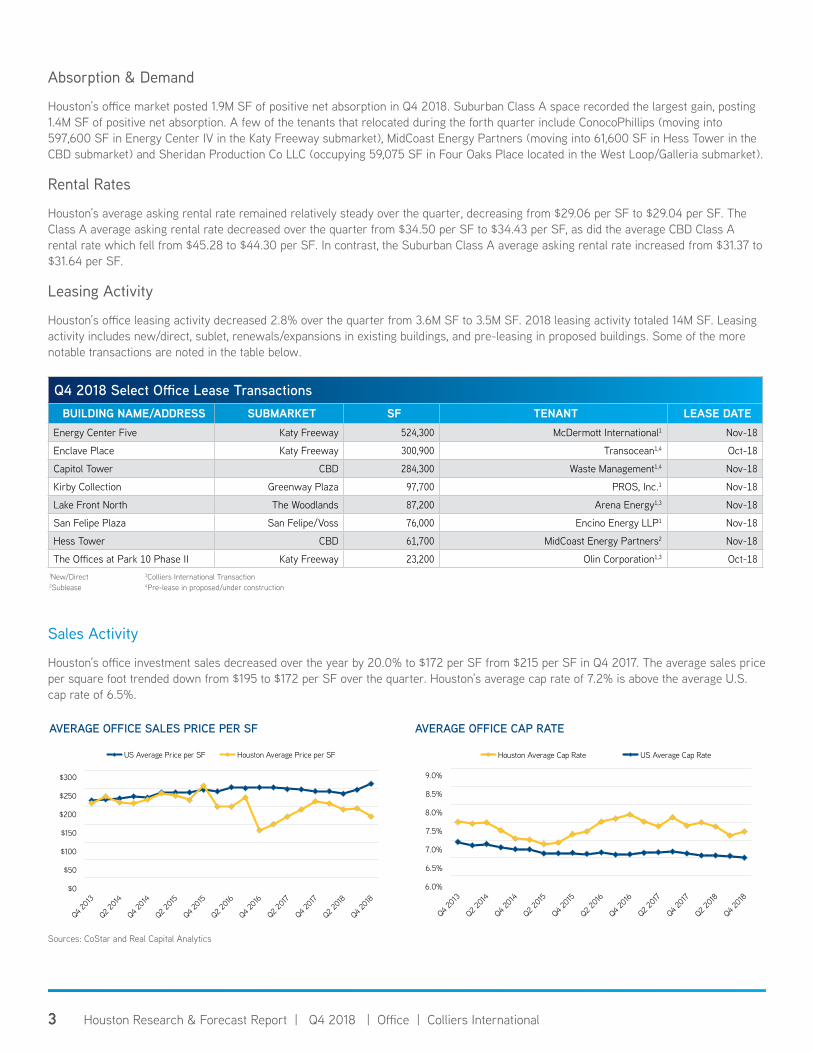
Absorption & Demand
Houston’s office market posted 1.9M SF of positive net absorption in Q4 2018. Suburban Class A space recorded the largest gain, posting 1.4M SF of positive net absorption. A few of the tenants that relocated during the forth quarter include ConocoPhillips (moving into 597,600 SF in Energy Center IV in the Katy Freeway submarket), MidCoast Energy Partners (moving into 61,600 SF in Hess Tower in the CBD submarket) and Sheridan Production Co LLC (occupying 59,075 SF in Four Oaks Place located in the West Loop/Galleria submarket).
Rental Rates
Houston’s average asking rental rate remained relatively steady over the quarter, decreasing from $29.06 per SF to $29.04 per SF. The Class A average asking rental rate decreased over the quarter from $34.50 per SF to $34.43 per SF, as did the average CBD Class A rental rate which fell from $45.28 to $44.30 per SF. In contrast, the Suburban Class A average asking rental rate increased from $31.37 to $31.64 per SF.
Leasing Activity
Houston’s office leasing activity decreased 2.8% over the quarter from 3.6M SF to 3.5M SF. 2018 leasing activity totaled 14M SF. Leasing activity includes new/direct, sublet, renewals/expansions in existing buildings, and pre-leasing in proposed buildings. Some of the more notable transactions are noted in the table below.
Q4 2018 Select Office Lease TransactionsBUILDING NAME/ADDRESS SUBMARKET SF TENANT LEASE DATE
Energy Center Five Katy Freeway 524,300 McDermott International1 Nov-18
Enclave Place Katy Freeway 300,900 Transocean1,4 Oct-18
Capitol Tower CBD 284,300 Waste Management1,4 Nov-18
Kirby Collection Greenway Plaza 97,700 PROS, Inc.1 Nov-18
Lake Front North The Woodlands 87,200 Arena Energy1,3 Nov-18
San Felipe Plaza San Felipe/Voss 76,000 Encino Energy LLP1 Nov-18
Hess Tower CBD 61,700 MidCoast Energy Partners2 Nov-18
The Offices at Park 10 Phase II Katy Freeway 23,200 Olin Corporation1,3 Oct-181New/Direct 3Colliers International Transaction2Sublease 4Pre-lease in proposed/under construction
Sales Activity
Houston’s office investment sales decreased over the year by 20.0% to $172 per SF from $215 per SF in Q4 2017. The average sales price per square foot trended down from $195 to $172 per SF over the quarter. Houston’s average cap rate of 7.2% is above the average U.S. cap rate of 6.5%.
Sources: CoStar and Real Capital Analytics
$0
$50
$100
$150
$200
$250
$300
US Average Price per SF Houston Average Price per SF
AVERAGE OFFICE SALES PRICE PER SF
6.0%
6.5%
7.0%
7.5%
8.0%
8.5%
9.0%
Houston Average Cap Rate US Average Cap Rate
AVERAGE OFFICE CAP RATE
4 Houston Research & Forecast Report | Q4 2018 | Office | Colliers International
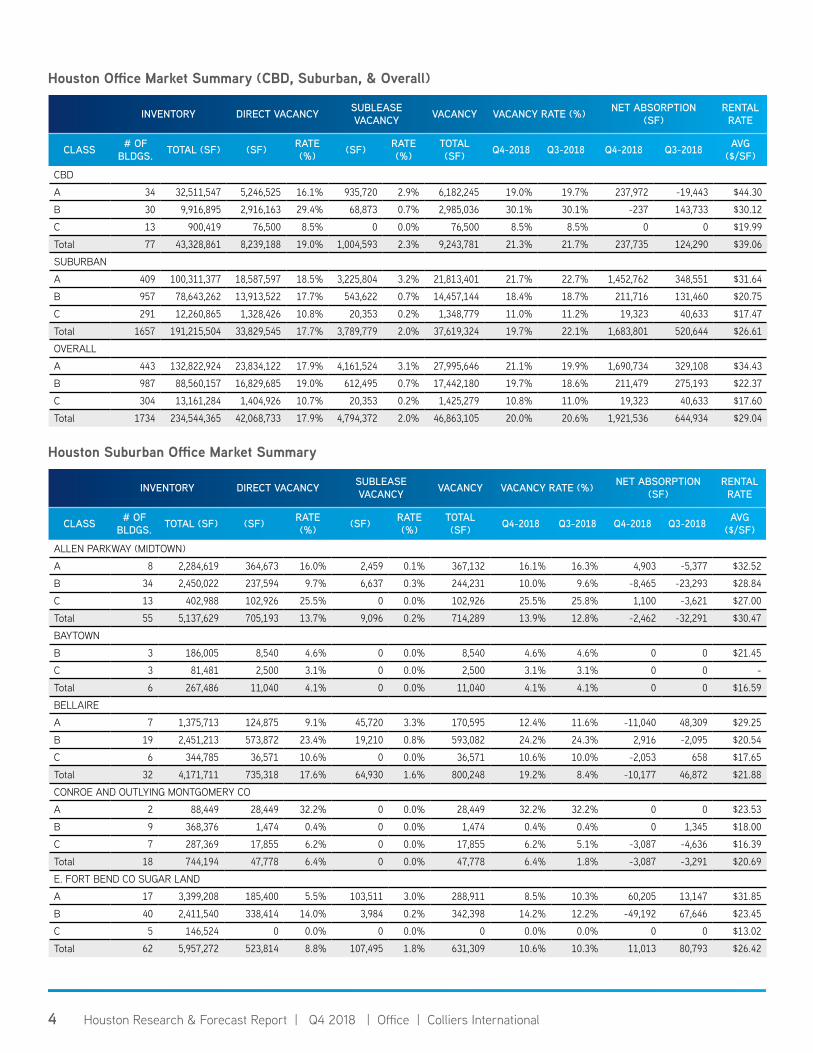
Houston Office Market Summary (CBD, Suburban, & Overall)
INVENTORY DIRECT VACANCY SUBLEASE VACANCY VACANCY VACANCY RATE (%) NET ABSORPTION
(SF)RENTAL
RATE
CLASS # OF BLDGS. TOTAL (SF) (SF) RATE
(%) (SF) RATE (%)
TOTAL (SF) Q4-2018 Q3-2018 Q4-2018 Q3-2018 AVG
($/SF)
CBD
A 34 32,511,547 5,246,525 16.1% 935,720 2.9% 6,182,245 19.0% 19.7% 237,972 -19,443 $44.30
B 30 9,916,895 2,916,163 29.4% 68,873 0.7% 2,985,036 30.1% 30.1% -237 143,733 $30.12
C 13 900,419 76,500 8.5% 0 0.0% 76,500 8.5% 8.5% 0 0 $19.99
Total 77 43,328,861 8,239,188 19.0% 1,004,593 2.3% 9,243,781 21.3% 21.7% 237,735 124,290 $39.06
SUBURBAN
A 409 100,311,377 18,587,597 18.5% 3,225,804 3.2% 21,813,401 21.7% 22.7% 1,452,762 348,551 $31.64
B 957 78,643,262 13,913,522 17.7% 543,622 0.7% 14,457,144 18.4% 18.7% 211,716 131,460 $20.75
C 291 12,260,865 1,328,426 10.8% 20,353 0.2% 1,348,779 11.0% 11.2% 19,323 40,633 $17.47
Total 1657 191,215,504 33,829,545 17.7% 3,789,779 2.0% 37,619,324 19.7% 22.1% 1,683,801 520,644 $26.61
OVERALL
A 443 132,822,924 23,834,122 17.9% 4,161,524 3.1% 27,995,646 21.1% 19.9% 1,690,734 329,108 $34.43
B 987 88,560,157 16,829,685 19.0% 612,495 0.7% 17,442,180 19.7% 18.6% 211,479 275,193 $22.37
C 304 13,161,284 1,404,926 10.7% 20,353 0.2% 1,425,279 10.8% 11.0% 19,323 40,633 $17.60
Total 1734 234,544,365 42,068,733 17.9% 4,794,372 2.0% 46,863,105 20.0% 20.6% 1,921,536 644,934 $29.04
INVENTORY DIRECT VACANCY SUBLEASE VACANCY VACANCY VACANCY RATE (%) NET ABSORPTION
(SF)RENTAL
RATE
CLASS # OF BLDGS. TOTAL (SF) (SF) RATE
(%) (SF) RATE (%)
TOTAL (SF) Q4-2018 Q3-2018 Q4-2018 Q3-2018 AVG
($/SF)
ALLEN PARKWAY (MIDTOWN)
A 8 2,284,619 364,673 16.0% 2,459 0.1% 367,132 16.1% 16.3% 4,903 -5,377 $32.52
B 34 2,450,022 237,594 9.7% 6,637 0.3% 244,231 10.0% 9.6% -8,465 -23,293 $28.84
C 13 402,988 102,926 25.5% 0 0.0% 102,926 25.5% 25.8% 1,100 -3,621 $27.00
Total 55 5,137,629 705,193 13.7% 9,096 0.2% 714,289 13.9% 12.8% -2,462 -32,291 $30.47
BAYTOWN
B 3 186,005 8,540 4.6% 0 0.0% 8,540 4.6% 4.6% 0 0 $21.45
C 3 81,481 2,500 3.1% 0 0.0% 2,500 3.1% 3.1% 0 0 -
Total 6 267,486 11,040 4.1% 0 0.0% 11,040 4.1% 4.1% 0 0 $16.59
BELLAIRE
A 7 1,375,713 124,875 9.1% 45,720 3.3% 170,595 12.4% 11.6% -11,040 48,309 $29.25
B 19 2,451,213 573,872 23.4% 19,210 0.8% 593,082 24.2% 24.3% 2,916 -2,095 $20.54
C 6 344,785 36,571 10.6% 0 0.0% 36,571 10.6% 10.0% -2,053 658 $17.65
Total 32 4,171,711 735,318 17.6% 64,930 1.6% 800,248 19.2% 8.4% -10,177 46,872 $21.88
CONROE AND OUTLYING MONTGOMERY CO
A 2 88,449 28,449 32.2% 0 0.0% 28,449 32.2% 32.2% 0 0 $23.53
B 9 368,376 1,474 0.4% 0 0.0% 1,474 0.4% 0.4% 0 1,345 $18.00
C 7 287,369 17,855 6.2% 0 0.0% 17,855 6.2% 5.1% -3,087 -4,636 $16.39
Total 18 744,194 47,778 6.4% 0 0.0% 47,778 6.4% 1.8% -3,087 -3,291 $20.69
E. FORT BEND CO SUGAR LAND
A 17 3,399,208 185,400 5.5% 103,511 3.0% 288,911 8.5% 10.3% 60,205 13,147 $31.85
B 40 2,411,540 338,414 14.0% 3,984 0.2% 342,398 14.2% 12.2% -49,192 67,646 $23.45
C 5 146,524 0 0.0% 0 0.0% 0 0.0% 0.0% 0 0 $13.02
Total 62 5,957,272 523,814 8.8% 107,495 1.8% 631,309 10.6% 10.3% 11,013 80,793 $26.42
Houston Suburban Office Market Summary

5 Houston Research & Forecast Report | Q4 2018 | Office | Colliers International
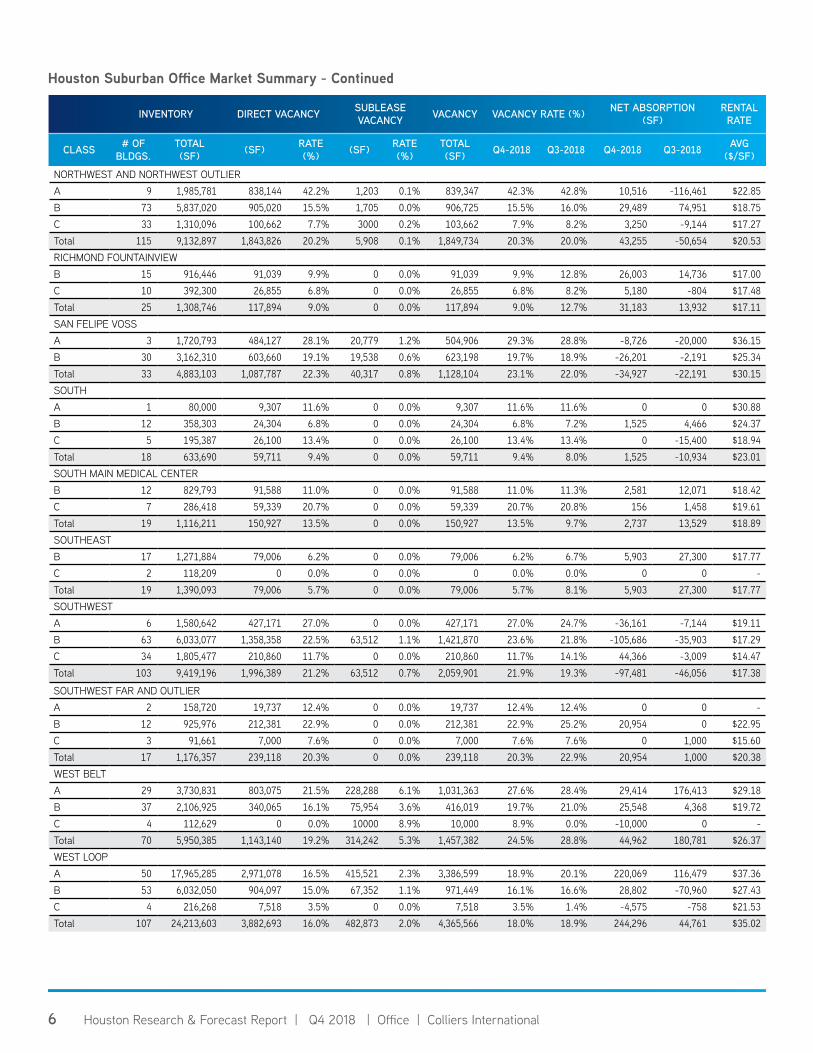
Houston Suburban Office Market Summary - Continued
INVENTORY DIRECT VACANCY SUBLEASE VACANCY VACANCY VACANCY RATE (%) NET ABSORPTION
(SF)RENTAL
RATE
CLASS # OF BLDGS.
TOTAL (SF) (SF) RATE
(%) (SF) RATE (%)
TOTAL (SF) Q4-2018 Q3-2018 Q4-2018 Q3-2018 AVG
($/SF)
FM 1960 A 13 2,968,954 379,329 12.8% 12,512 0.4% 391,841 13.2% 13.4% 7,162 -22,834 $28.26B 70 4,342,065 795,824 18.3% 48,210 1.1% 844,034 19.4% 19.4% -2,632 19,808 $16.37C 23 805,296 97,149 12.1% 0 0.0% 97,149 12.1% 13.6% 12,243 13,448 $14.47Total 106 8,116,315 1,272,302 15.7% 60,722 0.7% 1,333,024 16.4% 16.8% 16,773 10,422 $19.77GREENWAY PLAZAA 21 7,429,743 1,317,897 17.7% 70,952 1.0% 1,388,849 18.7% 18.7% 1,180 57,979 $36.26B 31 3,103,161 283,727 9.1% 1,675 0.1% 285,402 9.2% 12.0% 86,933 14,983 $26.86C 13 433,479 34,203 7.9% 0 0.0% 34,203 7.9% 8.2% 1,357 13,549 $22.16Total 65 10,966,383 1,635,827 14.9% 72,627 0.7% 1,708,454 15.6% 17.5% 89,470 86,511 $34.33GULF FREEWAY PASADENA A 2 105,782 29,975 28.3% 0 0.0% 29,975 28.3% 28.3% 0 0 -B 44 2,487,156 231,163 9.3% 10,555 0.4% 241,718 9.7% 10.9% 28,710 37,743 $21.96C 26 982,194 131,625 13.4% 0 0.0% 131,625 13.4% 10.7% -26,740 528 $23.35Total 72 3,575,132 392,763 11.0% 10,555 0.3% 403,318 11.3% 14.6% 1,970 38,271 $20.75I-10 EASTB 6 427,851 63,335 14.8% 0 0.0% 63,335 14.8% 17.4% 11,181 22,668 $17.17C 6 266,929 0 0.0% 0 0.0% 0 0.0% 4.9% 13,000 0 -Total 12 694,780 63,335 9.1% 0 0.0% 63,335 9.1% 16.3% 24,181 22,668 $17.17KATY FREEWAYA 95 23,278,021 3,575,765 15.4% 1,497,131 6.4% 5,072,896 21.8% 24.8% 703,436 122,403 $36.55B 101 9,261,588 1,984,531 21.4% 142,977 1.5% 2,127,508 23.0% 23.4% 36,609 30,961 $22.26C 29 1,363,282 109,791 8.1% 4,596 0.3% 114,387 8.4% 8.7% 4,517 -5,439 $19.87Total 225 33,902,891 5,670,087 16.7% 1,644,704 4.9% 7,314,791 21.6% 22.0% 744,562 147,925 $31.23KATY GRAND PARKWAYA 17 1,629,940 224,903 13.8% 8,302 0.5% 233,205 14.3% 16.8% 40,482 39,004 $27.83B 16 1,042,144 30,607 2.9% 0 0.0% 30,607 2.9% 2.4% -5,143 -2,465 $21.74C 2 149,262 0 0.0% 0 0.0% 0 0.0% 0.0% 0 0 -Total 35 2,821,346 255,510 9.1% 8,302 0.3% 263,812 9.4% 10.1% 35,339 36,539 $27.10KINGWOOD HUMBLEB 19 1,285,693 72,357 5.6% 100 0.0% 72,457 5.6% 6.9% 15,896 -7,242 $21.61C 5 159,105 12,903 8.1% 0 0.0% 12,903 8.1% 8.1% -25 800 $18.16Total 24 1,444,798 85,260 5.9% 100 0.0% 85,360 5.9% 6.2% 15,871 -6,442 $21.09NASA CLEAR LAKE A 12 1,778,721 187,603 10.5% 2,390 0.1% 189,993 10.7% 9.6% -18,894 -5,116 $26.21B 46 3,060,111 856,440 28.0% 0 0.0% 856,440 28.0% 27.6% -12,166 4,699 $20.22C 17 511,488 66,597 13.0% 0 0.0% 66,597 13.0% 14.7% 8,694 -4,849 $16.98Total 75 5,350,320 1,110,640 20.8% 2,390 0.0% 1,113,030 20.8% 22.9% -22,366 -5,266 $21.04NORTH BELT GREENSPOINT
A 25 5,522,618 3,338,681 60.5% 34,914 0.6% 3,373,595 61.1% 62.3% 64,775 -9,176 $22.11B 58 5,938,207 1,868,509 31.5% 28,157 0.5% 1,896,666 31.9% 32.1% 8,007 36,773 $15.75C 22 1,433,108 248,786 17.4% 2,757 0.2% 251,543 17.6% 15.6% -27,360 39,573 $12.68Total 105 12,893,933 5,455,976 42.3% 65,828 0.5% 5,521,804 42.8% 44.3% 45,422 67,170 $19.50NORTHEAST NEAR AND OUTLIERA 3 642,223 21,702 3.4% 0 0.0% 21,702 3.4% 3.4% 0 0 -B 6 243,799 41,938 17.2% 8,000 3.3% 49,938 20.5% 14.2% -15,430 -9,146 $21.69C 2 56,562 15,843 28.0% 0 0.0% 15,843 28.0% 21.3% -3,808 -1,819 $15.00Total 11 942,584 79,483 8.4% 8,000 0.8% 87,483 9.3% 6.3% -19,238 -10,965 $14.43
6 Houston Research & Forecast Report | Q4 2018 | Office | Colliers International
Houston Suburban Office Market Summary - Continued
INVENTORY DIRECT VACANCY SUBLEASE VACANCY VACANCY VACANCY RATE (%) NET ABSORPTION
(SF)RENTAL
RATE
CLASS # OF BLDGS.
TOTAL (SF) (SF) RATE
(%) (SF) RATE (%)
TOTAL (SF) Q4-2018 Q3-2018 Q4-2018 Q3-2018 AVG
($/SF)
NORTHWEST AND NORTHWEST OUTLIERA 9 1,985,781 838,144 42.2% 1,203 0.1% 839,347 42.3% 42.8% 10,516 -116,461 $22.85B 73 5,837,020 905,020 15.5% 1,705 0.0% 906,725 15.5% 16.0% 29,489 74,951 $18.75C 33 1,310,096 100,662 7.7% 3000 0.2% 103,662 7.9% 8.2% 3,250 -9,144 $17.27Total 115 9,132,897 1,843,826 20.2% 5,908 0.1% 1,849,734 20.3% 20.0% 43,255 -50,654 $20.53RICHMOND FOUNTAINVIEWB 15 916,446 91,039 9.9% 0 0.0% 91,039 9.9% 12.8% 26,003 14,736 $17.00C 10 392,300 26,855 6.8% 0 0.0% 26,855 6.8% 8.2% 5,180 -804 $17.48Total 25 1,308,746 117,894 9.0% 0 0.0% 117,894 9.0% 12.7% 31,183 13,932 $17.11SAN FELIPE VOSSA 3 1,720,793 484,127 28.1% 20,779 1.2% 504,906 29.3% 28.8% -8,726 -20,000 $36.15B 30 3,162,310 603,660 19.1% 19,538 0.6% 623,198 19.7% 18.9% -26,201 -2,191 $25.34Total 33 4,883,103 1,087,787 22.3% 40,317 0.8% 1,128,104 23.1% 22.0% -34,927 -22,191 $30.15SOUTH A 1 80,000 9,307 11.6% 0 0.0% 9,307 11.6% 11.6% 0 0 $30.88B 12 358,303 24,304 6.8% 0 0.0% 24,304 6.8% 7.2% 1,525 4,466 $24.37C 5 195,387 26,100 13.4% 0 0.0% 26,100 13.4% 13.4% 0 -15,400 $18.94Total 18 633,690 59,711 9.4% 0 0.0% 59,711 9.4% 8.0% 1,525 -10,934 $23.01SOUTH MAIN MEDICAL CENTERB 12 829,793 91,588 11.0% 0 0.0% 91,588 11.0% 11.3% 2,581 12,071 $18.42C 7 286,418 59,339 20.7% 0 0.0% 59,339 20.7% 20.8% 156 1,458 $19.61Total 19 1,116,211 150,927 13.5% 0 0.0% 150,927 13.5% 9.7% 2,737 13,529 $18.89SOUTHEASTB 17 1,271,884 79,006 6.2% 0 0.0% 79,006 6.2% 6.7% 5,903 27,300 $17.77C 2 118,209 0 0.0% 0 0.0% 0 0.0% 0.0% 0 0 -Total 19 1,390,093 79,006 5.7% 0 0.0% 79,006 5.7% 8.1% 5,903 27,300 $17.77SOUTHWESTA 6 1,580,642 427,171 27.0% 0 0.0% 427,171 27.0% 24.7% -36,161 -7,144 $19.11B 63 6,033,077 1,358,358 22.5% 63,512 1.1% 1,421,870 23.6% 21.8% -105,686 -35,903 $17.29C 34 1,805,477 210,860 11.7% 0 0.0% 210,860 11.7% 14.1% 44,366 -3,009 $14.47Total 103 9,419,196 1,996,389 21.2% 63,512 0.7% 2,059,901 21.9% 19.3% -97,481 -46,056 $17.38
SOUTHWEST FAR AND OUTLIER A 2 158,720 19,737 12.4% 0 0.0% 19,737 12.4% 12.4% 0 0 -B 12 925,976 212,381 22.9% 0 0.0% 212,381 22.9% 25.2% 20,954 0 $22.95C 3 91,661 7,000 7.6% 0 0.0% 7,000 7.6% 7.6% 0 1,000 $15.60Total 17 1,176,357 239,118 20.3% 0 0.0% 239,118 20.3% 22.9% 20,954 1,000 $20.38WEST BELTA 29 3,730,831 803,075 21.5% 228,288 6.1% 1,031,363 27.6% 28.4% 29,414 176,413 $29.18B 37 2,106,925 340,065 16.1% 75,954 3.6% 416,019 19.7% 21.0% 25,548 4,368 $19.72C 4 112,629 0 0.0% 10000 8.9% 10,000 8.9% 0.0% -10,000 0 -Total 70 5,950,385 1,143,140 19.2% 314,242 5.3% 1,457,382 24.5% 28.8% 44,962 180,781 $26.37WEST LOOPA 50 17,965,285 2,971,078 16.5% 415,521 2.3% 3,386,599 18.9% 20.1% 220,069 116,479 $37.36B 53 6,032,050 904,097 15.0% 67,352 1.1% 971,449 16.1% 16.6% 28,802 -70,960 $27.43C 4 216,268 7,518 3.5% 0 0.0% 7,518 3.5% 1.4% -4,575 -758 $21.53Total 107 24,213,603 3,882,693 16.0% 482,873 2.0% 4,365,566 18.0% 18.9% 244,296 44,761 $35.02
7 Houston Research & Forecast Report | Q4 2018 | Office | Colliers International7
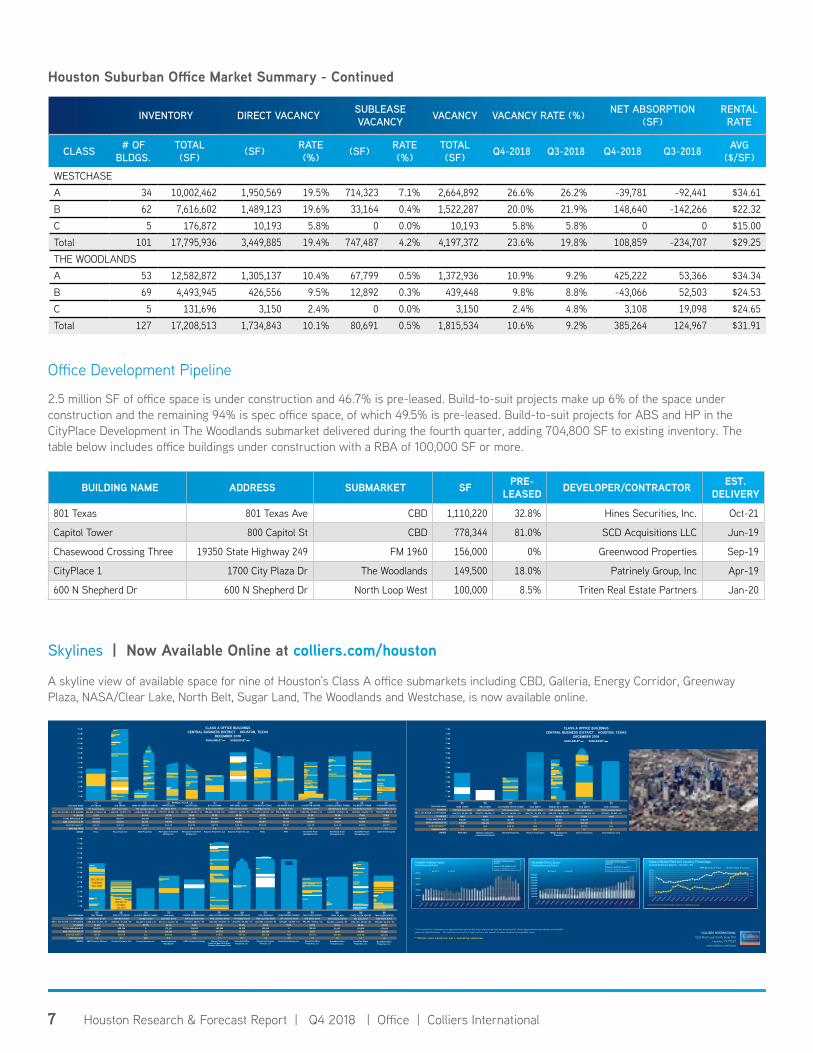
Office Development Pipeline
2.5 million SF of office space is under construction and 46.7% is pre-leased. Build-to-suit projects make up 6% of the space under construction and the remaining 94% is spec office space, of which 49.5% is pre-leased. Build-to-suit projects for ABS and HP in the CityPlace Development in The Woodlands submarket delivered during the fourth quarter, adding 704,800 SF to existing inventory. The table below includes office buildings under construction with a RBA of 100,000 SF or more.
BUILDING NAME ADDRESS SUBMARKET SF PRE-LEASED DEVELOPER/CONTRACTOR EST.
DELIVERY
801 Texas 801 Texas Ave CBD 1,110,220 32.8% Hines Securities, Inc. Oct-21
Capitol Tower 800 Capitol St CBD 778,344 81.0% SCD Acquisitions LLC Jun-19
Chasewood Crossing Three 19350 State Highway 249 FM 1960 156,000 0% Greenwood Properties Sep-19
CityPlace 1 1700 City Plaza Dr The Woodlands 149,500 18.0% Patrinely Group, Inc Apr-19
600 N Shepherd Dr 600 N Shepherd Dr North Loop West 100,000 8.5% Triten Real Estate Partners Jan-20
Houston Suburban Office Market Summary - Continued
INVENTORY DIRECT VACANCY SUBLEASE VACANCY VACANCY VACANCY RATE (%) NET ABSORPTION
(SF)RENTAL
RATE
CLASS # OF BLDGS.
TOTAL (SF) (SF) RATE
(%) (SF) RATE (%)
TOTAL (SF) Q4-2018 Q3-2018 Q4-2018 Q3-2018 AVG
($/SF)
WESTCHASEA 34 10,002,462 1,950,569 19.5% 714,323 7.1% 2,664,892 26.6% 26.2% -39,781 -92,441 $34.61B 62 7,616,602 1,489,123 19.6% 33,164 0.4% 1,522,287 20.0% 21.9% 148,640 -142,266 $22.32C 5 176,872 10,193 5.8% 0 0.0% 10,193 5.8% 5.8% 0 0 $15.00Total 101 17,795,936 3,449,885 19.4% 747,487 4.2% 4,197,372 23.6% 19.8% 108,859 -234,707 $29.25THE WOODLANDS A 53 12,582,872 1,305,137 10.4% 67,799 0.5% 1,372,936 10.9% 9.2% 425,222 53,366 $34.34B 69 4,493,945 426,556 9.5% 12,892 0.3% 439,448 9.8% 8.8% -43,066 52,503 $24.53C 5 131,696 3,150 2.4% 0 0.0% 3,150 2.4% 4.8% 3,108 19,098 $24.65Total 127 17,208,513 1,734,843 10.1% 80,691 0.5% 1,815,534 10.6% 9.2% 385,264 124,967 $31.91
2 31600 TRAVIS
600 Travis Street1,656,529 / 22,575 / 75
83.7%520,774213,678$43.40
1.0Texas Tower Ltd
717 TEXAS717 Texas Avenue
696,228 / 27,500 / 3347.7%
355,908355,908$45.75
1.3Hines
BANK OF AMERICA CENTER700 Louisiana Street
1,268,480 / 25,000 / 5690.0%
396,38386,435$44.49
2.0M-M Properties
BUILDING NAMEADDRESS
RBA / AVG FLOOR / # OF FLOORS% LEASED
TOTAL AVAILABLE SFMAX CONTIGUOUS SF
QUOTED RATE**PARKING RATIO
OWNER
AVAILABLE* SUBLEASE*
5
10
15
20
25
30
35
40
45
50
55
60
65
70
75
TWO ALLEN CENTER1200 Smith Street
995,623 / 26,613 / 3690.1%
433,608171,358$45.58
1.0Brook�eld O�ceProperties, Inc.
THREE ALLEN CENTER333 Clay Street
1,194,719 / 25,000 /5088.6%
253,81848,560$46.48
1.0Brook�eld O�ceProperties, Inc.
1100 LOUISIANA1100 Louisiana Street
1,327,882 / 23,060 / 5599.4%
299,435202,680$45.00
1.8Enterprise Products
Partners L.P.
HERITAGE PLAZA1111 Bagby Street
1,212,895 / 26,652 / 5199.4%36,35536,355$51.06
2.4Brook�eld O�ceProperties, Inc.
CENTERPOINT ENERGY1111 Louisiana Street
1,081,251 / 22,968 / 47100%
00
N/A2.5
CenterPoint Energy, Inc.
ONE ALLEN CENTER500 Dallas Street
993,297 / 29,214 / 3483.5%199,26170,171
$46.531.0
Brook�eld O�ceProperties, Inc.
KINDER MORGAN BLDG.1001 Louisiana Street937,003 / 28,510 / 32
100%124,600124,600
N/A1.0
EPEC Property Holdings
TOTAL PLAZA1201 Louisiana Street
843,533 / 24,600 / 3599.0%29,4037,272
$39.801.0
Brook�eld O�ceProperties, Inc.
1918 2322 262120 24 25WELLS FARGO PLAZA1000 Louisiana Street
1,721,242 / 25,000 / 7178.6%
483,858101,773$49.15
1.7Clarion Partners on
behalf of New York StateCommon Retirement Fund
BUILDING NAMEADDRESS
RBA / AVG FLOOR / # OF FLOORS% LEASED
TOTAL AVAILABLE SFMAX CONTIGUOUS SF
QUOTED RATE**PARKING RATIO
OWNER
5
10
15
20
25
30
35
40
45
50
55
60
65
70
75
BG GROUP PLACE811 Main Street
972,474 / 27,000 / 4692.0%77,42053,435$51.91
1.2NPS
ONE SHELL PLAZA910 Louisiana Street
1,228,923 / 24,572 / 5088.7%
400,868158,813$45.24
0.3Busycon Properties LLC
NORTH BLDG700 Milam Street
679,337 / 20,523 / 3660.9%252,713142,954$44.99
3.0Metropolis Investment
Holdings Inc.
2 HOUSTON CENTER909 Fannin Street
1,024,956 / 25,624 / 4051.9%
510,553309,966$43.75
1.0Brook�eld Asset Management Inc.
LYONDELLBASELL TOWER1221 McKinney Street
1,061,351 / 23,500 / 4690.8%
100,79424,301$44.20
1.0Brook�eld Asset Management Inc.
811 LOUISIANA811 Louisiana Street
588,423 / 31,500 / 2652.9%
274,524220,529$41.93
2.0Busycon Properties LLC
SOUTH BLDG711 Louisiana Street
664,940 / 20,000 / 3478.4%
265,203102,136$44.99
3.0Metropolis Investment
Holdings Inc.
FULBRIGHT TOWER1301 McKinney Street
1,247,061 / 24,452 / 5175.4%
416,85875,376$45.18
1.0Brook�eld Asset Management Inc.
5 HOUSTON CENTER1401 McKinney Street580,875 / 29,649 / 27
91.6%191,972147,790$49.75
2.0Spear Street Capital
1110 13124 5 96 7PENNZOIL PLACE609 MAIN at TEXAS
609 Main Street1,056,658 / 28,000 / 48
69.0%317,135255,911$52.00
1.7Hines
8
ONE CITY CENTRE1021 Main Street
608,660 / 21,266 / 2975.7%
425,326203,083$30.09
2.3Accesso Partners, LLC
1000 MAIN1000 Main Street
837,161 / 23,333 / 3680.7%175,321144,394$52.06
2.0Union Investment
Real Estate
1001 FANNIN1001 Fannin Street
1,385,212 / 27,210 / 4996.6%
596,939354,330$44.51
1.0JMB Financial Advisors
171514HILCORP ENERGY TOWER
1111 Main Street406,600 / 17,678 / 23
95.7%00
N/AN/A
Hilcorp Ventures Inc.
16
CLASS A OFFICE BUILDINGSCENTRAL BUSINESS DISTRICT HOUSTON, TEXAS
DECEMBER 2018
Available June 2019147,790 SF
354,330 SFAvailable Nov 2021
203,083 SFAvailable Jan 2021
AVAILABLE* SUBLEASE*
BUILDING NAMEADDRESS
RBA / AVG FLOOR / # OF FLOORS% LEASED
TOTAL AVAILABLE SFMAX CONTIGUOUS SF
QUOTED RATE**PARKING RATIO
OWNER
1500 LOUISIANA1500 Louisiana Street
1,157,690 / 25,263 / 40100%
00
N/A1.1
ChevronTexaco Corp.
1301 FANNIN OFFICE TOWER1301 Fannin Street
784,143 / 26,000 / 2489.1%
126,28752,544$38.63
1.0Netrality Properties
1400 SMITH1400 Smith Street
1,266,714 / 24,578 / 50100%
00
N/AN/A
Chevron Corporation
1600 SMITH1600 Smith Street
1,098,399 / 23,000 /5153.8%
508,039280,593$37.97
1.0Oracle Corporation
WEDGE INT’L TOWER1415 Louisiana Street520,475 / 18,000 / 43
48.5%283,04261,186
$33.072.7
Wedge CommercialProperties
HESS TOWER1501 McKinney Street844,763 / 30,500 /29
100%215,887215,887
N/A1.7
H&R REIT
NRG TOWER1201 Fannin Street
275,223 / 25,020 / 11100%
262,325262,325
N/A1.5
Midway Companies/Lionstone Investments
29 3027 3128 32 33
5
10
15
20
25
30
35
40
45
50
55
60
65
70
75 CLASS A OFFICE BUILDINGSCENTRAL BUSINESS DISTRICT HOUSTON, TEXAS
DECEMBER 2018
28
2
3
4 51
10
9
7
6
8
27
1716
15
14
25 2120
29
2426
19
1218
13
11
22
2330
3132
33
*Gold and white indicators are approximate only at the time of printing and are presented to show approximate percentage of availablespace by �oor/building. All indicators are left-to-right and are not meant to show location of available space.
**Rental rates listed are net + operating expenses.
COLLIERS INTERNATIONAL1233 West Loop South, Suite 900
Houston, TX 77027www.colliers.com/texas
0
1,000,000
2,000,000
3,000,000
4,000,000
5,000,000
6,000,000
7,000,000
8,000,000
9,000,000
Available Direct SpaceCentral Business District
Class A Class B
Available Direct SpaceQ4 2018
Class A: 8,627,277 SF or 25.1%Class B: 2,996,457 SF or 30.2%
0
500,000
1,000,000
1,500,000
2,000,000
2,500,000
Available Sublease SpaceCentral Business District
Class A Class B
Available Sublease SpaceQ4 2018
Class A: 1,551,3544 SF or 4.5%Class B: 308,348 SF or 3.1%
6.0%
8.0%
10.0%
12.0%
14.0%
16.0%
18.0%
20.0%
22.0%
$22.00$24.00$26.00$28.00$30.00$32.00$34.00$36.00$38.00$40.00$42.00$44.00$46.00$48.00
Class A Rental Rate and Vacancy Percentage Central Business District - Houston, TX
CBD Class A Rents CBD Class A Vacancy
*Vacancy percentage includes direct and sublease space.
Skylines | Now Available Online at colliers.com/houston
A skyline view of available space for nine of Houston’s Class A office submarkets including CBD, Galleria, Energy Corridor, Greenway Plaza, NASA/Clear Lake, North Belt, Sugar Land, The Woodlands and Westchase, is now available online.
8 North American Research & Forecast Report | Q4 2014 | Office Market Outlook | Colliers International
Copyright © 2015 Colliers International.The information contained herein has been obtained from sources deemed reliable. While every reasonable effort has been made to ensure its accuracy, we cannot guarantee it. No responsibility is assumed for any inaccuracies. Readers are encouraged to consult their professional advisors prior to acting on any of the material contained in this report.
Colliers International | Market000 Address, Suite # 000 Address, Suite #+1 000 000 0000colliers.com/<<market>>
8 North American Research & Forecast Report | Q4 2014 | Office Market Outlook | Colliers International
Copyright © 2019 Colliers International.The information contained herein has been obtained from sources deemed reliable. While every reasonable effort has been made to ensure its accuracy, we cannot guarantee it. No responsibility is assumed for any inaccuracies. Readers are encouraged to consult their professional advisors prior to acting on any of the material contained in this report.
Colliers International | Houston1233 West Loop South, Suite 900 Houston, Texas 77027+1 713 222 2111colliers.com/houston
FOR MORE INFORMATIONLisa Bridges, CPRCDirector of Market Research | Houston+1 713 830 [email protected]
Colliers statistical criteria includes all general purpose multi and single tenant office buildings 20,000 SF or greater.
Beth Staggs CPRC, CPMCResearch Coordinator | Houston+1 713 830 [email protected]
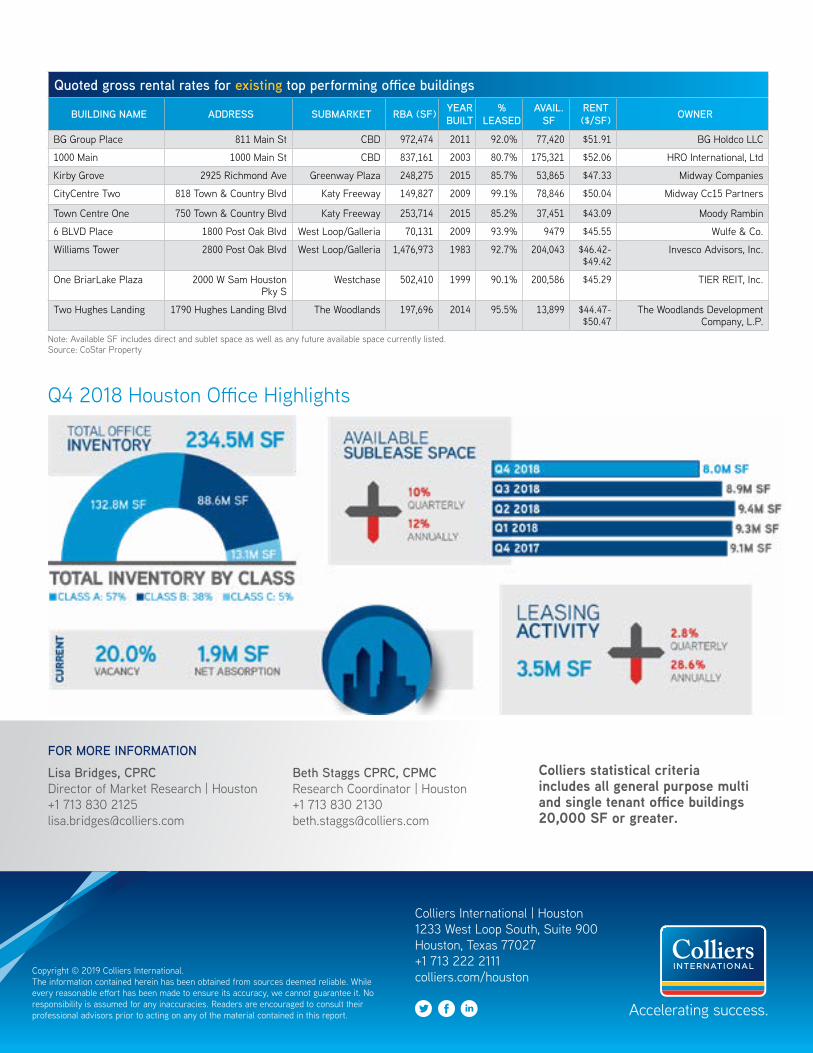
Quoted gross rental rates for existing top performing office buildings
BUILDING NAME ADDRESS SUBMARKET RBA (SF) YEAR BUILT
% LEASED
AVAIL. SF
RENT($/SF) OWNER
BG Group Place 811 Main St CBD 972,474 2011 92.0% 77,420 $51.91 BG Holdco LLC
1000 Main 1000 Main St CBD 837,161 2003 80.7% 175,321 $52.06 HRO International, Ltd
Kirby Grove 2925 Richmond Ave Greenway Plaza 248,275 2015 85.7% 53,865 $47.33 Midway Companies
CityCentre Two 818 Town & Country Blvd Katy Freeway 149,827 2009 99.1% 78,846 $50.04 Midway Cc15 Partners
Town Centre One 750 Town & Country Blvd Katy Freeway 253,714 2015 85.2% 37,451 $43.09 Moody Rambin
6 BLVD Place 1800 Post Oak Blvd West Loop/Galleria 70,131 2009 93.9% 9479 $45.55 Wulfe & Co.
Williams Tower 2800 Post Oak Blvd West Loop/Galleria 1,476,973 1983 92.7% 204,043 $46.42-$49.42
Invesco Advisors, Inc.
One BriarLake Plaza 2000 W Sam Houston Pky S
Westchase 502,410 1999 90.1% 200,586 $45.29 TIER REIT, Inc.
Two Hughes Landing 1790 Hughes Landing Blvd The Woodlands 197,696 2014 95.5% 13,899 $44.47-$50.47
The Woodlands Development Company, L.P.
Note: Available SF includes direct and sublet space as well as any future available space currently listed. Source: CoStar Property
Q4 2018 Houston Office Highlights

Our philosophyrevolves around the fact
that the bestpossible results come
from linking our globalenterprise with
local advisors whounderstand your
business, your market,and how to
integrate real estateinto a successfulbusiness strategy.
C O L L I E R S I N T E R N A T I O N A L G L O B A L L O C A T I O N S
COMMERCIAL REAL ESTATE SECTORS REPRESENTED
OFF
ICE
IND
US
TR
IAL
LAN
D
RE
TAIL
HE
ALT
HC
AR
E
MU
LTIF
AM
ILY
HO
TE
L
$127BTRANSACTION VALUE
2BSF UNDER MANAGEMENT
$3.3BIN REVENUE
438OFFICES
17,300PROFESSIONALS
340ACCREDITED MEMBERS
68COUNTRIES
SIOR
ADVANTAGEColliers International (NASDAQ, TSX: CIGI) is a leading global real estate services and investment management company. With operations in 68 countries, our 14,000 enterprising people work collaboratively to provide expert advice and services to maximize the value of property for real estate occupiers, owners and investors. For more than 20 years, our experienced leadership team, owning more than 40% of our equity, have delivered industry-leading investment returns for shareholders. In 2018, corporate revenues were $2.8 billion ($3.3 billion including a�liates), with more than $26 billion of assets under management.
Colliers professionals think di�erently, share great ideas and o�er thoughtful and innovative advice to accelerate the success of its clients. Colliers has been ranked among the top 100 global outsourcing �rms by the International Association of Outsourcing Professionals for 13 consecutive years, more than any other real estate services �rm. Colliers is ranked the number one property manager in the world by Commercial Property Executive for two years in a row.
Related Documents