Trends in the Pharmaceutical Treatment of Children’s Asthma, 1997 to 2008 Agency for Healthcare Research and Quality U.S. Department of Health & Human Services September 2011

Welcome message from author
This document is posted to help you gain knowledge. Please leave a comment to let me know what you think about it! Share it to your friends and learn new things together.
Transcript
Trends in the Pharmaceutical Treatment of Children’s Asthma, 1997 to 2008
Agency for Healthcare Research and Quality
U.S. Department of Health & Human Services September 2011

ii
ABSTRACT
This report uses nationally representative data from the 1997–2008 Medical Expenditure Panel Survey (MEPS) to examine trends in children’s use and expenditures for asthma medications. We begin by examining trends in the treated prevalence of asthma among all children, ages 0 through 17, in the U.S. civilian, non-institutionalized population. Then, among children with reported treatment for asthma, we examine trends in use and expenditures for three major types of medications—controllers, relievers, and oral corticosteroids (OCS). We find that from 1997–1998 to 2007–2008, the total number (proportion) of children reporting treatment for asthma increased from 3.4 million (4.7 percent) to 4.5 million (6.1 percent). We also observe significant changes in children’s use of asthma
medications. From 1997–1998 to 2007–2008, the proportion of children with reported treatment for asthma who used controllers, the recommended treatment for persistent asthma, nearly doubled from 29.4 to 58.3 percent. In both 1997–1998 and 2007–
2008, about two-thirds of children with reported treatment for asthma used at least one reliever per year, but the proportion that used relievers, and had no controller use, declined from 43.8 to 30.4 percent. Over the same period, the proportion using OCS, which are used to treat severe asthma symptoms, dropped by almost half from 17.1 to 8.7 percent. After adjusting for inflation, average annual total expenditures for all prescribed asthma medications more than quadrupled from $527 million in 1997–
1998 to $2.5 billion in 2007–2008, while average expenditures per user more than tripled from $207 to $605 per year. Expenditures for controllers accounted for about 90 percent of increased spending. In addition to aggregate trends, this report also examines trends within and differences across subgroups of children with reported treatment for asthma. We find that increased use of controllers was widespread, occurring in every subgroup of children we examined. We also find, however, that differences in controller use persisted in 2007–2008, as minority, publicly insured and poor and low income children were less likely than others to use these recommended medications and were more likely to use relievers only to treat their asthma. Suggested Citation Miller G. E. and Sarpong E. M. Trends in the Pharmaceutical Treatment of
Children’s Asthma, 1997 to 2008. Research Findings No. 31. September 2011. Agency for Healthcare Research and Quality, Rockville, MD. http://meps.ahrq.gov/mepsweb/data_files/publications/rf31/rf.pdf
∗ ∗ ∗
The estimates in this report are based on the most recent data available at the time the report was written. However, selected elements of MEPS data may be revised on the basis of additional analyses, which could result in slightly different estimates from those shown here. Please check the MEPS Web site for the most current file releases. Center for Financing, Access, and Cost Trends Agency for Healthcare Research and Quality 540 Gaither Road Rockville, MD 20850 http://www.meps.ahrq.gov/

iii
The Medical Expenditure Panel Survey (MEPS) Background The Medical Expenditure Panel Survey (MEPS) is conducted to provide nationally representative estimates of health care use, expenditures, sources of payment, and insurance coverage for the U.S. civilian noninstitutionalized population. MEPS is co-sponsored by the Agency for Healthcare Research and Quality (AHRQ), formerly the Agency for Health Care Policy and Research, and the National Center for Health Statistics (NCHS). MEPS comprises three component surveys: the Household Component (HC), the Medical Provider Component (MPC), and the Insurance Component (IC). Together these surveys yield comprehensive data that provide national estimates of the level and distribution of health care use and expenditures, support health services research, and can be used to assess health care policy implications. MEPS is the third in a series of national probability surveys conducted by AHRQ on the financing and use of medical care in the United States. The National Medical Care Expenditure Survey (NMCES) was conducted in 1977, the National Medical Expenditure Survey (NMES) in 1987. Beginning in 1996, MEPS continues this series with design enhancements and efficiencies that provide a more current data resource to capture the changing dynamics of the health care delivery and insurance system. The design efficiencies incorporated into MEPS are in accordance with the Department of Health and Human Services (DHHS) Survey Integration Plan of June 1995, which focused on consolidating DHHS surveys, achieving cost efficiencies, reducing respondent burden, and enhancing analytical capacities. To accommodate these goals, MEPS design features include linkage with the National Health Interview Survey (NHIS), from which the sample for the MEPS-HC is drawn, and enhanced longitudinal data collection for core survey components. The MEPS-HC augments NHIS by selecting a sample of NHIS respondents, collecting additional data on their health care expenditures, and linking these data with additional information collected from the respondents’ medical providers, employers, and insurance
providers. Household Component The MEPS-HC, a nationally representative survey of the U.S. civilian noninstitutionalized population, collects medical expenditure data at both the person and household levels. The HC collects detailed data on demographic characteristics, health conditions, health status, use of medical care services, charges and payments, access to care, satisfaction with care, health insurance coverage, income, and employment. The HC uses an overlapping panel design in which data are collected through a preliminary contact followed by a series of five rounds of interviews over a two-and-a-half year period. Using computer-assisted personal interviewing (CAPI) technology, data on medical expenditures and use for two calendar years are collected from each household. This series of data collection rounds is launched each subsequent year on a new sample of households to provide overlapping panels of survey data and, when combined with other ongoing panels, will provide continuous and current estimates of health care expenditures. The sampling frame for the MEPS-HC is drawn from respondents to NHIS, conducted by NCHS. NHIS provides a nationally representative sample of the U.S. civilian noninstitutionalized population, with oversampling of Hispanics and blacks.

iv
Medical Provider Component The MEPS-MPC supplements and validates information on medical care events reported in the MEPS-HC by contacting medical providers and pharmacies identified by household respondents. The MPC sample includes all hospitals, hospital physicians, home health agencies, and pharmacies reported in the HC. Also included in the MPC are all office-based physicians:
Providing care for HC respondents receiving Medicaid. Associated with a 75 percent sample of households receiving care through an HMO (health
maintenance organization) or managed care plan. Associated with a 25 percent sample of the remaining households. Data are collected on medical
and financial characteristics of medical and pharmacy events reported by HC respondents, including:
Diagnoses coded according to ICD-9 (9th Revision, International Classification of Diseases)
and DSMIV (Fourth Edition, Diagnostic and Statistical Manual of Mental Disorders). Physician procedure codes classified by CPT-4 (Current Procedural Terminology, Version 4). Inpatient stay codes classified by DRG (diagnosis related group). Prescriptions coded by national drug code (NDC), medication names, strength, and quantity
dispensed. Charges, payments, and the reasons for any difference between charges and payments.
The MPC is conducted through telephone interviews and mailed survey materials. Insurance Component The MEPS-IC collects data on health insurance plans obtained through private and public sector employers. Data obtained in the IC include the number and types of private insurance plans offered, benefits associated with these plans, premiums, contributions by employers and employees, and employer characteristics. Establishments participating in the MEPS-IC are selected through two sampling frames:
A Bureau of the Census list frame of private sector business establishments The Census of Governments from the U.S. Census Bureau
Data from these sampling frames are collected to provide annual national and state estimates of the supply of private health insurance available to American workers and to evaluate policy issues pertaining to health insurance. Since 2000, the Bureau of Economic Analysis has used national estimates of employer contributions to group health insurance from the MEPS-IC in the computation of Gross Domestic Product (GDP). The MEPS-IC is an annual panel survey. Data are collected from the selected organizations through a prescreening telephone interview, a mailed questionnaire, and a telephone follow-up for non-respondents.
v
Survey Management MEPS data are collected under the authority of the Public Health Service Act. They are edited and published in accordance with the confidentiality provisions of this act and the Privacy Act. NCHS provides consultation and technical assistance. As soon as data collection and editing are completed, the MEPS survey data are released to the public in staged releases of summary reports and microdata files. Summary reports and microdata files are available through the Internet on the MEPS Web site: http://www.meps.ahrq.gov/. For more information, visit the MEPS Web site or e-mail [email protected].
vi
Table of Contents The Medical Expenditure Panel Survey (MEPS) . . . . . . . . . . . . . . . . . . . . . . . . . . . . . . . . . . . . . . . . . . . . . . iii Introduction . . . . . . . . . . . . . . . . . . . . . . . . . . . . . . . . . . . . . . . . . . . . . . . . . . . . . . . . . . . . . . . . . . . . . . . . . . . . . 1
Findings . . . . . . . . . . . . . . . . . . . . . . . . . . . . . . . . . . . . . . . . . . . . . . . . . . . . . . . . . . . . . . . . . . . . . . . . . . . . . . . . 2 Percentage of Children with Reported Treatment for Asthma . . . . . . . . . . . . . . . . . . . . . . . . . . . . . . . . . . . . . 2 Percentage of Children Using Major Classes of Asthma Medications: Controllers, Relievers, and Oral
Corticosteroids . . . . . . . . . . . . . . . . . . . . . . . . . . . . . . . . . . . . . . . . . . . . . . . . . . . . . . . . . . . . . . . . . . . . . . . . 4 Average Annual Expenditures for Children’s Asthma Medications . . . . . . . . . . . . . . . . . . . . . . . . . . . . . . . . 8 Summary and Conclusions . . . . . . . . . . . . . . . . . . . . . . . . . . . . . . . . . . . . . . . . . . . . . . . . . . . . . . . . . . . . . . . . . 10
References . . . . . . . . . . . . . . . . . . . . . . . . . . . . . . . . . . . . . . . . . . . . . . . . . . . . . . . . . . . . . . . . . . . . . . . . . . . . . . . 11
Table 1. Percentage and total number of children with reported treatment for asthma, selected comorbid conditions, and family smoking status, 1997–1998 to 2007–2008 . . . . . . . . . . . . . . . . . . . . . . . . . . . . . . . . . . 13
Table 2. Percentage and total number of children with reported treatment for asthma, by selected population characteristics, 1997–1998 and 2007–2008 . . . . . . . . . . . . . . . . . . . . . . . . . . . . . . . . . . . . . . . . . . . . . . . . . . . 14
Table 3. Percentage of children using controllers, relievers, and oral corticosteroids, among children with reported treatment for asthma, 1997–1998 to 2007–2008 . . . . . . . . . . . . . . . . . . . . . . . . . . . . . . . . . . . . . . . . 15
Table 4. Percentage of children using controllers, relievers, and oral corticosteroids, among children with reported treatment for asthma, by selected population characteristics, 1997–1998 and 2007–2008 . . . . . . . . 16
Table 5. Average annual expenditures (in 2008 U.S. dollars) for asthma medications, among children with reported treatment for asthma, 1997–1998 and 2007–2008 . . . . . . . . . . . . . . . . . . . . . . . . . . . . . . . . . . . . . . . 17
Technical Appendix . . . . . . . . . . . . . . . . . . . . . . . . . . . . . . . . . . . . . . . . . . . . . . . . . . . . . . . . . . . . . . . . . . . . . . . 18
Rounding . . . . . . . . . . . . . . . . . . . . . . . . . . . . . . . . . . . . . . . . . . . . . . . . . . . . . . . . . . . . . . . . . . . . . . . . . . . . . 21 Standard Error Tables . . . . . . . . . . . . . . . . . . . . . . . . . . . . . . . . . . . . . . . . . . . . . . . . . . . . . . . . . . . . . . . . . . . . 22

1
Trends in the Pharmaceutical Treatment of Children’s Asthma,
19971998 to 20072008 G. Edward Miller, PhD and Eric Mensah Sarpong, PhD, Agency for Healthcare Research and Quality Introduction Asthma, a chronic respiratory disease, affects persons of all ages but it is more prevalent among children under the age of 18 than adults in the U.S. (Akinbami, et al., 2007; NHIS, 2007). Children with asthma have chronic inflammation of their airways which results in recurring episodes of coughing, wheezing, breathlessness, and chest tightness. Asthma exacerbations may also involve airflow obstruction. The burden of asthma falls on children and their parents in the form of lost school and work days, lessened quality of life, avoidable emergency room and hospital visits, asthma-related deaths and increased health care costs. According to the National Heart, Lung, and Blood Institute, the estimated costs of asthma in the U.S. in 2007 was $19.7 billion, of which $6.2 billion was attributed to prescription drugs. The pharmacotherapy section of the most recent treatment guidelines from the National Asthma Education and Prevention Program recommend a stepwise approach to asthma management that uses three general types of medications: controllers, relievers, and oral corticosteroids (OCSs)1 (NAEPP-EPR3, 2007). Recommendations call for children with intermittent asthma to use relievers, as required, to treat acute symptoms. Children with persistent asthma may also use relievers in conjunction with controllers. Use of a reliever more than two days per week, however, generally indicates the need to initiate, or intensify, treatment with a controller (NAEPP-EPR3, 2007). Daily anti-inflammatory treatment with an inhaled corticosteroid (ICS), the preferred first-line controller, is the cornerstone of therapy for persistent asthma (O'Connell, 2005; Wechsler, 2009). Children with mild persistent asthma may be treated with low doses of ICSs. Treatment for children with more severe, persistent asthma may be stepped-up by increasing the ICS dose and/or by adjunctive therapy with another class of controller medication. OCSs are used long-term to treat the most severe asthma that doesn’t respond to other medications, or in short
courses to treat severe exacerbations (NAEPP-EPR3, 2007; Wechsler, 2009). Asthma medications are among the most widely used chronic medication in children. Further, the control of asthma and the long-term course of the disease in children are both largely determined by the adequacy of treatment with prescription medications. Given this, it is important to understand how children and their families have responded to recent changes in treatment guidelines and the introduction of new pharmacotherapy.2 In this report, we examine changes in asthma medication use and expenditures among U.S. children with reported treatment for asthma from 19971998 to 20072008 using nationally representative data from the Household Component of the Medical Expenditure Panel Survey (MEPS-HC). We begin by examining the proportion of children with reported treatment for asthma in each two-year period from 19971998 to 20072008. Then, among children with reported treatment for asthma, we examine several measures of drug use and expenditures. First, we examine the percentages of children who used controllers, relievers, and OCS. We examine two measures of reliever use: the percentage of 1 OCSs could be considered a type of controller, but they are typically used in short bursts to control severe exacerbations of asthma, while other controllers are used long-term on a daily basis to manage persistent asthma. For this reason, we analyze OCSs separately from other controller medications. 2 A number of new asthma drugs, new formulations and new combinations first became available just prior to, or during the period of our study. Prominent examples include the FDA approval of the first leukotriene receptor agonists, Zafirlukast (Accolate) and Montelukast (Singulair) in 1996 and 1998, respectively; and the introduction of Fluticsaone-Salmeterol (Advair) and Budesonide-Fomoterol (Symbicort), the first drugs to combine an ICS with an inhaled long-acting beta-agonist, in 2000 and 2006, respectively.

2
children with any use and the percentage that used relievers but did not use controllers. We also report on trends for four commonly used subclasses of controller medications: ICSs, inhaled long-acting beta- agonists (ILABAs), leukotriene receptor agonists (LTRAs), and non-steroidal anti-allergy agents (NSAs). Then we examine aggregate total expenditures, total expenditures per user, and out-of-pocket expenditures per user for all asthma medications and for the three major types of asthma medications. In addition to investigating aggregate trends in drug utilization among children with reported treatment for asthma, we examine asthma medication use in subgroups of this population defined by age, race/ethnicity, sex, family income, health insurance status, perceived health status, MSA status, and Census region. In our discussion of these results we focus on trends within groups, from 19971998 to 20072008, in use and expenditures and differences across groups in use and expenditures in 20072008, but do not discuss differences across groups in 19971998. We use two-year pooled data from 19971998 and 20072008 to increase sample sizes and the precision of our estimates, especially for smaller subgroups. We present average annual estimates for these two time periods. Expenditures for asthma medications for all years are expressed in constant 2008 U.S. dollars. Throughout this report only differences in estimates that are statistically significant at the p < .05 level are discussed in the text (a few where .05<p<.10 are noted). The Technical Appendix provides details on the sample of children with reported treatment for asthma and the definitions of measures used in this report. Findings
Percentage of Children with Reported Treatment for Asthma
Overall
Table 1 presents trends from 19971998 to 20072008 in the proportion and total number of children with reported treatment for asthma, selected comorbidities and family smoking status. Over the period under review, the total number of children who were reported to have treatment for asthma rose from an annual average of 3.4 million in 19971998 to 4.5 million 20072008. This represents an increase of 1.4 percentage points in the treated prevalence of asthma from 4.7 percent of children in the U.S., civilian noninstitutionalized population in 19971998 to 6.1 percent in 20072008.3 Allergens and viral respiratory tract infections are important factors in the development, persistence, and severity of asthma. Exposure to cigarette smoke is associated with wheezing, and is under study as a potential cause of asthma (NAEPP-EPR3, 2007). Among children with reported treatment for asthma, the proportion reporting treatment for respiratory tract infections fell, over the period of our study, from 44.1 to 35.6 percent while the proportion reporting treatment for allergic rhinitis increased from 18.6 to 24.8 percent. In 20072008, a little less than a quarter (24.4 percent) of children with reported treatment for asthma lived with a family member who smoked.
By Selected Population Characteristics
Previous research indicates that the underlying prevalence of asthma in children varies by socioeconomic and demographic characteristics including age, race/ethnicity, sex, income, insurance status, perceived health status, urbanicity, and geographic region (Akinbami et al., 2007; Bloom et al., 2009). In this study we examine the treated prevalence of asthma. Treated prevalence of asthma may vary across groups of

3
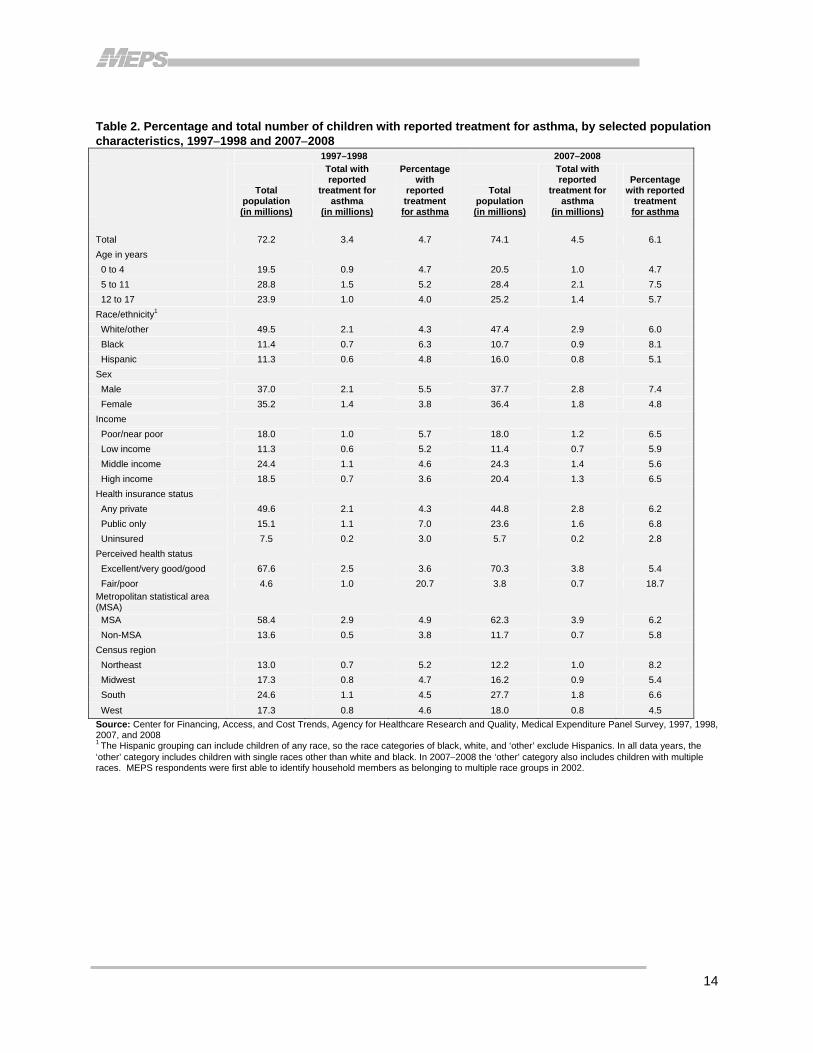
children both because of differences in the underlying prevalence of the disease and because of differences in access to care, attitudes and beliefs regarding the necessity of medical care and other factors that may affect medical care use (Kriner et al., 2003; Poureslami et al. 2007). Table 2 presents the percentage and total number of children with reported treatment for asthma in 19971998 and 20072008 by selected population characteristics. Results show that the treated prevalence of asthma varies across groups of children defined by age, race/ethnicity, sex, health insurance status, perceived health status, and Census regions. Age: Children ages 5 to 11 were more likely (7.5 percent) to be treated for asthma during the period 20072008 than children ages 0 to 4 (4.7 percent) or children ages 12 to 17 (5.7 percent). Between 1997–
1998 and 2007–2008, the proportion of children with reported treatment for asthma increased for children ages 5 to 11 and for children ages 12 to17. Race/ethnicity: During the period 2007–2008, non-Hispanic black children were more likely to be treated for asthma (8.1 percent) than non-Hispanic white/other children (6.0 percent) or Hispanic children (5.1 percent). Between 1997–1998 and 2007–2008, the proportion of children reported to have treatment for asthma increased for white-other non-Hispanic children and for black non-Hispanic children. Sex: Boys (7.4 percent) were more likely to be treated for asthma during the period 20072008 than girls (4.8 percent). The percentage with reported treatment for asthma increased for both boys and girls from 19971998 to 20072008. Income: During 2007–2008, there were no statistically significant differences across income groups in the proportion of children who were reported to have treatment for asthma. From 1997–1998 to 2007–2008, the proportion of children in high income families who were treated for asthma increased from 3.6 to 6.5 percent. Health insurance status: Children with any private insurance (6.2 percent) and children with public insurance only (6.8 percent) were both more likely than uninsured children (2.8 percent) to have reported treatment for asthma in 20072008. Among children with any private insurance, the proportion reporting treatment for asthma increased from 4.3 percent in 19971998 to 6.2 percent in 20072008. Perceived health status: In 20072008, children in fair/poor health (18.7 percent) were more than three times as likely as children in excellent/very good/good health (5.4 percent) to have reported treatment for asthma. From 19971998 to 20072008, the proportion of children in excellent/very good/good health with reported treatment for asthma increased from 3.6 to 5.4 percent. Metropolitan statistical area (MSA): While there was no significant difference between MSA and non-MSA in either time period, the proportion of children with reported treatment for asthma rose, from 19971998 to 20072008, for children in both MSA and non-MSA areas. Census region: During 2007–2008, children living in the West of the U.S. were less likely to have reported treatment for asthma (4.5 percent) than children residing in the South (6.6 percent) or Northeast (8.2 percent). Children living in the Midwest (5.4 percent) were also less likely than those in the Northeast to have reported treatment for asthma. The proportion of children with reported treatment for asthma rose by more than 2.0 percentage points from 1997–1998 to 2007–2008 for children living in the Northeast and the South.

4
Percentage of Children Using Major Classes of Asthma Medications: Controllers, Relievers, and Oral Corticosteroids
Overall
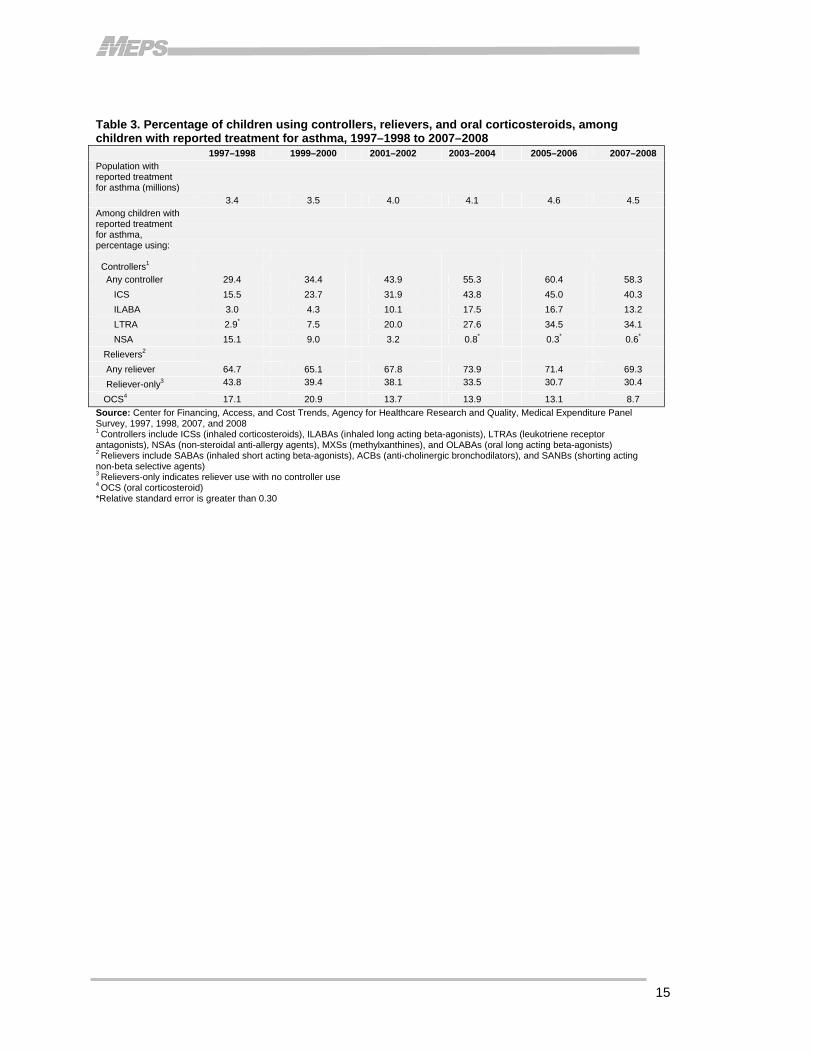
Pharmacotherapy is an essential component of efforts to control, prevent, and relieve asthma symptoms and attacks. In this section, we examine patterns of use for the three major types of asthma medications: controllers, relievers, and OCS. Controllers are used to prevent asthma symptoms, by minimizing inflammation, but they do not provide quick relief of symptoms. Relievers provide prompt relief of symptoms by relaxing airway muscles, but do not address the underlying inflammation, or otherwise control symptoms. Oral corticosteroids can be used long term to treat the most severe cases of asthma, but are more commonly used in short bursts to control severe exacerbations. Use of these drugs is limited by potential side effects (NAEPP-EPR3, 2007). Table 3 presents overall trends from 19971998 to 20072008 in the proportion of children with reported treatment for asthma who used each of these major types of asthma medications. The primary measures of use presented are the percentages of children with asthma using controllers, relievers, and oral corticosteroids (OCSs). Results show that the proportion of children with asthma who used controller medications, the recommended treatment for persistent asthma, nearly doubled from 29.4 percent in 19971998 to 58.3 percent in 20072008. Approximately two-thirds of children reported to have treatment for asthma used at least one reliever per year in both 19971998 (64.7 percent) and in 20072008 (69.3 percent), but the proportion that used relievers, and had no controller use, declined from 43.8 to 30.4 percent. Over the same period, the proportion using OCS dropped from 17.1percent in 19971998 to about one-half that level (8.7 percent) in 20072008. Results also show that there are changing patterns of use for different types of controllers. In 20072008, controller use by U.S. children almost entirely comprised three subclasses: inhaled corticosteroids (ICSs), inhaled long acting beta-agonists (ILABAs) and leukotriene receptor antagonists (LTRAs). Daily anti-inflammatory treatment with an ICS is the cornerstone of therapy for persistent asthma in children of all ages. Children with mild persistent asthma may be treated with low doses of ICS. Treatment for children with more severe, persistent asthma may be stepped-up by increasing the ICS dose and/or by adjunctive therapy with ILABAs or LTRAs. ILABAs complement the anti-inflammatory effect of ICSs by relieving bronchoconstriction of the airway smooth muscle and are only recommended for use in combination with ICSs. LTRAs have both anti-inflammatory and bronchodilating effects (Wechsler, 2009). Results showed rapidly increasing use for all three of these subclasses from 19971998 to 20072008. Among children with treatment for asthma, the percentage using ICSs increased from 15.5 to 40.3, the proportion using ILABAs increased from 3.0 to 13.2 percent, and the proportion using LTRAs increased from 2.9 to 34.1 percent. In contrast to the trends for these subclasses, the proportion of children using the older non-steroidal anti-allergy agents (NSAs) dropped from 15.1 percent in 19971998 to 0.6 percent in 20072008.
5
By Selected Population Characteristics
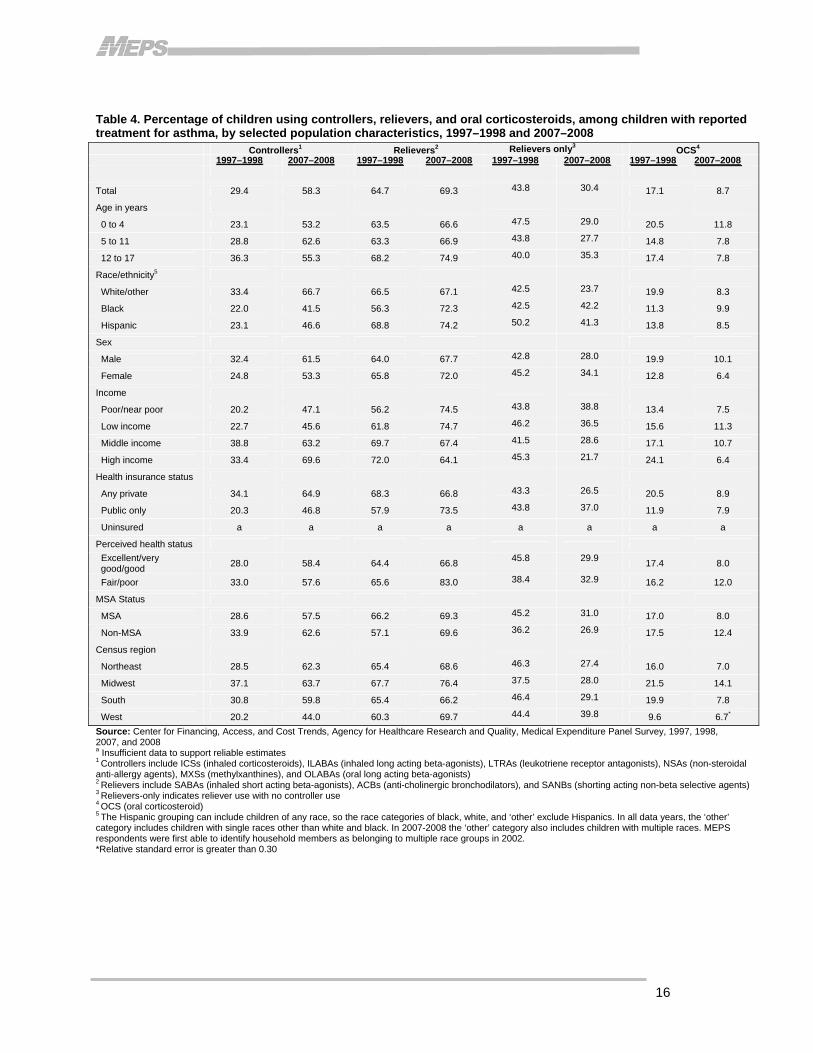
Table 4 presents the percentage of children with reported treatment for asthma who used controllers, relievers, and oral steroids in 19971998 and 2007–2008 by selected population characteristics.
Controllers
Daily anti-inflammatory treatment with controller medications is the recommended treatment for children with persistent asthma. We find that among children reported to have treatment for asthma, the proportion using controllers nearly doubled from 19971998 to 20072008. Further, we find that increased use of controllers was widespread—the proportion of children using controllers increased by 19.0 to 36.2 percentage points in every subgroup of children we examined. We also find differences in controller use in 20072008, across subgroups of children defined by race/ethnicity, sex, income, insurance status, and Census region. Race/ethnicity: During the period 2007–2008, white-other non-Hispanic children were more likely (66.7 percent) to use controllers than black non-Hispanic children (41.5 percent) or Hispanic children (46.6 percent). Sex: Among children with reported treatment for asthma, boys (61.5 percent) were more likely to use controllers in 20072008 than girls (53.3 percent). Income: During the period 20072008, children in poor/near poor families (47.1 percent) and children in low income families (45.6 percent) were less likely than children in middle income (63.2 percent) and high income families (69.6 percent) to use at least one controller medication during the year. Health insurance status: Among children with reported treatment for asthma, those with any private insurance were more likely (64.9 percent) than children with public coverage only (46.8 percent) to use controller medications in 20072008. Census region: During the period 20072008, children living in the West were less likely (44.0 percent) to use controller medications that children living in the Northeast (62.3 percent), Midwest (63.7 percent), or South (59.8 percent).
Relievers
Short-acting beta antagonists (SABAs), a subclass of relievers, are bronchodilators which are the treatment of choice for relief of acute asthma symptoms. SABAs accounted for nearly all of the relievers used by U.S. children during the period of our study. While these medications are invaluable for symptom relief, use of SABAs more than two times per week is one indication of poorly controlled asthma that requires a step up in therapy (NAEPP-EPR3, 2007; Wechsler, 2009). We report on the percentage of children with any reliever use during the year, and also report on the percentage of children that use used relievers only; that is, they used relievers but had no controller use during the year. Use of relievers only is appropriate treatment for children with intermittent asthma, but represents poor quality treatment for children with persistent asthma. The MEPS data do not provide information on asthma severity, so it is not possible to determine appropriate treatment for each child. In spite of this, large differences over time

6
or across groups in the percentage of children using relievers only is likely indicative, at least in part, of differences in quality of care.
Any Reliever Use
Overall, results did not show a statistically significant change in reliever use as about two-thirds of children with reported treatment for asthma used at least one reliever during the year in both 19971998 and 20072008. Results did show increased reliever use in several subgroups, however, including black non-Hispanic children, poor/near poor children, children with public insurance only and children in fair or poor health. Results also showed differences in reliever use, in 20072008, across subgroups of children defined by income, perceived health status, and Census region. Race/ethnicity: Among children with reported treatment for asthma, the proportion of black non-Hispanic children using reliever medications increased from 56.3 percent in 19971998 to 72.3 percent in 20072008. Income: During the period 19971998 to 20072008, the proportion of poor/near poor children using relievers to treat asthma increased from 56.2 to 74.5 percent. In 20072008, children in high income families (64.1 percent) were less likely than children in poor/near poor families (74.5 percent) to have used one or more relievers during the year. Health insurance status: Among children with reported treatment for asthma, the proportion of children with public insurance only who used reliever medications increased from 57.9 percent in 19971998 to 73.5 percent in 20072008. Perceived health status: During the period 19971998 to 20072008, the proportion of children in fair or poor health who used reliever medications increased from 65.6 to 83.0 percent. In 20072008, children in excellent/very good/good health (66.8 percent) were less likely than children in fair/poor health (83.0 percent) to have used one or more relievers during the year. Census region: Children living in the South (66.2 percent) were less likely than those living in the Midwest (76.4 percent) to use reliever medications to treat their asthma symptoms.
Use of Relievers Only (No Controller Use)
We find that among children reported to have treatment for asthma, the proportion using relievers, but not controllers, fell from 43.8 percent in 19971998 to 30.4 percent in 20072008. Further, we find that this trend was widespread—more than half of the subgroups examined in our study had statistically significant reductions in the proportion of children that used relievers only to treat their asthma and, for the remaining groups, point estimates of the proportion of children using relievers only were lower in 20072008 than in 19971998, but differences were not statistically significant. We also found statistically significant differences in the use of relievers only across groups defined by race/ethnicity, income, health insurance status, and Census region. Age: Among children with reported treatment for asthma, the proportion of children ages 0 to 4 that used relievers only fell from 47.5 percent in 19971998 to 29.0 percent in 20072008 and the proportion of children ages 5 to 11 using relievers only fell from 43.8 to 27.7 percent.
7
Race/ethnicity: During the period 19971998 to 20072008, the proportion of white-other non-Hispanic children using relievers only to treat asthma dropped from 42.5 to 23.7 percent. In 20072008, the proportion of non-Hispanic white children using relievers only (23.7 percent) was a little more than half the rate for non-Hispanic black children (42.2 percent) and Hispanic children (41.3 percent). Sex: Among children with treatment for asthma, the proportion using relievers only fell for boys, from 42.8 to 28.0 percent, and for girls, from 45.2 to 34.1 percent. Income: During the period 19971998 to 20072008, the proportion of children using relievers only fell by more than half, from 45.3 to 21.7 percent, in high income families and fell from 41.5 to 28.6 percent in middle income families. In 20072008, children in poor/near poor (38.8 percent) and low income families (36.5 percent) were more likely than children in high income families (21.7 percent) to use relievers only to treat their asthma. Children in poor/near poor families were also more likely than children in middle income families (28.6 percent) to use relievers only. Health insurance status: Among children with treatment for asthma, the proportion using relievers only fell for children with any private insurance from 43.3 percent in 19971998 to 26.5 percent in 20072008. In 20072008, children with public insurance only (37.0 percent) were more likely than children with any private insurance to use relievers only to treat their asthma. Perceived health status: During the period 19971998 to 20072008, the proportion of children in excellent/very good/good health who used relievers only to treat their asthma fell from 45.8 to 29.9 percent. Metropolitan statistical area (MSA): Among children with treatment for asthma, use of relievers only fell for children living in MSAs from 45.2 percent in 19971998 to 31.0 percent in 20072008. Census region: During the period 19971998 to 20072008, the proportion of children using relievers only to treat asthma fell for children living in the Northeast, from 46.3 to 27.4 percent, and for children residing in the South, from 46.4 to 29.1 percent. Children living in the West (39.8 percent) were more likely to use relievers only in 20072008 than children living in the Northeast (27.4 percent), South (29.1 percent), or Midwest (28.0 percent).
Oral Corticosteroids
Short courses of oral systemic corticosteroids (OCS) are used to gain prompt control of asthma. OCS may also be used long term to treat patients who have severe persistent asthma (NAEPP-EPR3, 2007). OCS, however, have significant side effects, including growth suppression, cataracts, myopathy, adrenal suppression, and weight gain (NAEPP-EPR3, 2007). Also, the use of OCS more than twice per year is an indication of asthma that is poorly controlled to the point that the patient should be referred to a specialist (Wechsler, 2009). In this report, we find that among children reported to have treatment for asthma, the proportion using OCS fell by almost half from 17.1 percent in 19971998 to 8.7 percent in 2007–2008. Further, we find that reductions in the use of OCS were widespread—a little more than half of the subgroups examined in our study had statistically significant declines in OCS use and, for the remaining subgroups, point estimates of use were lower in 20072008 than in 19971998, but differences were not statistically significant. We also found differences in OCS use across Census regions in 20072008.

8
Age: Among children with reported treatment for asthma, the proportion of children ages 5 to 11 using OCS medications fell from 14.8 percent in 19971998 to 7.8 percent in 20072008 and the proportion of children ages 12 to 17 using OCS fell from 17.4 to 7.8 percent. Race/ethnicity: During the period 19971998 to 20072008, the proportion of white-other non-Hispanic children using OCS to treat asthma dropped from 19.9 to 8.3 percent. Sex: Among children with treatment for asthma, OCS use fell for boys, from 19.9 to 10.1 percent, and for girls, from 12.8 to 6.4 percent. Income: During the period 19971998 to 20072008, the proportion of children in high income families using OCS to treat asthma fell by almost three-quarters from 24.1 to 6.4 percent. Health insurance status: Among children with treatment for asthma, OCS use fell for children with any private insurance from 20.5 percent in 19971998 to 8.9 percent in 20072008. Perceived health status: During the period 19971998 to 20072008, the proportion of children in excellent/very good/good health who used OCS to treat asthma fell by more than half from 17.4 to 8.0 percent. Metropolitan statistical area (MSA): Among children with treatment for asthma, OCS use fell for children living in MSAs from 17.0 percent in 19971998 to 8.0 percent in 20072008. Census region: During the period 19971998 to 20072008, the proportion of children using OCS to treat asthma fell for children living in the Northeast, from 16.0 to 7.0 percent, and for children residing in the South, from 19.9 to 7.8 percent. In 20072008 children living in the Midwest (14.1 percent) were more likely to use OCS than children living in the Northeast (7.0 percent), South (7.8 percent, .05<p < .10) or, West (6.7 percent, .05<p < .10).
Average Annual Expenditures for Children’s Asthma Medications
Table 5 presents trends from 1997–1998 to 2007–2008 in aggregate total expenditures, total expenditures per user, and out-of-pocket expenditures per user for all asthma medications and for the three major types of asthma medications: controllers, relievers, and OCS. All drug expenditures were adjusted to constant 2008 U.S. dollars in a two-step process. First, to produce two-year pooled drug expenditure data for the beginning and ending point of our study period, we used the Consumer Price Index (CPI) for prescription drugs to adjust 1997 expenditures to 1998 dollars and to adjust 2007 expenditures to 2008 dollars. Next, to adjust for general inflation between the beginning and ending point of our study, we used the all item CPI for all urban consumers (CPI-U), to adjust the pooled 19971998 expenditures to 2008 dollars.

9
Total Drug Expenditures
Average annual total expenditures for all prescribed asthma medications for children with reported treatment for asthma more than quadrupled from $527 million in 19971998 to $2.5 billion in 20072008 after adjustment for inflation. Controllers accounted for more than 90 percent of the increased expenditures. The $2.1 billion in total expenditures for controllers to treat children’s asthma in
20072008 was more than seven times the amount ($280 million) spent in 19971998. Over the same period, total expenditures on relievers increased from $222 to $352 million while spending for OCS dropped from $25 to $8 million. In 20072008, controllers accounted for about 85 percent of all spending on asthma medications for children.
Total Expenditures per User
The average annual expenditure per user on all prescribed asthma medications for children with reported treatment for asthma nearly tripled from $207 in 1997–1998 to $605 in 20072008. During the same period, per user expenditures for asthma controller medications nearly tripled from $282 to $796—about 40 times the expenditure per user on OCS in 20072008, which fell from $44 in 19971998 to $20 in 20072008. Expenditures per user on relievers averaged $112 in 20072008, about one-seventh the average expenditure per user on controllers in 20072008.
Out-of-Pocket Expenditures per User
The average annual out-of-pocket expenditures per user on all prescribed asthma medications for children with reported treatment for asthma nearly doubled from $65 in 19971998 to $123 in 20072008. While out-of-pocket expenditures per user on controller asthma medications nearly doubled from $77 to $153, out-of-pocket expenditures per user on OCS asthma medications fell by about half from $21 to $10. Out-of-pocket expenditures per user on relievers averaged $30 in 20072008, about one-fifth the amount for controllers.

10
Summary and Conclusions Trends in children’s use of and expenditures for asthma medications, and differences across groups in the use of recommended medications, are important health care research concerns. This report uses nationally representative data from the MEPS to examine trends in the use of asthma medications from 19971998 through 20072008. We begin by examining trends in the treated prevalence of asthma among all children, ages 0 through 17, in the U.S. civilian, noninstitutionalized population. Then, we examine trends in asthma medication use and expenditures among children with reported treatment for asthma. We find that the total number (proportion) of children with reported treatment for asthma increased from 3.4 million (4.7 percent) to 4.5 million (6.1 percent). Increases in the treated prevalence of asthma were widespread and occurred within most of the subgroups of children we examined. We also found that children ages 511, black non-Hispanic children, boys and children in fair/poor health were more likely, and uninsured children were less likely than others to have reported treatment for asthma in 20072008. Differences in the treated prevalence of asthma may result from differences in the underlying prevalence of asthma, or because of differences in access to care, attitudes and beliefs regarding the necessity of medical care or other factors that affect medical care use. Overall results for medication use, from 19971998 to 20072008, show that the proportion of children with asthma who used controller medications approximately doubled from 29.4 to 58.3 percent, the proportion using relievers, but not controllers, fell from 43.8 to 30.4 percent, and the proportion using OCS dropped by about half from 17.1 to 8.7 percent. Increased use of recommended controller medications, which treat the underlying inflammation that causes asthma symptoms, decreased use of mono-therapy with relievers, and a sharp drop in the use of OCSs to treat severe asthma exacerbations all suggest that the quality of pharmacotherapy for children with asthma increased substantially during the time of our study. Despite the encouraging overall trends, however, important differences in asthma care persisted in 20072008. In particular, children from vulnerable populations including black and Hispanic children, publicly insured children, and children living in poor and near poor families were substantially less likely than others to use controllers and more likely to use relievers only to treat their asthma. Furthermore, black children, publicly insured children, poor/near poor children, and children in fair or poor health all had increased use of reliever medications from 19971998 to 20072008. Taken together, these results suggest lower quality asthma care for groups of children who are at risk for poor asthma outcomes. Finally, we examine changes in expenditures for asthma medications. Average annual total expenditures for all prescribed asthma medications for children with reported treatment for asthma more than quadrupled from $527 million in 19971998 to $2.5 billion in 20072008 after adjustment for inflation. Controllers accounted for more than 90 percent of the increased expenditures and accounted for more than 80 percent of all spending on asthma medications for children in 20072008.

11
References Akinbami L. J., Moorman J. E., Liu X. Asthma Prevalence, Health Care Use, and Mortality: United
States, 2005–2009. National Health Statistics Reports; No. 32. Hyattsville, MD: National Center for Health Statistics. January 2011. Bloom B., Cohen R. A., Freeman G. Summary Health Statistics for U.S. Children: National Health
Interview Survey, 2009. National Center for Health Statistics. Vital Health Stat 10(247). 2010. Coffey R. M., Ho K., Adamson D. M., Matthews T. L., Sewell J., Kassed C. A. Asthma Care Quality
Improvement: A Resource Guide for State Action. (Prepared by Thomson Medstat and The Council of State Governments under Contract No. 290-00-0004; updated by Thomson Reuters, formerly Thomson Medstat). Rockville, MD: Agency for Healthcare Research and Quality, Department of Health and Human Services; April 2006, updated October 2009. AHRQ Pub. No. 06(10)-0012. http://www.ahrq.gov/qual/asthqwork.pdf (accessed September 15, 2011). Cohen J. Design and Methods of the Medical Expenditure Panel Survey Household Component. MEPS Methodology Report No. 1. AHCPR Pub. No. 97-0026. Rockville, MD: Agency for Health Care Policy and Research, 1997. http://www.meps.ahrq.gov/mepsweb/data_files/publications/mr1/mr1.pdf Cohen S. Sample Design of the 1996 Medical Expenditure Panel Survey Household Component. MEPS Methodology Report No. 2. AHCPR Pub. No. 97-0027. Rockville, MD: Agency for Health Care Policy and Research, 1997. http://www.meps.ahrq.gov/mepsweb/data_files/publications/mr2/mr2.pdf Cohen S. Design Strategies and Innovations in the Medical Expenditure Panel Survey. Medical Care, July 2003: 41(7) Supplement: III-5–III-12. National Asthma Education and Prevention Program. Expert Panel Report 3: Guidelines for the
Diagnosis and Management of Asthma: Full Report 2007. Bethesda, MD: National Institutes of Health, U.S. Dept. of Health and Human Services, National Heart, Lung, and Blood Institute; 2007. http://www.nhlbi.nih.gov/guidelines/asthma/asthgdln.pdf (accessed September 15, 2011). National Heart, Lung, and Blood Institute. Morbidity & Mortality: 2007 Chart Book on Cardiovascular,
Lung, and Blood Diseases. http://www.nhlbi.nih.gov/resources/docs/07-chtbk.pdf (accessed September 15, 2011). Kriner P., Bernal Y., Binggeli A., Ornelas I. Attitudes, Beliefs, and Practices Regarding Asthma Care
Among Providers and Adult Asthmatics in Imperial County. Californian Journal of Health Promotion 2003, Volume 1, Issue 2, 88-100. O'Connell E. J. Optimizing Inhaled Corticosteroid Therapy in Children with Chronic Asthma. Pediatric
Pulmonology, January 2005: 39:74-83. Poureslami I. M., Rootman I., Balka E., Devarakonda R., Hatch J., Fitzgerald J. M. A Systematic Review
of Asthma and Health Literacy: A Cultural-Ethnic Perspective in Canada. MedGenMed. 2007; 9(3):40. Centers for Disease Control and Prevention, National Center for Health Statistics. Table 2-1 Lifetime Asthma Prevalence Percents by Age, United States: National Health Interview Survey (NHIS) Data,
2007. http://www.cdc.gov/asthma/nhis/07/table2-1.htm (accessed September 15, 2011).

12
Wechsler M. E. Managing Asthma in Primary Care: Putting New Guideline Recommendations Into
Context. Mayo Clinical Proceedings. August 2009; 84(8): 707-717.

13
Table 1. Percentage and total number of children with reported treatment for asthma, selected comorbid conditions, and family smoking status, 1997−1998 to 2007−2008 1997–1998 1999–2000 2001–2002 2003–2004 2005–2006 2007–2008
Total population (millions) 72.2 72.6 72.8 73.1 73.8 74.1 Children with reported treatment for asthma Percentage 4.7 4.9 5.6 5.7 6.2 6.1
Number in millions 3.4 3.5 4.0 4.1 4.6 4.5
Among children with reported treatment for asthma, percentage with reported: Respiratory tract infection1 44.1 38.8 38.9 40.8 34.5 35.6
Allergic rhinitis 18.6 22.0 26.7 26.1 25.3 24.8
Smoker in the family2 — — 29.1 30.4 23.2 24.4
Source: Center for Financing, Access, and Cost Trends, Agency for Healthcare Research and Quality, Medical Expenditure Panel Survey, 1997, 1998, 2007, and 2008 1 Respiratory tract infections include otitis media, sinusitis, bronchitis, pharyngitis, and upper tract respiratory infection. 2 Data on whether respondents currently smoke were first collected in 2000.
14
Table 2. Percentage and total number of children with reported treatment for asthma, by selected population characteristics, 1997−1998 and 2007−2008
1997–1998 2007–2008
Total population (in millions)
Total with reported
treatment for asthma
(in millions)
Percentage with
reported treatment for asthma
Total population (in millions)
Total with reported
treatment for asthma
(in millions)
Percentage
with reported treatment for asthma
Total 72.2 3.4 4.7 74.1 4.5 6.1 Age in years 0 to 4 19.5 0.9 4.7 20.5 1.0 4.7 5 to 11 28.8 1.5 5.2 28.4 2.1 7.5 12 to 17 23.9 1.0 4.0 25.2 1.4 5.7 Race/ethnicity1 White/other 49.5 2.1 4.3 47.4 2.9 6.0 Black 11.4 0.7 6.3 10.7 0.9 8.1 Hispanic 11.3 0.6 4.8 16.0 0.8 5.1 Sex Male 37.0 2.1 5.5 37.7 2.8 7.4 Female 35.2 1.4 3.8 36.4 1.8 4.8 Income Poor/near poor 18.0 1.0 5.7 18.0 1.2 6.5 Low income 11.3 0.6 5.2 11.4 0.7 5.9 Middle income 24.4 1.1 4.6 24.3 1.4 5.6 High income 18.5 0.7 3.6 20.4 1.3 6.5 Health insurance status Any private 49.6 2.1 4.3 44.8 2.8 6.2 Public only 15.1 1.1 7.0 23.6 1.6 6.8 Uninsured 7.5 0.2 3.0 5.7 0.2 2.8 Perceived health status Excellent/very good/good 67.6 2.5 3.6 70.3 3.8 5.4 Fair/poor 4.6 1.0 20.7 3.8 0.7 18.7 Metropolitan statistical area (MSA) MSA 58.4 2.9 4.9 62.3 3.9 6.2 Non-MSA 13.6 0.5 3.8 11.7 0.7 5.8 Census region Northeast 13.0 0.7 5.2 12.2 1.0 8.2 Midwest 17.3 0.8 4.7 16.2 0.9 5.4 South 24.6 1.1 4.5 27.7 1.8 6.6 West 17.3 0.8 4.6 18.0 0.8 4.5 Source: Center for Financing, Access, and Cost Trends, Agency for Healthcare Research and Quality, Medical Expenditure Panel Survey, 1997, 1998, 2007, and 2008 1 The Hispanic grouping can include children of any race, so the race categories of black, white, and ‘other’ exclude Hispanics. In all data years, the ‘other’ category includes children with single races other than white and black. In 2007−2008 the ‘other’ category also includes children with multiple races. MEPS respondents were first able to identify household members as belonging to multiple race groups in 2002.
15
Table 3. Percentage of children using controllers, relievers, and oral corticosteroids, among children with reported treatment for asthma, 1997–1998 to 2007–2008 1997–1998 1999–2000 2001–2002 2003–2004 2005–2006 2007–2008 Population with reported treatment for asthma (millions) 3.4 3.5 4.0 4.1 4.6 4.5 Among children with reported treatment for asthma, percentage using: Controllers1
Any controller 29.4 34.4 43.9 55.3 60.4 58.3 ICS 15.5 23.7 31.9 43.8 45.0 40.3 ILABA 3.0 4.3 10.1 17.5 16.7 13.2 LTRA 2.9* 7.5 20.0 27.6 34.5 34.1 NSA 15.1 9.0 3.2 0.8* 0.3* 0.6*
Relievers2
Any reliever 64.7 65.1 67.8 73.9 71.4 69.3 Reliever-only3 43.8 39.4 38.1 33.5 30.7 30.4
OCS4 17.1 20.9 13.7 13.9 13.1 8.7 Source: Center for Financing, Access, and Cost Trends, Agency for Healthcare Research and Quality, Medical Expenditure Panel Survey, 1997, 1998, 2007, and 2008 1 Controllers include ICSs (inhaled corticosteroids), ILABAs (inhaled long acting beta-agonists), LTRAs (leukotriene receptor antagonists), NSAs (non-steroidal anti-allergy agents), MXSs (methylxanthines), and OLABAs (oral long acting beta-agonists) 2 Relievers include SABAs (inhaled short acting beta-agonists), ACBs (anti-cholinergic bronchodilators), and SANBs (shorting acting non-beta selective agents) 3 Relievers-only indicates reliever use with no controller use
4 OCS (oral corticosteroid) *Relative standard error is greater than 0.30
16
Table 4. Percentage of children using controllers, relievers, and oral corticosteroids, among children with reported treatment for asthma, by selected population characteristics, 1997–1998 and 2007–2008 Controllers1 Relievers2 Relievers only3 OCS4
1997–1998 2007–2008 1997–1998 2007–2008 1997–1998 2007–2008 1997–1998 2007–2008
Total 29.4 58.3 64.7 69.3 43.8 30.4 17.1 8.7
Age in years
0 to 4 23.1 53.2 63.5 66.6 47.5 29.0 20.5 11.8
5 to 11 28.8 62.6 63.3 66.9 43.8 27.7 14.8 7.8
12 to 17 36.3 55.3 68.2 74.9 40.0 35.3 17.4 7.8
Race/ethnicity5
White/other 33.4 66.7 66.5 67.1 42.5 23.7 19.9 8.3
Black 22.0 41.5 56.3 72.3 42.5 42.2 11.3 9.9
Hispanic 23.1 46.6 68.8 74.2 50.2 41.3 13.8 8.5
Sex
Male 32.4 61.5 64.0 67.7 42.8 28.0 19.9 10.1
Female 24.8 53.3 65.8 72.0 45.2 34.1 12.8 6.4
Income
Poor/near poor 20.2 47.1 56.2 74.5 43.8 38.8 13.4 7.5
Low income 22.7 45.6 61.8 74.7 46.2 36.5 15.6 11.3
Middle income 38.8 63.2 69.7 67.4 41.5 28.6 17.1 10.7
High income 33.4 69.6 72.0 64.1 45.3 21.7 24.1 6.4
Health insurance status
Any private 34.1 64.9 68.3 66.8 43.3 26.5 20.5 8.9
Public only 20.3 46.8 57.9 73.5 43.8 37.0 11.9 7.9
Uninsured a a a a a a a a
Perceived health status Excellent/very good/good 28.0 58.4 64.4 66.8 45.8 29.9 17.4 8.0
Fair/poor 33.0 57.6 65.6 83.0 38.4 32.9 16.2 12.0
MSA Status
MSA 28.6 57.5 66.2 69.3 45.2 31.0 17.0 8.0
Non-MSA 33.9 62.6 57.1 69.6 36.2 26.9 17.5 12.4
Census region
Northeast 28.5 62.3 65.4 68.6 46.3 27.4 16.0 7.0
Midwest 37.1 63.7 67.7 76.4 37.5 28.0 21.5 14.1
South 30.8 59.8 65.4 66.2 46.4 29.1 19.9 7.8
West 20.2 44.0 60.3 69.7 44.4 39.8 9.6 6.7*
Source: Center for Financing, Access, and Cost Trends, Agency for Healthcare Research and Quality, Medical Expenditure Panel Survey, 1997, 1998, 2007, and 2008 a Insufficient data to support reliable estimates 1 Controllers include ICSs (inhaled corticosteroids), ILABAs (inhaled long acting beta-agonists), LTRAs (leukotriene receptor antagonists), NSAs (non-steroidal anti-allergy agents), MXSs (methylxanthines), and OLABAs (oral long acting beta-agonists) 2 Relievers include SABAs (inhaled short acting beta-agonists), ACBs (anti-cholinergic bronchodilators), and SANBs (shorting acting non-beta selective agents) 3 Relievers-only indicates reliever use with no controller use 4 OCS (oral corticosteroid) 5 The Hispanic grouping can include children of any race, so the race categories of black, white, and ‘other’ exclude Hispanics. In all data years, the ‘other’ category includes children with single races other than white and black. In 2007-2008 the ‘other’ category also includes children with multiple races. MEPS respondents were first able to identify household members as belonging to multiple race groups in 2002. *Relative standard error is greater than 0.30

17
Table 5. Average annual expenditures (in 2008 U.S. dollars) for asthma medications, among children with reported treatment for asthma, 1997–1998 and 2007–2008
1997–1998 2007–2008
Total with reported treatment for asthma (in millions) 3.4 4.5
Total drug expenditures (millions)
All therapeutic classes
$527 $2,462
Controllers1
280 2,102
Relievers2
222 352
OCS3
25 8
Total expenditures per user
All therapeutic classes
$207 $605
Controllers1
282 796
Relievers2
101 112
OCS3
44 20
Out-of-pocket expenditures per user
All therapeutic classes
$65 $123
Controllers1
77 153
Relievers2
35 30
OCS3
21 10
Source: Center for Financing, Access, and Cost Trends, Agency for Healthcare Research and Quality, Medical Expenditure Panel Survey, 1997, 1998, 2007, and 2008 1 Controllers include ICSs (inhaled corticosteroids), ILABAs (inhaled long acting beta-agonists), LTRAs (leukotriene receptor antagonists), NSAs (non-steroidal anti-allergy agents), MXSs (methylxanthines), and OLABAs (oral long acting beta-agonists) 2 Relievers include SABAs (inhaled short acting beta-agonists), ACBs (anti-cholinergic bronchodilators), and SANBs (shorting acting non-beta selective agents) 3 OCS (oral corticosteroid)

18
Technical Appendix The data used in this report were obtained from interviews conducted as part of the Household Component of the Medical Expenditure Panel Survey (MEPS) for 1997–2008. MEPS is an ongoing, annual survey of the U.S. civilian noninstitutionalized population. MEPS collects detailed information on health care use and expenditures (including sources of payment); health insurance; and health status, access, and quality. It also collects detailed demographic and economic information on the persons and households surveyed. More information about MEPS can be found at http://www.meps.ahrq.gov. For a detailed description of the survey and its methodology, also see J. Cohen (1997) and S. Cohen (1997, 2003).
Definitions Children with reported treatment for asthma and comorbid conditions: We use the 1997 through 2008 MEPS Condition Files and the three-digit ICD-9-CM diagnosis condition variable (ICD9CODX) to construct indicator variables for specified conditions. We identified children with reported treatment for asthma and comorbid conditions within the sample by tying the diagnosis code for each condition to any reported health services utilization (i.e., home health, inpatient hospital stays, outpatient, office-based, emergency room visits, and prescribed medicines) during the year. Conditions in this report were defined using the following 3 digit ICD-9-CM codes: Conditions ICD-9-CM Diagnosis Asthma 493 Respiratory tract infections Otitis media 381, 382 Sinusitis 461, 473 Bronchitis 466, 490 Pharyngitis 034, 462, 463 Upper tract respiratory infection 460, 465 Allergic rhinitis 477 Smoker in the family: For each child, the smoking behavior of all co-residing, adult family members was determined based on a question on current smoking status in the MEPS Self-Administered Questionnaire (SAQ). Families were defined using health insurance eligibility units (HIEUs). The SAQ smoking question was first asked of MEPS respondents in the 2000 data. Asthma medications: Each drug that was listed as purchased or otherwise obtained in the MEPS Prescribed Medicines (PMED) Files was linked to the Multum Lexicon database, a product of Cerner Multum, Inc. We used the Multum drug name variable which gives the active ingredient(s) in each drug to identify three general types of asthma medications: controllers, relievers and oral corticosteroids. Controller medications included ICSs (inhaled corticosteroids), ILABAs (inhaled long acting beta-agonists), OLABAs (oral long acting beta-agonists), LTRAs (leukotriene receptor antagonists), MXSs (methylxanthines), NSAs (non-steroidal anti-allergy agents), and ICS-ILABA combinations. Relievers were primarily comprised of SABAs (inhaled short acting beta agonists), but also included ACBs (anti-cholinergic bronchodilators), SANBs (shorting acting non-beta selective agents) and SABA-ACB combinations. Oral corticosteroids included prednisone, dexamethasone, methylprednisolone and other steroids.
19
Utilization: Indicator variables were created to identify children who received each of the major classes of asthma medications—controllers, relievers and oral corticosteroids. For this report, “relievers-only” denotes children who, at any time during the year, were using relievers but no controllers to treat their asthma. We also created indicator variables to capture use of subclasses of controller medications and their combinations. For combination drugs, a child was identified as having had each medication comprising the combination therapy. For example, if a child had a combination drug that included both an ICS and an ILABA, then the child was identified as having used each of these types of asthma medications. Utilization estimates are presented as the proportion of children using each of the three general types of asthma medications, and each specific class of asthma controller medication during the year. Expenditures: Expenditures include all amounts paid for each drug purchased from any source including payments by individuals and their families and payments by private insurance, Medicaid, Medicare, and other sources of insurance. For this report, all drug expenditures were adjusted to constant 2008 U.S. dollars in a two-step process. First, to produce two-year pooled drug expenditure data for the beginning and ending point of our study period, we used the Consumer Price Index (CPI) for prescription drugs to adjust 1997 expenditures to 1998 dollars and to adjust 2007 expenditures to 2008 dollars. Next, to adjust for general inflation between the beginning and ending point of our study, we used the all item CPI for all urban consumers (CPI-U), to adjust the pooled 1998 expenditures to 2008 dollars. Age: In this report, age is the last reported age in each year for the sampled child. Race/ethnicity: Classification by race and ethnicity was based on information provided by the household respondent for each household member. From 1997 to 2001, the respondent was asked if each person’s race was best described as black, white, Asian or Pacific Islander, American Indian, or Alaska Native. Beginning in 2002, the respondent was able to describe each person’s race by specifying any combination of races that applied (i.e., multiracial). In all years, respondents were asked if each person’s main national origin or ancestry was Puerto Rican, Cuban, Mexican, Mexicano, Mexican American, or Chicano; other Latin American; or other Spanish. Persons claiming a main national origin or ancestry in one of these Hispanic groups, regardless of racial background, were classified as Hispanic. Since the Hispanic grouping can include children of any race, the race categories of black, white, and other exclude Hispanics. The other category includes children with single races other than white and black as well as children with multiple races. Income: In MEPS, personal income from all household members is summed to create family income. Potential sources of income include annual earnings from wages, salaries, bonuses, tips, and commissions; business and farm gains and losses; unemployment and Workers’ Compensation payments; interest and dividends; alimony, child support, and other private cash transfers; private pensions; individual retirement account (IRA) withdrawals; Social Security and Department of Veterans Affairs payments; Supplemental Security Income and cash welfare payments from public assistance, TANF (Temporary Assistance for Needy Families; formerly known as Aid to Families with Dependent Children, or AFDC); gains or losses from estates, trusts, partnerships, S corporations, rent, and royalties; and a small amount of “other” income. Children were classified according to their family’s income in terms of poverty status. In this report, poverty status is the ratio of the family’s income to the Federal poverty thresholds, which control for the size of the family and the age of the head of the family. The following classification of poverty status was used:
20
Poor/near poor income: Children in families with income of 125 percent of the Federal poverty line or less, including those who reported negative income.
Low income: Children in families with income from over 125 percent through 200 percent of the Federal poverty line.
Middle income: Children in families with income from over 200 percent through 400 percent of the Federal poverty line.
High income: Children in families with income over 400 percent of the Federal poverty line.
Health insurance status: Children ages 0 to 17 were classified in the following three insurance categories, based on household responses to health insurance status questions:
− Any private health insurance: Children who, at any time during the year, had insurance that provided coverage for hospital and physician care (other than Medicare, Medicaid, or other public hospital/physician coverage) were classified as having private insurance. Coverage by TRICARE (Armed Forces–related coverage) was also included as private health insurance. Insurance that provides coverage for a single service only, such as dental or vision coverage, was not included.
− Public coverage only: Children were considered to have public coverage only if they met both of the following criteria: 1) they were not covered by private insurance at any time during the year, and 2) they were covered by one of the following public programs at any point during the year: Medicare, Medicaid, or other public hospital/physician coverage.
− Uninsured: The uninsured were defined as children not covered by private hospital/physician insurance, Medicare, TRICARE, Medicaid, or other public hospital/physician programs at any time during the entire year or period of eligibility for the survey.
Perceived health status: During each round of interviewing, the household respondent was asked to rate the health of each person in the family according to the following categories: excellent, very good, good, fair, or poor. For this report, the response categories "excellent," "very good," and "good" were collapsed, as were "fair" and "poor". Metropolitan statistical area (MSA): Children were identified as residing either inside or outside an MSA as designated by the U.S. Office of Management and Budget, which applied 1990 standards using population counts from the 1990 U.S. Census. An MSA is a large population nucleus combined with adjacent communities that have a high degree of economic and social integration with the nucleus. Each MSA has one or more central counties containing the area’s main population concentration. In New England, metropolitan areas consist of cities and towns rather than whole counties. Census region: Each MEPS sampled person was classified as living in one of the following four regions as defined by the U.S. Census Bureau: Northeast: Maine, New Hampshire, Vermont, Massachusetts, Rhode Island, Connecticut, New York, New Jersey, and Pennsylvania Midwest: Ohio, Indiana, Illinois, Michigan, Wisconsin, Minnesota, Iowa, Missouri, South Dakota, North Dakota, Nebraska, and Kansas South: Delaware, Maryland, District of Columbia, Virginia, West Virginia, North Carolina, South Carolina, Georgia, Florida, Kentucky, Tennessee, Alabama, Mississippi, Arkansas, Louisiana, Oklahoma, and Texas
21
West: Montana, Idaho, Wyoming, Colorado, New Mexico, Arizona, Utah, Nevada, Washington, Oregon, California, Alaska, and Hawaii Rounding
Because of rounding and some missing data, some of the subpopulation estimates presented in the tables will not sum exactly to the overall population total. Standard errors are presented in tables A–E.
22
Standard Error Tables
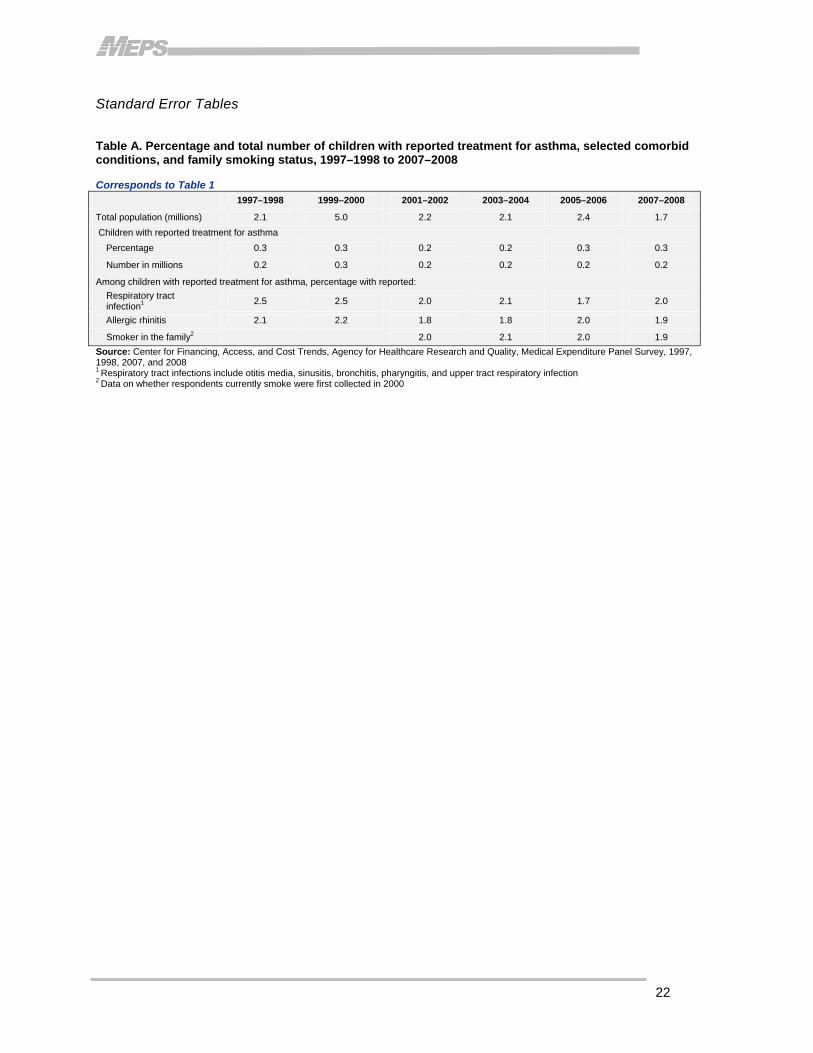
Table A. Percentage and total number of children with reported treatment for asthma, selected comorbid conditions, and family smoking status, 1997–1998 to 2007–2008 Corresponds to Table 1 1997–1998 1999–2000 2001–2002 2003–2004 2005–2006 2007–2008
Total population (millions) 2.1 5.0 2.2 2.1 2.4 1.7 Children with reported treatment for asthma Percentage 0.3 0.3 0.2 0.2 0.3 0.3
Number in millions 0.2 0.3 0.2 0.2 0.2 0.2
Among children with reported treatment for asthma, percentage with reported: Respiratory tract infection1 2.5 2.5 2.0 2.1 1.7 2.0
Allergic rhinitis 2.1 2.2 1.8 1.8 2.0 1.9
Smoker in the family2 2.0 2.1 2.0 1.9 Source: Center for Financing, Access, and Cost Trends, Agency for Healthcare Research and Quality, Medical Expenditure Panel Survey, 1997, 1998, 2007, and 2008 1 Respiratory tract infections include otitis media, sinusitis, bronchitis, pharyngitis, and upper tract respiratory infection 2 Data on whether respondents currently smoke were first collected in 2000
23
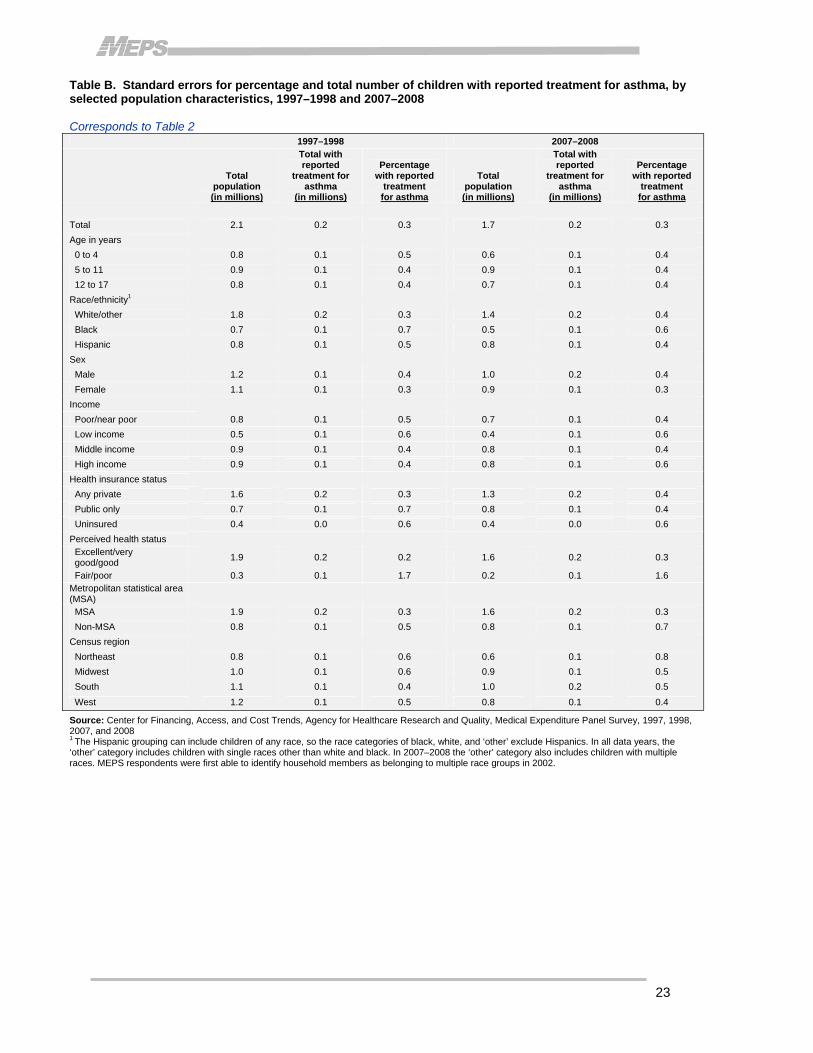
Table B. Standard errors for percentage and total number of children with reported treatment for asthma, by selected population characteristics, 1997–1998 and 2007–2008 Corresponds to Table 2 1997–1998 2007–2008
Total population (in millions)
Total with reported
treatment for asthma
(in millions)
Percentage with reported
treatment for asthma
Total population (in millions)
Total with reported
treatment for asthma
(in millions)
Percentage with reported
treatment for asthma
Total 2.1 0.2 0.3 1.7 0.2 0.3 Age in years 0 to 4 0.8 0.1 0.5 0.6 0.1 0.4 5 to 11 0.9 0.1 0.4 0.9 0.1 0.4 12 to 17 0.8 0.1 0.4 0.7 0.1 0.4 Race/ethnicity1 White/other 1.8 0.2 0.3 1.4 0.2 0.4 Black 0.7 0.1 0.7 0.5 0.1 0.6 Hispanic 0.8 0.1 0.5 0.8 0.1 0.4 Sex Male 1.2 0.1 0.4 1.0 0.2 0.4 Female 1.1 0.1 0.3 0.9 0.1 0.3 Income Poor/near poor 0.8 0.1 0.5 0.7 0.1 0.4 Low income 0.5 0.1 0.6 0.4 0.1 0.6 Middle income 0.9 0.1 0.4 0.8 0.1 0.4 High income 0.9 0.1 0.4 0.8 0.1 0.6 Health insurance status Any private 1.6 0.2 0.3 1.3 0.2 0.4 Public only 0.7 0.1 0.7 0.8 0.1 0.4 Uninsured 0.4 0.0 0.6 0.4 0.0 0.6 Perceived health status Excellent/very good/good 1.9 0.2 0.2 1.6 0.2 0.3
Fair/poor 0.3 0.1 1.7 0.2 0.1 1.6 Metropolitan statistical area (MSA) MSA 1.9 0.2 0.3 1.6 0.2 0.3 Non-MSA 0.8 0.1 0.5 0.8 0.1 0.7 Census region Northeast 0.8 0.1 0.6 0.6 0.1 0.8 Midwest 1.0 0.1 0.6 0.9 0.1 0.5 South 1.1 0.1 0.4 1.0 0.2 0.5 West 1.2 0.1 0.5 0.8 0.1 0.4
Source: Center for Financing, Access, and Cost Trends, Agency for Healthcare Research and Quality, Medical Expenditure Panel Survey, 1997, 1998, 2007, and 2008 1 The Hispanic grouping can include children of any race, so the race categories of black, white, and ‘other’ exclude Hispanics. In all data years, the ‘other’ category includes children with single races other than white and black. In 2007–2008 the ‘other’ category also includes children with multiple races. MEPS respondents were first able to identify household members as belonging to multiple race groups in 2002.
24
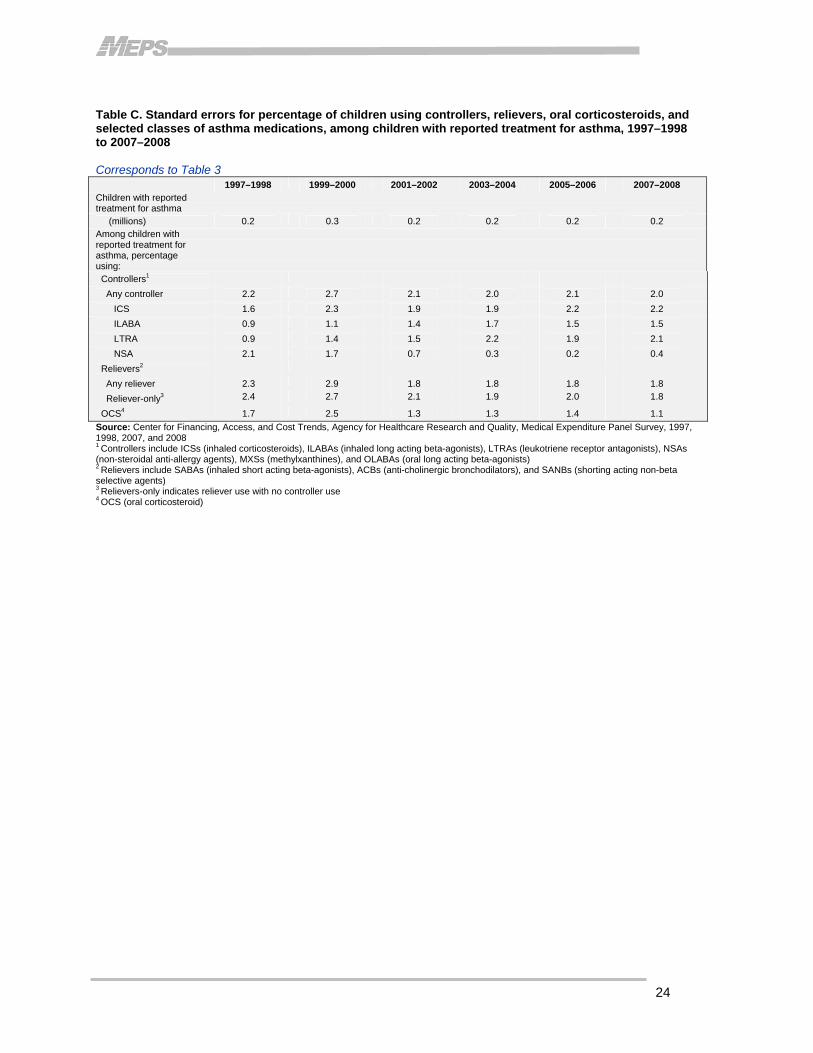
Table C. Standard errors for percentage of children using controllers, relievers, oral corticosteroids, and selected classes of asthma medications, among children with reported treatment for asthma, 1997–1998 to 2007–2008 Corresponds to Table 3 1997–1998 1999–2000 2001–2002 2003–2004 2005–2006 2007–2008 Children with reported treatment for asthma (millions) 0.2 0.3 0.2 0.2 0.2 0.2 Among children with reported treatment for asthma, percentage using: Controllers1
Any controller 2.2 2.7 2.1 2.0 2.1 2.0
ICS 1.6 2.3 1.9 1.9 2.2 2.2
ILABA 0.9 1.1 1.4 1.7 1.5 1.5
LTRA 0.9 1.4 1.5 2.2 1.9 2.1
NSA 2.1 1.7 0.7 0.3 0.2 0.4
Relievers2
Any reliever 2.3 2.9 1.8 1.8 1.8 1.8
Reliever-only3 2.4 2.7 2.1 1.9 2.0 1.8
OCS4 1.7 2.5 1.3 1.3 1.4 1.1
Source: Center for Financing, Access, and Cost Trends, Agency for Healthcare Research and Quality, Medical Expenditure Panel Survey, 1997, 1998, 2007, and 2008 1 Controllers include ICSs (inhaled corticosteroids), ILABAs (inhaled long acting beta-agonists), LTRAs (leukotriene receptor antagonists), NSAs (non-steroidal anti-allergy agents), MXSs (methylxanthines), and OLABAs (oral long acting beta-agonists) 2 Relievers include SABAs (inhaled short acting beta-agonists), ACBs (anti-cholinergic bronchodilators), and SANBs (shorting acting non-beta selective agents) 3 Relievers-only indicates reliever use with no controller use 4 OCS (oral corticosteroid)

25
Table D. Standard errors for percentage of children using controller, reliever, and oral corticosteroid, among children with reported treatment for asthma, by selected population characteristics, 1997–1998 and 2007–2008 Corresponds to Table 4 Controllers1 Relievers2 Relievers only3 OCS4
1997–1998 2007–2008 1997–1998 2007–2008 1997–1998 2007–2008 1997–1998 2007–2008
Total 2.2 2.0 2.3 1.8 2.4 1.8 1.7 1.1
Age in years
0 to 4 4.0 4.6 4.5 4.0 4.3 4.0 3.6 2.7
5 to 11 3.1 3.0 3.5 2.8 3.4 2.5 2.2 1.5
12 to 17 3.9 3.7 3.8 3.2 4.2 3.3 3.1 1.9
Race/ethnicity4
White/other 3.2 2.7 3.2 2.5 3.2 2.4 2.4 1.5
Black 5.2 3.8 4.5 3.1 5.1 3.4 2.7 2.0
Hispanic 3.5 4.0 3.4 3.7 3.6 3.9 3.0 2.1
Sex
Male 3.2 2.6 2.9 2.5 3.0 2.3 2.4 1.5
Female 3.2 3.1 4.2 3.1 4.1 3.0 2.6 1.6
Income
Poor/near poor 3.7 3.2 4.6 2.8 4.3 3.1 2.7 1.4
Low income 4.4 4.4 5.7 3.7 5.9 3.8 3.3 2.7
Middle income 4.2 3.6 3.9 3.5 4.4 3.4 3.0 2.3
High income 5.6 4.2 4.2 4.4 5.5 3.7 5.7 1.9
Health insurance status
Any private 3.1 2.7 2.7 2.7 3.1 2.5 2.4 1.6
Public only 3.9 3.0 4.2 2.5 4.1 2.6 2.5 1.5
Uninsured a a a a a a a a
Perceived health status
Excellent/very good/good 2.7 2.2 2.6 2.1 2.8 2.0 2.1 1.1
Fair/poor 4.1 3.9 4.0 3.0 3.9 4.0 2.7 3.5
MSA Status
MSA 2.4 2.2 2.5 2.0 2.6 2.0 1.8 1.2
Non-MSA 6.0 4.9 6.1 4.6 6.0 4.7 4.4 3.2
Census region
Northeast 3.8 4.9 5.5 3.7 5.4 4.3 2.6 1.9
Midwest 5.7 4.7 4.0 3.9 4.4 4.1 3.9 2.9
South 3.8 3.2 3.9 2.9 4.4 2.8 3.5 1.6
West 2.8 3.9 5.2 4.1 4.8 3.6 2.0 2.8
Source: Center for Financing, Access, and Cost Trends, Agency for Healthcare Research and Quality, Medical Expenditure Panel Survey, 1997, 1998, 2007, and 2008 a Insufficient data to support reliable estimates 1 Controllers include ICSs (inhaled corticosteroids), ILABAs (inhaled long acting beta-agonists), LTRAs (leukotriene receptor antagonists), NSAs (non-steroidal anti-allergy agents), MXSs (methylxanthines), and OLABAs (oral long acting beta-agonists) 2 Relievers include SABAs (inhaled short acting beta-agonists), ACBs (anti-cholinergic bronchodilators), and SANBs (shorting acting non-beta selective agents) 3 Relievers-only indicates reliever use with no controller use 4 OCS (oral corticosteroid) 5 The Hispanic grouping can include children of any race, so the race categories of black, white, and ‘other’ exclude Hispanics. In all data years, the ‘other’ category includes children with single races other than white and black. In 2007-2008 the ‘other’ category also includes children with multiple races. MEPS respondents were first able to identify household members as belonging to multiple race groups in 2002.
26
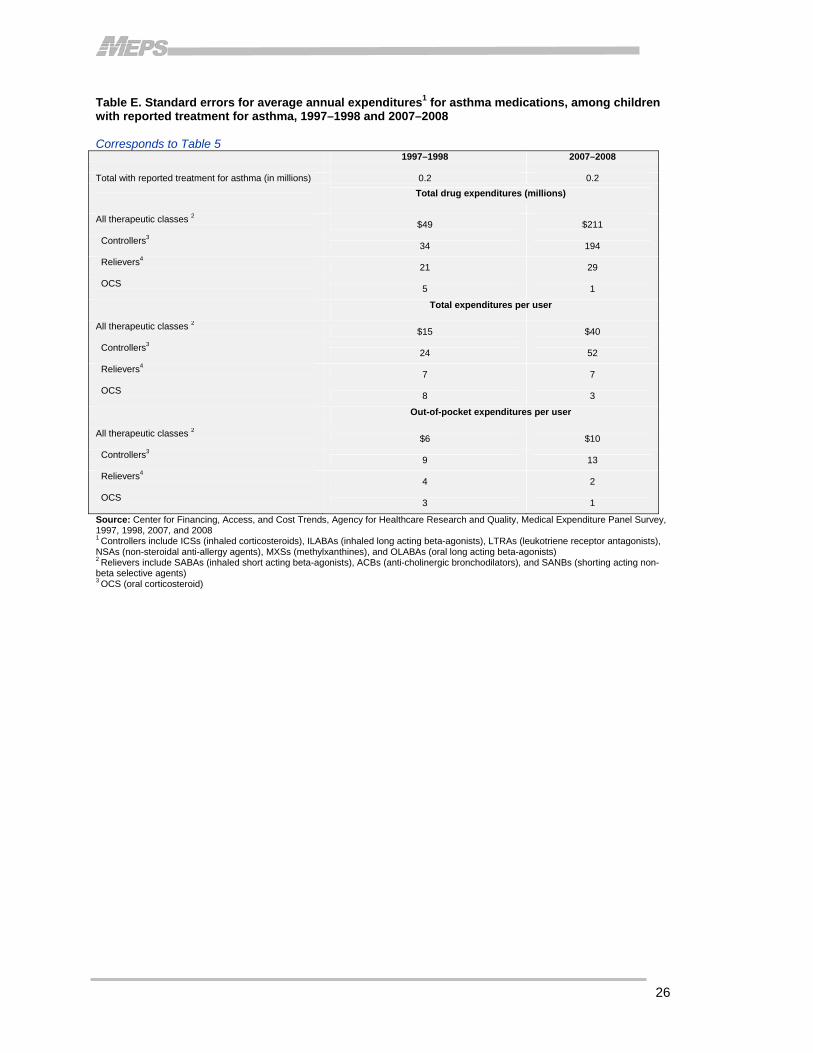
Table E. Standard errors for average annual expenditures1 for asthma medications, among children with reported treatment for asthma, 1997–1998 and 2007–2008 Corresponds to Table 5 1997–1998 2007–2008 Total with reported treatment for asthma (in millions) 0.2 0.2
Total drug expenditures (millions) All therapeutic classes 2
$49 $211
Controllers3 34 194
Relievers4
21 29
OCS 5 1
Total expenditures per user All therapeutic classes 2
$15 $40
Controllers3 24 52
Relievers4
7 7
OCS 8 3
Out-of-pocket expenditures per user All therapeutic classes 2
$6 $10
Controllers3 9 13
Relievers4
4 2
OCS 3 1
Source: Center for Financing, Access, and Cost Trends, Agency for Healthcare Research and Quality, Medical Expenditure Panel Survey, 1997, 1998, 2007, and 2008 1 Controllers include ICSs (inhaled corticosteroids), ILABAs (inhaled long acting beta-agonists), LTRAs (leukotriene receptor antagonists), NSAs (non-steroidal anti-allergy agents), MXSs (methylxanthines), and OLABAs (oral long acting beta-agonists) 2 Relievers include SABAs (inhaled short acting beta-agonists), ACBs (anti-cholinergic bronchodilators), and SANBs (shorting acting non-beta selective agents) 3 OCS (oral corticosteroid)
Related Documents