http://researchcommons.waikato.ac.nz/ Research Commons at the University of Waikato Copyright Statement: The digital copy of this thesis is protected by the Copyright Act 1994 (New Zealand). The thesis may be consulted by you, provided you comply with the provisions of the Act and the following conditions of use: Any use you make of these documents or images must be for research or private study purposes only, and you may not make them available to any other person. Authors control the copyright of their thesis. You will recognise the author’s right to be identified as the author of the thesis, and due acknowledgement will be made to the author where appropriate. You will obtain the author’s permission before publishing any material from the thesis.

Welcome message from author
This document is posted to help you gain knowledge. Please leave a comment to let me know what you think about it! Share it to your friends and learn new things together.
Transcript

http://researchcommons.waikato.ac.nz/
Research Commons at the University of Waikato Copyright Statement:
The digital copy of this thesis is protected by the Copyright Act 1994 (New Zealand).
The thesis may be consulted by you, provided you comply with the provisions of the
Act and the following conditions of use:
Any use you make of these documents or images must be for research or private
study purposes only, and you may not make them available to any other person.
Authors control the copyright of their thesis. You will recognise the author’s right
to be identified as the author of the thesis, and due acknowledgement will be
made to the author where appropriate.
You will obtain the author’s permission before publishing any material from the thesis.

Development of wirelessnetwork planning software for
rural community use
A thesis
submitted in fulfillment
of the requirements for the degree
of
Doctor of Philosophy in Computer Science
at
The University of Waikato
by
SAMUEL JAMES BARTELS
The University of Waikato
2012


Abstract
Rural New Zealand has poor access to broadband Internet. The CRCnet
project at the University of Waikato identified point-to-point wireless tech-
nology as an appropriate solution, and built networks for rural communities.
The project identified viable solutions using low-cost wireless technologies and
commodity hardware, allowing them to establish general construction guide-
lines for planning rural wireless networks. The CRCnet researchers speculated
that these general construction guidelines had simplified the wireless network
problem to a point at which it seemed feasible to embed the guidelines within
a software tool. A significant observation by the CRCnet researchers was that
community members are collectively aware of much of the local information
that is required in the planning process. Bringing these two ideas together,
this thesis hypothesises that a software tool could be designed to enable mem-
bers of rural communities to plan their own wireless networks.
To investigate this hypothesis, a wireless network planning system (Wi-
Plan) was developed. WiPlan includes a tutorial that takes the unique ap-
proach of teaching the user process rather than the detail of network planning.
WiPlan was evaluated using a novel evaluation technique structured as a role-
playing game. The study design provided participants with local knowledge
appropriate for their planning roles. In two trials, WiPlan was found to sup-
port participants in successfully planning feasible networks, soliciting local
knowledge as needed throughout the planning process. Participants in both
trials were able to use the techniques introduced by the tutorial while planning
their wireless network and successfully plan feasible wireless networks within
budget in both study trials. This thesis explores the feasibility of designing a
wireless networking planning tool, that can assist members of rural communi-
ties with no expertise in wireless network planning, to plan a feasible network
and provides reasonable evidence to support the claim that such a planning
tool is feasible.i


Declaration
The work in this thesis is based on research carried in the Department of
Computing and Mathematical Sciences at the University of Waikato, New
Zealand. No part of this thesis has been submitted elsewhere for any other
degree or qualification and it all my own work unless referenced to the contrary
in the text.
Copyright c© 2012 by Sam Bartels.
The copyright of this thesis rests with the author. No quotations from it
should be published without the author’s prior written consent and information
derived from it should be acknowledged.
iii

Acknowledgements
To my supervisors, thank you for your massive effort over this long journey.
Sally Jo, your on-going support and constructive criticism throughout this
long process has been much appreciated. With the much appreciated help of
Bill and Tony, you have helped me complete an interesting and novel piece of
research. Thank you.
Bill, your vision and insight have been vital factors for the success of the re-
search described in this thesis. You have this unique gift of viewing the big
picture and being able to explain it. Thank you.
Tony, you believed in me from the beginning, and for that I am very grateful.
You were always available when I needed advice and your thorough review of
my chapters was incredibly helpful.
Alan, you encouraged and supported to undertake a PhD. You have always
shown a keen interest in my work and I look forward to catching up with you.
Murray, you inspired me to further explore rural wireless networks and the
impact they have on rural communities. Thank you for sharing your knowl-
edge and expertise with me, particularly for conducting the expert review and
evaluating the network plans that the study participants designed.
v

Jamie, thanks for sharing your wireless knowledge with me and for answering
various questions I have had along the way.
Shane and Brendon, you guys have been my sounding board, my ’unofficial’
supervisors. When I needed fresh eyes to give advice, you guys were there to
help, thanks.
Matt, thanks for your help with Inkscape diagrams and friendship over the
final months of this journey. It’s great to be able to share thesis stories and
know that I am not the only one finding it hard!
My fellow PhDers Scott, Andreas, Alex and Paul, and our resident student
Brad, thank you for your friendship and advice during this journey.
This work has been supported financially by the Department of Computer Sci-
ence for which I am very grateful.
Dave Nichols and Mike Twidale, thank you for taking the time to conduct the
expert reviews on the WiPlan interface. The suggestions you both made were
very helpful and significantly improved the WiPlan interface.
Tena rawa atu koe Te Taka mo o tohutohu atawhai me o kupu awhina. I tua
ke au mahi awhina ka nui taku whakamiha mau. Tena koe. (Te Taka, thank
you so much for your kind guidance and advice. You went above and beyond
to help me out and it is much appreciated. Thank you.)
Tena koe Pania i whai wa ki te korero mai ki te awhina mai. E whakamiha
atu ana. (Pania, thank you for taking the time to talk with me and for your
advice, much appreciated.)
vi

E te iwi o Te Whaiti, otira Tuhoe nui tonu, tena koutou i manaakitia matou o
Rurallink me te arahi o matou i to whenua ataaahua. Ka wehi te tuhinga nei i
ta koutou mana, a, ko te tumanaako ka whai take te tuhinga nei mo a koutou
mahi me o koutou whakatipuranga. Kore e mutu te mihi ki a koutou. (The
people of Te Whaiti and wider Tuhoe, thank you for your hospitality when I
visited with Rurallink and for showing me around your beautiful land. I hope
that this thesis has been respectful towards you and that the findings of this
thesis are relevant and useful to you. Much appreciated.)
To my user study participants, many thanks for taking several hours out of
your busy schedule to assist me with evaluating WiPlan. Your support is much
appreciated and I hope you enjoyed participating in my user studies.
Friends and family, thank you so much for your understanding and support
during this journey. Mum and Dad, you have always endeavoured to support
me in every possible way that you could and I really appreciate your love and
support.
Finally, to my wonderful and supportive wife Brenda. You have stood by my
side for the entirety of this long journey, providing encouragement and
motivation, and for that I am deeply grateful.
vii

Contents
1 Introduction 1
1.1 Wireless technology solutions . . . . . . . . . . . . . . . . . . . 3
1.2 The CRCnet project . . . . . . . . . . . . . . . . . . . . . . . . 6
1.2.1 Established networks . . . . . . . . . . . . . . . . . . . 12
1.2.1.1 The original CRCnet network and extensions . 13
1.2.1.2 The Tuhoe network . . . . . . . . . . . . . . . 16
1.2.2 Conclusions from the CRCnet project . . . . . . . . . . . 19
1.3 Problem statement . . . . . . . . . . . . . . . . . . . . . . . . . 20
1.4 Research methodology . . . . . . . . . . . . . . . . . . . . . . . 21
1.4.1 How are wireless networks currently planned? . . . . . . 21
1.4.2 What information is required and how is that informa-
tion gathered? . . . . . . . . . . . . . . . . . . . . . . . . 22
1.4.3 If a wireless network planning tool needs to be imple-
mented, . . . . . . . . . . . . . . . . . . . . . . . . . . . 22
1.4.3.1 How can the feasibility of links be established? 23
1.4.3.2 How can the user interface of such a tool be de-
signed and implemented such that it is suitable
for collaborative use by non-expert community
members? . . . . . . . . . . . . . . . . . . . . 23
1.4.3.3 Once the tool has been implemented, how can
it be evaluated to determine if the thesis ques-
tion has been answered? . . . . . . . . . . . . . 23
1.5 Research contributions . . . . . . . . . . . . . . . . . . . . . . . 25ix
1.6 Thesis outline . . . . . . . . . . . . . . . . . . . . . . . . . . . 25
2 Planning wireless networks 29
2.1 Complexity and scale . . . . . . . . . . . . . . . . . . . . . . . 29
2.2 Broadness of constraints . . . . . . . . . . . . . . . . . . . . . . 31
2.3 Strategies for the planning process . . . . . . . . . . . . . . . . 33
2.3.1 Mesh strategy . . . . . . . . . . . . . . . . . . . . . . . . 34
2.3.2 Direct strategy . . . . . . . . . . . . . . . . . . . . . . . 34
2.3.3 Forward-branch strategy . . . . . . . . . . . . . . . . . . 35
2.3.4 Reverse-branch strategy . . . . . . . . . . . . . . . . . . 37
2.3.5 Multi-branch strategy . . . . . . . . . . . . . . . . . . . 37
2.4 Planning tasks and actions . . . . . . . . . . . . . . . . . . . . 40
2.4.1 Planning action context . . . . . . . . . . . . . . . . . . 42
2.5 Chapter summary . . . . . . . . . . . . . . . . . . . . . . . . . . 44
3 Computer-assisted planning 45
3.1 Algorithmic planning . . . . . . . . . . . . . . . . . . . . . . . . 45
3.1.1 An algorithmic planning example . . . . . . . . . . . . . 47
3.1.2 Algorithmic planning literature . . . . . . . . . . . . . . 50
3.1.2.1 Energy efficiency . . . . . . . . . . . . . . . . . 50
3.1.2.2 Coverage . . . . . . . . . . . . . . . . . . . . . 50
3.1.3 Algorithmic planning summary . . . . . . . . . . . . . . 51
3.2 Computer-assisted planning . . . . . . . . . . . . . . . . . . . . 52
3.2.1 Evaluation of existing CAP tools . . . . . . . . . . . . . 53
3.3 Chapter findings . . . . . . . . . . . . . . . . . . . . . . . . . . 60
3.4 Chapter summary . . . . . . . . . . . . . . . . . . . . . . . . . . 62
4 Gathering information for planning a wireless network 63
4.1 Methodology for information identification . . . . . . . . . . . . 63
4.1.1 Who was the first point of contact? . . . . . . . . . . . . 64
4.1.2 What were the processes employed to gather the infor-
mation? . . . . . . . . . . . . . . . . . . . . . . . . . . . 64x

4.2 Local knowledge . . . . . . . . . . . . . . . . . . . . . . . . . . 65
4.3 The natural environment . . . . . . . . . . . . . . . . . . . . . . 67
4.3.1 Climate . . . . . . . . . . . . . . . . . . . . . . . . . . . 70
4.4 The human environment . . . . . . . . . . . . . . . . . . . . . . 71
4.5 Chapter summary . . . . . . . . . . . . . . . . . . . . . . . . . . 75
5 Link feasibility analysis 77
5.1 Chosen propagation models . . . . . . . . . . . . . . . . . . . . 79
5.2 The link profile and area profile tools . . . . . . . . . . . . . . . 81
5.3 Decision tree . . . . . . . . . . . . . . . . . . . . . . . . . . . . . 84
5.4 Chapter summary . . . . . . . . . . . . . . . . . . . . . . . . . . 86
6 The process of designing the WiPlan user interface 87
6.1 Methodology overview . . . . . . . . . . . . . . . . . . . . . . . 87
6.1.1 Interface design requirements . . . . . . . . . . . . . . . 89
6.1.2 Stakeholders . . . . . . . . . . . . . . . . . . . . . . . . . 93
6.1.3 Actors . . . . . . . . . . . . . . . . . . . . . . . . . . . . 93
6.1.4 Personas . . . . . . . . . . . . . . . . . . . . . . . . . . . 97
6.2 WiPlan user interface overview . . . . . . . . . . . . . . . . . . 99
6.2.1 The WiPlan tutorial and guide . . . . . . . . . . . . . . 99
6.2.2 The main interface . . . . . . . . . . . . . . . . . . . . . 100
6.2.3 Advanced tools . . . . . . . . . . . . . . . . . . . . . . . 102
6.3 Use cases and implemented functionality . . . . . . . . . . . . . 104
6.3.1 Finding a site location . . . . . . . . . . . . . . . . . . . 105
6.3.1.1 Finding houses . . . . . . . . . . . . . . . . . . 105
6.3.1.2 Choosing relays . . . . . . . . . . . . . . . . . . 106
6.3.2 Creating a site . . . . . . . . . . . . . . . . . . . . . . . 107
6.3.3 Accessing site properties . . . . . . . . . . . . . . . . . . 109
6.3.3.1 Site properties for a house/source site . . . . . 109
6.3.3.2 Site properties for a relay site . . . . . . . . . . 110
6.3.4 Creating a link . . . . . . . . . . . . . . . . . . . . . . . 113
6.3.5 Computing line-of-sight . . . . . . . . . . . . . . . . . . . 115xi

6.3.6 Computing coverage analysis . . . . . . . . . . . . . . . . 120
6.4 Evaluation of WiPlan features . . . . . . . . . . . . . . . . . . . 121
6.4.1 Local knowledge and user support . . . . . . . . . . . . . 121
6.4.2 Algorithmic planning support . . . . . . . . . . . . . . . 122
6.4.3 Computer assistance . . . . . . . . . . . . . . . . . . . . 123
6.4.3.1 Geographic support . . . . . . . . . . . . . . . 123
6.4.3.2 Analysis support . . . . . . . . . . . . . . . . . 123
6.4.4 Wireless network planning action support . . . . . . . . 124
6.5 Chapter summary . . . . . . . . . . . . . . . . . . . . . . . . . . 125
7 Implementation 127
7.1 Development environment and WiPlan architecture . . . . . . . 127
7.2 Internal data structure of a site . . . . . . . . . . . . . . . . . . 137
7.3 Chapter summary . . . . . . . . . . . . . . . . . . . . . . . . . . 140
8 Expert evaluation 141
8.1 Usability heuristics . . . . . . . . . . . . . . . . . . . . . . . . . 143
8.2 HCI expert reviews . . . . . . . . . . . . . . . . . . . . . . . . . 144
8.2.1 Expert review one . . . . . . . . . . . . . . . . . . . . . 145
8.2.2 Expert review two . . . . . . . . . . . . . . . . . . . . . 152
8.3 Wireless network planning expert review . . . . . . . . . . . . . 153
8.3.1 Persona discussion . . . . . . . . . . . . . . . . . . . . . 154
8.3.2 Pre-tutorial discussion . . . . . . . . . . . . . . . . . . . 155
8.3.3 Post-tutorial discussion . . . . . . . . . . . . . . . . . . . 156
8.3.4 Recommendations . . . . . . . . . . . . . . . . . . . . . . 157
8.4 Chapter summary . . . . . . . . . . . . . . . . . . . . . . . . . . 158
9 Evaluating WiPlan in the wireless network planning process 159
9.1 Study design . . . . . . . . . . . . . . . . . . . . . . . . . . . . 159
9.2 First trial . . . . . . . . . . . . . . . . . . . . . . . . . . . . . . 165
9.2.1 Tutorial . . . . . . . . . . . . . . . . . . . . . . . . . . . 167
9.2.2 Network plan . . . . . . . . . . . . . . . . . . . . . . . . 170xii
9.2.2.1 Planning approach and decisions . . . . . . . . 171
9.2.3 Local knowledge consideration for relay creation . . . . 174
9.2.4 Usability issues . . . . . . . . . . . . . . . . . . . . . . . 176
9.2.5 Expert feedback . . . . . . . . . . . . . . . . . . . . . . 177
9.3 Second trial . . . . . . . . . . . . . . . . . . . . . . . . . . . . . 178
9.3.1 Tutorial . . . . . . . . . . . . . . . . . . . . . . . . . . . 180
9.3.2 Network plan . . . . . . . . . . . . . . . . . . . . . . . . 184
9.3.2.1 Planning approach and decisions . . . . . . . . 186
9.3.3 Local knowledge consideration for relay creation . . . . . 193
9.3.4 Usability issues . . . . . . . . . . . . . . . . . . . . . . . 195
9.3.5 Expert feedback . . . . . . . . . . . . . . . . . . . . . . . 197
9.4 Chapter findings . . . . . . . . . . . . . . . . . . . . . . . . . . 197
9.4.1 Did the participants engage in role-playing their per-
sonas and collaborate on planning the wireless network? 198
9.4.2 Did the tutorial assist participants with decision making
and troubleshooting during the wireless network plan-
ning process? . . . . . . . . . . . . . . . . . . . . . . . . 199
9.4.3 Were the participants able to plan a wireless network
and draw out relevant local knowledge during the process?201
9.4.4 What are the main threats to validity and limitations of
the evaluation results? . . . . . . . . . . . . . . . . . . . 203
9.5 Chapter summary . . . . . . . . . . . . . . . . . . . . . . . . . . 204
10 Conclusions 207
10.1 Research contributions . . . . . . . . . . . . . . . . . . . . . . . 211
10.2 Future work . . . . . . . . . . . . . . . . . . . . . . . . . . . . . 212
10.2.1 WiPlan . . . . . . . . . . . . . . . . . . . . . . . . . . . 212
10.2.2 Testing radio wave propagation models . . . . . . . . . 214
10.2.3 Exploring application context . . . . . . . . . . . . . . . 214
A Existing CAP tool evaluation 217
A.1 Local knowledge and user support . . . . . . . . . . . . . . . . . 218xiii
A.2 Algorithmic planning support . . . . . . . . . . . . . . . . . . . 219
A.3 Computer assistance . . . . . . . . . . . . . . . . . . . . . . . . 220
A.3.1 Geographic support . . . . . . . . . . . . . . . . . . . . 220
A.3.2 Analysis support . . . . . . . . . . . . . . . . . . . . . . 221
A.4 Wireless network planning action support . . . . . . . . . . . . 222
A.4.1 Creating a site (A1) . . . . . . . . . . . . . . . . . . . . 223
A.4.2 Naming a site (A2) . . . . . . . . . . . . . . . . . . . . . 224
A.4.3 Selecting heights (A3) . . . . . . . . . . . . . . . . . . . 224
A.4.4 Point-to-point analysis (A4) . . . . . . . . . . . . . . . . 225
A.4.5 Point-to-multipoint analysis (A5) . . . . . . . . . . . . . 227
A.4.6 Action conclusions . . . . . . . . . . . . . . . . . . . . . 228
B Radio wave propagation models 229
B.1 Free-space . . . . . . . . . . . . . . . . . . . . . . . . . . . . . . 229
B.2 Free-space models . . . . . . . . . . . . . . . . . . . . . . . . . 229
B.2.1 Free-space path loss model . . . . . . . . . . . . . . . . 231
B.2.2 Friis transmission equation . . . . . . . . . . . . . . . . . 231
B.2.3 Plane-earth two-ray reflection model . . . . . . . . . . . 232
B.3 Vegetation models . . . . . . . . . . . . . . . . . . . . . . . . . 233
B.3.1 Weissberger . . . . . . . . . . . . . . . . . . . . . . . . . 233
B.3.2 ITU Model . . . . . . . . . . . . . . . . . . . . . . . . . 234
B.4 Urban city models . . . . . . . . . . . . . . . . . . . . . . . . . 236
B.5 Terrain models . . . . . . . . . . . . . . . . . . . . . . . . . . . 238
B.5.1 Egli Model . . . . . . . . . . . . . . . . . . . . . . . . . . 238
B.5.2 Irregular terrain model . . . . . . . . . . . . . . . . . . 238
B.5.3 ITU Terrain Model . . . . . . . . . . . . . . . . . . . . . 239
C Converting field strength to loss 241
D Personas 243
D.1 Sheep and beef farmer . . . . . . . . . . . . . . . . . . . . . . . 243
D.2 Dairy farmer . . . . . . . . . . . . . . . . . . . . . . . . . . . . . 245xiv

D.3 School principal . . . . . . . . . . . . . . . . . . . . . . . . . . . 247
D.4 Community representative . . . . . . . . . . . . . . . . . . . . . 248
D.5 Cultural expert . . . . . . . . . . . . . . . . . . . . . . . . . . . 249
E Internet activities analysis 253
F WiPlan tutorial 255
G Radio wave propagation theory 261
G.1 Frequencies and line-of-sight . . . . . . . . . . . . . . . . . . . . 261
G.2 IEEE 802.11 protocols . . . . . . . . . . . . . . . . . . . . . . . 263
G.3 Antenna selection . . . . . . . . . . . . . . . . . . . . . . . . . 265
G.4 Signal and noise . . . . . . . . . . . . . . . . . . . . . . . . . . . 267
G.5 Loss . . . . . . . . . . . . . . . . . . . . . . . . . . . . . . . . . 269
G.6 Classification of transmission loss . . . . . . . . . . . . . . . . . 271
G.7 Link budget . . . . . . . . . . . . . . . . . . . . . . . . . . . . . 273
G.7.1 Example . . . . . . . . . . . . . . . . . . . . . . . . . . . 274
H Example area profile configuration 275
I Ethics approval 279
Bibliography 281
xv
List of Figures
1.1 Solar relay . . . . . . . . . . . . . . . . . . . . . . . . . . . . . . 8
1.2 Examples of a powered relay site and client premise equipment
for a house site. . . . . . . . . . . . . . . . . . . . . . . . . . . . 8
1.3 Height comparison of communication structures . . . . . . . . . 9
1.4 Parts of a solar relay site . . . . . . . . . . . . . . . . . . . . . . 10
1.5 A map of New Zealand showing the locations of key networks. . 12
1.6 The current structure of the CRCnet network. . . . . . . . . . . 15
1.7 The current structure of the Tuhoe network. . . . . . . . . . . . 17
2.1 Example of the mesh strategy . . . . . . . . . . . . . . . . . . . 36
2.2 Example of the direct strategy . . . . . . . . . . . . . . . . . . . 36
2.3 Example of forward-branch strategy . . . . . . . . . . . . . . . . 38
2.4 Example of reverse-branch strategy . . . . . . . . . . . . . . . . 38
2.5 Example of multi-branch strategy . . . . . . . . . . . . . . . . . 39
5.1 Example of a link profile plot showing the terrain, line-of-sight
and the innermost Fresnel zone. . . . . . . . . . . . . . . . . . . 78
5.2 The decision tree used in WiPlan for diagnosing a link. . . . . . 84
6.1 The spiral model . . . . . . . . . . . . . . . . . . . . . . . . . . 88
6.2 The main screen of WiPlan. . . . . . . . . . . . . . . . . . . . . 100
6.3 An example of the mouse helper text box when hovered over a
site. . . . . . . . . . . . . . . . . . . . . . . . . . . . . . . . . . 101
6.4 An example of the mouse helper text box when hovered over a
link. . . . . . . . . . . . . . . . . . . . . . . . . . . . . . . . . . 102xvi

6.5 The interface configuration tool in WiPlan. . . . . . . . . . . . . 103
6.6 The antenna configuration tool in WiPlan. . . . . . . . . . . . . 103
6.7 Icons representing mouse operations. . . . . . . . . . . . . . . . 104
6.8 Creating a site . . . . . . . . . . . . . . . . . . . . . . . . . . . 108
6.9 . . . . . . . . . . . . . . . . . . . . . . . . . . . . . . . . . . . . 108
6.10 Accessing a menu . . . . . . . . . . . . . . . . . . . . . . . . . . 109
6.11 An example of the site properties information window for a
house site. . . . . . . . . . . . . . . . . . . . . . . . . . . . . . . 111
6.12 An example of the site properties dialog for a relay site. . . . . 112
6.13 An example of the line-of-sight indicator in WiPlan. . . . . . . 113
6.14 An example of the line-of-sight confirmation dialog in WiPlan. . 114
6.15 An example of the link profile information window where the
link is successful. . . . . . . . . . . . . . . . . . . . . . . . . . . 116
6.16 An example of a link profile dialog where the link has failed. . . 117
6.17 An example of a link profile dialog where user input is required. 118
6.18 An example of a coverage plot created for a relay site in WiPlan.120
7.1 Model-view controller architecture of WiPlan showing lines of
communication. . . . . . . . . . . . . . . . . . . . . . . . . . . . 130
7.2 Class diagram showing the site data structure. . . . . . . . . . 139
8.1 Icons . . . . . . . . . . . . . . . . . . . . . . . . . . . . . . . . . 146
8.2 Link Profile dialog . . . . . . . . . . . . . . . . . . . . . . . . . 148
8.3 Site properties information window . . . . . . . . . . . . . . . . 149
8.4 Compass rose . . . . . . . . . . . . . . . . . . . . . . . . . . . . 150
9.1 Main map of the Te Whaiti area used for study design . . . . . 163
9.2 Room layout diagram for the first trial . . . . . . . . . . . . . . 167
9.3 These graphs show the main actions of the participants during
the tutorial of the first trial. . . . . . . . . . . . . . . . . . . . . 169
9.4 The final wireless network plan for the first trial . . . . . . . . . 170
9.5 The participants in the first trial plan their wireless network. . . 172xvii

9.6 These graphs show the main actions of the participants during
the network planning part of the first trial. The shaded areas
show where WiPlan crashed. . . . . . . . . . . . . . . . . . . . . 173
9.7 Room layout diagram for the second trial . . . . . . . . . . . . . 180
9.8 Participants engaged in the tutorial of the second trial . . . . . 181
9.9 Graphs showing a time-line of completed tutorial steps and map
modes used during the tutorial of the second trial. . . . . . . . 183
9.10 Graphs showing a time-line of site and link events, and time
spent in dialogs, during the tutorial of the second trial. . . . . 184
9.11 The final wireless network plan for the second trial . . . . . . . 185
9.12 The dairy farmer identifies Minginui during the planning part
of the second trial. . . . . . . . . . . . . . . . . . . . . . . . . . 187
9.13 Participants discuss line-of-sight for a link during the planning
part of the second trial. . . . . . . . . . . . . . . . . . . . . . . 189
9.14 The community representative points out relay site coverage
during the planning part of the second trial. . . . . . . . . . . . 190
9.15 These graphs show the main actions of the participants during
the network planning part of the second trial. . . . . . . . . . . 192
A.1 Radio Mobile Link Profile . . . . . . . . . . . . . . . . . . . . . 226
A.2 Splat! coverage plot . . . . . . . . . . . . . . . . . . . . . . . . . 227
B.1 The two-ray model applied to a particular link. . . . . . . . . . 233
B.2 Model of a link with vegetation obstruction. . . . . . . . . . . . 234
B.3 Model of a link with one terminal in vegetation. . . . . . . . . . 235
D.1 Map of the sheep and beef farm . . . . . . . . . . . . . . . . . . 244
D.2 Map of the dairy farm . . . . . . . . . . . . . . . . . . . . . . . 246
D.3 Map showing heritage sites . . . . . . . . . . . . . . . . . . . . . 251
G.1 Example of a path profile plot showing Fresnel zone . . . . . . . 263
G.2 Classifications of transmission loss (sourced from [28]) . . . . . . 273
xviii

List of Tables
2.1 Number of relays vs geographic area . . . . . . . . . . . . . . . 30
2.2 Exploring the search space . . . . . . . . . . . . . . . . . . . . . 30
2.3 Broadness of constraint classifications . . . . . . . . . . . . . . . 32
3.1 Example of food types and prices . . . . . . . . . . . . . . . . . 49
3.2 Example of daily minimum requirements . . . . . . . . . . . . . 49
3.3 Example of nutrient content per food type . . . . . . . . . . . . 49
3.4 Feature support for existing tools including local knowledge,
user support and algorithmic planning . . . . . . . . . . . . . . 56
3.5 Supported geographic features for existing CAP tools . . . . . . 57
3.6 Supported analysis methods for existing CAP tools . . . . . . . 58
3.7 Wireless network planning action support . . . . . . . . . . . . . 59
6.1 Characteristics of target end-users. . . . . . . . . . . . . . . . . 97
7.1 Main controller class. . . . . . . . . . . . . . . . . . . . . . . . . 131
7.2 Elevation controller class. . . . . . . . . . . . . . . . . . . . . . 131
7.3 ElevationModel class. . . . . . . . . . . . . . . . . . . . . . . . . 131
7.4 ExternalAppsController class. . . . . . . . . . . . . . . . . . . . 132
7.5 Hardwarecontroller class. . . . . . . . . . . . . . . . . . . . . . . 133
7.6 WGS84controller class. . . . . . . . . . . . . . . . . . . . . . . . 133
7.7 WGS84ModelNZTM class. . . . . . . . . . . . . . . . . . . . . . 133
7.8 SiteController class . . . . . . . . . . . . . . . . . . . . . . . . . 134
7.9 CoverageController class . . . . . . . . . . . . . . . . . . . . . . 135
7.10 LinkController class. . . . . . . . . . . . . . . . . . . . . . . . . 136xx

7.11 LinkModel class. . . . . . . . . . . . . . . . . . . . . . . . . . . 136
9.1 Characteristics of trial participants versus those of target end-
users. . . . . . . . . . . . . . . . . . . . . . . . . . . . . . . . . . 166
9.2 Time taken to complete each tutorial step for the first trial . . . 168
9.3 A summary of the relays placed in the first trial identifying
whether the relay was placed at a trig site and details of the
geographic coordinates. . . . . . . . . . . . . . . . . . . . . . . . 174
9.4 A summary of the relays placed in the first trial identifying the
antenna height and power supply, as well as detailing whether
permission and access were considered. . . . . . . . . . . . . . . 175
9.5 Characteristics of trial participants versus those of target end-
users. . . . . . . . . . . . . . . . . . . . . . . . . . . . . . . . . . 179
9.6 Time taken to complete each tutorial step for the second trial . 182
9.7 A summary of the relays placed in the second trial identifying
whether the relay was placed at a trig site and details of the
geographic coordinates. . . . . . . . . . . . . . . . . . . . . . . . 193
9.8 A summary of the relays placed in the second trial identify-
ing the antenna height and power supply, as well as detailing
whether permission and access were considered. . . . . . . . . . 194
B.1 A selection of radio wave propagation models and key properties.230

xxii

Chapter 1
Introduction
The impact of the Internet on human lives is increasing every day. More
and more services are becoming available online that help to enhance the stan-
dard of living for many people. Social networking has become viral with Face-
book [5] and Twitter [23] the dominant two. Facebook, which launched in
2004, had more than 500 million active users in 2010. Twitter launched in
2006 and is estimated to have 190 million users in 2010.
Economic opportunities have also increased with real-world stores opening
online stores and the introduction of online-only stores. Online auction sites
such as EBay [3] and Trademe [22] are also providing economic opportunities.
People want to be able to experience these services and opportunities online
but unfortunately there are still areas in the world that have poor Internet
connectivity, particularly rural areas. This thesis has a particular focus on
rural New Zealand but the findings in this thesis apply to any of these areas
where the population density is sparse. The definition of sparse in this thesis
refers to population densities of 2.6 to 0.5 people per square kilometre [32].
Broadband refers to the broad number or band of frequencies used to trans-
fer a signal at significant speed. The broader the band of frequencies, the more
the speed increases. More commonly though, broadband has become the term1

for describing a high-speed connection to the Internet. The OECD have de-
fined broadband as having download data transfer rates equal to or faster than
256 kbps [63]. The OECD definition of broadband is used in this thesis. In
New Zealand, as of 2009, 78% of rural households have access to the Internet
- 55% via broadband access and 23% via dialup [39]. Approximately 54% of
rural households on dialup do not have broadband because it is not available
in their area. Also, 30% of rural households on dialup do not have broadband
because they believe that broadband is too expensive. According to Net Index,
New Zealand’s average broadband speed is 7.64 Mbps [11].
New Zealand has a long history of low telecommunications investment in
rural areas [42]. DSL, the most common technology for delivering broadband
Internet, is ineffective at distances beyond seven kilometres from a DSL ex-
change [42] and installing new DSL exchanges can cost hundreds of thousands
of dollars. Telecommunication companies conventionally do not profit much
from providing Internet access and spending a large amount of money up-front
on rural areas would receive a poor return. Investing in telecommunication ven-
tures requires not only the cost of the network infrastructure, but also the cost
of network planning experts. Suitable experts may have limited availability
and rural networks require extensive time for the expert to become acquainted
with the rural area.
The advantage that wireless technology has over wired technology is that
the planning effort is concentrated on connection points, rather than the route
of the physical communication medium. For large rural areas with sparse pop-
ulations of people, this is an attractive advantage. Terrain and other factors
have less of an influence on wireless technologies than wired technologies be-
cause wired technology needs to be physically trenched in the ground or using
aerial deployment, where the cables are carried overhead by large poles. Rural
roll-out of wired technology costs up to $4000 per kilometre for trenching and
up to $5000 per kilometre for aerial deployment [98].2
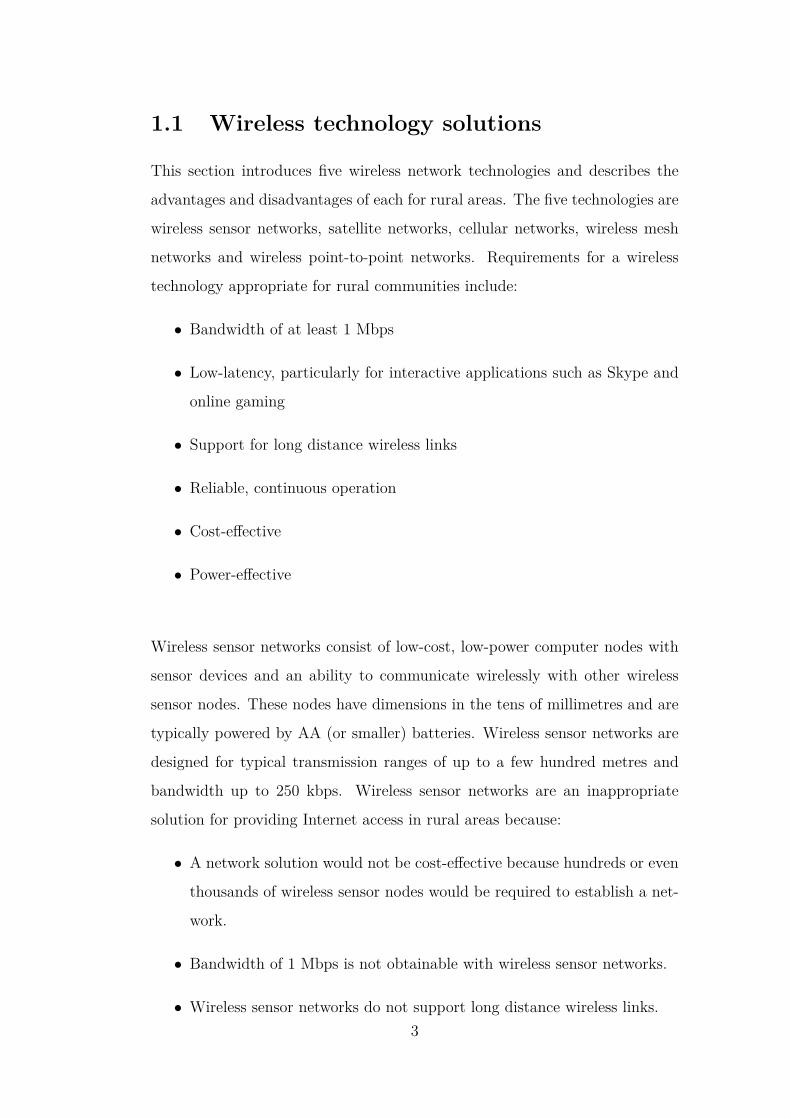
1.1 Wireless technology solutions
This section introduces five wireless network technologies and describes the
advantages and disadvantages of each for rural areas. The five technologies are
wireless sensor networks, satellite networks, cellular networks, wireless mesh
networks and wireless point-to-point networks. Requirements for a wireless
technology appropriate for rural communities include:
• Bandwidth of at least 1 Mbps
• Low-latency, particularly for interactive applications such as Skype and
online gaming
• Support for long distance wireless links
• Reliable, continuous operation
• Cost-effective
• Power-effective
Wireless sensor networks consist of low-cost, low-power computer nodes with
sensor devices and an ability to communicate wirelessly with other wireless
sensor nodes. These nodes have dimensions in the tens of millimetres and are
typically powered by AA (or smaller) batteries. Wireless sensor networks are
designed for typical transmission ranges of up to a few hundred metres and
bandwidth up to 250 kbps. Wireless sensor networks are an inappropriate
solution for providing Internet access in rural areas because:
• A network solution would not be cost-effective because hundreds or even
thousands of wireless sensor nodes would be required to establish a net-
work.
• Bandwidth of 1 Mbps is not obtainable with wireless sensor networks.
• Wireless sensor networks do not support long distance wireless links.3

• Wireless sensor networks are not designed for continuous transmissions.
Continuous transmissions would drain the batteries and nodes would
cease to function. Even with charging facilities, such as solar panels, it
is unlikely that the batteries could be charged at a rate faster than they
are being drained by the radio.
Satellites orbit the earth from 500–7,500 kilometres above the Earth’s surface
for low-earth orbit satellites [74], and at an altitude of 35,788 kilometres for
geosynchronous orbit satellites [29]. One-way and two-way satellite Internet so-
lutions exist. One-way operates by sending the signal from the users computer
to the Internet service provider (ISP) using a dialup telephone connection.
In the reverse direction, any data downloaded by the user is transmitted to
the satellite and relayed back to earth to the user’s location using a satellite
modem and a receive-only dish. Two-way is more common than one-way and
involves the satellite in both directions. The user has a satellite dish that is
capable of both transmitting to, and receiving from, the satellite. The primary
advantage of satellite networks is that Internet access can be provided nearly
anywhere on Earth. Satellite networks can provide Internet access where no
other Internet options are possible, such as on remote islands. However, in this
thesis, satellite Internet is considered an inappropriate solution for providing
Internet access to rural communities because:
• Satellite networks incur high latency ranging from 10 - 250ms [125].
These high latencies are inappropriate for interactive applications such
as Skype and online gaming.
• Satellite networks suffer from rain fade and other atmospheric conditions.
This means that bad weather can degrade or interrupt the satellite signal.
• Internet bandwidth is expensive and incurs strict data caps. These data
caps are typically per day rather than per month and unused data does
not rollover to the next day [58].
4

Cellular networks operate with a base station model where the base station
costs tens of thousands of dollars but can serve a great number of users. The
problem with cellular networks is that they are only cost effective for areas
with high population densities. In sparsely populated areas, such as rural ar-
eas, there are not enough users to make the cellular approach economically
viable.
Mesh-based solutions are cheaper than cellular networks but still suffer
from issues with user density. Mesh networks are prone to interference and
have a low throughput due to the number of hops involved. Mesh-based solu-
tions are inappropriate for providing Internet access to rural communities due
to the low density of users in rural areas and the costs involved.
Establishing long-range point-to-point networks in low-density areas is a
cost-effective approach for wireless networks in rural areas. Most point-to-
point technologies operate in the public spectrum and are low-latency. The
availability of standardised wireless equipment such as ubiquiti [24] and meri-
aki [10] is increasing and new equipment is emerging all the time as wireless
technology advances. The main advantage with point-to-point wireless tech-
nology is that it is low-cost; for example, ubiquiti devices cost a few hundred
dollars. The point-to-multipoint equivalent of the technology is useful for areas
of higher density, such as villages.
This discussion has shown that point-to-point is primarily the most ap-
propriate wireless technology solution for providing Internet connectivity in
rural areas. Point-to-point wireless networks are cost-effective and provide
low-latency while delivering broadband data rates. For these reasons, point-
to-point wireless technology, specifically 802.11 [35], has been selected for use
in this thesis.
5
1.2 The CRCnet project
This section introduces the CRCnet project and describes how the project
contributed to this thesis. The CRCnet project was a major inspiration and
motivation for this thesis and identified that there was a need for broadband
infrastructure in rural areas. The project shows that low-cost wireless tech-
nologies are viable for creating broadband wireless networks in rural areas and
that rural communities are willing to be involved. The success of the CRCnet
rural networks is largely dependent on community consultation and involve-
ment. Familiarisation with the CRCnet project has helped the researcher to
understand the wireless network planning process and identify important net-
work planning lessons that were learned throughout the CRCnet project.
The following tells the story of the CRCnet project; firstly, to introduce
useful terminology for this thesis by using the CRCnet infrastructure as exam-
ples; and secondly, to discuss the CRCnet networks and how the lessons that
were learned from these networks contributed to this thesis.
The CRCnet (Connecting Rural Communities) project was started at the
University of Waikato to investigate how best to provide Internet access to
rural communities using low-cost wireless technologies. The group gained a
greater understanding of how wireless networks operate in rural areas by build-
ing seven wireless networks over a period of ten years. Three of the networks
are actually extensions of the original CRCnet network. The three exten-
sions are: Te Pahu, Ngaroma and Eastern. The other three networks are the
Hokianga, Rotorua and Tuhoe networks. The group also collaborated on wire-
less networks in South Africa, Samoa and the Solomon islands. The CRCnet
project was recently commercialised and became Rurallink, showing that there
is a legitimate need for broadband access in rural New Zealand. Now a fully-
fledged ISP, Rurallink also operates the University of Waikato student wireless
network and is establishing a wireless hot-spot presence in central Hamilton,
New Zealand.6

There are four components that that are used to construct the CRCnet net-
works: the solar relay, the powered relay, client premise equipment (CPE) and
the Internet source. Relays transmit the wireless signal to other relays and to
peoples homes. Most CRCnet relays are based on Soekris Technologies [19]
small form-factor computers. Soekris computers have low DC power consump-
tion, no moving parts and can support multiple radios. Figure 1.1 shows an
example of a solar relay which is used where mains power is not available.
Solar panels and rechargeable batteries are used to provide power to the re-
lay. Solar relays have sufficient battery capacity to run for two or three days
without charging so the site can still operate in cloudy weather. The powered
relay can be mounted on a pole in a paddock, as shown in Figure 1.2(a) and
power sourced from tens of metres away or the relay can be put on a building
such as a shed or house to achieve the height advantage of being mounted on
a pole but for less cost. A CPE is required for peoples homes to receive the
wireless signal. The CPE is an integrated radio device designed for installation
on houses. Figure 1.2(b) shows an example of a CPE.
7

Figure 1.1: Solar relay
(a) A powered relay (b) Client premise equipment
Figure 1.2: Examples of a powered relay site and client premise equipment fora house site.
8

Kordia, New Zealand’s state owned telecommunications company, provides
the majority of Internet sources used in the CRCnet networks. Kordia pro-
vides national communication services for broadcast, telecommunications and
specialized network solutions in New Zealand. Kordia owns a nationwide net-
work of transmission towers, and has presence in major city buildings, that
allow network operators such as CRCnet to install their own equipment and
means that these transmission towers and buildings are potential sources for a
wireless network. Figure 1.3 shows a comparison between CRCnet relays and
major communication structures, including Kordia transmission towers, that
can be found in New Zealand.
Transmission
tower
40m
Rural
cellular
tower
20m
Urban
cellular
tower
9m
CRCnet
powered
repeater
6m
CRCnet
solar
repeater
4.5m
Average
adult
1.7m
Note: all heights are an approximate indication
Sensor
node
14cm
Figure 1.3: Height comparison of communication structures
In this thesis, a site is the particular location of an electronic communica-
tion device that is part of a wireless network. The term source site refers to
the point of connection to the Internet, usually via an Internet service provider
(ISP). The term relay site is used to refer to the solar relay and powered relay.
The CPE is referred to as a house site though this may be another type of
building such as a school. The term house site is used because the word ‘house’
is more meaningful to rural people than ‘client premise equipment’.
9

A site consists of distinct parts; Figure 1.4 shows the parts for a solar relay
site. Every site has at least one antenna that is responsible for converting
electrical current to radio wave energy for transmitting and converting radio
wave energy back to electrical current for receiving. A network interface card is
a component that allows computers to connect to a network and communicate.
Each wireless network interface card is physically connected to an antenna. A
site will have at least one host which is a small, generally low-power computer
that contains one or two network interface cards. The Soekris is a type of host.
Solar sites also require batteries and a solar controller to manage the charging
and use of the rechargeable batteries.
Figure 1.4: Parts of a solar relay site
A wireless link is a radio wave communications channel shared between
two or more wireless sites. A point-to-point (P2P) link is a dedicated link that
connects two wireless sites exclusively. A point-to-multipoint (P2MP) link is
when one wireless site is connected to other wireless sites via a shared chan-
nel. A wireless access point providing Internet connectivity to multiple houses
within a village is an example of point-to-multipoint. A link profile plot is a
cross-section of the terrain between two connected sites. The link profile plot
shows the terrain variation between the two sites as well as line-of-sight. Main-10
taining line-of-sight is important for the operation of wireless links as wireless
technologies work poorly or not at all when line-of-sight is obstructed.
Network connectivity means that each site is connected to every other site
in the network, either directly or via other sites, and ultimately, to the Inter-
net. Coverage refers to the geographic area within which a wireless site can
communicate. Coverage plots are used to visualise the coverage area. Cover-
age can also be expressed for the entire network–this is a union of each site’s
coverage area.
11

1.2.1 Established networks
This section discusses five of the CRCnet networks and the important lessons
that were learned during planning and construction of these networks. The
original CRCnet network is described, as well as three extensions: the Te
Pahu network, the Eastern network and the Ngaroma network. The fifth
network described is the Tuhoe network. Figure 1.5 shows the location of the
CRCnet network (including extensions) and the Tuhoe network on a map of
New Zealand.
Figure 1.5: A map of New Zealand showing the locations of key networks.12

1.2.1.1 The original CRCnet network and extensions
The original network was built to investigate how wireless networks perform in
rural areas and to be a testbed for the development and testing of technologies
and software. The original network extended from Hamilton to the west with
its Internet source being the University of Waikato. The focus was to connect
a number of schools, and homes of university staff, to broadband Internet.
The network involved about 20 relay sites and the link of greatest length was
17 km. Rural schools involved were able to successfully video conference as a
result.
Over subsequent years the network was extended to cover new areas. A
small rural community, Te Pahu, was just beyond the original network. At
the time the New Zealand Government was providing a broadband initiative
fund and the Te Pahu community was granted part of this fund. An additional
three relay sites were added to the existing network and now approximately
80 customers are connected to that part of the network. Another source was
added for redundancy from one of Kordia’s towers. The planner of the CRCnet
network estimates that five days were spent in consultation with the Te Pahu
community to plan this part of the network.
The network also extended to the east and to the south of Hamilton. The
Eastern network added six relay sites and was sourced from the University
of Waikato. The eastern network has approximately 80 customers and the
longest link in the eastern area is 23 km. The Ngaroma network to the south
was connected to the original network via a 42 km link and also to the eastern
network, creating a loop. Five relay sites were added to connect approximately
42 customers in the Ngaroma area to the network. The planner of the CR-
Cnet network estimates that seven days were spent in consultation with the
Ngaroma community to plan this part of the network. Figure 1.6 shows the
current structure and relative size of the CRCnet network including the three
extensions.13

The evolution of the CRCnet project is of particular motivational interest
for this thesis. A number of valuable lessons have been learned with respect
to wireless network planning including:
• CRCnet researchers noticed the quality of a link that cleared a group of
trees a few years ago started to degrade. Investigation showed that the
trees had grown taller and partially obstructed line-of-sight. The lesson
here is that future vegetation growth needs to be anticipated when plan-
ning a link over or near vegetation. This would be particularly important
if trees had only just been planted or if the landowner was planning on
planting trees there in the near future.
• CRCnet researchers found that attempting to get physical access to a
site at the back of a farm during winter proved to be quite difficult. The
dirt track had turned to mud due to the winter rain and the 4WD vehicle
could not get through the mud. The researchers had to return later once
the track had dried out. This highlights the issue of accessibility to sites.
It is important to know how a site should be accessed and how that
access changes as a result of the weather and time of year. Sites cannot
be built or maintained if they cannot be accessed.
• Livestock have chewed through CRCnet site cables and knocked equip-
ment about. This illustrates the importance of adequately protecting
cables and surrounding sites with fences.
• Lightning strikes can hit wireless sites and this has happened twice on
CRCnet networks. Every wireless site should have a lightning rod to
help protect the site against a lightning strike.
• Mains power is not available everywhere and so alternative energy sources
are often required. It is important to know what the typical weather
experienced at that site is like to make a decision about what alternative
energy source is best.14
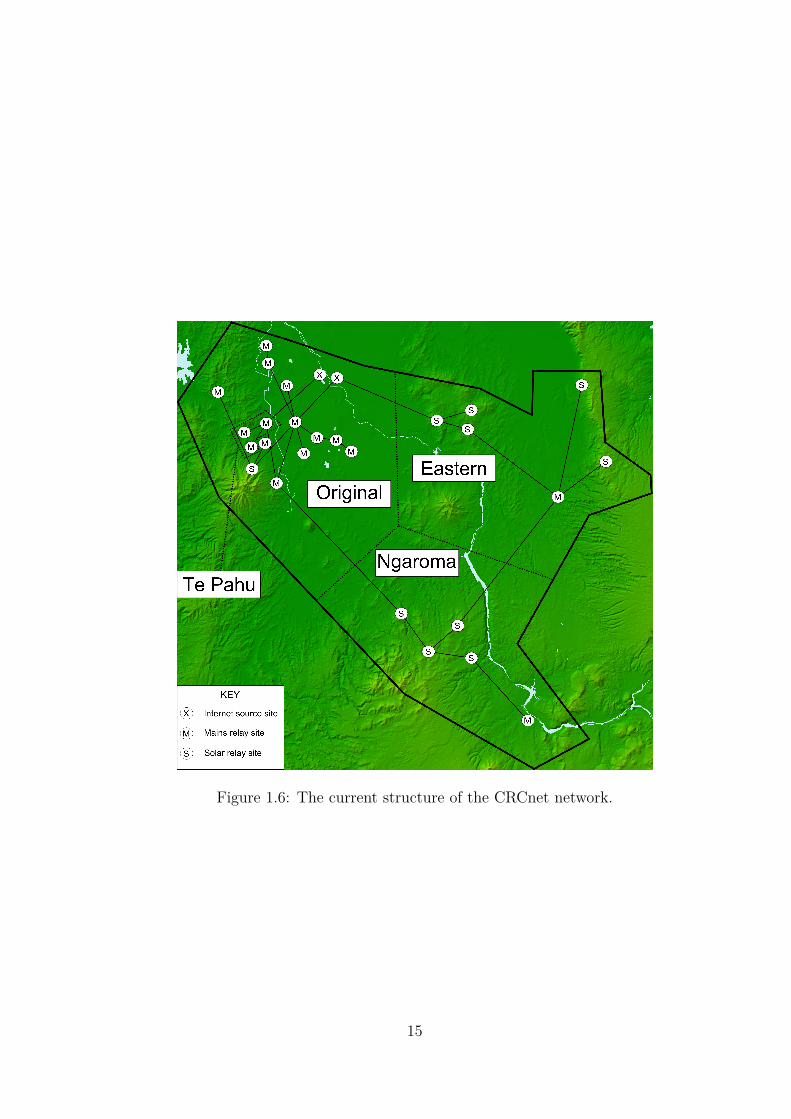
Figure 1.6: The current structure of the CRCnet network.
15

These valuable lessons have been applied to the planning tool presented in
this thesis. Part of the CRCnet network is used for the tutorial used in the
planning tool, which is discussed in Chapter 6.
1.2.1.2 The Tuhoe network
The Tuhoe network was originally built to connect four of New Zealand’s
most remote schools to the Internet. The schools were located in the moun-
tainous Urewera National Park while the Internet source was a Kordia site
70 kilometres away from the nearest school. The Urewera National Park is a
mountainous area with much of the terrain covered with vegetation. The area
is sparsely populated, with the majority of residents living in isolated villages.
The remoteness and rugged terrain of this area is of particular interest for this
thesis and part of the Tuhoe network has been used to create the user study
for this thesis, which is discussed in Chapter 9.
The network has since been extended to reach more schools and approx-
imately 40 homes. Approximately 20 relays were required to construct the
network and the longest link is 25 kilometres over mountainous terrain. The
planner of the Tuhoe network estimates that 20 days were spent in consulta-
tion with the Tuhoe community to plan this network. Most of this time was
spent consulting with iwi. Figure 1.7 shows the current structure and relative
size of the Tuhoe network.
Thirteen of the relays in the network are solar-powered, each taking a team
of three people a single day to build. Two of these solar sites required a he-
licopter to deliver all of the equipment due to their remoteness. One of the
solar sites sits on the top of Mount Tawhiuau and is regularly dusted with
snow during the winter months of the year. The construction of this network
has had significant input from the local communities involved and it is now
managed by Tuhoe Online, an ISP established by the local iwi.
16
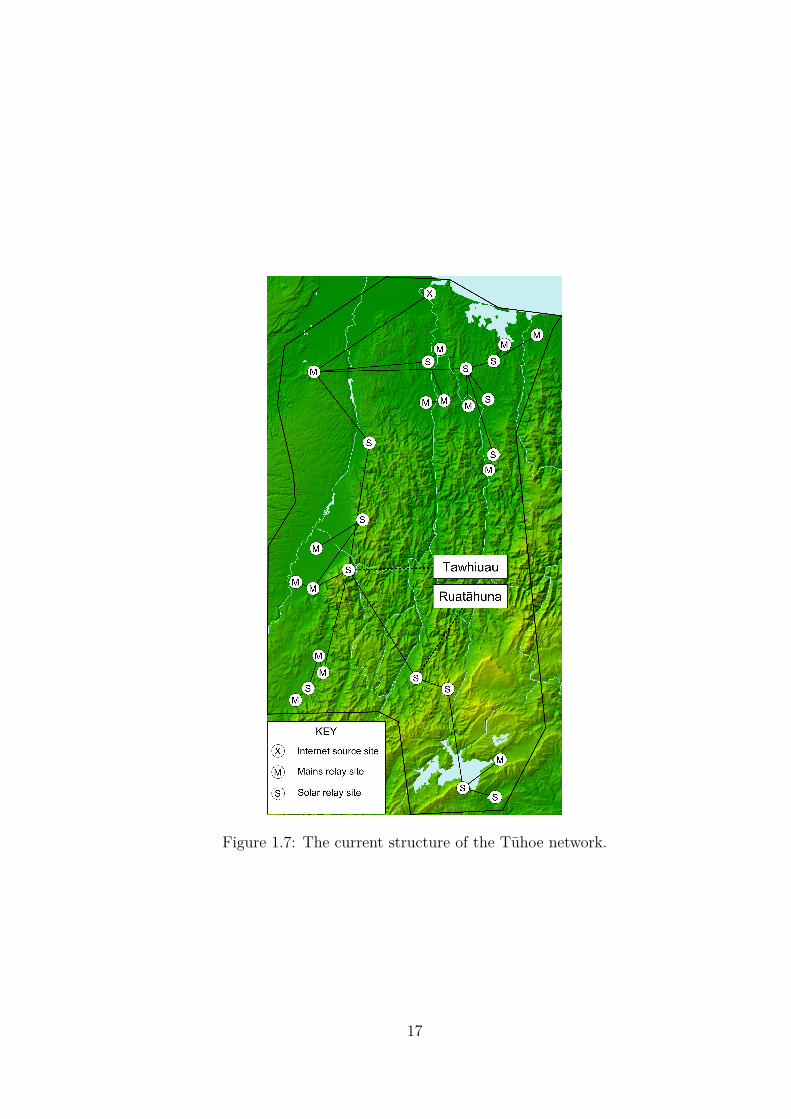
Figure 1.7: The current structure of the Tuhoe network.
17

The Tuhoe network highlighted the need and importance of cultural con-
sultation and local knowledge for wireless network planning including:
• Natural features such as mountains, forests and rivers are important to
Maori. Mountain summits are often a good choice for wireless sites how-
ever mountain summits may also be sacred to local Maori. This is the
case with Mount Tawhiuau and by consultation with iwi, the site was
built to one side of the summit. This raises the importance of consul-
tation with local cultural experts to identify culturally significant areas.
Another example of the importance of cultural consultation was when
CRCnet researchers were faced with two similar trees blocking a poten-
tial link. After consultation with a cultural expert, they found that one
of the trees was culturally significant and could not be touched but the
other tree was not and so could be removed. Again, this shows the im-
portance of consultation with local cultural experts to identify objects
and areas that are culturally significant.
• CRCnet researchers discovered after constructing the Tawhiuau site, that
at over 1000 metres in altitude, Mount Tawhiuau was often immersed in
cloud. This created issues with receiving enough solar energy to suffi-
ciently power the site. This was resolved by using larger batteries, though
occasionally an extended period of cloudy weather will run the batteries
flat and the batteries would then need to be replaced. Consultation with
the community about typical weather conditions at the site would have
helped identify these issues in advance and allow the site to be designed
appropriately with the use of larger batteries, more solar panels and the
possible consideration of wind power.
• Mount Tawhiuau has a walking track that is regularly used by people
in the community. This is an important piece of local knowledge that
indicates that there is adequate access by foot to the summit of Mount
Tawhiuau and illustrates the importance of accessibility to a site.18

1.2.2 Conclusions from the CRCnet project
The CRCnet project has identified the importance of community involvement
in the planning of a wireless network. CRCnet researchers discovered that
consultation with community members is vital for obtaining important infor-
mation to assist with the planning of a wireless network. The researchers found
that community involvement in planning the wireless network, as well as the
building and maintaining of the network, can bring a number of social bene-
fits to the community. The wireless network can be viewed as a community
achievement and as an important social bond for the community.
CRCnet researchers realised that their wireless network planning expertise
was only required for a small fraction of the time that they spent physically
visiting an area as the majority of their time was spent exploring the area
to determine what constraints exist. CRCnet researchers have investigated
building wireless networks using commodity hardware and have discovered
what works and what does not, allowing them to establish general construction
guidelines for planning rural wireless networks. These general construction
guidelines have simplified the wireless network problem to a point that it seems
feasible to embed these guidelines within a software tool.
19

1.3 Problem statement
Currently, wireless network planning is lead by wireless network planning ex-
perts because these experts have intimate knowledge of the behaviour of wire-
less networks and how wireless networks are affected by physical environmental
constraints. However, local communities have the best local knowledge of their
area. This includes detailed knowledge of the physical environment as well as
knowledge about culturally sensitive areas and potential social issues. The
general construction guidelines established by the CRCnet researchers have
simplified the wireless network problem to a point where it seems feasible to
embed these guidelines within a software tool. This thesis hypothesises that
such a software tool could be designed to enable members of rural communities
to plan their own wireless networks.
This thesis examines the following question:
Can a software tool be designed to assist members of rural com-
munities with no expertise in wireless network planning, to plan a
feasible wireless network?
The primary contribution of this thesis is that: the feasibility of designing a
wireless networking planning tool that can assist members of rural communi-
ties with no expertise in wireless network planning, to plan a feasible network,
has been established.
Current rural wireless network planning involves local community group meet-
ings led by a wireless planning expert. The proposed solution envisions such
meetings as still occurring but with software taking the place of the wireless
planning expert. It is probably still necessary for several members of the local
community to be involved collaboratively to obtain all the details about the
local area that are required.
20
1.4 Research methodology
The following research questions can be derived from the main thesis question:
• How are wireless networks currently planned?
• What information is required and how is that information gathered?
• If a wireless network planning tool needs to be implemented,
– How can the user interface of such a tool be designed and imple-
mented such that it is suitable for collaborative use by non-expert
community members?
– How can the feasibility and adequacy of links be established?
– Once the tool has been implemented, how can it be evaluated to
determine if the thesis question has been answered?
1.4.1 How are wireless networks currently planned?
Wireless networks are planned by radio engineers conducting site surveys [16]
and using analytical tools [121]. Depending on the scale of the network be-
ing planned and the wireless technology being used, software varies from on-
line calculators [70] through to commercial software such as EDX and Men-
tum Planet [121]. The CRCnet group use Google Earth [8] and Radio Mo-
bile [18] for wireless network planning; Johnson et al. recommend a similar
approach [85]. Literature review of wireless community networks, such as
those in India [113] and Latin America [73], and extensive consultation with
the CRCnet group were used to investigate how wireless networks are currently
planned.
It was established that there are a broad number of potential constraints
from natural, human and technical sources. Analysis of existing wireless net-
works indicated that the size of the network was independent of the phys-
ical area covered and the number of constraints present in that area. Five21
key strategies for planning rural wireless networks were identified, including
tasks and actions that occur as part of the planning process. Two methods
for approaching planning problems were discovered; algorithmic planning and
computer-assisted planning.
Further investigation discovered that algorithmic planning requires up-front
knowledge of all possible constraints and is therefore inappropriate for address-
ing the entire rural wireless network planning problem. Computer-assisted
planning bypasses this requirement of up-front knowledge of constraints. A
review of twelve prominent wireless network planning tools was conducted to
identify if any were appropriate for rural wireless network planning by non-
expert community members, and to identify software and usability features
that are important for wireless network planning.
1.4.2 What information is required and how is that in-
formation gathered?
Information required for wireless network planning, and how it is gathered,
was identified by:
• consultation with the CRCnet group and in particular, learning from
their previous experiences.
• visiting wireless site installations and observing the physical, social and
technical factors that are involved.
• visually analysing photos and topographic maps of CRCnet networks.
• speaking informally with rural community members.
1.4.3 If a wireless network planning tool needs to be
implemented,
Evaluation of the twelve prominent tools showed that no one tool was suitable
for rural wireless network planning. Extending one of the existing tools was22
considered, however most of the tools were commercial and/or closed source,
and a new user interface was required, it was decided to implement a new tool.
1.4.3.1 How can the feasibility of links be established?
There is extensive literature documenting radio wave propagation models which
is explored in Appendix B. This literature was used to conduct a review of ra-
dio wave propagation models in Section 5.1 to establish which model or models
were appropriate for radio wave propagation in rural environments. Once a
model is chosen and that model has been used to predict propagation loss,
the link budget formula that incorporates all gains and losses can be used to
establish link feasibility. Utility programs were then able to be implemented
that used these appropriate models with the link budget formula to calculate
radio wave propagation attenuation and establish link feasibility. These utility
programs are described in Section 5.2.
1.4.3.2 How can the user interface of such a tool be designed and
implemented such that it is suitable for collaborative use
by non-expert community members?
The use of personas is important, as potential end users would be difficult to
have a available for repeated design and usability tests. These personas were
accurately based on real people that the CRCnet group, and to a lessor degree
the author, have consulted with. The author and members of the design feed-
back panel are from rural/farming backgrounds. Respect and understanding
of cultural customs is important in both the development cycle and in the
final software. The tool is intended to be operated by one user but to support
collaborative use.
1.4.3.3 Once the tool has been implemented, how can it be evalu-
ated to determine if the thesis question has been answered?
The tool can be evaluated with expert reviews and user testing. Expert re-
views were conducted to evaluate usability and functionality. This included23

two usability expert reviews and one wireless network planning expert review.
Expert reviews were conducted prior to user testing to identify usability prob-
lems that would prevent users from completing the planning process. Expert
evaluation has a faster turn-around time than user testing and means that us-
ability problems could be quickly identified and addressed before progressing
to user testing.
The usability expert reviews were a mix of heuristic evaluation with a cog-
nitive walk-through. The two usability experts independently used the WiPlan
software by following the tutorial and experimenting with the interface. Each
expert evaluated the interface against Nielsen’s heuristics and identified usabil-
ity problems by heuristic. Issues from the first usability review were addressed
before the second review took place. The wireless network planning expert also
used the WiPlan software by following the tutorial and experimenting with the
interface. The expert commented on the user interface and functionality.
Two user study evaluations took place in groups of five where each person
role-played a persona. Role-playing was used as a real meeting that could
be observed is impractical. A real meeting may take place over more than
one day. Rural communities are typically isolated from urban areas and it
would be difficult to get real people together in one place at one time, as
farmers in particular are very busy people. Real people from an area where a
wireless network already exists may also be biased by the existing network. The
advantages of role-playing means that an area with an existing network that is
known to the researcher can be chosen where the situation is fully understood
and the presence of an existing network shows that a viable solution exists.
24

1.5 Research contributions
The research in this thesis makes the following original contributions:
• A review of widely-used existing wireless network planning tools, iden-
tifying features that a planning tool for use by non-expert rural com-
munities should support, and identification of five strategies for wireless
network planning.
• An methodology for identifying natural, human and technical constraints
that affect rural wireless network planning. Natural, human and techni-
cal constraints were identified in a New Zealand context and the effect
of those constraints on rural wireless network planning was analysed.
• A novel HCI study design, structured as a role-playing game, for eval-
uating cooperative planning software, and a demonstration of its effec-
tiveness for use when the target end users were difficult to attain.
• The proposed software tool was actually built and was fundamental for
the aforementioned novel role playing game evaluation.
1.6 Thesis outline
This thesis is multi-disciplinary, drawing on and contributing to work in the ar-
eas of radio wave propagation, radio regulations, wireless computer networks,
rural deployment, computer-aided planning, user interfaces and algorithms,
usability evaluation, rural communities and socio-technical issues. Because of
this diversity, there is no single literature review chapter in this thesis. In-
stead, review of other work in the areas concerned is presented in the relevant
chapters. Specific chapters that review literature include Chapter 3, Chap-
ter 5, Chapter 6, Chapter 8 and Chapter 9. Requirements elicitation is also
spread over many chapters in this thesis. Design requirements are explicitly
defined in a double-framed box as they are identified. Requirements identi-
fied in a particular chapter are summarised at the end of that chapter. All25

of the design requirements are then summarised at the beginning of Chapter 6.
Chapter 2 establishes that wireless network planning is non-trivial by dis-
cussing the range of issues that need to be considered. These issues include
the complexity and scale of the wireless network planning problem and the
broad range of constraints that affect wireless network planning. The chapter
then introduces five strategies that can be used for planning wireless networks.
These strategies are relevant in the user trials discussed in Chapter 9.
Two approaches to wireless network planning are presented in Chapter
3: algorithmic planning; and computer-assisted planning. Each of these ap-
proaches is described and literature relevant to the approach is reviewed. The
chapter concludes with a review of twelve existing computer-assisted planning
tools and identifies features that a planning tool should support.
Chapter 4 discusses the types of information that are required for planning
a wireless network and how these types of information can be obtained. The
chapter describes information regarding the natural environment, climate and
the human environment.
Chapter 5 discusses the key issue of link feasibility analysis in wireless
network planning and describes the WiPlan approach for determining link fea-
sibility.
Chapter 6 introduces the use of personas and how they were used in the
development of WiPlan. The chapter then describes the user interface design
of WiPlan and finally the WiPlan system is subjected to the same analysis as
the existing planning tools described in Chapter 3.
Chapter 7 discusses the implementation of WiPlan, describing the devel-
opment environment and the internal architecture of WiPlan.26
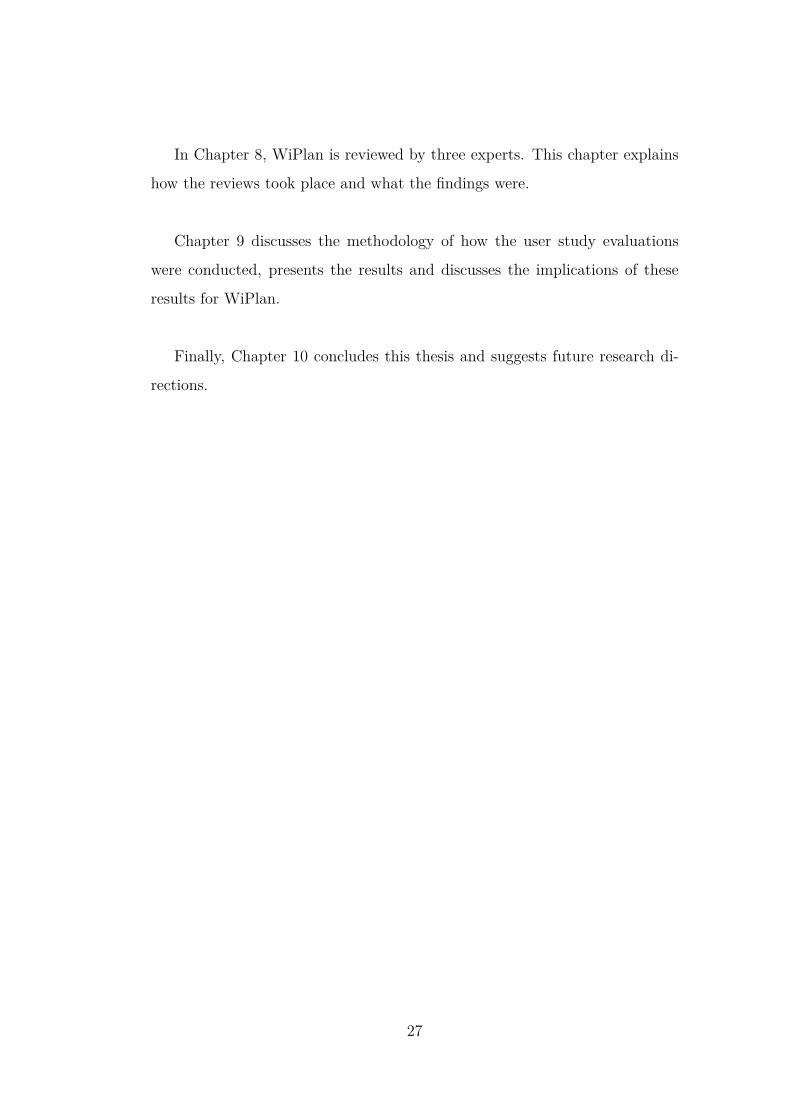
In Chapter 8, WiPlan is reviewed by three experts. This chapter explains
how the reviews took place and what the findings were.
Chapter 9 discusses the methodology of how the user study evaluations
were conducted, presents the results and discusses the implications of these
results for WiPlan.
Finally, Chapter 10 concludes this thesis and suggests future research di-
rections.
27

Chapter 2
Planning wireless networks
This chapter describes the complexity and scale of planning wireless networks
and discusses the broadness of the constraints involved. Planning a wireless
network requires decisions about where to place sites and establish links be-
tween sites. The complexity and scale of planning a wireless network means
that it is important to have a strategy to follow. This chapter presents five
different strategies for the planning process and details the tasks required in
following any of the strategies.
2.1 Complexity and scale
The complexity and scale of the wireless network planning problem is inter-
esting because the solution size remains almost constant independent of the
physical area and multiple constraints being searched. For example, consider
the CRCnet networks discussed in Section 1.2.1. Table 2.1 shows the approxi-
mate geographic area covered by three of the CRCnet networks and the number
of relays present in each. The table shows that the approximate geographic
area only has a small influence on the number of the relays in the solution.
29
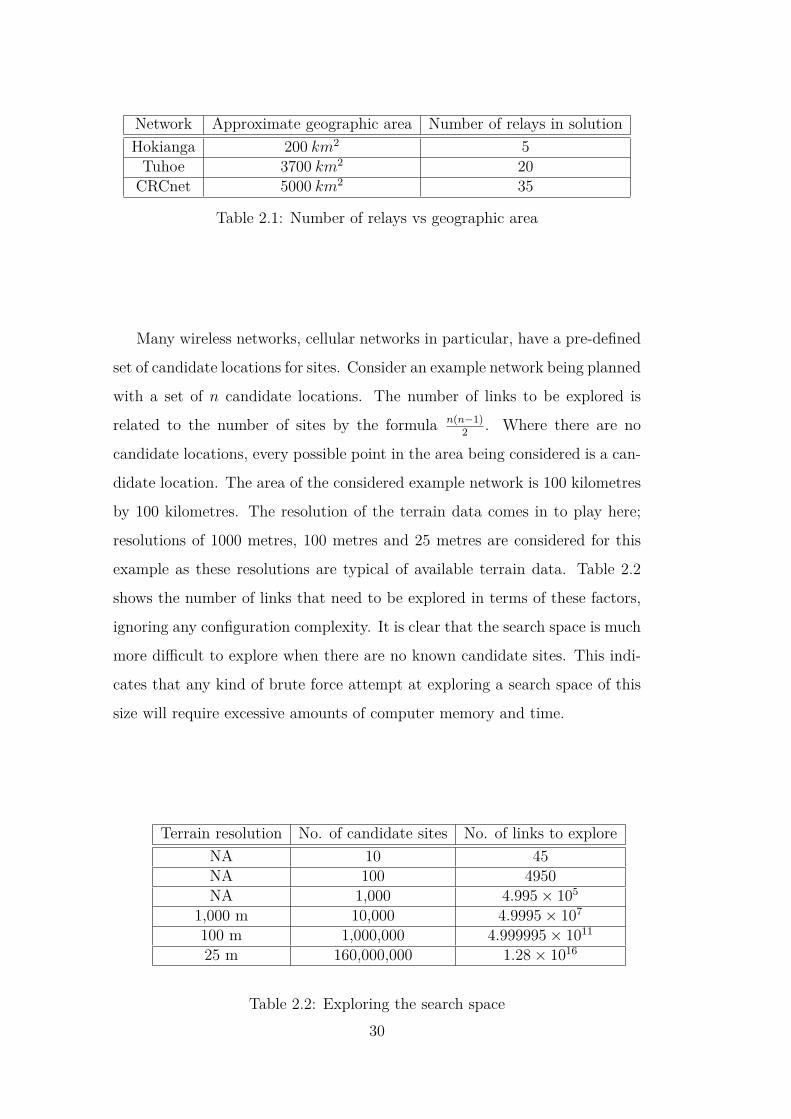
Network Approximate geographic area Number of relays in solutionHokianga 200 km2 5Tuhoe 3700 km2 20CRCnet 5000 km2 35
Table 2.1: Number of relays vs geographic area
Many wireless networks, cellular networks in particular, have a pre-defined
set of candidate locations for sites. Consider an example network being planned
with a set of n candidate locations. The number of links to be explored is
related to the number of sites by the formula n(n−1)2 . Where there are no
candidate locations, every possible point in the area being considered is a can-
didate location. The area of the considered example network is 100 kilometres
by 100 kilometres. The resolution of the terrain data comes in to play here;
resolutions of 1000 metres, 100 metres and 25 metres are considered for this
example as these resolutions are typical of available terrain data. Table 2.2
shows the number of links that need to be explored in terms of these factors,
ignoring any configuration complexity. It is clear that the search space is much
more difficult to explore when there are no known candidate sites. This indi-
cates that any kind of brute force attempt at exploring a search space of this
size will require excessive amounts of computer memory and time.
Terrain resolution No. of candidate sites No. of links to exploreNA 10 45NA 100 4950NA 1,000 4.995× 10⁵
1,000 m 10,000 4.9995× 10⁷
100 m 1,000,000 4.999995× 10¹¹
25 m 160,000,000 1.28× 10¹⁶
Table 2.2: Exploring the search space30

2.2 Broadness of constraints
Wireless network planning constraints span a broad range of environments.
Constraints can be categorised as: natural, such as terrain; human, such as
cultural sites; and technical, such as frequency. These constraints either affect
the placement of sites or the creation of links. The effects of these constraints
can often be mitigated; for example, the antennas of an obstructed link can be
raised so that the link is line-of-sight. However, some constraints can not be
mitigated and therefore the affected site or link is removed from consideration.
Constraints affect wireless network planning in different ways. It is a com-
plex task to identify and locate these constraints in the local area. The problem
is that it is difficult to acquire information on all the constraints globally in an
easy way. The sheer volume of data that would be required to store the broad
range of constraints for the entire geographic area being considered would be
very large.
The source of constraint data is the main problem. Some geographic data
is available digitally with varying degrees of quality. Knowledge of the ma-
jority of constraints are however only found in the minds of a diverse group
of people within the community. These people know where constraints are
and the significance of the constraints in the community, though they may not
know how the constraint affects wireless network planning. The precision and
accuracy of the knowledge of constraints may vary and other constraints can
vary and be prone to change.
Table 2.3 lists the constraint classifications by category that have been
identified through the CRCnet experience. Each classification of constraint
consists of several features; for example, hydrological consists of features such
as rivers, streams, lakes, swamps, wetlands and the coast. Examples of each
constraint category are given to illustrate the broadness of these constraints.
Further explanation of the effect that natural and human constraints have on31

wireless network planning are covered in Chapter 4. Technical constraints are
referred to throughout the thesis, though most of the technical constraints are
further described in Chapter 5.
Natural constraints Human constraints Technical constraintsTerrain Transportation infrastructure Line-of-sight
Hydrological Utilities Link distanceVegetation Buildings Link frequencyAnimals Theft/vandalism Radio selectionWeather Cultural Antenna selection
Social Link capacitySafety Power consumption
Power availability Site construction
Table 2.3: Broadness of constraint classifications
Terrain is a classification example of a natural constraint. Terrain exists in
different forms and affects wireless network planning in different ways. Terrain
primary affects the cost and access of a site as well as being a contributing
factor to deciding whether to place a site at a given location. As an example,
the Tawhiuau site in the Tuhoe network is at an elevation of 1000 metres.
Though a walking track exists, it takes approximately two and a half hours to
walk to the site. A helicopter was required to deliver the materials for building
the site. The batteries have had to be replaced twice for this site and both
times the batteries have been delivered by helicopter.
Cultural issues are a classification example of a human constraint. The pri-
mary cultural issue is respect of culturally significant objects and areas. Cer-
tain objects may affect a wireless link however these objects may be culturally
significant. For example, when building the Tuhoe network, the CRCnet team
were trying to establish a wireless link where a tree was obstructing line-of-
sight. After speaking to the cultural representative, they found that it was
fine to remove the tree. However, they were told that a similar tree, only a few
metres away, was culturally significant and could not be touched. Areas that
are culturally significant may prevent sites from being built in those areas. For32
example, in New Zealand, Maori people regard prominent mountain summits
as sacred; these sacred mountains should be respected by not building sites on
those sacred summits.
Site construction is an example of a technical constraint. The construction
of a site needs to protect the equipment from weather and animals while sup-
porting the antennas and other equipment. The CRCnet project has addressed
the issue of site construction with their solar and powered relay site solutions.
However in some situations, these site solutions may require adjustment, such
as in areas that experience high winds.
Requirement 1: a planning tool should solicit information about natural, hu-
man and technical constraints.
2.3 Strategies for the planning process
This section describes a range of planning strategies that people might use to
plan a wireless network. One of these strategies, the reverse-branch, is the
strategy that the CRCnet researchers employ for planning their wireless net-
works [106]. The other four strategies include: mesh, direct, forward-branch
and multi-branch. Discussing these five strategies shows that there are dif-
ferent strategies that people might use and that different strategies can apply
to different types of network planning problems. Identifying these strategies
also provides a means of evaluation for the study trials described in Chapter 9.
Constraints can be considered at any point in the strategies and therefore
are not explicitly referred to in the discussion of strategies. The discussed
strategies could be performed by hand, algorithmically or a blend of the two
(computer-assisted planning).
Requirement 2: a planning tool should support the use of all five of the network
planning strategies.33
2.3.1 Mesh strategy
The mesh strategy involves creating a mesh of links between sites and then
progressively eliminating links and sites. Figure 2.1 shows an example of how
to use the mesh strategy. Firstly, all of the source and house sites are created.
The area is then explored to identify possible relay site locations, such as el-
evated locations, where relay sites are subsequently placed. Links are then
established between the sites so the house sites and source site are connected
via relay sites. The process of site/link elimination can then begin.
There are several ways of eliminating sites and links from consideration.
In some cases, there will be a subset of line-of-sight links that connect the
house sites to the source site via relay sites. Any non-line-of-sight links and
associated relay sites are removed to leave the network solution.
One method of eliminating sites and links from consideration would be to
compare the cost of relays and repeatedly remove the most expensive relay
site until a solution is reached. This may require height adjustment of some
relay antenna heights to ensure line-of-sight links. Cost of relays should be
contrasted with the ease of access to a site, as a cheap site may be difficult to
access and vice-versa.
Often the elimination stage will reveal that there is not a complete solution
using the initial set of relay sites. In these cases, it is necessary to repeat the
process by placing relays in the areas where there are no viable links, creating
more links and removing by elimination.
2.3.2 Direct strategy
The direct strategy guarantees a solution but is likely to be inefficient for rural
areas as the solution will have an excessive number of relays. Figure 2.2 shows
an example of how to use the direct strategy. Firstly, all of the source and34

house sites are created. Secondly, the source and house sites are connected
using direct links. Thirdly, antenna heights are adjusted where possible to
create line-of-sight links.
Finally, for any links that are still non line-of-sight, a relay site is added at
the point in the link profile where line-of-sight is most significantly breached.
This means finding the highest hill that is blocking line-of-sight and placing a
relay site at the top of it. The non line-of-sight link can then be removed and
replaced with two new links, one of which needs to be line-of-sight to progress
towards a solution.
A solution will eventually found by repeating this method of adding relays
to non line-of-sight links. There is minimal area exploration involved in this
strategy and therefore this strategy tends to yield poor, and often expensive,
solutions.
2.3.3 Forward-branch strategy
The forward-branch strategy involves starting with the source site and branch-
ing towards the house sites. Figure 2.3 shows an example of how to use the
forward-branch strategy. Firstly, all of the source and house sites are created.
The forward-branch strategy starts with the source site, which is denoted the
current site. The area around the current site in the direction of the house
sites is explored to find possible relay site locations. Once suitable relay site
locations have been found, a relay is placed at each location and a link between
each relay and the source is established. This may require height adjustment
of some relay antenna heights to ensure line-of-sight links. Relay sites are then
eliminated based on site access and cost until one relay remains. This relay
then becomes the current site and the forward-branch strategy is repeated
until the source site is connected to all of the house sites via relay sites.35

Source
Relay
Relay
Relay
Relay
Relay
Relay
House
House
Relay
3 4
Source
Relay
Relay
House
House
Relay
Source
Relay
Relay
Relay
Relay
Relay
Relay
House
House
Relay
2
Source
House
House
1
Figure 2.1: Example of the mesh strategy
Source
House
House
1 2
Source
House
House
3
Source
House
House
Relay
4
Source
House
House
RelayRelay
5
Source
House
House
RelayRelay
Relay
6
Source
House
House
RelayRelay
RelayRelay
7
Source
House
House
RelayRelay
RelayRelay
Relay
Figure 2.2: Example of the direct strategy
36

2.3.4 Reverse-branch strategy
The reverse-branch strategy was used for planning the CRCnet networks [106].
Figure 2.4 shows an example of how to use the reverse-branch strategy. Firstly,
all of the source and house sites are created. The reverse-branch strategy starts
with the house sites and works backwards to the source site. The focus is to
firstly connect the house sites together using relay sites and then secondly
focus on connecting the house sites to the source site. The area around the
house sites is explored to find possible relay site locations for the house sites
to connect to. Once suitable relay site locations have been found, a relay is
placed at each location and a link between each relay and as many house sites
as possible is established. Some relay antenna heights may require adjustment
to ensure line-of-sight links.
Relay sites are then eliminated based on site considerations until the mini-
mum number of relays remains. The minimum number of relays is the number
of relays required to connect all of the house sites to at least one relay. Once
this has been achieved, the focus turns to connecting these relays to the source.
The area around each relay in the direction of the source site is explored to
find further possible relay site locations. Relay sites are then placed at these
locations and links are created between as many of the relays as possible. The
new relay sites are then eliminated based on site access and cost until ideally
one relay remains. In some cases, house sites may be far apart and several
iterations of the reverse-branch strategy may be required before only one new
relay is required to connect all of the previous relays. The reverse-branch strat-
egy is repeated until all of the house sites are connected to the source site via
relay sites.
2.3.5 Multi-branch strategy
The multi-branch strategy is best used when there is a single large tower or
hill that overlooks much of the surrounding area. Figure 2.5 shows an example37

3
Source
Relay
Relay
House
House
Relay
4
Source
Relay
Relay
Relay
House
House
Relay
Source
Relay
Relay
House
House
Relay
5 6
Source
Relay
Relay
House
House
Relay
2
Source
Relay
Relay
Relay
House
HouseSource
House
House
1
Figure 2.3: Example of forward-branch strategy
Source
Relay
Relay
Relay
Relay
Relay
House
House
Relay
5
Source
Relay
Relay
House
House
Relay
6
Source
Relay
Relay
House
House
Relay
3
Source
Relay
Relay
Relay
Relay
Relay
House
House
Relay
4
Source
Relay
Relay
Relay
Relay
House
House
Relay
2
Source
House
House
1
Figure 2.4: Example of reverse-branch strategy
38

of how to use the multi-branch strategy. Firstly, all of the source and house
sites are created. The focus is then to find a single relay site that is elevated
above the rest of the terrain. Once the relay site has been placed at this
high elevation, further relay site locations can be explored in the direction
of both the source and the house sites using either the forward-branch or
reverse-branch strategies. In some cases, direct links to the source and/or
house sites may be possible. Typically, links will branch out from the relay
site in two directions but more branches may be required if the house sites are
well dispersed. Focus can be on one branch at a time or one relay at a time
for each branch before looking at the next branch. Some relay antenna heights
may require adjustment to ensure line-of-sight links.
Source
Relay
Relay
Relay
Relay
Relay
House
House
Relay
3
Source
Relay
Relay
House
House
Relay
4
Source
Relay
Relay
Relay
Relay
Relay
House
House
Relay
2
Source
House
House
1
Figure 2.5: Example of multi-branch strategy
39

2.4 Planning tasks and actions
This section explains the tasks that take place as part of the wireless network
planning processes discussed in Section 2.3. These tasks can be derived by
considering the following three observations paraphrased from the observations
by Sen and Raman [113]:
O1 Antenna heights, antenna types, and transmit powers are all de-
pendent on the network topology
O2 Antenna heights are independent of the antenna types or the trans-
mit powers, as antenna heights ensure that there is line-of-sight
O3 Antenna types and transmit powers are directly dependent on one
another.
Observation O1 suggests that the primary objective in wireless network plan-
ning is to establish a network topology. Establishing a network topology is in
fact two tasks in itself; Task 1 (T1) is to determine the placement of sites and
Task 2 (T2) is to create links between the sites.
Since tower heights are independent of the antenna types and the transmit
powers, and are chosen simply to ensure line-of-sight, Task 3 (T3) is to estab-
lish line-of-sight for each link by adjusting antenna heights at either end of
the link. Once line-of-sight has been established, antenna types and transmit
powers can be determined. The use of 802.11 protocols largely implies that the
antennas determine the transmit power and so effectively the determination of
antenna types and transmit powers are solved together and are incorporated
within Task 3.
Typically Task 1, Task 2 and Task 3 are carried out in sequence but once
this sequence has occurred once, these tasks can be carried out in any order
(at least two sites must exist to create a link and a link must exist in order to
establish line-of-sight).40

T1 Placement of sites
T2 Creation of links
T3 Line-of-sight establishment
There are five actions that a user can perform to accomplish these tasks. Some
actions only achieve part of a task while other actions can complete more than
one task.
Action 1 (A1) is choosing a location for creating a site; it is useful to give
the created site a relevant name so it can be easily identified, Action 2 (A2) is
therefore naming a site. Both Action 1 (A1) and Action 2 (A2) are regarded
as part of Task 1 (T1).
Action 3 (A3) is the setting and adjusting of antenna heights which can
be regarded as being part of Task 1 (T1) or Task 3 (T3) depending on im-
plementation. For example, a site may be created that has a four metre pole
for mounting antennas on (T1). However, a particular link may require the
antenna to be five metres high (T3), in which case the pole height may be
revisited.
Creating a link/conducting point-to-point analysis is Action 4 (A4) and
computing coverage/conducting point-to-multipoint analysis is Action 5 (A5).
Action 4 (A4) and Action 5 (A5) achieve completing Task 2 (T2) and often
Task 3 (T3) also. For example, the user may create a link and establish line-
of-sight of that link in sequence (T2 and T3). Otherwise, the user may revisit
the link at a later stage and adjusts the antenna heights (A3) to establish
line-of-sight (T3).
A1 Choosing a location for creating a site (Part of T1)
A2 Naming a site (Part of T1)
A3 Setting/adjusting antenna heights (Part of T1 or T3)41

A4 Creating a link
A5 Computing coverage
Requirement 3: a planning tool should support all of these tasks and actions.
2.4.1 Planning action context
This section describes the context in which each planning action is performed,
discussing such issues as when the action is performed, how difficult the action
is and what information is required to perform the action.
A1 - Choosing a location for creating a site A site can be created at
anytime by anyone with knowledge about constraints in the local area. This is
achieved by deciding on a suitable location that is not subject to constraints
such as those identified in Section2.2. This action is of medium difficulty, as it
requires extensive local knowledge to identify constraints; however community
collaboration can help with identifying constraints and reduce the difficulty
involved.
A2 - Naming a site A site can be given any name by anyone, though the
site must first exist. The site should be given a sensible and relevant name,
for example the landowners’ surname. The only difficulty with this action is
obtaining the name of the landowners, though this should be easily obtainable
through local knowledge and community collaboration.
A3 - Setting/adjusting antenna heights Antenna heights can be set and
adjusted once a site exists and usually takes place in conjunction with creating
a link (Action 4) otherwise the antenna heights may need adjusting. The action
of setting or adjusting the height of an antenna is not difficult but often relies
on the outcome of creating a link (Action 4).
A4 - Creating a link Creating a link requires at least two sites to exist and
can be a difficult action to perform, as it requires a complex understanding42

of line-of-sight and mathematics, as well as identification of constraints that
may affect line-of-sight. Local knowledge and community collaboration can
assist with identifying these constraints. Technical understanding of radio
wave propagation, radio hardware and antenna is required to determine line-
of-sight. However in some situations, where there are few constraints and
short distances involved, links can be created through trial and error fairly
easily using visual line-of-sight as a guide.
A5 - Computing coverage Computing coverage requires a site to exist
and is dependent on the antenna height being set. As with creating a link,
computing coverage requires complex technical understanding and identifica-
tion of constraints that may affect line-of-sight. Once again, local knowledge
and community collaboration can assist with identifying these constraints.
43
2.5 Chapter summary
This chapter has described the complexity and scale involved in the wireless
network planning problem and discussed the broadness of constraints that
need to be considered. The complexity and scale of planning a wireless net-
work means that it is important to have a strategy to follow and therefore this
chapter has presented five different strategies for planning wireless networks
and detailed the tasks required. The actions required to achieve these tasks
were identified and the relative context of those actions were described.
The following requirements for a planning tool were identified:
• a planning tool should solicit information about natural, human and
technical constraints (Requirement 1).
• a planning tool should support all of the network planning strategies
identified in Section 2.3 (Requirement 2).
• a planning tool should support all of the tasks and actions identified in
Section 2.4 (Requirement 3).
Now that wireless network planning has been described in more detail, it is
appropriate to discuss high-level methods of how to solve the wireless net-
work planning problem. The next chapter introduces two high-level methods
for planning a wireless network: algorithmic planning and computer-assisted
planning.
44

Chapter 3
Computer-assisted planning
This chapter establishes why computer-assisted planning is the best method
for planning a wireless network by contrasting computer-assisted planning with
algorithmic planning. Algorithmic planning is explained including a literature
review of how algorithmic planning is used to solve sub-elements of the wireless
network planning problem. However, algorithmic planning requires up-front
knowledge of all possible constraints and is therefore inappropriate for ad-
dressing the entire wireless network planning problem. The chapter describes
how computer-assisted planning allows constraints to be addressed as they are
identified by the user. A review of twelve existing computer-assisted planning
tools identifies the features supported by each of the tools with a primary focus
on how each tool incorporates local knowledge and how the user is supported
in planning a wireless network.
3.1 Algorithmic planning
Algorithmic planning uses algorithmic optimisation or approximation tech-
niques to find the best possible solution relative to one or more objectives with
a set of data subjected to a set of constraints. Usually the objective is to
minimise or maximise one (or more) data parameters such as time, distance
or cost.
45

Algorithmic planning is an active area of research in the field of telecom-
munication network planning. Algorithmic planning techniques that have
been applied to telecommunication network planning include meta-heuristics
[43, 57, 69, 88, 92, 120], linear programming [44, 93, 95–97] and geometric ap-
proaches [56,91,116].
Meta-heuristic optimisation is a computational method that iteratively
works to improve a solution or set of solutions using some function of quality
but is not guaranteed to find an optimal solution. Meta-heuristics are used for
a variety of combinatorial problems and include such techniques as simulated
annealing [43,92,120] and genetic algorithms [43,57,69,88,120]. Hill-climbing
performs well as a quick search for local optima but cannot identify global
optima [43].
Linear programming is a mathematical method applied when the solution
search space can be expressed as a set of linear constraints. The objective is to
find the minimum or maximum value of a linear function that may consist of
many parts, subject to a set of linear constraints. Linear programming theory
falls within convex optimization theory and is an important part of operations
research [71]. In cases where some, or all, variables are restricted to integers;
variants of the approach referred to as integer linear programming or mixed
integer programming [54] are used. It is also possible for equations to be non-
linear (nonlinear programming [119]). Linear programming is used extensively
in business and economics, but can be useful in areas such as transportation,
energy, telecommunications, and manufacturing.
Other algorithmic planning techniques used in literature for telecommuni-
cation network planning include the use of Gaussian Processes [91], Steiner
trees [56] and Voronoi tessellations/Delaunay triangulation [116].
46
3.1.1 An algorithmic planning example
A relatively simple diet problem, as described by Pedregal [107], is used to
illustrate the inputs necessary for an optimisation algorithm and how those
inputs can be represented in an algorithmic way. The required data can be
determined once the objective and constraints are known. This discussion
is based on the optimisation example that Pedregal presents on page 10 of
Introduction to Optimization [107]. Pedregal’s diet example is presented below
with discussion about how the problem can be expressed algorithmically.
• The objective is to minimise the total cost of the diet.
• The single constraint is to meet the minimum daily requirement for each
nutrient
• The data includes:
– food types and their respective prices
– daily minimum requirements of each nutrient
– nutrient content for each food
The objective, constraints and data need to be expressed so that they are
appropriate for algorithm input. Note that, for this discussion, arrays are con-
sidered to be equivalent to matrices.
Consider the set of food types and their respective prices. This could be
expressed as two arrays where each index, i, of the two arrays represents one
type of food. The first array, x, stores the amount of each food type purchased
and the second array, c, stores the price of each food type. For example, xi is
the amount of food type i purchased for unit cost of ci; an example is given in
Table 3.1.
Consider now the set of daily minimum requirements of each nutrient. This
could be expressed as a single array, b, where each index, j, represents a re-
quired nutrient. For example, bj represents the daily minimum requirement of47

nutrient j.
Finally, consider the nutrient content that each food contains. As there
are multiple foods and each food has multiple nutrients, this will need to ex-
pressed as a two-dimensional array, a. Index i represents a particular food and
index j represents a particular nutrient content. For example, aij represents
the content of nutrient j in food i.
The objective and associated constraints can now be defined in algebraic
terms. Knowing that the total cost of food purchased needs to be minimised,
the objective can be expressed as:
Minimise∑
i
cixi
Also, knowing that the daily minimum requirement for each nutrient must
be met, the constraint can be expressed as:
∑i
aijxi ≥ bj for all j
Note that there is a second constraint that was not immediately apparent
before. The second constraint needs to enforce that all quantities of food must
be positive and is expressed as:
xi ≥ 0 for all i
The diet optimisation problem has been expressed in algebraic terms by
Pedregal [107] and is suitable for algorithmic input. However stepping through
this optimisation problem has shown that detailed knowledge and a complete
corpus of information is required to fulfill the data requirements. It is critical
that the data is as accurate as possible and it is difficult to represent vague
criteria in an algebraic form.. The data requirements of this relatively simple
problem highlight the issue of data volume requirements and that it would be
difficult to represent every constraint in an algorithmic way.48

Chocolate Steak Beans Carrots BaconArray x ? g ? g ? g ? g ? gArray y $1.00/100g $3.50/100g $0.30/100g $0.50/100g $1.75/100g
Table 3.1: Example of food types and prices
Nutrient Required AmountMagnesium 400 mg
Zinc 15 mgPotassium 3500 mgCalcium 1000 mgIron 18 mg
Table 3.2: Example of daily minimum requirements
Food type (100 g)Chocolate Steak Beans Carrots Bacon
Nutrient level
Magnesium 146 mg 28 mg 18 mg 10 mg 30 mgZinc 2.01 mg 5.55 mg 0.25 mg 0.17 mg 3.36 mg
Potassium 559 mg 406 mg 146 mg 237 mg 539 mgCalcium 56 mg 12 mg 44 mg 32 mg 10 mgIron 8.02 mg 3.42 mg 0.65 mg 0.89 mg 1.49 mg
Table 3.3: Example of nutrient content per food type
49
3.1.2 Algorithmic planning literature
Algorithmic planning has been used to address many sub-elements of the wire-
less network planning problem such as base station placement for cellular net-
works, coverage maximisation and sensor placement. There are two key themes
that have been identified in the literature: energy efficiency and coverage.
3.1.2.1 Energy efficiency
The first theme observed in the literature is energy efficiency. The primary
intention is to maximise the energy efficiency, often referred to as the lifetime,
of a network while meeting other objectives. A common objective in wireless
sensor networks is to maximise the lifetime of the network while also maximis-
ing the sensing coverage of the network. Genetic algorithms [69, 88], Gaus-
sian Processes [91], simulated annealing [92] and nonlinear programming [67]
approaches have been utilised to explore energy efficiency solutions. These
approaches all assume that a set of candidate locations is available.
Another common objective is to ensure that coverage or connectivity con-
straints have been met. Semidefinite programming [62] and integer program-
ming with a Lagrangian relaxation technique [124] approaches are used to max-
imise energy efficiency but ensure that the connectivity constraint is met in
wireless local area networks. A genetic algorithm was used by Chiara et al. [57]
to maximise energy efficiency while ensuring coverage in mobile networks.
3.1.2.2 Coverage
The second theme observed in literature is coverage. The primary intention
is to maximise or meet coverage constraints of a network while meeting other
objectives. The most common objective identified in the literature was max-
imising/meeting coverage while minimising the number of the stations/relays
or minimising the network cost. Effectively minimising the number of sta-
tions/relays is minimising the cost of the network, so these are categorised
as the same objective. Gondran et al. [76] present a model that thoroughly50
defines all major parameters met in wireless network access point planning
problems along with a didactical explanation of an indoor wireless network.
The objective is to minimise the total cost of the network subject to the con-
straints of ensuring all demand points are covered to an agreed signal level and
that the number of base stations does not exceed a given threshold. Maximis-
ing coverage while minimising cost is common theme for literature concerning
cellular networks and literature shows that variations of linear programming
is the typical approach used [44,93,96,97].
Other objectives involve maximising coverage while meeting other con-
straints. Mateus et al. [95] use integer programming to to maximise coverage of
an indoor local area network subject to a set of constraints concerning channel
allocations and areas of priority. As with energy efficiency, these approaches
all assume that a set of candidate locations is available.
3.1.3 Algorithmic planning summary
This discussion of algorithmic planning has described algorithmic planning and
provided a typical example. A review of relevant literature established that
algorithmic planning can solve sub-elements of the wireless network planning
problem, particularly energy efficiency and coverage related problems. How-
ever, all of the literature reviewed assumed that a set of candidate locations
was available and algorithmic planning suffers from the fact that the entirety
of all the constraints need to be known up front and represented in an al-
gorithmic way. Chapter 2 illustrated why having all of these constraints up
front is so difficult. This indicates that the best approach may be computer-
assisted planning where algorithmic planning can be used for specific problem
sub-elements.
Requirement 4: a planning tool should support the option of using algorithmic
planning for specific problem sub-elements.51

3.2 Computer-assisted planning
A computer-assisted planning (CAP) tool assists the user in planning a wireless
network by providing functionality and analysis conducive to wireless network
planning. Functionality and analysis typical of a CAP tool includes the ability
to create and name sites, set and adjust antenna heights, and conduct both
point-to-point and point-to-multipoint analysis.
As pointed out in Chapter 2, the search space for wireless network planning
is large, and with the inclusion of terrain, vegetation, access and placement
information, the search space becomes difficult to deal with. The advantage
of computer-assisted planning is that the problem can be approached by be-
ginning with the basics. The user can then incrementally add information as
necessary and this is much more suitable for community network planning.
The rural community may know that they want fast Internet access how-
ever all other inputs are vague to begin with. This makes the problem much
more like a shopping exercise rather than an engineering exercise. The rural
community may be willing to adjust certain features of the network and make
trade offs to achieve different goals. For example, the community may accept a
network plan with a maximum speed of 11 Mbps for half the price of a network
plan with a maximum speed of 54 Mbps. On the other hand, the community
may wish to spend a bit more by placing two relay sites to avoid placing a site
at a location of cultural importance.
52

3.2.1 Evaluation of existing CAP tools
There are many commercial and freely-available CAP software solutions that
are comprehensive and can produce viable network designs; however these
tools are only suitable for the wireless network planning professional because
the interfaces are designed for expert users. These interfaces expect the user
to understand many of the complexities of wireless network planning and op-
eration, and typically require detailed training in order to use the software.
It is difficult to fully evaluate CAP tools as trial versions of the commer-
cial software are not readily available. Advertising material has been used to
determine the capability of each piece of software and how they compare.
The following discussion explores how each of these tools assists in wire-
less network planning to determine how appropriate each tool is for the rural
wireless network planning problem. The results of this comparison can help
to identify what is required for a CAP tool that can be used by non-experts
from a rural community.
Twelve existing tools were evaluated. Tools will be referenced by name and
allocated letter in the following discussion. This is not an exhaustive list of
tools but these twelve were found to be prominent tools for wireless network
planning. Four research prototypes were considered for evaluation. Two pro-
totypes, B-Hive [108] and ICEPT [121], are tools for planning urban cellular
networks with a focus on optimal base station placement to provide coverage
to areas with demand for mobile communication services.
The other two prototypes were indoor wireless network design tools. McGib-
ney et. al [75] designed a tool for optimal placement of access points for indoor
wireless communication systems and Guinard et. al [77] designed a tool for
deploying building management systems relying on wireless sensors and actu-
ators. All four of these prototypes are designed to provide wireless coverage to53

an area using algorithmic planning and then present coverage visualisations.
The four prototypes are not present in the following discussion because at the
time of investigation, the prototypes were limited in terms of a user interface
and the only features that the prototypes supported were coverage analysis
and height optimisation. Essentially, the prototypes were at an early stage of
development and at that point were not in a position to contribute to the tool
evaluation.
A Aircom International Connect [1] is a commercial CAP tool, screen
shots indicate that it is for Windows.
B Mentum Planet [9] is a commercial CAP tool for Windows.
C ComSiteDesign [2] is a commercial CAP tool for Windows.
D The command-line Digital Line-of-Sight CAP tool for DOS 2.0 that
is detailed in a report released by the US Department of Commerce
in 1989 [68]. Though designed for “persons having no experience
in programming”, the program was intended for use by wireless
system engineers. The Digital Line-of-Sight tool will be referred to
as the DLOS tool in the following discussion.
E EDX SignalPro [4] is a commercial CAP tool, screen shots indicate
that it is for Windows.
F Forsk Atoll [6] is a commercial CAP tool for Windows.
G Google Earth [8] is a virtual globe program for Windows, Linux
and Mac that allows the user to explore the earth in a 3D environ-
ment. Though not actually a CAP tool, Google Earth is popular
for wireless network planning as it is freely available and has useful
features including: terrain elevation, satellite imagery, 3D visu-
alisation, distance measuring tools, image overlay and elevation
profile between two points.
H Overture Online [14] is a commercial CAP tool for Windows.54
I Radio Mobile [18] is a Freeware CAP tool for Windows.
J Pathloss [15] is a commercial CAP tool for Windows.
K SPLAT! [20] is an Open Source CAP tool for Linux/Unix.
L WiTech [25] is a commercial Web-based CAP tool.
The twelve tools were compared based on their technical capabilities and sup-
port for local knowledge, geographic assistance, analysis features and user ac-
tion support.. The author found these criteria most relevant for evaluating the
planning tools based on earlier findings in Chapter 2. A planning tool should
incorporate local knowledge and support the user throughout the planning
process. It is important that technical criteria are met and that the planning
tool supports features that allow the user to carry out the tasks and actions
introduced in Chapter 2
The relative importance of some of the criteria such as optimisation sup-
port and data layers is not as important because these criteria enhance the
planning capability but are not fundamental for the planning process. Other
evaluation criteria exists could have been used for tool evaluation including:
tool cost, source code license, hardware requirements and current users of the
tool. However, the aim of this evaluation was to identify the capabilities of
CAP tools. Other criteria would not assist in this aim and would possibly
restrict the tools that were evaluated.
The frequencies supported by these tools are extensive. Radio Mobile (I)
and SPLAT! (K) both support frequencies between 20 MHz and 20 GHz, due
to their use of the Longley-Rice propagation model (discussed in Section B.5).
EDX SignalPro (E) supports 30 MHz to 60 GHz while Pathloss (J) supports
30 MHz to 100 GHz. ComSiteDesign (C) supports 40 MHz to 40 GHz and
Aircom International Connect (A) supports 300 MHz to 30 GHz.
55
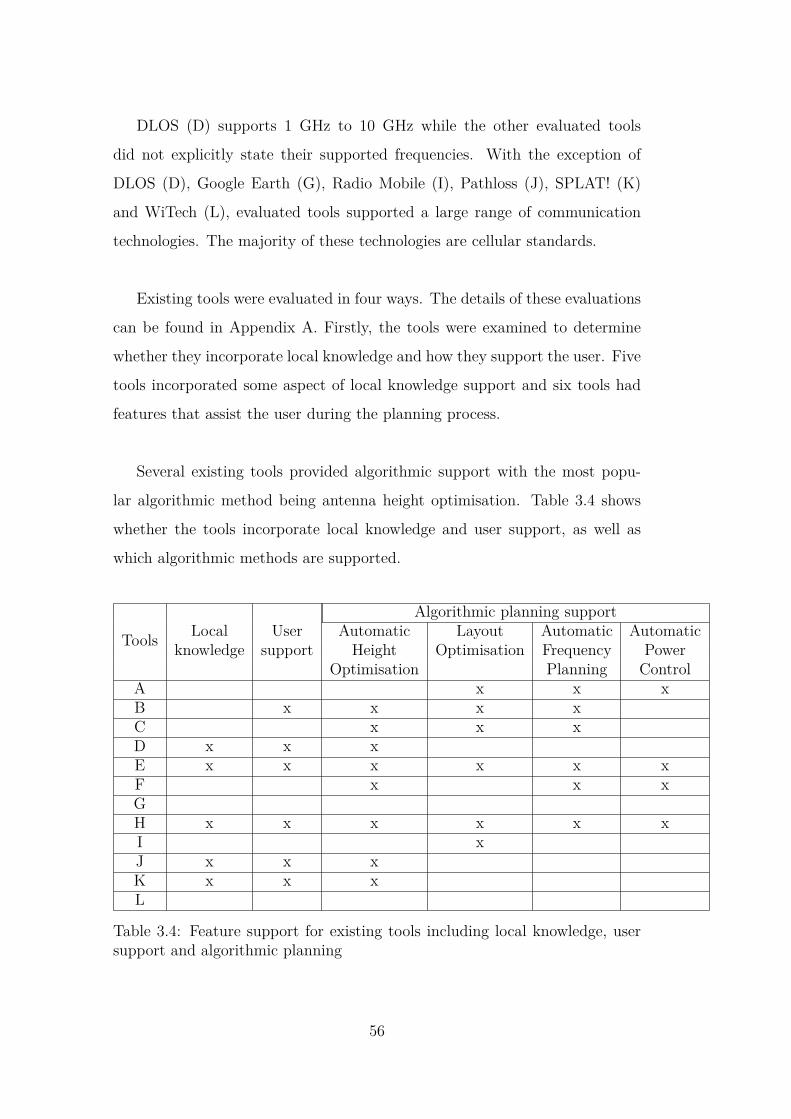
DLOS (D) supports 1 GHz to 10 GHz while the other evaluated tools
did not explicitly state their supported frequencies. With the exception of
DLOS (D), Google Earth (G), Radio Mobile (I), Pathloss (J), SPLAT! (K)
and WiTech (L), evaluated tools supported a large range of communication
technologies. The majority of these technologies are cellular standards.
Existing tools were evaluated in four ways. The details of these evaluations
can be found in Appendix A. Firstly, the tools were examined to determine
whether they incorporate local knowledge and how they support the user. Five
tools incorporated some aspect of local knowledge support and six tools had
features that assist the user during the planning process.
Several existing tools provided algorithmic support with the most popu-
lar algorithmic method being antenna height optimisation. Table 3.4 shows
whether the tools incorporate local knowledge and user support, as well as
which algorithmic methods are supported.
Tools
Algorithmic planning supportLocal User Automatic Layout Automatic Automatic
knowledge support Height Optimisation Frequency PowerOptimisation Planning Control
A x x xB x x x xC x x xD x x xE x x x x x xF x x xGH x x x x x xI xJ x x xK x x xL
Table 3.4: Feature support for existing tools including local knowledge, usersupport and algorithmic planning
56

Table 3.5 shows the results of evaluating the tools based on geographic
assistance features. Google Earth (G) is the most featured tool in terms of
geographic support. The entire earth is mapped using satellite imagery and
aerial photography over 3D terrain and provides a wealth of geographic data
layers such as transport, towns/cities and country/state borders.
Layers such as 3D buildings and key geographic features are also available
for particular areas in the world, particularly the United States. Overture On-
line (H) is similarly featured but restricted to 2D maps with 3D visualisations.
ToolsGeographic support
Database 3D GIS Map Map Pan andsupport visualisation integration scale orientation zoom
A x x xB x x x xC x x x x xDE x x x x xF x x x xG x x x x x xH x x x x x xI x xJ x x x xK xL
Table 3.5: Supported geographic features for existing CAP tools
57
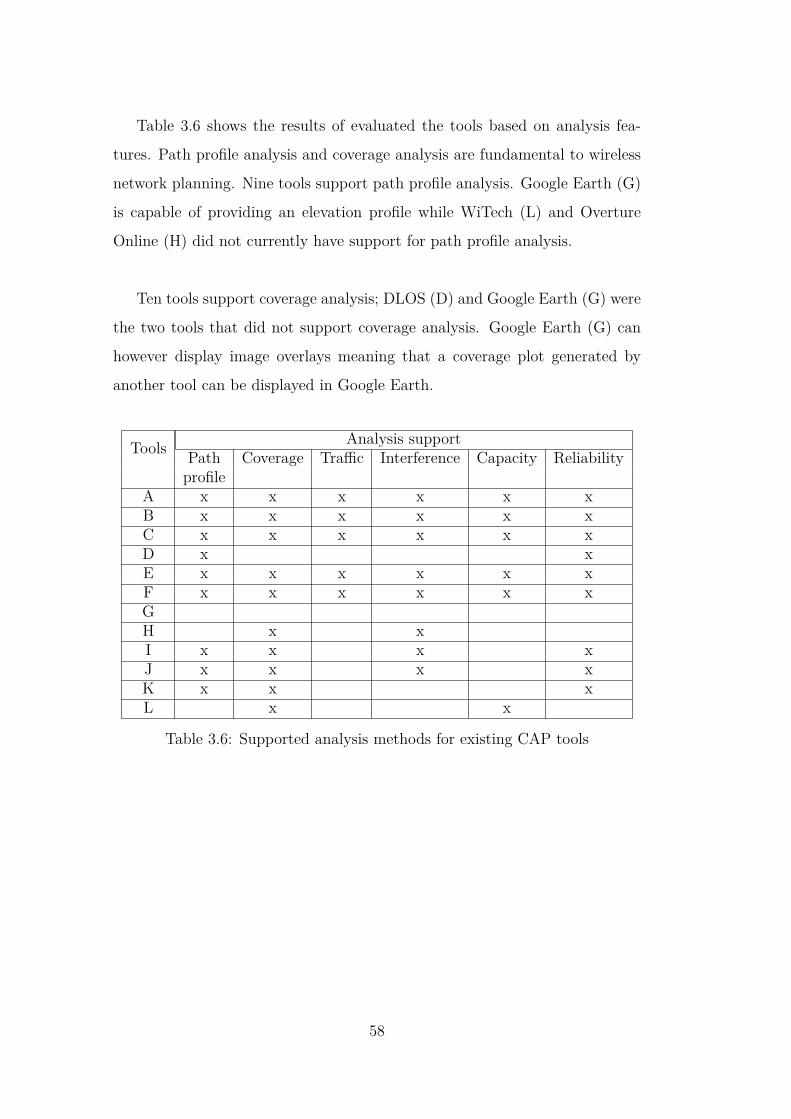
Table 3.6 shows the results of evaluated the tools based on analysis fea-
tures. Path profile analysis and coverage analysis are fundamental to wireless
network planning. Nine tools support path profile analysis. Google Earth (G)
is capable of providing an elevation profile while WiTech (L) and Overture
Online (H) did not currently have support for path profile analysis.
Ten tools support coverage analysis; DLOS (D) and Google Earth (G) were
the two tools that did not support coverage analysis. Google Earth (G) can
however display image overlays meaning that a coverage plot generated by
another tool can be displayed in Google Earth.
Tools Analysis supportPath Coverage Traffic Interference Capacity Reliabilityprofile
A x x x x x xB x x x x x xC x x x x x xD x xE x x x x x xF x x x x x xGH x xI x x x xJ x x x xK x x xL x x
Table 3.6: Supported analysis methods for existing CAP tools
58

Five actions were compared among six tools. These actions were the cre-
ation of a site, naming of a site, setting/adjusting antenna heights, conducting
a point-to-point analysis and conducting a point-to-multipoint analysis. The
six tools were DLOS (D), Google Earth (G), Overture Online (H), Pathloss (J),
Radio Mobile (I) and Splat! (K). These actions were then compared against
the criteria of being simple and straight-forward to carry out for non-experts
from rural communities.
Table 3.7 shows the support for each of these five actions by the six tools. A
detailed analysis of these actions is presented in Appendix A.4. This analysis
identified Overture Online (H) as the most appropriate tool but unfortunately
Overture Online does not implement the point-to-point analysis action which
is fundamental for wireless network planning in rural areas.
Tools Network planning actionsCreating Naming Selecting Point-to-point Point-to-multipointa site a site heights analysis analysis
D x x x xG x x xH x x x xI x x x x xJ x x x x xK x x x x x
Table 3.7: Wireless network planning action support
59
3.3 Chapter findings
Although algorithmic planning is an excellent approach for sub-elements of
the wireless network planning problem, it suffers from the fact that the en-
tirety of all the constraints need to be known up front and represented in an
algorithmic way indicating that computer-assisted planning is the better ap-
proach. A review of existing tools revealed that little support is present for
incorporating local knowledge required to address the number of constraints
in wireless network planning. Support for providing guidance while planning
a wireless network is also inadequate for non-experts from rural communities.
Evaluation found that Overture Online was the most appropriate tool for ac-
tion support but did not implement point-to-point analysis. All of the tools
evaluated, except Google Earth (G), are designed for expert users. As such,
the terminology and types of available features are intimidating for the novice
user. Commercial tools require significant training in order to use the tools
effectively.
Radio Mobile (I) and SPLAT! (K) are designed for expert users. Radio
Mobile (I) is intended for amateur radio operators and is used to predict radio
system performance for an existing wireless network design. SPLAT! (K) is
more suited to wireless network planning but as a command-line tool it expects
all the technical parameters to be specified, hence is currently inappropriate
for novice users. Google Earth (G) lacks general network planning support
and therefore is also inappropriate.
Code reusability was considered when evaluating these tools. SPLAT! (K)
was the only tool that offered code reusability as the other tools were closed
source. SPLAT! (K) contained many useful functions for calculating link pro-
files and determining line-of-sight. Unfortunately at the time of investigation,
the code for SPLAT! (K) was not well documented and difficult to follow.
60

Given that none of the evaluated tools were appropriate for use by non-
experts from rural communities, it is possible to identify a list of features that
an appropriate wireless network planning tool should support. The remainder
of this thesis examines the identified list of features in more detail and dis-
cusses the development of a prototype wireless network planning tool suitable
for use by non-experts from rural communities.
A wireless network planning tool should incorporate local knowledge and,
where required, solicit that local knowledge. For example, when placing a site,
the tool should solicit local knowledge appropriate to access and placement.
A wireless network tool should support the user as much as possible, guiding
them through decisions and helping the user with the process.
There are many optimisation methods that are potentially useful for wire-
less network planning as they assist in improving the wireless network plan.
Regarding wireless network planning for rural areas, the most useful optimi-
sation methods would be antenna height optimisation, automatic frequency
planning and automatic power control.
There are several computer assistance features that can be part of a wireless
network planning tool. Geographic features include multiple map types such
as shaded terrain and aerial photos, GIS data such as a terrain database for
extracting elevations and navigation aides such as scale, and orientation and
the ability to pan and zoom. Analysis features include path profile and cov-
erage analysis which are integral analysis tools in wireless network planning.
Other forms of analysis that are useful include traffic loading, interference,
capacity and reliability. Though useful forms of analysis, the latter four are
not necessary for wireless network planning in low-density rural areas.
61

Tools should support all of the five actions for wireless network planning
(creation of a site, naming of a site, setting/adjusting antenna heights, con-
ducting a point-to-point analysis and conducting a point-to-multipoint analy-
sis) and their implementation should be simple and straight-forward.
3.4 Chapter summary
The chapter has discussed algorithmic planning and presented a review of algo-
rithmic planning literature. This review found that algorithmic planning was
not suitable for the wireless network planning problem due to the broadness
of constraints but worked well for sub-elements of the problem. The chapter
then discussed computer-assisted planning and presented a review of relevant
literature. The literature review revealed a list of features that a wireless net-
work planning tool should support.
The key conclusion of this chapter is that:
• a new planning tool is required to address the problem state-
ment of this thesis.
A requirement established in this chapter was that:
• a planning tool should support the option of using algorithmic planning
for specific problem sub-elements (Requirement 4).
The next two chapters address the issues of the information required for wire-
less network planning and discusses potential computer assistance methods for
use in a wireless network planning tool.
62
Chapter 4
Gathering information for
planning a wireless network
This chapter investigates the findings of Chapter 3 further by describing the
information necessary for planning a wireless network and how that informa-
tion can be solicited from maps and local knowledge in the community. The
chapter begins by presenting a methodology for identifying information that
needs to be gathered. The chapter then presents an overview of the general
local knowledge required and discusses the types of people in the community
that may be able to contribute local knowledge. Finally, the chapter gives
a detailed explanation of factors in the natural environment and the human
environment that affect wireless network planning and how those factors can
be identified using maps and local knowledge.
4.1 Methodology for information identification
In general, technologists have difficulty in envisioning the problems faced, un-
less they have visited the place, have been exposed to the conditions, and
interacted with the people. Obtaining this local knowledge from the commu-
nity can supersede information gathered from other sources, such as maps.
The following section defines a methodology for identifying and gathering this
information by considering the following questions:63

4.1.1 Who was the first point of contact?
The CRCnet group was the first point of contact. Correspondence with the
wireless network planning expert and associates took place. The author then
met key members of rural communities that were involved in the deployment
and maintenance of their respective rural wireless network.
4.1.2 What were the processes employed to gather the
information?
Firstly the required information needed to be identified. This was done by:
• visiting rural wireless network installations to:
– observe the physical surroundings to identify natural factors.
– conduct informal conversations with community members to help
identify human factors.
• consulting with the CRCnet group about previous experiences and prob-
lems.
• consulting relevant literature such as ITU radio propagation standards.
The information could then be gathered by:
• contacting companies such as local councils for useful data such as:
– topographical maps, aerial photography and terrain data.
– weather statistics.
– locations of significant cultural sites.
• conducting further informal conversations with rural community mem-
bers.
Throughout the process, cultural laws need to be noted so as not to antago-
nize and alienate the community – which would be detrimental to a project.64

Although the author was familiar with Maori customs, two Maori experts were
consulted and relevant literature examined. The CRCnet group had practical
experience with Maori customs and so these experiences were also drawn upon.
4.2 Local knowledge
Communities are a rich source of local knowledge that can contribute valuable
information for planning a wireless network. Local knowledge can be used to
bring existing information up to date or to identify information that was not
previously known. Knowledge of where trees may have been planted or exist-
ing trees removed can have a significant effect on where sites might be placed.
Consulting with the local community can also encourage commitment of the
future use of an area. A land owner may be willing to remove trees so that a
link could pass through that area, or decide to plant trees else where so that
the link can be established.
Consulting with the community to obtain information also supports the
soft nature of the constraints, allowing features to be added, removed or mod-
ified where necessary. The budget for a network can change as people express
interest in obtaining an Internet connection. Consulting with the community
assists with determining who wants a connection to the network and therefore
identifying the physical houses to be connected. People can share knowledge
of high buildings with mains power in the area and who owns them. Members
of the community including farmers, hunters, hikers and cultural experts can
share information about the surrounding terrain and vegetation.
Local knowledge is best obtained by either by talking directly to members
of the rural community, or prompting the rural community members for lo-
cal knowledge using an intermediate component such as a computer program
or questionnaire. Obtaining local knowledge can result in issues such as in-
complete and inconsistent/conflicting information. Where these issues arise,65

it would be best to assume that the ’worst case’ version of the information is
correct, as this is more likely to result in a feasible network plan. One of the
local community members should be responsible for making this call. A sim-
ple example would be where two community members disagree over whether a
particular location is a burial ground or not. On the side of caution, the ’worst
case’ would be that the location is a burial ground. Where the resolution is
not clear, the location or area for which the information is in question should
be removed from current consideration until other possibilities have been dis-
cussed.
The task of detecting the ’worst case’ version of information is currently
carried out by the rural community members. The difficulty of detecting this
’worse case’ is that most information will be a textual or verbal representa-
tion of local knowledge from community members. Detecting the ’worst case’
would require the important elements of that information to be identified and
contrasted with identified elements obtained from other community members.
An expert system or similar could be used to record information from each
community member. The system could ask specific categorised questions that
have a fixed set of answers that could then be analysed by the system to de-
termine the ’worst case’.
Information obtained during the planning process should not be discarded.
It should be stored for future reference, particularly in case the wireless expert
has questions during the network design verification stage. Information that is
conflicting or incomplete should be noted and ideally resolved at a later time,
again this may be during the network design verification stage.
Long term volatility can be regarded as positive or negative for the wireless
network being planned. It is important for community members to try and
consider all possibilities, and the likelihood of those possibilities occurring. For
example, it is unlikely that a house would be removed and probably doesn’t66

need to be considered as volatile, whereas trees are very likely to continue to
grow and potentially cause problems in the future. Land use change over time
could potentially create problems and possibly solve problems. For example,
moving land usage from planted forest to dairying could solve radio propaga-
tion issues, whereas moving land usage dairying to planted forest could create
radio propagation issues. This is another opportunity where an expert system
or similar could ask about these long term volatility issues. In most cases
where the network already existed, these changes would occur around the net-
work in use.
Realistic costing of wireless deployments is an issue as costs change over
time. The distributing ISP should provide current prices that have an expiry
date. Users should clearly be informed when these prices have expired and
should be given the opportunity to request updated prices. The overall cost of
a network plan would not be guaranteed until reviewed by a wireless planning
expert.
Requirement 5: a planning tool should allow local knowledge information to
be entered and stored for future reference.
The following sections further identify these important aspects of informa-
tion within the natural and human environments, illustrating how they affect
wireless network planning and how local knowledge assists in this identifica-
tion.
4.3 The natural environment
There are many natural features in the network environment that need to con-
sidered when planning a wireless network. Three types of maps were identified
as being useful for assisting with identification of natural features: topograph-
ical maps, aerial photography and terrain maps. There may however be other
types of maps that were not considered that could also be useful for assisting67
with identification of natural features. Terrain maps often use hill shading and
a hypsometric colour scheme to produce a 3D-like visualisation of the terrain.
Terrain maps typically show hydrological features such as coastlines, lakes,
rivers and streams.
Terrain is the most obvious natural feature of which there are many forms.
Hills, mountains, valleys and plains all have a different effect on wireless net-
work planning. Slope, structure and composition of the terrain can be impor-
tant in various situations. For example, hills and mountains can obstruct radio
wave propagation, but a wireless site placed near the summit will potentially
have significant coverage. Local knowledge of high spots overlooking large ar-
eas of land is useful when planning a wireless network.
It is often difficult to gauge terrain using an aerial photograph however a to-
pographic map shows features such as contours, spot heights, depressions and
cliffs. Often topographic maps are cluttered and can be difficult to interpret
by inexperienced map users. Terrain maps aim to make terrain identification
easier by presenting a 3D-like visualisation of the terrain.
Hydrological features such as rivers, streams, lakes, swamps, wetlands and
the coast also need to be considered. Water is a barrier for placement and
accessibility in most cases. A site will not be placed over water unless the site
is designed for aquatic use or there is a stable platform above the surface of the
water. Knowledge of where bridges and other types of crossings are located is
necessary as crossing rivers and streams may be required to access sites. Water
can also cause undesired reflection of the wireless signals at particular antenna
angles. Terrain map typically show coastlines, rivers, streams and lakes. These
features can also be identified in aerial photographs and topographic maps, as
well as features such as swamps.
Vegetation such as single trees, bushes or entire forests have a significant68

effect on radio wave propagation. Placement of sites is limited somewhat by
trees and in scrubby areas it may be necessary to trim or remove vegetation
to place a site. Vegetation causes significant attenuation of radio waves as
well as scattering the waves in all directions. Though these effects can be
modeled, vegetation can be avoided by either transmitting around the area
of vegetation or having the sites high enough to transmit over it, such as on
hilltops or high buildings. Aerial maps are useful for locating vegetation but
identifying the type of vegetation may be difficult due to the birds eye point
of view. Topographic maps split vegetation in to categories including native
forest, exotic forest, scrub, shelter-belts and mangroves. However, once again
local knowledge is important as maps easily get out of date. New vegetation
may have been planted, existing vegetation grown higher or even have been
removed.
Protection of sites from animals, particularly on farms, is important to
prevent possible damage to equipment. Cattle, possums and goats can chew
wires and cause havoc with site equipment. It is best to have the site fenced off
and/or high enough above the ground to deter most animals. Local knowledge
can be used to determine the risk of damage from animals, and possibly the
proximity to vegetation.
Local knowledge supersedes maps as local knowledge is generally current
and considers features that are too small or outside the scope of features printed
on maps. For example, features such as gorges, sink holes and small stands of
trees may not be represented on a map or identifiable on an aerial photograph.
Requirement 6: a planning tool should support the use of maps for assisting
with natural feature identification and local knowledge solicitation.
69
4.3.1 Climate
The climate should also be considered for the network environment. In most
cases, climate precautions are common sense, though particular areas may re-
quire further consideration. The National Institute of Water and Atmospheric
Research (NIWA) provides climate station data for its 30 climate stations
throughout New Zealand including wind, rain and solar exposure data [13].
Climate consideration can help decide on alternative sources of power, such
as solar or wind power, when mains power is unavailable. Local knowledge
and/or appropriate data for that area should be consulted when considering
the use of alternative power sources.
In New Zealand, south and east-facing slopes have limited solar exposure.
Vegetation can also block solar energy. All maps will be of some use when
considering slopes and shading from hills. Potential shading from vegetation
can be identified using aerial photographs and topographic maps. Minimum
sunshine hour data can give a near-worst case scenario of how much solar en-
ergy can be expected at that location.
Wind direction, speed and frequency is important when considering wind
as a power generation source and may influence the building design of a site.
Indicators that the site experiences high winds include stunted tree/shrub
growth and wind shaping of vegetation. Wind can also affect sites on the net-
work. Loosely-secured antennas could potentially be blown out of alignment
by strong winds hence breaking the network connection and possibly wires as
well. Significantly strong wind could dislodge a poorly secured site or blow
other objects into it.
It is important to have some knowledge about the amount, direction and
intensity of rainfall that a site will experience. High winds may drive rain
horizontally or even vertically, hence equipment in areas subject to both high70

wind and intensive rainfall should be sealed to a high standard. Frequencies
below 10 GHz are rarely affected by rain, however very heavy rainfall can cause
some signal loss and link planning should take this in to account.
Lightning is a big risk to wireless sites as a lightning strike has the po-
tential to severely damage site equipment. Wireless sites should use lightning
rods and be properly grounded where there is any risk of potential strikes.
Equipment should also be rated to withstand extreme temperatures common
in that environment.
Requirement 7: a planning tool should support the use of climate data for
assisting in site placement.
4.4 The human environment
Transportation infrastructure, such as road and rail, provide accessibility to
site locations though can prevent site placement. For example, placing a site
on a road or railway would be difficult, though not impossible. Permission from
the appropriate authority would be required, as well as requiring a safe method
of installation. The site would need to be durable to handle the possibility of
being driven over. High traffic volume can have an effect on line-of-sight and
cause additional signal loss due to reflection and diffraction of the signal by the
passing traffic. Wireless links that cross road and/or rail with high volumes
of traffic should do so at a height such that the majority of the signal clears
the traffic to avoid additional signal loss. Topographic maps identify trans-
portation features including roads, tracks, tunnels, bridges, fords and railways;
transportation features can also be identified using aerial photographs.
Utilities such as fences and power structures such as poles and pylons can
affect line-of-sight but can also be useful as a height advantage for site place-
ment. Obtaining permission to place a site on such utilities may require more
effort and money than building a stand-alone site. Underground utilities can71

make it difficult to place a site as digging will be restricted. Topographic
maps identify major utilities such as fences, pipelines, power-lines, telephone
lines and gas lines, while fences and overhead lines can be identified on aerial
photographs. Local knowledge is necessary as minor utilities such as private
pipelines and power-lines may not be shown on topographic maps.
Buildings such as houses, barns and cowsheds can also significantly affect
line-of-sight. Buildings can however be used to the planner’s advantage as
buildings commonly have mains power and are of significant height. Topo-
graphic maps identify most buildings including residential areas, large build-
ings, isolated buildings, homesteads, churches, airfield/meteorological masts,
towers and wind turbines. Most buildings can also be identified from aerial
photographs. However, local knowledge is required to identify who the build-
ing belongs to and to obtain details of its construction. Identifying the owner
is important as the owner’s permission will be required and they may want
compensation in the form of rent. Building construction information helps
determine the ease of installing the site and how difficult wiring may be.
Wireless network sites can be a target for thieves as sites contain expensive
equipment and substantial amounts of metal. Equipment should be encased in
secure enclosures and security screws should be used. Sites should be fenced
off for protection from vandals in areas where vandalism could be a problem.
Risk to a site can be determined by considering the proximity of the site to
roads shown on topographic maps and aerial photographs, accompanied with
local knowledge.
Particular areas can be designated as forbidden zones for the wireless net-
work. Often these areas are culturally sensitive sites such as historic battle
grounds and cemeteries. In New Zealand, the Maori people regard prominent
mountain summits as sacred and hence these sacred mountains should be re-
spected. Some of these areas are present on topographic maps though many72
require identification by local experts. These areas typically forbid the place-
ment of sites but transmission of radio waves is generally not a problem. In
cases where transmission of radio waves through the area is a problem, this is
usually due to potential legal or health issues.
Observatories and high-security facilities often have a radio-silence buffer
zone requiring that there be no radio wave transmission in that area. Inter-
ference needs to be avoided when licensed frequencies are operating in the
area. There is conflicting literature about the health effects of radio waves
and some people refuse to have radio waves on their land or near their home.
Legal requirements should be obeyed and other forbidden zones should be
respected if not to keep the peace. Local knowledge plays an important role
here, as this information would not be present on a standard topographic map.
Safety is an important issue that should be taken seriously. Though safety
is more relevant during the building of network, it is useful to consider safety
implications when deciding on a site location. High structures should be fenced
off to avoid unauthorized people such as local children climbing and injuring
themselves. Workers should use appropriate climbing gear on high structures.
Care should be taken to ensure that there are no sharp edges on the structure
and equipment should be securely mounted. A site may be located near a cliff
or other hazardous terrain. Common sense and local knowledge can be used
to ensure safety.
Accessibility to sites must be strongly considered during the planning pro-
cess. Site structures may require timber, steel and concrete to build which are
heavy and difficult to transport. Once the network is up and running, sites
need to be quick to access in case of site failure. Batteries for solar sites are
large and heavy, while antennas can also be large and awkward to carry. Site
locations should be accessible by 4WD and where this is not possible, walking
distance should be minimised. A helicopter may be required to deliver heavy73
equipment for remote sites. Aerial photography, topographic maps and terrain
maps can all be used to determine accessibility to sites. Again, local knowledge
is important as it incorporates many details that maps do not, such as how
winter access compares to summer access.
Proximity to mains power should be strongly considered when site loca-
tions are chosen. Often this means that wireless sites will be constructed on
the roof of a building such as a house so wiring to mains power is simple. In
other cases where the wireless site is close enough, power can be trenched or a
cable run overhead from mains power nearby. In rural environments however,
sites will often be located far away from any source of mains power. In these
instances, sites require an alternative power source such as solar or wind, and
large batteries to store the charge. These types of sites incur more cost but
offer line-of-sight and coverage benefits due to their location. For example, a
solar site on a high mountain may reach four distant sites, whereas otherwise
extra sites would be required. Topographic maps and aerial photography can
help find sources of mains power by showing building locations. Local knowl-
edge is required to verify the availability of mains as a building shown on the
map may not have mains power.
Requirement 8: a planning tool should support the use of maps for assisting
with the identification of features in the human environment that may impact
on wireless network planning and soliciting associated local knowledge.
74
4.5 Chapter summary
This chapter has presented a methodology for identifying information to be
gathered and has given an overview of the general local knowledge required for
wireless network planning. The chapter described the implications of natural
features, the climate and factors in the human environment, in terms of their
effect on wireless network planning.
The following requirements for a planning tool were identified:
• a planning tool should allow local knowledge information to be entered
and stored for future reference (Requirement 5).
• a planning tool should support the use of maps for assisting with natural
feature identification and local knowledge solicitation (Requirement 6).
• a planning tool should support the use of climate data for assisting in
site placement (Requirement 7).
• a planning tool should support the use of maps for assisting with the
identification of features in the human environment that may impact on
wireless network planning and soliciting associated local knowledge (Re-
quirement 8).
75


Chapter 5
Link feasibility analysis
This chapter addresses the key issue of determining the feasibility of a link
in wireless network planning. The primary factor required to determine the
feasibility of any link, point-to-point or point-to-multipoint, is to estimate the
degree of loss that the link will experience. An important indication of this
loss is line-of-sight—if there is no line-of-sight, then most wireless technologies
will not be able to establish a functioning link.
Wireless line-of-sight is a technical constraint in wireless network planning
and is different than visual line-of-sight. As radio waves propagate, they also
spread out the further they travel. This phenomena is modeled using an ellip-
soidal volume of space known as the Fresnel zone (Figure 5.1). A link profile
plot is a visual method used to show both site endpoints, the curvature of the
earth, the terrain and the direct path. The innermost Fresnel zone is consid-
ered the most important for link feasibility analysis. The size of the Fresnel
zone is wavelength dependent because the wavelength determines the maxi-
mum radius/width of the ellipsoid.
The significance of the innermost Fresnel zone is that it defines the terrain
clearance required to achieve wireless line-of-sight. Any obstacles, such as
trees, buildings and mountains that obstruct the innermost Fresnel zone, will
have an impact on radio wave propagation. Minor obstruction of the innermost77

Figure 5.1: Example of a link profile plot showing the terrain, line-of-sight andthe innermost Fresnel zone.
Fresnel zone can be tolerated but is generally recommended by propagation
experts to be less than 40% of the Fresnel radius at the point of obstruction [45].
Radio wave propagation theory is covered in more detail in Appendix G.
Determining wireless line-of-sight is the first step to determining whether
a given link is feasible. The frequency of a link is a technical constraint where
there is a trade-off between the capacity of the link and the ability of the link to
deal with minor obstructions. Radio waves at lower frequencies travel further,
and are better at traveling through and around objects, however, radio waves
with higher frequencies can transport more data [70]. The distance of a link is
constrained by terrain and frequency. To determine the influence of technical
constraints such as link distance and frequency, it is necessary to use a radio
wave propagation model to predict the loss that the link will experience.
78
5.1 Chosen propagation models
The details of the propagation models considered for link feasibility analysis
are discussed in Appendix B. Each of the propagation models described in
Sections B.2, B.3, B.4 and B.5 were considered based on how that particular
model is applicable to rural wireless network planning. Rural New Zealand is
the focus of this thesis and so key characteristics of rural New Zealand have
been used to evaluate which propagation models are most suitable. The pri-
mary issue in rural New Zealand that affects radio wave propagation is terrain.
The terrain of rural New Zealand is considered irregular—irregular terrain can
be described as terrain that varies in elevation significantly over short dis-
tances. The radio wave propagation model findings in this section would be
relevant to other rural environments that also have irregular terrain.
Models such as the Free Space Path Loss model and the Friis model are
inappropriate for link prediction in areas of irregular terrain due to their re-
quirement of free-space—the space that the link exists in contains no particles
and no fields of force. Any predictions by a model requiring free space would
likely yield inaccurate results as free-space does not consider the affect of ter-
rain on radio wave propagation.
The plane-earth two-ray reflection model assumes short distance links and
ignores the curvature of the earth assuming relatively flat terrain. There are
links in a rural wireless network of length where the curvature of the earth
is important and the two-ray model does not consider the curvature of the
earth. The two-ray model assumes that the terrain is flat and smooth, which
is not true for terrain in rural New Zealand. Link predictions in rural New
Zealand using the two-ray model are likely to be inaccurate because of this
terrain assumption.
79
Vegetation models are useful when there is vegetation data to analyse.
WiPlan does not currently support vegetation data though this is a desired
feature for future work. The ability to predict loss due to vegetation would
increase the confidence in whether a given link was feasible. In this future
work, WiPlan would most likely implement the ITU vegetation model due to
the models ability to predict loss in different vegetation situations.
Urban models ignore the terrain between the transmitter and receiver as
the model assumes that the transmitter would normally be located on hills.
Additionally, the Hata model is restricted to links of less than 20 kilometres
in length. As a result, propagation prediction would be inaccurate and many
links would be considered line-of-sight when in fact they are obstructed by
terrain. Predictions of links greater than 20 kilometres in length using the
Hata model would also be inaccurate.
The Egli model assumes gently rolling terrain with average hill heights of
approximately 15 metres and is valid for frequencies between 40 MHz and 1
GHz. The lowest commonly used frequency for wireless network technology is
2.4 GHz which is well outside of this range. Some areas of New Zealand have
gently rolling terrain that fit this model but the frequency limitation would
lead to inaccurate predictions.
80
This leaves the irregular terrain model and the ITU terrain model for con-
sideration. Both models support a large range of frequencies from 20 MHz to
20 GHz as well as a wide variety of distances and antenna heights. However,
the irregular terrain model does not produce valid predictions for paths under
one kilometre in length and the ITU terrain model only considers the highest
point in the terrain. Links from a relay to houses can be less than 1 km and
so it was decided to incorporate both models. The irregular terrain model is
used for links exceeding one kilometre in length and for shorter links the ITU
terrain model is used. Other models were not applicable for paths under one
kilometre because the other models do not consider the affects of terrain ob-
structing a link. It is now possible to create tools for determining connectivity
and line-of-sight using the irregular terrain model and the ITU terrain model.
5.2 The link profile and area profile tools
The link profile tool is used to establish line-of-sight connectivity when the
user creates a link by estimating the path loss and creating the data necessary
to obtain a link profile plot. The link profile tool was implemented using the
C programming language. The tool is designed to work with plane coordinate
projections, such that coordinates can be described in terms of distance north
or south and east or west from the projection’s point of origin. Distance north
or south is commonly referred to as the northing and distance east or west as
the easting. The projection used for implementing and testing the path profile
tool is the New Zealand Traverse Mercator (NZTM) projection [12]. Any other
projections, such as WGS84, should first be converted to a linear projection.
A 3-tuple description is required for the two sites at each end of the path being
profiled: easting, northing and height above terrain. A frequency and polarity
also need to be specified. A digital elevation model in the same projection as
the site coordinates is required that covers the necessary area.
81
The link profile tool is reliant on the Geospatial Data Abstraction Library
(GDAL) [7] for dealing with the digital elevation models. Digital elevation
models are represented as rasters and contain meta data for geo-referencing
purposes. Such meta data includes the origin and pixel size. The origin is the
geographic coordinate in the chosen projection for a corner pixel, typically the
top-left. The origin is in turn a coordinate based on the projection’s point of
origin. Pixel size reflects the resolution of the digital elevation model. As an
example, the 500 meter digital elevation model of New Zealand has an ori-
gin for the top-left pixel with an easting of 1488800 meters and a northing of
6239495 meters. The pixel size is stored for both axes in case they are differ-
ent, for this example both axes are 500 meters in size.
Elevation extraction must be done in terms of pixels and hence using the
above meta data, GDAL can determine a relationship between the projection
coordinate system and pixel coordinate system. The coordinates for the sites
involved can be translated to their pixel counterparts once the relationship is
known. Elevations along the path are then extracted by interpolating along
the path between the two sites.
Once elevation has been extracted for the entire path, one of two propaga-
tion models is used to predict line-of-sight and associated loss, depending on
the distance between the two sites. The Irregular Terrain Model [83] is the
preferred choice however it is limited by being invalid on distances less than
1km. In these cases, the ITU model [33] is used to predict propagation loss
based on most significant terrain obstruction, using only the point of obstruc-
tion and operating frequency.
The area profile tool is used to create a coverage plot and is based on the
link profile tool. The area profile tool creates a coverage plot by performing
link profile calculations between the selected location for computing coverage
and every point in the coverage area. A configuration file can be supplied in82
order to have more fine grained control over the coverage being calculated.
Configuration options include bounding box selection, antenna specification
and confidence settings; a full example configuration file is included in Ap-
pendix H. The focus of WiPlan so far has been on using point-to-point links
and as a result, there is currently no integration of the configuration file in the
user interface of WiPlan. Further integration of the configuration file within
WiPlan as part of future work would provide more flexibility for coverage pre-
diction including custom distance ranges and coverage segments.
Both of these tools are invoked by the external applications controller (de-
scribed in Section 7.1) in WiPlan. When the user is creating a link, the exter-
nal applications controller runs the link profile tool for every mouse movement
event that WiPlan receives. A lower resolution digital elevation model is used
in this case to ensure that the process finishes in near-real time. When the user
has finished creating the link, then the external applications controller runs
the link profile tool with a higher resolution digital elevation model which takes
a few seconds. The results of this is then shown in the link profile information
window. The area profile tool is invoked by the external applications controller
when the user creates a coverage plot. At this stage, the configuration for
the coverage is fixed, however it is intended that interface functionality for
coverage configuration would be added to WiPlan in the future.
83
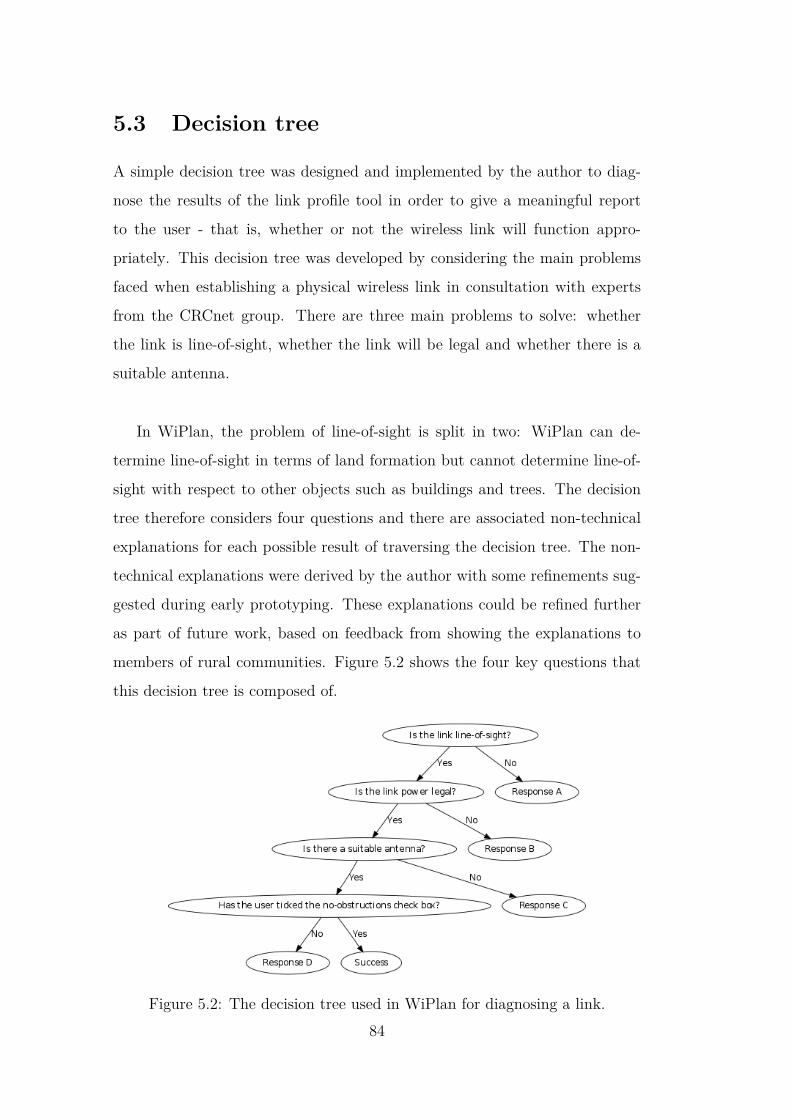
5.3 Decision tree
A simple decision tree was designed and implemented by the author to diag-
nose the results of the link profile tool in order to give a meaningful report
to the user - that is, whether or not the wireless link will function appro-
priately. This decision tree was developed by considering the main problems
faced when establishing a physical wireless link in consultation with experts
from the CRCnet group. There are three main problems to solve: whether
the link is line-of-sight, whether the link will be legal and whether there is a
suitable antenna.
In WiPlan, the problem of line-of-sight is split in two: WiPlan can de-
termine line-of-sight in terms of land formation but cannot determine line-of-
sight with respect to other objects such as buildings and trees. The decision
tree therefore considers four questions and there are associated non-technical
explanations for each possible result of traversing the decision tree. The non-
technical explanations were derived by the author with some refinements sug-
gested during early prototyping. These explanations could be refined further
as part of future work, based on feedback from showing the explanations to
members of rural communities. Figure 5.2 shows the four key questions that
this decision tree is composed of.
Figure 5.2: The decision tree used in WiPlan for diagnosing a link.84
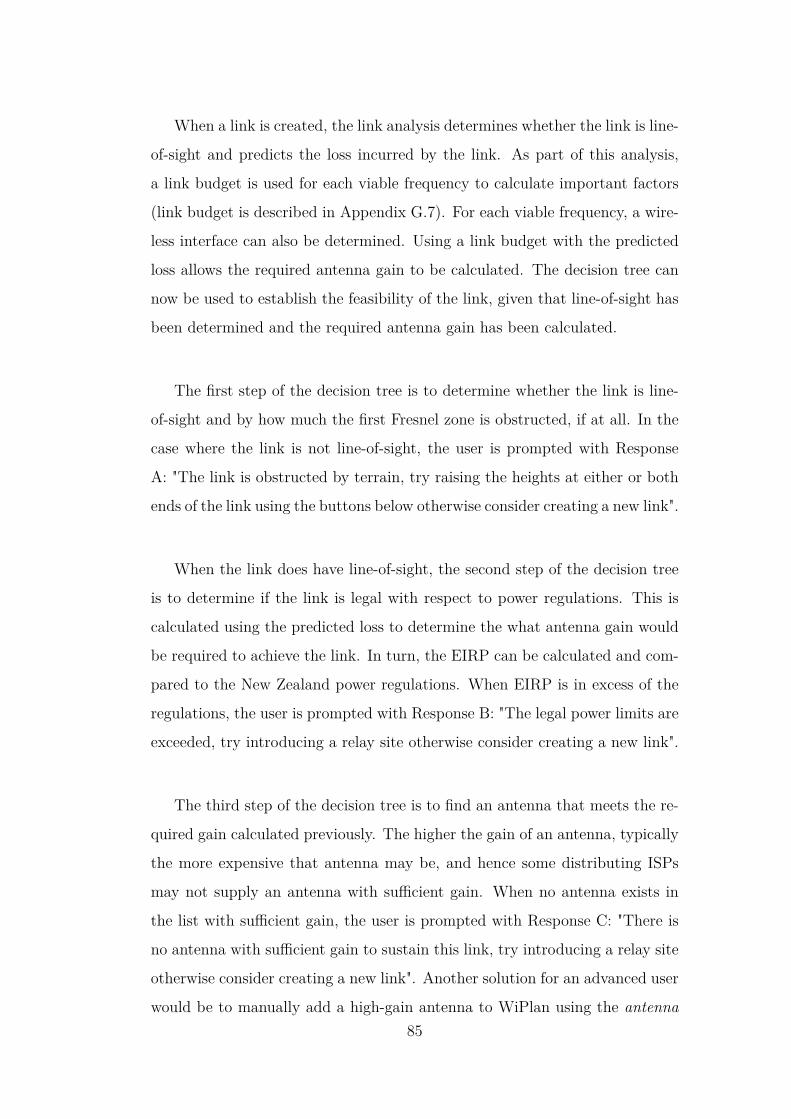
When a link is created, the link analysis determines whether the link is line-
of-sight and predicts the loss incurred by the link. As part of this analysis,
a link budget is used for each viable frequency to calculate important factors
(link budget is described in Appendix G.7). For each viable frequency, a wire-
less interface can also be determined. Using a link budget with the predicted
loss allows the required antenna gain to be calculated. The decision tree can
now be used to establish the feasibility of the link, given that line-of-sight has
been determined and the required antenna gain has been calculated.
The first step of the decision tree is to determine whether the link is line-
of-sight and by how much the first Fresnel zone is obstructed, if at all. In the
case where the link is not line-of-sight, the user is prompted with Response
A: "The link is obstructed by terrain, try raising the heights at either or both
ends of the link using the buttons below otherwise consider creating a new link".
When the link does have line-of-sight, the second step of the decision tree
is to determine if the link is legal with respect to power regulations. This is
calculated using the predicted loss to determine the what antenna gain would
be required to achieve the link. In turn, the EIRP can be calculated and com-
pared to the New Zealand power regulations. When EIRP is in excess of the
regulations, the user is prompted with Response B: "The legal power limits are
exceeded, try introducing a relay site otherwise consider creating a new link".
The third step of the decision tree is to find an antenna that meets the re-
quired gain calculated previously. The higher the gain of an antenna, typically
the more expensive that antenna may be, and hence some distributing ISPs
may not supply an antenna with sufficient gain. When no antenna exists in
the list with sufficient gain, the user is prompted with Response C: "There is
no antenna with sufficient gain to sustain this link, try introducing a relay site
otherwise consider creating a new link". Another solution for an advanced user
would be to manually add a high-gain antenna to WiPlan using the antenna85
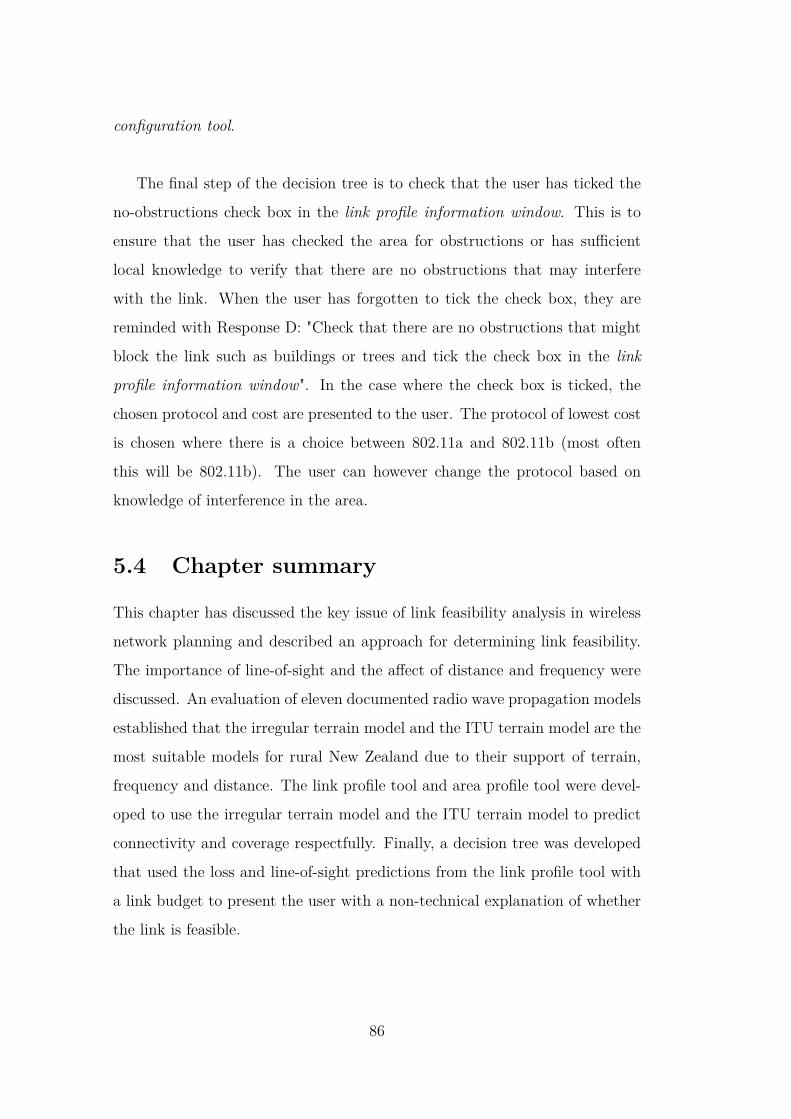
configuration tool.
The final step of the decision tree is to check that the user has ticked the
no-obstructions check box in the link profile information window. This is to
ensure that the user has checked the area for obstructions or has sufficient
local knowledge to verify that there are no obstructions that may interfere
with the link. When the user has forgotten to tick the check box, they are
reminded with Response D: "Check that there are no obstructions that might
block the link such as buildings or trees and tick the check box in the link
profile information window". In the case where the check box is ticked, the
chosen protocol and cost are presented to the user. The protocol of lowest cost
is chosen where there is a choice between 802.11a and 802.11b (most often
this will be 802.11b). The user can however change the protocol based on
knowledge of interference in the area.
5.4 Chapter summary
This chapter has discussed the key issue of link feasibility analysis in wireless
network planning and described an approach for determining link feasibility.
The importance of line-of-sight and the affect of distance and frequency were
discussed. An evaluation of eleven documented radio wave propagation models
established that the irregular terrain model and the ITU terrain model are the
most suitable models for rural New Zealand due to their support of terrain,
frequency and distance. The link profile tool and area profile tool were devel-
oped to use the irregular terrain model and the ITU terrain model to predict
connectivity and coverage respectfully. Finally, a decision tree was developed
that used the loss and line-of-sight predictions from the link profile tool with
a link budget to present the user with a non-technical explanation of whether
the link is feasible.
86

Chapter 6
The process of designing the
WiPlan user interface
This chapter discusses the design process followed for developing WiPlan.
Firstly, methodology overview for designing the interface is discussed. The
design requirements identified earlier in the thesis are summarised and some
new requirements are defined. The stakeholders and actors involved in the
wireless network planning process are then introduced, followed by a descrip-
tion of five rural personas based on characteristics of typical rural people. The
chapter describes an overview of the WiPlan user interface as well as identified
use cases and how those use cases were implemented in the WiPlan interface.
Finally, the WiPlan system is subjected to the same analysis as the existing
planning tools described in Section 3.2.1.
6.1 Methodology overview
This section gives an overview of the methodology used to design the WiPlan
interface. The spiral model [50], developed by Barry Boehm, was chosen as
it uses iterative development which allows for incremental refinement to the
user interface. The spiral model forces early user involvement in the system
development and allows for new requirements to be addressed as they become
known.
87

The four stages of the spiral model are:
1. Determine the objectives of the design.
2. Identify and resolve the risks involved.
3. Develop and test.
4. Plan the next design.
A simplified version of the spiral model is used for designing the WiPlan inter-
face that incorporates three stages: design, implement and evaluate. Figure 6.1
shows the simplified spiral model.
Figure 6.1: The spiral model
The design stage is where the objectives and the constraints of the project
are identified. This forms the base of the spiral model and is key to the entire
interface design process. A major part of this stage is the identification of
the requirements for the interface and the target users that will be using the
interface. Section 6.1.1 summarises the requirements that have been identified
for the WiPlan user interface throughout the earlier chapters of this thesis.
Identifying target users and designing the user interface for these users is criti-
cal to the success of the interface design. Section 6.1.3 describes how the users
were identified.
The implementation stage is where the actual interface development takes
place, usually by using a prototyping approach. The evaluation stage is where
the implemented prototype is evaluated and the feedback from that evaluation88

applied to the prototype in the next design phase. A prototype was developed
and incrementally refined through eight re-design cycles around the spiral for
the development of WiPlan. Design one was the intial paper prototype. The
paper prototype was presented to an evaluation panel of three people (two
HCI experts and a wired network expert who lives in a rural community) to
give feedback on weak points in the interface design. The implementation of
WiPlan then began to take place and is described in Chapter 7. Design two
through to design five were the implemented results based on feedback about
the previous design from the evaluation panel.
Design cycle six and design cycle seven were the implemented results from
design five and design six respectively, based on extensive feedback given by two
independent HCI experts. The findings of the two HCI experts is discussed in
Chapter 8. Design eight is the implemented result of first user study discussed
in Chapter 9 and is the final interface design of WiPlan. A second user study
took place using this final design and user feedback is discussed in Chapter 9.
6.1.1 Interface design requirements
The requirements for the WiPlan user interface design can be derived from the
thesis question: Can a software tool be designed to assist members of rural
communities with no expertise in wireless network planning, to plan a feasible
wireless network?
There are two observations that can be made from this question:
1. The interface needs to be designed for members of rural communities
2. The interface needs to support collaborative wireless network planning
by non-expert users
By analysing these two observations in conjunction with the GNOME Human
Interface Guidelines [49], the interface design requirements can be identified.
The GNOME Guidelines were used as they are well documented, widely used
and implementation of WiPlan took place in a GNOME environment.89
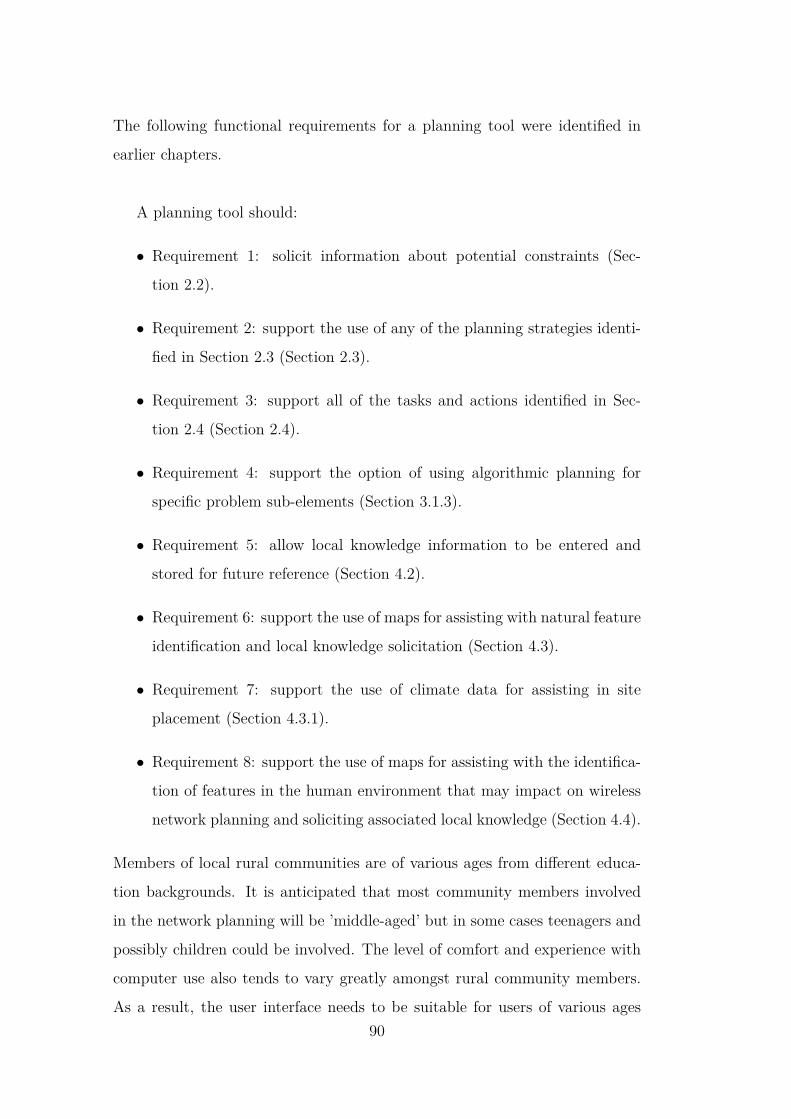
The following functional requirements for a planning tool were identified in
earlier chapters.
A planning tool should:
• Requirement 1: solicit information about potential constraints (Sec-
tion 2.2).
• Requirement 2: support the use of any of the planning strategies identi-
fied in Section 2.3 (Section 2.3).
• Requirement 3: support all of the tasks and actions identified in Sec-
tion 2.4 (Section 2.4).
• Requirement 4: support the option of using algorithmic planning for
specific problem sub-elements (Section 3.1.3).
• Requirement 5: allow local knowledge information to be entered and
stored for future reference (Section 4.2).
• Requirement 6: support the use of maps for assisting with natural feature
identification and local knowledge solicitation (Section 4.3).
• Requirement 7: support the use of climate data for assisting in site
placement (Section 4.3.1).
• Requirement 8: support the use of maps for assisting with the identifica-
tion of features in the human environment that may impact on wireless
network planning and soliciting associated local knowledge (Section 4.4).
Members of local rural communities are of various ages from different educa-
tion backgrounds. It is anticipated that most community members involved
in the network planning will be ’middle-aged’ but in some cases teenagers and
possibly children could be involved. The level of comfort and experience with
computer use also tends to vary greatly amongst rural community members.
As a result, the user interface needs to be suitable for users of various ages90

and computer experience. The number of user actions should be small, so that
novice and first-time users can carry out simple tasks successfully, and thus
reduce anxiety, build confidence and gain positive reinforcement [114].
The interface design needs to minimise the number of user actions and the
memory load on the users as it is expected that WiPlan will only be used once
by a particular group of users and therefore those users will be first-time users.
Shneiderman et al. states that in geographic applications, it seems natural to
give a spatial representation in the form of a map that provides a familiar
model of reality.
Shneiderman et al. also points out that the success of a spatial data-
management system depends on the skill of the designers in choosing icons,
graphical representations, and data layouts that are natural and comprehen-
sible to users. Therefore it seems sensible to provide a map-based interface
using direct manipulation, as direct manipulation interaction allows users to
carry out tasks rapidly and observe the results immediately. This is appealing
for novices as it enables easy learning, retention and encourages exploration.
Two important functional requirements for the interface design can be derived
from the preceding discussion:
• Requirement 9: The interface should be map-based and should provide
direct manipulation interaction.
• Requirement 10: The interface should support the wireless network plan-
ning process, incorporating the tasks, actions and strategies defined by
Requirement 2 and Requirement 3.
91
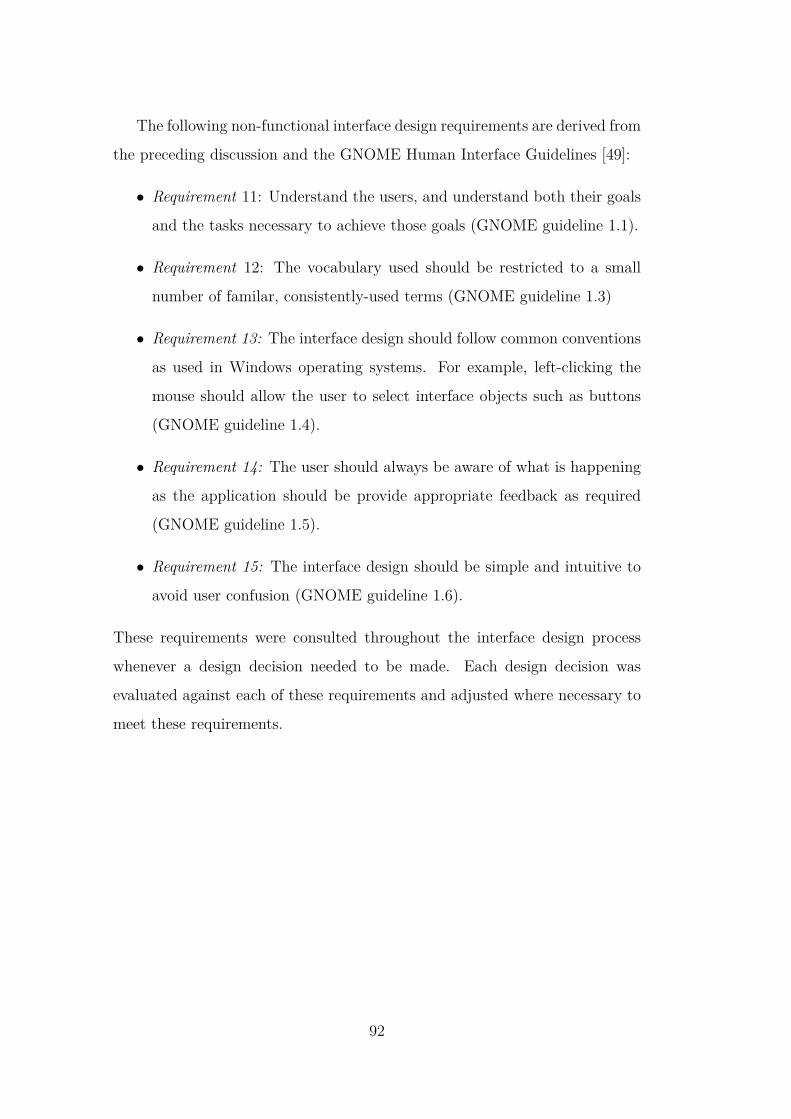
The following non-functional interface design requirements are derived from
the preceding discussion and the GNOME Human Interface Guidelines [49]:
• Requirement 11: Understand the users, and understand both their goals
and the tasks necessary to achieve those goals (GNOME guideline 1.1).
• Requirement 12: The vocabulary used should be restricted to a small
number of familar, consistently-used terms (GNOME guideline 1.3)
• Requirement 13: The interface design should follow common conventions
as used in Windows operating systems. For example, left-clicking the
mouse should allow the user to select interface objects such as buttons
(GNOME guideline 1.4).
• Requirement 14: The user should always be aware of what is happening
as the application should be provide appropriate feedback as required
(GNOME guideline 1.5).
• Requirement 15: The interface design should be simple and intuitive to
avoid user confusion (GNOME guideline 1.6).
These requirements were consulted throughout the interface design process
whenever a design decision needed to be made. Each design decision was
evaluated against each of these requirements and adjusted where necessary to
meet these requirements.
92
6.1.2 Stakeholders
Szabó et. al [118] points out that the stakeholders of community networks
include:
• public agencies
• users
• private sector service providers
• local and global facilitating agencies.
In the WiPlan rural wireless network planning scenario, these stakeholders are
identified as the following:
• public agencies
• the local rural community
• the developers of WiPlan
• the distributing ISP
6.1.3 Actors
The distributing ISP and the local rural community are the two key stakehold-
ers that need to be considered in the WiPlan interface design. These groups
were explored further by informal consultation with the CRCnet group and
observation by participation. The author had constant access to the CRCnet
wireless network planning expert and the senior network engineer. They were
available on demand as questions arose and were informally interviewed many
times, primarily about how the group worked as an ISP. The expert and en-
gineer were also able to provide information about community users they had
met.
93

An invaluable method for understanding characteristics of rural communi-
ties was observation by participation. The author visited the Te Pahu network,
introduced in Section 1.2.1.1, several times. Visits included accessing a solar
site on a farm, visiting a school and visiting some houses. On these occasions,
the author visually observed the surrounding environment and the people that
were met.
The author also visited the Tuhoe network, introduced in Section 1.2.1.1,
spending three days with local iwi community members and members of the
CRCnet group. During this visit, the author met two community champions
that lead and encouraged the community to utilise the wireless network. The
author also met several community supporters of various ages, two in their late
teens. The author visited and actively participated in wireless installations at
a farmer’s wool-shed, a school and a house in the community. The author
climbed a sacred mountain with the CRCnet expert and some of the commu-
nity supporters to carry out some solar site maintenance. Two other solar sites
were visited during this time. One of the community supporters was also the
local network installer and was informally interviewed about their role. These
visits gave a valuable insight to real rural community members and greatly
assisted identifying the target end users.
Based on these experiences and observations, six actors can be identified
that belong to the distributing ISP and the local rural community groups. It
is important to note that an end user can belong to more than one actor type.
The wireless network expert (distributing ISP)
The wireless network expert is a wireless network planning professional. There
is generally only one wireless network expert involved but sometimes there may
be more. The wireless network expert has minor involvement in the planning
process until near the end when verification of the network plan is required.
94
The primary goals for the wireless network expert are:
1. Profit by getting rural communities on board.
2. Assist rural communities with quality wireless network design and veri-
fication.
The wireless network helpdesk or installer (distributing ISP)
The wireless network helpdesk are the part of the distributing ISP that the
rural communities tend to deal with face-to-face. In some cases, there may be
no wireless network helpdesk and instead the wireless network expert will also
play this acting role. The wireless network helpdesk has the same goals as the
wireless network expert.
The community champion (community)
The community champion is the typical trigger for the rural community wire-
less network planning process. The community champion is the person (or
persons) that motivate the community to plan the wireless network and get
the distributing ISP on-board in the first place. The primary goals for the
community champion are:
1. Build a community wireless network.
2. Bring the community together.
3. Obtain access to the Internet.
95
The local knowledge contributor (community)
The local knowledge contributor is a member of the local community that con-
tributes local knowledge information as part of the planning process. Generally
there will be several local knowledge contributors taking part. The primary
goals for the local knowledge contributor are:
1. Identify and share relevant local knowledge for wireless network planning.
2. Obtain access to the Internet.
The computer operator (community)
This actor is required for the WiPlan planning process. The computer operator
is a member of the local community that is comfortable operating the computer
running WiPlan. Members of the community may take turns at playing this
role. The primary goals of the computer operator are:
1. Operate WiPlan and plan a wireless network with other community
members.
2. Obtain access to the Internet.
Community interested party (community)
The community interested party are the members of the community that want
access to the Internet but do not want to participate in the network planning
process. Their primary goal is:
1. Obtain access to the Internet.
Actors can be categorised as being a community member or an ISP mem-
ber. The primary actor in the rural wireless network planning process is the
community member, as they share the common goal of wanting access to the
Internet and they are willing to work together towards that goal. The next
section describes the personas that were developed for the community member
actor based on the experiences and observations discussed earlier.
96

6.1.4 Personas
A persona is a description of a stereotypical user that is used by interface de-
velopers to guide the design of the user interface and the interactions that take
place. Personas help to guide the design of the user interface by providing a
focus and fostering development of empathy towards the personas by the de-
signers. Personas also force the designers to think about specific use cases and
how that persona might cope in that situation. A persona includes personal
information such as age, sex, family, job and hobbies, as well as the real-world
needs and goals of that stereotypical user. The more specific the personas are,
the more effective they are as design tools [59]. Table 6.1 presents the set of
characteristics that encompass the end users. These characteristics can then
be used to help establish personas.
Characteristic Target end-usersAge Will range in age from teenagers to 80+Gender Both male and femaleEthnicity All, primarily NZ European and MaoriEducation May have only minimal education
qualificationsOccupation Primarily agriculture, education or small
businessGeneral computerexperience
May have little or no prior experience withusing computers
Spatial reasoning Likely to be quite skilled with distances andheights
Domain experience Expected to have no prior experience withwireless network planning
Attitude Positive and eager to work towards acommunity wireless network
Table 6.1: Characteristics of target end-users.
Five personas have been established to represent some of the real-world ru-
ral people who would be expected to use the WiPlan interface. These personas
were chosen as they are based on real people that the the CRCnet group has
liaised with. The personas were identified through consultation with the CR-
Cnet group and by meeting key rural community members that have an active
role in the management/maintenance of their respective rural wireless network.97

These five personas are intended to be representative by encompassing a
set of varying viewpoints on the local areas. The five personas include: a
sheep and beef farmer, a dairy farmer, a school principal, a community rep-
resentative and a cultural expert. The details of these personas are available
in Appendix D. An analysis of Internet use in New Zealand by Statistics New
Zealand [39] was used to help create these personas, details of which can be
found in Appendix.
Two of the five established personas are based on farmers. In terms of area,
sheep and beef farming and dairy farming are two of the dominant farm types
in New Zealand in terms of land area. The two personas therefore reflect the
stereotypical character of the sheep and beef farmer, and the dairy farmer.
The persona of a principal of a local rural school was chosen to represent
the importance of education among rural children and highlight the impor-
tance of the Internet for learning in a modern society.
The community representative is an important persona as that persona is
responsible for conveying the thoughts and issues of people in the community.
The final persona is the cultural expert, or a representative of the cultural
expert. The cultural expert is responsible for maintaining the fine balance
between cultural respect and planning a wireless network that meets expecta-
tions of the other personas. The cultural expert will typically be a person from
that culture. For example, in Maori culture, the expert would be a kaumatua1,
or a representative of the kaumatua.
1Kaumatua are respected elders who are the keepers of the knowledge and traditions ofthe family, sub-tribe or tribe [48].
98
6.2 WiPlan user interface overview
This section presents a description of the main components of the WiPlan user
interface including the WiPlan tutorial and guide, the main interface and the
advanced tools.
6.2.1 The WiPlan tutorial and guide
WiPlan includes a tutorial that introduces the user to each of the main tasks
within WiPlan and steps the user through completing each of those tasks. The
tools embedded within WiPlan are also introduced such as map zooming and
panning. The WiPlan tutorial provides a structured step-by-step work flow of
the tasks to be completed through direct manipulation of the user interface and
teaches the user the planning process (Requirement 10). As well as creating a
pre-determined wireless network plan, the tutorial provides general learning so
that the user gains familiarity with how to perform wireless network planning
tasks in WiPlan.
The tutorial has been integrated in to the main interface instead of using
approaches such as popups to keep the interface simple. This prevents the
tutorial being accidentally hidden behind other dialogs where users may not
be able to find it. As the user completes the step-by-step instructions, the tu-
torial will automatically advance to the next step. The tutorial introduces the
user to such tasks as: creating sites, creating links, solving line-of-sight issues,
exploring areas and creating coverage plots. The full tutorial is presented in
Appendix F.
WiPlan also includes a guide for assisting the user in the wireless network
planning process. WiPlan shows the guide when not in tutorial mode and pro-
vides support for when the user is unsure about what they should do next. The
guide provides five steps that describe the reverse-branch strategy discussed
in Section 2.3.4. The reverse-branch strategy was chosen as it is the strategy99

used by the CRCnet researchers. The guide is optional and WiPlan supports
the use of any of the strategies described in Section 2.3.
6.2.2 The main interface
Figure 6.2 shows the main interface of WiPlan which consists of a tool bar
(A & E), side bar (B & C), main map window (as per Requirement 9) and a
status bar (D, I & J). The tool bar shows four buttons for changing the mouse
mode on the main map window (A). The first, from left to right (A), is the
simple select-type mode, followed by the zoom in, zoom out and pan modes.
The toolbar also contains a drop-down list (E) that allows the user to switch
between a terrain map, topographic map and aerial photography. The side bar
contains a legend for explaining features on the map (C) and a tutorial that
steps the user through the actions required when planning a wireless network
(B). The status bar below the main map window shows the user the current
geographic location and elevation of the mouse pointer (D). The status bar
also shows the current connectivity of the network plan (I) and the total cost
(J).
Figure 6.2: The main screen of WiPlan.
The compass rose (F) and scale (G) on the map window assist the user
with map navigation. The compass rose provides the user with orientation100

and follows the common convention that north is at the top of the map. North
on the compass rose is aligned to true/geographic. The scale gives the user
a feeling for the size of features on the map. It also allows the user to gauge
approximate distances. A small helper text box follows the mouse cursor (H)
around the map window showing the elevation at the mouse cursors location
so the user does not have to move their eyes from the cursor in order to see
the elevation. Every persona is not necessarily expected to understand the
map portion of the main interface but as the planning is collaborative, it is
reasonable to assume that at least one of the users is familiar with maps. For
example, farmers use maps for day-to-day farming tasks, such as moving stock
from one paddock to another. Figure 6.3 shows an example of how the the
name and type of a site are displayed when the mouse cursor hovers over a site.
Figure 6.4 shows an example of how the cost of a link is displayed (if applicable)
when the mouse cursor hovers over a link. A cost is not shown when the link
is non line-of-sight, as an equipment solution cannot be determined without
line-of-sight. The file menu supports typical features such as open and save,
as well as advanced tool options and a help about option.
Figure 6.3: An example of the mouse helper text box when hovered over a site.
101

Figure 6.4: An example of the mouse helper text box when hovered over alink.
6.2.3 Advanced tools
There are two advanced tools included with WiPlan; the interface configura-
tion tool and the antenna configuration tool. The interface configuration tool
and antenna configuration tool are, as the names suggest, for the configuration
of interfaces and antennas respectively. The configuration tools are intended
for the distributing ISP and expert users; most users should not need to use
them. On the other hand, the site adder tool is for entering the coordinates of
known sites, and therefore will most likely receive significant usage.
Figure 6.5 shows the interface configuration tool. At the top of the tool
window there is a button for adding new interface configurations. These config-
urations are specified in XML files and clicking the button will display an open
file dialog. Added configurations will then be displayed in a tree-like structure
in the interface configuration tool. Each interface type forms the root of the
sub-tree representing that interface configuration. An interface configuration
can be removed by right-clicking the interface type and selecting delete item.
The OK button at the bottom of the window saves any changes made.
Figure 6.6 shows the antenna configuration dialog which has two main
parts; the current configuration and existing configurations. The current con-102

Figure 6.5: The interface configuration tool in WiPlan.
figuration allows the addition of a new antenna or the modification/removal
of an existing antenna configuration. The current configuration shows such
information as the antenna name, type, gain, azimuth, elevation, supported
frequencies and price. Each of information elements can be modified or the
entire configuration removed. The existing configurations table shows all pre-
vious defined antenna configurations and the selected configuration is shown
in the current configuration. When a blank row in the table is selected, as is
the default, then a new antenna specification will be added. Existing antenna
configurations can be loaded from appropriate CSV files or saved to CSV files.
Figure 6.6: The antenna configuration tool in WiPlan.
103

6.3 Use cases and implemented functionality
The following section describes the use cases derived from Requirement 3:
that a planning tool should support all of the tasks and actions identified in
Section 2.4. The derived use cases are:
1. Finding a site location.
2. Creating a site.
3. Accessing site properties.
4. Creating a link.
5. Computing line-of-sight.
6. Computing coverage analysis.
Figure 6.7 shows the icons and their associated meaning for explaining some
of the interactions that take place.
(a) Move the mouse. (b) Left-click. (c) Right-click.
Figure 6.7: Icons representing mouse operations.
104
6.3.1 Finding a site location
Use Case 1 Finding a site locationPrimary Actor: Computer Operator
Scope: Subsystem
Level: User Goal
The computer operator wants to decide where they should
create a site. The operator may be trying to find a particular
site, such as a house, or deciding where to place a relay site.
Finding the location for a site depends on whether the site to be placed
is a source, house or relay site. Locations for source sites should already be
provided with WiPlan by the distributing ISP. Section 6.3.1.1 explains how the
computer operator might find a particular house location in order to create a
site there. Section 6.3.1.2 explains the issues that need to be considered by
the computer operator when deciding where to place a relay site.
6.3.1.1 Finding houses
There are three main techniques to finding houses in WiPlan. The first tech-
nique is to use the advanced site adder tool if coordinates are known for the
houses. The second technique is to use satellite imagery to locate the ap-
proximate area and use roads and other features to locate houses using local
knowledge. Both of these techniques will yield fairly accurate coordinate lo-
cations. The third technique is to use topographic maps to locate houses by
identifying roads and other features using local knowledge. Depending on the
age of the house and the quality of the topographic map, individual houses
may or may not be present on the map. When the house is not present on
the map, bends in roads and rivers and features such as vegetation will be
necessary to estimate the location of a house using local knowledge. In this
situation, it is important to remember that the accuracy of placement may be
questionable and nearby terrain and vegetation should be considered closely.105

6.3.1.2 Choosing relays
A relay is chosen by considering five key issues: elevation, placement, access,
power and weather. Creating a relay at an elevation higher than most of
the surrounding area assists with establishing line-of-sight links and increases
coverage possibilities. Permission for placing a relay needs to be obtained from
the landowner and other parties, such as local iwi. Access to the site, power
requirements and weather conditions at that site also need to be considered.
Potential relay sites are usually identified using maps and local knowledge. A
user may already know of elevated locations where a relay may be suitable
and search for those areas using topographic maps. Otherwise the user can
look for elevated locations using the topographic map or the terrain map. The
topographic map shows contours and trig sites, while ridges and peaks can be
identified by the shading on the terrain map. Coordinates can also be entered
using the advanced site adder tool. Most relay locations are chosen based solely
on elevation to begin with and then the issues of placement, access, power and
weather are considered. A relay location can then be disregarded if any of
these issues can not be sufficiently addressed.
106

6.3.2 Creating a site
Use Case 2 Creating a sitePrimary Actor: Computer Operator
Scope: Subsystem
Level: User Goal
The computer operator wants to create a site. The operator
specifies the location of where they want the site created and
the type of site they want it to be. The system then creates
the correct type of site at the specified location.
A site can be created by moving the mouse to the desired location and
right-clicking the map to show the pop-up menu with site creation options.
Figure 6.8 shows the steps involved in creating a house site.
Alternatively, the site adder tool can be used to create sites. Figure 6.9(a)
shows the site adder tool being used to create five sites. The result of creating
these five sites can be observed in Figure 6.9(b). The current coordinates
shows the current site to add, or the details of a site that has been added but
not yet created. Sites listed in the table are not created until the user clicks
OK. The user enters the site name, coordinates, coordinate type and site type.
Currently, the supported coordinate types are the World Geodetic System
(WGS84) used by GPS devices and the NZTM projection. Site coordinates
can be imported from and exported to CSV files.
107

Figure 6.8: Creating a site
(a) Entering sites to add in the Site Adder. (b) Sites created after the user clicksOK.
Figure 6.9:
108
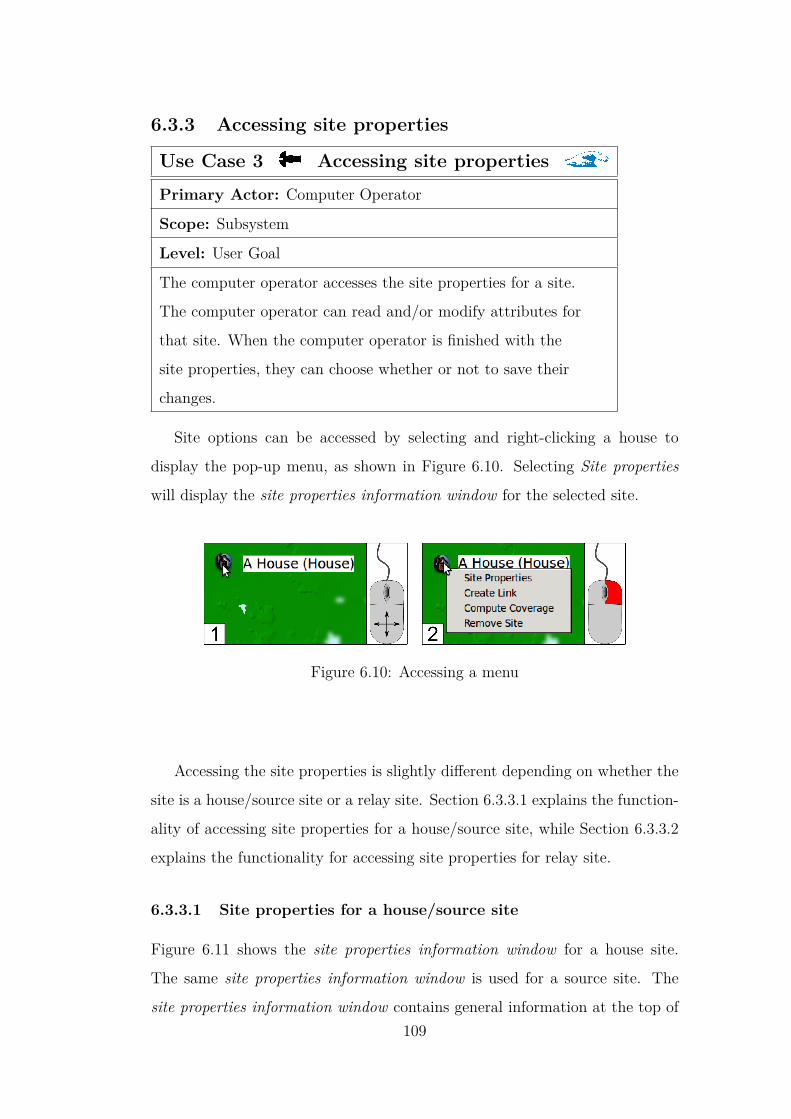
6.3.3 Accessing site properties
Use Case 3 Accessing site propertiesPrimary Actor: Computer Operator
Scope: Subsystem
Level: User Goal
The computer operator accesses the site properties for a site.
The computer operator can read and/or modify attributes for
that site. When the computer operator is finished with the
site properties, they can choose whether or not to save their
changes.
Site options can be accessed by selecting and right-clicking a house to
display the pop-up menu, as shown in Figure 6.10. Selecting Site properties
will display the site properties information window for the selected site.
Figure 6.10: Accessing a menu
Accessing the site properties is slightly different depending on whether the
site is a house/source site or a relay site. Section 6.3.3.1 explains the function-
ality of accessing site properties for a house/source site, while Section 6.3.3.2
explains the functionality for accessing site properties for relay site.
6.3.3.1 Site properties for a house/source site
Figure 6.11 shows the site properties information window for a house site.
The same site properties information window is used for a source site. The
site properties information window contains general information at the top of109

the window with some more specific information that will be described as en-
countered during the tutorial. The name of the house is shown in a text field
which allows the user to specify the name of the house. The type, coordinates
and elevation of the house are shown in label fields.
The user can select the approximate antenna height from the drop-down list
where each height in the list has a brief description such as One storey house
(4m). The button next to the drop-down list activates a dialog that allows for
a custom height and description to be added to the drop-down list. Users often
do not know exact heights and so a description can be more meaningful than
an actual number. Specification of an exact height may be off-putting to the
user as they may worry about how specific the height measurement needs to
be. The notes area is different depending on the type of the site. The general
notes text field allows the user to store general information such as who owns
the house or building in question.
The weather information section shows the estimated weather conditions
for the site location; including sun, wind and rain. The estimated weather
is presented using a five-star rating system as well as raw values. The five-
star rating system is intended to convey a visual rating of the weather types,
where five ’stars’ indicates a very high level and one ’star’ indicates a very low
level. The ’star’ levels were derived using New Zealand building regulation
information and weather data. The about button provides access to a dialog
explaining the source of the weather information. Another button accesses a
dialog that allows the user to enter raw weather data.
6.3.3.2 Site properties for a relay site
Figure 6.12 shows the site properties information window for a relay site. The
information window for a relay is similar to the dialog for a house. The drop-
down list for the power source allows the user to select whether the relay site
uses mains power or solar power. The cost and power requirements of the site110
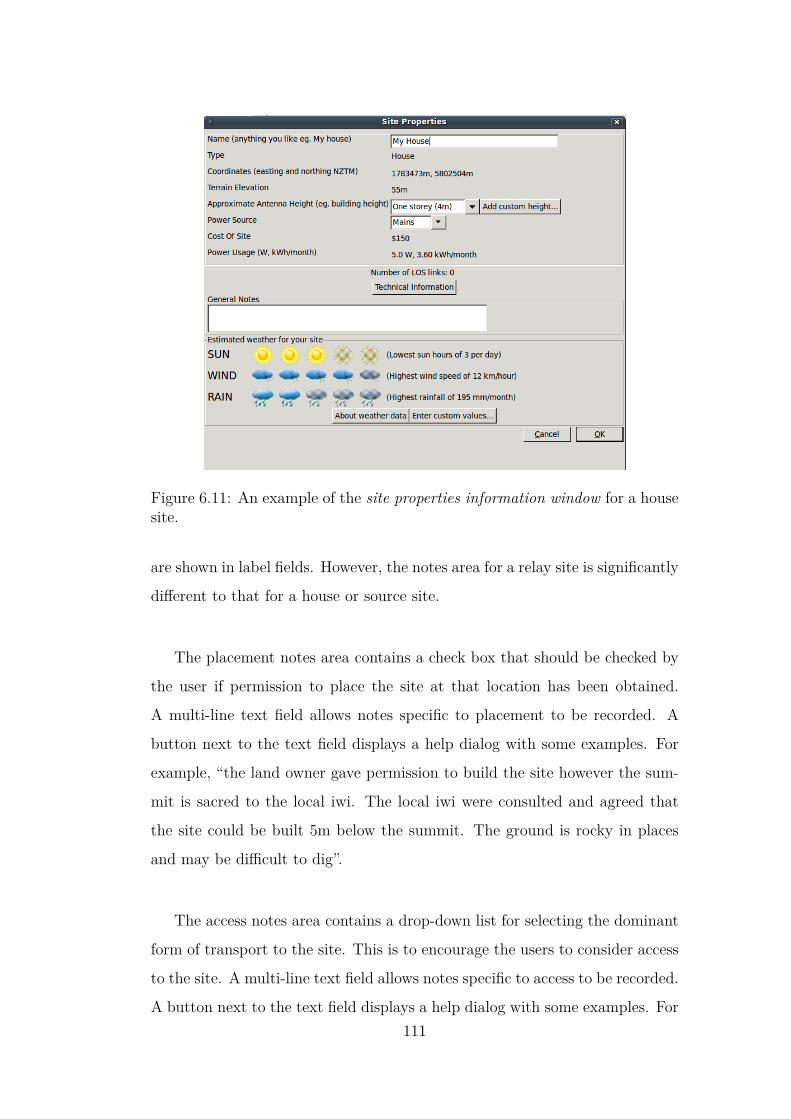
Figure 6.11: An example of the site properties information window for a housesite.
are shown in label fields. However, the notes area for a relay site is significantly
different to that for a house or source site.
The placement notes area contains a check box that should be checked by
the user if permission to place the site at that location has been obtained.
A multi-line text field allows notes specific to placement to be recorded. A
button next to the text field displays a help dialog with some examples. For
example, “the land owner gave permission to build the site however the sum-
mit is sacred to the local iwi. The local iwi were consulted and agreed that
the site could be built 5m below the summit. The ground is rocky in places
and may be difficult to dig”.
The access notes area contains a drop-down list for selecting the dominant
form of transport to the site. This is to encourage the users to consider access
to the site. A multi-line text field allows notes specific to access to be recorded.
A button next to the text field displays a help dialog with some examples. For111
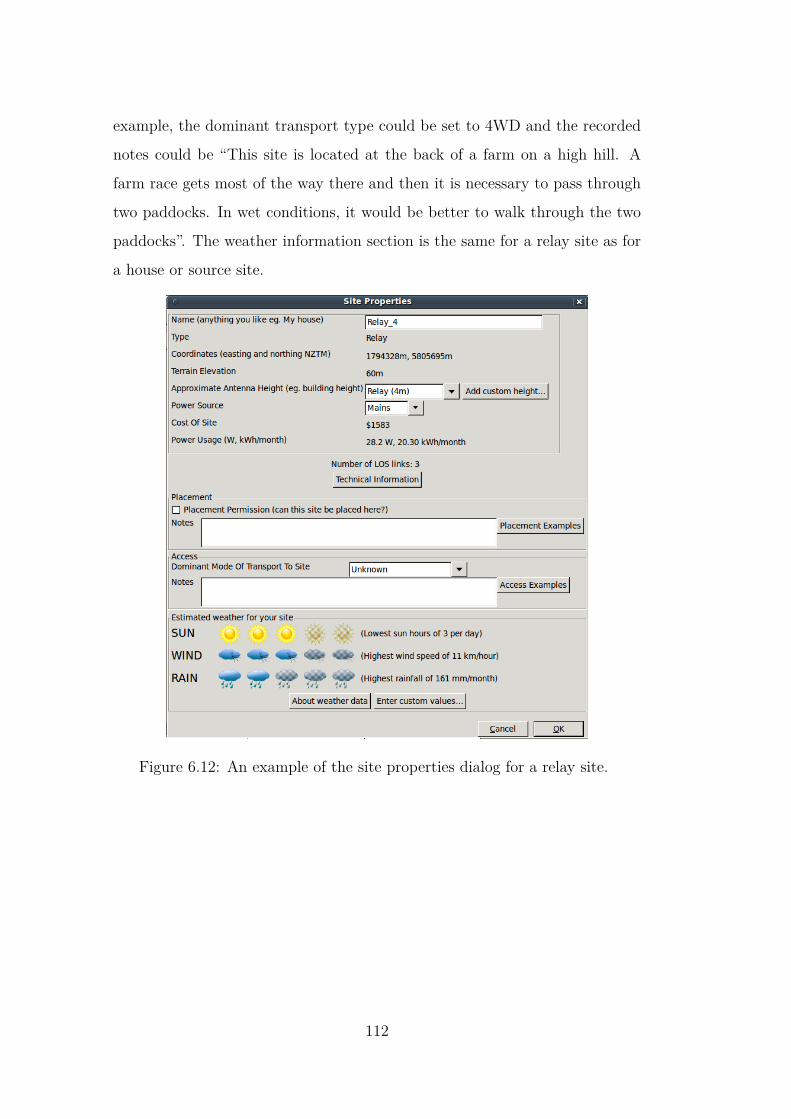
example, the dominant transport type could be set to 4WD and the recorded
notes could be “This site is located at the back of a farm on a high hill. A
farm race gets most of the way there and then it is necessary to pass through
two paddocks. In wet conditions, it would be better to walk through the two
paddocks”. The weather information section is the same for a relay site as for
a house or source site.
Figure 6.12: An example of the site properties dialog for a relay site.
112

6.3.4 Creating a link
Use Case 4 Creating a linkPrimary Actor: Computer Operator
Scope: Subsystem
Level: User Goal
The computer operator enables link creation mode and
creates a link between two sites. Once a link has been
created, the system indicates to the computer operator
whether the link is line-of-sight or not.
Selecting Create link from the site pop-up menu puts WiPlan in to link
creation mode. When the user moves the mouse, a dashed red or green line,
with the current site as its origin, will follow the mouse pointer (Figure 6.13).
The green line indicates line-of-sight while red indicates no line of sight but
neither are as precise as when a link is analysed in the link profile information
window. This is because the indicator needs to be repeatedly calculated as the
user moves the mouse and in order for the indicator to keep up with the user,
lower resolution terrain data is used for the calculations. The link profile in-
formation window only needs to calculate line-of-sight once and can take a bit
more time for the calculation, so much high resolution terrain data can be used.
Figure 6.13: An example of the line-of-sight indicator in WiPlan.
When a link is created, WiPlan will show the line-of-sight confirmation
dialog showing the protocol to use and the cost if there are no issues with
line-of-sight (Figure 6.14). The dialog simply asks the user whether there are113

any obstructions such as trees or buildings that could block line-of-sight. If
the user selects no then WiPlan creates the link. If the user selects yes, then
WiPlan still creates the link but the link is classed as non line-of-sight.
Figure 6.14: An example of the line-of-sight confirmation dialog in WiPlan.
A link can be removed by right-clicking the link to display the pop-up menu
which shows two options; Link profile and Remove link. Selecting Link profile
would open the link profile information window. The user should left-click
Remove link which will remove the link and any configurations on the sites
connected by the link, but will not remove the sites themselves.
114
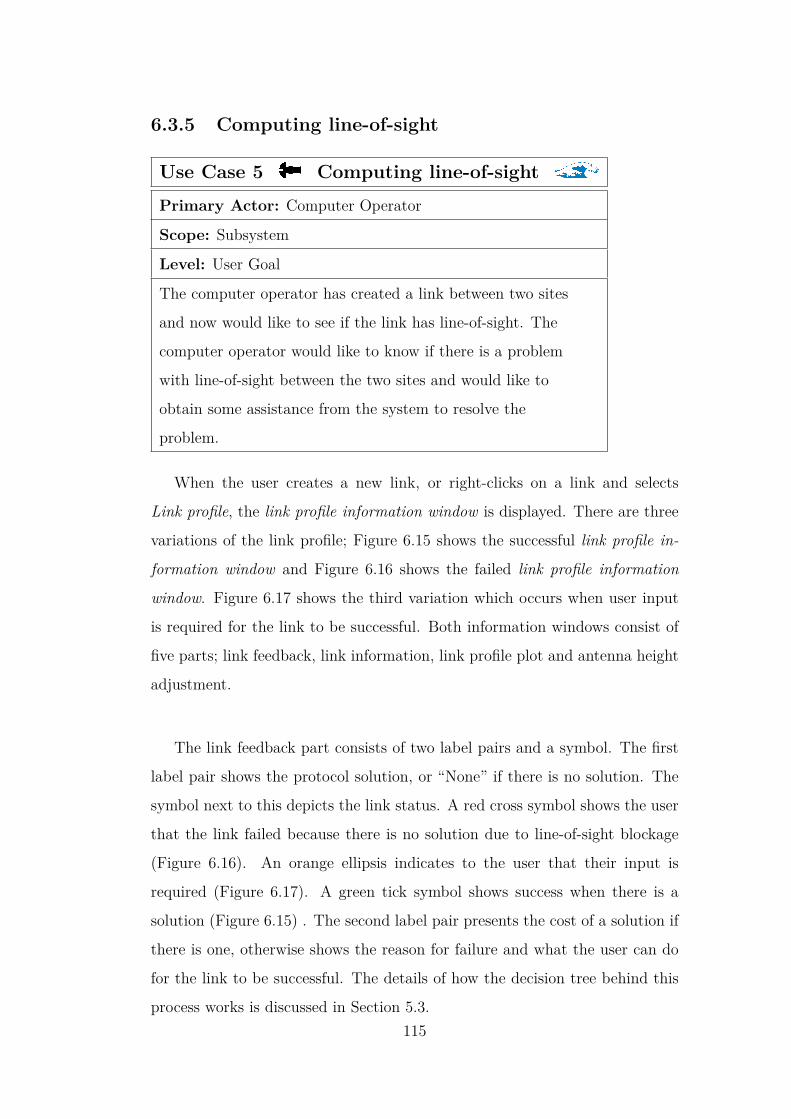
6.3.5 Computing line-of-sight
Use Case 5 Computing line-of-sightPrimary Actor: Computer Operator
Scope: Subsystem
Level: User Goal
The computer operator has created a link between two sites
and now would like to see if the link has line-of-sight. The
computer operator would like to know if there is a problem
with line-of-sight between the two sites and would like to
obtain some assistance from the system to resolve the
problem.
When the user creates a new link, or right-clicks on a link and selects
Link profile, the link profile information window is displayed. There are three
variations of the link profile; Figure 6.15 shows the successful link profile in-
formation window and Figure 6.16 shows the failed link profile information
window. Figure 6.17 shows the third variation which occurs when user input
is required for the link to be successful. Both information windows consist of
five parts; link feedback, link information, link profile plot and antenna height
adjustment.
The link feedback part consists of two label pairs and a symbol. The first
label pair shows the protocol solution, or “None” if there is no solution. The
symbol next to this depicts the link status. A red cross symbol shows the user
that the link failed because there is no solution due to line-of-sight blockage
(Figure 6.16). An orange ellipsis indicates to the user that their input is
required (Figure 6.17). A green tick symbol shows success when there is a
solution (Figure 6.15) . The second label pair presents the cost of a solution if
there is one, otherwise shows the reason for failure and what the user can do
for the link to be successful. The details of how the decision tree behind this
process works is discussed in Section 5.3.115

Figure 6.15: An example of the link profile information window where the linkis successful.
116

Figure 6.16: An example of a link profile dialog where the link has failed.
The link information part consists of three elements; a button and two check
boxes. A button allows access to the technical information dialog describing
the protocol results determined for that link. Results calculated for the link
using 802.11a and 802.11b include whether the link is line-of-sight, whether
the link is deemed legal, the frequency range, the radio card and antenna that
should be used, and the cost. This information is intended for an expert and
hence is in a separate dialog to avoid cluttering the link profile information
window and confusing users. The first check box should be ticked by the
user if the link has no obstructions such as trees or buildings that could block
line-of-sight. This is the user input required to transition from the user input
required state (Figure 6.17) to the successful state (Figure 6.15) and requires
local knowledge to ensure that line-of-sight exists. The other check box allows117
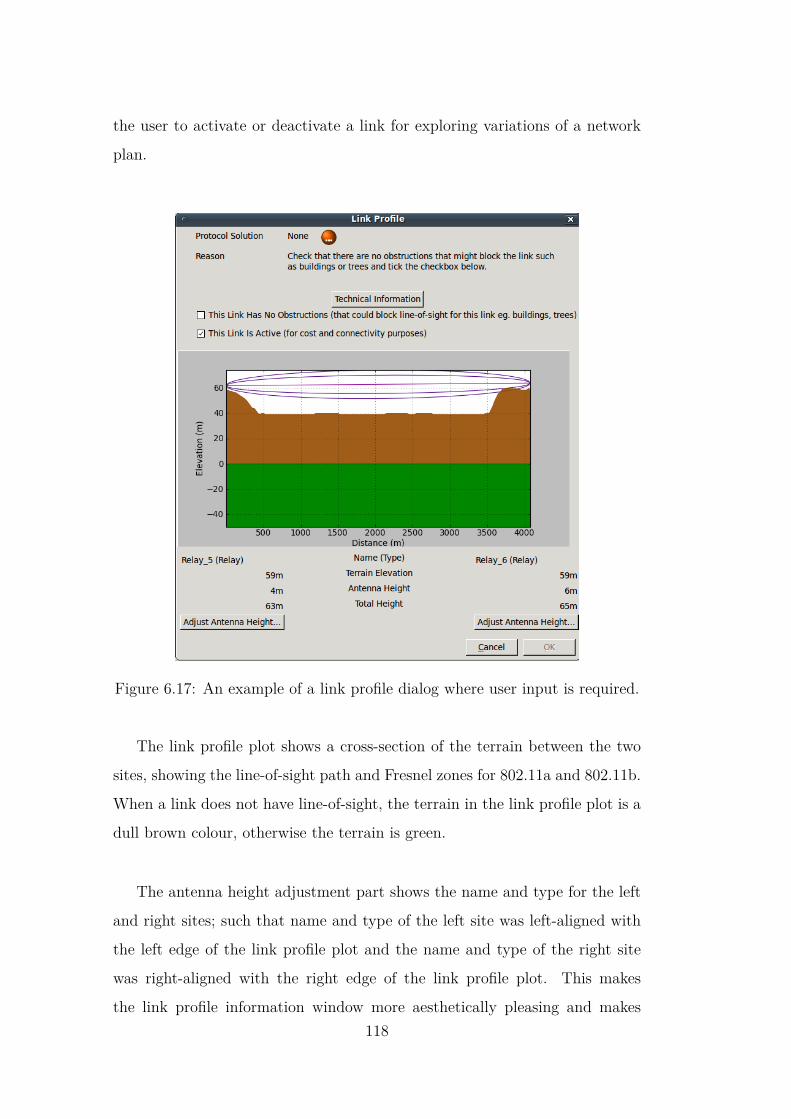
the user to activate or deactivate a link for exploring variations of a network
plan.
Figure 6.17: An example of a link profile dialog where user input is required.
The link profile plot shows a cross-section of the terrain between the two
sites, showing the line-of-sight path and Fresnel zones for 802.11a and 802.11b.
When a link does not have line-of-sight, the terrain in the link profile plot is a
dull brown colour, otherwise the terrain is green.
The antenna height adjustment part shows the name and type for the left
and right sites; such that name and type of the left site was left-aligned with
the left edge of the link profile plot and the name and type of the right site
was right-aligned with the right edge of the link profile plot. This makes
the link profile information window more aesthetically pleasing and makes118

the association of the antenna information to the link profile plot easier to
understand for the user. The terrain elevation and antenna height is shown
for each site. The total antenna height is shown for each site so that the
user could associate the total antenna height with the elevation read from
the link profile plot; the total antenna height being the sum of the terrain
elevation and the antenna height above ground. Each site has an associated
button for adjusting the antenna height for that site. Clicking the button will
show a dialog that allows the antenna height to be adjusted. Applying this
antenna height adjustment will recompute line-of-sight for the link and the
entire link profile information window will be updated to reflect the changes.
For example, the height adjustment may transition the link from the failed
state (Figure 6.16) to the user input required state (Figure 6.17).
119
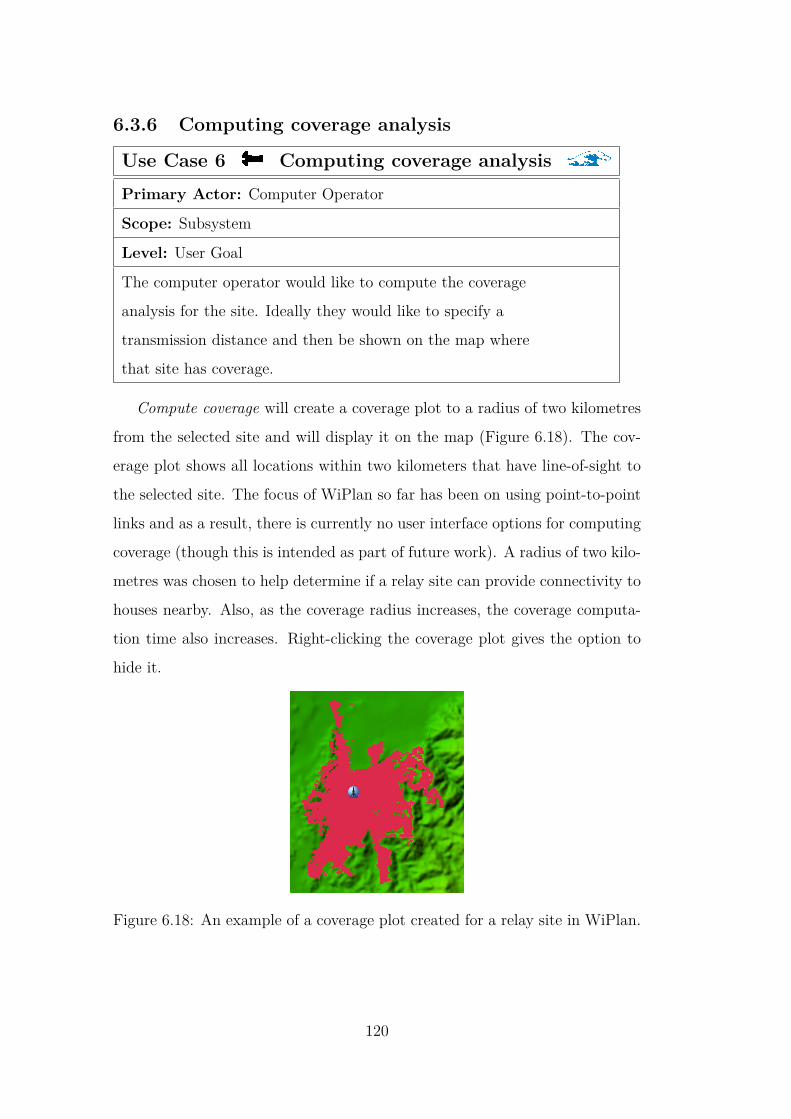
6.3.6 Computing coverage analysis
Use Case 6 Computing coverage analysisPrimary Actor: Computer Operator
Scope: Subsystem
Level: User Goal
The computer operator would like to compute the coverage
analysis for the site. Ideally they would like to specify a
transmission distance and then be shown on the map where
that site has coverage.
Compute coverage will create a coverage plot to a radius of two kilometres
from the selected site and will display it on the map (Figure 6.18). The cov-
erage plot shows all locations within two kilometers that have line-of-sight to
the selected site. The focus of WiPlan so far has been on using point-to-point
links and as a result, there is currently no user interface options for computing
coverage (though this is intended as part of future work). A radius of two kilo-
metres was chosen to help determine if a relay site can provide connectivity to
houses nearby. Also, as the coverage radius increases, the coverage computa-
tion time also increases. Right-clicking the coverage plot gives the option to
hide it.
Figure 6.18: An example of a coverage plot created for a relay site in WiPlan.
120

6.4 Evaluation of WiPlan features
WiPlan has implemented many of the features discussed in Chapter 3. This
section evaluates WiPlan based on the same set of features that the existing
tools in Chapter 3 were evaluated against. These features include incorpo-
rating local knowledge, supporting the user during the planning process and
supporting features that allow the user to carry out the tasks and actions
introduced in Chapter 2.
6.4.1 Local knowledge and user support
WiPlan provides local knowledge and user support in several ways. The site
properties information windows for house and source sites provide a notes text
field for providing ownership details and other relevant information. Users are
encouraged to think about placement issues such as whether they have permis-
sion to build a site at that location by a check box for confirming permission
as well as a notes text field for additional notes in the site properties informa-
tion window. They are also encouraged to think about how that site might
be accessed by a drop-down list for selecting the dominant form of transport
for accessing that site as well as a notes text field for additional notes in the
site properties information window. The ability to select the power source
enables users to use their knowledge of mains power supply in the area. The
line-of-sight confirmation dialog asks that users consider whether there are any
potential obstructions to line-of-sight such as trees and buildings using local
knowledge.
The tutorial and guide also encourage the users to think about local knowl-
edge as well as supporting the users through the wireless network planning
process. The tutorial introduces them to the main features of WiPlan and
some network planning tricks. The guide then provides support for what to
do next when the users get stuck in the wireless network planning process.121
6.4.2 Algorithmic planning support
Algorithmic planning support was not included in the current prototype of
WiPlan. WiPlan currently supports the core functionality for rural wireless
network planning - algorithmic planning support is not fundamental for rural
wireless network planning. Algorithmic does however assist in the planning
process and is therefore considered as part of future work for WiPlan .
Antenna height optimisation is used to determine the antenna heights at
both ends of a link to ensure line-of-sight. This functionality is implemented
within WiPlan but is not part of the interface as yet.
Access point layout optimisation determines the best locations for access
points based on a set of demand locations. Though the WiPlan interface does
not currently support access point layout optimisation, the area profile tool
used for determining coverage in WiPlan (discussed in Section 5.2) can identify
optimal access point locations based on demand locations.
Automatic frequency planning optimally assigns radio channels for all links
in a network such that any interference is minimised. Automatic power control
is used to optimally assign power levels to each transmitter to reduce inter-
ference while maximising signal quality. WiPlan implements automatic power
control by automatically determining the necessary equipment required for a
link to function.
122

6.4.3 Computer assistance
WiPlan provides several methods of geographic support and analysis support
for wireless network planning.
6.4.3.1 Geographic support
WiPlan supports three map types including: a terrain map that shows ele-
vation changes, peaks and ridge lines; a topographic map that shows roads,
houses, contours and other information; and satellite imagery where available.
WiPlan uses a terrain database as a source for obtaining elevation data, such
as for site elevations and when computing line-of-sight for a link. The map area
of WiPlan shows a compass rose for orientation and a scale for determining
the size of map features. WiPlan provides three modes for map navigation:
pointer mode for interacting with the map area, sites and links; zooming mode
for zooming in and out of the map area; and panning mode which allows the
map area to panned.
6.4.3.2 Analysis support
The main analysis assistance supported by WiPlan is link profile analysis and
coverage analysis as these are fundamental to wireless network planning. The
link profile analysis presents a link profile plot and information explaining
whether the link is line-of-sight. The coverage analysis computes a coverage
plot for a two kilometre distance around the site in question. Reliability anal-
ysis is provided on a per link basis by satisfying the link budget (discussed in
Appendix G.7) when a link is established. WiPlan does not consider traffic
types but configures links to use the highest bit rate that the selected protocol
is capable of. WiPlan analyses links based on the highest bit rate available
for each protocol and ensures reliability however WiPlan does not yet allow
selection of lower bit rates. WiPlan does not provide support for interference,
capacity or global reliability analysis. These analysis methods may however
be added in the future.123

6.4.4 Wireless network planning action support
WiPlan supports the five main actions necessary for wireless network plan-
ning. These actions are the creation of a site (A1), naming of a site (A2),
setting/adjusting antenna heights (A3), conducting a point-to-point analysis
(A4) and conducting a point-to-multipoint analysis (A5).
Creating a site (A1) A site can be created in WiPlan using either the
site adder tool or manually by right-clicking on the map to show a pop-up
menu. This menu shows two options: Create site here and Explore local area.
Selecting Create site here then shows a list of the types of sites that can be
created: a source, relay or house site.
Naming a site (A2) A site can be given a name in WiPlan by right-clicking
the site to show the pop-up menu with four options: Site properties, Create
link, Compute coverage and Remove site. By selecting Site properties, the site
properties information window will be displayed for the site. The name for the
site can then be entered in the name text field. Clicking OK will save the new
name for the site.
Selecting heights (A3) WiPlan provides two methods for selecting heights:
using the site properties information window or the link profile information
window (discussed in the Point-to-point analysis section). The site properties
information window can be accessed as for naming a site and the height for
the antenna can be selected from the drop-down menu. It is also possible to
enter a custom height.
Point-to-point analysis (A4) Point-to-point analysis is conducted when
a non line-of-sight link is created or when a link is right-clicked and Link
profile selected. The link profile information window is displayed showing a
link profile plot and information regarding line-of-sight and antenna details.
Either antenna height can be adjusted by clicking Adjust antenna height for
the appropriate antenna and entering the new height.124
Point-to-multipoint analysis (A5) Point-to-multipoint analysis is con-
ducted when the menu for a site is accessed and Create coverage is selected. A
coverage plot is created with a range of two kilometres that is then displayed
on the map.
6.5 Chapter summary
In this chapter, the design process for developing WiPlan has been discussed.
The design requirements for the WiPlan interface were identified as were the
stakeholders and actors involved in the wireless network planning process.
Five personas based on characteristics of typical rural people were introduced.
The chapter then discussed the interface design and associated features of
WiPlan in detail. The chapter concluded with a feature evaluation of WiPlan,
subjecting WiPlan to the same evaluation method that the existing tools in
Chapter 3 were subjected to. This evaluation showed that WiPlan supports
the majority of features identified for general wireless network planning and
all of the features deemed necessary for rural wireless network planning.
125


Chapter 7
Implementation
This chapter discusses the implementation details of WiPlan including the in-
ternal architecture of WiPlan and the libraries that were used. WiPlan was
developed over a period of five years. The first two years were spent under-
standing the subject area and its multi-disciplinary nature, while also devel-
oping the link profile and area profile tools (discussed in Section 5.2). Another
two years were spent on the interface design and implementation, with the
final year consisting of the WiPlan evaluation and thesis write-up.
Existing tools made it difficult for algorithm reuse as most of the tools were
closed source and those that were open-source were not well documented at
the time of investigation. Therefore, aside from the functionality provided by
software libraries, and the Irregular Terrain Model [83] mentioned in Chapter 5,
all implementation is work of the author.
7.1 Development environment andWiPlan ar-
chitecture
WiPlan was developed on the Ubuntu operating system for its ease of use
for software development. Ubuntu is based on the Debian GNU/Linux distri-
bution and distributed as free and open source software. The programming
languages and associated libraries used in development of WiPlan are cross-127
platform, so WiPlan could potentially be compiled to run on operating systems
other than Ubuntu, such as Microsoft Windows.
WiPlan was predominantly developed using the Python programming lan-
guage [17]. Python is a powerful dynamic language that is fully modular and
supports and extensive set of standard libraries. Python is available for all
major operating systems and has an open source software license.
Three main software libraries (wxPython, GDAL and pubsub) were used to
achieve the functionality in WiPlan. The wxPython library is a cross-platform
GUI toolkit for Python that allows programmers to create robust graphical
user interfaces [26]. The FloatCanvas [47] widget was perhaps the greatest
contribution of wxPython to WiPlan. The FloatCanvas forms the map of the
main interface in WiPlan. FloatCanvas provides a drawable canvas with a
user-defined coordinate system. FloatCanvas supports mouse and keyboard
events which can be bound to items drawn on the canvas.
GDAL [7] is a translator library for reading and writing raster geospatial
data formats, such as digital elevation model. GDAL also comes with a va-
riety of useful command-line utilities for data translation and processing. An
example of using the GDAL library in WiPlan is for showing the elevation at
the mouse cursor. Every time the user moves the mouse, wxPython fires a
mouse move event. The method bound to this event uses the coordinates of
the mouse cursor to read the elevation from a digital elevation model using
the GDAL library.
As the software grew more complex, it became clear that a suitable software
pattern needed to be followed. WiPlan employs the Model-View-Controller
(MVC) pattern [110] [122] as it manages the complexity of WiPlan while iso-
lating the domain logic from the graphical user interface.
128

The pubsub library framework is used to pass messages around WiPlan.
With pubsub, the programmer designates publishers and subscribers of mes-
sages. Publishers and subscribers do not communicate directly; each message
published has a topic and will be received by any subscriber to that topic. For
example, if wxPython registers a mouse click event on the map, that mouse
click event could be associated with a Python method that publishes a message
with a specific topic.
This would be regarded as occurring in the view part of the MVC pattern
and the pubsub framework acts as the controller in this case. An appropriate
method in the model part of the MVC pattern could then be subscribed to
that specific topic and as such, that method would be called. The pubsub
framework is mainly used for dealing with GUI events.
The model-view-controller (MVC) pattern was first proposed by Trygve
Reenskaug at Xerox PARC in 1978 [110]. The MVC pattern provides a soft-
ware architecture that isolates the domain-specific model from the graphical
user interface (view) via one or more controllers. The controller listens to
events associated with the view, such as a mouse click, and invokes the asso-
ciated action in the model.
The model may then inform the controller that it has been updated and
therefore the controller may inform the view to update. For example, when the
user wants to look at the site properties for a particular site, the view creates
a mouse click event that is then received by the controller. The controller then
obtains the site specific information from the model instance for that site, and
finally informs the view to show the site properties information window with
that specific information.
The implementation of the model-view-controller (MVC) pattern in Wi-
Plan involves a main controller with seven sub-controllers that are responsible129

for providing communication between four major models and the view. Fig-
ure 7.1 shows the relationship between the models, controllers and view. In
some cases, predominantly GUI events, it was necessary to make use of the
pubsub message passing framework.
Figure 7.1: Model-view controller architecture of WiPlan showing lines of com-munication.
The main controller is responsible for the creation of the other controllers
and for the common tasks of loading, saving or exporting a plan. The main
controller creates seven sub-controllers which are: the elevation controller,
external applications controller, hardware controller, WGS84 controller, site
controller, link controller and coverage controller. Table 7.1 summarises the
main controller class.
The elevation controller deals with elevation requests from the user interface
and passes them on to the elevation model. The elevation model can then read
the elevation from a digital elevation model and return it to the elevation
controller. Table 7.2 and Table 7.3 show the elevation controller and the
elevation model classes respectively.130
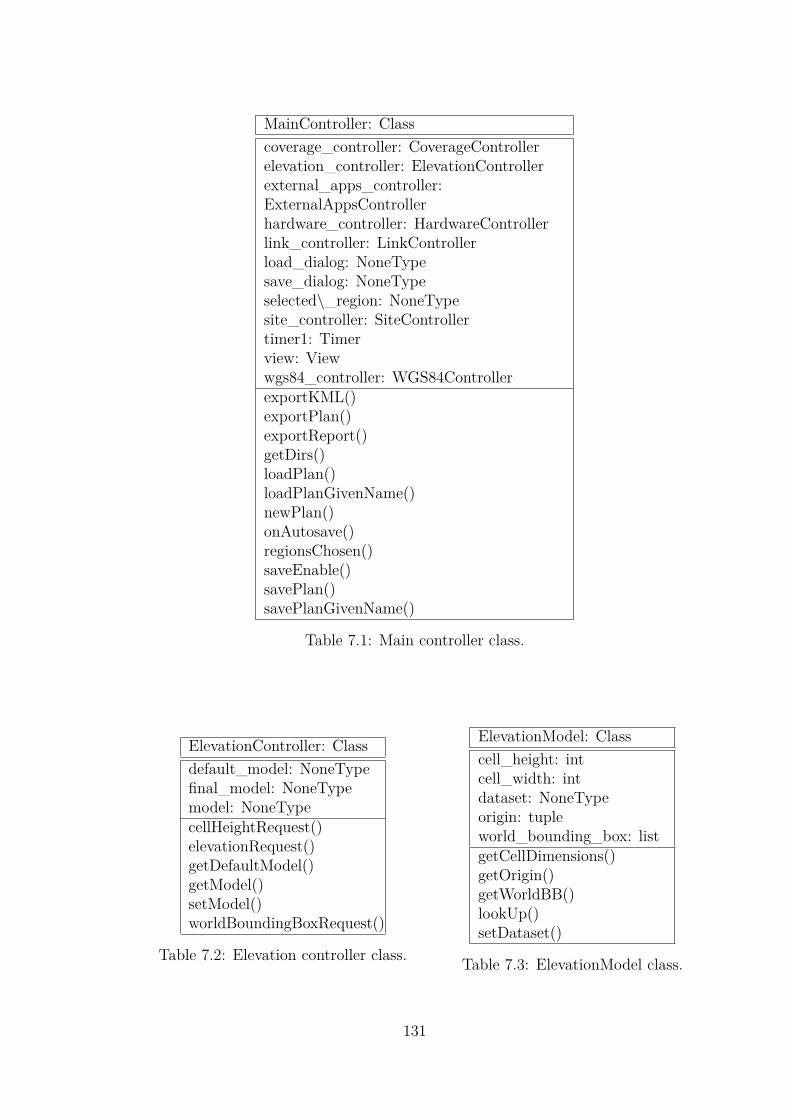
MainController: Classcoverage_controller: CoverageControllerelevation_controller: ElevationControllerexternal_apps_controller:ExternalAppsControllerhardware_controller: HardwareControllerlink_controller: LinkControllerload_dialog: NoneTypesave_dialog: NoneTypeselected\_region: NoneTypesite_controller: SiteControllertimer1: Timerview: Viewwgs84_controller: WGS84ControllerexportKML()exportPlan()exportReport()getDirs()loadPlan()loadPlanGivenName()newPlan()onAutosave()regionsChosen()saveEnable()savePlan()savePlanGivenName()
Table 7.1: Main controller class.
ElevationController: Classdefault_model: NoneTypefinal_model: NoneTypemodel: NoneTypecellHeightRequest()elevationRequest()getDefaultModel()getModel()setModel()worldBoundingBoxRequest()
Table 7.2: Elevation controller class.
ElevationModel: Classcell_height: intcell_width: intdataset: NoneTypeorigin: tupleworld_bounding_box: listgetCellDimensions()getOrigin()getWorldBB()lookUp()setDataset()
Table 7.3: ElevationModel class.
131
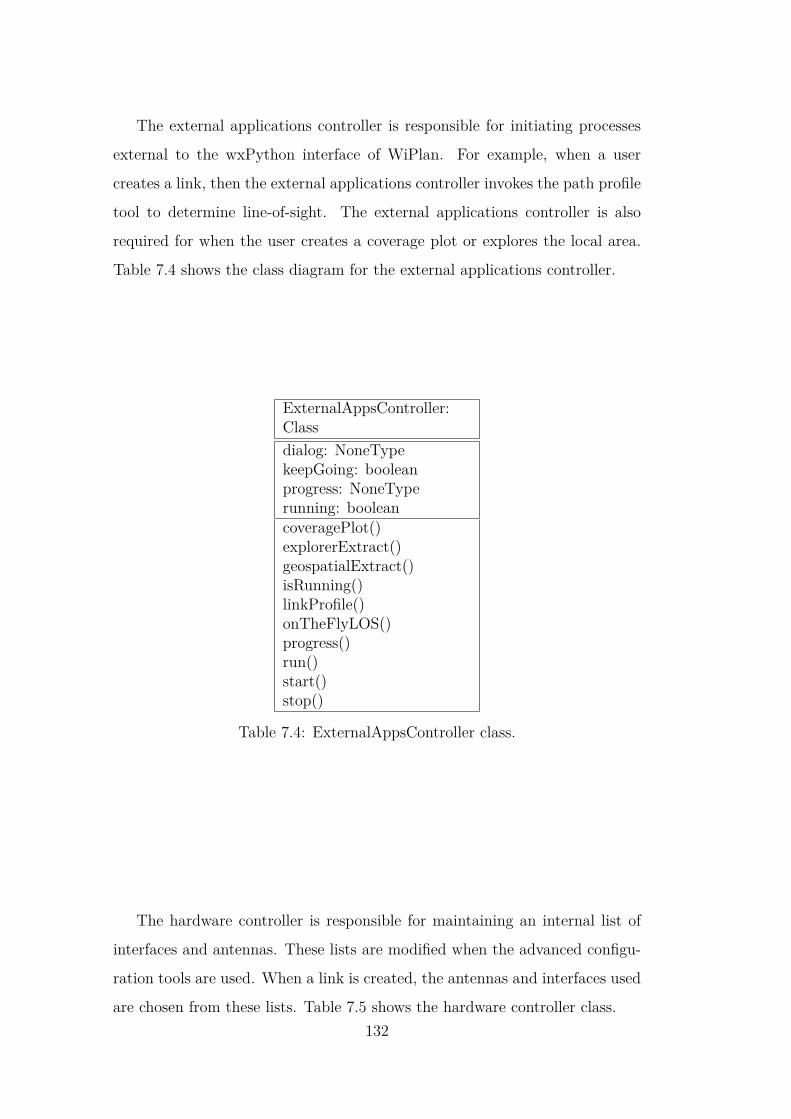
The external applications controller is responsible for initiating processes
external to the wxPython interface of WiPlan. For example, when a user
creates a link, then the external applications controller invokes the path profile
tool to determine line-of-sight. The external applications controller is also
required for when the user creates a coverage plot or explores the local area.
Table 7.4 shows the class diagram for the external applications controller.
ExternalAppsController:Classdialog: NoneTypekeepGoing: booleanprogress: NoneTyperunning: booleancoveragePlot()explorerExtract()geospatialExtract()isRunning()linkProfile()onTheFlyLOS()progress()run()start()stop()
Table 7.4: ExternalAppsController class.
The hardware controller is responsible for maintaining an internal list of
interfaces and antennas. These lists are modified when the advanced configu-
ration tools are used. When a link is created, the antennas and interfaces used
are chosen from these lists. Table 7.5 shows the hardware controller class.132
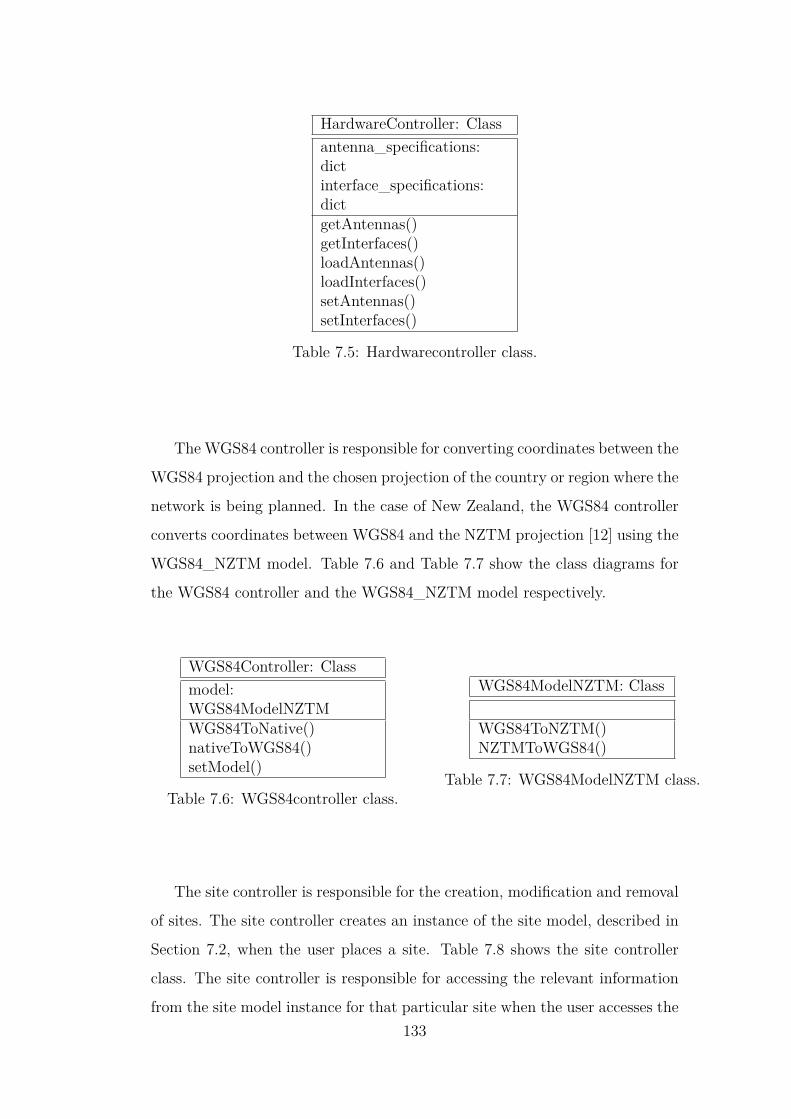
HardwareController: Classantenna_specifications:dictinterface_specifications:dictgetAntennas()getInterfaces()loadAntennas()loadInterfaces()setAntennas()setInterfaces()
Table 7.5: Hardwarecontroller class.
The WGS84 controller is responsible for converting coordinates between the
WGS84 projection and the chosen projection of the country or region where the
network is being planned. In the case of New Zealand, the WGS84 controller
converts coordinates between WGS84 and the NZTM projection [12] using the
WGS84_NZTM model. Table 7.6 and Table 7.7 show the class diagrams for
the WGS84 controller and the WGS84_NZTM model respectively.
WGS84Controller: Classmodel:WGS84ModelNZTMWGS84ToNative()nativeToWGS84()setModel()
Table 7.6: WGS84controller class.
WGS84ModelNZTM: Class
WGS84ToNZTM()NZTMToWGS84()
Table 7.7: WGS84ModelNZTM class.
The site controller is responsible for the creation, modification and removal
of sites. The site controller creates an instance of the site model, described in
Section 7.2, when the user places a site. Table 7.8 shows the site controller
class. The site controller is responsible for accessing the relevant information
from the site model instance for that particular site when the user accesses the133
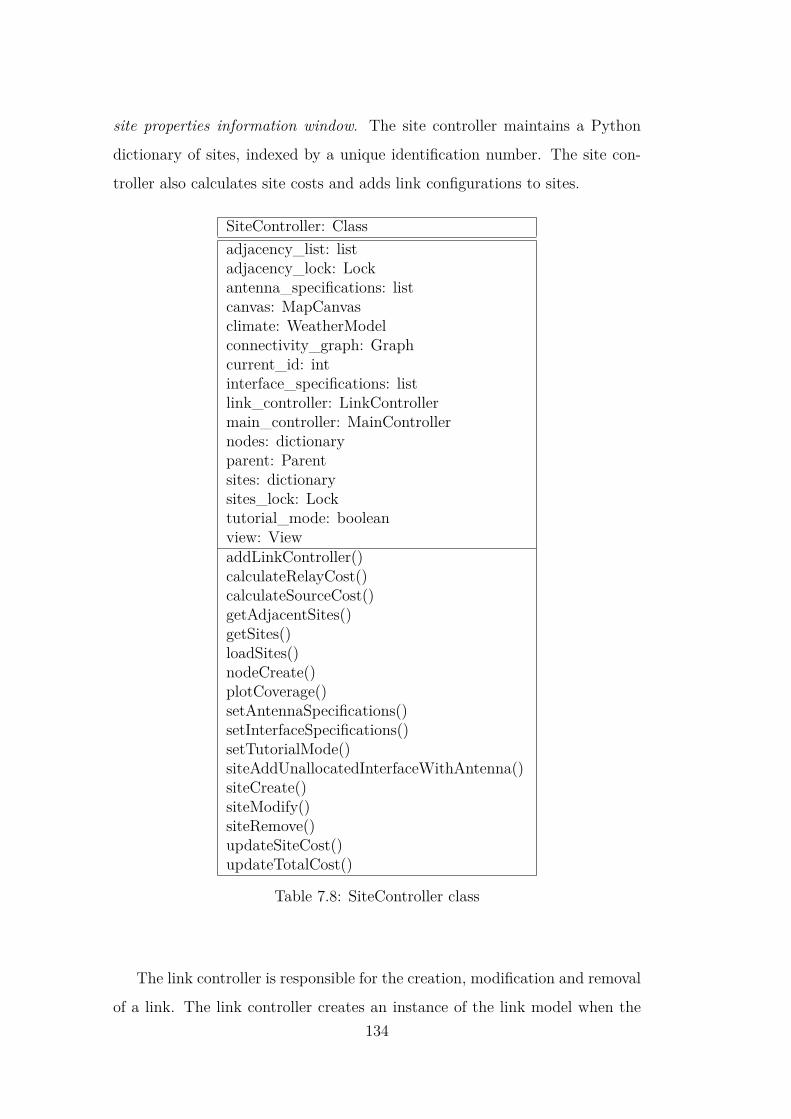
site properties information window. The site controller maintains a Python
dictionary of sites, indexed by a unique identification number. The site con-
troller also calculates site costs and adds link configurations to sites.
SiteController: Classadjacency_list: listadjacency_lock: Lockantenna_specifications: listcanvas: MapCanvasclimate: WeatherModelconnectivity_graph: Graphcurrent_id: intinterface_specifications: listlink_controller: LinkControllermain_controller: MainControllernodes: dictionaryparent: Parentsites: dictionarysites_lock: Locktutorial_mode: booleanview: ViewaddLinkController()calculateRelayCost()calculateSourceCost()getAdjacentSites()getSites()loadSites()nodeCreate()plotCoverage()setAntennaSpecifications()setInterfaceSpecifications()setTutorialMode()siteAddUnallocatedInterfaceWithAntenna()siteCreate()siteModify()siteRemove()updateSiteCost()updateTotalCost()
Table 7.8: SiteController class
The link controller is responsible for the creation, modification and removal
of a link. The link controller creates an instance of the link model when the134
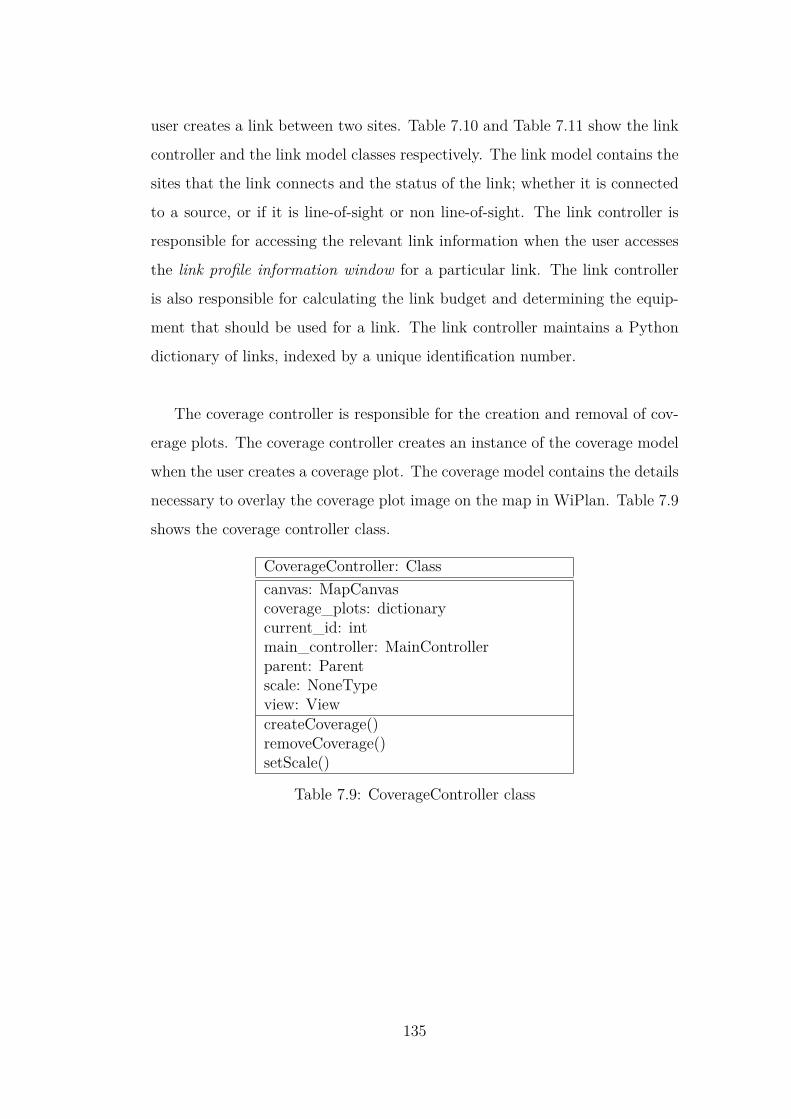
user creates a link between two sites. Table 7.10 and Table 7.11 show the link
controller and the link model classes respectively. The link model contains the
sites that the link connects and the status of the link; whether it is connected
to a source, or if it is line-of-sight or non line-of-sight. The link controller is
responsible for accessing the relevant link information when the user accesses
the link profile information window for a particular link. The link controller
is also responsible for calculating the link budget and determining the equip-
ment that should be used for a link. The link controller maintains a Python
dictionary of links, indexed by a unique identification number.
The coverage controller is responsible for the creation and removal of cov-
erage plots. The coverage controller creates an instance of the coverage model
when the user creates a coverage plot. The coverage model contains the details
necessary to overlay the coverage plot image on the map in WiPlan. Table 7.9
shows the coverage controller class.
CoverageController: Classcanvas: MapCanvascoverage_plots: dictionarycurrent_id: intmain_controller: MainControllerparent: Parentscale: NoneTypeview: ViewcreateCoverage()removeCoverage()setScale()
Table 7.9: CoverageController class
135

LinkController: Classcanvas: MapCanvasconnections: dictionaryconnectivity_dialog: NoneTypecurrent_id: intcurrently_selected_link:LinkModellink_line_temp: NoneTypelinks: dictionarylos_ready: intmain_controller: MainControllerprofile_list: dictionarysite_controller: SiteControllerstart_id: inttutorial_mode: booleanview: ViewcalculateOrientation()calculateTilt()check80211a()check80211b()checkHouse()connectionCreate()drawTempLink()findHouseAntennaSpec()findHouseInterfaceSpec()linkBudget()linkEnd()linkLOS()linkProfile()linkProfileReadData()linkRemove()linkStart()linkSuccess()linkUpdate()loadLinks()recommendHardware()setLinkModel()setMode()setPoleHeight()showProfile()
Table 7.10: LinkController class.
LinkModel: Classchannel: intclutter_los: booleandistance: intfrequency: intid: intsites: liststate: intcomputeDistance()getClutterLoss()getID()getSites()getState()setClutterLoss()setID()setState()
Table 7.11: LinkModel class.
136
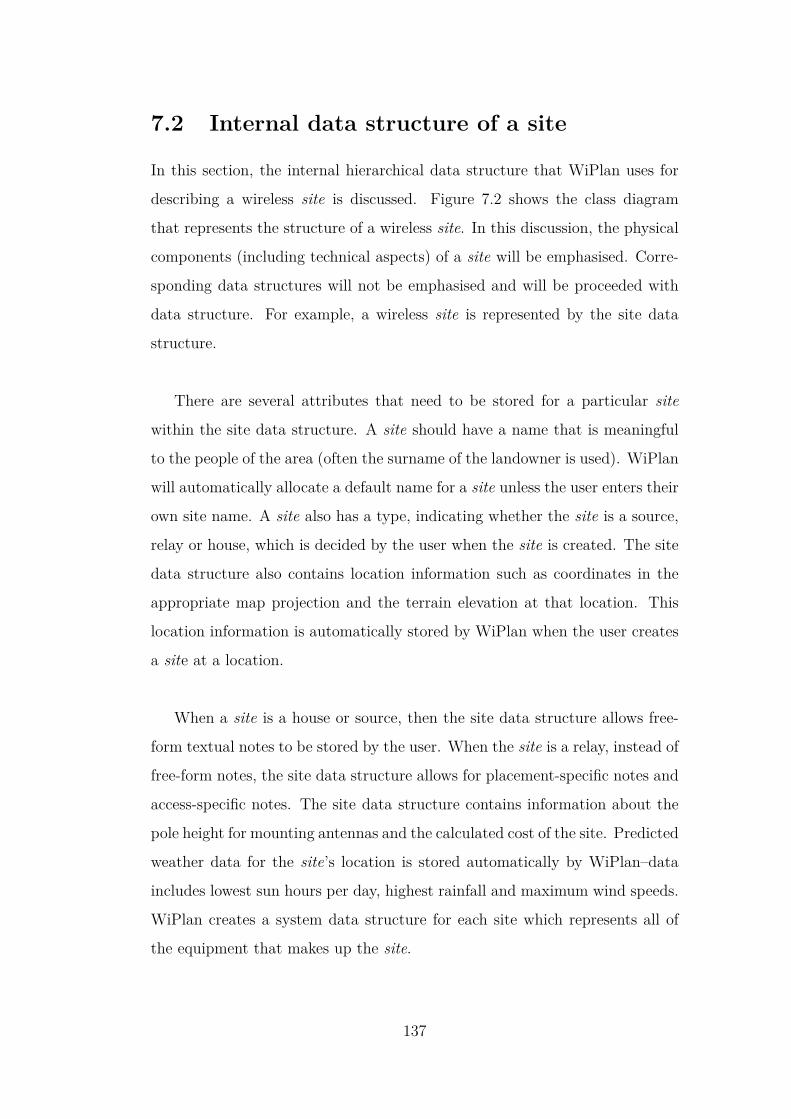
7.2 Internal data structure of a site
In this section, the internal hierarchical data structure that WiPlan uses for
describing a wireless site is discussed. Figure 7.2 shows the class diagram
that represents the structure of a wireless site. In this discussion, the physical
components (including technical aspects) of a site will be emphasised. Corre-
sponding data structures will not be emphasised and will be proceeded with
data structure. For example, a wireless site is represented by the site data
structure.
There are several attributes that need to be stored for a particular site
within the site data structure. A site should have a name that is meaningful
to the people of the area (often the surname of the landowner is used). WiPlan
will automatically allocate a default name for a site unless the user enters their
own site name. A site also has a type, indicating whether the site is a source,
relay or house, which is decided by the user when the site is created. The site
data structure also contains location information such as coordinates in the
appropriate map projection and the terrain elevation at that location. This
location information is automatically stored by WiPlan when the user creates
a site at a location.
When a site is a house or source, then the site data structure allows free-
form textual notes to be stored by the user. When the site is a relay, instead of
free-form notes, the site data structure allows for placement-specific notes and
access-specific notes. The site data structure contains information about the
pole height for mounting antennas and the calculated cost of the site. Predicted
weather data for the site’s location is stored automatically by WiPlan–data
includes lowest sun hours per day, highest rainfall and maximum wind speeds.
WiPlan creates a system data structure for each site which represents all of
the equipment that makes up the site.
137

The system data structure contains a list of all the host data structures that
represent the hosts in the site. The system data structure also contains details
of the type of power source and whether a switch is used. WiPlan will deter-
mine whether a switch is necessary and which host types are required. The
user is responsible for specifying the type of power source available i.e. mains
power. A host is a small, generally low-power computer such as a Soekris [19].
WiPlan contains a list of host types that should be pre-loaded by the dis-
tributing ISP. Additionally, the user can add host types to this list. The host
data structure has name, type and asset tag attributes, as well as an attribute
for whether a solar controller is used by the site. The host data structure is
responsible for the list of interface types that the host has - for most devices
this is one or two, though there are devices that can have more.
An interface is the radio card that fits inside the host. The interface data
structure has a name and asset tag, as well as a reference to an interface
specification data structure. The interface data structure represents the ac-
tual instance of the interface whereas the interface specification data structure
contains all the general details about the interface such as price. The interface
data structure contains details such as protocol, transmit and receive losses
particular to the type of interface and antenna. The distributing ISP is re-
sponsible for pre-loading WiPlan with a list of interface specifications. Again,
the user has the ability to add specifications using the advanced interface con-
figuration tool. The interface specification data structure contains details such
as the type of the interface, the price, the size and the form factor, such as
mini-PCI. The interface specification data structure contains a list of protocol
types supported by that interface.
The protocol data structure has a name that represents the actual protocol,
such as 802.11a, and has lists of supported bit rates and supported channels.
The bit rate data structure contains a 3-tuple of information detailing the bit
rate itself, as well as the associated transmit power and receive sensitivity. The138
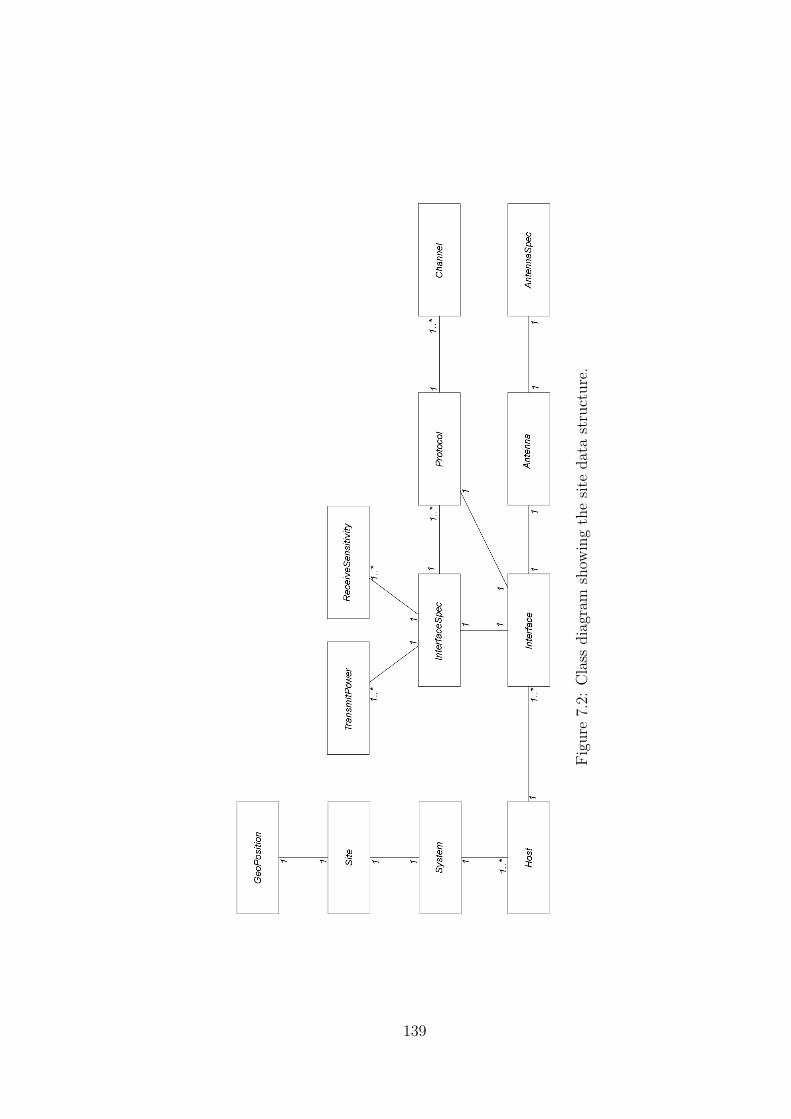
Figu
re7.2:
Class
diagram
show
ingthesit
eda
tastructure.
139
channel data structure contains the channel identification number, the centre
frequency of the channel and the width of the channel. Protocol, bit rate and
channel information are all provided as part of the interface specification.
As with the interface, an antenna also has a data structure representing the
antenna instance and a data structure representing the antenna specification.
As with host and interface specifications, the distributing ISP is responsible for
pre-loading WiPlan with a list of antenna specifications; the user can modify
and add antenna specifications using the advanced antenna configuration tool.
The antenna data structure has an asset tag and a reference to the antenna
specification data structure. It also has details about the height of the an-
tenna up the pole, the orientation of the antenna and the tilt of the antenna.
The antenna specification data structure contains details about the type of
antenna including the name of the antenna and type of the antenna, such as
parabolic. The specification stores the gain of the antenna, the azimuth or an-
gle of direction in the horizontal plane and the elevation or angle of direction
in the vertical plane. Finally, the antenna specification data structure stores
the frequency range supported by the antenna and the antenna price.
7.3 Chapter summary
This chapter discussed the libraries that WiPlan used and described the inter-
nal architecture, including how a site is represented, of WiPlan.
140

Chapter 8
Expert evaluation
The WiPlan user interface was evaluated using two approaches: expert evalu-
ation and user testing. This chapter describes the expert evaluations that took
place and the findings of those evaluations. Expert reviews were conducted to
evaluate usability and functionality before evolving to user testing. This in-
cluded two usability expert reviews and one wireless network planning expert
review.
A heuristic evaluation is a method for finding usability problems in a user
interface design where a small set of evaluators examine the interface and judge
the compliance of the interface with recognised usability principals, or heuris-
tics [102]. Heuristic evaluation is described as a one of the “discount” usability
engineering methods and is suitable for use early in the usability engineering
life cycle to identify usability problems in the user interface [103]. Heuristic
evaluation was chosen due to being inexpensive relative to other evaluation
methods [104] and having a faster turn-around time than user testing [90].
An expert evaluation is a heuristic evaluation where the evaluators are
deemed experts in their field. Different evaluators find different problems and
so multiple evaluation results can be aggregated to give a substantial set of
usability problems. Research shows that expert evaluation finds more minor
problems than other methods such as user testing [84]. Minor problems are141

often not seen in user testing, though still have a negative impact on usabil-
ity [102]. Evaluators pay more attention to identifying major usability prob-
lems while not neglecting minor problems when evaluating an interface [102].
Expert evaluators were used to quickly identify these usability problems so
they could be addressed before progressing to user testing.
Nielsen categorises evaluators in to three groups: novice evaluators with no
usability expertise, regular usability experts, and double usability experts who
also had experience with the particular type of interface being evaluated [102].
Nielsen explains that regular experts would identify more usability issues than
novice evaluators and double experts would identify the most issues; he notes,
however, that double experts are hard to come by [102]. Molich et al. warns
against conducting heuristic evaluation with end users as evaluators, as end
users do not have sufficient knowledge and understanding of usability princi-
pals [100].
The results of two types of expert evaluation are presented in this chapter.
The first is a conventional usability heuristic evaluation where two indepen-
dent HCI experts examinedWiPlan according to recognised usability heuris-
tics such as those described by Nielsen [101]. Two usability expert reviews were
conducted by regular HCI experts for this research. The second type of expert
evaluation presented here involved a wireless network planning expert
examining WiPlan according to their expectations of functionality. According
to Nielsen, the wireless network planning expert would be a novice evaluator
with respect to usability. This, along with the two conventional evaluations,
totals three independent usability evaluations which meets the number recom-
mended by Nielsen for identifying usability problems [104].
142

8.1 Usability heuristics
Nielsen’s heuristics [101] are probably the most popular usability heuristics for
user interface design and are used to justify the usability problems identified
and presented in Section 8.2. A summary of Nielsen’s heuristics are as follows:
Heuristic 1 - Visibility of system status The interface should always
keep users informed about what is going on, through appropriate feedback
within reasonable time.
Heuristic 2 - Match between system and the real world The interface
should use words, phrases and concepts familiar to the user, rather than tech-
nical terms. The interface should present information in a natural and logical
order.
Heuristic 3 - User control and freedom Users should feel in control and
that every function should have an “emergency exit”.
Heuristic 4 - Consistency and standards The interface should follow
platform conventions and that users should not have to wonder whether dif-
ferent words, situations, or actions mean the same thing.
Heuristic 5 - Error prevention Users should be presented with a con-
firmation option before committing to an action and careful design should
prevent problems from occurring.
Heuristic 6 - Recognition rather than recall The user’s memory load
should be minimised by making objects, actions, and options visible. The
user should not have to remember information from one part of the dialog
to another and instructions for use of the system should be visible or easily
retrievable whenever appropriate.143

Heuristic 7 - Flexibility and efficiency of use Accelerators, such as
special dialogs, may be used that may speed up the interaction for the expert
user such that the system can cater to both inexperienced and experienced
users.
Heuristic 8 - Aesthetic and minimalist design Dialogs should not con-
tain information which is irrelevant or rarely needed. Every extra unit of
information in a dialog competes with the relevant units of information and
diminishes their relative visibility.
Heuristic 9 - Help users recognize, diagnose, and recover from errors
Error messages should be expressed in plain language (no codes), precisely
indicate the problem, and constructively suggest a solution.
Heuristic 10 - Help and documentation Help and documentation should
be focused on the task and should be easy to use.
8.2 HCI expert reviews
The expert reviews were conducted by two independent academic experts in
the field of HCI to identify any problems associated with the design of the
WiPlan user interface. These experts were not involved in the development
or design of WiPlan, and did not have any previous experience with WiPlan
prior to the expert reviews. The researcher was present at both expert reviews
and the same process was followed for both evaluations. The process firstly
involved the expert stepping through the WiPlan tutorial and mentioning any
usability issues as they were encountered; these issues were recorded by the
researcher. Once the expert completed the tutorial, they were then asked to
have a second closer look at the main interface, the site properties informa-
tion window and the link profile information window, and to comment on any
further issues. The entire process was audio recorded and the researcher took
manual notes. Both expert review sessions lasted approximately one hour to144
enable the expert to carefully step through the tutorial and discuss any issues
that were encountered.
8.2.1 Expert review one
The first expert reviewer was a Senior Lecturer in HCI in the Computer Sci-
ence department at The University of Waikato. The expert review took place
in the expert’s office using the laptop that WiPlan was developed on. The
researcher recorded audio and made manual notes as the expert conducted
the review. Most of the changes made to address the issues identified by the
expert involved minor alterations unless otherwise mentioned in the following
discussion.
A small number of similar problems were found relating specifically to the
tutorial. There were some inconsistencies between the text shown in the tu-
torial and text else where in the interface, such as labels and buttons. These
inconsistencies match heuristics 2, 4 and 10. The role of the tutorial is to
provide help and documentation while presenting words, phrases and concepts
familiar to the user. The user should not have to wonder whether different
words mean the same thing. The inconsistencies were identified and fixed.
The expert identified a problem affecting heuristics 1 and 4. The problem
was that when the user ticked the “This link has no obstructions” check box
in the link profile information window (area B, Figure 8.2), a computation in
the order of seconds would take place before the tick showed in the check box.
This was fixed to provide instant feedback that the check box had been ticked
while following check box conventions.
Several inconsistencies and standard violations in the interface as a whole
were identified (heuristic 4). The expert identified that the name of the link
profile information window and the link profile plot were inconsistent, which145

has since been fixed. He found that the antenna buttons in the link profile
information window were originally labeled as “Raise antenna height” (ar-
eas C & D, Figure 8.2) but in some cases, the user may wish to lower the
antenna height. Therefore, the button labels were changed to “Adjust an-
tenna height”. He also discovered that many of the buttons and menu items
opened dialogs that required further information from the user. He explained
that it was standard practice in user interfaces to place an ellipsis (. . . ) after
the name of the button or menu item to indicate this. The appropriate buttons
and menu items were adjusted to contain an ellipsis suffix.
The expert pointed out that the northing and easting coordinates in both
the status bar and the site dialog lacked units, which were consequently added.
He mooted that the map controls should be similar to those of Google Maps;
this is a possible feature for future work. He also noted that the icons used
for representing sites required more of a professional look. The icons were
modified to have a matching background with different identifying icons in the
foreground which gave the icons a professional look (Figure 8.1). He pointed
out that the items in the menu bar were not standard and should be modified
to match a user interface standard. As WiPlan was developed in Ubuntu, the
menu items were modified to meet the GNOME human interface guidelines
[49].
Figure 8.1: Icons
146

Inconsistencies that could lead to user misunderstanding were identified
(heuristic 5). The expert felt that it was important to highlight that the
weather information in the site dialog (area C of Figure 8.3) was estimated or
predicted weather and not real live data. The wording was changed to prevent
the user misunderstanding that the weather was estimated, such a misunder-
standing could lead to an error of judgment. He also suggested introducing
a cost for antenna height, as a user would not realise the implications that
antenna height might have on the network design without an antenna height
cost being included. An additional fixed cost per metre was added to address
this.
Early in the development history of WiPlan, read-only text fields were used
to display static information in the site properties information window (area B,
Figure 8.3) and the Link profile dialog (areas A, C & D, Figure 8.2). He ex-
plained that the user may believe that these text fields can somehow be edited
and that the user may try to discover how they can edit the text fields. He
advised that these text fields should be changed to labels to avoid causing user
confusion and consequently this advice was followed.
147

Figure 8.2: Link Profile dialog
148
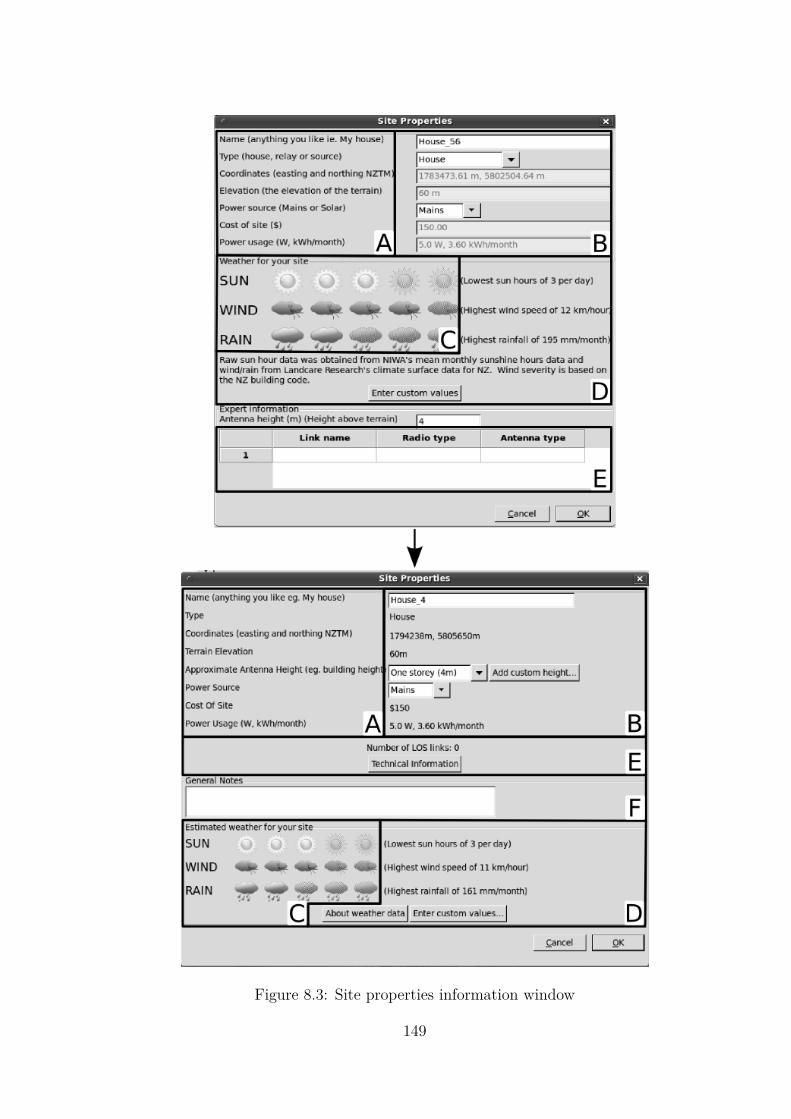
Figure 8.3: Site properties information window
149
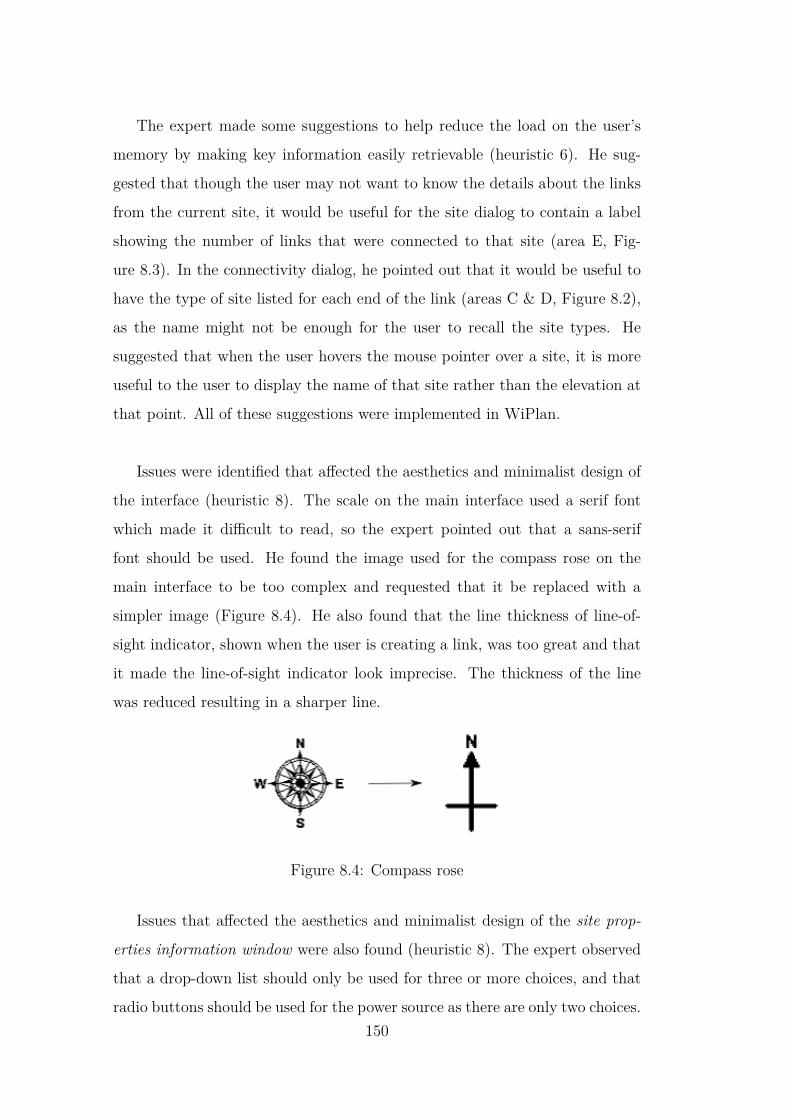
The expert made some suggestions to help reduce the load on the user’s
memory by making key information easily retrievable (heuristic 6). He sug-
gested that though the user may not want to know the details about the links
from the current site, it would be useful for the site dialog to contain a label
showing the number of links that were connected to that site (area E, Fig-
ure 8.3). In the connectivity dialog, he pointed out that it would be useful to
have the type of site listed for each end of the link (areas C & D, Figure 8.2),
as the name might not be enough for the user to recall the site types. He
suggested that when the user hovers the mouse pointer over a site, it is more
useful to the user to display the name of that site rather than the elevation at
that point. All of these suggestions were implemented in WiPlan.
Issues were identified that affected the aesthetics and minimalist design of
the interface (heuristic 8). The scale on the main interface used a serif font
which made it difficult to read, so the expert pointed out that a sans-serif
font should be used. He found the image used for the compass rose on the
main interface to be too complex and requested that it be replaced with a
simpler image (Figure 8.4). He also found that the line thickness of line-of-
sight indicator, shown when the user is creating a link, was too great and that
it made the line-of-sight indicator look imprecise. The thickness of the line
was reduced resulting in a sharper line.
Figure 8.4: Compass rose
Issues that affected the aesthetics and minimalist design of the site prop-
erties information window were also found (heuristic 8). The expert observed
that a drop-down list should only be used for three or more choices, and that
radio buttons should be used for the power source as there are only two choices.150

The drop-down list was retained as there are multiple forms of power sources
and it may be desired that these be added to the list of power sources. For ex-
ample, wind or water power sources may be available. In the second revision of
the site properties information window, extensive explanation text was added
(areas A & D, Figure 8.3). He pointed out that some of the explanation text
was unnecessary and that the site properties information window was becom-
ing cluttered, hence the text identified as being unnecessary was removed. He
suggested that the text and icons in the weather panel were too close together
(areas C & D, Figure 8.3) and that the set custom values dialog for weather
was over-sized. As a result, extra space was inserted between the text and
icons in the weather panel, and the set custom values dialog was re-sized.
The expert also observed some issues that affected the aesthetics and min-
imalist design of the link profile information window (heuristic 8). Most of
these issues related to the layout of the widgets in the link profile information
window. He suggested that the information for the sites on the left and right
(areas C & D, Figure 8.2) should be centre-aligned with their respective y-axis
of the link profile plot. He also suggested that the labels with numeric data
should be right-justified with zero decimal places, and that a total height label
be added so that the user can match the total height to the height shown on
the link profile plot (areas C & D, Figure 8.2). He observed that the dialog
information above the link profile plot was too close to the edge of the dia-
log and that the information should be indented (area A, Figure 8.2). These
recommended changes were implemented in WiPlan and required significant
restructuring of the link profile information window (Figure 8.2).
The final issue that the expert identified affected heuristic 7. In order for
the system to cater to expert users, WiPlan needs the functionality to export
the network plan to a common format for sharing with other members of the
community and the network planning expert from the distributing ISP. To
address this issue, functionality was added to WiPlan to export the network151

plan to an image file with details of the sites and links written to a text file
report. The capability of exporting the network plan to KML for use in Google
Earth and Google Maps was also added. Implementing export functionality
required significant effort.
8.2.2 Expert review two
The second HCI expert was a Professor of the Graduate School of Library and
Information Science at the University of Illinois. The issues identified by ex-
pert one were fixed before expert review two commenced. The second expert
review took place in the expert’s Waikato office using the laptop that WiPlan
was developed on. The researcher recorded audio and took manual notes as
the expert conducted the review.
The expert identified issues affecting the usability of the tutorial. He
pointed out that when a tutorial changed to the next step, the change was
not obvious to the user (heuristic 1). Also some steps of the tutorial transition
to the next step halfway through the text explanation, leading to confusion on
the part of the user and possible error (heuristic 5). He suggested that subse-
quent text be moved to the next step in order to avoid confusion. He pointed
out that when referencing a check box, it should be addressed by name, even
if it is the only check box (heuristics 2 and 4). He also mentioned that dialogs
should be referred to as windows for user familiarity (heuristic 2) and that the
tutorial should be sized such that scroll-bars are not required (heuristic 8).
These recommendations were all implemented in WiPlan and required mini-
mal effort to implement.
The expert also found some issues with the other parts of the interface.
He pointed out that in the site dialog for a relay site, the access and place-
ment dialogs should have the same title as the respective button text (heuris-
tics 2 and 4). He suggested that when the user clicks compute coverage for
a site, they should be prompted with a simple Yes/No dialog in case they152
clicked it by accident. As the coverage computation takes a few seconds to
run, the user might get confused and/or frustrated (heuristics 3 and 5). These
recommendations were all implemented in WiPlan with minor effort. He also
noted that the blurry lower-resolution maps outside of the area of interest may
confuse users (heuristic 5). This issue could be addressed using a pyramid map
scheme, as in Google Maps but this is outside the current scope of this research.
The expert noted ideas that would allow flexibility and enhance the effi-
ciency of use (heuristic 7). In the link profile information window, he mentioned
that it would be useful to have emphasis of an obstruction (if an obstruction
exists) in the link profile plot, such as zooming in on the obstruction. This sug-
gestion has not yet been implemented in WiPlan as it would require extensive
restructuring of the link profile information window. The expert also pointed
out that being able to click at a point on the link profile plot and have WiPlan
create a relay at that point would be useful. He suggested that when the user
hovers the mouse point over a link, then the interface should show the cost
of that link. Finally, he explained that in the site adder dialog, it would be
clearer to the user if the x and y labels changed based on the selected coordi-
nate type. For example, if the selected coordinate type was NZTM, the labels
would be easting and northing. If the selected coordinate type was WGS84,
then the labels would be longitude and latitude. The last three suggestions
were implemented in WiPlan with minor difficulty.
8.3 Wireless network planning expert review
The wireless network planning expert review was conducted by the chief techni-
cal officer of a local ISP with ten years experience in wireless network planning
in rural areas. The role of this expert was to identify any problems associated
with the functionality of WiPlan and comment on the user interface design
where appropriate. The expert conducted the review from both the point-of-
view of a network design expert and the point-of-view of a user. He was not153
involved in the development or design of the WiPlan interface, and did not
have any previous experience with WiPlan prior to the expert review.
He firstly answered a set of questions asked by the researcher. The expert
then stepped through the WiPlan tutorial, commenting on functionality and
usability issues as they were encountered. Once he had completed the tutorial,
he was asked about his experience and any suggestions he might have for re-
finement. The expert review session lasted approximately one hour and took
place in the expert’s office using the laptop that WiPlan was developed on.
The researcher recorded audio and made manual notes as the expert conducted
the review.
No changes were made to the software as a result of this expert review be-
cause the suggestions were primarily implementation changes geared towards
wireless network planning experts and would require a significant restructur-
ing of the WiPlan planning process. If implemented, the suggestions could
encourage planning experts to use the tool and could form part of future work.
Unfortunately other wireless network planning experts were not able to be
consulted in the time-frame available. It would however be interesting to ob-
tain expert reviews from other wireless network planning experts to see if their
opinions concur and restructure WiPlan as appropriate as part of future work.
8.3.1 Persona discussion
The expert was asked to comment on the realism of the personas and make any
suggestions. Overall, he felt that the personas were reasonably realistic though
optimistic with reference to real users that he has previously dealt with.
The farmers The expert commented that it is more typical that the farmers
have to use online tools for managing their farms rather than actually wanting
to do it, though there are some farmers pushing online tools. Eventually
farmers get fed up using dialup and begin asking for something faster. The154
expert pointed out that video Skype is popular in the farming community.
Skype is generally popular between grandparents and grandchildren, as the
grandchildren are away from home studying or traveling.
School principal The expert stated that “I do not think I have ever met that
school principal” but felt in a few more years that would probably change. He
explained that most school principals are not so comfortable using computers
and it is usually younger teachers pushing the technology. He has seen some use
of video conferencing between fully-integrated schools and tertiary providers
but not so much between schools. He did point out that most principals are
heavily involved with and strongly loyal to their local community.
Community representative The expert commented that this is a realistic
persona and he has certainly seen community representatives and gamers ex-
cept he is yet to meet someone that is both a community representative and a
gamer.
Cultural representative The expert pointed out that they have always
dealt with an intermediate person rather than someone of kaumatua status.
This intermediate person tends to be a younger trusted person in direct con-
tact with kaumatua who has the technical ability to understand some of the
technology and what the network will bring to the people. The concept of
using video conferencing to communicate with people that have moved away
from the community is quite strong. He stated that it is very important that
someone like this persona is involved as it is difficult to predict from external
sources what is allowed and what is not.
8.3.2 Pre-tutorial discussion
The expert pointed out that the ’average’ client they deal with are “fairly
motivated people that can’t get decent broadband” and would go out of their
way to achieve decent broadband. He explained that most clients know little
about how wireless networks work but that most of them are using computers155

and they are frustrated at not being able to get a fast enough Internet connec-
tion. Client occupations range from farmers through to people trying to run
businesses.
The expert felt that the persona motivations behind wanting decent broad-
band were realistic. He explained that in order for the software to support the
personas, “the most critical thing for the people is going to be determining
coverage” and identifying the trade-off between cost and coverage. He also
stated that given "a set of users that want to be connected, [the software needs
to assist in] determining the best way to connect those users".
He explained that helping to find the likely locations for placing sites by
being able to take a set of addresses and compute connectivity and coverage
from those addresses is necessary for rural wireless network planning.
8.3.3 Post-tutorial discussion
Once the expert completed the tutorial, he was asked about his experience.
He pointed out that he found zooming difficult using the zoom tools on the
tool bar. He had to ask the researcher how to zoom as he was so used to using
the mouse wheel for zooming in and out. He stated that when placing a site,
it is desirable to be well zoomed in but still be able to observe the two sites
that the link connects. “I suppose the difficulty is around working with things
at multiple scales, appropriate to the task. Being able to swap between those
modes or having a bifocal display might be a useful thing.”
He stated that WiPlan is “nice in that its purpose built for explicitly cre-
ating wireless links and seems to be giving good feedback” and that there
are useful features in there that are specifically targeted at wireless network
planning. He stated that “a lot of the other mapping tools [don’t] do things
as well” and that creating a link between two sites and being informed that
line-of-sight is obstructed is “really nice”.156

Finally, the expert considered whether they would use WiPlan for planning
rural wireless networks and he responded that it “would need to be a lot more
polished but certainly a tool with [those] sorts of features” would be useful.
He commented that WiPlan “still seems quite clunky but it is nice with the
feedback about whether links are going to work”.
8.3.4 Recommendations
The expert had recommendations relating to features of the interface.
The maps The expert explained that “the problem with a satellite map [is
that] you lose where you are very quickly, where as with a topographic map
[there is] quite a bit of text on there [showing] where things are”. He noted
that the explore local area dialog looked nice but being able to manipulate
sites in a Google Earth type fashion would be more useful. He suggested the
use of a rainbow colour scheme for the terrain, so that the user is to determine
the relative heights of hills and that as long as there is a legend, users would
be able to understand the colour scheme.
The line-of-sight indicator The expert suggested that the line-of-sight
indicator could be improved by determining when the mouse is stationary and
while the mouse remains stationary, repeatedly computing line-of-sight with
progressively finer resolution terrain data. Computation would cease once the
mouse was moved and the process would begin again. He also mentioned that
“what some of the other tools do [is] break it up and give immediate feedback
on where the obstructions are”. This is a way of showing along a link path
where in that path has line-of-sight to the transmitter. For example, Radio
Mobile does this by showing the terrain profile as green where there is line-of-
sight from the transmitter and red where there is not.
The link profile information window The expert stated that it would
be rare for the right place to position a relay to be on the direct path between157
two sites, referring to the ability to place a relay by clicking on the link profile
plot in the link profile information window. He explained that the user would
wanting to explore off to the sides of the direct path and that putting a site on
that line seems arbitrary”. He also pointed out that having the location of the
mouse indicated on the map when moving along the profile would be useful.
This is essentially a real-time version of placing a relay via the link profile plot
but showing an indicator on the main map rather than creating a relay site.
Other The expert noted that having the easting, northing and elevation
shown in the status bar was “quite nice”. He did express concern about the
sections on placement and access in the site properties information window,
stating that he wondered how much the sections on placement and access
would be used and how useful they will be.
8.4 Chapter summary
This chapter discussed concepts for conducting an expert review of the WiPlan
user interface and presented the results of three expert reviews. This chapter
explained what an expert review is and the reasons for conducting one before
introducing Nielsen’s heuristics for evaluating user interfaces. The results of
two expert reviews by experts in human-computer interaction with reference
to Nielsen’s heuristics were presented and the responsive actions described.
Finally a network expert conducted an expert review and found that the tool
“is nice with the feedback and things you are getting about whether links
are going to work”. The network expert also had suggestions for improving
functionality aspects of the user interface.
158
Chapter 9
Evaluating WiPlan in the
wireless network planning
process
In this chapter, the use of WiPlan in wireless network planning is explored. A
novel study design using role-playing is described for evaluating how WiPlan
assists with planning a wireless network. The chapter presents the findings of
the two trials undertaken following this study design. The chapter concludes
with a summary that explores the impact of WiPlan on the wireless network
planning process and how the study design influenced this process.
9.1 Study design
WiPlan was designed to facilitate a planning process appropriate for a rural
community, which is most likely to take place as an informal meeting at some-
ones home. WiPlan does not include explicit support for collaboration but is
intended to support synchronous, co-located work with a relaxed social set-
ting. It is anticipated that snacks and refreshments would be provided, and
that a computer with WiPlan would be connected to a TV or projector for
community members gather around and plan their community network.
159
This study is designed to simulate such a meeting taking place as setting
up a real meeting that could be observed is impractical. A real meeting may
take place over more than one day and rural communities that want broadband
access for their area are typically located a significant distance from urban ar-
eas. The advantage of simulating the meeting is that an area with an existing
network that is known to the researcher can be chosen where the situation
is fully understood, allowing reliable evaluation of the solutions discovered by
the participants.
The presence of an existing network shows that a viable solution exists and
the researcher can use their local knowledge of the area to evaluate how well
local knowledge was solicited. Rather than using real people from the area
who may already have the wireless network and be biased by it, people can be
selected from outside the area. Essentially, there are two alternative options::
• Conducting a user study in an area where a wireless network already
exists and the local area is known. This option would be prone to bias
by the existing network.
• Conducting a user study in an area where a wireless network does not
exist. This introduces uncertainty about the local area and the feasibility
of a wireless network.
Role-playing offers a third alternative where the certainty about an existing
network and the local area is established but bias is eliminated by selecting
people from outside the area. Role-playing is commonly known as the practice
where a person changes their behaviour to assume that of another person or
character in a fictional setting. Role-playing has been used in literature to help
solicit information and promote sharing of that information [51, 53, 64, 115].
Dionnet et al. [64] used a role playing game to raise awareness among farmers
about a joint irrigation project. The approach allowed experimental explo-
ration of decision making and supported the solicitation of information from160

the farmers and the sharing of that information. This is important because as
part of this methodology, the aim is for the participants to make decisions in
consultation with each other and to share their knowledge of the local area.
Camargo et al. [53] discuss how to use role-playing games to train people
about specific aspects of new and difficult to understand legislation relating
to land and water management. They point out that decision making is not
only based on logic-formal thinking but also mobilises emotive and affective
elements as in real life. The informality of a game also reduces tension and
provides a relaxed atmosphere. Camargo et al. state that the cooperation ef-
fort is essential to perform the required tasks. This highlights the importance
of providing a relaxed atmosphere so that people are comfortable to discuss
issues and participate in making decisions.
The study described in this chapter has been established as a novel role-
playing game where the game participants work together to plan a wireless
network for their community. The study design involves a group of five people
using WiPlan to plan a wireless network for their local community. As with
the comparable work of Dionnet et al. [64], the aim is for the participants to
make decisions in consultation with each other and to share knowledge of the
local area. The informality of a game environment and availability of refresh-
ments helps to create a relaxed atmosphere.
To establish a role-playing game for wireless network planning, the per-
sonas from Chapter 6 were further developed to provide characters for the
study participants to role play. There is a dairy farmer, a school principal, a
community representative, a kaumatua1 and a farmer that runs a mixed sheep
and beef farm (herein referred to as the sheep and beef farmer).
1kaumatua are respected elders who are the keepers of the knowledge and traditions ofthe family, sub-tribe or tribe [48].
161
WiPlan users are anticipated to be middle-aged people with low to mod-
erate comfort using computers. These users may have some academic back-
ground, such as the school principal, though most users are likely to have
grown up and worked in the local community. These characteristics have been
identified through discussions with the wireless network planning expert and
by meeting locals from the CRCnet and Tuhoe networks.
The setting of the study is a real location - the Te Whaiti valley in the
Urewera ranges, New Zealand. The Te Whaiti valley was chosen as the setting
for the following reasons:
1. Te Whaiti is isolated and surrounded by large mountains (the Ureweras).
This is appropriate as WiPlan is aimed at building wireless networks for
connecting isolated rural areas to the Internet.
2. Te Whaiti has a rich Maori history and has many sites of cultural signif-
icance. WiPlan has been designed such that cultural beliefs and sites of
cultural significance can be considered when planning a wireless network.
3. Te Whaiti has villages, a school and farms whose occupants are reflected
by the five personas.
4. Te Whaiti already has a wireless network installed by Rurallink, link-
ing Minginui and the school to the Internet. This is the network that
operated by Tuhoe Online and discussed in Section 1.2.1. This existing
wireless network provides a network solution to compare with the plans
created in this study. Also, the expert who planned the Tuhoe network
is available to comment on these plans.
5. The researcher has some local knowledge of the Te Whaiti area as he
has visited key parts of the existing wireless network. He met locals
and gained a hands-on appreciation for the mountainous terrain. This is
useful as the researcher was able to design a study with a realistic setting
and determine accurate user characteristics.162
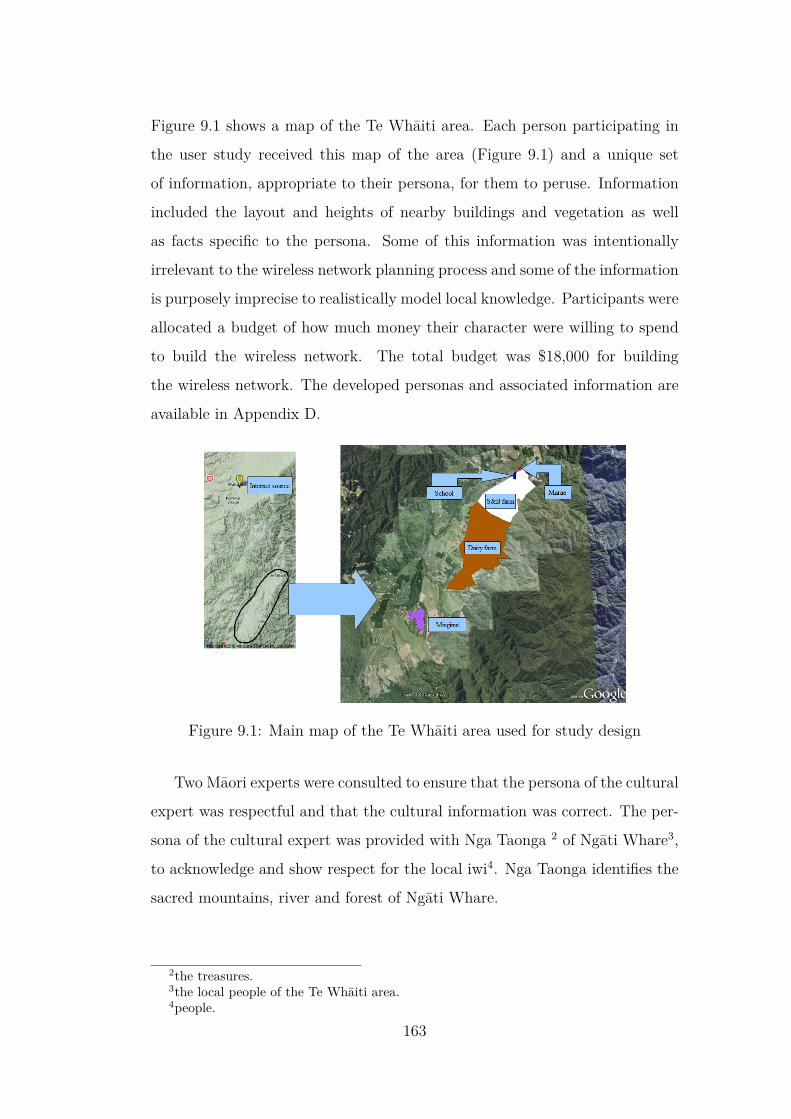
Figure 9.1 shows a map of the Te Whaiti area. Each person participating in
the user study received this map of the area (Figure 9.1) and a unique set
of information, appropriate to their persona, for them to peruse. Information
included the layout and heights of nearby buildings and vegetation as well
as facts specific to the persona. Some of this information was intentionally
irrelevant to the wireless network planning process and some of the information
is purposely imprecise to realistically model local knowledge. Participants were
allocated a budget of how much money their character were willing to spend
to build the wireless network. The total budget was $18,000 for building
the wireless network. The developed personas and associated information are
available in Appendix D.
Figure 9.1: Main map of the Te Whaiti area used for study design
Two Maori experts were consulted to ensure that the persona of the cultural
expert was respectful and that the cultural information was correct. The per-
sona of the cultural expert was provided with Nga Taonga 2 of Ngati Whare3,
to acknowledge and show respect for the local iwi4. Nga Taonga identifies the
sacred mountains, river and forest of Ngati Whare.
2the treasures.3the local people of the Te Whaiti area.4people.
163

The users had two main tasks to accomplish while role-playing their allo-
cated characters. The first task was to follow through the tutorial in order to
acquaint them with the software. The second task involved the users planning
a wireless network to connect the Minginui village, the local school and each of
the farmers’ houses to the Internet. WiPlan was configured to load the correct
maps for the Te Whaiti area and show the location of the Internet source, as
indicated in Figure 9.1. The users then had to peruse their information to
determine the locations of the houses, the school and Minginui village on the
maps.
Two trials were conducted using this study design. In the first trial, com-
puter science students were selected as participants for two reasons. The first
reason is that as this was the first trial, there was the potential for unexpected
software problems to occur. Computer science students are well-equipped to
identify and deal with these problems. In some cases, computer science stu-
dents can even resolve the problems.
The second reason is that computer science students are confident using
computers and are willing to give feedback on the experience, which helps
to ensure that there are no fundamental problems with the functionality of
WiPlan while also testing out the study design. In the second trial, participants
similar to the personas being role-played were selected. These participants were
primarily non-academic, middle-aged people who were moderately comfortable
using computers. They were not actually part of a rural community. All
participants had minimal knowledge of wireless networks and rural wireless
network planning.
164

There are three key questions that these trials are intended to answer.
1. Did the participants engage in role-playing their personas and collaborate
on planning the wireless network?
2. Did the tutorial assist participants with decision making and trouble
shooting during the wireless network planning process?
3. Were the participants able to plan a wireless network and draw out rel-
evant local knowledge during the process?
The following discussion examines the findings of the two trials to provide
answers to these questions.
9.2 First trial
The first trial was conducted in a group meeting room where the five partic-
ipants could gather around a projector. One participant was selected by the
group to be the computer operator. The session lasted two hours, including
stepping through the tutorial, planning the network and taking a break for
lunch. The participants actively play-acted their personas to the point that
they enjoyed the experience while still providing valuable feedback.
All participants were male and the average age of participants was 20,
ranging from 18 to 25 years old. Four of the participants were computer sci-
ence undergraduate students and one was a doctoral computer science student
involved in HCI research. Participants had minimal knowledge of wireless net-
works and no knowledge of rural wireless network planning. Participants had
a high level of comfort using computers. Table 9.1 shows the characteristics of
the participants for trial one compared to those characteristics identified for
the target end-users in Chapter 6.165
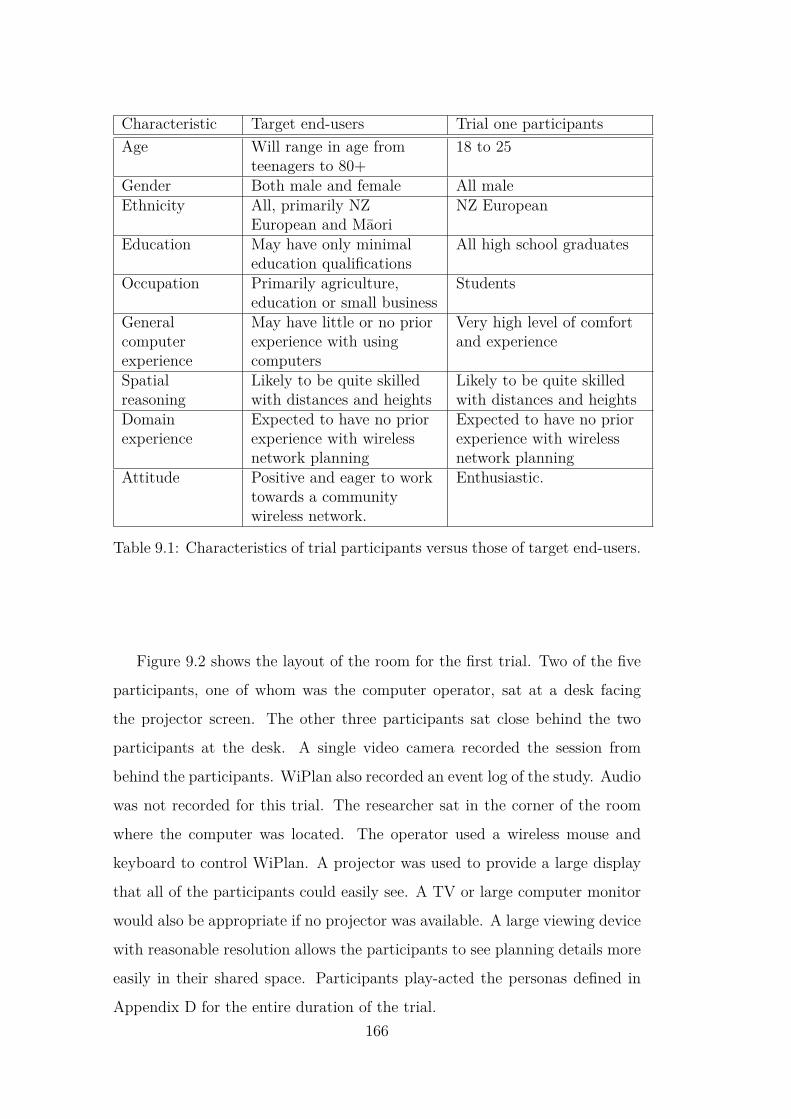
Characteristic Target end-users Trial one participantsAge Will range in age from
teenagers to 80+18 to 25
Gender Both male and female All maleEthnicity All, primarily NZ
European and MaoriNZ European
Education May have only minimaleducation qualifications
All high school graduates
Occupation Primarily agriculture,education or small business
Students
Generalcomputerexperience
May have little or no priorexperience with usingcomputers
Very high level of comfortand experience
Spatialreasoning
Likely to be quite skilledwith distances and heights
Likely to be quite skilledwith distances and heights
Domainexperience
Expected to have no priorexperience with wirelessnetwork planning
Expected to have no priorexperience with wirelessnetwork planning
Attitude Positive and eager to worktowards a communitywireless network.
Enthusiastic.
Table 9.1: Characteristics of trial participants versus those of target end-users.
Figure 9.2 shows the layout of the room for the first trial. Two of the five
participants, one of whom was the computer operator, sat at a desk facing
the projector screen. The other three participants sat close behind the two
participants at the desk. A single video camera recorded the session from
behind the participants. WiPlan also recorded an event log of the study. Audio
was not recorded for this trial. The researcher sat in the corner of the room
where the computer was located. The operator used a wireless mouse and
keyboard to control WiPlan. A projector was used to provide a large display
that all of the participants could easily see. A TV or large computer monitor
would also be appropriate if no projector was available. A large viewing device
with reasonable resolution allows the participants to see planning details more
easily in their shared space. Participants play-acted the personas defined in
Appendix D for the entire duration of the trial.166
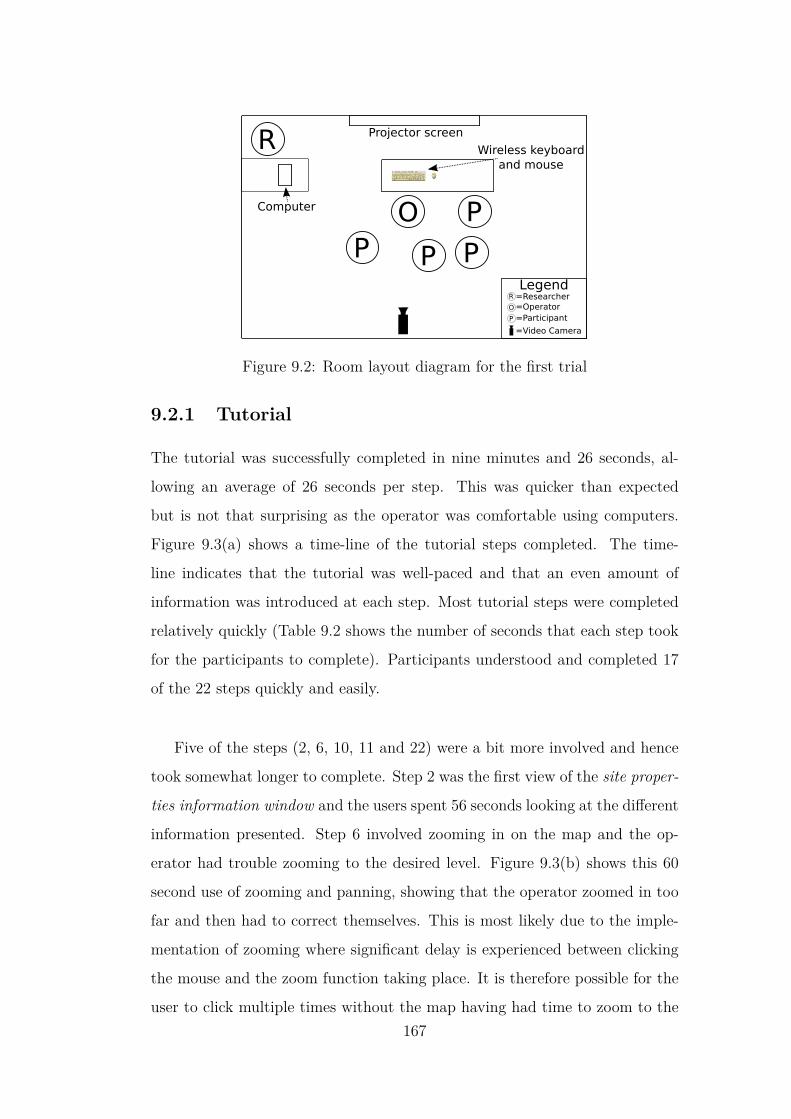
O P
R
P PP
Projector screen
Wireless keyboard
and mouse
Computer
LegendR =Researcher
O =Operator
P =Participant
=Video Camera
Figure 9.2: Room layout diagram for the first trial
9.2.1 Tutorial
The tutorial was successfully completed in nine minutes and 26 seconds, al-
lowing an average of 26 seconds per step. This was quicker than expected
but is not that surprising as the operator was comfortable using computers.
Figure 9.3(a) shows a time-line of the tutorial steps completed. The time-
line indicates that the tutorial was well-paced and that an even amount of
information was introduced at each step. Most tutorial steps were completed
relatively quickly (Table 9.2 shows the number of seconds that each step took
for the participants to complete). Participants understood and completed 17
of the 22 steps quickly and easily.
Five of the steps (2, 6, 10, 11 and 22) were a bit more involved and hence
took somewhat longer to complete. Step 2 was the first view of the site proper-
ties information window and the users spent 56 seconds looking at the different
information presented. Step 6 involved zooming in on the map and the op-
erator had trouble zooming to the desired level. Figure 9.3(b) shows this 60
second use of zooming and panning, showing that the operator zoomed in too
far and then had to correct themselves. This is most likely due to the imple-
mentation of zooming where significant delay is experienced between clicking
the mouse and the zoom function taking place. It is therefore possible for the
user to click multiple times without the map having had time to zoom to the167

correct level, so the user zooms in too far.
Steps 10 and 11 focused on placement and access for the relay site, requiring
the participants to read help dialogs and write some notes so spending 68 and
54 seconds respectively on these steps is expected. Figure 9.3(b) shows the
different map modes used during the tutorial. Apart from the use of zooming
and panning for step 6 of the tutorial, only the default pointer mode was used
for the duration of the tutorial.
Step number Seconds to complete1 172 563 234 145 96 607 388 139 2010 6811 5412 1413 1214 1915 816 2217 918 2719 3520 1121 2222 15
Table 9.2: Time taken to complete each tutorial step for the first trial
168

Figure 9.3(c) shows a time-line of tutorial events for the first trial. An
event represents a site or link being created or removed. The events match
what is expected from the tutorial except for the sites created at 500 seconds
onwards. This is step 22 of the tutorial where the user is asked to place a relay
by clicking on the link profile plot of the link profile information window. In
this case, the user has not seen the create relay confirmation dialog, and has
therefore clicked multiple times, hence creating multiple sites. This highlights
that there is an usability issue with the confirmation dialog in that the place-
ment and importance of the dialog were not obvious to the user. This is an
implementation problem and should be addressed in future work.
0 100 200 300 400 500 600 700
Time (s)
Ste
p nu
mbe
r
0 100 200 300 400 500 600 700
05
1015
20
05
1015
20
(a) Timeline of tutorial steps completed
0 100 200 300 400 500 600 700
Time (s)
Mod
e
0 100 200 300 400 500 600 700
Poi
nter
Zoo
m In
Zoo
m O
utP
an
Poi
nter
Zoo
m In
Zoo
m O
utP
an
(b) Timeline of map modes used during tuto-rial
0 100 200 300 400 500 600 700
Time (s)
Eve
nt ty
pes
Cre
ate
Site
Rem
ove
Site
Cre
ate
Link
Rem
ove
Link
Cre
ate
Site
Rem
ove
Site
Cre
ate
Link
Rem
ove
Link
0 100 200 300 400 500 600 700
Time (s)
Eve
nt ty
pes
Cre
ate
Site
Rem
ove
Site
Cre
ate
Link
Rem
ove
Link
Cre
ate
Site
Rem
ove
Site
Cre
ate
Link
Rem
ove
Link
(c) Timeline of site and link events during tu-torial
0 100 200 300 400 500 600 700
Time (s)
Info
rmat
ion
win
dow
type
s
0 100 200 300 400 500 600 700
Site
Pro
pert
ies
Link
Pro
file
Exp
lore
Site
Pro
pert
ies
Link
Pro
file
Exp
lore
(d) Time spent in information windows duringtutorial
Figure 9.3: These graphs show the main actions of the participants during thetutorial of the first trial.
169
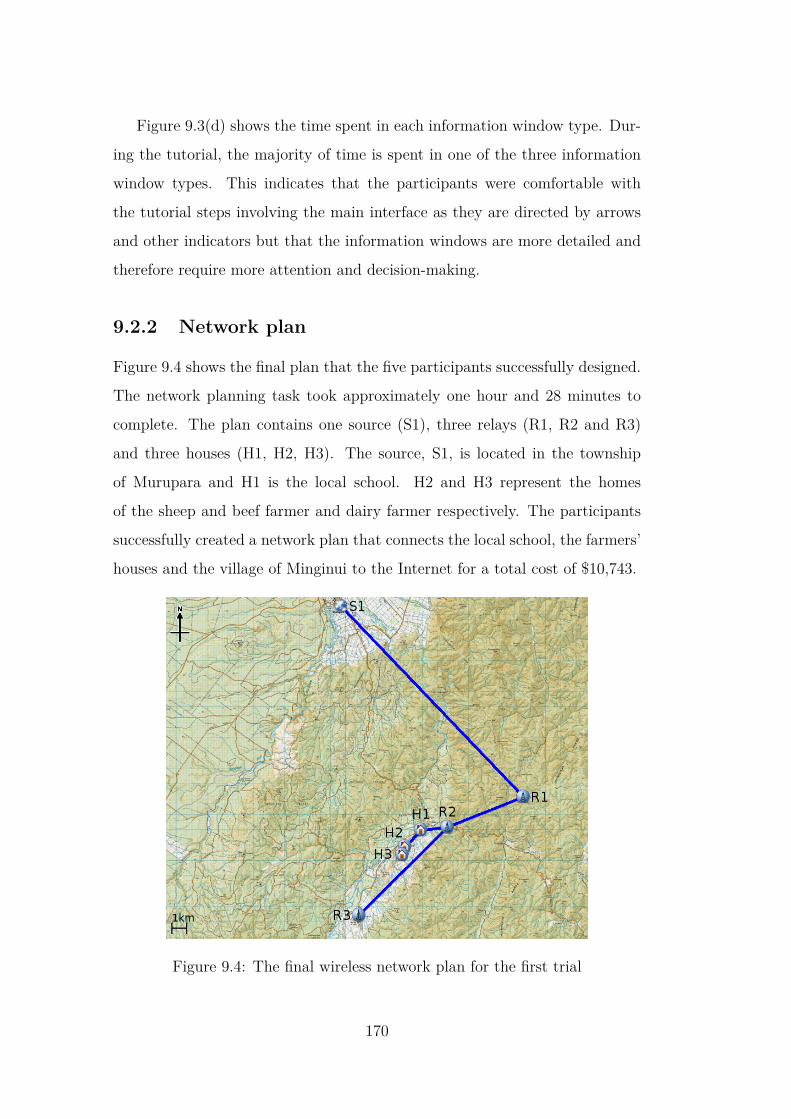
Figure 9.3(d) shows the time spent in each information window type. Dur-
ing the tutorial, the majority of time is spent in one of the three information
window types. This indicates that the participants were comfortable with
the tutorial steps involving the main interface as they are directed by arrows
and other indicators but that the information windows are more detailed and
therefore require more attention and decision-making.
9.2.2 Network plan
Figure 9.4 shows the final plan that the five participants successfully designed.
The network planning task took approximately one hour and 28 minutes to
complete. The plan contains one source (S1), three relays (R1, R2 and R3)
and three houses (H1, H2, H3). The source, S1, is located in the township
of Murupara and H1 is the local school. H2 and H3 represent the homes
of the sheep and beef farmer and dairy farmer respectively. The participants
successfully created a network plan that connects the local school, the farmers’
houses and the village of Minginui to the Internet for a total cost of $10,743.
Figure 9.4: The final wireless network plan for the first trial
170

The participants in trial one starting following the multi-branch strategy
discussed in Section 2.3.5 almost immediately. They were quick to make de-
cisions and seldom back-tracked. Participants were at ease with creating sites
and links. Their primary approach was to create several sites, link them to-
gether and then systematically adjust or remove them as they saw fit. Often
the participants were quick to make decisions that should have been discussed
in more depth. At the end of the trial, the participants discussed their final
design and were happy with the plan they had designed.
9.2.2.1 Planning approach and decisions
Observations are used to describe the approach that the users took as audio was
not recorded for this trial. The participants followed a fairly straight-forward
strategy. They began by importing all of the houses. The participants then
explored the area by panning around and zooming, as evident in Figure 9.6(b),
before deciding to place relays at each of the trig station locations. The par-
ticipants make frequent use of zooming but seem to avoid using panning where
possible. This is most likely due to the inaccurate and laggy implementation
of panning in WiPlan.
The participants then investigated their link options by creating links be-
tween sites to see where there was line-of-sight and what the different solu-
tions would cost. Figure 9.6(c) and Figure 9.6(d) show this process where the
participants are examining site and link details in the respective dialogs and
progressively eliminating sites and links from consideration.
Figure 9.6(d) shows that participants tried using the explore local area fea-
ture twice but did not use it again. This, along with the level of frustration
observed, indicated that they found it confusing and hence did not find it use-
ful. The explore local area feature was intended to give a 3D visualisation of
the local area however participants found that it was difficult to navigate and171
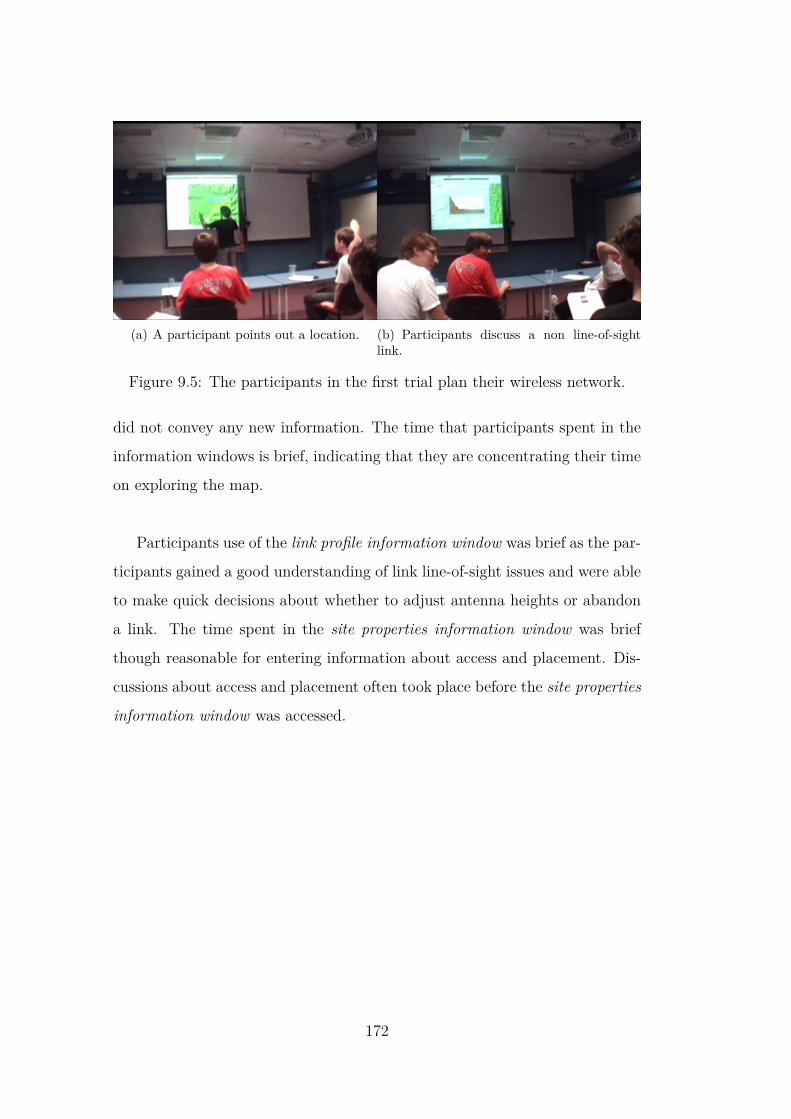
(a) A participant points out a location. (b) Participants discuss a non line-of-sightlink.
Figure 9.5: The participants in the first trial plan their wireless network.
did not convey any new information. The time that participants spent in the
information windows is brief, indicating that they are concentrating their time
on exploring the map.
Participants use of the link profile information window was brief as the par-
ticipants gained a good understanding of link line-of-sight issues and were able
to make quick decisions about whether to adjust antenna heights or abandon
a link. The time spent in the site properties information window was brief
though reasonable for entering information about access and placement. Dis-
cussions about access and placement often took place before the site properties
information window was accessed.
172

0 1000 2000 3000 4000 5000
Time (s)
Type
0 1000 2000 3000 4000 5000
Terr
ain
Topo
grap
hic
Sat
ellit
e
Terr
ain
Topo
grap
hic
Sat
ellit
e
(a) Timeline of map background types usedduring the network planning process.
0 1000 2000 3000 4000 5000
Time (s)
Mod
e
0 1000 2000 3000 4000 5000
Poi
nter
Zoo
m In
Zoo
m O
utP
an
Poi
nter
Zoo
m In
Zoo
m O
utP
an
(b) Timeline of map modes used during thenetwork planning process.
0 1000 2000 3000 4000 5000
Time (s)
Eve
nt ty
pes
Cre
ate
Site
Rem
ove
Site
Cre
ate
Link
Rem
ove
Link
Cre
ate
Site
Rem
ove
Site
Cre
ate
Link
Rem
ove
Link
0 1000 2000 3000 4000 5000
Time (s)
Eve
nt ty
pes
Cre
ate
Site
Rem
ove
Site
Cre
ate
Link
Rem
ove
Link
Cre
ate
Site
Rem
ove
Site
Cre
ate
Link
Rem
ove
Link
(c) Timeline of site and link events during thenetwork planning process.
0 1000 2000 3000 4000 5000
Time (s)
Info
rmat
ion
win
dow
type
s
0 1000 2000 3000 4000 5000
Site
Pro
pert
ies
Link
Pro
file
Exp
lore
Site
Pro
pert
ies
Link
Pro
file
Exp
lore
(d) Time spent in information windows duringthe network planning process.
Figure 9.6: These graphs show the main actions of the participants during thenetwork planning part of the first trial. The shaded areas show where WiPlancrashed.
This process of finding a single relay site that is elevated above the rest of
the terrain and then experimenting with other sites and links resembles the
multi-branch strategy discussed in Section 2.3.5. Eventually this progression
of elimination led to the final design shown in Figure 9.4.
Figure 9.6(a) shows a time-line of when the different map types were used
and for how long. The satellite map was the most preferred with frequent
changes to the topographic map and back again to the satellite map. This
indicates that the topographic map was useful for obtaining information but
that the participants were more comfortable with using the satellite map for
exploration.173

9.2.3 Local knowledge consideration for relay creation
Table 9.3 and Table 9.4 show the key attributes of the three relays. The partic-
ipants explored the list of trig station sites that the community representative
had as part of his information. They placed Relay R1 at a trig station site
of the mountain known as Whakaipu which has an elevation of 1034 metres.
Participants noted in the site properties information window that they had
permission and that the best access would be via helicopter. It seems that
the participants thought they were making an executive decision regarding
placement, when permission from other parties would actually be required.
Participants realised that getting the building materials to the site would be
difficult due to poor access hence they chose to use a helicopter.
Relay Trig site Easting Northing Elevation1 Yes 1935586m 5724102m 1034m2 No 1930630m 5722148m 537m3 No 1924869m 5716415m 368m
Table 9.3: A summary of the relays placed in the first trial identifying whetherthe relay was placed at a trig site and details of the geographic coordinates.
The participants also noted that the summit of Whakaipu could be accessed
via a 3km motorbike track followed by hiking approximately 600 metres up the
mountain. The participants determined that the antenna height at relay R1
needed to be 20 metres in order to have line-of-sight to the source S1 in Muru-
para. Building a 20m high antenna is somewhat unrealistic for a rural wireless
network due to the costs involved; the fact that the participants were happy
with the 20 metre antenna height indicates that the cost modeling of antenna
height in WiPlan is insufficient. This would be addressed by incorporating
more realistic cost modeling of antenna height in WiPlan and checking with
the user whether the height infrastructure already existed. The participants
chose relay R1 to be solar-powered. This choice is significant as it shows that
participants considered mains power as an option and decided it was unrealistic
to expect mains power at that location.174
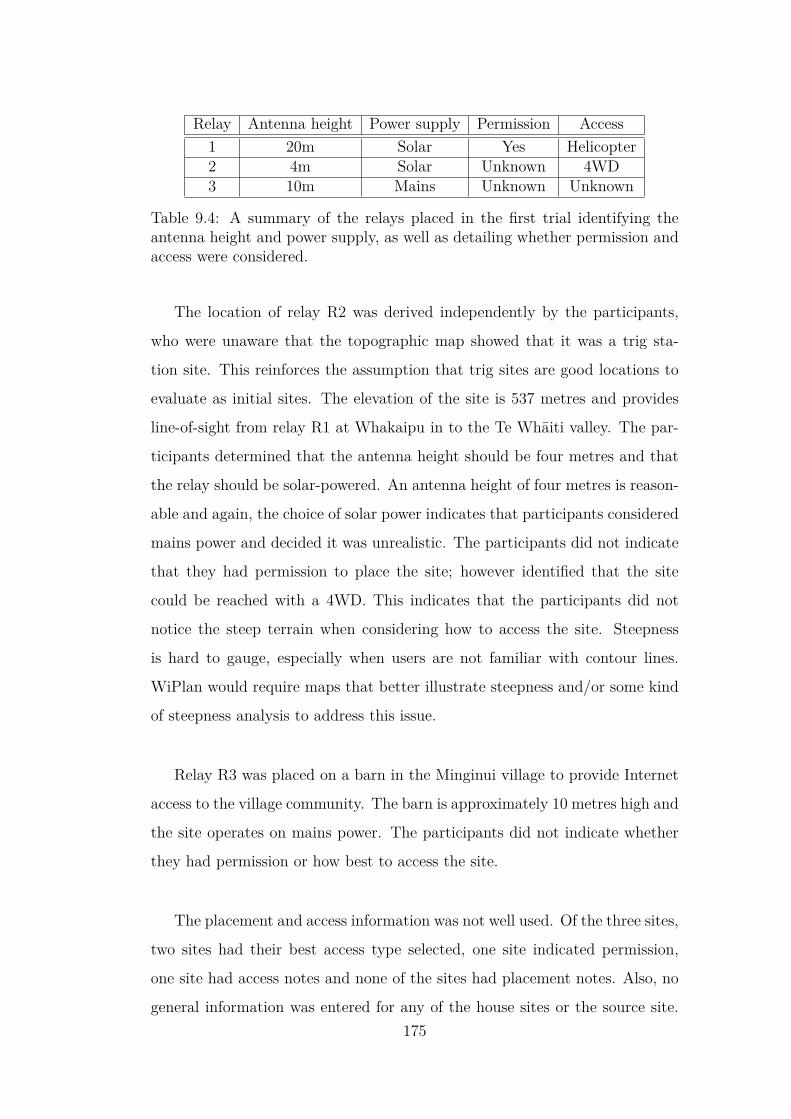
Relay Antenna height Power supply Permission Access1 20m Solar Yes Helicopter2 4m Solar Unknown 4WD3 10m Mains Unknown Unknown
Table 9.4: A summary of the relays placed in the first trial identifying theantenna height and power supply, as well as detailing whether permission andaccess were considered.
The location of relay R2 was derived independently by the participants,
who were unaware that the topographic map showed that it was a trig sta-
tion site. This reinforces the assumption that trig sites are good locations to
evaluate as initial sites. The elevation of the site is 537 metres and provides
line-of-sight from relay R1 at Whakaipu in to the Te Whaiti valley. The par-
ticipants determined that the antenna height should be four metres and that
the relay should be solar-powered. An antenna height of four metres is reason-
able and again, the choice of solar power indicates that participants considered
mains power and decided it was unrealistic. The participants did not indicate
that they had permission to place the site; however identified that the site
could be reached with a 4WD. This indicates that the participants did not
notice the steep terrain when considering how to access the site. Steepness
is hard to gauge, especially when users are not familiar with contour lines.
WiPlan would require maps that better illustrate steepness and/or some kind
of steepness analysis to address this issue.
Relay R3 was placed on a barn in the Minginui village to provide Internet
access to the village community. The barn is approximately 10 metres high and
the site operates on mains power. The participants did not indicate whether
they had permission or how best to access the site.
The placement and access information was not well used. Of the three sites,
two sites had their best access type selected, one site indicated permission,
one site had access notes and none of the sites had placement notes. Also, no
general information was entered for any of the house sites or the source site.175
This indicates that either the participants did not know what they should enter
in these fields or that the fields were ignored. Either way, the importance of
this information needs to be obvious to the user, and the requested information
needs to be more specific than just empty text fields.
9.2.4 Usability issues
The kaumatua, who operated the computer, found that the “values are cal-
culated with little user input which makes it fast to use” and that “the map
controls worked well”. Overall he thought that WiPlan “seemed to work really
well for its intended purpose of designing wireless networks” though “stability
and speed could be improved”. The sheep and beef farmer said “I didn’t use
it directly but it looked easy to use. There were a couple of features that we
didn’t notice initially (importing site info, changing map types) but once we
knew they were there we used them.” He thought that “the software seems
like it would be highly useful for planning a wireless network. In a couple of
places, it looked like the user interface could use a bit of polishing, but that
is to be expected from prototype software. As someone acting as a backseat
driver it was easy to follow what was going on. It provided a good view of the
layout of the network etc”.
Main interface The researcher observed that the operator had difficulty
with zooming and panning, mainly due to the lag involved. The researcher
also observed that the operator tried to move sites by dragging them but this
functionality is not implemented in WiPlan.
Site properties information window Participants created custom heights
which were added to the drop-down list of heights but not selected by default.
The participants then needed to select the newly created height in the drop-
down list. The same custom heights were created for different sites raising the
question of whether custom heights should be global between sites.176
Other The researcher observed that participants did not have a realistic
understanding of antenna height and that WiPlan did not highlight the extra
cost that the antenna height contributed to the total cost. Participants found
the site adder tool useful but were not aware of it until the researcher pointed
out its existence. They found that the site adder tool did not add the entered
names to the created sites, and that the coordinate type changed on each
site added. This was identified as a software bug and fixed for the second
trial. The WiPlan software crashed twice, raising the suggestion that an auto-
save feature should be implemented. The reasons for WiPlan crashing were
determined and later fixed before the commencement of the second trial.
9.2.5 Expert feedback
The chief technical officer of a local ISP with ten years experience in wireless
network planning in rural areas (the wireless network expert introduced in Sec-
tion 8.3) was asked to comment on the plan designed by the five participants.
He was asked if the plan was feasible and he responded that the design was
certainly going to be very challenging due to his knowledge of how steep the
terrain is in the area but that it was certainly feasible. The participants were
aware that the terrain was hilly and steep in parts but did not seem to fully
comprehend the scale involved and how this affected wireless network planning.
He commented that the antenna height of 20 metres at Whakaipu (R1)
would cost a lot more than the participants realised and more than WiPlan
estimated. This indicates that cost modeling for antenna height should further
investigated as part of future work so that the total cost can be conveyed to
the user. The expert explained that Whakaipu (R1) would be a difficult site
to access due to the deep dense vegetation and knowledge of the terrain in the
area. He knew through consultation with the local community that Tawhiuau
has a good walking track that was well used and that is one of the main reasons
why the Tawhiuau site was chosen for the Tuhoe network. Another major rea-
son for why it was chosen is that it can see through to the village of Ruatahuna.177

Participants were aware of the terrain and vegetation however their opin-
ion was that they could use a helicopter to access the site and that they could
remove some of the vegetation. This shows that in future work, extra cost
should be included by WiPlan when a helicopter is used for access. Removing
vegetation may be more difficult than participants realised and in some cases
may not be allowed.
He pointed out that there are possible problems when houses are connected
to each other and that it is best to avoid this by connecting each house to a
relay instead. Connecting the houses together also created the problem of a
deep network with more potential points of failure. In future work, WiPlan
should prevent houses being connected together unless the possible problems
are presented to the user and accepted. The expert also commented that
Minginui is surrounded by a shelter-belt and that any link in to Minginui
would need to clear the shelter-belt. Including vegetation support in WiPlan
as part of future work would help in such a situations.
9.3 Second trial
The second user study was conducted in a group meeting room where the five
participants could gather around a projector. One participant was selected
by the group to be the computer operator. The session lasted two and a
half hours, including stepping through the tutorial and planning the network,
though the participants did not finish planning the network. The participants
play-acted their personas but were not as enthusiastic as the participants from
trial one. They took the game quite seriously, adding a sense of realism to the
trial.
Four of the participants were male, one was female and the approximate
average age of participants was 50 years old. In comparison, the average age178

of participants in the first trial was 20 years old. Three of the participants
were managers in building services, one was a student liaison officer and the
other was an electrician. Participants had no knowledge of wireless networks
or rural wireless network planning. Participants had a low level of comfort
using computers, compared to participants from the first trial who had a high
level of comfort using computers.
Table 9.5 shows the characteristics of the participants for trial two com-
pared to those characteristics identified for the target end-users in Chapter 6.
This comparison of characteristics shows that trial two participants can be
considered representative of end users, particularly in terms of age, experience
and comfort using computers.
Characteristic Target end-users Trial two participantsAge Will range in age from
teenagers to 80+Estimated average age of50
Gender Both male and female Both male and femaleEthnicity All, primarily NZ
European and MaoriNZ European and Maori
Education May have only minimaleducation qualifications
Unknown
Occupation Primarily agriculture,education or small business
Building maintenancemanagers, education,retired tradesman.
Generalcomputerexperience
May have little or no priorexperience with usingcomputers
Little to some experience
Spatialreasoning
Likely to be quite skilledwith distances and heights
Quite skilled with distancesand heights
Domainexperience
Expected to have no priorexperience with wirelessnetwork planning
Expected to have no priorexperience with wirelessnetwork planning
Attitude Positive and eager to worktowards a communitywireless network.
Positive, slightlyover-whelmed by task athand.
Table 9.5: Characteristics of trial participants versus those of target end-users.
179
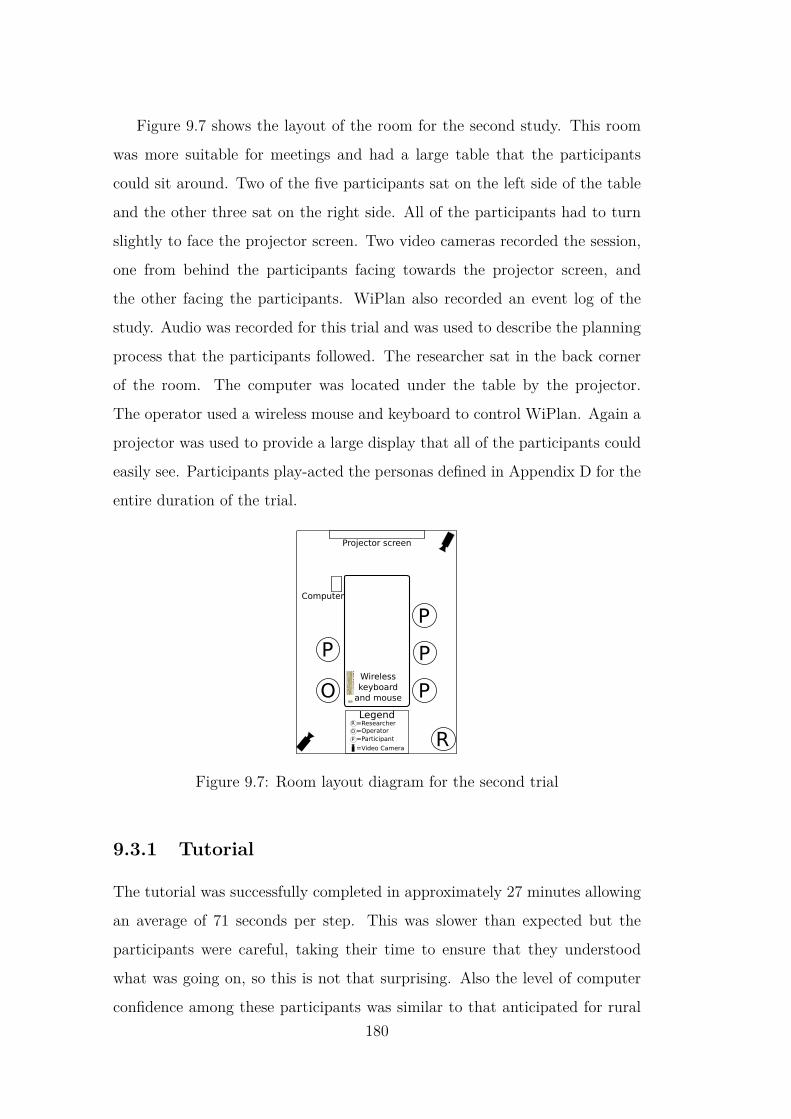
Figure 9.7 shows the layout of the room for the second study. This room
was more suitable for meetings and had a large table that the participants
could sit around. Two of the five participants sat on the left side of the table
and the other three sat on the right side. All of the participants had to turn
slightly to face the projector screen. Two video cameras recorded the session,
one from behind the participants facing towards the projector screen, and
the other facing the participants. WiPlan also recorded an event log of the
study. Audio was recorded for this trial and was used to describe the planning
process that the participants followed. The researcher sat in the back corner
of the room. The computer was located under the table by the projector.
The operator used a wireless mouse and keyboard to control WiPlan. Again a
projector was used to provide a large display that all of the participants could
easily see. Participants play-acted the personas defined in Appendix D for the
entire duration of the trial.
O
P
R
P
P
P
Projector screen
Wireless
keyboard
and mouse
Computer
LegendR =Researcher
O =Operator
P =Participant
=Video Camera
Figure 9.7: Room layout diagram for the second trial
9.3.1 Tutorial
The tutorial was successfully completed in approximately 27 minutes allowing
an average of 71 seconds per step. This was slower than expected but the
participants were careful, taking their time to ensure that they understood
what was going on, so this is not that surprising. Also the level of computer
confidence among these participants was similar to that anticipated for rural180

users, compared to the participants of the first trial. Figure 9.9(a) shows a
time-line of the tutorial steps completed. The time-line indicates that the tu-
torial was well-paced and that an even amount of information was introduced
at each step (Table 9.6 shows the number of seconds that each step took for
the participants to complete). Participants understood and completed 13 of
the 22 steps easily though carefully taking their time.
Figure 9.8: Participants engaged in the tutorial of the second trial
Participants had some difficulty with nine of the steps (1, 2, 7, 10, 11, 12,
13, 14 and 22). In step 1, the participants were asked to create a house site
at the indicated location. Participants did not realise that the house had to
be created at the indicated location for the tutorial to advance. This suggests
that the tutorial wording may have been unclear and that the animated arrow
indicating the location for creating the house site was not obvious. Step 2 was
the participants first view of the site properties information window and so
they spent some time to have a look at the different information presented.
Participants had difficulty with exploring the local area in step 7. They did
not know how to navigate around and expected to be able to move the existing
site and create a new site. They also mistook the relay site for the house site.181

Steps 10 and 11 focused on placement and access for the relay site, requiring
the participants to read help dialogs and write some notes so spending more
time on these steps is expected.
Step number Seconds to complete1 562 1113 464 345 376 507 1858 349 4010 7411 4212 10213 10014 13115 6916 6317 2318 7519 8120 1421 9822 98
Table 9.6: Time taken to complete each tutorial step for the second trial
In step 12, participants were zoomed too far out and did not notice the
zooming functions therefore it took the participants some time to identify the
potential link and then create a link. The zooming and panning tools were
available in the toolbar but the participants did not notice them. This could
be addressed by specifically introducing zooming and panning in the tuto-
rial. Participants also had difficulty with steps 13 and 14 where they had to
confirm that there were no possible obstructions and observe how the link pro-
file information window changed. The participants were firstly confused that
the obstruction was not immediately obvious and that they did not know the182

meaning of “protocol solution”. They were then confused about having to click
the check box, thinking that it should be checked automatically. It was not
clear to the participants that terrain obstructions are different to obstructions
such as vegetation and buildings. WiPlan needs to convey this difference to
users more clearly. Finally, the link profile information window changes were
not obvious to the participants and they had to check and un-check the check
box three times to identify all of the changes. This could be addressed by
identifying what parts of the link profile information window have actually
changed in the tutorial so that the changes are more evident to the users.
Figure 9.9(b) shows the different map modes used during the tutorial. Par-
ticipants were unaware of the ability to zoom and pan so Figure 9.9(b) shows
only the pointer mode being used. Again, the tutorial should specifically in-
troduce the user to the zooming and panning tools. Figure 9.10(a) shows a
time-line of site and link events that occurred during the tutorial. An event
represents a site or link being created or removed. The events match what is
expected from the tutorial except for anomalies at the beginning and end of
the tutorial. Figure 9.10(a) shows that in step 1, the house was created three
times before being placed in the correct spot to complete that step.
0 500 1000 1500
Time (s)
Ste
p nu
mbe
r
0 500 1000 1500
05
1015
20
05
1015
20
(a) Timeline of tutorial steps completed.
0 500 1000 1500
Time (s)
Mod
e
0 500 1000 1500
Poi
nter
Zoo
m In
Poi
nter
Zoo
m In
(b) Timeline of map modes used during thetutorial.
Figure 9.9: Graphs showing a time-line of completed tutorial steps and mapmodes used during the tutorial of the second trial.
In step 22, at the end of the tutorial, the participants were asked to place183
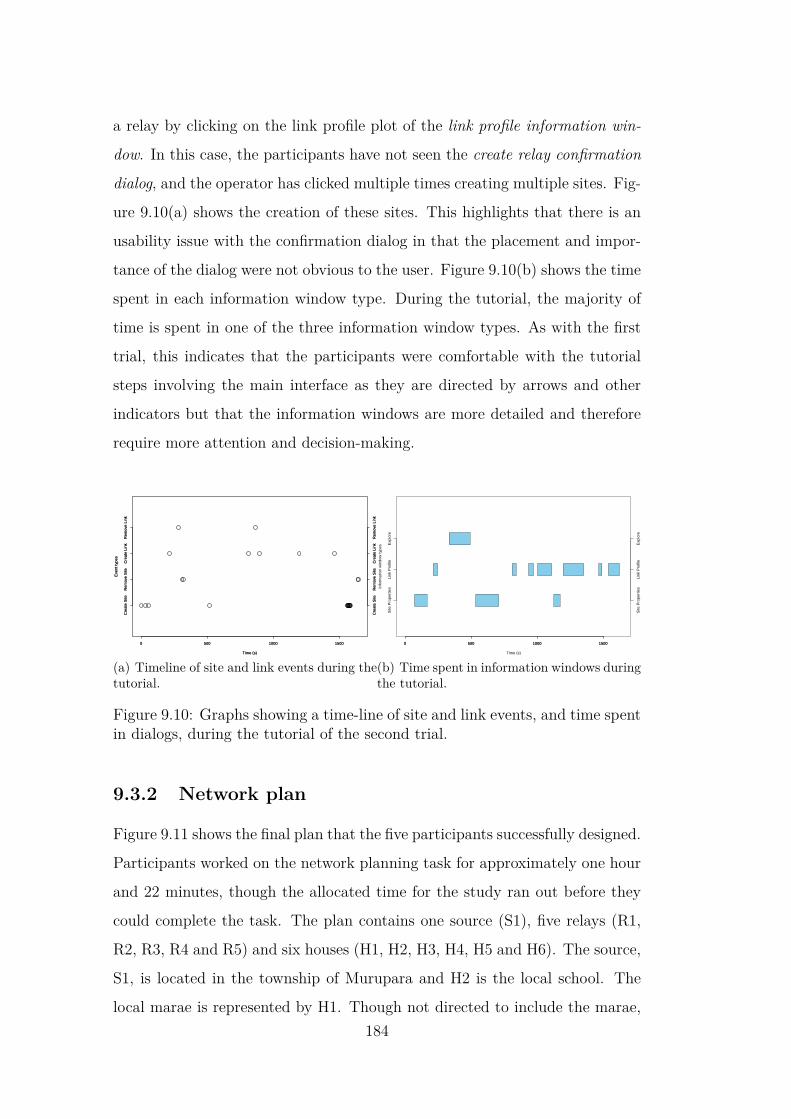
a relay by clicking on the link profile plot of the link profile information win-
dow. In this case, the participants have not seen the create relay confirmation
dialog, and the operator has clicked multiple times creating multiple sites. Fig-
ure 9.10(a) shows the creation of these sites. This highlights that there is an
usability issue with the confirmation dialog in that the placement and impor-
tance of the dialog were not obvious to the user. Figure 9.10(b) shows the time
spent in each information window type. During the tutorial, the majority of
time is spent in one of the three information window types. As with the first
trial, this indicates that the participants were comfortable with the tutorial
steps involving the main interface as they are directed by arrows and other
indicators but that the information windows are more detailed and therefore
require more attention and decision-making.
0 500 1000 1500
Time (s)
Eve
nt ty
pes
Cre
ate
Site
Rem
ove
Site
Cre
ate
Link
Rem
ove
Link
Cre
ate
Site
Rem
ove
Site
Cre
ate
Link
Rem
ove
Link
0 500 1000 1500
Time (s)
Eve
nt ty
pes
Cre
ate
Site
Rem
ove
Site
Cre
ate
Link
Rem
ove
Link
Cre
ate
Site
Rem
ove
Site
Cre
ate
Link
Rem
ove
Link
(a) Timeline of site and link events during thetutorial.
0 500 1000 1500
Time (s)
Info
rmat
ion
win
dow
type
s
0 500 1000 1500
Site
Pro
pert
ies
Link
Pro
file
Exp
lore
Site
Pro
pert
ies
Link
Pro
file
Exp
lore
(b) Time spent in information windows duringthe tutorial.
Figure 9.10: Graphs showing a time-line of site and link events, and time spentin dialogs, during the tutorial of the second trial.
9.3.2 Network plan
Figure 9.11 shows the final plan that the five participants successfully designed.
Participants worked on the network planning task for approximately one hour
and 22 minutes, though the allocated time for the study ran out before they
could complete the task. The plan contains one source (S1), five relays (R1,
R2, R3, R4 and R5) and six houses (H1, H2, H3, H4, H5 and H6). The source,
S1, is located in the township of Murupara and H2 is the local school. The
local marae is represented by H1. Though not directed to include the marae,184

the participants thought that they would connect the marae to the network.
H3 and H4 represent the home and wool-shed of the sheep and beef farmer.
H5 and H6 represent the home and milking shed of the dairy farmer. The plan
had a total cost of $11,207.
Figure 9.11: The final wireless network plan for the second trial
In general, the participants followed the multi-branch strategy discussed in
Section 2.3.5. However, particularly earlier in the trial, they moved around
map with no particular strategy and often back-tracked on decisions. As the
trial progressed, the participants became more comfortable with each other,
and began to discuss decisions more thoroughly before acting. The participants
put quite a lot of thought in to their decisions and spent quite a bit more
time on decision making than the participants in trial one. Participants were
apprehensive and conservative about creating sites and links in contrast to
participants from trial one who quickly created many sites and links in their
design. As the allocated time ran out for the trial, the participants were not
able to discuss their final design but they were quite impressed with the result.185
9.3.2.1 Planning approach and decisions
The participants immediately started following the guide. Taking the guide
wording literally, they decided that houses cannot be clustered as they are
fixed in place and cannot be moved. This led to confusion on how to begin
and what the actual task was. This indicates that the guide needs to be care-
fully worded to avoid confusion. After some group discussion and reading of
their personas, they quickly figured out that they were building a wireless net-
work to connect each of their homes to the Internet. The personas indicated
that Internet connectivity was desired but did not explicitly state that the
objective was to plan a wireless network to provide Internet connectivity.
The school principal suggested locating the village of Minginui. The dairy
farmer and community representative pointed at the approximate area on the
map, then the dairy farmer walked up to the screen and pointed out Minginui
(Figure 9.12). The participants were not familiar with topographic maps but
were able to determine the housing layout of Minginui. The school principal
pointed out that the school needed to be connected and so the participants
decided to locate the school and marae. While discussing the where the school
and marae were, the kaumatua pointed out the location of Murupara, the In-
ternet source of the network they were planning. The participants found the
school and marae, and the school principal made the observation that there
was at least one high hill between Murupara and the school.
The community representative then remembered his list of trig stations
and commented that they are usually at the highest points but he was not
sure what to do with the coordinates. The sheep and beef farmer remembered
the site adder tool and the participants decided to use the site adder tool to
add Whakaipu, the highest trig station on the community representative’s list.
After some confusion between NZTM and WGS84, the participants entered the
details for Whakaipu in the site adder tool. The site adder tool should provide
some explanation of NZTM and WGS84 including coordinate examples so that186
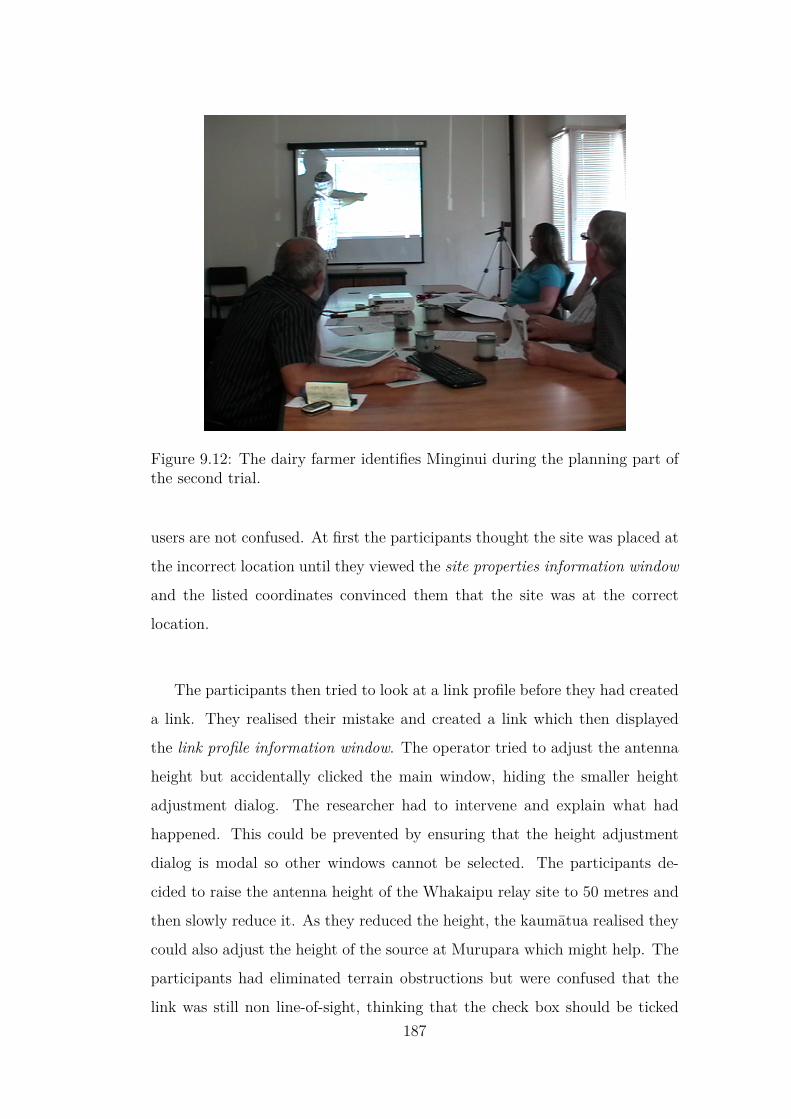
Figure 9.12: The dairy farmer identifies Minginui during the planning part ofthe second trial.
users are not confused. At first the participants thought the site was placed at
the incorrect location until they viewed the site properties information window
and the listed coordinates convinced them that the site was at the correct
location.
The participants then tried to look at a link profile before they had created
a link. They realised their mistake and created a link which then displayed
the link profile information window. The operator tried to adjust the antenna
height but accidentally clicked the main window, hiding the smaller height
adjustment dialog. The researcher had to intervene and explain what had
happened. This could be prevented by ensuring that the height adjustment
dialog is modal so other windows cannot be selected. The participants de-
cided to raise the antenna height of the Whakaipu relay site to 50 metres and
then slowly reduce it. As they reduced the height, the kaumatua realised they
could also adjust the height of the source at Murupara which might help. The
participants had eliminated terrain obstructions but were confused that the
link was still non line-of-sight, thinking that the check box should be ticked187
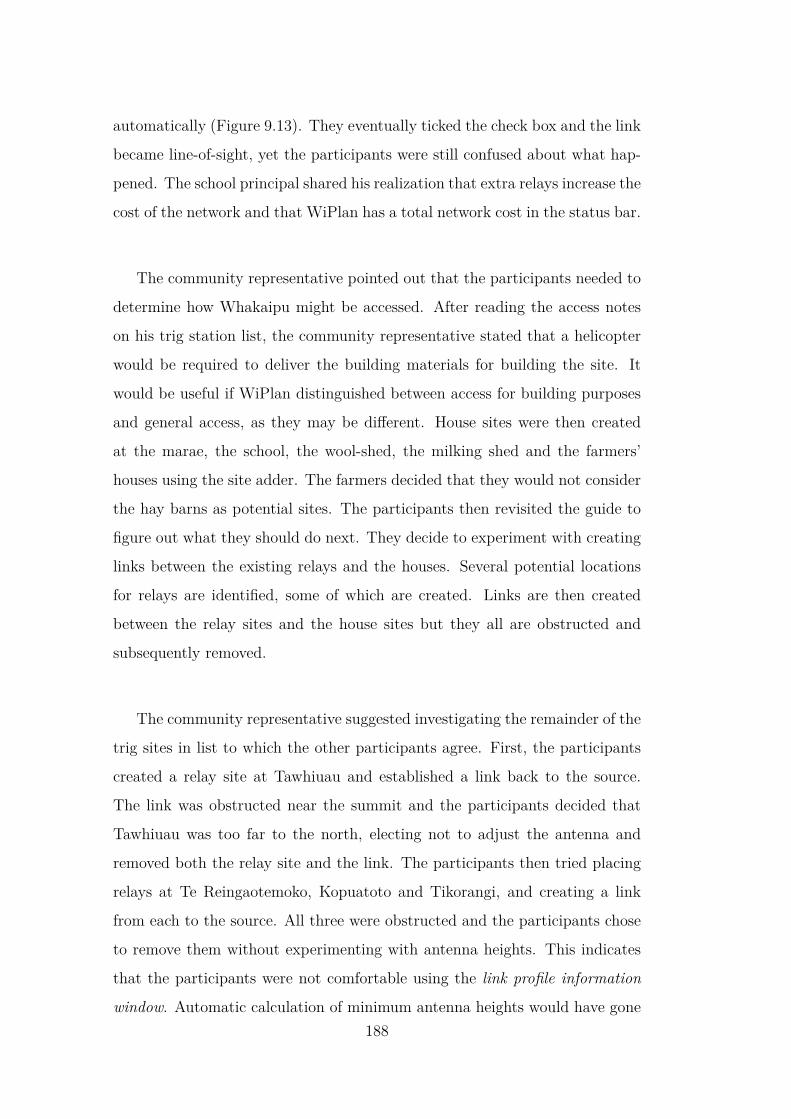
automatically (Figure 9.13). They eventually ticked the check box and the link
became line-of-sight, yet the participants were still confused about what hap-
pened. The school principal shared his realization that extra relays increase the
cost of the network and that WiPlan has a total network cost in the status bar.
The community representative pointed out that the participants needed to
determine how Whakaipu might be accessed. After reading the access notes
on his trig station list, the community representative stated that a helicopter
would be required to deliver the building materials for building the site. It
would be useful if WiPlan distinguished between access for building purposes
and general access, as they may be different. House sites were then created
at the marae, the school, the wool-shed, the milking shed and the farmers’
houses using the site adder. The farmers decided that they would not consider
the hay barns as potential sites. The participants then revisited the guide to
figure out what they should do next. They decide to experiment with creating
links between the existing relays and the houses. Several potential locations
for relays are identified, some of which are created. Links are then created
between the relay sites and the house sites but they all are obstructed and
subsequently removed.
The community representative suggested investigating the remainder of the
trig sites in list to which the other participants agree. First, the participants
created a relay site at Tawhiuau and established a link back to the source.
The link was obstructed near the summit and the participants decided that
Tawhiuau was too far to the north, electing not to adjust the antenna and
removed both the relay site and the link. The participants then tried placing
relays at Te Reingaotemoko, Kopuatoto and Tikorangi, and creating a link
from each to the source. All three were obstructed and the participants chose
to remove them without experimenting with antenna heights. This indicates
that the participants were not comfortable using the link profile information
window. Automatic calculation of minimum antenna heights would have gone188
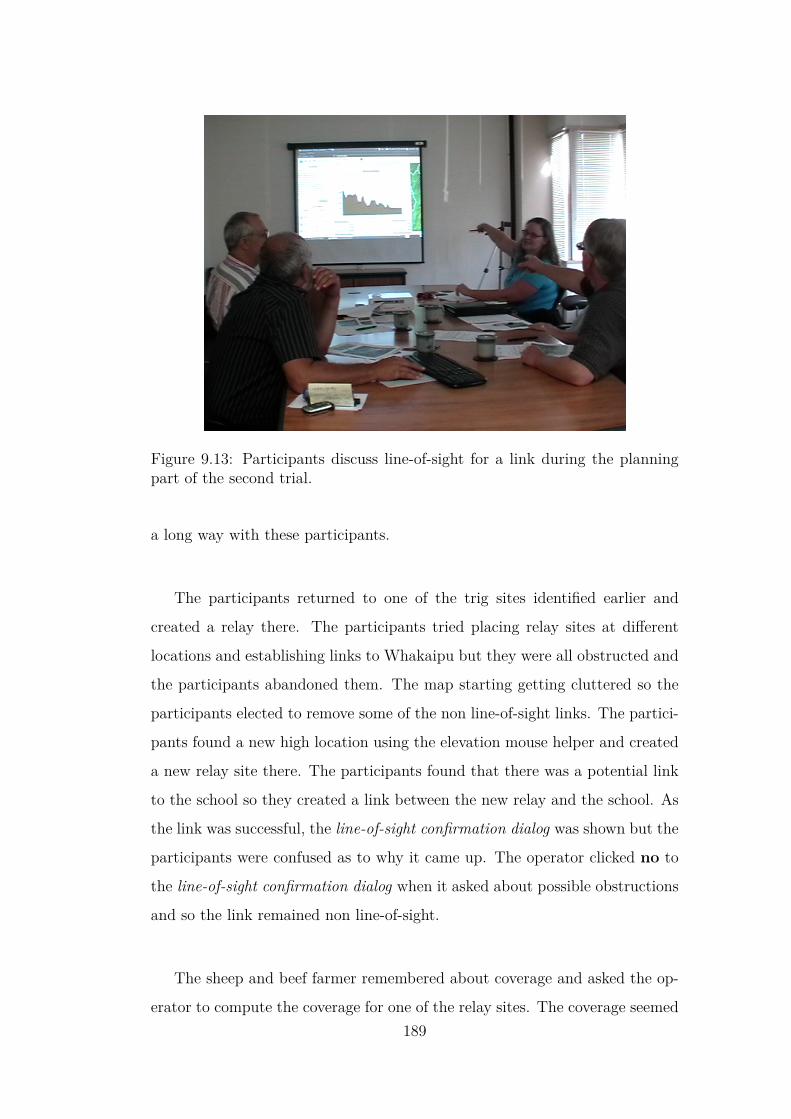
Figure 9.13: Participants discuss line-of-sight for a link during the planningpart of the second trial.
a long way with these participants.
The participants returned to one of the trig sites identified earlier and
created a relay there. The participants tried placing relay sites at different
locations and establishing links to Whakaipu but they were all obstructed and
the participants abandoned them. The map starting getting cluttered so the
participants elected to remove some of the non line-of-sight links. The partici-
pants found a new high location using the elevation mouse helper and created
a new relay site there. The participants found that there was a potential link
to the school so they created a link between the new relay and the school. As
the link was successful, the line-of-sight confirmation dialog was shown but the
participants were confused as to why it came up. The operator clicked no to
the line-of-sight confirmation dialog when it asked about possible obstructions
and so the link remained non line-of-sight.
The sheep and beef farmer remembered about coverage and asked the op-
erator to compute the coverage for one of the relay sites. The coverage seemed189

Figure 9.14: The community representative points out relay site coverage dur-ing the planning part of the second trial.
good and the kaumatua suggested that coverage might be a good way to deter-
mine how good a site location was. The participants created another relay site
and computed coverage but this time the coverage was poor so they removed
the site. They decided to return to the previous relay with good coverage and
raise the antenna height. The operator accessed the site properties information
window and entered five metres as a custom height, as the participants thought
that the current height was zero metres when it was actually four metres. The
operator recalculated the coverage, expecting to see an improvement but there
was no difference. The participants noticed that two of the relays that they
have placed provide good coverage of the northern part of the Te Whaiti valley
(Figure 9.14).
The participants investigated new links but each time the link was ob-
structed and they gave up. Eventually they returned to one of the non line-
of-sight links and look at the link profile. The participants then created a
new relay (R2) by clicking on the link profile plot and computed the coverage.
The coverage was poor but the participants decided to create a link between190

this new relay (R2) and Whakaipu. Participants were again faced by the line-
of-sight confirmation dialog; this time they took a bit of a gamble and were
delighted to see that the link was successful. The participants then created a
link between relay R2 and a relay created previously (R3). The link was ob-
structed and the participants had difficulty at first identifying the obstruction.
They raised one end to ten metres but the link still seemed obstructed. The
participants realised that they had not ticked the check box, so they ticked the
check box and the link succeeded.
The participants recomputed coverage on the relay sites to determine that
only some of the houses are covered. The school principal commented that
they should remove some of the old redundant relays and links and explore
how to get network connectivity to Minginui. The community representative
pointed out a trig station on the topographic map and the operator placed
a relay at that location (R4). The participants then decided to place a relay
in Minginui and the operator panned down the map with some difficulty to
Minginui. This is due to the inaccurate and laggy implementation of panning
in WiPlan. The sheep and beef farmer identifies a trig station near Minginui
as a good location for a relay. The operator created a relay at the trig station
location (R5) and seconds later WiPlan crashed, just minutes before the ses-
sion was due to end.
This process of finding a single relay site that is elevated above the rest of
the terrain and then experimenting with other sites and links resembles the
multi-branch strategy discussed in Section 2.3.5.
Figure 9.15(a) shows that the participants tried using the terrain map
and the satellite map but were most comfortable with the topographic map.
Figure 9.15(b) shows heavy interaction with the map between 0 and 1000
seconds, representing the initial period of exploration and finding Minginui and
Murupara. Figure 9.15(c) shows that event activity was slight (between 0 and191
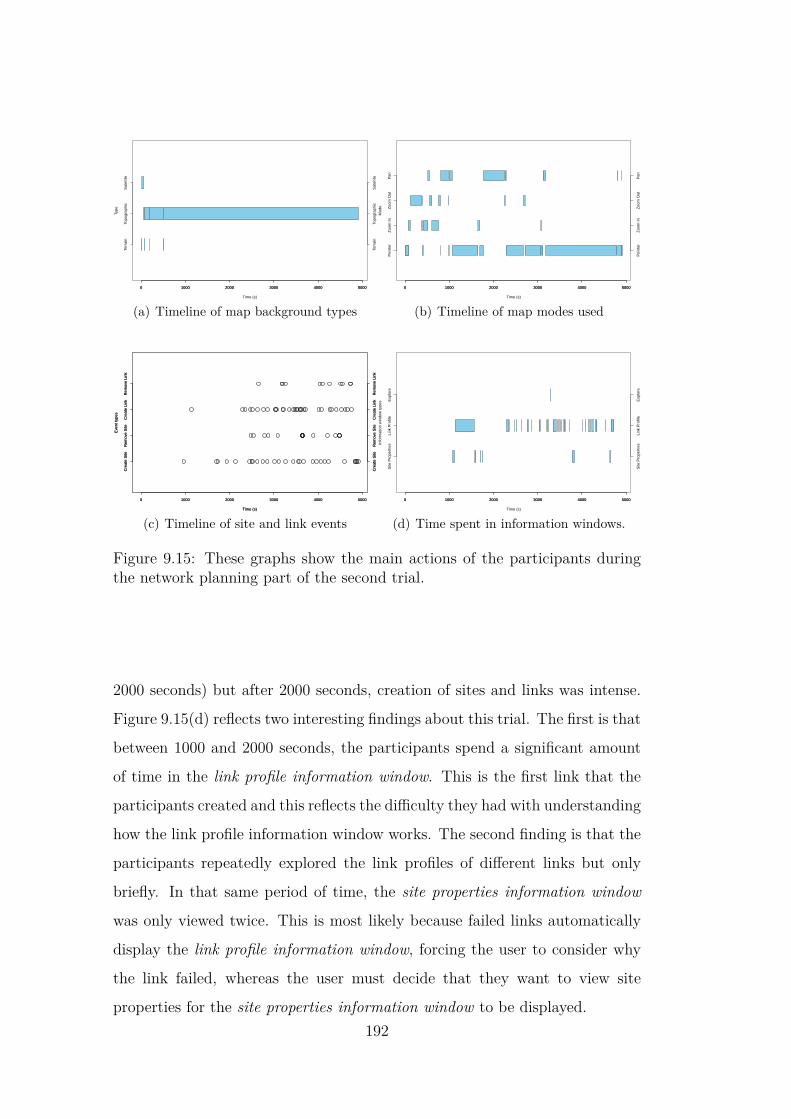
0 1000 2000 3000 4000 5000
Time (s)
Type
0 1000 2000 3000 4000 5000
Terr
ain
Topo
grap
hic
Sat
ellit
e
Terr
ain
Topo
grap
hic
Sat
ellit
e
(a) Timeline of map background types
0 1000 2000 3000 4000 5000
Time (s)
Mod
e
0 1000 2000 3000 4000 5000
Poi
nter
Zoo
m In
Zoo
m O
utP
an
Poi
nter
Zoo
m In
Zoo
m O
utP
an
(b) Timeline of map modes used
0 1000 2000 3000 4000 5000
Time (s)
Eve
nt ty
pes
Cre
ate
Site
Rem
ove
Site
Cre
ate
Link
Rem
ove
Link
Cre
ate
Site
Rem
ove
Site
Cre
ate
Link
Rem
ove
Link
0 1000 2000 3000 4000 5000
Time (s)
Eve
nt ty
pes
Cre
ate
Site
Rem
ove
Site
Cre
ate
Link
Rem
ove
Link
Cre
ate
Site
Rem
ove
Site
Cre
ate
Link
Rem
ove
Link
(c) Timeline of site and link events
0 1000 2000 3000 4000 5000
Time (s)
Info
rmat
ion
win
dow
type
s
0 1000 2000 3000 4000 5000
Site
Pro
pert
ies
Link
Pro
file
Exp
lore
Site
Pro
pert
ies
Link
Pro
file
Exp
lore
(d) Time spent in information windows.
Figure 9.15: These graphs show the main actions of the participants duringthe network planning part of the second trial.
2000 seconds) but after 2000 seconds, creation of sites and links was intense.
Figure 9.15(d) reflects two interesting findings about this trial. The first is that
between 1000 and 2000 seconds, the participants spend a significant amount
of time in the link profile information window. This is the first link that the
participants created and this reflects the difficulty they had with understanding
how the link profile information window works. The second finding is that the
participants repeatedly explored the link profiles of different links but only
briefly. In that same period of time, the site properties information window
was only viewed twice. This is most likely because failed links automatically
display the link profile information window, forcing the user to consider why
the link failed, whereas the user must decide that they want to view site
properties for the site properties information window to be displayed.192

9.3.3 Local knowledge consideration for relay creation
The key attributes of the five relays are shown in Table 9.7 and Table 9.8.
The participants explored the list of trig station sites that the community rep-
resentative had as part of his information. They placed Relay R1 at a trig
station site on the mountain known as Whakaipu which has an elevation of
1034 metres. Participants noted in the site properties information window
that the best access would be via helicopter as they realised that getting the
building materials to the site would be difficult due to poor access. However
the participants did not tick the permission check box or leave notes regarding
placement. The participants actively discussed that the summit of Whakaipu
could be accessed via a three kilometre motorbike track followed by hiking
approximately 600 metres up the mountain but recorded no details in the ac-
cess notes. Participants did not notice that the power source was set to mains
power; the power source should have been set to solar power as it is unlikely
that there would be mains power at that location. The participants deter-
mined that the antenna height at relay R1 needed to be five metres in order to
have line-of-sight to source S1 in Murupara. They achieved this by raising the
antenna at Murupara to 15 metres which is realistic as the Murupara antenna
could be located on a high building.
Relay Trig site Easting Northing Elevation1 Yes 1935586m 5724102m 1026m2 No 1930190m 5720551m 684m3 No 1927393m 5721516m 313m4 Yes 1926578m 5719168m 407m5 Yes 1923065m 5715772m 420m
Table 9.7: A summary of the relays placed in the second trial identifyingwhether the relay was placed at a trig site and details of the geographic coor-dinates.
The location of relay R2 was placed in scrub-covered hills on the eastern
side of the valley. The elevation of the site is 684 metres and provides line-of-
sight from relay R1 at Whakaipu in to the Te Whaiti valley. Relay R2 connects193

directly to the wool-shed owned by the sheep and beef farmer. Relay R2 also
connects directly to relay R3. The participants determined that the antenna
height should be ten metres which is high but not unreasonable. Participants
did not notice that the power source was set to mains power; the power source
should have been set to solar power as it is unlikely that there would be mains
power at that location. The participants did not indicate that they had per-
mission to place the site or identify the dominant form of transport to access
the site. They also did not record any notes for placement or access. This
indicates that the participants did not notice the placement and access areas,
or did not think they were important. This could be addressed by WiPlan
prompting the user to at least select the dominant form of transport and re-
mind them about permission.
Relay Antenna height Power supply Permission Access1 5m Mains Unknown Helicopter2 10m Mains Unknown Unknown3 10m Mains Unknown Unknown4 10m Mains Unknown Unknown5 4m Mains Unknown Unknown
Table 9.8: A summary of the relays placed in the second trial identifying theantenna height and power supply, as well as detailing whether permission andaccess were considered.
Relay R3 was placed in scrub-covered hills at an elevation of 313 metres on
the western side of the valley. Relay R3 is connected to relay R2 and relay R4.
Relay R3 also provides coverage to the marae, the school, the dairy farmer’s
milking shed and the houses of both farmers. The antenna height is ten metres
high and the site operates on mains power. The participants did not indicate
whether they had permission or how best to access the site.
Relay R4 was placed near a trig site at an elevation of 407 metres to pro-
vide connectivity further down the valley. Relay R4 connects to relay R3 but
participants ran out of time before they could finish their plan. The antenna
height is ten metres high and the site operates on mains power. The partici-194
pants did not indicate whether they had permission or how best to access the
site.
Relay R5 is also placed near a trig site at an elevation of 420 metres with
the intention of providing coverage to Minginui village. Relay R5 is not con-
nected to any other sites but indications are that the participants were looking
at connecting it to relay R4. The antenna height is four metres high and the
site operates on mains power. The participants did not indicate whether they
had permission or how best to access the site.
This discussion shows that the placement and access information has not
been well used. Of the five sites, only one site had the best access type selected.
None of the sites indicated permission or had notes on placement or access.
Also no general information was entered for any of the house sites or the source
site. It is possible that if the participants had more time for the planning task,
they may have revisited these issues. This indicates that either the participants
did not know what they should enter in these fields or that the fields were
ignored. Either way, the importance of this information needs to be obvious
to the user, and the requested information needs to be more specific than just
empty text fields. Also, participants did not seem to consider the power source
for any of the relays as they were all set to mains power. It is unlikely that
mains power would be available at any of the relay sites, particularly relay R1
and relay R2.
9.3.4 Usability issues
The community representative commented that “WiPlan has a way to go but
is a great idea and very useful if it can be refined”. Participants found that
some of the terminology is too technical and needs to be described using every
day language. The community representative described scrolling to find the
OK button as his “pet hate”. The kaumatua questioned why the window close
button was on the left-hand side rather than the right-hand side of the window.195

The researcher observed that in the site adder tool, participants were confused
about the meaning of NZTM and WGS84, and about which one they should
use.
Guide and tutorial The school principal pointed out that the overall best
strategy was not evident and that the guide should reflect this as some of the
wording in the guide was unclear. The sheep and beef farmer mentioned that
the tutorial should refer to the legend further and introduce the site adder tool.
The researcher observed that generated windows such as the site properties
information window would block the tutorial and guide from view, and that
the operator would then have to move the dialog to the right. The animated
arrows indicating where sites and links should be created did not appear to
be strong enough indicators as the participants struggled at the beginning of
the tutorial with placing a house site at the point denoted by the animated
arrow. Also, when the tutorial discusses the line-of-sight check box in the
link profile information window, the tutorial says that the information window
has changed but does not explain how. The participants found it difficult to
identify what had actually changed in the window.
Link profile dialog The participants had difficulty identifying terrain ob-
structions on the link profile plot and differentiating terrain obstructions from
potential obstructions such as vegetation and buildings. The community rep-
resentative commented that they did not know the meaning of protocol and
why it was there.
Other Participants had difficulty at times distinguishing between the icons
for a source, relay and house site. Participants did not notice the zooming
and panning buttons or the drop-down list for selecting the map background.
The participants found the explore local area feature was confusing and the
community representative described it as a “horrible bloody map”.196

9.3.5 Expert feedback
The chief technical officer of a local ISP with ten years experience in wireless
network planning in rural areas (the wireless network expert introduced in Sec-
tion 8.3) was asked to comment on the plan designed by the five participants.
He commented that the plan was reasonable but that five relays is excessive
for an area of that size; he would realistically expect to see a maximum of
three solar sites to serve the Te Whaiti valley area. He was pleased that par-
ticipants identified that placing sites with decent coverage is a good approach.
The participants did not consider cost as much as he would like, most likely
due to the relay site costing within WiPlan being too low. This indicates that
costs within WiPlan should be further investigated in future work to ensure
they are realistic. The expert noted that the plan was partially incomplete but
said it was clear how the plan would be completed to include Minginui village.
The expert stated that the most significant oversight by the participants is
that extra sites incur not only building costs but maintenance costs as well,
as sites are unreliable. The expert was concerned about the feasibility of the
Whakaipu site due to how difficult the site seemed to access. Participants
considered the difficulty involved in accessing Whakaipu and elected to use
a helicopter. This highlights the issue of cost involved and indicates that in
future work, extra cost should be included by WiPlan when a helicopter is
used for access.
9.4 Chapter findings
Both trials showed that participants could successfully complete the tutorial
and plan feasible wireless networks for their rural area. This section addresses
the three questions introduced at the beginning of the chapter as follows.197
9.4.1 Did the participants engage in role-playing their
personas and collaborate on planning the wireless
network?
The study design successfully enabled participants to plan a wireless network
for a geographic area about which they had no prior knowledge. The partici-
pants were able to engage with their role-playing personas and provide some
local knowledge during the planning process. Providing refreshments during
the trials helped to create a relaxed and community-like atmosphere. The
study design was conservative compared to a real meeting because community
members would readily have the local knowledge, whereas in the study design,
participants are expected to memorise new information. Therefore the em-
phasis of the study design is on whether any local knowledge was used during
the network planning process. Participants did remember and use this local
knowledge, however they found it difficult to memorise local knowledge from
their information sheets and plan the wireless network in the short period of
time that took place.
In both trials, participants remembered elements of local knowledge and
were able to collaboratively apply those elements in certain situations. In the
first trial, the participant role-playing the sheep and beef farmer engaged with
his persona; he examined the farm map supplied and questioned a wireless link
that passed over a shelter-belt on his farm. The community representative also
engaged with his persona; he examined the list of trig station locations which
the participants explored for placing relay sites. All participants considered
their allocated budget for planning the network. In the second trial, the com-
munity representative ensured that the village of Minginui was included in the
network plan and examined the list of trig station locations which the partici-
pants explored for placing relay sites. The dairy farmer noticed that using the
Fencepost portal would require an Internet connection at his milking shed to
monitor milk levels and so ensured his milking shed was connected to the net-198
work. The school principal ensured that the school received a good connection
so that they could use video conferencing.
The study design proved to be effective in providing participants with local
knowledge and providing a role-playing game to simulate planning a wireless
network for a rural community. Participants were able to remember elements
of local knowledge from their information sheets and apply those elements in
appropriate situations. The study design could be improved by allowing more
time for the trials to take place and providing photos or video of the area
so participants could see what the terrain and vegetation are like. The trials
have shown that middle-aged participants with moderate comfort using com-
puters engage more with their personas and associated information. Providing
some sort of incentive for participants to engage more with their personas and
associate local knowledge may also help. Real community members have the
incentive of an actual wireless network to connect them to the Internet but par-
ticipants will not have this encouragement. An ’ask the researcher’ approach
may be an alternative to information sheets for the study design. Rather than
trying to remember local knowledge from their information sheets, participants
could ask the researcher questions. The research could then determine using
some process whether the participant receives an accurate answer, a vague
answer or no answer at all.
9.4.2 Did the tutorial assist participants with decision
making and troubleshooting during the wireless
network planning process?
The tutorial taught participants the wireless networking planning process and
introduced them to the tasks that the participants would need to carry out
and decisions during the process. The tutorial was successfully completed in
both trials, indicating that the tutorial introduces an even amount of informa-
tion at each step and that the information is described at an appropriate level.199

Most of the features introduced during the tutorial were straight-forward and
participants understood how each feature was useful. The participants from
the first trial quickly applied the process taught by the tutorial and were able
to make decisions based on techniques conveyed by the tutorial in the network
planning phase. However, participants in the second trial found it difficult
to recall the wireless network planning process from the tutorial one they be-
gan the network planning phase. This indicates that WiPlan should provide
additional planning assistance to users by implementing a wizard or task man-
agement support mechanism. It would also be useful for WiPlan to flag issues
and guide the participants to address the issue. An example of such an issue
would be a network design that is incomplete. Participants in the second trial
did remember troubleshooting techniques from the tutorial and were able to
use them. The tutorial showed that here is no right or wrong order to execute
tasks in wireless network planning, as tasks with dependencies cannot be exe-
cuted until the dependencies are addressed.
The two main difficulties encountered with the tutorial was with the ex-
plore local area information window and the link profile information window.
The explore local area information window was considered confusing and dif-
ficult to use in both trials. Participants had difficulty understanding the link
profile information window in trial two as they did not understand the differ-
ence between obstructions caused by terrain and obstructions caused by other
objects such as trees and buildings. Participants in trial two also seemed to
have difficulty deciding whether to pursue line-of-sight by adjusting antenna
heights or to simply abandon the link.
The tutorial did help participants with decision making and troubleshoot-
ing in both trials. The tutorial could be improved to make it easier for partici-
pants to understand. The main issue that participants had was understanding
the tutorial wording. Some of the terminology used was too technical and in
some cases, the tutorial steps were not verbose enough for participants to gain200
a full understanding of what that tutorial step accomplished. However the
trials have shown that the tutorial does help participants to learn techniques
necessary for wireless network planning and help them with decision making.
9.4.3 Were the participants able to plan a wireless net-
work and draw out relevant local knowledge dur-
ing the process?
The participants successfully planned feasible networks in both trials. Par-
ticipants created house and relay sites, discussed access, created links, solved
line-of-sight issues and computed coverage. Participants successfully planned
wireless networks within budget in both trials. The wireless expert was asked
which network plan was the more efficient solution and whether they would
change it. He chose the wireless network plan from trial one but would change
the plan by connecting the houses to a relay rather than to each other. He
pointed out that the key to the whole network is the Whakaipu relay site and
that he would have to seriously look at access and placement before deciding
to place a relay site there. He commented that the Te Whaiti valley is unique
in that it is surrounded by national park, thick with vegetation, and poses a
difficult wireless network planning problem. He was impressed that in both
trials, participants planned a feasible wireless network for the Te Whaiti valley.
WiPlan supported the use of all five strategies for wireless network plan-
ning, discussed in Chapter 2. In both trials, participants followed the multi-
branch strategy (Section 2.3.5). Participants from the first trial were expected
to follow one of the five strategies due to their computer science background.
However, it was encouraging that participants from the second trial also fol-
lowed one of the five strategies and that it was the same strategy that the
participants from the first trial used. It is important to note that the partici-
pants in the second trial originally started following the guide (the participants
from the first trial completely ignored the guide), which steps users through201
the reverse-branch strategy (Section 2.3.4). However, the participants aban-
doned the reverse-branch strategy at the first step and naturally followed the
multi-branch strategy instead.
Participants were able to draw out some local knowledge but as already
mentioned, participants found it difficult to memorise local knowledge from
cards and plan a wireless network in short period of time. Local knowledge
relevant to site access received the most attention from participants. Partici-
pants tended to discuss access to sites but not actually enter that information
in to the site properties information window. In the first trial, the participants
created three relay sites. They entered the best access type for two of the sites;
one site was by helicopter and the other by 4WD. The participants entered
access notes for one site, explaining that the site could also be accessed via
a walking track. This walking track was identified on the community repre-
sentative’s trig station list. In the second trial, participants created five relay
sites. They entered the best access for one site as being by helicopter and did
not enter any access notes.
Participant consideration of placement issues was poor, though this may
have been influenced by not having enough time for planning the network.
Also, most of the sites were placed in what participants would consider to be
public areas and therefore participants may have thought that placement was
not an issue. In the first trial, participants indicated that they had permis-
sion to place one of the three sites but did not explain who that permission
was from. None of the sites had notes about placement issues. There was
little consideration of cultural issues and no consideration of weather condi-
tions. Participants did however consider the power source, electing to use solar
power for two of the relay sites and mains power for the other relay site. In the
second trial, participants did not indicate permission or enter any placement
notes for any of the sites. There was little consideration of cultural issues and
no consideration of weather conditions or power source.202

Participants in two separate trials successfully created feasible wireless net-
work plans within a given budget. This is a promising result and shows that
WiPlan was effective in supporting the planning of a wireless network. Partic-
ipants from both trials followed the multi-branch strategy for planning their
wireless networks which reinforces the success of WiPlan. The participants
were able to draw out local knowledge, though not as well as was expected.
Solicitation of local knowledge could be improved with minor changes to Wi-
Plan and the study design. Future work should include making the access
and placement information that is asked for in the site properties information
window more specific and making the prompts more forceful for getting the
user to enter that information to assist with local knowledge solicitation. Fu-
ture changes to the study design could include helping with local knowledge
solicitation by allowing more time for the participants to plan their wireless
network and investigating alternative methods for simulating local knowledge,
such as the ’ask the researcher’ method explained in Section 9.4.1.
9.4.4 What are the main threats to validity and limita-
tions of the evaluation results?
Though role-playing results have given a strong indication of validity, there is
a risk that the role-playing is not wholly representative of end users. However,
the roles were well researched and based on real members of rural communities
so this risk has been minimised. Local knowledge solicitation is theoretically
more difficult in a role-playing scenario than in a real end user scenario be-
cause the local knowledge is simulated. In a real end user scenario, the local
knowledge already exists (as long as there is a good mix of local community
members). Also, end users would have more enthusiasm to achieve their goal
of a community network. This is evident by the community involvement in
the physically building the CRCnet and Tuhoe community wireless networks.
203
One limitation of these results is that the performance of WiPlan was not
compared to that of another planning tool. Unfortunately, most of the avail-
able tools were either too complex to expect end-users to operate or the tools
did not support point-to-point wireless network planning (discussed in Chap-
ter 3). A comparison using Radio Mobile is possible as part of future work,
though would require the participants to undertake a training session before
planning a wireless network. The idea of the training session would be similar
to the WiPlan tutorial, though the training session would not be interactive
and would be limited in how it assisted the users.
It would have been ideal if the WiPlan user evaluation was conducted
using actual people from Te Whaiti. However distance and time constraints
(as mentioned in Section 9.1) made this difficult to achieve. It is important
to note that the expert rural wireless network planner that evaluated WiPlan
and the user study results was the same expert that planned the Te Whaiti
network and had good local knowledge of the Te Whaiti area. As mentioned in
Chapter 8, it would be interesting to obtain expert reviews from other wireless
network planning experts as future work to see if their opinions about WiPlan
concur.
9.5 Chapter summary
This chapter explored the influence that WiPlan has on the wireless network
planning process. The chapter introduced the study design, describing the
importance of role-playing and how role-playing characters based on rural per-
sonas is used in the study design. The chapter introduced the Te Whaiti valley
that the study design is based on and presented evidence for why the Te Whaiti
valley was an appropriate choice. The chapter then presented the findings of
the trials; the first with computer science student participants and the sec-
ond with older non-academic participants who were moderately comfortable
using computers. The tutorial was successfully completed in both trials and a204
complete network was planned in the first trial. The network plan was nearly
completed in trial two but the participants ran out of time. Minor issues were
identified within WiPlan during the trials. An expert found that both net-
work plans were feasible and that the plan from trial one was preferable. Some
threats to validity and limitations of the evaluation results were also addressed.
Overall, the study design proved to be an effective method for evaluating
WiPlan. The study design was able to provide participants with local knowl-
edge and use a role-playing game to simulate planning a wireless network for
a rural community. Participants engaged in role-playing their personas and
collaborated on planning the wireless network. Participants in both trials suc-
cessfully completed the WiPlan tutorial and used the techniques that they
had learned to plan their wireless network with few problems, showing that
the tutorial helped to teach users the wireless network planning process. Wi-
Plan successfully assisted participants in both trials to create wireless network
plans within a given budget and help those participants with soliciting local
knowledge. Suggestions for improving the study design and WiPlan were also
mentioned.
205


Chapter 10
Conclusions
There is a need for broadband Internet in rural areas due to a long history of
low telecommunications investment in rural areas of New Zealand. To address
this need for rural broadband, point-to-point wireless technology is identified
as an appropriate solution for providing broadband Internet to rural areas
(Section 1.1). The CRCnet project established that involving the local com-
munity in the planning of the wireless network can help reduce planning costs
and can bring a number of social benefits to the community.
The CRCnet project established general construction guidelines and used
commodity hardware to build six wireless networks, providing inspiration and
lessons for this thesis (Section 1.2). Local communities have the best local
knowledge of their area including detailed knowledge of the physical environ-
ment as well as knowledge about culturally sensitive areas and potential social
issues. This leads to the following research question that is asked in the intro-
duction of this thesis:
Can a software tool be designed to assist members of rural com-
munities with no expertise in wireless network planning, to plan a
feasible wireless network?
Wireless network planning is not only complex but involves a broad set of
constraints. These include technical, natural and human constraints. The207

complexity (Section 2.1) and broadness of constraints (Section 2.2) establishes
the need for a wireless network planning strategy. Five strategies for wireless
network planning are identified (Section 2.3), including associated planning
tasks (Section 2.4).
Computer-assisted planning is determined to be an appropriate approach
for planning wireless networks in rural areas (Chapter 3). This is because
computer-assisted planning can guide rural community members through the
wireless network planning process and supports an incremental approach for
soliciting constraint information from community members using local knowl-
edge.
To investigate the feasibility of rural communities planning a wireless net-
work, the WiPlan system for wireless network planning was developed. A key
issue in wireless network planning is determining the feasibility of a link. Wi-
Plan addresses this issue with a sub-system that hides the complex details from
the user. The sub-system is designed such that a user only needs to create a
link between two sites and WiPlan will determine whether the link is feasi-
ble. Determining the feasibility of a link begins with a radio wave propagation
model to determine whether the link is line-of-sight and to estimate the degree
of loss that the link will experience.
Evaluation of the eleven most popular radio wave propagation models (Sec-
tion B) has established that the irregular terrain model and the ITU terrain
model are the most suitable models for rural New Zealand due to their sup-
port of terrain, frequency and distance. The link profile tool and area profile
tool use the irregular terrain model and the ITU terrain model to predict con-
nectivity and coverage respectfully (Section 5.2). Finally, a decision tree was
developed that uses the loss and line-of-sight predictions from the link profile
tool to present the user with a non-technical explanation of whether the link
is feasible (Section 5.2).208

A major focus of a wireless network planning system for people with no
planning expertise is the user interface design. Personas are used as a basis
for designing the user interface of WiPlan. WiPlan is designed around the
principles of local knowledge and user support; the design of WiPlan is de-
scribed in Chapter 6. The WiPlan tutorial introduces the user to key wireless
network planning actions and conveys a planning process for users to follow.
The WiPlan system is subjected to the same analysis as the existing planning
tools described in Section 3.2.1.
A novel evaluation technique, structured as a role-playing game, was devel-
oped to explore howWiPlan assists users with planning a wireless network for a
rural area (Chapter 9). Two trials took place; the first with computer science
student participants (Section 165) and the second with older non-academic
participants (Section 9.3 ). The participants engaged in role-playing their per-
sonas and collaborated on planning the wireless network. The trials showed
that the tutorial included in WiPlan taught the participants the wireless net-
work planning process, as participants in both trials were able to follow the
planning process and execute tasks to plan a rural wireless network.
Some threats to the validity of this evaluation technique were identified in
Section 9.4.4. Though role-playing results have given a strong indication of
validity, there is a risk that the role-playing is not wholly representative of end
users. However, the roles were well researched and based on real members of
rural communities so this risk has been minimised.
One limitation of these results is that the performance of WiPlan was not
compared to that of another planning tool. Unfortunately, most of the avail-
able tools were either too complex to expect end-users to operate or the tools
did not support point-to-point wireless network planning (discussed in Chap-
ter 3).209

It would have been ideal if the WiPlan user evaluation was conducted us-
ing actual people from Te Whaiti. However distance and time constraints (as
mentioned in Section 9.1) made this difficult to achieve. It is important to note
that the expert rural wireless network planner that evaluated WiPlan and the
user study results was the same expert that planned the Te Whaiti network
and had good local knowledge of the Te Whaiti area.
WiPlan assisted participants in successfully planning feasible networks in
both trials and solicited local knowledge from participants throughout the
planning process. Participants created house and relay sites, discussed access,
created links, solved line-of-sight issues, computed coverage and were lead
by WiPlan to discuss how their local knowledge impacted on site access and
placement. Participants successfully planned wireless networks within budget
in both trials.
210
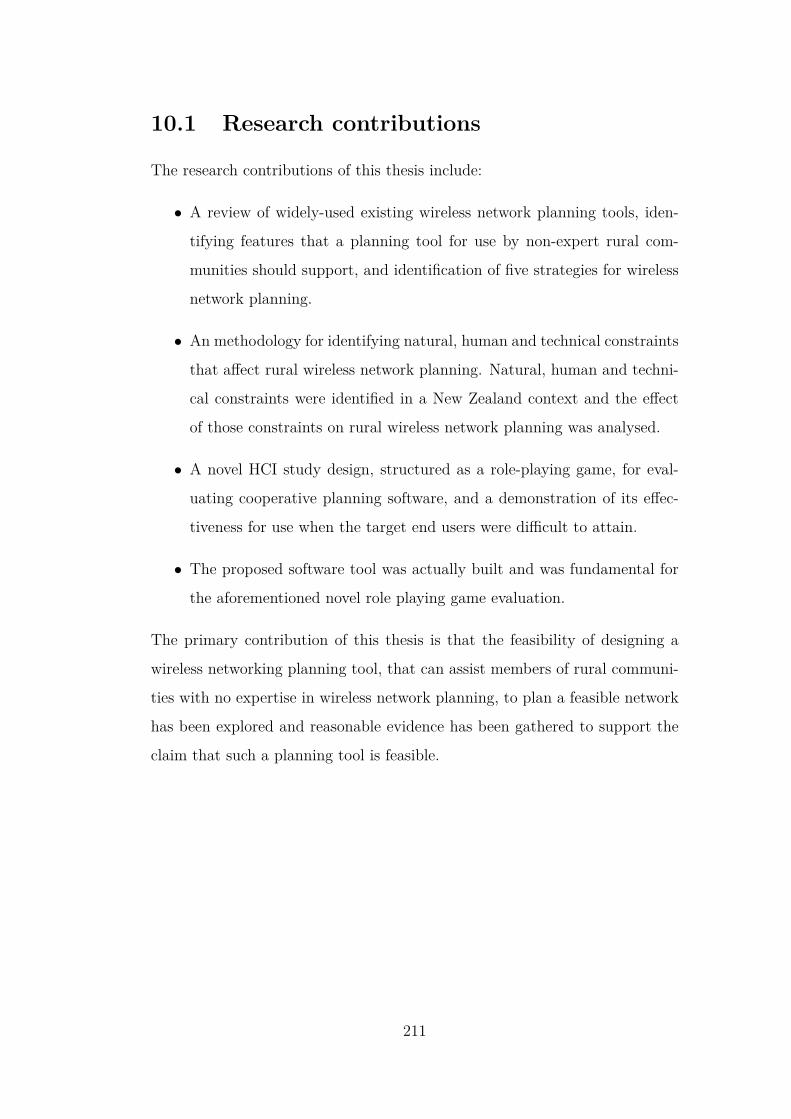
10.1 Research contributions
The research contributions of this thesis include:
• A review of widely-used existing wireless network planning tools, iden-
tifying features that a planning tool for use by non-expert rural com-
munities should support, and identification of five strategies for wireless
network planning.
• An methodology for identifying natural, human and technical constraints
that affect rural wireless network planning. Natural, human and techni-
cal constraints were identified in a New Zealand context and the effect
of those constraints on rural wireless network planning was analysed.
• A novel HCI study design, structured as a role-playing game, for eval-
uating cooperative planning software, and a demonstration of its effec-
tiveness for use when the target end users were difficult to attain.
• The proposed software tool was actually built and was fundamental for
the aforementioned novel role playing game evaluation.
The primary contribution of this thesis is that the feasibility of designing a
wireless networking planning tool, that can assist members of rural communi-
ties with no expertise in wireless network planning, to plan a feasible network
has been explored and reasonable evidence has been gathered to support the
claim that such a planning tool is feasible.
211

10.2 Future work
The key area of future work would involve an evaluation with real end users
working on planning a new wireless network for their local community. Con-
ducting an evaluation with real end users would require improving the cost
modeling within Wiplan, as well as refining other aspects in WiPlan. An eval-
uation with real end users would then provide a benchmark for accurately
comparing the role-playing planning approach. WiPlan could also be used
with an existing network design to evaluate performance, and compare it to
measured performance data if the network actively exists. Refinements and ex-
tensions for WiPlan are discussed in this section. Also, two potential avenues
for future research are introduced: testing radio wave propagation models and
exploring application domains.
10.2.1 WiPlan
Refinements and extensions for WiPlan were identified during evaluation that
should be addressed in future work. Vector data support, such as vegetation,
roads and buildings, makes it possible for appropriate radio wave propaga-
tion models to predict the effect of these objects on radio wave propagation.
For example, the effect of vegetation on radio wave propagation could be pre-
dicted. The ability to predict loss due to vegetation increases the confidence
in whether a given link is feasible.
Further integration of the area profile tool within WiPlan would provide
more flexibility for coverage prediction including custom distance ranges and
coverage segments. The focus of WiPlan so far has been on point-to-point links
and as a result, coverage prediction is currently limited in WiPlan. Further
integration would require a user interface window that allowed parameters to
be specified for computing a coverage plot. Support for custom distance ranges
and coverage segments would assist in the exploration of the rural area for site
placement.212

Algorithmic planning support and integration of network analysis tech-
niques would assist in the technical design of wireless network plans. Minimum
antenna height calculation support in WiPlan when establishing links would
provide further information to the user about the cost and feasibility of a link.
Automatic frequency planning for optimally assigning radio channels to links
in the network would help to minimise potential interference for the wireless
network plan. Providing analysis support would be a major step forward for
WiPlan. Such analysis includes: predicting interference within the network
and from other sources; network capacity; and network reliability. The ability
to perform this analysis on a wireless network plan would help to validate the
technical performance of the plan.
The wider network planning process around WiPlan could be further ex-
plored to determine how a community gets to the point of using WiPlan to
plan a wireless network and what happens afterward. For example:
• Identifying methods of making rural communities aware that they could
plan their own wireless network to provide broadband Internet.
• Establishing how interested members of the rural community become
involved in a community network project.
• Making WiPlan available for the community to obtain.
• Establishing a procedure for how network planning meetings should oper-
ate including information about how many hours the community should
spend on the project.
• Identifying the methods of planning advice available to the community.
• Describing a procedure for how a wireless network plan is verified by a
wireless network planning expert.
• Establishing a procedure for finalising a wireless network plan and ar-
ranging with the expert for the network to be built.213
10.2.2 Testing radio wave propagation models
WiPlan could be used as a testbed for developing and testing radio wave prop-
agation models. A corpus of real-world wireless network plans with associated
measurement data would allow wireless network plans to be selected for testing
in WiPlan. For example, the corpus could contain a network plan for the Tuhoe
network (Section 1.2.1.2). This network plan would contain all of the sites and
links that make up the Tuhoe network. Each link of the Tuhoe network would
have a set of measurement data associated with it. The measurement data
would include key performance data, such as measured loss, over a suitable
time period. Radio wave propagation models could be modularised such that
models could be swapped in and out of WiPlan. This would allow the loss,
and possibly other factors, to be predicted by these radio wave propagation
models which could then be compared to the real-world measurements. Effects
due to distance and terrain are supported by WiPlan. The addition of vector
data support to WiPlan would allow models that address objects other than
terrain, such as vegetation and buildings, to be developed and tested.
10.2.3 Exploring application context
The application context of cooperative community planning could be explored.
WiPlan has established that a community of people can plan a feasible wireless
network for a rural area in New Zealand. Therefore it is conceivable that other
types of communities could also plan a wireless network for their given context.
One example of a different application context would be planning a wireless
network within an apartment building. Residents of the apartment building
could work together to plan a wireless network to provide Internet connec-
tivity to every resident. WiPlan could assist these residents with planning
this apartment network. WiPlan would require vector support and radio wave
propagation models for predicting loss due to building materials. The impor-
tance of the constraints involved may change to compared to their importance214
in rural areas. For example, most natural features would be irrelevant in an
apartment building. New constraints may need to be considered and as a re-
sult, other local knowledge may be required. Social and cultural constraints
may be more prominent in an apartment building than in rural areas due to po-
tential diversity of cultures and high density of people. Parts of an apartment
building may be communal, such as a community centre or religious meeting
place. This could introduce further cultural and social constraints that would
not have an affect in the rural context.
Another example of a different application context would be investigating
a rural setting outside of New Zealand that has different constraints and re-
quirements for local knowledge. Such a setting could be the Australian outback
where large areas of the terrain are almost completely flat and the population
density is approximately 1 person per 100 square kilometres. An interesting
constraint is that Ayers Rock and Kata Tjuta, the major areas of elevated
terrain in the central outback, are sacred in the Aboriginal culture. Another
setting could be tropical islands such as Samoa where vegetation is lush and
the wireless network would need to connect multiple islands together. Most
of Samoa’s villages are located close to the coast on both islands and are sur-
rounded by lush tropical vegetation. Adding support for predicting how radio
wave propagation is affected by tropical vegetation and the ocean to WiPlan
would make it possible to plan a feasible wireless network for Samoa. Rural set-
tings in other parts of the world have their own social and cultural constraints
that will need to be addressed as part of the wireless network planning process.
215

Appendix A
Existing CAP tool evaluation
The existing tools were compared to determine whether there was support
for incorporating local knowledge in the wireless network plan and how the
tool helped the user in the planning process. There are twelve existing tools
that were considered. This is not an exhaustive list of tools but these twelve
were found to be prominent tools for wireless network planning. Tools will be
referenced by name and allocated letter in the following discussion.
A Aircom International Connect [1] is a commercial CAP tool, screen
shots indicate that it is for Windows.
B Mentum Planet [9] is a commercial CAP tool for Windows.
C ComSiteDesign [2] is a commercial CAP tool for Windows.
D The command-line Digital Line-of-Sight CAP tool for DOS 2.0 that
is detailed in a report released by the US Department of Commerce
in 1989 [68]. Though designed for “persons having no experience
in programming”, the program was intended for use by wireless
system engineers. The Digital Line-of-Sight tool will be referred to
as the DLOS tool in the following discussion.
E EDX SignalPro [4] is a commercial CAP tool, screen shots indicate
that it is for Windows.
F Forsk Atoll [6] is a commercial CAP tool for Windows.217

G Google Earth [8] is a virtual globe program for Windows, Linux
and Mac that allows the user to explore the earth in a 3D environ-
ment. Though not actually a CAP tool, Google Earth is popular
for wireless network planning as it is freely available and has useful
features including: terrain elevation, satellite imagery, 3D visu-
alisation, distance measuring tools, image overlay and elevation
profile between two points.
H Overture Online [14] is a commercial CAP tool for Windows.
I Radio Mobile [18] is a Freeware CAP tool for Windows.
J Pathloss [15] is a commercial CAP tool for Windows.
K SPLAT! [20] is an Open Source CAP tool for Linux/Unix.
L WiTech [25] is a commercial Web-based CAP tool.
A.1 Local knowledge and user support
Five tools had features that could be used for incorporating local knowledge.
EDX SignalPro (E) provides a building editor module that allows the user
to import and edit building plans. This may be useful for planning indoor
wireless networks or for modeling accurate building heights. DLOS (D) and
Pathloss (J) allow obstacles such as trees and water to be added manually. In
SPLAT! (K), the maximum height of ground clutter can be specified by the
user so the clutter height is considered in further analysis.
Overture Online (H) allows the use to create custom flags for a site to store
specific meta data. For example, the user could create a flag for storing the
owner of the site. Overture Online also allows the user to reject a site from
consideration and select a reason from a set list. This list includes the options
of access limitations and inappropriate location but does not support the spec-
ification of the details.218

Six tools had features that help the user during the planning process,
mainly as documentation.
EDX SignalPro (E) has a project wizard that allows the user to “rapidly
set up a project from a selection of system-specific templates” and will “in-
stantly display a map view with relevant GIS data for your chosen area, which
can be selected by simply entering a city name”. It is unclear how the user is
supported during the rest of the planning process.
Overture Online (H) includes a six-step tutorial in the side bar to help
the user and has integrated help. Overture Online also has extensive online
documentation, as does Pathloss (J). DLOS (D) and SPLAT! (K) have exten-
sive usage reports. Mentum Planet (B) has an online knowledge base for user
support.
Most tools seem to have the reasonable expectation that the user already
knows the planning process, as the majority of these tools are for the expert
planner.
A.2 Algorithmic planning support
EDX SignalPro (E) is the most featured tool in terms of optimisation methods
including support for antenna height optimisation, cell site/AP layout opti-
misation, automatic power control (APC) and automatic frequency planning
(AFP) using simulated annealing.
Antenna height optimisation is the most common optimisation method
among the existing tools. Eight of the twelve tools state support for antenna
height optimisation including: Mentum Planet (B), ComSiteDesign (C), DLOS
(D), EDX SignalPro (E), Forsk Atoll (F), Overture Online (H), Pathloss (J)219

and SPLAT! (K).
Six of the twelve tools provide some level of support for cell site/AP layout
optimisation including: Aircom International Connect (A), Mentum Planet
(B), ComSiteDesign (C), EDX SignalPro (E), Overture Online (H) and Radio
Mobile (I).
Six of the twelve tools have support for automatic frequency planning which
is optimally assigning radio channels such that any interference is minimised.
The tools are: Aircom International Connect (A), Mentum Planet (B), Com-
SiteDesign (C), EDX SignalPro (E), Forsk Atoll (F) and Overture Online (H).
Four of the twelve tools have support for automatic power control which
is optimally assigning power levels to each transmitter. The tools are Aircom
International Connect (A), EDX SignalPro (E), Forsk Atoll (F) and Overture
Online (H).
A.3 Computer assistance
There are several ways that a wireless network tool can provide computer
assistance. This section describes how geographic support and analysis support
are featured in the twelve existing tools.
A.3.1 Geographic support
Google Earth (G) is the most featured tool in terms of geographic support.
The entire earth is mapped using satellite imagery and aerial photography
over 3D terrain and provides a wealth of geographic data layers such as trans-
port, towns/cities and country/state borders. Layers such as 3D buildings and
key geographic features are also available for particular areas in the world,
particularly the United States. Overture Online (H) is similarly featured but
restricted to 2D maps with 3D visualisations.220
All of the evaluated tools with a graphical user interface1 provide support
for a variety of map types including shaded terrain, aerial photos and street
maps. These tools also support the use of various geographic databases such
as terrain, transport, population statistics and building heights. Seven of the
tools evaluated provide the ability for 3D visualisation of network designs; Ra-
dio Mobile does not currently provide a 3D visualisation.
All of the tools except for DLOS (D) provide GIS integration and/or ex-
port functionality. Mentum Planet (B) and Forsk Atoll (F) provide MapInfo
GIS integration. Overture Online (H) embeds Bing maps, which is Microsoft’s
mapping service, and ComSiteDesign (C) provides ArcView GIS integration.
The other tools can export to formats such as shapefiles and KML as used by
Google Earth.
Navigational aids for mapping should include scale and orientation, as well
as the ability to pan and zoom around the map. Five of the tools provide
a scale. Google Earth (G) and Overture Online (H) are the only tools that
explicitly show orientation. Eight of the ten remaining tools imply that up is
north. All of the evaluated tools provided panning and zooming ability with
the exception of DLOS (D), Radio Mobile (I), SPLAT! (K) and WiTech (L).
A.3.2 Analysis support
Path profile analysis and coverage analysis are fundamental to wireless net-
work planning. Nine tools support path profile analysis. Google Earth (G)
is capable of providing an elevation profile while WiTech (L) and Overture
Online (H) did not currently have support for path profile analysis. Ten tools
support coverage analysis; DLOS (D) and Google Earth (G) were the two tools
that did not support coverage analysis. Google Earth (G) can however display
1Tools that do not have a graphical user interface include DLOS (D), SPLAT! (K) andWiTech (L).
221

image overlays meaning that a coverage plot generated by another tool can be
displayed in Google Earth.
Other forms of analysis include traffic loading, interference, capacity and
reliability. Five of the twelve tools support traffic loading analysis: Aircom
International Connect (A), Mentum Planet (B), ComSiteDesign (C), EDX
SignalPro (E) and Forsk Atoll (F). Eight tools support interference analysis:
Aircom International Connect (A), Mentum Planet (B), ComSiteDesign (C),
EDX SignalPro (E), Forsk Atoll (F), Overture Online (H), Radio Mobile (I)
and Pathloss (J).
Capacity analysis is supported by six of the twelve tools: Aircom Inter-
national Connect (A), Mentum Planet (B), ComSiteDesign (C), EDX Sig-
nalPro (E), Forsk Atoll (F) and WiTech (L). Nine of the twelve tools have
support for reliability analysis varying from support for propagation loss pre-
diction through to worst month analysis [30, 33]. These nine tools include
Aircom International Connect (A), Mentum Planet (B), ComSiteDesign (C),
DLOS (D), EDX SignalPro (E), Forsk Atoll (F), Radio Mobile (I), Pathloss
(J) and SPLAT! (K).
A.4 Wireless network planning action support
Six of the twelve tools were compared based on five main actions necessary
for wireless network planning. These actions are the creation of a site (A1),
naming of a site (A2), setting/adjusting antenna heights (A3), conducting
a point-to-point analysis (A4) and conducting a point-to-multipoint analysis
(A5). Google Earth (G), Radio Mobile (I) and Splat! (K) are freeware and
hence could be evaluated by using the actual tools. A trial of Overture Online
(H) was obtained which allowed evaluation by actual use. Detailed documen-
tation was used to evaluate DLOS (D) and Pathloss (J).222

A.4.1 Creating a site (A1)
Overture Online (H) allows creation of a site by right-clicking on the map
where the site is to be placed and selecting Add Site Here. Google Earth (G)
is similar but requires the user to left-click Add Placemark on the toolbar and
drag the placemark to where the site should be placed. Alternatively the lati-
tude and longitude can be entered if they are known. The user then left-clicks
OK. DLOS (D) allows the entry of geometric coordinates for the transmitting
and receiving sites as well as the elevation at that point (including tower height
if applicable) in the Earth geometry module.
To create a site in Pathloss (J), the user left-clicks the Site list button on
the toolbar to open the Site list window. The site name, latitude and longi-
tude can then be entered in the table. The map will show the sites when the
Site list window is closed. Sites can also be imported from a CSV file or any
delimited text file.
Splat! (K) requires a text file with specific contents to create a site. The
text file must contain the name, latitude, longitude and antenna height where
a newline is used as a separator. To create a site in Radio Mobile (I), the user
right-clicks on the map where the site should go to position the map cursor
and then left-click Units properties on the toolbar to open the Units proper-
ties window. The user selects an unallocated unit from the list and left-clicks
Place unit at cursor position or manually enters the latitude and longitude,
then left-clicks OK.
Creating a site is a fundamental action in wireless network planning and
therefore needs to simple and straight-forward to carry out. Overture Online
(H) and Google Earth (G) meet this criteria.223

A.4.2 Naming a site (A2)
To name a site in Overture Online (H), the user left-clicks the particular site
once to select the site, and a second time to show the site properties in the
sidebar. The site name can then be edited. In Google Earth (G), the user
right-clicks the placemark to be named and left-clicks Properties. The name
can then be entered and the user left-clicks OK. In the DLOS program, site
names are entered when creating a link using the Select a link module.
To change the name of a site in Pathloss (J), the user left-clicks the Site
list button on the toolbar to open the Site list window. The user enters the
new site name in the table and when the Site list window is closed the site
will have the new name. Splat! (K) requires the site name to be specified in
the site text file, as explained for site creation. In Radio Mobile (I), a site
can be named by left-clicking Units properties on the toolbar and selecting the
appropriate unit. The user can edit the name and then left-click OK.
A.4.3 Selecting heights (A3)
Selecting heights in Overture Online (H) is similar to naming a site. The user
left-clicks the particular site once to select the site, and a second time to show
the site properties in the sidebar. The structure height above ground can then
be edited. Selecting heights in Google Earth (G) is also similar to the proce-
dure for naming a site. The user right-clicks the placemark to be named and
left-clicks Properties. The user then left-clicks the Altitude tab and can enter
the altitude for the site. It is important to note that altitude is not the same
as antenna height. The user then left-clicks OK.
DLOS (D) determines heights using the Primary antenna height recom-
mendations module. Both antenna heights can be calculated or if one an-
tenna height is known, then the other can be determined using the module.
Pathloss (J) requires that a point-to-point profile has been generated before224
antenna heights can be calculated. Once the profile has been generated, an-
tenna heights can be calculated by left-clicking Design and selecting Antenna
heights in the file menu to enter the antenna heights module. The user then
left-clicks the calculate button to calculate the antenna heights.
Splat! (K) requires the site’s antenna height to be specified in the site text
file, as explained for site creation. Radio Mobile (I) allows the site elevation
to be edited via Units properties but true antenna height adjustment occurs
during point-to-point analysis.
A.4.4 Point-to-point analysis (A4)
Overture Online (H) and Google Earth (G) do not support point-to-point
analysis, though point-to-point analysis is in active development for Overture
Online (H) and Google Earth (G) has a elevation profile feature. Splat! (K)
allows point-to-point analysis using the following command-line arguments
splat -t tx_site.qth -r rx_site.qth -p terrain_profile.png
where tx_site.qth is the transmitter text file and rx_site.qth is the receiver
text file.
Point-to-point analysis can be conducted in Radio Mobile (I) in the fol-
lowing way. The user should left-click Tools on the file menu and select Radio
Link. The user can then select the transmitter site and receiver site from
drop-down lists. Antenna heights and frequency can be entered and require
the Apply button to be clicked in order for the new values to be considered in
the analysis. Figure A.1 shows an example of point-to-point analysis in Radio
Mobile (I).225
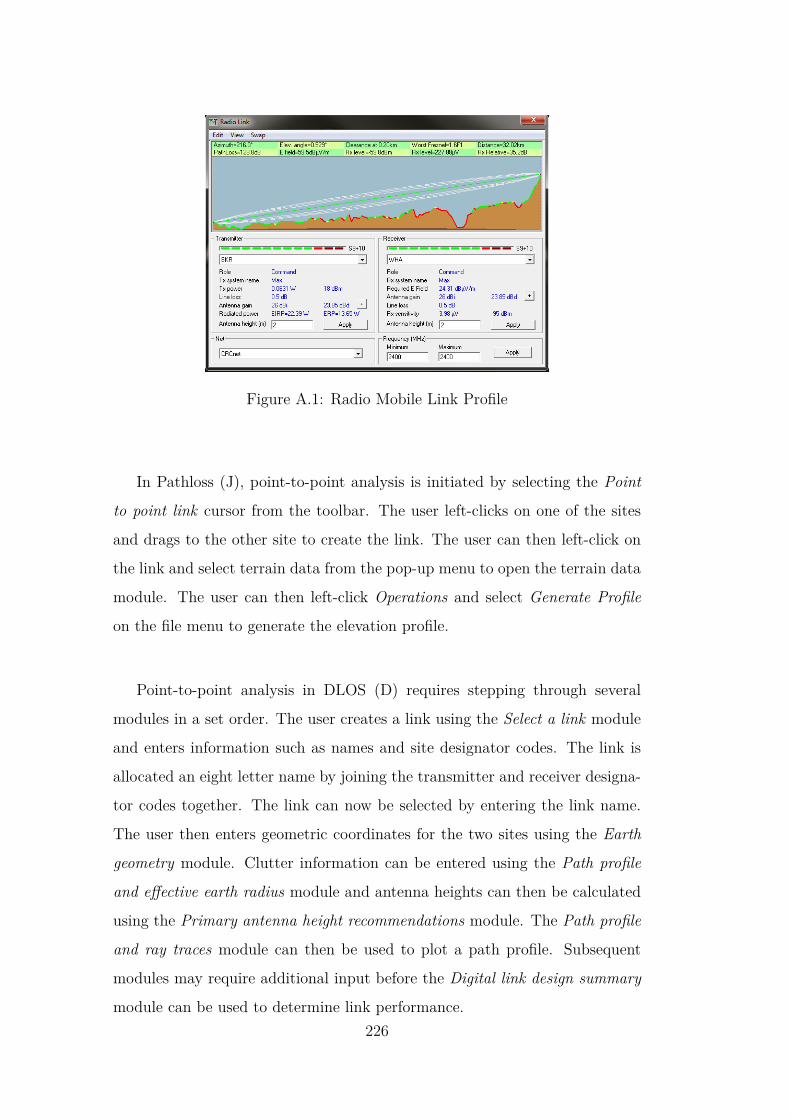
Figure A.1: Radio Mobile Link Profile
In Pathloss (J), point-to-point analysis is initiated by selecting the Point
to point link cursor from the toolbar. The user left-clicks on one of the sites
and drags to the other site to create the link. The user can then left-click on
the link and select terrain data from the pop-up menu to open the terrain data
module. The user can then left-click Operations and select Generate Profile
on the file menu to generate the elevation profile.
Point-to-point analysis in DLOS (D) requires stepping through several
modules in a set order. The user creates a link using the Select a link module
and enters information such as names and site designator codes. The link is
allocated an eight letter name by joining the transmitter and receiver designa-
tor codes together. The link can now be selected by entering the link name.
The user then enters geometric coordinates for the two sites using the Earth
geometry module. Clutter information can be entered using the Path profile
and effective earth radius module and antenna heights can then be calculated
using the Primary antenna height recommendations module. The Path profile
and ray traces module can then be used to plot a path profile. Subsequent
modules may require additional input before the Digital link design summary
module can be used to determine link performance.226
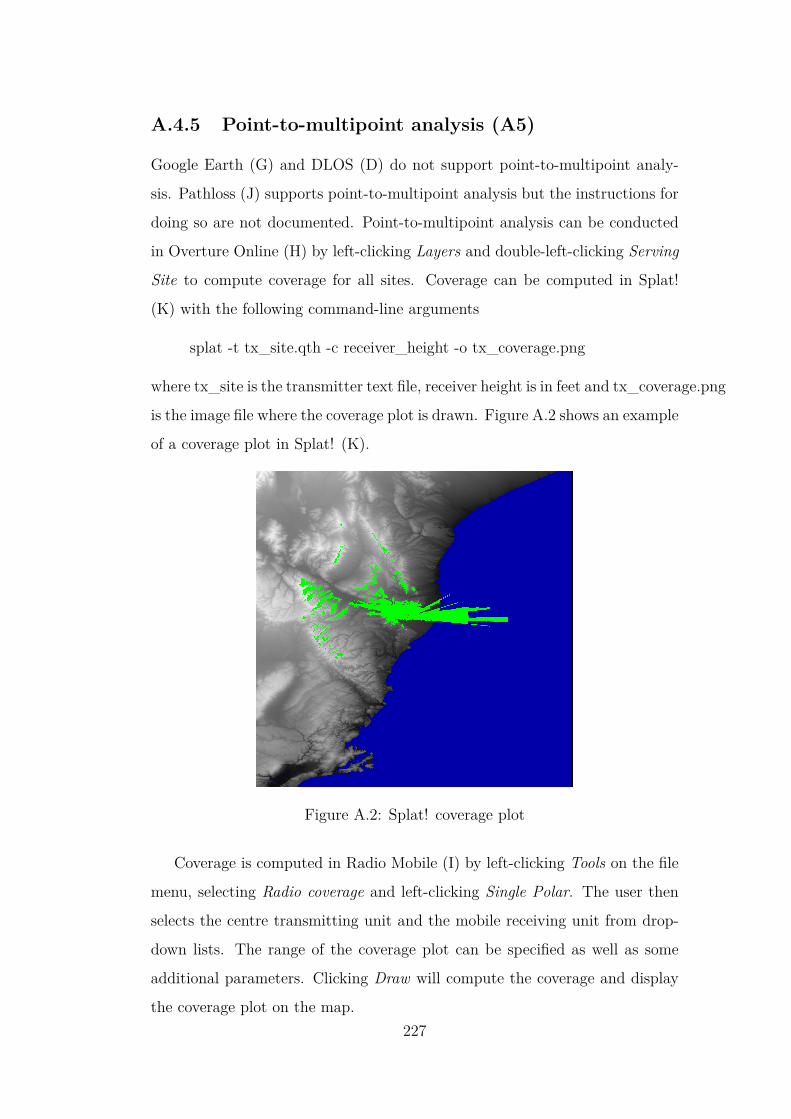
A.4.5 Point-to-multipoint analysis (A5)
Google Earth (G) and DLOS (D) do not support point-to-multipoint analy-
sis. Pathloss (J) supports point-to-multipoint analysis but the instructions for
doing so are not documented. Point-to-multipoint analysis can be conducted
in Overture Online (H) by left-clicking Layers and double-left-clicking Serving
Site to compute coverage for all sites. Coverage can be computed in Splat!
(K) with the following command-line arguments
splat -t tx_site.qth -c receiver_height -o tx_coverage.png
where tx_site is the transmitter text file, receiver height is in feet and tx_coverage.png
is the image file where the coverage plot is drawn. Figure A.2 shows an example
of a coverage plot in Splat! (K).
Figure A.2: Splat! coverage plot
Coverage is computed in Radio Mobile (I) by left-clicking Tools on the file
menu, selecting Radio coverage and left-clicking Single Polar. The user then
selects the centre transmitting unit and the mobile receiving unit from drop-
down lists. The range of the coverage plot can be specified as well as some
additional parameters. Clicking Draw will compute the coverage and display
the coverage plot on the map.227

A.4.6 Action conclusions
These five actions are fundamental for wireless network planning and there-
fore need to be simple and straight-forward to carry out for non-experts from
rural communities. Comparing how these actions are implemented in the six
tools (DLOS (D), Google Earth (G), Overture Online (H), Radio Mobile (I),
Pathloss (J) and Splat! (K)) has identified how each action for each tool meets
or does not meet this criteria. DLOS (D) and Splat! (K) do not meet this crite-
ria as non-experts from rural communities are not expected to be comfortable
with the command-line.
A1 Overture Online (H) and Google Earth (G) provided simple and
straight-forward implementations for placing a site, though Over-
ture Online (H) had the most appropriate implementation.
A2 All of the tools provided simple and straight-forward implementa-
tions for naming a site, again Overture Online (H) had the most
appropriate implementation.
A3 Overture Online (H) and Radio Mobile (I) provided simple and
straight-forward implementations for selecting height.
A4 Radio Mobile (I) and Pathloss (J) provided simple and straight-
forward implementations for point-to-point analysis.
A5 Overture Online (H) and Radio Mobile (I) provided simple and
straight-forward implementations for point-to-multipoint analysis.
These results show that for simple and straight-forward action implementation,
Overture Online (H) is the most appropriate tool. Unfortunately Overture
Online (H) does not implement the point-to-point analysis action which is
fundamental for wireless network planning in rural areas.
228
Appendix B
Radio wave propagation models
Propagation models provide the ability to predict the expected loss that a
wireless link might experience. Propagation models can be categorised as
general models, foliage models, urban models and terrain models. Discussion
of these models is restricted to those models that are suitable for outdoor areas.
Rain attenuation models are not discussed as the frequencies expected to be
used for planning rural wireless networks are not typically affected by rainfall.
Table B.1 shows a summary of the models that are discussed and some of the
key features that are considered when selecting a model to use.
B.1 Free-space
Free-space is a common term in the following discussion and therefore requires
some explanation. Free-space is defined as a space that contains no particles
and no fields of force. Formally it is distinguished from a vacuum, which
contains no particles but may contain fields [60].
B.2 Free-space models
This section discusses three models for radio wave propagation that are based
on free-space.229
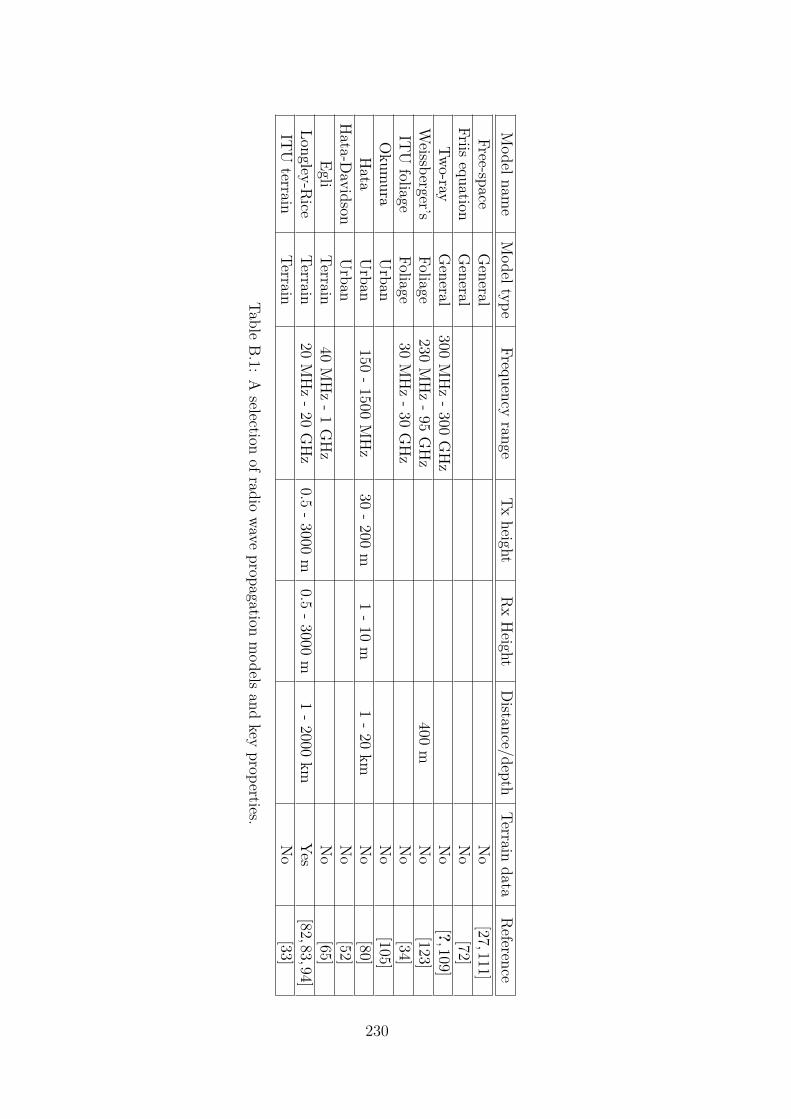
Modelnam
eModeltype
Frequencyrange
Txheight
RxHeight
Distance/depth
Terraindata
Reference
Free-spaceGeneral
No
[27,111]Friis
equationGeneral
No
[72]Two-ray
General
300MHz-300
GHz
No
[?,109]Weissberger’s
Foliage230
MHz-95
GHz
400m
No
[123]IT
Ufoliage
Foliage30
MHz-30
GHz
No
[34]Okum
uraUrban
No
[105]Hata
Urban
150-1500
MHz
30-200
m1-10
m1-20
kmNo
[80]Hata-D
avidsonUrban
No
[52]Egli
Terrain40
MHz-1
GHz
No
[65]Longley-R
iceTerrain
20MHz-20
GHz
0.5-3000
m0.5
-3000m
1-2000
kmYes
[82,83,94]IT
Uterrain
TerrainNo
[33]
TableB.1:
Aselection
ofradiowave
propagationmodels
andkey
properties.
230

B.2.1 Free-space path loss model
The free-space path loss (FSPL) model [27, 111] determines the loss in signal
strength that a radio wave would experience from an unobstructed line-of-sight
path through free space, known as free-space basic transmission loss.
Free-space path loss is proportional to both the distance squared and fre-
quency squared, as shown in Equation B.1.
Lbf =(
4πdλ
)2
=(
4πdfc
)2
dB (B.1)
In Equation B.1, λ is wavelength (in metres), f is frequency (in hertz),
d is the distance from the transmitter (in metres) and c is the speed of light
through air (~2.998 × 10⁸ metres/second). The free-space model is not valid
for small distances as the spreading out of electromagnetic energy in free-space
is determined by the inverse square law and hence as d → 0, the received
power becomes greater than the transmitted power. Free-space path loss is
the ratio pt
prwhere pt is the transmitter power and pr is the received power. It
is convenient to express free-space path loss in dB with frequency in MHz and
distances in km. The FSPL equation can also be expressed in logarithm form
as Equation B.2.
Lbf = 20 log10(d) + 20 log10(f) + 32.45 dB (B.2)
B.2.2 Friis transmission equation
The Friis transmission equation, derived by Harald T. Friis [72], calculates the
transmission loss of a radio link in free-space. The ratio of power received (Pa)
to power transmitted (Pt) is given in Equation B.3.
Pa
Pt
= ArAt/d2λ2 (B.3)
In Equation B.3, At and Ar are the effective area of the transmitting and
receiving antennas, respectively, λ is the wavelength, and d is the distance.231

The units for effective areas, wavelength and distance must be the same. By
substituting At and Ar in Equation B.3 with Equation B.4 (where G is the
gain of the respective antenna in dBi), then Equation B.5 can be derived which
uses antenna gains rather than effective areas.
Aeff = λ2
4πG (B.4)
Pr
Pt= GTGR
(λ
4πR
)2
(B.5)
The antennas are assumed to be in free-space with no multipath and correctly
aligned and polarized. Empirical adjustments can accommodate effects such
as absorption loss and the misalignment and polarization of antennas.
B.2.3 Plane-earth two-ray reflection model
The plane-earth two-ray reflection model [46] calculates ray path transmission
loss, expanding on the FSPL model by introducing a single ground reflection.
It is useful for short radio paths around 10 km in length where the earth’s
curvature can be ignored. In situations where low antennas are used and the
terrain is uncluttered, it can be assumed that ground reflection will occur at
grazing incidence, meaning that the reflected signal will almost be parallel with
the ground. Figure B.1 shows an example of such a situation. A useful approx-
imation for these situations is the two-ray model with a reflection coefficient
of -1. The direct (s1) and reflected (s2) rays are calculated using Equation B.6
and Equation B.7 respectively, where d is the horizontal distance and h1 and
h2 are the heights of the antennas above ground, all in the same units.
s1 =√d2 + (h1 − h2)2 (B.6)
s2 =√d2 + (h1 + h2)2 (B.7)
The resulting field strength (e) can then be calculated in complex notation232
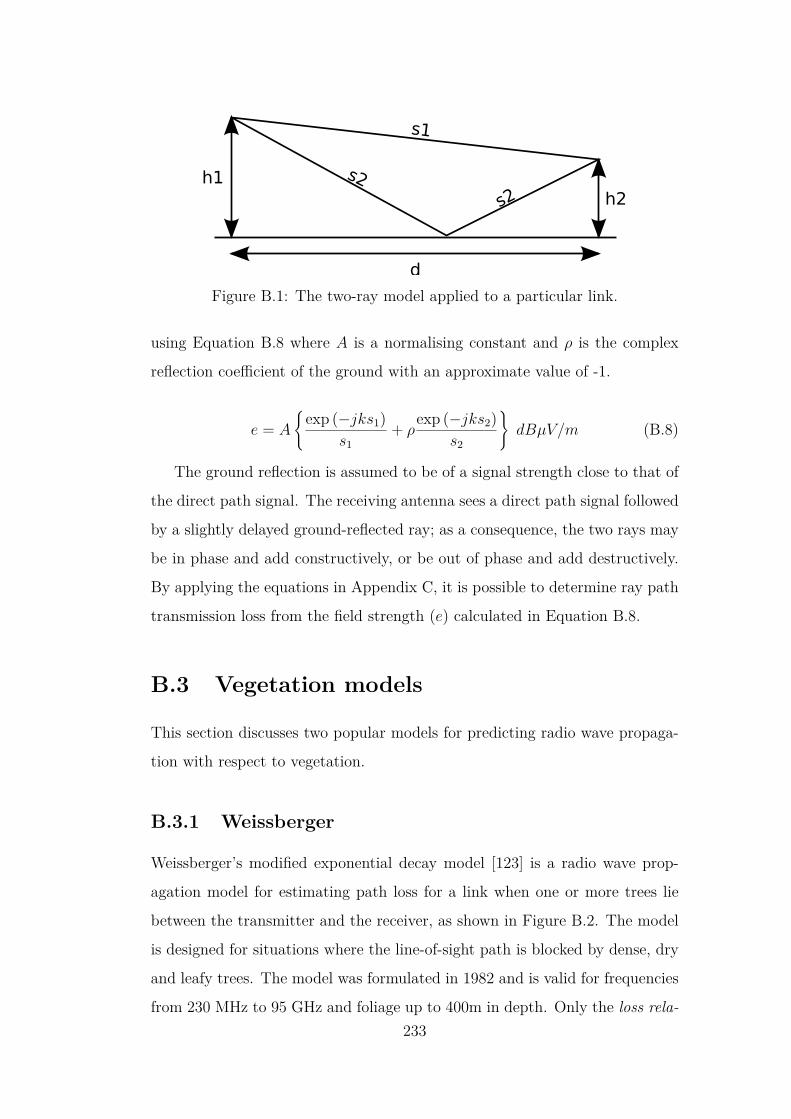
h2
h1
d
s1
s2
s2
Figure B.1: The two-ray model applied to a particular link.
using Equation B.8 where A is a normalising constant and ρ is the complex
reflection coefficient of the ground with an approximate value of -1.
e = A
{exp (−jks1)
s1+ ρ
exp (−jks2)s2
}dBµV/m (B.8)
The ground reflection is assumed to be of a signal strength close to that of
the direct path signal. The receiving antenna sees a direct path signal followed
by a slightly delayed ground-reflected ray; as a consequence, the two rays may
be in phase and add constructively, or be out of phase and add destructively.
By applying the equations in Appendix C, it is possible to determine ray path
transmission loss from the field strength (e) calculated in Equation B.8.
B.3 Vegetation models
This section discusses two popular models for predicting radio wave propaga-
tion with respect to vegetation.
B.3.1 Weissberger
Weissberger’s modified exponential decay model [123] is a radio wave prop-
agation model for estimating path loss for a link when one or more trees lie
between the transmitter and the receiver, as shown in Figure B.2. The model
is designed for situations where the line-of-sight path is blocked by dense, dry
and leafy trees. The model was formulated in 1982 and is valid for frequencies
from 230 MHz to 95 GHz and foliage up to 400m in depth. Only the loss rela-233
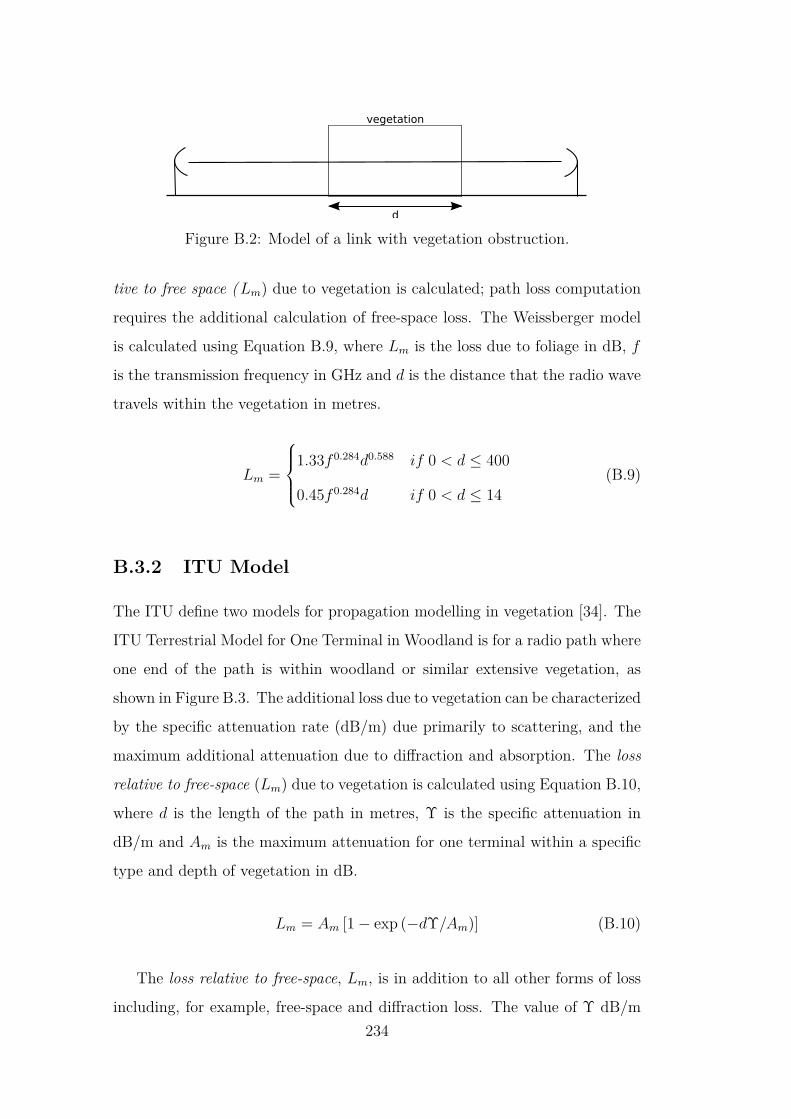
d
vegetation
Figure B.2: Model of a link with vegetation obstruction.
tive to free space (Lm) due to vegetation is calculated; path loss computation
requires the additional calculation of free-space loss. The Weissberger model
is calculated using Equation B.9, where Lm is the loss due to foliage in dB, f
is the transmission frequency in GHz and d is the distance that the radio wave
travels within the vegetation in metres.
Lm =
1.33f 0.284d0.588 if 0 < d ≤ 400
0.45f 0.284d if 0 < d ≤ 14(B.9)
B.3.2 ITU Model
The ITU define two models for propagation modelling in vegetation [34]. The
ITU Terrestrial Model for One Terminal in Woodland is for a radio path where
one end of the path is within woodland or similar extensive vegetation, as
shown in Figure B.3. The additional loss due to vegetation can be characterized
by the specific attenuation rate (dB/m) due primarily to scattering, and the
maximum additional attenuation due to diffraction and absorption. The loss
relative to free-space (Lm) due to vegetation is calculated using Equation B.10,
where d is the length of the path in metres, Υ is the specific attenuation in
dB/m and Am is the maximum attenuation for one terminal within a specific
type and depth of vegetation in dB.
Lm = Am [1− exp (−dΥ/Am)] (B.10)
The loss relative to free-space, Lm, is in addition to all other forms of loss
including, for example, free-space and diffraction loss. The value of Υ dB/m234
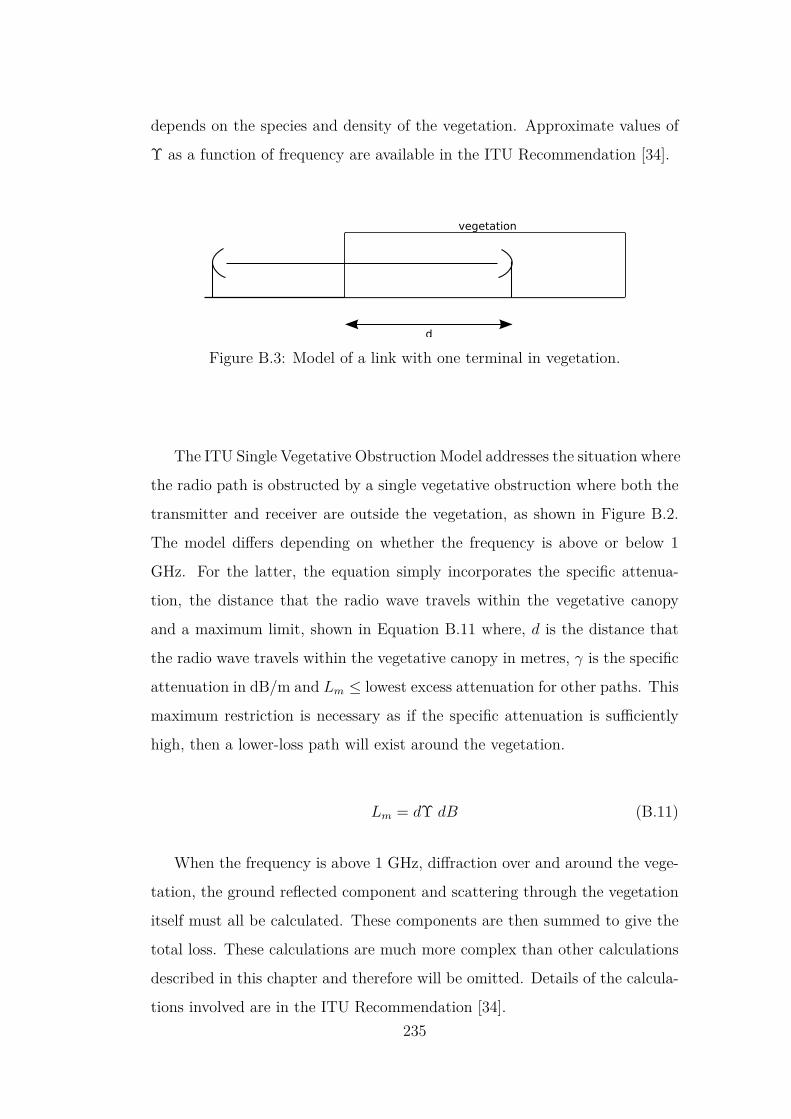
depends on the species and density of the vegetation. Approximate values of
Υ as a function of frequency are available in the ITU Recommendation [34].
d
vegetation
Figure B.3: Model of a link with one terminal in vegetation.
The ITU Single Vegetative Obstruction Model addresses the situation where
the radio path is obstructed by a single vegetative obstruction where both the
transmitter and receiver are outside the vegetation, as shown in Figure B.2.
The model differs depending on whether the frequency is above or below 1
GHz. For the latter, the equation simply incorporates the specific attenua-
tion, the distance that the radio wave travels within the vegetative canopy
and a maximum limit, shown in Equation B.11 where, d is the distance that
the radio wave travels within the vegetative canopy in metres, γ is the specific
attenuation in dB/m and Lm ≤ lowest excess attenuation for other paths. This
maximum restriction is necessary as if the specific attenuation is sufficiently
high, then a lower-loss path will exist around the vegetation.
Lm = dΥ dB (B.11)
When the frequency is above 1 GHz, diffraction over and around the vege-
tation, the ground reflected component and scattering through the vegetation
itself must all be calculated. These components are then summed to give the
total loss. These calculations are much more complex than other calculations
described in this chapter and therefore will be omitted. Details of the calcula-
tions involved are in the ITU Recommendation [34].235

B.4 Urban city models
The following urban city models predict ray path transmission loss:
The Okumura model [105] was first described by Yoshihisa Okumura in
1968 and is based on measurements at various frequencies in urban Japan.
The model is valid for distances between 1 and 100 km. The measured values
were statistically analysed to determine median field strengths and derive nu-
merous correction factors. These factors included adjustments for urbanness,
terrain slope, roughness and receiver location relative to nearby hills, valleys
and localised obstructions. The model is urban focused and is in the context
of Japanese cities, Tokyo in particular. There are three variants of the model
for use in urban, suburban and open areas. The typical US suburban situation
is considered to be somewhere between Okumura’s suburban and open ar-
eas. The application of Okumura’s model involves the use of numerous curves
(primarily based on Okumura’s empirical field strength data) to determine ad-
justment factors to be applied to field strength.
In 1980, Masaharu Hata [80] simplified the Okumura model by restricting
the distance to less than 20 km and frequency to less than 1500 MHz . Hata’s
model is designed for predicting the behaviour of cellular transmissions in built
up areas and to Okumura’s model adds the effects of diffraction, reflection and
scattering caused by city structures. However the model ignores the terrain
between the transmitter and receiver as the model assumes that the transmit-
ter would normally be located on hills.
As with the Okumura model, there are three variants of the model for
use in urban, suburban and open areas. The urban variant is for use in a
built-up city to large town where buildings and houses exceed two storeys, or
large villages with houses close together and tall, dense trees. The suburban
variant is for areas scattered with trees and buildings and the open variant is
for open areas where there are no tall trees or buildings, such as farmland. [112]236
In 1997, David Brown and Gregory M. Stone added an extension to Hata’s
work, known as the Hata/Davidson model [52]. Brown and Stone included fre-
quency and distance corrections to extend the limitations on Hata, particularly
the distance range to 300km and frequency to between 1500 and 2000 MHz.
Corrections are also included for antenna heights. Under some conditions, the
model can yield losses less than that calculated by the free-space model. In
these cases, the free-space value should be used.
237

B.5 Terrain models
This section describes three radio wave propagation models that consider the
effects of terrain in their predictions.
B.5.1 Egli Model
John Egli derived a propagation model that calculates the transmission loss in
1957 for frequencies between 40 MHz and 1 GHz [65]. Egli predicts the median
path loss based on real-world data from UHF and VHF television transmissions
in several large cities. The model assumes gently rolling terrain with average
hill heights of approximately 15 metres . The model can be applied to scenarios
involving irregular terrain however, at short range, the model loses accuracy.
The free-space propagation model is more accurate for these short distances.
Equation B.12 shows the Egli model where L is the median loss, d is the path
distance and β is(
40f
)2(where f is in MHz). Gb and Gm are the gains of the
base antenna and mobile antenna respectively. hb and hm are the heights of
the base antenna and mobile antenna respectively.
L = GbGm
[hbhm
d2
]2
β dB (B.12)
B.5.2 Irregular terrain model
The Irregular Terrain Model (ITM) [82,83] is used for calculating the ray path
transmission loss for links in the frequency range of 20 MHz to 20 GHz and
distances between 1 km and 2000 km. The ITM was first published in 1965 as
the Longley-Rice model and then revised in 1966 and 1967 [111]. The model
was implemented as a computer program in 1968 [94] and further developed
to produce the ITM during the 1970s. The model was initially created for
the needs of frequency planning in television broadcasting in 1960s America
and was extensively used for preparing the tables of channel allocations for
VHF/UHF broadcasting.
238

The Longley-Rice model has two parts: a model for predictions over an
area and a model for point-to-point link predictions. The model predicts long-
term median propagation loss over irregular terrain. Input parameters include
environmental information such as climate, surface refractivity, effective radius
of the earth, ground conductivity and permittivity. The user can specify an-
tenna heights, polarisation and variability confidence values in terms of time,
location and situation. The complex computer method computes predicted
loss based on these parameters by considering effects from such phenomena as
diffraction and scattering.
B.5.3 ITU Terrain Model
The ITU Terrain model [33] calculates the ray path transmission loss by pre-
dicting the median path loss based on diffraction theory. The model determines
path loss based on diffraction caused by the highest obstruction in the path.
The model is calculated using Equation B.13 where Ad is the diffraction loss
and h is the height difference in metres between the highest obstruction and
the path’s line-of-sight trajectory (h can be negative). F1 is the radius of the
first Fresnel ellipsoid which is calculating using Equation B.14, where f is the
frequency in GHz, d is the path length in kilometres and d1 and d2 are dis-
tance from the highest obstruction to the transmitter and receiver respectively.
Equation B.13 is deemed valid for losses over 15 dB.
Lt = −20hF1
dB (B.13)
F1 = 17.3√d1d2
fd(B.14)
239

Appendix C
Converting field strength to loss
In order to convert a field strength (e) in dBµV/m to a loss in dB, it is
necessary to follow these steps.
1. Determine the antenna factor (AF ) using Equation C.1 where f is the
frequency in MHz and G is the antenna gain in dBi.
2. Calculate voltage (Vo) using Equation C.2
3. Calculate the dBm equivalent of Vo using Equation C.3
AF = 20× log f −G− 29.78 (C.1)
Vo = e− AF (C.2)
Vo(dBm) = Vo − 107 (C.3)
241


Appendix D
Personas
D.1 Sheep and beef farmer
You are a 53 year old sheep and beef farmer that has been farming for 30 years.
You work dawn til dusk on the farm most days and when you can, enjoy a
spot of hunting and brewing beer. You are married with three children - two
daughters and a son. The eldest daughter is working in London and it would
be great to video Skype and share photos with her - the current dialup cuts
out and makes audio Skyping worse than a phone call, and emails with a single
photo takes minutes to download. Though you won’t touch a computer, your
spouse is quite clued up and is keen to do Internet banking and some online
selling of your wool and beef (they manage the books). It would also be great
to get long-range weather forecasts. Your teenage son enjoys playing computer
games and keeps reminding you how he wants to be able to play online. He
and your youngest daughter also frequently talk about Facebook and how it is
so slow on dialup.
• Lambing is during August-September. At this time you want people well
away from the ewes and their lambs.
• There are a number of bulls and rams on your farm. Some are prone to
misbehaving and may confront and even charge a unwary person.
• Figure D.1 shows the map of the farm that was supplied showing the243

Figure D.1: Map of the sheep and beef farm
farm layout of paddocks, races, water and trees. The map shows where
buildings are and whether they have mains power. Pictures of buildings
and trees were supplied for reference.
• You are willing to put $4000 towards building the wireless network.
244
D.2 Dairy farmer
You are a 38 year old dairy farmer, married with two kids. You are a motorbike
enthusiast and enjoy jogging. You are fairly comfortable using computers and
would be keen to do Internet banking and online GST returns. You have
heard good things about Fonterra’s Fencepost.com portal for near real-time
milk collection information and milk payout forecasts. It would also be great
to be able to check long-term weather forecasts and communicate with your
stock agent. Your 16 year old daughter works on the farm and would like to
enroll in a web-based farming qualification next year. Both kids want to be
able to Facebook their friends.
• Figure D.2 shows the map of the farm that was supplied showing the
farm layout of paddocks, races, water and trees. The map shows where
buildings are and whether they have mains power. Pictures of buildings
and trees were supplied for reference.
• You are willing to put $6000 towards building the wireless network.
245

Figure D.2: Map of the dairy farm
246

D.3 School principal
You are the 35 year old principal of the local school. You are married with
9 year old twins and a 5 year old, all girls. You enjoy reading books and
doing a bit of cooking. You are very comfortable using computers as you
use them on a daily basis for administration work. You are convinced that
rural kids are disadvantaged and that rural schools must have access to high-
speed broadband now to help achieve the same educational objectives as urban
children. Video conferencing with other schools would open up options and
interactive online learning would become a possibility. Staff could be in contact
with their peers and the Ministry of Education, providing support and teaching
resources.
• The school principal was given an annotated aerial photo showing the
main building
– the building has an easting of 1928940m, northing of 5721931m and
the roof is 6m high
• 3 teachers (including you)
• 58 pupils, mostly between the ages of 5 and 13
• 1 computer lab
• 2 offices (including yours)
• The school is willing to contribute $2000 towards building the wireless
network
247
D.4 Community representative
You are 42 years old and enjoy hiking and cycling. You are fairly comfortable
using computers and are a serious console gamer. You represent the Minginui
community; most people want to be able to surf the web and send email while
a few people want to be able to work from home and communicate with the
office via Skype and video-conference. You are also aware of some people that
do not wish to be involved and object to having wireless signals on their land.
Gaming-wise, apart from a few games online at a friends place in Rotorua,
you have been restricted to single player. You are itching to be able to jump
online and deal out some serious fragging.
• The community representative was given an annotated aerial photo show-
ing building locations
• The community representative was also given a list of the five highest
trig stations in the area with the station location and access information
• There are approximately 75 buildings in Minginui
• Each household that wants to be part of the network has pledged between
$50 and $100
• This means that there is a total of approximately $6000 towards the
building of the wireless network
248

D.5 Cultural expert
You are a respected elder amongst your hapu and iwi. You are 62 years of age
and through your lifetime you have learned much about the land and history
of your people. You are married with four adult children and enjoy reading
and gardening. You know a little about computers as you have been to a
few workshops and feel relatively comfortable using them. Many of the older
mokopuna have left the area to attend schools in other areas. It is your view
that with a decent Internet connection opportunities could be offered at the
local kura via video-conference and that as a result the mokopuna could stay
in the valley with their whanau until the end of high school. Many members
of the whanau are in other areas of New Zealand and the world, so the ability
to Skype, email and Facebook would be used extensively. Though you believe
that the network will bring much to your iwi, the network construction must
respect the land. To this end, you are on hand to ensure that the sacred
summits of local maunga are not built upon and that urupa sites and other
areas of significance must be respected.
• Figure D.3 shows the map supplied to the cultural expert persona show-
ing heritage sites in the Te Whaiti area.
• As you live in Minginui, you have already pledged some money towards
building the wireless network.
249

Cultural respect Two Maori experts were consulted to ensure that the
persona of the cultural expert was respectful and inoffensive. The persona of
the cultural expert was provided with the Nga Taonga [21] of Ngati Whare, to
acknowledge and show respect for the local iwi.
Nga Taonga I hare mai te mana a te iwi o Ngati Whare, mai nga wairua
o ratau ma inga pai maunga a Tuwatawata me Moerangi. Te wairua a te awa
o Whirinaki, ka pa i nga tipurana o Wharepakau. Te Whaiti Nui-a-Toi i
hara mai tenei ingoa nga, nga matua tuku iho. Mai te timatana he te awa o
Whirinaki. I taua wa ka tareka e koe ki te peke i te tahi taha ka hoki mai.
Kai te ki matau i hara mai matau mai ia Toi. I te ra wa nga tangata whenua
ko nga Marangaranga. Te wa o nga Marangaranga: he iwi manaki tangata, he
iwi tipu kai, he iwi mohio nga ranoa, nga mahi nga kai, he iwi kaitiakitanga o
nga whenua, ngahere, taonga tuki iho a kuia ma e koro ma. Hineruarangi ko
ia te kaitiaki o Ngati Whare iwi. Ko Hineruarangi te tamahine a Toi, a noho
ana aia i wahi tapu Te Whakamaru, ka puta mai ia pe nei te manu. Ka noho
te mana nga tikanga, te kawa, me nga taonga korero tuku iho, a kuia ma e
koro ma, mo ake tonu atu
English interpretation (the treasures) Know that we are Ngati Whare
and our life-force is from the union of our sacred mountains Tuwatawata and
Moerangi. The water of our Whirinaki River carries this to all descendants of
Wharepakau where ever in the world they reside. Te Whaiti Nui-a-Toi, the nar-
row canyon at the top of our valley takes its name from our spiritual ancestor
Toi, a great leader explorer and community builder who is famed throughout
the Pacific. Toi visited our ancestors the people of this valley, Marangaranga
and shared his knowledge with them. Theirs was a community where people
cared for each other and visitors were generously included . They had learned
and shared much about nature including its food and herbal medicines. They
were guardians of the land and forests that sustained them and they treasured
the knowledge that had been passed down to them by their wise elders. Toi’s
daughter Hineruarangi remains as the spiritual guardian of Ngati Whare and250

in this sacred place has protected our values and knowledge through times of
hardship. Ngati Whare are the kaitiaki (guardians) of the Whirinaki Forest -
a precious rainforest of international repute.
Figure D.3: Map showing heritage sites
251

Appendix E
Internet activities analysis
Whether people are from an urban community or a rural community does not
greatly affect the activities that people find useful on the Internet. However,
the reasons for finding those activities useful may be different for someone
from a rural community compared to someone from an urban community. In
2009, Statistics New Zealand conducted a survey1 of ICT in New Zealand [39].
Results from this survey are used to illustrate how popular various activities
are among people from throughout New Zealand who have Internet access,
including dial-up and broadband.
Survey results [39] showed that 90% of individuals surveyed used email and
46% used social networking. Results also showed that 26% of individuals used
Internet telephony such as Skype. Video conferencing was used by 17% of
individuals and 24% used other forms of communication such as chat rooms,
message boards, instant messaging and blogging. Rural people want to be
able to use these cheap reliable technologies to communicate with friends and
family, like their urban counterparts. Farmers also want to be able to email
their stock agent or check the current prices of wool, beef and milk.
Many rural people either operate a business from home, such as farmers,
1Results discussed were gathered from 2,677,000 individuals who accessed the Internetover twelve months
253

or choose to work from home some or all of the time. Rural people often live
a significant distance from an urban centre where there are banks and shops,
and for those people that work in these rural areas, it is difficult to find the
time to run errands such as banking and GST returns. Instead it is much
more convenient for rural people to conduct this business from home on the
Internet, saving both time and money.
Rural people want better resources for their schools, as rural schools are
often under-resourced compared to urban schools [86, 117]. Broadband Inter-
net can introduce services such as video conferencing for running extra-mural
courses and access to online teaching resources. In New Zealand, the Ministry
of Education provides a web service to support teachers and provide resources.
Internet at home would assist with children doing their home work. Some ru-
ral people may wish to further their education by completing online courses or
training in their own time.
Rural people have a keen interest in the news and weather [81,87]. Access
to the Internet provides a wealth of news and weather services, including long-
range weather forecasts.
Television and radio reception can be unreliable in rural areas so rural peo-
ple may wish to source entertainment via the Internet. Survey results [39]
showed that 39% of individuals surveyed used the Internet for downloading
and listening to music and 34% downloaded and read books, newspapers and
magazines. Movies, short films and images were downloaded and/or watched
by 34% of individuals while 26% listened to web radio or watched web tele-
vision. Computer games were played by 19% of surveyed individuals. It is
not unreasonable to assume that rural people would have a similar interest
in online entertainment, particularly given their physical distance from live
entertainment venues, cinemas and movie rental stores.
254
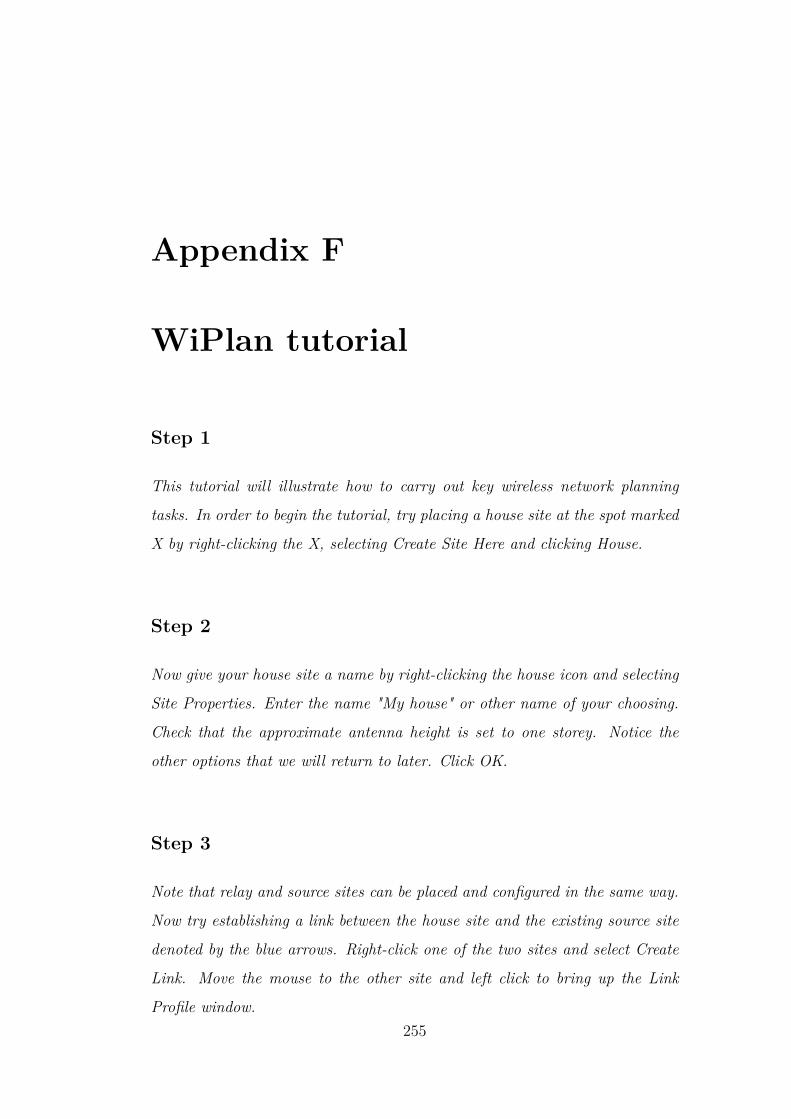
Appendix F
WiPlan tutorial
Step 1
This tutorial will illustrate how to carry out key wireless network planning
tasks. In order to begin the tutorial, try placing a house site at the spot marked
X by right-clicking the X, selecting Create Site Here and clicking House.
Step 2
Now give your house site a name by right-clicking the house icon and selecting
Site Properties. Enter the name "My house" or other name of your choosing.
Check that the approximate antenna height is set to one storey. Notice the
other options that we will return to later. Click OK.
Step 3
Note that relay and source sites can be placed and configured in the same way.
Now try establishing a link between the house site and the existing source site
denoted by the blue arrows. Right-click one of the two sites and select Create
Link. Move the mouse to the other site and left click to bring up the Link
Profile window.255
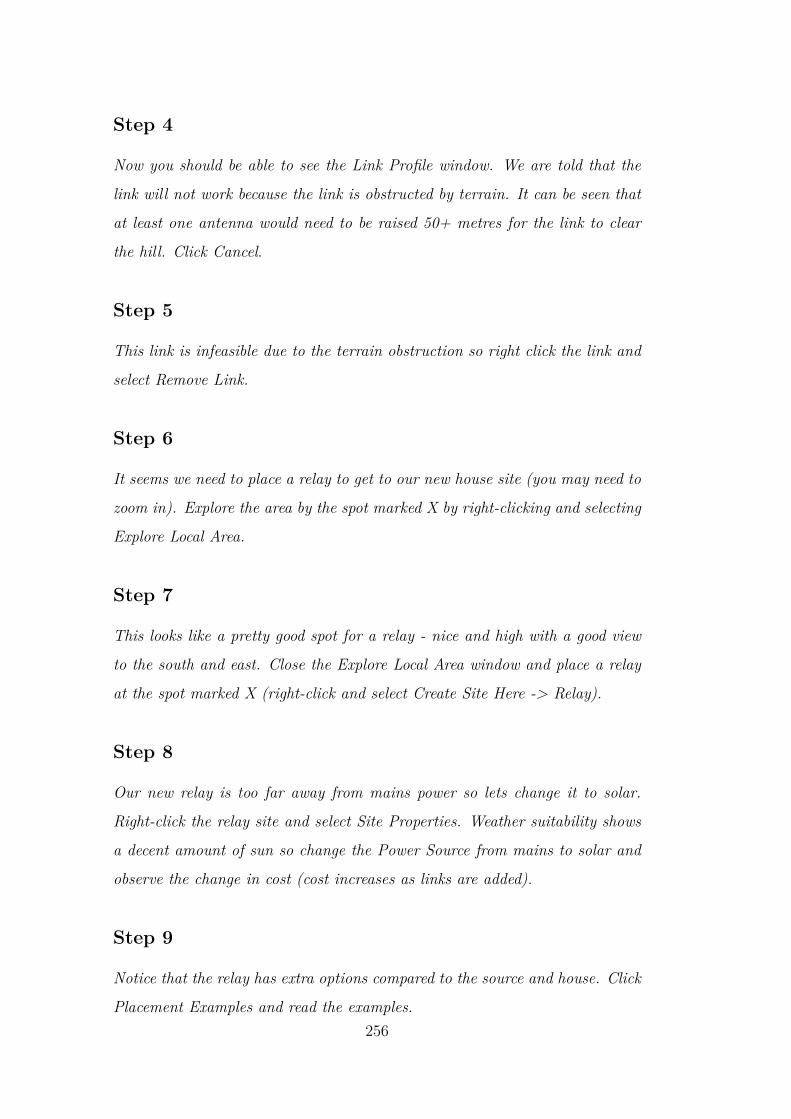
Step 4
Now you should be able to see the Link Profile window. We are told that the
link will not work because the link is obstructed by terrain. It can be seen that
at least one antenna would need to be raised 50+ metres for the link to clear
the hill. Click Cancel.
Step 5
This link is infeasible due to the terrain obstruction so right click the link and
select Remove Link.
Step 6
It seems we need to place a relay to get to our new house site (you may need to
zoom in). Explore the area by the spot marked X by right-clicking and selecting
Explore Local Area.
Step 7
This looks like a pretty good spot for a relay - nice and high with a good view
to the south and east. Close the Explore Local Area window and place a relay
at the spot marked X (right-click and select Create Site Here -> Relay).
Step 8
Our new relay is too far away from mains power so lets change it to solar.
Right-click the relay site and select Site Properties. Weather suitability shows
a decent amount of sun so change the Power Source from mains to solar and
observe the change in cost (cost increases as links are added).
Step 9
Notice that the relay has extra options compared to the source and house. Click
Placement Examples and read the examples.256

Step 10
For this tutorial assume we have permission and tick the box. Make up some
notes. Now click Access Examples and read the examples.
Step 11
Select 4WD as dominant transport. Move the window to one side so you can
see the relay and make notes about what you think access is like. When you
are done click OK.
Step 12
Hover over the relay and notice the gray potential link showing that there is
line-of-sight to the house. Create the link indicated by right-clicking a site,
selecting Create Link and left clicking the site to link to. The dashed arrow
gives a rough indication of whether there is line-of-sight between the site and
the mouse pointer.
Step 13
The link has been calculated as line-of-sight and a cost given. The last step
is for you, the user, to confirm that there are no possible obstructions such as
trees and buildings that could block the link. Assume that the link is free of
obstacles and click Yes.
Step 14
When a link is calculated as line-of-sight, the Link Profile window does not
come up automatically. Right-click the link and select Link Profile. Un-tick
the This Link Has No Obstructions check box and observe how the window
changes. Now re-tick the box to change the link back to line-of-sight.257

Step 15
Note there is a check box called This Link Is Active. Links can be activated
and deactivated when experimenting with network designs. When deactivated,
the link state changes to potential and the link’s cost is no longer considered.
Click OK.
Step 16
Look at the Site Properties for the relay, click Technical Information and ob-
serve the equipment listed. The cost of the relay is also updated (the same has
happened for the house site). Click OK and OK again.
Step 17
You may have noticed that we only had one potential link when we were ex-
pecting two for our relay. Create a link between the relay and the source so we
can figure out what is going on.
Step 18
We are told that the link is obstructed by terrain, the profile image shows there
is a small knoll obstructing our relay. This is where local knowledge is useful as
there is an un-powered barn that will give an extra 5m in height. Click Adjust
Antenna Height for the relay and enter 9m as the height. Click OK.
Step 19
Knowing just how high an antenna can be put is often how non-line-of-sight
(blocked by an obstruction) issues are solved. Make sure you tick the check box
that This Link Has No Obstructions and click OK.258

Step 20
Now we are going to compute a coverage plot. Right-click the source and select
Compute Coverage. This will take approximately 10 seconds to finish.
Step 21
The coverage plot shows all points that should be reachable by this site within
2 km. Any neighbours in the coverage area could be connected to this site. We
are going to revisit the house site and source site once again. Create a link
between the two to bring up the Link Profile window.
Step 22
Now locate the highest hill obstructing our link. Click on the hill such that
mouse cursor is at the correct x position (the y position does not matter). A
message should pop-up telling you that a relay has been created.
Step 23
You could now use this relay to create an alternative path of links from the
source to the house. It would then be possible to compare the costs, accessibility
and placement issues of the two relays. Congratulations! You have completed
the tutorial. Feel free to play around or load a real network plan to work on!
259


Appendix G
Radio wave propagation theory
G.1 Frequencies and line-of-sight
Radio wave propagation theory describes the propagation of radio waves in
different environments. Radio waves travel at the speed of light (c) and can
be expressed by the formula f × λ = c where f is the frequency in hertz and
λ is the wavelength in metres. Wavelength describes the distance between
consecutive corresponding peaks in the oscillating radio wave. Since speed is
constant, as frequency increases, the wavelength decreases, and vice versa. Ra-
dio waves with longer wavelengths travel further, and are better at travelling
through and around objects, however, radio waves with shorter wavelengths
can transport more data [70].
A wireless channel is a specific frequency, allocated with a number or letter
to identify it. Frequencies used for wireless communication belong to the radio
spectrum, which is a subset of the electromagnetic radiation spectrum. These
frequencies range from 300 Hz to 3000 GHz and the International Telecommu-
nications Union (ITU) have categorized these frequencies into bands by their
wavelength. Publicly available frequencies for wireless communication include
2.4 GHz, 5.4 GHz and 5.8 GHZ. Private frequencies used by protocols such as
WiMax [89] fall within a similar range e.g. 3.5 GHz. These frequencies belong
to the Ultra-High Frequency (UHF) and Super-High Frequency (SHF) bands261

designated by the ITU.
Frequency has an effect on radio waves propagation. Very low frequencies,
in the order of kilohertz, have wavelengths in the order of kilometers and prop-
agate along the surface of the earth due to electrical currents that flow in the
ground [99]. Frequencies in the low megahertz range propagate by sky wave
propagation where the radio waves transmitted from one location on earth can
be refracted by the ionosphere back down to another location [99]. Shortwave
radio is a well known example of sky wave propagation. For frequencies in the
high megahertz range and above, the only way for the radio waves to propagate
is directly between a transmitter and receiver, known as line-of-sight transmis-
sion. Line-of-sight means that the radio waves follow a direct path and that
obstructions such as hills and trees can block the signal and cause undesired
effects such as reflection and attenuation. Therefore, the path between the
transmitter and receiver must be free of obstructions in order to achieve an
efficient link.
Wireless line-of-sight is different than visual line-of-sight. As radio waves
propagate, they also spread out the further they travel. Hence, an ellipsoidal
volume of space known as the Fresnel zone needs to be considered. Equation
G.1 shows how the radius of a Fresnel zone is calculated for a particular point
P , where n is the Fresnel zone number, λ is the wavelength, d1is the distance
from the transmitter to P , and d2is the distance from P to the receiver.
Fn =√nλd1d2
d1 + d2(G.1)
There are theoretically an infinite number of Fresnel zones as n→∞; however
in wireless network planning, the innermost (n = 1) Fresnel zone is considered
the most important. Figure G.1 shows an example of the innermost Fresnel
zone. The size of the Fresnel zone is wavelength dependent because the wave-
length determines the maximum radius/width of the ellipsoid. The significance262

Figure G.1: Example of a path profile plot showing Fresnel zone
of the innermost Fresnel zone is that it defines the terrain clearance required
to achieve wireless line-of-sight. Any obstacles, such as trees, buildings and
mountains that obstruct the innermost Fresnel zone, will have an impact on
radio wave propagation. Minor obstruction of the innermost Fresnel zone can
be tolerated but is generally recommended by propagation experts to be less
than 40% of the Fresnel radius at the point of obstruction [45].
G.2 IEEE 802.11 protocols
The selection of which protocol to use for a particular link directly determines
the frequency that is used and maximum bit rate that can be obtained. The
802.11 protocols are discussed as they are the de-facto protocols for low-cost
wireless devices throughout the world and operate on publicly available fre-
quencies.
The IEEE 802.11 standards [36–38,40], known as Wifi, define a set of pro-
tocols for use with publicly available frequencies. The original 802.11 protocol,
now obsolete, was released in 1997 and provided only two bit rates, 1 Mbit/s
and 2 Mbit/s. A bit rate is a measure of speed and refers to the number of263
bits that can be conveyed in a unit of time. In 1999, two amendments were
made to 802.11(802.11a and 802.11b) which introduced higher bit rates.
The 802.11a protocol [37] operates in the 5 GHz band, in most cases be-
tween 5.150 and 5.320 GHz, and between 5.745 and 5.805 GHz. Due to the
higher frequency, 802.11a is incompatible with, and less power efficient than,
the other 802.11 protocols. 802.11a has eight data rates; 54, 48, 36, 24, 18, 12,
9 and 6 Mbit/s. The protocol supports up to 201 channels, however regulatory
domains only use a small subset. For example, in the United States the Fed-
eral Communications Commission has selected 12 non-overlapping channels to
make up the legal frequency range. WiPlan currently includes 802.11a as one
of the protocol choices for link configuration.
The 802.11b protocol [36] operates between 2.400 and 2.495 GHz and has
14 overlapping channels. Different regulatory domains support different sub-
sets of these channels but most include at least channels 1 to 11. 802.11b has
four bit rates; 11, 5.5, 2 and 1 Mbit/s. The 802.11b protocol is highly suscep-
tible to interference from other devices; including microwave ovens, cordless
home phones and baby monitors.
The 802.11g amendment [38] to 802.11 was introduced in June 2003. 802.11g
operates in the same frequency range as 802.11b; in this way 802.11g supports
12 bit rates in total, the same eight as 802.11a and four the same as 802.11b.
This means that the two protocols are compatible; that is, 802.11g can revert
back to the 802.11b bit rates if necessary. Since its introduction, 802.11g has
become a standard feature on most laptops and handheld devices. As with
802.11b, significant interference can be experienced with 802.11g due to oper-
ating in the popular 2.4 GHz spectrum. WiPlan currently includes 802.11g as
one of the protocol choices for link configuration.
The 802.11n protocol [40] is the latest amendment to 802.11, introduced264

in 2009. 802.11n operates in the 2.4 GHz range, however due to the use of
Multiple-Input Multiple-Output (MIMO) [79] technology achieves bit rates of
up to 600 Mbit/s. MIMO is a recent technology that uses multiple antennae
in order to significantly increase throughput; however due to having multiple
antenna, 802.11n devices are more costly than other 802.11 devices.
G.3 Antenna selection
Antenna selection is an important decision in wireless network planning. Dif-
ferent antenna types of antennas are used for different scenarios. Wireless
network planning tools should be capable of automatically selecting antenna
to be used for a particular scenario, for example, creating a point-to-point
link. This section describes key aspects of antenna behaviour that a wireless
network planning tool such as WiPlan needs to consider.
The isotropic antenna is a fundamental concept in wireless network plan-
ning. The isotropic antenna is a theoretical 100% efficient antenna that ra-
diates energy equally in all directions as a perfect sphere. This theoretical
isotropic antenna forms a basis for comparing antennas. The gain of an an-
tenna is the ratio between the power required at the input of an isotropic
antenna and the power required at the input of the real antenna being consid-
ered, such that the power intensity in a given direction is the same for both
antennas. Gain is measured in decibels relative to the isotropic antenna (dBi).
The direction of maximum gain is often used for the categorization of antennas.
Radiation patterns show the way an antenna propagates radio waves in
both the horizontal and vertical directions. Radiation patterns can be sum-
marised by the azimuth and elevation/zenith. The azimuth describes the angle
of direction in the horizontal plane; the elevation describes the angle above and
below the horizontal i.e. in the vertical plane. As an example, the direction of
maximum gain for an omni-directional antenna is in the horizontal direction265
with an azimuth of 360 degrees but an elevation of only a few degrees. These
sort of antenna are used as access points to provide network coverage to public
or common areas in mostly-flat areas. Highly directional antenna have very
precise azimuths and elevations of only a few degrees.
Directional antenna come in a range of form factors that influence the size
and shape of the directional beam they form for both transmission and re-
ception. Directional antenna have a number of benefits over omni-directional
antenna. Since the beam is more focused, the potential range of the antenna
is increased and the possibility of interference is reduced. Directional antenna
conserve bandwidth and energy consumption, making them an excellent choice
for long-distance links [61]. The gain of directional antenna typically range
from 15 dBi to 30 dBi for point-to-point links over distances up to 40 km [55].
Electro-magnetic radiation waves consist of electric and magnetic fields
travelling in the same direction but perpendicular to each other. Polarity de-
scribes the direction of the electrical field vector. A vertically aligned antenna
will transmit radio waves that have vertical electric fields and horizontal mag-
netic fields, a horizontally aligned antenna will be the opposite. Interference
can occur when the receivers of two separate links are in close proximity to each
other with the same frequency and antenna polarisation. This interference can
be mitigated by using vertically polarised antennas for one link and horizon-
tally polarised antennas for the other link. Links using vertically polarised
antennas experience higher signal attenuation than links using horizontally
polarised antennas in wooded areas due to radio wave scattering upon impact
with the vertical tree trunks [34]. Horizontal polarisation is the better choice
for urban areas with tall buildings while vertical polarisation is better when
the link is across water to prevent reflection off the water . Signal polarisation
can also be altered by heavy rainfall due to the non-spherical shape of large
raindrops [33].
266

G.4 Signal and noise
Tools for wireless network planning need to have signal strength and noise sup-
port in order to determine the performance of an arbitrary link. This section
describes why signal strength and noise are fundamental for wireless network
planning.
The radio wave that is being propagated is referred to as the signal and
at any moment in time that signal has a particular strength. This signal
strength is measured in decibels and is relative to one milliwatt, hence sig-
nal strength is expressed in decibel milliwatts (dBm). A signal strength of
0 dBm is equivalent to 1 milliwatt of power. Positive values mean that the
signal is stronger than 1 milliwatt and negative values indicate that the signal
is weaker than 1 milliwatt. Every +3 dBm is a doubling in power and every
-3 dBm is a halving in power (3 dBm = 2 milliwatts, -3 dBm = 0.5 milliwatts).
Effective isotropically radiated power (EIRP) is an important measure of
signal. This is the peak amount of power that would be emitted by a theoretical
isotropic antenna in the direction of the antenna’s maximum gain. EIRP also
takes in to account losses sustained in the connectors and cables. Equation
G.2 shows the formula for calculating EIRP, where Ptx is the power of the
transmitter in dBm, Ltx is the loss in dB due to connectors and cables, and
Gt is the antenna gain in dBi.
EIRP = Ptx − Ltx +Gt dB (G.2)
Regulations are often put in place to restrict the maximum EIRP in a
given area. This is usually to minimise interference on similar frequencies.
Most governments around the world have a working group that determine
these regulations across the radio spectrum for their region.
Signal strength can be measured at any point in the path between the267
transmitter and the receiver; the first of which is when the signal is transmit-
ted from the radio itself. At this point, the power measured is that generated
by the radio and is known as transmit power. The signal strength is then
increased relative to the gain of the transmitting antenna as the signal radi-
ates out from the transmitting antenna. The receiving antenna increases the
signal strength relative to the gain of the receiving antenna as the signal is re-
ceived by the receiving antenna and finally the signal reaches the radio receiver.
Each bit rate is transmitted at a particular transmit power and has to be
received above a certain signal strength, the receive sensitivity, in order for
the signal to be correctly decoded. The 802.11 standard [35] defines receive
sensitivity as the minimum signal level required for packet loss to exceed 3%.
As bit rate increases, the transmit power and/or the receive sensitivity must
also increase in order to meet the 3% packet loss requirement. Transmit power
is limited by EIRP restrictions therefore receive sensitivity is different for each
bit rate. The receive sensitivity is between -95 dBm and -70 dBm for 802.11
protocols.
Noise is any unwanted radio transmissions that occur on or near the oper-
ating frequency. Most frequency bands used by 802.11 wireless equipment are
in the unlicensed public spectrum. This means that network planners must
not only consider transmissions from other wireless networks but also trans-
missions from cordless phones, Bluetooth and some electrical devices such as
microwave ovens. Noise is a problem when it exceeds the power of the desired
signal. Enge et. al. show average noise measurements of -85.1 dBm and -97.1
dBm at two different rural study sites [66].
A common measure used by wireless network planners to gauge the perfor-
mance of a link is the signal to noise ratio (SNR). This is the ratio between the
desired signal and unwanted noise. Since both signal and noise are measured
in the logarithmic decibel scale, the signal-to-noise ratio can be calculated by268

simply subtracting the noise from the signal.
G.5 Loss
In wireless network planning, loss refers to the loss of power between a trans-
mitter and receiver in decibels (dB). Understanding the factors that influence
that loss, known as propagation loss, is necessary for predicting whether the
performance of an arbitrary link will be satisfactory. This section describes
the how propagation loss occurs and the effects that might result.
When a wireless signal is transmitted, radio waves radiate out from the
antenna. Phenomena such as reflection, absorption, refraction, diffraction and
scattering can occur as a result of obstructions that lie in the path of the
radio waves. The most common phenomena are reflection and absorption.
Radio waves reflect off most surfaces, also losing some of their power due to
absorption. This includes dense grids of bars or mesh, as long as the distance
between the bars/mesh is small compared to the wavelength of the radio wave.
For example, a one centimeter metal grid will appear as a solid metal plate at
a frequency of 2.4 GHz with a wavelength of 0.125m (12.5 cm). Some obstruc-
tions allow radio waves to pass through them, absorbing some of the power in
the process, depending on the frequency.
Refraction of radio waves can be caused by the atmosphere [31] and by
man-made products with a different refractive index than air, such as glass
or water. The planner needs to consider the possibility of propagation loss
due to the effects of water bodies when planning any links over water. Very
large expanses of water can have an interesting effect called ducting. This is
when there is a refractive index difference between the atmosphere and the
water which creates a duct that behaves like a giant optical fiber. The radio
wave becomes trapped in the duct and can travel great distances with low269
loss [78]. Diffraction [41] occurs when radio waves encounter the edge of an
obstacle, such as the top of a building or a mountain. Diffraction causes the
radio waves to bend around the obstacle which can be used to the network
planners’ advantage, however loss in signal strength will also result. Scatter-
ing is a form of reflection and occurs when the obstruction is non-uniform,
such as the branches and leaves of trees.
With all of these phenomena, a signal can arrive at its destination via
many distinct paths, and sometimes not at all. This occurrence is commonly
known as multipath. Changes in amplitude and phase may occur as a result
of the different reflections of the signal travelling via different paths. These
differences in path distance result in different time of arrivals. Radio waves
are considered to be sinusoidal waveforms and when reflections of the signal
arrive at a receiver, they combine to form a single waveform for the receiver to
decode. Constructive interference occurs when two peaks coincide, resulting
in increased power. When a peak and a valley coincide, destructive interfer-
ence occurs and the receiver will be unable to decode the signal. Multipath is
difficult to predict, therefore it is important that the effects of multipath are
minimized as much as possible during the wireless network planning process.
Loss can change dramatically over time. The timing variation experienced
by loss is known as fading. Fast fading is when the loss changes rapidly, such
as during the transmission of a single frame on a mobile network. Slow fading
occurs in the order of seconds and is due to changes in terrain and atmospheric
conditions. Flat fading is when the variation of loss is small and almost uni-
form in comparison to the radio system bandwidth. Frequency-selective fading
is when there are large signal variations over the system bandwidth and certain
frequencies may be severely affected while others are not affected at all.
Fading is often statistically modelled in one of two ways. Rayleigh fad-
ing represents scenarios where there are multiple indirect paths between the270
transmitter and the receiver, with no distinct dominant path, such as in an
urban canyon where there are many high buildings that can cause reflection
or diffraction of the signal. The signals arriving at the receiver are modelled
as the sum of multiple, independent, random variables. Where a dominant,
usually direct, path exists, then Ricean fading is more appropriate as Ricean
fading generates a stochastic distribution around a more consistent mean.
G.6 Classification of transmission loss
The ability to classify transmission loss is important as classification specifies
where the loss was measured. Consistent use of terms and definitions ensure
that the link budget is understood and provides a useful way to describe how
the propagation models work. The ITU recommends that the following terms
and definitions are used when describing transmission loss for radio links [28].
Figure G.2 provides an illustration of these terms and definitions. All of the
following loss types are expressed in decibels.
Total loss Total loss (Ll) is the ratio between the power supplied by the
radio transmitter and the power supplied to the radio receiver. The exact
point in the radios at which the power is measured should be specified. In
this research, some addition terms need to be defined. Ptx is the power at the
terminals of the radio transmitter and Prx is the power at the terminals of
the radio receiver. Losses incurred by feed lines (cables) and connectors are
denoted by Ltx and Lrx for the transmitter and receiver respectively.
System loss System loss (Ls) is ratio between the power at the terminals of
the transmitting antenna (Pt) and the power at the terminals of the receiving
antenna (Pa). System loss can be expressed by Ls = Pt − Pa dB.
Transmission loss Transmission loss (L) is the ratio between the power
radiated by the transmitting antenna and the power at the receiving antenna
output if there were no losses in the antenna circuitry. Transmission loss can271
be expressed by L = Ls−Ltc−Lrc dB where Ltc are the transmitting antenna
losses and Lrc are the receiving antenna losses.
Basic transmission loss Basic transmission loss (Lb) is the transmission
loss that would occur if the antennas were replaced with isotropic antennas but
including the effects of radio wave propagation phenomena. Basic transmission
loss can be expressed by Lb = L+Gt +Gr dB where Gt and Gr are the gains
of the transmitting and receiving antennas respectively.
Free-space basic transmission loss Free-space basic transmission loss
(Lbf ) is the transmission loss that would occur if the antennas were replaced
with isotropic antennas and those antennas were located in free-space.
Ray path transmission loss Ray path transmission loss (Lt) is the trans-
mission loss for a particular ray propagation path and can be expressed by
Lt = Lb −Gt −Gr dB.
Loss relative to free-space Loss relative to free-space (Lm) is the differ-
ence between the basic transmission loss and the free-space basic transmission
loss. Loss relative to free-space may be the summation of several independent
calculations. For example, incorporating loss calculations from multiple vege-
tation sources. Loss relative to free-space can be expressed by Lm = Lb − Lbf
dB.
272

Figure G.2: Classifications of transmission loss (sourced from [28])
G.7 Link budget
A link budget can be used to determine if a link configuration is acceptable by
accounting for all of the gains and losses in a wireless link [111]. These gains
and losses can be expressed with Equation G.3.
Prx = Ptx − Ltx +Gt − Ltc − Lbf − Lm +Gr − Lrc − Lrx (G.3)
TX and RX refer to the transmitting and receiving stations respectively.
The transmitting station has a radio with an output power (Pt) in dBm and
an antenna with gain (Gt) in dBi and associated antenna losses (Ltc) in dB.
The receiving station has a radio with a receive sensitivity that the received
power (Prx) must meet or exceed; Prx therefore represents that receive sensi-
tivity. The receiving station also has an antenna with gain (Gr) in dBi with
associated antenna losses (Lrc) in dB. Both stations have extra losses that can
be attributed to cables and connectors, which are represented by Ltx and Lrx.
Free-space loss is represented by Lbf . Loss relative to free-space (Lm) can be
derived using propagation modeling, fading modeling or by providing a margin
value; a margin value of 10 dB will satisfy most situations .273
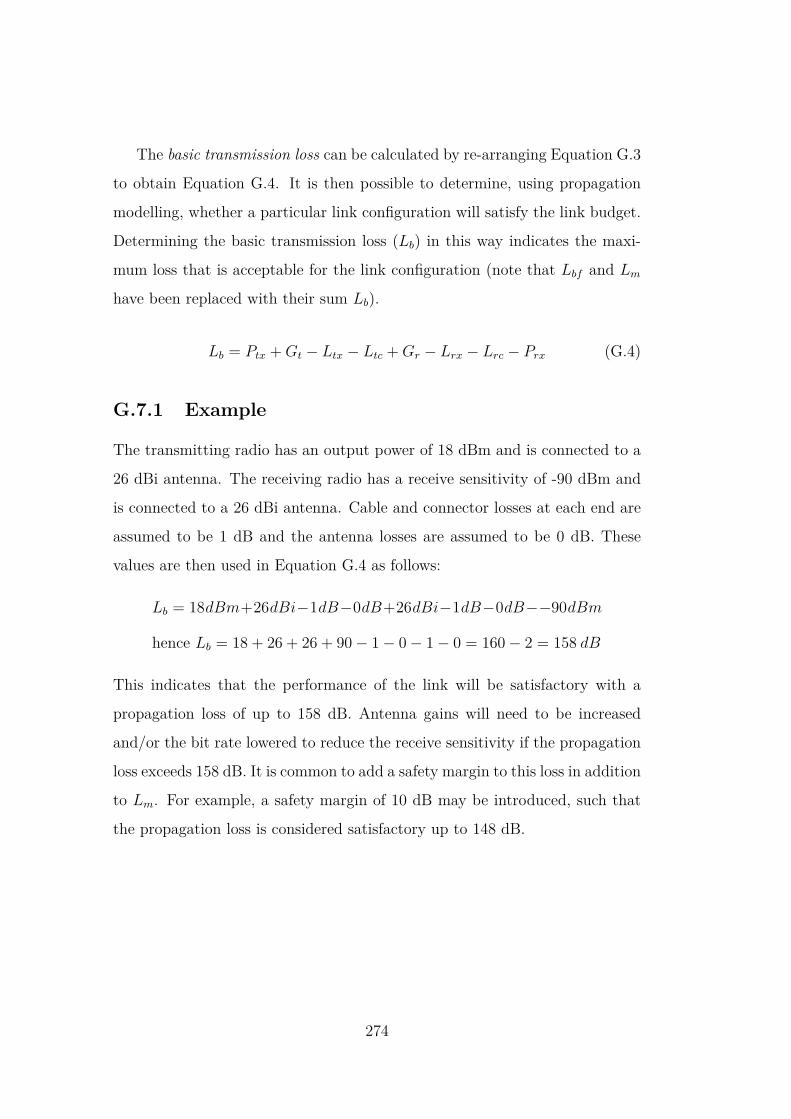
The basic transmission loss can be calculated by re-arranging Equation G.3
to obtain Equation G.4. It is then possible to determine, using propagation
modelling, whether a particular link configuration will satisfy the link budget.
Determining the basic transmission loss (Lb) in this way indicates the maxi-
mum loss that is acceptable for the link configuration (note that Lbf and Lm
have been replaced with their sum Lb).
Lb = Ptx +Gt − Ltx − Ltc +Gr − Lrx − Lrc − Prx (G.4)
G.7.1 Example
The transmitting radio has an output power of 18 dBm and is connected to a
26 dBi antenna. The receiving radio has a receive sensitivity of -90 dBm and
is connected to a 26 dBi antenna. Cable and connector losses at each end are
assumed to be 1 dB and the antenna losses are assumed to be 0 dB. These
values are then used in Equation G.4 as follows:
Lb = 18dBm+26dBi−1dB−0dB+26dBi−1dB−0dB−−90dBm
hence Lb = 18 + 26 + 26 + 90− 1− 0− 1− 0 = 160− 2 = 158 dB
This indicates that the performance of the link will be satisfactory with a
propagation loss of up to 158 dB. Antenna gains will need to be increased
and/or the bit rate lowered to reduce the receive sensitivity if the propagation
loss exceeds 158 dB. It is common to add a safety margin to this loss in addition
to Lm. For example, a safety margin of 10 dB may be introduced, such that
the propagation loss is considered satisfactory up to 148 dB.
274

Appendix H
Example area profile
configuration
# Example config file for areaprofile (C) Sam Bartels 2009
InputFilename = "/home/sam/gis/dem/w001001.adf"
OutputFilename = "/home/sam/test.png"
# Specify bounding box of interest
GeoBoundingBox{
# Type of coordinates for bounding box (NZTM, WGS84)
CoordType = "NZTM"
# Northern-most coordinate
NorthLimit = 5721327.37
# Southern-most coordinate
SouthLimit = 5717327.37
# Eastern-most coordinate
EastLimit = 1929563.04
# Western-most coordinate
WestLimit = 1925563.04
}
275
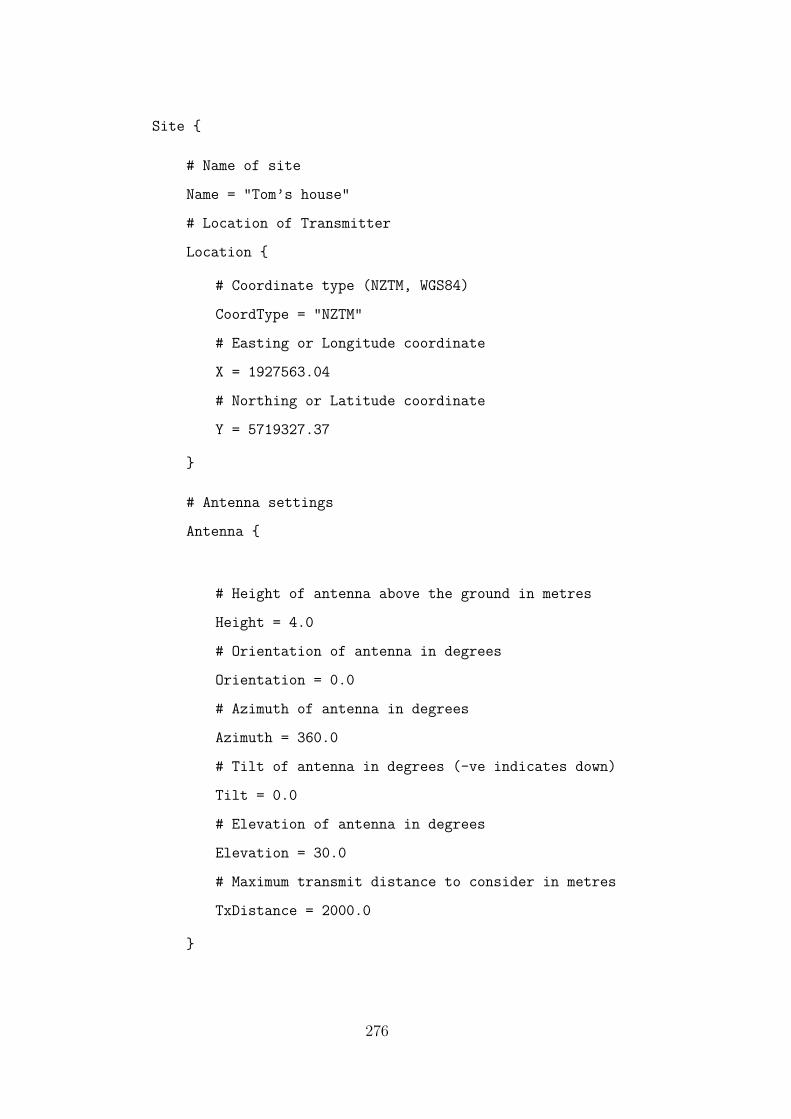
Site {
# Name of site
Name = "Tom’s house"
# Location of Transmitter
Location {
# Coordinate type (NZTM, WGS84)
CoordType = "NZTM"
# Easting or Longitude coordinate
X = 1927563.04
# Northing or Latitude coordinate
Y = 5719327.37
}
# Antenna settings
Antenna {
# Height of antenna above the ground in metres
Height = 4.0
# Orientation of antenna in degrees
Orientation = 0.0
# Azimuth of antenna in degrees
Azimuth = 360.0
# Tilt of antenna in degrees (-ve indicates down)
Tilt = 0.0
# Elevation of antenna in degrees
Elevation = 30.0
# Maximum transmit distance to consider in metres
TxDistance = 2000.0
}
276

# System variables
System {
# Maximum path loss allowed
PathLossLimit = 148.0
# Frequency of system in Mhz
Frequency = 5400.0
# Polarity of system (0=horizontal, 1=vertical)
Polarity = 0
}
# Environmental constants
Environment {
# Dielectric Constant of Ground
GroundDielectric = 15.0
# Conductivity of ground (S/m)
GroundConductivity = 0.001
# Surface refractivity (N-units)
SurfaceRefractivity = 301.0
# Radio climate: 1-Equatorial, 2-Continental Subtropical,
# 3-Maritime Tropical, 4-Desert,
# 5-Continental Temperate, 6-Maritime Temperate,
# Over Land, 7-Maritime Temperate, Over Sea
RadioClimate = 6
}
277
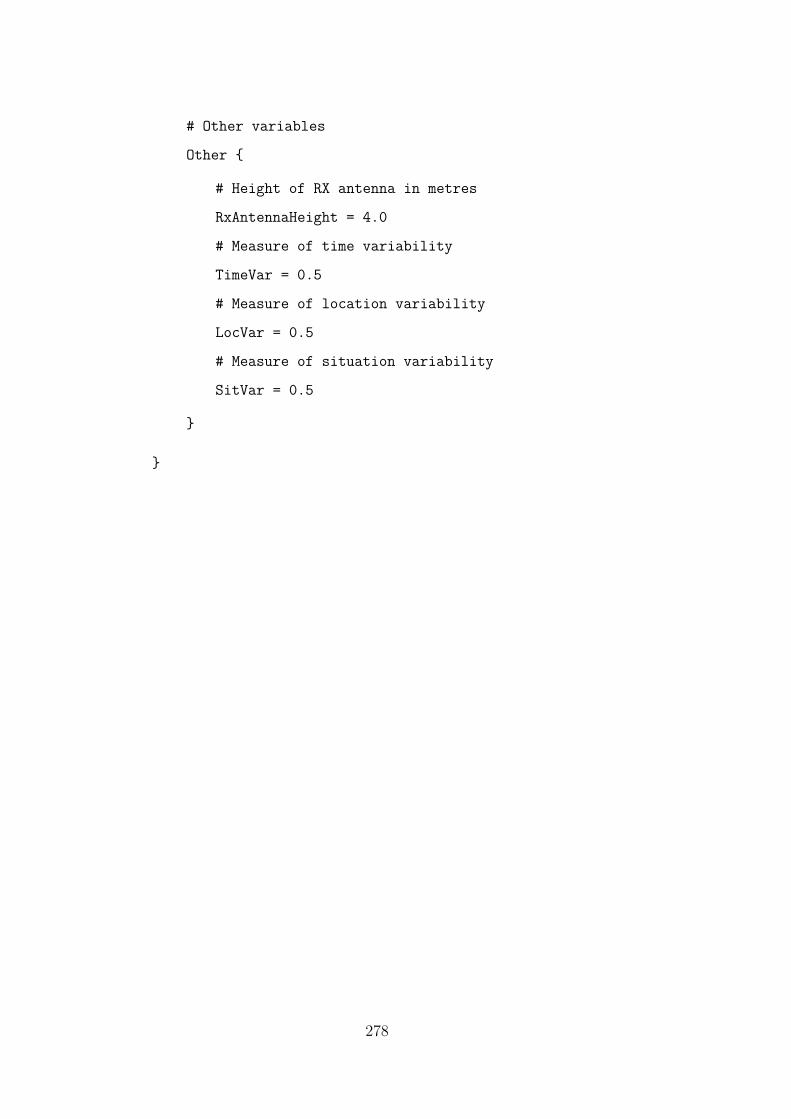
# Other variables
Other {
# Height of RX antenna in metres
RxAntennaHeight = 4.0
# Measure of time variability
TimeVar = 0.5
# Measure of location variability
LocVar = 0.5
# Measure of situation variability
SitVar = 0.5
}
}
278

Appendix I
Ethics approval
279

Bibliography
[1] AIRCOM International CONNECT [Online]. Retrieved from
http://www.aircominternational.com/products/connect [02 September
2010].
[2] ComSiteDesign [Online]. Retrieved from
http://www.rcc.com/comsite.shtml [23 September 2010].
[3] Ebay [Online]. Available http://www.ebay.com .
[4] EDX [Online]. Retrieved from http://www.edx.com/ [23 September
2010].
[5] Facebook [Online]. Available http://www.facebook.com .
[6] Forsk Atoll [Online]. Retrieved from http://www.forsk.com/ [02 Septem-
ber 2010].
[7] Geospatial Data Abstraction Library [Online]. Retrieved from
http://gdal.org.
[8] Google Earth [Online]. Retrieved from http://www.google.com/earth
[14 January 2011].
[9] Mentum Planet [Online]. Retrieved from http://www.mentum.com/ [23
September 2010].
[10] Meraki [Online]. Available http://www.meraki.com .
[11] Net Index [Online]. Retrieved from http://www.netindex.com/ [29 April
2011].281

[12] New Zealand Transverse Mercator 2000 [Online]. Retrieved from
http://www.linz.govt.nz/ [17 January 2011].
[13] NIWA Climate Data [Online]. Retrieved from http://cliflo.niwa.co.nz/.
[14] Overture Online [Online]. Retrieved from http://overtureonline.com/
[02 September 2010].
[15] Pathloss [Online]. Retrieved from http://www.pathloss.com/ [23
September 2010].
[16] Planning a Wireless Network. Technical report, ProCurve Networking
by HP.
[17] Python [Online]. Retrieved from http://www.python.org.
[18] Radio Mobile [Online]. Retrieved from
http://www.cplus.org/rmw/english1.html [24 September 2010].
[19] Soekris [Online]. Available http://www.soekris.com .
[20] SPLAT! [Online]. Retrieved from http://www.qsl.net/kd2bd/splat.html
[24 September 2010].
[21] Te Whaiti Nui-a-Toi [Online]. Retrieved from http://www.tewhaiti-nui-
a-toi.maori.nz/.
[22] Trademe [Online]. Available http://www.trademe.co.nz .
[23] Twitter [Online]. Available http://www.twitter.com .
[24] Ubiquiti [Online]. Available http://www.ubnt.com/ .
[25] WiTech [Online]. Retrieved from http://www.witech.it [3 December
2010].
[26] wxPython [Online]. Retrieved from http://www.wxpython.org.
[27] ITU-R P.525-2 Calculation of Free-space Attenuation. Recommendation
P.525-2, International Telecommunication Union, Geneva, Switzerland,
1994.
[28] ITU-R P.341-4 The Concept of Transmission Loss for Radio Links. Rec-
ommendation P.341-4, International Telecommunication Union, Geneva,
Switzerland, 1995.
[29] NASA Safety Standard - Guidelines and Assessment Procedures for
Limiting Orbital Debris. Safety Standard NSS 1740.14, National Aero-
nautics and Space Administration, Office of Safety and Mission Assur-
ance,Washington, D.C. 20546, 1995.
[30] ITU-R P.581-2 The Concept of "Worst Month". Recommendation P.581-
2, International Telecommunication Union, Geneva, Switzerland, 2000.
[31] ITU-R P.453-9 The radio refractive index: its formula and refractiv-
ity data. Recommendation P.453-9, International Telecommunication
Union, Geneva, Switzerland, 2003.
[32] New Zealand: An Urban/Rural Profile [Online]. Technical report, Statis-
tics New Zealand, 2004.
[33] ITU-R P.530-11 Propagation data and prediction methods required for
the design of terrestrial line-of-sight systems. Recommendation P.530-11,
International Telecommunication Union, Geneva, Switzerland, 2005.
[34] ITU-R P.833-5 Attenuation in Vegetation. Recommendation P.833-5,
International Telecommunication Union, Geneva, Switzerland, 2005.
[35] IEEE Std 802.11-2007 Section 14. Standard 802.11-2007, IEEE Com-
puter Society LAN/MAN Standards Committee, IEEE, 3 Park Avenue,
New York, NY 10016-5997, USA, June 2007.
[36] IEEE Std 802.11-2007 Section 15 and 18. Standard 802.11-2007, IEEE
Computer Society LAN/MAN Standards Committee, IEEE, 3 Park Av-
enue, New York, NY 10016-5997, USA, June 2007.

[37] IEEE Std 802.11-2007 Section 17. Standard 802.11-2007, IEEE Com-
puter Society LAN/MAN Standards Committee, IEEE, 3 Park Avenue,
New York, NY 10016-5997, USA, June 2007.
[38] IEEE Std 802.11-2007 Section 19. Standard 802.11-2007, IEEE Com-
puter Society LAN/MAN Standards Committee, IEEE, 3 Park Avenue,
New York, NY 10016-5997, USA, June 2007.
[39] Household Use of Information and Communication Technology [Online].
Technical report, Statistics New Zealand, 2009.
[40] IEEE Std 802.11n-2009 Section 20. Standard 802.11n-2009, IEEE Com-
puter Society LAN/MAN Standards Committee, IEEE, 3 Park Avenue,
New York, NY 10016-5997, USA, October 2009.
[41] ITU-R P.526-11 Propagation by diffraction. Recommendation P.526-11,
International Telecommunication Union, Geneva, Switzerland, 2009.
[42] Proposal for Comment - Rural Broadband Initiative. Technical report,
Ministry of Economic Development,New Zealand, 2009.
[43] Fulya Altiparmak and Berna Dengiz. Optimal Design of Reliable Com-
puter Networks: A Comparison of Metaheuristics. Journal of Heuristics,
9:471–487, 2003.
[44] E Amaldi, A. Capone, F. Malucelli, and F. Signori. UMTS Radio Plan-
ning: Optimizing Base Station Configuration. In Vehicular technology
conference IEEE, 2002.
[45] David Bacon. Propagation of Radiowaves, 2nd Edition, chapter Intro-
duction to diffraction (ch8), pages 129 – 144. The Institution of Electrical
Engineers, 2003.
[46] David Bacon. Propagation of Radiowaves, 2nd Edition, chapter Reflec-
tion and scattering from rough surfaces (ch6), pages 87 – 102. The
Institution of Electrical Engineers, 2003.

[47] Chris Barker. FloatCanvas [Online]. Retrieved from
http://trac.paulmcnett.com/floatcanvas.
[48] Cleve Barlow. Tikanga whakaaro : key concepts in Maori culture. Oxford
University Press, Oxford [England] : Auckland, N.Z. :, 1991.
[49] Calum Benson, Adam Elman, Seth Nickell, and Colin Z Robertson.
GNOME Human Interface Guidelines 2.2.1 [Online]. Retrieved from
http://library.gnome.org/devel/hig-book [7 February 2011].
[50] B Boehm. A spiral model of software development and enhancement.
SIGSOFT Softw. Eng. Notes, 11(4):14–24, August 1986.
[51] Stella Boess, Daniel Saakes, and Caroline Hummels. When is role playing
really experiential?: case studies. In Proceedings of the 1st international
conference on Tangible and embedded interaction, TEI ’07, pages 279–
282, New York, NY, USA, 2007. ACM.
[52] David Brown and Gregory M. Stone. A Report On Technology Inde-
pendent Methodology for the Modeling, Simulation, and Empirical Ver-
ification of Wireless Communication System Performance In Noice and
Interference Limited Systems Operation on Frequencies Between 30 and
1500 MHz. Technical report, Telecommunications Industry Association
(TIA), May 1997.
[53] Maria Eugênia Camargo, Pedro Roberto Jacobi, and Raphaèle Ducrot.
Role-playing games for capacity building in water and land management:
Some brazilian experiences. Simul. Gaming, 38:472–493, December 2007.
[54] Vijay Chandru and M. R. Rao. Algorithms and theory of computation
handbook. chapter Integer programming, pages 31–31. Chapman and
Hall, 2010.
[55] Kameswari Chebrolu, Bhaskaran Raman, and Sayandeep Sen. Long-
distance 802.11b links: performance measurements and experience. In

Proceedings of the 12th annual international conference on Mobile com-
puting and networking, MobiCom ’06, pages 74–85, New York, NY, USA,
2006. ACM.
[56] Xiuzhen Cheng, Ding-Zhu Du, Lusheng Wang, and Baogang Xu. Re-
lay Sensor Placement in Wireless Sensor Networks. Wireless Networks,
14(3):347 – 355, 2008.
[57] B.D Chiara, R. Sorrentino, M. Strappini, and L. Tarricone. Genetic
optimization of radiobase-station sizing and location using a gis-based
framework: experimental validation. Antennas and Propagation Society
International Symposium IEEE, pages 863–866, 2003.
[58] Stephen Cobb. Satellite Internet Connection for Rural Broadband. Tech-
nical report, Rural Mobile and Broadband Alliance, 2011.
[59] Alan Cooper. The Inmates Are Running the Asylum: Why High Tech
Products Drive Us Crazy and How to Restore the Sanity. Pearson Higher
Education, 2 edition, 2004.
[60] John Cullerne, editor. The Penguin dictionary of physics. Number 4 in
Penguin reference library. Penguin, c2009.
[61] Fei Dai and Jie Wu. Efficient Broadcasting in Ad Hoc Wireless Networks
using Directional Antennas. In IEEE Transactions on Parallel and Dis-
tributed Systems, volume 17. IEEE Computer Society, April 2006.
[62] Arindam K. Das and Mehran Mesbahi. K-node Connected Power Ef-
ficient Topologies in Wireless Networks: A Semidefinite Programming
Approach. Technical report, University of Washington, Seattle, WA,
2005.
[63] Agustín Díaz-Pinés. Indicators of Broadband Coverage. OECD Digital
Economy Papers 165, OECD Publishing, December 2009.
[64] Mathieu Dionnet, Marcel Kuper, Ali Hammani, and Patrice Garin. Com-
bining role-playing games and policy simulation exercises: An experience

with moroccan smallholder farmers. Simul. Gaming, 39:498–514, Decem-
ber 2008.
[65] J. J. Egli. Radio Propagation Above 40MC Over Irregular Terrain. In
Proceedings of the Institute of Radio Engineers, volume 45, pages 1383
– 1391, October 1957.
[66] Per Enge, Dennis Akos, Juyong Do, Joel B. Simoneau, L. Wilson Pear-
son, and Venkatesh Seetharam. Measurements of Man-Made Spectrum
Noise Floor. Technical report, Stanford University and Clemson Univer-
sity, 2004.
[67] Sinem Coleri Ergen and Pravin Varaiya. Optimal Placement of Relay
Nodes for Energy Efficiency in Sensor Networks. Technical report, 2005.
[68] J. E. Farrow and S. L. Rothschild. User-Friendly Software for the De-
sign of Digital Line-of-Sight Radio Links. NTIA Report 89-246, U.S.
Department of Commerce, 1989.
[69] Konstantinos P. Ferentinos and Theodore A. Tsiligiridis. Adaptive de-
sign optimization of wireless sensor networks using genetic algorithms.
Computer Networks, 51:1031–1051, 2007.
[70] Rob Flickenger, Corinna Aichele, Sebastian Büttrich, Laura M. Drewett,
Alberto Escudero-Pascual, Louise Berthilson, Carlo Fonda, Jim Forster,
Ian Howard, Kyle Johnston, Tomas Krag, Gina Kupfermann, Adam
Messer, Juergen Neumann, Ermanno Pietrosemoli, Frédéric Renet, and
Marco Zennaro. Wireless Networking in the Developing World. Second
edition, December 2007.
[71] L.R. Foulds, H.W. Hamacher, and J.M. Wilson. Integer programming
approaches to facilities layout models with forbidden areas. Annals of
Operations Research, 81:405–417, 1998.
[72] Harald T. Friis. A Note on a Simple Transmission Formula. In Proceed-
ings of the IRE and Waves and Electrons, May 1946.

[73] Hernan Galperin. Wireless networks and rural development: Opportu-
nities for latin america. Technical report, Annenberg School for Com-
munication, University of Southern California, 2005.
[74] Bezalel Gavish and Joakim Kalvenes. The impact of satellite altitude
on the performance of leos based communication systems. Wirel. Netw.,
4:199–213, February 1998.
[75] Alan Mc Gibney and Martin Klepal. Tool for automatic design and op-
timisation of large scale wlan. In Seventh IFIP International Conference
on Mobile and Wireless Communication Networks, 2005.
[76] Alexandre Gondran, Alexandre Caminada, Julien Fondrevelle, and
Oumaya Baala. Wireless LAN planning: a didactical model to opti-
mise the cost and effective payback. Int. J. Mobile Network Design and
Innovation, 2(1):13–25, 2007.
[77] Antony Guinard, Alan McGibney, and Dirk Pesch. A wireless sensor
network design tool to support building energy management. In Pro-
ceedings of the First ACM Workshop on Embedded Sensing Systems for
Energy-Efficiency in Buildings, BuildSys ’09, pages 25–30, New York,
NY, USA, 2009. ACM.
[78] S. Gunashekar, D. Siddle, and E. Warrington. Transhorizon radiowave
propagation due to evaporation ducting. Resonance, 11:51–62, 2006.
[79] Daniel Halperin, Wenjun Hu, Anmol Sheth, and David Wetherall. 802.11
with multiple antennas for dummies. SIGCOMM Comput. Commun.
Rev., 40:19–25, January 2010.
[80] Masaharu Hata. Empirical formula for propagation loss in land mobile
radio services. IEEE Transactions on Vehicular Technology, 29(3):317 –
325, August 1980.
[81] John Hay. Extreme Weather and Climate Events, and Farming Risks. In
Mannava V. K. Sivakumar and Raymond P. Motha, editors, Managing
Weather and Climate Risks in Agriculture, pages 1–19. Springer Berlin
Heidelberg, 2007.
[82] G.A. Hufford, A.G. Longley, and W.A. Kissick. A guide to the use of
the ITS Irregular Terrain Model in the area prediction mode. Technical
Report 82-100, NTIA, 1982.
[83] George Hufford. The ITS Irregular Terrain Model, version 1.2.2 The Al-
gorithm. National Telecommunications and Information Administration,
Institute for Telecommunications Sciences, 325 Broadway, Boulder, CO
80303-3328, USA.
[84] Robin Jeffries, James R. Miller, Cathleen Wharton, and Kathy Uyeda.
User interface evaluation in the real world: a comparison of four tech-
niques. In Proceedings of the SIGCHI conference on Human factors in
computing systems: Reaching through technology, CHI ’91, pages 119–
124, New York, NY, USA, 1991. ACM.
[85] D Johnson, K Matthee, D Sokoya, L Mboweni, A Makan, and H Kotze.
Building a Rural Wireless Mesh Network – A do-it-yourself guide to
planning and building a Freifunk based mesh network. Technical report,
Wireless Africa, Meraka Institute, 2007.
[86] Jerry Johnson and Marty Strange. Why Rural Matters 2007: The Real-
ities of Rural Education Growth. Technical report, October 2007.
[87] J. W. Jones, J. W. Hansen, F. S. Royce, and C. D. Messina. Potential
benefits of climate forecasting to agriculture. Agriculture, Ecosystems &
Environment, 82(1-3):169 – 184, 2000.
[88] Damien B. Jourdan and Olivier L. de Weck. Layout Optimization for
a Wireless Sensor Network using a Multi-Objective Genetic Algorithm.
Technical report, Dept. of Aeronautics and Astronautics, Massachusetts
Institute of Technology, 2004.

[89] Panagiotis Kalagiakos. Mobile WiMAX features. In Proceedings of the
5th conference on Applied electromagnetics, wireless and optical commu-
nications, pages 97–102, Stevens Point, Wisconsin, USA, 2007. World
Scientific and Engineering Academy and Society (WSEAS).
[90] Laurie Kantner and Stephanie Rosenbaum. Usability Studies of WWW
Sites: Heuristic Evaluation vs. Laboratory Testing. In SIGDOC, pages
153–160, 1997.
[91] Andreas Krause, Carlos Guestrin, Anupam Gupta, and Jon Kleinberg.
Near-optimal Sensor Placements: Maximizing Information while Mini-
mizing Communication Cost. 2006.
[92] Frank Y.S. Lin and P.L. Chiu. A Simulated Annealing Algorithm for
Energy-Efficient Sensor Network Design. Technical report, Department
of Information Management, National Taiwan University, 2005.
[93] Peng Lin, Hung Ngo, ChunMing Qiao, Xin Wang, Ting Wang, and
DaYou Qian. Minimum Cost Wireless Broadband Overlay Network Plan-
ning. Internation Symposium on a World of Wireless, Mobile and Mul-
timedia Networks, IEEE Computer Society, 2006.
[94] A. G. Longley and P. L. Rice. Prediction of Tropospheric Radio Trans-
mission Loss over Irregular Terrain - A Computer Method. Technical re-
port, Institute for Telecommunication Sciences, Boulder, Colorado, 1968.
[95] Geraldo Mateus, Antonio Loureiro, and Ricardo Rodrigues. Optimal
Network Design for Wireless Local Area Network. 2002.
[96] Rudolf Mathar and Thomas Niessen. Optimum positioning of base sta-
tions for cellular radio networks. Wireless Networks, 6:421–428, 2000.
[97] Filipe F. Mazzini, Geraldo R. Mateus, and James Macgregor Smith.
Lagrangean Based Methods for Solving Large-Scale Cellular Network
Design Problems. Wireless Networks, 9:659–672, 2003.
[98] Murray Milner. Fibre-to-the-Premise Cost Study. Technical report, Mil-
ner Consulting Limited, 2009.
[99] John Milsom. Propagation of Radiowaves, 2nd Edition, chapter Sur-
face waves, and sky waves below 2 MHz (ch18), pages 357 – 384. The
Institution of Electrical Engineers, 2003.
[100] Rolf Molich and Joseph S. Dumas. Comparative usability evaluation
(cue-4). Behav. Inf. Technol., 27:263–281, May 2008.
[101] J Nielsen. Usability Inspection Methods, chapter Heuristic Evaluation
(ch2). John Wiley and Sons, Inc, New York, 1994.
[102] Jakob Nielsen. Finding usability problems through heuristic evaluation.
In Proceedings of the SIGCHI conference on Human factors in computing
systems, CHI ’92, pages 373–380, New York, NY, USA, 1992. ACM.
[103] Jakob Nielsen. Usability Engineering. Morgan Kaufmann Publishers
Inc., San Francisco, CA, USA, 1993.
[104] Jakob Nielsen and Rolf Molich. Heuristic evaluation of user interfaces. In
Proceedings of the SIGCHI conference on Human factors in computing
systems: Empowering people, CHI ’90, pages 249–256, New York, NY,
USA, 1990. ACM.
[105] Y. Okumura, E. Ohmori, T. Kawano, , and K. Fukuda. Field strength
and its variability in VHF and UHF land mobile radio service. Rev.
Electr. Commun. Lab., 16:825–73, 1968.
[106] Murray Pearson and Jamie Curtis. Personal communication, 2011.
[107] Pablo Pedregal. Introduction to Optimization. Springer-Verlag, 2004.
[108] Harish Ramamurthy and Abhay Kar. B-HIVE: A CELL PLANNING
TOOL FOR URBAN WIRELESS NETWORKS. Technical report, De-
partment of Electrical Engineering, IIT Bombay, Powai, Mumbai-76.

[109] Theodore Rappaport. Wireless Communications: Principles and Prac-
tice. Prentice Hall PTR, Upper Saddle River, NJ, USA, 2001.
[110] Trygve Reenskaug. MVC (Model View Controller) [Online]. Retrieved
from http://heim.ifi.uio.no/ trygver/themes/mvc/mvc-index.html.
[111] P. L. Rice, A. G. Longley, K. A. Norton, and A. P. Barsis. Transmission
Loss Predictions For Tropospheric Communication Circuits. Technical
report, Institute for Telecommunication Sciences and Aeronomy, Envi-
ronmental Science Services Administration, Boulder, Colorado, 1967.
[112] Simon R. Saunders. Propagation of Radiowaves, 2nd Edition, chapter
Outdoor mobile propagation (ch11), pages 185 – 222. The Institution of
Electrical Engineers, 2003.
[113] Sayandeep Sen and Bhaskaran Raman. Long distance wireless mesh
network planning: problem formulation and solution. In Proceedings of
the 16th international conference on World Wide Web, WWW ’07, pages
893–902, New York, NY, USA, 2007. ACM.
[114] Ben Shneiderman and Catherine Plaisant. Designing the User Interface.
Pearson Education, Inc., 2005.
[115] Kristian T. Simsarian. Take it to the next stage: the roles of role playing
in the design process. In CHI ’03 extended abstracts on Human factors
in computing systems, CHI ’03, pages 1012–1013, New York, NY, USA,
2003. ACM.
[116] Ashish R. Sontakke and Rajarshi Roy. Optimization Issues in Radio
over Fiber Network Planning for vast Rural Areas: Initial Results. In
Australian Telecommunication Networks and Applications Conference,
2007.
[117] K Stevens. Open Learning to Sustain Rural Schools: The replication of a
Three-Stage Model. New Zealand Annual Review of Education, 12:127–
140, 2003.

[118] Csaba Szabo, Karoly Farkas, and Zoltan Horvath. Motivations, Design
and Business Models of Wireless Community Networks. Mobile Network
Applications, 13:147–159, 2008.
[119] Jung-Fa Tsai and Ming-Hua Lin. Global optimization of signomial
mixed-integer nonlinear programming problems with free variables. J.
of Global Optimization, 42:39–49, September 2008.
[120] Aleksandar Tsenov. Simulated Annealing and Genetic Algorithm in
Telecommunications Network Planning. International Journal of Com-
putational Intelligence, 2(4), 2005.
[121] K. Tutschku, N. Gerlich, and P. Tran-gia. An Integrated Approach To
Cellular Network Planning. In In Proceedings of the 7th International
Network Planning Symposium, pages 185–190, 1996.
[122] Matthias Veit and Stephan Herrmann. Model-view-controller and object
teams: a perfect match of paradigms. In Proceedings of the 2nd inter-
national conference on Aspect-oriented software development, AOSD 03,
pages 140–149, New York, NY, USA, 2003. ACM.
[123] Mark A. Weissberger. An Initial Critical Summary of Models for Pre-
dicting the Attenuation of Radio Waves by Trees. Technical report,
Department of Defense, July 1982.
[124] Di Yuan. Computing Optimal or Near-Optimal Trees for Minimum-
Energy Broadcasting in Wireless Networks. Technical report, Linköping
University, SE-601 74, Norrköping, Sweden, 2005.
[125] Jing Zhu, Sumit Roy, and Jae H. Kim. Performance modelling of tcp
enhancements in terrestrial-satellite hybrid networks. IEEE/ACM Trans.
Netw., 14:753–766, August 2006.
Related Documents