Hindawi Publishing Corporation Journal of Wind Energy Volume 2013, Article ID 735693, 7 pages http://dx.doi.org/10.1155/2013/735693 Research Article Power Generation Expansion Planning Including Large Scale Wind Integration: A Case Study of Oman Arif S. Malik 1 and Cornelius Kuba 2 1 College of Engineering, Sultan Qaboos University, 123 Al-Khod, Oman 2 Mechanical Engieering, Technical University Hamburg, Harburg, Germany Correspondence should be addressed to Arif S. Malik; [email protected] Received 25 April 2013; Accepted 28 June 2013 Academic Editor: Janaka Ekanayake Copyright © 2013 A. S. Malik and C. Kuba. is is an open access article distributed under the Creative Commons Attribution License, which permits unrestricted use, distribution, and reproduction in any medium, provided the original work is properly cited. Many options can be effectively used to meet the future power needs of a country in ways which would be more economically viable, environmentally sound, and socially just. A least-cost generation expansion planning study is conducted to find the economic feasibility of large scale integration of wind farms in the main interconnected transmission system of Oman. e generation expansion planning soſtware used is WASP which is restricted in its ability to model intermittent nature of wind. erefore, a wind turbine is modeled as a thermal plant with high forced outage rate related to its capacity factor. e result of the study has shown that wind turbines are economically viable option in the overall least-cost generation expansion plan for the Main Interconnected System of Oman. 1. Introduction In the planning of a power system, it is essential to estimate the operating cost and reliability of the system. To make these estimations, it is important to model the system load and gen- eration units in an appropriate way. Power system planning is made up of the electrical load forecast, generation planning, and electrical network planning [1, 2]. e electrical load forecast forms the basis of power system planning and pro- vides information on expected consumption increase, load curve profiles, and load distribution. e result of generation planning and electrical network can also conversely exert an influence on electrical load curve or distribution via marginal cost effort. In the planning process, major decisions in expansion planning of the generation system must consider alternative generating unit sizes, types of capacity, timing of addition, and locations. e main sources of uncertainty in strategic planning are forecasts of electricity demand, fuel prices and availability, availability and performance of new technology, governmental policies toward privatization and regulations, and public attitudes [3]. is paper reports a study that was aimed to find a least- cost generation expansion plan for the Main Interconnected System (MIS) of Oman considering the large scale integration of wind energy. e importance of the study is to show how wind turbines can be modeled in generation expansion planning soſtware models that are based on load duration curve technique and that wind energy system can form part of the least-cost plan in Oman while keeping the same planning standard of minimum reserve margin and cost of unserved energy. e study is limited by its scope as no detailed investiga- tion of wind energy sites and their true potential is estimated. However, ample literature on wind energy potential and its application in Oman is available which suggests that there is a significant potential available in the southern part and the coastal area of the country [4–10]. e study also does not consider the cost related to wind power evacuation from the south to the north of the country where the major load exists. e load and generation data used is taken from Oman Power and Water Procurement (OPWP) company’s report [11] and private communications to OPWP personnel. e candidate plants used for expanding the generation system are taken those which are presently in the Omani power system with the exception of wind plants. e generation expansion planning is done using Wien Automatic System

Welcome message from author
This document is posted to help you gain knowledge. Please leave a comment to let me know what you think about it! Share it to your friends and learn new things together.
Transcript

Hindawi Publishing CorporationJournal of Wind EnergyVolume 2013, Article ID 735693, 7 pageshttp://dx.doi.org/10.1155/2013/735693
Research ArticlePower Generation Expansion Planning Including Large ScaleWind Integration: A Case Study of Oman
Arif S. Malik1 and Cornelius Kuba2
1 College of Engineering, Sultan Qaboos University, 123 Al-Khod, Oman2Mechanical Engieering, Technical University Hamburg, Harburg, Germany
Correspondence should be addressed to Arif S. Malik; [email protected]
Received 25 April 2013; Accepted 28 June 2013
Academic Editor: Janaka Ekanayake
Copyright © 2013 A. S. Malik and C. Kuba. This is an open access article distributed under the Creative Commons AttributionLicense, which permits unrestricted use, distribution, and reproduction in any medium, provided the original work is properlycited.
Many options can be effectively used tomeet the future power needs of a country in ways whichwould bemore economically viable,environmentally sound, and socially just. A least-cost generation expansion planning study is conducted to find the economicfeasibility of large scale integration of wind farms in the main interconnected transmission system of Oman. The generationexpansion planning software used is WASP which is restricted in its ability to model intermittent nature of wind.Therefore, a windturbine is modeled as a thermal plant with high forced outage rate related to its capacity factor. The result of the study has shownthat wind turbines are economically viable option in the overall least-cost generation expansion plan for the Main InterconnectedSystem of Oman.
1. Introduction
In the planning of a power system, it is essential to estimatethe operating cost and reliability of the system. Tomake theseestimations, it is important tomodel the system load and gen-eration units in an appropriate way. Power system planning ismade up of the electrical load forecast, generation planning,and electrical network planning [1, 2]. The electrical loadforecast forms the basis of power system planning and pro-vides information on expected consumption increase, loadcurve profiles, and load distribution.The result of generationplanning and electrical network can also conversely exert aninfluence on electrical load curve or distribution viamarginalcost effort. In the planning process, major decisions inexpansion planning of the generation system must consideralternative generating unit sizes, types of capacity, timing ofaddition, and locations. The main sources of uncertainty instrategic planning are forecasts of electricity demand, fuelprices and availability, availability and performance of newtechnology, governmental policies toward privatization andregulations, and public attitudes [3].
This paper reports a study that was aimed to find a least-cost generation expansion plan for the Main Interconnected
System (MIS) ofOman considering the large scale integrationof wind energy. The importance of the study is to showhow wind turbines can be modeled in generation expansionplanning software models that are based on load durationcurve technique and thatwind energy system can formpart ofthe least-cost plan in Oman while keeping the same planningstandard of minimum reserve margin and cost of unservedenergy.
The study is limited by its scope as no detailed investiga-tion of wind energy sites and their true potential is estimated.However, ample literature on wind energy potential and itsapplication in Oman is available which suggests that thereis a significant potential available in the southern part andthe coastal area of the country [4–10]. The study also doesnot consider the cost related to wind power evacuation fromthe south to the north of the country where the major loadexists.The load and generation data used is taken fromOmanPower and Water Procurement (OPWP) company’s report[11] and private communications to OPWP personnel. Thecandidate plants used for expanding the generation systemare taken those which are presently in the Omani powersystem with the exception of wind plants. The generationexpansion planning is done using Wien Automatic System

2 Journal of Wind Energy
Ann
ual c
osts
($)
System reliability
Total cost
Utility cost
Customers cost
Figure 1: Relationship between consumers, utility, and total annualcost with respect to reliability.
Planning (WASP) software [12]. The software has its ownmodeling limitations; for example, the load model is basedon the load duration curve (LDC). LDC model providesinformation about the percentage of time the load equalsor exceeds a certain MW value and gives the same energyinformation as the actual chronological load curve; however,the chronology of the events is lost which poses modelinglimitations to nondispatchable technologies such as wind.
This paper is arranged in six sections. Section 1 is anintroduction. Section 2 is a theoretical review of powerplanning concepts. Section 3 is a review of wind energypotential in Oman. Section 4 discusses how wind plantscan be modeled in WASP. Section 5 provides generationand load data of MIS system. Section 6 presents the resultsof the generation expansion planning. And the last sectionconcludes the paper.
2. Electric Power System Planning
2.1. Objective of Power Planning Study. The objective ofelectric planning study is to meet the load forecast with highreliability at a minimum cost. There are three keywords inthe previous statement, that is, load forecast, reliability, andcost. A brief discussion on these three keywords is followed.The cost is minimized depending on the financial resources,technical, environmental, and political considerations. Fourquestions must be answered when the study of capacityplanning is done [1].
(1) What type of capacities will be added to the system?(2) How much capacities will be added?(3) When these capacities will be added?(4) Where these capacities will be located?
The first three questions can be answered by using anygeneration expansion planning software. However, for thequestionwhere to locate the new facilities a detailed feasibilitystudy has to be carried out considering the load center,availability of fuel, water, manpower, transmission corridors,and so forth.Theobjective function of the least-cost-planningsoftware is normally the following.
Minimize for all 𝑗,
𝐵𝑗 =𝑛
∑𝑖=1
(CC𝑖 − SV𝑖 + FC𝑖 +O𝑖&M𝑖 + UE𝑖) , (1)
where
CC is the capital cost;SV is the salvage value;FC is the fuel cost;O&M is the operating and maintenance cost;UE is the energy not served cost;𝑛 is number of years in study period;And over bar (—) on the above costs representspresent worth of all the costs.
The capital costs of only candidate generating plants con-sidered for expansion are added in the objective function.Thecapital costs of existing plants and those in the constructionphase (committed plants) in the system are considered sunkand are thus not considered in the objective function.
2.2. Generation Planning Study Period. The study periodnormally spans from twenty to twenty-five years. The studyperiod consists of three subperiods: preplanning period,planning period, and postplanning period [13]. Preplanningperiod is the first 3-4 years in which the planning was doneearlier. This is included in the study period to see the energyproduction cost and reliability of the system. The planningperiod is between 4 and 10 years in which the decision hasto be taken now about the plants that have to be added inthe future to meet the forecast. The post-planning period isadded in the study period to avoid the end effects by makingthe calculations continue for another 10 years or more so thata proper tradeoff between construction costs and operatingcosts is found. Therefore, the long-term forecasts of 20–25years of electricity consumption and demand are used inthe planning of investment in generating capacity and thedevelopment of fuel supplies.
2.3. Reliability. Reliability is the ability of a system orcomponent to perform its required functions under statedconditions for a specified period of time [14, 15]. In (1) thereliability is also embedded in terms of cost of energy notserved. This cost is basically customers’ electricity outagescost and is the penalty for unreliability. If more capacityis added in the system, the capital cost would be high butbecause of more capacity in the system the total unservedenergy cost would be low as the system would be morereliable. On the other hand, if the capacity added is lessthan the actual required, then there would be more customeroutages and hence higher unserved energy cost. The basicconcept of reliability-cost/reliability-worth evaluation is rel-atively simple and can be presented by the cost/reliabilitycurves, as shown in Figure 1 [14, 15]. These curves show thatthe investment cost generally increases with higher reliability,that is, capital investment is augmented in order to improve

Journal of Wind Energy 3
01234567
Win
d sp
eed
(m/s
)
Bura
imi
Duq
m
Fahu
d
Kha
sab
Mar
mul
Mas
irah
Qai
roon
Hai
riti
Saiq
Sala
lah
Seeb
Soha
r
Sur
Thum
rait
Figure 2: Annual averagewind speeds of some sites inOman at 10mheight.
the reliability. On the other hand, the customers’ outages costdecreases as the reliability increases. Furthermore, the totalcost of the two curves is the sum of the utility cost and thecustomers cost, and the minimum exhibits the optimal cost.
3. Wind Energy Potential in Oman
The wind speed in Oman is relatively high compared withother gulf countries. Oman’s southern region appears to havethe highest wind potential. Figure 2 shows the average windspeed in some of the cities in Oman. The highest windpotential is in Quiroon Hariti and Thumrait and both are inthe South of Oman. A brief literature review on wind energypotential in Oman is presented in the following paragraphs.
In [6], it is concluded that with the existing gas priceof 1.5 US$/MMBtu wind energy is not economical for gridapplication.Thewind energy atQuiroonHariti, (see Figure 2)the highest wind potential in Oman, becomes marginallyeconomical at a gas price of 6 $/MMBtu. At the opportunitycost of natural gas price of approximately 3 $/MMBtu andadding a depletion premium of 3% per annum, the cost ofwind energy become comparable to open cycle gas-turbine(GT) power plants. The combined cycle (CCGT) powerplants remain cheaper, however. The comparison is made byassuming the economic life of assets (GT, CCGT, and 20MWwind farm) to be 25 years and the real discount rate at 7.55%.
In [7], the electricity generation from wind energy forDuqm, a coastal region, was investigated based on themonthly mean wind speed observations. A technoeconomicevaluation was also presented using V90-1.8 turbine. It wasconcluded that the power generation cost is higher than thecurrent existing system, due to the highly subsidized price ofnatural gas. In [8], a single 50 kWwind turbine of TekVal wasused to demonstrate the economical utilization of the windenergy at the site. It was concluded that the operating costof the diesel generation was 1.7–1.8 times the specific cost ofwind turbine. It was also concluded that the simple paybackperiod of the turbine was about five years.
In [9], five-year hourly wind data is analyzed fromtwenty-nine weather stations to identify the potential loca-tion for wind energy applications in Oman. Different criteria
Table 1: Technical data of wind turbine.
Windmach.
Ratedpower(kW)
Cut-in(m/s)
Cut-out(m/s)
Ratedspeed(m/s)
Hubheight(m)
RotorDia(m)
Expectedlife(yrs)
V80 2000 4 25 16 67 80 20
including theoretical wind power output, vertical profile,turbulence, and peak demand fitness were considered toidentify the potential locations. Air density and roughnesslength, which play an important role in the calculation ofthe wind power density potential, are derived for each stationsite. Due to the seasonal power demand, a seasonal approachis also introduced to identify the wind potential on differentseasons. Finally, a scoring approach was introduced in orderto classify the potential sites based on the different factorsmentioned previously. It is concluded that Qairoon Hairiti,Thumrait, Masirah, and Ras Alhad have high wind powerpotential and that Quiroon Hariti is the most suitable site forwind power generation.
In [10], the article assessed wind power cost per kWhof energy produced using four types of wind machines at27 locations within Oman. These sites cover all regions inOman. Hourly values of wind speed recorded between 2000and 2009, in most cases, were used for all 27 locations. Windduration curves were developed and utilized to calculate thecost per kWh of energy generated from four chosen windmachines. It was found that the cost of energy is low in thesouth andmiddle regions of Oman compared with that in thenorth region.According to the study, themost promising sitesfor the economic harnessing of wind power are Thumrait,Qairoon Hairiti, Masirah, and Sur, with an energy cost ofless than 0.117US$/kWh when 2000 kW, 1500 kW, 850 kW, or250 kW wind turbines are used.
4. Wind Plant Modeling in WASP
As mentioned in the introduction that the load model inWASP software is based on the load duration curve (LDC)technique. LDC model provides information about the per-centage of time the load equals or exceeds a certain MWvalue and gives the same energy information as the actualchronological load curve. However, the chronology of theevents is lost in LDCmodels which posemodeling limitationsfor nondispatchable technologies such as wind which areinherently chronological devices that operate according tothe availability of wind. There are several ways to modelwind turbine/plant in WASP and all have some kind ofapproximation. Here are some of the ways to handle it.
(1) Wind turbine/plant can be modeled as a thermalplant with zero fuel cost and increased forced outagerate to reflect the variability of wind and reducedcapacity credit of wind turbine. With zero fuel cost,the economic loading order of wind turbine is first inthe merit and can be considered as a base load plant.
(2) Wind turbine is modeled as negative load. Theexpected energy produced by a wind turbine can first

4 Journal of Wind Energy
Table 2: Data of wind turbine for WASP.
Type Max. capacity(MW)
Forcedoutage rate
Sch. maintenancedays
Fixed O&M cost$/kW-month
Capitalcost $/kW Life (yrs) Construction
time (yr)Wind 20 75.4% 10 1.46 1500 20 1
Table 3: Technical and cost data of thermal plants in the year 2012.
No. Plantname
No. ofsets
Min. loadMW
CapacityMW
Heat ratesFast spinRes %
FOR%
Sched.Maintenance
days
O&M (FIX)$/kW-month
O&M(VAR)$/MWh
kcal/kWhBase Incr.load load
1 GBG5 8 6 16 4728 2434 9 10 27 3.78 0.182 GBG6 2 11 26 4176 2116 9 10 31 5.21 0.183 GBG9 2 91 91 2705 2705 0 5 31 7.17 0.184 GBS1 1 37 37 1811 1811 0 50 34 5.68 0.375 GBS2 2 30 30 1058 1058 0 20 25 8.91 0.376 RUSL 8 45 86 3713 2224 9 5 27 3.57 2.267 WJZ1 8 12 27 4204 2205 9 5 31 6.50 0.188 WJZ2 5 6 17 4701 2430 9 5 30 6.50 0.189 MNH1 3 12 29 4301 2253 9 2 20 6.52 3.2410 MNH2 2 42 94 3455 2215 9 2 30 6.52 2.1311 ALK 3 44 99 3515 2326 9 2 37 6.57 3.3212 BRK1 1 108 435 3257 1756 9 3 20 9.08 1.4413 BRK2 1 126 710 2114 1742 9 4 20 7.07 1.1614 BRK3 2 40 247 1797 1455 9 3 20 20.05 1.0415 SHR1 1 121 590 3467 1821 9 3 20 5.84 1.2816 SHR2 2 40 247 1797 1455 9 3 20 20.05 1.0417 SURa 0 400 799 1771 1316 9 3 20 13.01 0.6618 SURb 0 201 401 1711 1316 9 3.5 20 13.01 0.66
be subtracted from the original chronological loadcurve and then the load duration curve is made. Theoptimization is then done without considering windturbines and the cost of wind turbine can then beadded later in the optimal case.
(3) Wind turbine can be derated according to the capacitycredit and modeled as a thermal plant with zero fuelcost and a normal forced outage rate of say about 4%can be assigned.
(4) Wind turbine is modeled as a hydroplant with a baseload capacity and inflow energy as a constraint. Theinflow energy reflects the energy the wind turbine canproduce in a given load duration curve time span.
In the present study, a wind turbine is modeled as athermal plant with high forced outage rate to investigate theeconomic feasibility of wind plants.This technique is closer toreality as the higher forced outage rate force theWASPmodelto select more plants to meet the reliability requirement. Inreal systems also because of poor capacity credit attributedto wind energy a lot of backup supply has to be provided.The candidate plant of 2MW taken from [10] is used todemonstrate the economic feasibility at one of the best sitesof Thumrait. Table 1 gives the technical data of wind turbine.
The annual energy produced by this wind turbine atthe site is 4318MWh from which its forced outage rate iscalculated from its capacity factor using the following twoformulas:
Capacity Factor =Annual Energy Produced (MWh)Rated Capacity (MW) × 8760 hrs
.
Forced Outage Rate = 1 − Capacity Factor.(2)
It is assumed that 10 wind turbines of 2MW size forma wind park of 20MW. This 20MW is used as a candidateplant instead of 2MW wind turbine. The other needed datafor WASP is shown in Table 2.
5. MIS Generation and Load Data
5.1. Generation Data. The generation expansion planning iscarried out for the MIS from 2012 to 2034. The main Inter-connected System consists of ten existing plants Ghubrah,Rusail, Wadi Al-Jizzi, Manah, Barka-I, Barka-II, Barka-III,Sohar-I, Sohar-II, and Alkamil. All the plants are eithercombustion turbines or combined cycle plants. The fixed orexisting system consists of about 4770MW capacity [11]. The
Journal of Wind Energy 5
Table 4: Technical and cost data of candidate plants.
No. Plantname
Min. loadMW
CapacityMW
Heat ratesFast spinRes %
FOR%
Sched.maintenance
days
O&M (FIX)$/kW-month
O&M(VAR)$/MWh
Capitalcost
$/kWh
Plantlife(yrs)
Constructiontime
kcal/kWhBase Incrload load
1 GBG9 91 91 2705 2705 0 5 31 7.17 0.18 795 25 32 BRK1 108 435 3257 1756 9 3 20 9.08 1.44 977 25 33 FCOL 83 250 2800 2300 10 8 35 2.92 5.00 2000 25 5
Table 5: Results of base case: costs, reliability, type, and number of units selected.
Year Present worth cost of the year in thousands dollars LOLP % GBG9 BRK1 FCOLConst. cost Salvage value Operating
costEnergy notserved cost Total Obj. Fn
(Cumulative)2034 81646 73253 631261 0 639654 21847338 0.028 74 15 02033 104834 84241 651639 0 672232 21207684 0.024 69 15 02032 109827 78893 670504 0 701438 20535452 0.031 63 15 02031 117515 75307 689700 0 731908 19834014 0.028 63 14 02030 826712 471547 709039 0 1064204 19102106 0.027 63 13 02029 337793 171065 699590 126 866444 18037902 0.047 42 10 02028 143960 64548 734243 123 813778 17171458 0.046 39 8 02027 104885 41510 752857 235 816467 16357680 0.055 39 7 02026 112227 39068 777024 262 850445 15541213 0.055 35 7 02025 412757 125894 802078 327 1089268 14690768 0.058 31 7 02024 188703 50204 812510 372 951381 13601500 0.057 29 5 02023 708848 163664 830018 796 1375999 12650119 0.085 29 4 02022 252822 50358 823948 867 1027279 11274120 0.086 26 1 02021 157404 26859 846190 1015 977749 10246841 0.092 25 0 02020 252633 36626 867924 1639 1085570 9269092 0.124 21 0 02019 450528 54940 893340 1709 1290638 8183523 0.121 15 0 02018 241033 24418 910721 2313 1129649 6892885 0.144 5 0 02017 0 0 933210 535 933745 5763236 0.047 0 0 02016 0 0 961424 0 961424 4829492 0.006 0 0 02015 0 0 996447 0 996447 3868068 0 0 0 02014 0 0 997687 0 997687 2871621 0.001 0 0 02013 0 0 965412 965 966377 1873934 0.071 0 0 02012 0 0 906425 1132 907557 907557 0.076 0 0 0
committed plants and the retirements are also taken intoaccount. Table 3 provides technical and economic data forthe fixed system and committed plants. All power plantsare powered by natural gas, which comes from domesticproduction with a fuel cost of 1189 ¢/106 kcal equivalent to$3/MMBtu. The last two plants with zero number of setsshow the committed plants. Table 4 provides the technicaland economic data of units taken as candidate plants forexpansion.
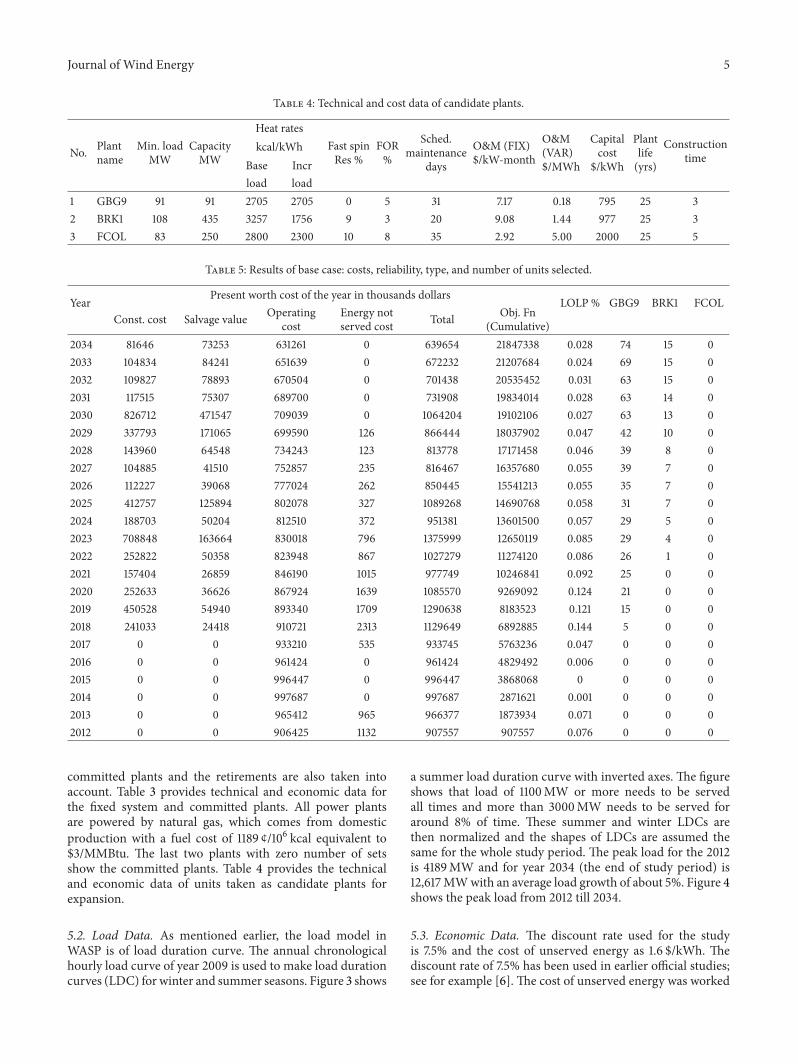
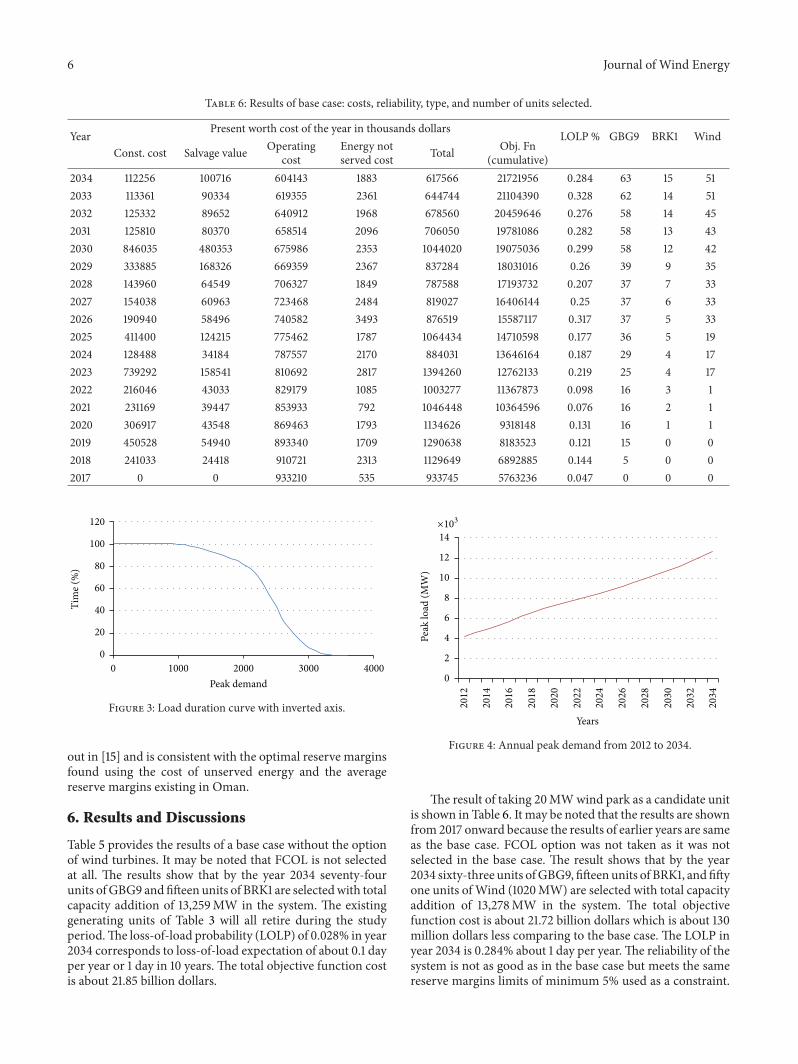
5.2. Load Data. As mentioned earlier, the load model inWASP is of load duration curve. The annual chronologicalhourly load curve of year 2009 is used to make load durationcurves (LDC) for winter and summer seasons. Figure 3 shows
a summer load duration curve with inverted axes. The figureshows that load of 1100MW or more needs to be servedall times and more than 3000MW needs to be served foraround 8% of time. These summer and winter LDCs arethen normalized and the shapes of LDCs are assumed thesame for the whole study period. The peak load for the 2012is 4189MW and for year 2034 (the end of study period) is12,617MWwith an average load growth of about 5%. Figure 4shows the peak load from 2012 till 2034.
5.3. Economic Data. The discount rate used for the studyis 7.5% and the cost of unserved energy as 1.6 $/kWh. Thediscount rate of 7.5% has been used in earlier official studies;see for example [6]. The cost of unserved energy was worked
6 Journal of Wind Energy
Table 6: Results of base case: costs, reliability, type, and number of units selected.
Year Present worth cost of the year in thousands dollars LOLP % GBG9 BRK1 WindConst. cost Salvage value Operating
costEnergy notserved cost Total Obj. Fn
(cumulative)2034 112256 100716 604143 1883 617566 21721956 0.284 63 15 512033 113361 90334 619355 2361 644744 21104390 0.328 62 14 512032 125332 89652 640912 1968 678560 20459646 0.276 58 14 452031 125810 80370 658514 2096 706050 19781086 0.282 58 13 432030 846035 480353 675986 2353 1044020 19075036 0.299 58 12 422029 333885 168326 669359 2367 837284 18031016 0.26 39 9 352028 143960 64549 706327 1849 787588 17193732 0.207 37 7 332027 154038 60963 723468 2484 819027 16406144 0.25 37 6 332026 190940 58496 740582 3493 876519 15587117 0.317 37 5 332025 411400 124215 775462 1787 1064434 14710598 0.177 36 5 192024 128488 34184 787557 2170 884031 13646164 0.187 29 4 172023 739292 158541 810692 2817 1394260 12762133 0.219 25 4 172022 216046 43033 829179 1085 1003277 11367873 0.098 16 3 12021 231169 39447 853933 792 1046448 10364596 0.076 16 2 12020 306917 43548 869463 1793 1134626 9318148 0.131 16 1 12019 450528 54940 893340 1709 1290638 8183523 0.121 15 0 02018 241033 24418 910721 2313 1129649 6892885 0.144 5 0 02017 0 0 933210 535 933745 5763236 0.047 0 0 0
0
20
40
60
80
100
120
0 1000 2000 3000 4000
Tim
e (%
)
Peak demand
Figure 3: Load duration curve with inverted axis.
out in [15] and is consistent with the optimal reserve marginsfound using the cost of unserved energy and the averagereserve margins existing in Oman.
6. Results and Discussions
Table 5 provides the results of a base case without the optionof wind turbines. It may be noted that FCOL is not selectedat all. The results show that by the year 2034 seventy-fourunits ofGBG9 and fifteen units of BRK1 are selectedwith totalcapacity addition of 13,259MW in the system. The existinggenerating units of Table 3 will all retire during the studyperiod.The loss-of-load probability (LOLP) of 0.028% in year2034 corresponds to loss-of-load expectation of about 0.1 dayper year or 1 day in 10 years. The total objective function costis about 21.85 billion dollars.
0
2
4
6
8
10
12
14×10
3
Peak
load
(MW
)
Years
2012
2014
2016
2018
2020
2022
2024
2026
2028
2030
2032
2034
Figure 4: Annual peak demand from 2012 to 2034.
The result of taking 20MWwind park as a candidate unitis shown in Table 6. It may be noted that the results are shownfrom 2017 onward because the results of earlier years are sameas the base case. FCOL option was not taken as it was notselected in the base case. The result shows that by the year2034 sixty-three units ofGBG9, fifteen units of BRK1, andfiftyone units of Wind (1020MW) are selected with total capacityaddition of 13,278MW in the system. The total objectivefunction cost is about 21.72 billion dollars which is about 130million dollars less comparing to the base case. The LOLP inyear 2034 is 0.284% about 1 day per year.The reliability of thesystem is not as good as in the base case but meets the samereserve margins limits of minimum 5% used as a constraint.

Journal of Wind Energy 7
This also shows that to meet the same reliability criteria ofLOLP more capacity additions are required and the reservemargin criteria are not as good measure when intermittenttechnology are considered in the system. It may also be notedthat environmental costs are not considered in the analysis.
7. Conclusions
This paper has presented the results of a least-cost generationexpansion plan using wind turbines as a candidate plant. Aset of 10 wind turbines of 2MW capacity is considered asa single unit of 20MW capacity and modeled as a thermalunit in WASP with high forced outage rate according tothe expected capacity factor at the selected site. The resultshows that with minimum 5% reserve margin reliabilitycriteria and the cost of unserved energy as $1.6/kWh thewind turbine indeed forms part of the generating systemexpansion economically. However, the result of reliabilitycriteria of LOLP has shown significant difference in the twocases. Although LOLP criteria are superior to reserve margincriteria but in the presence of cost of unserved energy asbalancing factor in the objective function LOLP should beautomatically taken care of. On the other hand, calculatingcost of unserved energy is not an easy task and needs a lotof assumptions and a reasonable sample size of survey inresidential, commercial, industrial, and other sectors. As afuture work it would be worthwhile to compare the highforced outage rate model of wind turbine with the negativeload model. It would also be worthwhile to find the limitof maximum wind potential that can be exploited in thesouthern part of the country so that it can be added as aconstraint to limit the number of wind turbine units selectedfor strategic plan.
Conflicts of Interests
The authors do not have any conflict of interests with thecontent of the paper.
References
[1] W. Buehring, C. Huber, and J. Marques de Souza, ExpansionPlanning for Electrical Generating Systems—AGuidebook, Tech-nical Report Series No. 241, IAEA, Vienna, Austria, 1984.
[2] J. Wang and J. McDonald, Modern Power System Planning,McGraw-Hill, London, UK, 1994.
[3] J. Stoll, Least-Cost Electric Utility Planning, John Wiley & Sons,New York, NY, USA, 1989.
[4] A. S. S. Dorvlo and D. B. Ampratwum, “Summary climatic datafor solar technology development in Oman,” Renewable Energy,vol. 14, no. 1–4, pp. 255–262, 1998.
[5] M. Y. Sulaiman, A. M. Akaak, M. A. Wahab, A. Zakaria, Z.A. Sulaiman, and J. Suradi, “Wind characteristics of Oman,”Energy, vol. 27, no. 1, pp. 35–46, 2002.
[6] Authority for Electricity Regulation, Oman, “Study on renew-able energy eesources, Oman,” Final Report, 2008, http://www.aer-oman.org/images/renewables%20study%20may%202008.pdf.
[7] M. H. Albadi, E. F. El-Saadany, and H. A. Albadi, “Wind topower a new city in Oman,” Energy, vol. 34, no. 10, pp. 1579–1586, 2009.
[8] A. Malik and A. H. Al-Badi, “Economics of wind turbine as anenergy fuel saver—a case study for remote application in oman,”Energy, vol. 34, no. 10, pp. 1573–1578, 2009.
[9] S. AL-Yahyai, Y. Charabi, A. Gastli, and S. Al-Alawi, “Assess-ment of wind energy potential locations in Oman using datafrom existing weather stations,” Renewable and SustainableEnergy Reviews, vol. 14, no. 5, pp. 1428–1436, 2010.
[10] A. H. Al-Badi, “Wind power potential in Oman,” InternationalJournal of Sustainable Energy, vol. 30, no. 2, pp. 110–118, 2011.
[11] “OPWP’s 7-year statement (2102-2018),” Oman Water andProcurementCompany, 2012, http://www.omanpwp.com/PDF/Final%207YS%202012-2018.pdf.
[12] Wein Automatic System Planning Package, WASP-IV, IAEA,2003.
[13] M. Malone, “Generation planning in the 1980’s,” in Proceedingsof the 11th National Convention of the Institute of ElectricalEngineers of the Philippines, Manila, Philippines, November1986.
[14] R. Billinton and R. Allan,Reliability Evaluation of Power System,Pitman, 1996.
[15] F. Al-Farsi, M. Al-Shihi, and Y. Al-Shokaili, “Optimal genera-tion reserve margin for Muscat interconnected system,” FinalYear Project Report, SQU, Electrical Engineering Department,Muscat, Oman, 2000.

TribologyAdvances in
Hindawi Publishing Corporationhttp://www.hindawi.com Volume 2014
International Journal of
AerospaceEngineeringHindawi Publishing Corporationhttp://www.hindawi.com Volume 2014
FuelsJournal of
Hindawi Publishing Corporationhttp://www.hindawi.com Volume 2014
Journal ofPetroleum Engineering
Hindawi Publishing Corporationhttp://www.hindawi.com Volume 2014
Industrial EngineeringJournal of
Hindawi Publishing Corporationhttp://www.hindawi.com Volume 2014
Power ElectronicsHindawi Publishing Corporationhttp://www.hindawi.com Volume 2014
Advances in
CombustionJournal of
Hindawi Publishing Corporationhttp://www.hindawi.com Volume 2014
Journal of
Hindawi Publishing Corporationhttp://www.hindawi.com Volume 2014
Renewable Energy
Submit your manuscripts athttp://www.hindawi.com
Hindawi Publishing Corporationhttp://www.hindawi.com Volume 2014
StructuresJournal of
International Journal of
RotatingMachinery
Hindawi Publishing Corporationhttp://www.hindawi.com Volume 2014
EnergyJournal of
Hindawi Publishing Corporationhttp://www.hindawi.com Volume 2014
Hindawi Publishing Corporation http://www.hindawi.com
Journal ofEngineeringVolume 2014
Hindawi Publishing Corporation http://www.hindawi.com Volume 2014
International Journal ofPhotoenergy
Hindawi Publishing Corporationhttp://www.hindawi.com Volume 2014
Nuclear InstallationsScience and Technology of
Hindawi Publishing Corporationhttp://www.hindawi.com Volume 2014
Solar EnergyJournal of
Hindawi Publishing Corporationhttp://www.hindawi.com Volume 2014
Wind EnergyJournal of
Hindawi Publishing Corporationhttp://www.hindawi.com Volume 2014
Nuclear EnergyInternational Journal of
Hindawi Publishing Corporationhttp://www.hindawi.com Volume 2014
High Energy PhysicsAdvances in
The Scientific World JournalHindawi Publishing Corporation http://www.hindawi.com Volume 2014
Related Documents