RESEARCH ARTICLE Open Access Estimation of genetic parameters and detection of quantitative trait loci for minerals in Danish Holstein and Danish Jersey milk Bart Buitenhuis 1* , Nina A Poulsen 2 , Lotte B Larsen 2 and Jakob Sehested 3 Abstract Background: Bovine milk provides important minerals, essential for human nutrition and dairy product quality. For changing the mineral composition of the milk to improve dietary needs in human nutrition and technological properties of milk, a thorough understanding of the genetics underlying milk mineral contents is important. Therefore the aim of this study was to 1) estimate the genetic parameters for individual minerals in Danish Holstein (DH) (n = 371) and Danish Jersey (DJ) (n = 321) milk, and 2) detect genomic regions associated with mineral content in the milk using a genome-wide association study (GWAS) approach. Results: For DH, high heritabilities were found for Ca (0.72), Zn (0.49), and P (0.46), while for DJ, high heritabilities were found for Ca (0.63), Zn (0.57), and Mg (0.57). Furthermore, intermediate heritabilities were found for Cu in DH, and for K, Na, P and Se in the DJ. The GWAS revealed a total of 649 significant SNP markers detected for Ca (24), Cu (90), Fe (111), Mn (3), Na (1), P (4), Se (12) and Zn (404) in DH, while for DJ, a total of 787 significant SNP markers were detected for Ca (44), Fe (43), K (498), Na (4), Mg (1), P (94) and Zn (3). Comparing the list of significant markers between DH and DJ revealed that the SNP ARS-BFGL-NGS-4939 was common in both breeds for Zn. This SNP marker is closely linked to the DGAT1 gene. Even though we found significant SNP markers on BTA14 in both DH and DJ for Ca, and Fe these significant SNPs did not overlap. Conclusion: The results show that Ca, Zn, P and Mg show high heritabilities. In combination with the GWAS results this opens up possibilities to select for specific minerals in bovine milk. Keywords: Bovine milk, Minerals, Element, Genetic parameters, Association study Background Bovine milk provides essential substances for growth and development of the newborn. Besides water, milk consists of proteins, fat, lactose, vitamins and minerals, in addition to other components like metabolites and free oligosaccharides. The mineral fraction constitutes a minor fraction of the milk solids (approximately 7.1 to 7.4 g/L), and comprises cations (among others calcium (Ca), magnesium (Mg), sodium (Na) and potassium (K)), and anions (among others phosphorus, and chloride) [1,2]. Minerals contribute to important physiological processes and in human nutrition it has been shown that e.g. Ca and P play a role in bone metabolism, Se and Zn play a role in the immune system while Ca, K and Mg are involved in maintaining blood pressure [3-5]. High mineral content and availability of milk makes dairy products important sources of minerals to the human diet [6,7]. Furthermore, the mineral composition of milk is im- portant for the technological properties of milk, because minerals are involved in the structure and stability of ca- sein micelles (micellar bound) and thereby e.g. the co- agulation properties of the milk. Free divalent cations, especially Ca ions in milk serum, significantly influence the surrounding environment of the negatively charged casein micelles [8] and thereby the coagulation proper- ties of the milk. For changing the mineral composition of milk to im- prove dietary needs in human nutrition or to improve * Correspondence: [email protected] 1 Aarhus University, Center for Quantitative Genetics and Genomics, Department of Molecular Biology and Genetics, Blichers Allé 20, P.O. Box 50 DK-8830 Tjele, Denmark Full list of author information is available at the end of the article © 2015 Buitenhuis et al.; licensee BioMed Central. This is an Open Access article distributed under the terms of the Creative Commons Attribution License (http://creativecommons.org/licenses/by/4.0) which permits unrestricted use, distribution, and reproduction in any medium, provided the original work is properly credited. The Creative Commons Public Domain Dedication waiver (http://creativecommons.org/publicdomain/zero/1.0/) applies to the data made available in this article, unless otherwise stated. Buitenhuis et al. BMC Genetics (2015) 16:52 DOI 10.1186/s12863-015-0209-9

Welcome message from author
This document is posted to help you gain knowledge. Please leave a comment to let me know what you think about it! Share it to your friends and learn new things together.
Transcript

Buitenhuis et al. BMC Genetics (2015) 16:52 DOI 10.1186/s12863-015-0209-9
RESEARCH ARTICLE Open Access
Estimation of genetic parameters and detectionof quantitative trait loci for minerals in DanishHolstein and Danish Jersey milkBart Buitenhuis1*, Nina A Poulsen2, Lotte B Larsen2 and Jakob Sehested3
Abstract
Background: Bovine milk provides important minerals, essential for human nutrition and dairy product quality. Forchanging the mineral composition of the milk to improve dietary needs in human nutrition and technological propertiesof milk, a thorough understanding of the genetics underlying milk mineral contents is important. Therefore the aim ofthis study was to 1) estimate the genetic parameters for individual minerals in Danish Holstein (DH) (n = 371) and DanishJersey (DJ) (n = 321) milk, and 2) detect genomic regions associated with mineral content in the milk using a genome-wideassociation study (GWAS) approach.
Results: For DH, high heritabilities were found for Ca (0.72), Zn (0.49), and P (0.46), while for DJ, high heritabilities werefound for Ca (0.63), Zn (0.57), and Mg (0.57). Furthermore, intermediate heritabilities were found for Cu in DH, and for K,Na, P and Se in the DJ. The GWAS revealed a total of 649 significant SNP markers detected for Ca (24), Cu (90), Fe (111),Mn (3), Na (1), P (4), Se (12) and Zn (404) in DH, while for DJ, a total of 787 significant SNP markers were detected forCa (44), Fe (43), K (498), Na (4), Mg (1), P (94) and Zn (3). Comparing the list of significant markers between DH and DJrevealed that the SNP ARS-BFGL-NGS-4939 was common in both breeds for Zn. This SNP marker is closely linked to theDGAT1 gene. Even though we found significant SNP markers on BTA14 in both DH and DJ for Ca, and Fe these significantSNPs did not overlap.
Conclusion: The results show that Ca, Zn, P and Mg show high heritabilities. In combination with the GWAS results thisopens up possibilities to select for specific minerals in bovine milk.
Keywords: Bovine milk, Minerals, Element, Genetic parameters, Association study
BackgroundBovine milk provides essential substances for growthand development of the newborn. Besides water, milkconsists of proteins, fat, lactose, vitamins and minerals,in addition to other components like metabolites andfree oligosaccharides. The mineral fraction constitutes aminor fraction of the milk solids (approximately 7.1 to7.4 g/L), and comprises cations (among others calcium(Ca), magnesium (Mg), sodium (Na) and potassium (K)),and anions (among others phosphorus, and chloride)[1,2]. Minerals contribute to important physiologicalprocesses and in human nutrition it has been shown that
* Correspondence: [email protected] University, Center for Quantitative Genetics and Genomics,Department of Molecular Biology and Genetics, Blichers Allé 20, P.O. Box 50DK-8830 Tjele, DenmarkFull list of author information is available at the end of the article
© 2015 Buitenhuis et al.; licensee BioMed CenCommons Attribution License (http://creativecreproduction in any medium, provided the orDedication waiver (http://creativecommons.orunless otherwise stated.
e.g. Ca and P play a role in bone metabolism, Se and Znplay a role in the immune system while Ca, K and Mgare involved in maintaining blood pressure [3-5]. Highmineral content and availability of milk makes dairyproducts important sources of minerals to the humandiet [6,7].Furthermore, the mineral composition of milk is im-
portant for the technological properties of milk, becauseminerals are involved in the structure and stability of ca-sein micelles (micellar bound) and thereby e.g. the co-agulation properties of the milk. Free divalent cations,especially Ca ions in milk serum, significantly influencethe surrounding environment of the negatively chargedcasein micelles [8] and thereby the coagulation proper-ties of the milk.For changing the mineral composition of milk to im-
prove dietary needs in human nutrition or to improve
tral. This is an Open Access article distributed under the terms of the Creativeommons.org/licenses/by/4.0) which permits unrestricted use, distribution, andiginal work is properly credited. The Creative Commons Public Domaing/publicdomain/zero/1.0/) applies to the data made available in this article,

Buitenhuis et al. BMC Genetics (2015) 16:52 Page 2 of 8
technological properties of milk, two different strategiescan be employed: Fortification or increasing the naturalcontent. As fortification by e.g. Ca is problematic for differ-ent reasons, including changing the milk pH and stability[9] a good understanding of the genetics underlying milkmineral content is needed in relation to explore the possi-bilities for increasing mineral content through feeding orbreeding. It has been shown that the mineral content inbovine milk is influenced by non-genetic factors like lacta-tion stage and nutrition [3,10]. However, substantial gen-etic variation for a number of minerals in bovine milk hasbeen reported [11]. In the current study we have collectedtissue and milk samples from Danish Holstein and DanishJersey dairy cows. The tissue samples were examined usingthe bovine 777 k single nucleotide polymorphism (SNP)chip combined with detailed milk mineral profiling by in-ductively coupled plasma mass spectrometry (ICP-MS).The aim of this study was to 1) estimate the genetic param-eters for individual minerals in Danish Holstein (DH) andDanish Jersey (DJ) dairy milk, and 2) detect genomic re-gions associated with mineral content in the milk using agenome-wide association study (GWAS) approach.
MethodsAnimalsAll procedures were performed in accordance with theNational Guidelines for Animal Experimentation and theguidelines of the Danish Animal Experimental EthicsCommittee. Within the Danish-Swedish Milk GenomicsInitiative, morning milk samples were collected from 456DH cows (20 dairy herds, October - December 2009) and436 DJ (22 dairy herds, February – April 2010). From eachherd, between 19 and 24 cows were sampled. All cowswere housed in loose housing systems, fed according tostandard practice, and milked twice a day. The cows sam-pled were all in mid-lactation (d129 to d229 in DH andd130 to d252 in DJ) and within parity 1 to 3. Immediatelyafter milking, milk samples were placed on ice for trans-port to the laboratory. Once at the laboratory, the milksamples were treated as described by Poulsen et al. [12].
Micro and macro elementsTen different elements (Ca, Cu, Fe, K, Mg, Mn, Na, P, Se,and Zn) were extracted from skimmed milk by acid sonic-ation and identified using inductively coupled plasma massspectrometry (ICP-MS) as described by Cava-Montesinoset al. [13].References and standards were analyzed in parallel with
the skimmed milk samples. The reference was whole milkpowder 1549a from The National Institute of Standardsand Technology (NIST, U.S. Department of Commerce).For Ca, Mg, P, S, Na and K the standard CZ9097 Mix 017from the Czeck Metrology Institute (Analytika Ltd., Praque,Czeck Republic) was used. For Cu, Fe, Mn, Se, and Zn, the
standard PlasmaCAL custom standard from SCP Science,Canada, was used.Samples were heated to 40°C in a water bath. Two g of
each milk sample was diluted with 2 mL aqua regia (65%super pure nitric acid and 30% super pure hydrochloric acid)in 13 mL polystyrene tubes (Deltalab, Spain), shaken for afew seconds on Whirl-mixer and left until next day. Sampleswere then ultrasonicated (Branson 3510, Danbury, USA) for10 minutes and diluted to 10 mL by 2% super-purenitric acid, and ultrasonicated for another 10 minutesbefore centrifugation at 3,578 g for 2 minutes. Thesupernatant (5 mL) was transferred to new vials 13 mLpolystyrene tubes (Deltalab, Spain) and analyzed byICP-MS (X-series II) from Thermo Fisher ScientificInc., U.S.
SNP chip and genotypingThe genotyping procedure was carried out as describedearlier [14]. In short, 371 DH and 321 DJ cows were geno-typed with the bovineHD beadchip [15]. The bovineHDchip contains 777,962 markers with a median interval of2.68 kb between SNPs (www.illumina.com/documents/products/datasheets/datasheet_bovineHD.pdf ). GenomicDNA was extracted from ear tissue. The platform usedwas an Illumina® Infinium II Multisample assay device.SNP chips were scanned using iScan and analyzed usingBeadstudio version 3.1 software. The quality parametersused for the selection of SNPs in the GWAS were mini-mum call rates of 80% for individuals and 95% for loci.Marker loci with minor allele frequencies (MAFs) below1% were excluded. The quality of the markers wasassessed using the GenCall data analysis software of Illu-mina. Individuals with average GenCall scores below 0.65were excluded following Teo et al. [16]. The SNP positionswere based on the Bos taurus genome assembly (Btau_4.0)[17]. In total 494,984 SNP markers were used in both DHand DJ.
SNPs assigned to genesFor each gene known in the cattle database, location in thebovine genome was determined as 5Kb before the startposition of the first exon to 5Kb after the end position ofthe last exon. Hence, the defined gene region includes allintrons and parts of the upstream and downstream regionsof the gene. When a SNP was located in this region it wasassigned to the corresponding gene.
Statistical analysisThe statistical analysis was based on the 315 DH and 316DJ animals having both genotypic and phenotypic records.
Calculation of the G-matrixThe calculation of the genomic relationship matrix has beendescribed in detail by Buitenhuis et al. [14]. In short, the
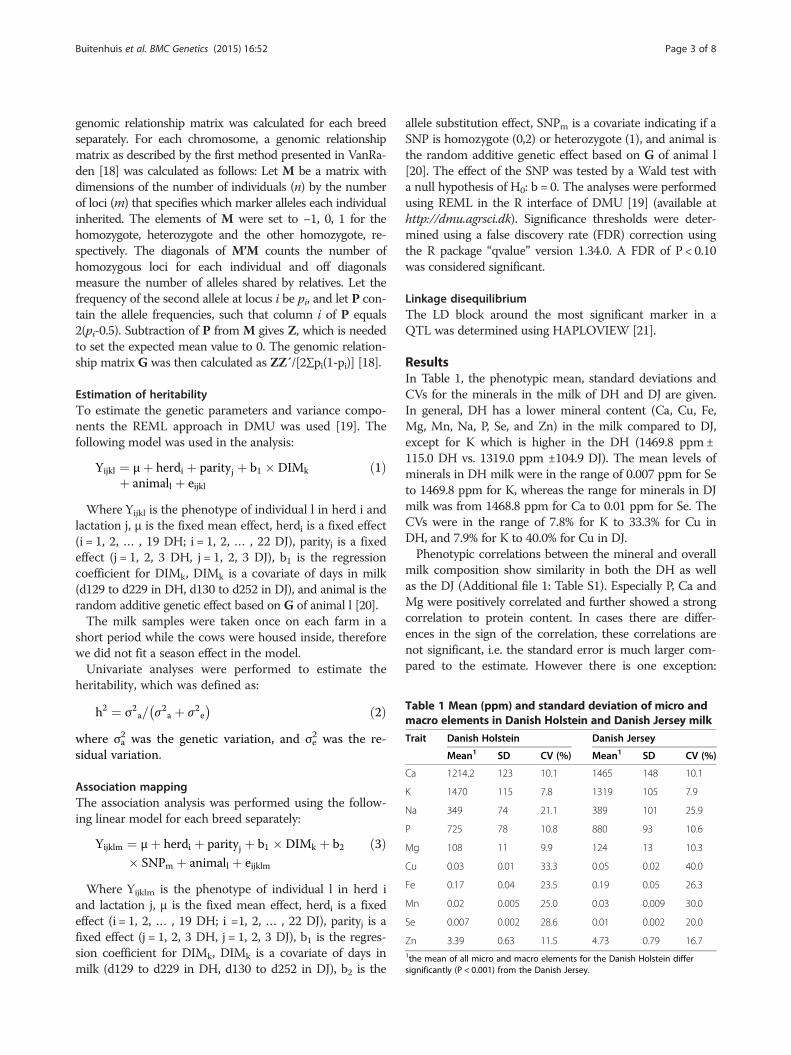
Table 1 Mean (ppm) and standard deviation of micro andmacro elements in Danish Holstein and Danish Jersey milk
Trait Danish Holstein Danish Jersey
Mean1 SD CV (%) Mean1 SD CV (%)
Ca 1214.2 123 10.1 1465 148 10.1
K 1470 115 7.8 1319 105 7.9
Na 349 74 21.1 389 101 25.9
P 725 78 10.8 880 93 10.6
Mg 108 11 9.9 124 13 10.3
Cu 0.03 0.01 33.3 0.05 0.02 40.0
Fe 0.17 0.04 23.5 0.19 0.05 26.3
Mn 0.02 0.005 25.0 0.03 0.009 30.0
Se 0.007 0.002 28.6 0.01 0.002 20.0
Zn 3.39 0.63 11.5 4.73 0.79 16.71the mean of all micro and macro elements for the Danish Holstein differsignificantly (P < 0.001) from the Danish Jersey.
Buitenhuis et al. BMC Genetics (2015) 16:52 Page 3 of 8
genomic relationship matrix was calculated for each breedseparately. For each chromosome, a genomic relationshipmatrix as described by the first method presented in VanRa-den [18] was calculated as follows: Let M be a matrix withdimensions of the number of individuals (n) by the numberof loci (m) that specifies which marker alleles each individualinherited. The elements of M were set to −1, 0, 1 for thehomozygote, heterozygote and the other homozygote, re-spectively. The diagonals of M’M counts the number ofhomozygous loci for each individual and off diagonalsmeasure the number of alleles shared by relatives. Let thefrequency of the second allele at locus i be pi, and let P con-tain the allele frequencies, such that column i of P equals2(pi-0.5). Subtraction of P from M gives Z, which is neededto set the expected mean value to 0. The genomic relation-ship matrix G was then calculated as ZZ´/[2∑pi(1-pi)] [18].
Estimation of heritabilityTo estimate the genetic parameters and variance compo-nents the REML approach in DMU was used [19]. Thefollowing model was used in the analysis:
Yijkl ¼ μþ herdi þ parityj þ b1 � DIMk
þ animall þ eijklð1Þ
Where Yijkl is the phenotype of individual l in herd i andlactation j, μ is the fixed mean effect, herdi is a fixed effect(i = 1, 2, … , 19 DH; i = 1, 2, … , 22 DJ), parityj is a fixedeffect (j = 1, 2, 3 DH, j = 1, 2, 3 DJ), b1 is the regressioncoefficient for DIMk, DIMk is a covariate of days in milk(d129 to d229 in DH, d130 to d252 in DJ), and animal is therandom additive genetic effect based on G of animal l [20].The milk samples were taken once on each farm in a
short period while the cows were housed inside, thereforewe did not fit a season effect in the model.Univariate analyses were performed to estimate the
heritability, which was defined as:
h2 ¼ σ2a= σ2a þ σ2e� � ð2Þ
where σ2a was the genetic variation, and σ2e was the re-sidual variation.
Association mappingThe association analysis was performed using the follow-ing linear model for each breed separately:
Yijklm ¼ μþ herdi þ parityj þ b1 � DIMk þ b2� SNPm þ animall þ eijklm
ð3Þ
Where Yijklm is the phenotype of individual l in herd iand lactation j, μ is the fixed mean effect, herdi is a fixedeffect (i = 1, 2, … , 19 DH; i =1, 2, … , 22 DJ), parityj is afixed effect (j = 1, 2, 3 DH, j = 1, 2, 3 DJ), b1 is the regres-sion coefficient for DIMk, DIMk is a covariate of days inmilk (d129 to d229 in DH, d130 to d252 in DJ), b2 is the
allele substitution effect, SNPm is a covariate indicating if aSNP is homozygote (0,2) or heterozygote (1), and animal isthe random additive genetic effect based on G of animal l[20]. The effect of the SNP was tested by a Wald test witha null hypothesis of H0: b = 0. The analyses were performedusing REML in the R interface of DMU [19] (available athttp://dmu.agrsci.dk). Significance thresholds were deter-mined using a false discovery rate (FDR) correction usingthe R package “qvalue” version 1.34.0. A FDR of P < 0.10was considered significant.
Linkage disequilibriumThe LD block around the most significant marker in aQTL was determined using HAPLOVIEW [21].
ResultsIn Table 1, the phenotypic mean, standard deviations andCVs for the minerals in the milk of DH and DJ are given.In general, DH has a lower mineral content (Ca, Cu, Fe,Mg, Mn, Na, P, Se, and Zn) in the milk compared to DJ,except for K which is higher in the DH (1469.8 ppm±115.0 DH vs. 1319.0 ppm ±104.9 DJ). The mean levels ofminerals in DH milk were in the range of 0.007 ppm for Seto 1469.8 ppm for K, whereas the range for minerals in DJmilk was from 1468.8 ppm for Ca to 0.01 ppm for Se. TheCVs were in the range of 7.8% for K to 33.3% for Cu inDH, and 7.9% for K to 40.0% for Cu in DJ.Phenotypic correlations between the mineral and overall
milk composition show similarity in both the DH as wellas the DJ (Additional file 1: Table S1). Especially P, Ca andMg were positively correlated and further showed a strongcorrelation to protein content. In cases there are differ-ences in the sign of the correlation, these correlations arenot significant, i.e. the standard error is much larger com-pared to the estimate. However there is one exception:
Buitenhuis et al. BMC Genetics (2015) 16:52 Page 4 of 8
Lactose and K has a negative correlation (−0.22 ± 0.06) inthe DH, while these components have a positive correl-ation (0.17 ± 0.06) in DJ (Additional file 1: Table S1).The heritability estimates and the genetic variance for
the minerals for both DH and DJ are presented in Table 2.For DH, high heritabilities were found for Ca (0.72), Zn(0.49), and P (0.46). For DJ, high heritabilities were foundfor Ca (0.63), Zn (0.57), and Mg (0.57). Intermediate heri-tabilities were found for Cu in DH, and for K, Na, P andSe in the DJ (Table 2).
GWAS resultsThe results of the GWAS are presented in Additionalfile 1: Table S1 for DH and Additional file 2: Table S2for DJ including the allele-substitution effect, locationand annotation.
Danish HolsteinIn total 649 significant SNP markers were detected forCa (24), Cu (90), Fe (111), Mn (3), Na (1), P (4), Se (12)and Zn (404) (Additional file 2: Table S2).For Ca SNP markers were detected on BTA14. For Cu
the QTL were distributed over 12 different chromosomes:BTA3 (6), BTA5 (26), BTA7 (25) and BTA14 (18) har-bored most significant SNP markers. For Se 12 significantSNP markers were located on BTA8. All these 12 SNPmarkers were located in the same LD block (BOVI-NEHD0800024680-BOVINE0800024709) and assigned tochromosome 8 open reading frame, human C9orf3(C8H9orf3) in the range of 82,922,191- 82,965,051 bp(BOVINEHD0800024693 - BOVINEHD0800024709). ForZn a strong QTL peak was detected on BTA2, where themost significant SNP marker (BOVINEHD0200037025)with a –log10(P-value) of 12.69 was assigned to PDLIM1interacting kinase 1 like (PDIK1L) (Figure 1). BOVINE
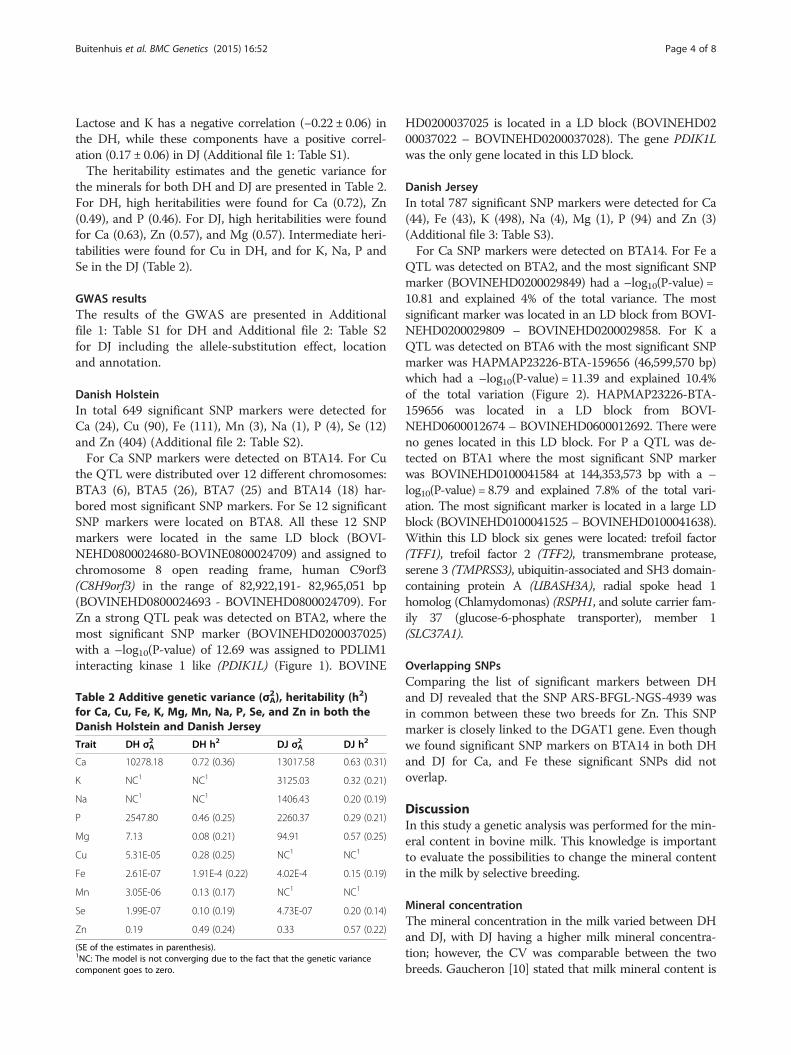
Table 2 Additive genetic variance (σ2A), heritability (h2)for Ca, Cu, Fe, K, Mg, Mn, Na, P, Se, and Zn in both theDanish Holstein and Danish Jersey
Trait DH σ2A DH h2 DJ σ2A DJ h2
Ca 10278.18 0.72 (0.36) 13017.58 0.63 (0.31)
K NC1 NC1 3125.03 0.32 (0.21)
Na NC1 NC1 1406.43 0.20 (0.19)
P 2547.80 0.46 (0.25) 2260.37 0.29 (0.21)
Mg 7.13 0.08 (0.21) 94.91 0.57 (0.25)
Cu 5.31E-05 0.28 (0.25) NC1 NC1
Fe 2.61E-07 1.91E-4 (0.22) 4.02E-4 0.15 (0.19)
Mn 3.05E-06 0.13 (0.17) NC1 NC1
Se 1.99E-07 0.10 (0.19) 4.73E-07 0.20 (0.14)
Zn 0.19 0.49 (0.24) 0.33 0.57 (0.22)
(SE of the estimates in parenthesis).1NC: The model is not converging due to the fact that the genetic variancecomponent goes to zero.
HD0200037025 is located in a LD block (BOVINEHD0200037022 – BOVINEHD0200037028). The gene PDIK1Lwas the only gene located in this LD block.
Danish JerseyIn total 787 significant SNP markers were detected for Ca(44), Fe (43), K (498), Na (4), Mg (1), P (94) and Zn (3)(Additional file 3: Table S3).For Ca SNP markers were detected on BTA14. For Fe a
QTL was detected on BTA2, and the most significant SNPmarker (BOVINEHD0200029849) had a –log10(P-value) =10.81 and explained 4% of the total variance. The mostsignificant marker was located in an LD block from BOVI-NEHD0200029809 – BOVINEHD0200029858. For K aQTL was detected on BTA6 with the most significant SNPmarker was HAPMAP23226-BTA-159656 (46,599,570 bp)which had a –log10(P-value) = 11.39 and explained 10.4%of the total variation (Figure 2). HAPMAP23226-BTA-159656 was located in a LD block from BOVI-NEHD0600012674 – BOVINEHD0600012692. There wereno genes located in this LD block. For P a QTL was de-tected on BTA1 where the most significant SNP markerwas BOVINEHD0100041584 at 144,353,573 bp with a –log10(P-value) = 8.79 and explained 7.8% of the total vari-ation. The most significant marker is located in a large LDblock (BOVINEHD0100041525 – BOVINEHD0100041638).Within this LD block six genes were located: trefoil factor(TFF1), trefoil factor 2 (TFF2), transmembrane protease,serene 3 (TMPRSS3), ubiquitin-associated and SH3 domain-containing protein A (UBASH3A), radial spoke head 1homolog (Chlamydomonas) (RSPH1, and solute carrier fam-ily 37 (glucose-6-phosphate transporter), member 1(SLC37A1).
Overlapping SNPsComparing the list of significant markers between DHand DJ revealed that the SNP ARS-BFGL-NGS-4939 wasin common between these two breeds for Zn. This SNPmarker is closely linked to the DGAT1 gene. Even thoughwe found significant SNP markers on BTA14 in both DHand DJ for Ca, and Fe these significant SNPs did notoverlap.
DiscussionIn this study a genetic analysis was performed for the min-eral content in bovine milk. This knowledge is importantto evaluate the possibilities to change the mineral contentin the milk by selective breeding.
Mineral concentrationThe mineral concentration in the milk varied between DHand DJ, with DJ having a higher milk mineral concentra-tion; however, the CV was comparable between the twobreeds. Gaucheron [10] stated that milk mineral content is
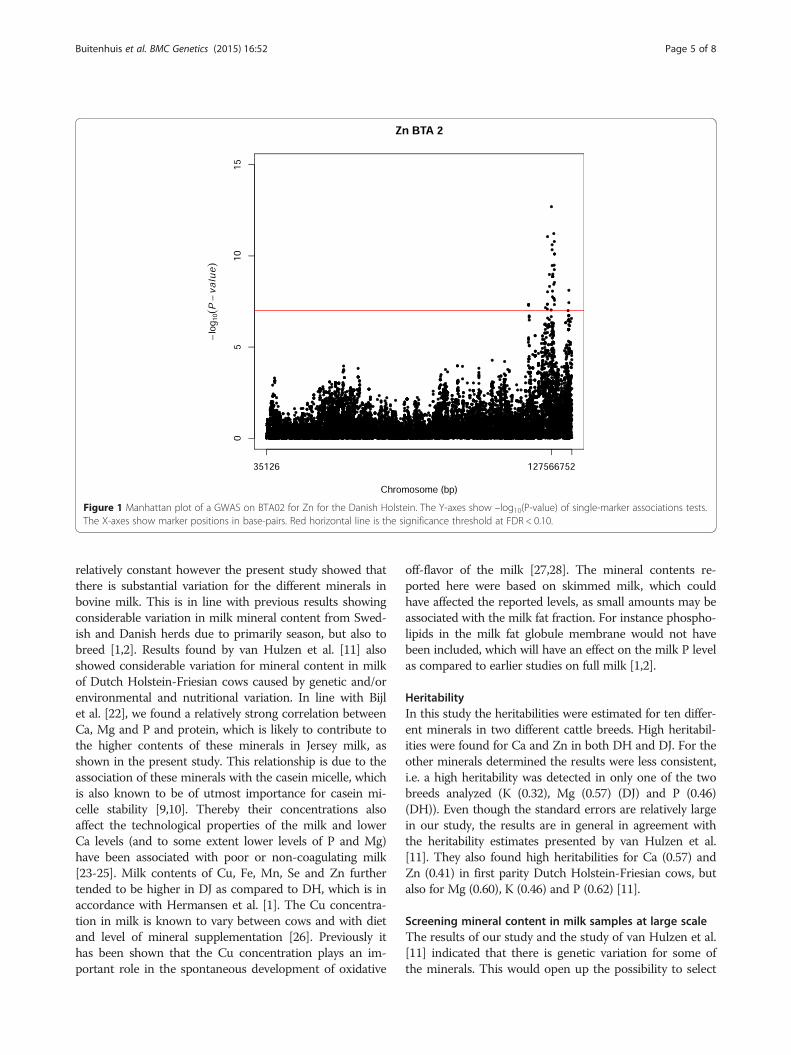
Figure 1 Manhattan plot of a GWAS on BTA02 for Zn for the Danish Holstein. The Y-axes show –log10(P-value) of single-marker associations tests.The X-axes show marker positions in base-pairs. Red horizontal line is the significance threshold at FDR < 0.10.
Buitenhuis et al. BMC Genetics (2015) 16:52 Page 5 of 8
relatively constant however the present study showed thatthere is substantial variation for the different minerals inbovine milk. This is in line with previous results showingconsiderable variation in milk mineral content from Swed-ish and Danish herds due to primarily season, but also tobreed [1,2]. Results found by van Hulzen et al. [11] alsoshowed considerable variation for mineral content in milkof Dutch Holstein-Friesian cows caused by genetic and/orenvironmental and nutritional variation. In line with Bijlet al. [22], we found a relatively strong correlation betweenCa, Mg and P and protein, which is likely to contribute tothe higher contents of these minerals in Jersey milk, asshown in the present study. This relationship is due to theassociation of these minerals with the casein micelle, whichis also known to be of utmost importance for casein mi-celle stability [9,10]. Thereby their concentrations alsoaffect the technological properties of the milk and lowerCa levels (and to some extent lower levels of P and Mg)have been associated with poor or non-coagulating milk[23-25]. Milk contents of Cu, Fe, Mn, Se and Zn furthertended to be higher in DJ as compared to DH, which is inaccordance with Hermansen et al. [1]. The Cu concentra-tion in milk is known to vary between cows and with dietand level of mineral supplementation [26]. Previously ithas been shown that the Cu concentration plays an im-portant role in the spontaneous development of oxidative
off-flavor of the milk [27,28]. The mineral contents re-ported here were based on skimmed milk, which couldhave affected the reported levels, as small amounts may beassociated with the milk fat fraction. For instance phospho-lipids in the milk fat globule membrane would not havebeen included, which will have an effect on the milk P levelas compared to earlier studies on full milk [1,2].
HeritabilityIn this study the heritabilities were estimated for ten differ-ent minerals in two different cattle breeds. High heritabil-ities were found for Ca and Zn in both DH and DJ. For theother minerals determined the results were less consistent,i.e. a high heritability was detected in only one of the twobreeds analyzed (K (0.32), Mg (0.57) (DJ) and P (0.46)(DH)). Even though the standard errors are relatively largein our study, the results are in general in agreement withthe heritability estimates presented by van Hulzen et al.[11]. They also found high heritabilities for Ca (0.57) andZn (0.41) in first parity Dutch Holstein-Friesian cows, butalso for Mg (0.60), K (0.46) and P (0.62) [11].
Screening mineral content in milk samples at large scaleThe results of our study and the study of van Hulzen et al.[11] indicated that there is genetic variation for some ofthe minerals. This would open up the possibility to select

Figure 2 Manhattan plot of a GWAS on BTA06 for K for the Danish Jersey. The Y-axes show –log10(P-value) of single-marker associations tests. The X-axesshow marker positions in base-pairs. Red horizontal line is the significance threshold at FDR < 0.10.
Buitenhuis et al. BMC Genetics (2015) 16:52 Page 6 of 8
genetically for specific minerals in the milk. However themethods used to quantify the mineral content in dairymilk are labor intensive and expensive, and are thereforenot suited to be implemented for large scale screening ofmilk samples from the milk control system. In the routinemilk laboratories mid infra red spectroscopy has been im-plemented to measure fat and protein in the milk. Soyeurtet al. [29] investigated the possibility to estimate the min-eral concentration in the milk based on infra red. Theycould develop and implement prediction models for Pand Ca [29], but the development of prediction models
for other minerals was more difficult (e.g. Mg, Na) or im-possible in case of K [29].
QTL and genes for mineral contentTo our knowledge this is the first study to reportGWAS results on the mineral content in milk. As thenumber of samples per population is relatively small,it is expected that only those QTL with large effectare detected. First we will focus on those QTL de-tected for minerals with a high heritability in one ofthe cattle breeds (Zn and P), and then on those QTL

Buitenhuis et al. BMC Genetics (2015) 16:52 Page 7 of 8
detected for minerals with an intermediate heritabilityin one of the cattle breeds (K and Cu).
ZnFor Zn we detected a QTL in DH on BTA2 with the mostsignificant SNP assigned to the gene (PDIK1L) (Figure 1).PDIK1L is involved in biological processes like proteinserine/threonine kinase activity, ATP binding and proteinphosphorylation, i.e. introducing phosphate group to aprotein (http://www.uniprot.org/uniprot/Q8N165). Phos-phorylation of the (casein) proteins in the milk influencesthe stability of the casein micelle in the milk. Even thoughit is not known how this gene plays a role in the regulationof the Zn concentration in the milk at this stage, PDIK1Lcould be considered as a candidate gene.A SNP marker close to DGAT was among the significant
markers for Zn in both DH and DJ. How DGAT is in-volved in the Zn concentration in milk is at this stage un-known, however it has been shown that low de novo milkfat diet can significantly increase plasma Zn and milk Zncontent, whereas dietary Zn level in itself did not influenceZn concentration in milk or plasma. This indicates thatthe transfer of fat from diet to milk might facilitate trans-fer of Zn from diet to milk [30].
PIn this study total P is measured including the bound P.However we are using skimmed milk, which could explainthe relative low levels of P in the milk samples comparedto the literature [11]. The most significant marker (BOVI-NEHD0100041584) for P is located in a LD block contain-ing 6 genes (TFF1, TFF2, UBASH3A, RSPH1 andSLC37A1). Based on the physical map position of BOVI-NEHD0100041584 and on the biological descriptions ofthe genes in the LD block, SLC37A1 is a good candidategene. BOVINEHD0100041584 is located 10 kb down-stream SLC37A1. In human SLC37A1 is involved in thetransport of glucose-6-phoshate and plays an importantrole in the blood glucose homeostasis [31]. More specific-ally SLC37A1 showed phosphate linked glucose-6-phoshate antiporter activity. SLC37A1 is part of the SLC37family. The SLC37 family is a group of genes involved inthe translocation of glucose-6-phoshate from the cyto-plasm into the lumen of the ER. There glucose-6-phoshateis hydrolyzed into glucose and P. [31].
KCohen-Zinder et al. [32] identified ABCG2 at 37.4 Mb onBTA6. This gene has a major effect on milk yield and milkcomposition [32]. The most significant SNP marker for Kis located around 46.6 Mb (Figure 2), indicating that thereis little or no overlap with ABCG2.
CuThe Cu concentration in the milk varies between cowsand depends on the diet and level of mineral supple-mentation [26]. Previously it has been shown that theCu concentration plays an important role in the spon-taneous development of oxidative off-flavor of the milk[27]. QTL regulating the Cu concentration in the milkmay be of interest to reduce or increase the Cu concen-tration by genetics. Morris et al. [33] had detected QTLfor Cu on BTA3, BTA5 and BTA13. These chromo-somes were also among our results for Cu content inthe milk in DH. A closer look showed however thatthese QTL [33] did not show overlap with the signifi-cant markers for Cu content in milk detected in ourstudy. With regard to the development of oxidative off-flavor in the milk the QTL on BTA14 for Cu is interest-ing. The significant SNP markers for Cu content in themilk are in LD with DGAT1 (data not shown) i.e. theLD block was based on the HD SNP markers coveringthe physical map position of DGAT1. Juhlin et al. [28]showed that DGAT1 polymorphisms together with theFA composition and Cu concentration were risk factorsfor the development of spontaneous oxidized flavor. Intheir study they tested the influence of DGAT1 on dif-ferent fatty acid groups, however not on the Cu concen-tration in the milk. Our results suggest that the DGAT1polymorphism may also influence the Cu concentrationin the milk.
ConclusionProfound differences in mineral concentration in the milkbetween DH and DJ were identified with a generallyhigher mineral concentration in milk from DJ. High herit-ability estimates were found for Ca and Zn in both DHand DJ. The GWAS identified QTL in both DH and DJ. AQTL on BTA14 for Ca and Zn was identified in bothDH and DJ. However, the majority of the QTL identi-fied were breed specific. The relatively high heritabilityestimates for content of several bovine milk mineralsopen up the possibility of elevating milk mineral con-tent by genetic selection.
Availability of supporting dataNo new SNPs were discovered in this manuscript. TheSNPs used in this manuscript are from the Illumina Bo-vine HD SNP array: http://res.illumina.com/documents/products/datasheets/datasheet_bovinehd.pdf. Names andlocation of these SNPs can be found at: http://suppor-t.illumina.com/downloads.html. Assigning the SNPs togenes was based on the publicly available bovine genomeassembly: ftp://ftp.cbcb.umd.edu/pub/data/assembly/Bos_taurus/Bos_taurus_UMD_3.1/annotation/UMD3.1.gff.gz.

Buitenhuis et al. BMC Genetics (2015) 16:52 Page 8 of 8
Additional files
Additional file 1: Table S1. Phenotypic correlation of between milkproduction traits and the mineral content of the milk. Above thediagonal the phenotypic correlation for the Danish Holstein and DanishJersey breeds. Below the diagonal the standard error.
Additional file 2: Table S2. Significant SNP associated to Mineral traitsin the Danish Holstein. A genome wide association scan was performedon the Danish Holstein cattle for detailed mineral composition. SNPswere considered significant at FDR < 0.10.
Additional file 3: Table S3. Significant SNP associated to Mineral traitsin the Danish Jersey. A genome wide association scan was performed onthe Danish Jersey cattle for detailed mineral composition. SNPs wereconsidered significant at FDR < 0.10.
Competing interestThe authors declare that they have no competing interests.
Authors’ contributionsBB processed the genotypes, performed the genetic analysis, and wrote themanuscript. NAP collected the milk samples and contributed to thediscussion of the results. LBL contributed to the planning, sampling anddiscussion of the results. JS performed the analysis of the minerals in themilk and contributed to the discussion of the results. All authors contributedto the manuscript and approved the final version of the manuscript.
AcknowledgementsThis study is part of the Danish-Swedish Milk Genomics Initiative(www.milkgenomics.dk) supported by the Danish Agency for Science,Technology and Innovation, Danish Cattle Federation, Aarhus Universityand Arla Foods amba (Viby J, Denmark), as well as part of the “Phenotypicand genetic markers for specific milk quality parameters” of the Milk LevyFund, Denmark (2011–2013).
Author details1Aarhus University, Center for Quantitative Genetics and Genomics,Department of Molecular Biology and Genetics, Blichers Allé 20, P.O. Box 50DK-8830 Tjele, Denmark. 2Aarhus University, Department of Food Science,Blichers Allé 20, P.O. Box 50 DK-8830 Tjele, Denmark. 3Aarhus University,Department of Animal Science, Blichers Allé 20, P.O. Box 50DK-8830 Tjele,Denmark.
Received: 27 February 2015 Accepted: 27 April 2015
References1. Hermansen JE, Badsberg JH, Kristensen T, Gundersen V. major and trace
elements in organically and conventionally produced milk. J Dairy Res.2005;72:362–8.
2. Lindmark-Månsson H, Fondén R, Pettersson HE. Composition of Swedishdairy milk. Int Dairy J. 2003;13:409–25.
3. Cashman KD. Milk minerals (including trace elements) and bone health. IntDairy J. 2006;16:1389–98.
4. Haug A, Høstmark AT, Harstad OM. Bovine milk in human nutrition–areview. Lipids Health Dis. 2007;6:25.
5. Overton TR, Yasui T. Practical applications of trace minerals for dairy cattle.J Anim Sci. 2014;92:416–26.
6. Jelen P, Lutz S. Functional milk and dairy products. In: Mazza G, Shi J, LeMaguer M, editors. Pages 357–380 in Functional Foods: Biochemical andProcessing Aspects Vol. 1. Boca Raton, FL: CRC Press; 1998.
7. Lönnerdahl B, Keen CL, Hurley LS. Iron, copper, zinc and manganese in milk.Ann Rev Nutr. 1981;1:149–74.
8. Tsioulpas A, Lewis MJ, Grandison AS. Effect of minerals on casein micellestability of cows' milk. J Dairy Res. 2007;74:167–73.
9. Deeth HC, Lewis MJ. Practical consequences of calcium addition to andremoval from milk and dairy products. Int J Dairy Technol. 2015;68(1):1–10.
10. Gaucheron F. The minerals of milk. Reprod Nutr Dev. 2005;45:473–83.11. van Hulzen KJE, Sprong RC, van der Meer R, van Arendonk JAM. Genetic
and nongenetic variation in concentration of selenium, calcium, potassium,
zinc, magnesium, and phosphorus in milk of Dutch Holstein-Friesian cows.J Dairy Sci. 2009;92:5754–9.
12. Poulsen NA, Gustavsson F, Glantz M, Paulsson M, Larsen LB, Larsen MK.The influence of feed and herd on fatty acid composition in 3 dairy breeds(Danish Holstein, Danish Jersey, and Swedish Red). J Dairy Sci.2012;95:6362–71.
13. Cava-Montesinos P, Cervera ML, Pastor A, de la Guardia M. Roomtemperature acid sonication ICP-MS multielemental analysis of milk.Analytica Chimica Acta. 2005;531:111–23.
14. Buitenhuis AJ, Sundekilde UK, Poulsen NA, Bertram HC, Larsen LB, SørensenP. Estimation of genetic parameters and detection of quantitative trait locifor metabolites in Danish Holstein milk. J Dairy Sci. 2013;96:3285–95.
15. Van Tassell CP, Smith TPL, Matukumalli LK, Taylor JF, Schnabel RD, LawleyCT, et al. SNP discovery and allele frequency estimation by deepsequencing of reduced representation libraries. Nature Methods.2008;5:247–52.
16. Teo YY, Inouye M, Small KS, Gwilliam R, Deloukas P, Kwiatkowski DP, et al.A genotype calling algorithm for the Illumina BeadArray platform.Bioinformatics. 2007;23:2741–6.
17. Liu Y, Qin X, Song XZ, Jiang H, Shen Y, Durbin KJ, et al. Bos taurus genomeassembly. BMC Genomics. 2009;10:180.
18. VanRaden PM. Efficient methods to compute genomic predictions. J DairySci. 2008;91:4414–23.
19. Madsen P, Jensen J: An user’s guide to DMU. A package for analysingmultivariate mixed models. 2007. Version 6, release 4.7. available at http://dmu.agrsci.dk.
20. Yang J, Benyamin B, McEvoy BP, Gordon S, Henders AK, Nyholt DR, et al.Common SNPs explain a large proportion of the heritability for humanheight. Nature Genet. 2010;42:565–9.
21. Barrett JC, Fry B, Maller J, Daly MJ. Haploview: analysis and visualization ofLD and haplotype maps. Bioinformatics. 2005;21(2):263–5.
22. Bijl E, van Valenberg HJF, Huppertz T, van Hooijdonk ACM. Protein, caseinand micellar salts in milk: Current content and historical perspectives.J Dairy Sci. 2013;96:5455–64.
23. Hallén E, Lunden A, Tyriseva A-M, Westerlind M, Andren A. Composition ofpoorly and non-coagulating bovine milk and effect of calcium addition.J Dairy Res. 2010;77:398–403.
24. Jensen HB, Holland JW, Poulsen NA, Larsen LB. Milk protein variants andisoforms identified in bovine milk representing extremes in coagulationproperties. J Dairy Sci. 2012;95:2891–903.
25. Jensen HB, Poulsen NA, Andersen KK, Hammershøj M, Poulsen HD, LarsenLB. Distinct composition of bovine milk from Jersey and Holstein-Friesiancows with good, poor, or noncoagulation properties as reflected in proteingenetic variants and isoforms. J Dairy Sci. 2012;95:6905–17.
26. Dunkley WL, Franke AA, Robb J, Ronning M. Influence of dietary copper andethylenediaminetetraacetate on copper concentration and oxidativestability of milk. J Dairy Sci. 1968;51:863–6.
27. Juhlin J, Fikse F, Lundén A, Pickova J, Agenäs S. Relative impact ofalpha-tocopherol, copper and fatty acid composition on the occurrence ofoxidized milk flavour. J Dairy Res. 2010;77:302–9.
28. Juhlin J, Fikse WF, Pickova J, Lundén A. Association of DGAT1 genotype,fatty acid composition, and concentration of copper in milk withspontaneous oxidized flavor. J Dairy Sci. 2012;95:4610–7.
29. Soyeurt H, Bruwier D, Romnee JM, Gengler N, Bertozzi C, Veselko D, et al.Potential estimation of major mineral contents in cow milk using mid-infrared spectrometry. J Dairy Sci. 2009;92:2444–54.
30. Wiking L, Larsen T, Sehested J. Transfer of dietary zinc and fat to milk–evaluation of milk fat quality, milk fat precursors, and mastitis indicators.J Dairy Sci. 2008;91:1544–51.
31. Pan CJ, Chen SY, Jun HS, Lin SR, Mansfield BC, Chou JY. SLC37A1 andSLC37A2 are phosphate-linked, glucose-6-phosphate antiporters. PLoS One.2011;6, e23157.
32. Cohen-Zinder M, Seroussi E, Larkin DM, Loor JJ, Everts-van der Wind A,Lee JH. Identification of a missense mutation in the bovine ABCG2 genewith a major effect on the QTL on chromosome 6 affecting milk yield andcomposition in Holstein cattle. Genome Res. 2005;15:936–44.
33. Morris CA, Bottema CD, Cullen NG, Hickey SM, Knowles SO, Pitchford WS.Effects of quantitative trait loci and the myostatin locus on trace and macroelements (minerals) in bovine liver, muscle and kidney. Anim Genet.2013;44:361–8.
Related Documents