RESEARCH ARTICLE Open Access Comparative multi-goal tradeoffs in systems engineering of microbial metabolism David Byrne 1* , Alexandra Dumitriu 1 and Daniel Segrè 1,2,3* Abstract Background: Metabolic engineering design methodology has evolved from using pathway-centric, random and empirical-based methods to using systems-wide, rational and integrated computational and experimental approaches. Persistent during these advances has been the desire to develop design strategies that address multiple simultaneous engineering goals, such as maximizing productivity, while minimizing raw material costs. Results: Here, we use constraint-based modeling to systematically design multiple combinations of medium compositions and gene-deletion strains for three microorganisms (Escherichia coli, Saccharomyces cerevisiae, and Shewanella oneidensis) and six industrially important byproducts (acetate, D-lactate, hydrogen, ethanol, formate, and succinate). We evaluated over 435 million simulated conditions and 36 engineering metabolic traits, including product rates, costs, yields and purity. Conclusions: The resulting metabolic phenotypes can be classified into dominant clusters (meta-phenotypes) for each organism. These meta-phenotypes illustrate global phenotypic variation and sensitivities, trade-offs associated with multiple engineering goals, and fundamental differences in organism-specific capabilities. Given the increasing number of sequenced genomes and corresponding stoichiometric models, we envisage that the proposed strategy could be extended to address a growing range of biological questions and engineering applications. Keywords: Metabolism, Microorganisms, Metabolic engineering, Constraint-based modeling Background Microorganisms possess metabolic capabilities that are essential to society, science, and industry. Today, most bulk and specialty chemicals are derived from crude oil. However, declining oil reserves, rising oil prices, and growing environmental concerns have prompted renewed interest in producing chemicals using microorganisms instead of fossil fuels [1]. To transform microbial hosts into cellular factories, the applied discipline of systems metabolic engineering is using genome-scale approaches that redirect microbial metabolism to synthesize renew- able and cost-effective biochemicals [1-3]. Classical metabolic engineering methods use localized metabolic intuition and random mutagenesis screening to develop microbial strains that possess improved bio- chemical production capabilities. For example, Escherichia coli does not naturally produce succinic acid as a major fermentative product; consequently, early metabolic en- gineering efforts targeted metabolic pathways that were thought to be involved in succinic acid synthesis. How- ever, these perceived improvements were often ineffective or produced undesirable side-effects (e.g. large amounts of impurities were produced or cell growth was significantly inhibited) [4-7]. While some conventional strategies have shown a degree of success, production levels for the synthesis of succinic acid, as well as many other valu- able biochemical compounds, often fall considerably short of maximum theoretical production limits [1,3,8]. These shortcomings are due, in part, to the fact that metabolic pathways and related regulatory processes form complex molecular and functional interaction networks. By focusing solely on one particular enzyme or metabolic pathway, it is likely that interrelated and potentially undesirable effects elsewhere in the cell might be inadvertently missed [9]. Similarly, conventional metabolic designs often singly focus on achieving maximal production rates or yields of targeted compounds without accounting for adverse economic consequences (e.g., due to material costs or * Correspondence: [email protected]; [email protected] 1 Bioinformatics Program, Boston University, Boston, MA 02215, USA 2 Department of Biology, Boston University, Boston, MA 02215, USA Full list of author information is available at the end of the article © 2012 Byrne et al.; licensee BioMed Central Ltd. This is an Open Access article distributed under the terms of the Creative Commons Attribution License (http://creativecommons.org/licenses/by/2.0), which permits unrestricted use, distribution, and reproduction in any medium, provided the original work is properly cited. Byrne et al. BMC Systems Biology 2012, 6:127 http://www.biomedcentral.com/1752-0509/6/127

Welcome message from author
This document is posted to help you gain knowledge. Please leave a comment to let me know what you think about it! Share it to your friends and learn new things together.
Transcript
Byrne et al. BMC Systems Biology 2012, 6:127http://www.biomedcentral.com/1752-0509/6/127
RESEARCH ARTICLE Open Access
Comparative multi-goal tradeoffs in systemsengineering of microbial metabolismDavid Byrne1*, Alexandra Dumitriu1 and Daniel Segrè1,2,3*
Abstract
Background: Metabolic engineering design methodology has evolved from using pathway-centric, random andempirical-based methods to using systems-wide, rational and integrated computational and experimentalapproaches. Persistent during these advances has been the desire to develop design strategies that addressmultiple simultaneous engineering goals, such as maximizing productivity, while minimizing raw material costs.
Results: Here, we use constraint-based modeling to systematically design multiple combinations of mediumcompositions and gene-deletion strains for three microorganisms (Escherichia coli, Saccharomyces cerevisiae, andShewanella oneidensis) and six industrially important byproducts (acetate, D-lactate, hydrogen, ethanol, formate, andsuccinate). We evaluated over 435 million simulated conditions and 36 engineering metabolic traits, includingproduct rates, costs, yields and purity.
Conclusions: The resulting metabolic phenotypes can be classified into dominant clusters (meta-phenotypes) foreach organism. These meta-phenotypes illustrate global phenotypic variation and sensitivities, trade-offs associatedwith multiple engineering goals, and fundamental differences in organism-specific capabilities. Given the increasingnumber of sequenced genomes and corresponding stoichiometric models, we envisage that the proposed strategycould be extended to address a growing range of biological questions and engineering applications.
Keywords: Metabolism, Microorganisms, Metabolic engineering, Constraint-based modeling
BackgroundMicroorganisms possess metabolic capabilities that areessential to society, science, and industry. Today, mostbulk and specialty chemicals are derived from crude oil.However, declining oil reserves, rising oil prices, andgrowing environmental concerns have prompted renewedinterest in producing chemicals using microorganismsinstead of fossil fuels [1]. To transform microbial hostsinto cellular factories, the applied discipline of systemsmetabolic engineering is using genome-scale approachesthat redirect microbial metabolism to synthesize renew-able and cost-effective biochemicals [1-3].Classical metabolic engineering methods use localized
metabolic intuition and random mutagenesis screening todevelop microbial strains that possess improved bio-chemical production capabilities. For example, Escherichiacoli does not naturally produce succinic acid as a major
* Correspondence: [email protected]; [email protected] Program, Boston University, Boston, MA 02215, USA2Department of Biology, Boston University, Boston, MA 02215, USAFull list of author information is available at the end of the article
© 2012 Byrne et al.; licensee BioMed Central LCommons Attribution License (http://creativecreproduction in any medium, provided the or
fermentative product; consequently, early metabolic en-gineering efforts targeted metabolic pathways that werethought to be involved in succinic acid synthesis. How-ever, these perceived improvements were often ineffectiveor produced undesirable side-effects (e.g. large amounts ofimpurities were produced or cell growth was significantlyinhibited) [4-7]. While some conventional strategies haveshown a degree of success, production levels for thesynthesis of succinic acid, as well as many other valu-able biochemical compounds, often fall considerably shortof maximum theoretical production limits [1,3,8]. Theseshortcomings are due, in part, to the fact that metabolicpathways and related regulatory processes form complexmolecular and functional interaction networks. By focusingsolely on one particular enzyme or metabolic pathway, it islikely that interrelated and potentially undesirable effectselsewhere in the cell might be inadvertently missed [9].Similarly, conventional metabolic designs often singly
focus on achieving maximal production rates or yields oftargeted compounds without accounting for adverseeconomic consequences (e.g., due to material costs or
td. This is an Open Access article distributed under the terms of the Creativeommons.org/licenses/by/2.0), which permits unrestricted use, distribution, andiginal work is properly cited.
Byrne et al. BMC Systems Biology 2012, 6:127 Page 2 of 19http://www.biomedcentral.com/1752-0509/6/127
final product purification processes) that may ultimatelymake a design impractical or commercially infeasible.Many, or even most, real engineering problems have mul-tiple engineering goals, such as maximizing operationalperformance, minimizing material cost, and maximizingexperimental reproducibility. The criteria subsequentlyused for design and optimization of engineering processeslargely depend on which engineering goals are chosen. Forindustrial fermentation processes, four of the most im-portant design-selection criteria are productivity, yield,final titer, and economic cost [10]. Productivity is the rateof product generation and is important to ensure theeffective utilization of production capacity (e.g. capacity ofbioreactors). Yield is the ratio of unit product formationto unit substrate consumption and is used as a measure ofthe production efficiency. Final titer is the purity of prod-uct generation and is important since further treatment ofthe fermentation medium, such as removal of impurities,may be necessary. Finally, economic cost is the monetaryexpenditure per unit of generated product. Economiccosts may be associated with each component of the fer-mentation process and may ultimately dictate the viabilityof a product given current market conditions. Further-more, engineering criteria may be condition-dependent(e.g. the criteria used for high volume, low value-addedindustrial fermentation products may differ significantlyfrom the criteria used for low volume, high value-addedproducts) and conflicting (e.g. the goal of maximumproductivity may adversely affect the goal for mini-mum economic cost). Thus, tradeoffs among engineeringgoals can help to differentiate and prioritize design selec-tion criteria.To help evaluate and understand these complex bio-
logical and engineering relationships, system modeling isbecoming an increasingly valuable tool for scientists andmetabolic engineers alike. Kinetic modeling has beenused to evaluate dynamic enzymatic effects of metabol-ism [11]. However, at whole-cell scales, kinetic modelingcan become unwieldy due, in part, to the prerequisite ofkinetic parameters that may be difficult to obtain experi-mentally [12]. Consequently, constraint-based modelinghas become a powerful alternative, since it obviates thisprerequisite by approximating metabolism in steady-state[9]. Despite this simplification and some additional limita-tions [12], constraint-based modeling has been experi-mentally shown to provide valuable predictions of whole-cell metabolic fluxes and growth phenotypes under a var-iety of environmental and genetic conditions [13-15]. As aresult, a growing number of constraint-based analysismethods are being developed to evaluate metabolic mod-els and the corresponding mathematical solution spacethat characterizes the phenotypic potential of an organism[9]. For example, flux balance analysis (FBA) uses a chosenobjective function to search the edges of the mathematical
solution space for a single optimal network state and asso-ciated flux distribution [16]. FBA has been used for avariety of applications, such as predicting the lethalityof gene knockouts [17] and quantitatively predictingcellular growth rates and fluxes under different condi-tions [14]. Bi-level optimization approaches based on FBA[18] have been developed to simultaneously optimize twohierarchically-related objectives such as a primary and sec-ondary metabolite production in microbial strain design.In particular, an initial algorithm aimed at identifying opti-mal designs through multiple gene knockouts (OptKnock[19]) was followed by more versatile approaches capableof taking into account gene up-regulation and down-regulation (OptReg [20]), as well as existing flux measure-ments (OptForce [21]). Rather than analyzing single net-work states, other constraint-based analysis techniques,such as extreme pathway analysis [22] and uniformrandom sampling [23], may be used to assess globalnetwork properties, characterizing ranges of optimal orsub-optimal biochemical network states. In addition, toaddress multiple optimality goals that may conflict andcannot be optimized simultaneously, multi-objectiveoptimization and trade-off analysis approaches have beenrecently developed [24-26]. Together, these methods areyielding new biological and engineering insights.In this study, we develop an integrative computational
framework that elucidates relationships between environ-mental and genetic perturbations and their system-wideeffects on microbial metabolism and metabolic engineer-ing design strategies. Prior metabolic engineering studieshave primarily focused on either environmental or geneticperturbation strategies, a single organism, one or a few en-gineering goals (usually productivity or yield) and optimaldesign solutions. Conversely, our approach addresses themultifaceted nature of metabolic engineering design pro-cesses by exhaustively generating and systematically ana-lyzing more than four hundred million designs thatincorporate both extracellular (i.e. medium composition)and intracellular (i.e. genetic knockout) perturbations andmultiple microorganisms and engineering goals. Althoughany biochemical reaction network and synthesized targetmetabolite can be incorporated into our methodology, wefocus on three microorganisms (E. coli, S. cerevisiae andS. oneidensis) and six target metabolite by-products ofindustrial interest: acetate [27], ethanol [28,29], formate[30], hydrogen [31], D-lactate [27,32], and succinate[33-35]. Escherichia coli [13,36] and Saccharomycescerevisiae [35] are perhaps the best characterized andstudied prokaryotic and eukaryotic microorganisms, re-spectively, and are commonly used for a wide range ofcomputational and experimental scientific studies andindustrial applications. Shewanella oneidensis [37] is, bycomparison, a more recently sequenced [38] and less well-studied bacterium, yet it possesses considerable potential
Byrne et al. BMC Systems Biology 2012, 6:127 Page 3 of 19http://www.biomedcentral.com/1752-0509/6/127
for bioremediation [37], microbial fuel cells [39] and otherbioenergy applications [31]. A set of 36 biological and eco-nomic traits is used to evaluate corresponding engineeringdesign goals. Although economic considerations are para-mount in evaluating feasibility of any industrial designwith commercial potential, a methodology for incorporat-ing economic factors into constraint-based modeling hadnot been implemented before. The resulting population ofphenotypes provides a rich dataset that is used to assesslocal design considerations and biological causalities, aswell as global perturbation effects. An experimental com-patibility score is used to assess the expected agreement ofpredictions with experimental data, such as mRNA ex-pression arrays. Additionally, we present local tradeoffsbetween individual designs and engineering goals and glo-bal tradeoffs of metabolic traits across and within organ-isms. We find distinctive phenotypic characteristics thatdifferentiate innate organism-specific metabolic capabil-ities, making certain organisms more suitable for particu-lar engineering applications. We also find specific andgeneral metabolic design strategies that can be used tofacilitate optimal engineering output.
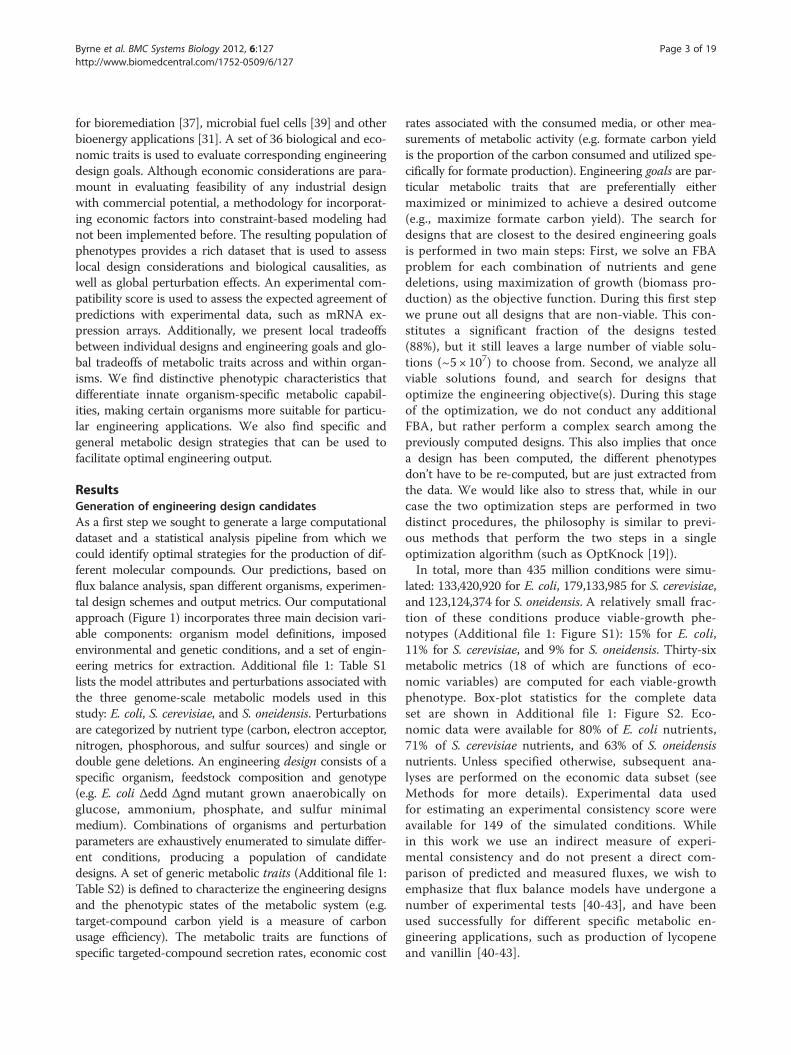
ResultsGeneration of engineering design candidatesAs a first step we sought to generate a large computationaldataset and a statistical analysis pipeline from which wecould identify optimal strategies for the production of dif-ferent molecular compounds. Our predictions, based onflux balance analysis, span different organisms, experimen-tal design schemes and output metrics. Our computationalapproach (Figure 1) incorporates three main decision vari-able components: organism model definitions, imposedenvironmental and genetic conditions, and a set of engin-eering metrics for extraction. Additional file 1: Table S1lists the model attributes and perturbations associated withthe three genome-scale metabolic models used in thisstudy: E. coli, S. cerevisiae, and S. oneidensis. Perturbationsare categorized by nutrient type (carbon, electron acceptor,nitrogen, phosphorous, and sulfur sources) and single ordouble gene deletions. An engineering design consists of aspecific organism, feedstock composition and genotype(e.g. E. coli Δedd Δgnd mutant grown anaerobically onglucose, ammonium, phosphate, and sulfur minimalmedium). Combinations of organisms and perturbationparameters are exhaustively enumerated to simulate differ-ent conditions, producing a population of candidatedesigns. A set of generic metabolic traits (Additional file 1:Table S2) is defined to characterize the engineering designsand the phenotypic states of the metabolic system (e.g.target-compound carbon yield is a measure of carbonusage efficiency). The metabolic traits are functions ofspecific targeted-compound secretion rates, economic cost
rates associated with the consumed media, or other mea-surements of metabolic activity (e.g. formate carbon yieldis the proportion of the carbon consumed and utilized spe-cifically for formate production). Engineering goals are par-ticular metabolic traits that are preferentially eithermaximized or minimized to achieve a desired outcome(e.g., maximize formate carbon yield). The search fordesigns that are closest to the desired engineering goalsis performed in two main steps: First, we solve an FBAproblem for each combination of nutrients and genedeletions, using maximization of growth (biomass pro-duction) as the objective function. During this first stepwe prune out all designs that are non-viable. This con-stitutes a significant fraction of the designs tested(88%), but it still leaves a large number of viable solu-tions (~5 × 10⁷) to choose from. Second, we analyze allviable solutions found, and search for designs thatoptimize the engineering objective(s). During this stageof the optimization, we do not conduct any additionalFBA, but rather perform a complex search among thepreviously computed designs. This also implies that oncea design has been computed, the different phenotypesdon’t have to be re-computed, but are just extracted fromthe data. We would like also to stress that, while in ourcase the two optimization steps are performed in twodistinct procedures, the philosophy is similar to previ-ous methods that perform the two steps in a singleoptimization algorithm (such as OptKnock [19]).In total, more than 435 million conditions were simu-
lated: 133,420,920 for E. coli, 179,133,985 for S. cerevisiae,and 123,124,374 for S. oneidensis. A relatively small frac-tion of these conditions produce viable-growth phe-notypes (Additional file 1: Figure S1): 15% for E. coli,11% for S. cerevisiae, and 9% for S. oneidensis. Thirty-sixmetabolic metrics (18 of which are functions of eco-nomic variables) are computed for each viable-growthphenotype. Box-plot statistics for the complete dataset are shown in Additional file 1: Figure S2. Eco-nomic data were available for 80% of E. coli nutrients,71% of S. cerevisiae nutrients, and 63% of S. oneidensisnutrients. Unless specified otherwise, subsequent ana-lyses are performed on the economic data subset (seeMethods for more details). Experimental data usedfor estimating an experimental consistency score wereavailable for 149 of the simulated conditions. Whilein this work we use an indirect measure of experi-mental consistency and do not present a direct com-parison of predicted and measured fluxes, we wish toemphasize that flux balance models have undergone anumber of experimental tests [40-43], and have beenused successfully for different specific metabolic en-gineering applications, such as production of lycopeneand vanillin [40-43].
Figure 1 Procedural overview. The multi-goal metabolic engineering process incorporates three main decision-variable components:(1) organism model definitions, (2) imposed environmental and genetic conditions, and (3) extraction of desirable engineering metrics and goals.The resultant extracellular engineering phenotypes, relationships between the decision variables, and intracellular pathway activity can then beanalyzed and experimentally verified to provide mechanistic insight and achieve optimal engineering designs.
Byrne et al. BMC Systems Biology 2012, 6:127 Page 4 of 19http://www.biomedcentral.com/1752-0509/6/127
Different organisms are better at achieving differentgoalsGiven the enormous amount of data collected throughthe simulations across organisms and designs (approxi-mately 6 terabytes of data in totality), it is a significantchallenge to sort through and visualize this informationin a useful manner. Using the metabolic traits, we classi-fied the resultant viable phenotypes into dominantengineering meta-phenotypes for each organism. Clas-sification was achieved by using iterative k-meansclustering on the set of engineering phenotypes untilan optimal cluster number was identified (Methods andAdditional file 1: Figure S3). Each meta-phenotype vectoris the computed centroid for the phenotypes within theassociated cluster. Along with cluster sizes and hetero-geneities, the meta-phenotypes succinctly describe thefrequency and similarity of dominant phenotypic char-acteristics. For the economic dataset, we found 10, 30,and 20 meta-phenotypes for E. coli, S. cerevisiae, andS. oneidensis, respectively. To compare metabolic traitsacross phenotypes and organisms, the data are trans-formed into row-wise z-scores. The transformed data arethen grouped by organism and hierarchically bi-clustered.The resultant “phenotypic maps” (Figure 2, Additionalfile 1: Figure S4 and Additional file 2: Table S4) provide acondensed global perspective of dominant phenotypiccharacteristics and metabolic capabilities that can quicklyand easily be scanned to compare metabolic traitswithin and across organisms. A comprehensive list of all
phenotype metrics and associated conditions may bedownloaded or viewed using the online tool (see Methods).Once organized into clustered meta-phenotypes, our
data reveal that different organisms possess distinct dom-inant phenotypic characteristics. Figure 2 shows the meta-phenotypes for the subset of data with economic pricing.E. coli can be characterized by the fewest number of dom-inant meta-phenotypes (10) followed by S. oneidensis (20)and S. cerevisiae (30). The associated number of pheno-types is 10,086,971 for E. coli, 10,080,733 for S. cerevisiae,and 12,632,536 for S. oneidensis. The largest phenotypecluster for E. coli accounts for more than 56% of all phe-notypes. That meta-phenotype has relatively low biomassproduction rates and high biomass carbon yields, as wellas low profit rates due to lower rates of targeted bypro-ducts synthesis. The second largest phenotype is similar tothe first largest phenotype; the only major difference isconsiderably higher acetate and hydrogen revenueyields. Together, the two largest meta-phenotypes ac-count for more than 70% of all phenotypes. This im-plies that for the metabolic traits and conditions underconsideration, E. coli has relatively low phenotypic vari-ation compared to S. cerevisiae and S. oneidensis, whichare much more broadly distributed. The first two largestmeta-phenotypes contain 30% and 36% of all phenotypesfor S. cerevisiae and S. oneidensis, respectively. A compari-son between the meta-phenotypes within and betweenorganisms can be visualized in the form of a correlationmatrix (Additional file 1: Figure S18).
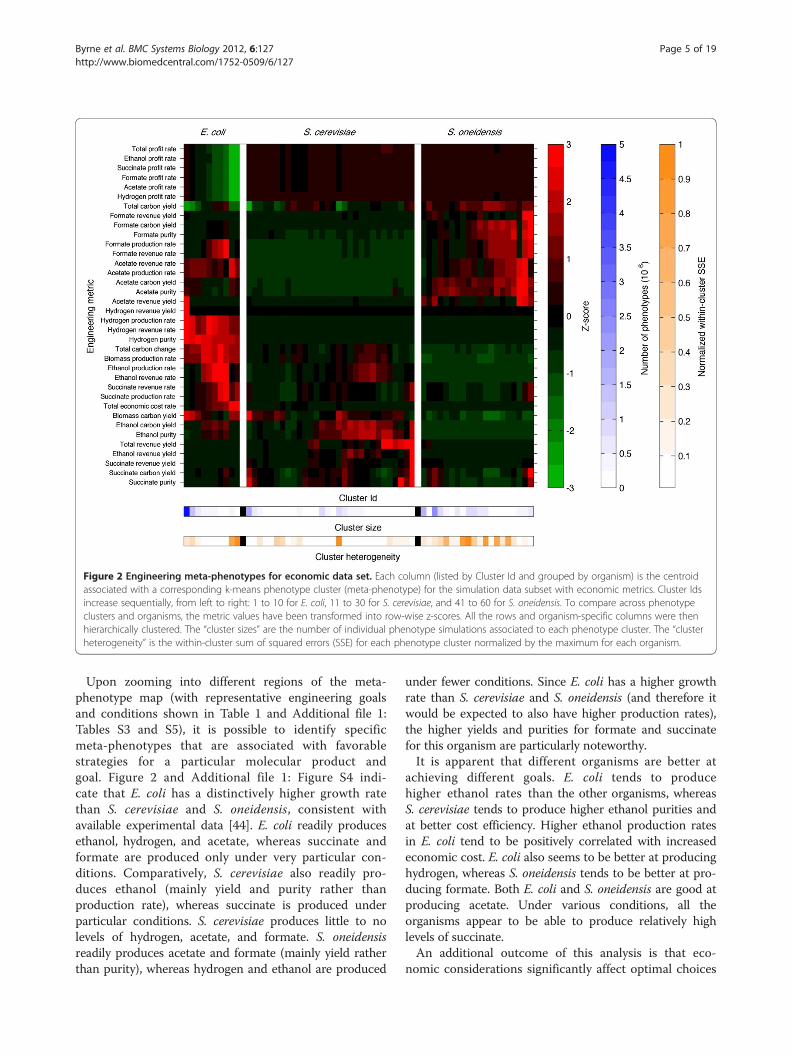
Figure 2 Engineering meta-phenotypes for economic data set. Each column (listed by Cluster Id and grouped by organism) is the centroidassociated with a corresponding k-means phenotype cluster (meta-phenotype) for the simulation data subset with economic metrics. Cluster Idsincrease sequentially, from left to right: 1 to 10 for E. coli, 11 to 30 for S. cerevisiae, and 41 to 60 for S. oneidensis. To compare across phenotypeclusters and organisms, the metric values have been transformed into row-wise z-scores. All the rows and organism-specific columns were thenhierarchically clustered. The “cluster sizes” are the number of individual phenotype simulations associated to each phenotype cluster. The “clusterheterogeneity” is the within-cluster sum of squared errors (SSE) for each phenotype cluster normalized by the maximum for each organism.
Byrne et al. BMC Systems Biology 2012, 6:127 Page 5 of 19http://www.biomedcentral.com/1752-0509/6/127
Upon zooming into different regions of the meta-phenotype map (with representative engineering goalsand conditions shown in Table 1 and Additional file 1:Tables S3 and S5), it is possible to identify specificmeta-phenotypes that are associated with favorablestrategies for a particular molecular product andgoal. Figure 2 and Additional file 1: Figure S4 indi-cate that E. coli has a distinctively higher growth ratethan S. cerevisiae and S. oneidensis, consistent withavailable experimental data [44]. E. coli readily producesethanol, hydrogen, and acetate, whereas succinate andformate are produced only under very particular con-ditions. Comparatively, S. cerevisiae also readily pro-duces ethanol (mainly yield and purity rather thanproduction rate), whereas succinate is produced underparticular conditions. S. cerevisiae produces little to nolevels of hydrogen, acetate, and formate. S. oneidensisreadily produces acetate and formate (mainly yield ratherthan purity), whereas hydrogen and ethanol are produced
under fewer conditions. Since E. coli has a higher growthrate than S. cerevisiae and S. oneidensis (and therefore itwould be expected to also have higher production rates),the higher yields and purities for formate and succinatefor this organism are particularly noteworthy.It is apparent that different organisms are better at
achieving different goals. E. coli tends to producehigher ethanol rates than the other organisms, whereasS. cerevisiae tends to produce higher ethanol purities andat better cost efficiency. Higher ethanol production ratesin E. coli tend to be positively correlated with increasedeconomic cost. E. coli also seems to be better at producinghydrogen, whereas S. oneidensis tends to be better at pro-ducing formate. Both E. coli and S. oneidensis are good atproducing acetate. Under various conditions, all theorganisms appear to be able to produce relatively highlevels of succinate.An additional outcome of this analysis is that eco-
nomic considerations significantly affect optimal choices
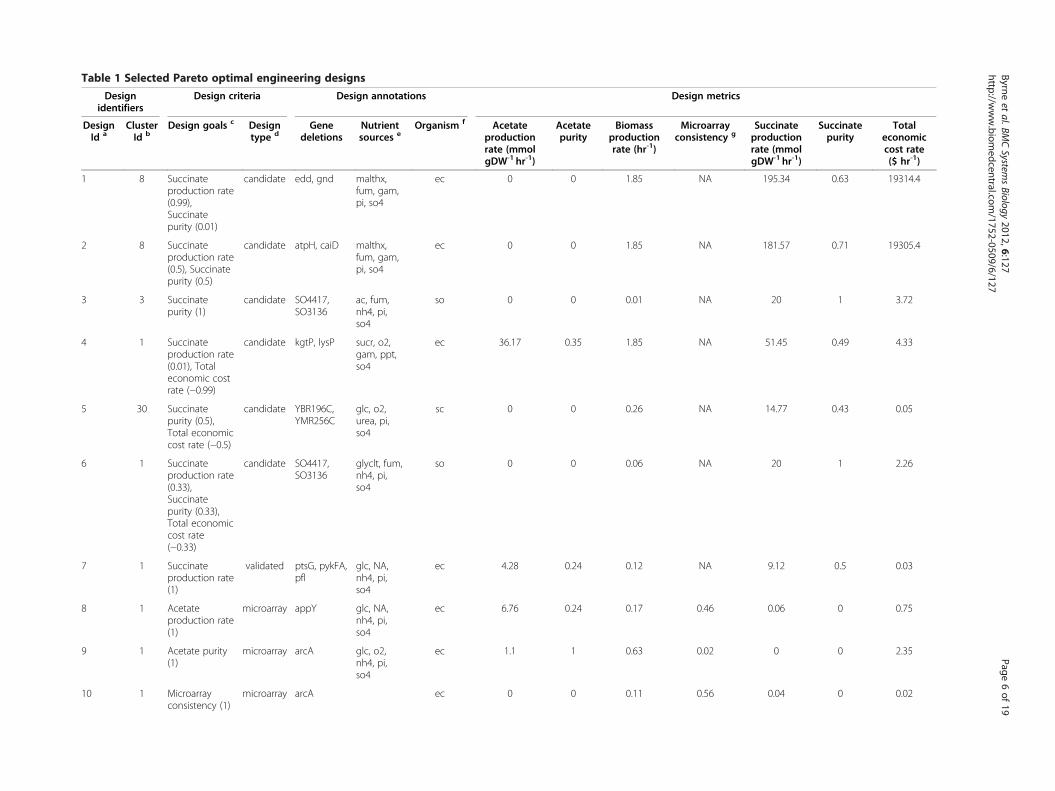
Table 1 Selected Pareto optimal engineering designs
Designidentifiers
Design criteria Design annotations Design metrics
DesignId a
ClusterId b
Design goals c Designtype d
Genedeletions
Nutrientsources e
Organism f Acetateproductionrate (mmolgDW-1 hr-1)
Acetatepurity
Biomassproductionrate (hr-1)
Microarrayconsistency g
Succinateproductionrate (mmolgDW-1 hr-1)
Succinatepurity
Totaleconomiccost rate($ hr-1)
1 8 Succinateproduction rate(0.99),Succinatepurity (0.01)
candidate edd, gnd malthx,fum, gam,pi, so4
ec 0 0 1.85 NA 195.34 0.63 19314.4
2 8 Succinateproduction rate(0.5), Succinatepurity (0.5)
candidate atpH, caiD malthx,fum, gam,pi, so4
ec 0 0 1.85 NA 181.57 0.71 19305.4
3 3 Succinatepurity (1)
candidate SO4417,SO3136
ac, fum,nh4, pi,so4
so 0 0 0.01 NA 20 1 3.72
4 1 Succinateproduction rate(0.01), Totaleconomic costrate (−0.99)
candidate kgtP, lysP sucr, o2,gam, ppt,so4
ec 36.17 0.35 1.85 NA 51.45 0.49 4.33
5 30 Succinatepurity (0.5),Total economiccost rate (−0.5)
candidate YBR196C,YMR256C
glc, o2,urea, pi,so4
sc 0 0 0.26 NA 14.77 0.43 0.05
6 1 Succinateproduction rate(0.33),Succinatepurity (0.33),Total economiccost rate(−0.33)
candidate SO4417,SO3136
glyclt, fum,nh4, pi,so4
so 0 0 0.06 NA 20 1 2.26
7 1 Succinateproduction rate(1)
validated ptsG, pykFA,pfl
glc, NA,nh4, pi,so4
ec 4.28 0.24 0.12 NA 9.12 0.5 0.03
8 1 Acetateproduction rate(1)
microarray appY glc, NA,nh4, pi,so4
ec 6.76 0.24 0.17 0.46 0.06 0 0.75
9 1 Acetate purity(1)
microarray arcA glc, o2,nh4, pi,so4
ec 1.1 1 0.63 0.02 0 0 2.35
10 1 Microarrayconsistency (1)
microarray arcA ec 0 0 0.11 0.56 0.04 0 0.02
Byrneet
al.BMCSystem
sBiology
2012,6:127Page
6of
19http://w
ww.biom
edcentral.com/1752-0509/6/127
Table 1 Selected Pareto optimal engineering designs (Continued)
glc, NA,nh4, pi,so4
11 1 Acetateproduction rate(0.33),Microarrayconsistency(0.33), Acetatepurity (0.33)
microarray appY glc, NA,nh4, pi,so4
ec 6.76 0.24 0.17 0.46 0.06 0 0.75
a Engineering designs are referenced in the text by this identifier. b Each engineering design is associated with an engineering phenotype cluster (meta-phenotype) and identified according to the “Clusters” shown inFigure 6(A) for E. coli, Additional file 1: Figure S13(A) for S. cerevisiae, and Additional file 1: Figure S14(A) for S. oneidensis. c The specified engineering design goals and weights (shown in parentheses, where positiveweights indicate goal maximization and negative weights indicate goal minimization) are used to determine the optimal engineering designs for the corresponding “Design type”. d “Validated” designs are designs thatwere experimentally validated, “microarray” designs are designs that had matching experimental microarray data, and “candidate” designs are simulated designs that are neither “validated” nor “microarray” designs.e Nutrients are ordered by nutrient type: carbon, electron acceptor, nitrogen, phosphorous, and sulfur source. “NA” indicates that no nutrient source of that type was provided. Metabolite abbreviations: ac = Acetate,fum= Fumarate, gam=D-Glucosamine, glc =D-Glucose, glu-L = L-Glutamate, glyclt = Glycolate, malthx =Maltohexoase, nh4 =Ammonium, o2 =O2, pi = Phosphate, ppt = Phosphonate, sbt-D =D-Sorbitol, so4 = Sulfate,sucr = Sucrose, urea =Urea. f Organism abbreviations: ec = Escherichia coli, sc = Saccharomyces cerevisiae, so = Shewanella oneidensis. g Engineering design simulations were compared with microarray data to computeexperimental microarray consistency. “NA” indicates that no microarray data was available for the corresponding design.
Byrneet
al.BMCSystem
sBiology
2012,6:127Page
7of
19http://w
ww.biom
edcentral.com/1752-0509/6/127
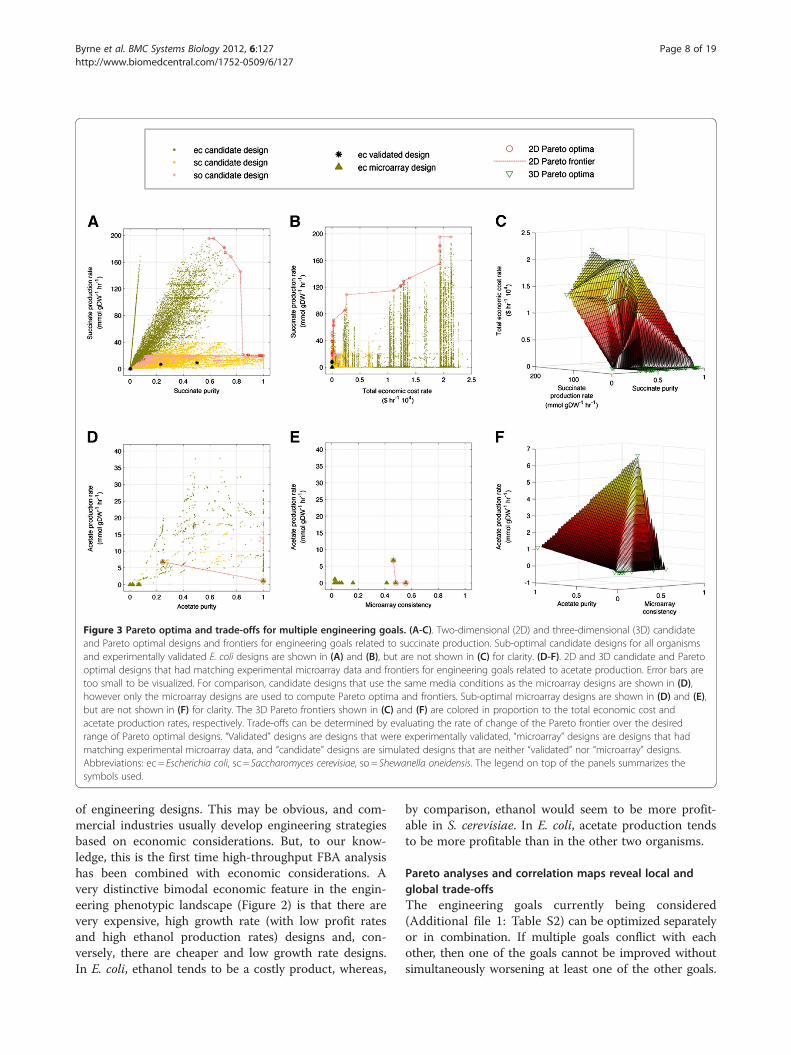
Figure 3 Pareto optima and trade-offs for multiple engineering goals. (A-C). Two-dimensional (2D) and three-dimensional (3D) candidateand Pareto optimal designs and frontiers for engineering goals related to succinate production. Sub-optimal candidate designs for all organismsand experimentally validated E. coli designs are shown in (A) and (B), but are not shown in (C) for clarity. (D-F). 2D and 3D candidate and Paretooptimal designs that had matching experimental microarray data and frontiers for engineering goals related to acetate production. Error bars aretoo small to be visualized. For comparison, candidate designs that use the same media conditions as the microarray designs are shown in (D),however only the microarray designs are used to compute Pareto optima and frontiers. Sub-optimal microarray designs are shown in (D) and (E),but are not shown in (F) for clarity. The 3D Pareto frontiers shown in (C) and (F) are colored in proportion to the total economic cost andacetate production rates, respectively. Trade-offs can be determined by evaluating the rate of change of the Pareto frontier over the desiredrange of Pareto optimal designs. “Validated” designs are designs that were experimentally validated, “microarray” designs are designs that hadmatching experimental microarray data, and “candidate” designs are simulated designs that are neither “validated” nor “microarray” designs.Abbreviations: ec = Escherichia coli, sc = Saccharomyces cerevisiae, so = Shewanella oneidensis. The legend on top of the panels summarizes thesymbols used.
Byrne et al. BMC Systems Biology 2012, 6:127 Page 8 of 19http://www.biomedcentral.com/1752-0509/6/127
of engineering designs. This may be obvious, and com-mercial industries usually develop engineering strategiesbased on economic considerations. But, to our know-ledge, this is the first time high-throughput FBA analysishas been combined with economic considerations. Avery distinctive bimodal economic feature in the engin-eering phenotypic landscape (Figure 2) is that there arevery expensive, high growth rate (with low profit ratesand high ethanol production rates) designs and, con-versely, there are cheaper and low growth rate designs.In E. coli, ethanol tends to be a costly product, whereas,
by comparison, ethanol would seem to be more profit-able in S. cerevisiae. In E. coli, acetate production tendsto be more profitable than in the other two organisms.
Pareto analyses and correlation maps reveal local andglobal trade-offsThe engineering goals currently being considered(Additional file 1: Table S2) can be optimized separatelyor in combination. If multiple goals conflict with eachother, then one of the goals cannot be improved withoutsimultaneously worsening at least one of the other goals.
Byrne et al. BMC Systems Biology 2012, 6:127 Page 9 of 19http://www.biomedcentral.com/1752-0509/6/127
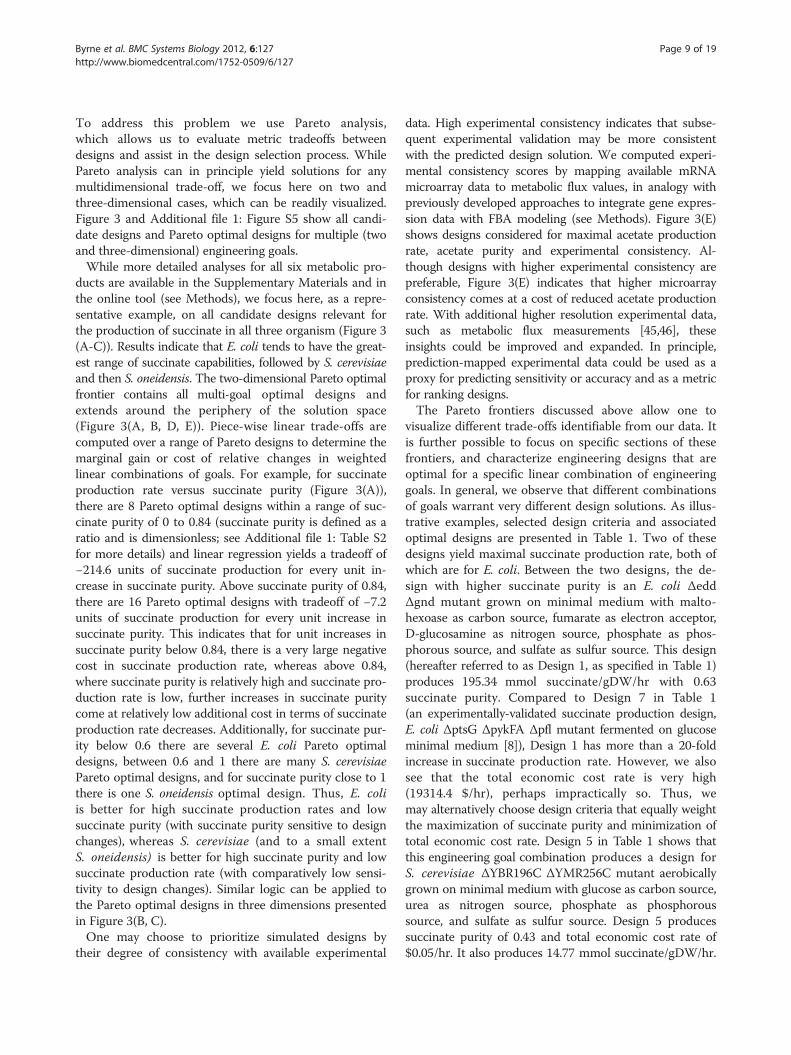
To address this problem we use Pareto analysis,which allows us to evaluate metric tradeoffs betweendesigns and assist in the design selection process. WhilePareto analysis can in principle yield solutions for anymultidimensional trade-off, we focus here on two andthree-dimensional cases, which can be readily visualized.Figure 3 and Additional file 1: Figure S5 show all candi-date designs and Pareto optimal designs for multiple (twoand three-dimensional) engineering goals.While more detailed analyses for all six metabolic pro-
ducts are available in the Supplementary Materials and inthe online tool (see Methods), we focus here, as a repre-sentative example, on all candidate designs relevant forthe production of succinate in all three organism (Figure 3(A-C)). Results indicate that E. coli tends to have the great-est range of succinate capabilities, followed by S. cerevisiaeand then S. oneidensis. The two-dimensional Pareto optimalfrontier contains all multi-goal optimal designs andextends around the periphery of the solution space(Figure 3(A, B, D, E)). Piece-wise linear trade-offs arecomputed over a range of Pareto designs to determine themarginal gain or cost of relative changes in weightedlinear combinations of goals. For example, for succinateproduction rate versus succinate purity (Figure 3(A)),there are 8 Pareto optimal designs within a range of suc-cinate purity of 0 to 0.84 (succinate purity is defined as aratio and is dimensionless; see Additional file 1: Table S2for more details) and linear regression yields a tradeoff of−214.6 units of succinate production for every unit in-crease in succinate purity. Above succinate purity of 0.84,there are 16 Pareto optimal designs with tradeoff of −7.2units of succinate production for every unit increase insuccinate purity. This indicates that for unit increases insuccinate purity below 0.84, there is a very large negativecost in succinate production rate, whereas above 0.84,where succinate purity is relatively high and succinate pro-duction rate is low, further increases in succinate puritycome at relatively low additional cost in terms of succinateproduction rate decreases. Additionally, for succinate pur-ity below 0.6 there are several E. coli Pareto optimaldesigns, between 0.6 and 1 there are many S. cerevisiaePareto optimal designs, and for succinate purity close to 1there is one S. oneidensis optimal design. Thus, E. coliis better for high succinate production rates and lowsuccinate purity (with succinate purity sensitive to designchanges), whereas S. cerevisiae (and to a small extentS. oneidensis) is better for high succinate purity and lowsuccinate production rate (with comparatively low sensi-tivity to design changes). Similar logic can be applied tothe Pareto optimal designs in three dimensions presentedin Figure 3(B, C).One may choose to prioritize simulated designs by
their degree of consistency with available experimental
data. High experimental consistency indicates that subse-quent experimental validation may be more consistentwith the predicted design solution. We computed experi-mental consistency scores by mapping available mRNAmicroarray data to metabolic flux values, in analogy withpreviously developed approaches to integrate gene expres-sion data with FBA modeling (see Methods). Figure 3(E)shows designs considered for maximal acetate productionrate, acetate purity and experimental consistency. Al-though designs with higher experimental consistency arepreferable, Figure 3(E) indicates that higher microarrayconsistency comes at a cost of reduced acetate productionrate. With additional higher resolution experimental data,such as metabolic flux measurements [45,46], theseinsights could be improved and expanded. In principle,prediction-mapped experimental data could be used as aproxy for predicting sensitivity or accuracy and as a metricfor ranking designs.The Pareto frontiers discussed above allow one to
visualize different trade-offs identifiable from our data. Itis further possible to focus on specific sections of thesefrontiers, and characterize engineering designs that areoptimal for a specific linear combination of engineeringgoals. In general, we observe that different combinationsof goals warrant very different design solutions. As illus-trative examples, selected design criteria and associatedoptimal designs are presented in Table 1. Two of thesedesigns yield maximal succinate production rate, both ofwhich are for E. coli. Between the two designs, the de-sign with higher succinate purity is an E. coli ΔeddΔgnd mutant grown on minimal medium with malto-hexoase as carbon source, fumarate as electron acceptor,D-glucosamine as nitrogen source, phosphate as phos-phorous source, and sulfate as sulfur source. This design(hereafter referred to as Design 1, as specified in Table 1)produces 195.34 mmol succinate/gDW/hr with 0.63succinate purity. Compared to Design 7 in Table 1(an experimentally-validated succinate production design,E. coli ΔptsG ΔpykFA Δpfl mutant fermented on glucoseminimal medium [8]), Design 1 has more than a 20-foldincrease in succinate production rate. However, we alsosee that the total economic cost rate is very high(19314.4 $/hr), perhaps impractically so. Thus, wemay alternatively choose design criteria that equally weightthe maximization of succinate purity and minimization oftotal economic cost rate. Design 5 in Table 1 shows thatthis engineering goal combination produces a design forS. cerevisiae ΔYBR196C ΔYMR256C mutant aerobicallygrown on minimal medium with glucose as carbon source,urea as nitrogen source, phosphate as phosphoroussource, and sulfate as sulfur source. Design 5 producessuccinate purity of 0.43 and total economic cost rate of$0.05/hr. It also produces 14.77 mmol succinate/gDW/hr.

Figure 4 Metabolic network pathway activity in E. coli. (A-C). Differential pathway activity between the wild-type E. coli grown anaerobicallyon glucose minimal media and the mutant E. coli Δedd Δgnd grown anaerobically on maltohexoase, fumarate, D-glucosamine, phosphate, andsulfate minimal media (Design 1 in Table 1). (A) The complete metabolic network map, and close-ups (regions framed by red boxes) of (B) thecitric acid cycle and (C) the lipid metabolism. Metabolic pathway reactions are color-coded according to the relative flux differences (color legendfor flux values in (C) applies to (A-C)) between the engineering designs. Similar metabolic network maps for all organisms and Pareto optimaldesigns can be viewed using the Multi-Goal Metabolic Engineering Website (Methods).
Byrne et al. BMC Systems Biology 2012, 6:127 Page 10 of 19http://www.biomedcentral.com/1752-0509/6/127
As a result, this design has comparable economic cost tothe validated E. coli ΔptsG ΔpykFA Δpfl mutant design(Design 7) [8], yet has 60% higher succinate productionrate. In general, many of the resultant designs (includingDesign 1 and Design 5) do not appear in published litera-ture and subsequent experimental validation of the simula-tion predictions will be warranted. It should be noted alsothat an effective implementation of Design 5 may be prob-lematic, as it involves the deletion of a gene (YBR196C)previously reported to be essential under similar growthconditions, probably due to regulatory effects [47].In order to obtain more biological insight about the spe-
cific designs identified, we developed a new metabolicnetwork visualization tool called Multi-Goal MetabolicEngineering (MGME) Visualizer that highlights the ac-tive fluxes for any given choice of engineering goals(Additional file 1: Figures S16 and S17 and online re-source at http://nets.bu.edu). This interactive visualization
of active fluxes makes it possible to identify potentialcausal connections between predicted phenotypes andunderlying metabolic activity. Thus, MGME Visualizerconstitutes a tool of broad practical applicability. Figure 4shows the differential pathway activity results from theMGME Visualizer for Design 1 relative to a baseline de-sign (wild-type E. coli grown fermentatively on glucoseminimal medium, which are a typical laboratory strainand feedstock, respectively). We see that many of the reac-tions have relatively high flux values, which is expectedsince there is a large influx of carbon due to the use ofmaltohexoase (36 carbons per mole) in Design 1, com-pared to glucose (6 carbons per mole) in the referencedesign. Importantly, however, while the carbon input ofDesign 1 is 7 times larger than the carbon input of stand-ard minimal medium, the predicted succinate rate increaseis more than 2000–fold, demonstrating that the pro-duction improvement observed in Design 1 is largely
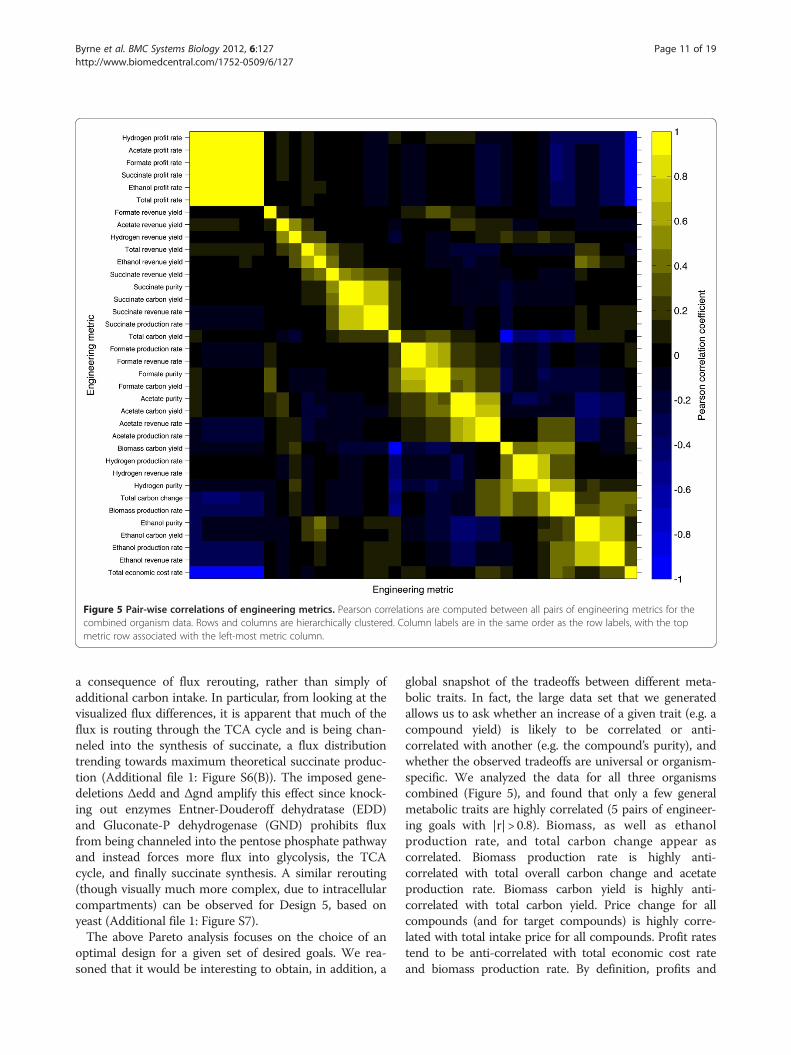
Figure 5 Pair-wise correlations of engineering metrics. Pearson correlations are computed between all pairs of engineering metrics for thecombined organism data. Rows and columns are hierarchically clustered. Column labels are in the same order as the row labels, with the topmetric row associated with the left-most metric column.
Byrne et al. BMC Systems Biology 2012, 6:127 Page 11 of 19http://www.biomedcentral.com/1752-0509/6/127
a consequence of flux rerouting, rather than simply ofadditional carbon intake. In particular, from looking at thevisualized flux differences, it is apparent that much of theflux is routing through the TCA cycle and is being chan-neled into the synthesis of succinate, a flux distributiontrending towards maximum theoretical succinate produc-tion (Additional file 1: Figure S6(B)). The imposed gene-deletions Δedd and Δgnd amplify this effect since knock-ing out enzymes Entner-Douderoff dehydratase (EDD)and Gluconate-P dehydrogenase (GND) prohibits fluxfrom being channeled into the pentose phosphate pathwayand instead forces more flux into glycolysis, the TCAcycle, and finally succinate synthesis. A similar rerouting(though visually much more complex, due to intracellularcompartments) can be observed for Design 5, based onyeast (Additional file 1: Figure S7).The above Pareto analysis focuses on the choice of an
optimal design for a given set of desired goals. We rea-soned that it would be interesting to obtain, in addition, a
global snapshot of the tradeoffs between different meta-bolic traits. In fact, the large data set that we generatedallows us to ask whether an increase of a given trait (e.g. acompound yield) is likely to be correlated or anti-correlated with another (e.g. the compound’s purity), andwhether the observed tradeoffs are universal or organism-specific. We analyzed the data for all three organismscombined (Figure 5), and found that only a few generalmetabolic traits are highly correlated (5 pairs of engineer-ing goals with |r| > 0.8). Biomass, as well as ethanolproduction rate, and total carbon change appear ascorrelated. Biomass production rate is highly anti-correlated with total overall carbon change and acetateproduction rate. Biomass carbon yield is highly anti-correlated with total carbon yield. Price change for allcompounds (and for target compounds) is highly corre-lated with total intake price for all compounds. Profit ratestend to be anti-correlated with total economic cost rateand biomass production rate. By definition, profits and

Figure 6 Perturbation effects on phenotype changes in E. coli. (A) A subset of the engineering metrics associated with E. coli phenotypeclusters (meta-phenotypes) shown in Figure 2. For values of engineering metrics (z-scores) and cluster sizes, refer to legend in Figure 2.(B) Meta-phenotype transition network for E. coli. Nodes i and j represent two viable-growth engineering meta-phenotypes (thenonviable-growth meta-phenotype is not shown). Node labels correspond to Clusters shown in (A). Node sizes are proportional to clustersizes shown in (A). Edge ti,j represents the cumulative phenotype-cluster transition frequency between Nodes i and j due to a specifiedperturbation type. Edges are bidirectional, so ti,j is equivalent to tj,i. Edge thickness is proportional to the cumulative transition frequencyfor environmental or genetic perturbations. Edges with relative frequency < 1% have been filtered out, primarily omitting low relativefrequency single and double gene-deletion perturbations. (C) Legend for meta-phenotype transition network in (B). Node faces aredivided into quadrants that correspond to the selected engineering metrics shown in (A). Quadrant colors indicate the associated metricz-scores for the corresponding Cluster. Perturbation type (edge attribute) abbreviations: C = carbon sources, EA = electron acceptor sources,N = nitrogen sources, P = phosphorous sources, S = sulfur sources, SGD = single gene deletions, and DGD= double gene deletions.
Byrne et al. BMC Systems Biology 2012, 6:127 Page 12 of 19http://www.biomedcentral.com/1752-0509/6/127
costs are inversely correlated. Additionally, economic prof-its are directly related to the over-production of desiredproducts ethanol, hydrogen, formate, or succinate. Thisover-production is typically made possible by re-routingprecursor metabolites away from biomass synthesis path-ways and towards by-product synthesis pathways. As aresult, the increased rates of targeted production tend toreduce the growth rate. In general, these conserved rela-tionships tend to reinforce our biological intuition.
Perturbation effects on engineering phenotypes aregeneralizableSo far, we focused on specific engineering goals. Toprovide an overall comparison of design strategies, weassessed the relative phenotypic effects of specific types ofenvironmental and genetic perturbations. From a practicalstandpoint, a metabolic engineer would like to know whattypes of perturbations (i.e. gene deletions or environmen-tal changes) are the most effective at inducing desirablephenotypes. To address this issue, a graph-based methodwas developed to assess the frequency at which differenttypes of perturbations induce changes in the phenotypes.
The availability of a huge number of phenotypic statesprovided the unique opportunity to explore the globalconnectivity between phenotypes. In particular, givenany two meta-phenotypes, we asked how many elem-entary changes in nutrient conditions (e.g. carbonsources) or genetic background (e.g. single gene deletions)could mediate a transition between these two phenotypes.By computing the relative frequency at which a phenotypetransitions from one meta-phenotype to another meta-phenotype, we can compare causal environmental andgenetic perturbation types.Figure 6 and Additional file 1: Figures S13 and S14
show the resultant meta-phenotype transition networksfor E. coli, S. cerevisiae, and S. oneidensis, respectively.Many interesting features are observed within and be-tween these networks. Phenotypic variation can beevaluated based on the number of meta-phenotypesfor each organism. For the 36 computed phenotypic traits,S. cerevisiae (30 meta-phenotypes) has the greatest pheno-typic variation, followed by S. oneidensis (20 meta-phenotypes) and then E. coli (10 meta-phenotypes).This comparison implies that S. cerevisiae is the most
Byrne et al. BMC Systems Biology 2012, 6:127 Page 13 of 19http://www.biomedcentral.com/1752-0509/6/127
versatile organism among the three, and can potentiallyserve a greater variety of metabolic engineering purposesassociated with the six target metabolic products (acetate,ethanol, hydrogen, formate, succinate, and D-lactate).Differences in the meta-phenotypic traits can be evalu-
ated by comparing node colors. Each node face is dividedinto quadrants associated with the four selected engineer-ing metrics: succinate production rate, succinate purity,biomass production rate, and total economic cost rate.For example, in Figure 6, meta-phenotype Nodes 9 and 10are the most economically costly, whereas Nodes 7 and 8have the highest succinate production rates. We compre-hensively analyzed Design 1 and Design 5. Table 1 showeddetails of the designs and associated phenotype ClusterIds. Design 1 is associated with Node 8 in Figure 6 andhas high succinate production rate. Design 5 is associatedwith Node 30 in Additional file 1: Figure S13 and has highsuccinate purity.Phenotypic prevalence is a measure of how common a
meta-phenotype is, given the imposed conditions. Pheno-typic prevalence is represented by node size, which isscaled by phenotype cluster size. We see that both Designs1 and 5 are phenotypes associated with less prevalentmeta-phenotypes. Node 1 in Figure 6 is the largest, andthus most common meta-phenotype for E. coli. We cansimilarly evaluate the distribution of phenotypic preva-lence for each organism. The distribution for E. coli isthe most skewed and, thus, the majority of E. coliphenotypes are associated with a few meta-phenotypes,whereas the distribution is comparatively more uniformfor S. cerevisiae and S. oneidensis. Together with pheno-typic variation, this further shows that for the studiedtraits E. coli has few overall dominant phenotypes and asingle super-dominant meta-phenotype.Some phenotypes are innately more robust or sensitive
to different types of perturbations. Self-loops indicatethe robustness of the phenotype cluster to genetic orenvironmental perturbations, whereas the thick edgesbetween meta-phenotypes indicate that those pheno-types are sensitive to the considered type of perturbation.In Figure 6, phenotypes are generally robust againstchanges in electron acceptors but are relatively moresensitive to changes in carbon or nitrogen sources.Design 1 (associated with Node 8 in Figure 6) is rela-tively robust to changes in phosphorous sources, butmore sensitive to carbon and nitrogen sources andsingle gene-deletions.Network edges can be used to determine global transi-
tions between meta-phenotypes. For example, Node 8(meta-phenotype associated with Design 1) is connectedto Nodes 6, 7, and 10 by nitrogen source perturbationsand to Node 3 by carbon source perturbations. Thus,Node 8 is more closely related to those nodes and it iseasier (i.e. fewer perturbations of those types are required)
to transition between those nodes than between the othernodes that it is not connected to.Interestingly, the different patterns of connectivity
found in meta-phenotype graphs for different organismssuggest that, broadly speaking, the metabolic usefulnessof different organisms may be best assessed throughdifferent types of perturbation analyses. Additional file 1:Figure S15 shows the relative perturbation influences onglobal phenotype changes. It is apparent that carbonand nitrogen source perturbations have the greatestrelative effect on changes in phenotype in E. coli,whereas S. cerevisiae, and S. oneidensis are more uniformlysensitive to all types of environmental and genetic per-turbations analyzed. Thus, if one is trying to perturbthe E. coli metabolism, one might preferentially designcarbon and nitrogen source perturbations.
DiscussionWe presented a high-throughput computational frame-work for generating and exploring an exhaustive land-scape of in silico perturbations and metabolic engineeringdesigns. Each design condition consists of an environment(medium composition), an organism (Escherichia coli,Saccharomyces cerevisiae, or Shewanella oneidensis) and agenotype (set of gene deletions). The vast population ofthe resultant design solutions produces a contextualizedphenotypic map that is used to evaluate relationshipsbetween engineering goals and fundamental biologicalnetwork properties. Using a set of metabolic traits, thelarge number of metabolic phenotypes is clustered intodominant meta-phenotypes. Whereas individual pheno-types are used to evaluate localized design considerations,causal biological mechanisms and design tradeoffs, themeta-phenotypes are used to evaluate global phenotypicdiversity and relationships between metabolic traits andperturbation strategies. The proposed approach can helpunderstand how environmental and genetic factors influ-ence metabolism and metabolic engineering design.A single unique optimal design solution may suffice
for a single distinct set of weighted engineering goals.The resultant phenotypic map provides a regional andglobal context for this design solution relative to allother designs. If, for example, the exact values of theweights associated with the importance of the engineer-ing goals are uncertain, we show that, by using the map,sub-optimal designs located in the proximity of optimal-ity can be evaluated to assess the sensitivity of thoseweights. A designer can then assess whether or not itmight be desirable to reprioritize engineering goals. Byanalogy, instead of having a single travel destination andnavigational route to that destination, a map is very use-ful for assessing alternative destinations and routes thatmay, upon further inspection, be deemed more desirablethan the original one.
Byrne et al. BMC Systems Biology 2012, 6:127 Page 14 of 19http://www.biomedcentral.com/1752-0509/6/127
Prior metabolic engineering studies have primarilyfocused on a single organism, engineering application, en-vironment or genetic perturbation strategy, and optimaldesign solution. However, different organisms have differ-ent metabolic capabilities, due to diverse environmentaladaptations and biochemical wiring. Thus, the inter-dependencies between the desirable organism, engineeringapplication and design strategy are often unclear a priori.Here, we extended prior approaches by comparing organ-isms and systematically evaluating both environmental andgenetic perturbation strategies. We illustrated inherentdifferences in the metabolic capabilities and phenotypicvariations of E. coli, S. cerevisiae and S. oneidensis. Toaccount for important economic considerations, we devel-oped a methodology for integrating economic data. Fur-thermore, we showed that preexisting experimental datacan be readily incorporated to help rank designs by howlikely they are to be accurately reproduced experimentally.After initial compilation of the phenotype population
dataset, multiple complex combinatorial optimization pro-blems can be solved (e.g. Pareto optimality design analysis).There is no restriction in terms of linearity or nonlinearityof metabolic traits and, if an engineering goal needs to bechanged, there is no need to re-compute the phenotypedataset; one just needs to redefine the corresponding func-tion and re-query the data. There are, however, limitations.For example, prediction accuracy of the metabolic designsis limited by the accuracy of the underlying models. Thus,accuracy can be further improved by improving the models(e.g. incorporating additional biological mechanisms, suchas transcriptional regulation). Searching the design param-eter space is also limited by the combinatorial nature ofthis “brute-force” approach. Here, we evaluated a compre-hensive, but limited, subset of the theoretically infinitenumber of genetic and environmental parameter valuesand combinations. Simulating and processing the 435million conditions took approximately 4 weeks of CPUtime (see Methods for more details). By further optimizingthe underlying programming code and by incorporatingadditional computing processors, the overall compute-time could be significantly reduced and many additionalorganisms and design strategies could be evaluated.Nevertheless, since an exhaustive search of the completeparameter space is not possible, prior knowledge will beuseful in deciding which regions and level of granularityof the parameter space to explore.Compared to other optimization approaches, our method
potentially sacrifices depth (e.g. looking at triple andmultiple knockouts) in favor of breadth (i.e. obtaining asnapshot of behaviors across an unprecedented number ofperturbations and environments). Future studies mayseek to further compare and contrast the spectrum ofperturbation strategies to assess the advantages andlimitations of each. For example, methods that can infer
optimal combinations of more than two gene additions ordeletions [19,41] could be preceded by broad surveysacross multiple organisms. In addition, our approachcould provide useful preliminary indication of the suit-ability of specific organisms for nonlinear objectivesthat may not be easily addressed through other avail-able optimization approaches.We would like to highlight that the biological details of
our results can be conveniently accessed and visualizedthrough the online tool that we present as part of thiswork. This tool is currently tied to predefined criteria forthe choice of designs and engineering goals. However, fu-ture elaborations of our approach and of this tool couldeasily relax the existing constraints, for example includingweights for the importance of different objectives, andthresholds for levels of acceptable violations of specificconstraints. In addition, the process could be transformedinto an iterative one, where an initial query throughoutthe entire space could be followed by a user-definedchoice of specific criteria, which would lead to a deepersearch in a restricted region of the space.Furthermore, while in the current work we focus
mainly on the metabolic phenotypes relevant for meta-bolic engineering applications, a different type of analysiscould provide complementary insight on the biologicalaspects of the data presented. For example, it would beinteresting to understand, for each meta-phenotype,whether it can be associated with specific environmen-tal or genetic properties (e.g. limitation of a specificnutrient). This type of analysis would require revisitingour large data set (i.e. the meta-phenotypes shown inAdditional file 2: Table S4, and the complete list of designsthey comprise, available online, see Methods), in searchfor meaningful biological patterns.
ConclusionsGiven the increasing number of sequenced genomes,improved model accuracy and the growing availablecomputing power, it is foreseeable that future extensionsof our approach could help address a growing range ofbiological questions and engineering applications. Rapidgrowth of industrial biotechnology is helping to drivedemand for a widening range of products, such as com-modity chemicals (e.g., succinic acid and ethanol), finechemicals (e.g. 6-aminopenicillanic acid and otherantibiotics), and specialty chemicals (e.g., food andfeed additives) [48]. In many application areas, how-ever, production output of cellular factories falls signifi-cantly short of what is theoretically possible and may beinsufficient for practical implementation. Systems engin-eering methods, including the approach presented, holdgreat promise in overcoming current engineering limita-tions and design challenges [1-3]. The exhaustive strategywe have explored, while combinatorially limited, enables
Byrne et al. BMC Systems Biology 2012, 6:127 Page 15 of 19http://www.biomedcentral.com/1752-0509/6/127
complex searches across nonlinear objectives and mul-tiple species, complementing other optimization methods,and providing a global portrait of the landscape of possiblemetabolic phenotypes.
MethodsConstraint-based modelingThe general equations describing the dynamics of a meta-bolic network can be written as
ddt
C ¼ Ax� μC ð1Þ
where C (mol/L) is the concentration vector of m internalmetabolites, x (mol/L/h) is the reaction rate (flux) vectorof n reactions, A is the stoichiometry matrix of dimensionm×n whose elements aij represent the stoichiometric coef-ficient of the element i involved in reaction j, and μ (1/h) isthe specific dilution rate associated with the change in vol-ume of the system. At steady state there is no accumulationof internal metabolites in the system [49] and Equation (1)can be simplified to Ax=0. Additionally, due to thermo-dynamic restrictions, some reactions can effectively be con-sidered irreversible leading to additional contraints of thetype xi≥0.Flux balance analysis (FBA) is a method for predinct-
ing steady state reaction rates in a metabolic network[16]. Additional linear constraints are included to setupper and lower bounds on individual fluxes (αi ≤ xi ≤ βi)and are often used to impose maximal nutrient uptakerates. Upon choosing a linear objective function f(x) tobe optimized, linear programming (LP) [50] is used toidentify a solution subject to the constraints:
max f xð Þs:t: Ax ¼ 0αi ≤ xi ≤ βi
ð2Þ
An objective function that is commonly used for micro-bial systems is the maximization of biomass formation[51] (see Equation 3). To simulate changes in nutrientcomposition or gene-deletion effects over a range of par-ameter values, parameters αi and βi in the LP problem(Equation 2) can be iteratively modified (e.g., both set tozero to stimulate a gene knockout) and the problemsolved again to obtain a new solution vector x. While thisnew solution achieves max f(x), the engineering objective(e.g. maximization of target-compound synthesis orminimization of media cost) may be suboptimal.The genome-scale metabolic models for E. coli [52],
S. cerevisiae [53], and S. oneidensis [44] are used to enu-merate over a comprehensive set of feedstock mediumcompositions and single and double gene deletions. Thenutrient and gene-deletion parameter space that isexplored is described in Additional file 1: Table S1. Single
and double gene-deletions are chosen from the genesassociated with the citric acid cycle, glycolysis, gluconeo-genesis, oxidative phosphorylation, pentose phosphate,and pyruvate metabolism pathways.Medium nutrients are first categorized as carbon, elec-
tron acceptor, nitrogen, phosphate, or sulfur sources(progressively and exclusively, in that order) to enu-merate all nutrient and gene-deletion combinations. Theresultant candidate designs are then screened and selectedto optimize for one or several specified engineering objec-tives. Upper bounds to nutrient uptake rates are com-puted based on the standard rates found in the literature[13,14,32,54]. Biomass production is incorporated as anadditional reaction,
X
i
dizi ! 1 biomass ð3Þ
where the stoichiometric coefficient di corresponds tothe experimentally measured contribution of biomasscomponent zi to biomass [51]. To quantify the engin-eering value of metabolic states under the various con-ditions, engineering metrics are defined as listed inAdditional file 1: Table S2. Values for maximum theor-etical engineering goals are computed using FBA(Equation (2)) using the engineering metrics themselvesas objectives to be either maximized or minimized, ra-ther than the objective function expressed in Equation(3). Linear programming is implemented using theGNU Linear Programming Kit software [55]. Data pro-cessing is implemented as a distributed process run ona computing cluster with 192 processor dual-dual core2.8 Ghz computer nodes.
Metabolic traitsMetabolic traits are defined in Additional file 1: TableS1. Final titer is typically measured as a concentration.However, it may alternatively be thought of as a ratio ofthe target product to the total by-products being pro-duced (i.e. titer ratio).Reagent prices were compiled from Sigma-Aldrich
Corporation’s website http://www.sigmaaldrich.com/on May 10, 2011. The nutrient unit prices ($/g) werecomputed using the largest reagent allotment sizeavailable and nutrient cost rates were computed as aproduct of the nutrient unit price, molecular weight,and flux:
$g� gmol
�mmolhr
� mol1000 mmol
Unit prices for some nutrients were not available.Approximately 23% of the simulated medium composi-tions included one or more nutrients that did not havean assigned nutrient unit price. Additional file 1: Figures
Byrne et al. BMC Systems Biology 2012, 6:127 Page 16 of 19http://www.biomedcentral.com/1752-0509/6/127
S2 and S4 show the results for all simulations. All otherfigures contain economic metric data based on nutrientunit prices and, therefore, omit those simulations withmissing unit price data.To evaluate how closely the simulated phenotype and
pathway activity predictions correspond to the experimen-tal values, a metric for experimental consistency is com-puted using a method called Gene Inactivity Moderated byMetabolism and Expression (GIMME) [56]. The GIMMEalgorithm provides a quantitative consistency score thatindicates how consistent a set of gene expression data iswhen compared to a simulated flux solution under similarconditions. A set of 149 Affymetrix microarrays for E. coli,processed using GC-RMA [57], was gathered [56]. Thismethod evaluates how closely the pathway activity, as mea-sured by microarray gene expression, matches the simu-lated pathway flux activity.
Meta-phenotypesA combination of the computed metabolic traits canbe considered a complex engineering phenotype. Theengineering phenotypes across all the possible designscomputed with FBA can be clustered into “meta-phenotypes” based on the similarity of their vectors.K-means clustering [58] was used with 10 seeds andup to 100 iterations to assign the engineering pheno-types into clusters that minimize the within-clusteraverage square-error:
E ¼ 1n
Xk
i¼1
X
x2Ci
x�mið Þ2
where mi=mean of cluster Ci and n=number of objec-tives in the dataset. To find the optimal number ofclusters, the gap statistic [59] is used to compare within-cluster dispersions in the observed data to expectedwithin-cluster dispersions in data generated from a nulldistribution when the deviation is maximized. Thismethod, designed to be applicable to any cluster techniqueand distance measure, is in wide use [60-62]. We foundthat our optimal cluster numbers are fairly robust, par-ticularly for the economic dataset discussed in the maintext (Additional file 1: Figure S3B), where the deviation issignificantly less for one cluster more or less than thecomputed optimal number of clusters.To compare engineering metric values across meta-
phenotypes, a z-score is computed as
yi � �yð Þσ
where yi is meta-phenotype i, �y is the average meta-phenotype vector and σ is the meta-phenotype standarddeviation. Instructions for downloading the phenotype
metric data and conditions and associated meta-phenotypesmapping are available at http://nets.bu.edu/about.
Pareto optimal designs and trade-offsMulti-goal optimization (also known as multi-objectiveoptimization) is the process of simultaneously optimiz-ing two or more conflicting goals (or objectives) subjectto a set of constraints [63-65]. In our study, we have avector of engineering goals f(v) = [f1(v),f2(v),. . .fm(v)],where v is the vector of computed engineering metricsshown in Table S2. The associated multi-goal optimizationproblem is min f (v), bounded by the discrete set of avail-able solutions. Each solution corresponds to a metabolicengineering design candidate (or multiple candidates ifthey have identical engineering phenotypes). If the individ-ual goals in f (v) do not conflict, then it is possible to finda unique optimal solution. However, if the individual goalsin f (v) do conflict, then a unique solution will not exist.Instead, there will be a set of Pareto solutions. If a change(or tradeoff) in one of the solutions improves one goalwithout making another goal any worse, then that changeis called a Pareto improvement and the initial solution iscalled dominated. If the subsequent solution is such thatan improvement in one goal requires degradation inanother goal, then that solution is called nondominatedand is Pareto optimal. The set of Pareto optimal solutionsis often called the Pareto frontier.To determine the Pareto optimal designs and frontiers in
our study, we use a Pareto-compliant method called Non-dominated Sorting Genetic Algorithm II (NSGA-II) [66].This method, widely used in prior research [25,67-69],incorporates a genetic algorithm and a ranking procedureto select nondominated solutions. Specifically, we used theMatlab function gamultiobj, from the Global OptimizationToolbox. We feed into the function our set of engineeringgoals, f(v), and obtain as a result the set of Pareto optimaldesigns. The parameter values that we used are 500maximum number of generations, population size of 100chromosomes, 0.85 probability of crossover, 0.05 probabil-ity of mutation, distribution index of 10 for simulatedcrossover, distribution index of 20 for simulated mutationand a random seed of 0.6. Prior studies showed that theseparameter values are generally satisfactory [25,68] and wefound that our results were not significantly sensitive tochanges in these values. Subsequent Pareto tradeoff ana-lysis (i.e. determining marginal gain or cost of relativechanges in weighted linear combinations of goals) is com-puted using piece-wise linear differences between thePareto designs associated with particular Pareto frontiers.
Meta-phenotype transition networkTransition frequencies are computed by varying a singleindividual perturbation type (carbon, electron acceptor,nitrogen, phosphorous, and sulfur sources and single
Byrne et al. BMC Systems Biology 2012, 6:127 Page 17 of 19http://www.biomedcentral.com/1752-0509/6/127
and double gene deletions), while maintaining fixedthe remaining perturbation types. Environmental pertur-bations are imposed by changing the absence or presenceof a nutrient in the medium (as described in the Methods“Constraint-based modeling” subsection), whereas geneticperturbations are imposed by deleting single or doublegenes. A resultant meta-phenotype transition network canbe generated such that Nodes i and j represent two viable-growth engineering phenotype clusters. Edge ti,j representsthe cumulative phenotype-cluster transition frequencybetween Nodes i and j due to either environmental pertur-bations or genetic perturbations. Node 0 represents thenonviable-growth phenotype. Thus, edges ti,0 and tj,0 repre-sent the cumulative phenotype-cluster transition fre-quencies to the nonviable-growth phenotype due toperturbations. Edges are bidirectional, so ti,j is equiva-lent to tj,i. Edge thickness is proportional to the cu-mulative transition frequency for environmental orgenetic perturbations. By performing this analysis system-atically for all meta-phenotypes, we obtained a network ofmeta-phenotype transitions for each organism E. coli,S. cerevisiae, and S. oneidensis. Because the non-viablemeta-phenotype is the sum of all possible non-viable phe-notypes, it is comparatively extremely large and wouldeffectively dwarf all viable meta-phenotype nodes. Thus,the non-viable meta-phenotype is not shown or includedin the figures and results presented.
Multi-goal Metabolic Engineering VisualizerA public website (Additional file 1: Figures S16 and S17),located at http://nets.bu.edu, was developed to make avail-able the optimal metabolic engineering design results. Thewebsite provides an interface that may be used to submitcustomized search queries, choose engineering designs, andinteract with resultant metabolic network visualizations.From the website’s main page (Additional file 1:
Figure S16), a user can choose from a list of organisms,target products, and engineering goals. Based on selectedoptimization criteria, the website generates a list of meta-bolic engineering designs. If multiple engineering goalsare selected, then a resultant set of Pareto optimal designsare tabulated where one can compare alternative designswith competing metric values. The user may click on anyone of the designs to generate a metabolic network mapthat has corresponding metabolic pathways and reactionscolor-coded by flux values. The map can be panned,zoomed, and searched. Other map features include click-able nodes and edges for obtaining additional informationabout metabolites and reactions.An online tutorial for the website (Additional file 1:
Figure S17) is located at http://nets.bu.edu/about. Alter-natively, the tutorial can be obtained by clicking “Help”on the website’s main page. The tutorial explains theprocess of defining engineering optimization criteria,
selecting resultant designs and visualizing metabolic path-way activity.
Additional files
Additional file 1: Supplementary Information. Tables S1, S2, S3, S5and Figures S1-S18.
Additional file 2: Supplementary Information. Table S4 (Tabulatedversion of Figure 2).
Abbreviationsec/E. coli: Escherichia coli; EDD: Douderoff dehydratase; FBA: Flux balanceanalysis; GC-RMA: GC Robust Multi-array Average; gDW: Gram dry weight;GIMME: Gene Inactivity Moderated by Metabolism and Expression;GND: Gluconate-P dehydrogenase; LP: Linear programming; MGME: Multi-Goal Metabolic Engineering; sc/S. cerevisiae: Saccharomyces cerevisiae; so/S.oneidensis: Shewanella oneidensis; TCA: Tricarboxylic acid cycle.
Competing interestsThe authors declare that they have no conflict of interest.
Authors’ contributionsDB conceived and designed the study. DB and AD generated the data andperformed the statistical analyses. DB and DS interpreted the results andwrote the manuscript. DS supervised the project. All authors edited andapproved the final version of the manuscript.
AcknowledgementsWe are thankful for helpful conversations with Timothy Gardner andmembers of the Segrè lab. DB was supported by a fellowship from NationalScience Foundation Integrative Graduate Education and ResearchTraineeship grant 0654108. DB and DS were supported by grants from NIH(5R01GM089978-02) and the Office of Science (BER) of the US Department ofEnergy (DE-FG02-07ER64388).
Author details1Bioinformatics Program, Boston University, Boston, MA 02215, USA.2Department of Biology, Boston University, Boston, MA 02215, USA.3Department of Biomedical Engineering, Boston University, Boston, MA02215, USA.
Received: 29 April 2012 Accepted: 29 August 2012Published: 26 September 2012
References1. Keasling JD: Manufacturing molecules through metabolic engineering.
Science 2010, 330:1355–1358.2. Kim I-K, Roldão A, Siewers V, Nielsen J: A systems-level approach for
metabolic engineering of yeast cell factories. FEMS Yeast Res 2011,12:228–248.
3. Lee JW, Kim TY, Jang Y-S, Choi S, Lee SY: Systems metabolic engineeringfor chemicals and materials. Trends Biotechnol 2011, 29:370–378.
4. Millard CS, Chao YP, Liao JC, Donnelly MI: Enhanced production of succinicacid by overexpression of phosphoenolpyruvate carboxylase inescherichia coli. Appl Environ Microbiol 1996, 62:1808–1810.
5. Stols L, Donnelly MI: Production of succinic acid through overexpressionof NAD(+)-dependent malic enzyme in an escherichia coli mutant. ApplEnviron Microbiol 1997, 63:2695–2701.
6. Hong SH, Lee SY: Metabolic flux analysis for succinic acid production byrecombinant escherichia coli with amplified malic enzyme activity.Biotechnol Bioeng 2001, 74:89–95.
7. Bunch PK, Mat-Jan F, Lee N, Clark DP: The ldhA gene encoding thefermentative lactate dehydrogenase of escherichia coli. Microbiology(Reading, Engl) 1997, 143(Pt 1):187–195.
8. Lee SJ, Lee D-Y, Kim TY, Kim BH, Lee J, Lee SY: Metabolic engineering ofescherichia coli for enhanced production of succinic acid, based ongenome comparison and in silico gene knockout simulation. Appl EnvironMicrobiol 2005, 71:7880–7887.

Byrne et al. BMC Systems Biology 2012, 6:127 Page 18 of 19http://www.biomedcentral.com/1752-0509/6/127
9. Price ND, Reed JL, Palsson B�: Genome-scale models of microbial cells:evaluating the consequences of constraints. Nat Rev Microbiol 2004,2:886–897.
10. Jarboe LR, Zhang X, Wang X, Moore JC, Shanmugam KT, Ingram LO:Metabolic engineering for production of biorenewable fuels andchemicals: contributions of synthetic biology. J Biomed Biotechnol 2010,2010:761042.
11. Tang YJ, Meadows AL, Keasling JD: A kinetic model describing shewanellaoneidensis MR-1 growth, substrate consumption, and product secretion.Biotechnol Bioeng 2007, 96:125–133.
12. Segrè D, Zucker J, Katz J, Lin X, D’haeseleer P, Rindone WP, Kharchenko P,Nguyen DH, Wright MA, Church GM: From annotated genomes to metabolicflux models and kinetic parameter fitting. OMICS 2003, 7:301–316.
13. Edwards JS, Palsson BO: Metabolic flux balance analysis and the in silicoanalysis of escherichia coli K-12 gene deletions. BMC Bioinforma 2000, 1:1.
14. Edwards JS, Ibarra RU, Palsson BO: In silico predictions of escherichia colimetabolic capabilities are consistent with experimental data. NatBiotechnol 2001, 19:125–130.
15. Famili I, Forster J, Nielsen J, Palsson BO: Saccharomyces cerevisiaephenotypes can be predicted by using constraint-based analysis of agenome-scale reconstructed metabolic network. Proc Natl Acad Sci U S A2003, 100:13134–13139.
16. Orth JD, Thiele I, Palsson B�: What is flux balance analysis? Nat Biotechnol2010, 28:245–248.
17. Suthers PF, Zomorrodi A, Maranas CD: Genome-scale gene/reactionessentiality and synthetic lethality analysis. Mol Syst Biol 2009, 5:301.
18. Kim J, Reed JL, Maravelias CT: Large-scale bi-level strain designapproaches and mixed-integer programming solution techniques.PLoS One 2011, 6:e24162.
19. Burgard AP, Pharkya P, Maranas CD: Optknock: a bilevel programmingframework for identifying gene knockout strategies for microbial strainoptimization. Biotechnol Bioeng 2003, 84:647–657.
20. Pharkya P, Maranas CD: An optimization framework for identifyingreaction activation/inhibition or elimination candidates foroverproduction in microbial systems. Metab Eng 2006, 8:1–13.
21. Ranganathan S, Suthers PF, Maranas CD: OptForce: an optimizationprocedure for identifying all genetic manipulations leading to targetedoverproductions. PLoS Comput Biol 2010, 6:e1000744.
22. Price ND, Reed JL, Papin JA, Famili I, Palsson BO: Analysis of metaboliccapabilities using singular value decomposition of extreme pathwaymatrices. Biophys J 2003, 84:794–804.
23. Price ND, Schellenberger J, Palsson BO: Uniform sampling of steady-stateflux spaces: means to design experiments and to interpretenzymopathies. Biophys J 2004, 87:2172–2186.
24. Oh Y-G, Lee D-Y, Lee SY, Park S: Multiobjective flux balancing using theNISE method for metabolic network analysis. Biotechnol Prog 2009,25:999–1008.
25. Lee FC, Pandu Rangaiah G, Lee D-Y: Modeling and optimization of amulti-product biosynthesis factory for multiple objectives. Metab Eng2010, 12:251–267.
26. Schuetz R, Zamboni N, Zampieri M, Heinemann M, Sauer U:Multidimensional Optimality of Microbial Metabolism. Science 2012,336:601–604.
27. Shanmugam KT, Ingram LO: Engineering biocatalysts for production ofcommodity chemicals. J Mol Microbiol Biotechnol 2008, 15:8–15.
28. Bro C, Regenberg B, Förster J, Nielsen J: In silico aided metabolicengineering of saccharomyces cerevisiae for improved bioethanolproduction. Metab Eng 2006, 8:102–111.
29. Otero JM, Panagiotou G, Olsson L: Fueling industrial biotechnologygrowth with bioethanol. Adv Biochem Eng Biotechnol 2007, 108:1–40.
30. Waks Z, Silver PA: Engineering a synthetic dual-organism system forhydrogen production. Appl Environ Microbiol 2009, 75:1867–1875.
31. Meshulam-Simon G, Behrens S, Choo AD, Spormann AM: Hydrogenmetabolism in shewanella oneidensis MR-1. Appl Environ Microbiol 2007,73:1153–1165.
32. Fong SS, Burgard AP, Herring CD, Knight EM, Blattner FR, Maranas CD,Palsson BO: In silico design and adaptive evolution of escherichia coli forproduction of lactic acid. Biotechnol Bioeng 2005, 91:643–648.
33. Cox SJ, Shalel Levanon S, Sanchez A, Lin H, Peercy B, Bennett GN, San K-Y:Development of a metabolic network design and optimization
framework incorporating implementation constraints: a succinateproduction case study. Metab Eng 2006, 8:46–57.
34. Zeikus JG, Jain MK, Elankovan P: Biotechnology of succinic acidproduction and markets for derived industrial products. Appl MicrobiolBiotechnol 1999, 51:545–552.
35. Branduardi P, Smeraldi C, Porro D: Metabolically engineered yeasts:“potential” industrial applications. J Mol Microbiol Biotechnol 2008,15:31–40.
36. Varma A, Boesch BW, Palsson BO: Biochemical production capabilities ofescherichia coli. Biotechnol Bioeng 1993, 42:59–73.
37. Fredrickson JK, Romine MF, Beliaev AS, Auchtung JM, Driscoll ME, Gardner TS,Nealson KH, Osterman AL, Pinchuk G, Reed JL, Rodionov DA, Rodrigues JLM,Saffarini DA, Serres MH, Spormann AM, Zhulin IB, Tiedje JM: Towardsenvironmental systems biology of shewanella. Nat Rev Microbiol 2008,6:592–603.
38. Heidelberg JF, Paulsen IT, Nelson KE, Gaidos EJ, Nelson WC, Read TD, Eisen JA,Seshadri R, Ward N, Methe B, Clayton RA, Meyer T, Tsapin A, Scott J, Beanan M,Brinkac L, Daugherty S, DeBoy RT, Dodson RJ, Durkin AS, Haft DH, Kolonay JF,Madupu R, Peterson JD, Umayam LA, White O, Wolf AM, Vamathevan J,Weidman J, Impraim M, Lee K, Berry K, Lee C, Mueller J, Khouri H, Gill J,Utterback TR, McDonald LA, Feldblyum TV, Smith HO, Venter JC, Nealson KH,Fraser CM: Genome sequence of the dissimilatory metal ion-reducingbacterium shewanella oneidensis. Nat Biotechnol 2002, 20:1118–1123.
39. Lovley DR: The microbe electric: conversion of organic matter toelectricity. Curr Opin Biotechnol 2008, 19:564–571.
40. Lun DS, Rockwell G, Guido NJ, Baym M, Kelner JA, Berger B, Galagan JE,Church GM: Large-scale identification of genetic design strategies usinglocal search. Mol Syst Biol 2009, 5:296.
41. Patil KR, Rocha I, Förster J, Nielsen J: Evolutionary programming as aplatform for in silico metabolic engineering. BMC Bioinforma 2005, 6:308.
42. Xu P, Ranganathan S, Fowler ZL, Maranas CD, Koffas MAG: Genome-scalemetabolic network modeling results in minimal interventions thatcooperatively force carbon flux towards malonyl-CoA. Metab Eng 2011,13:578–587.
43. Brochado AR, Matos C, Møller BL, Hansen J, Mortensen UH, Patil KR:Improved vanillin production in baker’s yeast through in silico design.Microb Cell Fact 2010, 9:84.
44. Pinchuk GE, Hill EA, Geydebrekht OV, De Ingeniis J, Zhang X, Osterman A,Scott JH, Reed SB, Romine MF, Konopka AE, Beliaev AS, Fredrickson JK, Reed JL:Constraint-based model of shewanella oneidensis MR-1 metabolism: a toolfor data analysis and hypothesis generation. PLoS Comput Biol 2010,6:e1000822.
45. Sauer U: Metabolic networks in motion: 13C-based flux analysis. Mol SystBiol 2006, 2:62.
46. Yuan J, Bennett BD, Rabinowitz JD: Kinetic flux profiling for quantitationof cellular metabolic fluxes. Nat Protoc 2008, 3:1328–1340.
47. Aguilera A: Deletion of the phosphoglucose isomerase structural genemakes growth and sporulation glucose dependent in saccharomycescerevisiae. Mol Gen Genet 1986, 204:310–316.
48. Gavrilescu M, Chisti Y: Biotechnology-a sustainable alternative forchemical industry. Biotechnol Adv 2005, 23:471–499.
49. Clarke BL: Stoichiometric network analysis. Cell Biophys 1988, 12:237–253.50. Bertsimas D, Tsitsiklis JN: Introduction to Linear Optimization. New
Hampshire: Athena Scientific; 1997.51. Feist AM, Palsson BO: The biomass objective function. Curr Opin Microbiol
2010, 13:344–349.52. Feist AM, Henry CS, Reed JL, Krummenacker M, Joyce AR, Karp PD,
Broadbelt LJ, Hatzimanikatis V, Palsson B�: A genome-scale metabolicreconstruction for escherichia coli K-12 MG1655 that accounts for 1260ORFs and thermodynamic information. Mol Syst Biol 2007, 3:121.
53. Mo ML, Palsson BO, Herrgård MJ: Connecting extracellular metabolomicmeasurements to intracellular flux states in yeast. BMC Syst Biol 2009, 3:37.
54. Barrett CL, Herring CD, Reed JL, Palsson BO: The global transcriptionalregulatory network for metabolism in escherichia coli exhibits fewdominant functional states. Proc Natl Acad Sci U S A 2005, 102:19103–19108.
55. GNU Linear Programming Kit (GLPK): [http://www.gnu.org/software/glpk/].56. Becker SA, Palsson BO: Context-specific metabolic networks are consistent
with experiments. PLoS Comput Biol 2008, 4:e1000082.57. Irizarry RA, Wu Z, Jaffee HA: Comparison of affymetrix geneChip
expression measures. Bioinformatics 2006, 22:789–794.

Byrne et al. BMC Systems Biology 2012, 6:127 Page 19 of 19http://www.biomedcentral.com/1752-0509/6/127
58. Hartigan J, Wong M: Algorithm AS 136: a k-means clustering algorithm.J R Stat Soc Ser C Appl Stat. Series C (Applied Statistics) 1979, 28:100–108.
59. Tibshirani R, Walther G, Hastie T: Estimating the number of clusters in adataset via the Gap statistic. J R Stat Soc 2000, 63:411–423.
60. Solovieff N, Hartley SW, Baldwin CT, Perls TT, Steinberg MH, Sebastiani P:Clustering by genetic ancestry using genome-wide SNP data. BMC Genet2010, 11:108.
61. Li M, Reilly MP, Rader DJ, Wang L-S: Correcting population stratification ingenetic association studies using a phylogenetic approach. Bioinformatics2010, 26:798–806.
62. Stegmayer G, Milone DH, Kamenetzky L, Lopez MG, Carrari F: A biologicallyinspired validity measure for comparison of clustering methods overmetabolic data sets. IEEE/ACM Trans Comput Biol Bioinform 2012, 9:706–716.
63. Bertsekas DP: Nonlinear programming. 1st edition. New Hampshire: AthenaScientific; 1995.
64. Censor Y: Pareto optimality in multiobjective problems. Appl Math Optim1977, 4:41–59.
65. Deb K: Multi-objective optimization using evolutionary algorithms. New Jersey:John Wiley and Sons; 2001.
66. Deb K, Pratap A, Agarwal S, Meyarivan T: A fast and elitist multiobjectivegenetic algorithm: NSGA-II. IEEE Trans Evol Comput 2002, 6:182–197.
67. Patnaik PR: Intelligent models of the quantitative behavior of microbialsystems. Food Bioprocess Technol. 2009, 2:122–137.
68. Tarafder A, Rangaiah GP, Ray AK: A study of finding many desirablesolutions in multiobjective optimization of chemical processes. ComputChem Eng 2007, 31:1257–1271.
69. Lee FC, Rangaiah GP, Ray AK: Multi-objective optimization of an industrialpenicillin V bioreactor train using non-dominated sorting geneticalgorithm. Biotechnol Bioeng 2007, 98:586–598.
doi:10.1186/1752-0509-6-127Cite this article as: Byrne et al.: Comparative multi-goal tradeoffs insystems engineering of microbial metabolism. BMC Systems Biology 20126:127.
Submit your next manuscript to BioMed Centraland take full advantage of:
• Convenient online submission
• Thorough peer review
• No space constraints or color figure charges
• Immediate publication on acceptance
• Inclusion in PubMed, CAS, Scopus and Google Scholar
• Research which is freely available for redistribution
Submit your manuscript at www.biomedcentral.com/submit
Related Documents


