RESEARCH ARTICLE Open Access A visual tool for accessibility study of pipeline maintenance during design Chu-Hsuan Lee 1 , Meng-Han Tsai 2 and Shih-Chung Kang 3* Abstract Background: Pipeline maintenance is becoming an important issue in modern construction and building information model (BIM) research. An understanding of pipeline accessibility considerations in terms of operation and maintenance is essential for planning and management. Previous studies have highlighted the complexity of multi-pipes including mechanical, electrical and plumbing (MEP) pipelines and the importance of information visualization, but few have proposed a way to consider accessibility problems during operation and maintenance. Methods: Therefore, this study develops a systematic method to evaluate accessibility with respect to pipeline maintenance. We first divided pipeline accessibility into three categories: (1) visual accessibility—the visibility for an inspector to view; (2) approachable accessibility—the difficulty for an inspector to approach; and (3) operational accessibility—the pipeline that can be operated by the inspectors. We created mathematical models and discussed the ergonomic details about each category. We then developed a user interface, VAO Checker, in which V, A and O stand for visual, approachable and operational respectively, to display visual information about pipeline accessibility. Through instantaneous analysis, the system visualizes the accessibility of the pipelines. We visually represent the intersection and union of these three categories to illustrate the varying accessibility of pipe elements. Results: A usability test was conducted to validate the system’s effectiveness. The results of the usability analysis show that users have higher correctness when using VAO Checker than 2D plan drawing and 3D model, and they evaluate the performance of this tool better than 2D plan drawing. Conclusion: Pipeline designers can benefit by using this tool to sketch a suitable traffic flow for engineers to investigate. Furthermore, the substantial amount of information saved in the layout database could be referenced for future optimization. Keywords: Pipeline maintenance; Building information model (BIM); Pipeline accessibility; Mechanical; Electrical; and Plumbing (MEP); Information Visualization Background Pipeline design has become increasingly important in modern construction. Operation and maintenance re- quires consideration of accessibility in the design of the layout of plant pipelines. Previous research has noted that piping accounts for 20% of costs for the industry as a whole (Calixto et al. 2009) and over 50% of the total detail-design labor hours (Park and Storch 2002). All other activities of following detail design depend on pip- ing and massive savings are achievable by utilizing good layout design and engineering practices. Mechanical, electrical, and plumbing (MEP) pipes used to be supplemental facilities in construction. However, they have become necessary facilities, especially in non- residential construction, such as hospitals, fire stations, and plants. Coordinating a MEP system is a tremendous challenge in engineering fields such as advanced technol- ogy, health care, and biochemistry industries (Khanzode et al. 2008). Knowing how to arrange MEP systems appro- priately is one of the most crucial aspects of the design phase (Riley et al. 2005). Maintenance is a crucial phase in these types of con- struction. Based on a statistics on expenses in a typical water treatment plant in year-2008, maintenance takes 15% possession of the expenses (Biehl and Inman 2010). * Correspondence: [email protected] 3 Department of Civil Engineering, National Taiwan University, Taipei, Taiwan Full list of author information is available at the end of the article © 2014 Lee et al.; licensee Springer. This is an Open Access article distributed under the terms of the Creative Commons Attribution License (http://creativecommons.org/licenses/by/4.0), which permits unrestricted use, distribution, and reproduction in any medium, provided the original work is properly credited. Lee et al. Visualization in Engineering 2014, 1:6 http://www.viejournal.com/content/1/1/6

Welcome message from author
This document is posted to help you gain knowledge. Please leave a comment to let me know what you think about it! Share it to your friends and learn new things together.
Transcript

Lee et al. Visualization in Engineering 2014, 1:6http://www.viejournal.com/content/1/1/6
RESEARCH ARTICLE Open Access
A visual tool for accessibility study of pipelinemaintenance during designChu-Hsuan Lee1, Meng-Han Tsai2 and Shih-Chung Kang3*
Abstract
Background: Pipeline maintenance is becoming an important issue in modern construction and buildinginformation model (BIM) research. An understanding of pipeline accessibility considerations in terms of operationand maintenance is essential for planning and management. Previous studies have highlighted the complexity ofmulti-pipes including mechanical, electrical and plumbing (MEP) pipelines and the importance of informationvisualization, but few have proposed a way to consider accessibility problems during operation and maintenance.
Methods: Therefore, this study develops a systematic method to evaluate accessibility with respect to pipelinemaintenance. We first divided pipeline accessibility into three categories: (1) visual accessibility—the visibility for aninspector to view; (2) approachable accessibility—the difficulty for an inspector to approach; and (3) operationalaccessibility—the pipeline that can be operated by the inspectors. We created mathematical models and discussedthe ergonomic details about each category. We then developed a user interface, VAO Checker, in which V, A and Ostand for visual, approachable and operational respectively, to display visual information about pipeline accessibility.Through instantaneous analysis, the system visualizes the accessibility of the pipelines. We visually represent theintersection and union of these three categories to illustrate the varying accessibility of pipe elements.
Results: A usability test was conducted to validate the system’s effectiveness. The results of the usability analysisshow that users have higher correctness when using VAO Checker than 2D plan drawing and 3D model, and theyevaluate the performance of this tool better than 2D plan drawing.
Conclusion: Pipeline designers can benefit by using this tool to sketch a suitable traffic flow for engineers toinvestigate. Furthermore, the substantial amount of information saved in the layout database could be referencedfor future optimization.
Keywords: Pipeline maintenance; Building information model (BIM); Pipeline accessibility; Mechanical; Electrical;and Plumbing (MEP); Information Visualization
BackgroundPipeline design has become increasingly important inmodern construction. Operation and maintenance re-quires consideration of accessibility in the design of thelayout of plant pipelines. Previous research has notedthat piping accounts for 20% of costs for the industry asa whole (Calixto et al. 2009) and over 50% of the totaldetail-design labor hours (Park and Storch 2002). Allother activities of following detail design depend on pip-ing and massive savings are achievable by utilizing goodlayout design and engineering practices.
* Correspondence: [email protected] of Civil Engineering, National Taiwan University, Taipei, TaiwanFull list of author information is available at the end of the article
© 2014 Lee et al.; licensee Springer. This is an OAttribution License (http://creativecommons.orin any medium, provided the original work is p
Mechanical, electrical, and plumbing (MEP) pipes usedto be supplemental facilities in construction. However,they have become necessary facilities, especially in non-residential construction, such as hospitals, fire stations,and plants. Coordinating a MEP system is a tremendouschallenge in engineering fields such as advanced technol-ogy, health care, and biochemistry industries (Khanzodeet al. 2008). Knowing how to arrange MEP systems appro-priately is one of the most crucial aspects of the designphase (Riley et al. 2005).Maintenance is a crucial phase in these types of con-
struction. Based on a statistics on expenses in a typicalwater treatment plant in year-2008, maintenance takes15% possession of the expenses (Biehl and Inman 2010).
pen Access article distributed under the terms of the Creative Commonsg/licenses/by/4.0), which permits unrestricted use, distribution, and reproductionroperly credited.

Lee et al. Visualization in Engineering 2014, 1:6 Page 2 of 15http://www.viejournal.com/content/1/1/6
Moreover, based on some European and U.S. case study,maintenance has remarkable impact on at least one ofthe environmental aspects (Junnila et al. 2006). A poorlydesigned pipeline layout design wastes space and mate-rials. Moreover, it can cause difficulty or even dangerduring manipulation and management.
Literature reviewThe literature reviewed for this study included findingsand recommendations related to piping that can be cate-gorized into three main groups: a pipe-routing algorithm,the integration of multi-pipes, and the visualization ofpipeline design.
Pipe-routing algorithmsPipe-routing design is a subset of assembly design thatconceives collision-free routes for pipes. A survey byQian et al. (2008) categorized it into four fields: indus-trial plant pipeline layout design, circuit layout design,aircraft design, and ship piping system design (Qianet al. 2008). Several studies have been devoted to routingalgorithms, and mainly focus on physical constraintsthat connect the terminals of given locations and avoidall obstacles. They then use economic constraints tominimize the length of pipes and the number of pipeturns, which leads to an optimal specification. However,few, if any, solutions have considered pipeline accessibil-ity in relation to operation and maintenance. Table 1shows previous studies have disregarded some importantconstraints (Guirardello and Swaney 2005; Ito 1999;Mitsuta et al. 1987; Newell 1972; Park and Storch 2002;Rourke 1975; Schmidt-Traub et al. 1998; Wangdahlet al. 1974; Zhu and Latombe 1991). Zhou and Yin(2010) emphasized that practical constraints, such asmaintenance requirements and manufacturability, arenot well recognized, and how humans still play an im-portant role in guiding the computer to finish the de-sign (Zhou and Yin 2010).
Integration of multi-pipesAn industrial plant typically has more than one kind ofpipeline. Feng et al. (2012) indicated a large number of
Table 1 Earlier studies of pipe routing
Algorithm Network optimization
Author Newell Wangdahl Zhu
Year 1972 1974 1991
Dimension 3D 2D 2D/3D
Domain General Ship Robotics
Operation/maintenance - - -
Installation - - ○
Safety - - -
-: not considered, ○: partially implemented, ●: fully implemented.
pipelines, multifarious design constraints, and numerousobstacles in layout complicate the design of a pipelinesystem (Feng et al. 2012). Recently, engineers havemainly used existing CAD software for design assistance,which has increased the problems associated with ex-perts, such as complex operation, a long design cycle,and low efficiency. Some researchers advocated a newlayout space model to reduce high complexity and de-sign interference in the automated design of pipelinesystems (Deliang and Huibiao 2009; Feng et al. 2012).Kim et al. (1996) found the range and complexity of theconstraints limits the possibility of automatic pipe routedesign, and demonstrated a more natural and effectiverepresentation for route optimization (Kim et al. 1996).Previous studies recognized the complexity in pipelinearrangement and proposed some methods to reduce it(Biehl and Inman 2010; Guirardello and Swaney 2005).However, in many instances the pipeline layout cannotbe simplified, so the complexity should be taken intoaccount.
Visualization regarding pipeline accessibilitySome researchers have begun noticing the utility of in-formation visualization for construction purposes as ameans of improving the data-rich, but information-poor,problems of the construction industry (Songer et al.2004; Tsai et al. 2010; Tsai et al. 2013). Previous researchfocused on the visualization of construction data, notinghow it can help identify potential causal relationshipsamong construction data (Korde et al. 2005; Kuo et al.2011; Russell et al. 2009). Gao et al. (2006) investigatedcolored construction drawing, which can increase theefficiency and accuracy of communication between de-signers and contractors (Grootjans 2009a). Chang et al.(2009) and Chen et al. (2013) suggested a systematicprocedure to determine the most suitable colors for ef-fectively presenting the construction information (Changet al. 2009; Chen et al. 2013). This procedure includesthe selection, evaluation, and testing of colors to ensurethey match the meaning of the construction informationwith the cognition of the users. Wang (2011) used theconception of visualization to develop an approach for
Maze Escape Genetic
Guiradello Rourke Mitsuta Schmidt Ito
2005 1975 1987 1998 1999
3D 3D 3D 3D 2D
Plant General General Plant General
- - - - -
- - - ○ ○
- - ● - -
Lee et al. Visualization in Engineering 2014, 1:6 Page 3 of 15http://www.viejournal.com/content/1/1/6
assessing reachability of wheelchair users (Wang 2011).With reference to pipeline arrangement, Deliang andHuibiao (2009) pointed out that visualization can helphandle the detection and response to collisions betweenpipes and obstacles (Deliang and Huibiao 2009).
Expert interviewsDuring the early stage of this research, we interviewedsix experts to determine the requirements of pipeline de-sign. They are all in the field of plant pipeline design, in-cluding three engineers from a construction company,two managers from a microelectronics corporation, andone executive officer from the Building InformationModeling (BIM) research center. After combining theopinion of experts with previous literature review, wemainly focused our research on pipeline accessibilityduring operation and maintenance, which is rarely dis-cussed in previous studies.
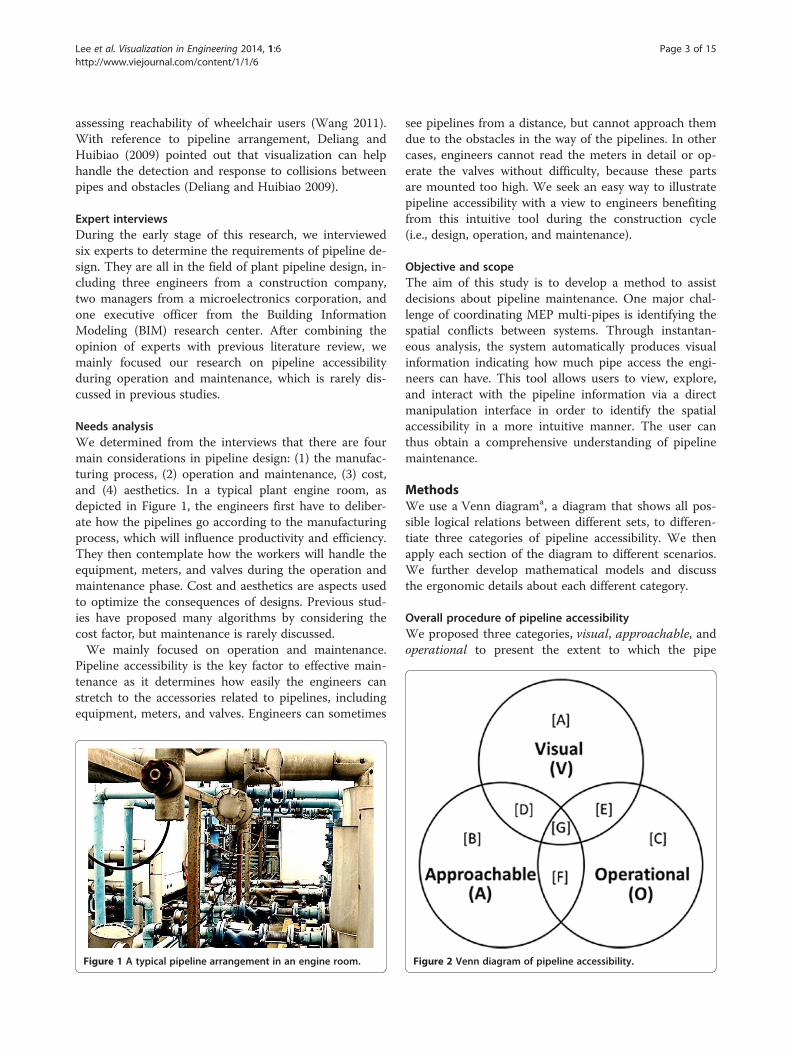
Needs analysisWe determined from the interviews that there are fourmain considerations in pipeline design: (1) the manufac-turing process, (2) operation and maintenance, (3) cost,and (4) aesthetics. In a typical plant engine room, asdepicted in Figure 1, the engineers first have to deliber-ate how the pipelines go according to the manufacturingprocess, which will influence productivity and efficiency.They then contemplate how the workers will handle theequipment, meters, and valves during the operation andmaintenance phase. Cost and aesthetics are aspects usedto optimize the consequences of designs. Previous stud-ies have proposed many algorithms by considering thecost factor, but maintenance is rarely discussed.We mainly focused on operation and maintenance.
Pipeline accessibility is the key factor to effective main-tenance as it determines how easily the engineers canstretch to the accessories related to pipelines, includingequipment, meters, and valves. Engineers can sometimes
Figure 1 A typical pipeline arrangement in an engine room.
see pipelines from a distance, but cannot approach themdue to the obstacles in the way of the pipelines. In othercases, engineers cannot read the meters in detail or op-erate the valves without difficulty, because these partsare mounted too high. We seek an easy way to illustratepipeline accessibility with a view to engineers benefitingfrom this intuitive tool during the construction cycle(i.e., design, operation, and maintenance).
Objective and scopeThe aim of this study is to develop a method to assistdecisions about pipeline maintenance. One major chal-lenge of coordinating MEP multi-pipes is identifying thespatial conflicts between systems. Through instantan-eous analysis, the system automatically produces visualinformation indicating how much pipe access the engi-neers can have. This tool allows users to view, explore,and interact with the pipeline information via a directmanipulation interface in order to identify the spatialaccessibility in a more intuitive manner. The user canthus obtain a comprehensive understanding of pipelinemaintenance.
MethodsWe use a Venn diagrama, a diagram that shows all pos-sible logical relations between different sets, to differen-tiate three categories of pipeline accessibility. We thenapply each section of the diagram to different scenarios.We further develop mathematical models and discussthe ergonomic details about each different category.
Overall procedure of pipeline accessibilityWe proposed three categories, visual, approachable, andoperational to present the extent to which the pipe
Figure 2 Venn diagram of pipeline accessibility.
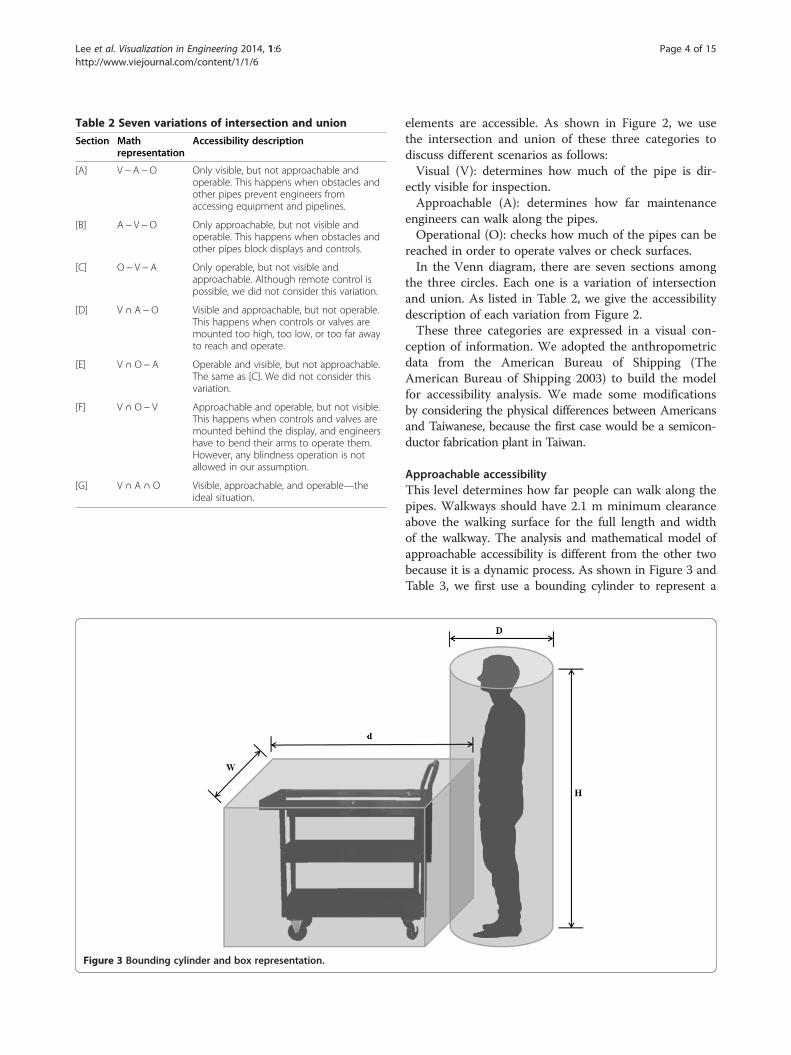
Table 2 Seven variations of intersection and union
Section Mathrepresentation
Accessibility description
[A] V − A −O Only visible, but not approachable andoperable. This happens when obstacles andother pipes prevent engineers fromaccessing equipment and pipelines.
[B] A − V −O Only approachable, but not visible andoperable. This happens when obstacles andother pipes block displays and controls.
[C] O − V − A Only operable, but not visible andapproachable. Although remote control ispossible, we did not consider this variation.
[D] V ∩ A − O Visible and approachable, but not operable.This happens when controls or valves aremounted too high, too low, or too far awayto reach and operate.
[E] V ∩ O − A Operable and visible, but not approachable.The same as [C]. We did not consider thisvariation.
[F] V ∩ O − V Approachable and operable, but not visible.This happens when controls and valves aremounted behind the display, and engineershave to bend their arms to operate them.However, any blindness operation is notallowed in our assumption.
[G] V ∩ A ∩ O Visible, approachable, and operable—theideal situation.
Figure 3 Bounding cylinder and box representation.
Lee et al. Visualization in Engineering 2014, 1:6 Page 4 of 15http://www.viejournal.com/content/1/1/6
elements are accessible. As shown in Figure 2, we usethe intersection and union of these three categories todiscuss different scenarios as follows:Visual (V): determines how much of the pipe is dir-
ectly visible for inspection.Approachable (A): determines how far maintenance
engineers can walk along the pipes.Operational (O): checks how much of the pipes can be
reached in order to operate valves or check surfaces.In the Venn diagram, there are seven sections among
the three circles. Each one is a variation of intersectionand union. As listed in Table 2, we give the accessibilitydescription of each variation from Figure 2.These three categories are expressed in a visual con-
ception of information. We adopted the anthropometricdata from the American Bureau of Shipping (TheAmerican Bureau of Shipping 2003) to build the modelfor accessibility analysis. We made some modificationsby considering the physical differences between Americansand Taiwanese, because the first case would be a semicon-ductor fabrication plant in Taiwan.
Approachable accessibilityThis level determines how far people can walk along thepipes. Walkways should have 2.1 m minimum clearanceabove the walking surface for the full length and widthof the walkway. The analysis and mathematical model ofapproachable accessibility is different from the other twobecause it is a dynamic process. As shown in Figure 3 andTable 3, we first use a bounding cylinder to represent a

Table 3 Bounding box size for recommended walkwaydimensions
Application Box size*
One person traveling in an area with limited access 51×51×150
One person in unrestricted area, where two personscould pass
71×71×210
One person with a cart 71×120×210
Normal two-way traffic or any means of egress thatleads to an entrance or exit
92×120×210
Corridor or passageway that serves as a required exit 112×120×210
*Size representation: W (cm) × (D + d) (cm) × H (cm).
Lee et al. Visualization in Engineering 2014, 1:6 Page 5 of 15http://www.viejournal.com/content/1/1/6
person, and bounding boxes in different sizes to representa cart in different applications. If obstacles or other pipesblock the box, it cannot go farther along the pipes.The mathematical model of visual accessibility is then
constructed as the equation:
A ¼ H ; r; Pð Þ ð1Þ
As denoted in Figure 4, r ¼ Max W ;Dð Þ2 ; and we used a
cylinder with radius r and height H to simplify thebounding box. S means the start point, and T means thetarget point. P is the path from S to T :
P ¼ S; p1;p2;…; pn; pnþ1;…Th i
; where the cylinder is
not blocked.
Visual accessibilityThis level determines how much of the pipe is directlyvisible for inspection. We further divide it into twolevels: visible and legible. The former includes thoseused for normal operations and those not requiring ac-curate readings, whereas the latter includes those usedfrequently, for obtaining precise readings, and in emer-gencies. The mathematical model of visual accessibilityis constructed as the following equation. Figure 5 indi-cates the parameters.
V ¼ S; oH ; oLmin ;oLmax ; θ;
oHvmin ;H
vmaxÞ
� ð2Þ
Figure 6 indicates people’s field-of-view. The two pa-rameters regarding it are the distance from eyes (L) and
Figure 4 Mathematical model of approachable accessibility.
the viewing angle from the central line (θ). Based onABS research, as shown in Table 4, people can see thedetails of pipes at distances between 33 cm and 71 cm,and a viewing angle within 35 degrees, where the legiblelevel should be located (provided obstacles or other pipesdo not block the pipes and displays). The distance for thevisible level can be up to 200 cm, with the viewing angleup to 60 degrees. Figure 7 illustrates the visual heights(Hv) for displays in different postures: standing (C), kneel-ing (D), and squatting (E). Table 5 shows the maximumand minimum heights for the legible and visible levels,based on personal height (H). Because the range of thesethree postures overlapped, we integrated the data. Thelegible level should be located within the multiple 0.4261-0.9375, but the visible level can be broader, 0.2955-1.0114.
Operational accessibilityTo facilitate the operation of valves or the checking ofsurfaces, this level checks the accessibility of pipes. It isderived from the arrival accessibility level, and shows theease with which people can operate within the pipe lay-out. We further divided it into two levels: general con-trol and precise control. The former includes those usedfor normal operations and those not requiring accuratemanipulation, whereas the latter includes those usedfrequently, for obtaining precise performance, or inemergencies. The mathematical model of operational ac-cessibility is constructed as the following equation. Figure 8indicates the parameters.
O ¼ S; oH ; oF ; oHomin ;H
omaxÞ
� ð3Þ
People’s forward functional reach from behind the shoul-der to the tip of the extended finger (F) and the operableheights (H0) for controls in different postures are illustratedin Figure 7: standing (G), kneeling (I), and squatting (J).Table 6 shows the maximum and minimum forward func-tional reach and heights for precise and general controls,based on personal height (H). Frequently used controlsshould be located within a radius of multiple 0.2614 fromthe operator’s centerline, whereas less frequently used con-trols should be located within a radius of multiple 0.4545

Figure 5 Mathematical model of visual accessibility.
Lee et al. Visualization in Engineering 2014, 1:6 Page 6 of 15http://www.viejournal.com/content/1/1/6
from the operator’s centerline. Because the range of thesethree postures overlapped, we integrated the data. Precisecontrol should be located within the multiple 0.2273-0.7670, but general control can be broader, 0.2045-1.0966.
ImplementationThis study developed a system, VAO Checker, which in-tegrated the user interface and visualization informationas a tool, to implement the proposed methodology. The
Figure 6 Field-of-view.
following sections describe the software used for the de-velopment environment and the system design.
Programming platformThis study used Microsoft Windows Presentation Foun-dation (WPF) for the display of the user interface. WPFwas chosen because it allows programmers to easilyunify multimedia data, and change the appearance orthe function of display controls for customization. Fur-thermore, the WPF application functions by off-loadingto graphics processing units (GPUs) rather than centralprocessing units (CPUs), which facilitates smoothergraphics and better performance (Nathan 2006).
Graphics engineThe framework developed for the visualization informa-tion was based on the Microsoft XNA Game Studio 4.0.This tool assists the development of video games andthe improvement of software management. XNA hasample performance for the development of 2D and 3Dgames. It offers users the capability to build the operat-ing system and visual images with ease (Grootjans 2009;Miller and Johnson 2010).
System designThe proposed tool called VAO Checker was built for thisstudy to consider the three categories of pipeline accessi-bility. As shown in Figure 9, the operation interface
Table 4 Suitable range of field-of-view
L (cm) θ (degrees)
Legible 33-71 35
Visible 0-200 60

Figure 7 Related height in different postures.
Lee et al. Visualization in Engineering 2014, 1:6 Page 7 of 15http://www.viejournal.com/content/1/1/6
displays a plan view of the space, including the equip-ment and pipelines. The user can use this tool to find acollision-free path through the space and to examine thedifferent levels of visual and operational accessibility.
Example caseWe created an example case to validate the practicalityof VAO Checker. We built a virtual building projectas an example case in a machinery room (Figure 10),which has some basic equipment and a pipelinearrangement.After the start point and target point are decided, and
the “Approachable” button is clicked, a collision-freepath with some check points listed in the blank comesinto view (Figure 11). The dot with sufficient approach-able accessibility is bigger and colored light green, andthe dot with limited approachable accessibility is smallerand colored dark green.The user can choose one of those listed points, and
the chosen point will turn into a red dot (Figure 12).The user can then examine different levels of visual and
Table 5 Suitable field-of-view and vision range (multiple of H
Posture L (cm) θ (degrees) Standin
Visible maximum 200 60 1.0114
Legible maximum 71 35 0.9375
Legible minimum 33 0 0.7216
Visible minimum 0 0 0.5909
operational accessibility by clicking the four buttonsat the bottom right corner. A visualization window,indicating a corresponding level of accessibility, willopen (Figure 13). The user can utilize some specifickeys to interact with the pipeline information, suchas rotating the view direction or stepping forward orbackward.
ValidationIn order to verify how VAO Checker could help usersexplore and understand relevant accessibility informa-tion, we conducted a usability test. We also solicitedexpert consultation to verify the usability and howthe users can interact with the pipeline accessibilityinformation.
Test planTest procedure For the usability test, we built a typicalmachinery room project with equipment and pipelines.There were 10 accessibility problems in this case, whichare categorized in Table 7 according to Figure 2 and
) for legible and visible levels
g (C) Kneeling (D) Squatting (E) Overall
0.8239 0.7102 1.0114
0.7500 0.5795 0.9375
0.5398 0.4261 0.4261
0.3977 0.2955 0.2955

Figure 8 Mathematical model of operational accessibility.
Lee et al. Visualization in Engineering 2014, 1:6 Page 8 of 15http://www.viejournal.com/content/1/1/6
Table 2. All users had to identify the problems in threeindividual tasks, each task using different mediums, 2Dplan drawing, 3D model and our system, VAO Checker.Besides, we also conducted the NASA Task Load Index(NASA-TLX) test. As shown in Figure 14, the test planbegan with the NASA-TLX weight assessment, in whichthe user compared the factors pairwise based on theirperceived importance. After the user finished the identi-fication of accessibility problems via one informationmedium, the user had to rate each factor of task loadwithin a 100-points range. The final NASA-TLX scorewas calculated based on the weight distribution, whichwas decided at the initial phase.
Test participants There were 30 participants in the us-ability test, 19 male and 11 female. Their ages ranged from20 to 37 years old. We solicited participant from non-engineering background as well, because they might pro-vide suggestion from different point of view. Among theparticipants, 27 participants are from a civil engineeringbackground, 2 from a psychology background, and 1 froman economics background.
Table 6 Suitable forward functional reach and heights (multip
Posture Forward (F) Standing (G)
General maximum 0.4545 1.0966
Precise maximum 0.2614 0.7670
Precise minimum 0 0.4886
General minimum 0 0.4318
Test environment The usability test was conducted in acontrolled environment that was limited to the roomshown in Figure 15. In this room, each participant wasasked to sit at the east side of the front table in the room.A researcher, sitting next to the participant, conductedand facilitated the test procedure and guided the partici-pants through the test.
Results and discussionAn α level of 0.05 was used for all statistical tests and ana-lysis, and we calculated the p-value between groups inanalysis of variance (ANOVA), where p < 0.05 means sta-tistically significant. The test results assessed how quicklyand accurately participants performed the task when usingdifferent mediums. There is also an analysis of NASA-TLX score, which shows how the participants evaluatedthe ergonomics performance of each medium. They aresummarized as follows:
Correctness: VAO ≧ 3D > 2DThe box-and-whisker plot, a visual display of the fivenumber summary, of success rate of each medium isshown in Figure 16. Table 8 presents means and
le of H) for precise and general controls
Kneeling (I) Squatting (J) Overall
0.8239 0.7102 1.0966
0.6136 0.4545 0.7670
0.3068 0.2273 0.2273
0.2614 0.2045 0.2045
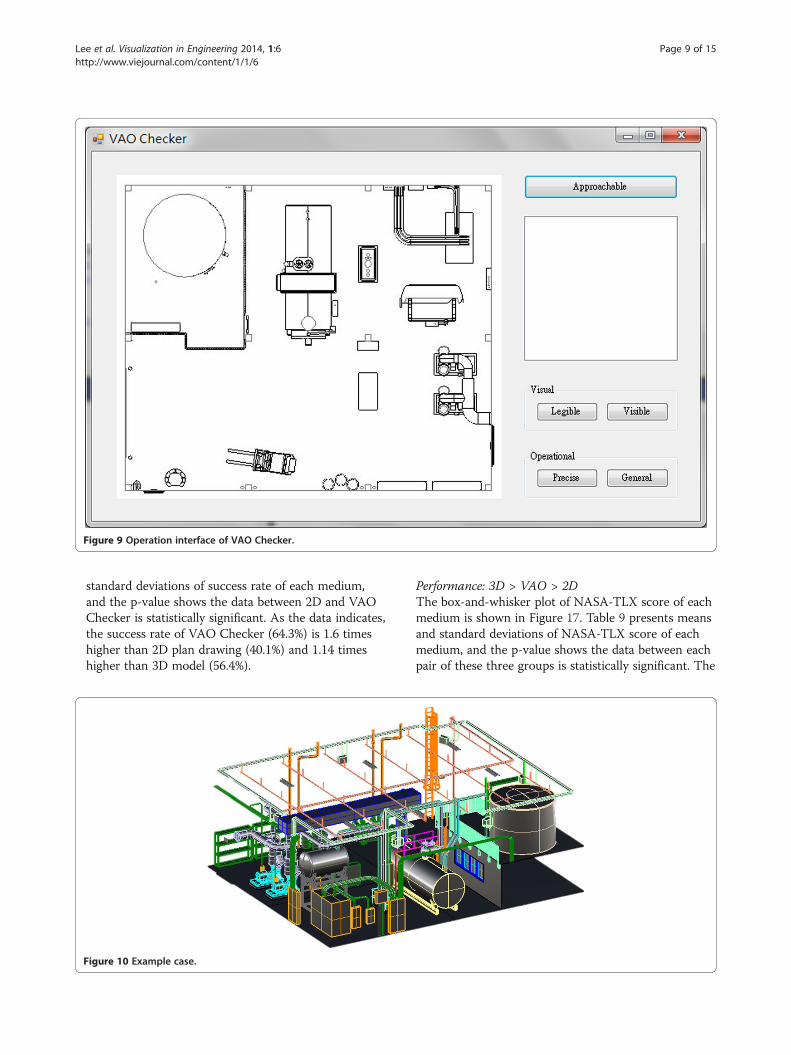
Figure 9 Operation interface of VAO Checker.
Lee et al. Visualization in Engineering 2014, 1:6 Page 9 of 15http://www.viejournal.com/content/1/1/6
standard deviations of success rate of each medium,and the p-value shows the data between 2D and VAOChecker is statistically significant. As the data indicates,the success rate of VAO Checker (64.3%) is 1.6 timeshigher than 2D plan drawing (40.1%) and 1.14 timeshigher than 3D model (56.4%).
Figure 10 Example case.
Performance: 3D > VAO > 2DThe box-and-whisker plot of NASA-TLX score of eachmedium is shown in Figure 17. Table 9 presents meansand standard deviations of NASA-TLX score of eachmedium, and the p-value shows the data between eachpair of these three groups is statistically significant. The
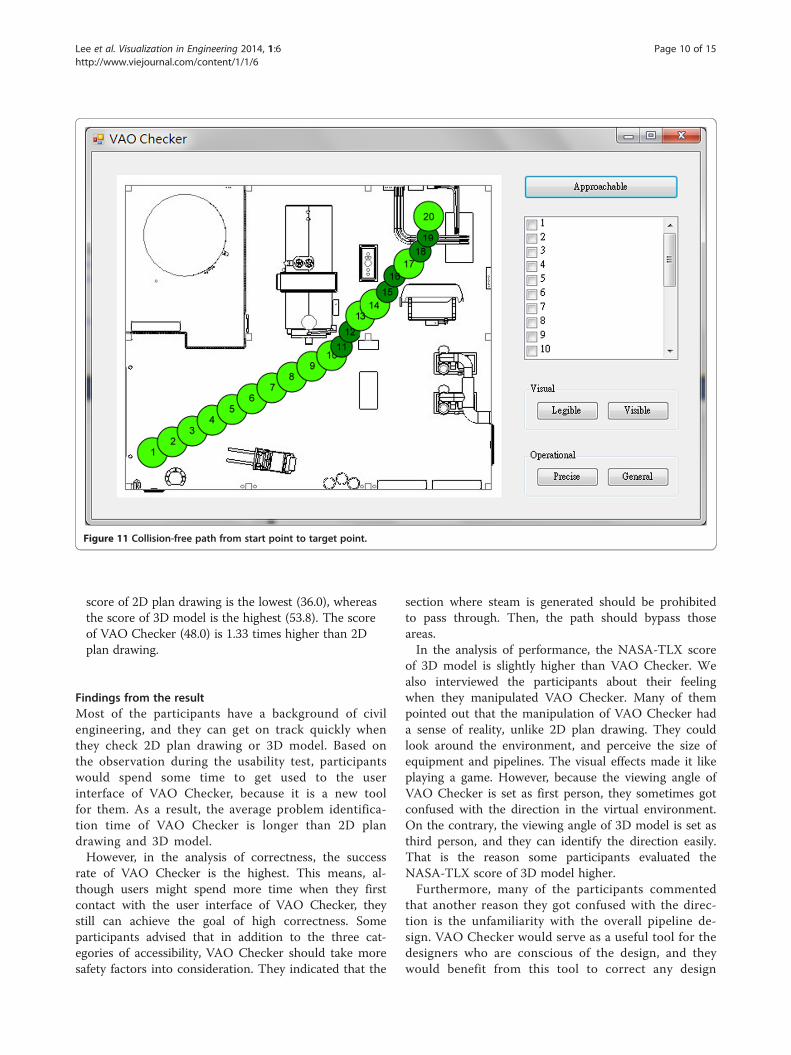
Figure 11 Collision-free path from start point to target point.
Lee et al. Visualization in Engineering 2014, 1:6 Page 10 of 15http://www.viejournal.com/content/1/1/6
score of 2D plan drawing is the lowest (36.0), whereasthe score of 3D model is the highest (53.8). The scoreof VAO Checker (48.0) is 1.33 times higher than 2Dplan drawing.
Findings from the resultMost of the participants have a background of civilengineering, and they can get on track quickly whenthey check 2D plan drawing or 3D model. Based onthe observation during the usability test, participantswould spend some time to get used to the userinterface of VAO Checker, because it is a new toolfor them. As a result, the average problem identifica-tion time of VAO Checker is longer than 2D plandrawing and 3D model.However, in the analysis of correctness, the success
rate of VAO Checker is the highest. This means, al-though users might spend more time when they firstcontact with the user interface of VAO Checker, theystill can achieve the goal of high correctness. Someparticipants advised that in addition to the three cat-egories of accessibility, VAO Checker should take moresafety factors into consideration. They indicated that the
section where steam is generated should be prohibitedto pass through. Then, the path should bypass thoseareas.In the analysis of performance, the NASA-TLX score
of 3D model is slightly higher than VAO Checker. Wealso interviewed the participants about their feelingwhen they manipulated VAO Checker. Many of thempointed out that the manipulation of VAO Checker hada sense of reality, unlike 2D plan drawing. They couldlook around the environment, and perceive the size ofequipment and pipelines. The visual effects made it likeplaying a game. However, because the viewing angle ofVAO Checker is set as first person, they sometimes gotconfused with the direction in the virtual environment.On the contrary, the viewing angle of 3D model is set asthird person, and they can identify the direction easily.That is the reason some participants evaluated theNASA-TLX score of 3D model higher.Furthermore, many of the participants commented
that another reason they got confused with the direc-tion is the unfamiliarity with the overall pipeline de-sign. VAO Checker would serve as a useful tool for thedesigners who are conscious of the design, and theywould benefit from this tool to correct any design
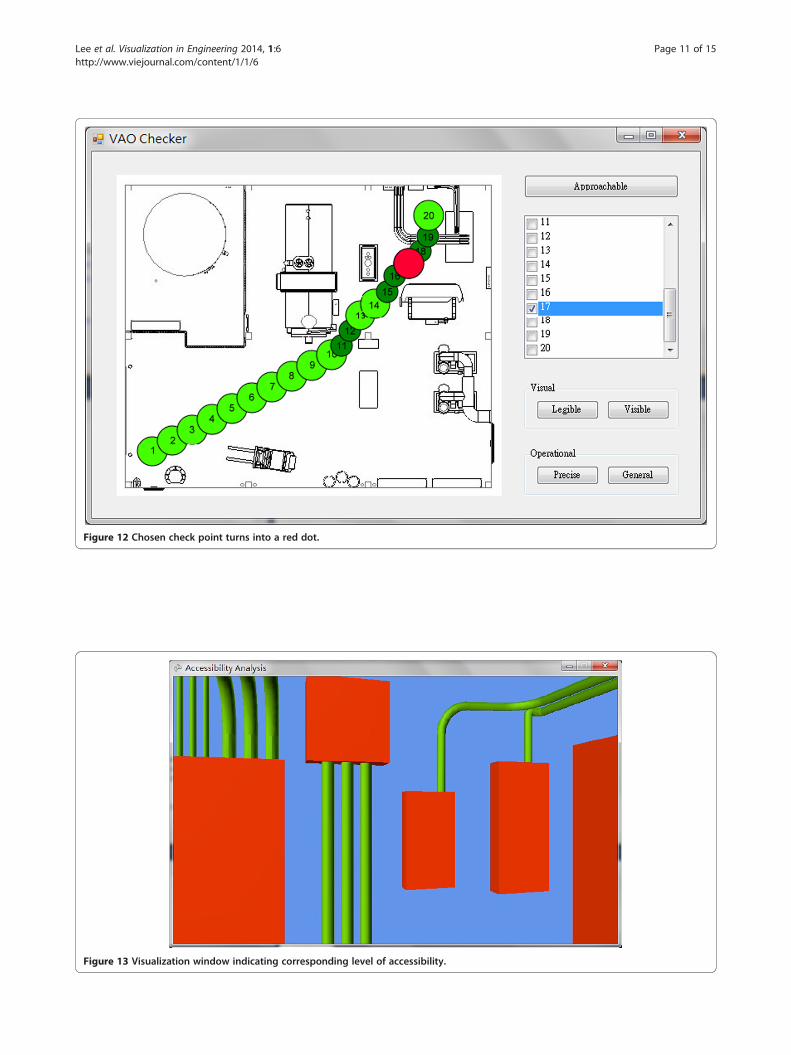
Figure 12 Chosen check point turns into a red dot.
Figure 13 Visualization window indicating corresponding level of accessibility.
Lee et al. Visualization in Engineering 2014, 1:6 Page 11 of 15http://www.viejournal.com/content/1/1/6
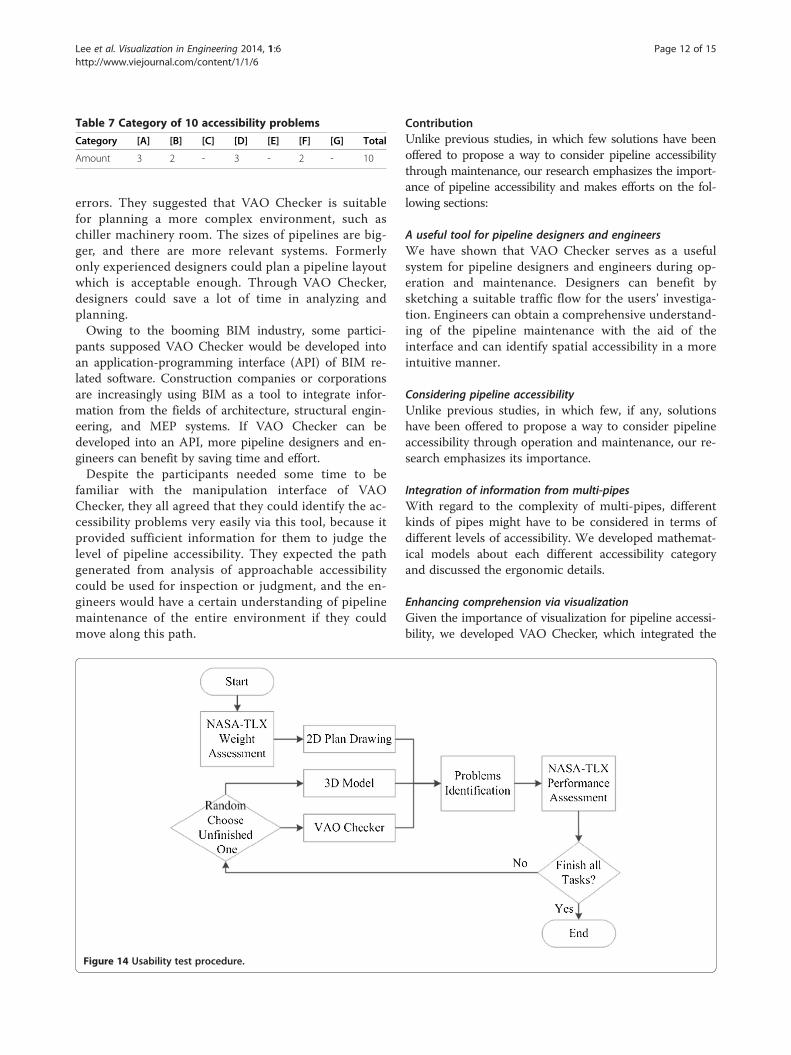
Table 7 Category of 10 accessibility problems
Category [A] [B] [C] [D] [E] [F] [G] Total
Amount 3 2 - 3 - 2 - 10
Lee et al. Visualization in Engineering 2014, 1:6 Page 12 of 15http://www.viejournal.com/content/1/1/6
errors. They suggested that VAO Checker is suitablefor planning a more complex environment, such aschiller machinery room. The sizes of pipelines are big-ger, and there are more relevant systems. Formerlyonly experienced designers could plan a pipeline layoutwhich is acceptable enough. Through VAO Checker,designers could save a lot of time in analyzing andplanning.Owing to the booming BIM industry, some partici-
pants supposed VAO Checker would be developed intoan application-programming interface (API) of BIM re-lated software. Construction companies or corporationsare increasingly using BIM as a tool to integrate infor-mation from the fields of architecture, structural engin-eering, and MEP systems. If VAO Checker can bedeveloped into an API, more pipeline designers and en-gineers can benefit by saving time and effort.Despite the participants needed some time to be
familiar with the manipulation interface of VAOChecker, they all agreed that they could identify the ac-cessibility problems very easily via this tool, because itprovided sufficient information for them to judge thelevel of pipeline accessibility. They expected the pathgenerated from analysis of approachable accessibilitycould be used for inspection or judgment, and the en-gineers would have a certain understanding of pipelinemaintenance of the entire environment if they couldmove along this path.
Figure 14 Usability test procedure.
ContributionUnlike previous studies, in which few solutions have beenoffered to propose a way to consider pipeline accessibilitythrough maintenance, our research emphasizes the import-ance of pipeline accessibility and makes efforts on the fol-lowing sections:
A useful tool for pipeline designers and engineersWe have shown that VAO Checker serves as a usefulsystem for pipeline designers and engineers during op-eration and maintenance. Designers can benefit bysketching a suitable traffic flow for the users’ investiga-tion. Engineers can obtain a comprehensive understand-ing of the pipeline maintenance with the aid of theinterface and can identify spatial accessibility in a moreintuitive manner.
Considering pipeline accessibilityUnlike previous studies, in which few, if any, solutionshave been offered to propose a way to consider pipelineaccessibility through operation and maintenance, our re-search emphasizes its importance.
Integration of information from multi-pipesWith regard to the complexity of multi-pipes, differentkinds of pipes might have to be considered in terms ofdifferent levels of accessibility. We developed mathemat-ical models about each different accessibility categoryand discussed the ergonomic details.
Enhancing comprehension via visualizationGiven the importance of visualization for pipeline accessi-bility, we developed VAO Checker, which integrated the

Figure 15 The test environment.
Lee et al. Visualization in Engineering 2014, 1:6 Page 13 of 15http://www.viejournal.com/content/1/1/6
user interface and visualization information as a tool toprovide users with complete information about pipelineaccessibility.
Future workEven though this research has made efforts on the pipe-line accessibility, there are still some possibilities can beworked on in the future:
Figure 16 Success rate of each medium.
Number of levels divided for each accessibility categoryOperational accessibility, for example, has more thanone kind of controls, such as toggle switches, pushbut-tons, and rotary controls. Each demands a differentlevel of sophistication, and might need a different de-scription for the mathematical model of operationalaccessibility. From the standpoint of plan amendments,VAO Checker could be much more practical tool if the

Table 8 Statistical analysis of correctness
Medium Mean (%) Std. Deviation (%) p-value
2D plan drawing 40.1 16.3 2D & 3D 0.002*
3D model 56.4 25.3 2D & VAO 0.000*
VAO Checker 64.3 24.5 3D & VAO 0.139
*the data is statistically significant.
Table 9 Statistical analysis of performance
Medium Mean(points)
Std. Deviation(points)
p-value
2D plan drawing 36.0 13.5 2D & 3D 0.000*
3D model 53.8 17.0 2D & VAO 0.004*
VAO Checker 48.0 17.3 3D & VAO 0.020*
*the data is statistically significant.
Lee et al. Visualization in Engineering 2014, 1:6 Page 14 of 15http://www.viejournal.com/content/1/1/6
analysis result can show the segmented and numericaldegree of accessibility.
Optimization via operatorsThe system we propose uses computation to suggest asuitable path by considering approachable accessibility.It might become much more usable if the pipeline’s de-signer can improve results through specific operatorsbased on the designer’s experience. Furthermore, the tre-mendous amount of information saved in the layoutdatabase might be referenced for future optimization.
Development of pipe assembly planningThe pipe-routing design still relies on designer’s experience.We hope this system can be extended to pipe assemblyplanning areas for efficient implementation, which mightlead to a process of automatic pipe routing. The pipeline ar-rangement will only become more complex in the future,and pipe assembly planning will help increase the effective-ness and efficiency of routing design.
ConclusionThis research developed a systematic method to evaluatethe accessibility of pipeline maintenance. During the
Figure 17 NASA-TLX score of each medium.
early stage of this research, we interviewed six experts todetermine the requirements of pipeline design. Aftercombining the opinion of experts with a literature re-view, we mainly focused our research on pipeline accessi-bility during operation and maintenance, which is rarelydiscussed in previous studies. We first divided pipeline ac-cessibility into three categories, developed mathematicalmodels, and discussed the ergonomic details of eachdifferent category. We then developed a system calledVAO Checker, which integrated the user interface andvisualization information as a tool to implement theproposed methodology. VAO Checker used a simplemotion-planning algorithm to find a path with acceptableapproachable accessibility, and programmed the mathemat-ical models into visualization information indicating thevisual and operational accessibility. We created an examplecase to validate the practicality of VAO Checker, and con-ducted a usability test to evaluate the effectiveness of thistool. The result showed that it is a useful system for pipe-line designers and engineers. It considered the pipeline ac-cessibility within multi-pipes and enhanced the spatialcomprehension. The system can be further integrated intoBIM software as an API, extended to pipe assembly plan-ning areas, or even referenced for future optimization.

Lee et al. Visualization in Engineering 2014, 1:6 Page 15 of 15http://www.viejournal.com/content/1/1/6
EndnotesaLewis, Clarence Irving and Leibniz, Gottfried Wilhelm
(1918). A survey of symbolic logic, University of CaliforniaPress.
Competing interestsThe authors declare that they have no competing interests.
Authors’ contributionsCH developed the methodology and the mathematical models,programmed VAO Checker, carried out the usability test, analyzed the resultsand drafted the manuscript. MH assisted the literature review and theusability test. SC offered suggestion and guidance to the research. Allauthors read and approved the final manuscript.
AcknowledgementThis research was supported in part by Taiwan’s Ministry of Economic Affairs,under contract 101-EC-17-A-15-S1-223. The authors are grateful to Mr. Ching-YangKao and Mr. Ming-Fa Lin of United Microelectronics Corporation (UMC),Mr. Yuan-Fu Liao and Mr. Yi-Ti Tsai of CTCI Corporation, Mr. Chien-Chih Lai ofL&K Engineering Corporation and Mr. Ching-Hsien Lee of Research Center forBIM, National Taiwan University for their kind support and assistance in thisresearch. We like to express our appreciation to the interviewees of thesecorporations and organizations.
Author details1Department of Civil Engineering, National Taiwan University, Taipei, Taiwan.2Center for Weather Climate and Disaster Research, National TaiwanUniversity, Taipei, Taiwan. 3Department of Civil Engineering, National TaiwanUniversity, Taipei, Taiwan.
Received: 30 December 2013 Accepted: 5 June 2014
ReferencesBiehl, WH, & Inman, JA. (2010). Energy optimization for water systems. Journal of
American Water Works Association, 102, 6.Calixto, EES, Bordeira, PG, Calazans, HT, Tavares, CAC, & Rodriguez, MTD. (2009).
Plant design project automation using an automatic pipe routing routine.Computer Aided Chemical Engineering, 27, 807–812. doi: 10.1016/S1570-7946(09)70355-4.
Chang, HS, Kang, SC, & Chen, PH. (2009). Systematic procedure of determining anideal color scheme on 4D models. Advanced Engineering Informatics, 23(4),463–473. doi: 10.1016/j.aei.2009.05.002.
Chen, YH, Tsai, MH, Kang, SC, & Liu, CW. (2013). Selection and evaluation of colorscheme for 4D construction models. Journal of Information Technology inConstruction, 18, 1–19.
Deliang, L, & Huibiao, L. (2009). Interfere-check applying to 3D automatic piperoute arrangement. Proceedings of International Conference on ComputationalIntelligence and Software Engineering, Wuhan, 11–13. doi:10.1109/cise.2009.5365920.
Feng, H, Fu, Y, & Li, L. (2012). Layout space modeling for automation design ofpipeline system. Proceedings of 2012 International Conference on Mechatronicsand Automation (ICMA), Chengdu, 5–8. doi:10.1109/icma.2012.6283259.
Gao, Z, Walters, RC, Jaselskis, EJ, & Wipf, TJ. (2006). Approaches to improving thequality of construction drawings from owner's perspective. Journal ofConstruction Engineering and Management, 132(11), 1187–1192. doi: 10.1061/(asce)0733-9364(2006)132:11(1187).
Grootjans, R. (2009). XNA 3.0 Game Programming Recipes: A Problem-SolutionApproach. New York: Apress.
Guirardello, R, & Swaney, RE. (2005). Optimization of process plant layout withpipe routing. Computers and Chemical Engineering, 30(1), 99–114. 10.1016/j.compehemeng.2005.08.009.
Ito, T. (1999). A genetic algorithm approach to piping route path planning.Journal of Intelligent Manufacturing, 10(1), 103–114. 10.1023/a:1008924832167.
Junnila, S, Horvath, A, & Guggemos, AA. (2006). Life-cycle assessment of officebuildings in Europe and the United States. Journal of Infrastructure Systems,12(1), 10–17. doi:10.1061/(asce)1076-0342(2006)12:1(10).
Khanzode, A, Fischer, M, & Reed, D. (2008). Benefits and lessons learned ofimplementing building virtual design and construction (VDC) technologies
for coordination of mechanical, electrical, and plumbing (MEP) systems on alarge healthcare project. Journal of Information Technology in Construction, 13,324–342.
Kim, D, Corne, D, & Ross, P. (1996). Industrial plant pipe-route optimisation withgenetic algorithms. Lecture Notes in Computer Science, 1141, 1012–1021.
Korde, T, Wang, Y, & Russell, A. (2005). Visualization Of Construction Data (pp. 2–4).Toronto, Canada: Proceedings of 6th Construction Specialty Conference.
Kuo, CH, Tsai, MH, & Kang, SC. (2011). A framework of information visualizationfor multi-system construction. Automation in Construction, 20(3), 247–262.10.1016/j.autcon.2010.10.003.
Miller, T, & Johnson, D. (2010). XNA Game Studio 4.0 Programming: Developing forWindows Phone 7 and Xbox 360. Boston: Addison-Wesley Professional.
Mitsuta, T, Kobayashi, Y, Wada, Y, Kiguchi, T, & Yoshinaga, T. (1987). Aknowledge-Based Approach To Routing Problems In Industrial PlantDesign. In Proceedings Of 6th International Workshop on Expert Systems &Their Applications (pp. 28–30). Avignon, France.
Nathan, A. (2006). Windows Presentation Foundation Unleashed. Indianapolis: SamsPublishing.
Newell, RG. (1972). An Interactive Approach To Pipe Routing In Process Plants(pp. 6–10). London: Proceedings of IFIP Congress 71.
Park, JH, & Storch, RL. (2002). Pipe-routing algorithm development: case study ofa ship engine room design. Expert Systems with Applications, 23(3), 299–309.10.1016/s0957-4174(02)00049-0.
Qian, X, Ren, T, & Wang, CE. (2008). A survey of pipe routing design. Proceedingsof 2008 Chinese Control and Decision Conference, Yantai, Shandong,doi:10.1109/ccdc.2008.4598081.
Riley, DR, Varadan, P, James, JS, & Thomas, HR. (2005). Benefit-cost metrics fordesign coordination of mechanical, electrical, and plumbing systems inmultistory buildings. Journal of Construction Engineering and Management,131(8), 877–889. doi: 10.1061/(asce)0733-9364(2005)131:8(877).
Rourke, PW. (1975). Development of a Three-Dimensional Pipe Routing Algorithm.Lehigh University: PhD Dissertation.
Russell, AD, Chiu, CY, & Korde, T. (2009). Visual representation of constructionmanagement data. Automation in Construction, 18(8), 1045–1062. 10.1016/j.autcon.2009.05.006.
Schmidt-Traub, H, Köster, M, Holtkötter, T, & Nipper, N. (1998). Conceptual plantlayout. Computers & Chemical Engineering, 1, S499–S504. 10.1016/S0098-1354(98)00093-3.
Songer, AD, Hays, B, & North, C. (2004). Multidimensional visualization of projectcontrol data. Construction Innovation: Information, Process, Management, 4(3),173–190. 10.1108/14714170410815088.
The American Bureau of Shipping. (2003). Guidance Notes on the Application ofErgonomics to Marine Systems. Houston: American Bureau of Shipping.
Tsai, MH, Kang, SC, & Hsieh, SH. (2010). A three-stage framework for introducing a4D tool in large consulting firms. Advanced Engineering Informatics, 24(4),476–489. 10.1016/j.aei.2010.04.002.
Tsai, MH, Kang, SC, & Hsieh, SH. (2013). Lessons learnt from customization of aBIM tool for a design-build company. Journal of the Chinese Institute ofEngineers, 37(2), 189–199. 10.1080/02533839.2013.781791.
Wang, CP. (2011). An Approach for Assessing Reachability of Wheelchair Users(Master Thesis). National Taiwan University.
Wangdahl, GE, Pollock, S, & Woodward, JB. (1974). Minimum-trajectory piperouting. Journal of Ship Research, 18(1), 44–49.
Zhou, C, & Yin, Y. (2010). Pipe assembly planning algorithm by imitating humanimaginal thinking. Assembly Automation, 30(1), 66–74. 10.1108/01445151011016082.
Zhu, D, & Latombe, JC. (1991). Mechanization of spatial reasoning for automaticpipe layout design. Artificial Intelligence for Engineering, Design, Analysis andManufacturing, 5(1), 1–20. 10.1017/S089006040000250X.
doi:10.1186/s40327-014-0006-yCite this article as: Lee et al.: A visual tool for accessibility study ofpipeline maintenance during design. Visualization in Engineering 2014 1:6.
Related Documents