Research Article Development of Automatic Visceral Fat Volume Calculation Software for CT Volume Data Mitsutaka Nemoto, 1 Tusufuhan Yeernuer, 2 Yoshitaka Masutani, 1 Yukihiro Nomura, 1 Shouhei Hanaoka, 1 Soichiro Miki, 3 Takeharu Yoshikawa, 3 Naoto Hayashi, 3 and Kuni Ohtomo 1 1 Department of Radiology, e University of Tokyo Hospital, 7-3-1 Hongo, Bunkyo-ku, Tokyo 113-8655, Japan 2 Imaging Center, e Second Affiliated Hospital, Xinjiang Medical University, e 2Rd Xiang 38, Nan Hu Dong Road, Urumqi, Xinjiang 830063, China 3 Department of Computational Diagnostic Radiology and Preventive Medicine, e University of Tokyo Hospital, 7-3-1 Hongo, Bunkyo-ku, Tokyo 113-8655, Japan Correspondence should be addressed to Mitsutaka Nemoto; [email protected] Received 2 September 2013; Revised 22 January 2014; Accepted 13 February 2014; Published 20 March 2014 Academic Editor: Mark A. Pereira Copyright © 2014 Mitsutaka Nemoto et al. is is an open access article distributed under the Creative Commons Attribution License, which permits unrestricted use, distribution, and reproduction in any medium, provided the original work is properly cited. Objective. To develop automatic visceral fat volume calculation soſtware for computed tomography (CT) volume data and to evaluate its feasibility. Methods. A total of 24 sets of whole-body CT volume data and anthropometric measurements were obtained, with three sets for each of four BMI categories (under 20, 20 to 25, 25 to 30, and over 30) in both sexes. True visceral fat volumes were defined on the basis of manual segmentation of the whole-body CT volume data by an experienced radiologist. Soſtware to automatically calculate visceral fat volumes was developed using a region segmentation technique based on morphological analysis with CT value threshold. Automatically calculated visceral fat volumes were evaluated in terms of the correlation coefficient with the true volumes and the error relative to the true volume. Results. Automatic visceral fat volume calculation results of all 24 data sets were obtained successfully and the average calculation time was 252.7 seconds/case. e correlation coefficients between the true visceral fat volume and the automatically calculated visceral fat volume were over 0.999. Conclusions. e newly developed soſtware is feasible for calculating visceral fat volumes in a reasonable time and was proved to have high accuracy. 1. Introduction e high correlation between the visceral fat volume and the development of arteriosclerotic diseases is well known [1–5]. Evaluation of the visceral fat volume is crucially important in research on arteriosclerotic diseases. Since direct measure- ment of the visceral fat volume is difficult at clinical sites, substitute indices such as the waist circumference (WC) at umbilicus level, the body mass index (BMI), and the area of the 2D visceral fat region on a CT/MR axial slice at the umbilicus level have been used to evaluate the visceral fat volume. However, the accuracy of these substitute indices is not yet well described in the medical literature. Wei et al. evaluated the three indices (WC, BMI, and percentage of body fat estimated by DXA method) with fasting serum insulin levels along with metabolic syndrome components [6]. Since the DXA method cannot separate visceral and subcutaneous fat, body fat is not only the visceral component but the total of the two components. On the other hand, Janssen et al. used MRI to measure the visceral fat volume and evaluate its association with WC and BMI [7]. Since they used a manual interactive method to segment the images, the whole visceral fat volume was estimated from only five images. An automatic method with a larger number of thin images would be necessary to calculate the volumes more accurately. In recent years, multislice CT scanners have come into global use. To meet the growing demand for reconstructed images, CT volume data has been acquired and accumulated in many institutions. Using the accumulated CT volume data, Hindawi Publishing Corporation Journal of Obesity Volume 2014, Article ID 495084, 7 pages http://dx.doi.org/10.1155/2014/495084

Welcome message from author
This document is posted to help you gain knowledge. Please leave a comment to let me know what you think about it! Share it to your friends and learn new things together.
Transcript

Research ArticleDevelopment of Automatic Visceral Fat VolumeCalculation Software for CT Volume Data
Mitsutaka Nemoto,1 Tusufuhan Yeernuer,2 Yoshitaka Masutani,1
Yukihiro Nomura,1 Shouhei Hanaoka,1 Soichiro Miki,3 Takeharu Yoshikawa,3
Naoto Hayashi,3 and Kuni Ohtomo1
1 Department of Radiology, The University of Tokyo Hospital, 7-3-1 Hongo, Bunkyo-ku, Tokyo 113-8655, Japan2 Imaging Center, The Second Affiliated Hospital, Xinjiang Medical University,The 2Rd Xiang 38, Nan Hu Dong Road, Urumqi, Xinjiang 830063, China
3Department of Computational Diagnostic Radiology and Preventive Medicine,The University of Tokyo Hospital, 7-3-1 Hongo, Bunkyo-ku, Tokyo 113-8655, Japan
Correspondence should be addressed to Mitsutaka Nemoto; [email protected]
Received 2 September 2013; Revised 22 January 2014; Accepted 13 February 2014; Published 20 March 2014
Academic Editor: Mark A. Pereira
Copyright © 2014 Mitsutaka Nemoto et al. This is an open access article distributed under the Creative Commons AttributionLicense, which permits unrestricted use, distribution, and reproduction in any medium, provided the original work is properlycited.
Objective. To develop automatic visceral fat volume calculation software for computed tomography (CT) volume data and toevaluate its feasibility.Methods. A total of 24 sets of whole-body CT volume data and anthropometric measurements were obtained,with three sets for each of four BMI categories (under 20, 20 to 25, 25 to 30, and over 30) in both sexes. True visceral fat volumeswere defined on the basis of manual segmentation of the whole-body CT volume data by an experienced radiologist. Software toautomatically calculate visceral fat volumes was developed using a region segmentation technique based onmorphological analysiswith CT value threshold. Automatically calculated visceral fat volumes were evaluated in terms of the correlation coefficient withthe true volumes and the error relative to the true volume. Results. Automatic visceral fat volume calculation results of all 24 datasets were obtained successfully and the average calculation time was 252.7 seconds/case. The correlation coefficients between thetrue visceral fat volume and the automatically calculated visceral fat volume were over 0.999. Conclusions. The newly developedsoftware is feasible for calculating visceral fat volumes in a reasonable time and was proved to have high accuracy.
1. Introduction
The high correlation between the visceral fat volume and thedevelopment of arteriosclerotic diseases is well known [1–5].Evaluation of the visceral fat volume is crucially importantin research on arteriosclerotic diseases. Since direct measure-ment of the visceral fat volume is difficult at clinical sites,substitute indices such as the waist circumference (WC) atumbilicus level, the body mass index (BMI), and the areaof the 2D visceral fat region on a CT/MR axial slice at theumbilicus level have been used to evaluate the visceral fatvolume. However, the accuracy of these substitute indicesis not yet well described in the medical literature. Wei etal. evaluated the three indices (WC, BMI, and percentageof body fat estimated by DXA method) with fasting serum
insulin levels along with metabolic syndrome components[6]. Since the DXA method cannot separate visceral andsubcutaneous fat, body fat is not only the visceral componentbut the total of the two components. On the other hand,Janssen et al. used MRI to measure the visceral fat volumeand evaluate its association withWC and BMI [7]. Since theyused a manual interactive method to segment the images,the whole visceral fat volume was estimated from only fiveimages. An automatic method with a larger number of thinimages would be necessary to calculate the volumes moreaccurately.
In recent years, multislice CT scanners have come intoglobal use. To meet the growing demand for reconstructedimages, CT volume data has been acquired and accumulatedinmany institutions. Using the accumulated CT volume data,
Hindawi Publishing CorporationJournal of ObesityVolume 2014, Article ID 495084, 7 pageshttp://dx.doi.org/10.1155/2014/495084

2 Journal of Obesity
CT image
(1) Rescaling
(2) Extraction of body trunk region(3) Segmentation of body trunk region
(4) Delineation of visceral region
(5) Volume calculation of visceral fat region
Visceral fat volume
(a) Bone regions (b) Muscle regions
(c) Fat regions (d) Air regions
(b) White = visceral region(a) White = bone + muscle + air
Figure 1: Flowchart of proposed fat volume calculation method.
it is possible to calculate a patient’s visceral fat volume bymanual segmentation of the visceral fat region in every slice ofthe CT volume data. However, since this manual calculationof the visceral fat volume is extremely time-consuming, ithas not been used in previous large-scale studies. Automaticvisceral fat calculation software would be a useful tool forlarge-scale research with accumulated CT volume data.
Although software for calculating the visceral fat volumefrom CT volume data has been developed [8, 9], the calcu-lation range did not include the entire visceral fat volume.To date, there has been no published literature on automaticvisceral calculation software that calculates the entire visceralfat volume, which would be indispensable for processing amassive amount of CT volume data sets.
Although some software for measuring the 3D fat volumefrom thick-slice 3D MR data has been developed [10, 11],MRI data is not accumulated over a wide abdominal rangein medical institutions because MRI scanning with a wideabdominal range is not common.
The purpose of this study is to develop automatic calcula-tion software to calculate the entire visceral fat volume fromCT volume data and to evaluate its feasibility.
2. Materials and Methods
We used 24 sets of whole-body CT volume data with anthro-pometric measurement data. All the CT volumes (voxel size:

Journal of Obesity 3
(a) Automatically extracted fat regions
(b) True fat regions
Figure 2: Example of successful automatic extraction of fat regions. Red/blue regions are visceral/subcutaneous fat regions.
0100020003000400050006000700080009000
0 1000 2000 3000 4000 5000 6000 7000 8000 9000
MaleFemale
Automatically calculated visceral fat volume (cm3)
True
fat v
olum
e (cm
3)
Figure 3: Correlation between automatically calculated visceral fatvolumes and true volumes.The correlation coefficient for the femaledata set is 0.9998 and the coefficient for the male data set is 0.9999.
0.98×0.98×1.25mm3) were scanned by a GE Light Speed CTscanner (16 detector row system, 120 kVp, auto (30–210)mA,500mm FOV, rotation time of 0.5 seconds, and moving tablespeed of 70mm/second). These CT volumes were obtainedfrom November 2006 to November 2008 at our institution.To represent various body types (from thin to obese) and bothgenders in equal numbers, three subjects were selected from
each of four BMI categories for both sexes: values under 20,from 20 to 25, from 25 to 30, and over 30. This study wasapproved by the Ethical Review Board of our institution, andinformed consent was obtained for the use of the CT volumedata and anthropometric measurement data.
The true visceral fat region was defined as the region withCT values from −190 to −30 Hounsfield units (HU) [12] inthe region between the diaphragm at the cranial end andthe axial plane with the cranial edge of the pubic symphysisat the caudal end and in the peritoneal or retroperitonealregion manually segmented by a radiologist with 18 yearsof CT-reading experience. In the manual segmentation,the radiologist was supervised by another radiologist withexperience in research on CT segmentation.The true visceralfat volume was measured from the true visceral fat region.
Software to automatically calculate the true visceral fatvolume was developed using region segmentation based onmorphological analysis with CT value thresholding. Detailsof the calculation method and implementation are describedlater. The calculated visceral fat volume is defined as thevolume calculated automatically with this software.
The true visceral fat volume and calculated visceral fatvolume of 24 subjects were compared by correlation analysis,and the ratio of error including calculated visceral fat volumewas also evaluated.
Three major indices used as substitutes for visceral fatvolumes, that is, the WC at the umbilicus level, the BMI, and
4 Journal of Obesity
0100020003000400050006000700080009000
10.0 15.0 20.0 25.0 30.0 35.0 40.0BMI
MaleFemale
Regression line (male)Regression line (female)
True
fat v
olum
e (cm
3)
y = 356.53x − 5311.4
y = 267.51x − 4048.4
(a) BMI
0100020003000400050006000700080009000
60 70 80 90 100 110 120
MaleFemale
Regression line (male)Regression line (female)
WC (cm)
True
fat v
olum
e (cm
3)
y = 120.86x − 7105
y = 97.365x − 6015.1
(b) WC at umbilical level
0100020003000400050006000700080009000
0 50 100 150 200 250
Visceral fat area on axial slice (cm2)
MaleFemale
Regression line (male)Regression line (female)
True
fat v
olum
e (cm
3)
y = 32.458x − 175.26
y = 26.936x − 42.83
(c) Visceral fat area on axial CT slice at umbilical level
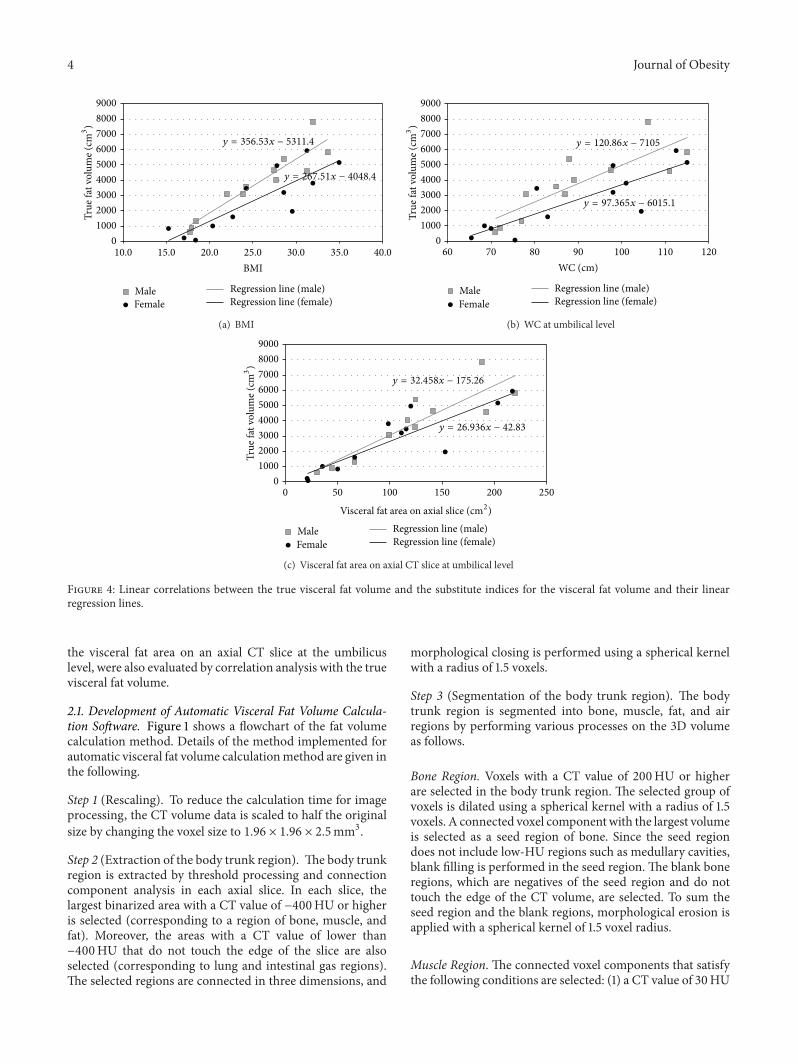
Figure 4: Linear correlations between the true visceral fat volume and the substitute indices for the visceral fat volume and their linearregression lines.
the visceral fat area on an axial CT slice at the umbilicuslevel, were also evaluated by correlation analysis with the truevisceral fat volume.
2.1. Development of Automatic Visceral Fat Volume Calcula-tion Software. Figure 1 shows a flowchart of the fat volumecalculation method. Details of the method implemented forautomatic visceral fat volume calculationmethod are given inthe following.
Step 1 (Rescaling). To reduce the calculation time for imageprocessing, the CT volume data is scaled to half the originalsize by changing the voxel size to 1.96 × 1.96 × 2.5mm3.
Step 2 (Extraction of the body trunk region). The body trunkregion is extracted by threshold processing and connectioncomponent analysis in each axial slice. In each slice, thelargest binarized area with a CT value of −400HU or higheris selected (corresponding to a region of bone, muscle, andfat). Moreover, the areas with a CT value of lower than−400HU that do not touch the edge of the slice are alsoselected (corresponding to lung and intestinal gas regions).The selected regions are connected in three dimensions, and
morphological closing is performed using a spherical kernelwith a radius of 1.5 voxels.
Step 3 (Segmentation of the body trunk region). The bodytrunk region is segmented into bone, muscle, fat, and airregions by performing various processes on the 3D volumeas follows.
Bone Region. Voxels with a CT value of 200HU or higherare selected in the body trunk region. The selected group ofvoxels is dilated using a spherical kernel with a radius of 1.5voxels. A connected voxel component with the largest volumeis selected as a seed region of bone. Since the seed regiondoes not include low-HU regions such as medullary cavities,blank filling is performed in the seed region. The blank boneregions, which are negatives of the seed region and do nottouch the edge of the CT volume, are selected. To sum theseed region and the blank regions, morphological erosion isapplied with a spherical kernel of 1.5 voxel radius.
Muscle Region. The connected voxel components that satisfythe following conditions are selected: (1) a CT value of 30HU

Journal of Obesity 5
(a) Example of overestimating visceral fat within muscle layers (left: automatically extracted result and right: true region)
(b) Another example of overestimating visceral fat within muscle (left: automatically extracted result and right: true region)
Figure 5: Examples of overestimation of visceral fat area by the proposed software.
or higher, (2) no bone contained in the component, (3) adistance from the body surface of five voxels or more, and(4) a volume of 20 voxels (≒190mm3) or more.
Air Region. Connected voxel components with a CT value ofless than −220HU are selected.
Visceral and Subcutaneous Fat Region. Connected voxelcomponents whose CT value ranges from −190 to −30HU[12] are selected from the body trunk region, excluding thecombined regions of bone, muscle, and air. Morphologicalclosing with a spherical kernel of 1.0 voxel radius is applied tothe combined regions beforehand to avoid the misextractionof false positive regions from intermuscular fat regions, theneighborhood of the air region boundary having similar CTvalues to the fat regions, and image noise.
Next, the superior-inferior range of fat volume mea-surement is defined as follows. The superior end surface isobtained by radial basis function interpolation [13] for thecaudal planes of the left and right lung regions, which arethe largest and the second largest air regions. The inferiorlimit is defined as the horizontal plane including the pubicsymphysis. To detect the level of the pubic symphysis, theanteriormost bony voxel is searched in a midsagittal slabwhose thickness is 9.8mm (=5 voxels).
Step 4 (Delineation of the visceral region). From the bone,muscle, and air regions obtained by the above processing,the visceral region is drawn to include the abdominal wallmuscle, abdominal organs, and visceral fat. Namely, mor-phological dilation processing is performed using a sphericalkernel with a radius of 20.0 voxels on the seeds of the visceralregion consisting of muscle, bone, and air regions. Afterthe blanks of the dilated combined region are extracted andadded to the dilated region, morphological erosion using aspherical kernel with a 20.0 voxel radius is applied to thecombined region.
Step 5 (Volume calculation of the visceral fat region). Allfat regions are classified as either visceral fat tissue orsubcutaneous fat tissue. Fat regions inside the visceral regionare classified as visceral fat regions, while fat regions outsidethe visceral region are classified as subcutaneous fat regions.
In this study, the fat volume calculation software based onthe proposed method is implemented in C++ language. Thedeveloped software handles DICOM-format CT data. Thedeveloped software is operated throughCIRCUSCS (ClinicalInfrastructure for Radiologic Computation of United Solu-tions Clinical Server) [14], which is a web-based integratedplatform system for the development and assessment ofvarious types of medical image analysis software.

6 Journal of Obesity
Table 1: List of data sets with substitute indices for visceral fat volume, calculated true visceral fat volume, and automatically calculatedvisceral fat volume.
Height (m) Weight (kg) Substitute indices Visceral fat volumes Absolute error ofvisceral fat volume
(cm3)BMI (kg/m2)Waist
circumference(cm)
Visceral fatarea (cm2) True (cm3) Calculated
(cm3)
Female
1.64 41 15.2 70.0 50 833 926 931.57 42 17.0 65.5 21 216 243 271.53 43 18.4 75.5 22 73 195 1221.47 44 20.4 68.5 36 1003 1054 511.44 47 22.7 83.0 66 1598 1697 991.56 59 24.2 80.5 116 3463 3565 1021.53 65 27.8 98.0 120 4955 5076 1211.40 56 28.6 98.0 111 3198 3340 1421.55 71 29.6 104.5 153 1955 2026 711.57 77 31.2 112.5 217 5936 6149 2131.47 69 31.9 101.0 99 3805 3910 1051.55 84 35.0 115.0 203 5159 5426 267
Male
1.68 50 17.7 71.0 30 603 624 211.62 47 17.9 72.0 44 891 908 171.79 59 18.4 77.0 66 1306 1348 421.68 62 22.0 78.0 99 3074 3239 1651.56 58 23.8 87.0 99 3081 3266 1851.65 66 24.2 85.0 124 3583 3726 1431.75 84 27.4 97.5 141 4647 4820 1731.71 81 27.7 89.0 117 4029 4137 1081.61 74 28.5 88.0 125 5393 5595 2021.58 78 31.2 111.0 192 4587 4748 1611.77 100 31.9 106.0 188 7837 8170 3331.80 109 33.6 115.0 220 5819 6069 250
The computer used to calculate the visceral fat volumeshas an Intel Quad Xeon CPU 2.0GHz processor and 3.0GBRAM with Windows XP SP 2 installed.
3. Results
Automatic calculation results for the visceral fat volume fromall 24 sets of CT volume data were successfully obtained withthe developed software. The average calculation time was252.7 seconds with a standard deviation of 66.7 seconds. Aselection of automatically segmented fat regions is shown inFigure 2.
The true visceral fat volume and calculated visceral fatvolume for each data set are shown in Table 1. Scatteredcorrelation diagrams between the true visceral fat volumeand the visceral fat volume calculated with our softwareshowed a strong linear correlation (Figure 3).The correlationcoefficients between the true visceral fat volume and theautomatically calculated visceral fat volume were 0.9998 formales and 0.9995 for females. The median error ratio onthe automatic calculation was 3.73% for males and 4.76% for
females. Higher error rates were seen for cases with a lowBMI.
All these substitute indices (BMI, WC at umbilicus level,and area of 2D visceral fat region on axial CT slice atumbilicus level) showed a positive correlation with the truevisceral fat volume (Figure 4) and also with the calculatedtrue visceral fat volume. The correlation coefficients of thethree substitute indices are shown in Table 2. The correlationcoefficients differedwith the genders and the substitute index.
4. Discussion
Software to automatically calculate the entire visceral fatvolume from CT volume data was successfully developed.The software proved to be feasible for calculating the visceralfat volume with high accuracy in a reasonably short time.To the best of our knowledge, this is the first software toautomatically calculate the entire visceral fat volume in theregion from the upper abdomen to the pelvis. By applyingthe developed software through theCIRCUSplatform, a largequantity of CT volume data can be processed automatically.This will be a useful tool in large-scale research involving
Journal of Obesity 7
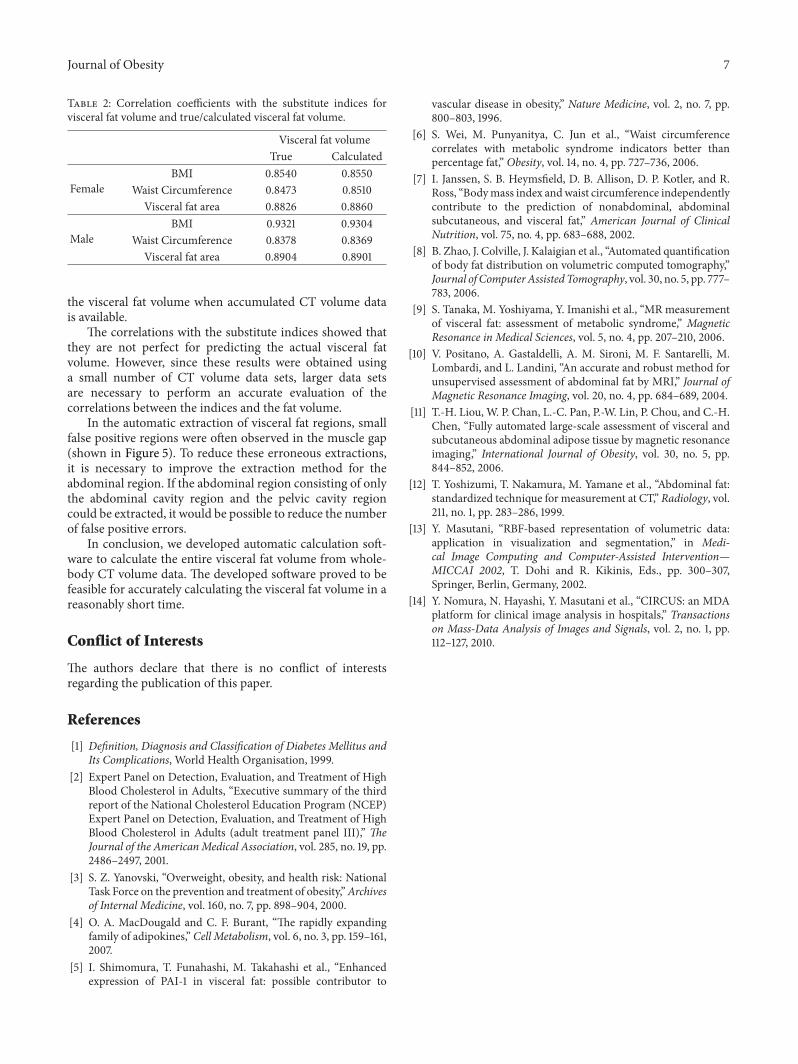
Table 2: Correlation coefficients with the substitute indices forvisceral fat volume and true/calculated visceral fat volume.
Visceral fat volumeTrue Calculated
FemaleBMI 0.8540 0.8550
Waist Circumference 0.8473 0.8510Visceral fat area 0.8826 0.8860
MaleBMI 0.9321 0.9304
Waist Circumference 0.8378 0.8369Visceral fat area 0.8904 0.8901
the visceral fat volume when accumulated CT volume datais available.
The correlations with the substitute indices showed thatthey are not perfect for predicting the actual visceral fatvolume. However, since these results were obtained usinga small number of CT volume data sets, larger data setsare necessary to perform an accurate evaluation of thecorrelations between the indices and the fat volume.
In the automatic extraction of visceral fat regions, smallfalse positive regions were often observed in the muscle gap(shown in Figure 5). To reduce these erroneous extractions,it is necessary to improve the extraction method for theabdominal region. If the abdominal region consisting of onlythe abdominal cavity region and the pelvic cavity regioncould be extracted, it would be possible to reduce the numberof false positive errors.
In conclusion, we developed automatic calculation soft-ware to calculate the entire visceral fat volume from whole-body CT volume data. The developed software proved to befeasible for accurately calculating the visceral fat volume in areasonably short time.
Conflict of Interests
The authors declare that there is no conflict of interestsregarding the publication of this paper.
References
[1] Definition, Diagnosis and Classification of Diabetes Mellitus andIts Complications, World Health Organisation, 1999.
[2] Expert Panel on Detection, Evaluation, and Treatment of HighBlood Cholesterol in Adults, “Executive summary of the thirdreport of the National Cholesterol Education Program (NCEP)Expert Panel on Detection, Evaluation, and Treatment of HighBlood Cholesterol in Adults (adult treatment panel III),” TheJournal of the AmericanMedical Association, vol. 285, no. 19, pp.2486–2497, 2001.
[3] S. Z. Yanovski, “Overweight, obesity, and health risk: NationalTask Force on the prevention and treatment of obesity,”Archivesof Internal Medicine, vol. 160, no. 7, pp. 898–904, 2000.
[4] O. A. MacDougald and C. F. Burant, “The rapidly expandingfamily of adipokines,” Cell Metabolism, vol. 6, no. 3, pp. 159–161,2007.
[5] I. Shimomura, T. Funahashi, M. Takahashi et al., “Enhancedexpression of PAI-1 in visceral fat: possible contributor to
vascular disease in obesity,” Nature Medicine, vol. 2, no. 7, pp.800–803, 1996.
[6] S. Wei, M. Punyanitya, C. Jun et al., “Waist circumferencecorrelates with metabolic syndrome indicators better thanpercentage fat,” Obesity, vol. 14, no. 4, pp. 727–736, 2006.
[7] I. Janssen, S. B. Heymsfield, D. B. Allison, D. P. Kotler, and R.Ross, “Bodymass index andwaist circumference independentlycontribute to the prediction of nonabdominal, abdominalsubcutaneous, and visceral fat,” American Journal of ClinicalNutrition, vol. 75, no. 4, pp. 683–688, 2002.
[8] B. Zhao, J. Colville, J. Kalaigian et al., “Automated quantificationof body fat distribution on volumetric computed tomography,”Journal of Computer Assisted Tomography, vol. 30, no. 5, pp. 777–783, 2006.
[9] S. Tanaka, M. Yoshiyama, Y. Imanishi et al., “MR measurementof visceral fat: assessment of metabolic syndrome,” MagneticResonance in Medical Sciences, vol. 5, no. 4, pp. 207–210, 2006.
[10] V. Positano, A. Gastaldelli, A. M. Sironi, M. F. Santarelli, M.Lombardi, and L. Landini, “An accurate and robust method forunsupervised assessment of abdominal fat by MRI,” Journal ofMagnetic Resonance Imaging, vol. 20, no. 4, pp. 684–689, 2004.
[11] T.-H. Liou, W. P. Chan, L.-C. Pan, P.-W. Lin, P. Chou, and C.-H.Chen, “Fully automated large-scale assessment of visceral andsubcutaneous abdominal adipose tissue by magnetic resonanceimaging,” International Journal of Obesity, vol. 30, no. 5, pp.844–852, 2006.
[12] T. Yoshizumi, T. Nakamura, M. Yamane et al., “Abdominal fat:standardized technique for measurement at CT,” Radiology, vol.211, no. 1, pp. 283–286, 1999.
[13] Y. Masutani, “RBF-based representation of volumetric data:application in visualization and segmentation,” in Medi-cal Image Computing and Computer-Assisted Intervention—MICCAI 2002, T. Dohi and R. Kikinis, Eds., pp. 300–307,Springer, Berlin, Germany, 2002.
[14] Y. Nomura, N. Hayashi, Y. Masutani et al., “CIRCUS: an MDAplatform for clinical image analysis in hospitals,” Transactionson Mass-Data Analysis of Images and Signals, vol. 2, no. 1, pp.112–127, 2010.

Submit your manuscripts athttp://www.hindawi.com
Stem CellsInternational
Hindawi Publishing Corporationhttp://www.hindawi.com Volume 2014
Hindawi Publishing Corporationhttp://www.hindawi.com Volume 2014
MEDIATORSINFLAMMATION
of
Hindawi Publishing Corporationhttp://www.hindawi.com Volume 2014
Behavioural Neurology
EndocrinologyInternational Journal of
Hindawi Publishing Corporationhttp://www.hindawi.com Volume 2014
Hindawi Publishing Corporationhttp://www.hindawi.com Volume 2014
Disease Markers
Hindawi Publishing Corporationhttp://www.hindawi.com Volume 2014
BioMed Research International
OncologyJournal of
Hindawi Publishing Corporationhttp://www.hindawi.com Volume 2014
Hindawi Publishing Corporationhttp://www.hindawi.com Volume 2014
Oxidative Medicine and Cellular Longevity
Hindawi Publishing Corporationhttp://www.hindawi.com Volume 2014
PPAR Research
The Scientific World JournalHindawi Publishing Corporation http://www.hindawi.com Volume 2014
Immunology ResearchHindawi Publishing Corporationhttp://www.hindawi.com Volume 2014
Journal of
ObesityJournal of
Hindawi Publishing Corporationhttp://www.hindawi.com Volume 2014
Hindawi Publishing Corporationhttp://www.hindawi.com Volume 2014
Computational and Mathematical Methods in Medicine
OphthalmologyJournal of
Hindawi Publishing Corporationhttp://www.hindawi.com Volume 2014
Diabetes ResearchJournal of
Hindawi Publishing Corporationhttp://www.hindawi.com Volume 2014
Hindawi Publishing Corporationhttp://www.hindawi.com Volume 2014
Research and TreatmentAIDS
Hindawi Publishing Corporationhttp://www.hindawi.com Volume 2014
Gastroenterology Research and Practice
Hindawi Publishing Corporationhttp://www.hindawi.com Volume 2014
Parkinson’s Disease
Evidence-Based Complementary and Alternative Medicine
Volume 2014Hindawi Publishing Corporationhttp://www.hindawi.com
Related Documents