Hindawi Publishing Corporation ISRN Analytical Chemistry Volume 2013, Article ID 851713, 14 pages http://dx.doi.org/10.1155/2013/851713 Research Article Determination of 25 Trace Element Concentrations in Biological Reference Materials by ICP-MS following Different Microwave-Assisted Acid Digestion Methods Based on Scaling Masses of Digested Samples S. M. Enamorado-Báez, 1,2 J. M. Abril, 2 and J. M. Gómez-Guzmán 3 1 Centro Nacional de Aceleradores (CNA), Universidad de Sevilla, omas Alba Edison 7, 41092 Seville, Spain 2 Departamento de Fisica Aplicada I, E.T.S. de Ingenieria Agronomica, Universidad de Sevilla, Carretera Utrera km. 1, 41013 Seville, Spain 3 Technische Universit¨ at M¨ unchen, Physics Department E12, James-Franck-Straße 1, 85748 Garching bei M¨ unchen, Germany Correspondence should be addressed to J. M. G´ omez-Guzm´ an; [email protected] Received 28 April 2013; Accepted 26 May 2013 Academic Editors: H. Alemu, G. Drochioiu, D. J. Fletouris, F. Kandemirli, A. Orte, and I. Zhukov Copyright © 2013 S. M. Enamorado-B´ aez et al. is is an open access article distributed under the Creative Commons Attribution License, which permits unrestricted use, distribution, and reproduction in any medium, provided the original work is properly cited. e use of normalized procedures designed for soil and sediment samples (like US-EPA 3051) to chemically prepare some kind of organic samples is a common practice in some laboratories. However, the performance of this method for other matrices has to be demonstrated. ree microwave-assisted digestion procedures with 0.5 g of sample and simplified reagents (10 mL HNO 3 alone and mixtures of HNO 3 /HCl- and HNO 3 /H 2 O 2 procedures A, B, and C, resp.) were compared for quantitative determination of 25 elements (Be, B, Al, Ti, V, Cr, Mn, Fe, Co, Ni, Cu, Zn, As, Se, Sr, Mo, Ag, Cd, Sb, Cs, Ba, Tl, Pb, and U) in three biological reference materials provided by NIST (mussel tissue (MT), tomato leaves (TL), and milk powder (MP)) by ICP-MS. From scaling masses (from 0.1 up to 0.9 g at 0.1 g interval) in procedure A, a linear relationship among instrumental signal and mass of digested sample could be constructed at 99% CL for most of the target analytes. e slope of this linear fit provided the estimation of sample concentration, while the ordinate in origin allowed the identification of matrix interferences which were absent in the reagent blank. 1. Introduction Inductively coupled plasma mass spectrometry (ICP-MS) is a robust and widely used technique for multielemental and isotopic analysis of environmental materials [1–3] that has shown clear advantages when compared with other analytical techniques such as inductively coupled plasma atomic emis- sion spectrometry (ICP-AES) [4–6], flame atomic absorption spectrometry (F-AAS), and electrothermal atomic absorption spectrometry (ET-AAS) [7, 8]. e basic setup for ICP-MS analysis requires the sample introduction as a liquid solution and thus, for solid matrices, an acid digestion procedure becomes mandatory. Sample digestion is mainly carried out by a fusion or a wet procedure based on an acid digestion with a heated mixture of mineral acids [2, 9–13]. In general, closed digestion systems are to be preferred to minimize possible contamination of the digest, increase reproducibility, and avoid losses of volatile elements [14–17]. Wet microwave digestion equipped with temperature and pressure control assisted by common min- eral acids, such as nitric, sulphuric, perchloric and hydrochlo- ric acids, is frequently used for sample digestion [18]. In order to dissolve the silicates and eliminate the effects of silica gel in environmental samples, hydrofluoric and or- thoboric acids are usually used, although they can produce unsatisfactory recoveries in volatile elements [19, 20]. A mix- ture of nitric acid and hydrogen peroxide is widely employed because they mineralise organic matter effectively and pro- duce less spectral interference in ICP analyses [1]. Nitric acid has been reported to be strong enough to solubilize metals

Welcome message from author
This document is posted to help you gain knowledge. Please leave a comment to let me know what you think about it! Share it to your friends and learn new things together.
Transcript

Hindawi Publishing CorporationISRN Analytical ChemistryVolume 2013, Article ID 851713, 14 pageshttp://dx.doi.org/10.1155/2013/851713
Research ArticleDetermination of 25 Trace Element Concentrations inBiological Reference Materials by ICP-MS following DifferentMicrowave-Assisted Acid Digestion Methods Based onScaling Masses of Digested Samples
S. M. Enamorado-Báez,1,2 J. M. Abril,2 and J. M. Gómez-Guzmán3
1 Centro Nacional de Aceleradores (CNA), Universidad de Sevilla, Thomas Alba Edison 7, 41092 Seville, Spain2Departamento de Fisica Aplicada I, E.T.S. de Ingenieria Agronomica, Universidad de Sevilla, Carretera Utrera km. 1,41013 Seville, Spain
3 Technische Universitat Munchen, Physics Department E12, James-Franck-Straße 1, 85748 Garching bei Munchen, Germany
Correspondence should be addressed to J. M. Gomez-Guzman; [email protected]
Received 28 April 2013; Accepted 26 May 2013
Academic Editors: H. Alemu, G. Drochioiu, D. J. Fletouris, F. Kandemirli, A. Orte, and I. Zhukov
Copyright © 2013 S. M. Enamorado-Baez et al. This is an open access article distributed under the Creative Commons AttributionLicense, which permits unrestricted use, distribution, and reproduction in any medium, provided the original work is properlycited.
The use of normalized procedures designed for soil and sediment samples (like US-EPA 3051) to chemically prepare some kind oforganic samples is a common practice in some laboratories. However, the performance of this method for other matrices has tobe demonstrated. Three microwave-assisted digestion procedures with 0.5 g of sample and simplified reagents (10mL HNO
3alone
and mixtures of HNO3/HCl- and HNO
3/H2O2procedures A, B, and C, resp.) were compared for quantitative determination of
25 elements (Be, B, Al, Ti, V, Cr, Mn, Fe, Co, Ni, Cu, Zn, As, Se, Sr, Mo, Ag, Cd, Sb, Cs, Ba, Tl, Pb, Th and U) in three biologicalreference materials provided by NIST (mussel tissue (MT), tomato leaves (TL), and milk powder (MP)) by ICP-MS. From scalingmasses (from 0.1 up to 0.9 g at 0.1 g interval) in procedure A, a linear relationship among instrumental signal and mass of digestedsample could be constructed at 99% CL for most of the target analytes.The slope of this linear fit provided the estimation of sampleconcentration, while the ordinate in origin allowed the identification ofmatrix interferences whichwere absent in the reagent blank.
1. Introduction
Inductively coupled plasma mass spectrometry (ICP-MS) isa robust and widely used technique for multielemental andisotopic analysis of environmental materials [1–3] that hasshown clear advantages when compared with other analyticaltechniques such as inductively coupled plasma atomic emis-sion spectrometry (ICP-AES) [4–6], flame atomic absorptionspectrometry (F-AAS), and electrothermal atomic absorptionspectrometry (ET-AAS) [7, 8]. The basic setup for ICP-MSanalysis requires the sample introduction as a liquid solutionand thus, for solid matrices, an acid digestion procedurebecomes mandatory.
Sample digestion ismainly carried out by a fusion or a wetprocedure based on an acid digestion with a heated mixture
ofmineral acids [2, 9–13]. In general, closed digestion systemsare to be preferred tominimize possible contamination of thedigest, increase reproducibility, and avoid losses of volatileelements [14–17]. Wet microwave digestion equipped withtemperature and pressure control assisted by common min-eral acids, such as nitric, sulphuric, perchloric and hydrochlo-ric acids, is frequently used for sample digestion [18].
In order to dissolve the silicates and eliminate the effectsof silica gel in environmental samples, hydrofluoric and or-thoboric acids are usually used, although they can produceunsatisfactory recoveries in volatile elements [19, 20]. A mix-ture of nitric acid and hydrogen peroxide is widely employedbecause they mineralise organic matter effectively and pro-duce less spectral interference in ICP analyses [1]. Nitric acidhas been reported to be strong enough to solubilize metals

2 ISRN Analytical Chemistry
from fly ashes [21], from soils with organic carbon contentup to 38% [22], and from plant materials for environmentalmonitoring [23]. However, in general, plant samples require amore complete decomposition procedure due to the presenceof high organic and/or silicon contents [24].
The use of normalized procedures for soil and sedimentsamples to prepare some kind of organic sample is a commonpractice.The US-EPA 3051 [25] proposes to use a representa-tive amount of sample of 0.5 g digested with 10mL of concen-trated nitric acid. For some cases this method also proposesthe use of the same amount of sample digested in a mixtureof 9mL of concentrated nitric acid and 3mL of concentratedhydrochloric acid. In the US-EPA 3052 [26] method, a rep-resentative sample of up to 0.5 g is digested in 9mL of con-centrated nitric acid, and usually 3mL hydrofluoric acid,although the method has provisions for scaling the samplesize up to a maximum of 1.0 g and enables the analyst toselect other decomposition reagents. The use of hydrofluoricacid requires strict safety procedures, and it can damage theglass components during instrumental analysis if its excesswas not previously removed from the samples. Apart fromthe normalized US-EPA methods, other digestion methodscan be extracted from the specialized literature and used withparticular samples [27]. Thus, in this work, we will studythe performance of methods based on the use of just nitricacid compared with those using a combination of nitric acidand hydrochloric acid or hydrogen peroxide. These optionswere chosen on the basis of widespread usage and seeminglyminimal contribution to ICP-MS spectral interferences.
In this work, we will be concerned with the analysis ofbiological samples with different characteristics to show theversatility of the procedures, although this is far away frombeing a universal procedure due to the limited number of cer-tifiedmaterials used.The acid digestionmethods proposed inthe literature are used in the preparation of soil, sediments,and other complexmatrices for a limited number of elements.TheUS-EPAmethods pursuit the acid digestion and allow thequantification of up to 26 elements (Al, Sb, As, B, Ba, Be, Cd,Ca, Cr, Co, Cu, Fe, Pb, Mg, Mn, Hg, Mo, Ni, K, Se, Ag, Na, Sr,Th,V, andZn).Theperformance of thismethod for other ana-lytes and/or matrices has to be demonstrated. Instrumentaldevelopments in both, ICP-MS andmicrowave digestion sys-tems, and the need of limiting the use of hazardous acids leadto an increasing interest in the improvement and updating ofsample digestion methods [1, 2, 28–32]. Until now, standardmethods for soils and/or sediments have been directly appliedto the preparation of organic samples. In this work, we willtry to justify the use of those methods for organic samplesand, depending on the results obtained, determine anotheralternative method which could give better results. For thatreason, we have made a digestion procedure using only nitricacid (similar to the US-EPA 3051 method established forsediments, sludges, soils, and oils) but increasing the samplemass to acid volume ratio. Also, digestion procedures basedon the use of a combination of nitric acid and hydrochloricacid or hydrogen peroxide have been checked.
The effect of microwave digestions with different reagentswill be tested on 25 different elements determined throughthe ICP-MS technique in three different biological standard
referencematerials (SRMs) provided by theNational Instituteof Standards and Technology (NIST). The amount of samplewill be scaled from 0.1 up to 0.9 g using just nitric acid. Thestudy of the instrumental signal versus the sample mass willenable a quality test, when a good linearity is found, andwill allow the determination of analyte concentration in thesample from the slope. Furthermore, an ordinate in origin dif-ferent from zero at a fixed confidence level will serve to iden-tifymatrix effects noncompensated by a background subtrac-tion based upon conventional digestion (reagents) blanks.Comparison between direct determination of concentrationsbased on dilution factors and the corresponding determinedfrom the linear fit will serve to identify the mass distribu-tion with unacceptable results. This, along with the study ofrelative uncertainties, will allow the construction of a figureof merit to find out the most suitable sample amount inthe digest. Finally, a comparative study of three different di-gestion procedures applied to the SRM samples will be ac-complished.
2. Experimental
2.1. Sample Materials and Reagents. In this work, the follow-ing biological standard reference materials (SRMs) providedby theNational Institute of Standards andTechnology (NIST)were used: SRM 1549 nonfat milk powder (referred hereafteras MP) [33], SRM 2976 mussel tissue (referred hereafter asMT) [34], and SRM 1573a tomato leaves (referred hereafteras TL) [35]. SRM 1549 was prepared by NIST to provideassistance in overcoming the difficulties in accurate traceand ultratrace levels analyses of food and other biologicalimportant materials (some of its certified elements haveconcentrations below 0.01mg kg−1), and its certified majorconstituents with concentrations above 1% (dry mass basis)are calcium, chlorine, phosphorus, and potassium. SRM 2976were collected by the International Atomic Energy Agency(IAEA) from the Mediterranean coast of France as part ofan effort to investigate metal speciation in the marine en-vironment and its major constituents with concentrationsabove 1% (dry mass basis) are chlorine and sodium. Finally,SRM 1573a were obtained by the NIST from plants at theHorticultural Research Farm at Rock Springs, PA (USA). Itwas produced to evaluate the analyses of some elements inbotanical materials and agricultural food products, and itscertified major constituents with concentrations above 1%(dry mass basis) are calcium, nitrogen and potassium.
All reagents used for the microwave-assisted digestions,that is, hydrochloric acid (36%HCl), nitric acid (69%HNO
3)
and hydrogen peroxide (30% H2O2), were of suprapur grade
(Merck,Darmstadt,Germany).High-puritywater (18MΩ cm)from aMilli-Qwater purification system (Millipore, Bedford,USA) was used for dilution of the standards, for preparingsamples throughout the chemical process, and for final rins-ing of the acid-cleaned vessels, glasses, and plastic utensils.
Before use, all glass and plastic utensils were thoroughlyacid cleaned and then rinsed with Milli-Q water. Moreover,prior to the use of the tetrafluoroethylene (PTFE-TFM) ves-sels, the following cleaning procedure was carried out: 10mLof concentrated HNO
3was added to each vessel, and, once

ISRN Analytical Chemistry 3
Table 1: Instrumental settings and calibration for ICP-MS.
ICP-MS instrumentForward power 1300WSampler and skimmer cones NickelArgon flow rates
Cool gas 14.5 Lmin−1
Auxiliary 0.76 Lmin−1
Nebuliser 0.92 Lmin−1
Acquisition parametersIon monitoring mode
Number of sweeps 60Channels per mass 1Dwell time 10msNumber of main runs 3
Survey modeCannels per mass 10Sweeps 10Dwell time 0.6ms
Internal standards 6Li, 45Sc, 115In, 159Tb, 209Bi
closed, the temperature was raised to 180∘C within 15minand held at this temperature for 10min. After cooling, thecontent of the vessels were discarded; PTFE-TFMvesselsweresoaked overnight with diluted HNO
3and then were rinsed
with double deionised water.The external calibration solutions must include known
concentrations of each target analyte. They were preparedfrom standard certified elemental solutions (Cromlab) andMilli-Q water containing 1% HNO
3to get a range of con-
centrations: 0.5, 2.5, 5.0, 25.0, 50.0, and 250𝜇g L−1 (for allelements except for Se, which were fivefold higher). A blanksolution consisting in Milli-Q water containing 1% HNO
3
completed the calibration curve (counts versus 𝜇g L−1) foreach analyte.
The nonspectral matrix effects associated to the ICP-MSmeasurements were resolved by the addition of internal stan-dards.The standard solution was prepared by diluting single-elemental stock solutions with Milli-Q water containing 1%HNO
3up to get 50 𝜇g L−1 of indium, terbium and bismuth,
500𝜇g L−1 scandium and 1000 𝜇g L−1 lithium.
2.2. Analytical Instrumentation. An inductively coupled plas-ma mass spectrometry system Thermo Elemental ICP-MSX7 (Thermo Fisher, Cambridge, UK) with quadrupole massanalyzer, multichannel detector (Pulse Counting and AnalogMethods), auto sampler ASX-500 (CETAC, Omaha, NE,USA), and software Plasma Lab version v4.5 was used for thiswork.The instrument, located at the Servicio de InvestigacionAgraria laboratory (University of Seville, Spain), was usedwith a concentric Meinhard type glass nebulizer, a silica im-pact bead spray chamber, cooled to 3∘Cby aPeltier cooler, anda standard silica torch. Standard nickel sample and skimmercones were used. The internal standard solution was addedonline by a “Y” connection in the pipe where the sample isaspired by the peristaltic pump.
Table 2: Equations used for the correction of isobaric and poly-atomic interferences#.
Element 𝑚/𝑧 Correction equationV 51 (1) 51V: −0.35252Cr − 3.12753CrAs 75 (2) 75As: −0.03182Kr − 3.132277ArClSe 82 (3) 82Se: −1.00183KrCd 111 (4) 111Cd: −0.764106Cd − 1.073108CdPb 208 (5) 208Pb: 1.00206Pb + 1.00207Pb#With the recommended coefficients for the X-series ICP-MS instruments.
The ion opticswere tuned to optimise the sensitivity of thesignal at𝑚/𝑧 9, 59, 115, 137, 140, and 238 for a 100mg L−1 beryl-lium, cobalt, indium, barium, cerium, and uranium solution,respectively, which was typically 10000–60000 counts s−1 instandard mode. The relative standard deviation of isotopessignals was less than 5%.The oxide and double charged levelswere bothmonitored to ensure that the 140Ce+/140Ce16O+ and137Ba+/137Ba++ ratios did not exceed 2% and 5%, respectively.Instrumental performance optimization, including nebulizergas flow rate, RF power, and ion lens voltages, was performedand operational conditions are described in Table 1.
The US-EPA 200.8 method [36] is the routine analyticalmethod implemented in our lab. In its original version, themethod is applied for 21 elements, but in this work, weincluded B, Ti, Fe, Sr, and Cs and excluded mercury, sincethis last element requires a separate procedure due to itsimportant memory effects. Thus, this was the list of 25 targetanalytes: Be, B, Al, Ti, V, Cr, Mn, Fe, Co, Ni, Cu, Zn, As, Se,Sr, Mo, Ag, Cd, Sb, Cs, Ba, Tl, Pb, Th, and U.
Although there are recommended targets𝑚/𝑧 in the US-EPA 200.8 method, usually several isotopes are monitoredfor each element. This provides helpful information for theanalyst to properly interpret and quantify the acquired data.Thus, 48𝑚/𝑧 have been monitored in the main run mode,and spectra were acquired in survey mode for each measuredsample. These spectra will serve to check interference effects.Finally, the undesirable effects of isobaric and polyatomicinterferenceswere corrected using the interference correctionequations given in Table 2.
For closed-vessel digestions, a microwave system Multi-wave 3000 (Anton Paar, Graz, Austria) with rotor HF100 andsoftware version v1.52 was used. The system was equippedwith 16 high-pressure PTFE-TFM vessels with an internalvolume of 100mL (maximum pressure and temperature of 40bars and 240∘C, resp.).
2.3. Microwave-Assisted Digestion Procedures. Three diges-tion procedures using different reagents were tested for diges-tion of standard reference biological materials: procedureA, assisted by HNO
3; procedure B, assisted by HNO
3and
HCl; and procedure C, assisted by HNO3and H
2O2. For
the previously mentioned procedures, approximately 0.5 g ofsample were weighted directly into the PTFE-TFM vessels,to which the reagents were added (10mL HNO
3for pro-
cedure A, 10mL HNO3+ 3mL HCl for procedure B, and
10mL HNO3+ 3mL H
2O2for procedure C) and the vessels

4 ISRN Analytical Chemistry
were closed immediately. The operational conditions and theheating program used were carried out according to theseconditions: a ramp time of 25min to reach 200∘C and ahold time of 25min at 200∘C. After cooling the vessels toroom temperature, they were vented and opened. In thatmoment, Milli-Q water was added to the vessels and theywere closed and shaken thoroughly to dilute any possible restof colloids attached in the vessels’ walls. This process wasrepeated three times. The resultant mixture was filtered witha 20–25𝜇mdiameter pore filter 110mmdiameter (Whatman)and diluted to 100mL in a volumetric flask with Milli-Qwater. To accomplish the TDS requirements for sample intro-duction in our ICP-MS, a further dilution of 1.2mL (1.0mLfor procedure C) of the previous digested solution to 10mLof Milli-Q water with 1% suprapure HNO
3was needed. Trip-
licate samples of the three reference materials were preparedby each digestion method.
The digestion procedure A was then modified, keepingconstant the acid volume (10mL HNO
3) and scaling the
sample mass from 0.1 up to 0.9 g at 0.1 g intervals. Triplicatesamples of the three reference materials were prepared bythis digestion method using the same microwave conditionspreviously described, and being then subject to the samedilution factor.
Matrix spike samples were prepared in duplicate follow-ing the US-EPA 200.8 procedure for the three biological ma-trices for a final extra concentration of 5𝜇g L−1 for all theanalytes (25 𝜇g L−1 for Se). Triplicate digested reagent blanksolutions for each digestion procedure were analyzed fordetermination of the method detection limit (MDL) [2, 37].These reagent blank solutions were ascribed for backgroundcorrection in the postexperiment analysis.
2.4. Statistical Analysis. Each individual sample was meas-ured with three main acquisition runs during the experi-ment, providing mean values and standard deviation. Resultsreported in this work will refer to the mean value and stand-ard deviation of the three replicates of each organic matrixand digestion method.
The general linear model procedure in Statgraphics Plus5.1 (StatPoint 2000) was used.This software was also used forregressions analyses.
3. Results and Discussion
3.1. Recovery of Internal Standard and Quality Controls.Recovery of internal standards decreased monotonicallythroughout the experiment up to ∼70% of their initial valuesfor 115In, 159Tb, and 209Bi and up to 76% for 45Sc, being thisan usual behaviour.The recovery of 6Li increased throughoutthe experiment to reach approximately a 140% of its initialvalue (in TL sample).This isotope can be naturally present inthe samples, and it can be interfered by 12C2+. Accordingly,6Li was removed as internal standard in the postexperimentanalysis. All target analytes were ascribed to the interpolationmode except Al, Be, B, and Ti, which were directly ascribedto 45Sc.
The calibration curve for all the isotopes showed a goodlinearity over thewhole range of concentrations, with correla-tion coefficients higher than 0.999 except for Fe andAl, whichshowed some deviations for low concentrations. Results forAl are reported, but they have to be handled carefully sincesome of the measured concentrations (∼550𝜇g L−1) were be-yond the range of the calibration curve (0.5–250𝜇g L−1).
Quality control (QC) samples included external calibra-tion verification (ICV), initial and continuous blank verifi-cation, and matrix spike samples (MXP). All target analytespassed all QC, but the 𝑚/𝑧 = 66 (Zn) failed the ICV testfor 5 𝜇g L−1, although it showed a good behaviour for higherconcentrations, in the range of the certified target values.
3.2. Reagent Blanks and Method Detection Limit (MDL). De-tection limits for each digestion procedure (MDL) were de-termined from reagent blanks by using the US-EPA 200.8definitions. Each reagent blank was prepared by using thesame volume and acid combinations, and following the sameexperimental procedure used to prepare the real samples.Results are shown in Table 3. They are reported for thethree digestion procedures which used 0.5 g of sample andreferred to concentration in original sample (mg kg−1). Forthe variations made in procedure A with different sampleamount,𝑚
𝑖(g), the corresponding MDLs can be obtained by
correcting those from procedure A by a factor 0.5/𝑚𝑖. The
use of correction equations may affect the MDL, as shown inTable 3.TheMDLs reported are about one order ofmagnitudehigher than those reported by Sucharova and Suchara [1]because the dilution factor was also one order of magnitudehigher in our case. For most of the elements, the choice ofthe digestion procedure had little influence on the MDL, inagreement with previous results [2].
When reagent blanks were treated as unknown sam-ples with subtraction of the calibration blank, only Al (2.4–5.5𝜇g L−1) and Cd (∼0.03𝜇g L−1) could be quantified overthe instrument detection limits. The first one is an airbornepollutant, and the second one is likely linked to some cross-contamination coming from previous tracing studies carriedout in our lab.
3.3. Procedure A with Scaling Masses: Linear Regression Meth-od. Concentrations in the digests were determined for each𝑚/𝑧 ratio in each target analyte by using the correspondingcalibration curve from calibration standards and the mea-sured signal (after subtracting the corresponding reagentblank).Then, a mean value and a standard deviation of meanvalue were obtained from the three analytical replicates. Re-sults were then plotted against the respective digestedmasses.Figures 1(a) and 1(b) show examples for a selected groupof elements measured in MT. Data followed a linear rela-tionship. Linear regression analysis provided the slope andordinate in the origin (with their corresponding uncertain-ties) and the correlation coefficient. Concentrations below thedetection limit in the digest were excluded from the analysis,applying the regression fit to the remaining data point.
Only in few cases the linear relationship did not hold (aconfidence level below 90%was used as criteria for rejection),

ISRN Analytical Chemistry 5
and the corresponding elements were discarded for quantifi-cation (see Tables 4(a), 4(b), and 4(c)).This usually happenedfor those analytes whose concentrations were below thedetection limit for all or most of the masses (e.g., Ag or Csin MT). The element 47Ti was interfered by 40Ar + 7Li, beingthis last added as internal standard.
For most of the 𝑚/𝑧 ratios, the linear relationship heldat 99% CL (Table 4), with correlation coefficients over 0.97.Results are summarised in Tables 4(a), 4(b) and 4(c), whereonly one isotope (the one showing the best behaviour) hasbeen selected for each target element.
There were two groups of elements regarding the ordinatein origin: those elements with an ordinate in origin compat-ible with zero value within 99% CL and those ones with avalue being different from zero at the same CL. Figures 1(a)and 1(b) show some examples for MT (noncompatible withzero and compatible with zero at 99%CL, resp.).The physicalmeaning of the slope is just the contribution to the instru-mental signal (provided as 𝜇g L−1 in the aspired solution) perunit mass of original organic sample. Thus, in both cases,the concentration of the target analyte in the organic samplecan be obtained from the slope and the common dilutionfactor used for all samples (results are shown in Tables 4(a),4(b), and 4(c), with associated uncertainties arising fromthe error in the slope). The comparison of these values withcertified/reference ones is also provided in Tables 4(a), 4(b),and 4(c), and it will be discussed further.
The physical meaning of the ordinate in origin is just acontribution to the signal coming from matrix effects whichare not present in the reagent blanks. Thus, these last includecontributions from impurities in the reagent acids and water,aswell as contamination throughout the analytical procedure.When a certainmass of organic sample is digested, even if thetarget analyte was absent, isobaric, polyatomic, and physicalinterferences could account to the background signal. It isworth to note that a direct quantification of the analyte usingthe total registered signal (corrected by reagent blank) and thedilution factor could misestimate the concentration value. Anonzero ordinate in origin could be likely lessened by usinginterference correction equations. Tables 4(a), 4(b), and 4(c)incorporate information of those elements showing nonzeroordinate in origin, and a brief discussion of the most relevantcases is presented in what follows.
Isotope 51V has a negative ordinate in origin when usingthe correction equation (Table 2) which becomes positivewhen omitting it. This is related with the nonfully adapted(to instrument and matrix) values of the parameters in thecorrection equation. The slope was not affected by the useof the correction equation. A similar situation was foundfor 75As. Isotope 52Cr was used for element quantification(as recommended in the US-EPA 200.8 method), and itsbackgroundwas likely contributed by C and Ca in thematrix.Similarly, polyatomic interferences of 1H + 59Co and 1H +64Zn could contribute to the observed background in the60Ni and 65Cu signals, respectively. Isotopes 106Cd and 108Cdshowed background contribution likely linked to Zn in thesample, but 111Cdwas used for element quantification. Quan-tification of 133Cs was difficult due to the low concentration
Table 3:Method detection limits (concentrations inmg kg−1) deter-mined for laboratory blank solutions.
Element m/z Equation# ProcedureA B C
Be 9 0.010 0.010 0.009B 11 0.76 0.85 0.69Al 27 2.9 4.7 2.0Ti 47 2.5 1.4 3.5V 51 (1) 0.12 0.69 0.44V 51 0.12 N.R. 0.91Cr 52 0.055 1.9 0.047Mn 55 0.033 0.11 0.039Fe 56 10.2 9.8 8.6Co 59 0.012 0.013 0.024Ni 60 0.15 0.38 0.12Cu 63 0.33 0.71 0.44Cu 65 0.50 0.27 0.17Zn 66 1.4 0.61 0.36As 75 0.020 N.R. 0.20As 75 (2) 0.27 0.86 0.20Se 82 (3) 0.87 1.4 0.89Se 82 0.88 0.89 0.97Sr 88 0.045 0.014 0.028Mo 95 0.26 1.13 0.32Ag 107 0.081 0.013 0.009Cd 111 (4) 0.083 0.055 0.081Sb 123 0.005 0.004 0.007Cs 133 0.014 0.028 0.023Ba 137 0.059 0.063 0.20Tl 205 0.003 0.006 0.006Pb 208 (5) 0.024 0.017 0.090Th 232 0.005 0.003 0.007U 238 0.002 N.Q. 0.003Procedures: A (HNO3) and B (HNO3 +HCl) use dilution factors of 0.6 g L−1,while 0.5 g L−1 is applied for procedure C (HNO3 + H2O2). In the threecases, 0.5 g of dry sample was digested. For the variations of method A withdifferent amount of sample, 𝑚𝑖 (g), the corresponding MDLs have to becorrected by a factor of 0.5/𝑚𝑖.#Correction equations from Table 2.N.R.: not recommended; N.Q.: not quantified.
and the interferences contributed by In, added as internalstandard.
Concerning the determination of analyte concentrationsfrom the slope, the values reported in Tables 4(a), 4(b) and4(c), were in reasonable good agreement with the certi-fied/reference ones, but in some cases significant statisticaldifferences were found. When plotting the determined slopeversus certificated/reference values of concentrations for allthe analytes (not shown), a linear relationship holds at 99%CL (𝑅2 = 0.991, 𝑛 = 38) with slope 0.886 ± 0.014.This last provides a gross estimation of the digestion yield,but elemental yields depend on the element geochemistry.Thus, incomplete recoveries in the digestions were found
6 ISRN Analytical Chemistry
1.6
1.4
1.2
1
0.8
0.6
0.4
0.2
00 0.2 0.4 0.6 0.8 1
Sample mass (g)
Ana
lyte
conc
entr
atio
n (𝜇
gL−1)
60Ni52Cr106Cd
(a)
1.6
1.4
1.2
1
0.8
0.6
0.4
0.2
00 0.2 0.4 0.6 0.8 1
Sample mass (g)
Ana
lyte
conc
entr
atio
n (𝜇
gL−1)
66Zn/137
208Pb
111Cd
(b)
Figure 1: Examples of linear regression for a selected group of elements measured in MTmatrix: (a) elements with noncompatible with zeroordinate in the origin at 99% CL and (b) elements with compatible with zero ordinate in origin at 99% CL. See text for explanation. Analyteconcentrations are reported as a mean value and standard deviation from the three analytical replicates.
for Fe and Sr in MT and for Al, V, Cr, Fe, Cu, and Sb inTL. Overestimations were identified for Se in MT (likelydue to poor signal calibration in the low concentrationrange) and Co and Ni in TL. 82Se recoveries could also beaffected by 81Br1H interference (MT has a Br concentrationof 329mg kg−1). 59Co is also affected by an interference withCa (formation of species 43Ca16O and 42Ca17OH), present inTL in a percentage of 5.05%.Arunachalam et al. [38] have alsoreported this overestimation in materials BCR CRM-141 andBCR CRM-142 digested by HNO
3(118% and 110%, resp.) and
by a mixture of HNO3+ HCl + HF (127% and 106%, resp.).
3.4. Procedure A with Scaling Masses: Direct Quantificationthrough theDilution Factor. Concentrations of target analytescan be directly quantified for each amount of digested organicsample by using the corresponding dilution factors. Thisprocedure has been applied in its standard version, that is, therecorded signal is corrected only by subtraction of the reagentblank and applying, when appropriate, the interference cor-rection equations. Detailed results will not be reported here,but a general discussion is presented below.
The good linear relationship reported previously alreadyensures consistent results for the group of elements whichare free of background contribution frommatrix effect (thosereported in Tables 4(a), 4(b), and 4(c) with compatible zeroordinate in origin and which will be referred hereafter asgroup “a”). For the complementary group (group “b”, withbackground contribution), it is expected that a direct quan-tification will misestimate the values of the concentrations.
It has been found that digestion of low amount of sampleleads to results with higher statistical dispersion. Results with
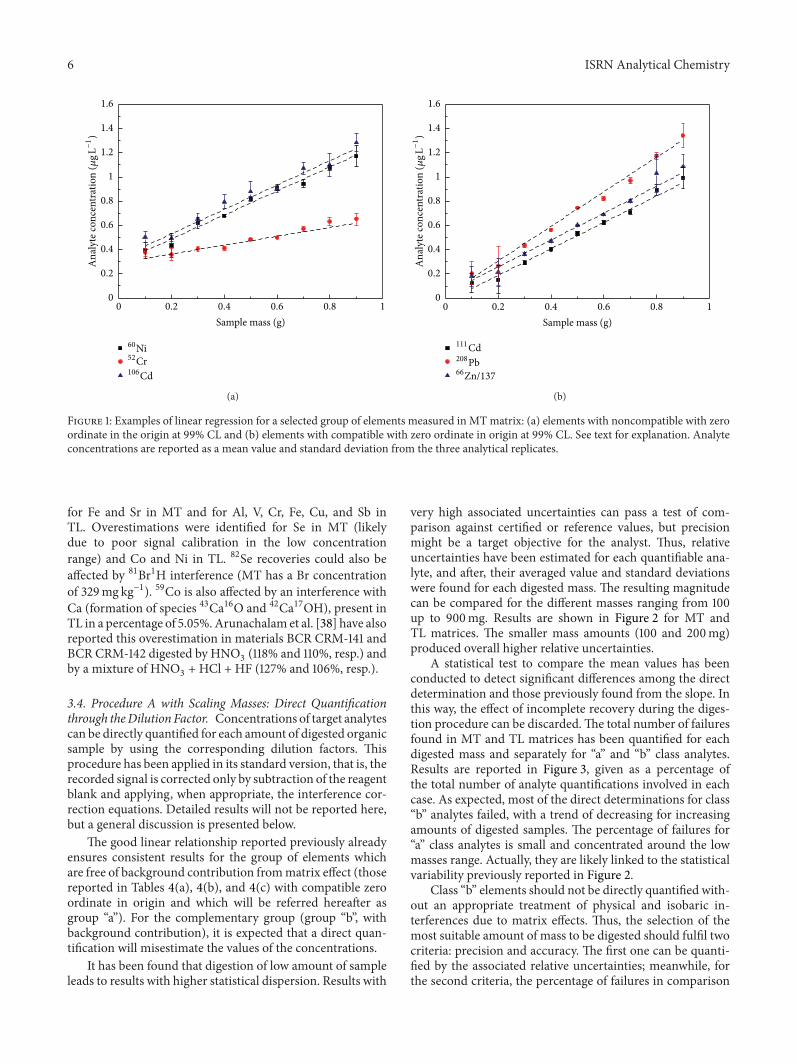
very high associated uncertainties can pass a test of com-parison against certified or reference values, but precisionmight be a target objective for the analyst. Thus, relativeuncertainties have been estimated for each quantifiable ana-lyte, and after, their averaged value and standard deviationswere found for each digested mass. The resulting magnitudecan be compared for the different masses ranging from 100up to 900mg. Results are shown in Figure 2 for MT andTL matrices. The smaller mass amounts (100 and 200mg)produced overall higher relative uncertainties.
A statistical test to compare the mean values has beenconducted to detect significant differences among the directdetermination and those previously found from the slope. Inthis way, the effect of incomplete recovery during the diges-tion procedure can be discarded.The total number of failuresfound in MT and TL matrices has been quantified for eachdigested mass and separately for “a” and “b” class analytes.Results are reported in Figure 3, given as a percentage ofthe total number of analyte quantifications involved in eachcase. As expected, most of the direct determinations for class“b” analytes failed, with a trend of decreasing for increasingamounts of digested samples. The percentage of failures for“a” class analytes is small and concentrated around the lowmasses range. Actually, they are likely linked to the statisticalvariability previously reported in Figure 2.
Class “b” elements should not be directly quantified with-out an appropriate treatment of physical and isobaric in-terferences due to matrix effects. Thus, the selection of themost suitable amount of mass to be digested should fulfil twocriteria: precision and accuracy. The first one can be quanti-fied by the associated relative uncertainties; meanwhile, forthe second criteria, the percentage of failures in comparison

ISRN Analytical Chemistry 7
Table 4: (a) Measured (from slope) and certified/reference concentrations (mg kg−1) for the target analytes in the SRM 2976 mussel tissue.(b) Measured (from slope) and certified/reference concentrations (mg kg−1) for the target analytes in the SRM 1549 nonfat milk powder. (c)Measured (from slope) and certified/reference concentrations (mg kg−1) for the target analytes in the SRM 1573a tomato leaves.
(a)
Element 𝑚/𝑧SRM 2976 mussel tissue
From slope Certified/reference Stat.Be 9 N.L.B 11 22.5 ± 1.0 AaAl 27 140 ± 11 R 134 ± 4 Ab-CaTi 49 15.02 ± 0.57 AaV 51 1.39 ± 0.10 AbCr 52 0.324 ± 0.029 R 0.50 ± 0.16 Ab-CaMn 55 37.1 ± 1.2 R 33.0 ± 2.0 Aa-CaFe 56 112.3 ± 7.5 C 171.0 ± 4.9 Aa-CbCo 59 0.644 ± 0.021 R 0.61 ± 0.02 Aa-CaNi 60 0.82 ± 0.04 R 0.93 ± 0.12 Ab-CaCu 65 3.35 ± 0.17 C 4.02 ± 0.33 Ab-CaZn 66 137 ± 6 C 137 ± 13 Aa-CaAs 75 14.6 ± 0.5 C 13.3 ± 1.8 Aa-CaSe 82 2.75 ± 0.23 C 1.80 ± 0.15 Aa-CbSr 88 67.0 ± 2.4 R 93 ± 2 Aa-CbMo 98 0.412 ± 0.025 AbAg 107 N.L.; <MDL R 0.011 ± 0.005
Cd 111 0.938 ± 0.03 C 0.82 ± 0.16 Aa-CaSb 123 N.L.Cs 133 N.L.; <MDL R 0.027 ± 0.001
Ba 137 0.65Tl 205 N.L.Pb 208 1.19 ± 0.04 C 1.19 ± 1.18 Aa-CaTh 232 0.0123 ± 0.0035 R 0.011 ± 0.002 Bb-CaU 238 0.244 ± 0.008 AaStatistical analysis: first (capital) refers to linear fit: A > 99%CL, B > 95%CL; C > 90%CL. Second (lower case) refers to the ordinate in origin: not significantlydifferent from zero at 99% CL; b, else. Third refers to the comparison between measured and certificated/reference values: Ca not statistically significantdifference at 95% CL, Cb, else. For those reference values without associated uncertainties, relative errors of 20% have been assumed.N.L: nonpositive linear relationship; <MDL: below method detection limit;R: reference value; C: certified value.
(b)
Element 𝑚/𝑧SRM 1549 nonfat milk powder
From slope Certified/reference Stat.Be 9 N.L.B 11 2.8 ± 0.7 BaAl 27 N.L.; <MDL R 2.0Ti 49 2.63 ± 0.17 AaV 51 N.L.Cr 52 N.L.; <MDL C 0.0026 ± 0.0007
Mn 55 0.254 ± 0.010 C 0.26 ± 0.06 Ab-CaFe 56 N.L.; <MDL C 1.78 ± 0.1
Co 59 <MDL R 0.0041Ni 60 0.308 ± 0.027 AbCu 65 0.71 ± 0.29 C 0.70 ± 0.1 Ca-CaZn 66 43.9 ± 1.4 C 46.10 ± 2.2 Aa-CaAs 75 <MDL R 0.0019Se 82 <MDL C 0.110 ± 0.010

8 ISRN Analytical Chemistry
(b) Continued.
Element 𝑚/𝑧SRM 1549 nonfat milk powder
From slope Certified/reference Stat.Sr 88 3.68 ± 0.12 AaMo 98 0.350 ± 0.017 R 0.34 Aa-CaAg 107 <MDL R <0.0003Cd 111 <MDL C 0.0005 ± 0.0002
Sb 123 <MDL R 0.00027Cs 133 N.L.Ba 137 0.87 ± 0.04 AaTl 205 N.L.; <MDLPb 208 <MDL C 0.019 ± 0.003
Th 232 N.L.U 238 N.L.
Statistical analysis: first (capital) refers to linear fit: A > 99%CL; B > 95%CL; C > 90%CL. Second (lower case) refers to the ordinate in origin: not significantlydifferent from zero at 99% CL; b, else. Third refers to the comparison between measured and certificated/reference values: Ca not statistically significantdifference at 95% CL, Cb, else. For those reference values without associated uncertainties, relative errors of 20% have been assumed.N.L: nonpositive linear relationship; <MDL: below method detection limit;R: reference value; C: certified value.
(c)
Element 𝑚/𝑧SRM 1573a tomato leaves
From slope Certified/reference Stat.Be 9 0.0274 ± 0.0016 AbB 11 30.5 ± 1.1 AaAl 27 543 ± 12 C 598 ± 12 Aa-CbTi 49 22.6 ± 1.6 AaV 51 0.56 ± 0.05 C 0.835 ± 0.010 Ab-CbCr 52 1.51 ± 0.06 C 1.99 ± 0.06 Ab-CbMn 55 236 ± 9 C 246 ± 8 Aa-CaFe 56 301 ± 8 C 368 ± 7 Ab-CbCo 59 0.756 ± 0.022 C 0.57 ± 0.02 Aa-CbNi 60 1.93 ± 0.10 C 1.590 ± 0.07 Ab-CbCu 65 3.85 ± 0.23 C 4.70 ± 0.14 Aa-CbZn 66 29.0 ± 1.8 C 30.90 ± 0.7 Aa-CaAs 75 0.063 ± 0.008 C 0.112 ± 0.004 Ab-CbSe 82 <MDL C 0.054 ± 0.003
Sr 88 78.2 ± 1.8 R 85 Aa-CaMo 98 0.400 ± 0.010 AaAg 107 0.016 ± 0.004 R 0.017 Aa-CaCd 111 1.56 ± 0.04 C 1.52 ± 0.04 Aa-CaSb 123 0.035 ± 0.002 C 0.063 ± 0.006 Aa-CbCs 133 0.036 ± 0.005 R 0.053 Ab-CaBa 137 57.6 ± 1.6 R 63 Aa-CaTl 205 0.0444 ± 0.0018 AaPb 208 0.594 ± 0.016 Aa

ISRN Analytical Chemistry 9
(c) Continued.
Element 𝑚/𝑧SRM 1573a tomato leaves
From slope Certified/reference Stat.Th 232 0.101 ± 0.003 R 0.120 Aa-CaU 238 0.0298 ± 0.0015 R 0.035 Aa-Ca
Statistical analysis: first (capital) refers to linear fit: A > 99%CL; B > 95%CL; C > 90%CL. Second (lower case) refers to the ordinate in origin: not significantlydifferent from zero at 99% CL; b, else. Third refers to the comparison between measured and certificated/reference values: Ca not statistically significantdifference at 95% CL, Cb, else. For those reference values without associated uncertainties, relative errors of 20% have been assumed.N.L: nonpositive linear relationship; <MDL: below method detection limit;R: reference value; C: certified value.
TLMT
103
102
101
100
10−1
Relat
ive m
ean
erro
r (%
)
0 0.2 0.4 0.6 0.8 1Sample mass (g)
Figure 2: Statistical variability estimated for each quantifiable ana-lyte in matrices TL and MT. The resulting magnitude can be com-pared for the different masses ranging from 100 up to 900mg (thesmaller mass amounts produced overall higher relative uncertain-ties).
against reference values can serve as a reasonable quantifica-tion. Thus, the following “figure of merit” has been defined:
FM = 𝑓1 (100 −%failures) + 𝑓2
⟨𝜀𝑟⟩
𝜀𝑟(𝑚𝑖), (1)
where 𝑓1and 𝑓
2are user-defined weighting factors, 𝜀
𝑟(𝑚𝑖)
is the averaged relative uncertainty found for mass 𝑚𝑖(from
Figure 2), and ⟨𝜀𝑟⟩ is the averaged value for all samplemasses.
Figure 3 shows this “figure of merit” for 𝑓1= 𝑓2= 50. The
best mass amount to be used in the digestion procedure isfound to be around 600mg, which correspondswith a samplemass to acid volume ratio of 60mgmL−1. Slight changes inthe values of the weighting factors 𝑓
1and 𝑓
2do not affect to
the final result. This sample mass to acid volume ratio is sim-ilar to those reported elsewhere. For example, by Sucharovaand Suchara [1] use a relation mass sample to acid ratio of36 and 72mgmL−1 (depending on the concentration of Sipresent in the samples) to determine the concentration of
120
100
80
60
40
20
00.2 0.3 0.4 0.5 0.6 0.7 0.8 0.9 1
Sample mass (g)
a (%)b (%)F-M (50%, 50%)
Fails
in te
st of
mea
n va
lues
(%)
Figure 3: Percentages of direct determinations from the dilutionfactor with statistically significant differences (at 95% CL) withrespect to the value found from the slope (see Table 4 and Figures1(a) and 1(b)) in MT and TL matrices). Classes “a” and “b” referto isotopes with an ordinate in origin statistically nondifferent andstatistically different from zero at 99% CL, respectively (see text forexplanation). The “figure of merit” (as defined in the text) pursuitsthe digested mass with the best compromise between precision andaccuracy.
36 elements in different plant reference materials by ICP-MSafter microwave digestions assisted by three different types ofmixtures. Gonzalez et al. [39] use a ratio of 67 to determine byICP-OES the concentration of 7 elements in plant and animalsamples after a microwave-assisted digestion with also nitricacid and hydrogen peroxide. Rodushkin et al. [40] reporteda ratio of 50 for a microwave digestion with nitric acid andhydrogen peroxide prior to the determination of 16 elementsin the certified reference material SRM 1547 (peach leaves)by ICP-AES, and ICP-SMS is reported. Finally, Sastre et al.[15] used a ratio of 66 in an acid digestion with nitric acidfor the determination of Cd, Cu, Pb, and Zn in a wide rangeof environmental samples (covering sediment, soil, sewagesludge, and plant matrices) by ICP-MS.

10 ISRN Analytical Chemistry
3.5. Comparison among Digestion Procedures A, B, and C.Attending to previous results, the best procedure is the oneusing 600mg of sample and 10mL of nitric acid. However, theUS-EPAmethods recommend 500mg of samplemass, so thisamount was used to compare the digestion procedures withdifferent mixtures of acids. 500mg of sample and dilutionfactors provided in the experimental section were used inall digestion procedures. Each target element was directlyquantified from the measured signal after subtracting thecorresponding reagent blank signal. Results are shown inTables 5(a), 5(b), and 5(c), where the mean values and thestandard deviation from three analytical replicates of each ofthe three matrices are reported. These data can be comparedwith certified/reference values and those obtained from thelinear regression method (Tables 4(a), 4(b), and 4(c)). AFisher’s Least Significant Difference (LSD) test at 95% CL hasbeen conducted to discriminate the reported values for eachanalyte. Results are also shown in Tables 5(a), 5(b), and 5(c)and they will serve for the present discussion. It is worthto note that this statistical test is mediated by the effect ofnonuniform uncertainties and by spurious background con-tributions by matrix effects which are not properly detectedand treated by the quantification method.
Total recovery can be understood as the absence of sta-tistically significant differences between digestion proceduresand certified/reference values. As seen in Tables 5(a), 5(b) and5(c), this was found to be dependent on the matrix (the effectof the element concentration within the same matrix cannotbe tested with our data).
There were not statistically significant differences amongdifferent digestion procedures at 95% CL (including deter-minations from the slope) and between procedures and cer-tified/reference values (when available) for the following setof elements (matrices are indicated as superindexes): MnMP,CoMT, CuMP, ZnMT,TL, AsMT, SrMP,TL, MoMP, AgMT,TL,CdMT,TL, BaMT,TL, ThMT, and PbMT. Nevertheless, most ofthese elements exhibited statistically significant differences inother matrices, and some of them were affected by spuriousbackground contributions (see Tables 4(a), 4(b), and 4(c)).Thus, Mn showed apparently excellent results in MP matrix(in which it is affected by matrix background); meanwhile,the three digestion procedures overestimated its concentra-tion in MT and underestimated it in TL matrix. Concentra-tions for the following set of elements were underestimated(when compared against certified/reference values) by all di-gestion procedures: FeMT,TL, CuMT,TL, ZnMP, SrMT, and SbTL.Contrarily, concentrations were overestimated by the threeprocedures only for MnMT. Thus, Tables 5(a), 5(b), and 5(c)can provide so guidance for selecting the most appropriateprocedure for any particular analyte depending on thematrix,but a general recommendation cannot be established forall three digestion procedures. Independent of the selecteddigestion procedure, the use of a sequence of digested massesshould provide a more robust tool for quality control andabsolute quantification with acceptable precision.
The digestion with HNO3alone quantitatively extracted
almost all the elements in the three SRMs. For the majority
of elements analyzed in the samples, there was no clear im-provement in the recovery when using HNO
3+ HCl or
HNO3+ H2O2in the digestions compared to HNO
3alone.
Incomplete recoveries were found for Fe, Sr, Al, V, Cr, Fe, Cu,and Sb, which could indicate a poor digestion of refractory Silikely affecting the recovery of silicon-bound elements. Onthe other hand, adding HCl to the HNO
3could carry out
disadvantages because Cl− ion is retained in the final samplematrix and could create interferences in the determination ofsome elements, such as Va, Cr, and As [41], although this hasnot been noticed in this study.
4. Conclusions
Microwave-assisted digestion procedures with simplified rea-gents (HNO
3alone and mixtures of HNO
3/HCl and HNO
3/
H2O2) were compared for quantitative determination of 25
elements (Be, B, Al, Ti, V, Cr, Mn, Fe, Co, Ni, Cu, Zn, As, Se,Sr, Mo, Ag, Cd, Sb, Cs, Ba, Tl, Pb, Th, and U) in biologicalreference materials provided by NIST (mussel tissue, tomatoleaves and milk powder) by ICP-MS.
The corresponding method detection limits were deter-mined from reagent blanks, being comparable to those pub-lished in the scientific literature when the dilution factor istaken into account. For most of the elements, the choice ofthe digestion procedure had little influence on the MDL.
From scaling masses in procedure A, a linear relationshipamong instrumental signal (background corrected throughreagent blank) and digested sample mass could be construct-ed at 99% CL for most of the target analytes. No linear rela-tionship was found for those present at very low concentra-tions (below their respective MDL) or interfered by internalstandards. The slope of this linear fit provided, along withthe applied dilution factor, the estimation of concentrationin the sample, while the ordinate in origin allowed for theidentification of matrix interferences which were absent inthe reagent blank and which were not properly resolved bythe implemented interference correction equations. Whenavailable, the so quantified concentrations were in goodagreement with certified/reference values. This methodologyprovides a robustmean for evaluating both, the analyte recov-ery resulting from the digestion method and the reliabilityof the treatment of interferes. The best compromise betweenaccuracy and precision was found when a sample amount of600mg was used in the digestion, which corresponds to asample mass to acid volume ratio of 60mgmL−1.
The digestion with HNO3alone (procedure A) quantita-
tively extracted almost all the elements in the three referencematerials, although incomplete recoveries in the digestionswere found for Fe and Sr in MT and for Al, V, Cr, Fe, Cu, andSb in TL, probably because these elements commonly occuras silicate compounds which are not solubilized efficientlyusing only HNO
3.
There were not statistically significant differences amongdifferent digestion procedures for the following set of ele-ments (matrices are indicated as superindexes):MnMP, CoMT,CuMP, ZnMT,TL, AsMT, SrMP,TL, MoMP, AgMT,TL, CdMT,TL,BaMT,TL, ThMT, and PbMT. Nevertheless, most of these

ISRN Analytical Chemistry 11
Table 5: (a) Measured concentrations (mg kg−1) in SRM 2976 mussel tissue for target analytes using different digestion procedures. (b)Measured concentrations (mg kg−1) in SRM 1549 nonfat milk powder for target analytes using different digestion procedures. (c) Measuredconcentrations (mg kg−1) in SRM 1573a tomato leaves for target analytes using different digestion procedures.
(a)
Element m/z SRM 2976 mussel tissueA B C LSD at 95% CL
Be 9 0.014 ± 0.003 <MDL <MDLB 11 20.5 ± 0.6 23.7 ± 0.3 22.7 ± 2.0 ab-a-b-ab-NAl 27 184 ± 9 204.0 ± 2.0 133 ± 14 a-b-b-a-aTi 49 16.5 ± 0.3 28 ± 3 13.3 ± 2.4 a-a-b-a-NV 51 2.24 ± 0.17 N.Q. 6.9 ± 0.4 a-b-N-c-NCr 52 0.597 ± 0.023 1.74 ± 0.05 <MDL a-b-c-N-bMn 55 38.7 ± 0.3 38.1 ± 1.0 38 ± 3 b-b-b-b-aFe 56 110 ± 4 112 ± 9 110 ± 10 a-a-a-a-bCo 59 0.663 ± 0.009 0.637 ± 0.015 0.63 ± 0.06 a-a-a-a-aNi 60 0.91 ± 0.04 1.02 ± 0.27 0.68 ± 0.23 ab-ab-b-a-abCu 65 2.745 ± 0.014 2.920 ± 0.028 3.2 ± 0.03 c-a-ab-bc-dZn 66 138.7 ± 2.8 137 ± 3 133 ± 11 a-a-a-a-aAs 75 14.77 ± 0.17 12.8 ± 0.3 12.6 ± 1.1 a-a-a-a-aSe 82 2.90 ± 0.06 1.6 ± 0.5 2.1 ± 0.3 b-b-a-a-aSr 88 69.3 ± 0.5 68.7 ± 0.9 68 ± 6 a-a-a-a-bMo 98 0.575 ± 0.022 0.486 ± 0.021 0.48 ± 0.04 a-c-b-b-NAg 107 0.020 ± 0.004 0.017 ± 0.004 0.014 ± 0.012 N-a-a-a-aCd 111 0.91 ± 0.03 0.90 ± 0.07 0.86 ± 0.10 a-a-a-a-aSb 123 0.0183 ± 0.0021 0.021 ± 0.004 0.0227 ± 0.0020 b-a-a-a-cCs 133 0.1687 ± 0.0015 0.33 ± 0.05 0.17 ± 0.06 N-b-c-b-aBa 137 0.636 ± 0.007 0.59 ± 0.04 0.68 ± 0.08 a-a-a-a-NTl 205Pb 208 1.214 ± 0.022 1.11 ± 0.0454 1.15 ± 0.10 a-a-a-a-aTh 232 0.0167 ± 0.0015 0.0140 ± 0.0026 0.015 ± 0.004 a-a-a-a-aU 238 0.2430 ± 0.0017 0.243 ± 0.0184 0.237 ± 0.018 a-a-a-a-NLSD test for the five independent determinations, ordered as follows: (1) from slope and scaling masses; (2) digestionmethod A (HNO3); (3) digestionmethodB (HNO3 + HCl); (4) digestion method C (HNO3 + H2O2); and (5) certified/reference values; N means nonincluded; low case letters a, b, c, and d are classesordered from lower to upper values; N.Q.: nonquantified; <MDL: below method detection limit.Certified/reference values and obtained from slope and scaling masses are shown in Table 4(a).
(b)
Element m/z SRM 1549 milk powderA B C LSD at 95% CL
Be 9B 11 3.2 ± 0.6 4.4 ± 0.3 4.0 ± 1.0 a-ab-b-ab-NAl 27Ti 49V 51Cr 52Mn 55 0.203 ± 0.013 0.29 ± 0.08 0.23 ± 0.14 a-a-a-a-aFe 56Co 59Ni 60Cu 65 0.51 ± 0.07 0.41 ± 0.13 0.58 ± 0.05 a-a-a-a-aZn 66 42.7 ± 2.7 42.5 ± 2.2 42.0 ± 2.4 c-ab-a-bc-dAs 75Se 82

12 ISRN Analytical Chemistry
(b) Continued.
Element m/z SRM 1549 milk powderA B C LSD at 95% CL
Sr 88 3.51 ± 0.17 3.53 ± 0.20 3.49 ± 0.25 a-a-a-a-NMo 98 0.330 ± 0.010 0.310 ± 0.027 0.33 ± 0.03 a-a-a-a-aAg 107Cd 111Sb 123Cs 133Ba 137 0.81 ± 0.05 0.73 ± 0.04 0.80 ± 0.06 b-ab-a-ab-NTl 205Pb 208Th 232U 238
LSD test for the five independent determinations, ordered as follows: (1) from slope and scaling masses; (2) digestion method A (HNO3); (3) digestion methodB (HNO3 + HCl); (4) digestion method C (HNO3 + H2O2); and (5) certified/reference values; N means nonincluded; low case letters a, b, c, and d are classesordered from lower to upper values; N.Q.: nonquantified; <MDL: below method detection limit.Certified/reference values and obtained from slope and scaling masses are shown in Table 4(b).
(c)
Element 𝑚/𝑧SRM 1573a tomato leaves
A B C LSD at 95% CLBe 9 0.0127 ± 0.0022 <MDL <MDLB 11 30.2 ± 0.4 34.1 ± 1.6 33.8 ± 1.4 a-a-b-b-NAl 27 567 ± 23 550 ± 50 557 ± 14 a-ab-a-ab-bTi 49 24.0 ± 1.7 31 ± 3 25 ± 7 a-ab-b-ab-NV 51 0.79 ± 0.04 N.Q. N.Q a-b-N-N-bCr 52 1.65 ± 0.10 2.2 ± 0.4 0.87 ± 0.06 b-bc-d-a-cdMn 55 219 ± 6 220 ± 8 226 ± 7 bc-a-a-ab-cFe 56 264 ± 10 281 ± 13 290 ± 7 c-a-ab-bc-dCo 59 0.696 ± 0.019 0.708 ± 0.028 0.737 ± 0.017 c-b-b-bc-aNi 60 1.64 ± 0.06 1.78 ± 0.25 1.76 ± 0.08 b-a-ab-ab-aCu 65 3.29 ± 0.14 3.24 ± 0.16 3.59 ± 0.08 c-ab-a-bc-dZn 66 25.9 ± 0.9 26.4 ± 1.4 27.4 ± 1.7 a-a-a-a-aAs 75 0.149 ± 0.022 0.78 ± 0.14 0.66 ± 0.08 bc-a-ab-ab-cSe 82Sr 88 76.9 ± 1.8 75 ± 3 78.0 ± 2.7 a-a-a-a-aMo 98 0.362 ± 0.015 0.336 ± 0.017 0.377 ± 0.011 c-b-a-bc-NAg 107 0.029 ± 0.018 0.027 ± 0.007 0.015 ± 0.004 a-a-a-a-aCd 111 1.47 ± 0.07 1.51 ± 0.07 1.50 ± 0.010 a-a-a-a-aSb 123Cs 133 0.017 ± 0.0020 0.030 ± 0.017 0.020 ± 0.013 ab-a-a-a-bBa 137 55.3 ± 2.0 54.0 ± 2.5 56.7 ± 1.4 a-a-a-a-aTl 205 0.041 ± 0.026 0.040 ± 0.004 0.042 ± 0.001 a-a-a-a-NPb 208 0.548 ± 0.0255 0.49 ± 0.0424 0.539 ± 0.003 c-bc-a-ab-N

ISRN Analytical Chemistry 13
(c) Continued.
Element 𝑚/𝑧SRM 1573a tomato leaves
A B C LSD at 95% CL
Th 232 0.095 ± 0.004 0.088 ± 0.0071 0.100 ± 0.007 ab-a-a-ab-b
U 238 0.0293 ± 0.0021 0.0243 ± 0.0031 0.033 ± 0.004 ab-ab-a-b-bLSD test for the five independent determinations, ordered as follows: (1) from slope and scaling masses; (2) digestion method A (HNO3); (3) digestion methodB (HNO3 + HCl); (4) digestion method C (HNO3 + H2O2) and (5) certified/reference values; N means nonincluded; low case letters a, b, c and d are classesordered from lower to upper values; N.Q.: nonquantified; <MDL: below method detection limit.Certified/reference values and obtained from slope and scaling masses are shown in Table 4(c).
elements exhibited statistically significant differences in othermatrices, and some of them were affected by spurious back-ground contributions Concentrations were underestimatedby the three digestion procedures for the following set ofelements: FeMT,TL, CuMT,TL, ZnMP, SrMT, and SbTL.
This illustrates the limitations of the assessment of dif-ferent digestion methods throughout a direct quantificationby the dilution factor, since it is mediated by a series offacts, as the nonuniform uncertainties, and by spurious back-ground contributions bymatrix effectswhich are not properlydetected and treated by the quantification method.
Conflict of Interests
Some commercial identities are mentioned in this paper: (i)Merck, Darmstadt, Germany, (ii) Millipore, Bedford, USA,(iii) Cromlab, (iv) Thermo Fisher, Cambridge, UK, (v)CETAC, Omaha, NE, USA, and (vi) Anton Paar, Graz, Aus-tria. None of the authors have any financial relation with anyof those companies that could lead to a conflict of interests.The names of the companies have been written in the paperonly as information for possible readers to know which kindof equipment has been used to get the results that we show.
References
[1] J. Sucharova and I. Suchara, “Determination of 36 elementsin plant reference materials with different Si contents by in-ductively coupled plasma mass spectrometry: comparison ofmicrowave digestions assisted by three types of digestion mix-tures,” Analytica Chimica Acta, vol. 576, no. 2, pp. 163–176,2006.
[2] S. Ashoka, B. M. Peake, G. Bremner, K. J. Hageman, and M. R.Reid, “Comparison of digestion methods for ICP-MS determi-nation of trace elements in fish tissues,”Analytica Chimica Acta,vol. 653, no. 2, pp. 191–199, 2009.
[3] F. C. Bressy, G. B. Brito, I. S. Barbosa, L. S. G. Teixeira, and M.G. A. Korn, “Determination of trace element concentrations intomato samples at different stages of maturation by ICP OESand ICP-MS following microwave-assisted digestion,” Micro-chemical Journal, vol. 109, pp. 145–149, 2013.
[4] E. Paredes, M. S. Prats, S. E. Maestre, and J. L. Todolı, “Rapidanalytical method for the determination of organic and in-organic species in tomato samples through HPLC-ICP-AEScoupling,” Food Chemistry, vol. 111, no. 2, pp. 469–475, 2008.
[5] W. P. C. dos Santos, V. Hatje, D. D. S. Santil, A. P. Fernandes, M.G. A. Korn, andM.M. de Souza, “Optimization of a centrifuga-tion andultrasound-assisted procedure for the determination oftrace and major elements in marine invertebrates by ICP OES,”Microchemical Journal, vol. 95, no. 2, pp. 169–173, 2010.
[6] A.Meche,M. C.Martins, B. E. S. N. Lofrano, C. J. Hardaway,M.Merchant, and L. Verdade, “Determination of heavy metals byinductively coupled plasma-optical emission spectrometry infish from the Piracicaba River in Southern Brazil,”Microchemi-cal Journal, vol. 94, no. 2, pp. 171–174, 2010.
[7] A. Demirbas, “Oil, micronutrient and heavy metal contents oftomatoes,” Food Chemistry, vol. 118, no. 3, pp. 504–507, 2010.
[8] L. S. Nunes, J. T. P. Barbosa, A. P. Fernandes et al., “Multi-element determination of Cu, Fe, Ni and Zn content in vege-table oils samples by high-resolution continuum source atomicabsorption spectrometry and microemulsion sample prepara-tion,” Food Chemistry, vol. 127, no. 2, pp. 780–783, 2011.
[9] M. Hoenig, H. Baeten, S. Vanhentenrijk, E. Vassileva, and P.Quevauviller, “Critical discussion on the need for an efficientmineralization procedure for the analysis of plant material byatomic spectrometric methods,” Analytica Chimica Acta, vol.358, no. 1, pp. 85–94, 1998.
[10] M. Canli and G. Atli, “The relationships between heavy metal(Cd, Cr, Cu, Fe, Pb, Zn) levels and the size of six Mediterraneanfish species,”Environmental Pollution, vol. 121, no. 1, pp. 129–136,2003.
[11] H. Hornung, M. D. Krom, Y. Cohen, and M. Bernhard, “Tracemetal content in deep-water sharks from the eastern Mediter-ranean Sea,”Marine Biology, vol. 115, no. 2, pp. 331–338, 1993.
[12] A. Giguere, P. G. C. Campbell, L. Hare, D. G. McDonald, andJ. B. Rasmussen, “Influence of lake chemistry and fish age oncadmium, copper, and zinc concentrations in various organs ofindigenous yellow perch (Perca flavescens),” Canadian Journalof Fisheries and Aquatic Sciences, vol. 61, no. 9, pp. 1702–1716,2004.
[13] H. Agemian, D. P. Sturtevant, and K. D. Austen, “Simultaneousacid extraction of six trace metals from fish tissue by hot-blockdigestion and determination by atomic-absorption spectrome-try,” Analyst, vol. 105, no. 1247, pp. 125–130, 1980.
[14] V. Sandroni and C. M. M. Smith, “Microwave digestion ofsludge, soil and sediment samples for metal analysis by induc-tively coupled plasma-atomic emission spectrometry,” Analyt-ica Chimica Acta, vol. 468, no. 2, pp. 335–344, 2002.
[15] J. Sastre, A. Sahuquillo, M. Vidal, and G. Rauret, “Determina-tion of Cd, Cu, Pb and Zn in environmental samples: micro-wave-assisted total digestion versus aqua regia and nitric acidextraction,” Analytica Chimica Acta, vol. 462, no. 1, pp. 59–72,2002.

14 ISRN Analytical Chemistry
[16] H. Lachas, R. Richaud, A. A. Herod, D. R. Dugwell, R. Kandiy-oti, and K. E. Jarvis, “Determination of 17 trace elements in coaland ash reference materials by ICP-MS applied to milligramsample sizes,” Analyst, vol. 124, no. 2, pp. 177–184, 1999.
[17] L. Garcıa-Rico, R. E. Ramos-Ruiz, and L. Gutierrez-Coronola,“Total metals in Cultivated oysters from the Northwest coastof Mexico determined by microwave digestion and atomicabsorption spectrometry,” The Journal of AOAC International,vol. 84, pp. 1909–1913, 2001.
[18] K. J. Lamble and S. J. Hill, “Microwave digestion procedures forenvironmental matrices,” Analyst, vol. 123, no. 7, pp. 103R–133R,1998.
[19] J. Ivanova, R. Djingova, S. Korhammer, and B.Markert, “On themicrowave digestion of soils and sediments for determinationof lanthanides and some toxic and essential elements by induc-tively coupled plasma source mass spectrometry,” Talanta, vol.54, no. 4, pp. 567–574, 2001.
[20] K. E. Jarvis, A. L. Gray, and R. Houk, Handbook of InductivelyCoupled PlasmaMass Spectrometry, Blackie, London, UK, 1992.
[21] Z. Mester, M. Angelone, C. Brunori, C. Cremisini, H. Muntau,and R. Morabito, “Digestion methods for analysis of fly ashsamples by atomic absorption spectrometry,”Analytica ChimicaActa, vol. 395, no. 1-2, pp. 157–163, 1999.
[22] B. Xing and P. L. M. Veneman, “Microwave digestion foranalysis of metals in soil,” Communications in Soil Science andPlant Analysis, vol. 29, no. 7-8, pp. 923–930, 1998.
[23] N. N. Meeravali and S. J. Kumar, “Comparison of openmicrowave digestion and digestion by conventional heating forthe determination of Cd, Cr, Cu andPb in algae using transverseheated electrothermal atomic absorption spectrometry,” Frese-nius’ Journal of Analytical Chemistry, vol. 366, no. 3, pp. 313–315,2000.
[24] H. Polkowska-Motrenko, B. Danko, R. Dybczynski, A. Koster-Ammerlaan, and P. Bode, “Effect of acid digestion methodon cobalt determination in plant materials,” Analytica ChimicaActa, vol. 408, no. 1-2, pp. 89–95, 2000.
[25] US-EPA Method 3051A, “Microwave assisted acid digestion ofsediments, sludges, soils and oils,” in Test Methods For Evaluat-ing Solid Waste, US Environmental Protection Agency, Wash-ington, DC, USA, 3rd edition, 2007.
[26] US-EPA Method 3052, “Microwave assisted acid digestion ofsiliceous and organically based matrices,” in Test Methods ForEvaluating Solid Waste, US Environmental Protection Agency,Washington, DC, USA, 3rd edition, 1995.
[27] H.M. Kingston and S. J. Haswell,Microwave-Enhanced Chemis-try. Fundamentals, Sample Preparation and Applications, Amer-ican Chemical Society, Washington, DC, USA, 1997.
[28] N.M.Hassan, P. E. Rasmussen, E. Dabek-Zlotorzynska, V. Celo,and H. Chen, “Analysis of environmental samples using mi-crowave-assisted acid digestion and inductively coupled plas-ma mass spectrometry: maximizing total element recoveries,”Water, Air, and Soil Pollution, vol. 178, no. 1–4, pp. 323–334, 2007.
[29] E. J. Llorent-Martınez, P. Ortega-Barrales, M. L. Fernandez-deCordova, A. Domınguez-Vidal, and A. Ruiz-Medina, “Investi-gation by ICP-MS of trace element levels in vegetable edibleoils produced in Spain,” Food Chemistry, vol. 127, pp. 1257–1262,2001.
[30] H.Altundag andM. Tuzen, “Comparison of dry, wet andmicro-wave digestion methods for the multi element determinationin some dried fruit samples by ICP-OES,” Food and ChemicalToxicology, vol. 49, no. 11, pp. 2800–2807, 2011.
[31] C. Yafa and J. G. Farmer, “A comparative study of acid-extractable and total digestion methods for the determinationof inorganic elements in peat material by inductively cou-pled plasma-optical emission spectrometry,” Analytica ChimicaActa, vol. 557, no. 1-2, pp. 296–303, 2006.
[32] E. Marguı, I. Queralt, M. L. Carvalho, and M. Hidalgo, “Com-parison of EDXRF and ICP-OES after microwave digestion forelement determination in plant specimens from an abandonedmining area,” Analytica Chimica Acta, vol. 549, no. 1-2, pp. 197–204, 2005.
[33] NIST. National Institute of Standards and Technology, Certifi-cate of Analysis, Standard Reference Material 1549 Non Fat MilkPowder, 2009.
[34] NIST. National Institute of Standards and Technology, Cer-tificate of Analysis, Standard Reference Material 2976 MusselTissue, 2008.
[35] NIST. National Institute of Standards and Technology, Cer-tificate of Analysis, Standard Reference Material 1573a TomatoLeaves, 1993.
[36] J. T. Creed, C. A. Brockhoff, and T. D.Martin, “US-EPAMethod200.8: determination of trace elements in waters and wastesby inductively coupled plasma-mass spectrometry,” in Environ-mental Monitoring Systems Laboratory Office of Research andDevelopment, Revision 5.4 EMMCVersion, U.S. EnvironmentalProtection Agency, Cincinnati, Ohio, USA, 1994.
[37] I. B. Brenner and B. Spence, “Determination of metals in envi-ronmental samples using the X series ICP-MS,” in Instructionsfor Operation Based on US-EPA Method 200.8 Version 5.5,Version: 2-2, Thermo Electron Corporation, 2005.
[38] J. Arunachalam, C. Mohl, P. Ostapczuk, and H. Emons, “Multi-element characterization of soil samples with ICP-MS for envi-ronmental studies,” Fresenius’ Journal of Analytical Chemistry,vol. 352, no. 6, pp. 577–581, 1995.
[39] M. H. Gonzalez, G. B. Souza, R. V. Oliveira, L. A. Forato, J. A.Nobrega, and A. R. A. Nogueira, “Microwave-assisted digestionprocedures for biological samples with diluted nitric acid: iden-tification of reaction products,” Talanta, vol. 79, no. 2, pp. 396–401, 2009.
[40] I. Rodushkin, T. Ruth, and A. Huhtasaari, “Comparison of twodigestion methods for elemental determinations in plant ma-terial by ICP techniques,” Analytica Chimica Acta, vol. 378, no.1–3, pp. 191–200, 1999.
[41] R. Falciani, E. Novaro, M. Marchesini, and M. Gucciardi,“Multi-element analysis of soil and sediment by ICP-MS aftera microwave assisted digestion method,” Journal of analyticalatomic spectrometry, vol. 15, no. 5, pp. 561–565, 2000.

Submit your manuscripts athttp://www.hindawi.com
Hindawi Publishing Corporationhttp://www.hindawi.com Volume 2014
Inorganic ChemistryInternational Journal of
Hindawi Publishing Corporation http://www.hindawi.com Volume 2014
International Journal ofPhotoenergy
Hindawi Publishing Corporationhttp://www.hindawi.com Volume 2014
Carbohydrate Chemistry
International Journal of
Hindawi Publishing Corporationhttp://www.hindawi.com Volume 2014
Journal of
Chemistry
Hindawi Publishing Corporationhttp://www.hindawi.com Volume 2014
Advances in
Physical Chemistry
Hindawi Publishing Corporationhttp://www.hindawi.com
Analytical Methods in Chemistry
Journal of
Volume 2014
Bioinorganic Chemistry and ApplicationsHindawi Publishing Corporationhttp://www.hindawi.com Volume 2014
SpectroscopyInternational Journal of
Hindawi Publishing Corporationhttp://www.hindawi.com Volume 2014
The Scientific World JournalHindawi Publishing Corporation http://www.hindawi.com Volume 2014
Medicinal ChemistryInternational Journal of
Hindawi Publishing Corporationhttp://www.hindawi.com Volume 2014
Chromatography Research International
Hindawi Publishing Corporationhttp://www.hindawi.com Volume 2014
Applied ChemistryJournal of
Hindawi Publishing Corporationhttp://www.hindawi.com Volume 2014
Hindawi Publishing Corporationhttp://www.hindawi.com Volume 2014
Theoretical ChemistryJournal of
Hindawi Publishing Corporationhttp://www.hindawi.com Volume 2014
Journal of
Spectroscopy
Analytical ChemistryInternational Journal of
Hindawi Publishing Corporationhttp://www.hindawi.com Volume 2014
Journal of
Hindawi Publishing Corporationhttp://www.hindawi.com Volume 2014
Quantum Chemistry
Hindawi Publishing Corporationhttp://www.hindawi.com Volume 2014
Organic Chemistry International
ElectrochemistryInternational Journal of
Hindawi Publishing Corporation http://www.hindawi.com Volume 2014
Hindawi Publishing Corporationhttp://www.hindawi.com Volume 2014
CatalystsJournal of
Related Documents