Research Article Clinical Course and Nutritional Management of Propionic and Methylmalonic Acidemias Amira Mobarak , 1 Heba Dawoud, 1 Hanaa Nofal, 2 and Amr Zoair 1 1 Pediatrics Department, Faculty of Medicine, Tanta University, Tanta, Egypt 2 Clinical Pathology Department, Faculty of Medicine, Tanta University, Tanta, Egypt Correspondence should be addressed to Amira Mobarak; [email protected] Received 27 March 2020; Revised 28 July 2020; Accepted 2 September 2020; Published 16 September 2020 Academic Editor: C. S. Johnston Copyright © 2020 Amira Mobarak et al. is is an open access article distributed under the Creative Commons Attribution License, which permits unrestricted use, distribution, and reproduction in any medium, provided the original work is properly cited. Propionic and methylmalonic acidemias result in multiple health problems including increased risk for neurological and in- tellectual disabilities. Knowledge regarding factors that correlate to poor prognosis and long-term outcomes is still limited. In this study, we aim to provide insight concerning clinical course and long-term complications by identifying possible correlating factors to complications. Results. is is a retrospective review of 20 Egyptian patients diagnosed with PA (n � 10) and MMA (n � 10) in the years 2014–2018. PA patients had lower DQ/IQ and were more liable to hypotonia and developmental delay. e DQ/IQ had a strong negative correlation with length of hospital stay, frequency of PICU admissions, time delay until diagnosis, and the mode ammonia level. However, DQ/IQ did not correlate with age of onset of symptoms or the peak ammonia level at presentation. Both the growth percentiles and albumin levels had a positive correlation with natural protein intake and did not correlate with the total protein intake. Additionally, patients on higher amounts of medical formula did not necessarily show an improvement in the frequency of decompensation episodes. Conclusion. Our findings indicate that implementation of NBS, vigilant and proactive management of decompensation episodes, and pursuing normal ammonia levels during monitoring can help patients achieve a better neurological prognosis. Furthermore, patients can have a better outcome on mainly natural protein; medical formula should only be used in cases where patients do not meet 100–120% of their DRI from natural protein. 1.Introduction Propionic acidemia (PA) and methylmalonic aciduria (MMA) are autosomal recessive organic acidemias caused by enzyme defects in the catabolic pathway of propiogenic amino acids. ese enzymes are propionyl CoA carboxylase and methylmalonyl CoA, respectively. Despite advances in detection and treatment of these two diseases, the long-term prognosis is still not favourable, especially for patients with propionic acidemia who are at risk for many long-term complications, particularly neurological [1]. As our knowledge about the long-term complications of these two diseases is still limited, our aim for this study is to provide some insight concerning long-term complications in these patient groups through the identification of possible correlating factors to complications. is aim works to contribute to a better understanding of the natural history of these two diseases. 2. Patients and Methods 2.1.Patients. We reviewed 20 Egyptian patients with PA and MMA from 20 different families diagnosed between the years 2014 and 2018. Details of the study group are shown in Tables 1 and 2. e study was approved by the ethical committee of the Faculty of Medicine, Tanta University, Egypt. Written informed consent was obtained from the patients’ parents/legal guardians. 2.2. Clinical Examination, Data Collection, and Analysis. Patients’ clinical examinations were performed during in- hospital admissions or routine outpatient clinic visits. Data Hindawi Journal of Nutrition and Metabolism Volume 2020, Article ID 8489707, 9 pages https://doi.org/10.1155/2020/8489707

Welcome message from author
This document is posted to help you gain knowledge. Please leave a comment to let me know what you think about it! Share it to your friends and learn new things together.
Transcript
Research ArticleClinical Course and Nutritional Management of Propionic andMethylmalonic Acidemias
Amira Mobarak ,1 Heba Dawoud,1 Hanaa Nofal,2 and Amr Zoair1
1Pediatrics Department, Faculty of Medicine, Tanta University, Tanta, Egypt2Clinical Pathology Department, Faculty of Medicine, Tanta University, Tanta, Egypt
Correspondence should be addressed to Amira Mobarak; [email protected]
Received 27 March 2020; Revised 28 July 2020; Accepted 2 September 2020; Published 16 September 2020
Academic Editor: C. S. Johnston
Copyright © 2020 Amira Mobarak et al. %is is an open access article distributed under the Creative Commons AttributionLicense, which permits unrestricted use, distribution, and reproduction in any medium, provided the original work isproperly cited.
Propionic and methylmalonic acidemias result in multiple health problems including increased risk for neurological and in-tellectual disabilities. Knowledge regarding factors that correlate to poor prognosis and long-term outcomes is still limited. In thisstudy, we aim to provide insight concerning clinical course and long-term complications by identifying possible correlatingfactors to complications. Results. %is is a retrospective review of 20 Egyptian patients diagnosed with PA (n� 10) and MMA(n� 10) in the years 2014–2018. PA patients had lower DQ/IQ and were more liable to hypotonia and developmental delay. %eDQ/IQ had a strong negative correlation with length of hospital stay, frequency of PICU admissions, time delay until diagnosis,and the mode ammonia level. However, DQ/IQ did not correlate with age of onset of symptoms or the peak ammonia level atpresentation. Both the growth percentiles and albumin levels had a positive correlation with natural protein intake and did notcorrelate with the total protein intake. Additionally, patients on higher amounts of medical formula did not necessarily show animprovement in the frequency of decompensation episodes. Conclusion. Our findings indicate that implementation of NBS,vigilant and proactive management of decompensation episodes, and pursuing normal ammonia levels during monitoring canhelp patients achieve a better neurological prognosis. Furthermore, patients can have a better outcome on mainly natural protein;medical formula should only be used in cases where patients do not meet 100–120% of their DRI from natural protein.
1. Introduction
Propionic acidemia (PA) and methylmalonic aciduria(MMA) are autosomal recessive organic acidemias caused byenzyme defects in the catabolic pathway of propiogenicamino acids. %ese enzymes are propionyl CoA carboxylaseand methylmalonyl CoA, respectively. Despite advances indetection and treatment of these two diseases, the long-termprognosis is still not favourable, especially for patients withpropionic acidemia who are at risk for many long-termcomplications, particularly neurological [1].
As our knowledge about the long-term complications ofthese two diseases is still limited, our aim for this study is toprovide some insight concerning long-term complicationsin these patient groups through the identification of possiblecorrelating factors to complications. %is aim works to
contribute to a better understanding of the natural history ofthese two diseases.
2. Patients and Methods
2.1. Patients. We reviewed 20 Egyptian patients with PA andMMA from 20 different families diagnosed between theyears 2014 and 2018. Details of the study group are shown inTables 1 and 2. %e study was approved by the ethicalcommittee of the Faculty of Medicine, Tanta University,Egypt. Written informed consent was obtained from thepatients’ parents/legal guardians.
2.2. Clinical Examination, Data Collection, and Analysis.Patients’ clinical examinations were performed during in-hospital admissions or routine outpatient clinic visits. Data
HindawiJournal of Nutrition and MetabolismVolume 2020, Article ID 8489707, 9 pageshttps://doi.org/10.1155/2020/8489707
were collected by a retrospective review of medical chartsand entered into a Microsoft Office Excel spreadsheet forstatistical analysis.
DQ was calculated in patients ≤2 years of age by usingthe equation DQ� chronological age/developmental age x100, while those between 2 and 7 years had their IQ tested byusing the Wechsler Preschool and Primary Scale of Intel-ligence. Global developmental delay was defined as signif-icant delay (at least 2 SDs below the mean with standardizedtests) in at least two developmental domains from the fol-lowing: gross or fine motor, speech/language, cognitionsocial/personal, and activities of daily living.
Patients were diagnosed with motor delay when theyshowed unusually slow development of fine motor or grossmotor abilities (2SD below the average for sex and age) andwere diagnosed with speech delay when either the child’s
speech was more incoherent than would be expected forage or had speech sound error patterns not appropriate forage.
Data are expressed as mean± SD, and anthropometricmeasurements are reported in percentiles. Student’s t-testwas used to compare values of any two independent groups,and Pearson’s correlation coefficient was used to evaluate thecorrelation between independent variables. Significance wasset at p< 0.05. One-way ANOVA with Bonferroni correc-tion for multiple comparisons was used to compare differentgrowth percentiles with a significance level of p< 0.016.
3. Results
%is study included 20 pediatric Egyptian patients, 10 withPA and 10 with MMA. Patients were diagnosed by selectivescreening promoted by a positive family history (one pa-tient) or a suspicious clinical presentation (Table 1).
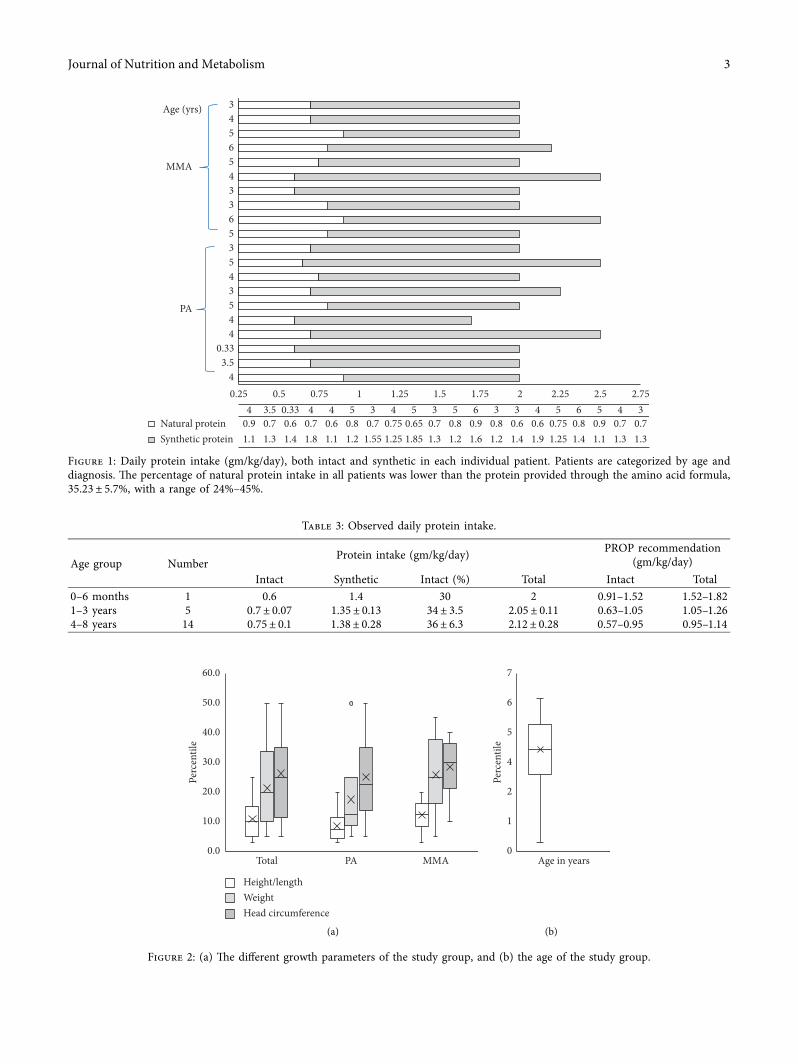
3.1. Diet, Physical Development, and Nutritional Status.Average percentile for height/length was 10.85± 6.71% with65% (13/20)≤ 10th percentile, average weight percentile was21.25± 14.04% with 35% (7/20)≤ 10th percentile, and headcircumference (HC) was 26.25± 14.13% with 10% (5/20) onthe ≤10th percentile.
Total protein intake was 2.09± 0.24 gm/kg/day, wherenatural protein intake was 0.73± 0.09 gm/kg/day, and pro-tein intake from amino acid formula was 1.37± 0.24 gm/kg/day. %e ratio between natural and medical formula proteinwas 0.55± 0.13. %e percentage of natural protein(35.32± 5.75%) was less than that supplied from the medicalformula (65.34± 5.95%) in all patients, p< 0.0001. Totalprotein intake in all 20 patients was above the recommendedDietary Reference Intakes (DRI). Natural protein intake in18 patients was within the recommended DRI, with 2 pa-tients below DRI (Figure 1 and Table 3). %e number ofdecompensation episodes did not correlate with total(r� −0.14, p � 0.53), natural (r� −0.15, p � 0.51), or med-ical formula (r� −0.08, p � 0.72) protein intake.
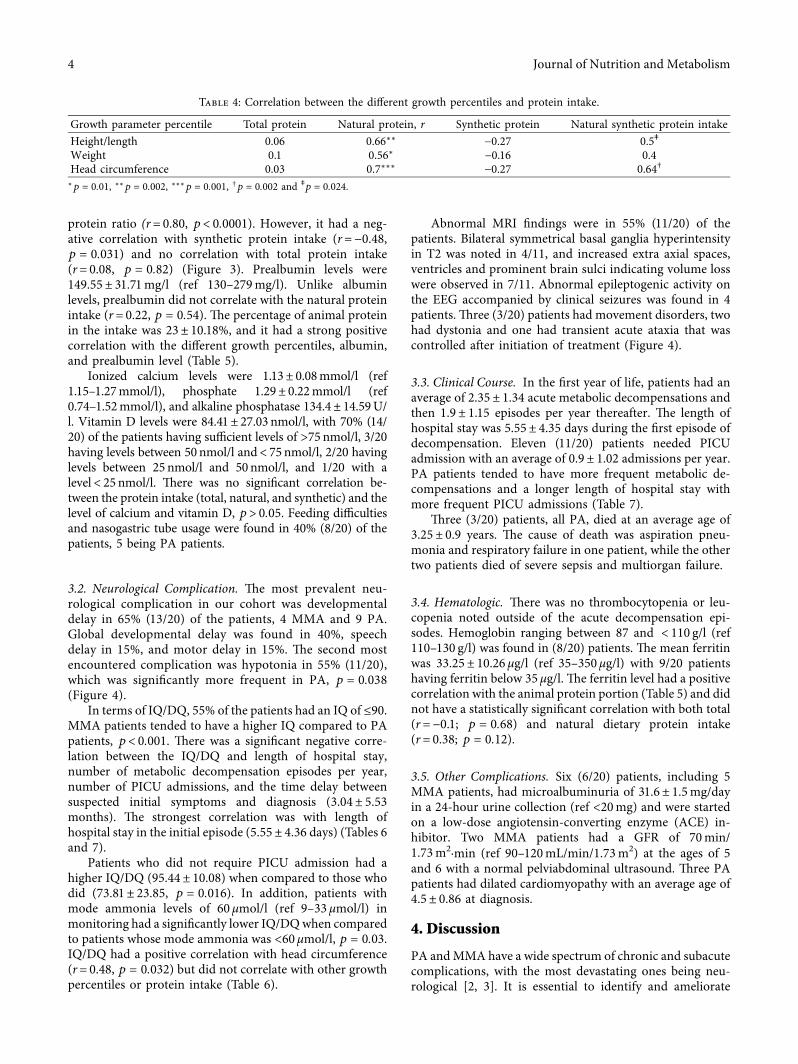
Although our patients were on a high total protein in-take, growth parameters were on the lower percentiles withheight being themost affected, p< 0.0001 (Figure 2). Growthindices (height/length, weight, and head circumference) hada strong positive correlation with both natural protein intakeand natural/synthetic protein ratio (Table 4). %e two pa-tients whose natural protein intake was below DRI had aheight/length on the 3rd percentile, a weight on the 5thpercentile, and a HC on the 10th and the 5th percentiles.Growth percentiles did not correlate with total protein ormedical formula intake (Table 4), age of onset of symptoms,age at diagnosis, number of metabolic decompensationepisodes, number of PICU admissions, and time delay be-tween initial symptoms and diagnosis, p> 0.05.
Albumin levels measured during periods of metabolicstability were 37.5± 3 g/l with no significant difference be-tween MMA and PA patients, p � 0.35. %e albumin levelhad a significant positive correlation with daily naturalprotein intake (r� 0.8, p< 0.001) and natural/synthetic
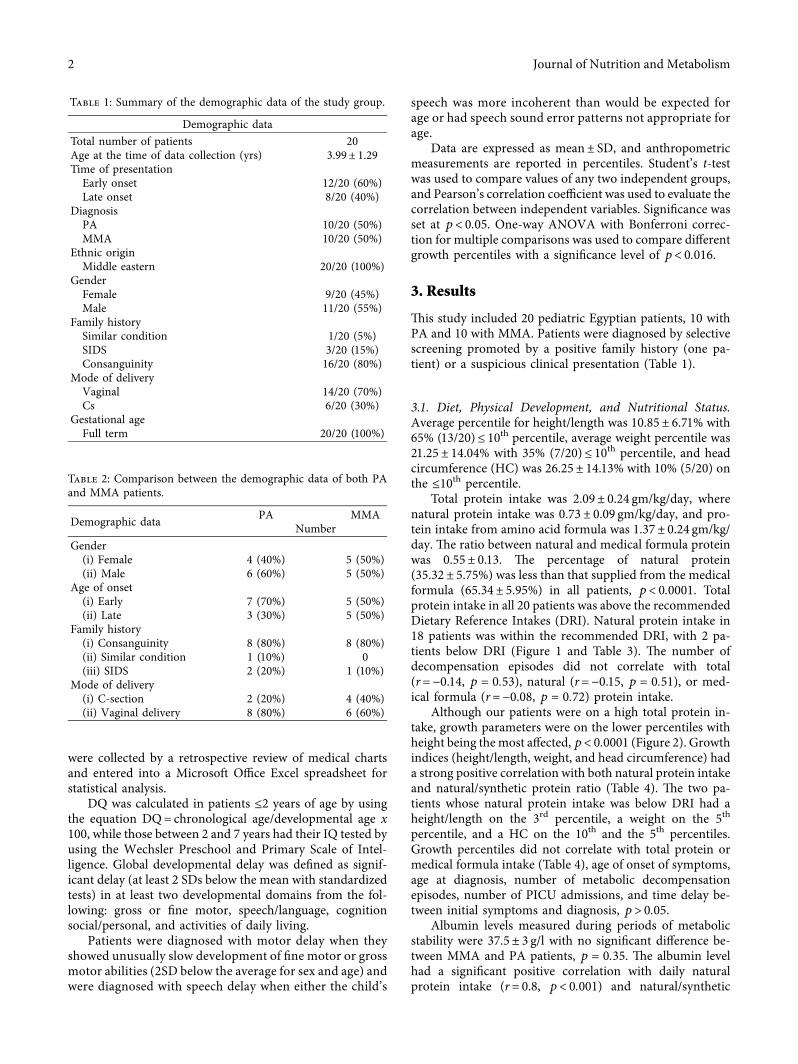
Table 1: Summary of the demographic data of the study group.
Demographic dataTotal number of patients 20Age at the time of data collection (yrs) 3.99± 1.29Time of presentationEarly onset 12/20 (60%)Late onset 8/20 (40%)
DiagnosisPA 10/20 (50%)MMA 10/20 (50%)
Ethnic originMiddle eastern 20/20 (100%)
GenderFemale 9/20 (45%)Male 11/20 (55%)
Family historySimilar condition 1/20 (5%)SIDS 3/20 (15%)Consanguinity 16/20 (80%)
Mode of deliveryVaginal 14/20 (70%)Cs 6/20 (30%)
Gestational ageFull term 20/20 (100%)
Table 2: Comparison between the demographic data of both PAand MMA patients.
Demographic data PA MMANumber
Gender(i) Female 4 (40%) 5 (50%)(ii) Male 6 (60%) 5 (50%)
Age of onset(i) Early 7 (70%) 5 (50%)(ii) Late 3 (30%) 5 (50%)
Family history(i) Consanguinity 8 (80%) 8 (80%)(ii) Similar condition 1 (10%) 0(iii) SIDS 2 (20%) 1 (10%)
Mode of delivery(i) C-section 2 (20%) 4 (40%)(ii) Vaginal delivery 8 (80%) 6 (60%)
2 Journal of Nutrition and Metabolism
0.25 0.5 0.75 1 1.25 1.5 1.75 2 2.25 2.5 2.754
3.50.33
44534535633456543
4 3.5 0.33 4 4 5 3 4 5 3 5 6 3 3 4 5 6 5 4 3Natural protein 0.9 0.7 0.6 0.7 0.6 0.8 0.7 0.75 0.65 0.7 0.8 0.9 0.8 0.6 0.6 0.75 0.8 0.9 0.7 0.7Synthetic protein 1.1 1.3 1.4 1.8 1.1 1.2 1.55 1.25 1.85 1.3 1.2 1.6 1.2 1.4 1.9 1.25 1.4 1.1 1.3 1.3
Age (yrs)
MMA
PA
Figure 1: Daily protein intake (gm/kg/day), both intact and synthetic in each individual patient. Patients are categorized by age anddiagnosis. %e percentage of natural protein intake in all patients was lower than the protein provided through the amino acid formula,35.23± 5.7%, with a range of 24%–45%.
Table 3: Observed daily protein intake.
Age group NumberProtein intake (gm/kg/day) PROP recommendation
(gm/kg/day)Intact Synthetic Intact (%) Total Intact Total
0–6 months 1 0.6 1.4 30 2 0.91–1.52 1.52–1.821–3 years 5 0.7± 0.07 1.35± 0.13 34± 3.5 2.05± 0.11 0.63–1.05 1.05–1.264–8 years 14 0.75± 0.1 1.38± 0.28 36± 6.3 2.12± 0.28 0.57–0.95 0.95–1.14
60.0
50.0
40.0
30.0
Perc
entil
e
20.0
10.0
0.0Total PA MMA
Height/lengthWeightHead circumference
(a)
7
6
5
4
Perc
entil
e
2
1
0Age in years
(b)
Figure 2: (a) %e different growth parameters of the study group, and (b) the age of the study group.
Journal of Nutrition and Metabolism 3
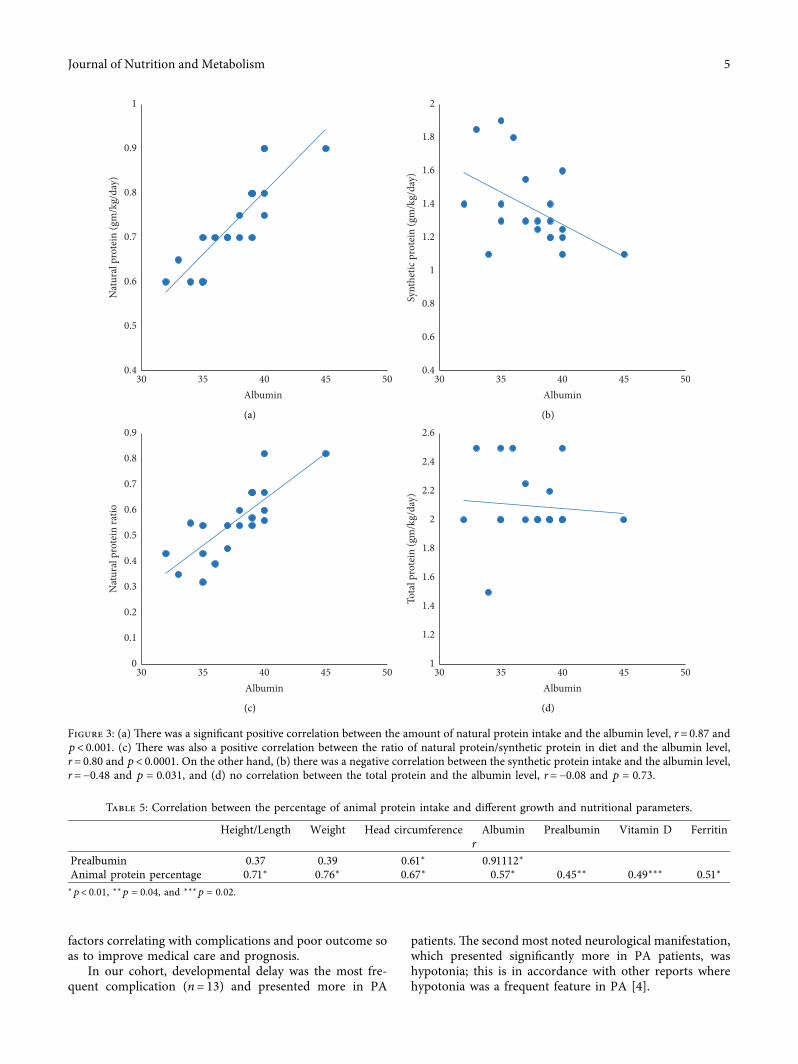
protein ratio (r� 0.80, p< 0.0001). However, it had a neg-ative correlation with synthetic protein intake (r� −0.48,p � 0.031) and no correlation with total protein intake(r� 0.08, p � 0.82) (Figure 3). Prealbumin levels were149.55± 31.71mg/l (ref 130–279mg/l). Unlike albuminlevels, prealbumin did not correlate with the natural proteinintake (r� 0.22, p � 0.54). %e percentage of animal proteinin the intake was 23± 10.18%, and it had a strong positivecorrelation with the different growth percentiles, albumin,and prealbumin level (Table 5).
Ionized calcium levels were 1.13± 0.08mmol/l (ref1.15–1.27mmol/l), phosphate 1.29± 0.22mmol/l (ref0.74–1.52mmol/l), and alkaline phosphatase 134.4± 14.59U/l. Vitamin D levels were 84.41± 27.03 nmol/l, with 70% (14/20) of the patients having sufficient levels of >75 nmol/l, 3/20having levels between 50nmol/l and< 75nmol/l, 2/20 havinglevels between 25nmol/l and 50nmol/l, and 1/20 with alevel< 25nmol/l. %ere was no significant correlation be-tween the protein intake (total, natural, and synthetic) and thelevel of calcium and vitamin D, p> 0.05. Feeding difficultiesand nasogastric tube usage were found in 40% (8/20) of thepatients, 5 being PA patients.
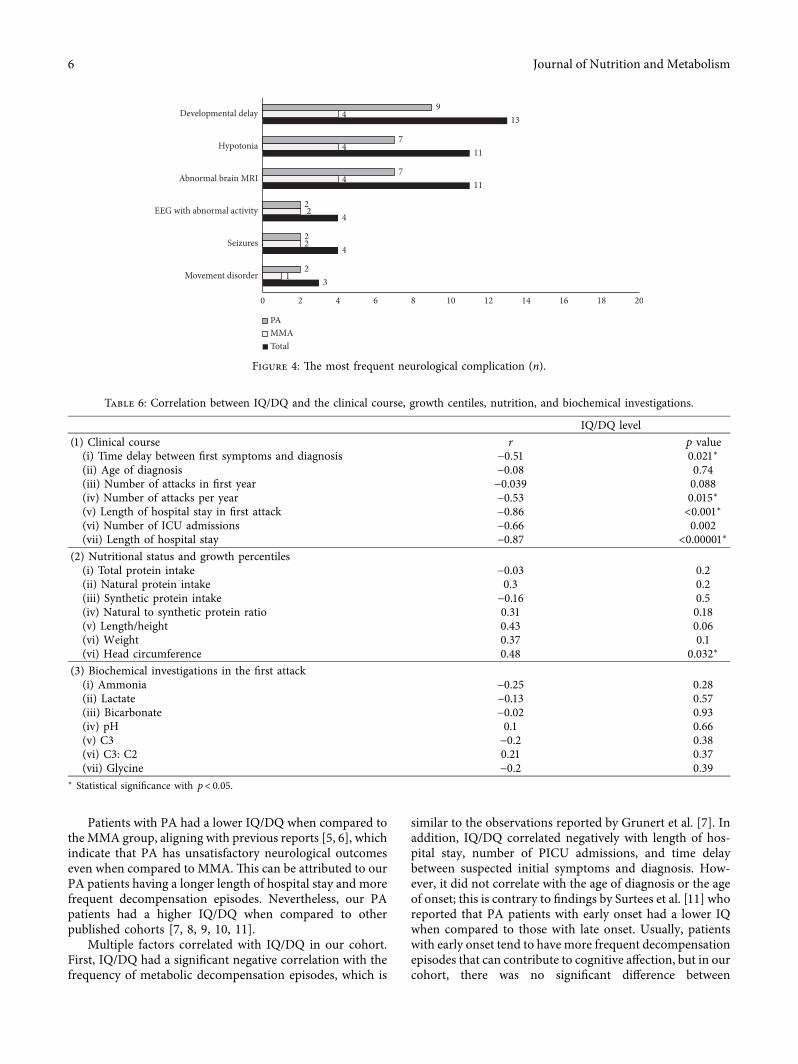
3.2. Neurological Complication. %e most prevalent neu-rological complication in our cohort was developmentaldelay in 65% (13/20) of the patients, 4 MMA and 9 PA.Global developmental delay was found in 40%, speechdelay in 15%, and motor delay in 15%. %e second mostencountered complication was hypotonia in 55% (11/20),which was significantly more frequent in PA, p � 0.038(Figure 4).
In terms of IQ/DQ, 55% of the patients had an IQ of ≤90.MMA patients tended to have a higher IQ compared to PApatients, p< 0.001. %ere was a significant negative corre-lation between the IQ/DQ and length of hospital stay,number of metabolic decompensation episodes per year,number of PICU admissions, and the time delay betweensuspected initial symptoms and diagnosis (3.04± 5.53months). %e strongest correlation was with length ofhospital stay in the initial episode (5.55± 4.36 days) (Tables 6and 7).
Patients who did not require PICU admission had ahigher IQ/DQ (95.44± 10.08) when compared to those whodid (73.81± 23.85, p � 0.016). In addition, patients withmode ammonia levels of 60 µmol/l (ref 9–33 µmol/l) inmonitoring had a significantly lower IQ/DQwhen comparedto patients whose mode ammonia was <60 µmol/l, p � 0.03.IQ/DQ had a positive correlation with head circumference(r� 0.48, p � 0.032) but did not correlate with other growthpercentiles or protein intake (Table 6).
Abnormal MRI findings were in 55% (11/20) of thepatients. Bilateral symmetrical basal ganglia hyperintensityin T2 was noted in 4/11, and increased extra axial spaces,ventricles and prominent brain sulci indicating volume losswere observed in 7/11. Abnormal epileptogenic activity onthe EEG accompanied by clinical seizures was found in 4patients. %ree (3/20) patients had movement disorders, twohad dystonia and one had transient acute ataxia that wascontrolled after initiation of treatment (Figure 4).
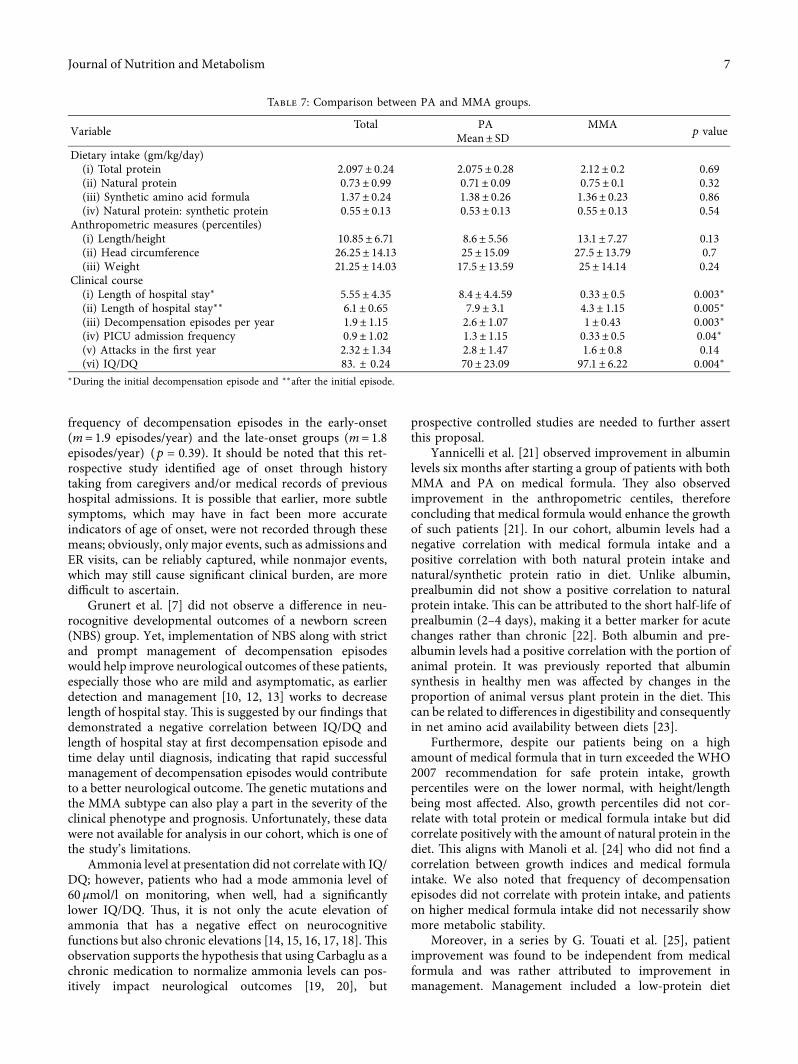
3.3. Clinical Course. In the first year of life, patients had anaverage of 2.35± 1.34 acute metabolic decompensations andthen 1.9± 1.15 episodes per year thereafter. %e length ofhospital stay was 5.55± 4.35 days during the first episode ofdecompensation. Eleven (11/20) patients needed PICUadmission with an average of 0.9± 1.02 admissions per year.PA patients tended to have more frequent metabolic de-compensations and a longer length of hospital stay withmore frequent PICU admissions (Table 7).
%ree (3/20) patients, all PA, died at an average age of3.25± 0.9 years. %e cause of death was aspiration pneu-monia and respiratory failure in one patient, while the othertwo patients died of severe sepsis and multiorgan failure.
3.4. Hematologic. %ere was no thrombocytopenia or leu-copenia noted outside of the acute decompensation epi-sodes. Hemoglobin ranging between 87 and < 110 g/l (ref110–130 g/l) was found in (8/20) patients. %e mean ferritinwas 33.25± 10.26 µg/l (ref 35–350 µg/l) with 9/20 patientshaving ferritin below 35 µg/l. %e ferritin level had a positivecorrelation with the animal protein portion (Table 5) and didnot have a statistically significant correlation with both total(r� −0.1; p � 0.68) and natural dietary protein intake(r� 0.38; p � 0.12).
3.5. Other Complications. Six (6/20) patients, including 5MMA patients, had microalbuminuria of 31.6± 1.5mg/dayin a 24-hour urine collection (ref <20mg) and were startedon a low-dose angiotensin-converting enzyme (ACE) in-hibitor. Two MMA patients had a GFR of 70min/1.73m2·min (ref 90–120mL/min/1.73m2) at the ages of 5and 6 with a normal pelviabdominal ultrasound. %ree PApatients had dilated cardiomyopathy with an average age of4.5± 0.86 at diagnosis.
4. Discussion
PA andMMA have a wide spectrum of chronic and subacutecomplications, with the most devastating ones being neu-rological [2, 3]. It is essential to identify and ameliorate
Table 4: Correlation between the different growth percentiles and protein intake.
Growth parameter percentile Total protein Natural protein, r Synthetic protein Natural synthetic protein intakeHeight/length 0.06 0.66∗∗ −0.27 0.5ǂ
Weight 0.1 0.56∗ −0.16 0.4Head circumference 0.03 0.7∗∗∗ −0.27 0.64†∗p � 0.01, ∗∗p � 0.002, ∗∗∗p � 0.001, †p � 0.002 and ǂp � 0.024.
4 Journal of Nutrition and Metabolism
factors correlating with complications and poor outcome soas to improve medical care and prognosis.
In our cohort, developmental delay was the most fre-quent complication (n� 13) and presented more in PA
patients. %e second most noted neurological manifestation,which presented significantly more in PA patients, washypotonia; this is in accordance with other reports wherehypotonia was a frequent feature in PA [4].
Nat
ural
pro
tein
(gm
/kg/
day)
0.4
0.5
0.6
0.7
0.8
0.9
1
35 40 45 5030Albumin
(a)
0.4
0.6
0.8
1
1.2
1.4
1.6
1.8
2
Synt
hetic
pro
tein
(gm
/kg/
day)
35 40 45 5030Albumin
(b)
Nat
ural
pro
tein
ratio
0
0.1
0.2
0.3
0.4
0.5
0.6
0.7
0.8
0.9
35 40 45 5030Albumin
(c)
1
1.2
1.4
1.6
1.8
2
2.2
2.4
2.6
Tota
l pro
tein
(gm
/kg/
day)
35 40 45 5030Albumin
(d)
Figure 3: (a) %ere was a significant positive correlation between the amount of natural protein intake and the albumin level, r� 0.87 andp< 0.001. (c) %ere was also a positive correlation between the ratio of natural protein/synthetic protein in diet and the albumin level,r� 0.80 and p< 0.0001. On the other hand, (b) there was a negative correlation between the synthetic protein intake and the albumin level,r� −0.48 and p � 0.031, and (d) no correlation between the total protein and the albumin level, r� −0.08 and p � 0.73.
Table 5: Correlation between the percentage of animal protein intake and different growth and nutritional parameters.
Height/Length Weight Head circumference Albumin Prealbumin Vitamin D Ferritinr
Prealbumin 0.37 0.39 0.61∗ 0.91112∗Animal protein percentage 0.71∗ 0.76∗ 0.67∗ 0.57∗ 0.45∗∗ 0.49∗∗∗ 0.51∗∗p< 0.01, ∗∗p � 0.04, and ∗∗∗p � 0.02.
Journal of Nutrition and Metabolism 5
Patients with PA had a lower IQ/DQ when compared totheMMA group, aligning with previous reports [5, 6], whichindicate that PA has unsatisfactory neurological outcomeseven when compared to MMA.%is can be attributed to ourPA patients having a longer length of hospital stay and morefrequent decompensation episodes. Nevertheless, our PApatients had a higher IQ/DQ when compared to otherpublished cohorts [7, 8, 9, 10, 11].
Multiple factors correlated with IQ/DQ in our cohort.First, IQ/DQ had a significant negative correlation with thefrequency of metabolic decompensation episodes, which is
similar to the observations reported by Grunert et al. [7]. Inaddition, IQ/DQ correlated negatively with length of hos-pital stay, number of PICU admissions, and time delaybetween suspected initial symptoms and diagnosis. How-ever, it did not correlate with the age of diagnosis or the ageof onset; this is contrary to findings by Surtees et al. [11] whoreported that PA patients with early onset had a lower IQwhen compared to those with late onset. Usually, patientswith early onset tend to have more frequent decompensationepisodes that can contribute to cognitive affection, but in ourcohort, there was no significant difference between
3
4
4
11
11
13
1
2
2
4
4
4
2
2
2
7
7
9
0 2 4 6 8 10 12 14 16 18 20
Movement disorder
Seizures
EEG with abnormal activity
Abnormal brain MRI
Hypotonia
Developmental delay
PAMMATotal
Figure 4: %e most frequent neurological complication (n).
Table 6: Correlation between IQ/DQ and the clinical course, growth centiles, nutrition, and biochemical investigations.
IQ/DQ level(1) Clinical course r p value(i) Time delay between first symptoms and diagnosis −0.51 0.021∗(ii) Age of diagnosis −0.08 0.74(iii) Number of attacks in first year −0.039 0.088(iv) Number of attacks per year −0.53 0.015∗(v) Length of hospital stay in first attack −0.86 <0.001∗(vi) Number of ICU admissions −0.66 0.002(vii) Length of hospital stay −0.87 <0.00001∗
(2) Nutritional status and growth percentiles(i) Total protein intake −0.03 0.2(ii) Natural protein intake 0.3 0.2(iii) Synthetic protein intake −0.16 0.5(iv) Natural to synthetic protein ratio 0.31 0.18(v) Length/height 0.43 0.06(vi) Weight 0.37 0.1(vi) Head circumference 0.48 0.032∗
(3) Biochemical investigations in the first attack(i) Ammonia −0.25 0.28(ii) Lactate −0.13 0.57(iii) Bicarbonate −0.02 0.93(iv) pH 0.1 0.66(v) C3 −0.2 0.38(vi) C3: C2 0.21 0.37(vii) Glycine −0.2 0.39
∗ Statistical significance with p< 0.05.
6 Journal of Nutrition and Metabolism
frequency of decompensation episodes in the early-onset(m� 1.9 episodes/year) and the late-onset groups (m� 1.8episodes/year) (p � 0.39). It should be noted that this ret-rospective study identified age of onset through historytaking from caregivers and/or medical records of previoushospital admissions. It is possible that earlier, more subtlesymptoms, which may have in fact been more accurateindicators of age of onset, were not recorded through thesemeans; obviously, only major events, such as admissions andER visits, can be reliably captured, while nonmajor events,which may still cause significant clinical burden, are moredifficult to ascertain.
Grunert et al. [7] did not observe a difference in neu-rocognitive developmental outcomes of a newborn screen(NBS) group. Yet, implementation of NBS along with strictand prompt management of decompensation episodeswould help improve neurological outcomes of these patients,especially those who are mild and asymptomatic, as earlierdetection and management [10, 12, 13] works to decreaselength of hospital stay. %is is suggested by our findings thatdemonstrated a negative correlation between IQ/DQ andlength of hospital stay at first decompensation episode andtime delay until diagnosis, indicating that rapid successfulmanagement of decompensation episodes would contributeto a better neurological outcome. %e genetic mutations andthe MMA subtype can also play a part in the severity of theclinical phenotype and prognosis. Unfortunately, these datawere not available for analysis in our cohort, which is one ofthe study’s limitations.
Ammonia level at presentation did not correlate with IQ/DQ; however, patients who had a mode ammonia level of60 µmol/l on monitoring, when well, had a significantlylower IQ/DQ. %us, it is not only the acute elevation ofammonia that has a negative effect on neurocognitivefunctions but also chronic elevations [14, 15, 16, 17, 18].%isobservation supports the hypothesis that using Carbaglu as achronic medication to normalize ammonia levels can pos-itively impact neurological outcomes [19, 20], but
prospective controlled studies are needed to further assertthis proposal.
Yannicelli et al. [21] observed improvement in albuminlevels six months after starting a group of patients with bothMMA and PA on medical formula. %ey also observedimprovement in the anthropometric centiles, thereforeconcluding that medical formula would enhance the growthof such patients [21]. In our cohort, albumin levels had anegative correlation with medical formula intake and apositive correlation with both natural protein intake andnatural/synthetic protein ratio in diet. Unlike albumin,prealbumin did not show a positive correlation to naturalprotein intake. %is can be attributed to the short half-life ofprealbumin (2–4 days), making it a better marker for acutechanges rather than chronic [22]. Both albumin and pre-albumin levels had a positive correlation with the portion ofanimal protein. It was previously reported that albuminsynthesis in healthy men was affected by changes in theproportion of animal versus plant protein in the diet. %iscan be related to differences in digestibility and consequentlyin net amino acid availability between diets [23].
Furthermore, despite our patients being on a highamount of medical formula that in turn exceeded the WHO2007 recommendation for safe protein intake, growthpercentiles were on the lower normal, with height/lengthbeing most affected. Also, growth percentiles did not cor-relate with total protein or medical formula intake but didcorrelate positively with the amount of natural protein in thediet. %is aligns with Manoli et al. [24] who did not find acorrelation between growth indices and medical formulaintake. We also noted that frequency of decompensationepisodes did not correlate with protein intake, and patientson higher medical formula intake did not necessarily showmore metabolic stability.
Moreover, in a series by G. Touati et al. [25], patientimprovement was found to be independent from medicalformula and was rather attributed to improvement inmanagement. Management included a low-protein diet
Table 7: Comparison between PA and MMA groups.
Variable Total PA MMAp valueMean± SD
Dietary intake (gm/kg/day)(i) Total protein 2.097± 0.24 2.075± 0.28 2.12± 0.2 0.69(ii) Natural protein 0.73± 0.99 0.71± 0.09 0.75± 0.1 0.32(iii) Synthetic amino acid formula 1.37± 0.24 1.38± 0.26 1.36± 0.23 0.86(iv) Natural protein: synthetic protein 0.55± 0.13 0.53± 0.13 0.55± 0.13 0.54
Anthropometric measures (percentiles)(i) Length/height 10.85± 6.71 8.6± 5.56 13.1± 7.27 0.13(ii) Head circumference 26.25± 14.13 25± 15.09 27.5± 13.79 0.7(iii) Weight 21.25± 14.03 17.5± 13.59 25± 14.14 0.24
Clinical course(i) Length of hospital stay∗ 5.55± 4.35 8.4± 4.4.59 0.33± 0.5 0.003∗(ii) Length of hospital stay∗∗ 6.1± 0.65 7.9± 3.1 4.3± 1.15 0.005∗(iii) Decompensation episodes per year 1.9± 1.15 2.6± 1.07 1± 0.43 0.003∗(iv) PICU admission frequency 0.9± 1.02 1.3± 1.15 0.33± 0.5 0.04∗(v) Attacks in the first year 2.32± 1.34 2.8± 1.47 1.6± 0.8 0.14(vi) IQ/DQ 83. ± 0.24 70± 23.09 97.1± 6.22 0.004∗
∗During the initial decompensation episode and ∗∗after the initial episode.
Journal of Nutrition and Metabolism 7
based on individual tolerance (versus restricting protein to aset amount given to PKU patients as was performed in the1970s), a limited use of medical supplements, an overnightenteral feeding with close follow up by a metabolic dietitian,and the use of antibiotics if there was any doubt that thepropionic metabolites came mainly from intestinal flora. AnAustralian study by Evans et al. also showed improvement inMMA/PA patients without the use of medical formula; theyhave been successfully treating PA/MMA patients withoutformula since 1991 [26].
Current management uses natural protein (providedthat it is tolerated) and adds medical formula when patientsfail to reach 100%–120% of the recommended safe proteinintake for age and sex [1, 27]. Based on our observations, weare inclined to support the use of natural protein overdepending on medical formula, while still maintaining abalance tailored to each patient.
While vegetarian children and adolescents’ growth pa-rameters do not differ significantly from nonvegetarians[28], the growth parameters in our cohort of patients cor-related positively with the proportion of animal proteingiven. %is can be explained by the fact that vegetarianchildren are not on a natural protein-restricted diet, makingthem able to consume larger portions of plant-based proteinto compensate for the lesser bioavailability of plant protein.On the other hand, patients with PA and MMA are on anatural protein-restricted diet; therefore, adding an animalprotein portion can impact the growth state due to thehigher bioavailability in the context of a natural protein-restricted diet.
Regarding bone health parameters, 30% of our cohorthad insufficient/deficient vitamin D levels and 90% hadmildly decreased calcium. %is differed from G. Touati et al.[25] who reported normal bone metabolism markers. It iswell known that patients with organic acidemias are liable tobone health disease for multiple reasons, including proteinrestriction [26] and their dependency on a plant-based dietwith low biological value and poor digestibility. However,vitamin D deficiency itself is a well-known nutritionalproblem among Egyptian children. In a cross-sectional studythat involved 200 prepubescent school children aged 9–11,vitamin D deficiency (<20 ng/mL) was detected in 11.5% ofsubjects, while its insufficiency (levels between 20 and29.9 ng/mL) was detected in 15%. Obesity, low physicalactivity, low sun exposure, and low maternal education levelwere significant predictors of insufficiency, while femalegender, low maternal education level, and low milk intakewere significant predictors of deficiency [29].
We also noted that 45% of our patients had low ferritin;interestingly, these levels did not correlate with proteinintake. However, it did correlate positively with the portionof animal protein intake. %is is due to the presence of hemeiron in animal protein, which has higher bioavailabilitycompared to nonheme iron from plant sources. Lack ofheme iron leads vegetarians to having an iron requirement1.8 times higher compared to nonvegetarians [30]. %esefindings indicate that such patients would need early sup-plementation with micronutrients and vitamins, given thattheir diet is dependent on medical formula or plant sources,
which may not be enough to maintain normal levels of thesemicronutrients in the long term (Craig 2009; Appleby andKey 2016; Rogerson 2017). A 2010 baseline survey aiming toevaluate the prevalence of iron deficiency anemia in Egyptrevealed that ferritin deficiency was most prevalent amongmothers (49.6%), followed by adolescents (47.4%), and thenpreschool- and school-aged children (38.2%). %is surveyindicated that iron deficiency is a major problem amongEgyptian children in general due to dependence on plant-based diets and consumption of iron inhibitors such asphyate, polyphenols, and oxalic acid, revealing a majorobstacle to dietary iron consumption and one of the poordietary habits [31, 32].
5. Conclusion
Despite advances in management of both PA and MMA,prognosis—especially neurological—is still unfavourable.Also, massive uniformity of therapeutic interventions hin-ders our understanding of optimal treatment and our abilityto compare patients’ outcomes.
%e IQ in our cohort correlated negatively with fre-quency of metabolic crisis, length of hospital stay (firstepisode and thereafter), and time delay between suspectedsymptoms and diagnosis initiation. %is indicates that theimplementation of NBS would improve prognosis byshortening the diagnosis timeframe, allowing for rapidmanagement initiation. %e fact that albumin levels andgrowth percentiles had a positive correlation with naturalprotein intake, and that patients on high amounts of medicalformula did not necessarily show an improvement in fre-quency of decompensation episodes, suggests that thesepatients can have a better outcome onmainly natural proteinwith medical formula only being used when patients fail tomeet 100–120% of their RDI from natural protein.
Table 3 shows the daily protein intake of the patientscategorized by age group and compared to the PROP rec-ommendations. All patients had a total protein intake (gm/kg/day) that exceeded the recommended DRI for age2.09± 0.24. Two patients had a natural protein intake that isbelow the DRI while the rest were within recommendedlevels of intake.
Data Availability
%e data used to support this study are included within themanuscript.
Conflicts of Interest
All the authors declare no conflicts of interest. %e corre-sponding author A. Mobarak received a joint supervisionscholarship from the Missions Sector, Ministry of HigherEducation, Egypt.
Acknowledgments
%e authors are very thankful to Dr. Gabriella Horvath,Division of Biochemical Diseases, BC Children’s Hospital,Vancouver BC, Canada, for all her mentoring, guidance, and
8 Journal of Nutrition and Metabolism
support during Amira Mobarak’s Clinical BiochemicalGenetics fellowship training at BC Children’s Hospital andduring the editing of this manuscript.
References
[1] M. R. Batshaw, F. Horster, C. Dionisi-Vici et al., “Proposedguidelines for the diagnosis and management of methyl-malonic and propionic acidemia,” Orphanet Journal of RareDiseases, vol. 9, no. 1, p. 130, 2014.
[2] L. Pena, J. Franks, K. A. Chapman et al., “Natural history ofpropionic acidemia,” Molecular Genetics and Metabolism,vol. 105, no. 1, pp. 5–9, 2012.
[3] V. R. Sutton, K. A. Chapman, A. L. Gropman et al., “Chronicmanagement and health supervision of individuals withpropionic acidemia,” Molecular Genetics and Metabolism,vol. 105, no. 1, pp. 26–33, 2012.
[4] J. Schreiber, K. A. Chapman, M. L. Summar et al., “Neurologicconsiderations in propionic acidemia,” in Molecular Geneticsand Metabolism, pp. 10–15, Elsevier, Amsterdam, Nether-lands, 2012.
[5] H. O. De Baulny, J. F. Benoist, O. Rigal, G. Touati, D. Rabier,and J. M. Saudubray, “Methylmalonic and propionic acid-aemias: management and outcome,” Journal of InheritedMetabolic Disease, vol. 28, no. 3, pp. 415–423, 2005.
[6] D. Fujisawa, K. Nakamura, H. Mitsubuchi et al., “Clinicalfeatures and management of organic acidemias in Japan,”Journal of Human Genetics, vol. 58, no. 12, pp. 769–774, 2013.
[7] S. C. Grunert, S. Mullerleile, L. De Silva et al., “Propionicacidemia: neonatal versus selective metabolic screening,”Journal of InheritedMetabolic Disease, vol. 35, no. 1, pp. 41–49,2012.
[8] S. C. Barth, S. Mullerleile, L. De Silva et al., “Propionicacidemia: clinical course and outcome in 55 pediatric andadolescent patients,”Orphanet Journal of Rare Diseases, vol. 8,no. 1, p. 6, 2013.
[9] K. N. Shchelochkov, M. S. Korson, Y. R. Gopal et al.,“Neonatal-onset propionic acidemia: neurologic and devel-opmental profiles, and implications for management,” 0eJournal of Pediatrics, vol. 126, no. 6, pp. 916–922, 1995.
[10] J. O. Sass, M. Hofmann, D. Skladal, B. Schwahn, andW. Sperl,“Propionic acidemia revisited: a workshop report,” ClinicalPediatrics, vol. 43, no. 9, pp. 837–843, 2004.
[11] R. A. H. Surtees, E. E. Matthews, and J. V. Leonard, “Neu-rologic outcome of propionic acidemia,” Pediatric Neurology,vol. 8, no. 5, pp. 333–337, 1992.
[12] C. Touati, F. Deodato, W. Roschinger, W. Rhead, andB. Wilcken, ““Classical” organic acidurias, propionic aciduria,methylmalonic aciduria and isovaleric aciduria: long-termoutcome and effects of expanded newborn screening usingtandem mass spectrometry,” Journal of Inherited MetabolicDisease, vol. 29, no. 2-3, pp. 383–389, 2006.
[13] J. Yudkoff, V. Valayannopoulos, V. Valayannopoulos et al.,“Impact of age at onset and newborn screening on outcome inorganic acidurias,” Journal of Inherited Metabolic Disease,vol. 39, no. 3, pp. 341–353, 2016.
[14] N. Ah Mew, L. Krivitzky, R. McCarter, M. Batshaw, andM. Tuchman, “Clinical outcomes of neonatal onset proximalversus distal urea cycle disorders do not differ,”0e Journal ofPediatrics, vol. 162, no. 2, pp. 324–329, 2013.
[15] R. M. Cohn and K. S. Roth, “Hyperammonemia, bane of thebrain,” Clinical Pediatrics, vol. 43, no. 8, pp. 683–689, 2004.
[16] V. Felipo and R. F. Butterworth, “Neurobiology of ammonia,”Progress in Neurobiology, vol. 67, no. 4, pp. 259–279, 2002.
[17] A. L. Ohura, M. Summar, and J. V. Leonard, “Neurologicalimplications of urea cycle disorders,” Journal of InheritedMetabolic Disease, vol. 30, no. 6, pp. 865–879, 2007.
[18] K. Barth, J. Wray, Z. J. Huang, M. Yudkoff, andM. L. Batshaw,“Metabolic and neuropsychological phenotype in womenheterozygous for ornithine transcarbamylase deficiency,”Annals of Neurology, vol. 55, no. 1, pp. 80–86, 2004.
[19] H. A. Haliloglu, “Carglumic acid in hyperammonaemia due toorganic acidurias: a profile of its use in the EU,” Drugs &0erapy Perspectives, vol. 35, no. 3, pp. 101–108, 2019.
[20] A. De Lonlay, L. Melpignano, A. Carella et al., “Long-termcontinuous N-carbamylglutamate treatment in frequentlydecompensated propionic acidemia: a case report,” Journal ofMedical Case Reports, vol. 12, no. 1, 2018.
[21] S. Di Mauro, P. B. Acosta, A. Velazquez et al., “Improvedgrowth and nutrition status in children with methylmalonicor propionic acidemia fed an elemental medical food,” Mo-lecular Genetics and Metabolism, vol. 80, no. 1-2, pp. 181–188,2003.
[22] U. Rohr, “Nutritional laboratory markers in malnutrition,”Journal of Clinical Medicine, vol. 8, no. 6, p. 775, 2019.
[23] G. Caso, L. Scalfi, M. Marra et al., Human nutrition andmetabolism albumin synthesis is diminished in men con-suming a predominantly vegetarian diet 1, 2000.
[24] I. Manoli, J. G. Myles, J. L. Sloan, O. A. Shchelochkov, andC. P. Venditti, “A critical reappraisal of dietary practices inmethylmalonic acidemia raises concerns about the safety ofmedical foods. Part 1: isolated methylmalonic acidemias,”Genetics in Medicine, vol. 18, no. 4, pp. 386–395, 2016.
[25] G. Touati, V. Valayannopoulos, K. Mention et al., “Methyl-malonic and propionic acidurias: management without orwith a few supplements of specific amino acid mixture,”Journal of Inherited Metabolic Disease, vol. 29, no. 2-3,pp. 288–298, 2006.
[26] M. Evans, H. Truby, and A. Boneh, “%e relationship betweendietary intake, growth, and body composition in inborn errorsof intermediary protein metabolism,” 0e Journal of Pediat-rics, vol. 188, pp. 163–172, 2017.
[27] E. Lund, K. Ueda, D. Frazier et al., “Nutrition managementguideline for propionic acidemia: an evidence-and consensus-based approach,” Molecular Genetics and Metabolism,vol. 126, no. 4, pp. 341–354, 2019.
[28] P. Gropman, D. Qin, and S. Marta, “Research article inte-grative food, nutrition and metabolism,” Integrative Food,Nutrition and Metabolism, vol. 4, pp. 1–4, 2017.
[29] M. M. A. Shady, M. M. Youssef, E. M. Salah El-Din et al.,“Predictors of serum 25-hydroxyvitamin D concentrationsamong a sample of Egyptian schoolchildren,” 0e ScientificWorld Journal, vol. 2016, Article ID 8175768, 7 pages, 2016.
[30] R. Rohr, J. Berger, and I. Hines, “Iron status of vegetarianadults: a review of literature,” American Journal of LifestyleMedicine, vol. 12, no. 6, pp. 486–498, 2018.
[31] T. Rhead and M. R. Huecker, Biochemistry, Iron Absorption,StatPearls Publishing, Tampa, FL, USA, 2019.
[32] S. Salem, F. Saeed, A. Hosni et al., Baseline Survey Data onIron Deficiency Anemia in Egypt, Gainhealth, Geneva, Swit-zerland, 2010.
Journal of Nutrition and Metabolism 9
Related Documents