Hindawi Publishing Corporation ISRN Geophysics Volume 2013, Article ID 215362, 12 pages http://dx.doi.org/10.1155/2013/215362 Research Article A Simulation Study of the Formation of Large-Scale Cyclonic and Anticyclonic Vortices in the Vicinity of the Intertropical Convergence Zone Igor V. Mingalev, 1 Natalia M. Astafieva, 2 Konstantin G. Orlov, 1 Victor S. Mingalev, 1 Oleg V. Mingalev, 1 and Valery M. Chechetkin 3 1 Polar Geophysical Institute, Kola Scientific Center of the Russian Academy of Sciences, Murmansk Region, Apatity 184209, Russia 2 Space Research Institute of the Russian Academy of Sciences, Moscow 117997, Russia 3 Keldysh Institute of Applied Mathematics of the Russian Academy of Sciences, Moscow 125047, Russia Correspondence should be addressed to Victor S. Mingalev; [email protected] Received 31 January 2013; Accepted 26 February 2013 Academic Editors: A. De Santis, M. Ernesto, and A. Streltsov Copyright © 2013 Igor V. Mingalev et al. is is an open access article distributed under the Creative Commons Attribution License, which permits unrestricted use, distribution, and reproduction in any medium, provided the original work is properly cited. A regional nonhydrostatic mathematical model of the wind system of the lower atmosphere, developed recently in the Polar Geophysical Institute, is utilized to investigate the initial stage of the origin of large-scale vortices at tropical latitudes. e model produces three-dimensional distributions of the atmospheric parameters in the height range from 0 to 15 km over a limited region of the Earth’s surface. Time-dependent modeling is performed for the cases when, at the initial moment, the simulation domain is intersected by the intertropical convergence zone (ITCZ). Calculations are made for various cases in which the initial forms of the intertropical convergence zone are different and contained convexities with distinct shapes, which are consistent with the results of satellite microwave monitoring of the Earth’s atmosphere. e results of modeling indicate that the origin of convexities in the form of the intertropical convergence zone, having distinct configurations, can lead to the formation of different large-scale vortices, in particular, a cyclonic vortex, a pair of cyclonic-anticyclonic vortices, and a pair of cyclonic vortices, during a period not longer than three days. e radii of these large-scale vortices are about 400–600 km. e horizontal wind velocity in these vortices can achieve values of 15–20 m/s in the course of time. 1. Introduction It is known that severe tropical cyclonic storms and hurri- canes can cause tremendous damage and numerous fatalities. erefore, prediction of tropical cyclone formation is a very important problem. Despite considerable efforts, the physical theory of tropical cyclone formation is still far from completion, even if some aspects of tropical cyclogenesis are commonly understood, in particular, in the late stages of formation as well as in a fully developed stage (see [1–4] and references therein). For tropical storm forecasting, it is necessary to investigate the pregenesis evolution of tropical cyclone. is investigation assumes that physical aspects of tropical cyclone formation must to be studied. To investigate physical mechanisms responsible for the tropical cyclone formation, mathematical models may be utilized. Most of numerical studies of tropical cyclogenesis explore how a tropical cyclone forms from vortices, those are precursors to tropical cyclones, or from other preexisting large-scale disturbances of the troposphere [5–12]. In the Polar Geophysical Institute (PGI), the nonhydro- static model of the global wind system in the Earth’s atmo- sphere has been developed not long ago [13, 14]. is model enables to calculate three-dimensional global distributions of the zonal, meridional, and vertical components of the wind at levels of the troposphere, stratosphere, mesosphere, and lower thermosphere, with whatever restrictions on the vertical transport of the atmospheric gas being absent. is

Welcome message from author
This document is posted to help you gain knowledge. Please leave a comment to let me know what you think about it! Share it to your friends and learn new things together.
Transcript

Hindawi Publishing CorporationISRN GeophysicsVolume 2013, Article ID 215362, 12 pageshttp://dx.doi.org/10.1155/2013/215362
Research ArticleA Simulation Study of the Formation of Large-ScaleCyclonic and Anticyclonic Vortices in the Vicinity ofthe Intertropical Convergence Zone
Igor V. Mingalev,1 Natalia M. Astafieva,2 Konstantin G. Orlov,1 Victor S. Mingalev,1
Oleg V. Mingalev,1 and Valery M. Chechetkin3
1 Polar Geophysical Institute, Kola Scientific Center of the Russian Academy of Sciences, Murmansk Region, Apatity 184209, Russia2 Space Research Institute of the Russian Academy of Sciences, Moscow 117997, Russia3 Keldysh Institute of Applied Mathematics of the Russian Academy of Sciences, Moscow 125047, Russia
Correspondence should be addressed to Victor S. Mingalev; [email protected]
Received 31 January 2013; Accepted 26 February 2013
Academic Editors: A. De Santis, M. Ernesto, and A. Streltsov
Copyright © 2013 Igor V. Mingalev et al. This is an open access article distributed under the Creative Commons AttributionLicense, which permits unrestricted use, distribution, and reproduction in any medium, provided the original work is properlycited.
A regional nonhydrostatic mathematical model of the wind system of the lower atmosphere, developed recently in the PolarGeophysical Institute, is utilized to investigate the initial stage of the origin of large-scale vortices at tropical latitudes. The modelproduces three-dimensional distributions of the atmospheric parameters in the height range from 0 to 15 km over a limited regionof the Earth’s surface. Time-dependent modeling is performed for the cases when, at the initial moment, the simulation domain isintersected by the intertropical convergence zone (ITCZ). Calculations are made for various cases in which the initial forms of theintertropical convergence zone are different and contained convexities with distinct shapes, which are consistent with the results ofsatellite microwave monitoring of the Earth’s atmosphere.The results of modeling indicate that the origin of convexities in the formof the intertropical convergence zone, having distinct configurations, can lead to the formation of different large-scale vortices, inparticular, a cyclonic vortex, a pair of cyclonic-anticyclonic vortices, and a pair of cyclonic vortices, during a period not longer thanthree days. The radii of these large-scale vortices are about 400–600 km.The horizontal wind velocity in these vortices can achievevalues of 15–20m/s in the course of time.
1. Introduction
It is known that severe tropical cyclonic storms and hurri-canes can cause tremendous damage and numerous fatalities.Therefore, prediction of tropical cyclone formation is avery important problem. Despite considerable efforts, thephysical theory of tropical cyclone formation is still far fromcompletion, even if some aspects of tropical cyclogenesis arecommonly understood, in particular, in the late stages offormation as well as in a fully developed stage (see [1–4]and references therein). For tropical storm forecasting, it isnecessary to investigate the pregenesis evolution of tropicalcyclone. This investigation assumes that physical aspects oftropical cyclone formation must to be studied.
To investigate physical mechanisms responsible for thetropical cyclone formation, mathematical models may beutilized. Most of numerical studies of tropical cyclogenesisexplore how a tropical cyclone forms from vortices, thoseare precursors to tropical cyclones, or from other preexistinglarge-scale disturbances of the troposphere [5–12].
In the Polar Geophysical Institute (PGI), the nonhydro-static model of the global wind system in the Earth’s atmo-sphere has been developed not long ago [13, 14]. This modelenables to calculate three-dimensional global distributionsof the zonal, meridional, and vertical components of thewind at levels of the troposphere, stratosphere, mesosphere,and lower thermosphere, with whatever restrictions on thevertical transport of the atmospheric gas being absent. This

2 ISRN Geophysics
model has been utilized in order to investigate numericallyhow the horizontal nonuniformity of the atmospheric gastemperature affects the formation of the middle atmospherecirculation for conditions corresponding to different seasons[13–16] and how solar activity affects the formation of thelarge-scale global circulation of the mesosphere and lowerthermosphere [17].
Recently, a regional mathematical model of the windsystem of the lower atmosphere has been developed in thePolar Geophysical Institute [18]. This model was applied toinvestigate the formation mechanisms of a large-scale vortexover a warm water band on the ocean surface. The results ofmodeling have allowed the authors to distinguish one of theformation mechanisms of moderate cyclones over the ocean[18].
Another formation mechanism of a cyclone was inves-tigated, using this mathematical model, in the study byBelotserkovskii et al. [19]. In this study, it was shown thatcyclones can appear in horizontally stratified shear flows ofwarm and wet air masses with a meridional direction ofgradients of the wind velocity components as a result of smalldisturbances of pressure which can be produced by Rossbywaves.
Also, this mathematical model has been applied to verifythe hypothesis of the influence of the shape of the intertropi-cal convergence zone (ITCZ) on the process of the formationof tropical cyclones. It was shown that the origin of a con-vexity in the configuration of the intertropical convergencezone can lead to the formation of a cyclonic vortex duringthe period of about one day. Its center is close to the southernedge of the initial intertropical convergence zone [20]. Theresults of mathematical modeling have indicated that theorigin of a convexity of the intertropical convergence zone,having the specific forms, can lead to the formation of notonly a single cyclonic vortex but also a pair of large-scalevortices [21–23].
The purpose of the present work is to continue thesestudies and to investigate numerically, applying the regionalmathematical model of the wind system of the lower atmo-sphere developed in the PGI, the initial stage of the originof large-scale vortices in the vicinity of the intertropicalconvergence zone. The applied model produces distributionsof the lower atmosphere parameters in the limited three-dimensional simulation domain. Time-dependent modelingis performed for various cases when, at the initial moment,the simulation domain is intersected by the intertropical con-vergence zones with different configurations. Calculationsare made for some cases in which the initial forms of theintertropical convergence zone are different and containedconvexities with distinct shapes.
2. Mathematical Model
In this study, the regional nonhydrostatic mathematicalmodel of thewind systemof the lower atmosphere, developednot long ago at the Polar Geophysical Institute, is applied. Inthis model, the atmospheric gas is considered as a mixtureof air and water vapor, in which two types of precipitating
water (namely, water microdrops and ice microparticles) canexist. The model is based on the numerical solution of thesystem of transport equations containing the equations ofcontinuity for air and for the total water content in all phasestates, momentum equations for the zonal, meridional, andvertical components of the air velocity, and energy equation.The characteristic feature of the model is that the verticalcomponent of the air velocity is calculated without using thehydrostatic equation. Instead, the vertical component of theair velocity is obtained by means of a numerical solution ofthe appropriate momentum equation, with whatever simpli-fications of this equation being absent. In the momentumequations for all components of the air velocity, the effectof the turbulence on the mean flow is taken into accountby using an empirical subgrid-scale parameterization similarto the global circulation model of the Earth’s atmospheredeveloped earlier in the PGI [13, 14].
Thus, the utilizedmathematicalmodel is based onnumer-ical solving of nonsimplified gas dynamic equations andproduces three-dimensional time-dependent distributionsof the wind components, temperature, air density, watervapor density, concentration of microdrops of water, andconcentration of ice particles. The model takes into accountheating/cooling of the air due to absorption/emission ofinfrared radiation, as well as due to phase transitions of watervapor to microdrops of water and ice particles, which playan important role in energetic balance. The finite-differencemethod and an explicit scheme are applied for solving thesystem of governing equations.
In the model calculations, the following variables arecomputed at each grid node: the temperature of the mixtureof air and water vapor, 𝑇; densities of air and water vapor,𝜌𝑎and 𝜌V, respectively; hydrodynamic velocity of the mixture
(a 3D vector), V⃗; and the total mass of water microdrops andice microparticles in a unit volume, 𝜌
𝑤and 𝜌
𝑖, respectively.
The governing equations in vectorial form can be written asfollows:
𝜕𝜌𝑎
𝜕𝑡+ div(𝜌
𝑎V⃗) = 0,
𝜕 (𝜌V + 𝜌𝑤 + 𝜌𝑖)
𝜕𝑡+ div[𝜌VV⃗ + 𝜌𝑤 (V⃗ + V⃗
prec𝑤
)
+ 𝜌𝑖(V⃗ + V⃗
prec𝑖
)] = 0,
𝜕 (𝜌mixV⃗)
𝜕𝑡+ div(𝜌mixV⃗ ⊗ V⃗)
= −∇𝑝 + div⌣𝜏 + (𝜌mix + 𝜌𝑤 + 𝜌𝑖) �⃗�,
(1)
𝜕𝑊
𝜕𝑡+ div[𝑊mixV⃗ +𝑊𝑤 (V⃗ + V⃗
prec𝑤
) + 𝑊𝑖(V⃗ + V⃗
prec𝑖
)]
= [𝜌mixV⃗ + 𝜌𝑤 (V⃗ + V⃗prec𝑤
) + 𝜌𝑖(V⃗ + V⃗
prec𝑖
) , �⃗�]
+ div(⌣𝜏 ⋅ V⃗ − 𝑝V⃗ − ⃗𝑗) + 𝑄,
(2)
where V⃗prec𝑤
and V⃗prec𝑖
are the precipitation velocities of watermicrodrops and ice microparticles, respectively, conditionedby the presence of an external force field anddetermined from
ISRN Geophysics 3
the Stokes relation with Cunningham’s correction; 𝜌mix =
𝜌𝑎+ 𝜌V; 𝑝 is the pressure of the mixture defined as 𝑝 =
(𝜌𝑎𝑅𝑎+ 𝜌V𝑅V)𝑇, where 𝑅𝑎 and 𝑅V are the gas constants of
air and water vapour, respectively; ⌣𝜏 is the extra stress tensorwhose components are given by the rheological equation ofstate or the law of viscous friction which is the same asin the global circulation model of the Earth’s atmospheredeveloped earlier [13, 14], with the effect of a small-scaleturbulence, having the scales equal and less than the stepsof finite-difference approximations, on the mean flow havingbeen taken into account; �⃗� is the acceleration due to anexternal force field, which consists of the gravity acceleration,Coriolis acceleration, and acceleration of translation, that canbe written in the form:
�⃗� = �⃗� − 2Ω⃗ × V⃗ − Ω⃗ × (Ω⃗ × ⃗𝑟) , (3)
where �⃗� is the acceleration due to gravity, Ω⃗ is the Earth’sangular velocity, and ⃗𝑟 is a radius vector from the center ofthe Earth to the point where the equation is applied. Thefollowing notations are used in (2):
𝑊𝑖= 𝜌𝑖[1
2(V⃗ + V⃗
prec𝑖
)2
+ 𝐶𝑖𝑇] ,
𝑊𝑤= 𝜌𝑤[1
2(V⃗ + V⃗
prec𝑤
)2
+ 𝐶𝑤(𝑇 − 𝑇
0) + 𝑞mel + 𝐶𝑖𝑇0] ,
𝑊 = 𝑊mix +𝑊𝑤 +𝑊𝑖,
(4)
where 𝐶𝑖and 𝐶
𝑤are the specific heat capacities of ice and
water, respectively, which are assumed constant; 𝑇0is the
freezing temperature of water; 𝑞mel is the specific heat ofice melting at 𝑇 = 𝑇
0; 𝑞0ev is the specific heat of water
evaporation at 𝑇 = 𝑇0; also, the vector of heat flux, �⃗�, is
given by the well-known formula, �⃗� = −⌣
𝜆 ∇𝑇, where⌣
𝜆 isthe symmetric tensor of thermal conductivity coefficients;and 𝑄 is the rate of change of energy in a unit volumedue to absorption/emission of infrared radiation. Concreteexpressions of the model parameters, those appear in (1)-(2),may be found in the studies of Belotserkovskii et al. [18, 19].
It can be noticed that the model assumes that the watermicrodrops can exist only in the presence of saturated watervapor on condition that 𝑇 ≥ 𝑇
0, while the ice microparticles
can exist only in the presence of saturated water vapor oncondition that 𝑇 ≤ 𝑇
0. At 𝑇 = 𝑇
0, the temperature of the
matter cannot increase until all ice microparticles melt, andit cannot decrease until all water microdrops freeze.
The three-dimensional simulation domain of the modelis a part of a spherical layer stretching from land and oceansurface up to the altitude of 15 km over a limited region of theEarth’s surface. The dimensions of this region in longitudinaland latitudinal directions are 32∘ and 25∘, respectively. Thefinite-difference method and explicit scheme are applied forsolving the system of governing equations. The calculatedparameters are determined on a uniform grid. The latitudeand longitude steps are equal to 0.08∘, and height step is equalto 200m. Complete details of the utilized finite-differencemethod and numerical schemes have been presented in thepaper of Mingalev et al. [24]. More complete details of the
applied regional mathematical model may be found in thestudies of Belotserkovskii et al. [18, 19] and Mingalev et al.[23].
3. Presentation and Discussion of Results
Modern scientific facility does not allow somebody to mea-sure detailed three-dimensional fields of thermodynamicaland gas dynamical parameters of the lower atmosphere withsufficient accuracy to understand the intrinsic nature oftropical cyclone genesis. However, for a better conceptualunderstanding of tropical cyclogenesis, satellite microwaveobservations may be applied, in particular, the results ofsatellite microwave monitoring of the Earth’s atmosphere,collected at the Space Research Institute of the RussianAcademy of Sciences (RAS) and included in the electronicdata base “GLOBAL-Field” (http://www.iki.rssi.ru/asp/).Thisdata base contains global radiothermal fields of the Earthat the frequencies containing the information about a mois-ture and water integral content distribution in the tropo-sphere. The data were obtained from the spacecraft mission,DMSP (Defense Meteorological Satellite Program), with thehelp of the instrument, SSM/I (Special Sensor Microwave/Imager).
As examples of data from the electronic collection“GLOBAL-Field,” fragments of global radiothermal fieldsover the Atlantic Ocean are presented in Figures 1 and2. In these Figures, the various colors of the image showthe distribution of radiobrightness temperature of surfaceof ocean and land. It is essential that this temperature isconsistent with the moisture and water integral contentdistribution in the troposphere. From Figures 1 and 2, onecan see that the Atlantic Ocean is intersected by a red bandstretched fromAfrica to SouthAmerica.This band representsan intertropical convergence zone. It can be noticed that anintertropical convergence zone is similar to a band, in whichzonal westward flow of air predominates, with the air velocitybeing enhanced. The width of the intertropical convergencezone can achieve a value of some hundreds of kilometers.
Studying numerous results of satellite microwave moni-toring of the Earth’s atmosphere, included in the electronicdata base “GLOBAL-Field,” we noticed that the form ofan intertropical convergence zone may be different and,sometimes, can contain convexities with distinct shapes. Justsuch examples are presented in Figures 1 and 2, where theconvexities are indicated by black pointers. As a consequenceof our studies of results of satellite microwave monitoring ofthe Earth’s atmosphere, we have advanced a hypothesis of theimportant role of the shape of the intertropical convergencezone in the process of the formation of tropical cyclones.
To verify the advanced hypothesis, we have decided tomake calculations with the help of the regional nonhydro-static mathematical model of the wind system of the loweratmosphere, described above, with the south boundary ofthe simulation domain having been disposed in the vicinityof the equator. It was supposed that the simulation domainis located between 5∘S and 20∘N and situated over theAtlantic Ocean. Simulations were performed for the cases

4 ISRN Geophysics
80 120 160 200 240 320(kelvin)
Figure 1: The fragment of global radiothermal field, derived fromthe results of satellite microwave monitoring of the Earth’s atmos-phere, obtained on June 29, 2005.
80 120 160 200 240(kelvin)
320
Figure 2: The same as in Figure 1, but obtained on July 3, 2005.
when the simulation domain is intersected by an intertropicalconvergence zone in the westeast direction.
From observation, it is known that, in an intertropicalconvergence zone, a zonal flow of air is westward, with thehorizontal wind velocity being enhanced inside an intertrop-ical convergence zone. A meridional wind velocity directstowards the centerline of an intertropical convergence zoneat levels less than approximately 3 km and directs fromthe centerline of an intertropical convergence zone at levelshigher than approximately 3 km. A vertical wind velocityin an intertropical convergence zone is upward. Therefore,an intertropical convergence zone may be considered as afluid stream, having enhanced zonal velocities, in the ambientatmospheric gas. In our calculations, we define the initial andboundary conditions as consistent with the situation whenthe intertropical convergence zone intersects the simulationdomain in the westeast direction. Calculations are made for
various cases in which the initial forms of the intertropicalconvergence zone are different and contained convexitieswith distinct shapes, which are consistent with observationaldata, included in the electronic collection “GLOBAL-Field.”Since the obtained results are different, it is convenient topresent them separately.
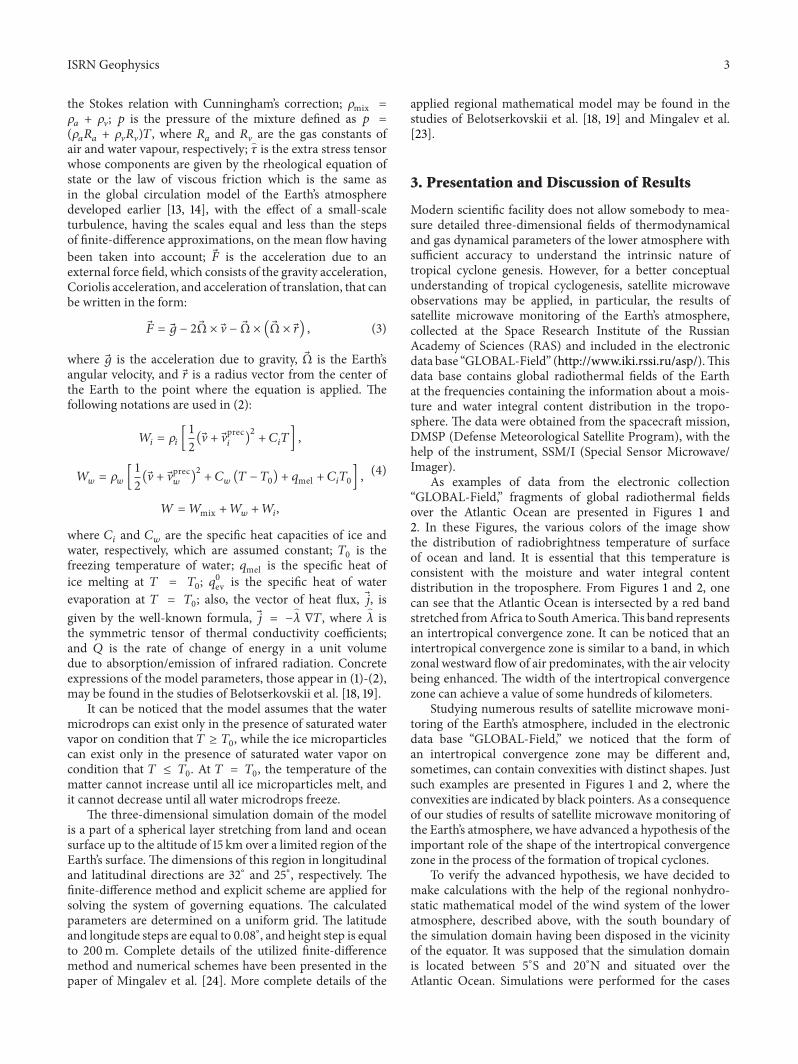
3.1. The Formation of a Cyclonic Vortex. Initially, let usconsider the first case when, at the initial moment, theintertropical convergence zone contains a convexity in thenorth direction, with the deviation achieving a value of a fewhundreds of kilometers. The initial form of the intertropicalconvergence zone may be easy seen from Figure 3(a), whereit is like a light curved band. It is essential to note that, inthe considered first case, the west crook of the convexity issharp while the east crook of the convexity is gently sloping,with the west and east ends of the convexity being at the samelatitudes.
The time evolution of model parameters was numericallysimulated using themathematicalmodel during the period ofabout one day. The results of time-dependent modeling arepartly shown in Figure 3. As can be seen from this figure,in the course of time, the initial distribution of horizontalcomponent of the air velocity was considerably transformed.A cyclonic vortex flow arose whose center is close to thesouthern edge of the initial intertropical convergence zone.The horizontal wind velocity in this cyclonic vortex achieveda value of 20m/s during the period of twenty-seven hours.The radius of this large-scale cyclonic vortex is about 600 km.
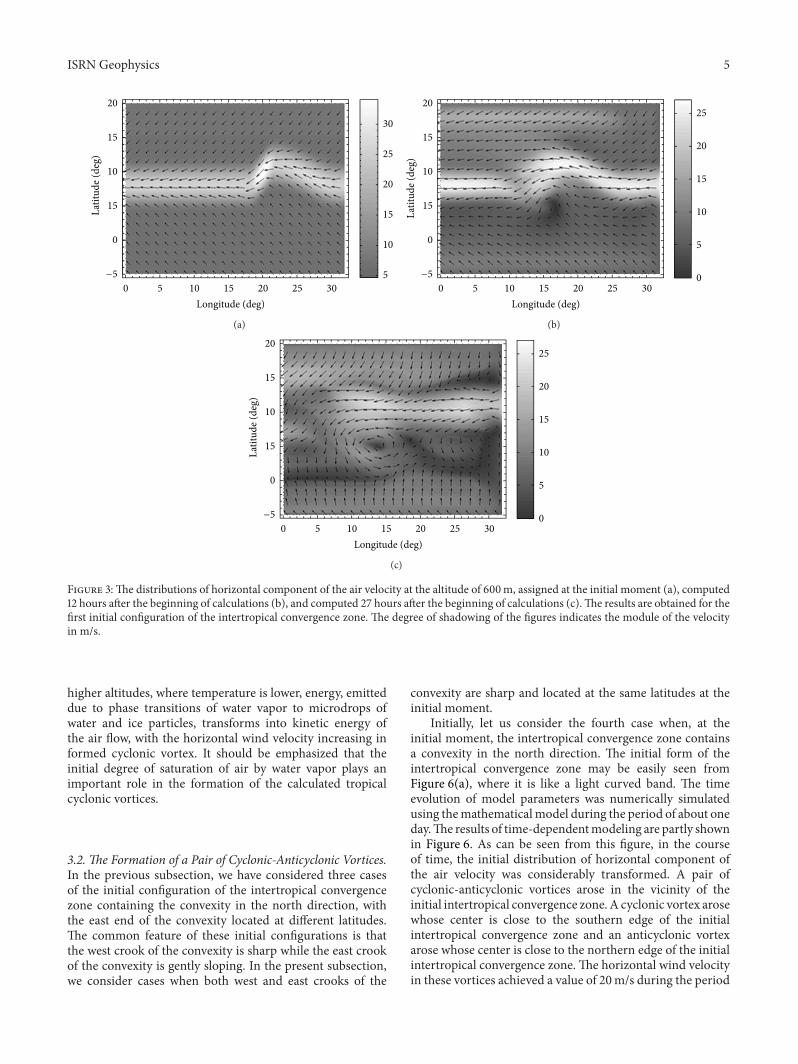
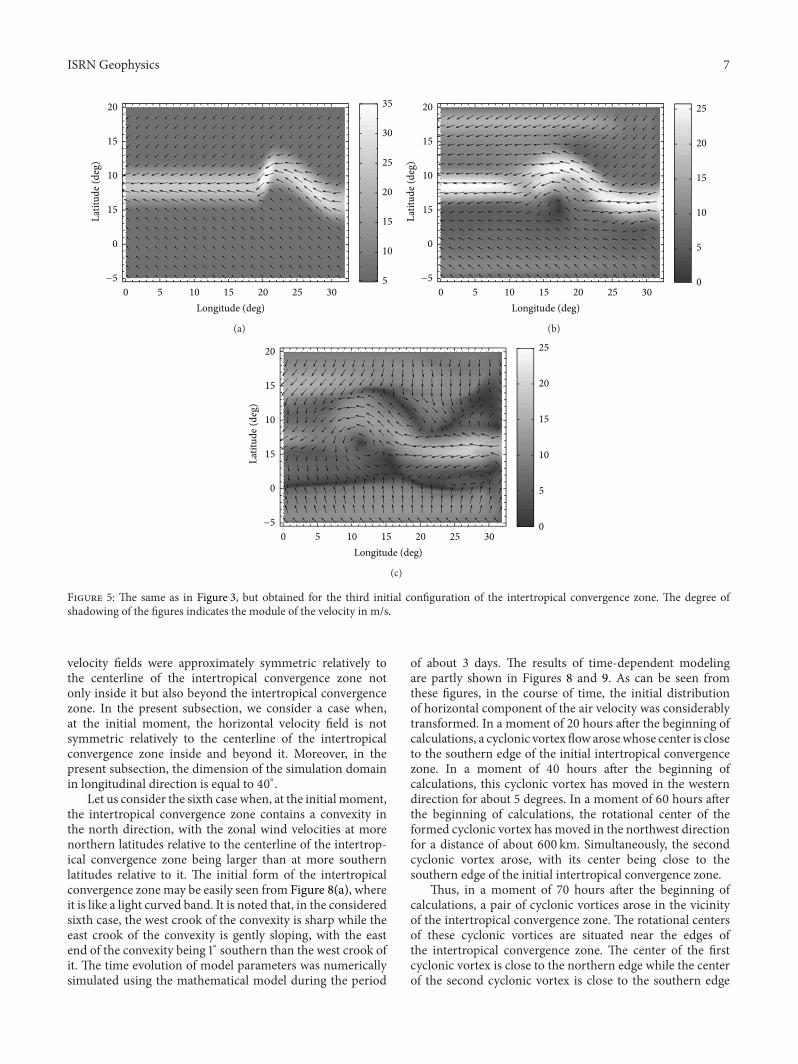
In addition, we made simulations for the second andthird cases when, at the initial moment, the intertropicalconvergence zone has different configurations. For bothcases, the initial forms of the intertropical convergence zonecontained the convexities analogous to the convexity of thefirst case. However, for the second case, the east end of theconvexity is situated at more northern latitudes than the westend of the convexity (see Figure 4(a)). On the contrary, forthe third case, the east end of the convexity is situated atmore southern latitudes than the west end of the convexity(see Figure 5(a)).The results of time-dependent modeling forthe second and third cases of the initial configurations of theintertropical convergence zone are partly shown in Figures4 and 5. As can be seen from these figures, in the courseof time, cyclonic vortex flows arose whose centers are closeto the southern edge of the initial intertropical convergencezone. These vortices are analogous to those obtained for thefirst case.
The simulation results indicate that physical reason of theformation of the calculated tropical cyclonic vortices is theorigin of a convexity in the configuration of the intertropicalconvergence zone. As a rule, such convexities are observedduring the periods of rebuilding of the global circulation ofthe atmosphere. The origin of a convexity of the intertropicalconvergence zone leads to the beginning of an instability ofstream air flow. As a consequence, a large-scale vortex flowarises in the lower atmosphere, with its center being closeto the southern edge of the initial intertropical convergencezone. When the mixture of air and water vapor moves to
ISRN Geophysics 5
20
15
10
15
0
−50 5 10 15 20 25 30
5
10
15
20
25
30
Longitude (deg)
Latit
ude (
deg)
(a)
20
15
10
15
0
−50 5 10 15 20 25 30
5
0
10
15
20
25
Longitude (deg)
Latit
ude (
deg)
(b)
20
15
10
15
0
−50 5 10 15 20 25 30
5
0
10
15
20
25
Longitude (deg)
Latit
ude (
deg)
(c)
Figure 3:The distributions of horizontal component of the air velocity at the altitude of 600m, assigned at the initial moment (a), computed12 hours after the beginning of calculations (b), and computed 27 hours after the beginning of calculations (c).The results are obtained for thefirst initial configuration of the intertropical convergence zone. The degree of shadowing of the figures indicates the module of the velocityin m/s.
higher altitudes, where temperature is lower, energy, emitteddue to phase transitions of water vapor to microdrops ofwater and ice particles, transforms into kinetic energy ofthe air flow, with the horizontal wind velocity increasing informed cyclonic vortex. It should be emphasized that theinitial degree of saturation of air by water vapor plays animportant role in the formation of the calculated tropicalcyclonic vortices.
3.2. The Formation of a Pair of Cyclonic-Anticyclonic Vortices.In the previous subsection, we have considered three casesof the initial configuration of the intertropical convergencezone containing the convexity in the north direction, withthe east end of the convexity located at different latitudes.The common feature of these initial configurations is thatthe west crook of the convexity is sharp while the east crookof the convexity is gently sloping. In the present subsection,we consider cases when both west and east crooks of the
convexity are sharp and located at the same latitudes at theinitial moment.
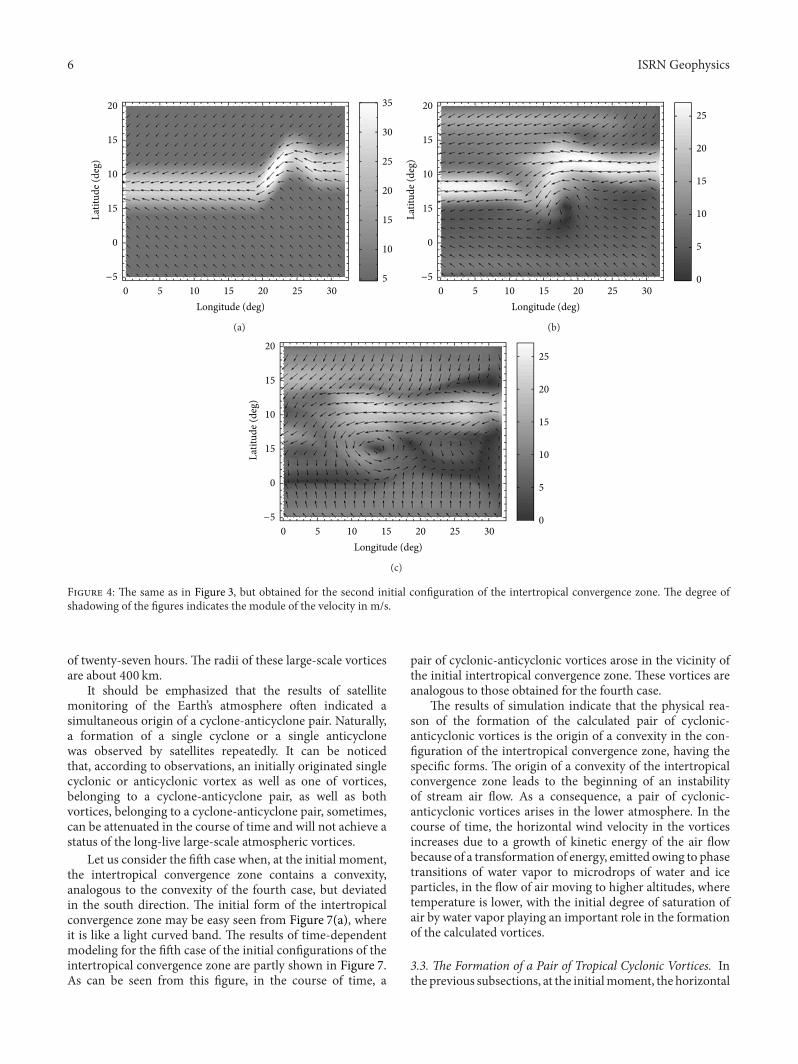
Initially, let us consider the fourth case when, at theinitial moment, the intertropical convergence zone containsa convexity in the north direction. The initial form of theintertropical convergence zone may be easily seen fromFigure 6(a), where it is like a light curved band. The timeevolution of model parameters was numerically simulatedusing themathematicalmodel during the period of about oneday.The results of time-dependentmodeling are partly shownin Figure 6. As can be seen from this figure, in the courseof time, the initial distribution of horizontal component ofthe air velocity was considerably transformed. A pair ofcyclonic-anticyclonic vortices arose in the vicinity of theinitial intertropical convergence zone. A cyclonic vortex arosewhose center is close to the southern edge of the initialintertropical convergence zone and an anticyclonic vortexarose whose center is close to the northern edge of the initialintertropical convergence zone. The horizontal wind velocityin these vortices achieved a value of 20m/s during the period
6 ISRN Geophysics
5
10
15
20
25
30
3520
15
10
15
0
−50 5 10 15 20 25 30
Longitude (deg)
Latit
ude (
deg)
(a)
20
15
10
15
0
−50 5 10 15 20 25 30
5
0
10
15
20
25
Longitude (deg)
Latit
ude (
deg)
(b)
20
15
10
15
0
−50 5 10 15 20 25 30
5
0
10
15
20
25
Longitude (deg)
Latit
ude (
deg)
(c)
Figure 4: The same as in Figure 3, but obtained for the second initial configuration of the intertropical convergence zone. The degree ofshadowing of the figures indicates the module of the velocity in m/s.
of twenty-seven hours. The radii of these large-scale vorticesare about 400 km.
It should be emphasized that the results of satellitemonitoring of the Earth’s atmosphere often indicated asimultaneous origin of a cyclone-anticyclone pair. Naturally,a formation of a single cyclone or a single anticyclonewas observed by satellites repeatedly. It can be noticedthat, according to observations, an initially originated singlecyclonic or anticyclonic vortex as well as one of vortices,belonging to a cyclone-anticyclone pair, as well as bothvortices, belonging to a cyclone-anticyclone pair, sometimes,can be attenuated in the course of time and will not achieve astatus of the long-live large-scale atmospheric vortices.
Let us consider the fifth case when, at the initial moment,the intertropical convergence zone contains a convexity,analogous to the convexity of the fourth case, but deviatedin the south direction. The initial form of the intertropicalconvergence zone may be easy seen from Figure 7(a), whereit is like a light curved band. The results of time-dependentmodeling for the fifth case of the initial configurations of theintertropical convergence zone are partly shown in Figure 7.As can be seen from this figure, in the course of time, a
pair of cyclonic-anticyclonic vortices arose in the vicinity ofthe initial intertropical convergence zone. These vortices areanalogous to those obtained for the fourth case.
The results of simulation indicate that the physical rea-son of the formation of the calculated pair of cyclonic-anticyclonic vortices is the origin of a convexity in the con-figuration of the intertropical convergence zone, having thespecific forms. The origin of a convexity of the intertropicalconvergence zone leads to the beginning of an instabilityof stream air flow. As a consequence, a pair of cyclonic-anticyclonic vortices arises in the lower atmosphere. In thecourse of time, the horizontal wind velocity in the vorticesincreases due to a growth of kinetic energy of the air flowbecause of a transformation of energy, emitted owing to phasetransitions of water vapor to microdrops of water and iceparticles, in the flow of air moving to higher altitudes, wheretemperature is lower, with the initial degree of saturation ofair by water vapor playing an important role in the formationof the calculated vortices.
3.3. The Formation of a Pair of Tropical Cyclonic Vortices. Inthe previous subsections, at the initialmoment, the horizontal
ISRN Geophysics 7
5
10
15
20
25
30
3520
15
10
15
0
−50 5 10 15 20 25 30
Longitude (deg)
Latit
ude (
deg)
(a)
20
15
10
15
0
−50 5 10 15 20 25 30
5
0
10
15
20
25
Longitude (deg)
Latit
ude (
deg)
(b)
20
15
10
15
0
−50 5 10 15 20 25 30
5
0
10
15
20
25
Longitude (deg)
Latit
ude (
deg)
(c)
Figure 5: The same as in Figure 3, but obtained for the third initial configuration of the intertropical convergence zone. The degree ofshadowing of the figures indicates the module of the velocity in m/s.
velocity fields were approximately symmetric relatively tothe centerline of the intertropical convergence zone notonly inside it but also beyond the intertropical convergencezone. In the present subsection, we consider a case when,at the initial moment, the horizontal velocity field is notsymmetric relatively to the centerline of the intertropicalconvergence zone inside and beyond it. Moreover, in thepresent subsection, the dimension of the simulation domainin longitudinal direction is equal to 40∘.
Let us consider the sixth case when, at the initial moment,the intertropical convergence zone contains a convexity inthe north direction, with the zonal wind velocities at morenorthern latitudes relative to the centerline of the intertrop-ical convergence zone being larger than at more southernlatitudes relative to it. The initial form of the intertropicalconvergence zone may be easily seen from Figure 8(a), whereit is like a light curved band. It is noted that, in the consideredsixth case, the west crook of the convexity is sharp while theeast crook of the convexity is gently sloping, with the eastend of the convexity being 1∘ southern than the west crook ofit. The time evolution of model parameters was numericallysimulated using the mathematical model during the period
of about 3 days. The results of time-dependent modelingare partly shown in Figures 8 and 9. As can be seen fromthese figures, in the course of time, the initial distributionof horizontal component of the air velocity was considerablytransformed. In a moment of 20 hours after the beginning ofcalculations, a cyclonic vortex flow arosewhose center is closeto the southern edge of the initial intertropical convergencezone. In a moment of 40 hours after the beginning ofcalculations, this cyclonic vortex has moved in the westerndirection for about 5 degrees. In a moment of 60 hours afterthe beginning of calculations, the rotational center of theformed cyclonic vortex has moved in the northwest directionfor a distance of about 600 km. Simultaneously, the secondcyclonic vortex arose, with its center being close to thesouthern edge of the initial intertropical convergence zone.
Thus, in a moment of 70 hours after the beginning ofcalculations, a pair of cyclonic vortices arose in the vicinityof the intertropical convergence zone. The rotational centersof these cyclonic vortices are situated near the edges ofthe intertropical convergence zone. The center of the firstcyclonic vortex is close to the northern edge while the centerof the second cyclonic vortex is close to the southern edge

8 ISRN Geophysics
0
5
10
15
20
25
30
40
3520
15
10
15
0
−50 5 10 15 20 25 30
Longitude (deg)
Latit
ude (
deg)
(a)
20
15
10
15
0
0 5 10 15 20 25 30Longitude (deg)
5
0
10
15
20
25
Latit
ude (
deg)
−5
(b)
5
0
10
15
20
2520
15
10
15
0
−50 5 10 15 20 25 30
Longitude (deg)
Latit
ude (
deg)
(c)
Figure 6:The distributions of horizontal component of the air velocity at the altitude of 600m, assigned at the initial moment (a), computed12 hours after the beginning of calculations (b), and computed 27 hours after the beginning of calculations (c).The results are obtained for thefourth initial configuration of the intertropical convergence zone.The degree of shadowing of the figures indicates the module of the velocityin m/s.
of the intertropical convergence zone. The horizontal windvelocity in these cyclonic vortices achieved values of 15–20m/s during the period of seventy hours. The radii of thesecyclonic vortices are about 600 km.
It can be noticed that the results of observation of theEarth’s atmosphere indicated a simultaneous origin of twintropical cyclones sometimes [25].
The results of simulation indicate that a key factor inthe modeled formation of twin tropical cyclonic vorticesis the origin of a convexity in the configuration of theintertropical convergence zone, having the specific form,which is accompanied by nonsymmetric horizontal velocityfield in the vicinity of this zone. The pointed out factorslead to the beginning of instability of stream air flow. As aconsequence, a pair of cyclonic vortices arise in the loweratmosphere in the course of time. A transformation of energy,emitted due to phase transitions of water vapor tomicrodropsof water and ice particles in themixture of air andwater vapormoving upward, into kinetic energy of the air flow plays animportant role in the increase of the horizontal wind velocityin the course of time, with the high initial degree of saturationof air by water vapor being an important factor.
4. Summary and Concluding Remarks
A number of earlier studies have shown that the intertropicalconvergence zone is sometimes observed to undulate andbreak down into a series of tropical disturbances [3, 26,27]. Some of these disturbances may develop into tropi-cal cyclones, while others dissipate, and the intertropicalconvergence zone may reform in the original region. Ithas been proposed that the intertropical convergence zonemay break down because of its heating-induced potentialvorticity anomalies. Moreover, it has been proposed thatthe intertropical convergence zone breakdown results froma convectively modified form of combined barotropic andbaroclinic instability of the mean flow [26]. Also, instabilityof the intertropical convergence zone has been studied in theworks of Wang and Magnusdottir [28] and Nolan et al. [29].The role of tropical waves in tropical cyclogenesis has beenstudied, too [30].
Nevertheless, in earlier studies, we have not found theidea that the transformation of the shape of the intertropicalconvergence zone can influence the process of the formationof tropical cyclones (with the exception of the studies bythe authors of the present work). Although, the position and

ISRN Geophysics 9
0
5
10
15
20
25
30
40
3520
15
10
15
0
−50 5 10 15 20 25 30
Longitude (deg)
Latit
ude (
deg)
(a)
20
15
10
15
0
−50 5 10 15 20 25 30
Longitude (deg)
5
10
15
20
25
30
Latit
ude (
deg)
(b)
20
15
10
15
0
−50 5 10 15 20 25 30
Longitude (deg)
0
5
10
15
20
25
Latit
ude (
deg)
(c)
Figure 7: The same as in Figure 6, but obtained for the fifth initial configuration of the intertropical convergence zone. The degree ofshadowing of the figures indicates the module of the velocity in m/s.
variability of the intertropical convergence zone have beenstudied in a number of earlier works [31–33]. It was found inthese studies that the northsouth position of the intertropicalconvergence zone responds to changes in interhemispherictemperature contrast. An asymmetry in air-sea interactionscan play an important role in forming the configurationof the intertropical convergence zone, too. In the presentstudy, the influence of the disturbance of the configurationof the intertropical convergence zone on the process of theformation of tropical large-scale cyclonic and anticyclonicvortices was investigated numerically.
To make this investigation, the limited-area nonhy-drostatic mathematical model of the wind system of thelower atmosphere, developed recently in the Polar Geo-physical Institute, was utilized. The model produces three-dimensional distributions of the atmospheric parameters inthe height range from land and ocean surface up to thealtitude of 15 km over a limited region of the Earth’s surface.The time evolution of model parameters was numericallysimulated using various variants of the initial and boundaryconditions which were defined as consistent with the situa-tion when the intertropical convergence zone intersects thesimulation domain in the westeast direction. Calculationswere made for various cases in which the initial forms of theintertropical convergence zone were different and contained
convexities with distinct shapes, which were consistent withthe results of satellite microwave monitoring of the Earth’satmosphere, included in the electron data base “GLOBAL-Field,” developed in the Space Research Institute of the RAS.
The results of modeling indicated that the origin of a con-vexity in the configuration of the intertropical convergencezone, having the latitudinal dimension of 800–1000 km andthe deviation of some hundreds of kilometers either in northor south direction, can lead to the formation of tropical large-scale vortices during the period of a few days. It was foundthat the initial shape of the convexity of the intertropicalconvergence zone plays a significant role in the process of theformation of tropical large-scale vortices.
Firstly, it was established the specific initial shapes ofthe intertropical convergence zone convexity, which bringforth a cyclonic vortex during the period of about one day.The common features of these initial shapes are that theconvexities deviate in the north direction and that the westcrook of the convexity is sharp while the east crook of theconvexity is gently sloping.The east end of the convexity maybe situated at more northern or at more southern latitudesthan the west end of the convexity as well as at the samelatitudes. The rotational center of the formed cyclonic vortexis close to the southern edge of the initial intertropicalconvergence zone.The cyclonic vortex has a horizontal extent

10 ISRN Geophysics
20
15
10
15
0
0 5 10 15 20 25 30
Latit
ude (
deg)
Longitude (deg)
5
10
15
20
25
30
−5
(a)
0
5
10
15
20
2520
15
10
15
0
0 5 10 15 20 25 30
Latit
ude (
deg)
Longitude (deg)
−5
(b)
0
5
10
15
20
2520
15
10
15
0
0 5 10 15 20 25 30
Latit
ude (
deg)
Longitude (deg)
−5
(c)
Figure 8:The distributions of horizontal component of the air velocity at the altitude of 600m, assigned at the initial moment (a), computed20 hours after the beginning of calculations (b), and computed 40 hours after the beginning of calculations (c).The results are obtained for thesixth initial configuration of the intertropical convergence zone. The degree of shadowing of the figures indicates the module of the velocityin m/s.
20
15
10
15
0
0 5 10 15 20 25 30Longitude (deg)
−5 0
5
10
15
20
Latit
ude (
deg)
(a)
20
15
10
15
0
0 5 10 15 20 25 30
Latit
ude (
deg)
Longitude (deg)
−5 0
5
10
15
20
(b)
Figure 9: The same as in Figure 8, but computed 60 hours after the beginning of calculations (a) and 70 hours after the beginning ofcalculations (b). The results are obtained for the sixth initial configuration of the intertropical convergence zone. The degree of shadowing ofthe figures indicates the module of the velocity in m/s.
of about 600 km.Thehorizontal wind velocity in this cyclonicvortex can achieve a value of 20m/s during the period of 27hours.
Secondly, it was found the specific initial shapes of theintertropical convergence zone convexity, which bring fortha pair of cyclonic-anticyclonic vortices during the period ofabout one day. The common feature of these initial shapesis that both west and east crooks of the convexity are sharp
at the initial moment. The convexity may be deviated eitherin the north direction or in the south direction, with thewest and east ends of the convexity being at the samelatitudes. The rotational center of the formed cyclonic vortexis close to the southern edge of the initial intertropicalconvergence zone while the rotational center of the formedanticyclonic vortex is close to the northern edge of the initialintertropical convergence zone to a moment of 27 hours after

ISRN Geophysics 11
the beginning of calculations. The radii of these large-scalevortices are about 400 km. The horizontal wind velocity inthese vortices can achieve a value of 20m/s during the periodof twenty-seven hours.
Thirdly, it was established the specific variant of theinitial and boundary conditions which, during the period ofabout three days, bringing forth a pair of tropical cyclonicvortices. It was supposed that, at the initial moment, theintertropical convergence zone contains the convexity inthe north direction; moreover, the zonal wind velocities atmore northern latitudes relative to the centerline of theintertropical convergence zone are larger than those at moresouthern latitudes relative to it, with the west crook of theconvexity being sharp while the east crook of the convexitybeing gently sloping. The cyclonic vortices were formed oneafter another in the course of time. The rotational center ofthe first cyclonic vortex is close to the northern edgewhile thecenter of the second cyclonic vortex is close to the southernedge of the initial intertropical convergence zone in amomentof 70 hours after the beginning of calculations. The radii ofthese cyclonic vortices are about 600 km.Thehorizontal windvelocity in the cyclonic vortices achieved values of 15–20m/sduring the period of about three days.
It should be emphasized that, according to observations,not each cyclonic or anticyclonic vortex, arisen in the loweratmosphere, has the potential to grow up to the long-livelarge-scale atmospheric vortex. It is known that, sometimes,a vortex, initially arisen in the lower atmosphere, can beattenuated in the course of time and will not achieve astatus of the long-live large-scale atmospheric vortex. Thispeculiarity may take place for the large-scale vortices arisenin the calculations of the present study, which were limited bythe time intervals not longer than three days. Unfortunately,more prolonged time intervals are impossible for the utilizedmathematical model because of limited sizes of its simulationdomain and owing to tendency of the modeled vortices tomove and to abandon the simulation domain in the courseof time.
The simulation results show that a key factor in themodeled formation of tropical large-scale vortices is theorigin of a convexity in the configuration of the intertropicalconvergence zone. As a consequence, instability of streamair flow arises, presenting in the intertropical convergencezone. This instability leads to considerable transformationof the wind field. As a result, tropical large-scale vorticesmay be formed in the vicinity of the initial position of theintertropical convergence zone in the course of time. Inaddition to that, the initial intertropical convergence zoneis broken down. Energy, emitted due to phase transitions ofwater vapor to microdrops of water and ice particles in themixture of air and water vapor, moving to higher altitudes,where temperature is lower, transforms into kinetic energy ofthe air flow, with the horizontal wind velocity increasing inthe formed vortices.
It may be expected that the simulation results of thepresent study will be useful for tropical cyclone forecast-ing. The origin of a convexity in the configuration of theintertropical convergence zone, which may be observed withthe help of satellite microwave monitoring of the Earth’s
atmosphere, is a precursor of the formation of a tropical large-scale vortex. This vortex either will grow up to the long-live large-scale atmospheric vortex, having the potential totransform to a tropical storm, or can be attenuated and vanishin the course of time. As a rule, intertropical convergencezone convexities originate during the periods of rebuildingof the global circulation of the atmosphere, in particular,from July to September over the Atlantic Ocean and Africa.Further transformation of the originated convexity of theintertropical convergence zone depends on its initial shapeand on environmental conditions, in particular, on the degreeof saturation of air by water vapor.
Acknowledgment
This work was partly supported by Grant no. 13-01-00063from the Russian Foundation for Basic Research.
References
[1] K. A. Emanuel, “An air-sea interaction theory for tropicalcyclones. Part I: steady-state maintenance,” Journal of theAtmospheric Sciences, vol. 43, no. 6, pp. 585–605, 1986.
[2] M. T. Montgomery and B. F. Farrell, “Tropical cyclone forma-tion,” Journal of the Atmospheric Sciences, vol. 50, no. 2, pp. 285–310, 1993.
[3] C. Q. Kieu and D. L. Zhang, “Genesis of tropical storm eugene(2005) frommerging vortices associatedwith ITCZ breakdown.Part I: observational and modeling analyses,” Journal of theAtmospheric Sciences, vol. 65, no. 11, pp. 3419–3439, 2008.
[4] J. Mao and G. Wu, “Barotropic process contributing to theformation and growth of tropical cyclone Nargis,” Advances inAtmospheric Sciences, vol. 28, no. 3, pp. 483–491, 2011.
[5] K. Ooyama, “Numerical simulation of the life cycle of tropicalcyclones,” Journal of the Atmospheric Sciences, vol. 26, no. 1, pp.3–40, 1969.
[6] M. T. Montgomery and J. Enagonio, “Tropical cyclogenesis viaconvectively forced vortex Rossby waves in a three-dimensionalquasigeostrophic model,” Journal of the Atmospheric Sciences,vol. 55, no. 20, pp. 3176–3207, 1998.
[7] T. Li, X. Ge, B. Wang, and Y. Zhu, “Tropical cyclogenesisassociated with Rossby wave energy dispersion of a preexistingtyphoon. Part II: numerical simulations,” Journal of the Atmo-spheric Sciences, vol. 63, no. 5, pp. 1390–1409, 2006.
[8] T. N. Venkatesh and J. Mathew, “A numerical study of the roleof the vertical structure of vorticity during tropical cyclonegenesis,” Fluid Dynamics Research, vol. 42, no. 4, Article ID045506, 2010.
[9] M. T. Montgomery, Z. Wang, and T. J. Dunkerton, “Coarse,intermediate and high resolution numerical simulations of thetransition of a tropical wave critical layer to a tropical storm,”Atmospheric Chemistry and Physics, vol. 10, no. 22, pp. 10803–10827, 2010.
[10] Y. Xu, “The genesis of tropical cyclone Bilis (2000) associatedwith cross-equatorial surges,”Advances in Atmospheric Sciences,vol. 28, no. 3, pp. 665–681, 2011.
[11] S. F. Abarca andK. L. Corbosiero, “Secondary eyewall formationin WRF simulations of Hurricanes Rita and Katrina (2005),”Geophysical Research Letters, vol. 38, no. 7, Article ID L07802,2011.

12 ISRN Geophysics
[12] K. A. Reed and C. Jablonowski, “Impact of physical param-eterizations on idealized tropical cyclones in the CommunityAtmosphereModel,”Geophysical Research Letters, vol. 38, no. 4,Article ID L04805, 2011.
[13] I. V.Mingalev andV. S.Mingalev, “The global circulationmodelof the lower and middle atmosphere of the Earth with a giventemperature distribution,” Mathematical Modeling, vol. 17, pp.24–40, 2005 (Russian).
[14] I. V. Mingalev, V. S. Mingalev, and G. I. Mingaleva, “Numericalsimulation of the global distributions of the horizontal andvertical wind in themiddle atmosphere using a givenneutral gastemperature field,” Journal of Atmospheric and Solar-TerrestrialPhysics, vol. 69, no. 4-5, pp. 552–568, 2007.
[15] I. V. Mingalev, O. V. Mingalev, and V. S. Mingalev, “Modelsimulation of the global circulation in the middle atmospherefor January conditions,” Advances in Geosciences, vol. 15, pp. 11–16, 2008.
[16] I. V. Mingalev, V. S. Mingalev, and G. I. Mingaleva, “Numericalsimulation of the global neutral wind system of the Earth’smiddle atmosphere for different seasons,”Atmosphere, vol. 3, no.1, pp. 213–228, 2012.
[17] I. V. Mingalev and V. S. Mingalev, “Numerical modeling of theinfluence of solar activity on the global circulation in the Earth’smesosphere and lower thermosphere,” International Journal ofGeophysics, vol. 2012, Article ID 106035, 15 pages, 2012.
[18] O. M. Belotserkovskii, I. V. Mingalev, V. S. Mingalev, O. V.Mingalev, and A. M. Oparin, “Mechanism of the appearance ofa large-scale vortex in the troposphere above a nonuniformlyheated surface,”Doklady Earth Sciences, vol. 411, no. 8, pp. 1284–1288, 2006.
[19] O. M. Belotserkovskii, I. V. Mingalev, V. S. Mingalev, O. V.Mingalev, A. M. Oparin, and V. M. Chechetkin, “Formation oflarge-scale vortices in shear flows of the lower atmosphere of theEarth in the region of tropical latitudes,” Cosmic Research, vol.47, no. 6, pp. 466–479, 2009.
[20] I. V. Mingalev, N. M. Astafieva, K. G. Orlov, V. S. Mingalev, andO. V. Mingalev, “Time-dependent modeling of the initial stageof the formation of cyclones in the intertropical convergencezone of the northern hemisphere,” in Proceedings of the 33rdAnnual Seminar on Physics of Auroral Phenomena, pp. 182–185,Polar Geophysical Institute, Apatity, Russia, 2011.
[21] I. V. Mingalev, N. M. Astafieva, K. G. Orlov, V. S. Mingalev,and O. V. Mingalev, “Simulation study of the initial stage ofthe origin of cyclonic and anticyclonic pairs in the intertropicalconvergence zone,” inProceedings of the 34thAnnual Seminar onPhysics of Auroral Phenomena, pp. 189–192, Polar GeophysicalInstitute, Apatity, Russia, 2011.
[22] I. V. Mingalev, N. M. Astafieva, K. G. Orlov, V. S. Mingalev, O.V. Mingalev, and V. M. Chechetkin, “Possibility of a detectionof tropical cyclones and hurricanes formation according tosatellite remote sensing,” in Actual Problems in Remote Sensingof the Earth from Space, vol. 8, no. 2, pp. 290–296, SpaceResearch Institute, Moscow, Russia, 2011, in Russian.
[23] I. V. Mingalev, N. M. Astafieva, K. G. Orlov, V. M. Chechetkin,V. S. Mingalev, and O. V. Mingalev, “Numerical simulation offormation of cyclone vortex flows in the intertropical zone ofconvergence and their early detection,”Cosmic Research, vol. 50,no. 3, pp. 233–248, 2012.
[24] V. S.Mingalev, I. V.Mingalev, O. V.Mingalev, A.M.Oparin, andK. G. Orlov, “Generalization of the hybrid monotone second-order finite difference scheme for gas dynamics equations to the
case of unstructured 3D grid,” Computational Mathematics andMathematical Physics, vol. 50, no. 5, pp. 877–889, 2010.
[25] T.-C. Chen, J.-D. Tsay, M.-C. Yen, and E. O. Cayanan, “Forma-tion of the Philippine twin tropical cyclones during the 2008summer monsoon onset,” Weather and Forecasting, vol. 25, no.5, pp. 1317–1341, 2010.
[26] R. N. Ferreira andW. H. Schubert, “Barotropic aspects of ITCZbreakdown,” Journal of the Atmospheric Sciences, vol. 54, no. 2,pp. 261–285, 1997.
[27] C.-C. Wang and G. Magnusdottir, “ITCZ breakdown in three-dimensional flows,” Journal of the Atmospheric Sciences, vol. 62,no. 5, pp. 1497–1512, 2005.
[28] C.-C. Wang and G. Magnusdottir, “The ITCZ in the Centraland Eastern Pacific on synoptic time scales,” Monthly WeatherReview, vol. 134, no. 5, pp. 1405–1421, 2006.
[29] D. S. Nolan, S. W. Powell, C. Zhang, and B. E. Mapes, “Idealizedsimulations of the intertropical convergence zone and its mul-tilevel flows,” Journal of the Atmospheric Sciences, vol. 67, no. 12,pp. 4028–4053, 2010.
[30] W. M. Frank and P. E. Roundy, “The role of tropical waves intropical cyclogenesis,” Monthly Weather Review, vol. 134, no. 9,pp. 2397–2417, 2006.
[31] A. J. Broccoli, K. A. Dahl, and R. J. Stouffer, “Response of theITCZ to Northern Hemisphere cooling,” Geophysical ResearchLetters, vol. 33, no. 1, Article ID L01702, 2006.
[32] A. Fedorov, M. Barreiro, G. Boccaletti, R. Pacanowski, and S. G.Philander, “The freshening of surface waters in high latitudes:effects on the thermohaline and wind-driven circulations,”Journal of Physical Oceanography, vol. 37, no. 4, pp. 896–907,2007.
[33] J. C. H. Chiang and A. R. Friedman, “Extratropical cool-ing, interhemispheric thermal gradients, and tropical climatechange,”Annual Review of Earth and Planetary Sciences, vol. 40,no. 1, pp. 383–412, 2012.

Submit your manuscripts athttp://www.hindawi.com
Hindawi Publishing Corporationhttp://www.hindawi.com Volume 2014
ClimatologyJournal of
EcologyInternational Journal of
Hindawi Publishing Corporationhttp://www.hindawi.com Volume 2014
EarthquakesJournal of
Hindawi Publishing Corporationhttp://www.hindawi.com Volume 2014
Hindawi Publishing Corporationhttp://www.hindawi.com
Applied &EnvironmentalSoil Science
Volume 2014
Mining
Hindawi Publishing Corporationhttp://www.hindawi.com Volume 2014
Journal of
Hindawi Publishing Corporation http://www.hindawi.com Volume 2014
International Journal of
Geophysics
OceanographyInternational Journal of
Hindawi Publishing Corporationhttp://www.hindawi.com Volume 2014
Journal of Computational Environmental SciencesHindawi Publishing Corporationhttp://www.hindawi.com Volume 2014
Journal ofPetroleum Engineering
Hindawi Publishing Corporationhttp://www.hindawi.com Volume 2014
GeochemistryHindawi Publishing Corporationhttp://www.hindawi.com Volume 2014
Journal of
Atmospheric SciencesInternational Journal of
Hindawi Publishing Corporationhttp://www.hindawi.com Volume 2014
OceanographyHindawi Publishing Corporationhttp://www.hindawi.com Volume 2014
Advances in
Hindawi Publishing Corporationhttp://www.hindawi.com Volume 2014
MineralogyInternational Journal of
Hindawi Publishing Corporationhttp://www.hindawi.com Volume 2014
MeteorologyAdvances in
The Scientific World JournalHindawi Publishing Corporation http://www.hindawi.com Volume 2014
Paleontology JournalHindawi Publishing Corporationhttp://www.hindawi.com Volume 2014
ScientificaHindawi Publishing Corporationhttp://www.hindawi.com Volume 2014
Hindawi Publishing Corporationhttp://www.hindawi.com Volume 2014
Geological ResearchJournal of
Hindawi Publishing Corporationhttp://www.hindawi.com Volume 2014
Geology Advances in
Related Documents