Research Article A Modified o-Phthalaldehyde Fluorometric Analytical Method for Ultratrace Ammonium in Natural Waters Using EDTA-NaOH as Buffer Hongzhi Hu, 1,2 Ying Liang, 1 Shuo Li, 1 Qing Guo, 1 and Chancui Wu 1 1 School of Life and Environmental Sciences, Guilin University of Electronic Technology, Guilin 541004, China 2 School of Automation Engineering, University of Electronic Science and Technology of China, Chengdu 611731, China Correspondence should be addressed to Ying Liang; [email protected] and Qing Guo; [email protected] Received 25 August 2014; Revised 16 October 2014; Accepted 16 October 2014; Published 11 November 2014 Academic Editor: Jesus Simal-Gandara Copyright © 2014 Hongzhi Hu et al. is is an open access article distributed under the Creative Commons Attribution License, which permits unrestricted use, distribution, and reproduction in any medium, provided the original work is properly cited. In the existence of appropriate amount of disodium ethylenediaminetetraacetate (EDTA), precipitation would not occur in seawater and other natural waters even if the sample solution was adjusted to strong basicity, and the NH 3 -OPA-sulfite reaction at the optimal pH range could be used to determine ammonium in natural waters. Based on this, a modified o-phthalaldehyde fluorometric analytical method has been established to determine ultratrace ammonium in natural waters. Experimental parameters, including reagent concentration, pH, reaction time, and effect of EDTA, were optimized throughout the experiments based on univariate experimental design. e results showed that the optimal pH range was between 10.80 and 11.70. EDTA did not obviously affect the fluorometric intensity. e linearity range of the proposed method was 0.032–0.500 mol/L, 0.250–3.00 mol/L, and 1.00– 20.0 mol/L at the excitation/emission slit of 3 nm/5 nm, 3 nm/3 nm, and 1.5 nm/1.5 nm, respectively. e method detection limit was 0.0099 mol/L. Compared to the classical OPA method, the proposed method had the advantage of being more sensitive and could quantify ultratrace ammonium without enrichment. 1. Introduction Ammonia nitrogen consists of ammonia (NH 3 ) and ammo- nium (NH 4 + ) in natural waters. Ammonium is predominant when the pH is below 8.75, and ammonia is predominant when pH is above 9.75 [1]. Ammonium is the main species in the pH range of most natural waters and is an essential nutrient in aquatic ecosystems [2]. e concentration of ammonium is usually more than micromolar level in mostly continental water and coastal seawater, even up to millimolar level due to environmental pollution [3]. However, it is less than micromolar level, even down to nanomolar level in ocean water [4]. e accurate measurement of ammonium concentrations is fundamental to understanding nitrogen biogeochemistry in aquatic ecosystems. e most common techniques used to measure ammonium in freshwater and seawater are the indophenol blue method [5, 6] and o- phthalaldehyde (OPA) fluorometric method [7–15]. e o- phthalaldehyde (OPA) fluorometric method is much more sensitive than the indophenol blue method. It has attracted a great deal of attention of scientists. In 1971, it was firstly reported that OPA could react with amino acid and ammo- nium in the existence of mercaptoethanol to produce a strongly fluorescent compound [7]. In 1989, the reaction was modified by replacing mercaptoethanol with sulfite, organic amine compounds did not interfere in the determination, and an OPA fluorometric method with higher sensitivity and selectivity was developed for ammonium by Genfa and Dasgupta [8]. Aſterwards, the method was further modified for the determination of ammonium in seawater [9–11] and was developed for shipboard using flow injection technology [12–14]. Recently, the sensitivity of the OPA method was further remarkably improved to determine ocean surface water by combining fluorescence detection with flow analysis and solid phase extraction [15]. e main analytical param- eters of the OPA methods mentioned above were listed in Table 1. e lower limit of quantitation (LOQ) listed in the table was the lowest concentration of the working range Hindawi Publishing Corporation Journal of Analytical Methods in Chemistry Volume 2014, Article ID 728068, 7 pages http://dx.doi.org/10.1155/2014/728068

Welcome message from author
This document is posted to help you gain knowledge. Please leave a comment to let me know what you think about it! Share it to your friends and learn new things together.
Transcript

Research ArticleA Modified o-Phthalaldehyde Fluorometric AnalyticalMethod for Ultratrace Ammonium in Natural Waters UsingEDTA-NaOH as Buffer
Hongzhi Hu,1,2 Ying Liang,1 Shuo Li,1 Qing Guo,1 and Chancui Wu1
1 School of Life and Environmental Sciences, Guilin University of Electronic Technology, Guilin 541004, China2 School of Automation Engineering, University of Electronic Science and Technology of China, Chengdu 611731, China
Correspondence should be addressed to Ying Liang; [email protected] and Qing Guo; [email protected]
Received 25 August 2014; Revised 16 October 2014; Accepted 16 October 2014; Published 11 November 2014
Academic Editor: Jesus Simal-Gandara
Copyright © 2014 Hongzhi Hu et al. This is an open access article distributed under the Creative Commons Attribution License,which permits unrestricted use, distribution, and reproduction in any medium, provided the original work is properly cited.
In the existence of appropriate amount of disodium ethylenediaminetetraacetate (EDTA), precipitationwould not occur in seawaterand other natural waters even if the sample solutionwas adjusted to strong basicity, and theNH
3-OPA-sulfite reaction at the optimal
pH range could be used to determine ammonium in natural waters. Based on this, a modified o-phthalaldehyde fluorometricanalytical method has been established to determine ultratrace ammonium in natural waters. Experimental parameters, includingreagent concentration, pH, reaction time, and effect of EDTA, were optimized throughout the experiments based on univariateexperimental design. The results showed that the optimal pH range was between 10.80 and 11.70. EDTA did not obviously affectthe fluorometric intensity. The linearity range of the proposed method was 0.032–0.500 𝜇mol/L, 0.250–3.00 𝜇mol/L, and 1.00–20.0 𝜇mol/L at the excitation/emission slit of 3 nm/5 nm, 3 nm/3 nm, and 1.5 nm/1.5 nm, respectively. The method detection limitwas 0.0099 𝜇mol/L. Compared to the classical OPA method, the proposed method had the advantage of being more sensitive andcould quantify ultratrace ammonium without enrichment.
1. Introduction
Ammonia nitrogen consists of ammonia (NH3) and ammo-
nium (NH4
+) in natural waters. Ammonium is predominantwhen the pH is below 8.75, and ammonia is predominantwhen pH is above 9.75 [1]. Ammonium is the main speciesin the pH range of most natural waters and is an essentialnutrient in aquatic ecosystems [2]. The concentration ofammonium is usually more than micromolar level in mostlycontinental water and coastal seawater, even up to millimolarlevel due to environmental pollution [3]. However, it is lessthan micromolar level, even down to nanomolar level inocean water [4]. The accurate measurement of ammoniumconcentrations is fundamental to understanding nitrogenbiogeochemistry in aquatic ecosystems. The most commontechniques used to measure ammonium in freshwater andseawater are the indophenol blue method [5, 6] and o-phthalaldehyde (OPA) fluorometric method [7–15]. The o-phthalaldehyde (OPA) fluorometric method is much more
sensitive than the indophenol blue method. It has attracteda great deal of attention of scientists. In 1971, it was firstlyreported that OPA could react with amino acid and ammo-nium in the existence of mercaptoethanol to produce astrongly fluorescent compound [7]. In 1989, the reaction wasmodified by replacing mercaptoethanol with sulfite, organicamine compounds did not interfere in the determination,and an OPA fluorometric method with higher sensitivityand selectivity was developed for ammonium by Genfa andDasgupta [8]. Afterwards, the method was further modifiedfor the determination of ammonium in seawater [9–11] andwas developed for shipboard using flow injection technology[12–14]. Recently, the sensitivity of the OPA method wasfurther remarkably improved to determine ocean surfacewater by combining fluorescence detection with flow analysisand solid phase extraction [15]. The main analytical param-eters of the OPA methods mentioned above were listed inTable 1. The lower limit of quantitation (LOQ) listed in thetable was the lowest concentration of the working range
Hindawi Publishing CorporationJournal of Analytical Methods in ChemistryVolume 2014, Article ID 728068, 7 pageshttp://dx.doi.org/10.1155/2014/728068
2 Journal of Analytical Methods in Chemistry
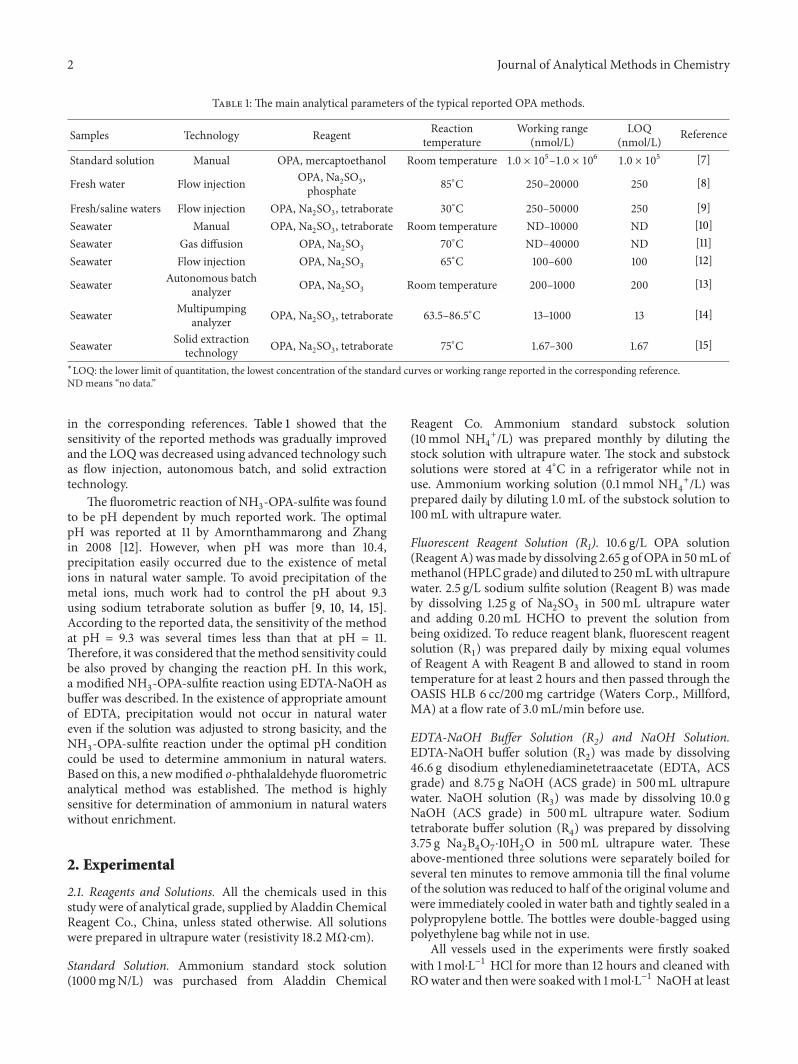
Table 1: The main analytical parameters of the typical reported OPA methods.
Samples Technology Reagent Reactiontemperature
Working range(nmol/L)
LOQ(nmol/L) Reference
Standard solution Manual OPA, mercaptoethanol Room temperature 1.0 × 10⁵–1.0 × 10⁶ 1.0 × 10⁵ [7]
Fresh water Flow injection OPA, Na2SO3,phosphate 85∘C 250–20000 250 [8]
Fresh/saline waters Flow injection OPA, Na2SO3, tetraborate 30∘C 250–50000 250 [9]Seawater Manual OPA, Na2SO3, tetraborate Room temperature ND–10000 ND [10]Seawater Gas diffusion OPA, Na2SO3 70∘C ND–40000 ND [11]Seawater Flow injection OPA, Na2SO3 65∘C 100–600 100 [12]
Seawater Autonomous batchanalyzer OPA, Na2SO3 Room temperature 200–1000 200 [13]
Seawater Multipumpinganalyzer OPA, Na2SO3, tetraborate 63.5–86.5∘C 13–1000 13 [14]
Seawater Solid extractiontechnology OPA, Na2SO3, tetraborate 75∘C 1.67–300 1.67 [15]
∗LOQ: the lower limit of quantitation, the lowest concentration of the standard curves or working range reported in the corresponding reference.ND means “no data.”
in the corresponding references. Table 1 showed that thesensitivity of the reported methods was gradually improvedand the LOQwas decreased using advanced technology suchas flow injection, autonomous batch, and solid extractiontechnology.
The fluorometric reaction of NH3-OPA-sulfite was found
to be pH dependent by much reported work. The optimalpH was reported at 11 by Amornthammarong and Zhangin 2008 [12]. However, when pH was more than 10.4,precipitation easily occurred due to the existence of metalions in natural water sample. To avoid precipitation of themetal ions, much work had to control the pH about 9.3using sodium tetraborate solution as buffer [9, 10, 14, 15].According to the reported data, the sensitivity of the methodat pH = 9.3 was several times less than that at pH = 11.Therefore, it was considered that themethod sensitivity couldbe also proved by changing the reaction pH. In this work,a modified NH
3-OPA-sulfite reaction using EDTA-NaOH as
buffer was described. In the existence of appropriate amountof EDTA, precipitation would not occur in natural watereven if the solution was adjusted to strong basicity, and theNH3-OPA-sulfite reaction under the optimal pH condition
could be used to determine ammonium in natural waters.Based on this, a newmodified o-phthalaldehyde fluorometricanalytical method was established. The method is highlysensitive for determination of ammonium in natural waterswithout enrichment.
2. Experimental
2.1. Reagents and Solutions. All the chemicals used in thisstudy were of analytical grade, supplied by Aladdin ChemicalReagent Co., China, unless stated otherwise. All solutionswere prepared in ultrapure water (resistivity 18.2 MΩ⋅cm).
Standard Solution. Ammonium standard stock solution(1000mgN/L) was purchased from Aladdin Chemical
Reagent Co. Ammonium standard substock solution(10mmol NH
4
+/L) was prepared monthly by diluting thestock solution with ultrapure water. The stock and substocksolutions were stored at 4∘C in a refrigerator while not inuse. Ammonium working solution (0.1mmol NH
4
+/L) wasprepared daily by diluting 1.0mL of the substock solution to100mL with ultrapure water.
Fluorescent Reagent Solution (R1). 10.6 g/L OPA solution(ReagentA)wasmade by dissolving 2.65 g ofOPA in 50mLofmethanol (HPLCgrade) and diluted to 250mLwith ultrapurewater. 2.5 g/L sodium sulfite solution (Reagent B) was madeby dissolving 1.25 g of Na
2SO3in 500mL ultrapure water
and adding 0.20mL HCHO to prevent the solution frombeing oxidized. To reduce reagent blank, fluorescent reagentsolution (R
1) was prepared daily by mixing equal volumes
of Reagent A with Reagent B and allowed to stand in roomtemperature for at least 2 hours and then passed through theOASIS HLB 6 cc/200mg cartridge (Waters Corp., Millford,MA) at a flow rate of 3.0mL/min before use.
EDTA-NaOH Buffer Solution (R2) and NaOH Solution.EDTA-NaOH buffer solution (R
2) was made by dissolving
46.6 g disodium ethylenediaminetetraacetate (EDTA, ACSgrade) and 8.75 g NaOH (ACS grade) in 500mL ultrapurewater. NaOH solution (R
3) was made by dissolving 10.0 g
NaOH (ACS grade) in 500mL ultrapure water. Sodiumtetraborate buffer solution (R
4) was prepared by dissolving
3.75 g Na2B4O7⋅10H2O in 500mL ultrapure water. These
above-mentioned three solutions were separately boiled forseveral ten minutes to remove ammonia till the final volumeof the solution was reduced to half of the original volume andwere immediately cooled in water bath and tightly sealed in apolypropylene bottle. The bottles were double-bagged usingpolyethylene bag while not in use.
All vessels used in the experiments were firstly soakedwith 1mol⋅L−1 HCl for more than 12 hours and cleaned withROwater and then were soaked with 1mol⋅L−1 NaOH at least
Journal of Analytical Methods in Chemistry 3
for 12 hours and cleaned thoroughly with ultrapure waterbefore use.
2.2. Analytical Procedures
2.2.1. The Proposed Method. 20mL of standard ammoniumsolution or sample solution with a concentration range of0.032–15.0 𝜇mol/L was exactly measured into a polypropy-lene bottle. Appropriate amounts of fluorescent reagent (R
1)
and buffer (R2) were added into the solution. The concentra-
tions of OPA, sodium sulfite, and EDTA in the final solutionwere 0.691 g/L, 0.163 g/L, and 5.77mmol/L, respectively. ThepH of the final solution was controlled in the range of 11.0–11.4 by adding appropriate amounts of NaOH solution (R
3).
After all the reagents were added, the mixed solution wastightly sealed and allowed to react for 50 minutes at roomtemperature. At least ten samples could be determined at thesame time. The fluorescence intensity (FI) was measured ona fluorescence spectrophotometer (RF-5301PC, SHIMADZUCo., Ltd., Japan) with excitation wavelength set at 361 nm andemission wavelength at 423 nm.
2.2.2. The Classical OPA Method. Based on the method of[10, 15], 20mL of standard ammonium solution or samplesolution with a concentration range of 0.250–2.00 𝜇mol/Lwas exactly measured into a polypropylene bottle. Both 3mLof fluorescent reagent (R
1) and 5mL of sodium tetraborate
buffer (R4) were added to the solution. After all the reagents
were added, themixed solutionwas tightly sealed and allowedto react for 60 minutes at room temperature. The pH ofthe reaction solution is about 9.3. The fluorescence intensity(FI) was measured in the same instrument as the proposedmethod.
3. Results and Discussion
3.1. Parameters Optimization. TheOPA-NH3-sulfite reaction
may be affected by the parameters OPA and sodium sulfiteconcentrations, reaction time, and pH.These parameters hadbeen optimized by much work [7–10]. However, the reactionsystem in this work was different from previous works due toadding EDTA-NaOH buffer solution, so they were optimizedbased on a univariate experimental design again.
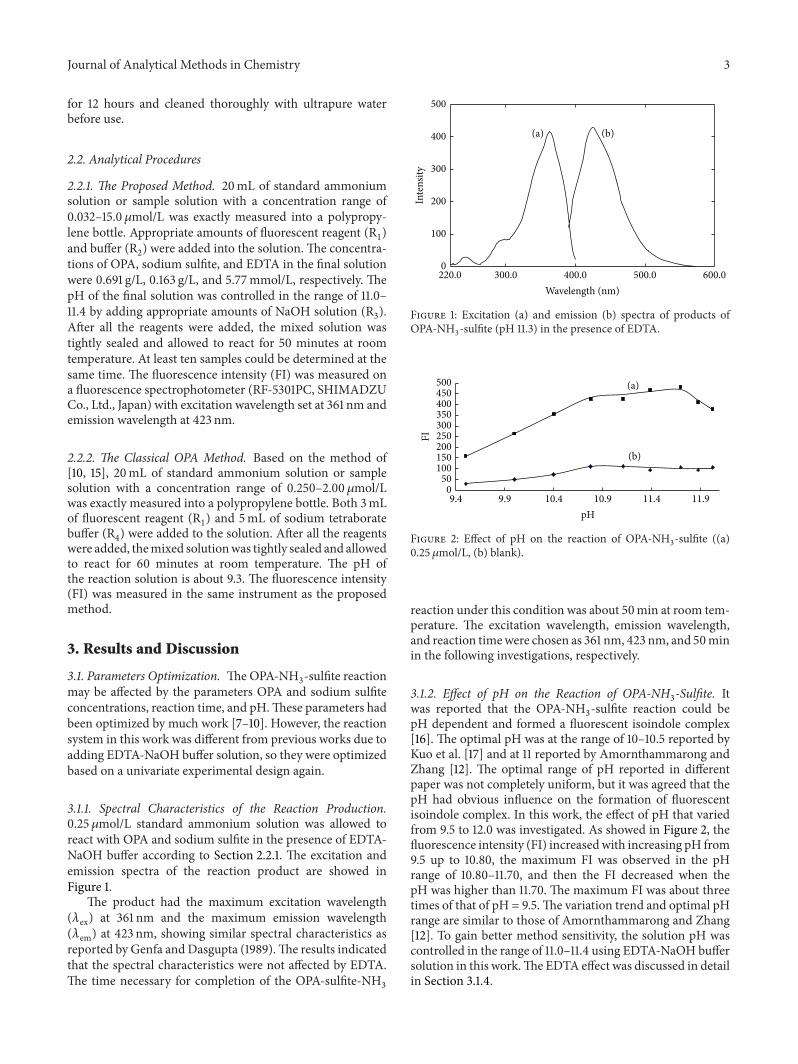
3.1.1. Spectral Characteristics of the Reaction Production.0.25 𝜇mol/L standard ammonium solution was allowed toreact with OPA and sodium sulfite in the presence of EDTA-NaOH buffer according to Section 2.2.1. The excitation andemission spectra of the reaction product are showed inFigure 1.
The product had the maximum excitation wavelength(𝜆ex) at 361 nm and the maximum emission wavelength(𝜆em) at 423 nm, showing similar spectral characteristics asreported by Genfa andDasgupta (1989).The results indicatedthat the spectral characteristics were not affected by EDTA.The time necessary for completion of the OPA-sulfite-NH
3
(a) (b)
200
300
400
500
100
0
Inte
nsity
220.0 300.0 400.0 500.0 600.0
Wavelength (nm)
Figure 1: Excitation (a) and emission (b) spectra of products ofOPA-NH
3-sulfite (pH 11.3) in the presence of EDTA.
050
100150200250300350400450500
9.4 9.9 10.4 10.9 11.4 11.9
FI
pH
(a)
(b)
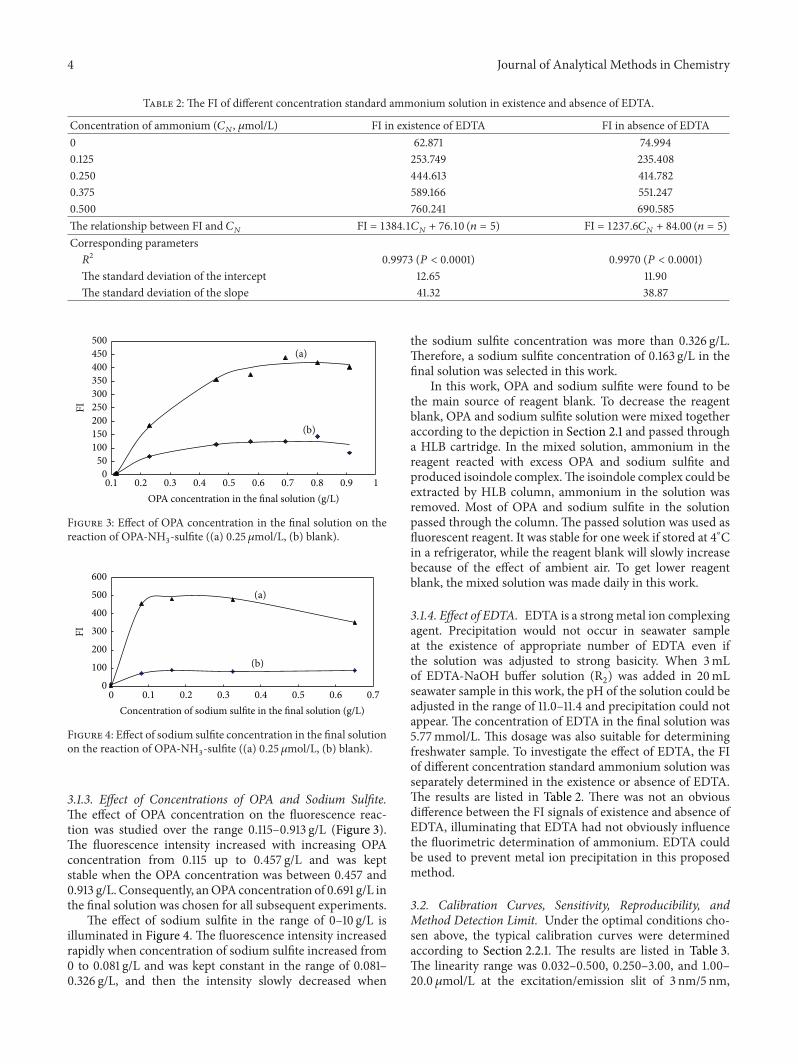
Figure 2: Effect of pH on the reaction of OPA-NH3-sulfite ((a)
0.25 𝜇mol/L, (b) blank).
reaction under this condition was about 50min at room tem-perature. The excitation wavelength, emission wavelength,and reaction timewere chosen as 361 nm, 423 nm, and 50minin the following investigations, respectively.
3.1.2. Effect of pH on the Reaction of OPA-NH3-Sulfite. It
was reported that the OPA-NH3-sulfite reaction could be
pH dependent and formed a fluorescent isoindole complex[16]. The optimal pH was at the range of 10–10.5 reported byKuo et al. [17] and at 11 reported by Amornthammarong andZhang [12]. The optimal range of pH reported in differentpaper was not completely uniform, but it was agreed that thepH had obvious influence on the formation of fluorescentisoindole complex. In this work, the effect of pH that variedfrom 9.5 to 12.0 was investigated. As showed in Figure 2, thefluorescence intensity (FI) increasedwith increasing pH from9.5 up to 10.80, the maximum FI was observed in the pHrange of 10.80–11.70, and then the FI decreased when thepH was higher than 11.70. The maximum FI was about threetimes of that of pH = 9.5.The variation trend and optimal pHrange are similar to those of Amornthammarong and Zhang[12]. To gain better method sensitivity, the solution pH wascontrolled in the range of 11.0–11.4 using EDTA-NaOH buffersolution in this work.The EDTA effect was discussed in detailin Section 3.1.4.
4 Journal of Analytical Methods in Chemistry
Table 2: The FI of different concentration standard ammonium solution in existence and absence of EDTA.
Concentration of ammonium (𝐶𝑁, 𝜇mol/L) FI in existence of EDTA FI in absence of EDTA
0 62.871 74.9940.125 253.749 235.4080.250 444.613 414.7820.375 589.166 551.2470.500 760.241 690.585The relationship between FI and 𝐶
𝑁FI = 1384.1𝐶
𝑁+ 76.10 (𝑛 = 5) FI = 1237.6𝐶
𝑁+ 84.00 (𝑛 = 5)
Corresponding parameters𝑅2 0.9973 (𝑃 < 0.0001) 0.9970 (𝑃 < 0.0001)
The standard deviation of the intercept 12.65 11.90The standard deviation of the slope 41.32 38.87
050
100150200250300350400450500
0.1 0.2 0.3 0.4 0.5 0.6 0.7 0.8 0.9 1
FI
OPA concentration in the final solution (g/L)
(b)
(a)
Figure 3: Effect of OPA concentration in the final solution on thereaction of OPA-NH
3-sulfite ((a) 0.25 𝜇mol/L, (b) blank).
0
100
200
300
400
500
600
0 0.1 0.2 0.3 0.4 0.5 0.6 0.7
FI
Concentration of sodium sulfite in the final solution (g/L)
(a)
(b)
Figure 4: Effect of sodium sulfite concentration in the final solutionon the reaction of OPA-NH
3-sulfite ((a) 0.25 𝜇mol/L, (b) blank).
3.1.3. Effect of Concentrations of OPA and Sodium Sulfite.The effect of OPA concentration on the fluorescence reac-tion was studied over the range 0.115–0.913 g/L (Figure 3).The fluorescence intensity increased with increasing OPAconcentration from 0.115 up to 0.457 g/L and was keptstable when the OPA concentration was between 0.457 and0.913 g/L. Consequently, anOPAconcentration of 0.691 g/L inthe final solution was chosen for all subsequent experiments.
The effect of sodium sulfite in the range of 0–10 g/L isilluminated in Figure 4. The fluorescence intensity increasedrapidly when concentration of sodium sulfite increased from0 to 0.081 g/L and was kept constant in the range of 0.081–0.326 g/L, and then the intensity slowly decreased when
the sodium sulfite concentration was more than 0.326 g/L.Therefore, a sodium sulfite concentration of 0.163 g/L in thefinal solution was selected in this work.
In this work, OPA and sodium sulfite were found to bethe main source of reagent blank. To decrease the reagentblank, OPA and sodium sulfite solution were mixed togetheraccording to the depiction in Section 2.1 and passed througha HLB cartridge. In the mixed solution, ammonium in thereagent reacted with excess OPA and sodium sulfite andproduced isoindole complex.The isoindole complex could beextracted by HLB column, ammonium in the solution wasremoved. Most of OPA and sodium sulfite in the solutionpassed through the column. The passed solution was used asfluorescent reagent. It was stable for one week if stored at 4∘Cin a refrigerator, while the reagent blank will slowly increasebecause of the effect of ambient air. To get lower reagentblank, the mixed solution was made daily in this work.
3.1.4. Effect of EDTA. EDTA is a strongmetal ion complexingagent. Precipitation would not occur in seawater sampleat the existence of appropriate number of EDTA even ifthe solution was adjusted to strong basicity. When 3mLof EDTA-NaOH buffer solution (R
2) was added in 20mL
seawater sample in this work, the pH of the solution could beadjusted in the range of 11.0–11.4 and precipitation could notappear. The concentration of EDTA in the final solution was5.77mmol/L. This dosage was also suitable for determiningfreshwater sample. To investigate the effect of EDTA, the FIof different concentration standard ammonium solution wasseparately determined in the existence or absence of EDTA.The results are listed in Table 2. There was not an obviousdifference between the FI signals of existence and absence ofEDTA, illuminating that EDTA had not obviously influencethe fluorimetric determination of ammonium. EDTA couldbe used to prevent metal ion precipitation in this proposedmethod.
3.2. Calibration Curves, Sensitivity, Reproducibility, andMethod Detection Limit. Under the optimal conditions cho-sen above, the typical calibration curves were determinedaccording to Section 2.2.1. The results are listed in Table 3.The linearity range was 0.032–0.500, 0.250–3.00, and 1.00–20.0𝜇mol/L at the excitation/emission slit of 3 nm/5 nm,

Journal of Analytical Methods in Chemistry 5
Table 3: Calibration curves and the corresponding performances.
Method Excitation/emissionslit widths Calibration curves 𝑛 𝑅
2
Standarddeviation of the
intercept
Standarddeviation of the
slope
Linearityrange
(𝜇mol/L)3 nm/5 nm FI = 1237.6𝐶
𝑁+ 84.0 6 0.9970 11.90 38.87 0.032–0.500
The proposed method 3 nm/3 nm FI = 283.0𝐶𝑁+ 35.8 6 0.9996 4.88 2.94 0.25–3.00
1.5 nm/1.5 nm FI = 36.6𝐶𝑁+ 20.7 8 0.9971 5.58 0.81 1.00–15.0
The classical method 3 nm/5 nm FI = 312.6𝐶𝑁+ 60.7 6 0.9951 5.71 12.66 0.25–2.00
Table 4: The matrix spiked recovery.
Matrix Matrix spiked curve Corresponding calibration curve The average matrix spiked recovery
Groundwater FI = 1240𝐶𝑁+ 162.0
(𝑛 = 5, 𝑅2 = 0.9961)FI = 1220𝐶
𝑁+ 125.2
(𝑛 = 5, 𝑅2 = 0.9955) 101.60%
Mountain spring water FI = 1194𝐶𝑁+ 246.2
(𝑛 = 5, 𝑅2 = 0.9908)FI = 1150𝐶
𝑁+ 172.0
(𝑛 = 5, 𝑅2 = 0.9941) 103.83%
Seawater FI = 915.1𝐶𝑁+ 118.2
(𝑛 = 5, 𝑅2 = 0.9912)FI = 937.8𝐶
𝑁+ 119.4
(𝑛 = 5, 𝑅2 = 0.9923) 97.60%
Table 5: Analytical results of the proposed method and classical OPA method.
Seawatersample
The proposed method(𝜇mol/L)
The classical OPA method(𝜇mol/L) Calculated 𝑡-value Critical 𝑡-value (𝑃 = 0.05)
1 0.536 ± 0.008 (𝑛 = 4) 0.560 ± 0.018 (𝑛 = 4) 2.43 2.452 0.385 ± 0.006 (𝑛 = 3) 0.360 ± 0.035 (𝑛 = 3) 1.22 2.78
3 nm/3 nm, and 1.5 nm/1.5 nm, respectively. The calibrationcurve with different linearity range could be used for typicalsample analysis, depending on the concentration of ammo-nium in water samples.
Under the same experimental environment as the pro-posed method, a calibration curve of the classical OPAmethod was determined according to Section 2.2.2 and wasFI = 312.6𝐶
𝑁+ 60.7 at the excitation/emission slit of
3 nm/5 nm (Table 3). The slope of the proposed method is1237.6, being 4 times that of the classical OPA method.This illuminated that the proposed method was much moresensitive than the classical method.
The reproducibility of the method was evaluated with5 repetitive determinations of a 0.250 𝜇mol/L ammoniumstandard solution. The relative standard deviation was 3.2%.Eleven blanks solutions were determined at the excita-tion/emission slit of 3 nm/5 nm, the average FI was 45.71, andthe standard deviation was 4.09. The method detection limit,estimated as three times the standard deviations of the blank,was 0.0099𝜇mol/L.
3.3. Validation of the Method
3.3.1. Recovery. Fresh water samples, groundwater andmountain spring water, were collected at Yaoshan ScenicArea in Guilin. A surface seawater sample was collected fromthe South China Sea and aged for one year. In order toexamine the recovery of the method, these three samplesspiked with a series of concentration of ammonium (0, 0.125,
0.250, 0.500, and 1.000𝜇mol/L) were separately analyzedusing the proposed method, together with the calibrationcurve. The linear equations of the matrix spike curves andcorresponding calibration curves are showed in Table 4. Theslopes of the calibration curves were not completely identicaldue to the slight difference of the room temperature andother environmental parameters in different days. To avoidthe influence of the experimental environment, the matrixspiked curve and the corresponding calibration curve weredetermined in the same time.The recovery of the ammoniumin spiked samples was represented as the ratio of the slopeof matrix spike curve to that of corresponding calibrationcurve [18]. The average recovery of the ammonium in freshwater and seawater matrix ranged from 97.60% to 103.83%,illuminating that the other amine in the water samples didnot disturb the determination of ammonium. The proposedmethod is available for both fresh water and seawater.
3.3.2. Comparison with Classical OPA Method. Two typi-cal seawater samples obtained from the South China Seawere analyzed using the proposed method according toSection 2.2.1. At the same time, the ammonium concentra-tions were determined using classical OPAmethod accordingto Section 2.2.2. The results are compared in Table 5. Usingthe paired Student’s t-test at 95% confidence level to testthe difference between the two methods, the calculated t-values were lower than the critical t-value.This indicates thatthere was no statistically significant difference between theproposed method and classical OPA method.

6 Journal of Analytical Methods in Chemistry
0
5
10
15
20
25
30
35
40
45
0 5 10 15 20 25 30 35 40 45
Am
mon
ium
conc
entr
atio
n by
indo
phen
ol
blue
met
hod
(𝜇m
ol/L
)
Ammonium concentration by the proposed method (𝜇mol/L)
y = 1.095x − 0.273
R2 = 0.991
Figure 5: Intercomparison data with indophenol blue method.
3.3.3. Application. Huajian River is located in Guilin cityand passes through Huajian Compus of Guilin University ofElectronic Technology (GUET). Twenty-three surface watersamples were collected from Huajian River at December 27,2013, and filtered by 0.45 𝜇m filter as soon as possible aftercollection.The filtered water samples were refrigerated at 4∘Cbefore determination.The samples were analyzed by both theproposed method and indophenol blue method [5] within 24hours. When the concentration of ammonium in the watersamplewas less than 15𝜇mol/L, the FI of thewater samplewasdetermined according to Section 2.2.1, and the calibrationcurve with appropriate linearity range in Table 3 was appliedto quantify the ammonium concentration. Otherwise, thewater sample should be diluted before determination. Theresults in Figure 5 show a good agreement between thesetwo methods with a wide concentration range from 0.44 to38.25 𝜇mol/L.The spatial variation of ammonium in HuajianRiver is described in Figure 6. The higher concentrationsof ammonium were found in the River at about 500mdownstream of GUET. The concentration of ammoniumin the upstream was lower and decreased gradually as thedistance to the GUET was increasing. This illuminated thatthe outfall of GUET was the most possible main source ofammonium in the river.
4. Conclusion
A new modified OPA fluorometric analytical method wasestablished to determine ultratrace concentrations ammo-nium in natural waters using EDTA-NaOH as buffer. In thismethod, the NH
3-OPA-sulfite reaction at the optimal pH
could be used to determine ammonium in natural waters.There was no significant statistical difference between theresults obtained from the proposed method and classicalOPA method. The results of the proposed method applied todetermine the river water were agreed with that of indophe-nol blue method. Compared to the classical OPA method,the main merit of the proposed method was enhancing thesensitivity by increasing the amount of reaction production
Shanli
Yaoshan
Guilin University of Electronic Technology
AreaPoint
Ammonium concentrationHigh: 38.24 𝜇mol/LLow: 0.399𝜇mol/L
0 1200(M)
Tian
EWN
S
Figure 6: The spatial variation of ammonium concentration inHuajian River.
under the optimal pH condition. It could quantify nanomolarlevel ammonium without enrichment.
Conflict of Interests
The authors declare that there is no conflict of interestsregarding the publication of this paper.
Acknowledgments
The work was financially supported by the National NaturalScience Foundation of China (no. 41206077). The authorswould like to thank the group of Professor Yuan Dongxingin Xiamen University for supplying the seawater samples.
References
[1] C.Molins-Legua, S.Meseguer-Lloret, Y.Moliner-Martinez, andP. Campıns-Falco, “A guide for selecting the most appropriatemethod for ammonium determination in water analysis,” TrACTrends in Analytical Chemistry, vol. 25, no. 3, pp. 282–290, 2006.
[2] W. G. Harrison, L. R. Harris, and B. D. Irwin, “The kineticsof nitrogen utilization in the oceanic mixed layer: nitrateand ammonium interactions at nanomolar concentrations,”Limnology and Oceanography, vol. 41, no. 1, pp. 16–32, 1996.
[3] S. J. Painting, M. J. Devlin, S. J. Malcolm et al., “Assessing theimpact of nutrient enrichment in estuaries: susceptibility toeutrophication,” Marine Pollution Bulletin, vol. 55, no. 1–6, pp.74–90, 2007.
[4] M. T. Johnson, P. S. Liss, T. G. Bell et al., “Field observationsof the ocean-atmosphere exchange of ammonia: fundamentalimportance of temperature as revealed by a comparison of high

Journal of Analytical Methods in Chemistry 7
and low latitudes,” Global Biogeochemical Cycles, vol. 22, no. 1,Article ID GB1019, pp. 1–15, 2008.
[5] I. Ivancic and D. Degobbis, “An optimal manual procedure forammonia analysis in natural waters by the indophenol bluemethod,”Water Research, vol. 18, no. 9, pp. 1143–1147, 1984.
[6] G. Chen, M. Zhang, Z. Zhang, Y. Huang, and D. Yuan, “On-line solid phase extraction and spectrophotometric detectionwith flow technique for the determination of nanomolar levelammonium in seawater samples,” Analytical Letters, vol. 44, no.1–3, pp. 310–326, 2011.
[7] M. Roth, “Fluorescence reaction for amino acids,” AnalyticalChemistry, vol. 43, no. 7, pp. 880–882, 1971.
[8] Z. Genfa and P. K. Dasgupta, “Fluorometric measurement ofaqueous ammonium ion in a flow injection system,” AnalyticalChemistry, vol. 61, no. 5, pp. 408–412, 1989.
[9] A. Aminot, R. Kerouel, and D. Birot, “A flow injection-fluorometric method for the determination of ammonium infresh and saline waters with a view to in situ analyses,” WaterResearch, vol. 35, no. 7, pp. 1777–1785, 2001.
[10] X. X. Yu andW. D. Guo, “Sensitive spectrofluorimetric methodfor determination of low concentration ammonium in seawa-ter,”Marine Sciences, vol. 31, no. 4, pp. 37–41, 2007 (Chinese).
[11] R. J. Watson, E. C. V. Butler, L. A. Clementson, and K. M.Berry, “Flow-injection analysis with fluorescence detection forthe determination of trace levels of ammonium in seawater,”Journal of Environmental Monitoring, vol. 7, no. 1, pp. 37–42,2005.
[12] N. Amornthammarong and J.-Z. Zhang, “Shipboard fluoromet-ric flow analyzer for high-resolution underwaymeasurement ofammonium in seawater,”Analytical Chemistry, vol. 80, no. 4, pp.1019–1026, 2008.
[13] N. Amornthammarong, J.-Z. Zhang, and P. B. Ortner, “Anautonomous batch analyzer for the determination of traceammonium in natural waters using fluorometric detection,”Analytical Methods, vol. 3, no. 7, pp. 1501–1506, 2011.
[14] B. Horstkotte, C. M. Duarte, and V. Cerda, “A miniature andfield-applicable multipumping flow analyzer for ammoniummonitoring in seawater with fluorescence detection,” Talanta,vol. 85, no. 1, pp. 380–385, 2011.
[15] Y. Zhu, D. X. Yuan, Y. M. Huang, J. Ma, and S. C. Feng,“A sensitive flow-batch system for on board determination ofultra-trace ammonium in seawater: method development andshipboard application,”AnalyticaChimicaActa, vol. 794, pp. 47–54, 2013.
[16] E. Trepman andR. F. Chen, “Fluorescence stopped-flow study ofthe o-phthaldialdehyde reaction,” Archives of Biochemistry andBiophysics, vol. 204, no. 2, pp. 524–532, 1980.
[17] C. T. Kuo, P. Y. Wang, and C. H. Wu, “Fluorometric deter-mination of ammonium ion by ion chromatography usingpostcolumn derivatization with o-phthaldialdehyde,” Journal ofChromatography A, vol. 1085, no. 1, pp. 91–97, 2005.
[18] Y. Liang, D. Yuan, Q. Li, and Q. Lin, “Flow injection analysis ofnanomolar level orthophosphate in seawater with solid phaseenrichment and colorimetric detection,”Marine Chemistry, vol.103, no. 1-2, pp. 122–130, 2007.

Submit your manuscripts athttp://www.hindawi.com
Hindawi Publishing Corporationhttp://www.hindawi.com Volume 2014
Inorganic ChemistryInternational Journal of
Hindawi Publishing Corporation http://www.hindawi.com Volume 2014
International Journal ofPhotoenergy
Hindawi Publishing Corporationhttp://www.hindawi.com Volume 2014
Carbohydrate Chemistry
International Journal of
Hindawi Publishing Corporationhttp://www.hindawi.com Volume 2014
Journal of
Chemistry
Hindawi Publishing Corporationhttp://www.hindawi.com Volume 2014
Advances in
Physical Chemistry
Hindawi Publishing Corporationhttp://www.hindawi.com
Analytical Methods in Chemistry
Journal of
Volume 2014
Bioinorganic Chemistry and ApplicationsHindawi Publishing Corporationhttp://www.hindawi.com Volume 2014
SpectroscopyInternational Journal of
Hindawi Publishing Corporationhttp://www.hindawi.com Volume 2014
The Scientific World JournalHindawi Publishing Corporation http://www.hindawi.com Volume 2014
Medicinal ChemistryInternational Journal of
Hindawi Publishing Corporationhttp://www.hindawi.com Volume 2014
Chromatography Research International
Hindawi Publishing Corporationhttp://www.hindawi.com Volume 2014
Applied ChemistryJournal of
Hindawi Publishing Corporationhttp://www.hindawi.com Volume 2014
Hindawi Publishing Corporationhttp://www.hindawi.com Volume 2014
Theoretical ChemistryJournal of
Hindawi Publishing Corporationhttp://www.hindawi.com Volume 2014
Journal of
Spectroscopy
Analytical ChemistryInternational Journal of
Hindawi Publishing Corporationhttp://www.hindawi.com Volume 2014
Journal of
Hindawi Publishing Corporationhttp://www.hindawi.com Volume 2014
Quantum Chemistry
Hindawi Publishing Corporationhttp://www.hindawi.com Volume 2014
Organic Chemistry International
ElectrochemistryInternational Journal of
Hindawi Publishing Corporation http://www.hindawi.com Volume 2014
Hindawi Publishing Corporationhttp://www.hindawi.com Volume 2014
CatalystsJournal of
Related Documents