RESEARCH AND PUBLIC POLICY: DENTAL CARIES AND FLUORIDATION Howard Pollick, BDS, MPH Health Sciences Clinical Professor Preventive & Restorative Dental Sciences School of Dentistry University of California San Francisco Research and Clinical Excellence Day University of Pacific, Arthur A. Dugoni School of Dentistry May 20th, 2009 UCSF Dental Public Health Seminar: PART 1 October 6, 2009

Welcome message from author
This document is posted to help you gain knowledge. Please leave a comment to let me know what you think about it! Share it to your friends and learn new things together.
Transcript
RESEARCH AND PUBLIC POLICY:DENTAL CARIES AND FLUORIDATION
Howard Pollick, BDS, MPHHealth Sciences Clinical ProfessorPreventive & Restorative Dental SciencesSchool of DentistryUniversity of California San Francisco
Research and Clinical Excellence Day University of Pacific,
Arthur A. Dugoni School of DentistryMay 20th, 2009
UCSF Dental Public Health Seminar: PART 1October 6, 2009
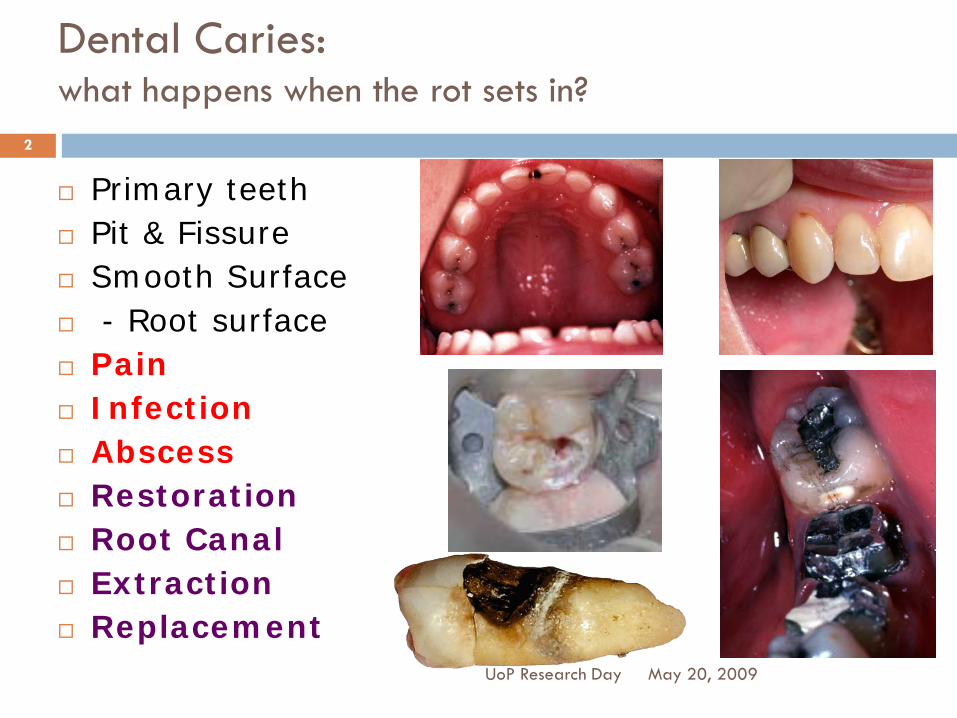
Dental Caries:what happens when the rot sets in?
Primary teeth Pit & Fissure Smooth Surface - Root surface Pain Infection Abscess Restoration Root Canal Extraction Replacement
May 20, 2009UoP Research Day
2
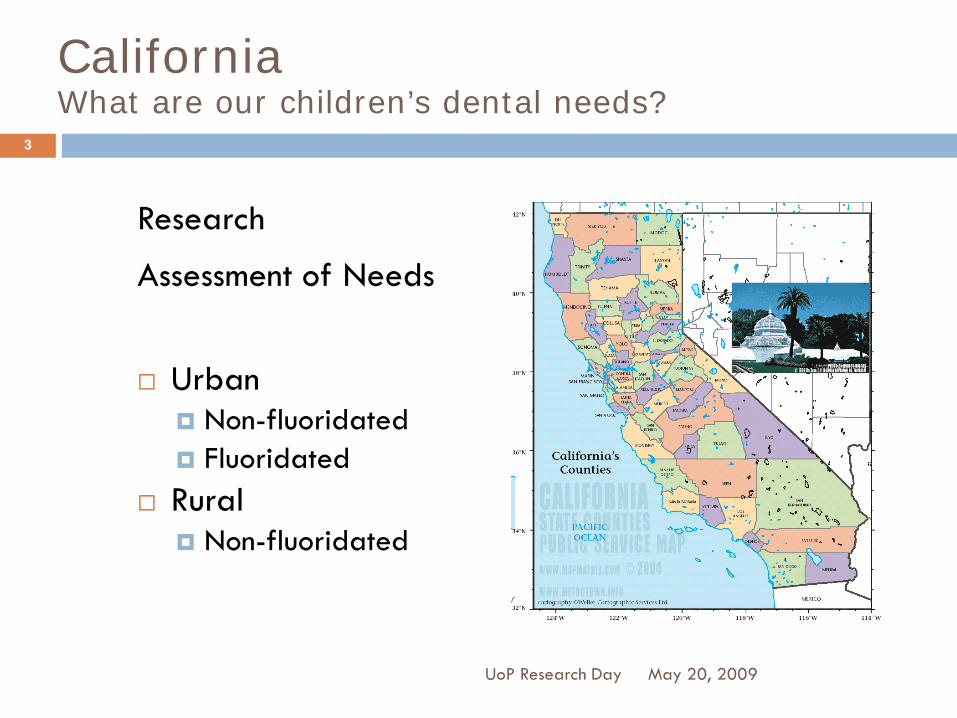
CaliforniaWhat are our children’s dental needs?
May 20, 2009UoP Research Day
3
Research
Assessment of Needs
Urban Non-fluoridated Fluoridated
Rural Non-fluoridated

California Oral Health Needs Assessment of Children, 1993-94
1993-94 First Statewide data
Pollick HF, Isman R, Fine JI, Wellman J, Kipnis P, Ellison J.
Report of the California Oral Health Needs Assessment of Children, 1993-94: Background, Methodology, Findings.
The Dental Health Foundation, Oakland, California. 1999
May 20, 2009UoP Research Day
4
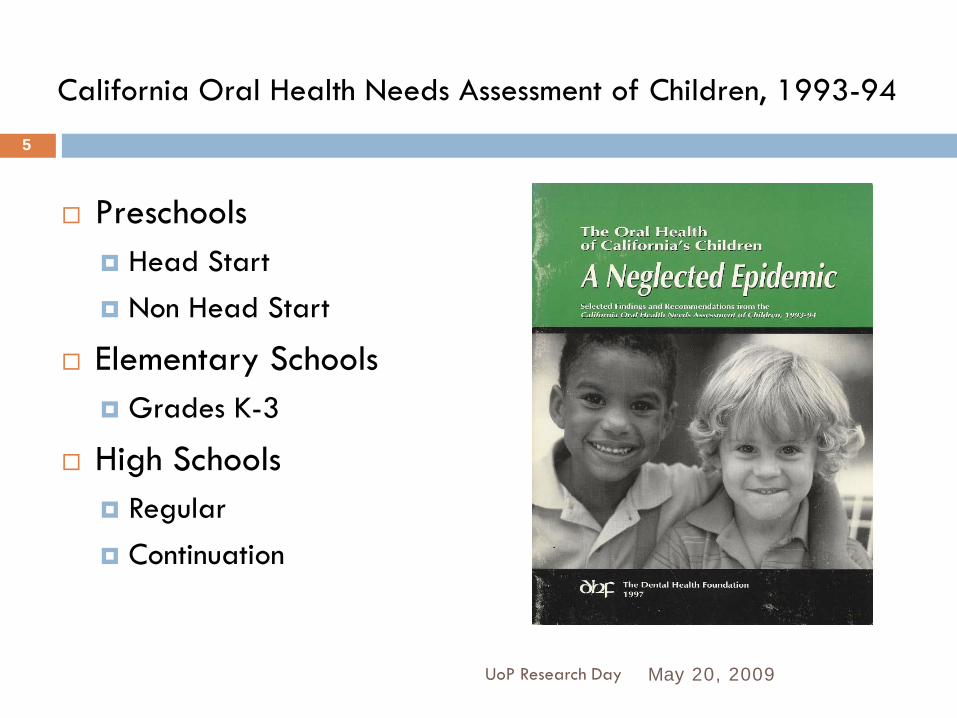
California Oral Health Needs Assessment of Children, 1993-94
Preschools Head Start Non Head Start
Elementary Schools Grades K-3
High Schools Regular Continuation
May 20, 2009UoP Research Day
5
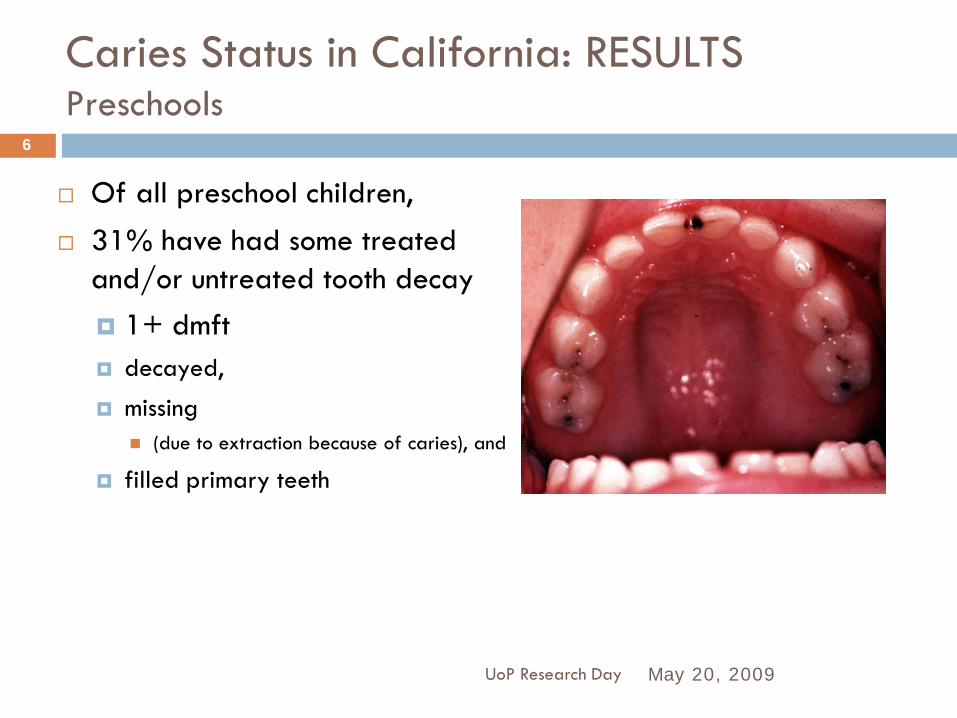
Caries Status in California: RESULTSPreschools
Of all preschool children, 31% have had some treated
and/or untreated tooth decay 1+ dmft decayed,
missing (due to extraction because of caries), and
filled primary teeth
May 20, 2009UoP Research Day
6
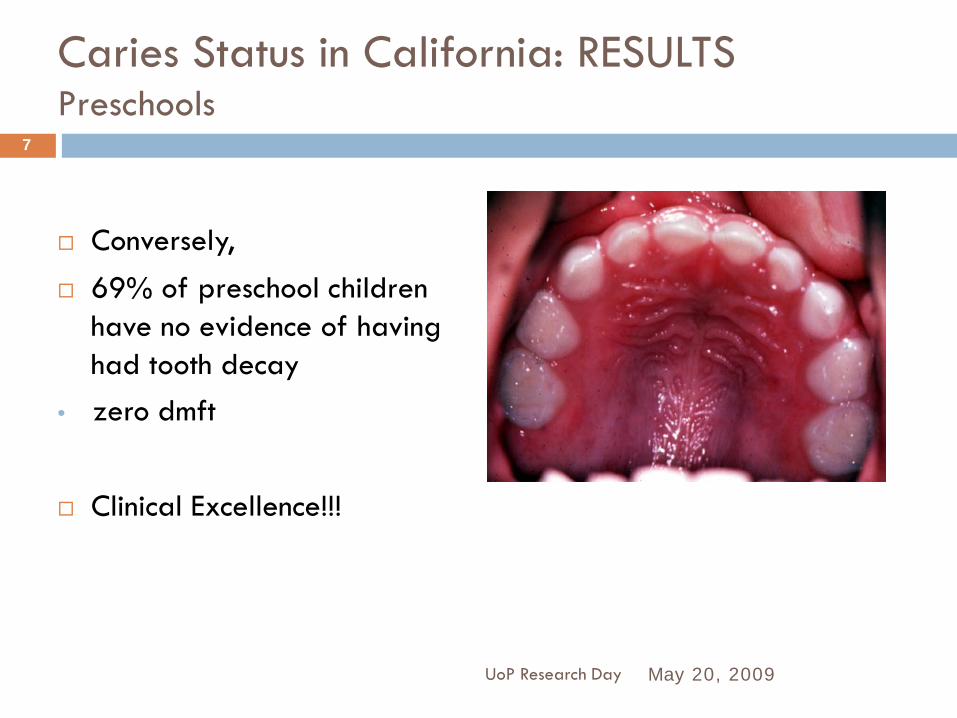
Caries Status in California: RESULTSPreschools
Conversely, 69% of preschool children
have no evidence of having had tooth decay
• zero dmft
Clinical Excellence!!!
May 20, 2009UoP Research Day
7

Caries Status in California: RESULTSPreschools: Disparities: Ethnicity, Region, Type of preschool
May 20, 2009UoP Research Day
8
1.3
4.5
0.3
00.5
11.5
22.5
33.5
44.5
5
dmft
All
AsianNon- fluoridatedHead Start
WhiteFluoridatedNon Head Start
31%
79%
10%
0%
20%
40%
60%
80%
100%
Prevalence
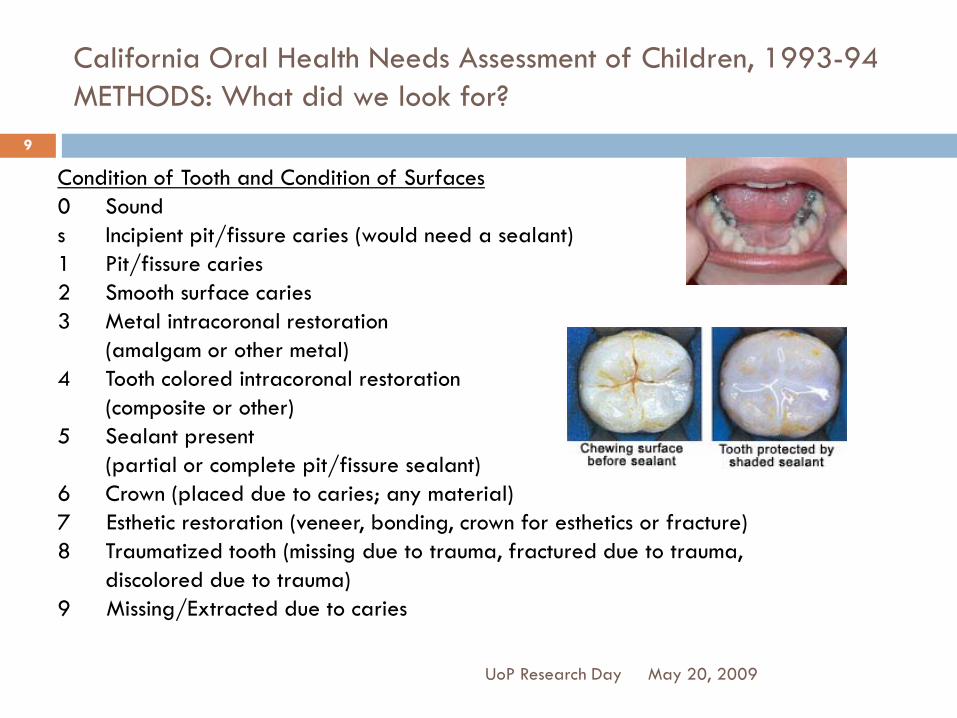
California Oral Health Needs Assessment of Children, 1993-94METHODS: What did we look for?
May 20, 2009UoP Research Day
9
Condition of Tooth and Condition of Surfaces0 Sounds Incipient pit/fissure caries (would need a sealant)1 Pit/fissure caries2 Smooth surface caries3 Metal intracoronal restoration
(amalgam or other metal)4 Tooth colored intracoronal restoration
(composite or other)5 Sealant present
(partial or complete pit/fissure sealant)6 Crown (placed due to caries; any material)7 Esthetic restoration (veneer, bonding, crown for esthetics or fracture)8 Traumatized tooth (missing due to trauma, fractured due to trauma,
discolored due to trauma)9 Missing/Extracted due to caries
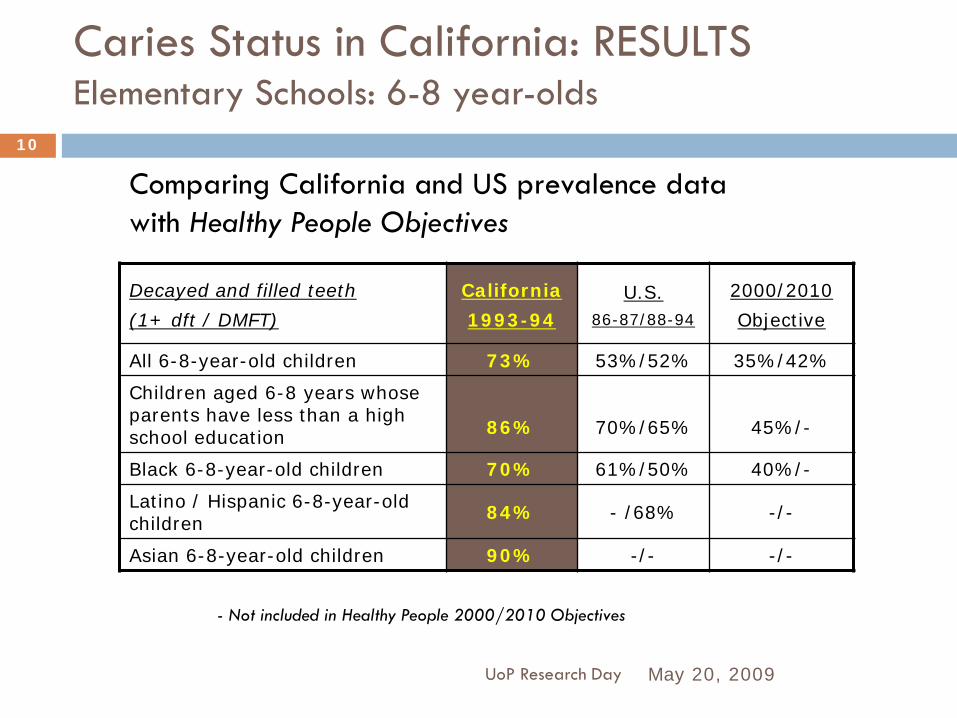
Caries Status in California: RESULTSElementary Schools: 6-8 year-olds
May 20, 2009UoP Research Day
10
Decayed and filled teeth
(1+ dft / DMFT)
California
1993-94U.S.
86-87/88-94
2000/2010
Objective
All 6-8-year-old children 73% 53%/52% 35%/42%
Children aged 6-8 years whose parents have less than a high school education 86% 70%/65% 45%/-
Black 6-8-year-old children 70% 61%/50% 40%/-
Latino / Hispanic 6-8-year-old children 84% - /68% -/-
Asian 6-8-year-old children 90% -/- -/-
- Not included in Healthy People 2000/2010 Objectives
Comparing California and US prevalence data with Healthy People Objectives
Caries Status in California: RESULTSHigh Schools
May 20, 2009UoP Research Day
11
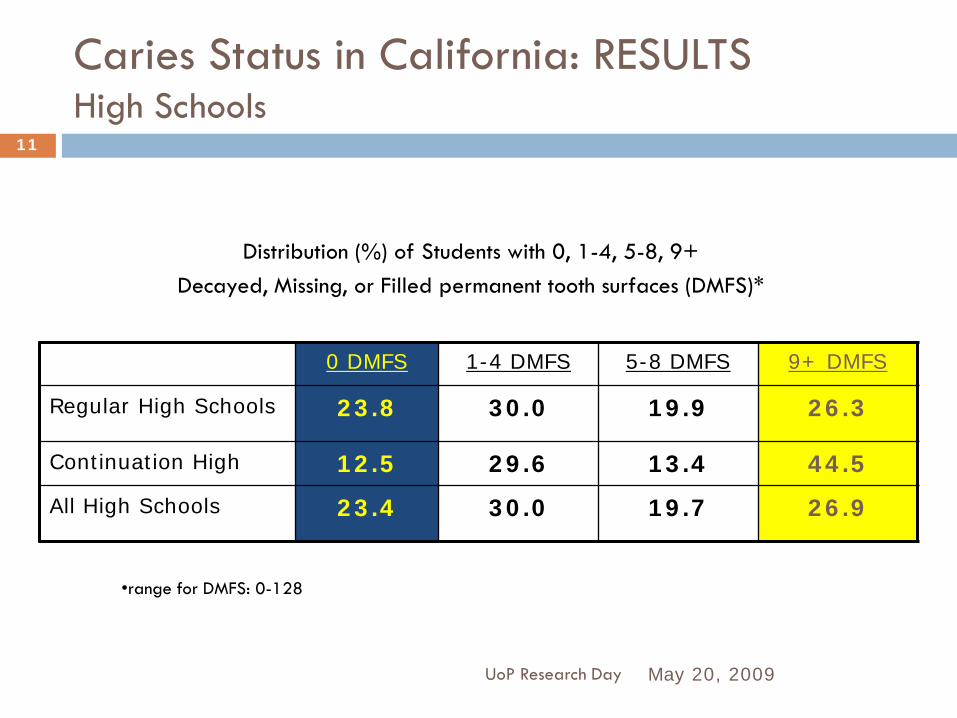
Distribution (%) of Students with 0, 1-4, 5-8, 9+ Decayed, Missing, or Filled permanent tooth surfaces (DMFS)*
0 DMFS 1-4 DMFS 5-8 DMFS 9+ DMFS
Regular High Schools 23.8 30.0 19.9 26.3
Continuation High 12.5 29.6 13.4 44.5
All High Schools 23.4 30.0 19.7 26.9
•range for DMFS: 0-128

Caries Status in California: RESULTSHigh Schools
May 20, 2009UoP Research Day
12
Mean number (and standard error of the mean) ofDecayed, Missing, or Filled permanent tooth surfaces (DMFS)
and percentage of DMFS by components D, M, F
mean DMFS SEM %D/DMFS %M/ DMFS %F/ DMFS
Regular High Schools 6.14 0.85 40.8 5.3 53.9
Continuation High 8.30 0.76 33.7 3.0 63.3
All High Schools 6.21 0.83 40.5 5.2 54.3
California Oral Health Needs Assessment of Children, 1993-94
May 20, 2009UoP Research Day
13
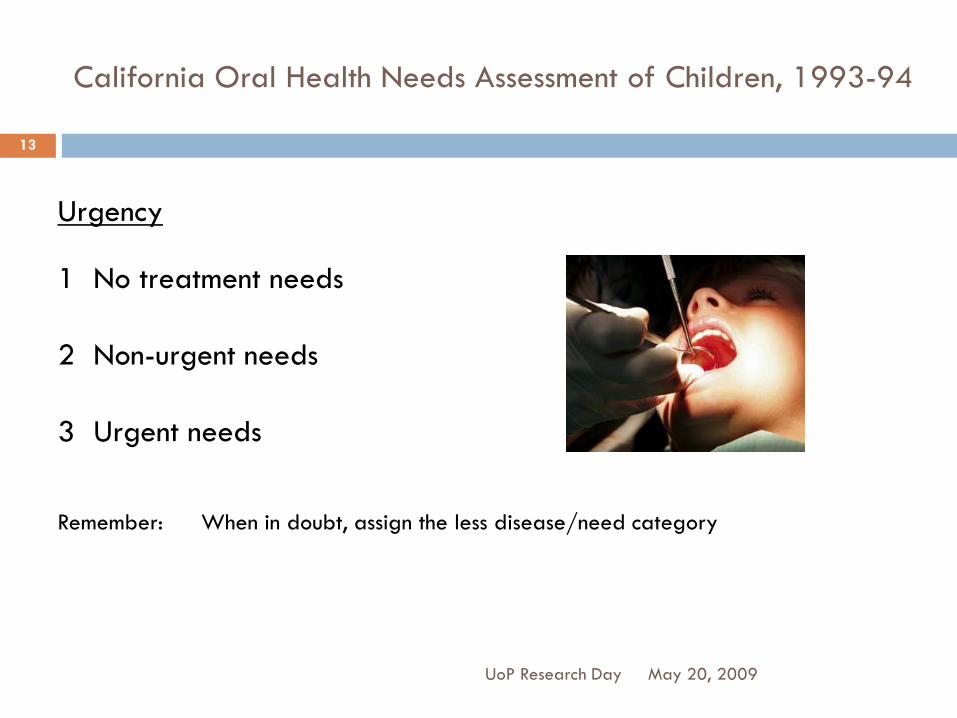
Urgency
1 No treatment needs
2 Non-urgent needs
3 Urgent needs
Remember: When in doubt, assign the less disease/need category
California Oral Health Needs Assessment of Children, 1993-94
High School Students
May 20, 2009UoP Research Day
14
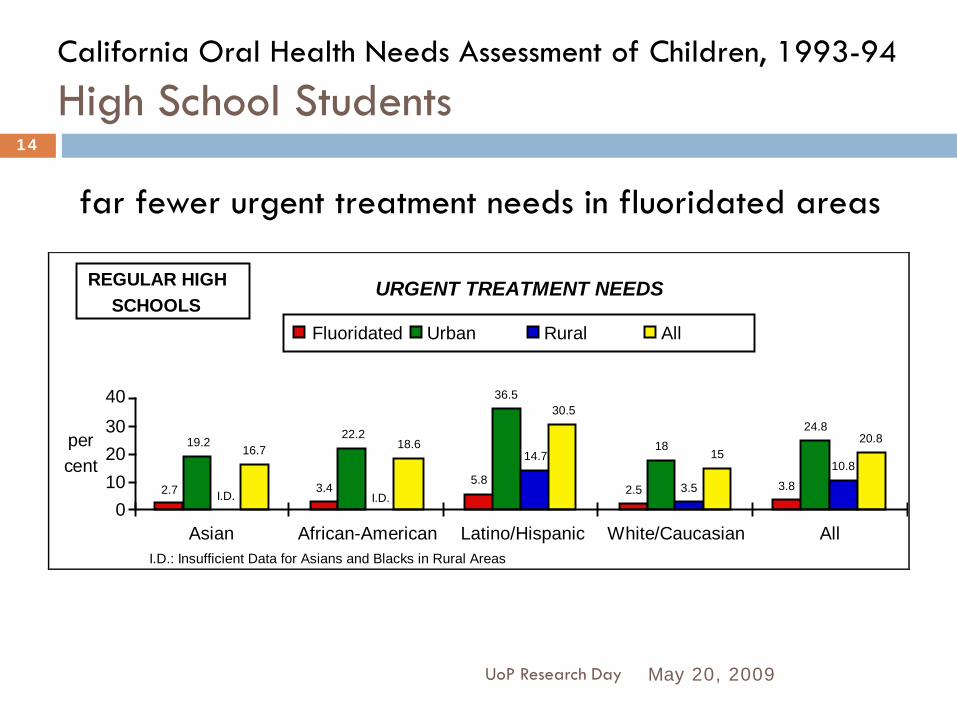
URGENT TREATMENT NEEDS
percent
010203040
Asian African-American Latino/Hispanic White/Caucasian All
2.7 3.45.8
2.5 3.8
19.222.2
36.5
1824.8
3.5
10.816.7 18.6
30.5
1520.8
14.7
Fluoridated Urban Rural All
REGULAR HIGHSCHOOLS
I.D. I.D.
I.D.: Insufficient Data for Asians and Blacks in Rural Areas
far fewer urgent treatment needs in fluoridated areas
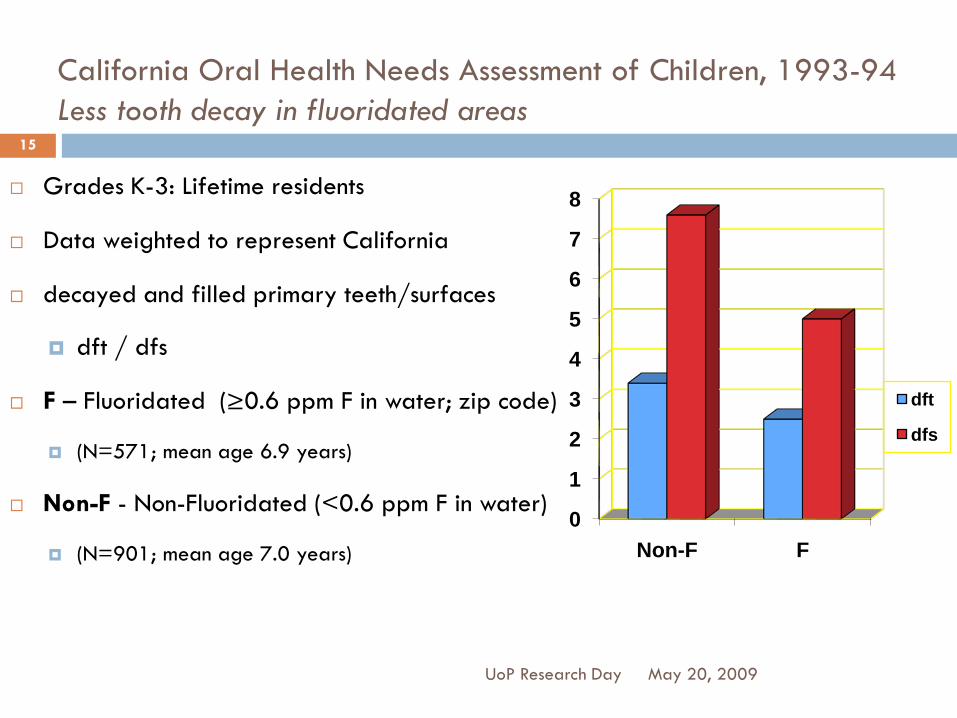
California Oral Health Needs Assessment of Children, 1993-94Less tooth decay in fluoridated areas
Grades K-3: Lifetime residents
Data weighted to represent California
decayed and filled primary teeth/surfaces
dft / dfs
F – Fluoridated (≥0.6 ppm F in water; zip code)
(N=571; mean age 6.9 years)
Non-F - Non-Fluoridated (<0.6 ppm F in water)
(N=901; mean age 7.0 years)
0
1
2
3
4
5
6
7
8
Non-F F
dft
dfs
May 20, 2009UoP Research Day
15
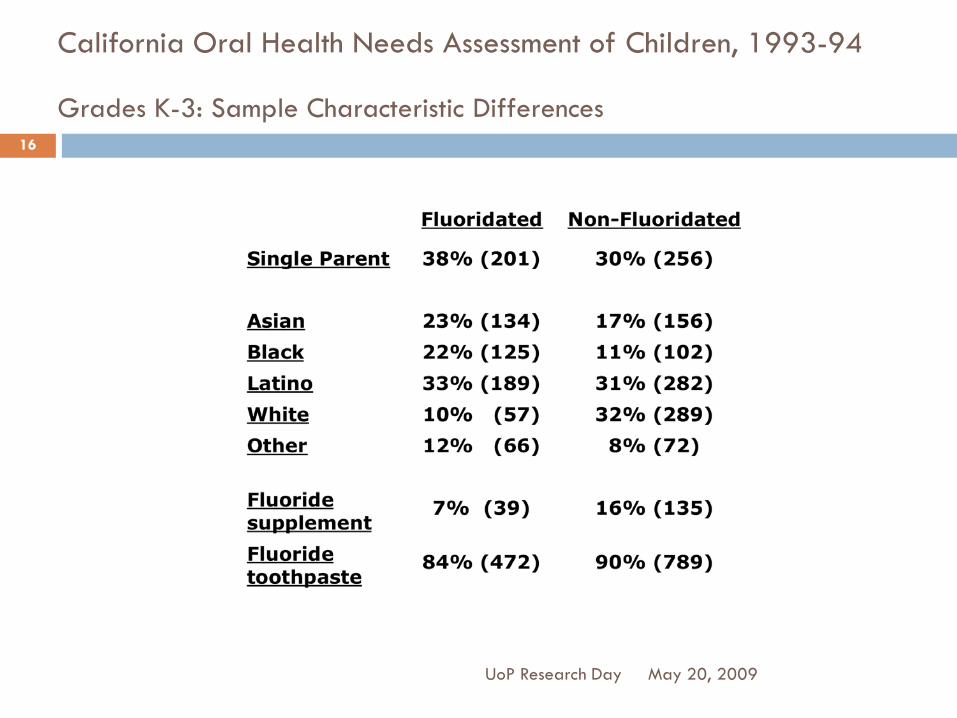
California Oral Health Needs Assessment of Children, 1993-94
Grades K-3: Sample Characteristic Differences
May 20, 2009UoP Research Day
16
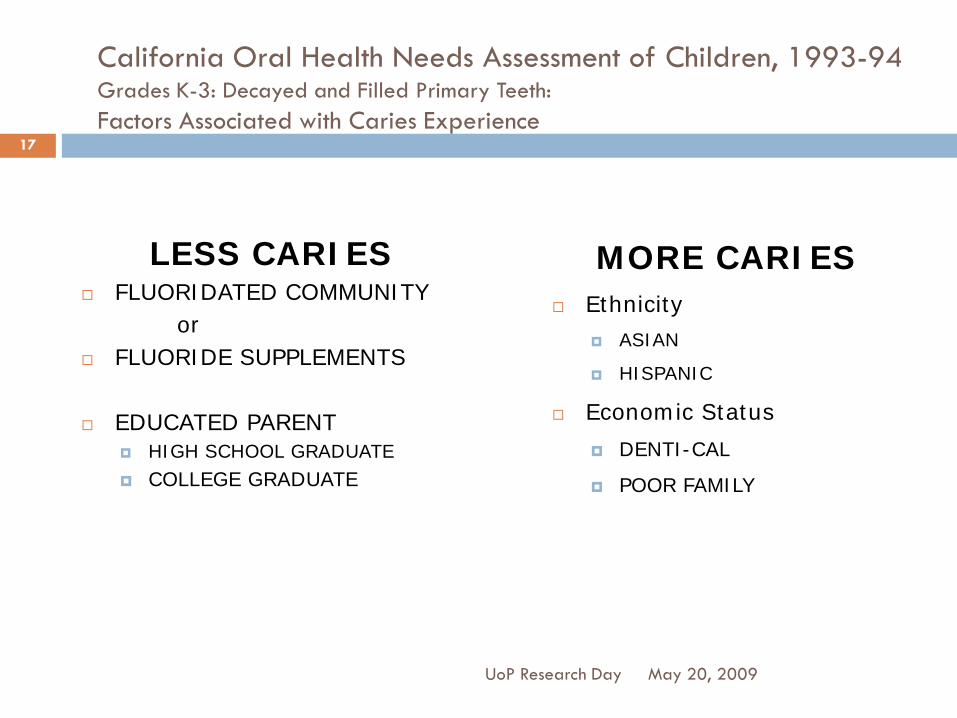
California Oral Health Needs Assessment of Children, 1993-94Grades K-3: Decayed and Filled Primary Teeth:Factors Associated with Caries Experience
LESS CARIES FLUORIDATED COMMUNITY
or FLUORIDE SUPPLEMENTS
EDUCATED PARENT HIGH SCHOOL GRADUATE
COLLEGE GRADUATE
MORE CARIES Ethnicity
ASIAN
HISPANIC
Economic Status
DENTI-CAL
POOR FAMILY
May 20, 2009
17
UoP Research Day

California Oral Health Needs Assessment of Children, 1993-94Acknowledgments
May 20, 2009UoP Research Day
18
Maternal & Child Health Branch, California DHS California Wellness Foundation
The Dental Health Foundation Original Team:
R. Isman, J. Fine, J. Wellman-Benson, J. Ellison, P. Kipnis Advisory Committee
25 Dentist Examiners
9 Regional Coordinators and 31Recorders 6792 children and their families
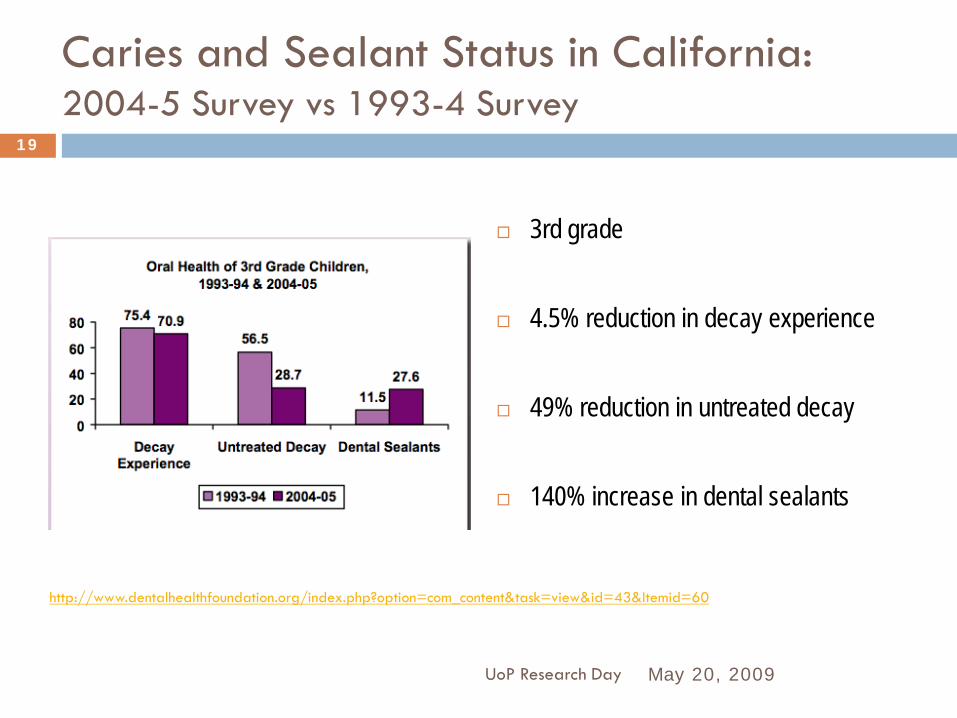
Caries and Sealant Status in California:2004-5 Survey vs 1993-4 Survey
3rd grade
4.5% reduction in decay experience
49% reduction in untreated decay
140% increase in dental sealants
May 20, 2009UoP Research Day
19
http://www.dentalhealthfoundation.org/index.php?option=com_content&task=view&id=43&Itemid=60
RESEARCH AND PUBLIC POLICY:DENTAL CARIES AND FLUORIDATION
Howard Pollick, BDS, MPH
Health Sciences Clinical Professor
Preventive & Restorative Dental Sciences
School of Dentistry
University of California San Francisco
Research and Clinical Excellence Day University of Pacific,
Arthur A. Dugoni School of DentistryMay 20th, 2009
UCSF Dental Public Health Seminar: PART 2October 6, 2009
What can be done? With all these dental treatment needs?
Public Policy: Fluoridation
May 20, 2009
2
UoP Research Day
Who Says Fluoridation Works?
May 20, 2009UoP Research Day
3
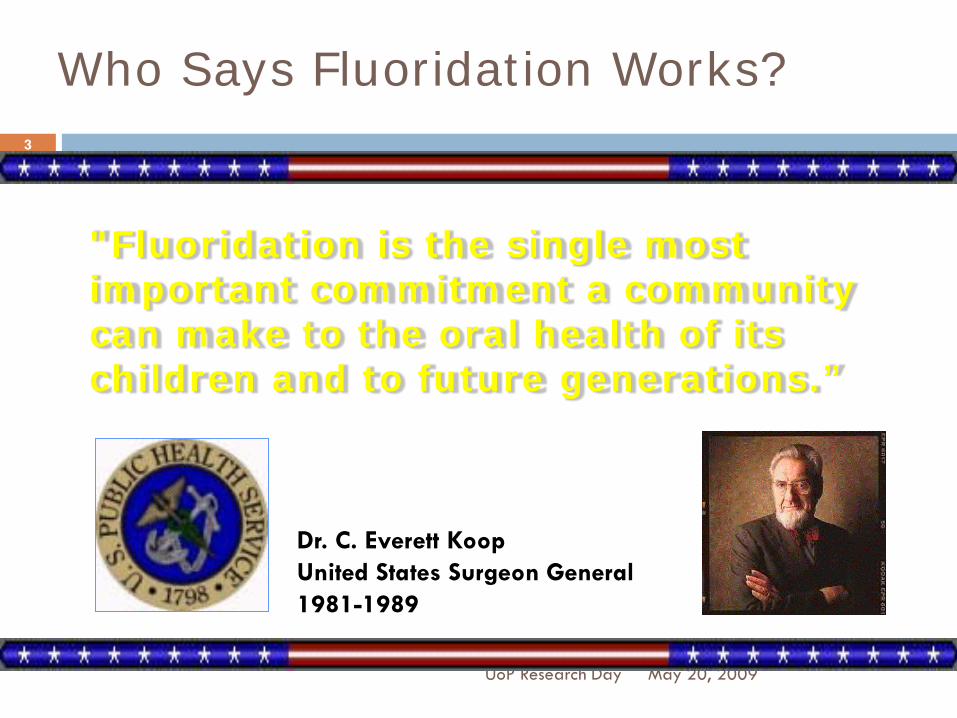
"Fluoridation is the single most important commitment a community can make to the oral health of its children and to future generations.”
Dr. C. Everett KoopUnited States Surgeon General 1981-1989

California Fluoridation Task ForceFormed in 1994
May 20, 2009
4
UoP Research Day
Fluoridation in California: Before 1995 till now
May 20, 2009UoP Research Day
5
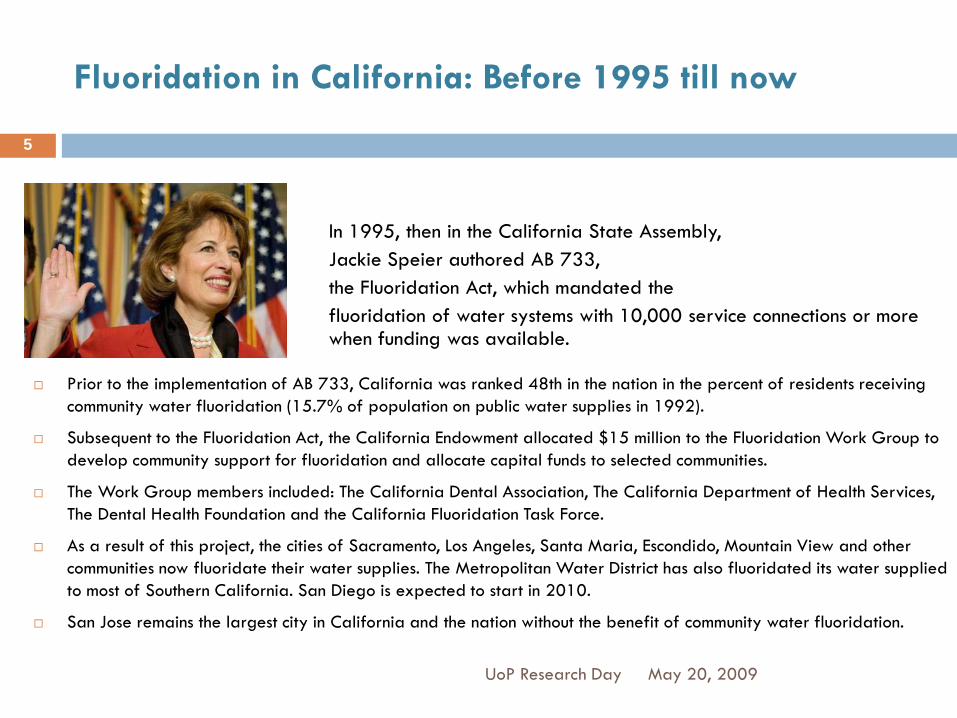
Prior to the implementation of AB 733, California was ranked 48th in the nation in the percent of residents receiving community water fluoridation (15.7% of population on public water supplies in 1992).
Subsequent to the Fluoridation Act, the California Endowment allocated $15 million to the Fluoridation Work Group to develop community support for fluoridation and allocate capital funds to selected communities.
The Work Group members included: The California Dental Association, The California Department of Health Services, The Dental Health Foundation and the California Fluoridation Task Force.
As a result of this project, the cities of Sacramento, Los Angeles, Santa Maria, Escondido, Mountain View and other communities now fluoridate their water supplies. The Metropolitan Water District has also fluoridated its water supplied to most of Southern California. San Diego is expected to start in 2010.
San Jose remains the largest city in California and the nation without the benefit of community water fluoridation.
In 1995, then in the California State Assembly,Jackie Speier authored AB 733, the Fluoridation Act, which mandated the fluoridation of water systems with 10,000 service connections or more when funding was available.
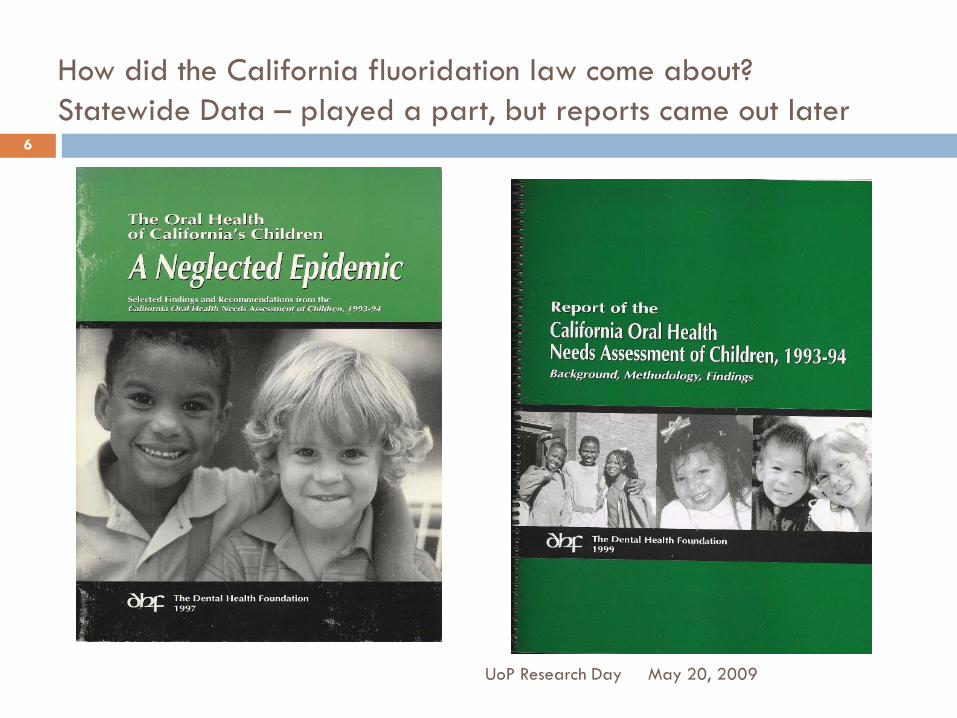
How did the California fluoridation law come about?Statewide Data – played a part, but reports came out later
May 20, 2009UoP Research Day
6
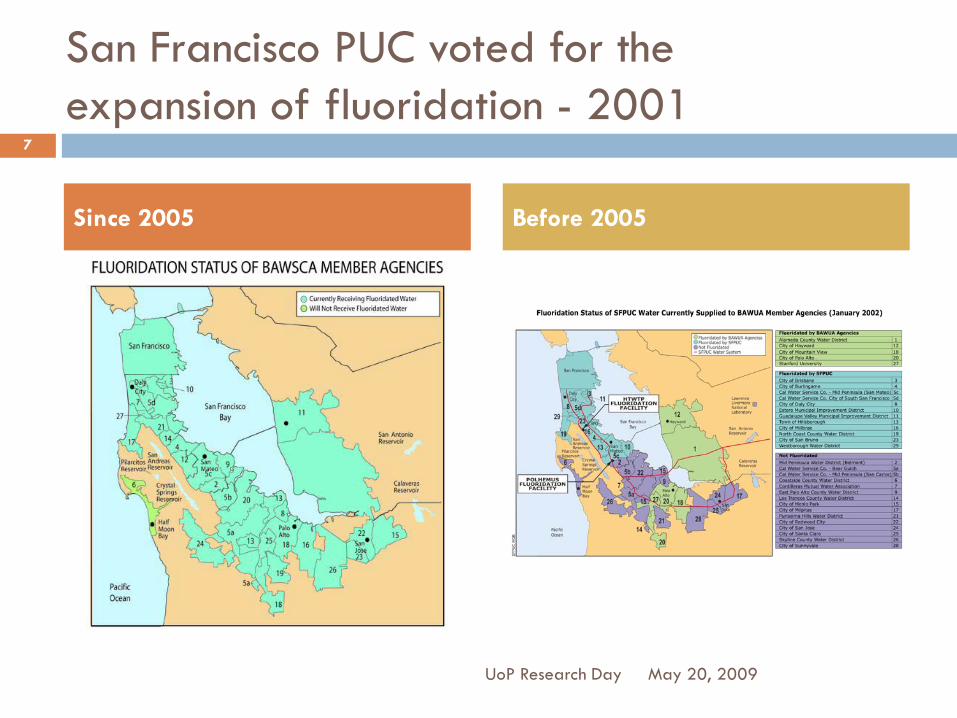
San Francisco PUC voted for theexpansion of fluoridation - 2001
May 20, 2009
7
UoP Research Day
Since 2005 Before 2005
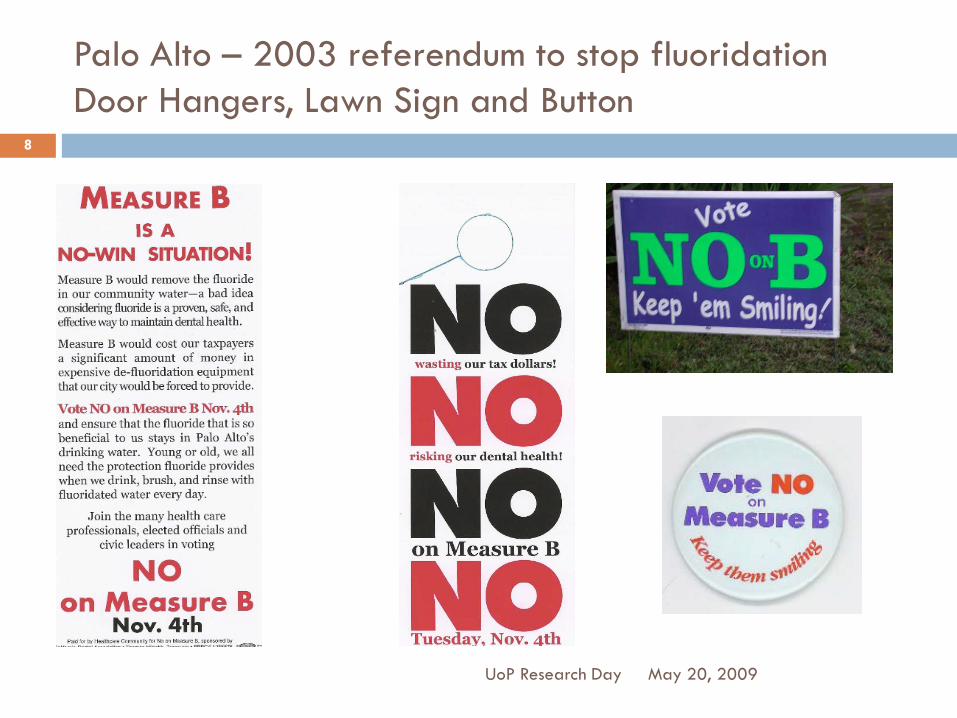
Palo Alto – 2003 referendum to stop fluoridationDoor Hangers, Lawn Sign and Button
May 20, 2009UoP Research Day
8
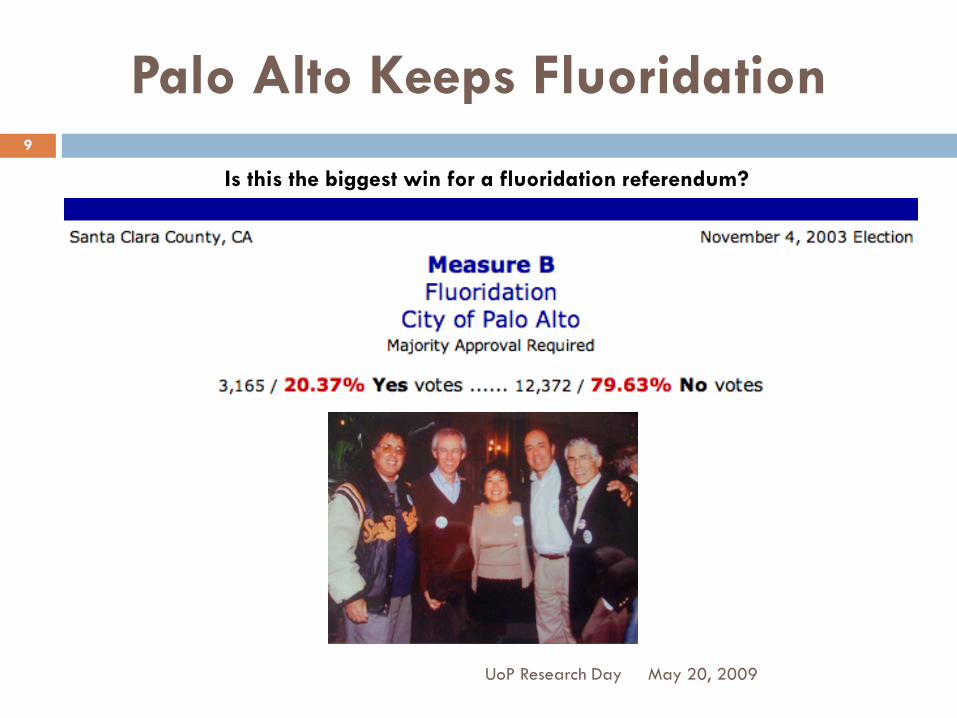
Palo Alto Keeps Fluoridation
May 20, 2009UoP Research Day
9
Is this the biggest win for a fluoridation referendum?
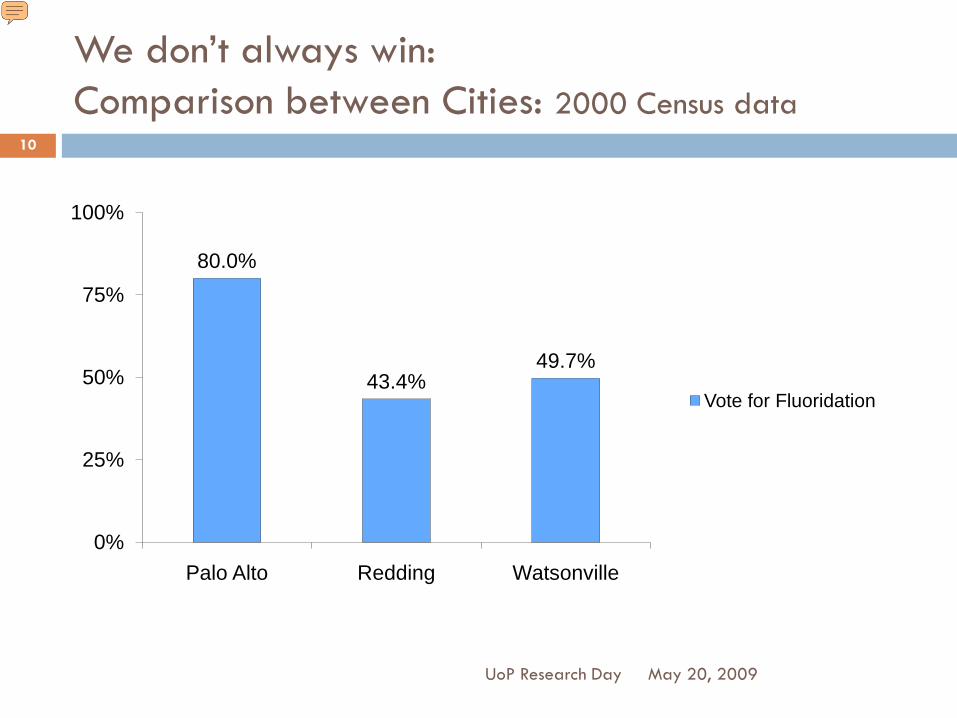
We don’t always win:Comparison between Cities: 2000 Census data
80.0%
43.4%49.7%
0%
25%
50%
75%
100%
Palo Alto Redding Watsonville
Vote for Fluoridation
May 20, 2009UoP Research Day
10
Presenter
Presentation Notes
Thus, the demographics alone may account for the difference in vote for fluoridation between these California cities. However there are probably several other factors at play.

Comparison between Cities2000 Census data: Persons over 25 years of age
May 20, 2009UoP Research Day
11
Presenter
Presentation Notes
The demographics of the populations are distinctly different. Nearly every other person (43%) over 25 years of age in Palo Alto has a graduate or professional degree, compared to fewer than 6% and 3% in Redding and Watsonville. Palo Alto has very few people over 25 in poverty, only 5%, compared to 16% and 19% in Redding and Watsonville.
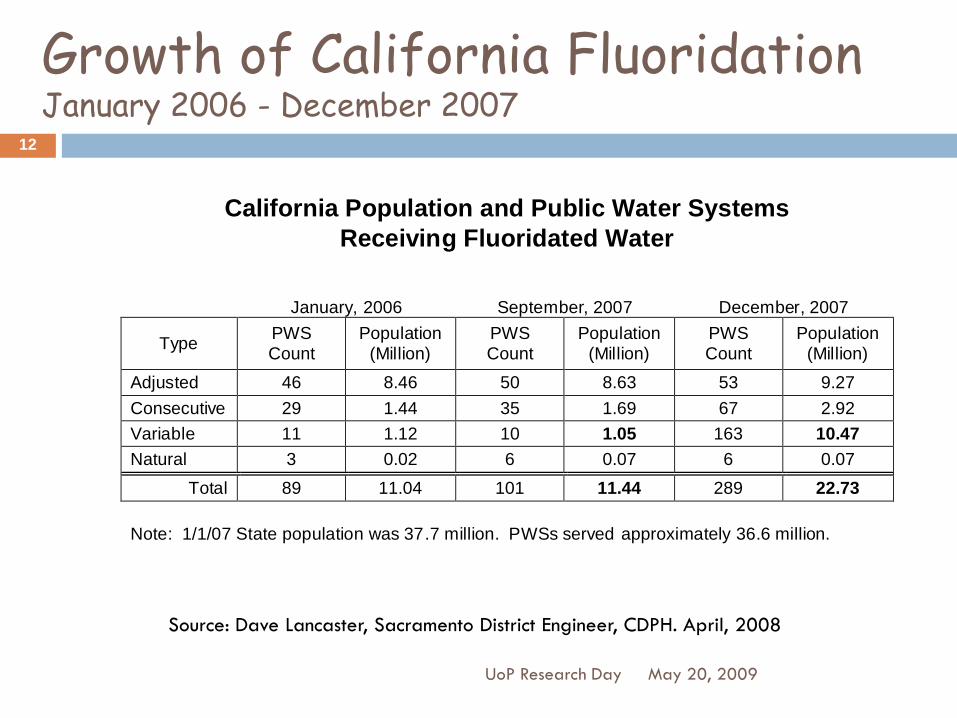
Growth of California FluoridationJanuary 2006 - December 2007
May 20, 2009UoP Research Day
12
California Population and Public Water Systems Receiving Fluoridated Water
January, 2006 September, 2007 December, 2007
Type PWS Count
Population (Million)
PWS Count
Population (Million)
PWS Count
Population (Million)
Adjusted 46 8.46 50 8.63 53 9.27 Consecutive 29 1.44 35 1.69 67 2.92 Variable 11 1.12 10 1.05 163 10.47 Natural 3 0.02 6 0.07 6 0.07
Total 89 11.04 101 11.44 289 22.73 Note: 1/1/07 State population was 37.7 million. PWSs served approximately 36.6 million.
Source: Dave Lancaster, Sacramento District Engineer, CDPH. April, 2008
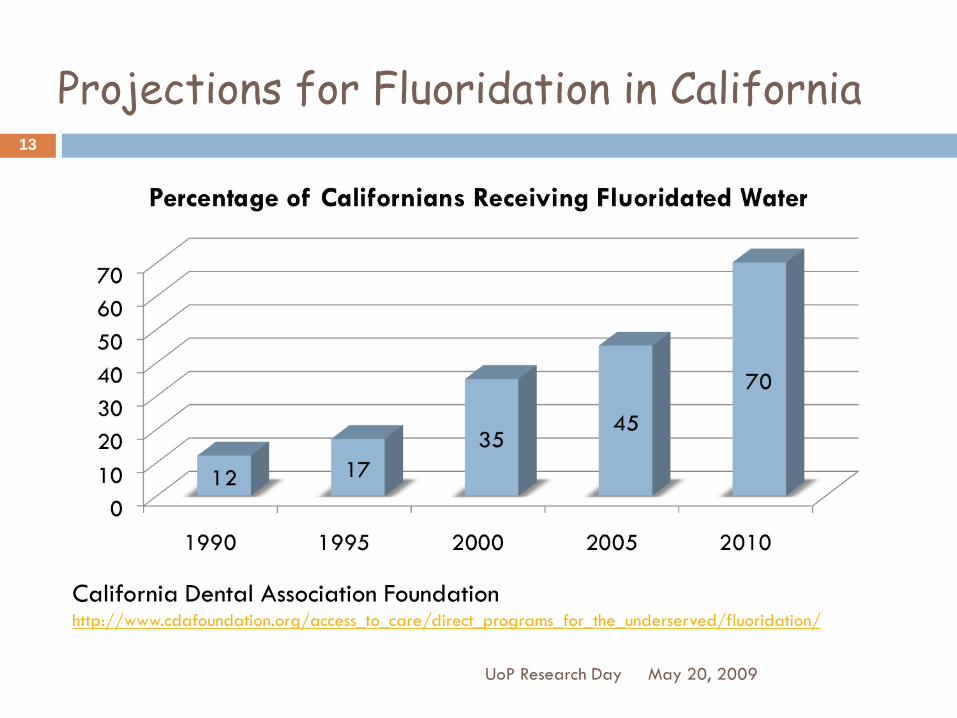
Projections for Fluoridation in California
May 20, 2009UoP Research Day
13
California Dental Association Foundationhttp://www.cdafoundation.org/access_to_care/direct_programs_for_the_underserved/fluoridation/

American Dental Association: Fluoridation Facts
www.ada.org/goto/fluoride
Centers for Disease Control & Prevention:Community Water Fluoridation
www.cdc.gov/fluoridation
Fluoridation Information:Good Resources
May 20, 2009
14
UoP Research Day

May 20, 2009UoP Research Day
15

May 20, 2009UoP Research Day
16

Latest data
Caries Prevalence in the USA:
May 20, 2009
17
UoP Research Day
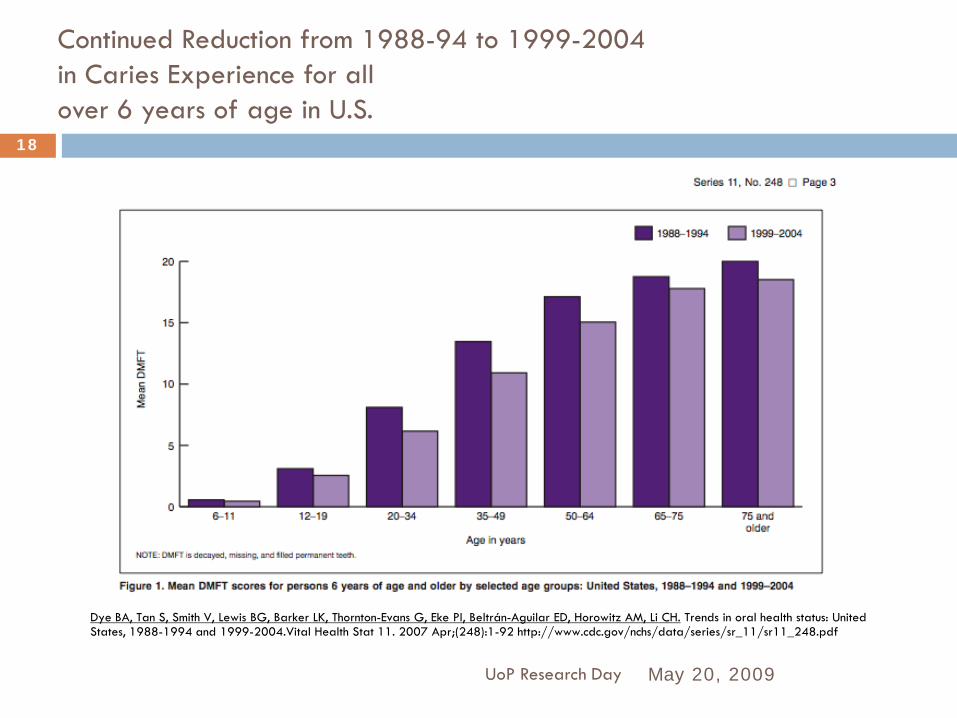
Continued Reduction from 1988-94 to 1999-2004 in Caries Experience for all over 6 years of age in U.S.
May 20, 2009UoP Research Day
18
Dye BA, Tan S, Smith V, Lewis BG, Barker LK, Thornton-Evans G, Eke PI, Beltrán-Aguilar ED, Horowitz AM, Li CH. Trends in oral health status: United States, 1988-1994 and 1999-2004.Vital Health Stat 11. 2007 Apr;(248):1-92 http://www.cdc.gov/nchs/data/series/sr_11/sr11_248.pdf
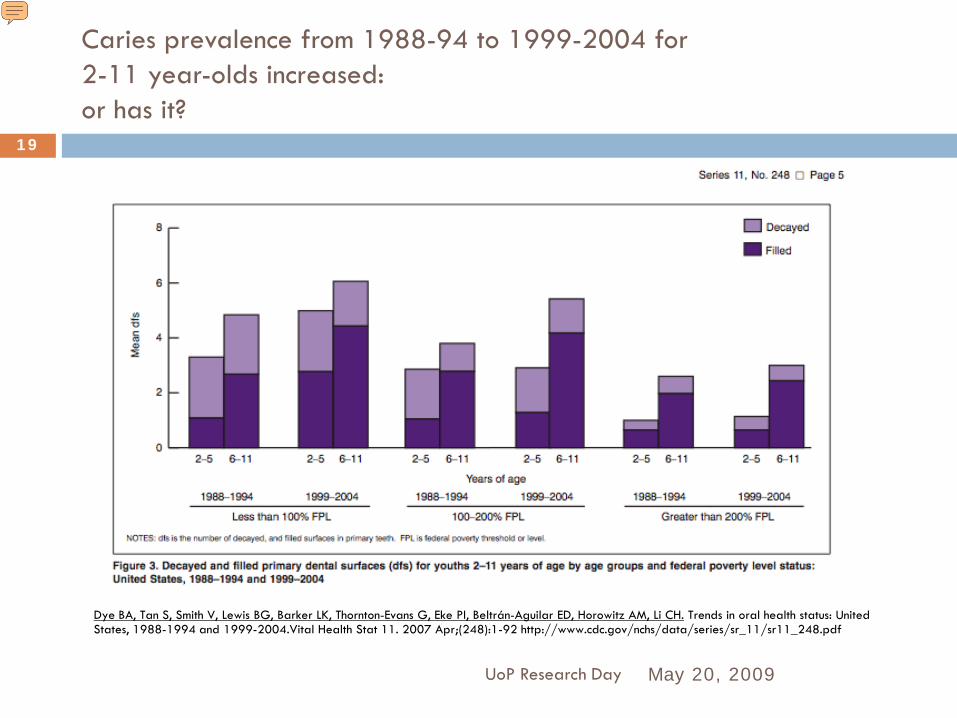
Caries prevalence from 1988-94 to 1999-2004 for 2-11 year-olds increased:or has it?
May 20, 2009UoP Research Day
19
Dye BA, Tan S, Smith V, Lewis BG, Barker LK, Thornton-Evans G, Eke PI, Beltrán-Aguilar ED, Horowitz AM, Li CH. Trends in oral health status: United States, 1988-1994 and 1999-2004.Vital Health Stat 11. 2007 Apr;(248):1-92 http://www.cdc.gov/nchs/data/series/sr_11/sr11_248.pdf
Presenter
Presentation Notes
Less untreated decay (for 2-5 yr-olds ds drop from mean 1.27 to 1.25; more treatment (mean fs increase from mean 0.87 to 1.33) for all subgroups Youths (2–11 Years) 1.Tables 5–24 present selected oral health estimates for persons aged 2–11 years. 2.Overall, the prevalence of dental caries in primary teeth (dft) increased from approximately 40% from 1988–1994 to 42% during 1999–2004 (Table 5). 3.However, among 2–5 year-olds, the prevalence of dental caries in primary teeth significantly increased from approximately 24% to 28%. 4.The prevalence of untreated primary tooth decay has remained unchanged (approximately 23%) between 1988–1994 and 1999–2004 for 2–11 year-olds (Table 6). For this age group, the mean number of decayed and filled primary teeth has significantly increased from 1.39 to 1.58 dft (Table 7). 5.Statistically significant increases were observed among males, non-Hispanic white persons, and youths living in households below 100% FPL. Similarly, the mean number of decayed and filled primary dental surfaces significantly increased from 2.94 to 3.63 from 1988–1994 to 1999–2004 (Table 8). 6.Increases were observed for all subgroups evaluated except for non-Hispanic black persons and youths living in households at or above 200% FPL. 7.Figure 2 shows the mean dfs scores for youths by the lowest and highest poverty strata and by survey period. Mean dfs scores are higher and may peak earlier in age for youths living in households less than 100% FPL compared with youths living in households greater than or equal to 200% FPL. 8.The contribution of untreated tooth decay to total number of decayed and filled primary tooth surfaces decreased for males (6.53%), Mexican Americans (12.15%), and youths living in households below 100% FPL (12.47%) (Table 9). Figure 3 shows that the difference between 1988–1994 and 1999–2004 in mean dfs scores for 2–11 year-olds varies by both age group and poverty status. 9.The prevalence of dental caries in permanent teeth (DMFT) for youths has decreased significantly from approximately 25% in 1988–1994 to 21% in 1999–2004 (Table 10). 10.The prevalence of untreated permanent tooth decay has remained nearly unchanged for all youths, except for children age 6–8 years and non-Hispanic black persons for whom the prevalence declined from 2.4% and 4.5%, respectively, from 1988–1994 to 1999–2004 (Table 11). 11.Overall, DMFT and DMFS declined in permanent teeth for youths during the same period (Tables 12, 13). The prevalence of dental sealants on permanent teeth among all youths significantly increased from approximately 22% in 1988–1994 to 30% in 1999–2004 (Table 15). This increase was observed for all subgroups evaluated except youths aged 6–8 years

Continued Reduction in DMFT and Extracted Teeth from 1988-94 to 1999-2004 for adults in U.S.
May 20, 2009UoP Research Day
20
Dye BA, Tan S, Smith V, Lewis BG, Barker LK, Thornton-Evans G, Eke PI, Beltrán-Aguilar ED, Horowitz AM, Li CH. Trends in oral health status: United States, 1988-1994 and 1999-2004.Vital Health Stat 11. 2007 Apr;(248):1-92 http://www.cdc.gov/nchs/data/series/sr_11/sr11_248.pdf
Presenter
Presentation Notes
Less untreated decay (for 2-5 yr-olds ds drop from mean 1.27 to 1.25; more treatment (mean fs increase from mean 0.87 to 1.33) for all subgroups Youths (2–11 Years) 1.Tables 5–24 present selected oral health estimates for persons aged 2–11 years. 2.Overall, the prevalence of dental caries in primary teeth (dft) increased from approximately 40% from 1988–1994 to 42% during 1999–2004 (Table 5). 3.However, among 2–5 year-olds, the prevalence of dental caries in primary teeth significantly increased from approximately 24% to 28%. 4.The prevalence of untreated primary tooth decay has remained unchanged (approximately 23%) between 1988–1994 and 1999–2004 for 2–11 year-olds (Table 6). For this age group, the mean number of decayed and filled primary teeth has significantly increased from 1.39 to 1.58 dft (Table 7). 5.Statistically significant increases were observed among males, non-Hispanic white persons, and youths living in households below 100% FPL. Similarly, the mean number of decayed and filled primary dental surfaces significantly increased from 2.94 to 3.63 from 1988–1994 to 1999–2004 (Table 8). 6.Increases were observed for all subgroups evaluated except for non-Hispanic black persons and youths living in households at or above 200% FPL. 7.Figure 2 shows the mean dfs scores for youths by the lowest and highest poverty strata and by survey period. Mean dfs scores are higher and may peak earlier in age for youths living in households less than 100% FPL compared with youths living in households greater than or equal to 200% FPL. 8.The contribution of untreated tooth decay to total number of decayed and filled primary tooth surfaces decreased for males (6.53%), Mexican Americans (12.15%), and youths living in households below 100% FPL (12.47%) (Table 9). Figure 3 shows that the difference between 1988–1994 and 1999–2004 in mean dfs scores for 2–11 year-olds varies by both age group and poverty status. 9.The prevalence of dental caries in permanent teeth (DMFT) for youths has decreased significantly from approximately 25% in 1988–1994 to 21% in 1999–2004 (Table 10). 10.The prevalence of untreated permanent tooth decay has remained nearly unchanged for all youths, except for children age 6–8 years and non-Hispanic black persons for whom the prevalence declined from 2.4% and 4.5%, respectively, from 1988–1994 to 1999–2004 (Table 11). 11.Overall, DMFT and DMFS declined in permanent teeth for youths during the same period (Tables 12, 13). The prevalence of dental sealants on permanent teeth among all youths significantly increased from approximately 22% in 1988–1994 to 30% in 1999–2004 (Table 15). This increase was observed for all subgroups evaluated except youths aged 6–8 years
Quote from Brian Burt:Fluoridation and Social Equity
Summary and Conclusion
May 20, 2009
21
UoP Research Day

FLUORIDATION AND SOCIAL EQUITY
J Public Health Dent. 2002 Fall; 62(4): 195-200. The overall reduction in caries prevalence and severity in the United States over recentdecades is largely due to widespread exposure to fluoride, most notably from thefluoridation of drinking waters. Despite this overall reduction, however, caries distributiontoday remains skewed, with the poor and deprived carrying a disproportionate share of thedisease burden. Dental caries, like many other diseases, is directly related to lowsocioeconomic status (SES). In some communities, however, caries experience has nowdiminished to the point where the need for continuing water fluoridation is beingquestioned. This paper argues that water fluoridation is still needed because it is the mosteffective and practical method of reducing the SES-based disparities in the burden of dentalcaries. There is no practical alternative to water fluoridation for reducing these disparities inthe United States. For example, a school dental service, like those in many other high-income countries, would require the allocation of substantial public resources, and as suchis not likely to occur soon. But studies in the United States, Britain, Australia, and NewZealand have demonstrated that fluoridation not only reduces the overall prevalence andseverity of caries, but also reduces the disparities between SES groups. Water fluoridationhas been named as one of the 10 major public health achievements of the 20th century bythe Centers for Disease Control and Prevention, and promoting it is a Healthy Peopleobjective for the year 2010. Within the social context of the United States, waterfluoridation is probably the most significant step we can take toward reducing thedisparities in dental caries. It therefore should remain as a public health priority.
Brian Burt

California Oral Health Needs Assessment of Children, 1993-94High Schools: Dental Fluorosis
Fluorosis Codes
0 = Normal
1 = Questionable
2 = Very mild
3 = Mild
4 = Moderate
5 = Severe
May 20, 2009UoP Research Day
23
Edwin Bringas
Stamp

California Oral Health Needs Assessment of Children, 1993-94
High Schools: Periodontal Conditions Community Periodontal Index of Treatment Needs (CPITN)
High School Students
0 = Healthy
1 = Bleeding observed after probing
2 = Calculus felt during probing but all the black area of the probe visible
3 = Pocket 4-5 mm (gingival margin situated on black area of probe)
4 = Pocket >6 mm (black area of probe not visible)
May 20, 2009UoP Research Day
24

California Oral Health Needs Assessment of Children, 1993-94: High Schools: Orthodontic Needs
May 20, 2009UoP Research Day
25
Orthodontic Needs WHO Index 1987
0 = None
1 = In treatment (fixed or removable)
2 = Mild needs (one or more rotated or tilted teeth or slight crowding or spacing, which disturb the regular alignment of the teeth)
3 = Moderate-severe needs including the presence of one or more of the following conditions of the incisors maxillary overjet 9mm or >9 mm; mandibular overjet/anterior crossbite equal to or greater than a full tooth depth; open bite; midline shift >4mm; crowding or spacing >4mm
Community Water FluoridationHealth Effects and Current Issues
Howard Pollick, BDS, MPH
Clinical Professor
School of Dentistry
University of California San Francisco
8/5/09
1
Presentation at the San Jose Water Company, August 5, 2009
Updated for the UCSF DPH Seminar, 10/6/09

OEHHA recently announced its intention to review fluoride
• OEHHA is the lead agency for the implementation of the California Safe Drinking Water and Toxic Enforcement Act of 1986, and periodically screens candidate chemicals for inclusion in the Proposition 65 list of chemicals.
• Fluoride was identified, along with 37 other compounds, from a total of 80, principally because of
• “its important widespread use,” as characterized by the chair of the committee, Thomas Mack, MD, MPH.
• Dr. Mack also noted on behalf of the committee that ranking a compound as a high priority for review in no way indicates that it is carcinogenic.
• http://www.oehha.ca.gov/prop65/public_meetings/pdf/cicMeetingTranscipt052909.pdf
• http://www.oehha.ca.gov/prop65/public_meetings/052909coms/fluoride/CDAFluoride.pdf
• http://www.cda.org/library/cda_member/pubs/update0609/fluoride.htm
8/5/09 2

Public Health Goal for FLUORIDE in Drinking Water - 1 mg/L (1 ppm)
Office of Environmental Health Hazard Assessment, CA EPA (1997)• A Public Health Goal (PHG) of 1 ppm (1,000 ppb) is developed for fluoride in
drinking water. • This level is intended to be an approximate year-round average. • The U.S. Environmental Protection Agency’s (U.S. EPA’s) Maximum Contaminant
Level (MCL) for fluoride is 4 mg/L. (to protect against crippling skeletal fluorosis)• Secondary MCL of 2 mg/L (to protect against dental fluorosis)• Moderate to severe dental fluorosis is rare when the drinking water fluoride level
is in the range of 1 mg/L, but begins to become significant at concentrations close to 2 mg/L.
• The PHG is based on a no-observed- adverse-effect-level (NOAEL) of 1 mg/L for dental fluorosis in children.
• This level is judged to be the optimum level for reducing the prevalence of dental fluorosis while providing protection against dental caries.
• http://www.oehha.ca.gov/water/phg/pdf/fluor_c.pdf
8/5/09 3

Public Health Goal for FLUORIDE in Drinking Water - 1 mg/L (1 ppm)
• Office of Environmental Health Hazard Assessment, CA EPA (June 2006)
• “Our review has not identified data that appear likely to result in substantive changes to the risk assessment methodology or the conclusions reached in the 1997 PHG report for fluoride, although substantial updating of the animal toxicology and human cancer sections appear to be needed.”
• http://www.oehha.ca.gov/water/phg/pdf/PHGinitiation0606.pdf
8/5/09 4
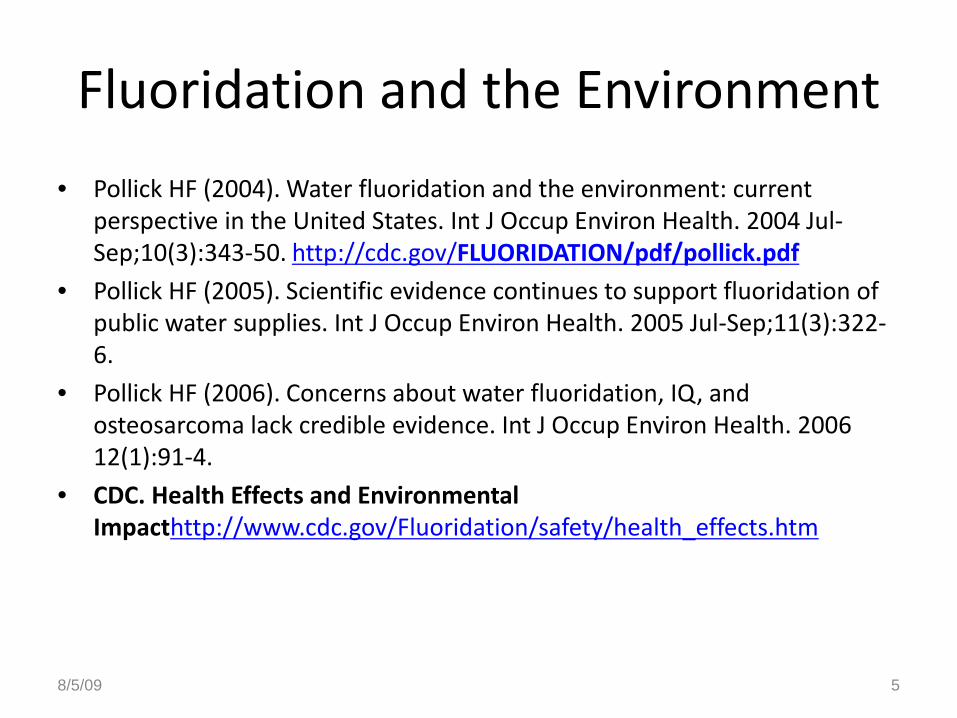
Fluoridation and the Environment
• Pollick HF (2004). Water fluoridation and the environment: current perspective in the United States. Int J Occup Environ Health. 2004 Jul-Sep;10(3):343-50. http://cdc.gov/FLUORIDATION/pdf/pollick.pdf
• Pollick HF (2005). Scientific evidence continues to support fluoridation of public water supplies. Int J Occup Environ Health. 2005 Jul-Sep;11(3):322-6.
• Pollick HF (2006). Concerns about water fluoridation, IQ, and osteosarcoma lack credible evidence. Int J Occup Environ Health. 2006 12(1):91-4.
• CDC. Health Effects and Environmental Impacthttp://www.cdc.gov/Fluoridation/safety/health_effects.htm
8/5/09 5

Suboptimal fluoridation
Within a community, one household may receive fluoridated water, while the one across the street does not. This is common where there is no central supply to all households in a community, which may be served by more than one water district, or more than one source where not all sources are fluoridated within a water district.
Due to the diffusion effect (people eat/drink at their neighbor’s house or at a restaurant or school or workplace, or purchase foods and beverages that are grown or manufactured with a fluoridated water source) there is an average effect and benefit of fluoridation across the community that is not 100% fluoridated.
A community may be a neighborhood, a town or city, a county or a state or region.
Studies have shown that where 75% of a community is fluoridated, the diffusion effect accounts for the fact that everyone benefits to a similar extent, although they would have benefitted more if there was closer to 100% fluoridation. 8/5/09
6
Target concentration of fluoride in water with an acceptable range. However, some districts provide a lower than target concentration (suboptimal).

WATER FLUORIDATION NOTICE
• October 2007 The California Department of Public Health (CDPH) recommends suspending prescription fluoride supplements for one year in areas served by the Metropolitan Water District of Southern California. http://www.cda.org/library/pdfs/fluoridation_notification.pdf
8/5/09 7

Data on fluoridation from the California Department of Public Health
8/5/09 8
[c]....Water system receives fluoridated water from PWS ID 3810001 (100%). Listed Fluoride levels are from this system. [i]…..Water system receives fluoridated water from PWS ID 3810001 and uses non-fluoridated water sources. Contact the water system for detailed fluoride level information. http://www.cdph.ca.gov/certlic/drinkingwater/Documents/Fluoridation/Fluoridationdatafor2008.pdf
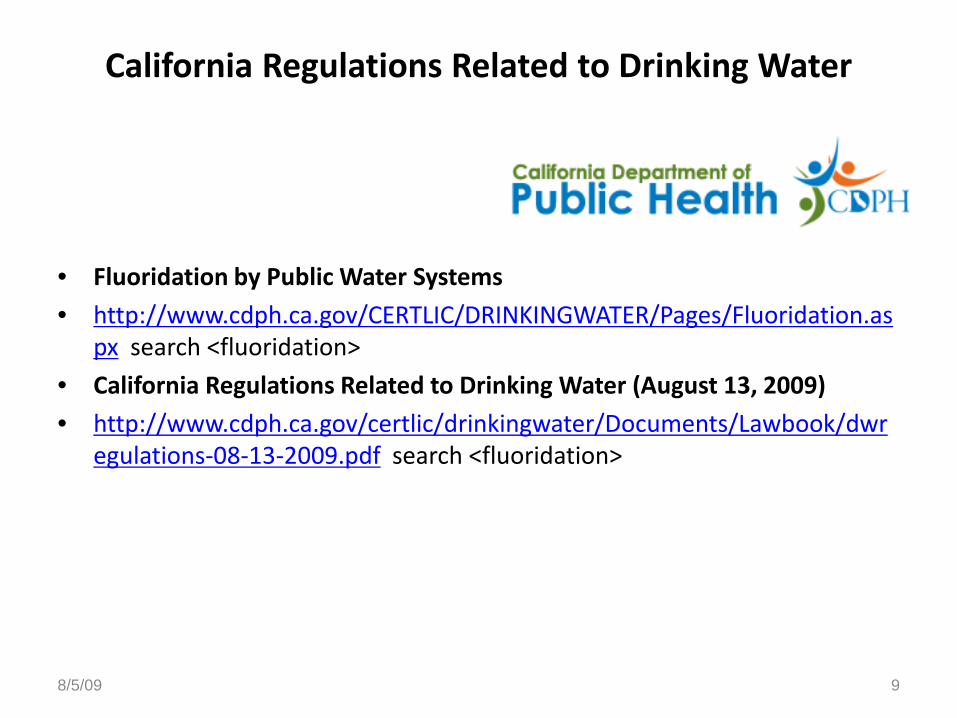
California Regulations Related to Drinking Water
• Fluoridation by Public Water Systems
• http://www.cdph.ca.gov/CERTLIC/DRINKINGWATER/Pages/Fluoridation.aspx search <fluoridation>
• California Regulations Related to Drinking Water (August 13, 2009)
• http://www.cdph.ca.gov/certlic/drinkingwater/Documents/Lawbook/dwregulations-08-13-2009.pdf search <fluoridation>
8/5/09 9
National Fluoridation Symposium 2005 10
Safety of Water Fluoridation
Total intake and Margin of Safety• Children up to age 8 years living in fluoridated areas
or receiving fluoride supplements (0.5 mg to 1.0 mg per day) have a 1.5 to 3-fold margin of safety for moderate or severe dental fluorosis.
• Older children and adults living in fluoridated areas have a margin of safety for pre-clinical and clinical stages of skeletal fluorosis 4- to 8-fold and 10-fold respectively
• Kaminsky LS, Mahoney MC, Leach J, Melius J, Miller MJ. Fluoride: benefits and risks of exposure. Crit Rev Oral Biol Med. 1990;1(4):261-81
To
tal
Inta
ke
Presenter
Presentation Notes
As suggested by the graph of fluoride, caries and fluorosis, the Kaminsky report indicated that children up to age 8 years living in fluoridated areas or receiving fluoride supplements (0.5 mg to 1.0 mg per day) have a 1.5 to 3-fold margin of safety for moderate or severe dental fluorosis. Older children and adults living in fluoridated areas have a margin of safety for pre-clinical and clinical stages of skeletal fluorosis 4- to 8-fold and 10-fold respectively. There are some who like to see a larger margin of safety; however, these are the particular and unique facts about fluoride. All the more important to regulate and control the fluoride concentration in water.
National Fluoridation Symposium 2005 11
Safety of Water Fluoridation
Fluoride Intake and Skeletal Fluorosis
• Extensive reviews of the scientific literature revealed no adverse effects unless fluoride intakes were greater than 10 mg/day for 10 or more years.
• At these high, chronic intake levels, the risk of skeletal changes consistent with preclinical or stage 1 skeletal fluorosis increases.
• Standing Committee on the Scientific Evaluation of Dietary Reference Intakes, Food and Nutrition Board, Institute of Medicine (1999). Dietary reference intakes for calcium, phosphorus, magnesium, vitamin D, and fluoride. Washington, D.C.: National Academy Press. Available at http://books.nap.edu/books/0309063507/html/288.html#pagetop
To
tal
Inta
ke
Presenter
Presentation Notes
Extensive reviews of the scientific literature have revealed no adverse effects unless fluoride intakes were greater than 10 mg/day for 10 or more years (Kaminsky et al., 1990; NRC, 1993; USPHS, 1991). At these high, chronic intake levels, the risk of skeletal changes consistent with preclinical or stage 1 skeletal fluorosis increases.
National Fluoridation Symposium 2005 12
Safety of Water FluoridationTotal Intake and Enamel Fluorosis
• The Tolerable Upper Intake Level for children under 8 years of age (0.1 mg/kg/day) is exceeded by approximately 1 in 100 children in areas where the water fluoride concentration is 1.0 mg/liter or slightly higher
• In the 1930s and 1940s, no moderate or severe cases of enamel fluorosis were recorded in these areas
• Fluoride intake from water and the diet appears not to have increased since that time
• Additional intake by children at risk of enamel fluorosis almost certainly derives from the use of fluoride-containing dental products (toothpaste, prescription supplements)
• Institute of Medicine 1999
To
tal
Inta
ke
Presenter
Presentation Notes
The 1999 IoM report established the Tolerable Upper Intake Level for children under 8 years of age which is 0.1 mg/kg/day. In recent years, that level is exceeded by approximately 1 in 100 children in areas where the water fluoride concentration is 1.0 mg/liter or slightly higher. In the 1930s and 1940s, no moderate or severe cases of enamel fluorosis were recorded in these areas. Since fluoride intake from water and the diet appears not to have increased since that time, additional intake by children at risk of enamel fluorosis almost certainly derives from the use of fluoride-containing dental products, namely fluoride toothpaste and prescription supplements.
National Fluoridation Symposium 2005 13
Safety of Water Fluoridation
Dietary fluoride intakes by adultsfrom food, water and beverages
• where concentration is 1.0 ppm F in water– range from 1.4 to 3.4 mg fluoride per day
• where concentration is less than 0.3 ppm F
– range from 0.3 to 1.0 mg/day
• Institute of Medicine 1999
To
tal
Inta
ke
Presenter
Presentation Notes
The Dietary fluoride intakes by adults from food, water and beverages where the concentration is 1.0 ppm F in water, range from 1.4 to 3.4 mg fluoride per day; while where concentration is less than 0.3 ppm F, the total intake ranges from 0.3 to 1.0 mg/day. Average water consumption is about a liter a day, so the increase in fluoridated areas is not from water alone but from foods and beverages grown and processed with fluoridated water. How does this compare with an adequate fluoride intake or a tolerable upper limit?

National Fluoridation Symposium 2005 14
Total Fluoride Intake
Institute of Medicine, 1999Table from http://www.ada.org - Dietary Reference Intakes for Fluoride
Presenter
Presentation Notes
Here is the IoM recommended dietary reference intakes for fluoride. This table is taken from the ADA web site. You can see that the Adequate Intake and Tolerable Upper Intake on the right hand columns vary according to weight, which is translated into the age of children and gender of adolescents and adults. The principal reason for different intakes are the weights and that after 8 years of age we are no longer concerned with enamel fluorosis since the crowns of the permanent teeth have been formed by that age and no further enamel fluorosis is possible. Infants and children under 5 years of age consume about a half a liter of water (if they are not breast-fed or drinking milk). This would equate to about 0.5 mg of fluoride per day in a fluoridated community. This is less than the tolerable upper intake and conforms to the adequate intake. The window of opportunity for the upper incisors to develop enamel fluorosis is between 18 months and 3 years of age, and it is highly unlikely that their total diet is fluoridated water.
National Fluoridation Symposium 2005
15
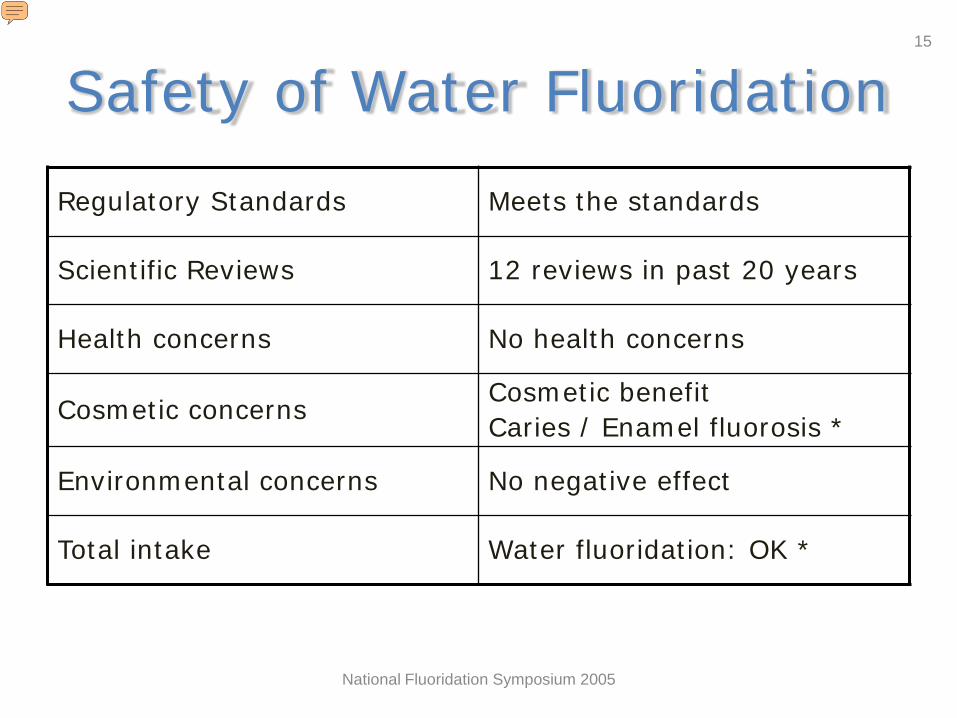
Safety of Water Fluoridation
Regulatory Standards Meets the standards
Scientific Reviews 12 reviews in past 20 years
Health concerns No health concerns
Cosmetic concernsCosmetic benefitCaries / Enamel fluorosis *
Environmental concerns No negative effect
Total intake Water fluoridation: OK *
* Concerns with compliance with Rx F Supplements, Toothpaste supervision
Presenter
Presentation Notes
So in summary, water fluoridation meets the regulatory standards; there have been a dozen scientific reviews of the literature on water fluoridation in the past 20 years demonstrating that there are no health concerns with water fluoridation. There is a cosmetic benefit when considering that water fluoridation does not lead to moderate or severe enamel fluorosis and prevents disfiguring tooth decay. No negative effects of water fluoridation on the environment have been found and that when considering the total intake of fluoride fluoridated water is safe. Finally a note about other sources of fluoride intake. While recommending the daily use of a pea-sized amount of fluoride toothpaste in supervised brushing by young children, we remain concerned about young children swallowing too much fluoride toothpaste. We are also concerned that fluoride supplements by prescribed and taken as recommended in non-fluoridated communities to prevent tooth decay and prevent dental fluorosis.
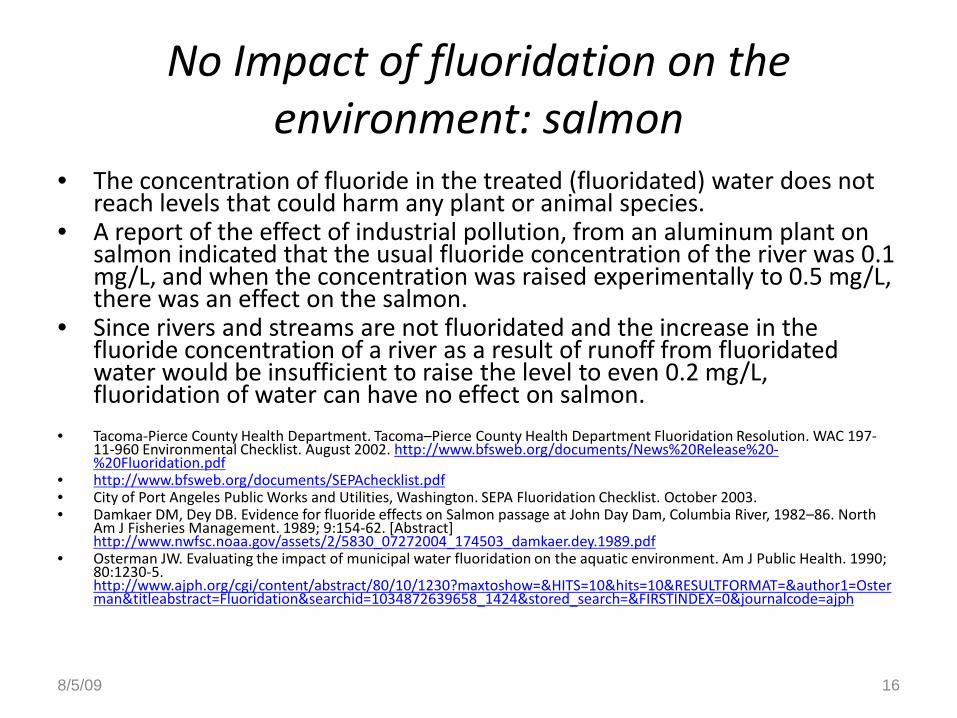
No Impact of fluoridation on the environment: salmon
• The concentration of fluoride in the treated (fluoridated) water does not reach levels that could harm any plant or animal species.
• A report of the effect of industrial pollution, from an aluminum plant on salmon indicated that the usual fluoride concentration of the river was 0.1 mg/L, and when the concentration was raised experimentally to 0.5 mg/L, there was an effect on the salmon.
• Since rivers and streams are not fluoridated and the increase in the fluoride concentration of a river as a result of runoff from fluoridated water would be insufficient to raise the level to even 0.2 mg/L, fluoridation of water can have no effect on salmon.
• Tacoma-Pierce County Health Department. Tacoma–Pierce County Health Department Fluoridation Resolution. WAC 197-11-960 Environmental Checklist. August 2002. http://www.bfsweb.org/documents/News%20Release%20-%20Fluoridation.pdf
• http://www.bfsweb.org/documents/SEPAchecklist.pdf• City of Port Angeles Public Works and Utilities, Washington. SEPA Fluoridation Checklist. October 2003.• Damkaer DM, Dey DB. Evidence for fluoride effects on Salmon passage at John Day Dam, Columbia River, 1982–86. North
Am J Fisheries Management. 1989; 9:154-62. [Abstract] http://www.nwfsc.noaa.gov/assets/2/5830_07272004_174503_damkaer.dey.1989.pdf
• Osterman JW. Evaluating the impact of municipal water fluoridation on the aquatic environment. Am J Public Health. 1990; 80:1230-5. http://www.ajph.org/cgi/content/abstract/80/10/1230?maxtoshow=&HITS=10&hits=10&RESULTFORMAT=&author1=Osterman&titleabstract=Fluoridation&searchid=1034872639658_1424&stored_search=&FIRSTINDEX=0&journalcode=ajph
8/5/09 16

Why are you putting medicine in my water?
• Fluoridation of water supplies is the adjustment of the naturally occurring level of fluoride in water to what has been found to be the optimal concentration for minimal tooth decay and minimal dental fluorosis in a community.
• Many water supplies actually have more fluoride naturally occurring than what is recommended; unfortunately, many more have much less.
• One of the purposes of a public water supply is to protect the public health of a community.
• In this regard, water could be described as “medicine”, though I hardly think most people think of water as medicine.
• Yet water will relieve and is used to treat thirst and dehydration. • An optimal concentration of fluoride in the water is not considered as “medicine”
either, but rather what our bodies need to help maintain optimal dental health.• While the dose of water that each individual consumes varies according to a
variety of factors, there has been no conclusive evidence of harm from fluoridated water.
• Each community decides through its representatives or electorate whether it wants fluoridation. So if government is for the people by the people, then the government has every right to dispense what the people want.
8/5/09 17

Comparing Annual Costs (1999 $)per person of different methods of fluoride use
Fluoride Mode Annual cost / person People benefitting
Water fluoridation (all costs) $0.72 ($0.17 - $7.62)
All ages, all groups
Fluoride toothpaste $6 - $12 All ages, all groups
Fluoride mouthrinseschool-based programs not including personnel/indirect costs
$1.41 Schoolchildren (>6 years)(High caries risk)
Prescription Dietary Fluoride Supplements $37 Ages 6 month to 16 years
(Poor compliance)
Professional topical fluoride application
$66(twice/year)
High caries risk
March 12, 2009 18
Centers for Disease Control and Prevention. Recommendations for using fluoride to prevent and control dental caries in the United States. MMWR Recomm Rep. 2001 Aug 17;50(RR-14):1-42.
Available at http://www.cdc.gov/fluoridation/fact_sheets/fl_caries.htm
Presenter
Presentation Notes
Water fluoridation is by far the most economical method of providing recommended fluoride levels to everyone in the community. Here are some cost estimates for different methods of fluoride use: Fluoridation $0.72 Fluoride toothpaste $6 -12 Fluoride Mouth Rinse $1.41; Prescription Dietary Fluoride Supplements $37 Professional topical fluoride application $66 (2/yr)

American Public Health Association Community Water Fluoridation in the US
Updated policy: 2008
• http://www.apha.org/advocacy/policy/policysearch/default.htm?id=1373
• This position paper provides updated evidence for the many supportive policies held by the American Public Health Association (APHA) on community water fluoridation (CWF). This position paper provides the scientific basis and justification for the importance of continuing to support CWF for our nation’s public water supplies. It also emphasizes the critical role that public health practitioners, health care professionals, and policymakers can play with respect to this important public health practice.
• 140 references
March 12, 2009 19
Presenter
Presentation Notes
American Public Health Association: Community Water Fluoridation in the US: Updated policy: 2008 This position paper provides updated evidence for the many supportive policies held by the American Public Health Association (APHA) on community water fluoridation (CWF). This position paper provides the scientific basis and justification for the importance of continuing to support CWF for our nation’s public water supplies. It also emphasizes the critical role that public health practitioners, health care professionals, and policymakers can play with respect to this important public health practice. 140 references

Excellent Resources
• American Dental Association Fluoridation Facts• www.ada.org/goto/fluoride
• CDC• http://www.cdc.gov/Fluoridation/
• AWWA• http://www.awwa.org/files/about/OandC/PolicyS
tatements/2009Fluoridation.pdf
March 12, 2009 20

Additional Resources
• Santa Clara Dental Society• http://www.sccds.org/public/Keytooralhealth/oralhe
althtopicsAZ/F/fluoridation.asp• The Health Trust• http://www.healthtrust.org/services/dental/oralheal
th.php• Have your patient check their water bill for the name
of your patient’s water supplier and request the latest water quality report for fluoride concentration online or by phone.
March 12, 2009 21
March 12, 2009 22
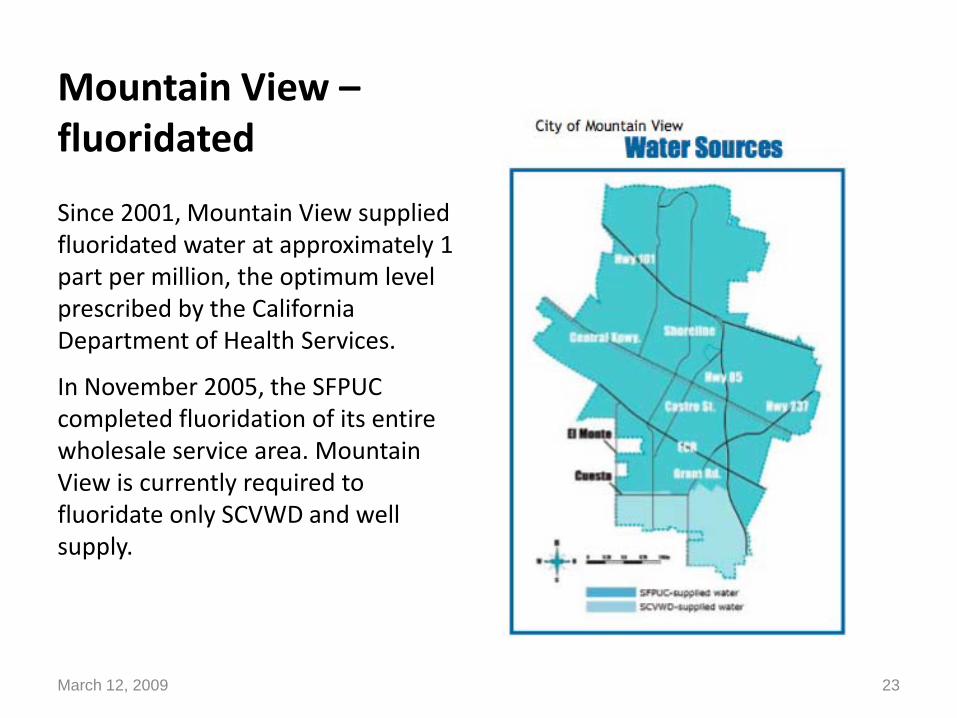
Mountain View –fluoridated
Since 2001, Mountain View supplied fluoridated water at approximately 1 part per million, the optimum level prescribed by the California Department of Health Services.
In November 2005, the SFPUC completed fluoridation of its entire wholesale service area. Mountain View is currently required to fluoridate only SCVWD and well supply.
March 12, 2009 23
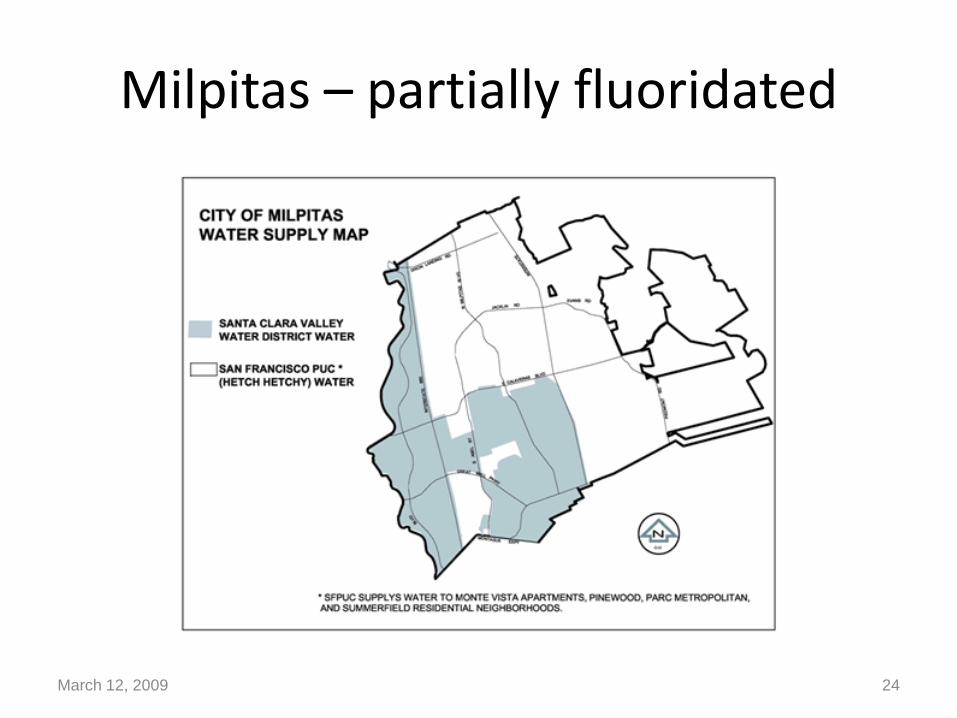
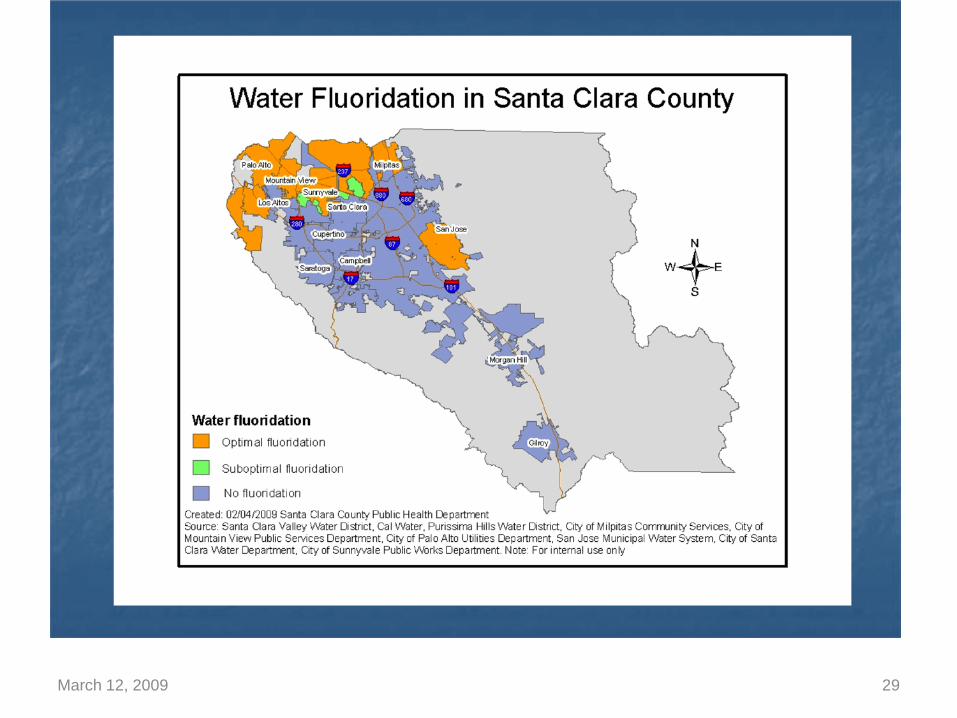
Milpitas – partially fluoridated
March 12, 2009 24
San Jose Mercury News Editorial: Fluoridating Santa Clara County's water supply is overdue
• Posted: 02/15/2009 08:00:00 PM PST
• Only one of the 10 largest cities in America is so backward that it does not fluoridate its water.
• That would be San Jose, whose residents should be embarrassed that their city doesn't provide one of the most basic services to improve public health.
• Liz Kniss, a registered nurse and president of the Santa Clara County Board of Supervisors, understands that tooth decay is a serious problem throughout the county. She wants to work with the Health Trust — the valley foundation that makes grants to innovative and effective health care programs — to make fluoridating Santa Clara County's drinking water a reality by 2015, without seeking public money.
March 12, 2009 25
San Jose Mercury News Editorial: Fluoridating Santa Clara County's water supply is overdue
• Posted: 02/15/2009 08:00:00 PM PST
• The public health payoff for fluoridation is huge, especially for children. All city and county officials should get behind the goal.
• Fluoridating drinking water is regarded as one of the top 10 public health advancements of the 20th century. It has the support of the Centers for Disease Control, the World Health Organization, American Medical Association and the Santa Clara County Public Health Department.
• A vocal minority fights fluoridation, despite a lack of credible scientific evidence against it. Public officials need to stand up to opponents.
March 12, 2009 26
S.J. city water utility does indeed fluoridate
• From Mercury News readersPosted: 02/20/2009 07:07:54 PM PST
The Mercury News (Editorial, Feb. 16) erroneously implied that the city of San Jose does not provide fluoridated water to our residents. To set the record straight, the city of San Jose does fluoridate the water it provides to all of the residents we serve through the municipal water utility. It is the private water supply companies serving the remainder of the city that do not currently do so. The city's water utility serves more than 120,000 (12 percent of the city's population) in Evergreen, North San Jose and Alviso. Evergreen residents have been drinking fluoridated water since 1965, and residents and businesses in North San Jose and Alviso started receiving it in November 2005. The city continues to recognize and support the benefits of fluoridation and its role in preventing tooth decay.
John Stufflebean
Director Environmental Services Department City of San Jose
March 12, 2009 27
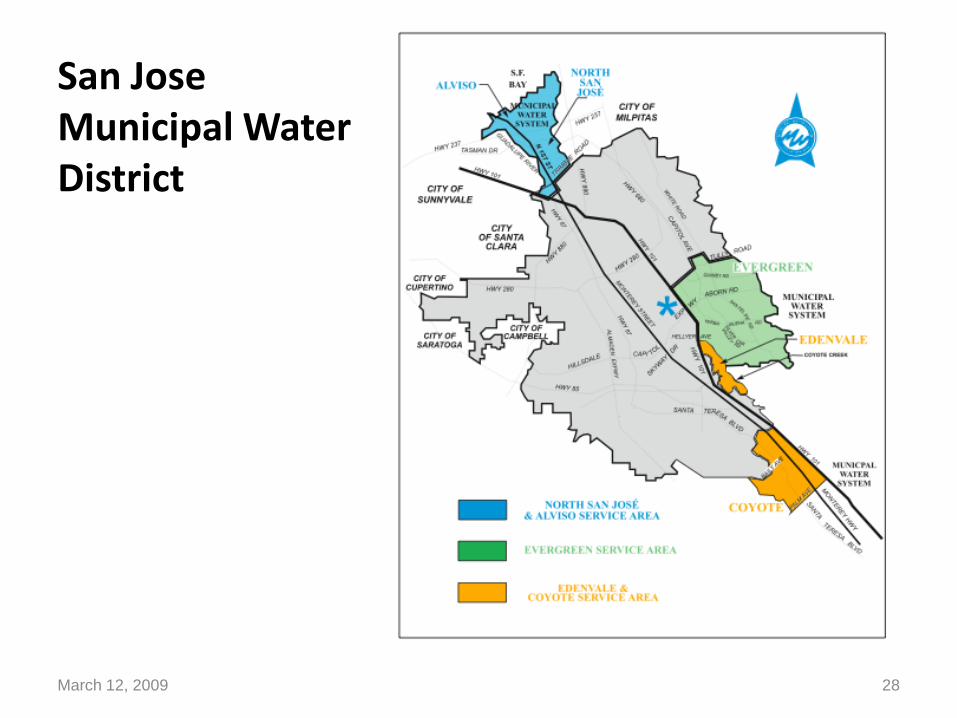
San Jose Municipal Water District
March 12, 2009 28
March 12, 2009 29

March 12, 2009 30
Other presentations by Dr. Pollick available on the Internet:
• http://www.nationaloralhealthconference.com/docs/presentations/2009/0422/Water%20Fluoridation%20Debating%20-%20Howard%20Pollick.pdf
• www.cdph.ca.gov/programs/Documents/Howard%20Pollick.ppt
• What is the evidence that fluoride works to prevent dental caries? http://www.oralhealth.ro/doc/V2-2004/V2-04-1.pdf
Questions?
March 12, 2009 31

Related Documents