Investor Presentation September 2013

Welcome message from author
This document is posted to help you gain knowledge. Please leave a comment to let me know what you think about it! Share it to your friends and learn new things together.
Transcript
Investor Presentation
September 2013
Forward Looking Statements
Some of the information in this news release may contain forward-looking statements within the meaning of Section 27A of the Securities Act of 1933, as amended, and Section 21E of the Securities Exchange Act of 1934, as amended (the “Exchange Act”). Forward-looking statements give our current expectations and may contain projections of results of operations or of financial condition, or forecasts of future events. Words such as “may,” “assume,” “forecast,” “position,” “predict,” “strategy,” “expect,” “intend,” “plan,” “estimate,” “anticipate,” “could,” “believe,” “project,” “budget,” “potential,” or “continue,” and similar expressions are used to identify forward-looking statements. They can be affected by assumptions used or by known or unknown risks or uncertainties. Consequently, no forward-looking statements can be guaranteed. When considering these forward-looking statements, you should keep in mind the risk factors and other cautionary statements in Hi-Crush’s reports filed with the Securities and Exchange Commission (“SEC”), including those described under Item 1A of Hi-Crush’s Form 10-K for the fiscal year ended December 31, 2012 and any subsequently filed Form 10-Q. Actual results may vary materially. You are cautioned not to place undue reliance on any forward-looking statements. You should also understand that it is not possible to predict or identify all such factors and should not consider the risk factors in our reports filed with the SEC or the following list to be a complete statement of all potential risks and uncertainties. Factors that could cause our actual results to differ materially from the results contemplated by such forward-looking statements include: the volume of frac sand we are able to sell; the price at which we are able to sell frac sand; the outcome of any pending litigation; changes in the price and availability of natural gas or electricity; changes in prevailing economic conditions; and difficulty collecting receivables. All forward-looking statements are expressly qualified in their entirety by the foregoing cautionary statements. Hi-Crush’s forward-looking statements speak only as of the date made and Hi-Crush undertakes no obligation to update or revise its forward-looking statements, whether as a result of new information, future events or otherwise.
2
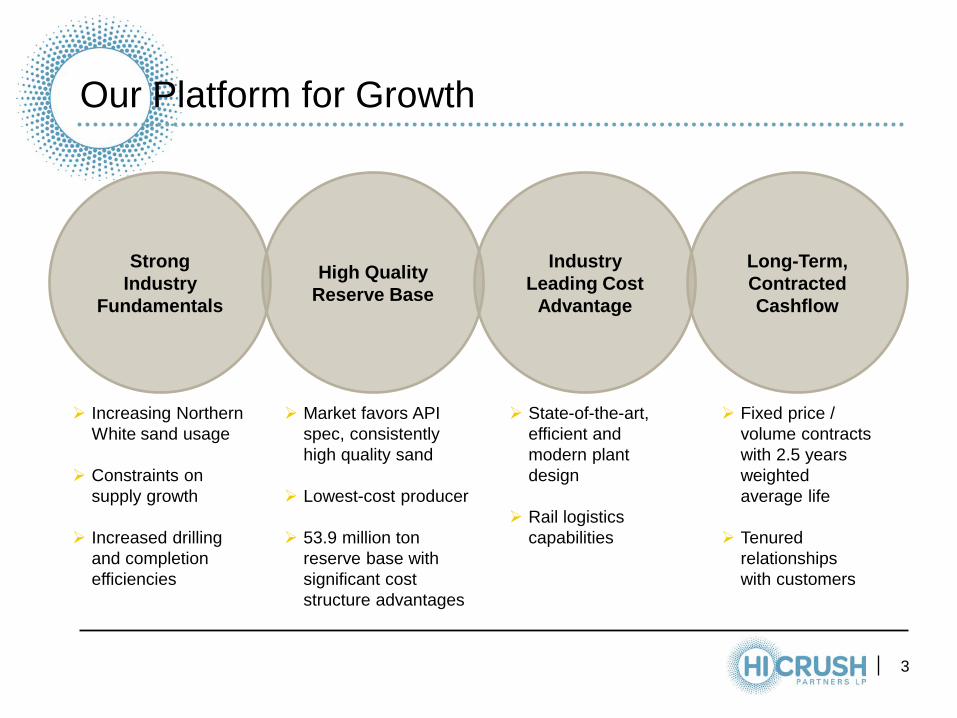
Our Platform for Growth
3
Increasing Northern White sand usage
Constraints on supply growth
Increased drilling and completion efficiencies
Market favors API spec, consistently high quality sand
Lowest-cost producer
53.9 million ton reserve base with significant cost structure advantages
Fixed price / volume contracts with 2.5 years weighted average life
Tenured relationships with customers
Strong Industry
Fundamentals
High Quality Reserve Base
Industry Leading Cost
Advantage
Long-Term, Contracted Cashflow
State-of-the-art, efficient and modern plant design
Rail logistics capabilities
4
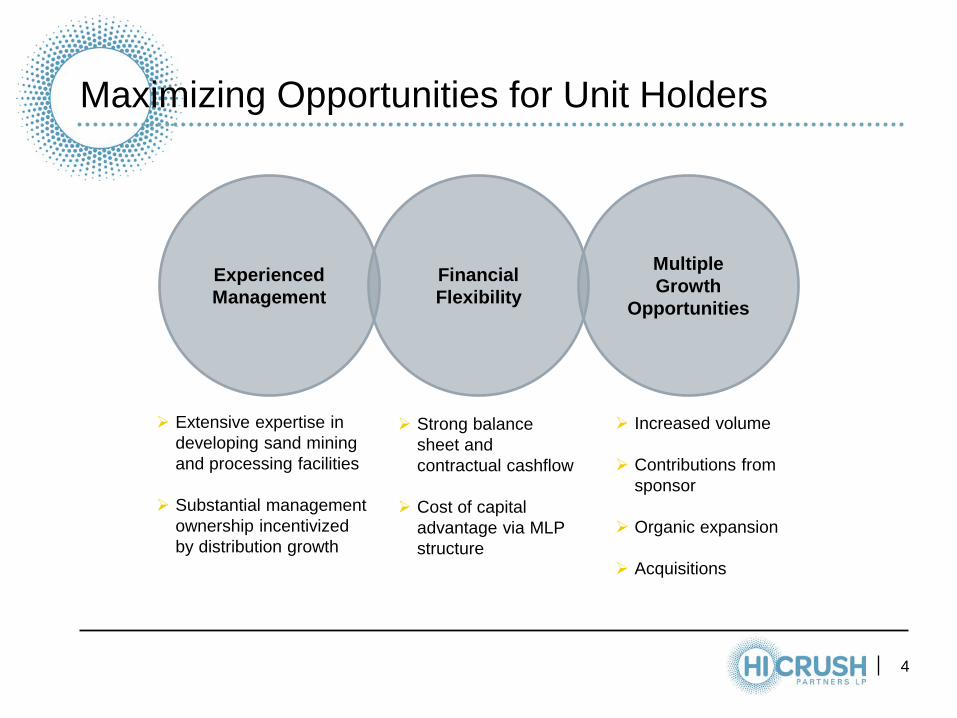
Extensive expertise in developing sand mining and processing facilities
Substantial management ownership incentivized by distribution growth
Increased volume
Contributions from sponsor
Organic expansion
Acquisitions
Maximizing Opportunities for Unit Holders
Multiple Growth
Opportunities
Experienced Management
Financial Flexibility
Strong balance sheet and contractual cashflow
Cost of capital advantage via MLP structure
5
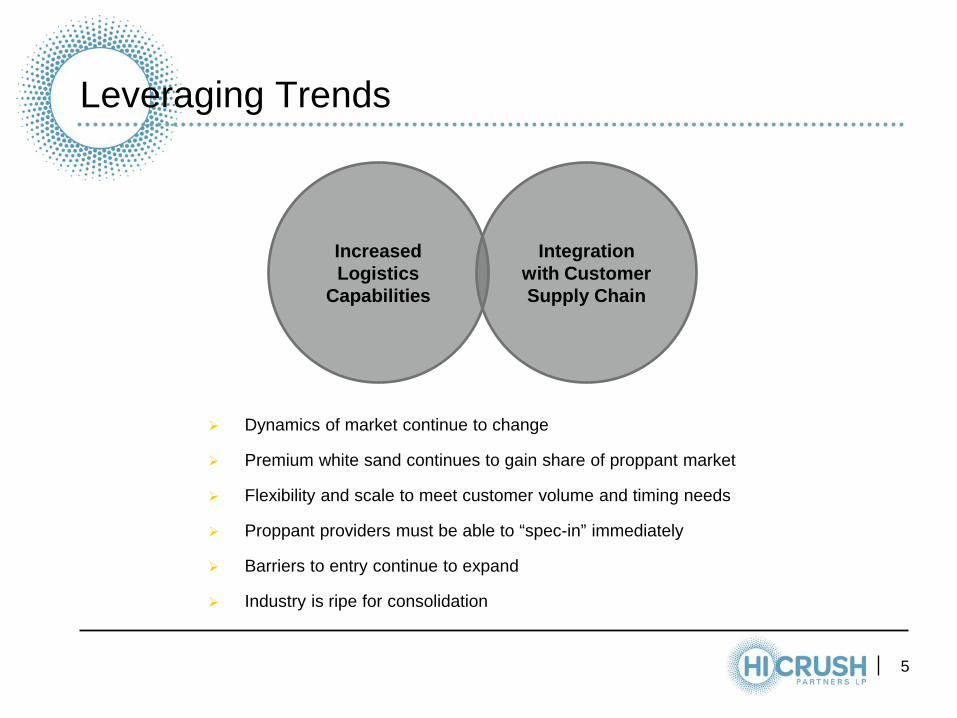
Leveraging Trends
Integration with Customer Supply Chain
Increased Logistics
Capabilities
Dynamics of market continue to change
Premium white sand continues to gain share of proppant market
Flexibility and scale to meet customer volume and timing needs
Proppant providers must be able to “spec-in” immediately
Barriers to entry continue to expand
Industry is ripe for consolidation
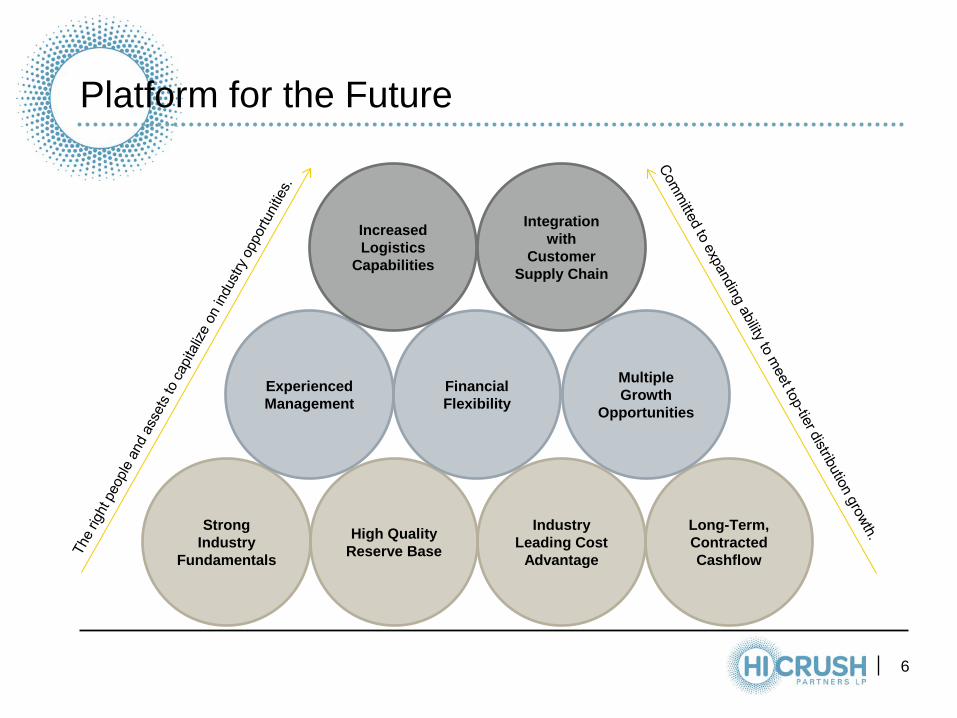
Platform for the Future
6
Long-Term, Contracted Cashflow
High Quality Reserve Base
Strong Industry
Fundamentals
Industry Leading Cost
Advantage
Multiple Growth
Opportunities
Experienced Management
Financial Flexibility
Integration with
Customer Supply Chain
Increased Logistics
Capabilities
7
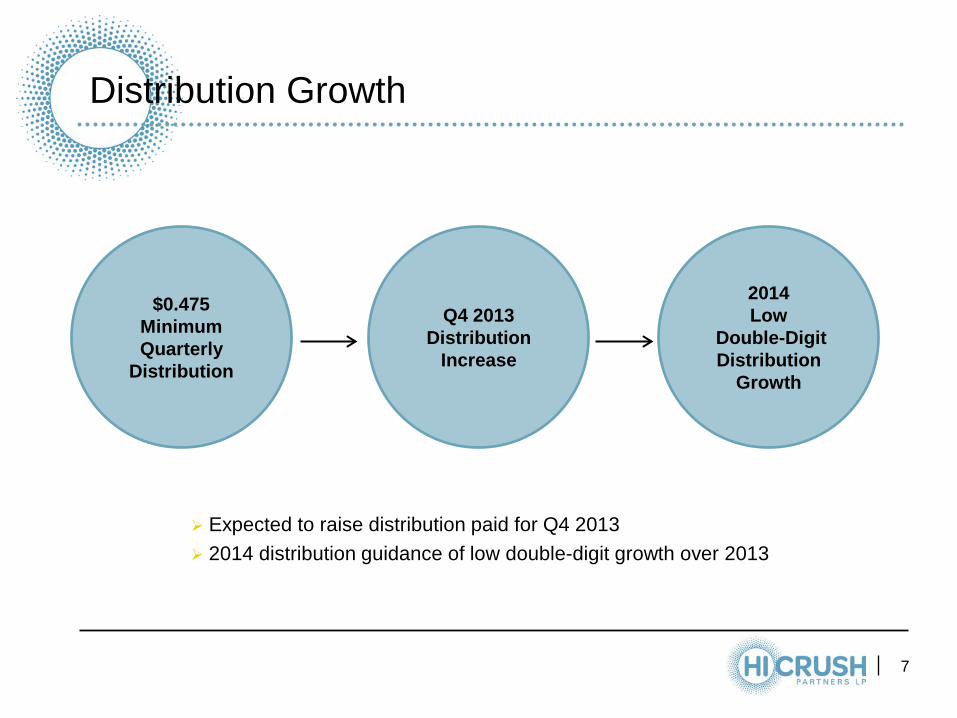
Distribution Growth
Expected to raise distribution paid for Q4 2013 2014 distribution guidance of low double-digit growth over 2013
2014 Low
Double-Digit Distribution
Growth
$0.475 Minimum Quarterly
Distribution
Q4 2013 Distribution
Increase
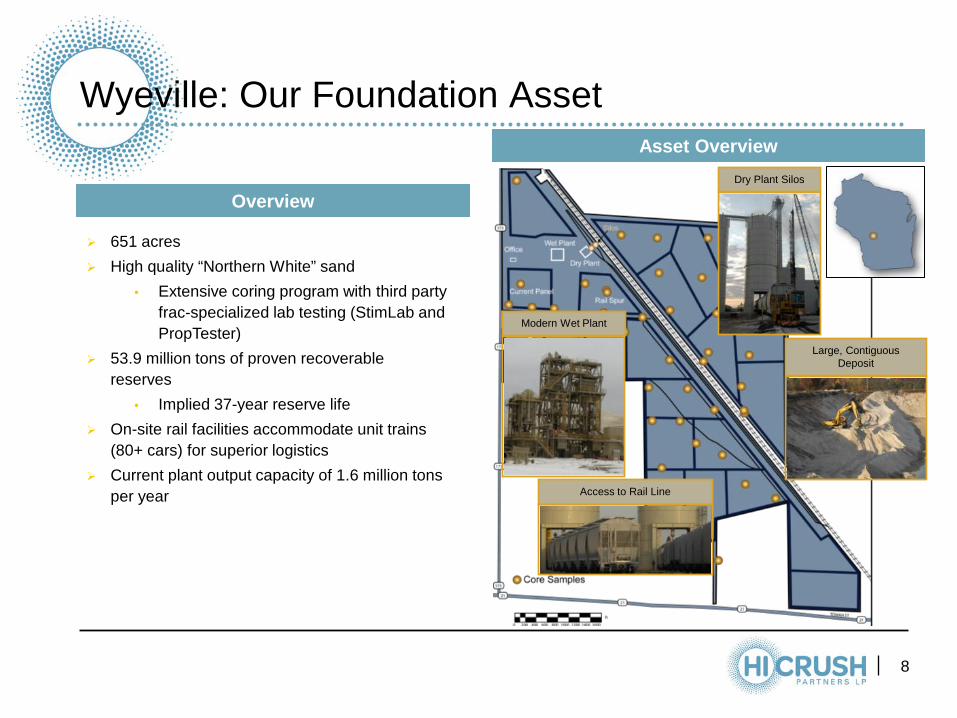
Wyeville: Our Foundation Asset
8
651 acres High quality “Northern White” sand
• Extensive coring program with third party frac-specialized lab testing (StimLab and PropTester)
53.9 million tons of proven recoverable reserves
• Implied 37-year reserve life On-site rail facilities accommodate unit trains
(80+ cars) for superior logistics Current plant output capacity of 1.6 million tons
per year
Modern Wet Plant
Access to Rail Line
Large, Contiguous Deposit
Dry Plant Silos
Asset Overview
Overview
Augusta: Growth Vehicle
9
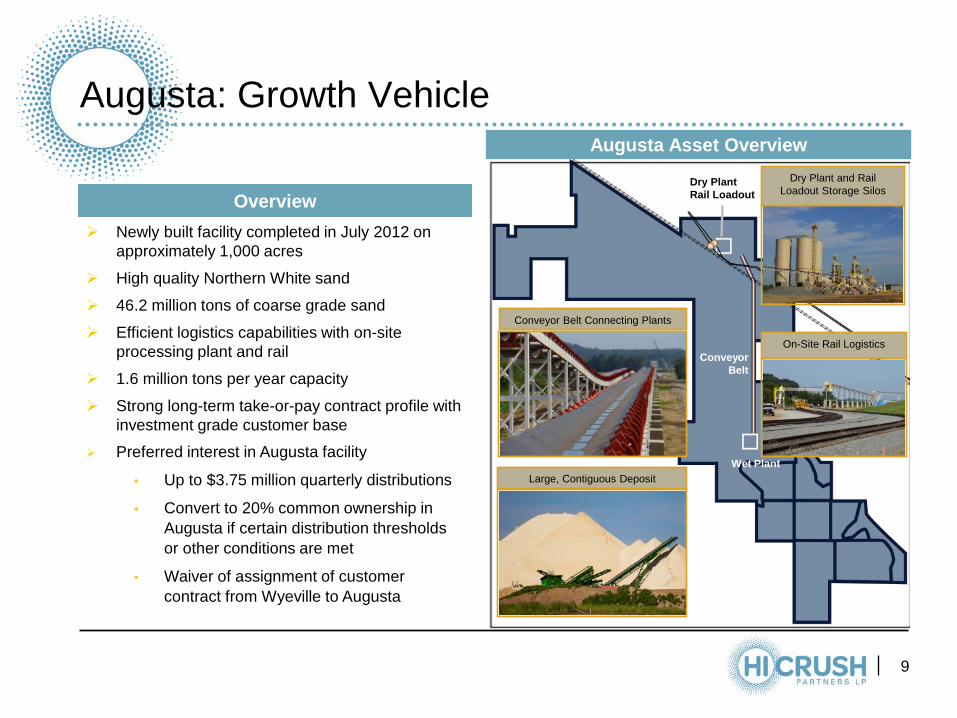
Newly built facility completed in July 2012 on approximately 1,000 acres
High quality Northern White sand
46.2 million tons of coarse grade sand
Efficient logistics capabilities with on-site processing plant and rail
1.6 million tons per year capacity
Strong long-term take-or-pay contract profile with investment grade customer base
Preferred interest in Augusta facility
• Up to $3.75 million quarterly distributions
• Convert to 20% common ownership in Augusta if certain distribution thresholds or other conditions are met
• Waiver of assignment of customer contract from Wyeville to Augusta
Augusta Asset Overview
Dry Plant Rail Loadout
Wet Plant
Conveyor Belt
Conveyor Belt Connecting Plants
On-Site Rail Logistics
Dry Plant and Rail Loadout Storage Silos
Large, Contiguous Deposit
Overview
D&I Acquisition
10
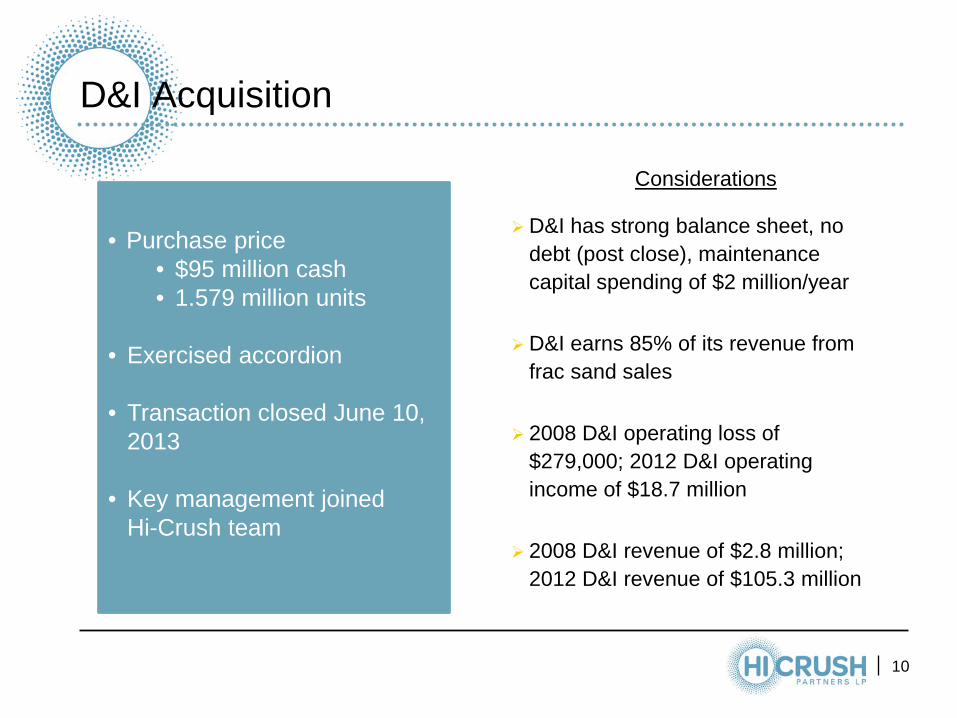
• Purchase price
• $95 million cash • 1.579 million units
• Exercised accordion • Transaction closed June 10,
2013
• Key management joined Hi-Crush team
D&I has strong balance sheet, no debt (post close), maintenance capital spending of $2 million/year
D&I earns 85% of its revenue from frac sand sales
2008 D&I operating loss of $279,000; 2012 D&I operating income of $18.7 million
2008 D&I revenue of $2.8 million; 2012 D&I revenue of $105.3 million
Considerations
Transaction Creates Substantial Unit Holder Value • Access to biggest distribution network in Marcellus & Utica
Enhances Long-Term Revenue Growth and Margin Potential
• More robust platform for products, replication across system
Achieves Broad Synergies • Rail expertise, increases sales and margins
Forges Clear Path to Grow Distributions
• Compelling growth for HCLP unit holders, accretive immediately
Continue To Have A Strong Balance Sheet • Conservative coverage, distribution growth
Transaction Delivers Benefits, Creates Value
11
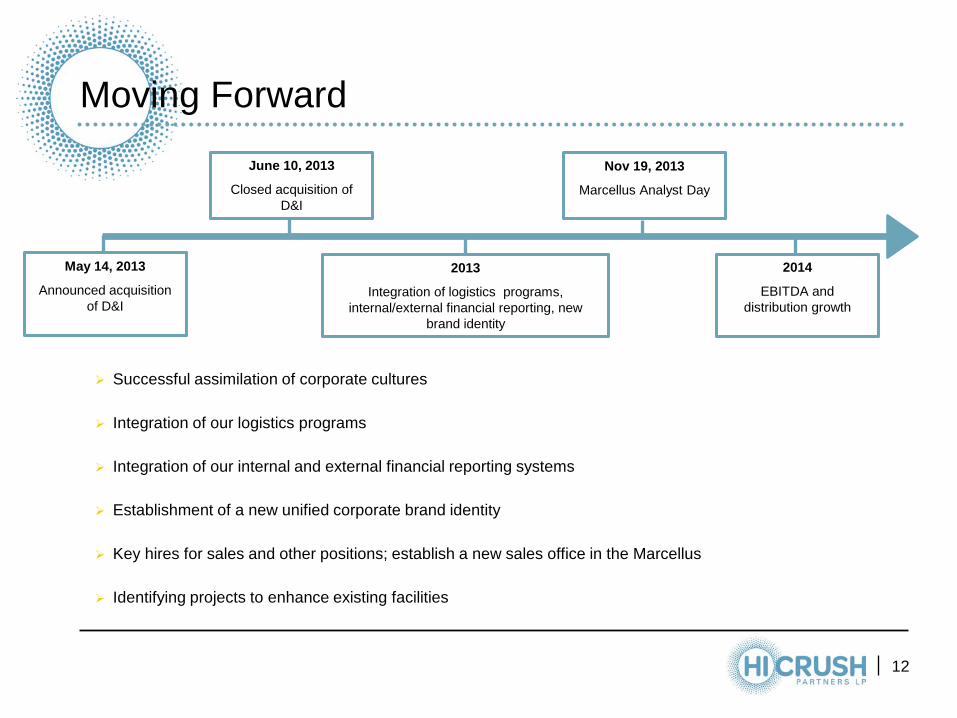
May 14, 2013
Announced acquisition of D&I
Moving Forward
12
Successful assimilation of corporate cultures
Integration of our logistics programs
Integration of our internal and external financial reporting systems
Establishment of a new unified corporate brand identity
Key hires for sales and other positions; establish a new sales office in the Marcellus
Identifying projects to enhance existing facilities
June 10, 2013
Closed acquisition of D&I
Nov 19, 2013
Marcellus Analyst Day
2013
Integration of logistics programs, internal/external financial reporting, new
brand identity
2014
EBITDA and distribution growth
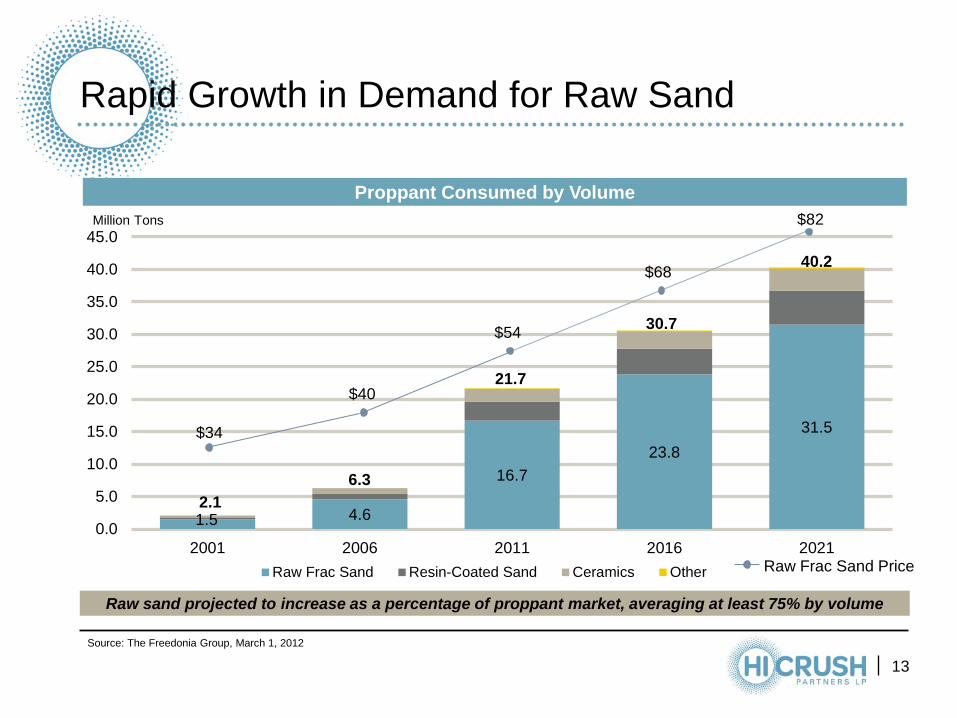
Rapid Growth in Demand for Raw Sand
Proppant Consumed by Volume
Source: The Freedonia Group, March 1, 2012
Raw sand projected to increase as a percentage of proppant market, averaging at least 75% by volume
13
1.5 4.6
16.7 23.8
31.5
0.0
5.0
10.0
15.0
20.0
25.0
30.0
35.0
40.0
45.0
2001 2006 2011 2016 2021Raw Frac Sand Resin-Coated Sand Ceramics Other
Million Tons
2.1 6.3
21.7
30.7
40.2
$34
$82
$68
$54
$40
Raw Frac Sand Price

14
Increase in Proppant Intensity
Source: The Freedonia Group.
0
200
400
600
800
1000
1200
0
10,000
20,000
30,000
40,000
50,000
60,000
2001 2006 2011 2016E 2021E
Tons
of P
ropa
nt /
Wel
l
Wel
ls D
rille
d
Wells Drilled Tons of Proppant / Well
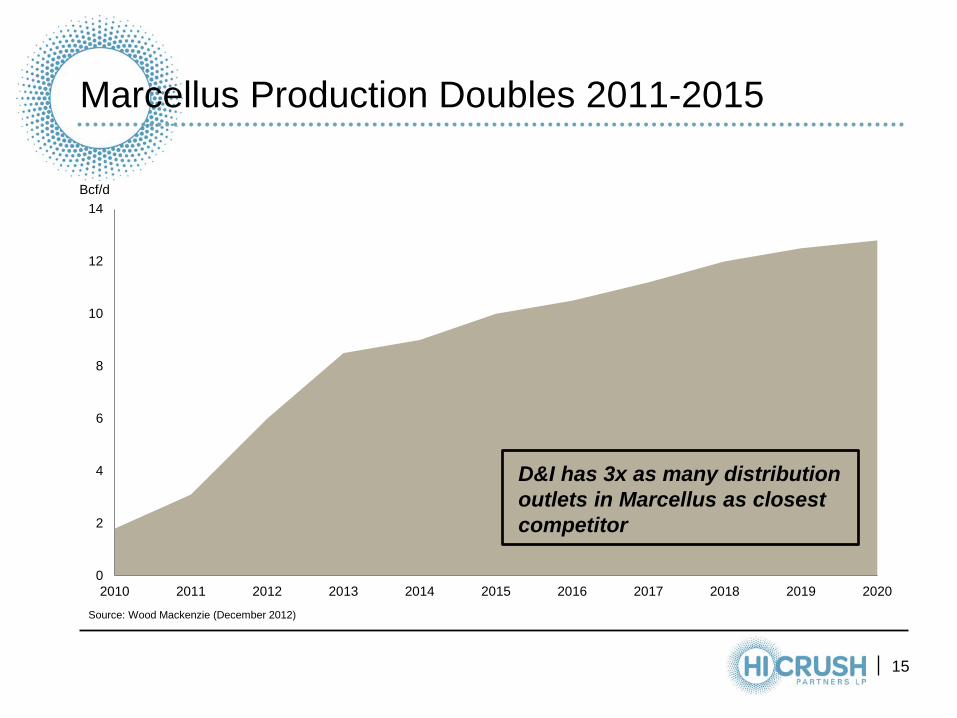
Marcellus Production Doubles 2011-2015
15
0
2
4
6
8
10
12
14
2010 2011 2012 2013 2014 2015 2016 2017 2018 2019 2020
Bcf/d
Source: Wood Mackenzie (December 2012)
D&I has 3x as many distribution outlets in Marcellus as closest competitor
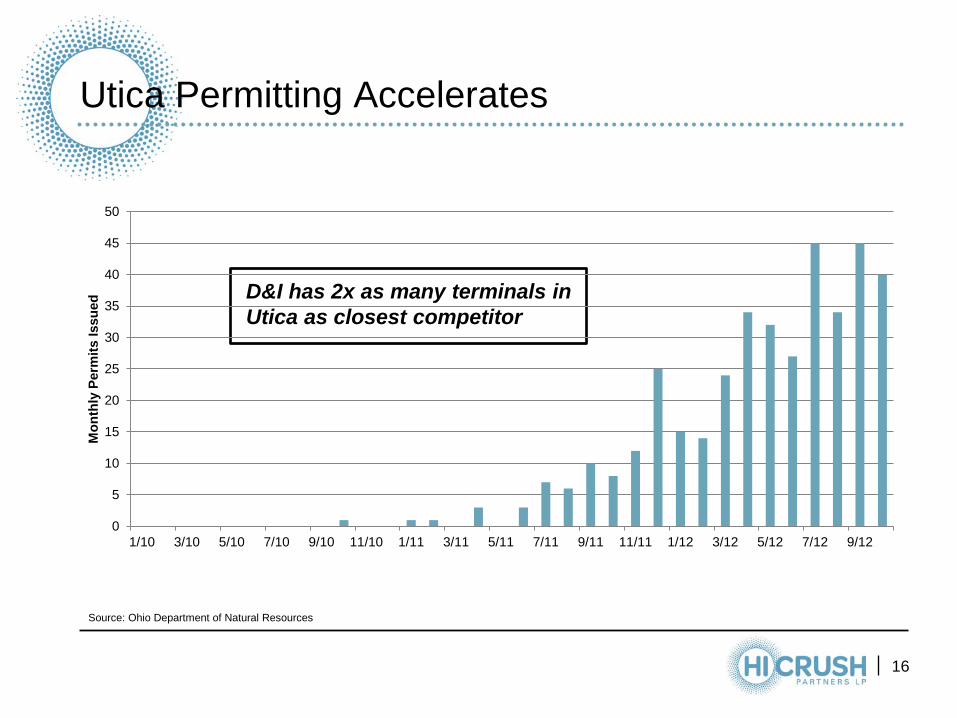
Utica Permitting Accelerates
16
D&I has 2x as many terminals in Utica as closest competitor
Source: Ohio Department of Natural Resources
0
5
10
15
20
25
30
35
40
45
50
1/10 3/10 5/10 7/10 9/10 11/10 1/11 3/11 5/11 7/11 9/11 11/11 1/12 3/12 5/12 7/12 9/12
Mon
thly
Per
mits
Issu
ed
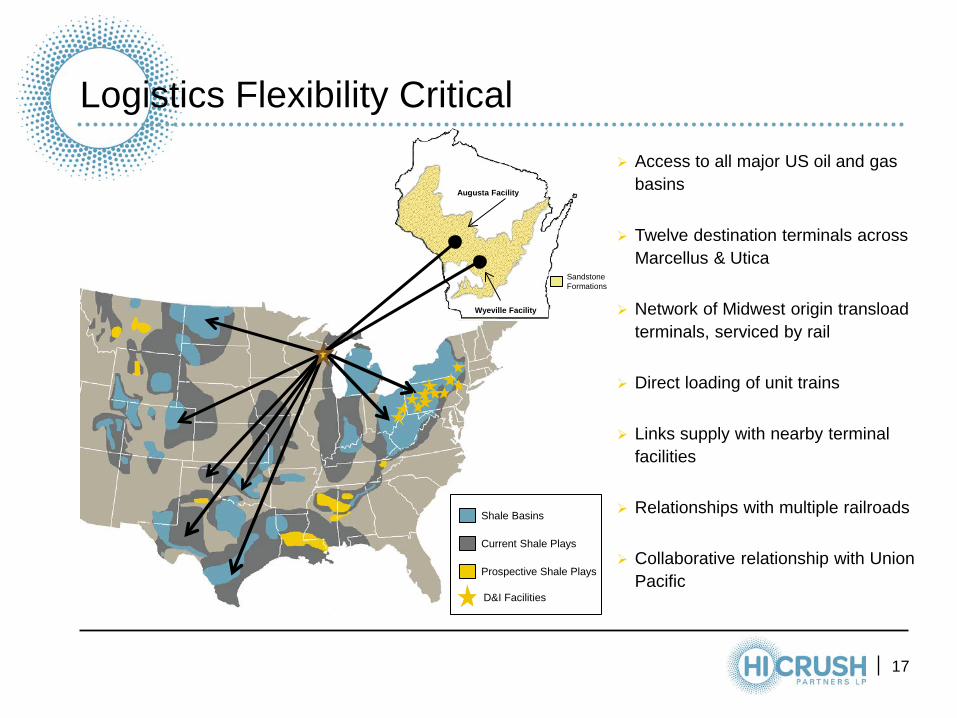
Logistics Flexibility Critical
17
Augusta Facility
Wyeville Facility
Sandstone Formations
Access to all major US oil and gas basins
Twelve destination terminals across Marcellus & Utica
Network of Midwest origin transload terminals, serviced by rail
Direct loading of unit trains
Links supply with nearby terminal facilities
Relationships with multiple railroads
Collaborative relationship with Union Pacific
Shale Basins
Current Shale Plays
Prospective Shale Plays
D&I Facilities
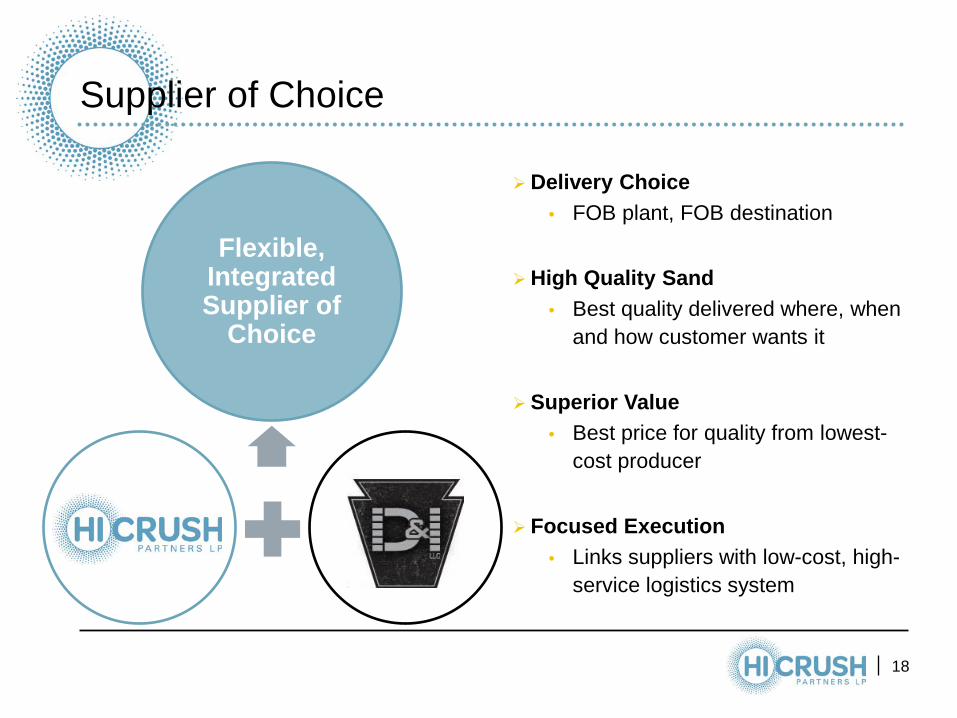
Supplier of Choice
18
Delivery Choice • FOB plant, FOB destination
High Quality Sand
• Best quality delivered where, when and how customer wants it
Superior Value
• Best price for quality from lowest-cost producer
Focused Execution
• Links suppliers with low-cost, high-service logistics system
Flexible, Integrated Supplier of
Choice
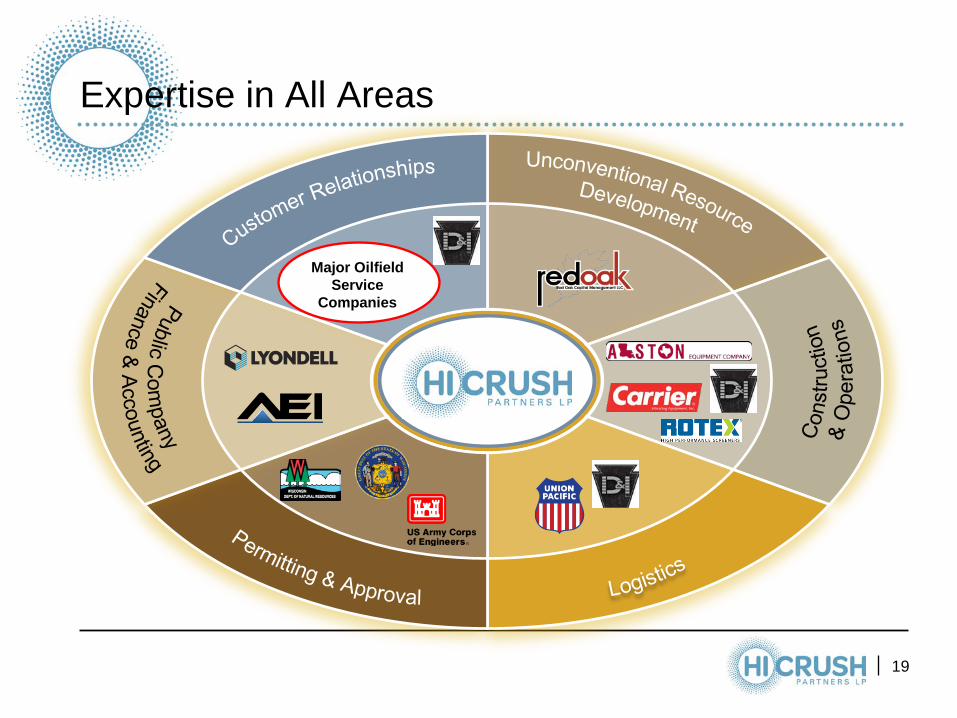
Expertise in All Areas
19
Major Oilfield Service
Companies
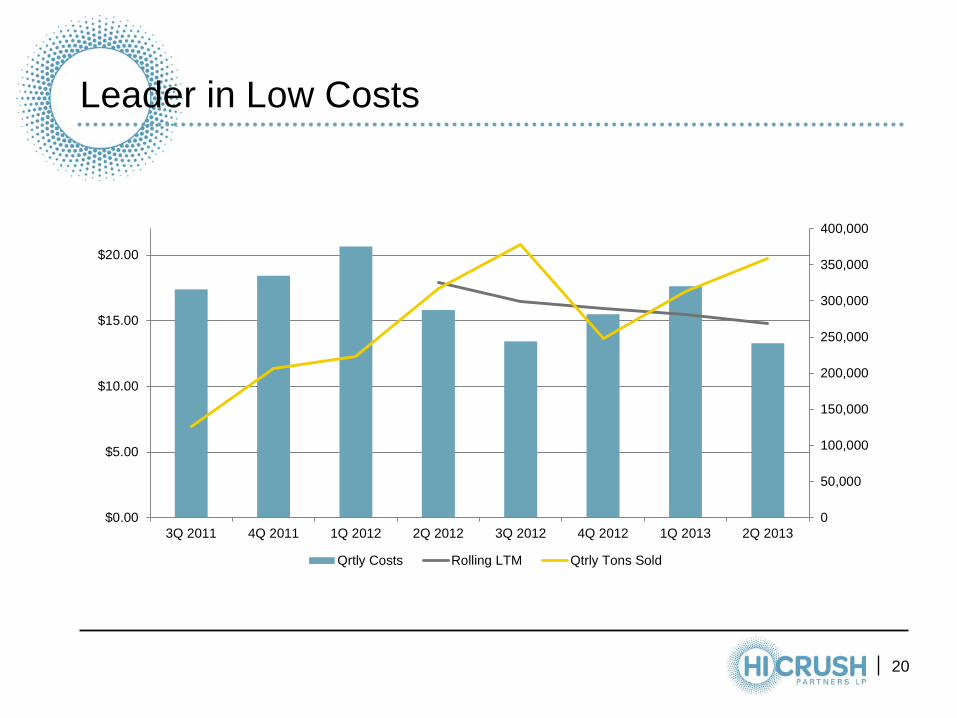
Leader in Low Costs
20
0
50,000
100,000
150,000
200,000
250,000
300,000
350,000
400,000
$0.00
$5.00
$10.00
$15.00
$20.00
3Q 2011 4Q 2011 1Q 2012 2Q 2012 3Q 2012 4Q 2012 1Q 2013 2Q 2013
Qrtly Costs Rolling LTM Qtrly Tons Sold
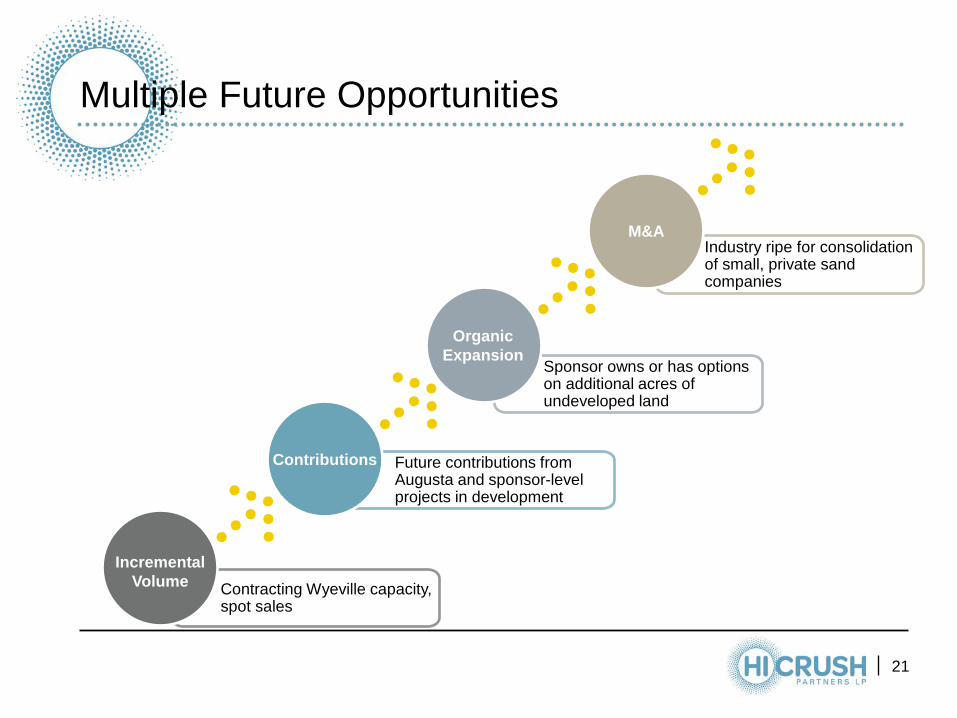
Multiple Future Opportunities
21
Contracting Wyeville capacity, spot sales
Future contributions from Augusta and sponsor-level projects in development
Sponsor owns or has options on additional acres of undeveloped land
Industry ripe for consolidation of small, private sand companies
Incremental Volume
Contributions
Organic Expansion
M&A
22
Second Quarter 2013
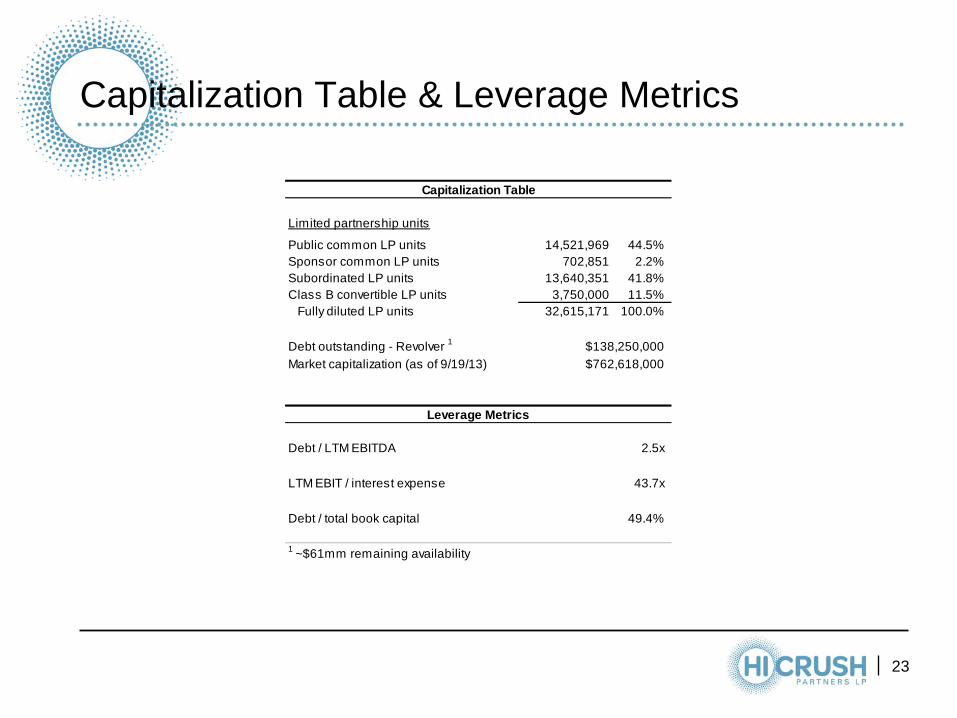
Capitalization Table & Leverage Metrics
23
Capitalization Table
Limited partnership units
Public common LP units 14,521,969 44.5%Sponsor common LP units 702,851 2.2%Subordinated LP units 13,640,351 41.8%Class B convertible LP units 3,750,000 11.5%
Fully diluted LP units 32,615,171 100.0%
Debt outstanding - Revolver 1
Market capitalization (as of 9/19/13)
Leverage Metrics
Debt / LTM EBITDA 2.5x
LTM EBIT / interest expense 43.7x
Debt / total book capital 49.4%
1 ~$61mm remaining availability
$138,250,000$762,618,000
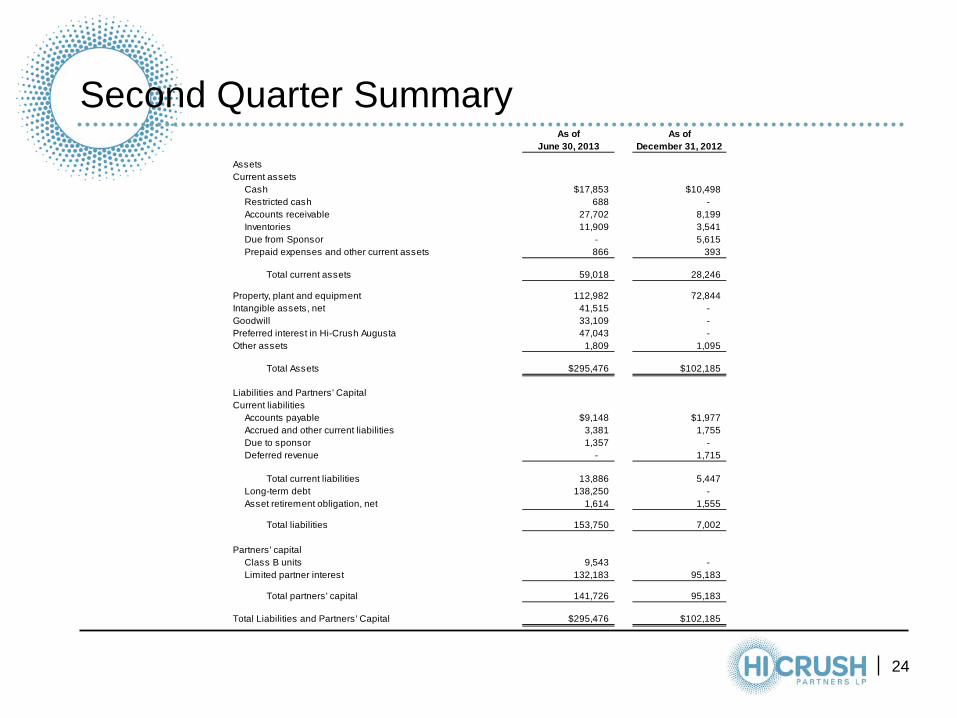
Second Quarter Summary
24
As of As ofJune 30, 2013 December 31, 2012
AssetsCurrent assets
Cash $17,853 $10,498Restricted cash 688 - Accounts receivable 27,702 8,199 Inventories 11,909 3,541 Due from Sponsor - 5,615 Prepaid expenses and other current assets 866 393
Total current assets 59,018 28,246
Property, plant and equipment 112,982 72,844 Intangible assets, net 41,515 - Goodwill 33,109 - Preferred interest in Hi-Crush Augusta 47,043 - Other assets 1,809 1,095
Total Assets $295,476 $102,185
Liabilities and Partners' CapitalCurrent liabilities
Accounts payable $9,148 $1,977Accrued and other current liabilities 3,381 1,755 Due to sponsor 1,357 - Deferred revenue - 1,715
Total current liabilities 13,886 5,447 Long-term debt 138,250 - Asset retirement obligation, net 1,614 1,555
Total liabilities 153,750 7,002
Partners' capitalClass B units 9,543 - Limited partner interest 132,183 95,183
Total partners' capital 141,726 95,183
Total Liabilities and Partners' Capital $295,476 $102,185
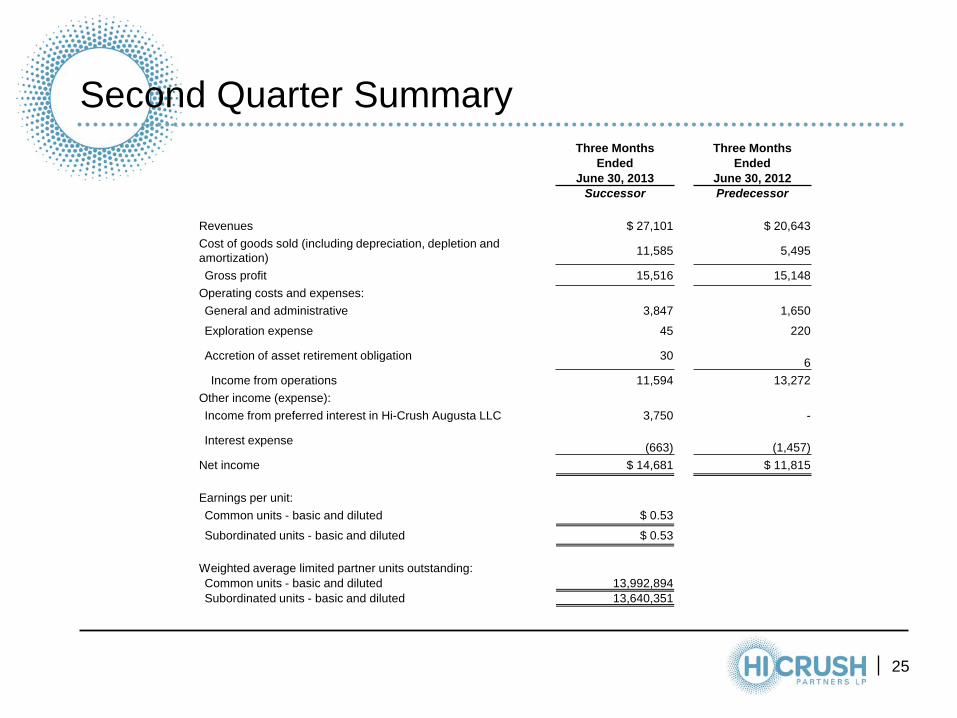
Second Quarter Summary
25
Three Months Three Months Ended Ended June 30, 2013 June 30, 2012 Successor Predecessor Revenues $ 27,101 $ 20,643 Cost of goods sold (including depreciation, depletion and amortization) 11,585 5,495
Gross profit 15,516 15,148 Operating costs and expenses: General and administrative 3,847 1,650
Exploration expense 45 220
Accretion of asset retirement obligation 30 6
Income from operations 11,594 13,272 Other income (expense): Income from preferred interest in Hi-Crush Augusta LLC 3,750 -
Interest expense (663)
(1,457) Net income $ 14,681 $ 11,815 Earnings per unit: Common units - basic and diluted $ 0.53
Subordinated units - basic and diluted $ 0.53 Weighted average limited partner units outstanding: Common units - basic and diluted 13,992,894 Subordinated units - basic and diluted 13,640,351
Second Quarter Summary
26
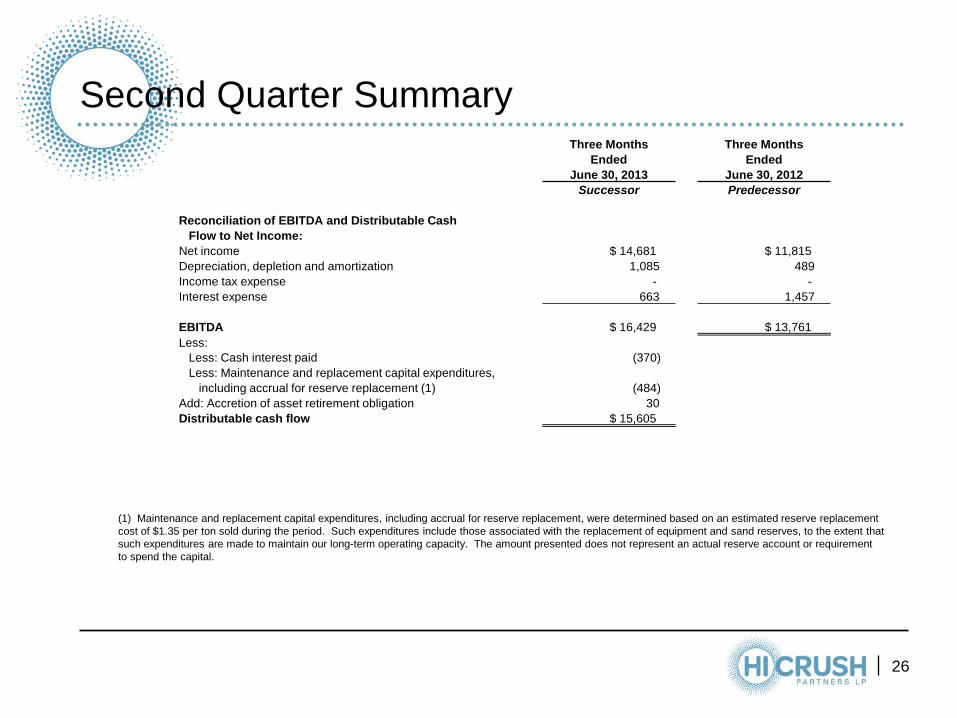
Three Months Three Months Ended Ended June 30, 2013 June 30, 2012 Successor Predecessor Reconciliation of EBITDA and Distributable Cash Flow to Net Income: Net income $ 14,681 $ 11,815 Depreciation, depletion and amortization 1,085 489 Income tax expense - - Interest expense 663 1,457 EBITDA $ 16,429 $ 13,761 Less: Less: Cash interest paid (370) Less: Maintenance and replacement capital expenditures, including accrual for reserve replacement (1) (484) Add: Accretion of asset retirement obligation 30 Distributable cash flow $ 15,605
(1) Maintenance and replacement capital expenditures, including accrual for reserve replacement, were determined based on an estimated reserve replacement cost of $1.35 per ton sold during the period. Such expenditures include those associated with the replacement of equipment and sand reserves, to the extent that such expenditures are made to maintain our long-term operating capacity. The amount presented does not represent an actual reserve account or requirement to spend the capital.
Production Costs per Ton Sold from Wyeville
27
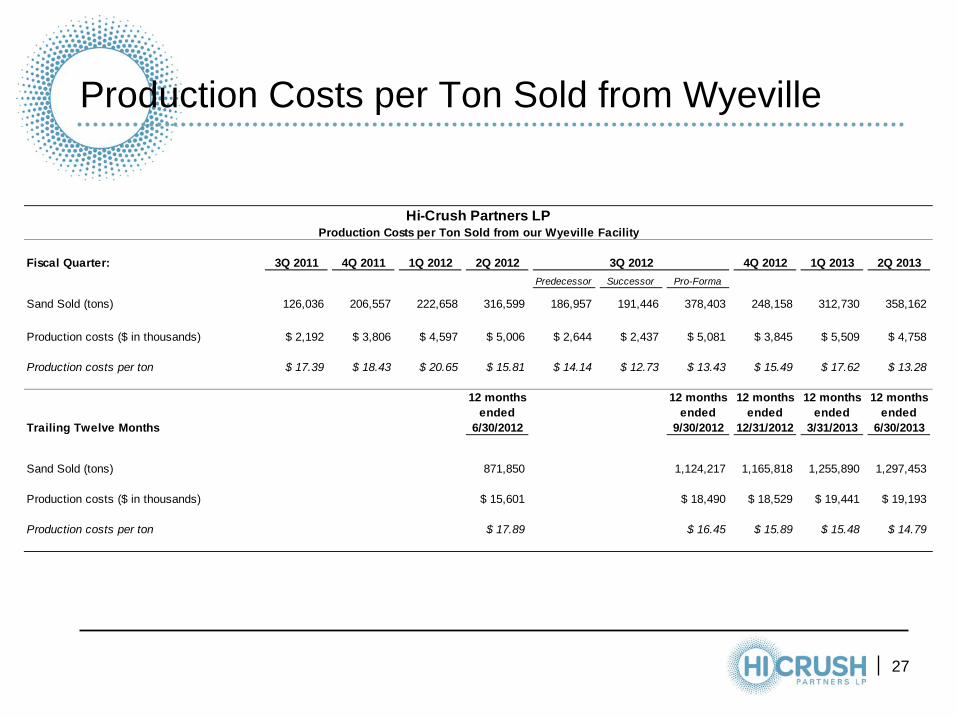
Hi-Crush Partners LPProduction Costs per Ton Sold from our Wyeville Facility
Fiscal Quarter: 3Q 2011 4Q 2011 1Q 2012 2Q 2012 3Q 2012 4Q 2012 1Q 2013 2Q 2013Predecessor Successor Pro-Forma
Sand Sold (tons) 126,036 206,557 222,658 316,599 186,957 191,446 378,403 248,158 312,730 358,162
Production costs ($ in thousands) $ 2,192 $ 3,806 $ 4,597 $ 5,006 $ 2,644 $ 2,437 $ 5,081 $ 3,845 $ 5,509 $ 4,758
Production costs per ton $ 17.39 $ 18.43 $ 20.65 $ 15.81 $ 14.14 $ 12.73 $ 13.43 $ 15.49 $ 17.62 $ 13.28
9 months ended
12 months ended
3 months ended
12 months ended
12 months ended
12 months ended
12 months ended
12 months ended
12 months ended
Trailing Twelve Months 9/30/2011 12/31/2011 3/31/2012 6/30/2012 9/30/2012 9/30/2012 12/31/2012 3/31/2013 6/30/2013Predecessor Successor
Sand Sold (tons) 126,036 332,593 222,658 871,850 726,214 191,446 1,124,217 1,165,818 1,255,890 1,297,453
Production costs ($ in thousands) $ 2,192 $ 5,998 $ 4,597 $ 15,601 $ 12,247 $ 2,437 $ 18,490 $ 18,529 $ 19,441 $ 19,193
Production costs per ton $ 17.39 $ 18.03 $ 20.65 $ 17.89 $ 16.86 $ 12.73 $ 16.45 $ 15.89 $ 15.48 $ 14.79
Wyeville Production Costs – Non-GAAP Recon.
28
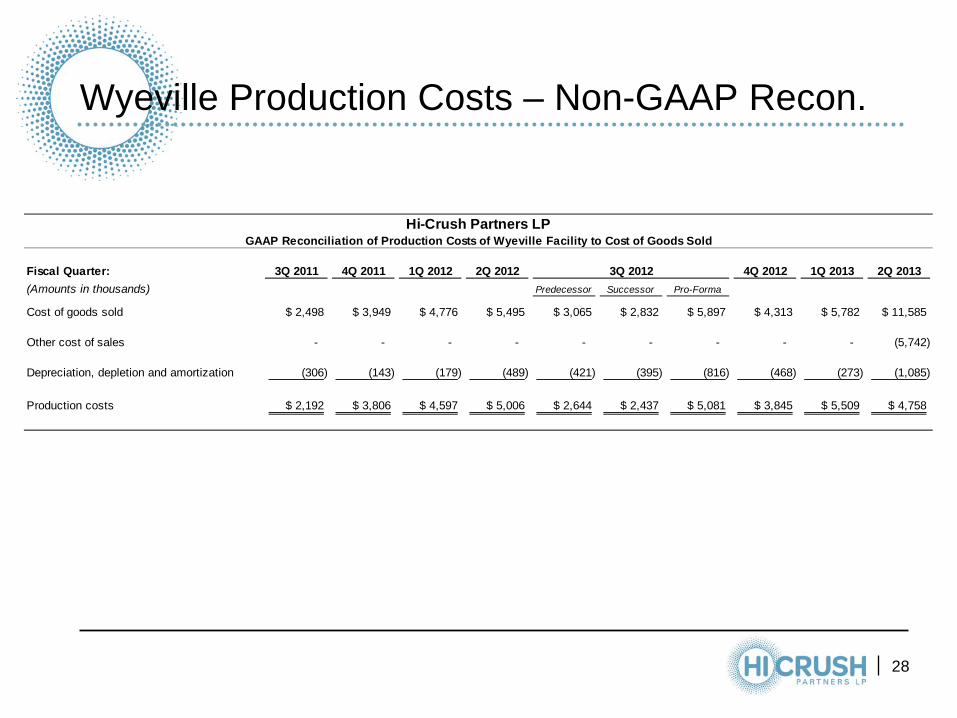
Hi-Crush Partners LPGAAP Reconciliation of Production Costs of Wyeville Facility to Cost of Goods Sold
Fiscal Quarter: 3Q 2011 4Q 2011 1Q 2012 2Q 2012 4Q 2012 1Q 2013 2Q 2013(Amounts in thousands) Predecessor Successor Pro-Forma
Cost of goods sold $ 2,498 $ 3,949 $ 4,776 $ 5,495 $ 3,065 $ 2,832 $ 5,897 $ 4,313 $ 5,782 $ 11,585
Other cost of sales - - - - - - - - - (5,742)
Depreciation, depletion and amortization (306) (143) (179) (489) (421) (395) (816) (468) (273) (1,085)
Production costs $ 2,192 $ 3,806 $ 4,597 $ 5,006 $ 2,644 $ 2,437 $ 5,081 $ 3,845 $ 5,509 $ 4,758
3Q 2012
Appendix
30
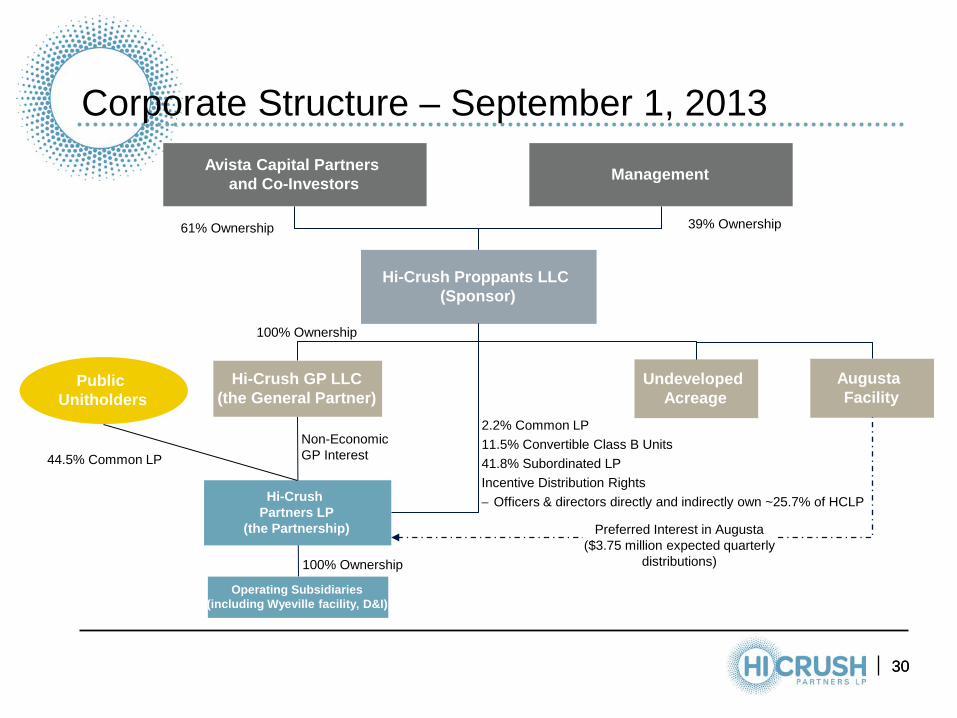
Corporate Structure – September 1, 2013
Avista Capital Partners and Co-Investors Management
Augusta Facility
44.5% Common LP
Operating Subsidiaries (including Wyeville facility, D&I)
Public Unitholders
2.2% Common LP 11.5% Convertible Class B Units 41.8% Subordinated LP Incentive Distribution Rights − Officers & directors directly and indirectly own ~25.7% of HCLP
39% Ownership 61% Ownership
Hi-Crush Partners LP
(the Partnership)
Hi-Crush Proppants LLC (Sponsor)
Hi-Crush GP LLC (the General Partner)
Non-Economic GP Interest
100% Ownership
100% Ownership
30
Undeveloped Acreage
Preferred Interest in Augusta ($3.75 million expected quarterly
distributions)
Related Documents