Welcome message from author
This document is posted to help you gain knowledge. Please leave a comment to let me know what you think about it! Share it to your friends and learn new things together.
Transcript


OPEN ACCESS International Journal of Dairy Science
ISSN 1811-9743DOI: 10.3923/ijds.2017.348.358
Research ArticleEconomic Impact of Exchange Rate on the ImportationRequirements of Dairy Industry in Egypt1Hanan Mohamed Mahrous and 2Mohamed Sayed Ahmed
1Department of Dairy Science, National Research Centre, 33th El-Bohooth St., Dokki, Giza, Egypt2Technical Office of Minister of trade and industry, Cairo, Egypt
AbstractBackground and Objective: The exchange rate for the currency of any country is the most important factors affecting economic activity.The food manufacturing sector for dairy products depends on some of the imported production inputs, mainly milk powder, proteinconcentrates, emulsifiers, salts and gelatin. Focus on the devaluation the value, of the Egyptian pound against other currencies, especiallythe US dollar ($) and its impact on the import of production requirements for the dairy industry. The study aims to measure the indicatorsof Egyptian imports and geographical distribution of the major exporting countries and the most important factors affecting theseimports. Materials and Methods: To achieve the descriptive and quantitative economic analysis of multi-linear regression and logarithmicby SPSS. Results: The value of the Egyptian pound against the dollar has taken a decreasing trend and a statistical significance difference(p<0.01) of an annual decline of about 133.4 thousand tons,(2.5% of the total average). New Zealand was ranked first among the leadingexporters of milk powder to the Egyptian market, while the Netherlands ranked first for the major exporters of protein and emulsifiersfor the market. As for the exporters of gelatin to the Egyptian market, Brazil is ranked first. The model used has a proved significantstatistical difference at (p<0.01). The exchange rate of the pound and the producer price index are the most important factors influencingthe quantity of Egyptian imports of powdered milk and protein concentrate. Conclusion: Replacing local products instead of imports leadsto increased production. This encourages factories to work, as well as, focus on localization for manufactories specially the proteinconcentrates used in the food industry.
Key words: Dairy products, exchange rate, Egyptian pound, US dollar, production requirements
Citation: Hanan Mohamed Mahrous and Mohamed sayed Ahmed, 2017. Economic impact of exchange rate on the importation requirements of dairyindustry in Egypt. Int. J. Dairy Sci., 12: 348-358.
Corresponding Author: Hanan Mohamed Mahrous, Department of Dairy Science, Food Industries and Nutrition Research Division,National Research Centre, 33th El-Bohooth St. Dokki, P.O. Box 12622, Giza, Egypt Tel:+2 01128887947
Copyright: © 2017 Hanan Mohamed Mahrous and Mohamed Sayed Ahmed. This is an open access article distributed under the terms of the creativecommons attribution License, which permits unrestricted use, distribution and reproduction in any medium, provided the original author and source arecredited.
Competing Interest: The authors have declared that no competing interest exists.
Data Availability: All relevant data are within the paper and its supporting information files.

Int. J. Dairy Sci., 12 (6): 348-358, 2017
INTRODUCTION
The exchange rate for the currency of any country was themost important factor influencing economic activity in allsectors and areas, especially on foreign trade sector in exportsand imports, price levels, level of real income and all areas ofeconomic life1. The fallout from the dollar-pound prices on theconsumer side had worst consequences on the Egyptianeconomy, which affects directly on the social aspect and theliving conditions of citizens, especially the middle and lowerclass. Because of expected high inflation and rising prices ofvarious products, such as imported component of foodproducts, importing goods and the cost of imported inputsthus raised the cost of living1.
The agricultural sector is an important economic sectorsin Egypt, contributes approximately 11.5% of gross domesticproduct (GDP), productivity sectors are highly sensitive toexchange rate, both in terms in the prices of some productionrequirements or even a change in the price of the finalproduct.
Dairy is one of the components of the agricultural sectorwhich considered as the main source of the Egyptian income.It also represents the most complete and balanced food forhuman needs because they contain many nutrients andvitamins in addition to being a food that protect the bodyfrom many diseases. Dairy production was about 25 billionpounds in 2015, representing 20.8% of the total animalproduction, while the average annual per capita dairy wasabout consumption 72.9 kg.
Dairy industry is of great importance as it works toprovided the important food products like pasteurized milk,white cheese, cooked cheese, yogurt, ice cream and butter.Dairy production increased approximately 224.5 thousandtons in 2004 to about 593.8 thousand tons in 2012, as thevalue of the production of dairy products increased fromabout 1292.3 million pounds in 2003 to 8837.7 million pounds20122. The dairy manufacturing sector relied on some ofimported production inputs, mainly milk powder, proteinconcentrates, emulsifying salts and gelatin.
In the past decades, the Egyptian pound has passed overdifferent stations, after each station the Egyptian pound lostpart of its value gradually for many reasons. The poundexchange rate superposed the dollar in the official market at8.8 pounds in December, 2016, then rose to 13 pounds inNovember during the same year compared to 5.90 in August2011, followed those changes increased the size of the gapbetween the official and parallel price to the dollar on theblack market despite the efforts made by the Central Bank tocontrol those changes. As well as, increases the severity of the
decline in the value of the pound against the dollar onEgyptian imports, most components of the structure of theEgyptian imports ranging from consumer goods, any goodshas got involved in manufacturing to meet the requirementsof the local market. Therefore, increase the re-export increasethe cost of products1.
Accordingly, the study aimed to achieve its objectives byaddressing the following points: (1) Evaluate the worth ofEgyptian pound against the dollar, (2) Shed light on thecurrent status of Egyptian imports of dairy industries supplies,(3) Measuring indicators for Egyptian imports of dairyindustries supplies and geographical distribution of majorexporting countries and (4) Measuring the most importantfactors affecting imports of dairy industries supplies in Egypt.
MATERIALS AND METHODS
Some statistical models as the general time trendequations, multi-linear and logarithmic regression analysiswere used for the descriptive and quantitative economicanalysis.
Using statistical analysis by SPSS obtained the mostimportant factors influencing quantities imported for the dairyindustry in Egypt, during the period (2008-2015) asindependent variables (the official exchange rate of thepound, the consumer price index and the producer priceindex), the imported quantities of dairy supplies in Egypt intons as a dependent variable (milk powder, proteinconcentrates, emulsifiers, gelatin). Using multiple regressionmodels to determine the most important independent factorsthat may affect the amount of imports of dairy supplies fromthis form can determine the impact of the Egyptian poundagainst the dollar on foreign trade, as well as the impact ofother variables that are selected and placed in the form3,4:
Linear model: yi = a+B1x1t-1+B2x2t-1+B3x3t-1
Logarithmic model: lnyi = a+B1lnx1t-1+B2lnx2t-1+B3lnx3t-1
Where:y = Indicate the dependent variable (the amount of
Egyptian imports of dairy products supplies tones)a = Constant indicating the equation expresses the
change in axis (the change in value of y if steady allvariables)
B1 = Magnitude of the impact of the change in theofficial exchange rate of the Egyptian poundagainst the dollar in the previous month to thedependent variable
349
Int. J. Dairy Sci., 12 (6): 348-358, 2017
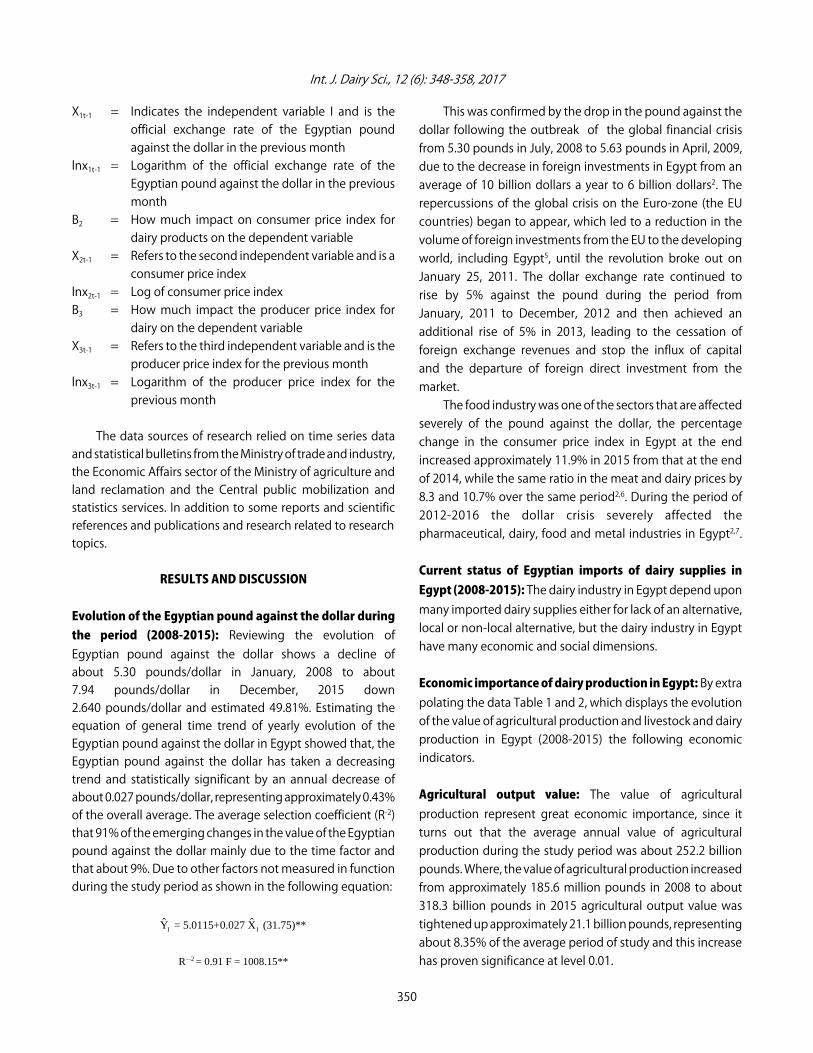
X1t-1 = Indicates the independent variable I and is theofficial exchange rate of the Egyptian poundagainst the dollar in the previous month
lnx1t-1 = Logarithm of the official exchange rate of theEgyptian pound against the dollar in the previousmonth
B2 = How much impact on consumer price index fordairy products on the dependent variable
X2t-1 = Refers to the second independent variable and is aconsumer price index
lnx2t-1 = Log of consumer price indexB3 = How much impact the producer price index for
dairy on the dependent variableX3t-1 = Refers to the third independent variable and is the
producer price index for the previous monthlnx3t-1 = Logarithm of the producer price index for the
previous month
The data sources of research relied on time series dataand statistical bulletins from the Ministry of trade and industry,the Economic Affairs sector of the Ministry of agriculture andland reclamation and the Central public mobilization andstatistics services. In addition to some reports and scientificreferences and publications and research related to researchtopics.
RESULTS AND DISCUSSION
Evolution of the Egyptian pound against the dollar duringthe period (2008-2015): Reviewing the evolution ofEgyptian pound against the dollar shows a decline ofabout 5.30 pounds/dollar in January, 2008 to about7.94 pounds/dollar in December, 2015 down2.640 pounds/dollar and estimated 49.81%. Estimating theequation of general time trend of yearly evolution of theEgyptian pound against the dollar in Egypt showed that, theEgyptian pound against the dollar has taken a decreasingtrend and statistically significant by an annual decrease ofabout 0.027 pounds/dollar, representing approximately 0.43%of the overall average. The average selection coefficient (R-2)that 91% of the emerging changes in the value of the Egyptianpound against the dollar mainly due to the time factor andthat about 9%. Due to other factors not measured in functionduring the study period as shown in the following equation:
I Iˆ ˆY = 5.0115+0.027 X (31.75)**
RG2 = 0.91 F = 1008.15**
This was confirmed by the drop in the pound against thedollar following the outbreak of the global financial crisisfrom 5.30 pounds in July, 2008 to 5.63 pounds in April, 2009,due to the decrease in foreign investments in Egypt from anaverage of 10 billion dollars a year to 6 billion dollars2. Therepercussions of the global crisis on the Euro-zone (the EUcountries) began to appear, which led to a reduction in thevolume of foreign investments from the EU to the developingworld, including Egypt5, until the revolution broke out onJanuary 25, 2011. The dollar exchange rate continued torise by 5% against the pound during the period fromJanuary, 2011 to December, 2012 and then achieved anadditional rise of 5% in 2013, leading to the cessation offoreign exchange revenues and stop the influx of capitaland the departure of foreign direct investment from themarket.
The food industry was one of the sectors that are affectedseverely of the pound against the dollar, the percentagechange in the consumer price index in Egypt at the endincreased approximately 11.9% in 2015 from that at the endof 2014, while the same ratio in the meat and dairy prices by8.3 and 10.7% over the same period2,6. During the period of2012-2016 the dollar crisis severely affected thepharmaceutical, dairy, food and metal industries in Egypt2,7.
Current status of Egyptian imports of dairy supplies inEgypt (2008-2015): The dairy industry in Egypt depend uponmany imported dairy supplies either for lack of an alternative,local or non-local alternative, but the dairy industry in Egypthave many economic and social dimensions.
Economic importance of dairy production in Egypt: By extrapolating the data Table 1 and 2, which displays the evolutionof the value of agricultural production and livestock and dairyproduction in Egypt (2008-2015) the following economicindicators.
Agricultural output value: The value of agriculturalproduction represent great economic importance, since itturns out that the average annual value of agriculturalproduction during the study period was about 252.2 billionpounds. Where, the value of agricultural production increasedfrom approximately 185.6 million pounds in 2008 to about318.3 billion pounds in 2015 agricultural output value wastightened up approximately 21.1 billion pounds, representingabout 8.35% of the average period of study and this increasehas proven significance at level 0.01.
350

Int. J. Dairy Sci., 12 (6): 348-358, 2017
Table 1: Relative importance of dairy production value for national production and agricultural and livestock and dairy in Egypt (2008-2015). (value millionth pounds)Agricultural production Animal production Dairy production Dairy to agricultural Dairy to animal
Years value value value production (%) production (%)2008 185666 65060 17811 9.59 27.382009 189438 69120 18082 9.86 27.032010 209354 77382 19954 9.53 25.792011 249989 84538 24164 9.67 28.582012 269905 92800 26931 9.97 29.022013 289900 100800 28975 9.99 28.742014 305400 113200 27100 8.87 23.942015 318332 119406 24888 7.82 20.84Average 252248 90288 23288 9.23 25.79Source: Ministry of agriculture and land reclamation, economic affairs sector, agricultural income, bulletin, setting (2008-2015)
Table 2: General time trend equations for production value of the agricultural, livestock and dairy (2008-2015)Type Equations Average Change rate (%) RG2 FAgricultural production value = 15742.2+21071.74 (15.017)** 252248 8.35 0.96 225.51**Iy IxAnimal production value = 53895.14+8087.36 (325.923)** 90288 8.95 0.98 615.72**Iy IxDairy production value = 16820.68+1481.65 (3.758)** 23288 6.36 0.65 14.13**Iy Ix
Estimated value of the dependent variable per annum, Factors linked to the time period, years 1, 2, 3,........., 8, **Level of significance (0.01%).Iy : Ix :Source: compiled and calculated from Table 1
Table 3: Estimation of the quantities of the most important imported dairy products for some dairy products in Egypt 2015Production quantity for 2015--------------------------------------------------------- Quantity of raw materials
Ratio Quantity Values used in production------------------------------------------- Production type (Thousand tons) (Thousand pounds) (Thousand tons)Gelatin 0.3% Ice cream 45.5 1139 0.1365Emulsifiers 2.5-3.5% Processed cheese 223.5 2392 6.705Milk powder 25% Processed cheese 223.5 2392 55.875
20-30% White cheese 122.3 2056 30.574Concentrates protein - All production - - -Source: 2, 8, 9, 10, 11
Value of animal production: The average annual value ofanimal production was approximately 90.3 billion pounds andrepresented 35.5% of the average value of agriculturalproduction. The animal production value rose from about65.1 billion pounds in 2008 to about 119.4 billion pounds in2015, taking the value of animal production during the studyperiod an increasing trend year-approximately 8.1 billionpounds represent 8.95% of the average value of animalproduction has proven to increase morality at level 0.01.
Value of dairy production: The average annual value of dairyproduction was around 23.3 billion pounds, representingapproximately 25.79% of animal production and contributestowards 9.23% of the value of agricultural production, dairyproduction value rose from about 17.8 million pounds in 2008to about 28.9 billion pounds in 2013 and dairy productionvalue were taken during the search direction years tightenedup around 1.5 billion pounds a year, representing around6.63% of the average value of dairy production moral provedat level 0.01.
Estimation of used quantities of the most importantimported dairy products: The data in Table 3 shows thequantities used of some imported raw materials in year 2015.
Gelatin2,8,9: Ice cream is one of the most important productsthat enter gelatin in its industry and Egypt imports about150,000 kg of gelatin worth about 7.977 million pounds by2015, Egypt produces an estimated 40.5 thousand tons of icecream used About 121.5 thousand kg of gelatin.
Emulsifying salts2,9,10: Egypt imports about 117 t of salts ofemulsification with an estimated value of 2.277 millionpounds. Emulsifying salts are used in the manufacture ofcooked cheese. Egypt produces about 223.5 thousand tons ofprocessed cheese. It uses about 6.7 thousand tons.
Milk Powder2,9,11: Egypt imports about 3.7 thousand tons ofmilk powder with an estimated value of 81.075 millionpounds. In many products, milk powder was replaced bynatural milk. It was used in the manufacture of white cheese
351

Int. J. Dairy Sci., 12 (6): 348-358, 2017
Januar
y, 200
8
May, 20
08
Septe
mber, 2
008
Januar
y, 20
09
May, 20
09
Septe
mber, 2
009
Januar
y, 20
10
May, 20
10
Septe
mber, 2
010
Janua
ry, 20
11
May, 2
011
Septe
mber, 2
011
Janua
ry, 20
12
May, 20
12
Septe
mber, 2
012
Januar
y, 20
13
May, 20
13
Septem
ber, 2
013
Janua
ry, 20
14
May, 20
14
Septe
mber, 2
014
Janua
ry, 20
15
May, 2
015
Septe
mber, 2
015
25000
20000
15000
10000
5000
0
Pow
der m
ilk (t
)
Years
Fig. 1: Evolution of dairy import quantity from powder milk (ton) (2008-2015)
and cooked cheese, representing about 25% each. Egyptproduces about 223.5, 122.3 thousand tons of each,respectively and used about 55.874, 30.5 thousand t of milkpowder each in production.
Evolution of Egyptian imports quantity and value of themain requirements of the dairy industry (2008-2015): Dairyproduction in Egypt based on many production requirementsof the local and imported ones, the most important inputsimported from abroad in dairy powder and protein status,some preparations used in food industry, gelatin andemulsifiers (according to the customs tariff of the HarmonizedSystem (HS code), the milk powder under the customs item0402, the emulsifying materials, the protein concentrates andthe food preparations are classified under the customs item2106 and the gelatin within the customs item 3503).
Evolution of the Egyptian imports of milk powder duringthe period (2008-2015)2: Through the evolution of Egyptianimports of powdered milk quantity notes an increase in theamount of imports during the period from February-May ofeach year during the study period (except as a result of thepolitical unrest in 2013), Fig. 1. The increased imports ofpowdered milk dramatically during the period of January-July,2014 was due to the decline in world prices for dairy powdersignificantly increased particularly in Europe after the Russianbanned to import milk powder from Europe. Where, prices fellto about 5000 dollars baby milk per ton to about 2400 dollarsa ton from 2013 until December, 20141.
Estimating the general time trend shown in the Table 4,the evolution of imports quantity milk powder is in Egyptshowed that the amount of milk powder imported taken anincreasing trend with an annual statistical significantincrement of about 45.731 t, representing about 1.37% of theoverall average of about 3322 t, a value of the coefficient ofdetermination (R-2) to 15% of the emerging changes in theamount of imports was mainly due to the time factor and theremaining were due to other factors not measured in functionduring the study period.
The general time trend equation indicates that the year ofimport value in Egyptian pound and dollar, respectively asshown in the Table 4 to increase statistical moral about728.28 thousand pounds, about $89.80 and representingabout 1.44 and 1.18% of the average value of importsrespectively. The value of the coefficient of determination (R-2)to 32 and 25%, respectively, of the emerging changes inimports due to the time factor and the rest was attributable toother factors not measured in function during the studyperiod.
Development of Egyptian imports of protein concentrates2:Figure 2 shows the development of Protein concentratesimports quantity (2008-2015). It was found that the averageannual quantity of imports of protein concentrates was about468.2 t during the study, the average was between thesword reached about 4 t in 6/2009 and their subordinateabout 331.4 t in 12/2014, increasing lack of 863.2, reached464.2 t, respectively on annual average. In reviewing the
352

Int. J. Dairy Sci., 12 (6): 348-358, 2017
Januar
y, 200
8
May, 20
08
Septe
mber, 2
008
Januar
y, 20
09
May, 20
09
Septe
mber, 2
009
Januar
y, 20
10
May, 20
10
Septe
mber, 2
010
Janua
ry, 20
11
May, 2
011
Septe
mber, 2
011
Janua
ry, 20
12
May, 20
12
Septe
mber, 2
012
Januar
y, 20
13
May, 20
13
Septem
ber, 2
013
Janua
ry, 20
14
May, 20
14
Septe
mber, 2
014
Janua
ry, 20
15
May, 2
015
Septem
ber, 2
015
1400
1200
1000
800
600
400
200
0
Prot
ein
conc
entra
tes (
t)
Years
Fig. 2: Evolution of protein concentrates imports quantity in tons (2008-2015)
Table 4: General time trend equations of quantity and value of Egyptian imports from most dairy supplies in Egypt (2008-2015)Dependent variables " $ Average Annual change rate (%) T RG2 FPowder milkQuantity (t) 1104.15 45.741 3322 1.37 4.175 0.15 7.43**Value (thousand pound) 15138.01 728.281 50460 1.44 6.732 0.32 4.33**Value (thousand $) 3236.24 89.799 7623 1.18 5.625 0.25 31.64**Protein concentratesQuantity (t) 93.11 11.573 468 2.47 15.159 0.71 229.81**Value (thousand pound) 381.63 111.254 5014 2.22 14.344 0.68 205.74**Value (thousand $) 77.83 13.838 749 1.85 12.393 0.62 153.30**EmulsifiersQuantity (t) 93.433 0.558 121 0.46 1.953 0.04 3.82*Value (thousand pound) 1537 2.14 2278 0.08 1.536 0.02 2.36*Value (thousand $) 326.66 0.695 360 0.19 0.875 0.01 0.77*GelatinQuantity (t) 97.46 0.725 131 0.55 1.933 0.04 3.74*Value (thousand pound) 2174.29 72.651 5698 1.27 8.977 0.46 80.58**Value (thousand $) 501.91 7.821 881 0.89 6.157 0.28 37.91****Significant at 1%, *5% in significant
Table 5: Outcome indicators of the Egyptian imports of production requirements for dairy productsGrowth rate Growth rate Egypt's Most important exporters of Egypt
Production element in the value in the value share -----------------------------------------------------------------------------------------------used in the dairy of imports from of imports from in world Import Import State participationindustry the world (%) the world (%) imports (%) States share (%) price in exports (%)Milk powder 3 10 1.5 New Zealand 28.7 2210 25
Germany 16.1 2194 8France 12.1 2225 6
Protein and emulsifiers 14 16 0.5 Netherland 19.3 3921 9Thailand 15.9 1965 3Germany 12.2 3127 9
Gelatin gelatinous material 7 3 1.0 Brazil 41.3 6633 17France 35.0 7258 10Germany 11.0 7508 13
Source:12,compiled and calculated from the international information network Internet
353
Int. J. Dairy Sci., 12 (6): 348-358, 2017
Januar
y, 200
8
May, 20
08
Septe
mber, 2
008
Januar
y, 20
09
May, 20
09
Septe
mber, 2
009
Januar
y, 20
10
May, 20
10
Septe
mber, 2
010
Janua
ry, 20
11
May, 2
011
Septe
mber, 2
011
Janua
ry, 20
12
May, 20
12
Septe
mber, 2
012
Januar
y, 20
13
May, 20
13
Septem
ber, 2
013
Janua
ry, 20
14
May, 20
14
Septe
mber, 2
014
Janua
ry, 20
15
May, 2
015
Septem
ber, 2
015
500
450
400
350
300
250
200
150
100
50
0
Emul
sifie
rs (t
)
Years
Fig. 3: Evolution of imports emulsifiers in tons (2008-2015)
evolution of protein concentrates imports reflected anincrease in imports of protein concentrates fromJanuary-December of each year during the study period(except in 2013 as a result of the political unrest), with asignificant increase in early 2014 and until the end of the studyperiod. This may be due to the inability of local alternativeprotein concentrates on meeting the needs of the dairyindustry in Egypt. By measuring the general time directionequations that are shown in the Table 4 the evolution ofimports quantity protein concentrates in Egypt showed that,the quantity of imports shows an increased significantstatistical trend with an annual increment of about 11.57 t,representing about 2.47% of the overall average of about468.2 t. The value of the coefficient of determination RG2
illustrated that 71% of the emerging changes in the amountof imports was mainly due to the time factor and theremaining were due to other factors not measured infunction during the study period. Also, the general timetrend equation indicates the import value of proteinconcentrates in Egyptian pound and dollar, respectively toincrease statistical moral about 111.253 thousand pounds,about 13.838 thousand dollars and representing about2.22 and 1.85% of the average value of imports, respectively.As well as, the value of the coefficient of determinationRG2 to 68 and 62%, respectively, of changes in the value ofimports was due to the time factor and the rest wasattributable to other factors not measured in function duringthe study period.
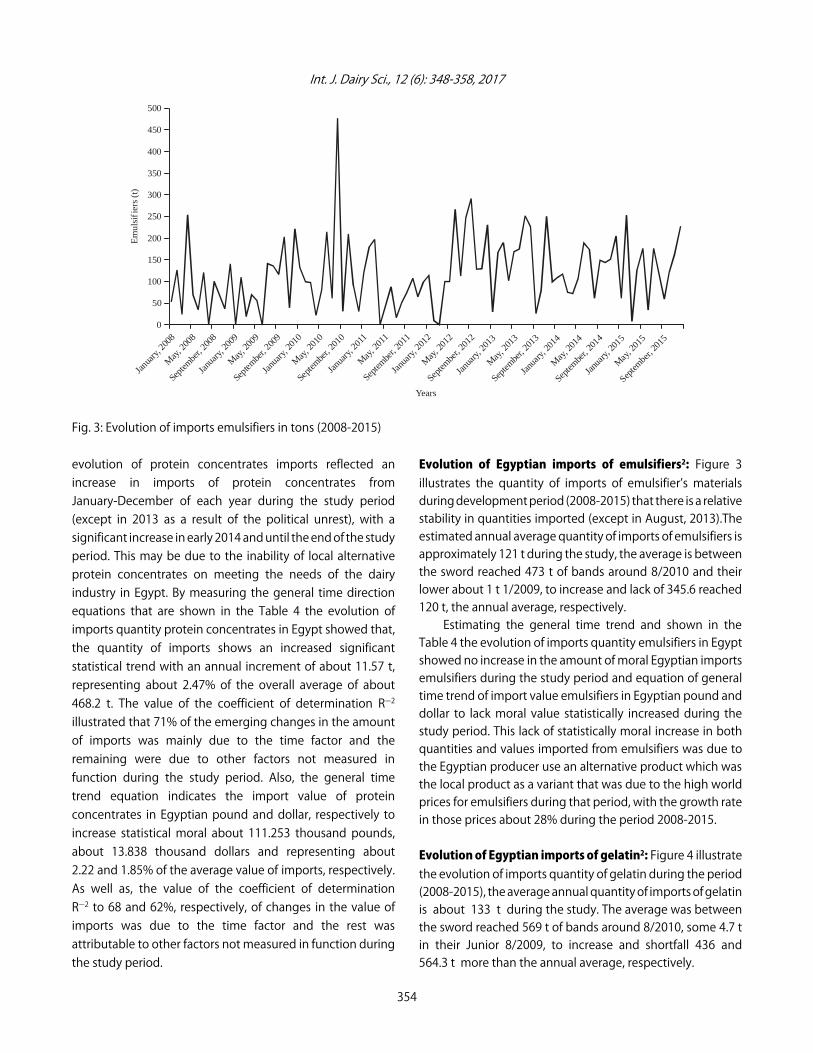
Evolution of Egyptian imports of emulsifiers2: Figure 3illustrates the quantity of imports of emulsifier’s materialsduring development period (2008-2015) that there is a relativestability in quantities imported (except in August, 2013).Theestimated annual average quantity of imports of emulsifiers isapproximately 121 t during the study, the average is betweenthe sword reached 473 t of bands around 8/2010 and theirlower about 1 t 1/2009, to increase and lack of 345.6 reached120 t, the annual average, respectively.
Estimating the general time trend and shown in theTable 4 the evolution of imports quantity emulsifiers in Egyptshowed no increase in the amount of moral Egyptian importsemulsifiers during the study period and equation of generaltime trend of import value emulsifiers in Egyptian pound anddollar to lack moral value statistically increased during thestudy period. This lack of statistically moral increase in bothquantities and values imported from emulsifiers was due tothe Egyptian producer use an alternative product which wasthe local product as a variant that was due to the high worldprices for emulsifiers during that period, with the growth ratein those prices about 28% during the period 2008-2015.
Evolution of Egyptian imports of gelatin2: Figure 4 illustratethe evolution of imports quantity of gelatin during the period(2008-2015), the average annual quantity of imports of gelatinis about 133 t during the study. The average was betweenthe sword reached 569 t of bands around 8/2010, some 4.7 tin their Junior 8/2009, to increase and shortfall 436 and564.3 t more than the annual average, respectively.
354

Int. J. Dairy Sci., 12 (6): 348-358, 2017
Januar
y, 200
8
May, 20
08
Septe
mber, 2
008
Januar
y, 20
09
May, 20
09
Septe
mber, 2
009
Januar
y, 20
10
May, 20
10
Septe
mber, 2
010
Janua
ry, 20
11
May, 2
011
Septe
mber, 2
011
Janua
ry, 20
12
May, 20
12
Septe
mber, 2
012
Januar
y, 20
13
May, 20
13
Septem
ber, 2
013
Janua
ry, 20
14
May, 20
14
Septe
mber, 2
014
Janua
ry, 20
15
May, 2
015
Septem
ber, 2
015
600
500
400
300
200
100
0
Gel
atin
(t)
Years
Fig. 4: Amount of imports of gelatin in tons (2008-2015)
The evolution of imports of gelatin indicate that there wasa relative stability in the amount of imports with spikes inimports during the third quarter of 2009, 2010 and 2011, dueto some constraints for local gelatin industry in Egypt such asthe spread of foot-and-mouth disease, which affected thenumber of the slaughtered animals (which was the maincomponent of the MCD gelatin).In addition, there were aresome governmental decisions to transfer tanneries (rattangelatin) to other industrial areas away from the residentialblocks, which affecting the quantities produced of gelatinlocally and imported alternative manufacturers. Also, resultspredicted that the specifications of the imported gelatin wasbest for the dairy industry than the local gelatin, due tolow of the production technology in Egypt of the gelatinmanufacturing processes compared to other countries,indicating the importance of Egyptian side interest to developglobal developments of gelatin industry in this area.
Estimating the general time trend shown in Table 4, theevolution of imports amount to gelatin in Egypt, showed noincrease in those moral quantities imported during the studyperiod. As well as, the equation of general time trend ofEgyptian imports of gelatin in Egyptian pound and dollar,respectively as shown in the same table to increasestatistical moral nearly 72.651,000 pounds, about7.821 thousand $ represent approximately 1.27 and 0.89%of the average value of imports, respectively. The value ofthe coefficient of determination RG2 46 and 28%,respectively, of changes in the value of imports was due
to the time factor and the rest was attributable to otherfactors not measured in function during the study period.
Indicators of the Egyptian imports of dairy supplies andgeographical distribution of major exporting countries12:Egypt depends heavily on European countries to import theproduction requirements for the dairy industry, where theEuropean Union is the largest exporter of such productsworldwide. The results in the Table 5, showed the mostimportant indicators of the Egyptian imports of those itemsinvolved in the manufacture of dairy products during theperiod (2008-2015) which include the following.
C For dairy powder Egypt imports accounted for about1.5% of total world imports, the rate of growth of thequantities imported by Egypt are about 10% in 2015compared to 2008. While, import value growth rate ofEgypt's imports of powdered milk for the same periodwas about 3% and may explain that due to low worldprices of powdered milk from 2013 until early 2015 anddirection of Egyptian importers import larger quantitiesunder the low price. Research results showed that theNew Zealand lies in first place for the most importantdairy exporting countries powder for the Egyptianmarket, followed by Germany and France in second andthird, while they contributed about 25, 8 and 6%,respectively, of total world exports of powdered milk forall the world
355

Int. J. Dairy Sci., 12 (6): 348-358, 2017
C For protein and emulsifiers materials, Egypt importsabout 0.5% of total world imports, the rate of growth ofthe quantities imported by Egypt about 16% in 2015compared to 2008, while import value growth rate ofEgypt's imports of powdered milk for the sameperiod about 14%. The results of the study indicatedthat the Netherlands lies in first place, followed byThailand and Germany in second and third respectively,while they contributed approximately 9, 3 and 9%,respectively
C For gelatin and gels Egypt imports represented about1% of total world imports, the rate of growth of thequantities imported by Egypt about 3% in 2015compared to 2008. Search results indicate that the mostimportant exporters of gelatin to the Egyptian marketthat Brazil ranked first concentrated, followed by Franceand Germany in second and third, while those statescontributed 17, 10 and 13%, respectively, of total worldexports of gelatin
A study of the most important factors affecting theEgyptian imports of production requirements associatedwith dairy products: Pound is considered and the availabilityof foreign currency are the most important determinantsfor the import operation in Egypt, especially imports ofproduction inputs to complete various manufacturingprocesses in general13 and production requirements for dairymanufacturing in particular, through the model used tomeasure the impact of exchange rate on Egyptian imports ofkey inputs used in the manufacture of dairy products.
Regression analysis method was used for linear and Logit Models progress to determine the most importantindependent factors, which may affect the amount of importsof dairy supplies. This model could see devaluations of theEgyptian pound against the dollar on the import of most dairysupplies, as well as the impact of other variables that were
selected. Where, the study found that the best sports picturesare appropriate and consistent with economic and statisticallogic as shown in Table 6.
Estimation results of the statistical model used to measurethe impact of exchange rate on Egyptian imports of keyinputs used in the manufacture of dairy products(2008-2015) indicate that6, 14
First: The Eq.1 in the Table 6 refers to the existence of a directcorrelation between the producer price index and the amountof Egyptian imports of milk powder, the producer price indexby 1% more Egyptian imports of milk powder by about81.99 t, while indicating an inverse relationship between thetotal quantity of imports of milk powder, the official rate of thedollar. Also, found an inverse relationship between thequantity of imports and consumer price index, indicatingproducers bear the burdens of higher production costs thanthe consumer in order to maintain higher prices to ensure aminimum level of consumption ensures continuation ofproduction processes and moral doesn't prove the rest of thefactors. As indicated in Eq. 2 in the double logarithmic inTable 6 that the pound against the dollar and the producerprice index of the most important factors affecting the amountof Egyptian imports of milk powder. So, that the exchange rateof the pound single unit leads to lower Egyptian imports by269 t, model has proven to be moral.
Second: The Eq.3 in the Table 6 the existence of a directcorrelation between the price of the dollar amount of theEgyptian imports of protein concentrates. As it turns outhaving a direct correlation between the producer price indexand the amount of Egyptian imports of protein concentrates,the greater the number of producer prices by 1% moreEgyptian imports of milk powder by about 7.981 t. While,indicating an inverse relationship between the quantity ofimports and consumer price index. While, explaining the
Table 6: Statistical model used to estimate results of measuring the impact of exchange rate on Egyptian imports of key inputs used in the manufacture of dairyproducts (2008-2015)
Variable dependent Number Model Equation RG2 F Sig.Milk powder Eq. 1 Linear Y = -5069.97-542.055x1t-1-97.114x2t-1+81.99x3t-1 (-0.643) (-1.030) (2.076) 0.14 5.075 **
Eq. 2 Logarithm lny = -4.523+0.269 lnX1-0.242 lnX2+2.442 lnX3 (0.184) (-0.779) (1.529) 0.15 5.793 **Protein concentrate Eq. 3 Linear Y = -1920.115+190.51x1t-1-8.826x2t-1+7.981x3t-1 (3.335) (-1.382) (2.979) 0.72 79.20 **
Eq. 4 Logarithm lny = -28.756+1.520 lnX1-0.489 lnX2+6.472 lnX3 (1.263) (-1.915) (4.925) 0.69 71.386 **Emulsifiers Eq. 5 Linear Y = 72.768+13.399x1t-1-2.530x2t-1-0.070x3t-1 (0.617) (-1.043) (-0.068) 0.06 2.068 --
Eq. 6 Logarithm lny = -0.198+0.173 lnX1-0.348 lnX2-1.034 lnX3 (0.112) (-1.067) (0.617) 0.05 1.728 --Gelatin Eq. 7 Linear Y = -32.164-26.336x1t-1-1.061x2t-1+2.192x3t-1 (-0.923) (-0.333) (1.639) 0.05 1.496 --
Eq. 8 Logarithm lny = -22.084-2.378 lnX1-0.302 lnX2+2.442 lnX3 (-1.538) (-0.922) (3.720) 0.25 10.532 ** Estimated value of the dependent variable per annum. **Level of significance (0.01%), non-moral, Source: Compiled and calculated data of the central agencyIy :
for public mobilization and statistics, foreign trade database, the central agency for public mobilization and statistics, published price indices for producers andconsumers
356
Int. J. Dairy Sci., 12 (6): 348-358, 2017
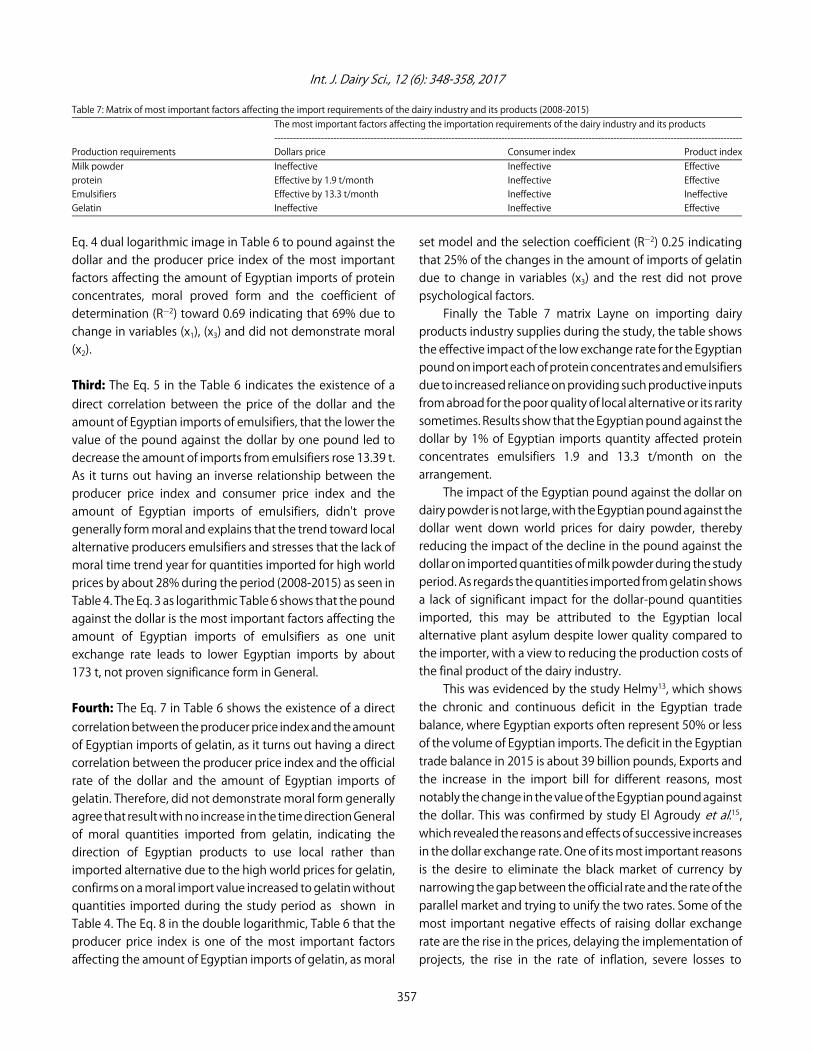
Table 7: Matrix of most important factors affecting the import requirements of the dairy industry and its products (2008-2015)The most important factors affecting the importation requirements of the dairy industry and its products------------------------------------------------------------------------------------------------------------------------------------------------------
Production requirements Dollars price Consumer index Product indexMilk powder Ineffective Ineffective Effectiveprotein Effective by 1.9 t/month Ineffective EffectiveEmulsifiers Effective by 13.3 t/month Ineffective IneffectiveGelatin Ineffective Ineffective Effective
Eq. 4 dual logarithmic image in Table 6 to pound against thedollar and the producer price index of the most importantfactors affecting the amount of Egyptian imports of proteinconcentrates, moral proved form and the coefficient ofdetermination (RG2) toward 0.69 indicating that 69% due tochange in variables (x1), (x3) and did not demonstrate moral(x2).
Third: The Eq. 5 in the Table 6 indicates the existence of adirect correlation between the price of the dollar and theamount of Egyptian imports of emulsifiers, that the lower thevalue of the pound against the dollar by one pound led todecrease the amount of imports from emulsifiers rose 13.39 t.As it turns out having an inverse relationship between theproducer price index and consumer price index and theamount of Egyptian imports of emulsifiers, didn't provegenerally form moral and explains that the trend toward localalternative producers emulsifiers and stresses that the lack ofmoral time trend year for quantities imported for high worldprices by about 28% during the period (2008-2015) as seen inTable 4. The Eq. 3 as logarithmic Table 6 shows that the poundagainst the dollar is the most important factors affecting theamount of Egyptian imports of emulsifiers as one unitexchange rate leads to lower Egyptian imports by about173 t, not proven significance form in General.
Fourth: The Eq. 7 in Table 6 shows the existence of a directcorrelation between the producer price index and the amountof Egyptian imports of gelatin, as it turns out having a directcorrelation between the producer price index and the officialrate of the dollar and the amount of Egyptian imports ofgelatin. Therefore, did not demonstrate moral form generallyagree that result with no increase in the time direction Generalof moral quantities imported from gelatin, indicating thedirection of Egyptian products to use local rather thanimported alternative due to the high world prices for gelatin,confirms on a moral import value increased to gelatin withoutquantities imported during the study period as shown inTable 4. The Eq. 8 in the double logarithmic, Table 6 that theproducer price index is one of the most important factorsaffecting the amount of Egyptian imports of gelatin, as moral
set model and the selection coefficient (RG2) 0.25 indicatingthat 25% of the changes in the amount of imports of gelatindue to change in variables (x3) and the rest did not provepsychological factors.
Finally the Table 7 matrix Layne on importing dairyproducts industry supplies during the study, the table showsthe effective impact of the low exchange rate for the Egyptianpound on import each of protein concentrates and emulsifiersdue to increased reliance on providing such productive inputsfrom abroad for the poor quality of local alternative or its raritysometimes. Results show that the Egyptian pound against thedollar by 1% of Egyptian imports quantity affected proteinconcentrates emulsifiers 1.9 and 13.3 t/month on thearrangement.
The impact of the Egyptian pound against the dollar ondairy powder is not large, with the Egyptian pound against thedollar went down world prices for dairy powder, therebyreducing the impact of the decline in the pound against thedollar on imported quantities of milk powder during the studyperiod. As regards the quantities imported from gelatin showsa lack of significant impact for the dollar-pound quantitiesimported, this may be attributed to the Egyptian localalternative plant asylum despite lower quality compared tothe importer, with a view to reducing the production costs ofthe final product of the dairy industry.
This was evidenced by the study Helmy13, which showsthe chronic and continuous deficit in the Egyptian tradebalance, where Egyptian exports often represent 50% or lessof the volume of Egyptian imports. The deficit in the Egyptiantrade balance in 2015 is about 39 billion pounds, Exports andthe increase in the import bill for different reasons, mostnotably the change in the value of the Egyptian pound againstthe dollar. This was confirmed by study El Agroudy et al.15,which revealed the reasons and effects of successive increasesin the dollar exchange rate. One of its most important reasonsis the desire to eliminate the black market of currency bynarrowing the gap between the official rate and the rate of theparallel market and trying to unify the two rates. Some of themost important negative effects of raising dollar exchangerate are the rise in the prices, delaying the implementation ofprojects, the rise in the rate of inflation, severe losses to
357

Int. J. Dairy Sci., 12 (6): 348-358, 2017
tourism companies, lack of medicines and the rise in the pricesof building and construction materials, especially those thatare imported. Moreover, some of the reasons for raising of thedollar rate are the government’s attention to the economicconference in March, the Central Bank’s last decision to reducethe interest rate on bank deposits to 1%, repaying some of thefinancial obligations, owed by the state.
In 20161, the negative impact of the devaluation of thepound on the foreign trade sector has positive effects onexports and other negative effects on the import bill. Theincrease in the import bill is one of the main negative effectsof the depreciation of the pound in terms of the high cost ofimporting foreign goods.
In light of all this, it was necessary for the government totake some measures that help improve the investment climateand control the exchange market. This was done by allowingthe Egyptian Central Bank to reduce the value of the Egyptianpound against the dollar in order to reduce the differencebetween the official price and the parallel price in particularstages during. In 2015 and this led to a violent earthquake inthe parallel market led to a decrease in the difference betweenthe official and parallel prices and the occurrence of manyrepercussions in the Egyptian economy, the most importantimpact of the devaluation of the pound against the dollar onprices and living standards.
CONCLUSION
The quality of products of gelatin is increased byintroducing modern technologies through specializedprograms. As well as, focus on localization for manufactoriesspecially the protein concentrates used in the food industry.Above all, encourage factories to work for local productsimports whenever possible, especially in relation to rely onlocal gelatin instead of importer. The government should takesome measures to improve the investment climate andcontrol the decline in the exchange rate.
SIGNIFICANCE STATEMENTS
This study reveals the seriousness of the devaluation ofthe pound against the dollar on Egyptian imports and theextent to which the dairy industry in Egypt was affected by thechange in the exchange rate. This helps in the development ofthe productive activity of the food industry in general and thedairy industry in particular. The study will also help theresearcher to uncover the most important factors that affectthe imports of the dairy supplies in Egypt.
REFERENCES
1. Ali, M.S., 2016. The economic effects of the Egyptian poundand mechanisms to handle foreign trade and industrysectors. The Ministry of Trade and Industry Reports.
2. Central Agency for Public Mobilization and Statistics, 2016.Monthly bulletin of foreign trade data. http://www.capmas.gov.eg/Pages/Publications.aspx?page_id=5107&Year=22964
3. Algendy, M., 2009. The global financial crisis, its diagnostics,causes and impacts. European Association of AgriculturalEconomists (EAAE), Parma, Italy, pp: 225-250.
4. Engle, R.F. and C.W.J. Granger, 1987. Co-integration anderror correction: Representation, estimation and testing.Econometrica, 55: 251-276.
5. Abd El-Kader, A.M., 2009. The Standard Economics betweenTheory and Practice. University House for Printing, Publishingand Distribution, Alexandria, Egypt.
6. Central Agency for Public Mobilization and Statistics, 2016.Producer price indices during the period 2008-2015.http://www.capmas.gov.eg/Pages/Publications.aspx?page_id=5107&Year=23117
7. Central Agency for Public Mobilization and Statistics, 2016.General directorate of industrial statistics during the period2012-2015. Central Agency for Public Mobilization andStatistics, Egypt.
8. Marshall, R.T., H.D. Goff and R.W. Hartel, 2003. Formulas andRecipes. In: Ice Cream, Marshall, R.T., H.D. Goff and R.W. Hartel(Eds.). 6th Edn., Springer, USA., ISBN-13: 9780306477003,pp: 343-355.
9. Hofi, A.A., E.H. Youssef, M.A. Ghoneim and G.A. Tawab, 1970.Ripening changes in cephalotyre “RAS” cheese manufacturedfrom raw and pasteurized milk with special reference toflavor. J. Dairy Sci., 53: 1207-1211.
10. Meyer, A., 1973. Processed Cheese Manufacture. 1st Edn.,Food Trade Press Ltd., London, UK., Pages: 329.
11. Trademap.com, 2017. List of supplying markets for a productimported by Egypt. http://www.trademap.org/Country_SelProductCountry_TS.aspx?nvpm=1|818||||2106|||4|1|1|1|2|1|2|3|1
12. FAO., 2016. Detailed trade matrix. Food and AgricultureOrganization of the United Nation. http://www.fao.org/faostat/en/#data/TM
13. Helmy, O., 2015. The influence of the depreciation of theexchange rate on the Egyptian trade balance. The EgyptianCenter for Economic Studies, Egypt, December 2015.
14. Central Agency for Public Mobilization and Statistics, 2016.Monthly bulletin of consumer price index (CPI), during theperiod 2008-2015. http://www.capmas.gov.eg/Pages/Publications.aspx?page_id=5107&Year=23017
15. El Agroudy, N.M., F.A. Shafiq and S. Mokhtar, 2015. The effectof the rise in the dollar rate on the Egyptian economy. MiddleEast J. Applied Sci., 5: 509-514.
358
Related Documents