Report No: ACS7534 Republic of Malawi Diagnostic Trade Integration Study (DTIS) Update Reducing trade costs to promote competitiveness and inclusive growth March 25, 2014 AFTP1 AFRICA Public Disclosure Authorized Public Disclosure Authorized Public Disclosure Authorized Public Disclosure Authorized

Welcome message from author
This document is posted to help you gain knowledge. Please leave a comment to let me know what you think about it! Share it to your friends and learn new things together.
Transcript

Report No: ACS7534
Republic of Malawi
Diagnostic Trade Integration Study (DTIS) Update
Reducing trade costs to promote competitiveness and
inclusive growth
March 25, 2014
AFTP1
AFRICA
Pub
lic D
iscl
osur
e A
utho
rized
Pub
lic D
iscl
osur
e A
utho
rized
Pub
lic D
iscl
osur
e A
utho
rized
Pub
lic D
iscl
osur
e A
utho
rized
ii
Standard Disclaimer:
This volume is a product of the staff of the International Bank for Reconstruction and Development/ The World
Bank. The findings, interpretations, and conclusions expressed in this paper do not necessarily reflect the views of
the Executive Directors of The World Bank or the governments they represent. The World Bank does not guarantee
the accuracy of the data included in this work. The boundaries, colors, denominations, and other information
shown on any map in this work do not imply any judgment on the part of The World Bank concerning the legal
status of any territory or the endorsement or acceptance of such boundaries.
Copyright Statement:
The material in this publication is copyrighted. Copying and/or transmitting portions or all of this work without
permission may be a violation of applicable law. The International Bank for Reconstruction and Development/ The
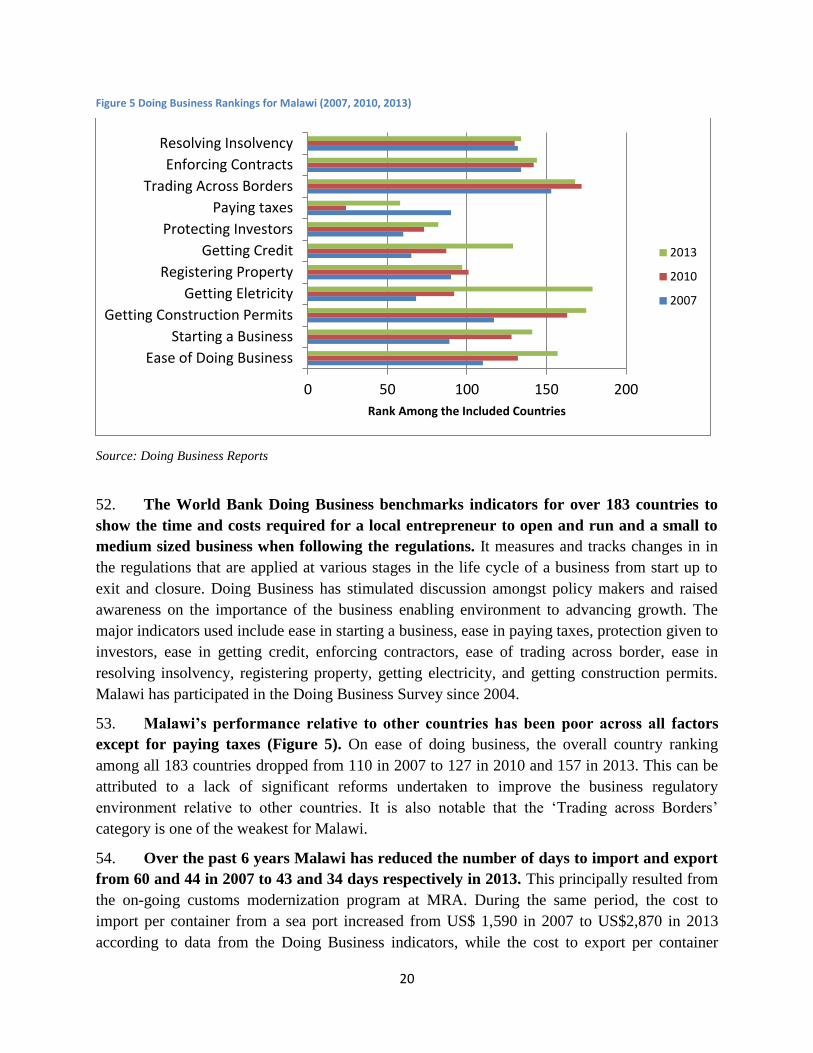
World Bank encourages dissemination of its work and will normally grant permission to reproduce portions of the
work promptly.
For permission to photocopy or reprint any part of this work, please send a request with complete information to
the Copyright Clearance Center, Inc., 222 Rosewood Drive, Danvers, MA 01923, USA, telephone 978-750-8400, fax
978-750-4470, http://www.copyright.com/.
All other queries on rights and licenses, including subsidiary rights, should be addressed to the Office of the
Publisher, The World Bank, 1818 H Street NW, Washington, DC 20433, USA, fax 202-522-2422, e-mail

iii
Table of contents
Executive Summary ............................................................................................................................... 1
Proposed DTIS Update Action Matrix.................................................................................................... 8
Chapter 1. Introduction ................................................................................................................. 10
Chapter 2. Trade and Inclusive Growth ...................................................................................... 14
Macroeconomic Overview .................................................................................................................... 14
Malawi’s trade openness ....................................................................................................................... 17
Malawi Financial Sector ....................................................................................................................... 18
Business Enabling Environment ........................................................................................................... 19
Welfare, Poverty, and Inequality .......................................................................................................... 24
Lessons from the Implementation of the 2004 Action Matrix .............................................................. 25
Chapter 3. Trade Policy and Performance .................................................................................. 27
Malawi’s Export Performance .............................................................................................................. 27
Direction of Imports and Exports.......................................................................................................... 29
Characteristics of Exporters in Malawi ................................................................................................. 31
Multiple Tariff Schedules: MFN and Regional Preferences ................................................................. 33
Regional Trade Preferences .................................................................................................................. 37
Duty Preferences on Imported Inputs ................................................................................................... 40
Summary ............................................................................................................................................... 46
Chapter 4. Non-Tariff Barriers in Malawi .................................................................................. 48
Trade Policy Issues: Import and Export Licenses ................................................................................. 52
Elements of a National Quality Infrastructure ...................................................................................... 55
The National Quality Infrastructure of Malawi: Overview ................................................................... 56
Integrated Border Management ............................................................................................................ 71
Pricing and Competition in the Road Transport Sector ........................................................................ 77
Chapter 5. Trade and Regulatory Polices: Agriculture .............................................................. 83
Agriculture: Background ...................................................................................................................... 83
The Supply of Agriculture Inputs ......................................................................................................... 84
Trade management: tariffs, domestic polices and trade requirements .................................................. 90
Case Study: Trade Costs between Malawi and Zambia at the Mwami/Mchinji Border Crossing ........ 98
Opportunities for Enhanced Trade Competitiveness .......................................................................... 104
Chapter 6. Trade and Regulatory Polices: Professional Services ............................................ 108
Malawi’s main services trade developments and challenges .............................................................. 109
Professional services are essential for Malawi’s growth .................................................................... 115
Explaining the underdevelopment of professional services in Malawi............................................... 122
Recommendations for policy action ................................................................................................... 130
Conclusion .......................................................................................................................................... 133
Appendix 1 – Next steps for implementation .................................................................................. 135
Appendix 2 – DTIS 2003 Action Matrix Scorecard ........................................................................ 139

iv
List of Figures Figure 1: Trends in the Economic Indicators ........................................................................................ 15
Figure 2 Trends in Sector Distribution of GDP .................................................................................... 16
Figure 3 Merchandise Trade as per cent of GDP, 2000-2011 ............................................................... 18
Figure 4 Trade and current-account balance, 2000-2011 ...................................................................... 18
Figure 5 Doing Business Rankings for Malawi (2007, 2010, 2013) .................................................... 20
Figure 6 Trading Across Border Ranks for Malawi and Comparator Countries .................................. 21
Figure 7 Cost to Export (US$/Container) ............................................................................................. 22
Figure 8 Number of Documents to Export ............................................................................................ 22
Figure 9 Time to Export (Days) ............................................................................................................ 23
Figure 10 Cost to Import (US$/Container) ........................................................................................... 23
Figure 11 Export Concentration: Malawi and Comparators ................................................................. 28
Figure 12 Element of a National Quality Infrastructure ....................................................................... 56
Figure 13 Standards Development in MBS .......................................................................................... 59
Figure 14 Percentage of Rejected Spring Balances by MBS 2007-2012 .............................................. 66
Figure 15 Functional Allocation of Malawi’s Agriculture Budget (% of total) .................................... 85
Figure 16 Nitrogen Based Fertilizer Prices in 2010 (USD per ton of nutrients) ................................... 86
Figure 17 Malawi’s adjusted trade openness in services .................................................................... 109
Figure 18 Structure of goods and services trade (%), Malawi and comparators 2011........................ 110
Figure 19 Value of goods and services trade, Malawi and comparators 2011 .................................... 110
Figure 20 Growth rates of services trade, Malawi and comparators ................................................... 110
Figure 21 Composition of services trade (%), Malawi and comparators 2011 ................................... 111
Figure 22 FDI in Malawi and comparators, 2006-2011 ...................................................................... 112
Figure 23 Services Trade Restrictiveness Index, Malawi and comparators ....................................... 114
Figure 24 Malawi’s Services Trade Restrictiveness Index by type of service .................................... 114
Figure 25 Average Productivity of Users vs. Non-Users of Professional Services ............................ 116
Figure 26 Usage of professional services in Malawi and COMESA, %............................................. 116
Figure 27 Usage of professional services in Malawi and COMESA, %............................................. 118
Figure 28 Number of accountants per 100,000 inhabitants ................................................................ 119
Figure 29 Figure 29 Number of lawyers per 100,000 inhabitants ...................................................... 119
Figure 30 Average gross monthly wage of accounting professionals (USD) ..................................... 120
Figure 31 Average gross monthly wages of engineering professionals (USD) .................................. 121
Figure 32 Export of professional services, Malawi and comparators ................................................. 121
Figure 33 Modes of supply, professional services exports in APEI countries .................................... 122
Figure 34 Overall Regulation Index Accounting ................................................................................ 123
Figure 35 Overall Regulation Index Legal ......................................................................................... 124
Figure 36 Top regulatory constraints to professional services providers in Malawi .......................... 126
Figure 37 Top regulatory constraints faced by Malawian professional services providers abroad .... 127
Figure 38 Services Trade Restrictiveness Index Accounting ............................................................. 128
Figure 39 Services Trade Restrictiveness Index Legal ....................................................................... 129
v
List of Tables Table 1 Selected Social and Demographic Indicators: Malawi and SSA, 2012 ................................... 24
Table 2 Summary of Implementation of DTIS 2004 Action Matrix .................................................... 25
Table 3 Malawi Exports 2005 – 2011 (US $ million) ........................................................................... 29
Table 4 Malawi Export Shares 2005 – 2011 ......................................................................................... 29
Table 5 Malawi Imports by Country of Origin and Exports by Destination (per cent) ........................ 30
Table 6 Share of Total Exports Accounted for By Top Exporters - Malawi 2009-2012 ...................... 31
Table 7 Distribution of Malawi’s Exports across Sectors ..................................................................... 32
Table 8 Malawi 2013 Tariff Structure .................................................................................................. 34
Table 9 Sector Groups: Tariffs, Collection Rates, Imports and Exports............................................... 35
Table 10 Malawi Customs Tariff Schedules ......................................................................................... 36
Table 11 Summary of Tariff Line Changes, 2007-2012 ....................................................................... 36
Table 12 Malawi Tariff Removal Commitments under the SADC Trade Protocol .............................. 38
Table 13 Malawi Value of Tariff Preferences under SADC and Aggregate: 2012 .............................. 39
Table 14 Imports, Customs Duties and Preferences on Imports from South Africa, 2012 ................... 40
Table 15 Geographical Share of Imports and Duty Preferences, 2012 ................................................. 41
Table 16 Imports, customs duties and customs rebates, 2005-2012 ..................................................... 42
Table 17 Imports, Customs Duty Collected and Duty Rebates by Tariff (2005 and 2012) .................. 42
Table 18 Schedule 8 Import Duty Concessions, 2009 – 2012 (MK million) ........................................ 43
Table 19 List of Manufacturing Industries Eligible for Tariff Rebates ................................................ 44
Table 20 Tripartite NTB Reporting Mechanism, 2009-2013 ................................................................ 49
Table 21 Cross Country Comparison of ITC NTM Firm Level survey results .................................... 50
Table 22 List of Agriculture Commodities Requiring a Trade Permit 2013 ........................................ 54
Table 23 Consignments inspected under the Quality Monitoring Schemes 2008-2013 ....................... 62
Table 24 Samples Tested in the Testing Service Department ............................................................... 64
Table 25 Revenue of the Malawian Bureau of Standards 2009-2012 .................................................. 68
Table 26 Distance by Road to the ports and Indicative Transport Prices ............................................. 77
Table 27 Characteristics of Main International Transport Corridors .................................................... 78
Table 28 Costs Quoted to Evaluate Soybean Varieties (2011/12 Season) ............................................ 88
Table 29 Import Tariffs and VAT Rates for Selected Agriculture Commodities ................................. 91
Table 30 Overview of Agriculture Import and Export Requirements .................................................. 93
Table 31 Cost of Formal Rice Exports to Zambia at Mchinji (30t and 7t truck) .................................. 99
Table 32 Cost of Formal Rice Exports to Zambia at Mchinji (2t – with(out) using COMESA STR) 101
Table 33 Cost of Formal Maize Meal Imports from Zambia at Mchinji (30t and 7t truck) ............... 103
Table 35 Malawi’s trade in services, 2011 ......................................................................................... 111
Table 36 performance indicators for selected services sectors ........................................................... 113
List of Boxes
Box 1: Example of Effective Rate of Protection ................................................................................... 45
Box 2: The Importance of Regional Agriculture Trade ........................................................................ 84
Box 3: Domestic Regulation in Professional Services in Malawi ...................................................... 125
Box 4: Explicit trade barriers affecting professional services in Malawi ........................................... 129
Box 5: Regulatory initiatives that could be used as a model by the COMESA countries .................. 132

vi
ABBREVIATION AND ACRONYMS
ADD Agricultural Development Division
ADMARC Agricultural Development and Marketing Corporation
AGOA African Growth and Opportunity Act
APEI Accelerated Program for Economic Integration
ASYCUDA Automated System for Customs Data
ATCC Agriculture Technology Clearing Committee
CAGR Compound Average Growth Rates
CD1 Currency Declaration Form
CET Common External Tariff
CFA Clearing and Forwarding Agent
COMESA Common Market for Eastern and Southern Africa
CPC Customs Process Codes
DFID Department for International Development
DTIS Diagnostic Trade Integration Study
DTI Direct Trader Input
EDF Export Development Fund
EAC East African Community
EIF Enhanced Integrated Framework
EQCS Export Quality Certification Scheme
ERP Economic Recovery Plan
FDI Foreign Direct Investment
FISP Farm Input Subsidy Program
GDP Gross Domestic Product
GCI Global Competitiveness Index
GMO Genetically Modified Organism
GNI Gross National Income
GOM Government of Malawi
HS Harmonized System
IAF International Accreditation Forum
IHS3 Third Integrated Household Survey
ILAC International Laboratory Accreditation Cooperation
ITC International Trade Center
IMF International Monetary Fund
IQMS Import Quality Monitoring Scheme
MAST Multi-Agency Support Team
MBS Malawi Bureau of Standards
MCCCI Malawi Confederation of Chambers of Commerce and Industry
MDG Millennium Development Goals
MGDS Malawi Growth and Development Strategy
MFN Most Favored Nation
MIT Ministry of Industry and Trade
MoAFS Ministry of Agriculture and Food Security
MRA Malawi Revenue Authority

vii
MTS Metrology Service Department
NAB National Accreditation Body
NASFAM National Smallholders Farmers Association of Malawi
NES National Export Strategy
NQI National Quality Infrastructure
NSB National Standards Bureau
NSC National Steering Committee
NTB Non-Tariff Barrier
NTM Non-Tariff Measures
QASP Quality Assurance Services Department
SABS South African Bureau of Standards
SACU Southern African Customs Union
SADC Southern African Development Community
SANAS South African National Accreditation Service
SFFRFM Smallholder Farmers Fertilizer Revolving Fund
SPS Sanitary and Phyto-Sanitary Measures
SOCAM Society of Accountants in Malawi
SPAC Standards Policy Advisory Committee
SQAM Standardization, Quality Assurance, Accreditation and Metrology
STR Simplified Trade Regime
TBT Technical Barriers to Trade
TIR Transports Internationaux Routiers
TPRM Trade Policy Review Mechanism
UNCTAD United Nations Commission on Trade and Development
VAT Value Added Tax
WEF World Economic Forum
WFP World Food Program
WTO World Trade Organization

viii
Acknowledgements
At the request of the Government of Malawi, the World Bank took the leading role in the
preparation of this DTIS Update. The core members of the team were: Mombert Hoppe, Task
Team Leader, Robert Kirk, Lead Consultant (overall write-up and trade policy), Nora Dihel
(services), Alan Hall (trade facilitation), John Keyser (agriculture), Temwa Gondwe (Trade and
Inclusive Growth), Axel Mangelsdorf (National Quality Infrastructure), Ana Fernandes (Export
Dynamics), Felix Maoni (trade data), Masuako Chamkakala (Survey for Trade in Services),
Jonathan Said (Review of 2003 Implementation Matrix), Deliwe Ziyendammanja (Team
Assistant) and Tamara Glazer (research assistance on the tariff schedules).
The analysis in the report benefited greatly from very helpful comments and feedback provided
by Paul Brenton, Julian Clarke, Martin Humphreys, Praveen Kumar, Charles Kunaka, James
Markland, Tadatsugu Matsudaira, Appolenia Mbowe, Gerard McClinden, Mark Pearson, and
John Panzer among others.
The DTIS update was elaborated in close cooperation with counterparts in the Malawi
government, including the EIF Coordinator Nelson Nsiku at the Ministry of Industry and Trade,
(MIT) who assisted with updating the implementation status of Action Matrix projects, Edwin
Starch from the MRA, who assisted in obtaining critical customs data, and the Director and staff
from the Malawi Bureau of Standards. The team also wishes to thank the EIF Donor
Coordinator, Milika Kalyati for facilitating meetings with the donor community and for
providing valuable insights during the two team missions. The report also benefited from the
constructive comments provided by the EIF Secretariat in Geneva and the EIF Board on the
Concept Note and the draft Final Report.
The DTIS update team would also like to thank the numerous stakeholders from the public and
private sectors who provided helpful insights during the team missions undertaken in 2012 and
March 2013, and during the two validation workshops held in Lilongwe and Blantyre in
November 2013. These include Mr. Nebert Nyirenda the Principal Secretary MIT, and Christina
Zakeyo Chatima, Director for Foreign Trade MIT, the MCCCI and many private sector
representatives for their extensive cooperation and the valuable time spent with the DTIS update
team.
1
Executive Summary
1. The Government of Malawi (GOM) is committed to reducing poverty through
increasing employment-generating growth and has prioritized the expansion and
diversification of exports in the Malawi Growth and Development Strategy (MGDS) II, the
National Export Strategy (NES) and the Economic Recovery Plan (ERP). The 2012
economic reforms restored macroeconomic stability and improved the business enabling
environment. While this provides a solid foundation for building competitiveness and increasing
investment, the government also realizes that reducing trade costs will be essential to improve
competitiveness, stimulate inclusive economic growth and encourage economic diversification.
Smaller producers and farmers often face particular difficulties in overcoming trade costs which
are incurred per transaction and need to be distributed over smaller trade volumes. Reducing
trade costs will therefore allow particularly smaller producers and farmers to enter new markets,
thereby generating new growth and employment opportunities for a wider range of economic
actors.
2. The absence of significant product diversification over the past decade reflects
Malawi’s inability to enter or join global or regional supply chains because trade costs are
simply too high. Reducing trade costs will enable all sectors of the economy to obtain imports at
more competitive prices and increase the competitiveness of Malawian exports in both
neighboring and international markets, opening up opportunities for Malawi to participate in
both regional and global supply chains. Recent changes in the global economy have changed the
economic landscape, with many industrial markets stagnating while strong economic growth
took place in emerging countries, including in Malawi’s neighbors. There are significant new
opportunities in neighboring countries that could be exploited, and a number of companies
indicated they had already identified potential opportunities, demonstrating opportunities for
regional linkages in the short run.
3. Lowering trade costs is essential if Malawi is to move from being dependent on a
narrow range of resource based activities to more diverse higher value activities.
Successfully diversifying into new production and service sectors requires increasing
engagement in international trade both regionally and internationally. Recognizing the necessity
for this transition, the government of Malawi developed a NES, which establishes a road map
aimed at diversifying the production base and puts in place an inter-governmental coordination
mechanism for implementation. The NES identifies three priority sectors in which Malawi has a
potential comparative advantage. These include oil seeds, sugar cane products and agro-
manufactures, in addition to the existing clusters. The NES recognizes that achieving economic
diversification requires a positive business enabling environment, appropriate supporting
institutions and increased training and empowerment for workforce development.
4. To complement the recommendations of the NES and to help prioritize trade policy
reforms, this DTIS Update focuses on the importance of reducing trade costs and identifies
the key cross-cutting policy constraints to trade. Addressing these cross-cutting barriers to
2
trade integration which mainly result from high trade costs, is a prerequisite for the success of
the very valid sector-specific recommendations developed under the NES. This DTIS therefore
complements the analysis undertaken as part of the NES and proposes a series of targeted
reforms to promote competitiveness, deliver employment creating and poverty reducing
inclusive growth, through mainstreaming trade into the MGDS II and the ERP. Implementing the
recommendations of this report will be critical to the success of the NES and other strategies.
5. Infrastructure constraints remain a critical issue for Malawi and initiatives to
address them are under way and need to be further supported however, it is also necessary
to focus on the ‘soft infrastructure’. Recognizing that the (Enhanced) Integrated Framework
and the DTIS’s (including the 2003 DTIS for Malawi) have not been effective in addressing
many of the broader issues requiring large-scale physical investments in most countries, this
DTIS Update focused on specific trade related policy and regulatory issues within the mandate
and policy space of the Ministry of Industry and Trade (MIT) and the National Implementation
Unit (NIU).
6. Regional Integration can play a key role in reducing trade costs as long as
commitments are implemented and the regional agenda is premised on a vision of creating
an open, internationally competitive market in goods and services. As a landlocked economy
Malawi is dependent on transport corridors and ports in neighboring countries for all their trade.
Unreliable and unpredictable delivery times prevent producers from competing in regional and
international markets and serve to highlight the importance of the GOM actively engaging in
regional cooperation initiatives (COMESA, SADC, TFTA) to harmonize regulations and fast-
track the reduction in non-tariff measures where possible (for example through the Accelerated
Program for Economic Integration (APEI) and the tripartite NTM-elimination mechanism).
Malawi also stands to benefit from the successful outcome of the WTO Negotiations on Trade
Facilitation. A comprehensive agenda to reduce trade costs through lowering tariffs, removing
loopholes, and addressing Non-Tariff Measures (NTMs) will encourage investment. The recently
adopted APEI Action Matrix represents a welcome development and is consistent with the
recommendations contained in the DTIS Update.
7. However, opportunities for Malawi to supply neighboring countries with
agricultural and agro-food products are currently held back by restrictions on trade. These
include licensing limitations on agricultural inputs (which restricts choice), protection of local
transport providers which increase costs, import and export licensing and minimum prices.
Policies that restrict trade in basic commodities with the aim of promoting food security serve to
destabilize growth, encourage illegal trade, increase price variation, discourage production for
sale by smallholders and ultimately reduce the living standards of the most vulnerable groups in
society. Such policies are inconsistent with the objectives set out in the NES, ERP, and MDGS
II.
8. It is therefore essential that the trade agenda is effectively integrated and
mainstreamed into Malawi’s development strategy. The recent launch of the NES by
3
President Banda in December 2012, and the subsequent release of the second draft of the
National NTB Elimination Strategy in May 2013 signal the mainstreaming of trade issues into
the national development agenda, although inconsistencies across various policies remain and
need to be addressed comprehensively. These positive developments indicate a break from the
earlier marginalization of the DTIS 2003 Action Matrix where only 8 actions out of 67 were
fully implemented. Limited or no progress was recorded in strengthening institutional capacity
for effective coordination, negotiation and implementation of trade agreements, reducing the
adverse trade impact of non-tariff measures, and export diversification. Overall, the lack of
implementation of the recommendations of the 2003 DTIS Action Matrix mainly resulted from
the absence of a constituency or high level champion with the mandate, capacity and
commitment to push through cross-cutting reforms that require coordination among various
ministries (paragraphs 63-68).
9. Learning from the past experience of many similar studies, this DTIS Update
presents a very focused and prioritized updated Action Matrix that can guide policy
making going forward. Lessons from earlier DTIS throughout the world show that developing a
long list of constraints and hurdles is not helpful in framing priorities and mobilizing the
necessary inter-agency and diverse stakeholder commitment to reform required to effect change.
Focusing on national level policy issues in need of strong political support and broad stakeholder
engagement, the authors hope the prioritized policy matrix with key activities will serve as an
effective basis for dialogue among the various government ministries, business and civil society
and also in the dialogue with development partners. Addressing the limited and focused priority
activities will have a significant impact and should be achievable with strong leadership of the
MIT, high-level support from the Ministry of Finance and the President’s office, strong linkages
with other strategies such as the NES, and strong support from the development partners. The
implementation mechanism established under the NES could therefore be used to ensure priority
recommendations of the DTIS update will be implemented and coordinated with the NES.
10. For Malawi to increase export growth and diversification, key policy barriers in five
areas need to be addressed. These include a) reviewing the trade policy framework to make
it more transparent and neutral, and increase transparency in its implementation; b) reviewing
existing Non-Tariff Barriers resulting from outdated technical regulations and the way these
are applied at borders; c) improving trade logistics by improving border and transit procedures
and increasing competition in the transport sector with a view to shorten delivery, increase
reliability and reduce costs; d) address a number of binding constraints facing the expansion of
agricultural trade and trade in agro-industrial products; and e) addressing key regulatory
constraints increasing the cost (and reducing availability) of professional services.
11. Trade policy should be revised to simplify the multiple schedules and adopt a
transparent and well publicized policy on eligibility for duty rebates (paragraph 125). The
tariff schedule is characterized by multiple tariffs-many of which are less than 5 per cent on
preferential imports- and widespread and non-transparent exemptions (virtually exclusively

4
restricted to large enterprises). A large number of products continue to require import and export
licenses (paragraphs 140-146). Even though the Cabinet has taken a decision to reduce the
number of products requiring such export permits from 25 to 10, this policy remains to be
implemented. Implementation of this policy should be a priority, and the government should
work towards eliminating all non-automatic requirements as it will encourage increased
production in agriculture.
12. Malawi imposes many NTMs which increase the landed price of imports and the ex-
factory price of finished products. Most of these result from the import inspections mandated
under the Import Quality Monitoring Scheme, which often duplicate tests undertaken by
qualified laboratories in countries of origin. Unlike tariffs, NTMs are non-transparent may also
have a differential impact on producers depending on their size or the products. NTMs must be
assessed on a case-by-case basis and developing transparent NTMs that minimize restrictions on
trade requires countries to pursue a best practice approach to regulation that highlights the
importance of transparency and dialogue and the need to draw heavily on international norms
and best practices. As a priority all new mandatory technical regulations should be publicized
with time allowed for discussion and subjected to a regulatory impact assessment.
13. The list of mandatory standards should be reduced and redundant mandatory
testing eliminated to enable Malawi Bureau of Standards (MBS) to focus on ensuring
product safety while facilitating competitiveness and meeting its role in implementing the
National Quality Policy (paragraphs 195-202). Ensuring citizens have access to safe and
healthy food products and reliable consumer goods represent important and legitimate public
policy objectives and are addressed through the National Quality Infrastructure. The MBS
currently implements its mandate largely through controls at borders, with many of the activities
more focused on revenue generation rather than advancing consumer safety and promoting
competitiveness. Eliminating the mandatory testing for imports of products with certificates from
regional or internationally accredited conformity assessment bodies by gradually introducing risk
analysis on such shipments under the IQMS, and increasing the role of post market surveillance,
would allow the MBS to take a more targeted approach to addressing consumer concerns. It is
also recommended that the MBS adopt a more transparent pricing policy, review the list of
mandatory standards and request SADC and COMESA partners to recognize MBS tests.
Increasing market surveillance would justify the MBS receiving a subvention from the GOM.
14. Existing regulations and procedures impose higher fixed costs on small companies
relative to large commercial activities, stifling export diversification and effectively
discriminating against such smaller economic operators. Analysis of trade data at the
transaction level reveals that exporters in Malawi are dominated by a small number of long
established large traders exporting a narrow range of products dominated by agricultural
products. New entrants moving into new markets with new products are conspicuously absent or
frequently do not manage to sustain exports for more than one year and consequently to generate
sustainable new employment. Key factors contributing to this outcome include high fixed costs

5
of exporting resulting from the unpredictability of applied trade policy such as burdensome and
non-transparent border and other administrative procedures, as well as high transport costs.
15. While Malawi has made progress in modernizing customs clearance procedures
since the earlier DTIS, the Update identified considerable scope for reducing transit times,
increasing reliability and lowering trade costs (paragraphs 221-223). An effective regional
transit mechanism (paragraphs 224-229) remains a goal, and multiple border agencies undertake
duplicative and redundant checking and demand redundant submission of information. This
increases delays and information on current border charges and procedures are not readily
available. The government has realized that the lack of coordination among multiple border
agencies represents a key constraint and Cabinet has taken a decision in March 2013 to reduce
the number of agencies from 14 to 5. This is an important and welcome development although
implementation is still pending. Positive effects will only be felt by the trading community once
this decision is implemented, so implementation should be a priority. Complementing this
reform, it will be important to establish a National Trade Portal that would bring together all the
information and forms required for moving goods across the border and would serve large and
small traders. Increased transparency regarding the correct application of trade policies and
administrative procedures would increase the predictability of trade costs and transit times,
making it easier for companies to integrate into regional and global value chains.
16. High trade costs result from long supply routes (a factor outside the control of the
government) and high domestic freight rates that remain more than 20 times higher than
international freight rates (paragraphs 230-246). Reducing high domestic transport costs is a
priority and demands government to complement investment in feeder roads with regulatory
change. To reduce domestic transport costs, the government could start by gradually removing
cabotage restrictions for domestic road transport that restrict access and result in increased
transport costs within Malawi. Setting clear targets for identifying and opening selected internal
routes for cabotage would increase competition, reduce prices, stimulate demand and increase
the availability of transport options to regional ports, permitting companies to expand the array
of export products and export destinations. At the same time, such a gradual approach coupled
with reviewing current regulations that increase operating cost (such as excise duties on re-
treaded tires, discriminatory use of road user charges across COMESA, or tax incentives) would
reduce concerns in the domestic transport industry about their ability to compete which has
prevented similar reforms in the past.
17. Small traders in basic agricultural commodities exported from Malawi to Zambia
face significantly higher trade costs as the specific fees per transaction result in economies
of scale for the large traders (paragraphs 304-319). The COMESA Simplified Trade Regime
(STR) which eliminates all customs duties fails to compensate for these higher trade costs and is
therefore not widely used. A detailed assessment showed that prices per truck crossing the border
increased with the size of the operation, but that these costs were highly regressive on a per ton
basis, effectively discriminating against smaller traders. A large share of the costs is driven by
6
the costs of permits that are issued per transaction and are therefore highly regressive,
encouraging informal trade. The governments of Malawi and Zambia should work together to
review existing fees and documentary requirements, expand the common list of products
covered, and implement the decision taken in June 2013 to reduce the transaction costs for small
to traders to USD 1.
18. The majority of small traders are women and there are frequent complaints about
harassment by border officials which particularly affect women. This also contributes to
traders choosing informal channels. It will therefore be important to complement the review of
the STR with the publication of a Traders’ Charter that would clearly outline basic rights and
obligations that both traders and border officials have to comply with in local languages.
Identifying constraints that are particularly affecting women traders and establishing an impartial
and anonymous reporting mechanism for complaints would also be critical to support small
traders. These recommendations were strongly endorsed by traders during a workshop with
traders from Malawi and Zambia in Chipata in November 2013.
19. Widespread government intervention in the determination of agricultural prices,
along with regulations governing the access to agricultural inputs and the absence of an
effective system for controlling aflatoxin all contribute to reducing agricultural growth and
lowering rural incomes (paragraphs 321-334). It would be important to establish a phone
(text) based price information system that would increase the access to price information by rural
farmers to increase their negotiation position with intermediaries. At the same time, the
minimum prices established by government fiat should be removed. Cumbersome requirements
for testing new seed varieties and fertilizer mixes constrain farmers from accessing improved and
more competitive inputs. Poor storage conditions increase farm losses and limits trade.
Establishing a public private partnership to introducing a more effective aflatoxin control
mechanism has the potential to substantially increase farmer incomes even at existing levels of
production.
20. Ensuring efficient access to a wide range of services from the backbone services of
transport, electricity and communications to professional services is a key determinant in
international competitiveness and efficiency (paragraphs 336-395). The report identifies the
constraints to the development of professional services, noting how inadequate regulations in
conjunction with a lack of regional cooperation are holding back the development of the national
market for professionals with adverse knock-on effects for competitiveness. The Action Matrix
recommends targeting three major regulatory constraints. This would include easing entry
requirements, eliminating dis-proportionate restrictions that limit competition, establishing
transparent procurement procedures, and reviewing non-transparent licensing procedures.
Undertaking regulatory audits in all examined professional service sectors would be important to
identify specific areas where reforms could be fast-tracked in the context of the COMESA,
SADC, Tripartite and APEI services dialogues. Expanding the growth of the professional

7
services sector and enabling access by small and medium size firms will increase their
productivity.
21. There are no known examples of countries successfully transitioning to middle
income status based on inward looking development. Such policies lead to significant anti-
export bias as companies serve protected domestic markets to capture rents rather than
generating additional growth and jobs by serving export markets. Reducing trade costs and
increasing trade represents the most powerful policy package available to the GOM for reducing
poverty and placing Malawi on the path to meeting the MDG and advancing to middle income
status. Malawi can benefit from the experience of other developing countries that have
effectively traded their way out of poverty.
22. The Draft Action Matrix presented below summarizes the recommended policy
reforms identified in the DTIS Update and outlined in this section. They are all critical to
reducing trade costs and thereby permitting Malawian enterprises and farmers to more
successfully compete in regional and global markets and achieving the government’s stated
policy objectives of expanding and diversifying exports for increased economic growth.

8
Proposed DTIS Update Action Matrix
Identified Constraint Action Responsible Agencies Priority/Difficulty/Payoff
I Trade Policy
Multiple Tariffs/Nuisance Tariffs Review tariff policy to eliminate tariffs on
all items currently 5 per cent or less, reduce
tariff peaks and reduce/tariffs on inputs
MOF/MRA High/Low/Modest
Tariff Exemptions/Trade
Bans/Export restrictions/Trade
licenses
Adopt and Publicize a clear policy on tariff
exemptions and preferences and restricted
products, minimize products requiring
import and export licenses
MIT/MOF/MRA/MoAFS High/High/High
Removal of existing NTB and
prevention of new NTM
Review and remove existing priority NTBs.
All new Regulation Measures to be
publicized and subject to Regulatory
Impact Assessment.
MIT/MoAFS/Ministry of
Transport
High start with preventing new
NTM/Medium/High
National Quality Infrastructure Implement NQI, gradually eliminate
compulsory testing for imports from
regional partners and those with certificates
from internationally accredited conformity
assessment bodies by gradually introducing
risk analysis on such shipments, review and
reduce the list of mandatory standards,
request SADC partners to recognize MBS
tests. Increase the role of market
surveillance.
MIT/MoAFS/MBS High/Medium-need to address
MBS revenue and safety concerns/
High
Improve the operation of the
Simplified Trade Regime and
increase transparency at borders to
reduce discrimination against
small traders
Reduce the processing fee for use of the
STR, review fees required for obtaining
permits for import and export, expand the
common list of products benefitting under
the STR, implement the Charter for Cross-
Border Trade, and identify specific
constraints impacting on women traders
MIT/MoAFS/MBS High/Difficult requires multi-
agency coordination/positive
welfare impact on lower income
groups
II Trade Logistics, Transit and Customs
Absence of a regional transit
mechanism
Work with regional partners to introduce a
TIR scheme
MIT/MOF/Ministry of
Transport
Multiple Border Agencies Amend legislation to empower the core MRA/All Agencies at the High/Difficult required multi

9
resulting in delays border agencies –MRA and Immigration to
perform cross border functions.
Border agency coordination
Difficulty in obtaining information
on trade rules and regulations
Introduce a National Trade Portal that
would contain all legally binding
information on trade procedures, easily
accessible to the public
MRA/MOF/MIT High/ Medium/Donor Interest in
financing
Cabotage restrictions increase
transport prices
Using a gradual but time-bound approach,
identify selected internal routes and reduce
restrictions on foreign truckers delivering
and collecting goods in Malawi
Ministry of Transport High/Difficult
III Agriculture
Absence of market-based price
information for agricultural
commodities
Introduce SMS based price information and
dissemination system
MoAFS in partnership
with a private firm or
NGO
Use of minimum prices for
agricultural commodities
Phase out the use of statutory minimum
prices
MoAFS in partnership
with a private firm or
NGO
Regulations governing access to
agricultural inputs
(seeds/fertilizer)
Review Seed Act and fast track
implementation of SADC Harmonized
Seed System
Fast track system allowing for increased
regional trade in fertilizer
MoAFS with MIT
Lack of effective system for
aflatoxin control
With private sector and parastatal
marketing companies develop and
implement a strategy to promote testing of
aflatoxin at first point of sale and provide
trading in simple storage techniques and
other cost-effective control methods
MoAFS (Plant Health
Office) with private
sector, ADMARC and
other crop traders
IV Professional Services
Non-transparent procurement
procedures; Lengthy and
burdensome licensing
/accreditation procedures, and
competition issues
Fast-track regulatory audits in all examined
professional service sectors, and work to
fast-track reforms in the context of the
COMESA, SADC, Tripartite and APEI
services dialogue
MIT, Professional
Associations, Employers’
Association
High/Difficult as opening
protected sectors to competition
when the Professional
Associations influence the
regulations/high

10
Chapter 1. Introduction
23. The Diagnostic Trade Integration Study (DTIS) Update identifies the trade related
constraints holding back Malawi from diversifying and deepening its production base, and
increasing trade. The Update takes stock of the progress in implementing the priority
recommendations from the earlier 2004 DTIS study (specifically the Action Matrix agreed at the
Stakeholder Meeting in 2003) and focuses on identifying and quantifying the trade costs
constraining Malawi’s competitiveness within regional and international markets as the basis for
developing a streamlined and updated Action Matrix.
24. The GOM prioritizes poverty reduction through creating employment, expanding
exports, and diversifying productive activities to achieve the goals of Vision 2020, the
Malawi Growth and Development (MGDS II), the Economic Recovery Plan (ERP) and the
National Export Strategy (NES). The MGDS and the ERP commit to ensuring macroeconomic
stability and improving the business enabling environment to stimulate growth. The NES sets out
a road map for diversifying the production base through identifying priority sectors in which
Malawi is perceived to have a comparative advantage. Realizing economic diversification and
attracting investment in value added activities requires a reduction in trade costs. The DTIS
Update identifies and quantifies specific trade costs that determine the availability and price of
inputs and the ability of producers to get their products to regional and international markets. The
report focuses on tariff policies, regulatory issues impacting on trade, trade facilitation and
logistics, and policies affecting agricultural trade and trade in services.
25. While Infrastructure constraints remain a critical issue for Malawi and initiatives to
address them are under way and need to be further supported, it is also necessary to focus
on the ‘soft infrastructure’. Recognizing that the (Enhanced) Integrated Framework and the
Diagnostic Trade Integration Studies (including the 2003 DTIS for Malawi) have not been
effective in addressing many of the broader issues requiring large-scale physical investments in
most countries, this DTIS Update focused on specific trade related policy and regulatory issues
within the mandate and policy space of the Ministry of Trade and the National Implementation
Unit or similar implementation mechanisms.
26. This section provides a short introductory overview of the key themes contained in
the main report. Chapter 2 outlines the current macroeconomic position and the level of trade
openness, summarizes the status of the business enabling environment. The chapter draws out
the linkages between the Vision 2020 and Growth and Development Strategy to reducing
poverty, creating employment through inclusive growth and the importance of expanding trade.
Finally the chapter summarizes the progress made in implementing the recommendations from
the earlier Action Matrix.

11
27. Chapter 3 describes Malawi’s current trade policy with a detailed review of the
existing tariff schedules. The nominal rate of protection is followed by an outline of the
effective rates of protection which takes into account the impact of tariffs on both the inputs and
the final product. Increasing export growth and diversifying the production base requires a more
neutral trade policy along with the ability to source inputs and deliver the final product at more
internationally competitive prices. A neutral trade policy will consider Malawian consumers and
not simply prioritize import competing industries or large exporters. The current trade regime
creates incentives to produce for the domestic market as firms recover the high costs of their
intermediate inputs through increasing the price of their final product. The tariff schedules could
be streamlined and simplified through reducing the number of bands and eliminating nuisance
(all those less than 5 per cent) tariffs. Finally the report outlines the key characteristics of
exporting firms using a detailed database of exporters. Exports are concentrated in a small
number of product categories and across a relatively small number of firms
28. Chapter 4 addresses a range of the key regulatory issues that raise costs for all
producers in Malawi. The chapter is organized in four sections which focus on import and
export licenses, the National Quality Infrastructure, Customs and Border related issues and
transportation and transit corridors. In addition to import tariffs, firms are confronted with non-
tariff barriers including the requirement for import/export permits on virtually all agricultural
products and strict licensing requirements for fertilizer, seeds and other agricultural inputs that
increase costs, reduce choice and delay the introduction of new technology.
29. The high cost of obtaining inputs and high transport costs continue to constrain
Malawi from diversifying its productive base beyond agricultural commodity production
and mining. Manufacturing is dominated by a relatively small number of relatively large long
established firms serving the domestic market with a small number of labor intensive apparel
companies whose exports are dependent on either regional or multilateral preferences.
Following the decision by SACU not to renew the derogation from the apparel rule of origin
several apparel exporting firm’s closed down. While the mining sector had recently been
increasing in importance, recent developments such as placing the uranium mine into ‘care and
maintenance’ put the future role of the sector into question.
30. As a landlocked small economy Malawi is also dependent on the efficiency of transit
corridors and trade logistics in neighboring countries. Regional cooperation on trade
facilitation and transport regulations is vital for Malawi. While SADC and COMESA are both
working to harmonize regulations and streamline transit mechanisms to date progress in driving
down costs and improving reliability has been modest. Establishing an efficient transit
mechanism on the main routes to Mozambique (Beira/Nacala) and to South Africa (Durban)
would reduce costs and increase competitiveness.

12
31. Efficient and predictable border operations are essential. The Malawi Revenue
Authority has made good progress over the past decade however challenges remain in
introducing a comprehensive customs valuation, risk assessment, advance declaration and the
Authorized Economic Operator scheme. It is also necessary to streamline the roles of the
multiple agencies operating at the border to eliminate duplicative checks. Establishing a Trade
Portal containing all the forms, processes, charges required for importing and exporting should
be a priority, along with prioritizing the existing commitment to Integrating Border Management
processes. This trade portal should be designed in a way to serve large and small traders alike.
32. Ensuring product safety is important and the Malawi Bureau of Standards (MBS)
has a vital role to play in ensuring illegal counterfeits and non-conforming products which
might pose health risks to consumers are not distributed within the country. Currently the
MBS requires the frequent retesting of many imported products that have already satisfied
equivalent safety requirements. This imposes additional costs, creates uncertainty over delivery
and approval times and takes scarce resources away from targeting high risk products and faulty
weighing scales which cheat smallholders and consumers. The MBS should provide automatic
recognition for all accredited imports.
33. Chapter 5 looks in depth at how the trade and regulatory policies within the
agricultural sector impact on competitiveness. Competitiveness is held back by the absence of
transparent rules and market driven pricing. The recourse to bans on imports and export of
particular commodities and government intervention in price setting are counterproductive.
Attention is also given to how the regulations governing essential imported inputs, such as seeds
and fertilizer, restrict choice, increase costs, and reduce growth. Importers and exporters are also
required a range of Certificates and approvals which all carry a flat fee. These include the SPS
Fumigation Certificate and Non-GMO Certificate (for certain agricultural products), Certificate
of Origin (if using one of the preferences), the Currency Declaration Form processing fee, and
for the Clearing Agent. The chapter also shows how existing costs for cross border agricultural
trade between Malawi and Zambia has a disproportionate effect on the small traders. These
specific charges and fees results in smaller exporters-exporting loads of 2 tons or less-incurring
trade related costs more than three times higher than firms exporting containers or fully laden
trucks.
34. Finally, Chapter 6 addresses the important issues of trade in services through
focusing on professional services such as engineering, accounting, and law. Access to high
quality professional services is essential for reducing the costs of doing business and increasing
international competitiveness. The survey of users of professional services found those using
accounting, architectural and legal services had significantly higher productivity. The report
recommends reducing explicit trade barriers that limit the movement of natural persons and the
commercial presence of professional services.

13
35. The recommendations of all chapters are summarised in the Executive Summary
which also presents the revised Action Matrix. Appendix 1 presents a more detailed matrix
with suggested next steps.

14
Chapter 2. Trade and Inclusive Growth
36. The MGDS II and the Economic Recovery Program (ERP) launched in 2012 both
prioritize the commitment of the GOM to realize more inclusive economic growth in order
to reduce poverty by raising productivity, diversifying production and expanding export
growth. Expanding trade both within the region and internationally along with broadening the
product range are identified as priorities. The GOM recognizes that delivering these results
requires a reduction in trade costs, improvements in the business enabling environment and
regulatory reforms that reduce non-tariff barriers. These commitments are embodied in the
recently launched NES and the draft Non-Tariff Barrier Elimination Strategy. The chapter
outlines the existing macroeconomic situation, discusses Malawi’s relative performance on the
World Bank’s Doing Business Indicators, and summarizes existing income, welfare and poverty
levels, before concluding with a discussion of the lessons from the implementation of the 2003
Action Matrix.
37. The MGDS II 2011-16, approved in April 2012 and launched in September along
with the ERP seeks to deliver rapidly more inclusive economic growth that will reduce
unemployment and poverty, and contribute towards realizing the Millennium Development
Goals (MDGs). The ERP focuses on restoring macroeconomic stability, improving the business
enabling environment and providing social protection for the most vulnerable as the economy
transitions to a higher growth path. The MGDS II maintains the strategic focus of the earlier
MGDS I through emphasizing increasing productivity and diversifying the economy, especially
in the agricultural sector.
38. The MGDS II focuses over the next three years at developing more diversified
commercial agriculture, tourism, energy, and mining sectors, as well as infrastructure
development. It prioritizes increasing exports as a key growth driver for creating jobs and
reducing poverty through advancing productivity (p.58). The MGDS make reference to on-going
trade reforms aimed at reducing trade costs, and includes specific reference to both the simplified
trade regime (STR) and one stop border posts. The Update shows how trade costs effectively
negate the benefits of the STR and also highlights how the multiple agencies with border
responsibilities requires a comprehensive approach to addressing cross border issues. Specific
challenges highlighted by the MGDS include high transportation costs, lack of market
information, the narrow market base, low levels of trade expertise, lack of adherence to
international standards and inadequate energy supply. The DTIS Update addresses the challenges
that raise trade costs which increase the price of inputs and reduce international competitiveness.
Macroeconomic Overview
39. The Malawi economy is dominated by a small number of primary commodities
making it susceptible to shocks. Malawi’s economy has for decades been subject to exogenous
shocks partly due to the structure of its economy, as largely a rain-fed agricultural economy

15
locked into subsistence maize production, prone to adverse weather conditions, landlocked and
poorly integrated into the region in terms of both trade and physical infrastructure. The
concentration of its economy in a few primary commodities and its high dependence on imports
and aid inflows renders it vulnerable to shocks, especially adverse movements in the terms of
trade. These economic vulnerabilities have been compounded by weaknesses in the management
of the public finances through macroeconomic channels and resource losses, the infrastructure
deficit (especially energy and transport) and a history of policy reversals.
40. The economy remains vulnerable. Despite the implementation of a series of broad
macroeconomic and structural reforms over the past two decades, Malawi’s economy remains
vulnerable. During 2001-2004, the macroeconomic performance was characterized by high level
of domestic borrowing, which resulted in a high interest burden, thus compromising the
government’s ability to allocate resources for critical poverty reducing expenditure. The
economy made a remarkable turnaround during 2006-2010, through strong stabilization
measures that were geared towards instilling discipline and controls in the overall management
of public finances, which helped to restore macroeconomic stability during 2006-2007. This was
a period where real GDP growth averaged 7 per cent.
Figure 1: Trends in the Economic Indicators
41. The high rates of economic growth (Figure 1) were largely driven by agricultural
exports (mainly tobacco), aid inflows, and rising FDI (especially in the mining sector). The
agriculture sector has been a key pillar of economic growth over the past 30 years, although over
the last decade the importance of services in GDP has increased to about 53.2 per cent of GDP,
driven largely by telecommunications, retail and wholesale trade, and financial services. The
population and labor force remain predominantly rural largely locked into low productivity
subsistence agriculture as shown by the low share of GDP. There has been limited progress in
transitioning smallholders from subsistence to commercial production.
Source: Bank and IMF Staff, World Economic Outlook, Sept 2012
0
50
100
150
200
250
300
350
400
-6
-4
-2
0
2
4
6
8
10
12
200
0
200
1
200
2
200
3
200
4
200
5
200
6
200
7
200
8
200
9
201
0
201
1e
201
2p
GD
P p
er
Cap
ita (
US
$)
Real
GD
P G
row
th R
ate
s (
%)
GNI per Capita, 2000-2012
Malawi : Real GDP Growth Rates(%) (left scale)
Malawi: GNI per Capita (US$) (right scale)
0
50
100
150
200
250
300
350
-20
-10
0
10
20
30
40
19
98
19
99
20
00
2001
2002
20
03
20
04
20
05
20
06
2009
2010
20
11
e.
20
12
p
Macro Indicators
Malawi: Current Account Def icit (% GDP) (left scale)
Malawi: Fiscal Deficit afte r grants (% GDP) (left scale)
Malawi: Inflation (%) (lef t scale)
Malawi: Gross international reserves (US$ mn) (right scale)

16
Figure 2 Trends in Sector Distribution of GDP
Source: Bank and IMF Staff
42. In 2011 Malawi’s balance of payments position significantly weakened on account of
a strong deficit in the current account resulting from lower tobacco earnings and cuts in
external aid in 2011/12. The country’s official exchange rate was still overvalued and according
the IMF staff report (EBS/12/96), the overvaluation of the real effective exchange rate (REER)
was around 34 percent before the devaluation in May 2012. The country was facing a severe
shortage of foreign exchange, especially with the loss of credit lines, with a huge demand for
FOREX to clear private sector external payment arrears to suppliers/creditors, which amounted
to over US$ 700 million. The FOREX shortages were also manifested in shortages of critical
imports (including fuel, inputs for production, and medicines) and a much lower capacity
utilization in the industrial sector (less than 30 percent). Economic growth had slowed
significantly to 4.3 percent in 2011, after averaging over 7 percent real GDP growth a year
during 2007-10. Inflation was also on an upswing, with the year-on-year headline rate jumping
to 17.3 percent in May 2012.
43. In order to arrest the downward spiral of the economy and restore macroeconomic
stability the GOM liberalized the foreign exchange and fuel markets in May 2012. These
reforms1 facilitated the removal of market distortions (especially in the energy sector and foreign
exchange markets) and strengthened macroeconomic management (aimed at containing growth
in aggregate demand and inflationary pressures) while also putting in place support programs for
the most vulnerable groups. The GOM also addressed a range of governance issues, including
the normalization of relations with its neighbors and the international community, which has
1 The reforms included unifying the official and the parallel market exchange rates (a de facto devaluation of 50 percent), adopting a floating
exchange rate regime; removing the requirement for foreign exchange earnings to be surrendered to the RBM; canceling the requirement for the
RBM to review all applications for external payments over US$50,000; reinstating the automatic adjustment mechanism for retail prices of petroleum products to reflect import parity prices movements in the international fuel prices and exchange rate; adjusting electricity tariffs to
move towards cost recovery and scaling up the subsidy program. Inflationary pressures were contained by tightening monetary policy.

17
yielded positive results as evidenced by the significant increases in grants, especially budget
support and dedicated grants.
44. Following these reforms real GDP growth recovered in 2013, and inflation declined.
In 2013 real GDP growth is expected to bounce back to exceed 5 percent, driven largely by
recovery in agriculture production and manufacturing. Inflationary pressures have eased; after
peaking at 37.8 percent in February 2013, headline inflation decreased to 23.3 percent in August
2013, on account of a marked decrease in food inflation, and the deceleration of non-food inflation.
The overall fiscal deficit declined from 8.4 percent in 2011/12 to 1.2 percent in 2012/13. Similarly,
after registering a significant depreciation following the May 2012 reforms, the Kwacha
appreciated sharply in May 2013 in response to improved foreign exchange inflows from tobacco
sales and market recognition of the improved growth prospects resulting from the implementation
of prudent monetary and fiscal policies.
45. The performance of the external sector remains weak, with persistent merchandize
trade deficits. Malawi’s balance of payments improved in 2012, with a surplus of 0.9 percent of
GDP, from deficit of -1.9 percent of GDP in 2011. Foreign Direct Investments (FDIs) picked up
slightly to 1.5 percent of GDP in 2012, from 1.1 percent of GDP in 2011, partly reflecting a gradual
return in investors’ confidence and inflows in the mining sector. The narrow economic base renders
the economy vulnerable to changes in the terms of trade, weather and other exogenous shocks,
including an uncertain future for the tobacco in international markets.
Malawi’s trade openness
46. In 2011 agriculture accounted for just over one third of total GDP and almost 80
per cent of exports. Tobacco remains the dominant commodity exported, accounting for more
than 40 per cent of total exports by value, valued by sugar, tea, and raw cotton.
47. Figure 3 shows how trade in goods as a share of GDP increased from two thirds in
2003 to 83 per cent in 2009. This was largely driven by a surge of imports and a deteriorating
balance of trade which is shown in Figure 4. In 2010 Malawi imported $2.3 billion of goods and
services and exported $1.2 billion. This structural deficit was funded in the short term by Aid
flows and increased borrowing. The excess demand for foreign exchange resulted in foreign
exchange restrictions which limited imports through 2011. In May 2012 the Kwacha was
devalued by 49 per cent and has since fallen further against the dollar and other major trading
currencies. While this has reduced the structural deficit Malawi remains vulnerable to exogenous
shocks arising from drought and adverse movements in the terms of trade.

18
Figure 3 Merchandise Trade as per cent of GDP, 2000-2011
Source: http://data.worldbank.org/indicator/TG.VAL.TOTL.GD.ZS
Figure 4 Trade and current-account balance, 2000-2011
Source: http://data.worldbank.org/indicator/
Malawi Financial Sector
48. The Malawi banking sector comprises twelve commercial banks. The three largest
banks account for over 60 percent of gross loans, deposits and total capital. The three midsize
banks account for 24.1 percent of gross loans, 19.5 percent of deposits and 23 percent of total
capital. The six smaller banks account for 14.8 percent of gross loans, 20.1 percent of deposits
and 14.7 percent of total capital.

19
49. Risks to banks’ portfolios remain elevated due to the difficult macroeconomic
environment, which characterized the year 2012. In the wake of the exchange rate liberalization in
May 2012 and the ensued liquidity crisis in the banking system, some banks suffered losses,
although deposits at systemic level remained stable. Banks faced severe liquidity pressures as
interbank, repo and long-term funding markets all suffered major disturbances. The credit risk was
manifested in a reduction in asset quality with the ratio of non-performing loans (NPL) to gross loans
and leases rising to 11.8 percent in March 2013, from 6.5 percent in September 2012.
50. While the banking sector remains well capitalized with a total capital and core
capital ratios registering well above the minimum regulatory requirements, the credit risk
remains. The RBM has taken steps towards addressing weak banks and identifying banking
risks and plans to strengthen its framework for addressing emerging banking problems as well as
its bank supervision capacity. The build-up of NPLs is likely to prevail in the short term and this
raises concern on the soundness of a number of banks. Banks are also expected to be fully Basle
II compliant by January 2014 and as such need more resources for capital regulatory
requirements and for boosting up their informed human capital. The planned third party
diagnostic assessment of the banks will help identify the underlying weaknesses in the sector as
well as the sector’s readiness for Basle II.
Business Enabling Environment
51. The business environment in Malawi remains challenging. The country ranks behind
its neighbors in indicators that measure attractiveness of the business environment, such as the
Global Competitiveness Index (GCI) of the World Economic Forum and the World Bank’s
Doing Business Report. Business Climate Surveys highlight the following among the main
obstacles to doing business in Malawi: (i) lack of access to finance; inadequate infrastructure
(especially electricity); (iii) inefficient government bureaucracy; (iv) policy instability; and (v)
inadequate education and skilled workforce. Enabling Malawi to benefit more fully from the
large export and growth opportunities offered by the regional and global economy requires
improvements in the business environment; reducing the infrastructure deficit, especially energy
and water supply; facilitating trade and regional integration; making credit more available and
affordable, especially to smallholders; and addressing the skills gap. Existing initiatives include
the establishment of a one-stop-shop to facilitate the setting up of businesses and to inform
investors of available incentives. In November 2012, parliament approved the Single License
Bill aimed at reducing the number of procedures and time required to start a business. The
government has also launched NES in December 2012 which puts in place inter-governmental
coordination aimed at removing road blocks to export development and identifies three priority
sectors. In April 2013 import and export permits were removed on many (but not all)
agricultural products. While commendable progress is being made to stabilize the economy,
improving the business environment will depend on policy certainty and predictability, and the
removal of legal and regulatory hurdles.
20
Figure 5 Doing Business Rankings for Malawi (2007, 2010, 2013)
Source: Doing Business Reports
52. The World Bank Doing Business benchmarks indicators for over 183 countries to
show the time and costs required for a local entrepreneur to open and run and a small to
medium sized business when following the regulations. It measures and tracks changes in in
the regulations that are applied at various stages in the life cycle of a business from start up to
exit and closure. Doing Business has stimulated discussion amongst policy makers and raised
awareness on the importance of the business enabling environment to advancing growth. The
major indicators used include ease in starting a business, ease in paying taxes, protection given to
investors, ease in getting credit, enforcing contractors, ease of trading across border, ease in
resolving insolvency, registering property, getting electricity, and getting construction permits.
Malawi has participated in the Doing Business Survey since 2004.
53. Malawi’s performance relative to other countries has been poor across all factors
except for paying taxes (Figure 5). On ease of doing business, the overall country ranking
among all 183 countries dropped from 110 in 2007 to 127 in 2010 and 157 in 2013. This can be
attributed to a lack of significant reforms undertaken to improve the business regulatory
environment relative to other countries. It is also notable that the ‘Trading across Borders’
category is one of the weakest for Malawi.
54. Over the past 6 years Malawi has reduced the number of days to import and export
from 60 and 44 in 2007 to 43 and 34 days respectively in 2013. This principally resulted from
the on-going customs modernization program at MRA. During the same period, the cost to
import per container from a sea port increased from US$ 1,590 in 2007 to US$2,870 in 2013
according to data from the Doing Business indicators, while the cost to export per container
0 50 100 150 200
Ease of Doing Business
Starting a Business
Getting Construction Permits
Getting Eletricity
Registering Property
Getting Credit
Protecting Investors
Paying taxes
Trading Across Borders
Enforcing Contracts
Resolving Insolvency
Rank Among the Included Countries
2013
2010
2007

21
increased from US$ 1,565 in 2007 to US$ 2, 175 in 2013. Progress was also achieved on
reducing the number of documents required for importing from 16 in 2007 to 9 in 2013.
However, the number of documents required to export increased from 8 in 2007 to 10 in 2013.
For reasons of comparison, the Doing Business Indicators report the number of documents
needed for a container with standard goods not requiring special documentation, so the overall
number of documents required could differ depending on the type of cargo.
55. Comparing the trading across borders rankings for Malawi with comparator
countries shows that it is relatively easier to import and export in Chile and Georgia than
in the neighboring African countries namely of Zambia and Tanzania. Over the past four
decades Chile transitioned from a dependence on mineral exports to become a major supplier of
diversified fruit and vegetables throughout the Americas. The transition was facilitated by
substantial reforms which reduced trade costs and lowered the cost of doing business.
Figure 6 Trading Across Border Ranks for Malawi and Comparator Countries
Source: Doing Business Reports
56. Figure 6 above shows that Georgia has undertaken considerable reforms to improve
the procedure, the length of time and cost to import and export relative to their African
counterparts. Within the region, Tanzania and Mozambique have better rankings for trading
across borders than Malawi, Uganda and Zambia.
57. Figure 7 below shows the cost to export per container. Chile and Georgia costs are
about half those experienced by Malawian exporters. In Malawi, the cost to export per container
has increased consistently from US$ 1,565 in 2007 to US$1,713 in 2010 and US$ 2, 175 in 2013.
Malawi’s cost to export is relatively high and has been increasing whereas both Tanzania and
Zambia have managed to reduce the cost of exporting, although Zambia continues to face higher
costs.
- 50 100 150 200
Chile
Georgia
Malawi
Mozambique
Tanzania
Uganda
Zambia
TAB Rank
TAB Rank 2013
TAB Rank 2010
TAB Rank 2007

22
Figure 7 Cost to Export (US$/Container)
Source: Doing Business Reports.
58. Figure 8 below compares the number of documents required to finalize export sales.
The figure shows that Chile, Georgia, Uganda and Zambia have made some considerable
reforms to reduce the number of documents required to export. In 2013, Malawi reported the
highest number of documents required at 10 though it is an improvement from the 12 required in
2010. Further reforms are required to reduce the number of required documents to less than 5.
Figure 8 Number of Documents to Export
,
Source: Doing Business Reports
59. Figure 9 below compares the time it takes to export goods among the comparator
countries. The figure shows that both Georgia and Chile are among the top performers as it
takes less than 15 days to export. In the region, Tanzania and Mozambique are, again, better
performers as between 15 and 22 days are taken to export whereas Zambia takes 45 days to
export. Malawi and Uganda are in-between at 35 days to export. The time needed for document
- 500 1,000 1,500 2,000 2,500 3,000 3,500
Chile
Georgia
Malawi
Mozambique
Tanzania
Uganda
Zambia
Cost to Export (US$/Container)
2013
2010
2007
- 5 10 15 20
Chile
Georgia
Malawi
Mozambique
Tanzania
Uganda
Zambia
Number of Documents to Export
2013
2010
2007

23
preparation is a key driver of these differences, demanding 12 days in Mozambique, and 21 days
in Malawi. It is worth noting that all countries have made considerable reforms to reduce the
number of days it takes to export between the periods 2007 and 2013, with Malawi reducing
from 44 days to 34 days.
Figure 9 Time to Export (Days)
Source: Doing Business Reports
60. Figure 10 below compares the cost to import per container for the comparator
countries. The figure shows that the cost to import per container has generally increased
between 2007 and 2013. Within the region, Tanzania and Mozambique has cost to import
comparative advantage as the cost are less than US$1,700 while among the landlocked countries
Malawi has the lowest import cost. However, it is worth noting that there was a significant
increase in cost to import between 2007 and 2010 as it increased from US$ 1,590 to US$2,570
and climbed further to US$2, 870 in 2013.
Figure 10 Cost to Import (US$/Container)
Source: Doing Business Reports
- 10 20 30 40 50 60 70
Chile
Georgia
Malawi
Mozambique
Tanzania
Uganda
Zambia
Time to Export (Days)
2013
2010
2007
- 1,000 2,000 3,000 4,000
Chile
Malawi
Tanzania
Zambia
Cost to Import (US$/Container)
2013
2010
2007
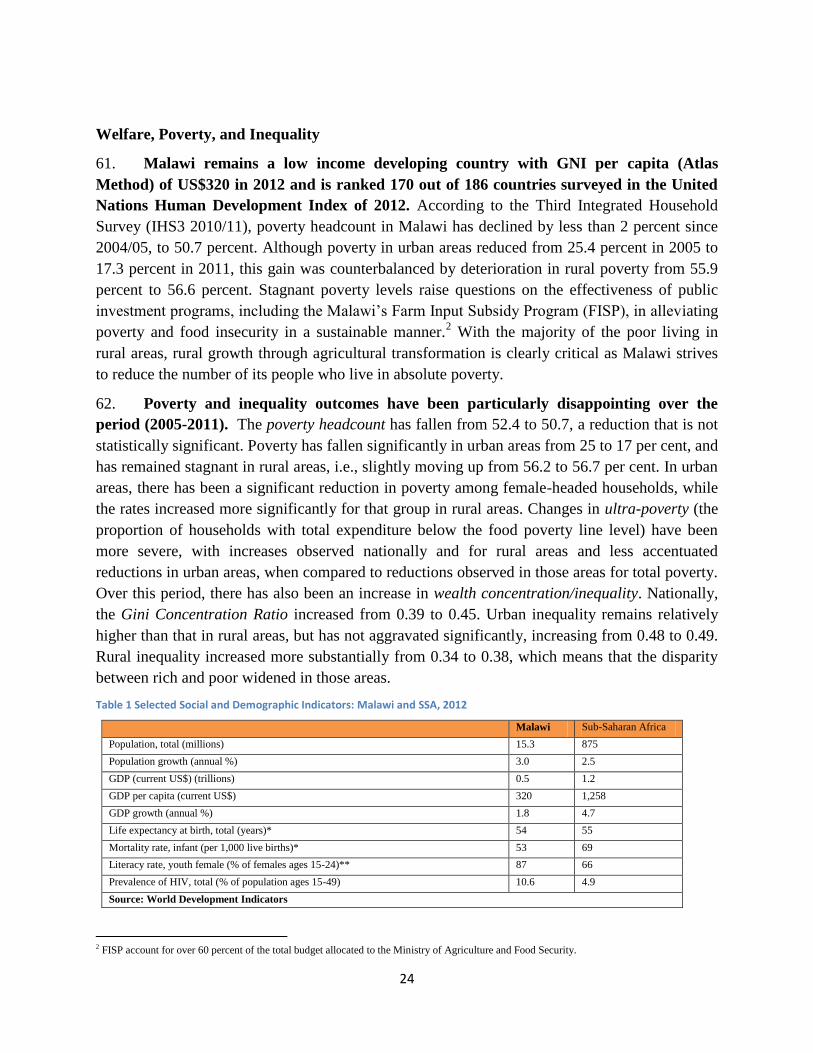
24
Welfare, Poverty, and Inequality
61. Malawi remains a low income developing country with GNI per capita (Atlas
Method) of US$320 in 2012 and is ranked 170 out of 186 countries surveyed in the United
Nations Human Development Index of 2012. According to the Third Integrated Household
Survey (IHS3 2010/11), poverty headcount in Malawi has declined by less than 2 percent since
2004/05, to 50.7 percent. Although poverty in urban areas reduced from 25.4 percent in 2005 to
17.3 percent in 2011, this gain was counterbalanced by deterioration in rural poverty from 55.9
percent to 56.6 percent. Stagnant poverty levels raise questions on the effectiveness of public
investment programs, including the Malawi’s Farm Input Subsidy Program (FISP), in alleviating
poverty and food insecurity in a sustainable manner.2 With the majority of the poor living in
rural areas, rural growth through agricultural transformation is clearly critical as Malawi strives
to reduce the number of its people who live in absolute poverty.
62. Poverty and inequality outcomes have been particularly disappointing over the
period (2005-2011). The poverty headcount has fallen from 52.4 to 50.7, a reduction that is not
statistically significant. Poverty has fallen significantly in urban areas from 25 to 17 per cent, and
has remained stagnant in rural areas, i.e., slightly moving up from 56.2 to 56.7 per cent. In urban
areas, there has been a significant reduction in poverty among female-headed households, while
the rates increased more significantly for that group in rural areas. Changes in ultra-poverty (the
proportion of households with total expenditure below the food poverty line level) have been
more severe, with increases observed nationally and for rural areas and less accentuated
reductions in urban areas, when compared to reductions observed in those areas for total poverty.
Over this period, there has also been an increase in wealth concentration/inequality. Nationally,
the Gini Concentration Ratio increased from 0.39 to 0.45. Urban inequality remains relatively
higher than that in rural areas, but has not aggravated significantly, increasing from 0.48 to 0.49.
Rural inequality increased more substantially from 0.34 to 0.38, which means that the disparity
between rich and poor widened in those areas.
Table 1 Selected Social and Demographic Indicators: Malawi and SSA, 2012
Malawi Sub-Saharan Africa
Population, total (millions) 15.3 875
Population growth (annual %) 3.0 2.5
GDP (current US$) (trillions) 0.5 1.2
GDP per capita (current US$) 320 1,258
GDP growth (annual %) 1.8 4.7
Life expectancy at birth, total (years)* 54 55
Mortality rate, infant (per 1,000 live births)* 53 69
Literacy rate, youth female (% of females ages 15-24)** 87 66
Prevalence of HIV, total (% of population ages 15-49) 10.6 4.9
Source: World Development Indicators
2 FISP account for over 60 percent of the total budget allocated to the Ministry of Agriculture and Food Security.

25
Lessons from the Implementation of the 2004 Action Matrix
63. The Action Matrix made recommendations across five broad areas: (i)
macroeconomic and social stability; (ii) transportation: (iii) export sector-specific measures
(tobacco, sugar, groundnuts and spices, tea, cotton, textiles and clothing, and food products); (iv)
customs reform and other institutional capacity; and (v) trade policy. In total implementation was
endorsed for 67 actions, many with numerous sub-actions, spread across the five broad subject
areas with responsibility across Ministries, Agencies, Regulatory Bodies, technical working
groups and other stakeholders.
64. Out of 67 recommended actions, only 8 were fully implemented and these were driven
by other strategies and programs such as the MGDS, the Privatization Program and individual
agency initiatives. Thirteen actions were largely implemented and a further twelve were half
implemented. 19 actions were started and then stopped or have shown progress recently
following years of minimal or no action. 15 actions have not been implemented. A summary of
the progress is contained in Table 2. A detailed assessment of each recommended action in the
Matrix is contained in Appendix 2.
65. The actions implemented include a comprehensive modernization program by the
Malawi Revenue Authority which resulted in some advances in trade facilitation, opening
the long-haul international road routes resulted in more competitive international transport costs
(although internal transportation remains expensive), and the updating of several commercial
laws and regulations. However in many areas there was either limited progress or no action.
These include: strengthening institutional capacity for ensuring effective coordination,
negotiation and implementation of trade agreements, reducing the adverse trade impact of non-
tariff measures on imports and exports, diversifying exports and benefiting from increased
investment and growth through advancing regional integration.
Table 2 Summary of Implementation of DTIS 2004 Action Matrix
Action Category Number of
Recommendations
Implementation
Status in %
Degree of
Impact in %
Macroeconomic and Social Stability 3 65 55
Transportation 10 28 20
Export Sector Specific Measures 25 41 26
Customs Reform and Other
Institutional Capacity
20 60 41
Trade Policy 9 33 17
66. The actions implemented following the DTIS would have been implemented
independently of the DTIS process. In each case the stakeholders were committed to
implementation, independent of the DTIS. Why did the vast majority of actions witness either
no implementation or at best a partial implementation? An assessment of the progress found the
absence of a constituency or high level champion with the mandate, capacity and commitment to

26
push through the reforms as the prime reason for weak implementation. Lacking a strong
mandate the Ministry of Trade and Industry and the EIF National Implementation Unit did not
have the ability to overcome the resistance to reform or to gain support from other, more
influential, parts of government which could have supported the Ministry of Trade in its reform
efforts.
67. The review of the progress on the Action Matrix interviewed a wide range of
stakeholders in Malawi and found many implementing agencies were unaware that the
activities remained priorities for mainstreaming through government programs. The earlier
Action Matrix was largely only known to those who had been directly involved in its
development. The Ministry of Trade and Industry was not held accountable for implementation,
following up on progress, and reporting to the Cabinet Committee on the Economy. Following
the validation workshop in 2004 it is difficult to avoid concluding that the Action Matrix was not
used as a key input for guiding either policy or programs.
68. The experience of the past decade on mainstreaming and implementing the Action
Matrix provide salient lessons for the Update. Firstly, the Update should identify and quantify
the key trade related issues that require addressing in order for the GOM to steer the economy
towards more inclusive growth and economic diversification. Secondly, these activities should
only include those could realistically be addressed through the leadership of the National
Implementation Unit in the Ministry of Industry and Trade and with support by the development
partners in the context of the Enhanced Integrated Framework, and hence should focus on policy
reforms rather than infrastructure reforms. Thirdly, the updated Action Matrix must be endorsed
and integrated into existing Government programs and strategic documents. Specifically the
Action Matrix could be added to the NES and linked to the MGDS and ERP. The NES
implementation mechanism or sector-wide approach could therefore be used to ensure priority
recommendations of the DTIS update will be implemented.

27
Chapter 3. Trade Policy and Performance
69. This chapter describes aggregate trends in exports performance since the 2004
DTIS and then dives down to examine the characteristics of exporters using a rich new
dataset on exporting firms for Malawi and a range of comparator countries between 2009
and 2012. This is followed by a description of the structure of nominal protection, or price
raising impact of tariffs, under both the Most Favored Nation and Regional trade preferences
schedules, prior to focusing on the use of duty rebates by both import competing and exporting
firms.
70. Multiple tariff schedules in conjunction with rebates on imported inputs and duty
preferences in regional and international markets results in creating significant incentives
for Malawian firms to sell into the domestic market. Simplifying and streamlining trade
policies will create a more neutral environment between producing for the domestic or
international market. Reducing anti-export bias will encourage investment in a wider range of
economic activities that promise to expand linkages to the existing domestic agro-industries and
manufacturing sectors. Furthermore, reducing anti-export bias will increase Malawi’s
attractiveness as a location for activities linked to either regional or global value chains.
Malawi’s Export Performance
71. The earlier DTIS (2004) summary of Malawi’s trade regime and performance noted
that exports were dominated by tobacco which accounted for two-thirds of the total.
Furthermore relative to similar least developed economies export growth had been sluggish
through the 1990s. Even though Malawi has a relatively high ratio of trade to GDP the 2004
DTIS noted the limited linkages between exports and the domestic economy constrained trade
from making a broader contribution to economic growth. The modest response to the substantial
liberalization of MFN Tariffs as part of the structural adjustment process in the late 1980’s was
attributed to the continued existence of binding supply side constraints.
72. With hindsight it is apparent that reducing tariffs without addressing the numerous
non-tariff measures left trade costs at high, and for many prohibitive, levels and
consequently constrained further significant export growth. Recent work focusing on the
costs of moving goods across borders has also identified the highly regressive impact of fixed
costs which crowd out small and medium scale enterprises for engaging in trade (see for example
Brenton and Isik, 2012). Worsening trade deficits and a fixed exchange rate during the second
half of the last decade served to undermine export competitiveness. Liberalizing the exchange
rate in May 2012 has improved export competitiveness however, trade costs remain high.
73. Malawi is similar to many least developed economies in having a very narrow
export basis. There is a strong correlation between export diversification and income levels.
Figure 11 shows Malawi to have higher concentration of exports, measured by the Herfindahl
Index based on average over the period 2010-2012, than Mozambique but is slightly more
diversified relative to Zambia, and is similar to Ghana.

28
74. In 2000 the largest five commodity exports accounted for almost 90 per cent of the
total value, by 2011 the same commodities accounted for 77 per cent of the total with the
newly opened uranium mine accounting for almost 9 per cent. Mineral exports are expected
to increase further as new mines come on stream. The continued dominance of agricultural
commodities within total exports is shown in Tables 4 and 5. Agriculture accounts for almost 80
per cent of total exports and is concentrated in a small number of firms. More than 50 per cent of
total exports are traded outside the region to the EU and North America, with African markets
accounting for approximately one quarter. Imports are sourced more widely with almost two-
thirds originating from Africa, and South Africa accounts for 40 per cent.
Figure 11 Export Concentration: Malawi and Comparators
Note: Herfindahl index calculated at HS chapter (HS2) level. Source: Derived from WITS Database www.wits.worldbank.org/
75. The Paladin uranium mine at Kayelekera opened in 2009 and exports all of its
production for processing in Canada, but operations will be put on hold around mid 2014.
With falling uranium prices, the uranium mine will be put in “care and maintenance” and exports
are expected to cease once remaining chemicals for operations are used up. According to reports,
operations are only likely to resume following a “significant” recovery in the price for uranium.
Substantial additional investment in mining could take place with the Kanyika niobium mine and
other possible investment for mining rare earths and heavy mineral sands under exploration.
Another notable development in exports has been the increase in regional exports of plastic
household products from less than $1m in 2004 to over $25m in 2011 as Arkay Plastics sells to
the major South African retail chain stores. Apparel exports from Malawi to South Africa, which
accounted for most of the exports classified under textiles and clothing, traded duty free with a
simple rule of origin (which allowed all the cloth to be imported) under the SADC Trade
Protocol. This facility was scheduled to terminate in 2008 and was finally revoked in 2011. Since
2011 several apparel plants, employing approximately 4,000 workers have closed down. The
agricultural sector has seen a significant expansion in sugar production and the growth of non-
0
0.1
0.2
0.3
0.4
0.5
0.6
Export Concentration: Malawi and comparators
2009-2011

29
traditional agricultural products such as oil seeds. Oil seeds have grown from close to zero to
reach almost 3 per cent of total exports in the past 7 years (see tables 3 and 4).
Table 3 Malawi Exports 2005 – 2011 (US $ million)
Industrial Classification 2005 2006 2007 2008 2009 2010 2011
Agricultural Materials 415.4 576.5 735.0 771.9 1,089.0 865.0 1,147.3
Agricultural Raw Materials 19.9 27.4 34.0 44.8 41.1 45.6 73.0
Chemicals 2.9 7.2 11.3 9.1 12.5 49.5 87.6
Food 107.1 137.6 237.7 212.8 300.2 245.8 418.4
Ores and Metals 1.1 1.6 1.5 1.8 5.9 59.1 79.4
Manufactured Goods 75.7 85.8 123.7 104.0 89.5 138.2 195.9
Textiles and Clothing 53.2 62.3 62.9 70.0 59.4 54.7 77.3
Transport and Machinery 12.0 13.4 56.6 38.8 22.5 29.4 32.7
Services (excluding Govt.
Services)
104.2 104.6 117.5 121.6 126.5 141.5 n.a.
Total Exports (Goods and
Services)
602.0 773.2 988.5 1,003.4 1,318.6 1,207.7 1,425.3
Source: Trademap
Table 4 Malawi Export Shares 2005 – 2011
Product Category 2006 2007 2008 2009 2010 2011
Tobacco 61.7 48.7 67.1 64.0 54.9 40.0
Sugar 7.1 7.4 6.0 5.9 6.5 15.1
Uranium Ores 0.0 0.0 0.0 0.7 10.7 8.8
Cereals 0.9 11.8 1.7 1.2 0.5 6.7
Coffee/Tea/Spices 8.6 7.1 4.8 7.1 8.2 6.7
Cotton 2.3 2.7 2.7 2.5 1.7 3.4
Oil Seeds 2.0 5.8 2.4 4.6 1.6 2.4
Vegetables 0.9 1.9 1.9 2.8 2.6 1.9
Plastic Products 0.4 2.1 0.4 1.4 1.9 1.9 Source: Derived from COMTRADE
76. In a notable contrast with exports Malawi’s imports are relatively diversified with
the ten largest HS 2 digit chapter headings accounting for 62 per cent of total imports by
value. The largest import categories are fuel and gasoline, machinery, fertilizer, pharmaceuticals,
vehicles, electrical machinery, plastics, tobacco and cereals.
77. Trade in services which accounted for 12 per cent of total trade 2010 is discussed in
Chapter 6.
Direction of Imports and Exports
78. The main trends in the direction of imports and exports may be observed from
Table 5. The past decade has witnessed considerable changes in the sourcing of imports as South

30
Africa has declined in relative importance as the Gulf States (primarily UAE), China, India and
the neighboring states of Zambia and Tanzania have all more than doubled and in some cases
trebled there relative shares. Almost 60 per cent of Malawi’s imports originate from Sub-Saharan
Africa with SADC accounting for 47 per cent, while this remains the largest regional supplier
they have lost market share over the past decade. East and South East Asia have increased their
market share from 10 per cent in 2001 to 24 per cent in 2011. The EU share remained broadly
constant at 13 per cent while the NAFTA region increased their share from 3 to 5 per cent.
Table 5 Malawi Imports by Country of Origin and Exports by Destination (per cent)
Imports Exports
Country of Origin 2001 2011 Destination 2001 2011
South Africa 43.7 25.0 Canada 0.1 8.8
Zambia 1.8 4.5 Zimbabwe 1.7 8.6
Tanzania 0.8 3.1 South Africa 9.7 8.2
India 5.5 11.5 United Kingdom 10.1 7.7
Peoples Rep. of China 2.7 9.3 Belgium 1.1 6.5
UAE 0.8 3.1 USA 14.4 5.4
Kenya 3.9 5.2
Egypt 10.9 4.4 Source: Trademap
79. The geographical pattern of Malawi’s exports has diversified over the past decade
reflecting changes in the international markets for tobacco and cotton, and the new
uranium mine. In 2001 the US and Egypt were major destinations for tobacco, however, there
shares have declined as tobacco is now sent to Spain, Belgium and also Zimbabwe. Canada has
emerged as the single largest trading partner as it receives all the uranium Concentrate from the
new Paladin mine.
80. The share of imports from SADC countries other than South Africa increased
through the past decade to reach 30 per cent before declining during the global economic
downturn to 20 per cent. Imports from India, China and the Middle East have displaced many
of the consumer goods that were previously imported from South Africa. South Africa remains
the single largest source for imports and continues to export a wide range of products to Malawi
although it is possible that many of these are actually imported into South Africa as the major
regional distribution hub. It is not possible to separate out products that are produced in South
Africa from those that originate elsewhere. The largest dutiable items from South Africa are fuel,
motor vehicles and commercial vehicles, and ovens/cookers. In aggregate these three sectors
account for more than half of all customs duties levied on South African imports. The other
SADC countries export a narrow range of products to Malawi. For example, five products –
cement, soap powder, cotton seeds, fertilizer, and chemicals –account for two thirds of Zambia’s
exports to Malawi.

31
Characteristics of Exporters in Malawi
81. An analysis of firm level export data found a number of stylized facts on exporter
competitiveness.3 Using data for 2009-2012 for Malawi and eight comparator countries (Kenya,
Mauritius, South Africa, Tanzania, Uganda, Zambia, Cambodia and Guatemala)
82. Malawi has a smaller number of exporters to the comparator countries and this
remains the case even when accounting for differences in the levels of development and
relative size. Malawi also has the highest churn rate-entry and exit- among all the comparator
countries over the period 2006-2012. The sheer magnitudes are striking. In any given year
between 2009 and 2012 half of the exporters had not exported in the previous year. Over the
same period Malawi also showed the lowest survival rates for new entrants with an average of
only one third of all exporters remaining in the following year. The relatively small number of
exporters and the low survival rates of new exporters suggest a challenging business
environment.
83. Although there was a modest reduction in concentration between 2009 and 2012
exports in Malawi continue to be dominated by a very small number of large firms. In 2012
the largest five firms accounted for 62 per cent of total exports and the top 20 firms accounted
for 81 per cent. The share of total exports account for by the largest exporters are shown in
Table 6. Given the high concentration of exports in the top 50 firms it follows that the vast
majority of exporters are small. Over 65 per cent of firms exports less than USD 50,000 per year.
The dominance of large exporters has implications for the design of an export strategy as further
rapid growth would be heavily dependent on expanding the number and size of large firms.
Except for the tobacco sector more than 75 per cent of new exporters do not survive past the
second year. Firms registered in customs date as exporting vehicles (likely resale of used cars)
have a turnover of almost 80 per cent annually and account for less than 5 per cent of total
exports.
Table 6 Share of Total Exports Accounted for By Top Exporters - Malawi 2009-2012
Source: Author’s calculations based on data used for the Exporter Dynamics Database.
84. Recent work by the World Bank (2012) explained the observed low survival of
export flows in African countries to: (i) the difficult business environment with high trade costs
due to both high freight rates, long supply routes, burdensome customs and administrative
procedures and restrictive non-tariff barriers, and (ii) the constraints of productive capacities in
3 These data are part of the new Exporter Dynamics Database presented in Cebeci, Fernandes, Freund, and Pierola (2012). The Appendix
provides all details on the dataset as well as on the export competitiveness indicators that will be presented below.
Top 5
Exporters
Top 10
Exporters
Top 20
Exporters
Top 50
Exporters
2009 70% 80% 88% 96%
2010 63% 77% 87% 95%
2011 56% 69% 81% 93%
2012 62% 73% 81% 92%
Share of Malawi's Exports Accounted for by:

32
terms of access to finance which prevents exporters from responding to potential opportunities.
Improvements in the business enabling environment will contribute to increasing export survival
through reducing transport costs.
85. Through 2009-2012 only 180 exporting firms exported each year. These continual
exporters represented 13 per cent of the total number of firms that operated at some point
through the period while accounting for 94 per cent of total exports. They were larger more
diversified and served more destinations than occasional or intermittent exporters. Over the same
period continual exporters in South Africa also accounted for over 90 per cent of total exports,
however, they accounted for more than a third of all exporters.
86. Malawi’s exports continue to be dominated by tobacco which accounts for half of the
total. However, the opening of the Paladin uranium mine in 2009 resulted in minerals increasing
in importance from 2010, but uranium exports are expected to cease by mid-2014 as the
Kayelekera mine is being put in ‘care and maintenance’. In Table 7, vegetable products and oils
also includes the traditional agricultural exports of sugar and tea. The fifth largest sector, textiles
includes the export of raw and ginned cotton.
Table 7 Distribution of Malawi’s Exports across Sectors
Source: Author’s calculations based on data used for the Exporter Dynamics Database. Note: HS 27 is excluded from
our analysis therefore it is not part of the HS 2-digit codes covered by the sector ‘Minerals’. Some firms export products
in multiple sectors, and the sums for some of the sectors may not exactly match the percentage commodity pattern
identified in Table 4.
87. The small number and large size of exporters of agricultural commodities –in
tobacco, oilseeds, sugar, tea- largely reflects the importance of traders/wholesalers in
promoting exports. The traders/wholesalers are agents whose transactions are captured by the
exporter-level customs data and in many cases they are acting as intermediaries while the
agricultural production is undertaken by a large number of small holders and smaller farmers.
The dearth of small and medium sized exporters (who survive) is indicative of high fixed trade
costs and uncertainty in exporting. These include the many charges/fees that are more onerous
HS 2-digit codes Sector 2009 2010 2011 2012
HS 24 Tobacco 68.83% 55.76% 42.11% 54.37%
HS 06-15 Vegetable Products & Oils 14.07% 14.18% 19.43% 16.42%
HS 25-27 Minerals 0.71% 11.29% 9.22% 11.39%
HS 16-23 Food & Beverages 6.10% 7.49% 17.77% 5.04%
HS 50-59 & 41 Textiles (Including Leather) 2.59% 1.89% 3.73% 4.84%
HS 28-40 Chemicals & Plastics 1.69% 3.16% 2.87% 2.61%
HS 44-46 & 94 Wood & Articles Thereof 1.28% 1.27% 1.03% 1.73%
HS 86-89 Transportation Vehicles 0.79% 0.42% 1.01% 0.89%
HS 60-67 & 42-43Apparel & Footwear (Including Leather
Articles) 2.21% 1.97% 1.43% 0.76%
HS 47-49 Paper 0.13% 0.14% 0.21% 0.66%
HS 84 & 91-92Mechanical Machinery (Including Clocks
& Music Instruments) 0.93% 1.45% 0.58% 0.64%
HS 01-05 Live Animals & Animal Products 0.06% 0.18% 0.26% 0.25%
HS 72-83 Base Metals 0.31% 0.46% 0.15% 0.20%
HS 85 & 90Electrical Machinery (Including Optical,
Medical, Photographic Instruments) 0.22% 0.27% 0.13% 0.17%
HS 71 & 93 & 95-97 Others 0.05% 0.05% 0.03% 0.03%
HS 68-70 Cement, Ceramics & Glass 0.03% 0.02% 0.03% 0.02%

33
for small traders, the uncertainty and time required to obtain import and export permits for
agricultural products, transport costs, finance constraints, and the costs of building up a reliable
network.
Multiple Tariff Schedules: MFN and Regional Preferences
88. The regional agreements with COMESA and SADC, bilateral preferences and the
multilateral Most Favored Nation (MFN) under the WTO result in Malawi having multiple
tariff schedules. Overlapping membership between regional neighbors adds to the complexity as
importers can be classified in one of five different schedules depending on both the origin of the
imports and whether the goods conform to rule of origin requirements under the preferential
trade agreements. The tariff schedules include General for the non WTO countries, MFN for all
WTO members, COMESA, SADC, and South Africa. Malawi also has bilateral agreements that
allow for preferential access with Mozambique and Zimbabwe. However, these have now been
superseded by the tariff concessions provided under the regional agreements and are not listed as
separate schedules.
89. The Most Favored Nation (MFN) tariff comprises eight bands of applied tariffs:
duty free, 5 %, 7.5%, 10%, 15%, 20%, 25% and 200%. All tariffs are applied on an ad
valorem basis to the c.i.f. value of the import, there are no specific tariffs. The 2013 MFN tariff
schedule contains 5,537 lines at the HS 8-digit level and is based on the HS-2007 nomenclature.
90. Almost one third of the MFN tariff lines are now at zero and a further 28 per cent
are at 10 per cent. More than half of all imports enter at zero rates of duty, with a further 32 per
cent incurring MFN duties of 10 per cent. The modal (or most common) tariff rate is the 25 per
cent band accounting for almost 40 per cent of the tariff lines but less than 14 per cent of total
imports. The economy wide simple average MFN tariff is 14 per cent. The simple average tariff
is higher for agriculture relative to industry with HS Chapters 1-24 show a simple average of
19.6 per cent and HS Chapters 25-98 registering 11.5 per cent.
91. More than 50 per cent of imports in 2012 entered through zero rated tariff lines (see
Table 8). Most capital goods and fertilizers are classified as duty free. The 5 per cent tariff
applies to raw materials and basic foodstuffs, while higher rates applied to industrial goods and
‘non-essential’ consumer goods. Customs Duties on many agricultural commodities and
products, including vegetables, fish, coffee, tea, nuts and spices were increased to 25 per cent in
2009 with the stated objective of protecting the domestic industry. The five tariff lines at 200 per
cent relate to imported international brands of cigarettes and cigars.
92. In 2012 the average tariff weighted by the commodity composition of imports was
6.9 per cent which would have yielded approximately 30 Billion Kwacha in 2012. However, the
MRA collected 14.6 billion Kwacha in customs duties (the ex post tariff) which represents an
average collection rate of 3.4 per cent. The difference between the ex-ante and the ex post tariff
rates is accounted for by duty exemptions and preferential tariffs. The dependence on tariff

34
revenue has declined over the period 2007-2012 from accounting for 10-12 per cent of total
government income in 2007/8 to 7.5 per cent in 2012.
Table 8 Malawi 2013 Tariff Structure
Tariff (%) Number of
Tariff Lines
Per Cent
Tariff Bands
2012 Imports
(MK. million)
2012 Imports
Per cent
Zero 1,773 32 225,795 51.97
5 61 1.1 2,803 0.64
7.5 2 0.1 9 0.01
10 1,573 28.4 142,531 32.80
15 6 0.1 716 0.16
20 8 0.1 2,005 0.46
25 2,109 38.1 60,615 13.95
200 5 0.1 37 0.01
Total 5,537 100.0 434,511 100.0 Source: Derived from the MRA ASYCUDA Database
93. The ex post (based on tariffs paid) duty rate is significantly lower than the ex-ante
(or published/statutory MFN) tariff rate because of exceptions from the standard MFN
tariff. Table 9 presents the information on average tariff rates by major sector groupings and
shows the divergence between the published schedules and the actual duty paid on imports.
These include regional and bilateral preferential trade agreements, rebate or duty remission
schemes, and exceptions for imports from international organizations, diplomats and returning
migrant workers. It shows the MFN simple average for various import categories, presents the
trade-weighted average statutory rate (ExAnte Tariff %) and compares this to the effectively
collected customs duties obtained from MRA data, expressed as ExPost Duty %. The table
shows that effectively collected duties are significantly lower than statutory duty rates.
94. While the basic tariff structure has remained unchanged since the mid 1990’s a
small number of new tariff lines have been added since the publication of the Full Tariff
Schedules as a supplement to the Malawi Gazette in December 28, 2007. This is available
electronically on the Malawi Revenue Authority Website (www.mra.mw/), however, it has not
been updated. The tariff schedules listed on the web site differ considerably from the applied
tariff schedules that are taken from the ASYCUDA database, partially because tariffs change
frequently. The MRA has published Annual Notices which outline the amendments to the
Customs and Excise Tariffs Order. The notices (which are on the MRA website) provide a
product description rather than the 8 digit HS Code and are a summary that does not contain
detailed duty rates. Information on the 8 digit HS tariff code is provided in the ASYCUDA tariff
database which is available to all registered customs brokers since it is used for the Direct Trader
Input (DTI) which cannot be accessed by the general public from the MRA website. To increase
transparency, however, it is important for the general public to always have access to up-to date
information, without the need of consulting a customs broker.

35
Table 9 Sector Groups: Tariffs, Collection Rates, Imports and Exports
Values in MK (million)
HS chapter Sector Groups MFN
S. Avg. ExAnte ExPost Import ExPost Export
Tariff Tariff % Duty % (cif) Duty (fob)
01-05 Animal Products 14.7 6.6% 6.3% 1,896.7 119.8 711.4
06-15 Vegetable Products 14.2 8.8% 1.3% 18,465.9 236.0 48,464.8
16-24 Foodstuffs 23.3 12.7% 9.2% 6,566.9 604.3 170,283.6
25-26 Minerals 9.6 5.9% 0.2% 32,238.5 66.3 32,704.1
27 Mineral Fuels 3.3 9.2% 8.0% 59,132.8 4,721.1 389.6
28-38 Chemicals 9.1 0.9% 0.4% 144,579.9 573.3 510.1
39-40 Plastic and Rubber 11.1 6.5% 3.9% 14,335.6 562.0 6,902.1
41-43 Hides and Skins 21.4 25.0% 23.5% 376.1 88.2 501.8
44-49 Wood 13.9 7.1% 2.6% 17,104.8 442.5 6,784.3
50-63 Textiles & Clothing 18.7 20.4% 14.4% 10,129.9 1,457.5 15,604.0
64-67 Footwear 24.6 23.0% 21.2% 2,101.2 445.0 62.2
68-71 Stone and Glass 16.2 15.8% 8.9% 3,816.1 339.0 80.8
72-83 Metals 11.5 10.6% 4.9% 15,635.0 772.7 581.4
84-85 Machinery & Elect. 6.4 3.4% 2.4% 54,291.8 1,286.1 1,401.6
86-89 Transport Equip. 9.1 16.7% 9.8% 25,372.5 2,493.5 2,419.9
90-98 Miscellaneous 19.5 14.4% 1.4% 28,467.5 391.4 1,048.1 Source: Derived from MRA Data.
95. The 2009 WTO TPRM reported that the MFN tariff scheduled contained 5,436
lines. In March 2013 this had increased to 5,537 tariff lines. Table 11 shows the number of 8
digit HS tariff lines that either increased or decreased over the period 2007-2012. It is notable
that while virtually no tariff lines changed on the MFN scheduled significant changes took place
under both the SADC and COMESA regional preferences. Table 10 shows the total number of
tariff bands taking into account both MFN and preferential tariff schedules. While the MFN tariff
schedule has 8 bands when COMESA, SADC and South Africa (under the SADC Trade
Protocol) are considered the combined total number of tariff bands increases threefold to 24.
96. The COMESA tariff preference also contains a large number of ‘nuisance’ tariffs,
defined by the WTO as tariffs of 2 per cent of less, and has a smaller number of zero tariff
lines than under the MFN which is anomalous. Under COMESA 90 per cent of the tariff lines
are below 10 per cent (see Table 10). Malawi’s tariff preferences to SADC, excluding South
Africa have resulted in 94 per cent of tariff lines being at zero customs duty, while the offer to
South Africa under the SADC offers duty free access to 65 per cent of tariff lines (3613), with
virtually all of the remaining lines at 15 per cent. The offer to South Africa also includes over
200 tariff lines at 30 per cent which is higher than the MFN rates (which is anomalous).
97. The review of tariffs at the HS 8 digit level highlighted a small number of
inconsistencies where preferential tariff rates exceed the MFN rate. In most cases these
relate to tariff lines where there is minimal or no trade, however, they should be made consistent
with no preferential tariffs exceeding the applied MFN rates. More important, the complexity of

36
the tariff schedule with its multiple rates and prevalence of nuisance rates of less than 2 per cent
should be simplified. This would have a minimal impact on revenue while reducing red tape and
the time required for customs clearance at the border. The justification for having 2 tariff lines at
7.5 per cent is not apparent.
Table 10 Malawi Customs Tariff Schedules
Number of Tariff Lines
Customs Tariff
(%)
MFN COMESA SADC South Africa 0
1773 1621 5222 3613
1
0 959 0 0 2
0 123 110 0
3
0 364 0 0 4
0 279 0 0
5
61 575 44 94 6
0 651 0 0
7
0 31 0 0 7.5
2 0 0 0
8
0 3 0 0 9
0 171 0 0
10
1573 6 25 21 11
0 2 0 0
12
0 488 0 0 12.5
0 0 1 0
13
0 238 0 0 14
0 5 0 0
15
6 0 36 1593 18
0 1 0 0
19
0 14 0 0 20
8 5 4 1
25
2109 1 94 0 30
0 0 1 215
200
5 0 0 0 Total 24
5537 5537 5537 5537
Source: Derived from the ASYCUDA Tariff Schedule (provided by MRA in March 2013)
Table 11 Summary of Tariff Line Changes, 2007-2012
Tariff Schedule Increase Decrease Number of Lines
MFN 21 9 30
COMESA 331 340 671
SADC 272 13 285
South Africa 305 19 324 Source: Derived from the Malawi Gazette Supplement dated 28
th December 2007 and the ASYCUDA Tariff files
provided by MRA in March 2013.
98. Recent changes in the MFN tariff have been justified as bringing the tariff in line
with the structures agreed for the CET under COMESA Customs Union, namely the
removal of import duty on Chapters 28 and 29 (chemicals) and an increase in tariffs from 5 to 10
per cent on electric transformers and cathode lamps. A line by line review of the published tariff
schedule with the ASYCUDA database revealed more than 100 cases of tariff splitting as
37
Malawi adopted HS 2007 and introduced a number of new national level HS Codes are with
different tariffs. The majority of the tariff line changes relate to implementation of the
COMESA and SADC FTA under agreed phase down schedules (see Table 11).
Regional Trade Preferences
99. Malawi has participated in the COMESA FTA since its launch in 2000 and offers
duty free access to all tariff lines for those COMESA members implementing the Free
Trade Agreement4. For those members of COMESA not implementing the FTA-DRC, Eritrea,
Ethiopia, Swaziland and Uganda- Malawi offers preferential access to almost 4,000 tariff lines.
The COMESA tariff schedule in the Tariff Book only refers to imports from these five non
implementing members. Malawi applies an average preferential tariff of 4.3 per cent to these 5
members of COMESA.
100. In June 2009 Malawi, along with other COMESA FTA members committed to align
their national tariffs with the COMESA Common External Tariff (CET) within five years.
The proposed COMESA CET has three tariff bands: zero for raw materials and capital goods, 10
per cent for intermediate goods and 25 per cent for finished products. The COMESA CET
contains 6,912 tariff lines and detailed work will be required to match this with the existing MFN
external tariff. To date there has been no assessment of the expected economic impact on
incentives and revenue of transitioning to the COMESA CET. A simple comparison of the
existing MFN tariff with the proposed COMESA CET, where the MFN HS codes were matched
with the corresponding COMESA tariff codes at the 6 digit level indicated that Malawi would be
required to increase applied tariffs for 885 tariff lines -mainly from tariff lines currently at rates
between zero and 5 per cent to 10 per cent.
101. Malawi sources almost 40 per cent of its total merchandise imports from SADC,
mainly from South Africa, while exports to SADC account for less than 25 per cent5. The
SADC Trade Protocol was launched in August 2008 following an 8 year transition period. Each
member committed to liberalizing 85 per cent of trade by 2008 and phasing out the remaining
tariffs by 2012 (except for Mozambique which phases out tariffs by 2015). SADC notified the
Trade Protocol to the WTO under Article XXIV. Under the terms of the Trade Protocol, Malawi
as a Least Developed Country was scheduled to begin liberalizing against South Africa in 2005
and against all the other SADC countries from 2003.
102. The SADC tariff phase down schedule was arranged in three baskets. Category A
products which were mostly capital goods and raw materials and accounted for 1,788 tariff lines
with very low or zero MFN tariffs were liberalized on the Trade Protocol entering into effect.
4 This includes 13 countries: 8 since 2000, Djibouti, Egypt, Kenya, Madagascar, Mauritius, Sudan, Zambia, and Zimbabwe: plus Rwanda and
Burundi in 2004; plus Comoros and Libya in 2006; and Seychelles in 2009. 5 This percentage is based on Malawi’s ASYCUDA trade data which is consistent with the COMTRADE mirror data.
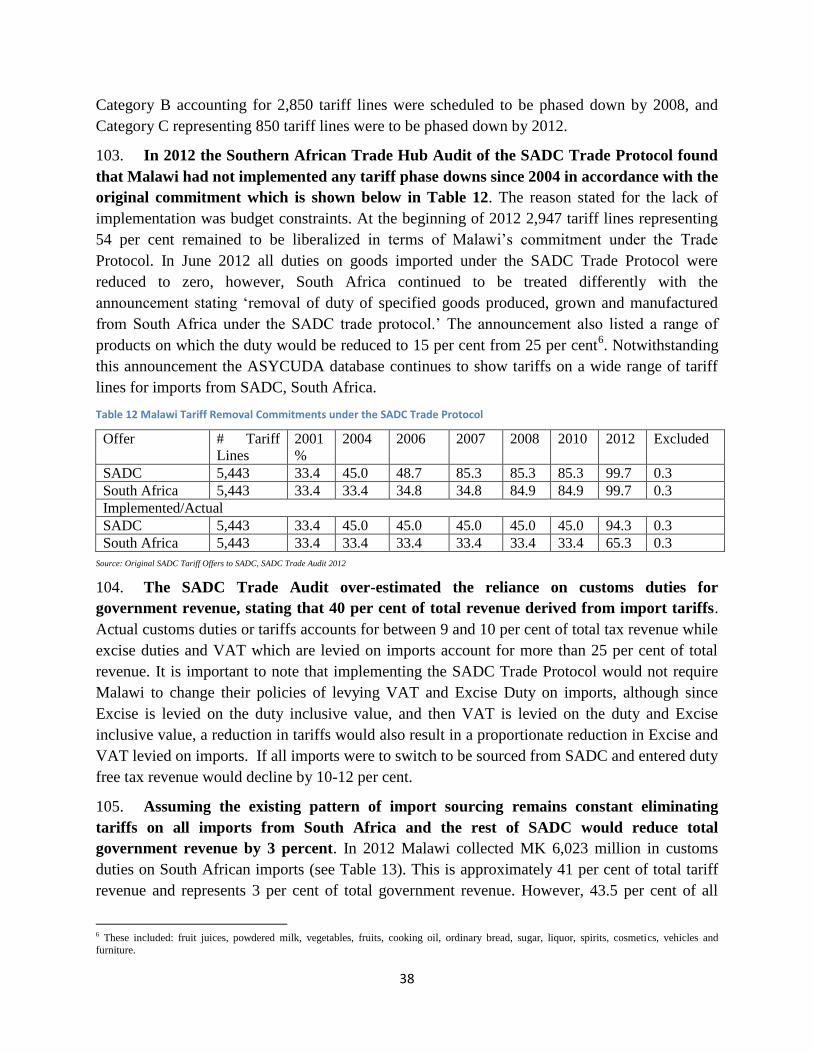
38
Category B accounting for 2,850 tariff lines were scheduled to be phased down by 2008, and
Category C representing 850 tariff lines were to be phased down by 2012.
103. In 2012 the Southern African Trade Hub Audit of the SADC Trade Protocol found
that Malawi had not implemented any tariff phase downs since 2004 in accordance with the
original commitment which is shown below in Table 12. The reason stated for the lack of
implementation was budget constraints. At the beginning of 2012 2,947 tariff lines representing
54 per cent remained to be liberalized in terms of Malawi’s commitment under the Trade
Protocol. In June 2012 all duties on goods imported under the SADC Trade Protocol were
reduced to zero, however, South Africa continued to be treated differently with the
announcement stating ‘removal of duty of specified goods produced, grown and manufactured
from South Africa under the SADC trade protocol.’ The announcement also listed a range of
products on which the duty would be reduced to 15 per cent from 25 per cent6. Notwithstanding
this announcement the ASYCUDA database continues to show tariffs on a wide range of tariff
lines for imports from SADC, South Africa.
Table 12 Malawi Tariff Removal Commitments under the SADC Trade Protocol
Offer # Tariff
Lines
2001
%
2004 2006 2007 2008 2010 2012 Excluded
SADC 5,443 33.4 45.0 48.7 85.3 85.3 85.3 99.7 0.3
South Africa 5,443 33.4 33.4 34.8 34.8 84.9 84.9 99.7 0.3
Implemented/Actual
SADC 5,443 33.4 45.0 45.0 45.0 45.0 45.0 94.3 0.3
South Africa 5,443 33.4 33.4 33.4 33.4 33.4 33.4 65.3 0.3
Source: Original SADC Tariff Offers to SADC, SADC Trade Audit 2012
104. The SADC Trade Audit over-estimated the reliance on customs duties for
government revenue, stating that 40 per cent of total revenue derived from import tariffs.
Actual customs duties or tariffs accounts for between 9 and 10 per cent of total tax revenue while
excise duties and VAT which are levied on imports account for more than 25 per cent of total
revenue. It is important to note that implementing the SADC Trade Protocol would not require
Malawi to change their policies of levying VAT and Excise Duty on imports, although since
Excise is levied on the duty inclusive value, and then VAT is levied on the duty and Excise
inclusive value, a reduction in tariffs would also result in a proportionate reduction in Excise and
VAT levied on imports. If all imports were to switch to be sourced from SADC and entered duty
free tax revenue would decline by 10-12 per cent.
105. Assuming the existing pattern of import sourcing remains constant eliminating
tariffs on all imports from South Africa and the rest of SADC would reduce total
government revenue by 3 percent. In 2012 Malawi collected MK 6,023 million in customs
duties on South African imports (see Table 13). This is approximately 41 per cent of total tariff
revenue and represents 3 per cent of total government revenue. However, 43.5 per cent of all
6 These included: fruit juices, powdered milk, vegetables, fruits, cooking oil, ordinary bread, sugar, liquor, spirits, cosmetics, vehicles and
furniture.

39
customs duties levied on South African imports are on fuel and gasoline (see Table 14) which
could be switched to an equivalent Excise duty to ensure revenue neutrality. Motor Vehicles
account for a further 6.6 per cent of total tariff revenue. Switching the import duty on
fuel/gasoline to an Excise tax and offering duty free access for South Africa on the remaining
tariff lines in compliance with the SADC tariff offer, at 2012 import values would reduce
government tax revenue by 1.8 per cent. The potential 1.8 per cent revenue foregone most likely
overestimates the shortfall as many imports from South Africa, facing a low MFN tariff will
continue to enter under MFN status in order to avoid the compliance costs required to qualify for
SADC preferences.
Table 13 Malawi Value of Tariff Preferences under SADC and Aggregate: 2012
Imports South Africa Rest of SADC Total SADC Total Imports
CIF value MK million 85,413 76,016 161,435 434,511
Tariff Duty Collected 6,023 2.098 8,122 14,599
Tariff Duty Preference 2,801 2,501 5,302 13,825 Source: Mission calculations derived from MRA data
106. Imports from South Africa and SADC classified by the MRA as eligible under the
SADC Trade Protocol (i.e., classified as imports for customs purposes under Columns 8
and 9 in the Published Tariff Schedule) were significantly less than the value of total
imports from South Africa and SADC. This implies that many imports from SADC countries
are either ineligible (because they do not quality under the rules of origin) or importers choose to
pay the MFN tariff. Customs Brokers/importers choose to import under the MFN schedule
(Column 6 in the Published Tariff Schedule) to avoid the compliance costs required under the
SADC Trade Protocol.
107. Tariffs on SADC imports in 2012 accounted for MK 763.7 million in customs duties
on SADC Trade Protocol eligible imports. This represents just over 5 per cent of the total
customs duties collected with imports from South Africa accounting for 95 per cent of the tariff
revenues (MK725.5 million) levied on SADC eligible imports. The balance of customs duties
paid on South Africa imports were classified as MFN and not deemed eligible for preferential
tariff rates. Table 14 shows the value of tariff preferences accruing to imports from South Africa
under the SADC Trade Protocol. To qualify for SADC preferences the regulations require a
Certificate of Origin in hard copy, with one copy for every item (or tariff line) which is onerous
for multiple loads. These obstacles to utilizing the SADC tariff preference are documented in the
recent World Bank report (2011), Harnessing Regional Integration for Trade and Growth in
Southern Arica, which notes how Shoprite, a major retail company may be required to have up to
1,600 documents per truck as each load contain up to 750 tariff items. These compliance costs in
conjunction with the absence of significant tariff preferences because of either low or zero MFN
schedules or the lack of implementation (of the agreed tariff phase down schedule) work to
negate the economic impact of the SADC Trade Protocol.
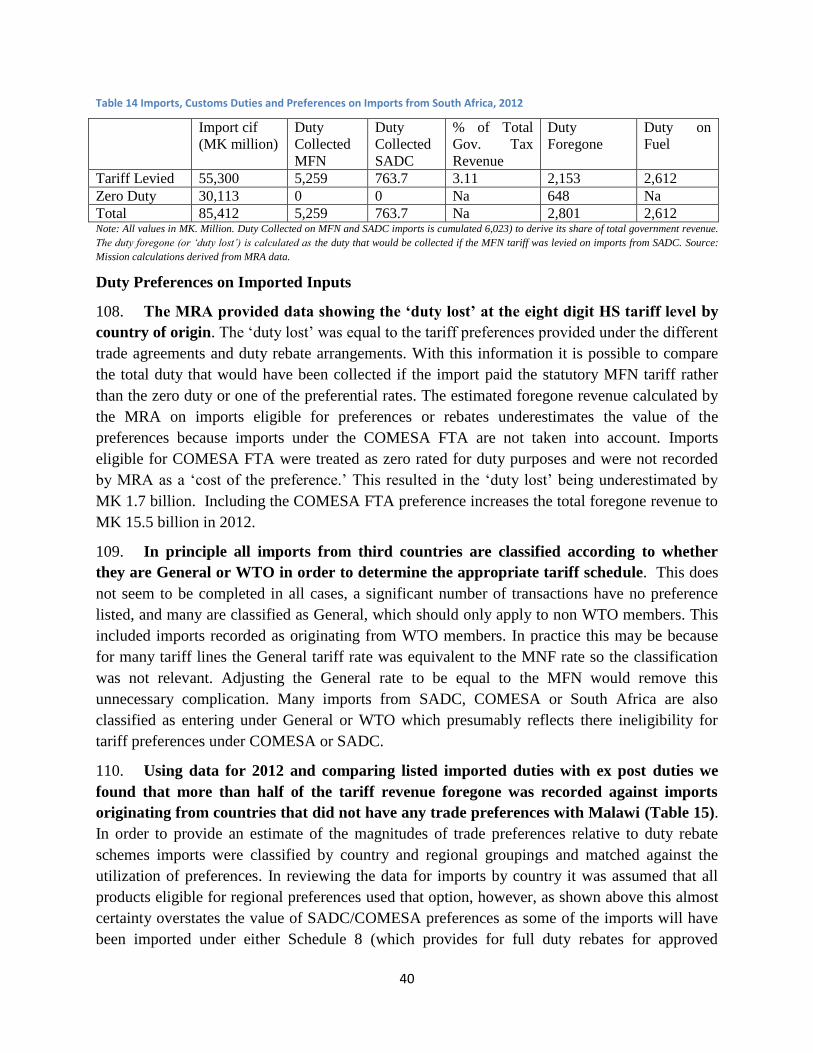
40
Table 14 Imports, Customs Duties and Preferences on Imports from South Africa, 2012
Import cif
(MK million)
Duty
Collected
MFN
Duty
Collected
SADC
% of Total
Gov. Tax
Revenue
Duty
Foregone
Duty on
Fuel
Tariff Levied 55,300 5,259 763.7 3.11 2,153 2,612
Zero Duty 30,113 0 0 Na 648 Na
Total 85,412 5,259 763.7 Na 2,801 2,612 Note: All values in MK. Million. Duty Collected on MFN and SADC imports is cumulated 6,023) to derive its share of total government revenue.
The duty foregone (or ‘duty lost’) is calculated as the duty that would be collected if the MFN tariff was levied on imports from SADC. Source:
Mission calculations derived from MRA data.
Duty Preferences on Imported Inputs
108. The MRA provided data showing the ‘duty lost’ at the eight digit HS tariff level by
country of origin. The ‘duty lost’ was equal to the tariff preferences provided under the different
trade agreements and duty rebate arrangements. With this information it is possible to compare
the total duty that would have been collected if the import paid the statutory MFN tariff rather
than the zero duty or one of the preferential rates. The estimated foregone revenue calculated by
the MRA on imports eligible for preferences or rebates underestimates the value of the
preferences because imports under the COMESA FTA are not taken into account. Imports
eligible for COMESA FTA were treated as zero rated for duty purposes and were not recorded
by MRA as a ‘cost of the preference.’ This resulted in the ‘duty lost’ being underestimated by
MK 1.7 billion. Including the COMESA FTA preference increases the total foregone revenue to
MK 15.5 billion in 2012.
109. In principle all imports from third countries are classified according to whether
they are General or WTO in order to determine the appropriate tariff schedule. This does
not seem to be completed in all cases, a significant number of transactions have no preference
listed, and many are classified as General, which should only apply to non WTO members. This
included imports recorded as originating from WTO members. In practice this may be because
for many tariff lines the General tariff rate was equivalent to the MNF rate so the classification
was not relevant. Adjusting the General rate to be equal to the MFN would remove this
unnecessary complication. Many imports from SADC, COMESA or South Africa are also
classified as entering under General or WTO which presumably reflects there ineligibility for
tariff preferences under COMESA or SADC.
110. Using data for 2012 and comparing listed imported duties with ex post duties we
found that more than half of the tariff revenue foregone was recorded against imports
originating from countries that did not have any trade preferences with Malawi (Table 15).
In order to provide an estimate of the magnitudes of trade preferences relative to duty rebate
schemes imports were classified by country and regional groupings and matched against the
utilization of preferences. In reviewing the data for imports by country it was assumed that all
products eligible for regional preferences used that option, however, as shown above this almost
certainty overstates the value of SADC/COMESA preferences as some of the imports will have
been imported under either Schedule 8 (which provides for full duty rebates for approved
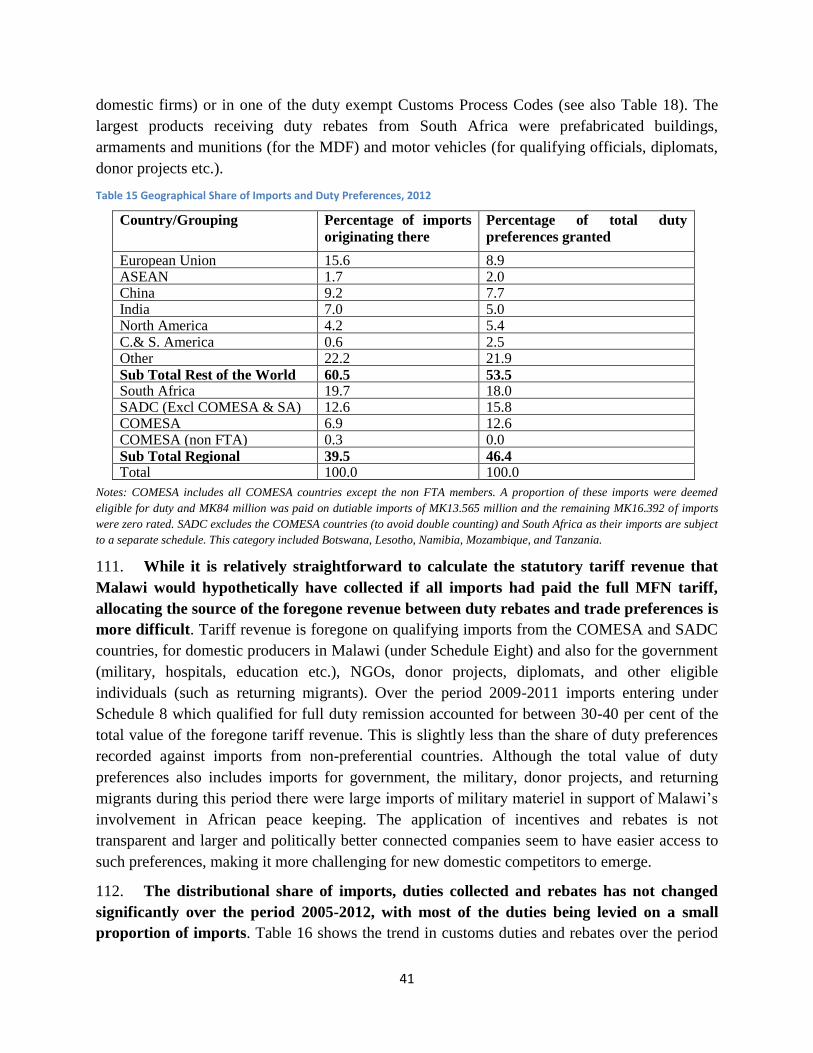
41
domestic firms) or in one of the duty exempt Customs Process Codes (see also Table 18). The
largest products receiving duty rebates from South Africa were prefabricated buildings,
armaments and munitions (for the MDF) and motor vehicles (for qualifying officials, diplomats,
donor projects etc.).
Table 15 Geographical Share of Imports and Duty Preferences, 2012
Country/Grouping Percentage of imports
originating there
Percentage of total duty
preferences granted
European Union 15.6 8.9 ASEAN 1.7 2.0 China 9.2 7.7 India 7.0 5.0 North America 4.2 5.4 C.& S. America 0.6 2.5 Other 22.2 21.9 Sub Total Rest of the World 60.5 53.5 South Africa 19.7 18.0 SADC (Excl COMESA & SA) 12.6 15.8 COMESA 6.9 12.6 COMESA (non FTA) 0.3 0.0 Sub Total Regional 39.5 46.4 Total 100.0 100.0
Notes: COMESA includes all COMESA countries except the non FTA members. A proportion of these imports were deemed
eligible for duty and MK84 million was paid on dutiable imports of MK13.565 million and the remaining MK16.392 of imports
were zero rated. SADC excludes the COMESA countries (to avoid double counting) and South Africa as their imports are subject
to a separate schedule. This category included Botswana, Lesotho, Namibia, Mozambique, and Tanzania.
111. While it is relatively straightforward to calculate the statutory tariff revenue that
Malawi would hypothetically have collected if all imports had paid the full MFN tariff,
allocating the source of the foregone revenue between duty rebates and trade preferences is
more difficult. Tariff revenue is foregone on qualifying imports from the COMESA and SADC
countries, for domestic producers in Malawi (under Schedule Eight) and also for the government
(military, hospitals, education etc.), NGOs, donor projects, diplomats, and other eligible
individuals (such as returning migrants). Over the period 2009-2011 imports entering under
Schedule 8 which qualified for full duty remission accounted for between 30-40 per cent of the
total value of the foregone tariff revenue. This is slightly less than the share of duty preferences
recorded against imports from non-preferential countries. Although the total value of duty
preferences also includes imports for government, the military, donor projects, and returning
migrants during this period there were large imports of military materiel in support of Malawi’s
involvement in African peace keeping. The application of incentives and rebates is not
transparent and larger and politically better connected companies seem to have easier access to
such preferences, making it more challenging for new domestic competitors to emerge.
112. The distributional share of imports, duties collected and rebates has not changed
significantly over the period 2005-2012, with most of the duties being levied on a small
proportion of imports. Table 16 shows the trend in customs duties and rebates over the period

42
2007-2012. The share of duty rebated on imports in the highest tariff bracket with ex ante tariff
rates of 20 per cent or higher has declined in relative importance while rebates on tariffs in the 5
to 9.99 per cent range register a modest increase. This reflects a trend for more firms to apply for
duty rebates on a wider range of products.
Table 16 Imports, customs duties and customs rebates, 2005-2012
Year Imports
MK(million)
Customs
Duty
Ex Post
Duty Rate
Duty
Preferences
Ex Ante
Duty Rate
2005 110,869 4,374 3.95 3,001 6.65
2006 86,408 3,646 4.22 3,428 8.19
2007 181,557 8,877 4.89 3,140 6.62
2008 282,573 11,755 4.16 5,033 5.94
2009 253,222 11,533 4.55 7,039 7.33
2010 306,293 11,990 3.91 6,123 5.91
2011 290,148 8,959 3.09 6,040 5.17
2012 434,511 14,599 3.36 13,825 6.54 Source: Derived from MRA ASYCUDA Database
113. Tariff revenues and tariff exemptions are both highly concentrated on a limited
number of import flows. Approximately 14 percent of imports are classified against MFN tariff
lines of 15 percent or higher. They account for 41 per cent of the total duty collected and
represent 38 percent of the duty foregone. Table 17 presents the distribution of duty collected
and duty rebates against the statutory MFN tariff schedule.
Table 17 Imports, Customs Duty Collected and Duty Rebates by Tariff (2005 and 2012)
MFN
Customs
Duty Rate
Imports
cif %
2005 2012
Duty Collected % within
MFN Tariff Bands
2005 2012
Duty Preferences %
within MFN Tariff
Bands
2005 2012
Zero-4.99 46.7 46.7 11.8 7.6 8.9 5.8
5 – 9.99 28.8 30.9 38.0 42.8 16.0 35.9
10 – 14.99 9.7 9.5 11.6 8.7 31.7 20.1
15 – 19.99 8.5 8.7 18.4 22.0 21.1 22.7
20 + 6.3 4.3 20.2 18.9 22.3 15.4 Note: Duty Rebates include all duty preferences from bilateral and regional trade agreements and the Malawi Duty Rebate
scheme under Schedule Eight. Source: Derived from data provided by MRA.
114. A wide range of industries are eligible for duty and tax concessions (VAT and
excise) under the Eighth Schedule of the Customs Tariff Act (see Table 19). The WTO
TPRM estimated revenue foregone due to exemptions and regional trade concessions at MK 15
billion in 2008/09. The MRA data for the Financial Year ended March 31 2013 shows foregone
customs duties of MK 12.7 billion. This was allocated across 3,531 tariff lines, however, 12 tariff
lines accounted for half of the total value. Adjusting this figure to account for the duty free
imports from COMESA members of the FTA increases the total to MK 15.5 billion in 2012. The
Customs Process Codes (CPC) providing for duty remission listed in the tariff book cover a wide
number of beneficiaries including diplomatic missions, registered non-government organizations,
the military, government to government imports, imports by registered medical, pharmaceutical,
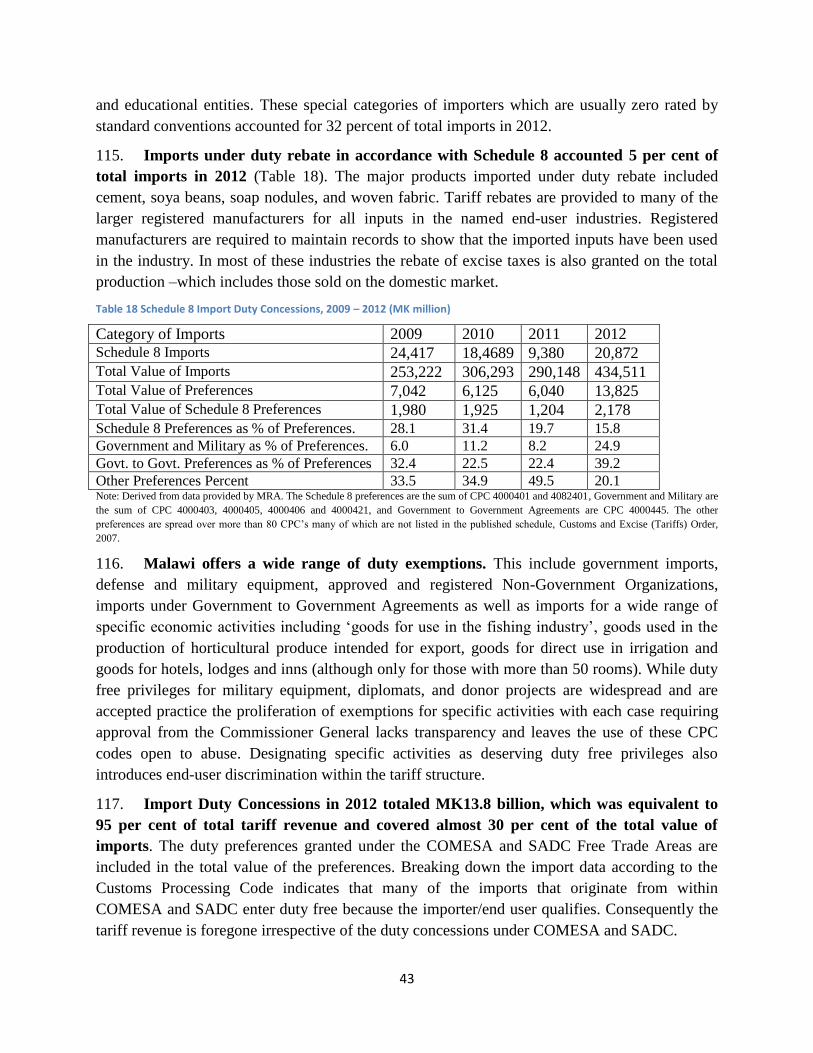
43
and educational entities. These special categories of importers which are usually zero rated by
standard conventions accounted for 32 percent of total imports in 2012.
115. Imports under duty rebate in accordance with Schedule 8 accounted 5 per cent of
total imports in 2012 (Table 18). The major products imported under duty rebate included
cement, soya beans, soap nodules, and woven fabric. Tariff rebates are provided to many of the
larger registered manufacturers for all inputs in the named end-user industries. Registered
manufacturers are required to maintain records to show that the imported inputs have been used
in the industry. In most of these industries the rebate of excise taxes is also granted on the total
production –which includes those sold on the domestic market.
Table 18 Schedule 8 Import Duty Concessions, 2009 – 2012 (MK million)
Category of Imports 2009 2010 2011 2012 Schedule 8 Imports 24,417 18,4689 9,380 20,872 Total Value of Imports 253,222 306,293 290,148 434,511 Total Value of Preferences 7,042 6,125 6,040 13,825 Total Value of Schedule 8 Preferences 1,980 1,925 1,204 2,178 Schedule 8 Preferences as % of Preferences. 28.1 31.4 19.7 15.8
Government and Military as % of Preferences. 6.0 11.2 8.2 24.9
Govt. to Govt. Preferences as % of Preferences 32.4 22.5 22.4 39.2
Other Preferences Percent 33.5 34.9 49.5 20.1 Note: Derived from data provided by MRA. The Schedule 8 preferences are the sum of CPC 4000401 and 4082401, Government and Military are
the sum of CPC 4000403, 4000405, 4000406 and 4000421, and Government to Government Agreements are CPC 4000445. The other
preferences are spread over more than 80 CPC’s many of which are not listed in the published schedule, Customs and Excise (Tariffs) Order,
2007.
116. Malawi offers a wide range of duty exemptions. This include government imports,
defense and military equipment, approved and registered Non-Government Organizations,
imports under Government to Government Agreements as well as imports for a wide range of
specific economic activities including ‘goods for use in the fishing industry’, goods used in the
production of horticultural produce intended for export, goods for direct use in irrigation and
goods for hotels, lodges and inns (although only for those with more than 50 rooms). While duty
free privileges for military equipment, diplomats, and donor projects are widespread and are
accepted practice the proliferation of exemptions for specific activities with each case requiring
approval from the Commissioner General lacks transparency and leaves the use of these CPC
codes open to abuse. Designating specific activities as deserving duty free privileges also
introduces end-user discrimination within the tariff structure.
117. Import Duty Concessions in 2012 totaled MK13.8 billion, which was equivalent to
95 per cent of total tariff revenue and covered almost 30 per cent of the total value of
imports. The duty preferences granted under the COMESA and SADC Free Trade Areas are
included in the total value of the preferences. Breaking down the import data according to the
Customs Processing Code indicates that many of the imports that originate from within
COMESA and SADC enter duty free because the importer/end user qualifies. Consequently the
tariff revenue is foregone irrespective of the duty concessions under COMESA and SADC.
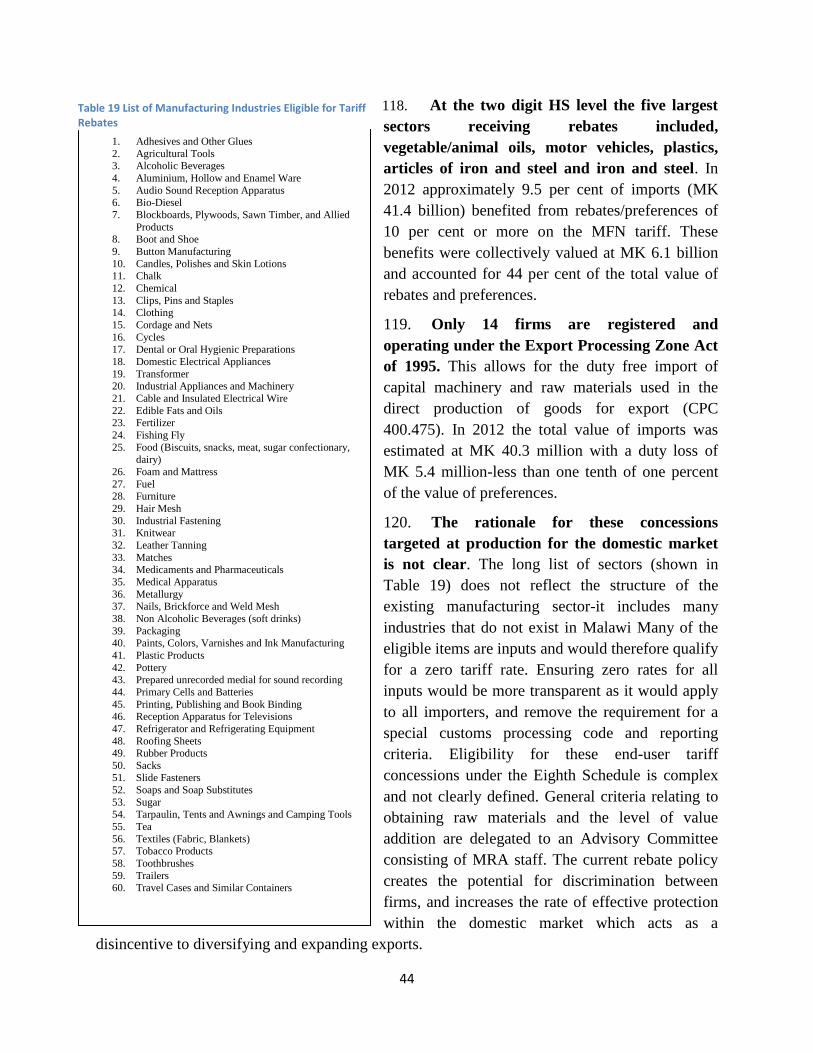
44
118. At the two digit HS level the five largest
sectors receiving rebates included,
vegetable/animal oils, motor vehicles, plastics,
articles of iron and steel and iron and steel. In
2012 approximately 9.5 per cent of imports (MK
41.4 billion) benefited from rebates/preferences of
10 per cent or more on the MFN tariff. These
benefits were collectively valued at MK 6.1 billion
and accounted for 44 per cent of the total value of
rebates and preferences.
119. Only 14 firms are registered and
operating under the Export Processing Zone Act
of 1995. This allows for the duty free import of
capital machinery and raw materials used in the
direct production of goods for export (CPC
400.475). In 2012 the total value of imports was
estimated at MK 40.3 million with a duty loss of
MK 5.4 million-less than one tenth of one percent
of the value of preferences.
120. The rationale for these concessions
targeted at production for the domestic market
is not clear. The long list of sectors (shown in
Table 19) does not reflect the structure of the
existing manufacturing sector-it includes many
industries that do not exist in Malawi Many of the
eligible items are inputs and would therefore qualify
for a zero tariff rate. Ensuring zero rates for all
inputs would be more transparent as it would apply
to all importers, and remove the requirement for a
special customs processing code and reporting
criteria. Eligibility for these end-user tariff
concessions under the Eighth Schedule is complex
and not clearly defined. General criteria relating to
obtaining raw materials and the level of value
addition are delegated to an Advisory Committee
consisting of MRA staff. The current rebate policy
creates the potential for discrimination between
firms, and increases the rate of effective protection
within the domestic market which acts as a
disincentive to diversifying and expanding exports.
1. Adhesives and Other Glues
2. Agricultural Tools 3. Alcoholic Beverages
4. Aluminium, Hollow and Enamel Ware
5. Audio Sound Reception Apparatus 6. Bio-Diesel
7. Blockboards, Plywoods, Sawn Timber, and Allied
Products 8. Boot and Shoe
9. Button Manufacturing
10. Candles, Polishes and Skin Lotions 11. Chalk
12. Chemical
13. Clips, Pins and Staples 14. Clothing
15. Cordage and Nets
16. Cycles 17. Dental or Oral Hygienic Preparations
18. Domestic Electrical Appliances
19. Transformer 20. Industrial Appliances and Machinery
21. Cable and Insulated Electrical Wire
22. Edible Fats and Oils 23. Fertilizer
24. Fishing Fly
25. Food (Biscuits, snacks, meat, sugar confectionary, dairy)
26. Foam and Mattress
27. Fuel 28. Furniture
29. Hair Mesh
30. Industrial Fastening 31. Knitwear
32. Leather Tanning
33. Matches 34. Medicaments and Pharmaceuticals
35. Medical Apparatus
36. Metallurgy 37. Nails, Brickforce and Weld Mesh
38. Non Alcoholic Beverages (soft drinks)
39. Packaging 40. Paints, Colors, Varnishes and Ink Manufacturing
41. Plastic Products
42. Pottery 43. Prepared unrecorded medial for sound recording
44. Primary Cells and Batteries
45. Printing, Publishing and Book Binding 46. Reception Apparatus for Televisions
47. Refrigerator and Refrigerating Equipment
48. Roofing Sheets 49. Rubber Products
50. Sacks
51. Slide Fasteners
52. Soaps and Soap Substitutes
53. Sugar 54. Tarpaulin, Tents and Awnings and Camping Tools
55. Tea
56. Textiles (Fabric, Blankets) 57. Tobacco Products
58. Toothbrushes
59. Trailers 60. Travel Cases and Similar Containers
Table 19 List of Manufacturing Industries Eligible for Tariff Rebates

45
Box 1: Example of Effective Rate of Protection
A food processing factory employing 75 persons produces Cooking Oil for the domestic market. Its main
input is the bulk import of sunflower oil which enters duty free. Other Inputs such as bottles, containers,
and packaging materials and consumables are conservatively assumed to be purchased at world prices as
are non-traded goods such as electricity, water, and security charges. The total value of all inputs accounts
for 70 per cent of the total value of the ex-factory price of the cooking oil. Sunflower cooking oil is
protected in the domestic market with a tariff of 20 per cent.
The firm produces 3 million liters of oil at $2 per liter per annum in domestic prices. Assuming all
production is sold domestically this generates an annual turnover of $6m. At world prices 70 per cent by
value is either imported or sourced locally at world prices. With a zero tariff on the inputs the firm pays
0.7 of the total sales at world prices which is 0.7 *($6m*0.83) for all its inputs, $3.499 million. Assuming
it sells all its production domestically at $6m, it then realizes domestic value added of $2.501 million
which is shared between employees (labor) and the owners (returns on capital). However, if it were to sell
its product overseas it would have to sell at world prices ($1.67 per liter) because other countries also
protect their domestic cooking oil production with a 20 per cent tariff. Therefore any sales overseas would
only realize 83 per cent of the price achieved in Malawi. Assuming the firm where to sell all its
production overseas its total revenue would decline to $4.998m. So although it would have a positive
value added, it would be reduced significantly to 16.5c/liter relative to producing for sale in the domestic
market where value added would be 83.1c per liter. On this basis it is not surprising that the firm would
try and expand its domestic production before entering foreign markets as the former is much more
profitable. If the firm were able to sell duty free (through COMESAS/SADC preferences) into
neighboring markets which were also protected by a tariff on the final product this would also be more
profitable that selling to the world market
Under these assumptions value added on sales in the domestic market is more than double value added on
sales in the foreign market. The Effective Rate of Protection is 125 per cent.
121. For those firms using largely imported inputs with relatively low domestic value
added the ability to obtain duty rebates create substantial incentives to sell in the domestic
market rather than to produce for export. The Effective Rate of Protection quantifies the
combined effect of price distortions on both the inputs and the outputs. It measures the
proportion by which an activity’s (firm) value added at domestic prices differs from that which
would be realized if the prices of its products and inputs were not distorted through tariffs.
Positive effective rates of protection indicate that domestic industries are able to operate with a
higher level of value added that would prevail with reduced MFN tariffs, increasing financial
profits and/or allowing reduced levels of efficiency and thus constituting a subsidy. Even
relatively modest levels of preference such as 10 per cent can generate significant effective
protection in the domestic market. A simple example of the effective rate of protection is shown
in the text box
122. Excluding government and military preferences, the value of duty drawbacks and
user specific preferences is estimated to be approximately MK 10.3 billion in 2012
(approximately $42.7 million). While many of the specific preferences are required by

46
international agreements (almost one third of the total value of preferences), the widespread use
of duty drawback or duty remission for firms producing for the domestic market serves to
provide high levels of effective protection and creates anti-export bias for exports outside of the
region. By deepening the ability of a firm to increase its rate of return on sales to the domestic
market, it reduces the incentives for expanding into foreign markets, where the product would
have to be sold at lower prices. To the extent that regional markets are also protected by an
equivalent or similar external tariff the firm will be able to maintain its level of effective
protection providing it can meet the origin requirements.
Will implementing Regional Free Trade Agreements result in Trade Diversion?
123. The proposed COMESA CET will result in Malawi having to increase some MFN
tariff rates, and the proposed cascading tariff structure with higher tariffs on finished
products will maintain the existing anti-export bias while also raising the risk of trade
diversion. Malawi is committed to modifying its MFN tariff to the rest of the world to
implement the proposed COMESA CET rates while removing tariffs selectively for members of
COMESA and SADC at the current proposed tariff rates this will exacerbate anti-export bias.
Trade diversion occurs when a country substitutes more expensive imports from its
SADC/COMESA partners for less expensive imports from more efficient producers in the rest of
the world. The continued existence of the MFN (COMESA CET) tariff may also result in final
consumer prices being little changed, while the government loses tariff revenue. To date there is
little evidence of trade diversion as the share of imports from the rest of the world have increased
since 2009, however, this may reflect both the slow implementation of tariff preferences and the
widespread use of tariff rebates on MFN imports (valued by MRA at more than MK 8.5 billion
in 2012). Many of the rebates on MFN imports is consistent with international norms and relate
to exemptions for government education/health, security/defense, NGO’s and registered
charities, returning migrants, and donor projects. Rationalizing the use of rebates under Schedule
8, reducing the MFN tariff rates and implementing the SADC Trade Protocol concurrently would
minimize the risk of trade diversion, reduce anti-export bias and have a modest impact on
government revenue. Furthermore all customs tariffs are levied on the c.i.f. value of the import
which given the high transportation costs of goods from outside the region provides additional
‘natural’ protection.
Export Duties
124. The existing tariff seeks to discourage the export of wood and levies a 50 per cent
export duty on all wood for fuel, raw wood, and also sawn, chipped and sliced wood. While
there are no ad valorem export duties on agricultural commodities they are subject to licensing.
The impact of import and export permits on agricultural items is discussed in Chapter 5.
Summary
125. The review of Malawi’s tariff policy highlights the widespread use of exemptions
under international agreements for government and NGO/donor imports, the use of duty

47
rebates under Schedule 8 for large import competing firms. Implementing the SADC Trade
Protocol on imports from South Africa would have a much more modest impact on total
government revenue than has previously been estimated as a large proportion of the tariff
revenue on imports from South Africa relates to oil and gasoline and this revenue could be
maintained by switching the taxation to non-discriminatory excise taxes and eliminating import
tariffs. The detailed analysis of firm level exporters finds that exports are dominated by a small
number of long established very large firms. There are few new exporters who are able to remain
as exporters for more than one year. This lack of dynamism reflects the existence of significant
barriers to entry in competing in export markets.

48
Chapter 4. Non-Tariff Barriers in Malawi
126. Awareness of the importance of Non-Tariff Measures (NTM) has increased
considerably over the past decade as the reduction in tariffs has served to highlight the cost
raising impact of regulatory requirements and administrative procedures. A NTM is any
measure other than customs tariffs that can potentially have an economic effect on trade. These
include regulations aimed at ensuring consumer safety, health, environmental protection and
other public policy objectives that are desirable and permissible under the WTO and all the
regional agreements providing they are applied equally to domestic products and imports,
designed to minimize the trade impact, and in the case of sanitary and phyto-sanitary measures
have a basis in scientific knowledge.
127. A Non-Tariff Barrier (NTB) refers to a NTM which has a negative impact on trade.
This may result from a measure having a differential impact on importers vis a vis domestic
producers and also from procedural obstacles that stem from the business enabling environment
and existing administrative and institutional arrangements. While the intent of the regulation may
legitimately aim to deliver consumer safety the way in which the measure is implemented may
unintentionally have an adverse impact on potential exporters by imposing high market entry
costs which are prohibitive for small and medium scale operators.
128. Malawi as a member of both SADC and COMESA participates in the
SADC/COMESA/EAC on line Non-Tariff Barriers (NTB) Reporting, Monitoring and
Eliminating Mechanism that is managed by TRADEMARK Southern Africa. The three
Regional Economic Communities (RECs), COMESA, East African Community (EAC) and
SADC, have established a Non-Tariff Barriers (NTB) reporting, monitoring and eliminating
mechanism. The information is available on a public website www.tradebarriers.org .Under the
mechanism stakeholders, including the REC secretariat, government departments/agencies,
firms, private sector associations, or individuals, can report the barriers they encounter in cross-
border trade within the Tripartite Community. The website provides instructions on how to
submit a report on line. The website went live in 2009 and by the end of June 2013 had formally
registered 457 complaints and reported that 349 complaints had been resolved, leaving 108
outstanding. Out of these 108 complaints 100 had been outstanding longer than 60 days.
129. Malawi has registered 30 complaints which have all been formally resolved. Out of
these 30 complaints 10 related to NTB’s within Malawi, 7 in South Africa, 7 in Mozambique, 3
in Zambia, and one each in Zimbabwe, Mauritius and throughout SADC. Malawi has only one
NTB outstanding relating to lengthy and costly customs procedures at Dedza. Virtually all of the
‘resolved’ NTBs relate to issues that continue to be raised by the private sector, such as
cumbersome and non-transparent testing procedures, SPS procedures, lack of information, export
certification, restrictions on imports. These are the same issues identified in the recent ITC report
(noted below) and highlighted from interviews with the private sector for the DTIS.

49
130. The NTBs are all classified in accordance with the 8 categories agreed by the 2009
Multi-Agency Support Team (MAST):
Category 1: Government participation in trade and restrictive practices;
Category 2: Customs and administrative entry procedures;
Category 3: Technical Barriers to Trade (TBT);
Category 4: Sanitary and Phyto-sanitary (SPS) measures;
Category 5: Specific Limitation (captures restrictive trade policies such as prohibitions
and import licensing);
Category 6: Charges on imports;
Category 7: Other procedural problems;
Category 8: Transport, Clearing and Forwarding.
Table 20 Tripartite NTB Reporting Mechanism, 2009-2013
NTB Category Total Resolved >60 Days 30-59 Days Current <30 Days
1 40 33 7 0 0
2 174 143 29 1 1
3 18 15 3 0 0
4 26 19 7 0 0
5 47 44 3 0 0
6 9 7 1 0 1
7 69 57 11 0 1
8 74 31 39 1 3
Source: Compiled from www.tradebarriers.org accessed on June 28, 2013.
131. The allocation of the complaints between the different categories is shown in Table
20. Customs and administrative entry procedures accounts for almost 40 percent of the total
followed by transport, clearing and forwarding policies and procedures and Category 7 which
includes arbitrary behavior, discrimination, corruption, and complex and costly procedures.
Given the importance of the agriculture sector throughout the region it is not surprising that SPS
shows up more often than TBT.
132. The Tripartite NTB Monitoring Mechanism database rich source of data that can
be used to assess the volume and type of NTB that concern cross border traders within
Eastern and Southern Africa. A unique reference number is assigned to each complaint, and
information is provided on the type of NTB, date of the incident, location, reporting country, a
description of the complaint (provided by the plaintiff), the progress (or response by the officials
from the country with the NTB), the current status (new/in process/resolved) and the date
resolved. At first blush the proportion of resolved complaints relative to those outstanding would
appear to imply a success rate of over 75 percent.
133. However, when the resolved cases are examined it becomes apparent that removal
from the online database does not necessarily translate in removal of the NTB or a
reduction in trade costs. A NTB may be classified as resolved and removed from the database,

50
and classified as Non-Tariff Measure (NTM) and therefore justified by public policy and not
unnecessarily trade restrictive, simply because the country applying the trade restriction responds
with an explanation. However, in virtually all cases the explanation does not result in any
material change for the potential importer and does not meet the criteria of being ‘least trade
restrictive’ as required by the WTO and the regional agreements. The government should
commit to a thorough review of the existing complaints that have been submitted through the
mechanism to identify the underlying issues and address them in this spirit.
134. The ITC found NTMs affected over three quarters of all firms exporting and more
than two thirds of all companies surveyed. The ITC Malawi firm level NTM survey covered
the period October 2009 –June 2011. From a telephone survey of 129 firms, 89 firms were
affected by NTMs. From these 89 firms 65 firms completed detailed face to face interviews.
Comparing Malawi across countries already surveyed by the ITC shows a much higher share of
exporters affected by trade relative to many other countries in Sub-Saharan Africa and
significantly higher than Mauritius where 30 per cent of companies reported NTMs. The range of
responses across the comparator countries is shown in Table 21.
Table 21 Cross Country Comparison of ITC NTM Firm Level survey results
Country Per Cent of Companies Reporting Trade
Impediments
Malawi 81.5 Kenya 74.8 Rwanda 71.0 Sri Lanka 69.7 Paraguay 68.9 Madagascar 67.3 Burkino Faso 63.2 Uruguay 56.0 Jamaica 42.0 Peru 41.9 Egypt 36.7 Morocco 34.6 Mauritius 30.5 Hong Kong 23.1
Source: Table 5 Malawi: Company Perspective: An ITC Series on Non-Tariff Measures, 2013
135. The interviews reported widespread NTMs imposed by Malawi on its own firms
whether producing for the domestic or foreign markets. In export markets, conformity
assessment procedures, such as certification which is accepted as proof of compliance with the
underlying technical requirements was the most commonly reported measure. As outside SADC
and COMESA countries do not recognize test results issued by either MBS or the Department of
Agricultural Research and Technical Services (DARTS). Other NTMs mentioned included pre-
shipment inspections, additional charges, and problems related to the certificate of origin.
Domestically applied NTMs were dominated by export licenses which accounted for half of the
total, followed by export inspections, technical certification and foreign exchange conversion
requirements (with the liberalization of the current account in May 2012 the foreign exchange

51
conversion is no longer applicable). There were also complaints over the delays in testing results
from MBS and DARTS for Technical Regulations and SPS requirements, according to ITC
(2012), these could range from few days to four weeks, but the report also noted exceptional
cases of several months.
136. The most common import constraint reported by firm in the ITC survey (after
foreign exchange regulations which have now been removed) was the import inspections
mandated under the Import Quality Monitoring Scheme (IQMS). This is discussed in more
detail in the section on National Quality Infrastructure. Procedural obstacles relating to the
modalities governing implementation of a technical regulation were reported by more than 90
per cent of respondents. Domestic procedural constraints encompass a wide range of complaints
including multiple checks, inconsistent behavior, administrative delays, high fees and charges,
inadequate facilities. Procedural complaints and administrative requirements are often considered
to be more straightforward to remedy as they do not reflect the intent of government policy.
However, such reforms are rarely implemented solely by ‘stroke of the pen’ actions as they are
specific to institutions/departments and agencies and frequently require considerable investments
in training, organizational development, funding that will only happen with a strong commitment
from the highest level of government.
137. The recent release of the second draft of the National NTB Elimination Strategy in
May 2013, as part of the National Export Strategy (NES) is a positive development,
however, both political commitment and support is required to remove the administrative
and organizational hurdles. The Elimination Strategy proposes an institutional framework for
addressing and monitoring NTB and identifies four main NTB categories:
Trade Policy Issues: Import and Export Licenses, Bans, Quotas;
National Quality Infrastructure: Standards and Accreditation;
Transportation and Transit Corridors; and
Trade Facilitation: Customs Border Related and Rules of Origin.
138. The NTB Committee work program must build on the work to date by engaging in
a review of existing regulations. This might include reviewing existing Technical Regulations
and evaluating those that are necessary from those where a voluntary standard would be
sufficient. Requiring all new Technical Regulations to have a Regulatory Impact Assessments
(RIA) with the aim of improving the quality of regulations to ensure they are ‘smart’ and least
trade restrictive and promoting transparency and public debate on appropriate levels of
regulatory protection. The recent World Bank NTM Policy Toolkit (Streamlining Non-Tariff
Measures: A Toolkit for Policy Makers, 2012) provides a useful approach and checklist for
identifying the issues, assessing the costs and benefits, and streamlining the processes and
institutions.
139. This chapter follows the categories presented in the Malawi National NTB
Elimination Strategy by focusing on: trade policy regulations; national quality
infrastructure; trade logistics; and trade facilitation.
52
Trade Policy Issues: Import and Export Licenses
140. At the time of writing, virtually every type of agricultural commodity imported to or
exported from Malawi requires a special Trade Permit. Similar licensing requirements also
apply to: fertilizer, seed, agrichemicals, and machinery (see Table 22), and a number of other
products. In June 2013 in a positive development the Minister of Industry and Trade decided to
remove the export licensing requirements for most agricultural commodities except for maize
(meal) and rice. As part of this decision, such products would also no longer need an authorizing
letter from the Ministry of Agriculture either. However, this decision has to date not been
gazetted and therefore most agricultural exports were effectively still in need of documentation
from Ministry of Agriculture and Ministry of Trade at borders. There has been no decision to
reduce the requirements for import permits yet.
141. For goods requiring a permit the Control of Goods Act requires importers and
exporters to write a letter to the Ministry of Agriculture and Food Security providing
details (product, quantity, value, origin) of the proposed transaction. On review of the
application, the Permanent Secretary (PS) must sign a Recommendation Letter which is then
physically collected by the applicant and hand carried to the Ministry of Industry and Trade
(MIT) for further review and issuance of permit. MoAFS says the main function of its review is
to ensure that the proposed transaction is within the firm’s capacity. In order to obtain MoAFS
approval to import or export, the company must be formally registered in Malawi as a trader.
142. Upon receiving the MoAFS Recommendation Letter, the Ministry of Industry and
Trade may, in turn, request further information on the transaction or recommend the
application for approval. For the approval to take place, a Recommendation Document must be
prepared and sent to the Minister of Industry and Trade for personal signature. According to the
interviews, the previous Minister frequently requested additional information from applicants
that often resulted in considerable delay. The Ministry indicated that the current policy is to issue
the Trade Permits without requiring any additional information. The MIT employs two persons
to work on import and export permits. Abolishing the requirement for trade permits would
enable these staff to be redeployed more productively..
143. Export Permits are valid for three months from the date of issue while Import
Permits are valid for six months. Dairy importers, however, complain that permits for milk and
milk products, licensed under the Ministry of Agriculture, are valid for only four weeks thereby
making business risky and difficult to negotiate favorable contracts. Both import and export
permits cover one specific type of commodity only and specify the total quantity and value that
can be traded from the date of issue. In principle the permits are to be stamped each time they are
used until the total quantity has been exhausted, however, officials noted that it was virtually
impossible to monitor the quantities being traded. The absence of effective monitoring raises
further questions over the rationale for having any license requirement. The uncertainty over the

53
issuing of licenses and the costs of delays both discourage trade and discourage banks from
providing financing since the increased trade costs increase the risk of failure.
144. The operation of the permit system is regressive and effectively discriminates
against small traders and small farmers. Essentially the requirement for permits restricts
formal trade to organized large scale and Lilongwe based traders/firms as the permits have to be
obtained in person (or by an employee) from the Government Offices. The applicant has to be a
registered commercial enterprise or cooperative. This process excludes smallholders-they can
only participate through NASFAM, organized cooperative, or indirectly by selling to a larger
trader.
145. While the Ministry of Industry and Trade does not charge a fee for Import or
Export Permits, all the firms interviewed for the DTIS considered the time and costs of
obtaining Trade Permits represented a major constraint to their business. On the one hand,
most agreed it “is possible” to obtain a permit in just one day except that all companies said this
depends on whether they are lucky enough to find all individuals around who must sign-off on
the permit and on having someone from the company who can go from office to office to push
the process throughout the day. Without this kind of constant follow-up, exporters said it usually
takes four to six weeks for a permit to be approved. Because many business transactions depend
on fast turnaround, some companies said that their usual practice is to keep a supply of Trade
Permits on hand in order to avoid delay when a real business deal comes through.
146. Export permits are also required for petroleum products, gemstones, scrap metal
and raw hard round wood timbers. A number of metals including uranium, thorium, titanium,
niobium also require permits although this is related to the regulation of the mining sector. The
government has recently decided to reduce the number of products requiring export permits from
25 to 10, but this policy has not yet been implemented although it has been announced on June
20, 2013. Import permits remain in force for a large number of products as outlined above.

54
Table 22 List of Agriculture Commodities Requiring a Trade Permit 2013
Import Permits Export Permits All grains (including barley, maize, millet, rice,
sorghum, and wheat in every form)
Bananas
Beans
Beetroot
Cabbage
Carrots
Cauliflower
Citrus fruits (oranges, lemons, grapefruit, etc)
Cotton lint, cotton seed, cotton cake and all other
forms of cotton
Eggplants
Fresh beans
Fresh chilies
Fresh peas
Green pepper
Groundnuts
Hides and skins in processed and non-processed
form
Irish potatoes
Lettuce
Live fish and animals
Maize including dried maize, crushed maize, samp
but excluding green maize on the cob
Maize Meal (including maize grits, cones, hominy
chop or maize offal)
Millet (munga or munga meal)
Oilseeds, oil meals, oil cake and offal and residues
from oil seeds
Onions
Potatoes (all types)
Poultry and poultry products (including frozen
broiler chickens, eggs, day old chicks and breeding
stock)
Radishes
Rape
Rupoko meal and grams
Salt
Seed for planting
Sorghum, including meals and malts
Soybeans, soy meals and all other forms of soya
Tomatoes
Turnips
Vegetable oils
Wild animals
All grains (including barley*, maize, millet*, rice,
sorghum*, and wheat* in every form)
Bananas*
Beans*
Beetroot*
Cabbage*
Carrots*
Cassava*
Cauliflower*
Citrus fruits (oranges, lemons, etc)*
Cotton lint, cotton seed, cotton cake and all other
forms of cotton*
Eggplants*
Fresh beans*
Fresh chilies*
Fresh peas*
Green pepper*
Groundnuts*
Hides and Skins in processed and non-processed
form*
Irish potatoes*
Lettuce*
Live fish and animals
Maize including dried maize, crushed maize, samp
Maize Meal (including maize grits, cones, hominy
chop, maize offal or processed maize meals)
Oilseeds, oil meals, oil cake and offals and residues
from oilseeds*
Onions*
Potatoes (all types)*
Poultry and poultry products (including frozen
broiler chickens, eggs, day old chicks and breeding
stock)
Radishes*
Rape*
Seed for planting*
Salt*
Seeds for planting in quantities greater than 90kg*
Sorghum meal or sorghum malt*
Sorghum, including meals and malts*
Soya Beans, meals and all other forms*
Tea*
Tobacco*
Tomatoes*
Turnips*
Vegetable oils*
Wild animals*
Note: In June 2013 many of the export permits were abolished, these are indicated by *.
55
Elements of a National Quality Infrastructure
147. The National Quality Infrastructure (NQI) includes standardization, testing,
certification, metrology and accreditation which are all necessary for proving that products
or services meet public policy objectives such as health and safety. The relationship between
the different components of the NQI is shown in Figure 12.
148. Standards are formal documents containing the requirements that a product,
process or services are expected to meet. Best practice policy supports maximizing the use of
international standards and removing obsolete standards. International standards should be
adopted in areas with adequate domestic technological conditions and high trade potential.
Technical Regulations are often referred to as mandatory standards since they must be complied
with. Standards can also be set by industries or international bodies as recommendations and
these are referred to as private standards. When countries set Technical Regulations it is best
practice to adopt international standards that have been agreed by industries and international
bodies.
149. Conformity Assessment includes testing, inspection and certification services.
Testing refers to either public or private services which determine certain product characteristics
against the requirements of a standard. Inspection is mostly conducted on consignments in order
to ensure that the entire consignment is equivalent to the product sample tested. One example is
import inspection done at the border. Inspection services are provided by private or public
institutions. Certification means the formal substantiation by a certification body (which can be
either public or private) an evaluation following testing that a product, service, organization or
individual meets the requirements.
150. The Malawi Bureau of Standards operates as regulatory body and has the
monopoly on testing and certification of imports subject to Technical Regulations. They
also provide voluntary business services. Good regulatory practice separates regulation from
conformity assessment (testing and certification). South Africa has separated the governance of
mandatory standards from the South African Bureau of Standards (SABS) by establishing the
National Regulator for Compulsory Standards (NRCS). The NRCS is not allowed to run its own
laboratories. Malawi’s new National Quality Policy (NQP) also foresees this separation of
powers in accordance with best practice, and its implementation would bring significant positive
benefits (see also para 194).
Standards define characteristics or performance and convey information to the buyer/user and are
voluntary. Standards are frequently set by Specialist International Agencies representing industry
groups, or even private firms, or groups of private firms. They are not set by the WTO.
Technical Regulations are sometime referred to as mandatory standards. They define characteristics
or performance required by Government statute. Technical Regulations can be set by Governments,
adopted from international or regional bodies, or private firms. To be compliant with the WTO they
should be least trade restrictive and follow international standards where applicable.
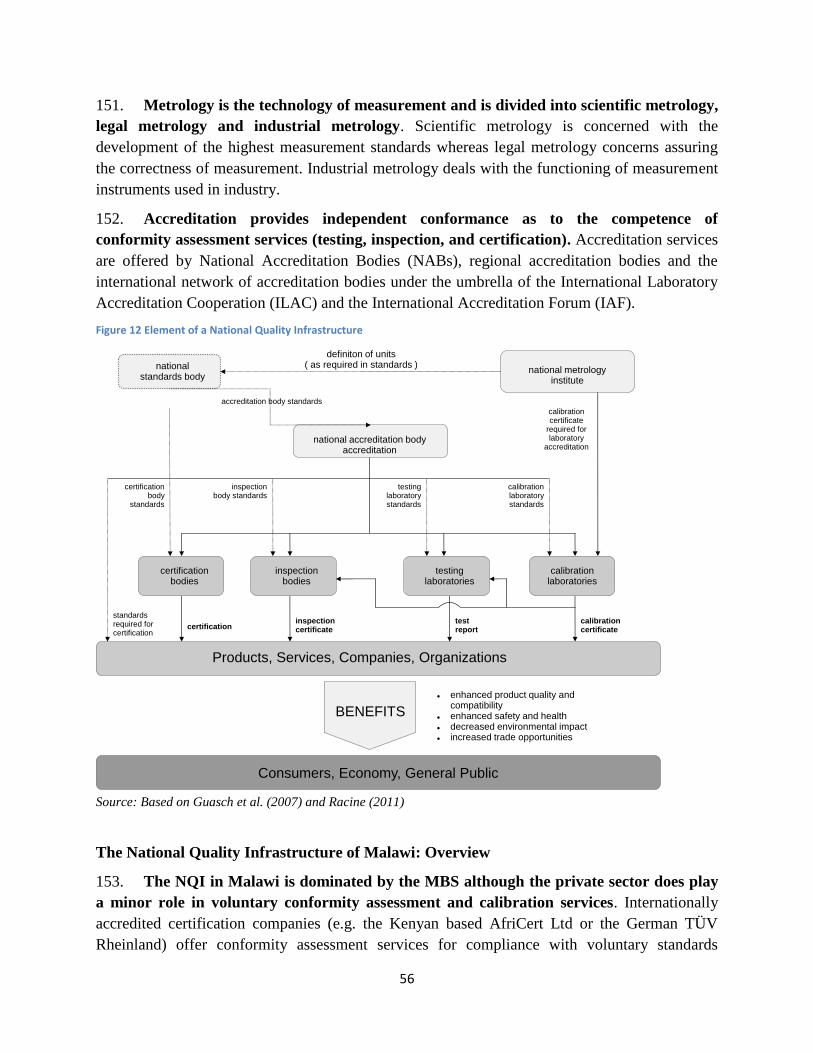
56
151. Metrology is the technology of measurement and is divided into scientific metrology,
legal metrology and industrial metrology. Scientific metrology is concerned with the
development of the highest measurement standards whereas legal metrology concerns assuring
the correctness of measurement. Industrial metrology deals with the functioning of measurement
instruments used in industry.
152. Accreditation provides independent conformance as to the competence of
conformity assessment services (testing, inspection, and certification). Accreditation services
are offered by National Accreditation Bodies (NABs), regional accreditation bodies and the
international network of accreditation bodies under the umbrella of the International Laboratory
Accreditation Cooperation (ILAC) and the International Accreditation Forum (IAF).
Figure 12 Element of a National Quality Infrastructure
Source: Based on Guasch et al. (2007) and Racine (2011)
The National Quality Infrastructure of Malawi: Overview
153. The NQI in Malawi is dominated by the MBS although the private sector does play
a minor role in voluntary conformity assessment and calibration services. Internationally
accredited certification companies (e.g. the Kenyan based AfriCert Ltd or the German TÜV
Rheinland) offer conformity assessment services for compliance with voluntary standards
definiton of units( as required in standards )national
standards bodynational metrology
institute
national accreditation body accreditation
certificationbodies
inspectionbodies
testinglaboratories
calibrationlaboratories
accreditation body standards
calibrationcertificate
required forlaboratory
accreditation
Products, Services, Companies, Organizations
Consumers, Economy, General Public
BENEFITS
enhanced product quality and compatibility
enhanced safety and health decreased environmental impact increased trade opportunities
certificationbody
standards
inspectionbody standards
testinglaboratorystandards
calibrationlaboratorystandards
standardsrequired forcertification
certificationinspectioncertificate
testreport
calibrationcertificate

57
required by importers in the European Union or North America. Calibration services are also
offered by private companies such as SGS S.A. Subsidiaries from multinational companies
operating in Malawi are also part of the NQI. For example, the laboratory of the Carlsberg
brewery in Blantyre is also used by other companies to test for conformity with private
standards.
154. Established in 1972 the MBS is a statutory organization with the mandate as
described on its website to: (a) advance the national economy; (b) benefit the health, safety, and
welfare of the public; (c) assist and protect consumers; (d) facilitate domestic and international
trade; and (e) furthering international cooperation in the field of standardization.
155. The MBS interprets it mandate as protecting consumers from substandard
products. Frequent campaigns in the media warn that Malawi will be turned into a “dumping
ground” for substandard products without widespread checking and testing by MBS and growing
consumer awareness.7 Ensuring consumers are protected from substandard, adulterated, or
counterfeit, products represents an important and legitimate role for the MBS but cannot be done
with border inspections alone. However, it is not apparent that this objective is best served by the
compulsory testing of all imports regulated under the Import Quality Monitoring Scheme, and
the predominant focus on border operations. Increasing the role of market surveillance,
introducing risk analysis on imports under the IQMS and recognizing already accredited imports
would allow a more targeted approach to addressing consumer concerns. Increasing market
surveillance would justify the MBS receiving a subvention from the GOM.
156. During interviews with private sector stakeholders it was apparent that they
considered the MBS implementation of the mandatory conformity assessment
requirements as an implicit tax which served to increase costs and contributed to border
delays rather than as payment for the provision of a legitimate and valued service. The
mandatory IQMS requires all imports subject to Technical Regulations to be tested, including the
products that had already been tested by internationally accredited firms prior to arrival in
Malawi. Many firms never received their test results, or only did so following enquiry, and some
observers suspect that not all samples are actually tested. The MBS is not accredited by either the
SADC Accreditation Agency or either of the two international bodies (ILAC and IAF). While
the MBS accepts test results from its own laboratories, it does not recognize test results from
overseas accredited testing bodies.
157. The MBS is the National Enquiry Point for the WTO Agreements on Sanitary and
Phytosanitary (SPS) measures (Food Safety only) and Technical Barriers to Trade (TBT)
as well as the National Codex Contact Point. MBS is therefore responsible for providing
information on national food safety measures, standards and conformity assessment
requirements.8 The MBS is a member or affiliate member of a number of regional or
7http://www.nyasatimes.com/2012/02/16/regulators-making-malawi-a-dumping-ground/ 8 There are two additional enquiry points, the Department of Animal Health, and the Bvumbwe Agricultural Research Station, and one notification authority, the Ministry of Industry and Trade, creating a potential for confusion and increasing the risk of obtaining incomplete

58
international standards bodies. At the regional level, MBS participates in the SADC
Standardization, Quality Assurance, Accreditation and Metrology (SQAM) activities, the
COMESA Committee on Standardization and Quality Assurance, the Intra-Africa Metrology
System, and the African Organization for Standardization. At the international level, MBS is a
member of the International Organization for Standardization (ISO), and an affiliated member of
the International Electrotechnical Commission (IEC), the International Organization of Legal
Metrology, and Codex Alimentarius Commission (Gama 2011).
158. The MBS has five departments: (1) Standards Development Department; (2) Quality
Assurance Department; (3) Testing Services Department; (4) Metrology services; and (5)
Finance and Administration Department. Besides accreditation service, the MBS provides all
NQI services in one organization. The Standards Development Department is responsible for
issuing voluntary standards and technical regulations (i.e. mandatory standards). Conformity
assessment services are provides by the Quality Assurance Department and the Technical
Services Department and measurement services are offered by the Metrology Service
Department. Finally, the Financial Department provides horizontal services for all MBS
departments including financial and human resource management.
Standards Development
159. Standards development in Malawi is a demand driven process and commences with
a representative from a trade association, consumer group, or Government submitting a
proposal to the MBS. The proposal is then examined to determine whether it is consistent with
the principles for the preparation of standards. After successful examination, the proposal is sent
to an appropriate Technical Committee (TC). The TC officer prepares a draft standard or
alternatively appoints a subcommittee or working group (WG). The subcommittee or WG
extensively discusses and reviews the proposal if required. After a draft standard has been
prepared by the subcommittee or WG, the TC discusses and reviews it and then passes it to the
MBS secretariat for wide circulation.
160. The circulation of the draft aims to inform interested parties in Malawi and abroad
which may be affected by the standard. The TC incorporates comments to the draft standards.
The draft is submitted to the Divisional committee where the draft is examined. The final draft is
then sent to the Standards Policy Advisor Committee (SPAC) and the Malawi Bureau of
Standards Board. After approval by these committees, the MBS submits the approved standard to
the Ministry of Trade and Industry for gazetting. Standards developed by MBS can be voluntary
or mandatory. According to the MBS, standards that have an impact on health and safety of the
consumer are made mandatory. The TCs can make a recommendation whether or not a standard
should be voluntary or mandatory. The Malawi Standards Board makes the final decision on the
implementation status (SDD 2012). The steps of standards development are shown in Figure 13.
information. In the process of creating a centralized Trade Portal, it would be important to identify one authority responsible to coordinate all
relevant agencies.

59
161. According to interviews with private sector companies in Malawi, standards
development in MBS - which includes stakeholder consultation - is working well. The
representative from the Malawian subsidiary of the Swiss based SGS S.A., an inspection,
verification, testing, and certification company, said during the personal interview that MBS
regularly informs SGS about new standards developments and workshops. The Malawian
subsidiary of Illovo Sugar Ltd also participates in MBS standards setting. There have been no
complaints about obstacles with regard to participation in standards setting, a lack of
transparency, the length of standardization process or a lack of consultation opportunities among
large companies.
Figure 13 Standards Development in MBS
Source: MBS 2012
162. To ensure standards reflect the needs of consumers (and not primarily the interests
of established producers) it is important to engage society at large. It is less clear to which
degree smaller companies and society at large are involved in the standard setting processes, and
it is important to publicize discussions and draft standards or technical regulations early on. This

60
can help prevent setting of standards which are overly stringent, for example by simply adopting
international standards, and which would make it impossible for producers to meet, or overly
costly such that consumers could not afford final products.9
163. The Standards Development Department conducted the stakeholder consultation
process for developing the Malawi standardization strategy with the support of the
International Organization for Standardization (ISO). In 2011, the ISO provided
standardization training for standardization strategies in which an official from the MBS’
Standards Development Department participated. The stakeholder consultation process resulted
in identifying more than 1300 proposals for new or revised standards (SDD 2012b).
164. According to the Catalogue of Malawi Standards from 2012, Malawi has developed
a total of 934 standards, an increase of 304 standards since the year 2000. From the 934
standards, 560 are mandatory standards (technical regulations) and 374 voluntary. 38% of
technical regulations and 19% of voluntary standards are based on international standards (ISO,
IEC or Codex). According to interviews with representatives from the Standards Development
Department, about 86 Malawi Standards (less than 9% of the total10
) are harmonized with
Common Market for Eastern and Southern Africa (COMESA) standards and 56 Malawi
Standards are harmonized with Southern African Development Community (SADC) standards.
The standards listed in the Catalogue of Malawi Standards represent the “supply side” of
Malawian standards.
165. When the Malawi Standard is harmonized with either the COMESA or SADC
regional standard this is indicated on the cover of the standard. In order to increase the
transparency of Malawi Standards, the name of the standard should also reference the specific
regional or international standards that have been referenced. This practice is used in the
European Union. For instance, a German standard is called DIN EN ISO when it is based on a
standard issued from the European Standards Organization (CEN) and ISO. Harmonization of
standards and technical regulations helps exporters to save costs related to double certification or
double testing of goods. However, the current practice is that foreign certification marks are not
recognized in Malawi. This includes certification marks from the SADC/COMESA region as
well as mark from internationally accredited certification bodies. This practice undermines the
potential benefits from regional and international harmonization of standards and technical
regulations.
166. Malawi Standards are relatively old and it would be useful to review existing
standards to assess their impact on the economy and continued relevance. While the
majority of national standards have been developed in the last twelve years, the average age of
voluntary standards and technical regulations is fifteen years. Some requirements of the technical
regulations are outdated and seem overly restrictive. For example, MS 109 (mandatory Malawi
standard on Casual and fashion plastic shoes – Speciation) specifies the thickness of straps and
9 For an example of standards in the dairy sector in East Africa, see Jensen, Keyser, and Strychacz (2010). 10
This figure also results from the fact that there are only about 380 harmonized COMESA standards, of which Malawi has adopted 86 (23%).
61
bands of shoes. A container of shoes from China was rejected in February 2013 by the Quality
Assurance Service Department for non-compliance with the requirements specifying the
thickness of straps and bands. While correctly applying existing legislation, this requirement
seems to be more of a design or fashion feature than a safety requirement requiring a mandatory
standard, raising questions regarding the usefulness of that standard. As stated earlier, the recent
World Bank NTM Policy Toolkit (Streamlining Non-Tariff Measures: A Toolkit for Policy
Makers, 2012) provides a useful approach and checklist for identifying the issues, assessing the
costs and benefits, and streamlining the processes and institutions.
167. The “demand side” for standards is reflected by the number of standards sales. The
voluntary standard MS-ISO 9001 for quality management systems has been sold more often than
any other standard. There is also high demand for MS-ISO 19011 Guideline for Quality and/or
environmental management system auditing and ISO 22000 for Food safety management
systems. The demand for technical regulations (mandatory standards) is largest for standards
concerning Food and food processing units (MS 21) and Labelling of pre-packaged Food –
General standard (MS 19).
Conformity Assessment
168. The Quality Assurance Services Department (QASD) and the Testing Service
Department (TSD) are responsible for conformity assessment services in Malawi. The
QASD has several mandatory certification schemes for domestic and imported goods to ensure
compliance with Malawi Standards: (a) the permit scheme for domestically produced goods, (b)
the designation scheme for domestic catering services, and (c) the imports quality monitoring
scheme (IQMS) for imported manufacturing products. The department also offers the voluntary
export quality certification scheme (EQCS). Under the EQCS, products aimed for the export
markets can be inspected and tested for compliance with overseas specifications.
169. The TSD operates laboratories for general and food chemistry, petrochemicals,
pesticides residue, microbiology, radiochemistry, engineering and materials (Gama 2011).
The laboratories provide their testing services for other MBS departments (e.g. the product
certification schemes of the QASD) or on demand of customers. Laboratories of the TSD are not
accredited to international standards. Foreign countries, except for some countries within SADC,
do not accept certificates or test reports issued by MBS. Therefore, Malawian exporters need to
use foreign laboratories which are accredited to international standards in order to show
compliance with foreign buyer requirements. Exporting companies have to bear the extra export
costs.
170. Interviews with private sector highlight the absence of accredited laboratories as a
major problem for exporting companies. According to the Malawi Confederation of Chambers
of Commerce and Industry (MCCCI) companies who want to export their products outside the
SADC region have to retested or recertify their products in the accredited laboratories.
According to Sable Farming Limited, costs for re-testing amount to about 1,200 US$ for each
sample that has to be sent to a foreign accredited laboratory. All interviewed companies which
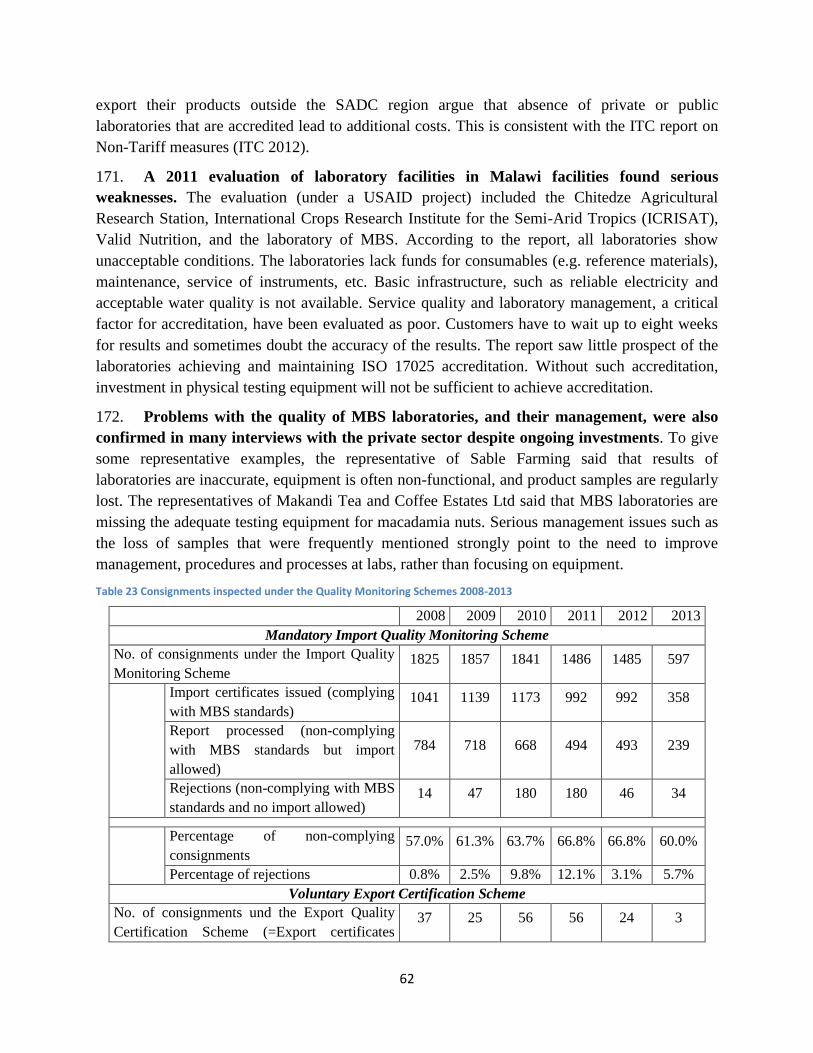
62
export their products outside the SADC region argue that absence of private or public
laboratories that are accredited lead to additional costs. This is consistent with the ITC report on
Non-Tariff measures (ITC 2012).
171. A 2011 evaluation of laboratory facilities in Malawi facilities found serious
weaknesses. The evaluation (under a USAID project) included the Chitedze Agricultural
Research Station, International Crops Research Institute for the Semi-Arid Tropics (ICRISAT),
Valid Nutrition, and the laboratory of MBS. According to the report, all laboratories show
unacceptable conditions. The laboratories lack funds for consumables (e.g. reference materials),
maintenance, service of instruments, etc. Basic infrastructure, such as reliable electricity and
acceptable water quality is not available. Service quality and laboratory management, a critical
factor for accreditation, have been evaluated as poor. Customers have to wait up to eight weeks
for results and sometimes doubt the accuracy of the results. The report saw little prospect of the
laboratories achieving and maintaining ISO 17025 accreditation. Without such accreditation,
investment in physical testing equipment will not be sufficient to achieve accreditation.
172. Problems with the quality of MBS laboratories, and their management, were also
confirmed in many interviews with the private sector despite ongoing investments. To give
some representative examples, the representative of Sable Farming said that results of
laboratories are inaccurate, equipment is often non-functional, and product samples are regularly
lost. The representatives of Makandi Tea and Coffee Estates Ltd said that MBS laboratories are
missing the adequate testing equipment for macadamia nuts. Serious management issues such as
the loss of samples that were frequently mentioned strongly point to the need to improve
management, procedures and processes at labs, rather than focusing on equipment.
Table 23 Consignments inspected under the Quality Monitoring Schemes 2008-2013
2008 2009 2010 2011 2012 2013
Mandatory Import Quality Monitoring Scheme
No. of consignments under the Import Quality
Monitoring Scheme 1825 1857 1841 1486 1485 597
Import certificates issued (complying
with MBS standards) 1041 1139 1173 992 992 358
Report processed (non-complying
with MBS standards but import
allowed)
784 718 668 494 493 239
Rejections (non-complying with MBS
standards and no import allowed) 14 47 180 180 46 34
Percentage of non-complying
consignments 57.0% 61.3% 63.7% 66.8% 66.8% 60.0%
Percentage of rejections 0.8% 2.5% 9.8% 12.1% 3.1% 5.7%
Voluntary Export Certification Scheme
No. of consignments und the Export Quality
Certification Scheme (=Export certificates
issued)
37 25 56 56 24 3

63
Notes: Figures have been compiled by G. Mwakikunga and A. Gama from the Quality Assurance Services Department of
the Malawi Bureau of Standards in March 2013.
173. Table 23 shows that much more consignments are processed under the mandatory
IQMS compared to the voluntary EQCS. The demand for export certification is relatively low
and seems to have decreased over time. The low and decreasing demand for voluntary
conformity assessment services is consistent with the complaints of laboratory quality by the
private sector and the observations by USAID (Louw 2011).
174. Between 57% and 67% of all consignments under the IQMS are found to be non-
compliant (see Table 23). MBS rejects between 0.8% and 12.1% of the consignments at the
border. Based on interviews with representatives of the QASD, import rejections are issued when
(a) one or more microbiological parameters in case of food products fail; (b) two or more failures
of non- microbiological parameters, (c) deviation of more than 10% of non-microbiological
parameters; (d) failure of labeling requirement (expire date, name and address of manufacturer,
country of origin); (e) the importer fails to address failure after three failures; and (f) failure on
one or more parameters for pre-shipment sample.
175. Mandatory import inspections (IQMS) are a burden for importing companies. This
concerns the costs for the mandatory conformity assessment, a lack of transparency regarding the
costs, and time delays at the border and for the release of goods. Almost all of the importing
companies interviewed report problems with mandatory inspections. For example, Bata Shoes - a
subsidiary of the Swiss based footwear and fashion Company - report time delays for their
imports. Bata also reports that that all imports consignments are inspected and tested by MBS
which contradicts MBS rules about how to handle import consignments that conform to Malawi
Standards. According to MBS, an annual import certificate is issued if four consecutive
consignments of the same manufacturer are complying with Malawi Standards. IQMS fees are
then waived for the next 12 months with the annual import certificate. However, Bata Shoes
claims it had to pay IQMS fees for all its shipments in 2012 (20 containers) in contrast to MBS
rules. The 2 million MKW fees represent about 1% of the import value and effectively results in
higher prices being passed to consumers. In addition to the high trade costs, the representative
from Bata Shoes complains about a lack of transparency regarding the IQMS fees.
176. The South African based retailer Shoprite also reports burdensome procedures with
mandatory IQMS. The representatives said that for all its imports foreign certificates are
not recognized by MBS including certificates issued by SADC or COMESA countries as
well as certificates from EU countries. Moreover, the retailer representative found the actions
of MBS to be unpredictable and non-transparent. For example, the representative mentions that
testing costs for IQMS are unknown at the time MBS officers take samples from the warehouses
and the costs for testing are high and are increasing. Unpredictable behavior by MBS officers
includes taking several items as samples. In one case MBS officers took 100 pens. Test results
are obtained weeks after samples are taken but only when the retailer specifically asks for the test
results. Without such requests, test results are delivered after months or in some case not at all.

64
177. Burdensome mandatory import inspections under the IQMS scheme are also
reported by companies in the ITC report on non-tariff measures and make up 19% of the
import measures. Companies report that IQMS controls are redundant since SADC, COMESA
and certification from internationally accredited are not recognized by MBS officers at the
border. Companies also report that delays due to IQMS control laid to significant delays which
range from a couple of day to several month (ITC 2012).
178. MBS re-test imports although they have been tested by SADC/COMESA or
internationally accredited conformity assessment bodies. Company representatives
interviewed for the ITC report on non-tariff measures also complain about the non-acceptance of
certificates issued by SADC or COMESA conformity assessment bodies although mutual
recognition of certificates applies for the SADC and COMESA region. In the ITC report, MBS
argues that product quality can change during transport which justifies that some products need
to be inspected before they enter the Malawian market (ITC 2012).
179. Over the period 2010-2012 food products were rejected more than 160 times. The
most frequently rejected products are salt (46), spices (26), and milk (13). Rejected industrial
goods are fertilizer (30), lead acid batteries (20), and corrugated sheets (11 times). Consumers
good have rejected more than 80 times and include primary batteries (26 times), matches (13
times), and light bulbs (6). Most of the rejected imported goods (147) originate from SADC.
Rejections from SADC countries include South Africa (88), Zambia (27), Mozambique (17),
Tanzania (11), Mauritius (8), Botswana (4), and Zimbabwe (3). The SADC region is followed by
Switzerland (43), United Arab Emirates (38), COMESA countries (32), and China (22).
COMESA countries include Kenya (31) and Egypt (1).
180. MBS collects information on the sampling date and reporting date for the import
rejections but it was not comprehensive and was only available for 17 cases from the total
of 351 (5 per cent). Thus, the time importers have to wait to get the results can only be
calculated for those cases. The minimum time was 18 days and the maximum time was 88 days.
The average time between sampling date and reporting date was 53 days. In some cases,
importers had to wait about three months to get a test report from the MBS.
Table 24 Samples Tested in the Testing Service Department
2011 2012 20131
No. of samples tested under domestic certification schemes 1756 1336 317
No. of samples tested under import certification scheme 1916 4380 845
No. of samples test on demand of clients 1507 1567 372
Total no. of samples tested 5179 7283 1534
Percentage of samples tested under domestic certification
schemes 33.9% 18.3% 20.7%
Percentage of samples tested under import certification scheme 37.0% 60.1% 55.1%
Percentage of samples test on demand of clients 29.1% 21.5% 24.3%
Total 100% 100% 100%

65
Notes: 1) Numbers until March 14th
2013; All figures have been compiled by Patrician Kondowe, at
Malawi Bureau of Standards in March 2013.
181. Mandatory import testing represents a large part of laboratory work in TSD (about
60%). Table 24 shows the number of product samples processed in laboratories of TSD in the
last two years and the first two months of 2013. The product samples are differentiated into those
that have been analyzed under mandatory scheme for locally produced products, mandatory
scheme for imported products and product samples tested on demand of clients. Mandatory tests
for domestic products represent between 20% and 30% of all product tests in TSD and the same
is true for samples tested voluntary on demand of clients. The numbers of samples tested in TSD
laboratories suggest that there is some demand for laboratory services of MBS. The demand for
voluntary tests comes from exporters who want to know, for example, if their products comply
with specifications in export destinations.
182. Besides mandatory and voluntary conformity assessment services provided by MBS,
international certification companies are also active in Malawi in order to certify
companies who demand certification from internationally accredited certification
companies. Although the demand for quality management standards in Malawi seems rising
over the last year, the demand is nevertheless very low. Based on statistics provided by the
International Organization for Standardization (ISO) only 10 companies have been certified with
ISO 9001 standard for quality management systems.
183. In Malawi the low demand for accredited certification reflects the limited range of
products exported. This was confirmed by the representative of an international certification
company (SGS S.A. in Blantyre). The demand is so low that it is not worthwhile for SGS S.A. to
train local auditors. Instead, auditors come from South Africa to Malawi. The representative
from SGS S.A. mentions that the situation is different in neighboring countries. For example, the
SGS S.A. subsidiary in Mozambique employs trained auditors for quality management standards.
The demand for accredited certification in Mozambique is larger because the seaports enable
companies to export overseas where customers demand accredited certifications.
Metrology Services
184. The Metrology Service Department (MSD) of the MBS is responsible for legal and
industrial metrological services. Malawi has no independent National Metrology Institute.
Metrology services are offered in MBS since the Trade Department of the then Ministry of
Commerce and Industry moved the Assize Unit to the MBS in 1996 (Gama 2011). Through the
Weights and Measure Act (CAP 48:04), the objective of the Department is to verify the correct
calibration of weighing and measuring instruments used in commercial transactions (MBS 2011).
According to personal interview with the Department Director, 17 people work in the Metrology
Department. The MSD suffers from a lack of personnel and physical equipment. For example,
MSD had no test equipment for the calibration of pressure equipment as of late 2013 but is said
to have subsequently been procured. The lack of adequate resources makes it difficult to meet
demands made by its customers.

66
185. The MSD is divided in two subdivisions: the Legal Metrology Division (LMD) and
the Industrial Metrology Division (IMD). LMD has offices in Blantyre, Lilongwe and Mzuzu
and IMD is based in Blantyre. Legal metrology services are related to the verification of
measuring equipment either in the three regional offices or during verification tours. During
Verification tours MBS officers travel to trading centers throughout Malawi in order to verify
traders weighing instruments. Metrology officers also visit companies (in-situ verification) in
cases where the instruments cannot be carried to MBS for verification. Calibrated measurement
equipment includes: weighbridges, platform scales, spring balances, counter scales, length
measures, capacity measures, bulk flow meters, fuel dispensers, and weights.
186. In cases where officers of the Metrology Department find measurement instruments
that fail to comply with legal requirements (Weights and Measures Act of Malawi, chapter
48:04), the instruments are prevented from being uses for commercial purposes and the
owners of the equipment are advised to repair their equipment. If there is evidence of
malfeasance the officers in MBS are empowered to initiate legal action. When traders are found
guilty, fines are imposed and scales are destroyed. From the interviews it was not clear how the
officers distinguished between malfeasance and simple miscalibration of the scales. Given the
serious welfare implications for smallholders stemming from inaccurate measuring instruments
consideration should be given to introducing automatic penalties (fines).
187. Illegal measurement instruments are a serious problem in Malawi. Spring balances
are used on markets throughout the country for agricultural products and particularly for maize,
the staple food for most Malawians. MBS officers regularly find illegal spring balances during
verification tours. Figure 14 shows the percentage of rejected spring balances from 2007 to 2012.
On average, 7% of the more than 14,000 tested spring balances fail to comply with Weights and
Measures Act of Malawi. The percentage is higher in the last three years. According to the
Metrology Department, increased import of non-trade scales on the market is responsible for the
recent increase. According to personal interview with the Department Director the revised
Metrology Bill will allow MBS to control the import of non-trade scales.
Figure 14 Percentage of Rejected Spring Balances by MBS 2007-2012
Source: Metrology Service Department Reports 2007-2012
0%
2%
4%
6%
8%
10%
12%
14%
16%
2007 2008 2009 2010 2011 2012
67
188. The MSD also conducts awareness rising and education campaigns for consumers to
explain how to recognize calibrated scales. During a campaign with village communities
organized in 2011, the communities raised concerns that verification of weighing instruments
only happens once a year which is not enough to protect farmers from the fraudulent use of
scales. Furthermore, the communities requested that Malawi Police Service and District Trade
Officers of MIT support MBS with verification of weighing instruments (MBS 2011). However,
the MSD Department Director in a personal interview that this is not possible due to logistic
challenges and lack of knowledge of the Malawi Police Service and lack of personnel of the
District Trade Officers.
189. The Industrial Metrology Division (IMD) is responsible for maintaining traceability
of industrial measuring equipment according to international standards and offers
calibration services for measuring equipment for industrial use. Eighty per cent of the
revenue generated by the MSD, the Department Director comes from mandatory legal metrology
activities. Industrial metrology services are also offered by private sector companies in Malawi.
The industrial metrology section of MBS competes with the private sector. For instance, SGS
S.A. offers calibration services for bulk-flow meters for the largest petroleum importer of
Malawi, Petroleum Importers Ltd, as well as international organizations such as the United
Nations World Food Programme.
Accreditation
190. Malawi has no independent accreditation body. MBS conformity assessment bodies
are also not accredited by foreign or regional accreditation bodies. If importing countries
demand certificates issued by internationally accredited certification bodies, Malawian exporters
need to use the services of foreign certification bodies. Lack of accredited facilities has been
recognized as a constraint and there are now plans for the MBS to achieve accredited status with
the assistance of the EU funded project by 2016.
Funding
191. Since 2008 MBS has been self-financing with income from the CESS, testing fees
and the sale of standards. As both a regulator and a service provider MBS has considerable
flexibility in setting its fees and charges. MBS more than doubled its revenue over the period
2009-2012. The quality development CESS Order of 0.2 per cent on the value of imports has to
be paid on 91 (rather broadly) defined products and 89 of these are imported. In practice slightly
more than one third of total imports are eligible for the CESS tax (since all textiles and clothing
are listed as just one product, as are all agricultural imports). The CESS is levied to cover
development and investment in quality infrastructure and is paid at the point of importation. For
those products where a mandatory Malawi standard exists, additional charges are then levied
under the IQMS for inspection and testing. While the IQMS fees represent 0.65 per cent of FOB,
there is a minimum payable of MK 15,000, effectively increasing the rate to shipments valued at
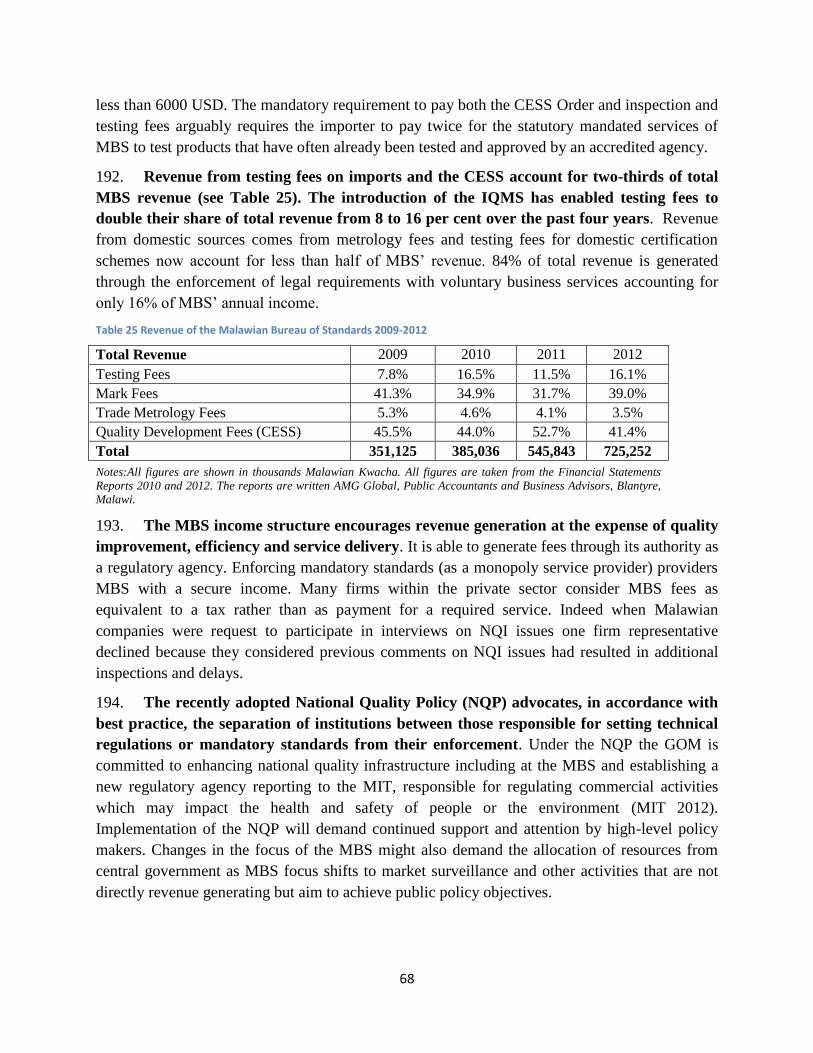
68
less than 6000 USD. The mandatory requirement to pay both the CESS Order and inspection and
testing fees arguably requires the importer to pay twice for the statutory mandated services of
MBS to test products that have often already been tested and approved by an accredited agency.
192. Revenue from testing fees on imports and the CESS account for two-thirds of total
MBS revenue (see Table 25). The introduction of the IQMS has enabled testing fees to
double their share of total revenue from 8 to 16 per cent over the past four years. Revenue
from domestic sources comes from metrology fees and testing fees for domestic certification
schemes now account for less than half of MBS’ revenue. 84% of total revenue is generated
through the enforcement of legal requirements with voluntary business services accounting for
only 16% of MBS’ annual income.
Table 25 Revenue of the Malawian Bureau of Standards 2009-2012
Total Revenue 2009 2010 2011 2012
Testing Fees 7.8% 16.5% 11.5% 16.1%
Mark Fees 41.3% 34.9% 31.7% 39.0%
Trade Metrology Fees 5.3% 4.6% 4.1% 3.5%
Quality Development Fees (CESS) 45.5% 44.0% 52.7% 41.4%
Total 351,125 385,036 545,843 725,252
Notes:All figures are shown in thousands Malawian Kwacha. All figures are taken from the Financial Statements
Reports 2010 and 2012. The reports are written AMG Global, Public Accountants and Business Advisors, Blantyre,
Malawi.
193. The MBS income structure encourages revenue generation at the expense of quality
improvement, efficiency and service delivery. It is able to generate fees through its authority as
a regulatory agency. Enforcing mandatory standards (as a monopoly service provider) providers
MBS with a secure income. Many firms within the private sector consider MBS fees as
equivalent to a tax rather than as payment for a required service. Indeed when Malawian
companies were request to participate in interviews on NQI issues one firm representative
declined because they considered previous comments on NQI issues had resulted in additional
inspections and delays.
194. The recently adopted National Quality Policy (NQP) advocates, in accordance with
best practice, the separation of institutions between those responsible for setting technical
regulations or mandatory standards from their enforcement. Under the NQP the GOM is
committed to enhancing national quality infrastructure including at the MBS and establishing a
new regulatory agency reporting to the MIT, responsible for regulating commercial activities
which may impact the health and safety of people or the environment (MIT 2012).
Implementation of the NQP will demand continued support and attention by high-level policy
makers. Changes in the focus of the MBS might also demand the allocation of resources from
central government as MBS focus shifts to market surveillance and other activities that are not
directly revenue generating but aim to achieve public policy objectives.

69
Recommendations
195. Accept conformity assessment results from regional partners and accredited
certification bodies and from private testing companies that are internationally accredited
or accredited by SADCAS. The MBS demands mandatory retesting or recertification for
products from both SADC/COMESA countries and from imports that have been tested in
accordance with internationally accredited certification bodies. Recognition of foreign
conformity assessment results and the removal of mandatory retesting will reduce the costs and
time delays at the border and eventually reduce the costs of imports and increase the welfare of
consumers. Such a move should also include the acceptance of test results from private national
laboratories that have obtained international accreditation. Because their test results would then
be accepted by MBS, permitting importers to choose laboratories for conformity assessment, this
would generate additional incentives for the establishment of private laboratories in Malawi, and
could contribute to reducing costs for importers and exporters.
196. Increase visibility of regional standards. MBS should continue to harmonize Malawi
standards with partners in the SADC and COMESA region and international standards and
publicize how these are linked.
197. Increase transparency through publicizing fees, procedures, waiting times and
allowing the right of appeal. The fee structure and payment mechanism should be made more
transparent and integrated more closely with MRA and other border agencies. Companies should
know in advance the fees and the time it takes for MBS to deliver the test results. MBS should
collect and publish statistics on average waiting times at the border as well as statistic on import
rejections. Fees for imports - including the quality development cess - should be reduced. MBS
would benefit from benchmarking their fees to international best practices.
198. MBS should ensure a consistent approach in accordance with their own published
procedures. It is not clear why imports listed as ‘failing’ are subsequently imported. If the
imports do not meet the accepted minimum mandatory standards surely they should not be
imported. It is not clear how this achieves the regulatory intent of increasing consumer safety? In
the interests of transparency data on inspections, test results, and rejections should be published.
199. Continued participation in the Integrated Border Management initiative aimed at
ensuring increased co-operation with other border agencies will also be critical. This should
include streamlining procedures, increasing transparency by including requirements and
procedures in a Trade Portal, feeding risk selectivity criteria (and keeping them updated) into the
risk management system managed by customs. These activities would prepare the basis for
introducing a Single Window as the next stage.
200. To more effectively achieve its mandate, the MBS should shift emphasis towards
market surveillance which will require increased cooperation with law enforcement. For
example, to more effectively address fraudulent weighing scales, the MBS will have to allocate
more resources to the Metrology Department and increase the capacity for legal metrology

70
services. This will have a positive impact on the poorest and most vulnerable groups. Spring
scales are used in markets throughout the country for measuring agricultural products, including
maize flower, the staple food of most Malawian. Data provided by the MBS Metrology
Department shows that a large and increasing percentage of such scales are not calibrated.
Fraudulent use of weighing scales acts represents a tax on consumers and impacts most on the
poor and very poor. In order to increase activities for verification and market surveillance of
weighing instruments other non-MBS authorities (e.g. Malawi Police Service or District Trade
Officers of Ministry of Industry and Trade) should support the MBS officers of the legal
metrology department.
201. Support to the MBS and accredited laboratories of the Technical Service
Department should be complemented by policy reforms that would allow the emergence of
private accredited laboratories. Test results issued by MBS are only accepted in the
SADC/COMESA region but due to the non-accreditation of the MBS not in other markets.
Having internationally accredited private or public laboratories in Malawi that could meet testing
demand from exporters would eliminate the need for retesting in accredited laboratories outside
the country, which is costly for Malawian companies and reduces their international
competitiveness. This recommendation is in line with the objectives of the EU funded project
which aims to obtain accreditation with ISO/IEC 17025 (General requirements for the
competence of testing and calibration laboratories).
202. To demonstrate its commitment of improving the national quality infrastructure,
the government should prioritize effective implementation of the NQP. This will provide the
basis for ensuring the NQI delivers efficient business services in support of companies producing
quality products for both domestic and export markets. An increased focus on post market
surveillance is an important element of this strategy and will assist MBS to more effectively
ensure consumer health and safety. Increasing post market surveillance would justify the MBS
receiving a subvention from the GOM.
Customs Clearance and Transit Mechanisms
203. Since the 2004 DTIS the GOM has implemented a number of reforms aimed at
improving the environment for trading across borders. In 2008 the MRA introduced risk
management and post clearance audit units which enabled compliant traders to benefit from
fewer customs interventions. In 2009, pre-clearances for compliant traders were introduced. In
2011, the authorities reduced the number of documents required for processing a customs
transaction from 30 to 6. Furthermore, remote electronic filing of declarations was introduced in
2011. This has enabled Clearing and Forwarding Agents (CFA) to electronically track the
progress of their declarations. MRA introduced the Declaration Processing Center (DPC) in 2012
and this has facilitated on line uploading and declaration processing by all major customs offices.
The DPC has ensured the uniform application of customs law, valuation, classification and
reduced corruption (or its perception) which has eliminated the practice of border shopping by
some traders. All of these reforms have, in principle, enabled MRA to release goods within 30

71
minutes when all the required information is in order. Earlier this year, the MRA has begun to
implement non-intrusive inspections and plans to roll out scanners at the major border stations to
minimize physical inspections.
204. Notwithstanding significant positive developments from the MRA program of
customs modernization many challenges remain. The major challenges are outlined below.
Integrated Border Management
205. There are currently up to 14 government agencies represented at the Mchinji,
Dedza and Mwanza, border posts, plus private support entities such as clearing and
forwarding agents (CFA), insurance companies and banks are also based at the border.
Each of the government agencies represents a distinct legal purpose while performing
functionally similar and relatively uncomplicated work, e.g., inspecting permits, taking samples
and ensuring payment of fees. Multi-agency interventions stem from laws granting powers to the
various agencies to inspect, take samples, and collect taxes and fees. CFA are critical to the
clearance process by acting on behalf of the trader to convert commercial information into the
standard language and administrative format required by the regulatory agencies and also play an
unusual (and perhaps inappropriate) part in the regulatory function.
206. Placing multiple government institutions at the border is based on the misplaced
view that only officials from the relevant agencies can or should make the interventions
(presupposing that the interventions are necessary at all.). In other cases, there is a desire to
insure or augment the importance of the particular agency through the presence of officials and
the collection of fees. This manifests in territorial or competitive behavior between agencies
(seemingly driven more from head office than at the border itself). This result is added cost,
unpredictable cross border times and delays.
207. The main roles of the regulatory agencies could be absorbed by the MRA and the
Department of Immigration. Other agencies are responsible for ensuring that goods (imports or
exports) subject to certain restrictions, have been issued with the relevant permits or licenses; for
physically examining goods to ensure compliance (e.g., free of disease, properly marked etc.);
for taking samples; and ensuring that any fees are paid. Logically the MRA would be able to
absorb the functions of fee collection, inspection and sample selection that are carried out by the
MBS, Environment and others, while Immigration could address the human health concerns.
Amending the legislation to empower Customs and Immigration officials to perform additional
relevant functions is straightforward.
208. A recent Presidential Decree (2013) limited the border agencies to the MRA,
Department of Immigration, MBS, Malawi Police Services and Ministry of Health,
although this has not yet been implemented. The rationale for selecting these agencies is not
known. Streamlining institutional and administrative controls at the border should be a priority.
This initiative could build on the momentum generated following the Southern African Trade
Hub assessments of border coordination at Mchinji, Dedza and Songwe. Linking better

72
coordination to reducing the number of border agencies will require regulatory requirements to
be streamlined. Agreeing on the derogation of regulatory responsibilities from transport, MBS
and other Agencies to MRA will require negotiation. Introducing a Trade Portal, which does not
require any regulatory or organizational changes, would be an important first step and should be
prioritized.
209. The MRA has the lead role at the border, the area being a Customs area designated
under the law and all imported and exported goods passing through the border are subject
to Customs control. After the formation of the MRA in 1998, Customs role was principally
directed to revenue collection, aligning with the MRA mission. A reduced focus on the control of
prohibited and restricted goods may have led other agencies to assume more direct controls
themselves. The Immigration Department has no direct role in the border clearance of goods but
does control the movement of people, which means that all people, including drivers of motor
vehicles and their passengers must undergo an immigration clearance process.
210. Despite improvements in risk management by the MRA, other agencies’ selectivity
criteria are not part of the system, and across all agencies, physical inspection at borders
remains extremely high. The MRA abolished Pre Shipment Inspection in 2007,11
transitioned to
UNCTAD’s Automated System for Customs Data (ASYCUDA++) and selectively implements
advance clearance and post-clearance audits.12
However, interview with CFA at Mwanza
reported that virtually all commercial imports were subjected to physical inspection by one or
more agencies resulting in delays and increased costs. Green lane declarations (release without
check) are also frequently subject to documentary check of physical inspection. Further, the
recent organization change separating import clearances from export appears to be based on the
premise that greater controls are required for imports for revenue reasons. Import entries for
goods with a value of over MK 300,000 (>$1000) may be lodged remotely but are processed in
Blantyre. However, documents are said often not to be available until the trucks arrive at the
border. Other goods, including informal clearances are made at the border post. All exports are
cleared at Blantyre, Lilongwe, Mzuzu, or at border stations.
211. Duplication of Data amongst Agencies Basic data elements such as the name of
importers/exporters, goods description, value, origin etc. is partly or wholly common to most of
the agencies and functions. But data required by each relevant agency is collected independently.
The outcome is that same data has to be presented to various agencies in different formats and
using different processes. Presenting the same information multiple times increases error rates
and wastes resources.
212. Excessive use of manual procedures centralized in Lilongwe. There are eight agencies
that issue permits or licenses for imported and exported goods. All processes are manual and
must be carried out in Lilongwe. This requirement incurs time and direct cost handicaps to trade
11 This means that MRA has resumed full responsibility for valuation, origin and classification functions and valuation decisions can now be appealed to higher authorities inside MRA and through an external administrative appeals process. 12 Not all border stations are yet connected directly to ASYCUDA ++. CFAs are linked, either locally or directly to Blantyre, but no other
agencies are connected.

73
as each permit or license (and there may be more than one per consignment) requires one or
more trips to Lilongwe to visit each relevant agency. Absences or complications increase the risk
of further delays and add to the trade cost. Many of the fees are specific to a shipment or
transaction and consequently highly regressive and work to discourage small cross border
shipments.
213. Lack of Transparent regulations and procedures. Access to information about trade
regulations, procedures, fees and charges is limited and indirect, i.e., largely through the Ministry
of Trade or CFAs. Some agencies operate websites. The MRA website contains a range of
general information but this is neither comprehensive nor up to date (as noted in Chapter 3 on the
Tariff Schedules). Furthermore it is not possible to download a comprehensive set of forms from
the MRA website. Malawi does not have a single or central source, or any organized distribution
of comprehensive information.
214. Infrastructure issues are not the main cause for delays. In general, the facilities at all
posts are constrained with frequently cramped office spaces, overcrowded public areas and a
shortage of office furniture, computers, telephones and consumables. While these could all be
improved it is important to note that the major cause of delays, increased costs and uncertain
delivery times rests with the need to obtain approvals across multiple independent (and un-
coordinated) agencies that results in processes and data being duplicated along with redundant
checking of documents and cargo.
215. Frequent and lengthy power cuts disrupt all border related processes. According to
officers and stakeholders, system downtime occurs once to three times per week and lasts several
hours. Currently the MRA uses generators which are expensive to operate and unreliable, and are
also frequently out of action. Whilst this disrupts the Customs process, a worse problem is that
CFAs cannot process and lodge Customs declarations and other agencies also have to switch to
manual processing. Customs and CFA should cooperate in developing a parallel manual system
as a fall back for the power failures. For example, Mozambique has introduced solar panels to
back up the main supply but there is very limited output and power storage is a problem. MRA
plans to install solar panels at all border stations to support the operation of ASYCUDA ++.
216. The most important MRA corporate and individual performance measurement
criterion is revenue collected – equally so in Customs. Annual and monthly targets are set and
if achieved form the basis of bonus payments. The recent restructuring of the MRA into an
import and export division (with the latter being equated to trade facilitation) raises concerns that
trade facilitation is not considered of central importance to import transactions but rather for
exports. The priority on raising revenue creates pressures for Customs to ensure a high valuation
which creates incentives for importers to submit under-valuations in the expectation that they
will be routinely increased in value. Some Customs staff agreed, explaining that undervaluation
by traders is rife and without up to date and accurate valuation data they have no way of being
sure about values. Private sector representatives say that overvaluing goods is safer in case of

74
recheck and helps to achieve monthly revenue targets. This encourages a high rate of physical
inspections which adds to and increases the unpredictability of clearance times.
217. Valuation has improved since 2003 but the Agreement on Customs Valuation is still
not applied fully and valuation adjustments are frequent. Price lists, minimum prices and
domestic prices are still used to determine the customs value. Private sector representatives,
including CFAs allege that invoice prices are not respected, even when genuine. As a guide to
‘real’ values, MRA has created and maintains its own valuation database of historical reference
prices based largely on duty free imports of each commodity. Its usefulness is limited by its lack
of comprehensive coverage of the commodities being imported, the inability of MRA to keep it
updated and current and a lack of reliable and relevant information. In the past, this data was
loaded into the ASYCUDA ++ valuation database, but it has not been maintained and so has
fallen into disuse. At a practical level, border officers resort to a combination of value lists
distributed from Blantyre, their own written lists and internet research locally to try to assess
values and typically a single officer can only make 4 to 5 valuation decisions per day.
218. Improving the quality and professionalism of the CFA is essential. A modern customs
clearance operation requires efficient and reliable CFAs who acting on behalf of the owner of the
goods mitigates risk by ensuring the provision of accurate declaration information, providing
security bonds and in the case of Malawi (assuming a role tacitly assigned by the MRA)
directing which agency requirements must be applied. The efficacy and efficiency of trade
clearance is dependent on the quality of the CFAs as they manage and control all the required
information. Currently there are 100 licensed agencies in Malawi, each with a number of
employees. There is limited quality control through pre-license assessments or examination of
post-license performance measurement. Further it was confirmed that CFAs have a less than
adequate understanding of customs and border procedures, controls and regulations. It is rare for
the MRA to sanction a CFA with a suspension or ban. Enforcing efficient and transparent criteria
for licensing MRA is a necessary step for improving trust and efficiency at the border.
219. It is important for MRA to introduce improved standards for CFAs with sanctions
for abuse and continued transgressions. The 2003 DTIS recommended reviewing the licensing
of Customs agents to include more stringent criteria and performance standards and MRA
amended legislation in 2010 to introduce new and higher standards with a more effective overall
regime. Examinations set in 2012 resulted in only 45 of the 300 applicants passing but
subsequent lobbying resulted in failed MRAs being re-registered. The changes were shelved but
it is important to urgently review and implement revised legislation applying more stringent
entry criteria. The CFA Association is also committed to promoting greater professionalism for
both CFAs and Customs Officials and works to promote dialogue as well as training.
220. Increasing gender awareness and gender balance at borders will be critical to
reduce discrimination at borders. The National Association of Business Women reported that
women account for 80 percent of cross-border traders and reported many incidences of
harassment. In general, border officials are mainly men with few notable exceptions. MRA has

75
one third women staff at Mwanza and two thirds at Mchinji, however, all heads of post are men.
More than half the CFAs at Mwami are women. Several international, regional and national
organizations, advocate that a more gender-balanced presence at borders, together with formal
gender training, might help to alleviate many of the difficulties faced by CBTAs.
Recommendations
221. Recent USAID reports on Malawi border posts recommend introducing more
coordination of border agencies and infrastructure development and building one stop
border posts (OSBPs). The former needs to be predicated on rationalizing agencies present and
consideration may be given to the possibility of establishing a single border post. The latter, if
planned and executed strategically, might provide effective solutions to several of the main
issues. This would be a large and expensive undertaking and it carries the risk of failure (see the
Case Study of the Chirundu Border Post). It requires the introduction of a new ‘philosophy’
which is much more challenging that constructing the new infrastructure.
222. The Government of Malawi has committed to implementing a Single Window as a
solution for automation, connectivity, sharing data and providing information. Developing
a Single Window is complex, expensive and involves a lengthy process of re-engineering
processes as administrative and legal responsibilities are streamlined. The experience of MCNet
in Mozambique, and many countries within ASEAN should provide pause for thought on how to
frame priorities and allocate scarce resources in order to achieve tangible reductions in trade
costs in the shortest possible time.
223. For Malawi the short term, immediate priority and an achievable interim step is to
establish a Trade Information Portal which will place on one web site all the regulatory
requirements, procedures and fees required for importing, transiting and exporting goods to and
from Malawi. Users should also be able to download all the forms for permit applications and
perhaps even submit online. A good example of a recent Trade Information Portal may be
observed at http://laotradeportal.gov.la/index.php?r=site/index .
Transit Cargo and Bond Guarantees
224. Zambia and Malawi, and Malawi and Mozambique do not have ‘door to door’
transit systems. A transit system is a transport activity under customs control. It is not a
clearance or a series of clearances. Regional transit between Malawi and Mozambique requires
procedural and document harmonization, and internationally accepted guarantee system and
mutual control of transit operations.
225. In Southern Africa transit cargo is not routinely separated from cargo for
clearance, in many cases the time at the port initiating transit is similar to time required for
clearance. The traditional fragmented markets of customs brokers and country specific
guarantees can results in multiple transactions where the same information is entered into the
computer twice at each border crossing. Transit cargo from Durban to Blantyre may go through 8
different customs brokers-one on each side of the four borders along the corridor.

76
226. The failure of Southern African countries to implement a cross-border or regional
bond guarantee mechanism keeps the financing costs high. On average in Sub-Saharan Africa
a bond guarantee can cost between 0.25 and 0.5 per cent, while for countries implementing the
TIR system it averages 0.1 per cent. In Malawi, Mozambique and Zambia, the bond guarantee
systems contribute significantly to high costs and long delays for Malawian imports and exports.
CFA’s are directly responsible for posting the required amounts which limits the number of
CFAs who can provide the service. Fewer CFAs means higher demand on each to provide
security bond coverage.
227. In April 2013, Mozambique introduced the transit element into their Single
Electronic Window (SEW), thereby forcing customs agents and freight forwarders to use
statutory mechanisms that had long been circumvented. This generated significant delays at
borders in Malawi and for transit goods in Mozambique ports. Prior to this change, bonds were
issued informally, allowing for faster processing but also allowing for potential leakage as transit
declarations remained outside the control system of the SEW. While the inclusion of transit
operations under the SEW permitted the Mozambique authorities to close some loopholes, it led
to significant delays of shipments as customs brokers were not ready for the change and were not
able to issue sufficient customs bonds as needed under the application of existing procedures.
The MCNet system is also said to crash at times, creating further delays. With informal
procedures no longer an option, some shipments were held for up to four weeks while CFAs
adapted to the new procedures.
228. In addition to the limited availability of bonds in Mozambique, acquittals can also
be very slow. CFAs who have reached their financial ceiling are not able to transact more
business until sufficient acquittals are made and accepted by the system. Delays in receiving
enough cash from clients also hamper the bond guarantee process. The amount of bond that must
be provided by the CFA is very high (Malawi and Zambia require 50% of the value;
Mozambique, 35% of the value), again limiting the CFAs capability to cover the volume.
Following discussions between Mozambique and Malawi, the Mozambique Authorities
expanded the number of products exempt from transit bonds due to limited risk of leakage,
including tobacco and sugar. This has improved the situation though delays continue to be
reported.
229. The existing bond guarantee systems adversely impacts Malawian trade. The risk to
government revenues may be reduced to almost zero, but at what cost? This appears to be a case
of administrative convenience being imposed without regard to the economic consequences in
the country concerned and in neighboring countries. A more workable system, consistent with
the application of customs risk management principles, would be to allow approved CFAs to
lodge a bank guarantee covering a proportion of the amount likely to be outstanding at any one
time (e.g., 20%). The CFA could then operate within the ceiling amount without having to put up
cash on a transaction by transaction basis.

77
Pricing and Competition in the Road Transport Sector
230. The earlier DTIS highlighted the key role of the transport sector in determining the
domestic price of staple foods, the cost of imports, and the international competitiveness.
The 2004 World Bank Country Economic Memorandum noted that notwithstanding recent
policy reforms aimed at increasing competition on the international routes and measures aimed at
improving the transport infrastructure transport prices on both the domestic and international
routes remained high and continued to undercut Malawi’s competitiveness.
231. A decade later transport prices continue to be a major factor for both producers
and consumers in Malawi. During the 2012 planting season transport costs accounted for 32
per cent of the delivered price of fertilizer in Malawi, with internal transport costs estimated at
$0.136 per ton/km adding further to the final delivered cost. This is not significantly different
from the estimates of transport costs in 2004 when they accounted for 47 per cent of the retail
price of fertilizer (based on delivery in Kasungu), 24 per cent of the pump price of diesel (cost
from Beira only), and 12.5 per cent of the auction price of tobacco (excluding transport from
farms to the auction floor).
232. Transport prices in Malawi reflect both structural conditions and the regulatory
framework. The structural factors over which the Government has little impact in the short run
include limited backhaul, the seasonal peaking of demand (tobacco harvest, fertilizer
distribution) in an agricultural dominated economy, and low demand on the feeder routes in the
rural areas. During the tobacco harvesting season many trucks are parked for days and even
weeks while they wait to be weighed and off-loaded, adding further to transport costs. This is
because trucks effectively function as warehouses, charging fees to farmers, and because truck
cycle time is increased. This increases average costs to truckers as they can transport less loads
in a season and reduces competition in the trucking sector as trucks remain immobile, driving up
prices. Regulatory issues include licensing restrictions limiting competition on domestic routes
which inflates prices on the feeder routes
Table 26 Distance by Road to the ports and Indicative Transport Prices
From
Lilongwe
(km)
From Blantyre
(km)
Cost/US$/ton/km
Full
Container/Truck
Cost/US$/ton/km
Small load 1 ton
Beira 1,194 846 0.16-0.18
Durban 2,678 2,323 0.09 2.52 (to J/Burg)
Nacala (Rail) 1,085 959 0.055- 0.092
Dar-es-Salaam 1,667 2,031 0.40
Note: The transport prices are based on a small sample of trucking/freight forwarding companies and should be considered
indicative, a more accurate estimate of transport prices is being compiled as part of a proposed Transport Sector Study.
Source: Distances from CEM (2009) Costs from interviews with private firms March 2013, none of the firms interviewed used
Dar-es-Salaam and one of the firms quoting for Nacala stated ‘ the railway is so inefficient that we cannot use it.’
233. The efficiency of transit corridors is a key element in determining Malawi’s
competitiveness as its geographical status requires trade to transit through neighboring

78
countries in order to access regional and international markets. Table 26 shows the four
alternative transport corridors, through which Malawi has access to the sea, and how they vary
by distance, reliability and costs. Durban is the most reliable and cheapest on a ton/km basis, but
also the furthest and therefor the most expensive in terms of total cost because of the added
distance. Malawi’s trade volume is relatively small and was estimated in 2009 to be
approximately 2 million tons per year. Almost half of the tonnage is routed through Beira, with
Durban accounting for up to 20 per cent and Nacala, which is the nearest port, slightly more than
10 per cent. It is important to note that both Nacala and Beira are feeder ports to Durban which
adds to the cost and time indicated in tables 26 and 27, reducing the comparability of these
figures as far as total costs to final markets are concerned. In 2012, indicative transit time from
Beira to Durban was 6-7 days, with one weekly service,13
but following the capital dredging of
the port in 2011, the number and size of vessels calling has been increasing. The traffic is
dominated by relatively time insensitive high bulk/volume exports of tobacco and minerals
which accounts for the relative preference of Beira and Nacala over the quicker and more
reliable Durban route. The MGDS II focuses on improving the quality of the physical transport
infrastructure (paved roads and effective road maintenance) and services to economic
development (p.38). While these are undoubtedly important they do not represent the binding
constraints to reducing transport costs and prices.
Table 27 Characteristics of Main International Transport Corridors
Port Transport
Mode
Infrastructure
Condition
Port
Reliability
Port Delay Transit Time
Freight
Transit
Time
Passenger
Beira Road Good/Fair Medium 2 -4weeks 2-3 days 10 hours
Durban Road Good High 1 day 5 days 30 hours
Nacala Railway Poor Low >3 weeks Unpredictable 14 hours
Dar-es-
Salaam
Road Good/Fair Medium 4 weeks 4 days to 3
months
21 hours
Note: Malawi Leaf sent a trial consignment of 4 containers by train to Dar-es-Salaam in 2012 and it took 3 months; Beira is very
congested during the harvest season and wait times can exceed one month; Source: CEM (2009), interviews with Malawi Leaf
and Freight Forwarders (March 2013) and www.travelmath.com
234. Trade Logistics and Trade Regulations are key determinants of delays and generate
uncertainty in travel time. If infrastructure constraints were the major cause of delay one would
expect private passenger traffic which is using the same route to take a similar period of time to
commercial freight traffic, however, this is clearly not the case as may be observed from Table
27. A small survey of trip trucking times from Dedza to Beira and back to the Mwanza border
found that almost half (3 days) of the total time (6 days) was spent waiting at Beira port to load
the vehicle. Likewise, delays at ports are often significant in Beira, Nacala and Dar-es-Salaam. A
recent study14
found that 88 per cent of total transit time from Beira to Lilongwe and Blantyre
was spent in the port, and 80 (82) per cent of total transit time was spent in the port of Nacala
when importing to Lilongwe (Blantyre). Port performance remained poor as of 2010, with
13 Southern Africa Trade Hub, 2012, Logistics Review of the Beira and Nacala Corridors. 14 Southern Africa Trade Hub, 2012, Logistics Review of the Beira and Nacala Corridors.

79
container throughput and crane productivity significantly lower than in comparator ports,
container dwell times exceeding that of Durban container port by a factor of eight or more, and
high average truck cycle time. These figures indicate that improvement in port management
could lead to significant improvements although more detailed analytical work will be needed.
The actual time spent crossing the borders ranged from one hour when empty on the outward
journey to four hours on the return (at Mwanza) for customs clearance. The absence of 24 hour
customs clearance services results in the journey taking at least one extra day as truckers time
their ‘rest stops’ to coincide with the border operating hours.
235. In line with standard practice transport prices are significantly higher for smaller
loads. Transport prices overland for imports from Johannesburg vary depending on the cargo
with break bulk cargo and small loads being significantly more expensive per ton/km. One
freight forwarder provided a current (March 2013) quotation of $2.52 per ton/km for a minimum
one ton load.
236. In 2004 domestic transport rates in Malawi were double the rates in South Africa
and Zimbabwe for rural roads and over 3 times more expensive per ton/km when
compared with trunk roads (World Bank, 2003). These high rates were explained by the
relatively poorer infrastructure, the lack of warehouses along the Blantyre/Lilongwe/Mzuzu
route, and high taxes on the transport sector. A 2009 study based on a survey of transport
providers found internal transport rates remained high (Lall et al, 2009). Relatively low volumes
and high fixed costs reduced the number of transport operators. The poor quality of feeder roads
connecting villages to the main road network also increased costs. Interviews with transport
service providers reaffirmed this finding and highlighted the segmentation between the domestic
and international market and also within the domestic market between those serving the main
trunk roads between Mzuzu-Lilongwe and Blantyre and smaller firms serving more remote
areas. These interviews also revealed a preference by transport service providers to allocate fleets
to domestic transport services rather than to regional transport operations, as overall profit
expectations were higher for a variety of reasons.
237. The large contracts issued by the Government of Malawi for the delivery of
fertilizer under the FISP have also influenced transport rates. Most of these contracts appear
to have been won by larger companies or consortia of businesses based in Lilongwe who then
subcontract to smaller transport operators. In 2011 the transport costs for the World Food
Program (WFP) were 30 per cent lower than equivalent transport contracts through the GOM for
distributing subsidized agricultural inputs (fertilizer). The WFP was able to negotiate lower
prices using a small number of large transport operators compared to the FISP. While several
firms observed that internal transport costs varied widely depending on the season, with rates
peaking during harvest time and during the subsidized distribution of fertilizer, this nevertheless
raises questions on the way the transport contracts under FISP were allocated.
238. Dependence on agriculture and narrow production base results in large seasonal
swings in demand and reduces the opportunities for backhaul. Outside of the period August-

80
November, when fertilizer is being imported the volume of traffic from Beira back to Malawi is
very low which results in low backhaul. Many road transport operators would rather bring a rig
back immediately than have it waiting for a return load. The tobacco buying season is in April-
June with many exports going straight to Durban a high proportion return empty with the result
that they increase the prices for the first leg of the journey to cover the absence of backhaul.
239. Local transport from villages to market centers is characterized by low volumes,
poor roads, empty backhauls, and few transport service providers. The 2008 survey of
trucking companies (Lall et al., 2009) found an average transport cost of $1.63 per ton/km for
transport from a village to a market center, compared with $0.073 from the center to the port. In
interviews with transport companies and large domestic users of internal and international
transport services it became apparent that the transport sector was segmented between large
firms with a relatively modern and reliable fleet with management systems showing their
vehicles and drivers were compliant with all the road regulations and small scale operators with
one or two trucks which were primarily used for short haul transport from the rural areas to
market centers. Major international employers in the tobacco, sugar and cement sectors would
only contract their transport requirements to trucking companies with modern management
systems that could show they were compliant.
240. Transport policies in neighboring countries impact adversely on Malawi’s
competitiveness. Mozambique requires trucks entering from Malawi to travel with an escort.
One major importer and exporter stated that owing to delays at the port of Beira and the time
spent waiting for a convoy they allowed an extra four weeks over Durban. Mozambique also
requires that goods in transit are insured through a bond arranged through a Mozambique
registered clearing agent. This requires all Malawian transport operators to appoint a local agent,
most of the larger companies have offices in each country however this is a hurdle for smaller
traders.
241. Regional inland transport from Malawi to Mozambique (Tete), Lusaka, and
Bulawayo are 20 to 50 times more expensive per ton/km relative to inbound traffic from
Durban and Johannesburg. One company –Malawi Packaging- quoted prices per ton/km of
$5.09, $2.32 and $3.09 for delivery to Tete, Lusaka and Bulawayo. This contrasts strongly with
$0.11-0.13 per ton/km for imports from South Africa and $0.09 per ton/km for imports in transit
through Durban.
242. High transport costs are equivalent to a tax on producers since they increase the
cost of all imported inputs (regardless of any import duties or other charges) and have a
similar impact on exports. The net effect of high transport costs –from farm to auction to
regional and international markets- is to crowd out production for the market which impacts most
on the smallholder. The potential reduction in transport costs resulting from improving logistics,
deregulating domestic transport (allowing foreign carriers to deliver and collect goods
throughout Malawi will significantly reduce costs by eliminating off-loading and re-loading
charges), increasing road maintenance on feeder roads, would also have a positive impact on

81
reducing poverty in the rural areas. The earlier DTIS estimated that more fully utilizing the
Mozambique ports along with more efficient farm to market transport services could increase
smallholder’s cash income by up to 50 per cent. Since 65 per cent (243,000) of tobacco growers
are poor and ultra-poor, improvements in transport could potentially impact positively on up to
1.1 million persons (assuming an average family size of 4.56 based on the Third Income and
Household Survey, 2010-11).
243. Effective implementation of the COMESA and SADC regional initiatives on
transport harmonization will benefit Malawi. Both COMESA and SADC have committed to
trade facilitation initiatives on the simplification and harmonization of procedures, the use of a
single administrative document (by customs), harmonized axle loading, harmonized road transit
charges, a regional Carrier’s license (allowing 5th freedom) and the COMESA Yellow Card
Scheme (Third Party Insurance). Negotiations continue on harmonizing Third party Vehicle
Insurance throughout COMESA, SADC and the EAC. This would cover all Malawi’s neighbors
and key regional trading partners. Malawi stands to reap considerable benefits if neighboring
states along the transport corridors implement all these measures and should continue to put
these issues on the table during regional talks.
244. Malawi stands to benefit from fully implementing the Yamoussoukro Declaration
and permitting cabotage. Malawi has active bilateral air services agreements covering the first
four freedoms of the air with South Africa, Zimbabwe, Zambia, Mozambique, Kenya, Tanzania
and Ethiopia. The four freedoms allow designated airlines of the two parties to operate services
between specified city pairs in their respective countries. Air Malawi, a government owned
company has the exclusive traffic rights for regional service (currently Dar-es-Salaam, Harare,
Lusaka, and Johannesburg. Malawi allowed 5th freedom rights under the Yamoussoukro
Declaration (aimed at liberalizing Africa’s air transport markets) through COMESA Legal
Notice number 2 but this was revoked while Ethiopian Airlines negotiated to purchase of Air
Malawi, so Malawi does not permit cabotage for foreign airlines and Kenya Airways had to stop
exploitation of the Lusaka-Lilongwe route in March, 2014. The Department of Civil Aviation
functions both as the regulator of the sector and the operator of all Malawi’s airports except
Kamuzu International Airport which is operated by a government company, Airports
Developments Limited (ADL).
245. The rail line under construction from Moatize to Nacala presents an opportunity for
Malawi to reduce the cost of importing and exporting bulk freight. The rail sector has
operated under a private concession with the Central East African Railways (CEAR) since 1999.
Demand declined considerably following severe flooding and the destruction of the Rivirivi
Bridge. Reduced demand and lower revenues resulted in the company cutting back on
maintenance which led to further declines in demand as more traffic switched to road transport.
The development of the Moatize coal fields has spurred investment in a new rail line linking the
coal field to the CEAR network. This has the potential to provide improved access from Malawi
to Nacala, however, the line will be used primarily for coking coal exports which will be

82
transported in coal hoppers and cannot be used to transport general cargo. The GOM agreement
with Vale provides for the movement of coal from Moatize through Malawi but the GOM also
renegotiated the concession agreement for the CEAR network (where Vale is also a majority
shareholder), with the draft agreement reserving some traffic for non-coal freight both to and
from Malawi. Improvements at the Nacala port will also be required for Malawi to benefit from
improvements in rail access for general cargo.
246. While many of the factors contributing to relatively high transport costs are
dictated by the existing level of economic development and geographical location,
government regulations also influence competition within the road sector. To encourage
competition in the domestic transport sector and to reduce domestic transport costs, the
government could start by gradually removing restrictions on foreign truckers transporting goods
within Malawi. Using a gradual but time-bound approach that would set clear targets for
identifying selected internal routes for cabotage. This would encourage more competitive prices
and bring down domestic prices per ton/km that remain more than 20 times higher than
international freight rates. At the same time, such a gradual approach coupled with reviewing
current regulations that increase operating cost (such as excise duties on re-treaded tires,
discriminatory use of road user charges across COMESA, or tax incentives) would reduce
concerns in the domestic transport industry about their ability to compete which has prevented
similar reforms in the past. More structural issues affecting transport prices such as seasonality
of production and limited backhaul or the landlocked status will only be mitigated as demand
increases in Malawi and within the region.

83
Chapter 5. Trade and Regulatory Polices: Agriculture
Agriculture: Background
247. Agriculture plays a central role in the Malawi economy currently contributing
around 30% of GDP and 75% of total export earnings. Although some successes have been
recorded in agriculture diversification with recent gains in non-traditional crops including
various kinds of pulses, cotton, and oilseeds, Malawi remains overwhelmingly dependent on
tobacco. With over 85% of the population living in rural area, the vast majority people in Malawi
have a direct stake in the country’s trade policies for crop inputs (seed, fertilizer, chemicals,
farm machinery, etc.) and outputs (tobacco, maize, cotton, sugar, pulses, etc.) in regional and
other international markets.15
248. The majority of farmers in Malawi have access to very little land. According to the
World Bank’s 2007 Poverty and Vulnerability Assessment, the average cultivable land holding
in Malawi is just 0.87ha or barely 0.2ha per capita. Overall, 58% of the farmers cultivate on less
than 1ha while 11% are nearly landless. Only 13 % of households cultivate on more than 2ha and
the majority of these are in the north where population density is lower compared with central
and southern Malawi.16
This gives rise to a particular challenge for export diversification in that
farmer profits from tobacco are among the very best per hectare. The GOM has long recognized
the importance of diversifying crop production to reduce vulnerability and improve
environmental sustainability. While other crops are available that also provide high profits from
a limited area, these commodities mostly have much smaller markets and/or involve complex
value chain linkages that will take time to develop. The current strong market for tobacco
provides time for Malawi to create the conditions for diversifying crop production and growing
new value chains.
249. To help policymakers, agribusiness firms, farmers, donors, and other sector
stakeholders map the way forward for agriculture trade, this study specifically aims to:
Increase understanding of strategic bottlenecks to agriculture trade;
Consider how trade policies affect the competitiveness of Malawi’s agriculture; and
Identify opportunities for enhanced trade performance.
250. Beyond the opportunities to enhance Malawi’s own agriculture trade, some of the
greatest opportunities for improved trade performance involve, and would also benefit,
Malawi’s trade partners. Problems with fragmented regional markets are not only a burden to
Malawi, but are increasingly recognized as a major factor underlying Africa’s growing
dependence on global food imports.17
Through increased trade and closer economic integration,
Africa could easily feed itself and it is hoped the discussion here will serve as a practical starting
15 Data compiled from World Development Indicators (http://data.worldbank.org/country/malawi#cp_wdi), FAO 2012, NKC 2010, and World
Bank, 2010. 16 World Bank, 2007. 17 World Bank, 2012

84
point for the kind of on-going dialogue needed to integrate trade policy as a central part of
agriculture development strategy in Malawi and beyond (see Box 2).
251. This chapter assesses the main trade management challenges facing Malawi
agriculture including obtaining agricultural inputs at competitive prices, the continued reliance
on centrally determined minimum farm gate prices, import and export licensing requirements for
all types of agriculture commodities, and mandatory standards inspection requirements for
imports.
252. This is followed by two case study examples of actual trade costs at the
Mwami/Mchinji border with Zambia which shows how formal sector trade requirements
discriminate against smaller traders, undermines agriculture competitiveness and holds
back opportunities for economic diversification. The chapter concludes with a review of the
main areas where policy improvements or other institutional changes could help set Malawi on a
track to realize its full potential for agriculture trade.
The Supply of Agriculture Inputs
253. Agriculture trade competitiveness begins with the decisions farmers make based on
the access and prices of essential inputs such as seed and fertilizer. Since 2005/06 Malawi
has made significant progress in increasing farmer access to hybrid maize seed and fertilizer
through the Farm Inputs Subsidy Program (FISP). Since the 2008/09 season, farmers have also
been able to select one type of legume seed in addition to maize. The FISP is also designed to
provide subsidized storage pesticide to minimize losses of maize and pulses retained for home
Box 2: The Importance of Regional Agriculture Trade
Rising prices for basic food products are back in the headlines and when food prices go up poor
people, who spend the majority of their income on simple foodstuffs, suffer. Rising food prices
are also having important macroeconomic impacts on many African countries since more and
more food is being imported from the global market leading to worsening balances of trade. This
issue is not going to go away. Demand for food in Africa is projected to double by 2020 with
consumers increasingly located in rapidly growing cities.
The recent report, Africa Can Help Feed Africa (World Bank, 2012b), shows how the continent
has the means to deliver improved food security to its citizens. If African farmers were to achieve
the yields that farmers attain in other developing countries, the output of food staples would more
than double.
For this to happen, however, farmers need to be better linked to both inputs and to consumers.
Often the nearest source of demand is across a border yet fragmented regional markets, high trade
costs, and lack of predictable trade policies deter much needed private investments – including
small investments by poor farmers in raising productivity to large investments in input supply,
seed multiplication, and food marketing. Given that different seasons and rainfall patterns are not
conveniently confined within national borders, and that variability in production is expected to
increase with climate change, facilitating cross-border trade is essential to providing farmers and
traders with the opportunity to meet Africa’s rapidly growing food requirements.

85
consumption. These gains, however, have come at a very high cost to the government’s budget
with the FISP accounting for over 60% of total spending on agriculture in recent years. Apart
from sustainability issues, the expenditure on the FISP has crowded out investment on irrigation
crop production, research, and extension (see Figure 15).
Figure 15 Functional Allocation of Malawi’s Agriculture Budget (% of total)
Source: World Bank, 2013 Malawi Public Sector Expenditure Review.
254. Malawi imposes many administrative costs on seed and fertilizer importers. With
seed, for example, it takes a minimum of two years to test a new variety at a cost of
approximately $13,000-15,000 per year per seed even if the variety has already been released in
another country. Once a variety has been approved, additional costs are incurred for seed
certification with imported seed often being retested even when it arrived with a quality
certificate issued by the exporting country. Re-registration charges also apply for already
approved varieties.
255. Studies of fertilizer markets throughout Africa show that reducing trade costs
together with increased reliance on domestic blending to avoid transportation of inert
fillers can easily save USD 30-40 per ton.18 In 2012/13, Malawi imported a total of 154,000
tons of fertilizer through the FISP meaning the total potential savings from trade facilitation and
domestic blending could be more than USD 6 million.
256. Input dealers also complain of not being able to import inoculant needed to improve
soybean germination. According to private input dealers, the National Research Station at
Chitedze has an unofficial monopoly on the supply of soybean inoculant. Making matters worse,
companies complain that the inoculant supplied by Chitedze is dead and has no effect. When
private seed companies have attempted to import active inoculant to sell with their product,
Chitedze has refused to issue the required permits.
18 See Bumb, et. al. 2011.
0
10
20
30
40
50
60
70
80
2005/2006 2006/2007 2007/2008 2008/2009 2009/2010 2010/2011 2011/2012 2012/2013
Crop Production excl FISP Extension Livestock Management and Support FISP Other

86
Fertilizer trade
257. While tender awards under the FISP are generally competitive with fertilizer
contracts spread widely, unit prices vary substantially from one company to the next with
some of the highest prices being paid to the state-owned companies ADMARC and
SFFRFM. All of the private importers interviewed complained that the process of importing
FISP fertilizer is unnecessarily expensive and time consuming as they are required to go through
various tender procedures and procedures to obtain the required foreign exchange, but also have
to price in expected delays in GOM payment together with exchange rate and inflation risks over
this period. Compared with Malawi’s regional competitors these factors result in fertilizer prices
being among the highest in eastern and southern Africa (see Figure 16). Since 2009/10, FISP has
accounted for around 55-70% of all fertilizer imported to Malawi including fertilizer used by
large estates. Recently, around 20% of the total value of FISP fertilizer contracts has been
awarded to parastatal firms.19
Figure 16 Nitrogen Based Fertilizer Prices in 2010 (USD per ton of nutrients)
Source: World Bank, 2012.
258. Introducing new types of basal fertilizer based on different soil types and growing
conditions found around Malawi promises to reduce fertilizer costs. Under the FISP, the
only kind of basal fertilizer made available is 21:23:0+4S, which is common only in Malawi so
has to be custom made at a small scale and correspondingly high unit cost.
259. Fertilizer suppliers agreed that the universal application of 23:21:0+4S on maize is
an outdated and inappropriate recommendation. Measures to provide farmers a choice of
different types of fertilizer, or at least to introduce regional differences or even differences by 19 Chirwa and Doward, 2012.
87
Agriculture Development Division (ADD), would contribute to improving the overall efficiency
of Malawi’s subsidy program and the potential to trade in maize.
260. Promoting domestic fertilizer blending capacity and opening up regional trade in
fertilizers has the potential to reduce input costs. Inert fillers account for 52% of the volume
of Malawi’s 23:21:0+4S fertilizer and domestic blending and/or regional trade of fertilizers made
in neighboring countries would to save on international shipping. Limited port capacity
constrains regional traders from being able to realize significant economies of scale on imports
(through importing on a larger ‘boat’). Regional trade and/or domestic manufacture of different
products adapted to local conditions could, however, still create the potential for realizing
improved economies of scale and savings on transport.
Seed trade
261. Malawi has created space for the private sector to participate in the seed component
of Malawi’s input subsidy program. Whereas fertilizer is only distributed through ADMARC
and SFFRFM, private agro-dealers have been allowed to redeem seed coupons since the second
year of FISP implementation (i.e. since 2006/07).
262. Each variety of seed sold in Malawi must be tested and registered with Malawi Seed
Services. As in other countries, registration and testing requirements are intended to ensure that
each variety of seed sold domestically is well suited to local conditions and of good quality. In
terms of new variety development, Malawi Seed Services reports that it typically takes a
minimum of seven to eight years for the agency to develop and test a new seed before it is
approved for general release. A private company that wishes to import a seed to Malawi or
register a variety for domestic multiplication that it developed elsewhere must make the seed
available for a minimum of two years of domestic on-station and farmer field trials by Seed
Services before it can be registered and approved for domestic sale. In other countries, the testing
period sometimes requires a minimum of four years.
263. Following the results of the field trails, each new variety in Malawi must then be
reviewed by the Agriculture Technology Clearing Committee (ATCC) to receive formal
approval. The ATCC is mandated to approve all agriculture technologies in Malawi including
different kinds of fertilizer, agrichemicals, and farm machinery. Once the variety is registered by
ATCC, all certified seed multiplied in Malawi must be inspected by Seed Services throughout
the growing season. Imported seed multiplied elsewhere must undergo germination tests on
arrival in Malawi to ensure its quality.
264. The cost of registering a new seed type is high and unpredictable. The official costs
of registering a new type of seed are modest at only MWK 1,400 (USD 3.50) per line for
statistical trial and MWK 2,000 (USD 5.00) per line for release trial. However the actual amount
is much higher and unpredictable as the private company is required to cover all transport costs
and out of station allowances for seed officers, seed inspectors, assistant seed inspectors and
drivers of Seed Services. In one example from the 2011/12 season, the total costs quoted by Seed

88
Services for eight on-farm and four on-station field trials for one variety totaled MWK 1.94
million (nearly USD 13,000 based on the exchange rate of the time) but came in even higher
after additional bills for materials were received with over 85% of the costs going to cover travel
expenses and staff allowances against just 15% for materials and analysis of results (see Table
28).
265. Onerous seed registration results in private companies registering fewer varieties in
each country rather than all of the seeds in their portfolio that may be better suited or offer
better value for certain end users.
Table 28 Costs Quoted to Evaluate Soybean Varieties (2011/12 Season)
Note: Costs Quoted by Malawi Seed Services for On-Farm and On-Station of Evaluation of Soybean Varieties for the 2011/12
Season: Cost for eight on-farm and four on-station trials. Assume USD 1.00 = MWK 150 as 2011/12 exchange rate.
266. Many of the domestic tests are redundant and divert scarce resources that could be
better used to control the sale of counterfeit products to end users. To improve the situation,
SADC has developed a harmonized system of seed rules that would allow any variety that has
been registered in two other SADC Member States to be listed in the SADC Seed Catalog and
then be freely traded throughout the region without the need for further variety registration or in
country testing. A similar harmonized seed system is also being developed by COMESA.
Price
(MWK) Unit Qty
Total
MWK Total USD
Site selection and delivery of farm inputs
Seed Inspector 17,000 night 5 85,000 566.67
Seed Officer 15,000 night 5 75,000 500.00
Assistant Officer 8,000 night 5 40,000 266.67
Driver 6,000 night 5 30,000 200.00
Monitoring and Inspection visits
Seed Inspector (4 nights x 3 visits) 17,000 night 12 204,000 1,360.00
Driver (4 nights x 3 visits) 6,000 night 12 72,000 480.00
Land preparation
Fuel contribution 60,000 ls 1 60,000 400.00
Casual Laborers
Planting (6 workers @ 3 days per site) 40,000 ls 1 40,000 266.67
Weeding (6 workers @ 3 days per site) 38,000 ls 1 38,000 253.33
Harvesting (6 workers) 45,000 ls 1 45,000 300.00
General Supplies
Jumbo bags (assorted sizes) 35,000 ls 1 35,000 233.33
Paint (1 black & 1 white) for each station 15,000 tin 2 30,000 200.00
Flat metal sheets 15,000 15,000 100.00
Vehicle operation and maintenance
Fuel (site selection) 250,000 trip 1 250,000 1,666.67
Fuel (inspection visits) 200,000 trip 3 600,000 4,000.00
Parts for servicing 50,000 trip 4 200,000 1,333.33
Preparation of final report
Data compilation and analysis 120,000 ls 1 120,000 800.00
Total budget excluding farm inputs 1,939,000 12,926.67

89
267. Implementing the SADC and COMESA Harmonized Seed Systems should be a
priority. The SADC Seed System was developed over more than 15 years with extensive input
from Malawi and other SADC Member States. In 2008, full details of the system were released
and by June 2013, the necessary two-thirds majority of SADC Ministers of Agriculture had
signed a Memorandum of Understanding to allow implementation to begin. Similarly, in
COMESA, all of the rules of the regional seed system have basically been agreed and Member
Countries are now only waiting for final approval from the Council of Ministers expected in
early 2013. Before either regional agreement can take effect, however, Malawi’s domestic seed
laws need to be amended to ensure conformity with the regional approach. While Malawi has
recently begun the process of reviewing its 1996 Seed Act (with World Bank assistance) much
still needs to conclude the review and push the revised legislation through Parliament. Other
partner countries in SADC and COMESA also need to adopt appropriate legislation to allow
regional trade under the harmonized system. Malawi’s partners in APEI (Zambia, Mozambique,
Seychelles and Mauritius), for example, are all members of SADC and fast track implementation
of regional seed agreement would be good strategy for increased trade..
Trade in Farm machinery
268. Malawi agriculture is not widely mechanized. There is no reliable figure for the total
number of working tractors in Malawi, but was estimated to be around 1,400 total units equal to
just 4.8 machines per 100km2 of arable land. Neighboring Zambia also suffers from a lack of
mechanization, but has a reported 6,000 working tractors equal to equal to 11.4 machines per
100km2 of arable land.20
269. Price controls and export restrictions constrain the adoption of mechanized
agriculture. Local sources report that Malawi has imported a total of around 50 tractors per year
through commercial channels since 2011. The most popular size is the relatively small 60-80hp.
Tractor importers observed that sales in Malawi are fundamentally constrained by the fact that
estates and other larger-scale farmers cannot sell or export grain, soybeans, and other crops
suited to extensive production at real market prices. The setting of maximum consumer prices to
protect poor consumers and blocking exports at parity prices has been a particular problem for
the profitability of large-scale grain and oilseed production which is required for Malawi to
guarantee its own food security and potentially become a reliable food exporter.
270. Consider adapting successful innovative approaches to facilitate mechanization
among medium and small scale farmers. In Zambia a commercial cotton company with
financial support from with Gates Foundation, USAID, and World Food Program (WFP), has put
34 tractors on the ground since 2011 by establishing a revolving fund whereby “lead farmers”
are given credit and training in tractor operation and management of local hire services. Other
farmers in the area are able to pay for the tractor service through a deduction from their cotton
payment, which is refunded to the operator. USAID provided management training and helped to
20 See www.tradingeconomics.com.

90
get the program off the ground; WFP’s Purchase for Progress (P4P) program and Gates
Foundation provided the original finance for the revolving fund. Plans are now underway to
expand the smallholder tractor program with commercial credit from a local bank.
Trade management: tariffs, domestic polices and trade requirements
271. Improving the trade environment for agriculture is necessary for attracting
investment in the new production systems and alternative agriculture enterprises required
for improving rural incomes and delivering sustainable growth.
Agriculture Tariffs
272. Through Malawi’s membership of SADC and COMESA Free Trade Areas, duty
exemptions are available for all types of qualifying goods from Member Countries.
Obtaining duty free status, however, requires the exporter to provide a SADC or COMESA
Certificate of Origin. To the extent that some foreign producers have not registered their
products or are trading in small quantities that do not justify the cost of obtaining a Certificate of
Origin, Malawi importers may still be required to pay import duty. The same situation applies to
Malawi’s exports. If the domestic company cannot provide the foreign buyer a Certificate of
Origin, Malawi will not enjoy the benefit of duty free status in regional markets.
273. In 2007, 10 out of 19 COMESA countries introduced a Simplified Trade Regime
(STR) whereby a Simplified Certificate of Origin could be obtained at the border for
consignments with a total value less than USD 500. In September 2011, six countries (namely
Malawi, Zambia, Zimbabwe through COMESA, and Kenya, Rwanda and Uganda through the
EAC) agreed increase the STR threshold to USD 1,000 per consignment. Despite this change,
border officials and small-scale trader representatives say the STR has had very little uptake. At
the Mwami/Mchinji border with Zambia, for example, officials say there are fewer than 20 STR
transactions per month and almost no transactions in agriculture. Even with the STR, small
agriculture traders are still required to provide all other kinds of export and import
documentation including trade licenses, phytosanitary certificates, certificates of standards
compliance, foreign exchange certificates, and certificates of non-GMO conformity. As a result,
it is often much cheaper and more practical for small traders to use informal routes to avoid
border procedures completely.
Tariffs on agriculture inputs
274. Malawi maintains a very liberal tariff regime on most agriculture inputs. All types
of fertilizer and agrichemicals can be imported duty-free and are zero-rated for value added tax
(VAT) regardless of where they are from. Day old chicks used to raise broiler chickens can also
be imported without duty and are VAT exempt.21 Most types of seed attract 5% import duty and
are VAT exempt. While this policy may provide a modest amount of protection to domestic seed
21 Zero-rated supplies are taxable supplies subject to VAT at zero percent. Exempt supplies are not taxable for VAT purposes and therefore do not form part of a business’ VAT-related enterprise. A business may only recover input tax on expenses incurred in the course of making taxable
supplies. No input tax deductions may be claimed on goods or services acquired for the purposes of making exempt supplies.

91
producers, farmer income and trade competitiveness begins with the inputs producers use. Given
that crop yields in Malawi are notoriously low, any effort to improve farmer access to better
planting material would be a worthwhile strategy to explore. Planting seed for cotton attracts
15% import duty and is VAT exempt. Even though Malawi may wish to be reliant on its own
cotton seed production, a far more urgent challenge for trade is to ensure farmers have access to
the best inputs at competitive prices.
275. All sizes of tractors and tractor attachments can be imported without duty and are
VAT exempt. Tractor spare parts, however, are treated the same as any other automotive part
and attract a relatively high 30% import duty and standard (16.5%) VAT. Knapsack sprayers of
the type used by smallholder cotton farmers attract 0% duty and are VAT exempt.
Tariffs on agriculture commodities
276. With respect to agriculture outputs, Malawi maintains relatively high tariff rates on
many products as shown in table 29 below.
Table 29 Import Tariffs and VAT Rates for Selected Agriculture Commodities
Category and Item Customs Rate VAT Rate
Livestock, meat, and dairy
Live animals (most types)
Beef and pork (meat)
Processed meats (most types)
Poultry (meat)
Fish
Dairy (most products)
10%
15%
30%
30%
30%
15-30%
E
E
16.5%
E
E
E
Grains and Flour
Maize grain
Maize flour
Wheat grain
Wheat flour
Rice
Sorghum
Malt (for brewing)
0%
15%
0%
30%
10%
15%
15%
E
E
E
16.5%
E
E
E
Oilseeds and Edible Oil
Soybeans
Sunflower
Oilcake
Edible oil (soybean, sunflower, palm, etc)
- crude oil
- refined oil
15%
15%
15%
25%
30%
E
E
16.5%
16.5%
16.5%
Sugar
Cane sugar & confectionery
Other sugar
30%
15%
16.5%
16.5%
Other Foods
Fresh and dried vegetables (most types)
Prepared foods (canned goods, pasta, etc.)
30%
30%
E
16.5%
Source: Compiled from http://www.mra.mw/customs_tariff.php; E = VAT Exempt

92
277. While these tariff rates on agriculture commodities help to protect domestic
producers from international competition, this is at the cost of raising consumer prices and
perpetuating domestic inefficiencies. For example, maize and wheat grain can be imported
without duty or VAT, whereas maize flour (mealie meal) attracts 15% duty while wheat flour
attracts 30% duty and 16.5% VAT.
Minimum Farmgate Prices
278. The Government’s continued use of centrally determined minimum producer prices
further distorts the incentives to expand production. Each year, the Ministry of Agriculture
and Food Security (MoAFS) announces minimum farmgate prices for around 23 different
commodities including maize, groundnuts, rice, millet, beans, soybeans, sunflower, and various
other minor products excluding tobacco that are meant to be enforced by the police and the
parastatal marketing company, ADMARC. According to the official press release, these prices
are “set as incentives to assist farmers to make informed business decisions” during the
agriculture season. In practice, however, ADMARC does not have the financial strength to buy
all of the crops at the set price. Since 2008, Government has also announced minimum producer
prices for seed cotton.
279. Established formal sector marketing companies are obliged to pay the minimum
price, but only do this at their factory gate meaning that farmers often sell to primary
assemblers and other local traders for less. Moreover, there is a significant risk that floor
prices announced at the beginning the season bear little resemblance to the commodity’s actual
value when the transaction takes place. Before the 2013 marketing season even began traders
interviewed for the DTIS said the GOM/ADMARC price for maize is barely relevant as a
measure of the commodity’s worth.
280. The goal of ensuring farmers receive a “fair” price is commendable, however, there
are many other potentially less harmful and less risky ways to achieve this objective such as
support for radio or SMS price information systems and/or defense of market driven
prices. Setting arbitrary prices discourages innovation, suppresses production and encourages
informal cross-border selling. For example, in 2009 the government set minimum cotton prices
above world market conditions which resulted in Cargill, the country’s largest ginner and out
grower credit provider, closing its operations in Malawi. Government responded the following
year by launching the Cotton Up-scaling Program that among other things replaced the private
sector out grower support with a new (government financed) USD 10.6 million revolving fund.
281. Price formulas based on assumed types and levels of input use discourage
innovation. Growing conditions and optimal levels of input use vary from place to place so
unrealistic to determine a farmer’s “fair” price based on one crop model for the entire nation.
Such an approach can easily undermine trade competitiveness by encouraging farm practices that
are not driven by fundamental agronomic and/or economic realities.

93
Export Development Fund
282. To improve conditions for agriculture exporters, the GOM established an Export
Development Fund (EDF) in February 2012 managed by the Ministry of Finance. Under the
EDF, government issues loan guarantees through private financial institutions for up to 70% of
the cost of exporting (i.e. loans for working capital to finance export operations). Plans are also
underway to include a facility specifically targeted at commercial farmers growing maize,
soybeans, pigeon peas, groundnuts, chilies, paprika, orange squash, coffee, forestry products, and
cut flowers.22
283. EDF finance may represent a partial solution to accessing trade finance but the
major constraint remains the much high costs faced by small traders in complying with
Malawi’s formal sector trade requirements (as outlined in the next section). Potential EDF
clients interviewed during the DTIS claimed the benefits are undermined by having to pay a 3%
fee to cover EDF administration costs in addition to existing commercial bank interest rates.
Small exporters targeted by the EDF, for instance, currently pay 40-42% interest rates on bank
loans (or 43-45% including EDF fees), whereas established traders with a record of borrowing
pay around 35% interest. With such costs the EDF is unlikely to represent more than a partial
solution to accessing trade finance.
Trade Requirements
284. From a value chain perspective, each transaction cost reduces the total profit
available to flow upstream to farmers, traders, transporters, processors, and all other
domestic value chain participants. Streamlining trade procedures, therefore, is not only
important for improving Malawi’s trade competitiveness, but can also have a direct, positive
impact on rural incomes and incentives for on-farm improvement and agriculture diversification.
Table 30 Overview of Agriculture Import and Export Requirements
To Export To Import
Export permit
Phytosanitary certificate
Fumigation certificate
Standards certification (optional)
Non-GMO certificate (depending on market)
Foreign exchange documentation (CD-1)
Certificate of origin (to avoid duty)
Testing and registration of seed and other inputs
in foreign market
Customs documents
Import permit
Phytosanitary inspection
Fumigation certificate
Standards inspection and testing
Non-GMO certificate (from foreign supplier)
Application for foreign exchange
Certificate of origin (to avoid duty)
Testing and registration of seed and other inputs
in Malawi
Customs documents
22 FUM, 2012.

94
285. Malawi imposes (and encounters) a wide variety of paperwork and product
registration requirements –listed in Table 30- that make trade difficult and expensive. This
is seen on many levels beginning with the use of trade permits and the risk of outright trade bans
through to multiple certification and inspection requirements that add to trade costs. On the one
hand, phytosanitary and many other trade rules serve legitimate purposes in terms of protecting
human, animal, and plant health, yet in practice there are frequently institutional overlaps
whereby traders are required to obtain certificates for the same or similar requirements from
different agencies and to submit their goods for duplicate inspections by both the exporting and
importing country. In Malawi and many other African countries, the same standards bodies and
other institutions that set trade rules depend on the fees charged for issuing trade certificates to
cover salaries and other operating costs so can easily be more interested in revenue collection
than in actual trade facilitation.
Import and Export permits
286. As described in the previous Chapter import and export permits are required for
virtually all agricultural products. These requirements discourage production for export, drive
down prices, encourage illegal trade, contribute to increased food insecurity and exacerbate
initiatives aimed at reducing poverty.
Phytosanitary certificates
287. Under the rules of the International Plant Protection Convention (IPCC)
Phytosanitary certificates are required by importing countries. These are issued by the Plant
Health Inspection Office near Lilongwe, Blantyre, and Mzuzu. Each certificate costs MWK 500
(about USD 1.21 at the current exchange rate). Phytosanitary certificates can also be issued at the
border for individuals carrying 1-2 bags of commodity. For larger consignments, or for traders
traveling in a bus, the phytosanitary certificate must be issued in advance at one of the three
designated Plant Health Inspection offices. To be issued with a phytosanitary certificate for
maize or rice, exporters must show a valid export permit. Individuals may export up to 100kg of
rice, groundnuts, and beans as a “personal allowance” without an export permit, but still require
a phytosanitary certificate. There is no personal allowance for maize.
288. For small traders traveling by bus with up to about 4-5 bags of commodity, plant
health inspectors will issue the certificate at their office without physical inspection of the
commodity. They say this is because they “know the markets” where the commodities come
from and carry out occasional spot inspections of these locations to check for quarantine pests.
289. For larger consignments, however, a physical inspection of the commodity usually
takes place. Sometimes an exporter may bring a sample to the Plant Health Inspection office,
but otherwise the exporter must collect a Plant Health Inspector from their office and drive them
to where the product is stored. Inspectors explained that this is because their budget allocation is
not enough to cover cost of vehicle operations so have no choice but to pass the cost to the

95
exporter. Out-of-station allowances are usually also paid by the exporter for time spent in the
field. There was recently talk of increasing the cost of a permit to MWK 2,000 (about USD 4.87)
but this was rejected because of complaints from tobacco and tea exporters. As part of the
inspection, and to verify that the product has been fumigated, Plant Health Inspectors say the
usual practice is to bring a sample back from the inspection site to keep under observation for
any pests that emerge. Only after a suitable period of observation will the Plant Health Officer
then issue a phytosanitary certificate.
290. For imports, Malawi mostly recognizes the certificates issued by other countries and
only carries out physical inspection at the border to check for signs of pests. Animal
products including all dairy items are likewise subject to border inspection by the Veterinary
Department. When the Government of Malawi plans to import a large quantity of foodstuffs on
official basis, however, standard procedure is to send a three to four person delegation consisting
of representatives of the Ministry of Agriculture, Ministry of Trade, and Office of the President
and Cabinet to inspect the consignment in the country of origin before it is dispatched.
Sometimes a representative of the National Food Reserve Agency may also be included. Since
the exporter is still required to provide an internationally recognized phytosanitary certificate
from the exporting country, and to submit a pre-shipment sample for analysis by MBS, the
justification for sending an official delegation to do its own inspections are not entirely clear.
291. The absence of an effective system for aflatoxin control and management is a serious
constraint to Malawi’s export competitiveness in groundnuts, Birdseye chilies, paprika,
maize, and oilseeds. The Chitedze Research Station was recently equipped with laboratory
facilities for aflatoxin analysis of export consignments, but this is unlikely to have a significant
impact unless matched with measures to control aflatoxin, where the problems actually arise - on
the farm and in storage. A 2012 report prepared for the USAID Southern Africa Trade Hub
outlined the key elements of a commercially viable system for aflatoxin control that included
interventions at the buying, grading and storage, and export levels.23
Aflatoxin test kits capable
of testing up to 1.2 tons of groundnuts at the farmgate level, for example, costs USD 10.00
(about MWK 4,100) and would be a very cost-effective intervention at only USD 0.008 per kg
(MWK 3.42). The introduction of “platform tests” on product reception by ADMARC and other
buyers could therefore go a long way to minimizing Malawi’s aflatoxin problem. A recently
piloted test using smart phones could also significantly improve the situation.
Fumigation certificate
292. Proof of fumigation is usually covered as part of the phytosanitary certificate.
Depending on the importing country’s own SPS declaration requirements, however, Plant Health
Services says they can easily issue a separate Certificate of Fumigation. All grains imported to
Malawi must be fumigated prior to dispatch with full details of the fumigation stated in the
accompanying phytosanitary certificate.
23 Emmott, 2012.
96
Non-GMO certificate
293. All maize and other agriculture commodities imported to Malawi must be
accompanied by a non-GMO certificate. Malawi is currently undertaking trails for genetically
modified (GM) cottonseed, but is otherwise a GMO-free country. Other non-GMO countries in
eastern and southern Africa include Botswana, Mozambique, Tanzania, Uganda, Zambia, and
Zimbabwe, while South Africa and the Democratic Republic of Congo do not have restrictions
on GMO imports.
294. In Malawi, non-GMO certificates cost MWK 3,500 (about USD 8.53) each and are
required to export all types of commodity including pulses, groundnuts, chilies, and maize
to other non-GMO countries. Non-GMO certificates are issues by the same Plant Health
Inspection Office that issues phytosanitary certificates. Malawi does not have capacity to test for
genetically modified organisms. The Non-GMO Certificate is a letter that states Malawi does not
allow GMO seeds into the country all therefore all exports are non-GMO. Although this
approach is very simple (and perhaps begs the question of why a standard letter should cost
MWK 3,500), the procedure makes sense for Malawi. Exporters whose buyers require detailed
analysis can send samples to independent laboratories and should not be required to submit
samples for detailed GMO analysis if the buyer does not demand it.
295. In Zambia, by contrast, non-GMO certificates cost ZMW 150 (about USD 30) each.
One original certificate is required per truck meaning the cost works out to USD 1.00 per ton for
a full size 30-ton truck but can be much higher for traders dealing in small quantities. In addition
to the cost of the certificate, Zambia requires various levels of testing to determine the
shipment’s non-GMO status before the certificate is issued. The type of test depends on buyer
requirements, but some kind of chemical analysis must be performed for every shipment.
Standards certificate
296. Although Malawi does not require its exports to be accompanied by a quality
certificate, proof of compliance with Malawi Standards is compulsory for 226 different
categories of imported product.24
Virtually all imports in the agriculture and food sectors are
subject to mandatory MBS inspection. Malawi does not recognize foreign quality certificates and
to avoid delay at the border, importers are advised to send a pre-shipment sample for MBS
testing at least two weeks before the expected arrival in Malawi.
297. Malawi does not recognize international test certificates provided by fertilizer
manufacturers and importers must pay MBS for analysis of every consignment brought
into the country. The mandatory MBS inspection for imported fertilizer cost is equivalent to
1.6% and 1.2% of the non-subsidized fertilizer price for traders bringing in a single truckload
and convoy of five truckloads respectively. Based on a total cost of the 154,000 tons of fertilizer
procured for the 2012/13 FISP of approximately USD 131 million, this results in the
24 In Zambia, standards analysis is mandatory for just 44 different categories of product. In agriculture, these are: animal feeds for cattle, pigs, and
poultry; maize meal; wheat flour; refined edible vegetable oil; and all types of fertilizer.

97
Government paying between USD 1.6 to 2.1 million to MBS for quality analysis.25
If the trucks
do not cross at the same time, each shipment must be analyzed separately. Importers of all types
of goods have complained they never hear back from MBS on the quality test results and must
pay for separate private tests is they wish to have the results for their own commercial use.
298. Although Malawi does not require MBS inspection of exports, similarly high
charges apply in foreign markets for quality tests by other standards bodies. Companies
exporting pigeon peas to Kenya and South Africa, for example, say they can pay around USD
600-700 for between 500 to 1,500 tons of product (i.e. USD 0.40 to USD 1.40/ton).
299. Companies importing custom blended fertilizer made in Mozambique and Zambia
reported that their products were rejected by MBS because the composition did not match
one of the 16 types specified in Malawi’s domestic standards for compound fertilizer (i.e. the
specifications approved by MBS and the ATCC). The products were made of perfectly good
active ingredients according to customer demand for specific soil types in Malawi, but were
rejected by MBS. Importers said the matter was being reviewed by MBS and MoAFS, although
to date no one has been able to give a definitive answer on whether different blends form the
ones listed in Malawi’s domestic standards specifications are allowed to be imported. Domestic
blenders, on the other hand, indicated they are free to make and sell whatever blends of
customers demand since domestic products are not subject to MBS analysis.
Certificate of Origin
300. A Certificate of Origin must be purchased from the Chamber of Commerce office in
Blantyre. The travel and transit time can represent a hurdle for smaller businesses not located in
the major cities. The certificates are required under the terms of the SADC and COMESA Trade
Protocols to qualify for duty preferences. Certificates cost MWK 1,500 (USD 3.65) for non-
members and MWK 1,400 (USD 3.41) for members. One original certificate is required per
truck.
Foreign Exchange Documentation
301. Malawi monitors foreign exchange movements at its borders. For goods with a value
above USD 5,000 at the official exchange rate, exporters must file a Currency Declaration Form
(CD-1 Form) which is provided by the exporter’s commercial bank and used to ensure the
foreign currency comes back to Malawi (or for a foreign exporter to show that the money came
into Malawi at the official exchange rate). The Malawi Revenue Authority does not officially
charge a fee to process the CD-1 Form at the border, but some traders claimed during interviews
that they nevertheless had to pay MWK 5,000 (about USD 12.20). For imports, customs
clearance documentation (i.e. Customs Form 12) is used to verify that the goods came into
Malawi and must be submitted to the importer’s bank to account for all foreign exchange paid to
the supplier.
25 Based on a tender price of USD 850/ton.

98
Customs Documentation
302. For all import and export transactions of goods valued above USD 5,000 at the
official exchange rate, a licensed clearing agent must be used to ensure all the correct
documents are filed, including the CD-1 for exports and Customs Form 12. To complete
these forms, the exporter/importer is required to provide an original invoice. The fees for this
service vary, but typically work out at around USD 75 to 150 per commercial invoice handled.
Case Study: Trade Costs between Malawi and Zambia at the Mwami/Mchinji Border
Crossing
303. Two case studies of cross border trade highlight the high costs of complying with
Malawi’s trade procedures, and shows how these effectively crowd out small traders. The
first example looks at the costs of exporting rice to Zambia and the second example looks at the
costs of importing maize meal to Malawi. For both examples, the analysis covers three different
size loads including (i) a full size 30-ton truck of the sort used by large traders; (ii) a smaller 7-
ton truck of the sort a medium-size trader might use; and (iii) a small 2-ton truck that a small
local trader might use. For the small 2-ton load, the analysis further compares the costs of
crossing the border with and without the COMESA STR facility.
Costs of Exporting Rice
304. The cost of a formal sector border crossing at Mwami/Muchinji for two different
size loads of exported rice are shown in Table 31. As shown, exporters require the full range
of Malawi trade certificates including an Export Permit, Phytosanitary/Fumigation Certificate,
and Non-GMO certificate to cross the Malawi border. Zambia charges 15% import duty on rice
and a COMESA or SADC Certificate of Origin is also required to avoid paying this charge.
Traders stated they had to pay a CD-1 processing fee of MWK 5,000 (about USD 12.20) for
foreign exchange controls and use a licensed clearing agent (which in the example below is
assumed to be slightly less expensive for the 7-ton truck than a 30-ton truck).
305. On top of the fees charged in Malawi, Table 31 shows that even higher charges
apply to enter Zambia. Whereas Malawi does not charge for import/export permits, Zambia
does charge for these at a rate roughly equal to USD 150 per 510 tons. Zambian trade permits are
valid for 30 days only and any unused portion does not carry forward. Zambia also charges
around USD 10 for use of its automated systems of customs entry (ASYCUDA) and levies a
carbon tax on all foreign registered vehicles that depends on engine size. COMESA Yellow Card
insurance must also be purchased and a licensed clearing agent must be used to handle all
document entries. For its part, the Zambia Bureau of Standards (ZABS) does not require rice
imports to be analyzed for standards compliance, but would require standards analysis of maize,
maize meal, animal feeds, fertilizer, and 44 other potential exports from Malawi. Given that even
higher trade costs arise outside of Malawi, dialogue with Zambia and other regional partners
through COMESA, SADC and the Accelerated Program for Economic Integration (APEI) on

99
opportunities to reduce trade costs would be a good strategy for Malawi to pursue.26
In the above
analysis, fees charged by clearing agents account for almost two-thirds of the total cost of a
formal border crossing excluding the costs of acquiring all required permits.
Table 31 Cost of Formal Rice Exports to Zambia at Mchinji (30t and 7t truck)
306. The fixed costs of exporting are highly regressive with medium-size traders paying
significantly more per ton than large traders. In the above example, an exporter with only a 7-
ton load pays almost three and half times more at USD 36.57/ton vs. USD 10.74/ton paid by
large exporters with a full-size 30-ton load excluding the costs of acquiring the required permits.
Compared with the GOM’s minimum farmgate price for paddy rice (converted to milled rice
equivalent at 60% outturn), the prescribed costs paid by a 7-ton trader to enter Zambia are equal
to 8.2% of the farmgate price. A 30-ton trader, on the other hand, would pay just 2.4% of the
GOM minimum farmgate price to cross the Malawi-Zambia border. Compared with the
wholesale price in Lusaka, the costs paid by a 7-trader are equal 6.1% of the landed CIF value
vs. 1.8% of the CIF value when handled by a larger-scale, 30-ton trader.
307. In addition to the official costs detailed above, traders also incur fixed costs of USD
186.41 to acquire the Malawi trade certificates. As discussed in the section on trade
26 The APEI is an initiative started by Malawi, Mauritius, Mozambique, Seychelles, and Zambia aiming at accelerating the implementation of
reforms aimed at strengthening regional integration and facilitating the flow of goods and persons across borders. The initiative largely aims at implementing commitments that the countries have already made at regional for a. APEI was launched in September 2012 and operates within the
framework of variable speed and variable geometry endorsed by SADC and COMESA.
USD/truck USD/ton USD/truck USD/ton
Costs to Exit Malawi
Export permit (free) - - - - Free, but takes 4-6 weeks w/o constant follow-up
Phytosanitary/fumigation certificate 1.22 0.04 1.22 0.17 MWK 500 each
Non-GMO certificate 8.54 0.28 8.54 1.22 MWK 3,500 each
Certificate of origin (to avoid duty) 3.66 0.12 3.66 0.52 Zambia charges 15% duty on imported rice
CD-1 processing fee 12.20 0.41 12.20 1.74 MWK 5,000 per invoice
Clearing agent (customs entry) 100.00 3.33 75.00 10.71 About USD 75 to 100 depending on agent and load size
Total cost to exit Malawi 125.61 4.19 100.61 14.37 Total excluding cost of obtaining certificates
Costs to Enter ZambiaImport permit 8.82 0.29 2.06 0.29 USD 150 for 510 tons (valid 30 days, assume use all)
ZABS quality analysis - - - - Not required for rice (would be for maize)
ASYCUDA fee 10.00 0.33 10.00 1.43 Fixed cost per customs entry
Insurance card 40.00 1.33 40.00 5.71 Quoted price
Carbon tax 37.74 1.26 28.30 4.04 ZMW 200 large truck, ZMW 150 medium truck
Clearing agent 100.00 3.33 75.00 10.71 Typically USD 50 to 100 depending on agent
Total cost to enter Zambia 196.56 6.55 155.36 22.19 Total excluding cost of obtaining certificates
TOTAL FEES FOR FORMAL CROSSING 322.17 10.74 255.97 36.57
As % of Malawi minimum farmgate price 2.4% 8.2% MWK 110/kg paddy (USD 447/ton @ 60% milling outturn)
As % Lusaka wholesale 1.8% 6.1% USD 600/ton cif for aromatic variety
Plus estimated cost of acquiring Malawi permits
Export permit 46.90 1.56 46.90 6.70 10lt fuel to/from Capitol Hill + 2 days staff and phone
Phyto/fumigation/Non-GMO certificate 107.61 3.59 107.61 3.59 40lt fuel to/from NPPO and site + staff time and phone
Certificate of origin 31.90 1.06 31.90 1.06 10lt fuel to/from Chamber + 1 days staff and phone
Total estimated costs 186.41 6.21 186.41 11.35
TOTAL INCLUDING COST OF ACQUIRING MALAWI PERMITS
Total fees plus costs of acquisition 508.58 16.95 442.39 63.20 Excludes time/fuel for acquiring Zambia import permit
As % of Malawi minimum farmgate price 3.8% 14.2% MWK 110/kg paddy (USD 447/ton @ 60% milling outturn)
As % Lusaka wholesale 2.8% 10.5% USD 600/ton coif for aromatic variety
30-ton Truck 7-ton Truck Notes

100
management, the practical reality is that exporters must send staff to Lilongwe to facilitate the
process of getting an export permit through MoAFS and MIT for the procedures to be completed
in a timely manner. Exporters must likewise travel to the nearest Plant Health Inspection Office
and take an inspector to where the product is stored in order to receive a phytosanitary
certificate. They must also visit the Chamber of Commerce to get a Certificate of Origin. On a
per ton basis, the total costs of trade are therefore estimated to equal 3.8% of the minimum farm
gate price for a large 30-ton load and 14.2% of the minimum farm gate price for a 7-ton load.
308. To improve conditions for small traders, COMESA launched a Simplified Trade
Regime (STR) for traders handling goods valued less than USD 1,000. Under the STR they
are able to obtain a Simplified Certificate of Origin at the border to avoid paying import duty and
use a Simplified Customs Form to avoid using a clearing agent. In this regard, Table 32 shows
the costs of exporting a small 2-ton load of rice through the formal channel with and without the
COMESA STR. Based on an FOB value of around USD 470, two tons is about the maximum
that can be carried under the STR’s ceiling of USD 1,000 per load.
309. The COMESA STR provides a considerable amount of savings. By not having to use
a licensed clearing agent, a small trader is able to save approximately USD 150 in total costs or
USD 75 per ton for a 2-ton load. The trader is also able to save on the costs of a Certificate of
Origin including USD 3.66 for the certificate itself and an estimated USD 12.44 for bus fare and
other expenses associated with visiting the Chamber of Commerce.
310. Nevertheless, even with the STR (see Table 32) small traders still pay a very high
price to follow all legal procedures at an estimated USD 67.18 per ton or 15.1% of the
minimum farm gate price and 6% of the Lusaka wholesale price just to cross the border.
Because of poor economies of scale, these costs are USD 3.98/ton higher than the amount paid
by a medium scale (7-ton) trader and USD 50.23/ton more than the amount paid by a large (30-
ton) trader. Moreover, to use the formal route, small traders must be formally registered as an
exporter, have a valid taxpayer identification number, and bank account. For these reasons,
Customs officials at the Mwami/Mchinji border say that most small traders prefer to use the
“bush route” where they can avoid formal sector trade requirements completely. Currently there
are fewer than 20 STR transactions per month at Mwami/Mchinji and almost none in agriculture.
311. High trade costs and harassment encourage small cross border traders to avoid the
formal border crossings. The Cross Border Traders Association of Malawi (CBTAM) believes
that the majority of informal traders actively avoid the formal border crossing as many members
(of whom 80 per cent are women) complain of harassment and humiliation ranging from
overvaluation of the goods, delays, bad language and physical abuse. Obtaining the required
permits from Lilongwe can represent a prohibitive cost, yet in the case of agricultural products
these are required for all traders irrespective of size apply even when the product can benefit
from the Simplified Trade Regime (STR). The CBTAM also reported allegations of sexual
harassment including rape and cited cases of some women providing ‘favors’ to officials to

101
ensure smooth clearance of goods. As a result of these high personal, monetary, travel, and time
related costs, traders prefer crossing the border informally.
312. Acknowledging that many traders were not aware, or did not understand, the
prerequisites for using the STR, COMESA trade desk officers have recently been posted to
the border crossing where they explain the STR and provide assistance with completing the
forms. While this represents an important first step, initiatives to improve the STR will also have
to address issues related to harassment and costs related to obtaining permits. As a first step, it
would be important to publicize all relevant information on key products for traders in local
languages, including a description in simple terms of all documentary requirements, applicable
fees and charges, and how they should be computed in simple terms. Publicizing these
requirements should also include the description of basic rights and obligations that both traders
and border officials have to comply with, and establish an impartial and anonymous mechanism
for complaint. These activities are outlined in the Charter for Cross-Border Trade whose
principles were discussed by the AU Trade Ministers in Ghana in 2011. Complementing
improvements of the STR with the implementation of this charter could reduce discrimination
and harassment at borders, increase mutual trust between traders and border officials and lead to
more formal trade transactions, also by small traders.
Table 32 Cost of Formal Rice Exports to Zambia at Mchinji (2t – with(out) using COMESA STR)
USD/truck USD/ton USD/truck USD/ton
Costs to Exit Malawi
Export permit (free) - - - - Free, but takes 4-6 weeks w/o constant follow-up
Phytosanitary/fumigation certificate 1.22 0.61 1.22 0.61 MWK 500 each
Non-GMO certificate 8.54 4.27 8.54 4.27 MWK 3,500 each
Certificate of origin (to avoid duty) 3.66 1.83 - - Zambia charges 15% duty on imported rice
CD-1 processing fee 12.20 6.10 12.20 6.10 MWK 5,000 per invoice
Clearing agent (customs entry) 75.00 37.50 - - About USD 75 to 100 depending on agent and load size
Total cost to exit Malawi 100.61 50.30 21.95 10.98 Total excluding cost of obtaining certificates
Costs to Enter ZambiaImport permit 15.00 7.50 15.00 7.50 USD150 for 510 tons (valid 30 days, assume use 10 tons)
ZABS quality analysis - - - - Not required for rice (would be for maize)
ASYCUDA fee 10.00 5.00 10.00 5.00 Fixed cost per customs entry
Insurance card 40.00 20.00 40.00 20.00 Quoted price
Carbon tax 18.87 9.43 18.87 9.43 ZMW 100 for small truck
Clearing agent 75.00 37.50 - - Typically USD 50 to 100 depending on agent
Total cost to enter Zambia 158.87 41.93 83.87 41.93 Total excluding cost of obtaining certificates
TOTAL FEES FOR FORMAL CROSSING 259.48 92.24 105.82 52.91
As % of Malawi minimum farmgate price 20.7% 11.9% MWK 110/kg paddy (USD 447/ton @ 60% milling outturn)
As % Lusaka wholesale 15.4% 8.8% USD 600/ton cif for aromatic variety
Plus estimated cost of acquiring Malawi permits
Export permit 12.44 6.22 12.44 6.22 Bus to/from Capitol Hill + time and phone
Phyto/fumigation/Non-GMO certificate 16.10 8.05 16.10 8.05 Bus to/from NPPO + time and phone
Certificate of origin 12.44 6.22 - - Bus to/from Chamber + time and phone
TOTAL INCLUDING COST OF ACQUIRING MALAWI PERMITS
Total fees plus costs of acquisition 300.45 150.23 134.36 67.18 Excludes time/fuel for acquiring Zambia import permit
As % of Malawi minimum farmgate price 33.7% 15.1% MWK 110/kg paddy (USD 447/ton @ 60% milling outturn)
As % Lusaka wholesale 25.0% 11.2% USD 600/ton coif for aromatic variety
2-tons w/o STR 2-tons w/ STR Notes

102
313. Gender issues must be integrated into all initiatives aimed at reducing formal trade
costs and facilitating cross border trade. Given the dominance of women in informal trade, it
will be particularly important that trade facilitation interventions specifically target women.
Explicitly identifying the constraints faced by women will enable more accurate interventions to
reduce harassment and trade costs and promises to have a direct positive impact on reducing
poverty. Establishing a Charter for Cross-Border Trade would be an important step forward in
this regard. This would ensure that initiatives to improve overall border management will also
benefit small traders, particularly women who represent the majority of traders.
Costs of Importing Maize Meal
314. The second case study example looks at the costs of importing maize meal from
Zambia. These costs are summarized in Table 33 for a full size (30-ton) load and medium size
(7-ton) load. As shown, traders must obtain the usual range of Zambian trade certificates
including an export permit, phytosanitary certificate, and non-GMO certificate. Exporters of
maize meal must also have a COMESA or SADC Certificate of Origin to avoid paying Malawi’s
15% import duty (maize grain would not attract import duty, but milled flour does). In this
example, the costs of obtaining Zambian trade certificates are not included in the calculations but
as in Malawi, these costs can be quite high. For example, even though Malawi does not require
laboratory analysis, Zambia demands that all maize exports be physically tested to confirm their
non-GMO status at a minimum cost of around USD 5/ton for a 30-ton load. On the Malawi side
of the border, traders must show a Malawi import permit, Zambia phytosanitary certificate
including proof of fumigation, and Zambia non-GMO certificate. Malawi importers must also
make special application for hard currency and use a special form (Customs Form 12) to show
that the consignment entered Malawi so that the importer’s bank can remit foreign exchange to
the supplier.
315. The fees charged by the importing country (in this case, Malawi) are higher than the
ones charged by the exporter (i.e. Zambia). The main reason in this case is that all importers to
Malawi must pay for mandatory standards inspection by the Malawi Bureau of Standards (MBS).
As discussed in the section on trade management, MBS requires of 226 different categories of
product to be tested upon entry to Malawi regardless of whether the consignment has already
been approved by a foreign standards bureau. Charges vary depending on the product and
materials used for the test, but for maize and maize meal the fee includes a base charge of MWK
15,416 (USD 110) per consignment plus 0.65% of the FOB value for certification. The cost of
sending a pre-shipment sample to MBS is separate and works out to around USD 100-150 per
shipment. At this level, Malawi’s charge is somewhat lower than the fees imposed by the Zambia
Bureau of Standards (ZABS) for analysis of maize meal where the base charge is USD 281.75
(MWK 115,502) plus 0.5% of fob value. ZABS, however, requires domestic analysis of
relatively few agriculture goods compared with Malawi where most every kind of import is
subject to mandatory analysis regardless of the consignment’s size or value. MBS reports that it

103
takes a minimum of 14 days to complete the tests and advises importers to send a pre-shipment
sample as far in advance as possible to avoid delays at the border.
Table 33 Cost of Formal Maize Meal Imports from Zambia at Mchinji (30t and 7t truck)
316. The analysis of the costs to import maize meal shows that formal sector trade costs
are highly regressive whereby small traders using a 7-ton truck pay 259% more per ton
than large traders do using a full-size 30-ton truck. These high costs, together with the time
and expense of compiling all of the required documents, are a large part of what drives many
traders to use the informal route where legal charges can be avoided.
317. Because most fees relating to border crossing are paid as fixed amounts per
crossing, the per ton costs of crossing the border increase as the value of the transaction
decreases. Smaller traders have to divide these fixed costs over smaller quantities. Unlike rice
exports to Zambia for which ZABS analysis is not required, the Malawi Bureau of Standards also
imposes mandatory analysis of maize meal even when shipped in very small consignments,
generating significant costs. For example, minimum IQMS fees of MK 15,000 would represent
3.75 percent of the value of a 1000 USD shipment of maize.
318. The STR would facilitate transactions and reduce costs, but the common list of
products that can benefit from the STR between Zambia and Malawi is extremely limited.
For products on the common list, traders could obtain a certificate of origin, and would not have
to use clearing agents, reducing their costs significantly. But maize meal, for example, is not part
of the common list of products despite the fact that maize meal is a major commodity that is
widely carried by small traders.
319. During a workshop in November 2013 in Chipata, Zambia, customs officials and
traders from Malawi and Zambia discussed key recommendations to make the STR more
USD/truck USD/ton USD/truck USD/ton
Costs to exit Zambia
Export permit for maize or mealie meal 8.76 0.29 5.32 0.76 USD 150 for 510 tons (valid 30 days)
Phytosanitary certificate 3.13 0.10 3.13 0.45 USD 62.50 for book of 20 (1 per truck)
Non-GMO certificate 30.00 1.00 30.00 4.29 Needed for Zambia permits, not required by DRC
Certificate of origin (to avoid duty) 9.43 0.31 9.43 1.35 Not req for maize grain (0% duty); 15% on flour
ASYCUDA fee 10.00 0.33 10.00 1.43 Fixed cost per customs entry
Clearing agent 100.00 3.33 75.00 10.71 Typically USD 50 to 100 depending on agent
Total cost to exit Zambia 161.33 5.38 132.89 18.98
Costs to enter Malwi
Import permit (free) - - - - Free, but takes 4-6 weeks
Customs Form 12 (MWK 5,000 per invoice) 35.71 1.19 35.71 5.10 Needed for bank to pay forex to foreign supplier
Fumigation certificate (from Zambia) 50.00 1.67 11.69 1.67 About USD 50 per 30/ton truck
Malawi Bureau of Standards 160.70 5.36 121.83 17.40 MWK15,416 (USD110) + 0.65% of fob (ex air freight)
Insurance card 40.00 1.33 40.00 5.71 Quoted price
Clearing agent (customs entry) 75.00 2.50 75.00 10.71 Typically USD 50 to 100 depending on agent
Total cost to enter Malawi 361.41 12.05 284.23 40.60
TOTAL COSTS OF FORMAL CROSSING 522.74 17.42 417.12 59.59
As % of Zambia farmgate price 7% 23% USD 260/ton paid by Food Reserve Agency
As % Lilongwe wholesale 3% 12% USD 500/ton quoted price for maize meal
30-ton Truck 7-ton Truck Notes

104
effective.27
Traders expressed a need to expand the list of products during the workshop, and
other recommendations developed by all participants called for eliminating and adjusting certain
taxes and fees to reduce costs, increasing the threshold for transactions, and making information
regarding the STR more easily available to traders and customs officials. There were also calls
for piloting a “Traders’ Charter” which would outline rights and responsibilities of traders and
border officials, and putting in place a mechanisms to facilitate reporting of abuse. Participants
felt that implementing these measures would bring more informal traders into the formal system.
Following similar thinking, the Malawi government already announced (in June) in the 2013
budget speech, that the processing fee for small traders under the STR would be reduced to USD
1 as agreed at COMESA level, but that policy is yet to be implemented and traders continue to
pay MK 5,000 per transaction.
Opportunities for Enhanced Trade Competitiveness
320. The DTIS Update shows that agriculture importers and exporters face uncertain
conditions and high costs that undermine Malawi’s trade competitiveness and militate
against the opportunities for economic diversification. These problems not only arise within
Malawi itself, but also occur in neighboring markets. Strengthening of Malawi’s trade
performance therefore depends on carefully planned domestic policy reforms and focused
dialogue with regional trade partners.
Transparent Rules and Market Driven Pricing
321. Establishing transparent trade rules and market driven pricing are essential for
advancing agriculture growth and diversification. There needs to be a firm commitment to
keeping Malawi’s borders open to agriculture imports and exports. The risk of trade restrictions
or even outright trade bans together with price distortions caused by reliance on centrally
determined minimum farmgate prices deters private investment and contributes directly to
problems with volatile production and lack of competitiveness.
322. Achieving domestic food security, fair prices, and export growth are not mutually
exclusive or even opposing objectives and would be complementary in an improved policy
environment. With a firm, clear, and reliable commitment to keeping Malawi’s borders open to
agriculture exports together with reliance on market driven pricing, there would be strong
incentives for estates and other commercially minded smallholder farmers to expand production
of food crops and invest in new technologies needed to produce reliable surpluses.
323. A specific strategy would be for government to guarantee export permits for a
certain percentage of private maize and rice purchases while the remainder is held in
reserve for domestic use until the overall food balance is known. Such a policy would enable
forward contracting by agriculture marketing companies at regional export parity prices and
27 For more information on the detailed discussions and recommendations, please refer to the workshop report in World Bank (2013).
105
provide a strong incentive for large and small estates and even individual smallholder farmers to
grow food they would not otherwise produce to the benefit of Malawi’s export development and
national food security overall.
324. Improved information on which goods are allowed for trade, which ones are not,
and what restrictions apply would assist with minimizing trade costs and helping sector
participants cope better with the risk of trade bans. Case-by-case review of import and export
applications for virtually every kind of agriculture commodity including products without any
food security implications such as tea, cotton, and tobacco are unnecessary. Even for major food
crops, there is little reason for MoAFS and MIT to review each and every trade application. As a
priority for improved trade performance, Malawi needs to introduce a more transparent and
streamlined framework that clearly states whether importing and exporting specific commodities
is allowed and eliminates the unnecessary time and expense of the current system for both
private sector and government workers.
325. Information on which commodities are allowed for trade could easily be
disseminated through the internet using an official website. The possibility of setting up a
regional website to communicate what trade rules apply and when trade bans or other trade
restrictions are put in place and when they are lifted would be a good area for immediate
dialogue with Malawi’s partners in APEI.
326. A longer-term objective should be to make implementation of trade bans or other
restrictions much more predictable. This may be difficult to achieve, but efforts to agree a set
of verifiable conditions under which Malawi and other regional governments could exercise their
discretion to implement different kinds of trade restrictions would be a good area for regional
dialogue, especially if such a system were geared to provide an early warning of when these
measures might be put in place. The USAID project, FEWS NET has done extensive work in
Africa to develop systems for predicting food shortages that could be a practical starting point
for such a system.
327. Launching an SMS-based price information system would significantly improve
market transparency to the benefit of smallholder farmers and traders. This would replace
the GOM’s outdated approach of relying on centrally determined minimum farmgate prices.
SMS-based information systems have been used extensively in other countries to provide small
farmers real time price information for different commodities and market locations. Cell phone
access is increasing in rural Malawi and GOM could solicit international technical and financial
support to develop a price system to provide farmers the type of transparent, market-driven
information they need to make good business decisions.
Streamlining of Trade Procedures
328. Many duplicate and overlapping procedures exist which add to the costs of trade
and undermine Malawi’s export competitiveness. While economies of scale are natural and to
be expected, the worst effect of these policies are felt by small-scale traders for whom the

106
charges are significantly higher on a per ton basis. As illustrated by the case study analysis of
trade costs at Mwami/Mchinji, the requirement for all importers to submit a sample of their
goods for MBS testing negates the benefits of the COMESA STR and leaves small traders little
practical choice other than to engage in informal trade outside the legal system.
329. Promoting dialogue at the national and regional levels on opportunities to eliminate
unnecessary trade procedures will build consensus for reform. In addition to eliminating
trade permits for all types of imported and exported commodities, streamlining the procedures
for standards certification through mutual recognition of other countries’ standards marks would
be a major improvement. As noted earlier eliminating the redundant testing of agricultural
imports when the product has already been certified in another countries would reduce costs.
330. Fees, standards, or other trade requirements need to match actual buyer
requirements and supplier capabilities. Malawi has no use for advanced regulations that
cannot be enforced or that do not serve genuine commercial and/or public health interests.
Malawi’s trade negotiators need to pay careful attention to these issues and avoid agreeing to
unnecessary standards, testing procedures, and other trade requirements that its producers cannot
easily meet or that its consumers cannot afford in regional trade negotiations. A focus on mutual
recognition and equivalence rather than negotiating to harmonize requirements is likely to be
more productive in minimizing the trade effects of technical regulations.28
Regional Trade of Inputs
331. There is considerable scope for Malawi and neighboring countries to streamline the
trade of crop inputs (seeds, pesticides and fertilizer) through mutual acceptance of other
countries’ registered products and quality test results. Agriculture production and trade
competitiveness begin with the inputs farmers use. Breaking down the barriers to regional trade
of seed and fertilizer would not only be a good strategy for increasing rural incomes and
improved food security, but could also provide the Malawi Government significant savings on
the cost of FISP subsidies.
332. Permitting different blends of fertilizer to be traded freely within the region
(SADC/COMESA) would lower costs and promote increased production. At present,
regional exporters face problems moving different blends across borders that do not correspond
with each country’s national specifications and have to submit samples for laboratory analysis in
each destination market. Details of a regional free trade system for fertilizer would need to be
worked out, but the like the SADC Regulatory System for Seed, the idea of such an approach
would be to (i) permit free entry of fertilizer between members; (ii) provide for acceptance of
fertilizer compounds that have been approved by another member; and (iii) allow shipments of
fertilizer inspected by another member. Harmonized regional policies for fertilizer would reduce
transaction costs, and the resulting (larger) regional market could be of considerable commercial
interest to blending companies in Malawi.
28 See Keyser, 2012 for a fuller discussion of the risks of harmonization and potential benefits of alternative approaches.

107
Improved Systems for Aflatoxin Control
333. Aflatoxin management and control is important for Malawi. Despite this constraint,
relatively little attention has been given by the Plant Health Office to aflatoxin control. This
might include promoting platform testing of aflatoxin sensitive crops at the first point of sale and
other critical control points by ADMARC, NASFAM, and others, together with training of
farmers and handling agents in simple storage methods to minimize the risk of aflatoxin.
Laboratory facilities at Chitedze do not address Malawi’s underlying aflatoxin problem and will
have limited impact unless matched with improved systems along the value chain.
334. The Ministry of Trade with support from USAID also identified aflotoxin control
for groundnuts as one of the key areas for SPS capacity building.29
Following that work, the
WTO’s Standards and Trade Development Facility (STDF) provided funding to the MIT to take
stock of existing government and donor supported initiatives to address aflatoxin contamination,
address outstanding gaps and priorities, and promote effective coordination and synergies
between the various stakeholders. This is a welcome development and supports the
recommendation of introducing effective controls for managing aflatoxin.30
Summary Recommendations
335. Improving the agricultural trade environment requires a number of critical
reforms. First, the government should eliminate the risk of trade bans or other forms of export
restrictions. It should also abolish the use of statutory minimum prices for selected products and
reduce the number of mandatory standards inspections to those essential for public health, safety
and the environment. To improve the access to agricultural inputs, it will be key to streamline
procedures to ensure the fast track registration of new seed types and remove import restrictions
on fertilizer to enabling farmers access a wider range of fertilizers. To support the export of
agricultural products, the government should also work towards introducing effective controls
for managing aflatoxin. Last, to reduce biases against small traders and improve the functioning
of the Simplified Trade Regime, the government should review existing fees and documentary
requirements conjointly with the Zambian government. It should then remove selected fees,
expand the common list of products covered, and implement the decision taken in June 2013 to
reduce the transaction costs for small to traders to USD 1. These recommendations relating to the
STR were strongly endorsed by local traders and government officials who participated in a pre-
validation workshop of the Zambia and Malawi DTIS in Chipata, Zambia in November 2013.
29The Multi-Criteria Decision Analysis (MCDA) tool was applied in Malawi, identifying four priorities:
http://www.standardsfacility.org/Files/EconAnalysis/Countries/MCDA%20Malawi%20final%20report%2017%20July%202012.pdf 30http://www.standardsfacility.org/Files/Project_documents/Project_Preparation_Grants/STDF_PPG_400_FinalReport_Sep-13.pdf

108
Chapter 6. Trade and Regulatory Polices: Professional Services
336. Services matter for Malawi’s growth and diversification. Malawi’s heavy reliance on
a few agricultural commodities and limited ability to deal with exogenous shocks resulted in
volatile government revenues and unstable expenditures. Services sectors can help diversify
Malawi’s highly concentrated trade away from agricultural commodity dependence. Given that
services provide the inputs to many other economic activities, they can also have significant
positive spillover effects throughout the economy and contribute to poverty reduction. Owing to
limited resources the DTIS has focused on professional services which have been largely
neglected to date in discussions on the trade in services agenda.
337. The tourism sector remains a key export sector for Malawi, but challenges remain
which are mostly not trade-related. Although it has grown significantly and contributed 5.8
per cent of Malawi’s GDP in 2008 (representing a higher contribution to GDP than in other SSA
countries), export potential remains for the travel and tourism sector. Key constraints identified
in a recent World Bank report31
related to missing skills, limited linkage with the domestic
economy, marketing, lack of attention to cultural sites and events, but also infrastructure related
challenges (roads, energy) and poor air access. The report recommended improving overall
competitiveness, improving the availability of skilled workers, improving overall investment
policies, and more effective marketing. The cross-cutting recommendations of this DTIS confirm
this. Recommendations to improve air connectivity and promote overall competitiveness are
confirmed as central recommendations to improve the overall trading environment.
Recommendations regarding professional services would also directly contribute to improving
the quantity and quality of trained supervisors and managers. Given extensive recent work and
the establishment of a Tourism master plan, it was agreed that this DTIS would not look at the
tourism sector in greater detail.
338. The expansion of infrastructure as well as higher-value knowledge-intensive services
can bring significant economic and social benefits to the country. For example, while the
agricultural sector is viewed as an important engine of trade growth, it has remained far below its
potential. To increase agriculture production the productivity of farms will have to improve. That
means better transport infrastructure, agricultural technology and support services. Opening up to
services imports and foreign direct investment (FDI) can be an effective mechanism to increase
the availability, affordability and quality of these services, and enhance productivity and increase
technology and skills transfers. In addition, services offer dynamic new opportunities for exports.
Exports of services are of particular importance for land-locked countries like Malawi for which
opportunities to diversify into the export of manufactures is more limited by the high costs of
transporting goods.
339. The GOM recognizes the importance of services for the economy. In the past,
services were rather neglected as a potential source for growth and export diversification. For
31 World Bank (2010), Malawi Travel and Tourism – Realizing the Potential, World Bank Report No. 62353-MW

109
example, the 2004 DTIS Action Matrix focused almost exclusively on trade in goods. However,
several recent strategic documents highlight the need to improve the performance of services and
the need to open them up to imports and foreign direct investment and in regional initiative the
GOM has identified priority services sectors for trade negotiations. For example, as part of the
COMESA services negotiations, transport, communication, financial and tourism services have
been identified as top priority sectors for deeper integration with neighboring countries with
business, construction and related engineering and energy services to follow in the next phase.
340. To guide and support the government’s services reform, the DTIS Update provides
an assessment of Malawi’s services sectors. Particular emphasis is put on professional services
as a priority identified by both Government and the NIU.
Malawi’s main services trade developments and challenges
341. During the last decade, the services sector has increased its share to more than 50%
of GDP. This positive development is, however, not reflected in Malawi’s services trade
performance. In fact, the scatter diagram that plots the country‘s overall services openness
measured as the percentage of cross-border services trade in GDP against its per capita income,
shows that the 2003/05 and 2009/11 ratios of services trade-to-GDP for Malawi were both below
the benchmark for a country at its level of economic development. In addition, the ratio
deteriorated by 2011, indicating that Malawi’s poor services trade performance has worsened
over the examined period (Figure 17). Moreover, cross-border services exports and imports
remain a small part of Malawi’s total trade with shares of 5 and 8 percent of total trade
respectively (Figure 18).
Figure 17 Malawi’s adjusted trade openness in services
Source: WDI 2013.

110
Figure 18 Structure of goods and services trade (%), Malawi and comparators 2011
Source: IMF BOP 2013.
Figure 19 Value of goods and services trade, Malawi and comparators 2011
Source: IMF BOP 2013.
Figure 20 Growth rates of services trade, Malawi and comparators
Source: IMF BOP 2013.
0%20%40%60%80%
100%M
alaw
i
Mau
riti
us
Mo
zam
biq
ue
Seyc
hel
les
Zam
bia
Mal
awi
Mau
riti
us
Mo
zam
biq
ue
Seyc
hel
les
Zam
bia
Exports Imports
Structure of goods and services trade (2011)
Services (%)
Goods (%)
- 2,000 4,000 6,000 8,000
Mal
awi
Mau
riti
us
Mo
zam
biq
ue
Seyc
hel
les
Zam
bia
Mal
awi
Mau
riti
us
Mo
zam
biq
ue
Seyc
hel
les
Zam
bia
Exports Imports
Value of goods and services trade (2011)
Services
Goods
(USD millions)
14% 12% 9% 8% 6%
14% 14% 11%
8%
0%
Zam
bia
Mau
riti
us
Mo
zam
biq
ue
Seyc
hel
les
Mal
awi
Mau
riti
us
Zam
bia
Mo
zam
biq
ue
Seyc
hel
les
Mal
awi
Exports Imports
CAGR of services trade (2002-2011)

111
Table 34 Malawi’s trade in services, 2011
USD millions (and % of total) Exports Imports
Commercial services 75 (92%) 199 (89%)
Transport 27 (33%) 79 (35%)
Travel 34 (41%) 66 (29%)
Other services 21 (26%) 79 (35%)
Government services 7(8%) 25 (11%)
Total 82 (100%) 224 (100%)
Commercial services CAGR (2002-2011) 6% 0.1%
Source: Calculations based on IMF BOP 2013
342. Malawi remains a modest regional player in terms of services trade with exports of
about 82 million USD and imports of 224 million USD (Figure 19). Both exports and imports
of services have grown very modestly during the last decade, with average growth rates
significantly lower than those recorded by neighboring countries (Figure 20).
343. Malawi’s services trade is composed primarily of transportation and travel services.
In 2011, travel accounted for more than 40 per cent of total services exports, followed by
transportation services with 33 per cent. Other service sectors such as construction,
communications, insurance, and finance, combined, accounted for about 26 per cent of Malawi’s
total services exports and 35 per cent of Malawi’s total services imports (Table 34).
Figure 21 Composition of services trade (%), Malawi and comparators 2011
Source: Calculations based on IMF BOP 2013
344. Furthermore, Malawi has so far not managed to diversify its services exports
(Figure 21). This is in contrast with other neighboring countries where exports of both
traditional (e.g. travel and transport) and non-traditional (e.g. other services such as
communication, financial and business services) services sectors are beginning to emerge.
Together with Malawi, Mauritius, Mozambique, Seychelles, and Zambia aim to accelerate
0%20%40%60%80%
100%
Mal
awi
Mau
riti
us
Mo
zam
biq
ue
Seyc
hel
les
Zam
bia
Mal
awi
Mau
riti
us
Mo
zam
biq
ue
Seyc
hel
les
Zam
bia
Exports Imports
Composition of services trade (2011)
Other
Travel
Transport

112
reforms aimed at removing barriers to trade in services as part of the Accelerated Program for
Economic Integration (APEI).
345. Foreign direct investments (FDI) to Malawi did not register improvements over the
last five years (Figure 22). FDI inflows per capita are still lower in Malawi than in other APEI
countries. Malawi’s capacity to attract FDI is undermined by numerous factors, including its
poor business environment, high trade costs and small market size.
Figure 22 FDI in Malawi and comparators, 2006-2011
Source: UNCTAD, FDI Online Database (March 2013) and World investment Report 2012.
346. Malawi’s services are underdeveloped with performance indicators well below the
Sub-Saharan average. For example, compared to many of its African neighbors, Malawi is
characterized by a lower number of fixed and mobile phone subscribers, lower number of firms
with lines of credit or loans from financial institutions, higher number of power outages in a
typical month, and higher delays in obtaining an electrical connection (Table 36). This suggests
that Malawi does not have a robust supplier base from which to draw high quality services
inputs, and translates into an important competitive disadvantage given that services are essential
inputs for most economic activities.
347. Trade agreements can play an important role in delivering a wider variety of lower
cost services to consumers in Malawi by locking in reforms and stimulating greater flows of
foreign direct investment in services. The establishment of regional markets such as
COMESA, SADC or APEI offers new opportunities in terms of trade in services and FDI,
conditional on the continuation of liberalization and privatization processes and of investment
climate reforms. The increased size of the regional market and the increased FDI would be a
major asset to facilitate export diversification.
0
500
1000
1500
2000
2500
2006 2007 2008 2009 2010 2011
FDI in APEI (current USD million)
Malawi
Mauritius
Mozambique
Seychelles
Zambia

113
Table 35 performance indicators for selected services sectors
Indicator Malawi Mauritius Mozambique Seychelles Zambia
Financial services
Financial market development
index
(1-7: lowest - highest)1
3.38 4.35 3.17 4.10 3.80
Domestic credit to private sector (%
GDP)2
38.00 110.04 24.96 45.77 18.05
Account at a formal financial
institution
(% age 15+)3
16.54 80.12 39.90 n/a 21.36
Accounts per 1,000 adults at4:
- commercial banks 163.44 2,109.04 140.50 n/a 27.59
- cooperatives and credit unions 12.13 n/a
- microfinance institutions n/a 0.17
Branches per 100,000 adults of4:
2.16 20.11 2.89
n/a
3.64
- commercial bank
- cooperatives and credit unions n/a n/a 0.10 n/a n/a
- microfinance institutions n/a n/a 0.30 n/a 1.56
Loan from a financial institution in
the past year (% age 15+)3
9.19 14.27 5.87 n/a 6.13
Saved at a financial institution in
the past year (% age 15+)3
8.24 30.83 17.46 n/a 11.77
Debit card (% age 15+)3 9.36 50.94 37.35 n/a 15.69
ATMs per 100,000 adults / per
1,000 sq.km.4
1.23 0.21 6.45 n/a 10.96
Telecommunication services
Fixed and mobile cellular
subscriptions (per 100 people)2
27 128 33 178 61
Internet users (per 100 people)2 3.33 34.95 4.3 43.16 11.5
Source: 1WEF Global Competitiveness Index 2013;
2World Bank WDI (2011 data);
3 World Bank Global Findex
(2011 data) ; 4 CGAP Branchless Banking Database (2011 data)
348. Malawi is currently participating in several regional negotiations on trade in
services. A 2008 World Bank survey of applied trade policies in five services sectors - financial
services (banking and insurance), telecommunications, retail distribution, transport and
professional services in over 80 countries shows that Malawi’s overall restrictiveness index of
applied services policies (explicit market access and national treatment barriers plus selected
discriminatory regulatory measures) is moderate and slightly below the COMESA average
(Figure 23). The most protected sectors seem to be telecommunication and professional services
(Figure 24).
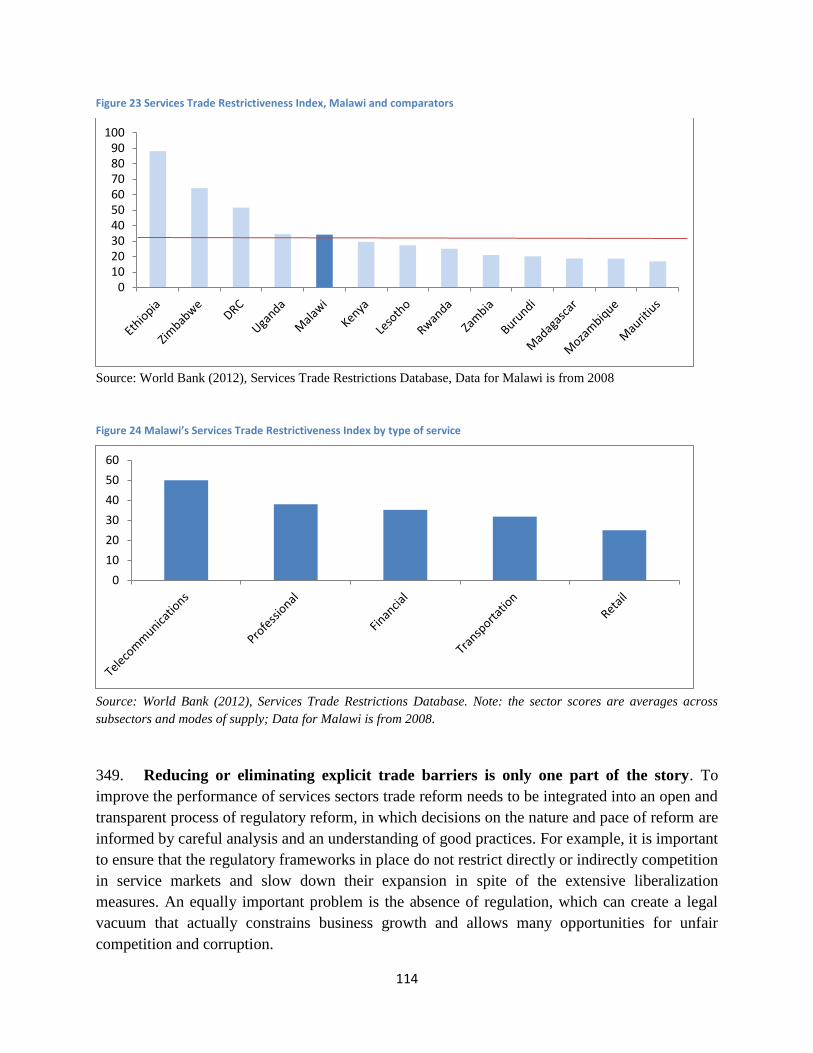
114
Figure 23 Services Trade Restrictiveness Index, Malawi and comparators
Source: World Bank (2012), Services Trade Restrictions Database, Data for Malawi is from 2008
Figure 24 Malawi’s Services Trade Restrictiveness Index by type of service
Source: World Bank (2012), Services Trade Restrictions Database. Note: the sector scores are averages across
subsectors and modes of supply; Data for Malawi is from 2008.
349. Reducing or eliminating explicit trade barriers is only one part of the story. To
improve the performance of services sectors trade reform needs to be integrated into an open and
transparent process of regulatory reform, in which decisions on the nature and pace of reform are
informed by careful analysis and an understanding of good practices. For example, it is important
to ensure that the regulatory frameworks in place do not restrict directly or indirectly competition
in service markets and slow down their expansion in spite of the extensive liberalization
measures. An equally important problem is the absence of regulation, which can create a legal
vacuum that actually constrains business growth and allows many opportunities for unfair
competition and corruption.
0102030405060708090
100
0
10
20
30
40
50
60

115
350. Thus, a key challenge of services reforms relates to the coordination of regulatory
reform with liberalization. Indeed, coordinating regulatory reform with liberalization of trade
in services is the main recurring challenge raised by Malawian officials in several services talks.
Liberalizing services trade is typically more complex than liberalizing goods trade and can
require considerable technical capacity. The ability to implement such a reform process is
constrained by limited capacity within government and the private sector.
351. The analysis presents a diagnostics regarding the level of development and the
availability of professional services and services providers in Malawi. These sectors, selected
in consultation with the government, are important for the country’s growth, skills generation
and export diversification, and are priority sectors in the COMESA and APEI services
discussions. The analysis also identifies which policies explain the underdevelopment of
professional services in Malawi and the segmentation of these markets in Sub-Saharan Africa.
While the focus is on trade policies and domestic regulation, limiting the analysis to those areas
would only partially address the diagnosed problems. It is also important to analyze the
education challenges, in order to remedy the origin of the skills shortages and skills mismatches
in financial and professional services. Similarly, the general immigration restrictions have to be
analyzed to address the free movement of various professionals.
352. Particular attention is given to policy action at the regional level to illustrate how
Malawi can benefit from regional regulatory cooperation that can advance its domestic
services reforms and facilitate trade. For example, the report shows that the mutual
recognition of qualifications and licensing requirements in professional services can accelerate
the development of these services in Malawi and reduce the fragmentation of services markets in
Africa. Concrete technical assistance activities related to the implementation of this section’s
recommendations could be pursued also through as part of the on-going Accelerated Program for
Economic Integration which is being supported by the World Bank and other development
partners.
Professional services are essential for Malawi’s growth
353. High value, knowledge-intensive services such as professional services contribute
directly and indirectly to economic growth, including by lowering transactions costs and by
creating spill-overs of knowledge to other sectors. For example, engineering and IT services
are knowledge-intensive sectors essential to the productivity and sustainability of other economic
activities, including the oil sector. Civil engineering is critical for the development and
maintenance of a country’s physical infrastructure, while electrical engineering is important to
the operation of public networks such as utilities or commercial facilities and communication
systems (Cattaneo et al., 2010). IT –based services including application services (such as
application development and maintenance, system integration, IT infrastructure services, IT
consulting), or IT engineering services (such as manufacturing engineering and software product
development) also have an important impact on productivity and growth (World Bank, 2011).

116
Accountancy is critical for accountability, sound financial management, and good corporate
governance (Trolliet and Hegarty, 2003).
354. Firms using accounting, architectural, engineering and legal services — whether
externally outsourced or provided in-house — have higher average labor productivity than
firms without such professional services linkages. Based on data from the 2012/2013 World
Bank Survey of Users of Professional Services in Malawi, these results are in line with the
findings for most COMESA countries, but interestingly the productivity differential between
users and non-users seems more pronounced in Malawi (Figure 25).
Figure 25 Average Productivity of Users vs. Non-Users of Professional Services
Source: World Bank Surveys of professional services in COMESA, 2013
Figure 26 Usage of professional services in Malawi and COMESA, %
02000400060008000
1000012000140001600018000
Lab
or
Pro
du
ctiv
ity,
USD
Labor Productivity
non users
users
0
20
40
60
80
100
120
% o
f fi
rms
usi
ng
pro
fess
ion
al s
erv
ice
non users
internal & external
external
internal
117
Source: World Bank Surveys of professional services in COMESA, 2013
355. Demand for all examined professional services sectors is already important and is
expected to increase with economic growth in Malawi. A surprising finding of the business
surveys undertaken in Malawi is the relatively high level of demand reported by the surveyed
firms. For example, the results of the user surveys suggest that about 60% of the surveyed firms
use accounting services and almost 40 % of the interviewed firms use engineering services. By
contrast, demand is less important in architectural and legal services, and is significantly lower
than the COMESA average in the legal sector (Figure 26).
High demand for professional services in Malawi
356. While usage of professional services is higher among large firms, it is interesting to
note that micro- and small firms are also starting to use professional services (Figure 27).
357. Respondents to the World Bank Survey of Users of Professional services listed a
number of channels through which professional services affect their productivity and
performance. First, basic accounting services are important for most firms, including (formal)
SMEs and microenterprises. While many respondents indicated that they use accounting services
because of statutory requirements, they also name accounting services as useful for maintaining
and improving existing activities within enterprises and as helpful in accessing loans.
Accounting and audit services also help manage costs, expenses and income of the firm, disclose
the company's financial health, undertake future planning and comply with tax laws and
requirements. Engineering services help firms understand technological advancements and how
to use them effectively to construct, install, and maintain their machineries in normal operating
condition. Still, such knowledge intensive services remain largely neglected and their
development and export potential remains overlooked.
358. Across all examined professional services subsectors, micro and small firms are key
clients of professional service providers and play a more important role than in many
COMESA countries. The demand exists across the whole spectrum of professional services –
from simple basic services such as bookkeeping to auditing, tax advice and management
consulting in accountancy, from advice on domestic and international law, title transferring, and
court representation to representation before administrative agencies, tax advice, insolvency
practice, business advisory services, and advice on patent law in legal services, from engineering
consulting services, design and planning to tender and contract administration in engineering
services. These results, assessed by size and ownership profile of the main clients of professional
service providers as well as their main source of revenue, are in line with findings obtained for
other Sub-Saharan African countries.
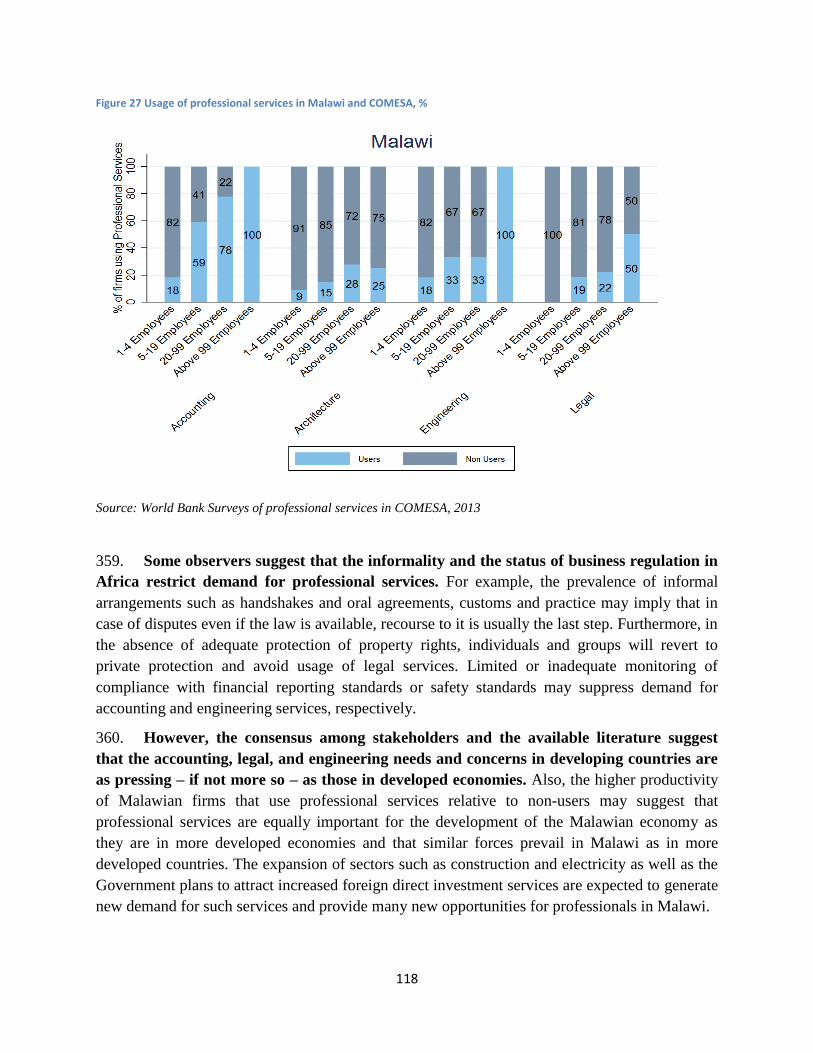
118
Figure 27 Usage of professional services in Malawi and COMESA, %
Source: World Bank Surveys of professional services in COMESA, 2013
359. Some observers suggest that the informality and the status of business regulation in
Africa restrict demand for professional services. For example, the prevalence of informal
arrangements such as handshakes and oral agreements, customs and practice may imply that in
case of disputes even if the law is available, recourse to it is usually the last step. Furthermore, in
the absence of adequate protection of property rights, individuals and groups will revert to
private protection and avoid usage of legal services. Limited or inadequate monitoring of
compliance with financial reporting standards or safety standards may suppress demand for
accounting and engineering services, respectively.
360. However, the consensus among stakeholders and the available literature suggest
that the accounting, legal, and engineering needs and concerns in developing countries are
as pressing – if not more so – as those in developed economies. Also, the higher productivity
of Malawian firms that use professional services relative to non-users may suggest that
professional services are equally important for the development of the Malawian economy as
they are in more developed economies and that similar forces prevail in Malawi as in more
developed countries. The expansion of sectors such as construction and electricity as well as the
Government plans to attract increased foreign direct investment services are expected to generate
new demand for such services and provide many new opportunities for professionals in Malawi.

119
The limited availability of professionals in Malawi
361. Malawi is facing an acute shortage of professionals and skills mismatches. Skills
shortages of both highly skilled and middle level professionals are observed across all examined
sectors in Malawi. Figure 28 and 29 present the density of accountants and lawyers per 100,000
inhabitants for Malawi and a sample of Sub-Saharan African countries. They reveal significant
variations in the availability of professionals, with relative scarcity in Burundi, Rwanda, Zambia,
Malawi, and Tanzania and relative abundance in Mauritius, South Africa, and Kenya.
Figure 28 Number of accountants per 100,000 inhabitants
Source: World Bank (2010); Niyongabo (2011) and OPC figures for Burundi, Chamkakala (2013) for Malawi
Figure 29 Figure 29 Number of lawyers per 100,000 inhabitants
Source: World Bank (2010); Niyongabo (2011) and OPC figures for Burundi, Chamkakala (2013) for Malawi
362. Relative to other countries in Sub-Saharan Africa, Malawi performs rather poorly
in terms of the availability of qualified accountants. In 2013, 607 chartered accountants and
auditors were members of the Society of Accountants in Malawi (SOCAM). Stakeholders note,
0.9
1.2
1.7
2.3
3.9
7.7
14
48
90.5
0 20 40 60 80 100
Rwanda
Zambia
Burundi
Uganda
Malawi
Tanzania
Kenya
South Africa
Mauritius
Number of accountants per 100,000 inhabitants
1.7 2 2.1
3.7 4.6
5.7 18.9
39.2 46.2
0 10 20 30 40 50
Burundi
Tanzania
Rwanda
Kenya
Mauritius

120
however, that it is possible that the actual number of accounting professionals is higher than the
607 SOCAM members since registration is mandatory only for accounting professionals engaged
in public practice. According to World Bank (2007) Report on the Observance of Standards and
Codes (ROSC) for Malawi, the country seems to have a shortage of locally produced accountants
as there is evidence of a significant presence of foreign accountants working in Malawi, often
they are brought to the country by foreign investors. The ROSC suggests that Malawi should
better market local accountants and local qualifications to the foreign investors.
363. Malawi is also poorly endowed with legal professionals relative to the other
countries in the sample. Malawi had 285 practicing lawyers in 2008, 2 of which were foreign
nationals. Note that the legal profession in Malawi operates a fused system whereby there is no
segregation between barristers, solicitors, attorneys, advocates, and notaries. Any registered
professional can operate in any of these forms. In Malawi, the availability of registered engineers
is dependent upon projects being undertaken in the country. Between 2000 and 2008, 40
engineering professionals were registered in Malawi. This figure suggests an acute scarcity of
engineers in the country.
364. The scarcity of professionals is confirmed by data on wages. Professionals in Malawi
receive higher or comparable nominal wages relative to their counterparts in other African
countries reflecting their scarcity relative to demand for their services (Figures 30 and 31).
Figure 30 Average gross monthly wage of accounting professionals (USD)
Source: World Bank Surveys of professional services in COMESA, 2013
1,442
668
453
1,098
733
417
-
200
400
600
800
1,000
1,200
1,400
1,600
Managers Senior professional Junior professional
Malawi Accountancy
COMESA Accountancy

121
Figure 31 Average gross monthly wages of engineering professionals (USD)
Source: World Bank Surveys of professional services in COMESA, 2013
Trade in professional services
365. The business surveys undertaken in 2012-13 in Sub-Saharan Africa show that about
15 per cent of the interviewed firms in Malawi already export professional services (Figure
32). The predominant mode of trading professional services is cross border supply (Figure 33).
The question is whether mode 1 is indeed the preferred mode of supply of Sub-Saharan
professional services firms or whether this is a way of circumventing barriers affecting other
modes of supply.
Figure 32 Export of professional services, Malawi and comparators
Source: World Bank Surveys of professional services in COMESA, 2013
930
650
336
1,059
674
389
-
200
400
600
800
1,000
1,200
Managers Senior professional Junior professional
Average gross monthy salaray of legal professionals (USD)
Malawi Legal
COMESA Legal
18% 15% 13%
10%
0%
12% 16%
0%
10%
20%
30%
Zambia(11/60)
Malawi (9/60) Mozamb.(6/45)
Mauritius(6/61)
Seychelles(0/40)
APEI (32/266) COMESA(192/1227)
Proportion of firms exporting servicesAverage share of exporters' revenue obtained from export
Parenthese: (exporting firms/sample) Parenthese: (exporting firms/sample)
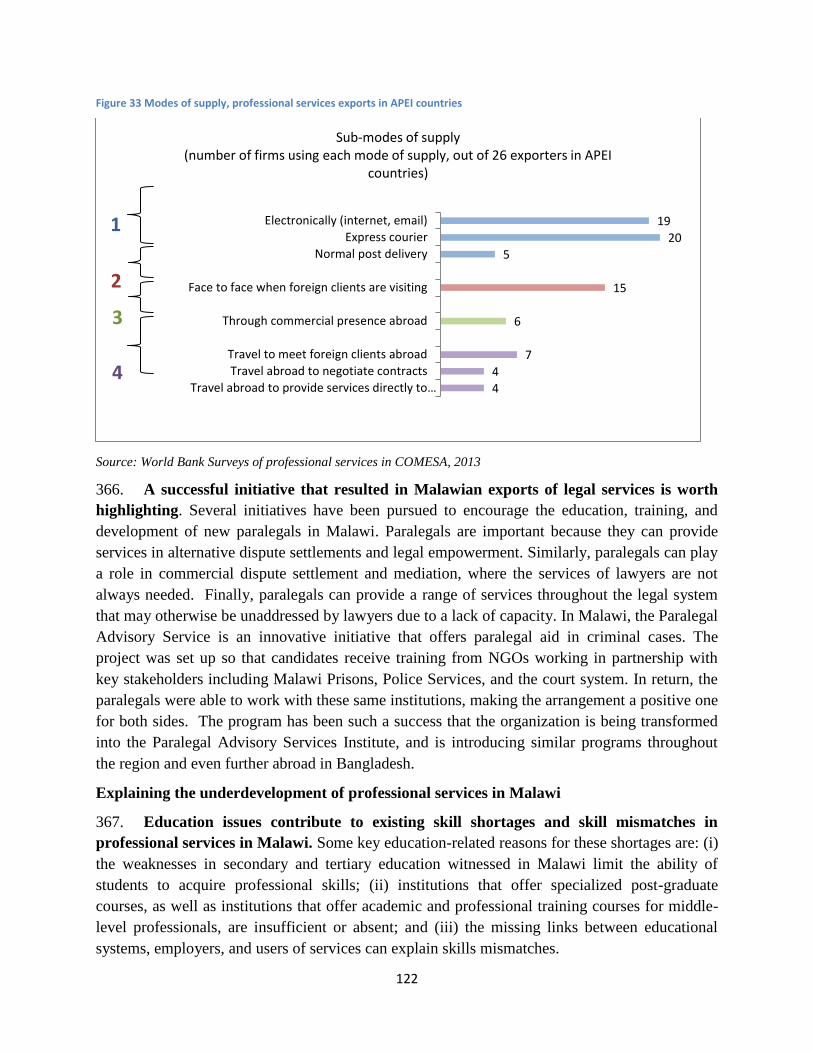
122
Figure 33 Modes of supply, professional services exports in APEI countries
Source: World Bank Surveys of professional services in COMESA, 2013
366. A successful initiative that resulted in Malawian exports of legal services is worth
highlighting. Several initiatives have been pursued to encourage the education, training, and
development of new paralegals in Malawi. Paralegals are important because they can provide
services in alternative dispute settlements and legal empowerment. Similarly, paralegals can play
a role in commercial dispute settlement and mediation, where the services of lawyers are not
always needed. Finally, paralegals can provide a range of services throughout the legal system
that may otherwise be unaddressed by lawyers due to a lack of capacity. In Malawi, the Paralegal
Advisory Service is an innovative initiative that offers paralegal aid in criminal cases. The
project was set up so that candidates receive training from NGOs working in partnership with
key stakeholders including Malawi Prisons, Police Services, and the court system. In return, the
paralegals were able to work with these same institutions, making the arrangement a positive one
for both sides. The program has been such a success that the organization is being transformed
into the Paralegal Advisory Services Institute, and is introducing similar programs throughout
the region and even further abroad in Bangladesh.
Explaining the underdevelopment of professional services in Malawi
367. Education issues contribute to existing skill shortages and skill mismatches in
professional services in Malawi. Some key education-related reasons for these shortages are: (i)
the weaknesses in secondary and tertiary education witnessed in Malawi limit the ability of
students to acquire professional skills; (ii) institutions that offer specialized post-graduate
courses, as well as institutions that offer academic and professional training courses for middle-
level professionals, are insufficient or absent; and (iii) the missing links between educational
systems, employers, and users of services can explain skills mismatches.
19
20
5
15
6
7
4
4
Electronically (internet, email)
Express courier
Normal post delivery
Face to face when foreign clients are visiting
Through commercial presence abroad
Travel to meet foreign clients abroad
Travel abroad to negotiate contracts
Travel abroad to provide services directly to…
Sub-modes of supply (number of firms using each mode of supply, out of 26 exporters in APEI
countries)
1
2
3
4
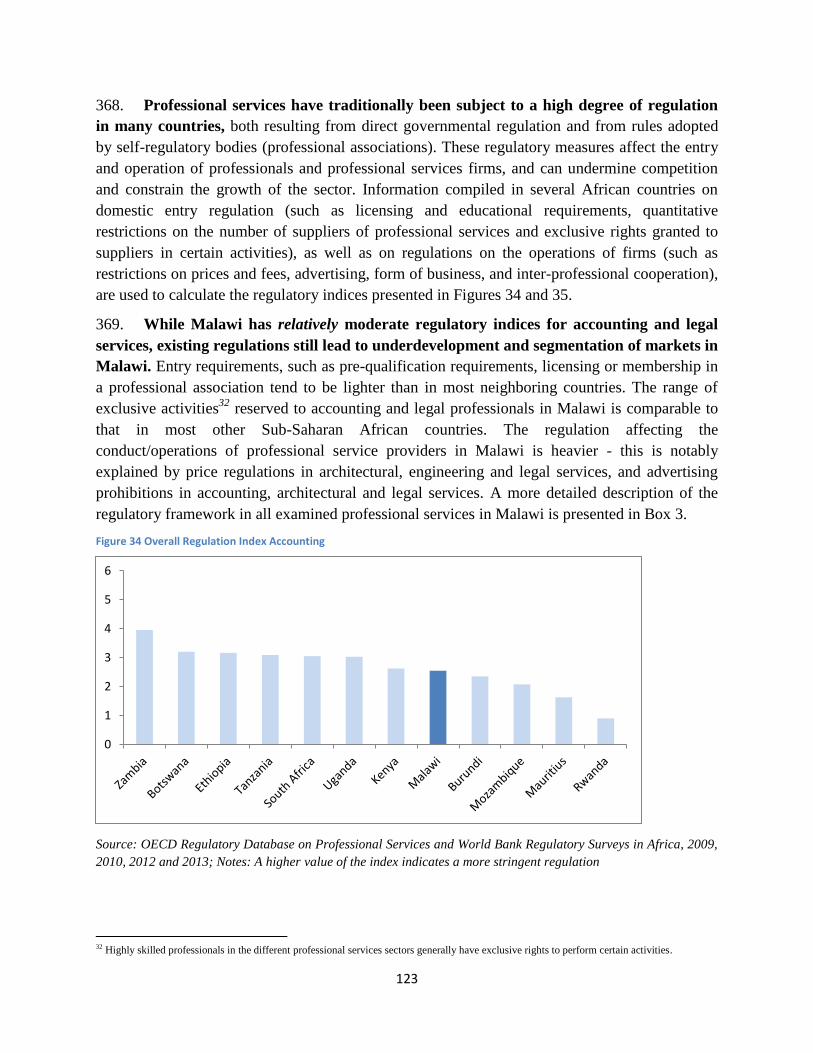
123
368. Professional services have traditionally been subject to a high degree of regulation
in many countries, both resulting from direct governmental regulation and from rules adopted
by self-regulatory bodies (professional associations). These regulatory measures affect the entry
and operation of professionals and professional services firms, and can undermine competition
and constrain the growth of the sector. Information compiled in several African countries on
domestic entry regulation (such as licensing and educational requirements, quantitative
restrictions on the number of suppliers of professional services and exclusive rights granted to
suppliers in certain activities), as well as on regulations on the operations of firms (such as
restrictions on prices and fees, advertising, form of business, and inter-professional cooperation),
are used to calculate the regulatory indices presented in Figures 34 and 35.
369. While Malawi has relatively moderate regulatory indices for accounting and legal
services, existing regulations still lead to underdevelopment and segmentation of markets in
Malawi. Entry requirements, such as pre-qualification requirements, licensing or membership in
a professional association tend to be lighter than in most neighboring countries. The range of
exclusive activities32
reserved to accounting and legal professionals in Malawi is comparable to
that in most other Sub-Saharan African countries. The regulation affecting the
conduct/operations of professional service providers in Malawi is heavier - this is notably
explained by price regulations in architectural, engineering and legal services, and advertising
prohibitions in accounting, architectural and legal services. A more detailed description of the
regulatory framework in all examined professional services in Malawi is presented in Box 3.
Figure 34 Overall Regulation Index Accounting
Source: OECD Regulatory Database on Professional Services and World Bank Regulatory Surveys in Africa, 2009,
2010, 2012 and 2013; Notes: A higher value of the index indicates a more stringent regulation
32 Highly skilled professionals in the different professional services sectors generally have exclusive rights to perform certain activities.
0
1
2
3
4
5
6

124
Figure 35 Overall Regulation Index Legal
Source: OECD Regulatory Database on Professional Services and World Bank Regulatory Surveys in Africa, 2009,
2010, 2012 and 2013; Notes: A higher value of the index indicates a more stringent regulation
370. While some qualitative entry requirements are necessary, they can limit the number
of professionals and services available if they are excessive. Qualitative regulatory measures
may be necessary to guarantee high-quality services and avoid adverse selection. However,
excessive entry requirements set by rent-seeking professionals and professional associations may
disproportionately restrict access. In addition, if the profession gains a monopoly over the
organization of the required training, the education of necessary professionals may be limited.
This may be especially the case when entry restrictions are combined with exclusive tasks for the
regulated profession (OECD, 2007).
371. Exclusive rights can improve the quality of service but can also generate negative
price and allocation effects. For each of the professional services categories, there are a number
of activities that might be affected by exclusive rights.33
These rights can lead to increased
specialization of professionals, but where these restrictions are too strong and created
monopolies, negative effects can be substantial. This is particularly the case where they are
granted for standardized services that can be provided at a lower cost by less-regulated or non-
regulated providers – such as the middle-level professionals in these sectors.
33 Architectural activities include feasibility studies; topographical determination, demarcation, land surveying; planning (elaboration of
blueprints); request for construction permit; preparation and monitoring of construction/execution; technical control and certification; construction cost management; urban and landscape planning; interior design; and other architectural services.
Legal activities include advice on matters predominantly regulated by domestic law, advice on matters predominantly regulated by international
law, advice on matters predominantly regulated by foreign law, transferring of title to real estate, wills and regulation of family matters
(conveyance), representation of clients before courts, representation before administrative agencies (including tax matters), and advice and representation on patent law.
Accounting and auditing activities include statutory audit, non-statutory audit, audit of mergers & contribution in kind, public sector audit,
accounting, insolvency and restructuring practice, tax advice, tax representation, management consultancy, investment advice, legal advice and
representation, expert witness in accounting, forensic auditing.
Typical engineering activities encompass the following: feasibility studies, environmental assessments, design and planning, representation for obtaining permits (signature of designs), tender and contract administration, project management, including monitoring of execution, construction
cost management, planning and managing maintenance, survey sites, testing and certification, expert witness activities.
0
1
2
3
4
5
6

125
Box 3: Domestic Regulation in Professional Services in Malawi
Entry regulations in Malawi are moderate in all professional services sectors. With the exception of
paralegals, accounting technicians and certified accountants all examined professions face qualitative
entry requirements in Malawi. The academic pre-qualification requirements for highly skilled
professionals consist of university degrees in all examined professions (the time required to complete
these academic degrees in Malawi ranges from 5 to 6 years: minimum 5 years to obtain an engineering
degree, 6 years to obtain an architectural degree). Additional practical training (between 2 and 3 years) is
mandatory to become a fully certified accountant or medium and highly skilled architectural and
engineering professional in Malawi. A lawyer is admitted to practice after working under the supervision
of a mentor for a year.
Furthermore, passing a professional exam is required in accounting, architectural and engineering
services. Every person who seeks to be admitted to practice law in Malawi has to pass the Malawi Law
Examination. Except for accounting technicians, membership in the relevant professional association is
mandatory in all examined professional services for both middle and highly skilled professionals.
Compulsory licensing is a must in all professional services with licenses issued by SOCAM in accounting
services, the Malawi Institute of Architects in architectural services, the Malawi Board of Engineers in
engineering services, and the Malawi High Court and Law Society in legal services. Continuing education
is an obligation for architects in Malawi; there are no such requirements in the other examined
professional services sectors.
Regarding exclusive activities, the scope is wider in legal and architectural services than in accounting
and engineering services in Malawi. The number of activities reserved to architectural and legal
professionals ranges from 9 to 11 out of 10 and 13 activities, respectively. In architectural services,
architects enjoy exclusive rights in all activities except interior design, while in legal services, lawyers
have exclusive rights to provide all activities except insolvency related issues and advice on patent law. In
accounting services, auditors and accountants enjoy exclusive rights to provide traditional accounting
(bookkeeping) services, statutory audit and public sector audit services, international audit and expert
witness in accounting – that is 4 out of 13 possible activities. In engineering services, the profession does
not seem to have exclusive rights to provide engineering activities.
Regulation affecting the conduct/operations of professional services providers in Malawi tends to be
heavier than entry regulation. This result is explained by price regulations, advertising prohibitions,
restrictions on firms’ business structure and on multidisciplinary activities.
In accounting services, professional services’ fees tend to be negotiated freely between practitioners and
clients, but prices are regulated in the architectural, engineering and legal sectors. 34
Advertising remains
prohibited in all examined professional services.35
Malawi also imposes restrictions on the legal form of businesses in professional services. These
regulations restrict the ownership structure of professional services companies, the scope for collaboration
within the profession and with other professions and the opening of branches, franchises, or chains. For
example, in accounting limited liability partnerships or corporations are prohibited. Also, there are
restrictions on fee sharing and multi-disciplinary associations between architecture professionals and
other professionals.36
34 Price regulations aim to prevent adverse selection problems, but such regulatory instruments can also restrict competition. Less restrictive
mechanisms, such as better information on the services provided, are available. 35 Advertising restrictions may aim at protecting consumers but private interest theories maintain that there is no justification for prohibiting
advertising that is relevant, truthful, and not misleading. Advertising fosters competition by informing consumers about different products and allowing them to make better-informed buying decisions. Advertising, especially comparative advertising, can also be a crucial competitive tool
for new firms entering a market. 36 To justify these regulations, professional associations argue that professionals are more likely to give independent advice if certain forms of
intra-professional partnerships are prohibited, while restrictions on multidisciplinary activities prevent potential conflicts of interests that are detrimental to consumers. But private interest theories stress that these regulations are clearly anti-competitive and may harm consumers by
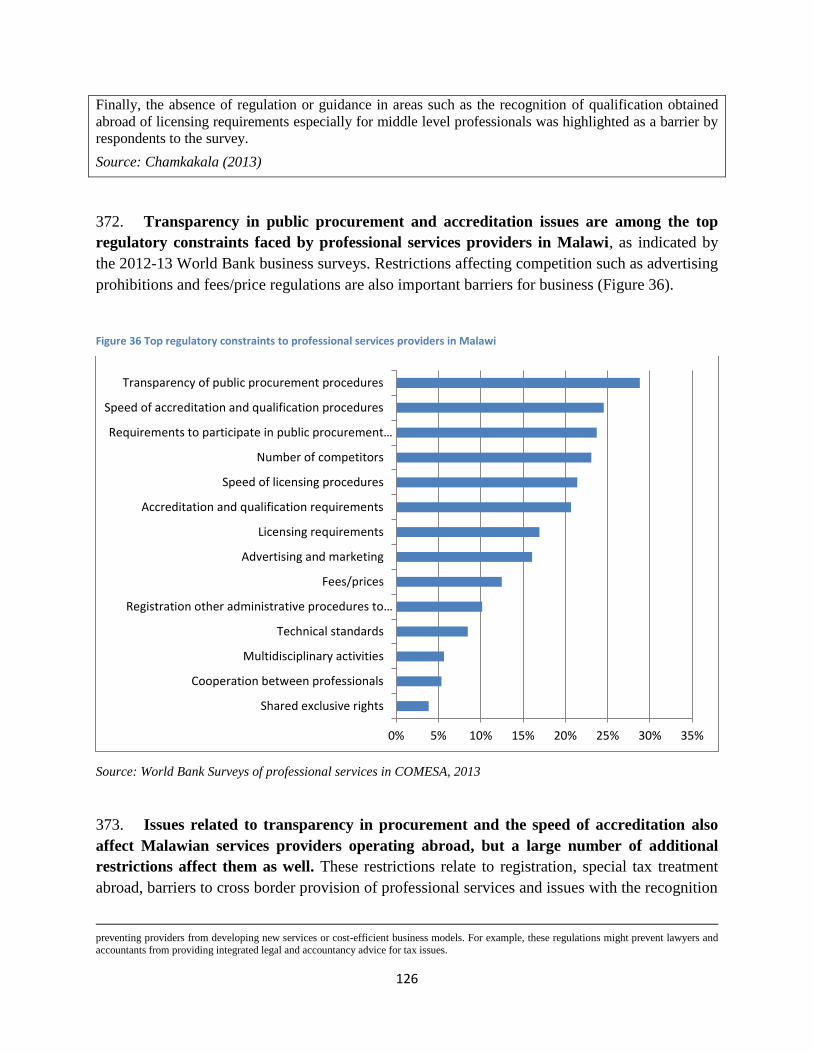
126
Finally, the absence of regulation or guidance in areas such as the recognition of qualification obtained
abroad of licensing requirements especially for middle level professionals was highlighted as a barrier by
respondents to the survey.
Source: Chamkakala (2013)
372. Transparency in public procurement and accreditation issues are among the top
regulatory constraints faced by professional services providers in Malawi, as indicated by
the 2012-13 World Bank business surveys. Restrictions affecting competition such as advertising
prohibitions and fees/price regulations are also important barriers for business (Figure 36).
Figure 36 Top regulatory constraints to professional services providers in Malawi
Source: World Bank Surveys of professional services in COMESA, 2013
373. Issues related to transparency in procurement and the speed of accreditation also
affect Malawian services providers operating abroad, but a large number of additional
restrictions affect them as well. These restrictions relate to registration, special tax treatment
abroad, barriers to cross border provision of professional services and issues with the recognition
preventing providers from developing new services or cost-efficient business models. For example, these regulations might prevent lawyers and
accountants from providing integrated legal and accountancy advice for tax issues.
0% 5% 10% 15% 20% 25% 30% 35%
Shared exclusive rights
Cooperation between professionals
Multidisciplinary activities
Technical standards
Registration other administrative procedures to…
Fees/prices
Advertising and marketing
Licensing requirements
Accreditation and qualification requirements
Speed of licensing procedures
Number of competitors
Requirements to participate in public procurement…
Speed of accreditation and qualification procedures
Transparency of public procurement procedures

127
of professional qualifications pose additional difficulties to exporting professional services firms
(Figure 37).
Figure 37 Top regulatory constraints faced by Malawian professional services providers abroad
Source: World Bank Surveys of professional services in COMESA, 2013
Explaining the Segmentation of Markets for Professional Services – Trade Barriers and
Immigration Regulation37
374. Malawi has a relatively moderate services trade restrictiveness index. Trade barriers
can limit competition and the efficiency of professional service providers in Africa. Foreign
entry restrictions include: (i) Restrictions on the movement of natural persons (nationality and
residency requirements, quotas, economic needs test, limits on the length of stay, recognition of
academic and professional qualifications); (ii) Restrictions on the establishment of commercial
presence (restrictions on foreign ownership, limits on the type of legal entry, limits on the scope
of business); (iii) Restrictions on cross border trade (entry restrictions and limits on the scope of
37 Data on trade barriers come from the WB/DECTI Survey on Foreign Services Restrictions. Only accounting and legal services are covered at
this stage.
0% 2% 4% 6% 8% 10% 12% 14% 16% 18% 20%
Shared exclusive rights
Fees/prices
Technical standards
Multidisciplinary activities
Cooperation between professionals
Limits to foreign ownership
Number of competitors
Limits to the number of foreign firms which can…
Limitations on the number of foreign professionals…
Technical standards imposed on foreign suppliers
Residency requirement applied to foreign…
Restrictions on foreign participation in public…
Licensing requirements and procedures applied to…
Accreditation and qualification requirements
Licensing requirements
Recognition or accreditation of qualifications…
Requirements to participate in public procurement…
Special tax treatment to foreign service providers
Restrictions on cross-border services provision
Regulations related to registration procedures
Advertising and marketing
Speed of licensing procedures
Transparency of public procurement procedures
Speed of accreditation and qualification procedures

128
business); and (iv) Restrictions on labor mobility (procedures for hiring a foreign worker). The
Services Trade Restrictiveness Indices that take into account such restrictions reveal that Malawi
is not more restrictive than most sub-Saharan African countries in accounting and legal services
(Figures 38 and 39).
375. It is important to highlight that the estimates based on the methodology of the STRI
are inherently subjective and uncertain.38
Therefore, rather than drawing detailed policy
conclusions based on these estimates, we would recommend a more flexible, qualitative
interpretation of the quantitative results, combined with rank ordering of countries for indicative
purposes. More details on concrete policy recommendations emerge from the qualitative analysis
based on business survey results and interactions with local players.
Figure 38 Services Trade Restrictiveness Index Accounting
Source: World Bank (2012) Services Trade Restrictions Database;
376. Trade restrictions in professional services in Malawi include: nationality
requirements to provide certain professional services, prohibitions to use the name of the
parent company, requirements to employ a certain percentage of nationals and restrictions
on the composition of management of foreign professional firms established in Malawi.
Foreign degrees are recognized on an ad-hoc basis. Similarly, work permits are allocated and
extended on a case by case basis. Finally, the trade-migration linkage is an important part of the
debate on migration reform. Trade policy officials should not neglect the immigration and labor
market perspectives when considering temporary entry or mode 4 issues. Policies related to
visas, work permits, and treatment of foreign workers must be considered. More details about the
explicit trade barriers affecting professional services by mode of supply are presented in Box 4.
38 While the specific restrictions affecting the various modes of supply are being considered, the calculation of the index relies on the following
methodology: within each subsector-mode policy regimes are assessed in their entirety and the bundle of applied policies is mapped into five broad categories (with associated scores): “Completely open” (0); “Virtually open but with minor restrictions” (25); “Major restrictions” (50);
“Virtually closed with limited opportunities to enter and operate” (75); and “Completely closed” (100).
0
10
20
30
40
50
60
70
80
90
100

129
Figure 39 Services Trade Restrictiveness Index Legal
Source: World Bank (2012) Services Trade Restrictions Database; available at www
Box 4: Explicit trade barriers affecting professional services in Malawi
Explicit barriers to trade that cover foreign entry restrictions and discriminatory conduct restrictions, and
broader labor mobility limit competition and the efficiency of professional service providers in Malawi.
Trade in legal services tends to be more restricted than trade in accounting/auditing services in Malawi
and elsewhere.
The establishment of foreign professional firms (mode 3 of trade in services in GATS) is permitted in
Malawi. With the exception of engineering services there are no limits on ownership or control in a
foreign firm’s office in Malawi by foreign natural or juridical persons, but some forms of entry such as
standalone foreign branches or subsidiaries are required in all examined professional services sectors.
Also, there are some requirements regarding the composition of the board of directors of an office of a
foreign professional service firm in Malawi – for example, at least one of the directors need to be
nationals, residents or locally licensed in engineering services.
The movement of natural persons (mode 4 of trade in services in GATS) is substantially more restricted
than the establishment of foreign professional firms in Malawi. Mode 4 is not allowed in legal services
and statutory audit subsector, while entry is subject to certain conditions such as nationality requirements
in subsectors such as insolvency practice. All foreign professionals require visas to enter Malawi and a
work permit o practice in the country. Also, foreign professionals in all sectors are subject to labor market
tests and economic needs tests in Malawi. Finally, it is worth noting that there remains significant
confusion among respondents about the types of entry available for foreign professionals to enter Malawi
for the provision of services.
Cross-border trade (mode 1 in GATS terminology) in accountancy and architectural services is not
allowed for certain activities in Malawi. For example, auditing and insolvency practice work must be
done by an accounting professional or accounting firm duly licensed in Malawi to be acceptable to
government offices.
Source: Chamkakala (2013)
0
10
20
30
40
50
60
70
80
90
100

130
Recommendations for policy action
377. Policy action is required to address the constraints to the development of
professional services. The national markets for professionals and professional services in
Malawi are underdeveloped, with performance indicators below the averages of countries at a
similar level of development. Inadequate domestic regulations, combined with a lack of regional
coordination among countries, further constrain foreign investment and Malawi’s integration
with other Sub-Saharan African countries. These outcomes are the result of constraints that
suggest policy action in the following areas: education, regulation of professional services, trade
policy, and labor mobility. International and regional cooperation (for example, WTO, APEI and
COMESA services negotiations) would ideally complement domestic policy reform. Trade
liberalization and regional integration can be used to advance regulatory reform, enhance
competition, and address labor mobility issues that are crucial in professional services. The key
recommendations are highlighted in the Action Matrix.
378. Policy reforms at the national level need to focus on the development of framework
conditions that address skills shortages and skills mismatches, and that attempt to facilitate the
growth of professional services in Malawi through regulatory reforms.
379. Education reforms: Faculties and other training programs must be improved and
expanded to satisfy professional training needs, but this must be planned and carried out in a
manner that will increase not only the quantity but also the quality of offerings. Merely certifying
schools and granting more degrees or certificates to poorly-trained students would not address
the needs, and instead would worsen the overall situation in the long run by infusing poorly
equipped graduates into the system.
380. International and national experiences related to quality assurance of secondary
and higher education could serve as a model for Malawi. For example, the program that is
currently being developed by the Inter-University Council for East Africa (IUCEA) in terms of
designing university curricula and research, and creating university/industry partnerships for
fostering knowledge, could provide guidance for education reforms in Malawi and other
Southern African countries.
381. Moreover, Malawi needs to put special emphasis on the development of programs
for middle level professionals. Malawi’s experience with courses for middle-level legal
professionals could be a useful model for other professional services sectors in the country.
382. Finally, improving links between educational systems, employers, and users of
services would help young graduates to find employment and could reduce the attrition of
skills in several professions. Several stakeholders from the private sector have emphasized the
coordination problems between employers, professional associations, and education institutions
in the content of educational programs for engineers and accountants. Policy actions to
encourage collaboration between universities, professional associations, and the private sector,
for example through internships, could help students acquire skills and practical training. The

131
Structured Engineers Apprenticeship Program (SEAP) for Graduate Engineers developed by the
Engineers Registration Board in Tanzania provides an example that could be followed by
Malawi.
383. Regulatory reform was, once again, identified by the business community as a
priority area for reform. The business surveys indicate that reforms regarding regulations on
entry -- such as addressing opaque public procurement processes and long accreditation and
qualification procedures for professionals - and regulatory reforms affecting the operation of
professionals and professional firms -- such as eliminating price regulations and advertising
prohibitions - need to be on the top of policy makers' reform agenda.
384. Regulatory reforms need to focus on incremental, qualitative improvements in
domestic regulation. Specifically this requires developing adequate regulations that ensure that
professionals are equipped with market-relevant skills. Disproportionate cumulative entry
requirements need to be relaxed. For example, narrowing the scope of exclusive tasks in certain
professions would contribute to this goal. Exclusive rights can lead to increased specialization of
professionals and guarantee a higher quality of service, but if they create monopolies they can
have adverse price and allocation effects, especially when granted for services for which
adequate quality can be provided at a lower cost by less-regulated middle-level professionals.
385. Disproportionate restrictions that limit competition as outlined earlier need to be
eliminated: Price regulations affecting legal services and public procurement contracts in
engineering are supported and introduced by professional associations or the government, who
claim that they are useful tools to prevent adverse selection problems. Malawi needs to adopt less
restrictive mechanisms, such as better access to information on services and services providers to
accomplish the same goals at lower economic cost.
386. Advertising prohibitions are imposed by Malawi in accounting and legal services
and should be reviewed. The country needs to allow advertising of professional services, which
facilitates competition by informing consumers about different products and which can be used
as a competitive tool for new firms entering the market.
387. The key issue regarding regulatory reform is not less regulation but better
regulation; that is regulation that more effectively achieves public policy objectives while
ensuring efficiently produced low cost services. Tools and procedures can be put in place to
assist policy makers to assess whether existing or new regulation will achieve the sector-specific
public policy objectives while contributing to market openness. Box 5 presents such regulatory
tools – Malawi could learn from these experiences:

132
Box 5: Regulatory initiatives that could be used as a model by the COMESA countries
The OECD principles on key market-oriented and trade-and-investment-friendly regulation could
offer guidance to the regulation of services sectors in Africa. Furthermore, the APEC-OECD
Integrated Checklist on Regulatory Reform (adapted to developing countries’ needs) could provide
further guidance on how to undertake such a combined assessment of regulatory and competition
policies, and market openness policies. The Checklist highlights key issues that should be considered
during the process of development and implementation of regulatory policy and could be useful in
building domestic capacities for quality regulation.
The APEC-OECD Checklist is a voluntary tool that Malawi and other African economies may use to
evaluate their respective regulatory reform efforts. The checklist has four sections including 40
specific open questions in total. The first is a horizontal questionnaire that deals with the degree of
integration of regulatory, competition and market openness policies across levels of government, and
on the accountability and transparency mechanisms needed to ensure their success. The second is on
regulatory policies which are designed to maximize the efficiency, transparency and accountability of
regulations based on an integrated rule-making approach and the application of regulatory tools and
institutions. The third is on competition policies which promote economic growth and efficiency by
eliminating or minimizing the distorting impact of laws, regulations and administrative policies,
practices and procedures on competition, and by preventing and deterring private anti-competitive
practices through effective enforcement of competition laws. The fourth is on market openness
policies which aim to ensure that an economy can reap the benefits of globalization and international
competition by eliminating or minimizing the distorting effects of border as well as behind-the-
border regulations and practices.
Other regulatory experiences such as the ASEAN Mutual Recognition Arrangement Framework on
Accountancy Services, the ASEAN Mutual Recognition Arrangements on Engineering Services and
on Architectural Services could provide further guidance to Malawi and other African countries
which are willing to engage in mutual recognition discussions. Furthermore, the experience of the EU
with the internal recognition of professional qualifications as well as the regulatory dialogues and
regulatory platforms established with third countries could give additional guidance to Malawian
policy makers.
Sources: OECD, APEC, ASEAN
388. Removing barriers to regional and multilateral trade and reducing regulatory
differences could generate large welfare gains. The fragmentation of regional markets for
professional services and professional education by restrictive policies and regulatory
heterogeneity prevents Malawi from taking advantage of gains from trade based on comparative
advantage, as well as gains from enhanced competition and economies of scale. Trade barriers
would ideally be liberalized on a most favored nation (MFN) or non-preferential basis, since this
would generate the largest welfare gains, and complemented with regional cooperation to reduce
regulatory differences.
389. Steps need to be taken to relax the explicit trade barriers applied by Malawi to the
movement of natural persons and commercial presence of professional services. Examples
of possible reforms would include i) articulating the economic and social motivation for
nationality and residency requirements; ii) minimizing restrictions on the forms of establishment
allowed; and iii) developing a transparent and consistent framework for accepting professionals

133
with foreign qualifications. The reduction of explicit trade barriers also needs to be
complemented with the reform of immigration laws and rules on the hiring of foreign workers.
390. Trade liberalization needs to be coordinated with regulatory reform and
cooperation at the regional level. Deeper regional integration, through regulatory cooperation
with neighboring partners who have similar regulatory preferences, can usefully complement
non-preferential trade liberalization. Regional integration would also enhance competition
among services providers, enable those providers to exploit economies of scale in professional
education, and produce a wider variety of services. Regional integration brings further benefits in
that a larger regional market is able to attract greater domestic and foreign investment; and
regionalization may help take advantage of scale economies in regulation, particularly where
national agencies face technical skills or capacity constraints.
391. Opening up regional boundaries and establishing Mutual Recognition Agreements
(MRAs) would facilitate Malawi’s services integration with its African partners. The free
movement of APEI/COMESA/SADC nationals without work permit requirements would be of
great help to increase business opportunities within the region and boost service exports.
Regional discussions in Southern Africa on MRAs in professional services are in a very
preliminary phase with a higher progress potential among APEI countries. Interested countries
could learn from East Africa’s experience with MERAs in account and architectural services.
The EAC Common Market Protocol, adopted by the Multi Sector Council in 2009, includes an
annex on a framework agreement on MRA of academic and professional qualifications. The five
EAC countries have already signed an MRA in accounting services and implementation focuses
on the following areas: requirements for education, examinations, experience, conduct and
ethics, professional development and re-certification, scope of practice, and local knowledge. To
assist with the preparation of potential MRAs Malawi and other interested countries could
benefits from technical assistance in the context of the APEI program.
Conclusion
392. Malawi needs to engage in deep regulatory cooperation at the regional level and use
multilateral trade liberalization and regional integration to reform and strengthen its
professional services sectors. The government could engage with donors to secure technical and
financial assistance to strengthen the capacity of regulatory organizations, and develop
appropriate regulation.
393. The pace of integration is largely dependent upon Malawi’s political motivation and
conviction that such liberalization is beneficial to the domestic constituencies. To improve
such prospects, the promotion of more frequent and open dialogue between the key stakeholders
involved in professional services - professional bodies, private sector providers, users of
services, higher education institutions, trade negotiators – is important. Malawi’s participation in
the APEI program as well as other regional initiatives can help the country with the development

134
of a meaningful reform program that includes the elimination of explicit barriers and regulatory,
education and immigration reforms.
394. An important first step to improve regulations would be to undertake regulatory
audits in all examined professional service sectors. This would increase transparency and
predictability and allow identifying specific areas where reforms could be fast-tracked in the
context of the COMESA, SADC, Tripartite and APEI services dialogues.

135
Appendix 1 – Next steps for implementation
Area of constraint Specific next steps potential indicators
Multiple Tariffs/Nuisance Tariffs
Simplify tariffs for COMESA imports by reducing them to the next lower band. Reduce all tariffs that are below 5 percent to zero, and those between 5 and 10 to 5, those below 25 to 10.
number of effective bands reduced to 4
Review tariff schedule, ensure it is updated on the website, and remove irregularities
Online-tariff schedule up-to-date at any given moment and in line with commitments
Review Tariff bands and consolidate all tariffs to main four bands Published tariff shows that all tariffs fall into four bands
Replace import tariffs at 200 percent with excise duties 200 percent tariff band removed and excise duties published
Tariff exemptions/trade bans/export restrictions/trade licenses
Implement decision taken in June to reduce products needing export licenses to 10 categories
Government decision has been gazetted and no new licenses are introduced
Remove or automate all import licenses No reports of traders complaining about not obtaining import licenses
Undertake quarterly analysis of which products/importers have obtained exemptions: undertake economic and revenue impact analysis
Detailed report on exemptions published on MRA website
Based on analysis, reduce general duties on those products that have obtained most exemptions
Tariff Schedule Gazetted with lower rates for major products receiving exemptions
Review criteria and procedures for granting exemptions to ensure it does not discriminate against small and medium-sized enterprises
Revised Guidelines for Exemptions Published
Remove all remaining export bans No reports of traders complaining about remaining export bans
Removal of existing NTBs and prevention of new NTBs
Validate and update NTM stocktaking that has been done in 2011 NTB Committee publish report listing NTM.
Publicise all existing NTMs, NTBs, procedures and regulatory agencies All NTMs publicly available on the web
NTB Committee to start reviewing NTMs for their effectiveness NTB Committee publishes report on NTMs
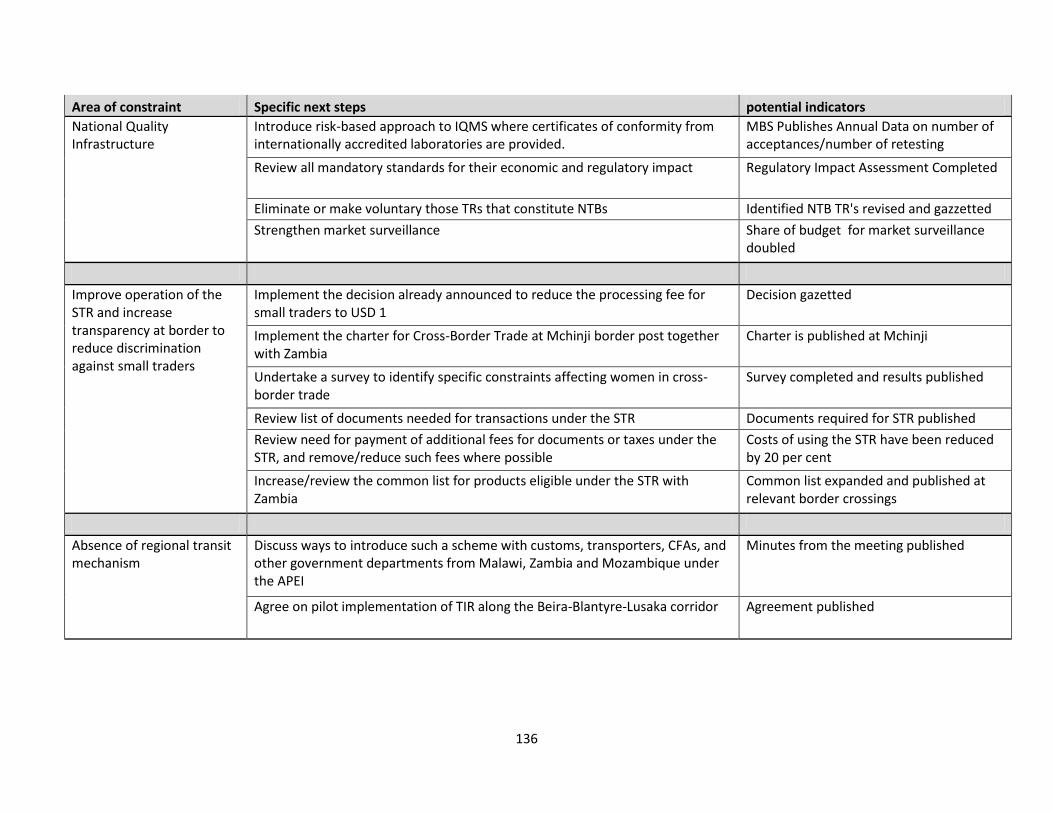
136
Area of constraint Specific next steps potential indicators
National Quality Infrastructure
Introduce risk-based approach to IQMS where certificates of conformity from internationally accredited laboratories are provided.
MBS Publishes Annual Data on number of acceptances/number of retesting
Review all mandatory standards for their economic and regulatory impact Regulatory Impact Assessment Completed
Eliminate or make voluntary those TRs that constitute NTBs Identified NTB TR's revised and gazzetted
Strengthen market surveillance Share of budget for market surveillance doubled
Improve operation of the STR and increase transparency at border to reduce discrimination against small traders
Implement the decision already announced to reduce the processing fee for small traders to USD 1
Decision gazetted
Implement the charter for Cross-Border Trade at Mchinji border post together with Zambia
Charter is published at Mchinji
Undertake a survey to identify specific constraints affecting women in cross-border trade
Survey completed and results published
Review list of documents needed for transactions under the STR Documents required for STR published
Review need for payment of additional fees for documents or taxes under the STR, and remove/reduce such fees where possible
Costs of using the STR have been reduced by 20 per cent
Increase/review the common list for products eligible under the STR with Zambia
Common list expanded and published at relevant border crossings
Absence of regional transit mechanism
Discuss ways to introduce such a scheme with customs, transporters, CFAs, and other government departments from Malawi, Zambia and Mozambique under the APEI
Minutes from the meeting published
Agree on pilot implementation of TIR along the Beira-Blantyre-Lusaka corridor Agreement published

137
Area of constraint Specific next steps potential indicators
Multiple border agencies resulting in delays
Implement government decision to reduce agencies at borders in Malawi Decision gazetted
Review and revise mandates of agencies that are, or will no longer be, at borders
Findings of review published, and laws to adjust mandates in force
Introduce delagation of powers to those agencies remaining at the border Regulations granting derogation of authority published
Establish integrated risk-management system by including selectivity criteria from ALL agencies in customs system to strengthen collaboration
MRA's selectivity criteria contain relevant criteria from other agencies including Agriculture, and MBS
Difficulty in obtaining information on trade rules and regulations
Take stock of all procedures, regulations, fees, requirements, and involvement for imports and exports at the product level
Trade Portal launched and work plan published
Put together information in a publicly accessible Trade Portal Trade Portal launched
Change legislation to ensure only procedures and regulations described on the Trade Portal are legally in force to ensure all agencies keep updating relevant information
Legislation Gazetted
Cabotage restrictions increase transport prices
Assess transport costs for specific routes, establish a time table for removing cabotage restrictions on specific routes, and start phasing out restrictions
Agreement on routes for lifting cabotage restrictions
Estalish an exchange for transport service providers that could improve matching of back-hauls, allow evaluation of service providers, and increase competition
Use of minimum prices for agricultural commodities
Establish an SMS-based system to disseminate market prices to farmers SMS based pricing system launched
Abolish the use of statutory minimun prices

138
Area of constraint Specific next steps potential indicators
Regulations governing access to agricultural inputs (seeds/fertilizer)
Implement the new Seed Act Seed Action Published
Fast track implementation of SADC Seed System
Make system for the importation of fertilizer imports more flexible
Remove monopoly on innoculant Regulation removed
Lack of effective mechanisms for aflotoxin control
Investigate simple methods for platform testing of aflatoxin
Promote routine adoption of platform testing and have buyers of groundnuts and other aflatoxin sensitive commodities incorporate platform testing as part of their buying strategy to pass price signals for aflotoxin-free products to farmers
Prices for products are differentiated based on aflotoxin levels
Complement these approaches with training of farmers in simple storage techniques that can be used to limit/prevent aflatoxin contamination
Address top three regulatory constraints faced by professional service providers in Malawi and for those exporting
Undertake regulatory audits in the engineering, legal services, architecture, and accounting sectors
Regulatory audits completed and published
Implement reforms identified as part of the regulatory review Revised regulations gazetted
Engage with neighboring countries in the context of the APEI, SADC, and COMESA, to harmonize regulatory requirements
Start negotiating MRAs at the technical level in selected sectors
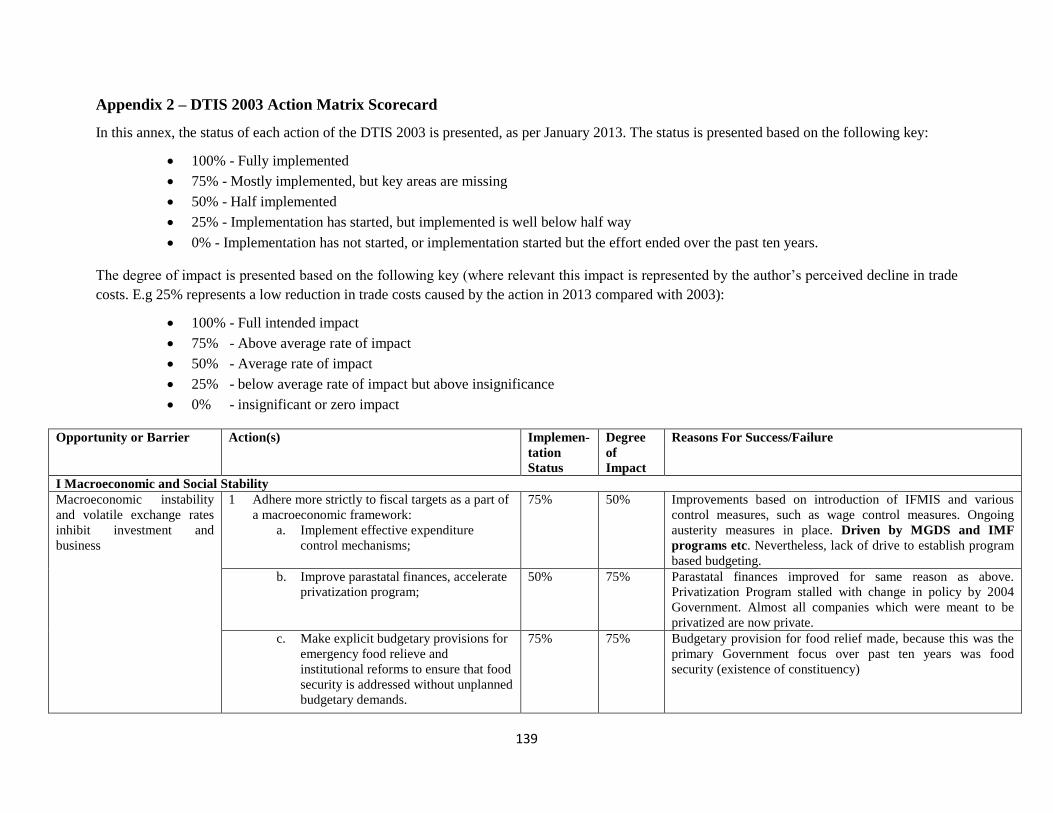
139
Appendix 2 – DTIS 2003 Action Matrix Scorecard
In this annex, the status of each action of the DTIS 2003 is presented, as per January 2013. The status is presented based on the following key:
100% - Fully implemented
75% - Mostly implemented, but key areas are missing
50% - Half implemented
25% - Implementation has started, but implemented is well below half way
0% - Implementation has not started, or implementation started but the effort ended over the past ten years.
The degree of impact is presented based on the following key (where relevant this impact is represented by the author’s perceived decline in trade
costs. E.g 25% represents a low reduction in trade costs caused by the action in 2013 compared with 2003):
100% - Full intended impact
75% - Above average rate of impact
50% - Average rate of impact
25% - below average rate of impact but above insignificance
0% - insignificant or zero impact
Opportunity or Barrier Action(s) Implemen-
tation
Status
Degree
of
Impact
Reasons For Success/Failure
I Macroeconomic and Social Stability
Macroeconomic instability
and volatile exchange rates
inhibit investment and
business
1 Adhere more strictly to fiscal targets as a part of
a macroeconomic framework:
a. Implement effective expenditure
control mechanisms;
75% 50% Improvements based on introduction of IFMIS and various
control measures, such as wage control measures. Ongoing
austerity measures in place. Driven by MGDS and IMF
programs etc. Nevertheless, lack of drive to establish program
based budgeting.
b. Improve parastatal finances, accelerate
privatization program;
50% 75% Parastatal finances improved for same reason as above.
Privatization Program stalled with change in policy by 2004
Government. Almost all companies which were meant to be
privatized are now private.
c. Make explicit budgetary provisions for
emergency food relieve and
institutional reforms to ensure that food
security is addressed without unplanned
budgetary demands.
75% 75% Budgetary provision for food relief made, because this was the
primary Government focus over past ten years was food
security (existence of constituency)

140
2 Further stabilize real exchange rate by consistent
adherence to the monetary and fiscal targets set in
the macro framework and develop a more active
nominal exchange rate policy to avoid sharp
short-run fluctuations (this will require a higher
level of international reserves.
25% 25% Exchange Rate not stabilized due to failure to prevent the
growth in the structural trade deficit. Trade deficit rose from 7%
of GDP in 2001 to 21% in 2010. The main reason is a lack of
institutional capacity for long term economic management
and planning, and a parallel lack of understanding of
market-based development.
Social Stability is an
essential precursor to an
environment in which
economic growth and
development can be pursued
3 Implement a set of safety net programs (as per
the MRSP) to provide supplemental
employment, improved food security, and
transfers to the most vulnerable population
groups. Pursuing this will require refinement of
the poverty focus of public works, development
of appropriate systems for targeting of crop pack
distribution etc.
100% 50% Most safety net programs had significant support from both
government and donors (the presence of a constituency).
Successful because it was in line with political goals, and the
welfare goals and expertise of donors.
II Transportation-Critical for Increasing Trade Value and the Income of the Poor
High cost of transport
remains a major constraint to
trade, growth and poverty
alleviation
4 Work with the Government of Mozambique to
improve the Nacala corridor. Urgently assist in
fixing the 77km stretch that is damaged.
a. Work on the port’s security and
capacity
25% 25% Vale is now investing in this area, but there was little progress
prior to Vale’s arrival in 2010. The 77km stretch has not been
completed. The issue is therefore the creation of a
constituency, overriding the impact of lack of institutional
capacity.
b. Assess opportunities and create an
action plan with the Nacala secretariat
25% 25% Creation of an action plan only materialized after the arrival of
Vale in 2010 (as above). The impact is minimal since the Vale
project has just commenced
c. Study options for rail extension to
Lusaka
25% 25% The rail way was extended to Chipata but no action thereafter,
until arrival of Vale in 2010, which has created Zambian
interest to connect the TAZARA line to Chipata.
5 Address the issue of the domestic trucking
cartel. Ensure access for foreign truckers to
Malawi traffic in order to bring internal
transport costs more in line with regional norms.
a. Look for means of equitable
liberalization of the internal transport
market
50% 50% The introduction of foreign truckers into Malawi and the
allowance of the 3rd
party rule have helped, but cabotage
continues to protect domestic routes. Resistance from the
domestic trucking cartel, which includes politician investors,
is the main obstacle to implementation. The CFTC has only
been established in 2010, so there has been a lack of
competition debate, compared to the strength of the trucking
lobby group and political vested interests. Lack of progress at
the international level on cabotage is also a key hindrance.

141
6 Reassess tax structure on transport equipment
and services with a view toward lowering costs
and increasing competitiveness
a. Tax Committee to examine tax
structure in transport
25% 25% Little institutional capacity in Malawi to develop tax policy to
support productive sectors, such as transport. Tax policy
remains ad hoc and is driven by IMF pressure to balance the
budget. Some tax incentives were introduced on buses and
trucks to try to support domestic truckers, due to the latter’s
strong lobby. These tax incentives had a positive impact of
lowering costs and increasing competitiveness in the transport
sector, but the cost of transport remains high.
7 Review existing restrictions on air transport
landing rights and existing landing and
associated fees with a view toward increasing
services and lowering costs
a. Implement Open Skies Agreement
Yamoussoukro Declaration that
Malawi is party to
25% 0% Failure for Malawi to allow the application of the 5th
freedom of
air traffic due to the desire to protect Air Malawi. Malawi has
been trying to find a strategic investor in the airline since 2002,
and this process is ongoing (possible deal with Ethiopian
Airlines in 2013). It is therefore unwilling to open up its airline
markets, as yet and for the foreseeable future, thus resisting
this liberalization.
8 Explore opportunities for improved freight
transport management involving more back-
hauling and thus reduced regional freight rates
0% 0% This sector has to be private sector driven, but importers are not
organized. Prior to September 2012, the Shippers’ Council was
never revived to fill this gap, probably as importers operate
individually in a ‘closed deals world’ (therefore causing a lack
of constituency) and because the responsibility stood with
government, who lacked organization capacity.
9 Lake transport: opportunity needs to be
developed to enhance domestic trade and
increase the freedom of movement for and of
people and goods
25% 0% Lake transport has not been seen as part of a multi modal
transport system, and this is necessary for its development.
There is lack of constituency as lake transport is derived
demand. It ties in to Dar es Salaam and Mtwara Corridors but
these are not the priority – which is the Nacala Corridor. The
inaction here was also due to the lack of investment in railways
(such that it made sense for sugar and other crops to be trans-
ported by road and not by lake to then connect to the railway).
Mota Engil given concession on lake transport in 2012.
Therefore, lack of resources is also a major limiting factor.
10 Mtwara corridor (part of Mozambique-Malawi-
Zambia growth triangle)
0% 0% It has not been developed due to the poor state of the Mtwara-
Songea Road, which also remains a low priority in Tanzania
where the focus is the Mbeya to Dar Corridor. The private
sector believes that the Mtwara route will not become viable
without major infra structural development in both Malawi and
Tanzania. The main issue is a lack of constituency: the
Mtwara corridor is not a priority for Tanzania (or Malawi),
both countries have other corridor priorities (SACGOT and
Nacala, respectively.)

142
11 Strengthen public and private sector partnerships
and create entrance opportunities for private
sector
25% 25% Little progress was made because the Public Private Partnership
Act was only passed in 2011. This was due to a lack of
institutional capacity to push through this act prior to 2011.
12 A separate Infrastructure Strategy should be
drawn out of the Growth Strategy and further
developed
50% 25% There were efforts in this direction, and the Transport Sector
Investment Program is now based on Vision 2020. But it was
not based on a growth strategy. This is because of the MGDS II
does not provide a robust economic growth strategy to which
the transport policy/strategy can tie in to. Rather, the transport
plans serve as an input into MGDS II. This boils down to a lack
of economic planning capacity in the Government. It is
important to tie the current updating of the transport policy to
the National Export Strategy.
13 District Assemblies to plan and manage feeder
roads and enhance public/private sector
partnerships for feeder roads
0% 0% Lack of investment in District Assemblies: they lack the
institutional capacity to manage primary and secondary roads.
III Export Sector Specific Measures
Tobacco
Lack of collective strategic
vision on the prospects and
national development role of
the industry
14 Formulation of tobacco sub-sector strategy
25% 25% This collective strategy plan was not formulated until a draft
was prepared in 2012. Lack of progress over the past ten years
was because the debate focused on the introduction of the
Integrated Production System (contract farming in tobacco),
stakeholders did not assume the responsibilities set out in 2004
and it was only when the risks for certain value chain players
arose that the Government recognized a need for this strategy.
In other words, there was a lack of constituency. The quality
of the consultants in the 2012 effort was also poor.
Weak governance structure
inhibits policy formulation
and effective regulation of
the tobacco industry
15 Restructure the board of the TCC to render it
autonomous of vested interests
25% 25% Restructuring did take place. However, there remains political
influence since the CEO is appointed by the President of
Malawi. The reason is resistance: a lack of willingness by
Government to relinquish control of what remains Malawi’s
major export sector.
16 Strengthen TCC’s analytical, monitoring, and
market intelligence capacities
25% 25% Lack of recognition of this need to protect farmers. TCC relies
heavily on buyers for market information and has limited
capacity to verify such information. Lack of recognition of need
to invest in institutional capacity of TCC and how this is
crucial to regulate the sector and protect farmers, also under the
Integrated Production System.

143
17 Restructure TAMA as an association
representing and supporting commercial
agriculture (not tobacco-specific)
0% 25% TAMA lacks resources to support commercial agriculture in
other sectors – it is overburdened with settling farmer debts
from the 1990s and its levy revenue was cut in 2003. Limited
institutional and management capacity also played a part.
TAMA was also never aware of the DTIS up to this research
being conducted.
18 Revamp grower registration system to increase
transparency and reduce evasion of taxes, levies
and loan payments
25%
0%
A biometric system has been launched but it is small and has
many teething problems. The biometric system is expensive and
the manual registration is prone to double registration, which
makes it attractive for certain parties. It is resisted by those
who stand to lose from not being able to manipulate the
registration scheme.
Opportunity to improve the
efficiency and equity of
tobacco marketing
arrangements
19 Remove 7 per cent withholding tax from
smallholders
75% 75% This tax was removed for clubs and not for estates. Currently
there is a flat 3% tax rate across clubs and estates to counter tax
evasion tendencies by estates. Poor and fluctuating prices
received by farmers are a key problem here, as this limits their
capacity to pay this tax.
20 Negotiate reduced AHL auctioning fees
75% 50% This was implemented through a directive by Government, not
a negotiation, in an effort to support smallholder farmers.
Mixed outcome: has hindered investment in auction services.
21 Implement a transparent and non-discriminatory
‘designated buyer’ system plus permit contract
farming in tobacco
75% 25% Contract farming is permitted and farmers have a choice to be
contracted or not. However the IPS system (contract farming)
has critics who question if farmers stand to benefit. On the other
hand IPS is required by Malawi’s tobacco customers – it is
therefore imposed by the global market. This is driving the
move to contract farming.
22 Develop “code of practice” + performance
monitoring system for satellite depots
25% 0% Developed but not implemented possibly because of resistance
by what are known as briefcase associations (businessmen
who set up associations to attract levy revenue, without having
a real membership.
Sugar
Uncertain policy
environment constrains
further investment in
production and processing
capacity
23 Develop a sugar sector policy and strategy
100% 0% This strategy was not developed until 2012 through the National
Export Strategy, because the NES identified sugar as a priority
export crop. Government viewed sugar as an estate crop with
little farmer benefits. This view is changing, largely driven by
crisis management in reaction to the foreign exchange
shortages. Impact at 0% as strategy has only just been launched
24 Remove 7 per cent withholding tax from
smallholders
75% 75% It was removed in 2005, but then raised to 3% for the same
reasons as those in the tobacco sector

144
Groundnuts and Spices
Low productivity and
inconsistent quality limit the
realization of export potential
for groundnuts, other
legumes, and various spices,
all widely produced by
smallholders
25 Improve the availability of quality seed and of
technical information to farmers. Direct public
sector activity or financing may be needed for
foundation seed multiplication for legumes,
Farmer advisory services can be coordinated by
industry association in collaboration with
MOAI.
50% 25% The Farm Input Subsidy Program was the main reason for the
recent improvement in seed availability. However the slow
progress to implement SADC and COMESA MoU on seed
harmonization (resistance by domestic testing services) and a
lack of investment in extension services (because of FISP and
a lack of focus on the productive economy) mitigated progress.
26 Apply international standards and develop
necessary quality control systems. Develop
industry code of practice which incorporates
these standards.
25% 25% This is because the MBS is not internationally accredited and
very little SPS and standards capacity has been built in the past
10 years. One reason is the crowding out effect of FISP.
Another is the failure to view standards as a trade
facilitation role (lack of constituency for such services also
as firms perceive MBS to be unreliable and test in South
Africa), rather than a revenue generating or consumer
protection role.
Tea
Uncertainty regarding the
future viability and
competitiveness of tea
industry
27 Assess the impact of the recent (January 2003)
revision of electricity rates on the viability of
irrigation in tea production. Make additional
revisions if necessary
0% 0% Tea development in Malawi is affected by lack of
implementation of the new land policy. Tea has limited scope
for expansion, and lacks a constituency also because the
industry has limited drive to expand.
28 Ensure the management of STA/MATECO is
professional and independent from political
interference; and strengthen the smallholder
production support capacities of the organization
2% 0% This did not occur, largely due to lack of smallholder capacity
and external support.
29 Develop a successor scheme to the Stabex
program to assist tea growers to replant and shift
further to clonal varieties
0% 0% Lack of Government interest in the tea sector due to limited
scope for expansion and limited smallholder benefits and
economic spillovers.
30 Design and implement a code of practice to
enable the industry to comply with the technical
and social standards being set by the Tea
Sourcing Partnership
100% 50% The Tea Association of Malawi took the lead because it was
essential for market retention (success due to constituency).
Although most of the industry has adopted third party codes
such as Fair Trade.
31 Remove 7 per cent withholding tax from
smallholders
75% 75% This was implemented through 2004 reforms across most
sectors, (see tobacco and sugar)

145
Cotton
Very low productivity and
declining quality, low
ginnery capacity utilization,
and uncoordinated
interventions inhibit growth
and income generation
32 Through the planned Cotton Council, create and
implement a focused program of cotton R&D,
farmer advisory services, farmer group
development, and industry quality standards and
monitoring.
50% 25% The cotton council was never established mainly due to lack of
progress to enact the Cotton Bill. The main reason was a stop-
start approach by Government due to a lack of institutional
capacity. Its approach to developing the sector has been too
piecemeal such that the private sector and NGOs took the lead
through the Cotton Development Trust. The piecemeal effort
boils down to lack of Government capacity beyond its
investment in maize for food security. In terms of impact: some
progress being made, but the key challenges remain
unaddressed.
Textiles and Clothing
Generally unrealized
opportunity for garment
exports to the United States
under the AGOA initiative
Weak performance and
uncertainty surrounding
DWS inhibits textile exports
as well as forward and
backward linkages
33 Evaluate the implications of AGOA post 2004
rule of origin requirements for the Malawi
garment industry, in particular in relation to its
sourcing of cloth and accessories. Develop
negotiating strategy with government and
regional counterparts in preparation for
successor AGOA programs
50% 25% The evaluation was never carried out because the AGOA third
country fabric source rule was extended in 2004, 2008 and
2012. Negotiating strategy for all AGOA products developed in
2010, because of technical assistance to the Ministry of Industry
and Trade through the ODI Fellowship. The impact was less
significant because there was unrealized opportunity by Malawi
for garment exports to the United States. In addition MMTZ
preferential access was lost.
34 Intensify efforts to encourage FDI in the
garments sector
0% 0% This action was misplaced given the loss of market following
the end of the MMTZ preferential agreement with South Africa.
No FDI in the sector since 2003 because of this. Businesses
have shut.
35 Facilitate the strengthening of the Garment and
Textile Manufacturers Association in order to
address emergent industry problems and
improve public/private sector consultations
0% 0% The Association has weakened significantly following the
closing down of most garment manufacturers.
36 Strengthen the capacities for product design and
development among SME garment companies
0% 0% The capacity was weakened due to the loss of the MMTZ
preferential access to South Africa.
37 Accelerate the process of privatizing DWS and
if necessary during an interim period put in
place a management contract
100% 75% This was completed through the Privatization Program, which
in turn was driven by efforts to raise government revenues
(existence of constituency).
Food Products
Generally unrealized
opportunities to penetrate the
South African market for
higher value-added food
products
38 Encourage joint venture investments and other
strategic marketing arrangements
50% 25% The challenge still remains to attract investment on a necessary
scale that can tap on growing regional markets. Progress has
been made compared to 2003, but not on required scale. The
slow process to form MITC (which took 10 years) was due to
the lack of prioritization of the productive economy: if there
was such a prioritization, Government would have given
sufficient attention to this issue to drive the merger through in a
much quicker period of time. It also would have ensured the

146
allocation of sufficient resources to this activity. Impact at 25%
as the food processing industry has grown in the past 10 years,
but way below its potential.
IV Customs Reform and Other Institutional Capacity
Trade Finance
Transit Issues and Fees
Customs Documentation
Insurance and transit bond
Border post operating hours
Regional Trade Payment
system
More fully harmonize with
regional systems and
procedures
Phase out of PSI procedures
and implementation of the
WTO Customs Valuation
Agreement have not received
sufficient management
attention
39 Facilitate establishment of a trade finance
scheme
25% 0% No such scheme until 2012 when RBM launched the Export
Development Fund (EDF). The government was reluctant to
provide the MEPC with resources because focus was mainly on
food security. Main underlying reason was lack of strategic
focus to develop productive economy: the Government relied
on tobacco for revenue and hence did not see the need to
support exports. Impact at 0% as the EDF was only just
launched.
40 Enforce compliance mechanism for harmonized
transit fees
25% 25% Negotiations for harmonized transit fees in SADC and
COMESA are still underway hence a compliance mechanism
has not yet been developed. Driven by speed of regional
integration process.
41 Streamline customs documentation especially
for MSMEs
75% 50% The BESTAP project was a helpful intervention, and also the
simplified rules of origin have been very significant. MRA has
also invested in streamlining. Driven by constituency: MRA
effort to improve image and regional integration process.
42 Establish system similar to COMESA Yellow
Card
100% 75% The insurance companies were in a position to set this up. This
is driven by the regional integration process. However, non
COMESA countries are not that cooperative.
43 Harmonize border operating hours with
neighbors
100% 75% These have been harmonized even though the hours differ by
each border, on the back of trade facilitation efforts in SADC
and COMESA. This is driven by the regional integration
process.
44 Infrastructure development e.g. Electricity,
telephone and roads
75% 25% Investments made by MRA for SADC/COMESA trade
facilitation efforts – driven by regional integration process –
but infrastructure remains weak. Very remote areas remain hard
to reach though and vandalism is still a major challenge.
45 Need for standard pay system. Administration
needs computerizing
100% 75% Commercial Banks have made it possible for contract payment
and also there is e-filling. This is driven by the regional
integration process.
46 A speedy and standardized payment system
needed
75% 50% Online transactions have been made progress even though some
bureaucratic procedures still slow things down. There has been
slow progress on the implementation of tariff bands and this
is why there has been no action here.

147
Compliance with Customs
Regulations is lacking
47 Benchmark current status of harmonization with
regional initiatives and develop program for
further implementation
0% 0% Member states are still discussing the benchmarking
regional initiative, so MRA has been unable to move on this.
48 Senior managers workshop to assess the
implications of, and plan for, the retirement of
PSI services and the full implementation of
WTO valuation
75% 75% PSI has been phased out. MRA says full implementation of
WTO valuation has not been possible because the lack of a
system to prevent false declarations. The elimination of PSI
was driven by regional integration efforts.
49 Development of plan for sequencing the
retirement of PSI services
100% 100% This was completed, as per Action 48. The elimination of PSI
was driven by regional integration efforts.
50 Customs and staff to be trained prior to
retirement of PSI services and introduce post-
importation clearance
51 Set up Customs Commercial Investigation,
Intelligence and Post-Clearance Audit Units (to
be conjoined with the Tax Audit and
Investigation Directorate of MRA). This will
entail (i) identifying resource requirements, (ii)
writing position profiles, (iii) recruiting/training
personnel, and (iv) supervising start-up
operations.
75%
50%
It was done as part of the PSI retirement process, although more
training is required. The elimination of PSI was driven by
regional integration efforts.
75% 25% The Customs Commercial Investigation Unit has not been
established, but the Customs and Tax Investigation Division
has. The main reason for progress here was constituency:
MRA’s internal effort to improve its image relative to
corruption and inefficiency.
Ineffective implementation
of duty drawback schemes
52 Strengthen institutional capacity to administer
drawback program
75% 25% MRA now has a duty drawback desk and has invested in this as
it facilitates its operations and reduces administrative costs. The
main reason for progress here was constituency: MRA’s
internal effort to improve its image relative to corruption
and inefficiency. Tax revenue pressure also played a part.
53 Speed up establishment/implementation of the
drawback fund
50% 75% Improvements made, but the challenge in delivering speedy
refunds remains is because of the need for checks at MRA and
also Ministry of Finance. Government revenue pressures also
play a part. Reason, as with Action 52.
Lack of confidence in the
integrity of the organization
54 WCO workshop on Integrity 50% 25% MRA still has a lot of political interference. In 2012, MRA
launched a Customs-Business Forum to enhance the MRA’s
interface with business community. Staff integrity remains a
challenge given the incentive structure. The main reason for
the mixed progress here was constituency: MRA’s internal
effort to improve its image relative to corruption.

148
55 Develop and implement an integrity strategy
following the principles of the WCO’s Arusha
Declaration
25% 0% Implementation has not yet taken place despite the strategy has
been developed. Staff integrity remains a challenge given the
incentive structure. The MRA has lacked the resources and
institutional capacity to address this issue head-on.
56 Create clear perception: conduct workshops,
hold road shows and create civic education
program to and for the public
50% 25% MRA holds road shows around the country for taxpayer
education, but these rarely focus on integrity and they are more
focused on reporting rather than stopping the abuse of power.
Progress here is ultimately tied to Action 55.
Opportunity for standards
harmonization and regional
collaboration in ensuring
standards compliance
57 Support Malawi’s participation in SADC and
COMESA regional standards and technical
regulations initiatives
25% 25% Lack of inter-ministerial coordination. Lack of investment in
capacity by the Department of Agricultural Research Services
and Malawi Bureau of Standards, because of the lack of
management and financial resources allocated to such activities
by Government
58 Procure equipment to speed up testing services
25% 25% There was little technical assistance for international standards
bodies over the past ten years. The main reason was a dearth of
institutional capacity and constituency: a lack of government
prioritization of this area, and hence limited long-lasting
donor investments, and in addition the lack of reliance
placed by the private sector on the MBS.
V Trade Policy
Weak analytical capacity for
trade policy analysis and
implementation. Improve
capacity for negotiating at
the WTO and in regional and
bilateral agreements
Overlapping regional trade
integration efforts create
confusion among
policymakers and the
business community
59 Strengthen institutional structure for formulation
and implementation of trade policy and insure
that sufficient human resources are trained and
deployed.
25% 0% The main reason for limited progress is institutional capacity:
the lack of government prioritization over past ten years to develop
economic institutions, trade and the productive economy. This is
because improvements here require strong Government leadership
and commitment. Lack of human resources in the Ministry of Trade
especially on trade policy. Government institutional capacity is too
weak in the area, and numerous donor support programs have
proved unsustainable because they have failed to tackle this
institutional deficit: and as such those trained have either left or are
assigned tasks that are unrelated to their training. This suggests a
different prioritization by government.
60 Improve understanding of the WTO within the
government and private sector
25% 25% There is less coordinated effort to train core staff to undertake trade
analysis work. The focus is piecemeal and short term: those trained
in WTO matters do not work on WTO issues, suggesting a lack of
institutional capacity for long-term planning and prioritization.
61 Improve understanding of SADC, COMESA,
and AGOA within the public and private sector
50% 25% MoIT has hosted a number of good workshops but some areas such
as trade in services remain unaddressed. Furthermore, Malawi is not
benefiting from these initiatives, even though it is a participant,
because of trucking and transport issues. Those trained often work
in different areas, suggesting a lack of institutional capacity for

149
long-term planning.
62 Improve negotiating skills with respect to on-
going bilateral, regional, and multilateral trade
liberalization
25% 0% Negotiating skills have been lost over the past decade as staff left,
there is a shortage of applied trade economists and revenue
shortages constrained full participation in a number of regional
meetings. Government institutional capacity is too weak in this area:
e.g. SADC only has 1 officer and that officer is not full-time on
SADC. So negotiation planning meetings are organized at the last
minute.
63 Improve inter-ministerial coordination
25% 25% Lack of prioritization of the development of economic institutions
by government and development partners over the past decade. It
was reported that staff are too busy to plan regular coordination
meetings.
64 Conduct economic assessment of the
opportunities for increasing the economic
benefits from regional integration
75% 25% Only one study was conducted (PSIA) but there was little focus on
building the productive economy since focus has been more on
welfare poverty reduction programmes. This was conducted as part
of the National Export Strategy. Reason is lack of priorisation of
the need for such economic analysis.
65 Encourage dialogue between SADC and
COMESA members on a process of
rationalization of the integration process
75% 50% In 2004, there were significant efforts’ leading to the launching of
the tripartite regional framework in 2008. However, there is limited
understanding on the key issues relating to the upcoming Tripartite
Free Trade agreement, due to limited capacity to coordinate and
outreach at regional and local level. Reason for progress is the
institutionalization of the regional integration process.
Regional Integration efforts
continue to evolve and to
alter the business
environment
66 Assess opportunities and risks from negotiations
of US-SACU FTA and other initiatives
0% 0% This action was not done as it was not relevant since there were
some other more important issues such the Economic Partnership
Agreement (EPA) with the EU.
Lack of coordination
between institutions and
stakeholders is hampering
progress and creating
duplication of effort
67 Improve liaison with private sector advisory
groups such as the National Action Group and
the National Steering Committee on Trade
Policy
0% 0% There was limited will to improve liaison on trade policy over the
past decade, as other Government strategic objectives (food security,
above others) were prioritized. In interviews the private sector
claimed: there was lack of interest by government to focus on
trade policy and the productive economy. Consequently the
private sector considered such meetings were of limited value, and
learned to operate through lobbying for firm or industry specific
deals. The Government claims a lack of organizational capacity
to manage a constructive liaison program.

150
List of References
African Development Fund (2009), Macadamia Smallholder Development Project: Project Completion
Report, Agriculture and Agro-Industry Department (OSAN), African Development Bank (ADB), Malawi
Field Office, Lilongwe.
Agar, Jason and Kopicki, Ron (2010), Challenges in Malawi’s Agribusiness Sector, Volume II
Background Paper for Malawi Country Economic Memorandum, Poverty Reduction and Economic
Management (PREM), The World Bank, Washington DC.
APEC-OECD. 2005. “APEC-OECD Integrated Checklist on Regulatory Reform: A Policy Instrument for
Regulatory Quality, Competition Policy and Market Openness,” Accessed at
http://www.oecd.org/dataoecd/41/9/34989455.pdf
ASEAN. 2004. “ASEAN Mutual Recognition Arrangement Framework on Accountancy ServicesA,”
Accessed at http://vacpa.org.vn/upload/infodoc/mraaccountancy(feb09).pdf.
ASEAN. 2005. “ASEAN Mutual Recognition Arrangement on Engineering Services,” Accessed at
http://www.thaifta.com/trade/ascorner/asser_11.pdf.
ASEAN. 2007. “ASEAN Mutual Recognition Arrangement on Architectural Services,” Accessed at
http://www.aseanarchitectcouncil.org/pdf/amra.pdf.
Borchert, I., B. Gootiiz and A. Mattoo (2009), “Policy Barriers to International Trade in Services: New
Empirical Evidence”, Policy Research Working Paper 4917, Washington D.C.: The World Bank.
Brenton, P., and G. Isik (2012), “De-Fragmenting Africa” Deepening Regional Trade Integration in
Goods and Services”, The World Bank, Washingon DC.
Conway, P. and G. Nicoletti (2006), “Product Market Regulation in the Non-Manufacturing Sectors of
OECD Countries: Measurement and Highlights”, OECD Economics Department Working Papers No.
530.
Binswanger-Mkhize, Hans P; Keyser, John; Rohrbach, David; and Tchale, Hardwick (2010), Agriculture
Growth and Diversification, Volume II Background Paper for Malawi Country Economic Memorandum,
Poverty Reduction and Economic Management (PREM), The World Bank, Washington DC.
Crown Agents, Benchmark Study on Malawi’s Trade Facilitation Systems and Processes, Final Report,
April 2012.
Chirwa, Ephraim (2011). Analysis of the Tobacco Industry in Malawi, Wadonda Consult, Zomba.
Ellis, Karen; Singh, Rohit; and Musonda, Chiwama (2010). Assessing the Economic Impact of
Competition: Findings from Zambia, Overseas Development Institute (ODI), London.
Emmott, Andrew (2012). Value Chain Approach – Aflatoxin (Groundnuts), Southern Africa Trade Hub
Technical Report (March 2012), AECOM International Development for USAID, Southern Africa,
Southern Africa Trade Hub, Gaborone.
FAO (2012), Malawi MAFAP Country Profile, Food and Agriculture Organization, Monitoring African
Food and Agriculture Policies (MAFAP), Rome.

151
FUM (2012). The Malawian Farmer, Issue 2 (September 2012), Farmers Union of Malawi (FUM),
Lilongwe.
Government of Malawi, Malawi Growth and Development Strategy, 2011-2015, 2012.
Government of Malawi, Malawi Gazette Supplement Dated 28th December 2007, Customs and Excise
(Tariffs) Order 2007.
IFC, Doing Business Report, (2007-2013).
Integrated Framework, Malawi: Diagnostic Trade Integration Study, February 20, 2004.
IMF, Malawi, IMF Country Report
ITC, Malawi: Company Perspectives: An ITC Series on Non-Tariff Measures, 2012
Jaffee, Steven M. (2003) Malawi’s Tobacco Sector: Standing on One Strong Leg is Better than on None,
Africa Region Working Paper Series, No 55, The World Bank, Washington DC.
Jensen, Keyser, and Strychacz (2010), Non-Tariff Barriers and Regional Standards in the EAC Dairy
Sector, Africa Trade Policy Notes No. 2, The World Bank.
Keyser, John C. and Lungu, Victor (1997). Malawi Agriculture Comparative Advantage, World Bank,
Washington DC.
Keyser, John C (2012). Regional Quality Standards for Food Staples in Africa: Harmonization not
Always Appropriate, Africa Trade Policy Notes No. 33, The World Bank, Washington DC.
Lall S.V., Wang Hyoung, Munthali Thomas, Explaining High Transport Cost within Malawi: Bad Roads
or Lack of Trucking Competition, World Bank, Policy Research Working Paper 5133, November 2009.
Mangani, Ronald, Trade Facilitation in Malawi, UNECA, 2012
NKC (2010), The Role of Burley Tobacco in Selected African Economies and the Expected Impact of a
Decline in the Crop’s Production, NKC Independent Economists, Paarl.
OECD. 1997. “The OECD Report on Regulatory Reform: Synthesis,” Paris: OECD.
PASI, Paralegal Advisory Service Institute (2007). “Changing the Landscape,” Evaluation Report March
2007, Lilongwe, Malawi.
Southern Africa Trade Hub, Technical Report: Logistics Review of the Beira and Nacala Corridors,
August 2012.
SADC (2008). Technical Agreements on Harmonization of Seed Regulations in the SADC Region: Seed
Variety Release, Seed Certification and Quality Assurance, and Quarantine and Phytosanitary Measures
for Seed, Southern Africa Development Community (SADC), SADC Secretariat, Gaborone.
TAG, Competition Issues in the Transport Sector in Malawi: Passenger Services and Road Haulage,
October 2007.
Tchale, Hardwick and Keyser, John (2010). Quantitative Value Chain Analysis: An Application to
Malawi, World Bank Policy Research Working Paper, WPS 5242.
TERA International Group, Road Maintenance and Rehabilitation Project: Malawi Transport Cost
Study, April 2005.
152
Inter-University Council for East Africa (2011), “Rolling Strategic Plan 2011/12- 2015/16”.
Trolliet, C. and J. Hegarty (2003). “Regulatory Reform and Trade Liberalization in Accountancy
Services”, in Domestic Regulation & Services Trade Liberalization edited by Mattoo, A. and P. Sauve,
World Bank and Oxford University Press, 2003.
World Bank (2003), Malawi: Diagnostic Trade Integration Study, Integrated Framework, Geneva.
World Bank (2004), Country Economic Memorandum: Policies for Accelerating Growth, June 2004
World Bank (2007), Malawi Poverty and Vulnerability Assessment: Investing in Our Future, World
Bank, Washington DC.
World Bank (2008), “Report on the Observance of Standards and Codes: Malawi,” Washington DC: The
World Bank.
World Bank (2010a), Reform and Regional Integration of Professional Services in East Africa: Time for
Action. Washington, DC: World Bank.
World Bank (2010b), Country Economic Memorandum: Seizing Opportunities for Growth through
Regional Integration and Trade, Two Volumes, Report No. 47969-MW, Poverty Reduction and
Economic Management (PREM), World Bank, Washington DC.
World Bank (2011), Harnessing Regional Integration for Trade and Growth in Southern Africa,
Washington, DC: World Bank.
World Bank (2012a) Report on the Implementation of the Accountancy Professional Mutual Recognition
Agreement in the East African Community, forthcoming 2012
World Bank (2012b), Africa Can Help Feed Africa: Removing Barriers to Regional Trade in Food
Staples, Poverty Reduction and Economic Management (PREM), World Bank, Washington DC.
World Bank (2013), Report of the Joint Malawi-Zambia pre-validation Diagnostics Trade Integration
Study (DTIS) workshop, Chipata, Zambia, November 14, 2013.
World Economic Forum (2012), Global Competitiveness Report 2012. Geneva.
WTO, Trade Policy Review of Malawi, 2010.
WHO (2007) Crop Substitutes and Alternative Crops for Tobacco, study conducted by John Keyser for
The World Health Organization (WHO) Ad Hoc Study Group on Alternative Crops established by the
Conference of Parties of the WHO Framework Convention on Tobacco Control, World Health
Organization, Geneva.
Related Documents