Medical and surgical use of the gut in the treatment of obesity Rosalie Kiewiet-Kemper

Welcome message from author
This document is posted to help you gain knowledge. Please leave a comment to let me know what you think about it! Share it to your friends and learn new things together.
Transcript

Medical and surgical use of the gut in
the treatment of obesity
Rosalie Kiewiet-Kemper
Cover: Venus von Willendorf, Naturhistorisches Museum, Vienna, Austria
Cover design: Rosalie Kiewiet-Kemper & Optima Grafi sche Communicatie, Rotterdam
Lay-Out: Optima Grafi sche Communicatie, Rotterdam
Printed by: Optima Grafi sche Communicatie, Rotterdam
Copyright © 2010 R.M.Kiewiet-Kemper
All rights are reserved. No part of this publication may be reproduced, stored in a retrieval
system, or transmitted in any form or by any means, mechanically, by photocopying, record-
ing, or otherwise, without a written permission from the author.
Publication of this thesis was fi nancially supported by:
Allergan, Amgen, AstraZeneca, Eli Lilly, Ferring, Ipsen Farmaceutica, Novartis Pharma, Novo
Nordisk, Pfi zer, ProStrakan, Sanofi -Aventis, Vifor Pharma, Zambon.
Medical and surgical use of the gut in
the treatment of obesity
Medisch en chirurgisch gebruik van de darm voor de behandeling van obesitas.
Proefschrift
ter verkrijging van de graad van doctor aan de
Erasmus Universiteit Rotterdam
op gezag van de
rector magnifi cus
Prof. dr. H.G. Schmidt
en volgens besluit van het College voor Promoties.
De openbare verdediging zal plaatsvinden op
woensdag 5 januari 2011 om 15.30 uur
door
Rosalia Marije Kiewiet-Kemper
geboren te Dordrecht

PROMOTIECOMMISSIE
Promotor: Prof.dr. A.J. van der Lelij
Overige leden: Prof.dr. J.F. Lange
Prof.dr. J.A. Romijn
Prof.dr.ir. A.P.N. Themmen
Co-promotor: Dr.ir. J.A. Visser

CONTENTS
IntroductionChapter 1 Obesity. 9Chapter 2 Metabolic aspects of obesity: ghrelin, obestatin and adiponectin. 19Chapter 3 Outcome of surgical treatment of obesity: gallstones and quality
of life.
27
Part I Metabolic aspects of obesity: ghrelin, obestatin and
adiponectinChapter 4 Eff ects of acute administration of acylated and unacylated ghrelin
on glucose and insulin concentrations in morbidly obese subjects
without overt diabetes.
Eur J Endocrinology 2009; 161: 567-573
45
Chapter 5 Unacylated ghrelin acts as a potent insulin secretagogue in
glucose-stimulated conditions.
Am J Physiol Endocrinol Metab 2007; 293: E697-E704
59
Chapter 6 Bolus administration of obestatin does not change glucose and
insulin levels neither in the systemic nor in the portal circulation
of the rat.
Peptides 2008; 29: 2144-2149
77
Chapter 7 Acute eff ects of acylated and unacylated ghrelin on total and High
Molecular Weight adiponectin in morbidly obese subjects.
J Endocrinol Invest, 2010 Oct 15 (Epub ahead of print)
89
Part II Outcome of surgical treatment of obesity: gallstones and
quality of lifeChapter 8 Gallstone formation after weight loss following gastric banding in
morbidly obese Dutch patients.
Obes Surg 2006; 16: 592-596
105
Chapter 9 Quality of life after gastric banding in morbidly obese Dutch
patients: long-term follow-up.
Obes Res Clin Pract 2008; 2: 151-158
115
General discussion, perspectives and summaryChapter 10 General discussion 131
Summary 153Samenvatting 159List of abbreviations 171List of publications 177Dankwoord 183Curriculum Vitae 191


Introduction


Cha pter 1 Obesity

1.
2.
3.
4.
5.
6.
7.
8.
9.
10.
11.
12.
13.
14.
15.
16.
17.
18.
19.
20.
21.
22.
23.
24.
25.
26.
27.
28.
29.
30.
31.
32.
33.
34.
35.
36.
37.
38.
39.
Chap
ter 1
11
Obesity
1.1 INTRODUCTION
For centuries, obesity was a sign of wealth and well-being, and therefore a condition found in
the happy few only. This, however, changed drastically in the 20th century. At the end of the
20th century obesity had grown into a worldwide epidemic that threatened to overwhelm both
developed and developing countries,1 which stimulated medical profession and politics to
regard obesity as a serious health concern. In 1995, the World Health Organization accepted the
Body Mass Index (BMI) as the appropriate method to discern healthy weight from overweight
and obesity.2 Despite being arbitrary, a BMI of 25 kg/m2 is generally accepted as cut-off point
for overweight, while obesity is defi ned as a BMI of 30 kg/m2 or higher. Using these criteria,
the International Obesity Task Force estimated that at least 1.1 billion adults are overweight
world-wide.3 In the Netherlands, 46.9% of adults were overweight in 2008,4 while at least 10%
was obese.5
1.2 COMPLICATIONS OF OBESITY
The major burden of obesity to both patients and public health is the signifi cantly increased
morbidity and mortality.6, 7 Overweight and obesity are associated with large decreases in life
expectancy. For example, a Dutch study based on the Framingham Heart Study shows that
female and male forty-year-old non-smokers loose 3.3 and 3.1 years of life expectancy because
of overweight, while obese subjects loose 7.1 and 5.8 years, respectively.8 On average, each 5
kg/m2 increase in BMI is associated with about 30% higher all-cause mortality.6
Diseases associated with obesity can be classifi ed into two pathophysiological categories:
co-morbidity due to an absolute increase in fat mass and co-morbidity due to metabolic
changes resulting from excess fat mass.9 The last category, dominated by cardiovascular dis-
ease and type 2 diabetes and, to a smaller extent, malignancy, accounts for the largest part of
increase in morbidity and mortality.3, 6 Although it is likely that many factors are still unknown,
several pathophysiological mechanisms that account for the development of co-morbidity in
obesity have been identifi ed.
Type 2 diabetes is the disease with the strongest correlation with obesity: both insulin secre-
tion and insulin sensitivity are negatively infl uenced by obesity.9 Indeed, the risk of type 2 dia-
betes already increases from a BMI of 21 kg/m2 and correlates strongly with BMI.10 For example,
the Nurses Health Study shows that at a BMI above 35 kg/m2, the age-adjusted relative risk for
diabetes increases to 4000%.10 Additionally, weight gain is known to increase the risk of type
2 diabetes whereas after a moderate weight loss of 5-11 kg the risk decreases by nearly 50%.11
Insulin resistance is induced by an increase in the amount of fatty acids that infi ltrate tissues (e.g.
liver, skeletal muscle) and by an increase in circulating toxic adipokines (e.g. interleukin-1 (IL-1),
IL-6 and tumor necrosis factor α (TNFα)) produced by an increased amount of hypertrophic

1.
2.
3.
4.
5.
6.
7.
8.
9.
10.
11.
12.
13.
14.
15.
16.
17.
18.
19.
20.
21.
22.
23.
24.
25.
26.
27.
28.
29.
30.
31.
32.
33.
34.
35.
36.
37.
38.
39.
Chap
ter 1
12
Obesity
adipocytes.3, 12, 13 These cytokines promote a chronic infl ammatory state and have a negative
impact on cellular insulin sensitivity in peripheral tissues with increased intracellular lipids.13
In addition to that, infi ltration of fat into the pancreatic islet cells diminishes the islets’ capacity
to maintain the increased insulin output demanded by insulin resistance.3 Finally, adiponectin,
which has a strong insulin sensitizing eff ect, is known to be decreased in obesity.14-16
Hypertension and heart disease account for a large part in obesity associated morbidity
and mortality as well. In a large meta-analysis and a large prospective study, hypertension was
present in 38% and 55% of patients, respectively, and the risk of hypertension is up to fi ve times
higher among obese people.17-19 BMI and mortality from ischemic heart disease are strongly
positively correlated, and each 5 kg/m2 increase in BMI is associated with 40% higher ischemic
heart disease mortality.6 Multiple factors contribute to the development of hypertension in
obesity: increased angiotensinogen release from adipocytes, an increase in blood volume
associated with greater body mass and an increase in blood viscosity as a result of increased
release of procoagulant factors.3 Obesity associated heart disease results from both cardiac
failure due to altered hemodynamics, and coronary heart disease, which is mainly caused by
obesity-induced dyslipidemia.3
Excess body weight is increasingly recognized as an important risk factor for several types
of cancer. The mechanistic background of the observed association between malignancy and
overweight is not fully understood, but this link is thought to be the result of changes in the
insulin and Insulin-like Growth Factor (IGF) system, in sex steroids and in adipokines.20 BMI is
positively correlated with cancer mortality: an increase of 5 kg/m2 accounts for 10% higher neo-
plastic mortality.6 A large meta-analysis by Renehan et al. demonstrated that in men increased
BMI was associated with an increased relative risk ratio (RR) in oesophageal adenocarcinoma
(RR 1.52), thyroid (RR 1.33), colon (RR 1.24) and renal cancer (RR 1.24). A weaker but still sig-
nifi cant correlation was shown between increased BMI and melanoma, multiple myeloma,
rectal cancer, leukemia and non-Hodgkin lymphoma. In women, increased BMI was positively
associated with endometrial (RR 1.59), gallbladder (RR 1.59) and renal (RR 1.34) cancer, and
esophageal adenocarcinoma (RR 1.51). Weaker correlations were demonstrated in leukemia,
non-Hodgkin lymphoma and thyroid, pancreas, colon and postmenopausal breast cancer.21
The main diseases resulting from increased fat mass are psychosocial and psychiatric disor-
ders, obstructive sleep apnea and bone and joint disorders.
1.3 CAUSES OF OBESITY
The discussion on the causes of the epidemic is ongoing, especially on which environmental
factors can be held responsible for this major change in average body weight. It is generally
acknowledged that a decrease in physical activity in combination with relative overeating leads
to a chronic positive energy balance, thereby causing an increase in body weight.5 Indeed, in
1.
2.
3.
4.
5.
6.
7.
8.
9.
10.
11.
12.
13.
14.
15.
16.
17.
18.
19.
20.
21.
22.
23.
24.
25.
26.
27.
28.
29.
30.
31.
32.
33.
34.
35.
36.
37.
38.
39.
Chap
ter 1
13
Obesity
the last decades of the 20th century the availability of automobiles, computers and mechanical
aids removed the physical demands from daily life.1 Additionally, feeding habits changed rigor-
ously: food is easily available and generally high in energy density and low in satiating fi bers,
leading to high energy meals.1
Nevertheless, many wonder whether energy dysbalance in the present ‘obesogenic society’
is the only explanation for the increasing prevalence of obesity, since large inter-individual vari-
ability despite similar environmental factors still remains. Common observations that relatives
display the same tendency to become obese suggest that inherited factors may play an impor-
tant role as well. The importance of genetics has been confi rmed in twin and adoption studies.
Studies in adult identical twins reared apart show heritabilities up to 70%,22, 23 while a recent
study in children demonstrates a heritability of BMI of 77%.24 On the other hand, adoption
studies or general family studies give signifi cantly lower results of 30-60%.25 Surprisingly, the
infl uence of a shared childhood environment eff ect is relatively low (10%)24 or even absent.23
At present, several forms of monogenic obesity have been identifi ed, all based on muta-
tions in genes involved in the leptin-melanocortin pathway: leptin (Lep), leptin receptor (Lepr),
proopiomelanocortin (Pomc), melanocortin 4 receptor (MC4R), neurotrophic tyrosine kinase
receptor (TRKB) and single-minded homolog 1 (SIM1).25-28 Mutations in these genes all result in
severe, often childhood onset, obesity. Most mutations are extremely rare with the exception of
the MC4R mutation: this is present in about 1% of obese adults and in 5.8% of severe childhood
obesity.25, 29
On the other hand, polygenic obesity arises when an individual’s genetic pattern is suscep-
tible to an environment that promotes energy consumption over energy expenditure. This
unfavorable genetic makeup is mostly based on single nucleotide polymorphisms (SNPs), and
several genome wide association studies have been performed to identify involved genes.30, 31
At present, common variants at two loci, FTO and MC4R, have been reproducibly shown to be
modestly associated with BMI,32, 33 but it is expected that many more will follow. In this respect,
the recently formulated concept of nutrigenetics, which studies the role of genetic variation on
interactions between diet and health, is a challenging new area. In the future, it could possibly
provide us with personalized strategies to prevent or treat obesity.34
Additionally, in recent years the knowledge on adipose tissue, the digestive tract and the
hypothalamus, and on their role in energy balance has increased dramatically. The adipokines
(e.g. leptin and adiponectin), the gut hormones (e.g. ghrelin, peptide tyrosine tyrosine (PYY),
glucagon-like peptide 1 (GLP-1), cholecystokinin (CCK)) and the hypothalamic pathways involv-
ing neuropeptide Y (NPY) and agouti-related peptide (AgRP) constitute a complex mechanism
that is designed to regulate short-term meal intake and long term body weight.35 Therefore, it is
hypothesized that deregulation of this system contributes to the development of obesity. Up to
now, disruption of energy homeostasis as a cause of obesity has only been shown in the above-
mentioned monogenic disorders interfering with downstream pathways of leptin signaling
within the brain.27, 28 Since dysfunction of this pathway mostly interferes with adequate food
1.
2.
3.
4.
5.
6.
7.
8.
9.
10.
11.
12.
13.
14.
15.
16.
17.
18.
19.
20.
21.
22.
23.
24.
25.
26.
27.
28.
29.
30.
31.
32.
33.
34.
35.
36.
37.
38.
39.
Chap
ter 1
14
Obesity
intake, it is challenging to hypothesize that factors contributing to inter-individual variation in
bodyweight are more likely to change food intake than to infl uence the effi ciency with which
ingested nutrients are stored or disposed, as was previously assumed.28
1.4 TREATMENT OF OBESITY
Since obesity is regarded as a physical and psychological burden to most patients, establishing
eff ective treatment modalities for this condition has the highest priority. Although patients
generally regard weight reduction as their primary goal of therapy, reduction of (the risk of )
co-morbidity is equally important. Therefore, eff ective anti-obesity treatment should be able to
induce signifi cant and persistent weight loss, resulting in improvement of present co-morbidity
and reduction of the risk to develop obesity-associated diseases. At present, three diff erent
treatment modalities have been proven to be more or less eff ective: lifestyle modifi cation,
pharmacotherapy and bariatric surgery.
1.4.1 Lifestyle intervention
Mammals, including men, possess a powerful and complex orexigenic system to protect them
in periods of food deprivation.35 However, there appears to be no eff ective counter-regulatory
mechanism to protect individuals from caloric overabundance, a condition that is present
in large parts of the world. Therefore, a decrease in physical activity in combination with
relative overeating is regarded as the central cause of obesity.5 Based on this hypothesis, the
cornerstone of anti-obesity treatment should be dietary modifi cation (i.e. reduced-calorie diet,
regardless of macronutrient composition)36 together with increased physical exercise.1, 37
Lifestyle intervention is proven to be eff ective in establishing moderate but relevant weight
reduction,38 thereby resulting in improvement in insulin sensitivity, blood pressure and lipid
profi le.39-41 Physical activity acts directly by improving metabolic parameters and indirectly by
promoting weight reduction.
One of the main concerns of lifestyle changes is its poor long-term adherence.40, 42 While
treatment is eff ective on short-term, on long-term patients tend to revert to their former obesity
promoting lifestyle, maintaining only part of the changes achieved or returning to their initial
status before treatment. Active long-term follow-up seems to positively infl uence long-term
adherence.40, 43
1.4.2 Pharmacotherapy
In the Netherlands, only orlistat is currently available for the treatment of obesity. Orlistat is
a gastrointestinal lipase inhibitor that reduces dietary fat absorption by 30% by preventing
the hydrolysis of ingested triglycerides.44 A large meta-analysis has demonstrated that orlistat
reduced weight by 2.9 kg more than placebo did.45 Additionally, orlistat signifi cantly reduced
1.
2.
3.
4.
5.
6.
7.
8.
9.
10.
11.
12.
13.
14.
15.
16.
17.
18.
19.
20.
21.
22.
23.
24.
25.
26.
27.
28.
29.
30.
31.
32.
33.
34.
35.
36.
37.
38.
39.
Chap
ter 1
15
Obesity
waist circumference, BMI, blood pressure, total cholesterol, low-density lipoprotein (LDL) cho-
lesterol, high-density lipoprotein (HDL) cholesterol and fasting glucose.45, 46 Incidence of type
2 diabetes was reduced in patients with impaired glucose tolerance. Unfortunately, data on
morbidity and mortality are not available.45, 46 As a result of its mechanism of action, the main
side eff ects of orlistat are fatty stools, fecal urgency and oily spotting.45, 46
In the last decade two other drugs have been registered as a treatment for obesity:
rimonabant and sibutramine. After a promising start, both have been withdrawn due to
unacceptable side eff ects. Sibutramine was a centrally acting specifi c reuptake inhibitor for
norepinephrine and serotonin, reducing food intake by enhancing satiety.47, 48 However, it has
recently been shown to increase cardiovascular death and was withdrawn in January 2010.
Rimonabant was a selective blocker of the cannabinoid receptor CB1, thereby reducing appe-
tite. Blockade of this receptor, however, appeared to be related to severe depression and the
prevalence of suicide has been shown to be signifi cantly higher in patients using rimonabant.49
In 2008, the European Medicines Agency advised against the prescription of rimonabant.
In conclusion, the eff ects of pharmacological intervention on weight loss are limited. Addi-
tionally, results on morbidity and mortality are lacking, while two formerly registered drugs had
unacceptable side eff ects. At present, it is advised to restrict the use of pharmacotherapy to
patients with insuffi cient weight loss during participation in a lifestyle intervention program.5
1.4.3 Bariatric surgery
In the 1950s, surgery was introduced to treat obesity. Bariatric surgery is based on either restric-
tion of food intake or malabsorption of ingested food.50 The most frequently used restrictive
procedure is gastric banding: a laparoscopic adjustable gastric band (LAGB) is placed around
the stomach to reduce the gastric volume, thereby decreasing the amount of food possible to
ingest. On the other hand, biliopancreatic diversion with duodenal switch (BPD-DS) induces
malabsorption by bypassing the duodenum and jejunum by means of a newly formed anas-
tomosis between stomach and ileum. Additionally, (Roux-en-Y) gastric bypass (GB) combines
restriction and malabsorption. In this procedure, the stomach is divided into a small proximal
reservoir accompanied by bypass of the remaining stomach, duodenum and proximal jejunum.
The small bowel is divided as well and re-arranged into a Y-confi guration, to enable outfl ow of
food from the small upper stomach pouch, via a “Roux limb”.50 These three surgical techniques
account for 90% of bariatric procedures performed worldwide.51
1.4.3.1 Eff ectivity
All bariatric procedures result in substantial and clinically relevant weight loss, with a mean
of 55.9% to 61.2% of excess weight loss (EWL).52, 53 In general, malabsorptive procedures are
more eff ective in weight reduction than purely restrictive surgery. One year after surgery, EWL
is 25% higher in favor of GB vs LAGB.54 Indeed, pooled data of a large meta-analysis show aver-
age weight loss of 46.2% EWL after LAGB, 59.5% after laparoscopic GB and 63.6% after BPD.52
1.
2.
3.
4.
5.
6.
7.
8.
9.
10.
11.
12.
13.
14.
15.
16.
17.
18.
19.
20.
21.
22.
23.
24.
25.
26.
27.
28.
29.
30.
31.
32.
33.
34.
35.
36.
37.
38.
39.
Chap
ter 1
16
Obesity
However, morbidity and mortality are slightly higher after laparoscopic GB than after LAGB.
Biertho et al. reported major perioperative complication rates of 2.0% in laparoscopic GB versus
1.3% in LAGB, early postoperative major complication rates were 4.2% versus 1.7% respectively,
and mortality rate was 0.4% versus 0%, respectively.55 Recently, Flum et al. reported 30-day
major complication (deep-vein thrombosis, venous thromboembolism, reintervention and
failure to be discharged) rates of 1.0% in LAGB vs. 4.8% and 7.8% in laparoscopic and open GB,
respectively.19 The 30-day mortality rates were 0.0%, 0.2% and 2.1%, respectively.19 These data
show that bariatric surgery is highly eff ective in reducing weight accompanied by relatively low
morbidity and mortality.
Nevertheless, the main parameter of effi cacy of bariatric surgery is its eff ect on improvement
of co-morbidity. A large meta-analysis by Buchwald et al. demonstrated that hypertension
resolved in 61.7% of patients, while either resolution or improvement was present in 78.5%.53
The same study showed that hyperlipidemia improved in at least 70% of patients.53 These
improvements are clearly of clinical relevance. Nevertheless, the benefi cial eff ects of bariatric
surgery on type 2 diabetes are most impressive. Notably, the ability to induce complete resolu-
tion of type 2 diabetes (defi ned as the ability to discontinue all diabetes-related medication)
depends on the type of operative procedure: after BPD the resolution is 98.9%, after GB 83.7%
and after LAGB 47.9%.53
At present bariatric surgery is by far the most eff ective long-term treatment of obesity. The
Swedish Obese Subjects (SOS) study shows that after 2 years follow-up, weight loss in surgically
treated patients (LAGB, laparoscopic GB and vertical banded gastroplasty (VBG)) was -23.4%
vs. +0.1% in a contemporaneously matched conventionally treated control group, while after
10 years weight loss was -13.2% (LAGB), -16.5% (VBG) and -25.0% (laparoscopic GB) vs. +1.6%,
respectively.56 This diff erence in long-term weight change had signifi cantly benefi cial eff ect
on co-morbidity. Recovery rate of type 2 diabetes after 2 and 10 years was 72% and 36% in the
surgically treated group vs. 21% and 13% in the conventionally treated group.56 Less impres-
sive, but still signifi cantly diff erent was the recovery rate of hypertension: 34% and 19% in the
surgically treated group vs. 21% and 11% in the conventionally treated group.56 Finally, overall
mortality in the surgically treated group was signifi cantly lower with a hazard ratio of 0.76, as
compared to the control group.57 These favorable long-term results have been confi rmed by
Adams et al., who demonstrated that during a mean follow-up of 7.1 years, all-cause mortal-
ity decreased by 40% after surgery, as compared with that in a non-treated severely obese
population. Cause-specifi c mortality in the surgery group decreased by 56% for coronary artery
disease, by 92% for diabetes, and by 60% for cancer.58
1.4.3.2 Mechanism of action
While surgical procedures are based on food restriction, malabsorption, or both, it becomes
increasingly likely that additional mechanisms are involved. Several observations, especially
regarding the dramatic improvement in glycemic control after bariatric surgery, have
1.
2.
3.
4.
5.
6.
7.
8.
9.
10.
11.
12.
13.
14.
15.
16.
17.
18.
19.
20.
21.
22.
23.
24.
25.
26.
27.
28.
29.
30.
31.
32.
33.
34.
35.
36.
37.
38.
39.
Chap
ter 1
17
Obesity
necessitated the search for alternative explanations. At fi rst, type 2 diabetes often resolves
within several days to weeks after GB, long before substantial weight loss has occurred. Sec-
ondly, GB and BPD have been shown to achieve greater glycemic improvement than other
weight reduction interventions (either lifestyle intervention of LAGB) with equivalent weight
loss. Finally, GB and BPD result in almost complete resolution of type 2 diabetes, despite the fact
that patients are still overweight.53, 59, 60 These observations have led to the hypothesis that the
improvements in glycemic control, reduction in appetite and subsequent weight loss following
GB and BPD result from changes in gut hormone profi les.60, 61
Several hypotheses regarding changes in gut hormone profi les mediating the eff ects of
bariatric surgery have been postulated. For example, concentrations of the orexigenic gut
hormone ghrelin, which is almost exclusively produced by the stomach, have been observed
to remain extremely low after GB, although ghrelin concentrations are generally known to
increase after weight loss. Since ghrelin is known to induce insulin resistance, a decrease in
ghrelin concentrations could contribute to the improvement of insulin sensitivity after bariatric
surgery.60 Additionally, gastrointestinal bypass could lead to expedited delivery of nutrients to
the lower bowel, resulting in early secretion of GLP-1 and PYY. Both peptides induce satiety, and
GLP-1 additionally stimulates food-dependent insulin secretion.60, 62
All hypotheses regarding changes in gut hormone profi les after bariatric surgery demand
confi rmation. Nevertheless, it is challenging that bariatric surgery seems to extend beyond
mechanically restricting food intake and/or inducing malabsorption and that in the future it
should be regarded as ‘metabolic surgery’.


Cha pter 2Metabolic aspects of obesity:
ghrelin, obestatin and adiponectin


1.
2.
3.
4.
5.
6.
7.
8.
9.
10.
11.
12.
13.
14.
15.
16.
17.
18.
19.
20.
21.
22.
23.
24.
25.
26.
27.
28.
29.
30.
31.
32.
33.
34.
35.
36.
37.
38.
39.
Chap
ter 2
21
Metabolic aspects of obesity
2.1 GHRELIN
2.1.1 Introduction
Ghrelin, a 28-amino acid peptide produced mainly by the stomach, was originally discovered
as the natural ligand of the Growth Hormone Secretagogue Receptor type 1a (GHS-R1a).63 Its
unique molecular structure is characterized by n-octanoylation of serine at position 3 (acylated
ghrelin, AG), which is essential for binding to the GHS-R1a.63 However, in vivo, most circulating
ghrelin is unacylated (UAG), which was consequently thought to be devoid of any endocrine
action.64 Indeed, UAG does not share with AG its potent growth hormone (GH) stimulating
eff ect,63, 65, 66 but more recent studies have shown that UAG does have intrinsic biological
eff ects.67-70 However, a receptor through which UAG exerts its eff ects is not identifi ed yet.
Despite being primarily identifi ed as a potent GH stimulating factor, ghrelin has been
demonstrated to have a wide spectrum of biological activities, such as stimulation of prolactin
and adrenocorticotropic hormone (ACTH) secretion, promotion of gastric motility and acid
secretion, and modulation of cardiovascular function.71-75
2.1.2 Regulation of energy homeostasis
The identifi cation of the stomach as the principal site of production of the most important
endogenous growth hormone secretagogue (GHS), having its main eff ect in the pituitary
region, was surprising.63 It was therefore hypothesized that ghrelin functioned as an endocrine
link between the digestive tract and the hypothalamus-pituitary system. Indeed, ghrelin was
demonstrated to play an important role in energy balance. Acute administration of ghrelin to
rodents induced an increase in food intake and body weight.76, 77 In agreement, human subjects
experienced appetite after administration of ghrelin.78 Eventually, ghrelin was shown to display
a preprandial rise, followed by a sharp decrease after food intake, supporting the hypothesis
that ghrelin plays a physiological role in meal initiation in humans.79-81 In conclusion, ghrelin
was found to be one of the most powerful orexigenic and adipogenic agents known in mam-
malian physiology.
Ghrelin functions as a short-term meal regulator, but on the other hand, ghrelin concentra-
tions are aff ected by long-term energy homeostasis. At fi rst, excess ghrelin concentrations were
thought to cause obesity. However, studies comparing plasma ghrelin concentrations in obese
and normal weight subjects showed opposite results: obesity was associated with low ghrelin
concentrations.82 Additionally, diet induced weight loss resulted in an increase of ghrelin con-
centrations.83, 84 Therefore, low ghrelin concentrations in obesity rather seem compensatory
than causative.
In contrast to other potent orexigenic agents, such as NPY and AgRP, which are solely active
when administered intracerebroventricular, ghrelin exerts an orexigenic and adipogenic eff ect
when administered both in the brain and peripherally.76, 85 The exact position of ghrelin within
the extremely complex network of the regulation of energy balance in which the hypothalamus
1.
2.
3.
4.
5.
6.
7.
8.
9.
10.
11.
12.
13.
14.
15.
16.
17.
18.
19.
20.
21.
22.
23.
24.
25.
26.
27.
28.
29.
30.
31.
32.
33.
34.
35.
36.
37.
38.
39.
Chap
ter 2
22
Metabolic aspects of obesity
plays a central role in appetite regulation, is not completely elucidated yet. Transfer of peripheral
signals to hypothalamic activation is most likely mediated in the ventromedial arcuate nucleus,
where neurons co-expressing NPY-, AgRP- and GHS-R are demonstrated.86 Indeed, the arcuate
nucleus is not protected by the blood-brain barrier.87 Finally, it remains to be demonstrated
whether ghrelin solely exerts its adipogenic and orexigenic eff ect through the GHS-R1a or that
another, not yet identifi ed receptor is involved as well.
2.1.3 Glucose/insulin metabolism
So far, it is not known which mechanism is responsible for the increase during fasting and the
postprandial decrease in ghrelin concentrations. The main focus of ghrelin production being
the stomach suggests food to inhibit ghrelin secretion after a meal. Indeed, ingestion of car-
bohydrates strongly suppresses ghrelin secretion, in a larger extent than protein and fat do.88
This inhibitory eff ect of glucose on ghrelin is at least partly mediated by insulin, since insulin
as well was demonstrated to have a direct negative eff ect on ghrelin concentrations during
hyperinsulinemic euglycemic clamps in humans.89
Vice versa, ghrelin is reported to have an impact on insulin secretion and glucose homeo-
stasis as well. In humans, peripheral injection of AG was followed by an acute and signifi cant
increase in glycemia.90, 91 Since the eff ects of AG on glucose and insulin concentrations lasted
signifi cantly longer than the short transient GH peak, it was suggested that this eff ect was
GH-independent.90 Indeed, in vitro AG was shown to hamper the inhibitory eff ect of insulin on
gluconeogenesis in a hepatoma cell line. Additionally, AG was shown to induce a rapid increase
in glucose and insulin concentrations in GH defi cient subjects.68, 91
The eff ect of UAG on glucose and insulin metabolism is less clear. Since UAG is not able
to bind to the GHS-R1a, it was assumed not to have any endogenous eff ect on glucose and
insulin, which was initially confi rmed in a human study.65 However, UAG appeared to be able
to counteract the decrease in insulin sensitivity induced by AG in GH defi cient subjects. Acute
co-administration of AG and UAG in a 1:1 ratio was even demonstrated to signifi cantly improve
insulin sensitivity.91 Additionally, continuous intravenous administration of UAG was shown to
decrease glucose concentrations without aff ecting insulin concentrations, which suggests an
increase in insulin sensitivity.92
In conclusion, available results suggest that AG and UAG, although being derived from the
same molecule, are able to modify each other’s actions on glucose homeostasis. The recep-
tor to which UAG is able to bind, and that might mediate AG’s eff ect on glucose and insulin
metabolism as well, needs to be identifi ed.
1.
2.
3.
4.
5.
6.
7.
8.
9.
10.
11.
12.
13.
14.
15.
16.
17.
18.
19.
20.
21.
22.
23.
24.
25.
26.
27.
28.
29.
30.
31.
32.
33.
34.
35.
36.
37.
38.
39.
Chap
ter 2
23
Metabolic aspects of obesity
2.1.4 Ghrelin, aim of the thesis
2.1.4.1 Chapter 4
Obesity is a condition characterized by insulin resistance eventually leading to type 2 diabetes.93
Subjects suff ering from obesity usually display very low GH concentrations.94 Since the study
by Gauna et al. reported a signifi cant improvement in insulin sensitivity after co-administration
of AG and UAG to GH defi cient subjects,91 we evaluated whether this eff ect could be repro-
duced in obese subjects as well. Being able to improve insulin sensitivity in obese subjects may
implicate a fi rst step towards a new treatment modality for type 2 diabetes. Additionally, we
intended to clarify the role of UAG in glucose and insulin homeostasis.
2.1.4.2 Chapter 5
Both AG and UAG are predominantly produced in the stomach but the pancreas produces both
peptides as well.95-97 This means that they are primarily secreted into the portal circulation
and that they pass the liver before entering the systemic circulation. Since both AG and UAG
are reported to have hepatic eff ects as well, we hypothesized that measuring portal insulin
and glucose concentrations may be more informative than measurements in the systemic
circulation. Therefore, we used a rat model in which both the jugular and the portal vein were
cannulated, allowing us to simultaneously measure glucose and insulin concentrations in the
systemic and portal circulation. In the present model we assessed whether blockade of endog-
enous AG action (by blocking the GHS-R1a), or administration of exogenous AG, UAG, or their
combinations diff erentially aff ect glucose and insulin concentrations in the portal and systemic
circulation after an intravenous glucose tolerance test (IVGTT).
2.2 OBESTATIN
2.2.1 Introduction
In 2005 Zhang et al. discovered a second peptide derived from the preproghrelin polypeptide.98
Using a bioinformatic approach, they were able to identify a second conserved region in the
ghrelin gene, encoding a 23 amino acid peptide, which they called obestatin.98 Plasma ghrelin
and obestatin appeared not to be strictly correlated and were even diff erentially regulated in
fasted and fed conditions, which supported the hypothesis that obestatin had endogenous
physiological eff ects.98 This hypothesis seemed to be confi rmed when obestatin was demon-
strated to be the natural ligand of the G protein-coupled receptor 39 (GPR39).98
2.2.2 Anorexigenic eff ect
One of the most intriguing functions of obestatin was its anorexigenic eff ect in rodents. Acute
intracerebroventricular and intraperitoneal administration of obestatin suppressed food intake,

1.
2.
3.
4.
5.
6.
7.
8.
9.
10.
11.
12.
13.
14.
15.
16.
17.
18.
19.
20.
21.
22.
23.
24.
25.
26.
27.
28.
29.
30.
31.
32.
33.
34.
35.
36.
37.
38.
39.
Chap
ter 2
24
Metabolic aspects of obesity
while daily administration of obestatin suppressed body weight gain and induced delayed
gastric emptying.98 This implicated that obestatin and ghrelin, despite being derived from the
same prohormone, were functional antagonists. However, the majority of subsequent studies
were not able to replicate this anorexigenic eff ect.99-104 Additionally, obestatin proved not to be
the ligand for GPR39,105-107 which was later indeed confi rmed by the original authors.108 Since
positive studies on the inhibitory eff ect of obestatin on food intake are still reported as well,109,
110 the discussion on this topic is not closed yet.
2.2.3 Glucose/insulin metabolism
Since AG is known to induce insulin resistance,68, 90, 111 it could be hypothesized that obestatin
does infl uence glucose and insulin homeostasis as well. Up to now, data on this subject are
limited. Two previous studies have extensively evaluated the eff ects of obestatin administra-
tion on glucose and insulin levels in rodents.109, 112 The eff ects they observed were small, if
any. However, a problem that they may have encountered in evaluating the eff ect of obestatin
on glucose and insulin metabolism is its short half-life.87 Obestatin is mainly produced in the
stomach and might accordingly exert its eff ect primarily in the portal system.98 Therefore,
assessment of systemic insulin and glucose concentrations may fail to demonstrate its eff ect.
2.2.4 Obestatin, aim of the thesis, chapter 6
To evaluate the acute eff ects of intravenously administered obestatin, we used the previously
described rat model, which allowed us to simultaneously measure glucose and insulin con-
centrations in the systemic and portal circulation.113, 114 The aim of this study was to evaluate
whether obestatin plays a role in glucose and insulin metabolism, and if so, whether it acts as a
functional antagonist of (acylated) ghrelin.
2.3 ADIPONECTIN
2.3.1 Introduction
Adiponectin (previously also known as Acrp30, AdipoQ or GBP28) is the most abundant adi-
pokine, representing approximately 0.05% of total serum protein.15, 115-117 It is exclusively pro-
duced by white adipose tissue (WAT).115 In contrast to other adipokines like resistin and leptin
that parallel fat cell mass, adiponectin concentration is decreased in obesity.14, 15 Hypertrophic
adipocytes in obesity have been shown to display decreased adiponectin action.118
Adiponectin’s molecular structure shows striking homology with complement 1q (C1q).15, 115
Corresponding to the complement 1q family, adiponectin forms trimers connected by disulfi de
bonds.115 In circulation, adiponectin exists in three isoforms: a trimer (low molecular weight,
LMW), a hexamer (trimer-dimer, medium molecular weight, MMW) and an oligomer (high molec-
ular weight, HMW).119 It has been suggested that HMW adiponectin is the active isoform.119, 120
1.
2.
3.
4.
5.
6.
7.
8.
9.
10.
11.
12.
13.
14.
15.
16.
17.
18.
19.
20.
21.
22.
23.
24.
25.
26.
27.
28.
29.
30.
31.
32.
33.
34.
35.
36.
37.
38.
39.
Chap
ter 2
25
Metabolic aspects of obesity
Two receptors through which adiponectin exerts its eff ects have been identifi ed: AdipoR1,
which is ubiquitously expressed and mediates 5’ adenosine monophosphate-activated protein
kinase (AMPK) activation, and AdipoR2, which is mostly expressed in liver and mediates peroxi-
some proliferator-activated receptor α (PPARα) activation.16
2.3.2 Insulin sensitivity
Both functional and genetic studies on adiponectin strongly suggest that reduced adiponectin
levels play a causal role in the development of insulin resistance, metabolic syndrome and type
2 diabetes.118 Low circulating adiponectin levels correlate strongly with markers of insulin resis-
tance and metabolic syndrome (e.g. systolic blood pressure, plasma glucose, HDL-cholesterol,
triglyceride (TG) and Homeostasis Model Assessment for Insulin Resistance (HOMA-IR)) and low
levels have been shown to be a strong risk marker for metabolic syndrome and type 2 diabetes,
independent of obesity.121-124 Additionally, mutations in human adiponectin resulting in low
plasma concentrations or impaired multimerisation are related to type 2 diabetes.125
Adiponectin improves insulin sensitivity by reducing tissue TG content, thereby improving
insulin signal transduction, by activating PPARα, which leads to fatty-acid combustion, and
fi nally by activating AMPK, which induces β-oxidation and glucose uptake.16 While adiponectin
strongly improves insulin sensitivity, insulin on the other hand has been demonstrated to be a
strong suppressor of adiponectin concentration.126, 127
In conclusion, it has been hypothesized that low adiponectin levels and high insulin levels
display a vicious cycle in the early stages of obesity: obesity leads to low circulating adiponectin
concentrations which results in increased insulin resistance. To overcome relative insulin insuf-
fi ciency insulin levels will increase, which in turn decreases adiponectin levels even further.126
Therefore, adiponectin might play a crucial causal role in the development of insulin resistance
and type 2 diabetes in obesity.16
2.3.3 Adiponectin, aim of the thesis, chapter 7
Energy homeostasis and body weight are regulated by a highly complex network involving
brain, digestive tract and WAT.35 Circulating gut hormones (e.g. ghrelin, GLP-1, CCK) and adipo-
kines (e.g. leptin and adiponectin) connect digestive tract and WAT with hypothalamic centers,
thereby modulating food intake and energy expenditure.35, 128, 129
Signaling pathways connecting digestive tract and WAT are less known. Both ghrelin and
adiponectin concentrations are decreased in human obesity, a condition characterized by
insulin resistance.93 Therefore, we used human obesity as a model to study the eff ects of acute
intravenous administration of UAG and the combination of AG and UAG on adiponectin con-
centration, either directly or indirectly through changes in plasma insulin concentrations. Since
HMW adiponectin has been suggested to be the most active isoform we measured both total
and HMW adiponectin plasma concentrations.


Cha pter 3Outcome of surgical treatment of
obesity: gallstones and quality of life

1.
2.
3.
4.
5.
6.
7.
8.
9.
10.
11.
12.
13.
14.
15.
16.
17.
18.
19.
20.
21.
22.
23.
24.
25.
26.
27.
28.
29.
30.
31.
32.
33.
34.
35.
36.
37.
38.
39.
Chap
ter 3
29
Outcome of surgical treatment of obesity
3.1 GALLSTONES
3.1.1 Introduction
Cholelithiasis is a common condition among the overweight and obese, and it is well known
that obesity is a major risk factor for the development of gallstones.130, 131 The Nurses’ Health
Study cohort demonstrated an age-adjusted RR for development of gallstones of 6.0 for women
with a BMI > 32 kg/m2, compared with women whose BMI was < 20 kg/m2. The incidence rate
of gallstones is linearly associated with BMI.132, 133 Although the incidence of gallstones is high
in obesity, most of the patients are asymptomatic and do not require treatment.131, 134 In the
general population, the mean likelihood of symptoms occurring by 5 years is 17%.135 However,
it is unknown whether these results can be extrapolated to the obese subpopulation.
The majority of gallstones (87%) in obesity appear to be cholesterol stones.136 At least
three physical conditions are necessary for the formation of cholesterol gallstones: unphysi-
ologic cholesterol supersaturation of hepatic bile, presence of nucleating factors promoting
cholesterol crystal precipitation, and gallbladder hypomobility causing stasis of bile.131, 137 The
mechanism of increased cholesterol stone formation in obesity is a combination of excessive
hepatic cholesterol secretion accompanied by increased gallbladder volumes, and possibly
decreased gallbladder contractility, facilitating precipitation of cholesterol into stones.131, 138-140
3.1.2 Gallstones after weight loss
While obesity is a major risk factor for the development of gallstones, rapid weight loss, induced
by either dieting or bariatric surgery, further increases the risk. Additional to the above men-
tioned mechanism of increased cholesterol gallstone formation in obesity, weight loss induces
a further increase in cholesterol clearance into the gallbladder due to cholesterol mobilization
from adipose tissue.130, 139-141 Furthermore, it has been suggested that reduced food intake,
especially after bariatric surgery, causes less frequent and less eff ective stimulation of gallblad-
der contraction, resulting in bile stasis which facilitates gallstone formation.140, 142 However,
unchanged gallbladder kinetics have been observed by others.139 Nevertheless, it has been
established that the rate and amount of weight loss (> 1.5 kg/week, or > 24% of initial body
weight) plays a crucial role in the development of gallstones.130, 131, 140, 142-144
Many studies have evaluated the incidence of gallstones after weight loss, especially when
induced by bariatric surgery. Surprisingly, reported postoperative prevalence of asymptomatic
gallstones or incidence of symptomatic gallstones after surgery varies widely. Screening for
gallstones by ultrasound results in postoperative prevalences of 27% to 71%.130, 140, 142, 145,
146 Symptomatic gallstones (i.e. patients requiring cholecystectomy) are reported in 3% to
40.5%.130, 142, 145-153
Since the rate of weight loss has been shown to be an important risk factor for the develop-
ment of gallstones after bariatric surgery, it is likely that most gallstones develop in the fi rst
period after surgery. Stone formation has been reported as early as 6 weeks after surgery,140

1.
2.
3.
4.
5.
6.
7.
8.
9.
10.
11.
12.
13.
14.
15.
16.
17.
18.
19.
20.
21.
22.
23.
24.
25.
26.
27.
28.
29.
30.
31.
32.
33.
34.
35.
36.
37.
38.
39.
Chap
ter 3
30
Outcome of surgical treatment of obesity
with a mean time to detection of 8 to 14 months.142, 151 Almost no gallstone formation has
been reported beyond two years after surgery, which exactly matches the period of most rapid
weight loss.136, 151 However, this should be interpreted with care, since most studies describe
a follow-up shorter than two years. When weight stabilizes at a signifi cantly lower level, cho-
lesterol saturation of bile returns to normal, allowing spontaneous stone dissolution in some
cases.130, 131, 154
3.1.3 Gallstones, aim of the thesis, chapter 8
Several diff erent management strategies concerning the risk of gallstone formation after bar-
iatric surgery have been advocated: concomitant cholecystectomy in all patients, wait-and-see
policy, or prophylactic treatment with ursodeoxycholic acid to prevent gallstone formation.
Realistic choices in management can only be made when exact fi gures concerning incidence
and prevalence of gallstones after surgery are available, especially concerning incidence of
symptomatic cholelithiasis.
Therefore, we evaluated a population of previously morbidly obese patients, who had been
treated by LAGB 1.3 to 8.5 years earlier, for the prevalence of symptomatic and asymptomatic
gallstones. None of the patients underwent prophylactic cholecystectomy, and ursodeoxycho-
lic acid was not prescribed, which enabled us to study long-term natural history of gallstone
disease after surgically induced weight loss. Additionally, we compared the prevalence of
gallstones in this population with a morbidly obese population on a waiting list for bariatric
surgery. Finally, the presence of other risk factors for development of gallstones besides rapid
weight loss was assessed as well to evaluate whether individuals at high risk could be identifi ed.
3.2 QUALITY OF LIFE
3.2.1 Introduction
Severity of disabling conditions is generally described in objective criteria. However, these
criteria bear limited relation to how patients are feeling and how much impact the disease has
on their daily life. Therefore, it might be useful to evaluate severity of disease in terms of quality
of life (QoL). QoL refers to the overall eff ects of medical conditions on physical, mental, and
social functioning and well-being as subjectively evaluated and reported by the patient.155, 156
The most reliable and reproducible manner to quantify highly subjective QoL is by the use of
standardized and validated questionnaires, which are either generic (applicable to the general
population) or disease-specifi c.157-159
In individuals suff ering from obesity, QoL is typically severely impaired compared to the
general population.156, 160-162 As discussed previously, individuals suff ering from obesity are
prone to develop a wide variety of serious health consequences, leading to increased dis-
ability, morbidity, and mortality. Additionally, the prevalence of psychiatric disorders, mainly
1.
2.
3.
4.
5.
6.
7.
8.
9.
10.
11.
12.
13.
14.
15.
16.
17.
18.
19.
20.
21.
22.
23.
24.
25.
26.
27.
28.
29.
30.
31.
32.
33.
34.
35.
36.
37.
38.
39.
Chap
ter 3
31
Outcome of surgical treatment of obesity
depression and anxiety disorders, is very high among obese subjects, with reported rates
between 20 to 50%.162-165 The high prevalence of both serious physical and psychological
impairment seems to be an acceptable explanation for the observed deterioration of QoL.
However, in this respect, obesity does not necessarily diff er from other serious chronic condi-
tions. Nevertheless, patients suff ering from obesity are likely to rate their condition as more
disabling than other major handicaps. Rand et al. studied a group of morbidly obese subjects
who successfully lost weight after bariatric surgery and described that all patients would prefer
to be normal weight with a major handicap (e.g. deafness, heart disease, one leg amputated)
than to be morbidly obese again.166 All patients said they would rather be normal weight than
a morbidly obese multi-millionaire.166
The most generally accepted explanation for the aggravated psychosocial dysfunction in
obesity compared to other chronic conditions is the social stigmatization and discrimination
obese individuals experience in society.164, 167-170 As a result of this discrimination, overweight
individuals are less educated, are less likely to be married, and have lower household incomes,
while indeed other chronic conditions did not aff ect these outcomes.169
Not every individual suff ering from morbid obesity experiences the same negative impact
on QoL. In general, women, young individuals, and those with greater rates of comorbidity
experience the greatest burden.162-164 Additionally, as BMI increases, greater impairment in
QoL is observed.162, 171 Finally, treatment-seeking individuals appear to be more impaired than
nontreatment-seeking individuals.171
3.2.2 Eff ect of bariatric surgery on QoL
Traditionally, results of bariatric surgery have been quantifi ed in the amount of weight lost.
However, as discussed above, changes in QoL might be a more important factor to the indi-
vidual patient. During the last two decades, increasing attention has been paid to improvement
in QoL after bariatric surgery. Virtually all studies report signifi cant improvement after bariatric
surgery, regardless of the surgical procedure.156, 162, 165, 167, 172-180
Signifi cant improvement in QoL has been observed as early as 2 to 4 weeks postoperatively,
while weight loss in this period is almost negligible.174 The most important improvement in
QoL is generally reported in the fi rst year after surgery. Some studies even report normalization
of QoL, although patients are still severely overweight.156, 174, 178 The few available long-term
follow-up studies, however, suggest that improvement in QoL levels off or even reverts toward
preoperative levels starting from 2 years after surgery.175, 179, 180 It remains to be established
whether this is the result of waning optimism in a period of weight stabilization or disappoint-
ment about only limited improvement in everyday life.167, 180 Additionally, it has been suggested
that the decrease in frequency and intensity of clinical visits might play a role as well.179 Finally,
weight regain, which is observed especially in restrictive types of bariatric surgery, might be a
causal factor as well.181, 182

1.
2.
3.
4.
5.
6.
7.
8.
9.
10.
11.
12.
13.
14.
15.
16.
17.
18.
19.
20.
21.
22.
23.
24.
25.
26.
27.
28.
29.
30.
31.
32.
33.
34.
35.
36.
37.
38.
39.
Chap
ter 3
32
Outcome of surgical treatment of obesity
3.2.3 Quality of life, aim of the thesis, chapter 9
To evaluate whether LAGB has benefi cial eff ects on QoL in morbid obesity after long-term
follow-up, we compared a previously morbidly obese population who had undergone LAGB
at least fi ve years earlier, with morbidly obese subjects on a waiting list for bariatric surgery.
Additionally, the use of a generic questionnaire enabled us to compare the patient groups with
Dutch community norm values, to evaluate whether QoL normalizes after surgical treatment
for morbid obesity. Finally, determinants infl uencing QoL in morbidly obese patients having
undergone LAGB were identifi ed.
1.
2.
3.
4.
5.
6.
7.
8.
9.
10.
11.
12.
13.
14.
15.
16.
17.
18.
19.
20.
21.
22.
23.
24.
25.
26.
27.
28.
29.
30.
31.
32.
33.
34.
35.
36.
37.
38.
39.
Chap
ter 3
33
Introduction
REFERENCES
1 James WP. The epidemiology of obesity: the size of the problem. J Intern Med. 2008; 263: 36-52. 2 WHO. Physical Status: the Use and Interpretation of Anthropometr. Tech. Rep. Series 854. Geneva:
WHO. 1995. 3 Haslam DW, James WP. Obesity. Lancet. 2005; 366: 1197-209. 4 CBS. www.statline.cbs.nl. 5 CBO. Richtlijn Diagnostiek en behandeling van obesitas bij volwassenen en kinderen. wwwcbonl.
2008. 6 Whitlock G, Lewington S, Sherliker P, Clarke R, Emberson J, Halsey J, et al. Body-mass index and cause-
specifi c mortality in 900 000 adults: collaborative analyses of 57 prospective studies. Lancet. 2009; 373: 1083-96.
7 Flegal KM, Graubard BI, Williamson DF, Gail MH. Cause-specifi c excess deaths associated with under-weight, overweight, and obesity. JAMA. 2007; 298: 2028-37.
8 Peeters A, Barendregt JJ, Willekens F, Mackenbach JP, Al Mamun A, Bonneux L. Obesity in adulthood and its consequences for life expectancy: a life-table analysis. Ann Intern Med. 2003; 138: 24-32.
9 Bray GA. Medical consequences of obesity. J Clin Endocrinol Metab. 2004; 89: 2583-9. 10 Colditz GA, Willett WC, Rotnitzky A, Manson JE. Weight gain as a risk factor for clinical diabetes mel-
litus in women. Ann Intern Med. 1995; 122: 481-6. 11 Chan JM, Rimm EB, Colditz GA, Stampfer MJ, Willett WC. Obesity, fat distribution, and weight gain as
risk factors for clinical diabetes in men. Diabetes Care. 1994; 17: 961-9. 12 Ahima RS. Adipose tissue as an endocrine organ. Obesity (Silver Spring). 2006; 14 Suppl 5: 242S-49S. 13 Berg AH, Scherer PE. Adipose tissue, infl ammation, and cardiovascular disease. Circ Res. 2005; 96:
939-49. 14 Arita Y, Kihara S, Ouchi N, Takahashi M, Maeda K, Miyagawa J, et al. Paradoxical decrease of an adipose-
specifi c protein, adiponectin, in obesity. Biochem Biophys Res Commun. 1999; 257: 79-83. 15 Hu E, Liang P, Spiegelman BM. AdipoQ is a novel adipose-specifi c gene dysregulated in obesity. J Biol
Chem. 1996; 271: 10697-703. 16 Kadowaki T, Yamauchi T. Adiponectin and adiponectin receptors. Endocr Rev. 2005; 26: 439-51. 17 Maggard MA, Shugarman LR, Suttorp M, Maglione M, Sugerman HJ, Livingston EH, et al. Meta-
analysis: surgical treatment of obesity. Ann Intern Med. 2005; 142: 547-59. 18 Wolf HK, Tuomilehto J, Kuulasmaa K, Domarkiene S, Cepaitis Z, Molarius A, et al. Blood pressure levels
in the 41 populations of the WHO MONICA Project. J Hum Hypertens. 1997; 11: 733-42. 19 Flum DR, Belle SH, King WC, Wahed AS, Berk P, Chapman W, et al. Perioperative safety in the longitudi-
nal assessment of bariatric surgery. N Engl J Med. 2009; 361: 445-54. 20 Renehan AG, Frystyk J, Flyvbjerg A. Obesity and cancer risk: the role of the insulin-IGF axis. Trends
Endocrinol Metab. 2006; 17: 328-36. 21 Renehan AG, Tyson M, Egger M, Heller RF, Zwahlen M. Body-mass index and incidence of cancer: a
systematic review and meta-analysis of prospective observational studies. Lancet. 2008; 371: 569-78. 22 Maes HH, Neale MC, Eaves LJ. Genetic and environmental factors in relative body weight and human
adiposity. Behav Genet. 1997; 27: 325-51. 23 Stunkard AJ, Harris JR, Pedersen NL, McClearn GE. The body-mass index of twins who have been
reared apart. N Engl J Med. 1990; 322: 1483-7. 24 Wardle J, Carnell S, Haworth CM, Plomin R. Evidence for a strong genetic infl uence on childhood
adiposity despite the force of the obesogenic environment. Am J Clin Nutr. 2008; 87: 398-404. 25 Dina C. New insights into the genetics of body weight. Curr Opin Clin Nutr Metab Care. 2008; 11: 378-84. 26 Montague CT, Farooqi IS, Whitehead JP, Soos MA, Rau H, Wareham NJ, et al. Congenital leptin defi -
ciency is associated with severe early-onset obesity in humans. Nature. 1997; 387: 903-8. 27 Mutch DM, Clement K. Unraveling the genetics of human obesity. PLoS Genet. 2006; 2: e188.

1.
2.
3.
4.
5.
6.
7.
8.
9.
10.
11.
12.
13.
14.
15.
16.
17.
18.
19.
20.
21.
22.
23.
24.
25.
26.
27.
28.
29.
30.
31.
32.
33.
34.
35.
36.
37.
38.
39.
Chap
ter 3
34
Introduction
28 O’Rahilly S, Farooqi IS. Human obesity as a heritable disorder of the central control of energy balance. Int J Obes (Lond). 2008; 32 Suppl 7: S55-61.
29 Farooqi IS, Keogh JM, Yeo GS, Lank EJ, Cheetham T, O’Rahilly S. Clinical spectrum of obesity and muta-tions in the melanocortin 4 receptor gene. N Engl J Med. 2003; 348: 1085-95.
30 Thorleifsson G, Walters GB, Gudbjartsson DF, Steinthorsdottir V, Sulem P, Helgadottir A, et al. Genome-wide association yields new sequence variants at seven loci that associate with measures of obesity. Nat Genet. 2009; 41: 18-24.
31 Willer CJ, Speliotes EK, Loos RJ, Li S, Lindgren CM, Heid IM, et al. Six new loci associated with body mass index highlight a neuronal infl uence on body weight regulation. Nat Genet. 2009; 41: 25-34.
32 Frayling TM, Timpson NJ, Weedon MN, Zeggini E, Freathy RM, Lindgren CM, et al. A common variant in the FTO gene is associated with body mass index and predisposes to childhood and adult obesity. Science. 2007; 316: 889-94.
33 Loos RJ, Lindgren CM, Li S, Wheeler E, Zhao JH, Prokopenko I, et al. Common variants near MC4R are associated with fat mass, weight and risk of obesity. Nat Genet. 2008; 40: 768-75.
34 Corella D, Peloso G, Arnett DK, Demissie S, Cupples LA, Tucker K, et al. APOA2, dietary fat, and body mass index: replication of a gene-diet interaction in 3 independent populations. Arch Intern Med. 2009; 169: 1897-906.
35 Wynne K, Stanley S, McGowan B, Bloom S. Appetite control. J Endocrinol. 2005; 184: 291-318. 36 Sacks FM, Bray GA, Carey VJ, Smith SR, Ryan DH, Anton SD, et al. Comparison of weight-loss diets with
diff erent compositions of fat, protein, and carbohydrates. N Engl J Med. 2009; 360: 859-73. 37 Miller WC, Koceja DM, Hamilton EJ. A meta-analysis of the past 25 years of weight loss research using
diet, exercise or diet plus exercise intervention. Int J Obes Relat Metab Disord. 1997; 21: 941-7. 38 Wadden TA, West DS, Neiberg RH, Wing RR, Ryan DH, Johnson KC, et al. One-year weight losses in the
Look AHEAD study: factors associated with success. Obesity (Silver Spring). 2009; 17: 713-22. 39 Lindstrom J, Louheranta A, Mannelin M, Rastas M, Salminen V, Eriksson J, et al. The Finnish Diabetes
Prevention Study (DPS): Lifestyle intervention and 3-year results on diet and physical activity. Diabe-tes Care. 2003; 26: 3230-6.
40 Fappa E, Yannakoulia M, Pitsavos C, Skoumas I, Valourdou S, Stefanadis C. Lifestyle intervention in the management of metabolic syndrome: could we improve adherence issues? Nutrition. 2008; 24: 286-91.
41 Knowler WC, Fowler SE, Hamman RF, Christophi CA, Hoff man HJ, Brenneman AT, et al. 10-year follow-up of diabetes incidence and weight loss in the Diabetes Prevention Program Outcomes Study. Lancet. 2009; 374: 1677-86.
42 National Heart, Lung, and Blood Institute Obesit Education Initiative. Clinical Guidelines on the identifi cation, evaluation, and treatment of overweight and obesity in adults: the evidence report. . Bethesda, MD: US Department of Health and Human Services. 1998.
43 Svetkey LP, Stevens VJ, Brantley PJ, Appel LJ, Hollis JF, Loria CM, et al. Comparison of strategies for sustaining weight loss: the weight loss maintenance randomized controlled trial. JAMA. 2008; 299: 1139-48.
44 Hauptman JB, Jeunet FS, Hartmann D. Initial studies in humans with the novel gastrointestinal lipase inhibitor Ro 18-0647 (tetrahydrolipstatin). Am J Clin Nutr. 1992; 55: 309S-13S.
45 Rucker D, Padwal R, Li SK, Curioni C, Lau DC. Long term pharmacotherapy for obesity and overweight: updated meta-analysis. BMJ. 2007; 335: 1194-9.
46 Padwal RS, Majumdar SR. Drug treatments for obesity: orlistat, sibutramine, and rimonabant. Lancet. 2007; 369: 71-7.
47 Ryan DH, Kaiser P, Bray GA. Sibutramine: a novel new agent for obesity treatment. Obes Res. 1995; 3 Suppl 4: 553S-59S.
48 Lean ME. How does sibutramine work? Int J Obes Relat Metab Disord. 2001; 25 Suppl 4: S8-11. 49 Akbas F, Gasteyger C, Sjodin A, Astrup A, Larsen TM. A critical review of the cannabinoid receptor as a
drug target for obesity management. Obes Rev. 2009; 10: 58-67.
1.
2.
3.
4.
5.
6.
7.
8.
9.
10.
11.
12.
13.
14.
15.
16.
17.
18.
19.
20.
21.
22.
23.
24.
25.
26.
27.
28.
29.
30.
31.
32.
33.
34.
35.
36.
37.
38.
39.
Chap
ter 3
35
Introduction
50 Kral JG, Naslund E. Surgical treatment of obesity. Nat Clin Pract Endocrinol Metab. 2007; 3: 574-83. 51 Robinson MK. Surgical treatment of obesity--weighing the facts. N Engl J Med. 2009; 361: 520-1. 52 Buchwald H, Estok R, Fahrbach K, Banel D, Jensen MD, Pories WJ, et al. Weight and type 2 diabetes
after bariatric surgery: systematic review and meta-analysis. Am J Med. 2009; 122: 248-56 e5. 53 Buchwald H, Avidor Y, Braunwald E, Jensen MD, Pories W, Fahrbach K, et al. Bariatric surgery: a system-
atic review and meta-analysis. JAMA. 2004; 292: 1724-37. 54 Tice JA, Karliner L, Walsh J, Petersen AJ, Feldman MD. Gastric banding or bypass? A systematic review
comparing the two most popular bariatric procedures. Am J Med. 2008; 121: 885-93. 55 Biertho L, Steff en R, Ricklin T, Horber FF, Pomp A, Inabnet WB, et al. Laparoscopic gastric bypass versus
laparoscopic adjustable gastric banding: a comparative study of 1,200 cases. J Am Coll Surg. 2003; 197: 536-44; discussion 44-5.
56 Sjostrom L, Lindroos AK, Peltonen M, Torgerson J, Bouchard C, Carlsson B, et al. Lifestyle, diabetes, and cardiovascular risk factors 10 years after bariatric surgery. N Engl J Med. 2004; 351: 2683-93.
57 Sjostrom L, Narbro K, Sjostrom CD, Karason K, Larsson B, Wedel H, et al. Eff ects of bariatric surgery on mortality in Swedish obese subjects. N Engl J Med. 2007; 357: 741-52.
58 Adams TD, Gress RE, Smith SC, Halverson RC, Simper SC, Rosamond WD, et al. Long-term mortality after gastric bypass surgery. N Engl J Med. 2007; 357: 753-61.
59 Schauer PR, Burguera B, Ikramuddin S, Cottam D, Gourash W, Hamad G, et al. Eff ect of laparoscopic Roux-en Y gastric bypass on type 2 diabetes mellitus. Ann Surg. 2003; 238: 467-84; discussion 84-5.
60 Thaler JP, Cummings DE. Minireview: Hormonal and metabolic mechanisms of diabetes remission after gastrointestinal surgery. Endocrinology. 2009; 150: 2518-25.
61 Bose M, Olivan B, Teixeira J, Pi-Sunyer FX, Laferrere B. Do Incretins Play a Role in the Remission of Type 2 Diabetes after Gastric Bypass Surgery: What are the Evidence? Obes Surg. 2008.
62 le Roux CW, Aylwin SJ, Batterham RL, Borg CM, Coyle F, Prasad V, et al. Gut hormone profi les following bariatric surgery favor an anorectic state, facilitate weight loss, and improve metabolic parameters. Ann Surg. 2006; 243: 108-14.
63 Kojima M, Hosoda H, Date Y, Nakazato M, Matsuo H, Kangawa K. Ghrelin is a growth-hormone-releasing acylated peptide from stomach. Nature. 1999; 402: 656-60.
64 Hosoda H, Kojima M, Matsuo H, Kangawa K. Ghrelin and des-acyl ghrelin: two major forms of rat ghrelin peptide in gastrointestinal tissue. Biochem Biophys Res Commun. 2000; 279: 909-13.
65 Broglio F, Gottero C, Prodam F, Gauna C, Muccioli G, Papotti M, et al. Non-acylated ghrelin counteracts the metabolic but not the neuroendocrine response to acylated ghrelin in humans. J Clin Endocrinol Metab. 2004; 89: 3062-5.
66 Takaya K, Ariyasu H, Kanamoto N, Iwakura H, Yoshimoto A, Harada M, et al. Ghrelin strongly stimulates growth hormone release in humans. J Clin Endocrinol Metab. 2000; 85: 4908-11.
67 Asakawa A, Inui A, Fujimiya M, Sakamaki R, Shinfuku N, Ueta Y, et al. Stomach regulates energy bal-ance via acylated ghrelin and desacyl ghrelin. Gut. 2005; 54: 18-24.
68 Gauna C, Delhanty PJ, Hofl and LJ, Janssen JA, Broglio F, Ross RJ, et al. Ghrelin stimulates, whereas des-octanoyl ghrelin inhibits, glucose output by primary hepatocytes. J Clin Endocrinol Metab. 2005; 90: 1055-60.
69 Heijboer AC, van den Hoek AM, Parlevliet ET, Havekes LM, Romijn JA, Pijl H, et al. Ghrelin diff erentially aff ects hepatic and peripheral insulin sensitivity in mice. Diabetologia. 2006; 49: 732-8.
70 Thompson NM, Gill DA, Davies R, Loveridge N, Houston PA, Robinson IC, et al. Ghrelin and des-octanoyl ghrelin promote adipogenesis directly in vivo by a mechanism independent of the type 1a growth hormone secretagogue receptor. Endocrinology. 2004; 145: 234-42.
71 Date Y, Nakazato M, Murakami N, Kojima M, Kangawa K, Matsukura S. Ghrelin acts in the central nervous system to stimulate gastric acid secretion. Biochem Biophys Res Commun. 2001; 280: 904-7.
72 Masuda Y, Tanaka T, Inomata N, Ohnuma N, Tanaka S, Itoh Z, et al. Ghrelin stimulates gastric acid secre-tion and motility in rats. Biochem Biophys Res Commun. 2000; 276: 905-8.
1.
2.
3.
4.
5.
6.
7.
8.
9.
10.
11.
12.
13.
14.
15.
16.
17.
18.
19.
20.
21.
22.
23.
24.
25.
26.
27.
28.
29.
30.
31.
32.
33.
34.
35.
36.
37.
38.
39.
Chap
ter 3
36
Introduction
73 Nagaya N, Kangawa K. Ghrelin improves left ventricular dysfunction and cardiac cachexia in heart failure. Curr Opin Pharmacol. 2003; 3: 146-51.
74 Tassone F, Broglio F, Destefanis S, Rovere S, Benso A, Gottero C, et al. Neuroendocrine and metabolic eff ects of acute ghrelin administration in human obesity. J Clin Endocrinol Metab. 2003; 88: 5478-83.
75 Vestergaard ET, Andersen NH, Hansen TK, Rasmussen LM, Moller N, Sorensen KE, et al. Cardiovascular eff ects of intravenous ghrelin infusion in healthy young men. Am J Physiol Heart Circ Physiol. 2007; 293: H3020-6.
76 Nakazato M, Murakami N, Date Y, Kojima M, Matsuo H, Kangawa K, et al. A role for ghrelin in the central regulation of feeding. Nature. 2001; 409: 194-8.
77 Tschop M, Smiley DL, Heiman ML. Ghrelin induces adiposity in rodents. Nature. 2000; 407: 908-13. 78 Wren AM, Seal LJ, Cohen MA, Brynes AE, Frost GS, Murphy KG, et al. Ghrelin enhances appetite and
increases food intake in humans. J Clin Endocrinol Metab. 2001; 86: 5992. 79 Cummings DE, Frayo RS, Marmonier C, Aubert R, Chapelot D. Plasma ghrelin levels and hunger scores
in humans initiating meals voluntarily without time- and food-related cues. Am J Physiol Endocrinol Metab. 2004; 287: E297-304.
80 Cummings DE, Purnell JQ, Frayo RS, Schmidova K, Wisse BE, Weigle DS. A preprandial rise in plasma ghrelin levels suggests a role in meal initiation in humans. Diabetes. 2001; 50: 1714-9.
81 Tschop M, Wawarta R, Riepl RL, Friedrich S, Bidlingmaier M, Landgraf R, et al. Post-prandial decrease of circulating human ghrelin levels. J Endocrinol Invest. 2001; 24: RC19-21.
82 Tschop M, Weyer C, Tataranni PA, Devanarayan V, Ravussin E, Heiman ML. Circulating ghrelin levels are decreased in human obesity. Diabetes. 2001; 50: 707-9.
83 Cummings DE, Weigle DS, Frayo RS, Breen PA, Ma MK, Dellinger EP, et al. Plasma ghrelin levels after diet-induced weight loss or gastric bypass surgery. N Engl J Med. 2002; 346: 1623-30.
84 Hansen TK, Dall R, Hosoda H, Kojima M, Kangawa K, Christiansen JS, et al. Weight loss increases circu-lating levels of ghrelin in human obesity. Clin Endocrinol (Oxf). 2002; 56: 203-6.
85 Chen HY, Trumbauer ME, Chen AS, Weingarth DT, Adams JR, Frazier EG, et al. Orexigenic action of peripheral ghrelin is mediated by neuropeptide Y and agouti-related protein. Endocrinology. 2004; 145: 2607-12.
86 Cowley MA, Smith RG, Diano S, Tschop M, Pronchuk N, Grove KL, et al. The distribution and mecha-nism of action of ghrelin in the CNS demonstrates a novel hypothalamic circuit regulating energy homeostasis. Neuron. 2003; 37: 649-61.
87 Pan W, Tu H, Kastin AJ. Diff erential BBB interactions of three ingestive peptides: obestatin, ghrelin, and adiponectin. Peptides. 2006; 27: 911-6.
88 Williams DL, Cummings DE. Regulation of ghrelin in physiologic and pathophysiologic states. J Nutr. 2005; 135: 1320-5.
89 Saad MF, Bernaba B, Hwu CM, Jinagouda S, Fahmi S, Kogosov E, et al. Insulin regulates plasma ghrelin concentration. J Clin Endocrinol Metab. 2002; 87: 3997-4000.
90 Broglio F, Arvat E, Benso A, Gottero C, Muccioli G, Papotti M, et al. Ghrelin, a natural GH secretagogue produced by the stomach, induces hyperglycemia and reduces insulin secretion in humans. J Clin Endocrinol Metab. 2001; 86: 5083-6.
91 Gauna C, Meyler FM, Janssen JA, Delhanty PJ, Abribat T, van Koetsveld P, et al. Administration of acyl-ated ghrelin reduces insulin sensitivity, whereas the combination of acylated plus unacylated ghrelin strongly improves insulin sensitivity. J Clin Endocrinol Metab. 2004; 89: 5035-42.
92 Broglio F PF, Riganti F, Gramaglia E, Benso A, Lucatello B, Abribat T, van der Lely AJ, Ghigo E. Unacyl-ated Ghrelin (UAG) Enhances the Early Insulin Response to Meal, Improves Glucose Metabolism and Decreases Free Fatty Acids Levels in Healthy Volunteers. ENDO 2007, Toronto, Canada, Abstract P2-190. 2007.
93 Reaven GM. Banting lecture 1988. Role of insulin resistance in human disease. Diabetes. 1988; 37: 1595-607.
1.
2.
3.
4.
5.
6.
7.
8.
9.
10.
11.
12.
13.
14.
15.
16.
17.
18.
19.
20.
21.
22.
23.
24.
25.
26.
27.
28.
29.
30.
31.
32.
33.
34.
35.
36.
37.
38.
39.
Chap
ter 3
37
Introduction
94 Maccario M, Grottoli S, Procopio M, Oleandri SE, Rossetto R, Gauna C, et al. The GH/IGF-I axis in obesity: infl uence of neuro-endocrine and metabolic factors. Int J Obes Relat Metab Disord. 2000; 24 Suppl 2: S96-9.
95 Dezaki K, Hosoda H, Kakei M, Hashiguchi S, Watanabe M, Kangawa K, et al. Endogenous ghrelin in pancreatic islets restricts insulin release by attenuating Ca2+ signaling in beta-cells: implication in the glycemic control in rodents. Diabetes. 2004; 53: 3142-51.
96 Gnanapavan S, Kola B, Bustin SA, Morris DG, McGee P, Fairclough P, et al. The tissue distribution of the mRNA of ghrelin and subtypes of its receptor, GHS-R, in humans. J Clin Endocrinol Metab. 2002; 87: 2988.
97 Date Y, Nakazato M, Hashiguchi S, Dezaki K, Mondal MS, Hosoda H, et al. Ghrelin is present in pancre-atic alpha-cells of humans and rats and stimulates insulin secretion. Diabetes. 2002; 51: 124-9.
98 Zhang JV, Ren PG, Avsian-Kretchmer O, Luo CW, Rauch R, Klein C, et al. Obestatin, a peptide encoded by the ghrelin gene, opposes ghrelin’s eff ects on food intake. Science. 2005; 310: 996-9.
99 Depoortere I, Thijs T, Moechars D, De Smet B, Ver Donck L, Peeters TL. Eff ect of peripheral obestatin on food intake and gastric emptying in ghrelin-knockout mice. Br J Pharmacol. 2008; 153: 1550-7.
100 Gourcerol G, Coskun T, Craft LS, Mayer JP, Heiman ML, Wang L, et al. Preproghrelin-derived peptide, obestatin, fails to infl uence food intake in lean or obese rodents. Obesity (Silver Spring). 2007; 15: 2643-52.
101 Nogueiras R, Pfl uger P, Tovar S, Arnold M, Mitchell S, Morris A, et al. Eff ects of obestatin on energy balance and growth hormone secretion in rodents. Endocrinology. 2007; 148: 21-6.
102 Seoane LM, Al-Massadi O, Pazos Y, Pagotto U, Casanueva FF. Central obestatin administration does not modify either spontaneous or ghrelin-induced food intake in rats. J Endocrinol Invest. 2006; 29: RC13-5.
103 Yamamoto D, Ikeshita N, Daito R, Herningtyas EH, Toda K, Takahashi K, et al. Neither intravenous nor intracerebroventricular administration of obestatin aff ects the secretion of GH, PRL, TSH and ACTH in rats. Regul Pept. 2007; 138: 141-4.
104 Zizzari P, Longchamps R, Epelbaum J, Bluet-Pajot MT. Obestatin partially aff ects ghrelin stimulation of food intake and growth hormone secretion in rodents. Endocrinology. 2007; 148: 1648-53.
105 Chartrel N, Alvear-Perez R, Leprince J, Iturrioz X, Reaux-Le Goazigo A, Audinot V, et al. Comment on “Obestatin, a peptide encoded by the ghrelin gene, opposes ghrelin’s eff ects on food intake”. Science. 2007; 315: 766; author reply 66.
106 Holst B, Egerod KL, Schild E, Vickers SP, Cheetham S, Gerlach LO, et al. GPR39 signaling is stimulated by zinc ions but not by obestatin. Endocrinology. 2007; 148: 13-20.
107 Lauwers E, Landuyt B, Arckens L, Schoofs L, Luyten W. Obestatin does not activate orphan G protein-coupled receptor GPR39. Biochem Biophys Res Commun. 2006; 351: 21-5.
108 Zhang JV, Klein C, Ren PG, Kass S, Donck LV, Moechars D et al. Response to comment on Obestatin, a peptide encoded by the ghrelin gene oposes ghrelin’s eff ects on food intake. Science. 2007; 315: 766.
109 Green BD, Irwin N, Flatt PR. Direct and indirect eff ects of obestatin peptides on food intake and the regulation of glucose homeostasis and insulin secretion in mice. Peptides. 2007; 28: 981-7.
110 Lagaud GJ, Young A, Acena A, Morton MF, Barrett TD, Shankley NP. Obestatin reduces food intake and suppresses body weight gain in rodents. Biochem Biophys Res Commun. 2007; 357: 264-9.
111 Vestergaard ET, Djurhuus CB, Gjedsted J, Nielsen S, Moller N, Holst JJ, et al. Acute eff ects of ghrelin administration on glucose and lipid metabolism. J Clin Endocrinol Metab. 2008; 93: 438-44.
112 Ren AJ, Guo ZF, Wang YK, Wang LG, Wang WZ, Lin L, et al. Inhibitory eff ect of obestatin on glucose-induced insulin secretion in rats. Biochem Biophys Res Commun. 2008; 369: 969-72.
113 Gauna C, Kiewiet RM, Janssen JA, van de Zande B, Delhanty PJ, Ghigo E, et al. Unacylated ghrelin acts as a potent insulin secretagogue in glucose-stimulated conditions. Am J Physiol Endocrinol Metab. 2007; 293: E697-704.
114 Gauna C, Uitterlinden P, Kramer P, Kiewiet RM, Janssen JA, Delhanty PJ, et al. Intravenous glucose administration in fasting rats has diff erential eff ects on acylated and unacylated ghrelin in the portal
1.
2.
3.
4.
5.
6.
7.
8.
9.
10.
11.
12.
13.
14.
15.
16.
17.
18.
19.
20.
21.
22.
23.
24.
25.
26.
27.
28.
29.
30.
31.
32.
33.
34.
35.
36.
37.
38.
39.
Chap
ter 3
38
Introduction
and systemic circulation: a comparison between portal and peripheral concentrations in anesthe-tized rats. Endocrinology. 2007; 148: 5278-87.
115 Scherer PE, Williams S, Fogliano M, Baldini G, Lodish HF. A novel serum protein similar to C1q, pro-duced exclusively in adipocytes. J Biol Chem. 1995; 270: 26746-9.
116 Maeda K, Okubo K, Shimomura I, Funahashi T, Matsuzawa Y, Matsubara K. cDNA cloning and expres-sion of a novel adipose specifi c collagen-like factor, apM1 (AdiPose Most abundant Gene transcript 1). Biochem Biophys Res Commun. 1996; 221: 286-9.
117 Nakano Y, Tobe T, Choi-Miura NH, Mazda T, Tomita M. Isolation and characterization of GBP28, a novel gelatin-binding protein purifi ed from human plasma. J Biochem. 1996; 120: 803-12.
118 Yamauchi T, Kadowaki T. Physiological and pathophysiological roles of adiponectin and adiponectin receptors in the integrated regulation of metabolic and cardiovascular diseases. Int J Obes (Lond). 2008; 32 Suppl 7: S13-8.
119 Pajvani UB, Du X, Combs TP, Berg AH, Rajala MW, Schulthess T, et al. Structure-function studies of the adipocyte-secreted hormone Acrp30/adiponectin. Implications fpr metabolic regulation and bioactivity. J Biol Chem. 2003; 278: 9073-85.
120 Nakashima R, Kamei N, Yamane K, Nakanishi S, Nakashima A, Kohno N. Decreased total and high molecular weight adiponectin are independent risk factors for the development of type 2 diabetes in Japanese-Americans. J Clin Endocrinol Metab. 2006; 91: 3873-7.
121 Hung J, McQuillan BM, Thompson PL, Beilby JP. Circulating adiponectin levels associate with infl am-matory markers, insulin resistance and metabolic syndrome independent of obesity. Int J Obes (Lond). 2008; 32: 772-9.
122 Saisho Y, Hirose H, Yamamoto Y, Nakatani H, Itoh H. Combination of C-reactive protein and high molecular weight (HMW)-adiponectin refl ects further metabolic abnormalities compared with each of them alone in Japanese type 2 diabetic subjects. Endocr J. 2008; 55: 331-8.
123 Weyer C, Funahashi T, Tanaka S, Hotta K, Matsuzawa Y, Pratley RE, et al. Hypoadiponectinemia in obesity and type 2 diabetes: close association with insulin resistance and hyperinsulinemia. J Clin Endocrinol Metab. 2001; 86: 1930-5.
124 Tschritter O, Fritsche A, Thamer C, Haap M, Shirkavand F, Rahe S, et al. Plasma adiponectin concentra-tions predict insulin sensitivity of both glucose and lipid metabolism. Diabetes. 2003; 52: 239-43.
125 Waki H, Yamauchi T, Kamon J, Ito Y, Uchida S, Kita S, et al. Impaired multimerization of human adipo-nectin mutants associated with diabetes. Molecular structure and multimer formation of adiponectin. J Biol Chem. 2003; 278: 40352-63.
126 Basu R, Pajvani UB, Rizza RA, Scherer PE. Selective downregulation of the high molecular weight form of adiponectin in hyperinsulinemia and in type 2 diabetes: diff erential regulation from nondiabetic subjects. Diabetes. 2007; 56: 2174-7.
127 Mohlig M, Wegewitz U, Osterhoff M, Isken F, Ristow M, Pfeiff er AF, et al. Insulin decreases human adiponectin plasma levels. Horm Metab Res. 2002; 34: 655-8.
128 van der Lely AJ, Tschop M, Heiman ML, Ghigo E. Biological, physiological, pathophysiological, and pharmacological aspects of ghrelin. Endocr Rev. 2004; 25: 426-57.
129 Qi Y, Takahashi N, Hileman SM, Patel HR, Berg AH, Pajvani UB, et al. Adiponectin acts in the brain to decrease body weight. Nat Med. 2004; 10: 524-9.
130 Erlinger S. Gallstones in obesity and weight loss. Eur J Gastroenterol Hepatol. 2000; 12: 1347-52. 131 Everhart JE. Contributions of obesity and weight loss to gallstone disease. Ann Intern Med. 1993; 119:
1029-35. 132 Stampfer MJ, Maclure KM, Colditz GA, Manson JE, Willett WC. Risk of symptomatic gallstones in
women with severe obesity. Am J Clin Nutr. 1992; 55: 652-8. 133 Maclure KM, Hayes KC, Colditz GA, Stampfer MJ, Speizer FE, Willett WC. Weight, diet, and the risk of
symptomatic gallstones in middle-aged women. N Engl J Med. 1989; 321: 563-9. 134 Gracie WA, Ransohoff DF. The natural history of silent gallstones: the innocent gallstone is not a myth.
N Engl J Med. 1982; 307: 798-800.
1.
2.
3.
4.
5.
6.
7.
8.
9.
10.
11.
12.
13.
14.
15.
16.
17.
18.
19.
20.
21.
22.
23.
24.
25.
26.
27.
28.
29.
30.
31.
32.
33.
34.
35.
36.
37.
38.
39.
Chap
ter 3
39
Introduction
135 Schwesinger WH, Diehl AK. Changing indications for laparoscopic cholecystectomy. Stones without symptoms nd symptoms without stones. Surg Clin North Am. 1996; 76: 493-504.
136 Deitel M, Petrov I. Incidence of symptomatic gallstones after bariatric operations. Surg Gynecol Obstet. 1987; 164: 549-52.
137 Carey MC. Pathogenesis of gallstones. Am J Surg. 1993; 165: 410-9. 138 Stone BG, Ansel HJ, Peterson FJ, Gebhard RL. Gallbladder emptying stimuli in obese and normal-
weight subjects. Hepatology. 1992; 15: 795-8. 139 Zapata R, Severin C, Manriquez M, Valdivieso V. Gallbladder motility and lithogenesis in obese
patients during diet-induced weight loss. Dig Dis Sci. 2000; 45: 421-8. 140 Al-Jiff ry BO, Shaff er EA, Saccone GT, Downey P, Kow L, Toouli J. Changes in gallbladder motility and
gallstone formation following laparoscopic gastric banding for morbid obestity. Can J Gastroenterol. 2003; 17: 169-74.
141 Shiff man ML, Sugerman HJ, Kellum JM, Moore EW. Changes in gallbladder bile composition following gallstone formation and weight reduction. Gastroenterology. 1992; 103: 214-21.
142 Wudel LJ, Jr., Wright JK, Debelak JP, Allos TM, Shyr Y, Chapman WC. Prevention of gallstone formation in morbidly obese patients undergoing rapid weight loss: results of a randomized controlled pilot study. J Surg Res. 2002; 102: 50-6.
143 Papavramidis S, Deligianidis N, Papavramidis T, Sapalidis K, Katsamakas M, Gamvros O. Laparoscopic cholecystectomy after bariatric surgery. Surg Endosc. 2003; 17: 1061-4.
144 Shiff man ML, Kaplan GD, Brinkman-Kaplan V, Vickers FF. Prophylaxis against gallstone formation with ursodeoxycholic acid in patients participating in a very-low-calorie diet program. Ann Intern Med. 1995; 122: 899-905.
145 Shiff man ML, Sugerman HJ, Kellum JM, Brewer WH, Moore EW. Gallstone formation after rapid weight loss: a prospective study in patients undergoing gastric bypass surgery for treatment of morbid obesity. Am J Gastroenterol. 1991; 86: 1000-5.
146 O’Brien PE, Dixon JB. A rational approach to cholelithiasis in bariatric surgery: its application to the laparoscopically placed adjustable gastric band. Arch Surg. 2003; 138: 908-12.
147 Fobi M, Lee H, Igwe D, Felahy B, James E, Stanczyk M, et al. Prophylactic cholecystectomy with gastric bypass operation: incidence of gallbladder disease. Obes Surg. 2002; 12: 350-3.
148 Patel JA, Patel NA, Piper GL, Smith DE, 3rd, Malhotra G, Colella JJ. Perioperative management of cholelithiasis in patients presenting for laparoscopic Roux-en-Y gastric bypass: have we reached a consensus? Am Surg. 2009; 75: 470-6; discussion 76.
149 Patel KR, White SC, Tejirian T, Han SH, Russell D, Vira D, et al. Gallbladder management during laparoscopic Roux-en-Y gastric bypass surgery: routine preoperative screening for gallstones and postoperative prophylactic medical treatment are not necessary. Am Surg. 2006; 72: 857-61.
150 Tucker ON, Fajnwaks P, Szomstein S, Rosenthal RJ. Is concomitant cholecystectomy necessary in obese patients undergoing laparoscopic gastric bypass surgery? Surg Endosc. 2008; 22: 2450-4.
151 Miller K, Hell E, Lang B, Lengauer E. Gallstone formation prophylaxis after gastric restrictive procedures for weight loss: a randomized double-blind placebo-controlled trial. Ann Surg. 2003; 238: 697-702.
152 Swartz DE, Felix EL. Elective cholecystectomy after Roux-en-Y gastric bypass: why should asymptom-atic gallstones be treated diff erently in morbidly obese patients? Surg Obes Relat Dis. 2005; 1: 555-60.
153 Papasavas PK, Gagne DJ, Ceppa FA, Caushaj PF. Routine gallbladder screening not necessary in patients undergoing laparoscopic Roux-en-Y gastric bypass. Surg Obes Relat Dis. 2006; 2: 41-6; discus-sion 46-7.
154 Shiff man ML, Shamburek RD, Schwartz CC, Sugerman HJ, Kellum JM, Moore EW. Gallbladder mucin, arachidonic acid, and bile lipids in patients who develop gallstones during weight reduction. Gastro-enterology. 1993; 105: 1200-8.
155 World Health Organisation. What constitutes quality of life? Concepts and dimensions. Clin Nutr. 1988; 7: 53-63.
1.
2.
3.
4.
5.
6.
7.
8.
9.
10.
11.
12.
13.
14.
15.
16.
17.
18.
19.
20.
21.
22.
23.
24.
25.
26.
27.
28.
29.
30.
31.
32.
33.
34.
35.
36.
37.
38.
39.
Chap
ter 3
40
Introduction
156 Choban PS, Onyejekwe J, Burge JC, Flancbaum L. A health status assessment of the impact of weight loss following Roux-en-Y gastric bypass for clinically severe obesity. J Am Coll Surg. 1999; 188: 491-7.
157 Le Pen C, Levy E, Loos F, Banzet MN, Basdevant A. “Specifi c” scale compared with “generic” scale: a double measurement of the quality of life in a French community sample of obese subjects. J Epide-miol Community Health. 1998; 52: 445-50.
158 Oria HE, Moorehead MK. Bariatric analysis and reporting outcome system (BAROS). Obes Surg. 1998; 8: 487-99.
159 Ware JE, Jr., Sherbourne CD. The MOS 36-item short-form health survey (SF-36). I. Conceptual frame-work and item selection. Med Care. 1992; 30: 473-83.
160 Andersen JR, Aasprang A, Bergsholm P, Sletteskog N, Vage V, Natvig GK. Predictors for health-related quality of life in patients accepted for bariatric surgery. Surg Obes Relat Dis. 2009; 5: 329-33.
161 de Zwaan M, Mitchell JE, Howell LM, Monson N, Swan-Kremeier L, Roerig JL, et al. Two measures of health-related quality of life in morbid obesity. Obes Res. 2002; 10: 1143-51.
162 Wadden TA, Sarwer DB, Womble LG, Foster GD, McGuckin BG, Schimmel A. Psychosocial aspects of obesity and obesity surgery. Surg Clin North Am. 2001; 81: 1001-24.
163 Ali MR, Rasmussen JJ, Monash JB, Fuller WD. Depression is associated with increased severity of co-morbidities in bariatric surgical candidates. Surg Obes Relat Dis. 2008.
164 Dixon JB, Dixon ME, O’Brien PE. Depression in association with severe obesity: changes with weight loss. Arch Intern Med. 2003; 163: 2058-65.
165 Herpertz S, Kielmann R, Wolf AM, Langkafel M, Senf W, Hebebrand J. Does obesity surgery improve psychosocial functioning? A systematic review. Int J Obes Relat Metab Disord. 2003; 27: 1300-14.
166 Rand CS, Macgregor AM. Successful weight loss following obesity surgery and the perceived liability of morbid obesity. Int J Obes. 1991; 15: 577-9.
167 van Hout GC, Boekestein P, Fortuin FA, Pelle AJ, van Heck GL. Psychosocial functioning following bariatric surgery. Obes Surg. 2006; 16: 787-94.
168 Flanagan SA. Obesity: The Last Bastion of Prejudice. Obes Surg. 1996; 6: 430-37. 169 Gortmaker SL, Must A, Perrin JM, Sobol AM, Dietz WH. Social and economic consequences of over-
weight in adolescence and young adulthood. N Engl J Med. 1993; 329: 1008-12. 170 Wadden TA, Stunkard AJ. Social and psychological consequences of obesity. Ann Intern Med. 1985;
103: 1062-7. 171 Kolotkin RL, Crosby RD, Williams GR. Health-related quality of life varies among obese subgroups.
Obes Res. 2002; 10: 748-56. 172 de Zwaan M, Lancaster KL, Mitchell JE, Howell LM, Monson N, Roerig JL, et al. Health-related quality of
life in morbidly obese patients: eff ect of gastric bypass surgery. Obes Surg. 2002; 12: 773-80. 173 Dixon JB, Dixon ME, O’Brien PE. Quality of life after lap-band placement: infl uence of time, weight
loss, and comorbidities. Obes Res. 2001; 9: 713-21. 174 Dymek MP, Le Grange D, Neven K, Alverdy J. Quality of life after gastric bypass surgery: a cross-
sectional study. Obes Res. 2002; 10: 1135-42. 175 Karlsson J, Sjostrom L, Sullivan M. Swedish obese subjects (SOS)--an intervention study of obesity.
Two-year follow-up of health-related quality of life (HRQL) and eating behavior after gastric surgery for severe obesity. Int J Obes Relat Metab Disord. 1998; 22: 113-26.
176 Kolotkin RL, Crosby RD, Gress RE, Hunt SC, Adams TD. Two-year changes in health-related quality of life in gastric bypass patients compared with severely obese controls. Surg Obes Relat Dis. 2009; 5: 250-6.
177 Mathus-Vliegen EM, de Weerd S, de Wit LT. Health-related quality-of-life in patients with morbid obesity after gastric banding for surgically induced weight loss. Surgery. 2004; 135: 489-97.
178 Schok M, Geenen R, van Antwerpen T, de Wit P, Brand N, van Ramshorst B. Quality of life after laparo-scopic adjustable gastric banding for severe obesity: postoperative and retrospective preoperative evaluations. Obes Surg. 2000; 10: 502-8.
1.
2.
3.
4.
5.
6.
7.
8.
9.
10.
11.
12.
13.
14.
15.
16.
17.
18.
19.
20.
21.
22.
23.
24.
25.
26.
27.
28.
29.
30.
31.
32.
33.
34.
35.
36.
37.
38.
39.
Chap
ter 3
41
Introduction
179 van Gemert WG, Adang EM, Greve JW, Soeters PB. Quality of life assessment of morbidly obese patients: eff ect of weight-reducing surgery. Am J Clin Nutr. 1998; 67: 197-201.
180 Waters GS, Pories WJ, Swanson MS, Meelheim HD, Flickinger EG, May HJ. Long-term studies of mental health after the Greenville gastric bypass operation for morbid obesity. Am J Surg. 1991; 161: 154-7; discussion 57-8.
181 Sarwer DB, Wadden TA, Fabricatore AN. Psychosocial and behavioral aspects of bariatric surgery. Obes Res. 2005; 13: 639-48.
182 Waaddegaard P, Clemmesen T, Jess P. Vertical gastric banding for morbid obesity: a long-term follow-up study. Eur J Surg. 2002; 168: 220-2.


Part IMetabolic aspects of obesity:
ghrelin, obestatin and adiponectin

Cha pter 4Eff ects of acute administration of
acylated and unacylated ghrelin on
glucose and insulin concentrations in
morbidly obese subjects without overt
diabetes
Rosalie M. Kiewiet, Maarten O. van Aken, Kim van der Weerd,
Piet Uitterlinden, Axel P.N. Themmen, Leo J. Hofl and,
Yolanda B. de Rijke, Patric J.D. Delhanty, Ezio Ghigo, Thierry Abribat,
Aart Jan van der Lely
European Journal of Endocrinology 2009; 161: 567-573

1.
2.
3.
4.
5.
6.
7.
8.
9.
10.
11.
12.
13.
14.
15.
16.
17.
18.
19.
20.
21.
22.
23.
24.
25.
26.
27.
28.
29.
30.
31.
32.
33.
34.
35.
36.
37.
38.
39.
Chap
ter 4
46
Eff ects of AG and UAG on glucose and insulin
ABSTRACT
Objective
To investigate the eff ects of unacylated ghrelin (UAG) and co-administration of acylated ghrelin
(AG) and UAG in morbid obesity, a condition characterized by insulin resistance and low growth
hormone (GH) levels.
Design and Methods
Eight morbidly obese non-diabetic subjects were treated with either UAG 200μg, UAG 100μg
in combination with AG 100μg (Comb), or placebo in 3 episodes of 4 consecutive days in a
double-blind randomized crossover design. Study medication was administered as daily single
i.v. bolus injections at 0900h after an overnight fast. At 1000h a standardized meal was served.
Glucose, insulin, GH, free fatty acids (FFA) and ghrelin were measured up to 4 h after administra-
tion.
Results
Insulin concentrations signifi cantly decreased after acute administration of Comb only, reach-
ing a minimum at 20 min: 58.2 ± 3.9% of baseline, vs. 88.7 ± 7.2% and 92.7 ± 2.6% after adminis-
tration of placebo and UAG, respectively (P < 0.01). After 1 h, insulin concentration had returned
to baseline. Glucose concentrations did not change after Comb. However, UAG administration
alone, did not change glucose, insulin, FFA or GH levels.
Conclusion
Co-administration of AG and UAG as a single i.v. bolus injection causes a signifi cant decrease
in insulin concentration in non-diabetic subjects suff ering from morbid obesity. Since glucose
concentration did not change in the fi rst hour after Comb administration, our data suggest a
strong improvement in insulin sensitivity. These fi ndings warrant studies in which UAG with or
without AG is administered for a longer period of time. Administration of a single bolus injec-
tion of UAG did not infl uence glucose and insulin metabolism.

1.
2.
3.
4.
5.
6.
7.
8.
9.
10.
11.
12.
13.
14.
15.
16.
17.
18.
19.
20.
21.
22.
23.
24.
25.
26.
27.
28.
29.
30.
31.
32.
33.
34.
35.
36.
37.
38.
39.
Chap
ter 4
47
Eff ects of AG and UAG on glucose and insulin
INTRODUCTION
Ghrelin, a 28-amino acid peptide produced mainly by the stomach, was originally discovered
as the natural ligand of the Growth Hormone Secretagogue Receptor type 1a (GHS-R1a).1 Its
unique molecular structure is characterized by n-octanoylation of serine at position 3 (acylated
ghrelin, AG), which is essential for binding to the GHS-R1a.1 However, in vivo, most circulating
ghrelin is unacylated (UAG), which was consequently thought to be devoid of any endocrine
action.2 Indeed, UAG does not share with AG its potent GH-stimulating eff ect,1, 3, 4 but more
recent studies have shown that UAG does have biological eff ects.5-8
Despite being primarily identifi ed as a potent GH-stimulating factor, ghrelin has been
demonstrated to have a wide spectrum of biological activities, such as stimulation of prolac-
tin and ACTH secretion, promotion of gastric motility and acid secretion, and modulation of
cardiovascular function.9-13 One of its most intriguing functions is the long-term and short-
term regulation of energy balance. Continuous administration of ghrelin to rodents induces
increased food intake resulting in weight gain, whereas in humans 24-h plasma profi les show
marked preprandial increases and postprandial decreases in circulating ghrelin concentrations,
which suggests an orexigenic eff ect.8, 14-17 Since insulin displays an exactly opposite meal-
related pattern, the interaction between insulin and ghrelin has been extensively studied. In
general, it is assumed that insulin has a negative eff ect on ghrelin concentrations,18, 19 whereas
administration of AG results in insulin resistance.6, 20-22 On the other hand, the eff ect of UAG on
insulin metabolism is still a matter of debate.
Since the main biological diff erence between AG and UAG is its ability to bind to the
GHS-R1a, the question arises whether this receptor and consequently GH release is involved
in ghrelin eff ects on glucose and insulin metabolism. To answer this question, our group has
previously studied the eff ects of administration of AG, UAG and a combination of AG and UAG
in adult-onset GH-defi cient subjects.23 Surprisingly, the combination of AG and UAG strongly
improved insulin sensitivity in these individuals, whereas AG as well as UAG alone was shown
to increase glucose concentration at constant insulin levels.23
Since decreased insulin sensitivity plays a key role in the pathophysiology of type 2 dia-
betes, ways to improve insulin sensitivity could be benefi cial to individuals prone to develop
this disease. Obesity is typically associated with insulin resistance and, in a later phase, with
type 2 diabetes.24 Additionally, obesity is characterized by low GH levels, comparable with GH-
defi cient subjects.25
In the present study, we therefore evaluated the eff ects of UAG and co-administration of
AG and UAG on glucose and insulin metabolism in individuals suff ering from morbid obesity, a
condition characterized by insulin resistance and low GH levels. As we were only interested in
potential ways to improve insulin sensitivity, we did not study the eff ects of AG administration
only, as this substance is known to worsen insulin sensitivity in all animal and human models
studied so far.
1.
2.
3.
4.
5.
6.
7.
8.
9.
10.
11.
12.
13.
14.
15.
16.
17.
18.
19.
20.
21.
22.
23.
24.
25.
26.
27.
28.
29.
30.
31.
32.
33.
34.
35.
36.
37.
38.
39.
Chap
ter 4
48
Eff ects of AG and UAG on glucose and insulin
MATERIALS AND METHODS
Study population
Eight morbidly obese female Caucasian subjects (age 45.4 ± 10.3 (mean ± SD), range 28-62
years, mean body mass index (BMI) 42.4 ± 4.8 kg/m2) were recruited from an affi liated clinic for
bariatric surgery. All were on a waiting list to undergo gastric banding or gastric bypass (criteria:
BMI > 40 kg/m2 or BMI > 35 kg/m2 in combination with relevant comorbidity).26 Exclusion criteria
for the present study were: overt diabetes mellitus, liver enzyme test abnormalities, pregnancy
and previous bariatric surgery. All subjects gave their written informed consent to participate in
the study, which had been approved by the ethical committee of our hospital. Two participants
were suff ering from hypertension, for which they were treated with antihypertensive drugs. Six
were healthy, not suff ering from any relevant comorbidities.
Study design
The present double-blind randomized crossover study design consisted of three study episodes
in which three treatment regimens were administered: i) UAG 200 μg (UAG), ii) UAG 100 μg in
combination with AG 100 μg (Comb), and iii) placebo (placebo). Every patient underwent all
treatment regimens, which were separated by a wash out period of at least 2 weeks. Every study
episode consisted of 4 consecutive days. Study medication was administered as a single daily
intravenous bolus injection.
After an overnight fast, an indwelling catheter was placed in the forearm and kept patent
by a slowly running saline infusion. At 0900 h study medication was administered as an acute
bolus injection. Blood samples were taken before administration of study medication and at
regular intervals up to 240 min: at 10, 20, 30, 45, 60, 75, 90, 120, 180 and 240 min. Subjects
were kept fasted during the fi rst hour after administration of study medication. At 1000 h they
received a standard breakfast containing 595 kcal (23 g protein, 27 g fat and 65 g carbohydrate),
and at 1300 h, they received a standard lunch, comparable with breakfast. After lunch up to
midnight, patients were free to choose their food intake.
Study medication
Both AG and UAG were obtained from Bachem AG, Bubendorf, Switzerland. To prevent deg-
radation of ghrelin vials were stored at -80°C up to 90 min before administration. To prevent
interaction of AG and UAG in vitro, two separate samples were administered to the patients,
followed by 5 ml of saline after each infusion. Samples were blinded and randomized.
Assessments
Blood samples for total ghrelin and AG measurements were collected in EDTA tubes. Samples
were stored on ice until centrifuging. After centrifuging, serum samples were stored at -20°C
until processing. Acylated and total ghrelin levels were determined using a commercially

1.
2.
3.
4.
5.
6.
7.
8.
9.
10.
11.
12.
13.
14.
15.
16.
17.
18.
19.
20.
21.
22.
23.
24.
25.
26.
27.
28.
29.
30.
31.
32.
33.
34.
35.
36.
37.
38.
39.
Chap
ter 4
49
Eff ects of AG and UAG on glucose and insulin
available RIA (Linco Research, St. Charles, MO, USA). Intra- and interassay variation of the AG
assay are 7 and 13% respectively, and of the total ghrelin assay 6% and 16% respectively.
Both insulin and GH were measured using a chemiluminescent immunometric assay (Immu-
lite 2000, Siemens Medical Solutions Diagnostics, Los Angeles, CA, USA). Intra- and interassay
variation of the insulin assay are 4% and 5% respectively, while intra- and interassay variation
of the GH assay are 4% and 6% respectively. Glucose was measured on a Hitachi 917 (Roche
Diagnostics) by a glucose oxidase method. Free fatty acids (FFA) concentrations in the pres-
ence of tetrahydrolipstatin (fi nal concentration 1 mg/L, prepared from Xenical capsules) were
measured in EDTA plasma on a Hitachi 912 using the Wako Chemicals kit (Wako Chemicals
GmbH, Neuss, Germany).27
Statistical analysis
Results are presented as mean ± SEM unless otherwise specifi ed. P < 0.05 was considered
signifi cant. Diff erences between the three study periods were calculated using the Friedman
test, the non-parametric equivalent of a one-sample repeated-measures design. To determine
correlations between various parameters, a two-tailed Spearman’s rank test was used. Areas
under the curve (AUC) were calculated using the trapezoid rule.
Statistic calculations were performed using Statistical Package for the Social Sciences (SPSS
release 14.0; SPSS Inc, Chicago, IL, USA).
UAG concentrations were determined calculating the diff erence between total ghrelin and
AG. Glucose-to-insulin ratio was used as an estimate of insulin sensitivity.
RESULTS
Concentrations of AG and UAG
After acute administration of AG 100 μg i.v. (in combination with UAG 100 μg), baseline AG
concentration of 64 pg/ml increased to a peak of 2325 pg/ml after 10 min. The half-life was
short: AG concentrations returned to baseline 100 min after administration (Fig. 1A). Baseline
concentrations of UAG were 844 pg/ml, increasing to 10499 pg/ml and to 11205 pg/ml 10 min
after administration of UAG 200 μg i.v. alone and 100 μg i.v. in combination with AG 100 μg
respectively. At termination of the measurements, 4 h after administration, UAG concentrations
had not completely returned to baseline (Fig. 1B).
Eff ects of administration of UAG
During fasting, fi rst hour after administration
Acute administration of UAG 200 μg did not induce any change in GH concentration.
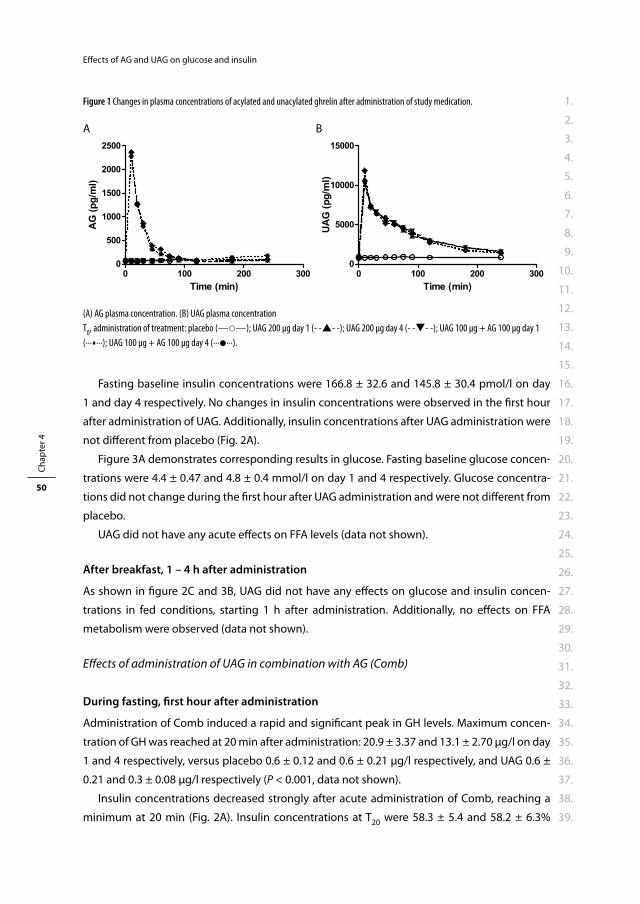
1.
2.
3.
4.
5.
6.
7.
8.
9.
10.
11.
12.
13.
14.
15.
16.
17.
18.
19.
20.
21.
22.
23.
24.
25.
26.
27.
28.
29.
30.
31.
32.
33.
34.
35.
36.
37.
38.
39.
Chap
ter 4
50
Eff ects of AG and UAG on glucose and insulin
Fasting baseline insulin concentrations were 166.8 ± 32.6 and 145.8 ± 30.4 pmol/l on day
1 and day 4 respectively. No changes in insulin concentrations were observed in the fi rst hour
after administration of UAG. Additionally, insulin concentrations after UAG administration were
not diff erent from placebo (Fig. 2A).
Figure 3A demonstrates corresponding results in glucose. Fasting baseline glucose concen-
trations were 4.4 ± 0.47 and 4.8 ± 0.4 mmol/l on day 1 and 4 respectively. Glucose concentra-
tions did not change during the fi rst hour after UAG administration and were not diff erent from
placebo.
UAG did not have any acute eff ects on FFA levels (data not shown).
After breakfast, 1 – 4 h after administration
As shown in fi gure 2C and 3B, UAG did not have any eff ects on glucose and insulin concen-
trations in fed conditions, starting 1 h after administration. Additionally, no eff ects on FFA
metabolism were observed (data not shown).
Eff ects of administration of UAG in combination with AG (Comb)
During fasting, fi rst hour after administration
Administration of Comb induced a rapid and signifi cant peak in GH levels. Maximum concen-
tration of GH was reached at 20 min after administration: 20.9 ± 3.37 and 13.1 ± 2.70 μg/l on day
1 and 4 respectively, versus placebo 0.6 ± 0.12 and 0.6 ± 0.21 μg/l respectively, and UAG 0.6 ±
0.21 and 0.3 ± 0.08 μg/l respectively (P < 0.001, data not shown).
Insulin concentrations decreased strongly after acute administration of Comb, reaching a
minimum at 20 min (Fig. 2A). Insulin concentrations at T20 were 58.3 ± 5.4 and 58.2 ± 6.3%
Figure 1 Changes in plasma concentrations of acylated and unacylated ghrelin after administration of study medication.
A B
(A) AG plasma concentration. (B) UAG plasma concentration
T0, administration of treatment: placebo (——); UAG 200 μg day 1 (- -- -); UAG 200 μg day 4 (- -- -); UAG 100 μg + AG 100 μg day 1
(∙∙∙∙∙∙); UAG 100 μg + AG 100 μg day 4 (∙∙∙∙∙∙).
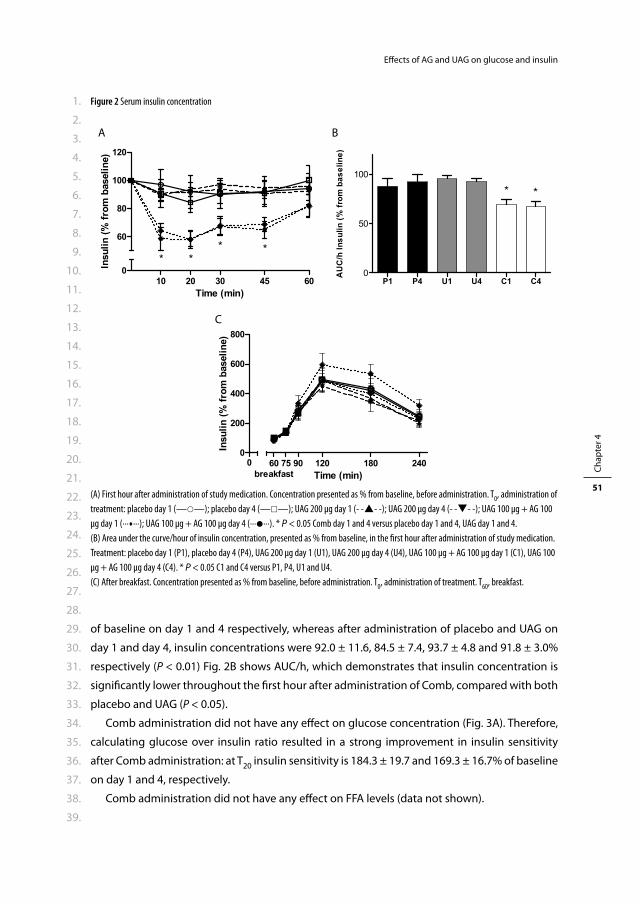
1.
2.
3.
4.
5.
6.
7.
8.
9.
10.
11.
12.
13.
14.
15.
16.
17.
18.
19.
20.
21.
22.
23.
24.
25.
26.
27.
28.
29.
30.
31.
32.
33.
34.
35.
36.
37.
38.
39.
Chap
ter 4
51
Eff ects of AG and UAG on glucose and insulin
of baseline on day 1 and 4 respectively, whereas after administration of placebo and UAG on
day 1 and day 4, insulin concentrations were 92.0 ± 11.6, 84.5 ± 7.4, 93.7 ± 4.8 and 91.8 ± 3.0%
respectively (P < 0.01) Fig. 2B shows AUC/h, which demonstrates that insulin concentration is
signifi cantly lower throughout the fi rst hour after administration of Comb, compared with both
placebo and UAG (P < 0.05).
Comb administration did not have any eff ect on glucose concentration (Fig. 3A). Therefore,
calculating glucose over insulin ratio resulted in a strong improvement in insulin sensitivity
after Comb administration: at T20 insulin sensitivity is 184.3 ± 19.7 and 169.3 ± 16.7% of baseline
on day 1 and 4, respectively.
Comb administration did not have any eff ect on FFA levels (data not shown).
Figure 2 Serum insulin concentration
A
C
B
(A) First hour after administration of study medication. Concentration presented as % from baseline, before administration. T0, administration of
treatment: placebo day 1 (——); placebo day 4 (——); UAG 200 μg day 1 (- -- -); UAG 200 μg day 4 (- -- -); UAG 100 μg + AG 100
μg day 1 (∙∙∙∙∙∙); UAG 100 μg + AG 100 μg day 4 (∙∙∙∙∙∙). * P < 0.05 Comb day 1 and 4 versus placebo day 1 and 4, UAG day 1 and 4.
(B) Area under the curve/hour of insulin concentration, presented as % from baseline, in the fi rst hour after administration of study medication.
Treatment: placebo day 1 (P1), placebo day 4 (P4), UAG 200 μg day 1 (U1), UAG 200 μg day 4 (U4), UAG 100 μg + AG 100 μg day 1 (C1), UAG 100
μg + AG 100 μg day 4 (C4). * P < 0.05 C1 and C4 versus P1, P4, U1 and U4.
(C) After breakfast. Concentration presented as % from baseline, before administration. T0, administration of treatment. T
60, breakfast.
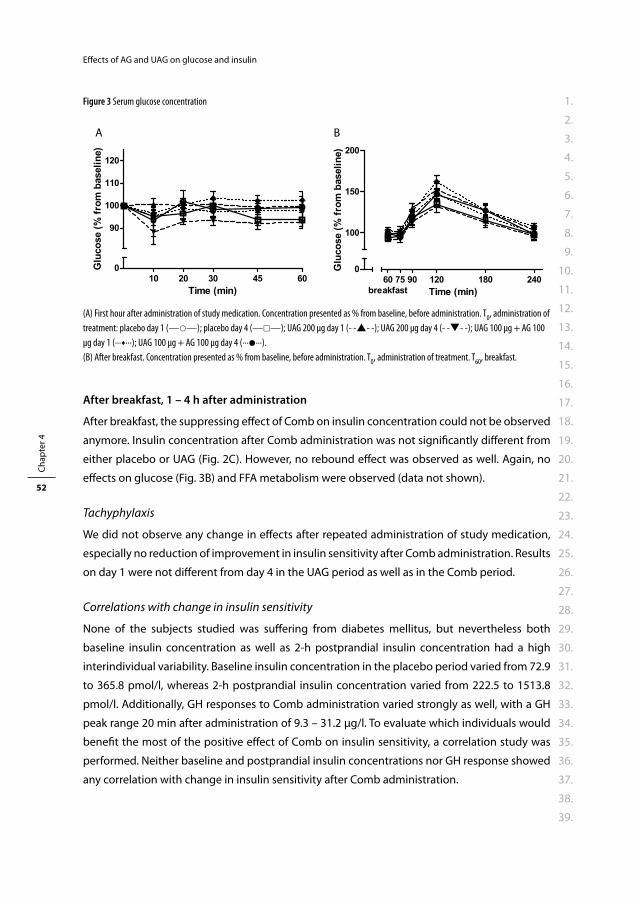
1.
2.
3.
4.
5.
6.
7.
8.
9.
10.
11.
12.
13.
14.
15.
16.
17.
18.
19.
20.
21.
22.
23.
24.
25.
26.
27.
28.
29.
30.
31.
32.
33.
34.
35.
36.
37.
38.
39.
Chap
ter 4
52
Eff ects of AG and UAG on glucose and insulin
After breakfast, 1 – 4 h after administration
After breakfast, the suppressing eff ect of Comb on insulin concentration could not be observed
anymore. Insulin concentration after Comb administration was not signifi cantly diff erent from
either placebo or UAG (Fig. 2C). However, no rebound eff ect was observed as well. Again, no
eff ects on glucose (Fig. 3B) and FFA metabolism were observed (data not shown).
Tachyphylaxis
We did not observe any change in eff ects after repeated administration of study medication,
especially no reduction of improvement in insulin sensitivity after Comb administration. Results
on day 1 were not diff erent from day 4 in the UAG period as well as in the Comb period.
Correlations with change in insulin sensitivity
None of the subjects studied was suff ering from diabetes mellitus, but nevertheless both
baseline insulin concentration as well as 2-h postprandial insulin concentration had a high
interindividual variability. Baseline insulin concentration in the placebo period varied from 72.9
to 365.8 pmol/l, whereas 2-h postprandial insulin concentration varied from 222.5 to 1513.8
pmol/l. Additionally, GH responses to Comb administration varied strongly as well, with a GH
peak range 20 min after administration of 9.3 – 31.2 μg/l. To evaluate which individuals would
benefi t the most of the positive eff ect of Comb on insulin sensitivity, a correlation study was
performed. Neither baseline and postprandial insulin concentrations nor GH response showed
any correlation with change in insulin sensitivity after Comb administration.
Figure 3 Serum glucose concentration
A B
(A) First hour after administration of study medication. Concentration presented as % from baseline, before administration. T0, administration of
treatment: placebo day 1 (——); placebo day 4 (——); UAG 200 μg day 1 (- -- -); UAG 200 μg day 4 (- -- -); UAG 100 μg + AG 100
μg day 1 (∙∙∙∙∙∙); UAG 100 μg + AG 100 μg day 4 (∙∙∙∙∙∙).
(B) After breakfast. Concentration presented as % from baseline, before administration. T0, administration of treatment. T
60, breakfast.
1.
2.
3.
4.
5.
6.
7.
8.
9.
10.
11.
12.
13.
14.
15.
16.
17.
18.
19.
20.
21.
22.
23.
24.
25.
26.
27.
28.
29.
30.
31.
32.
33.
34.
35.
36.
37.
38.
39.
Chap
ter 4
53
Eff ects of AG and UAG on glucose and insulin
Side eff ects
Three patients experienced a short episode of fl ushing and dizziness shortly after administra-
tion of Comb. They all developed this mild and self-limiting side eff ect on one day, randomly in
4 days during the Comb study period.
DISCUSSION
This study demonstrates that co-administration of AG and UAG induces a strong decrease in
insulin concentration in morbidly obese subjects without overt diabetes. A single injection of
AG + UAG resulted in almost 50% reduction of insulin concentration with unaff ected glucose
levels, suggesting a strong improvement in insulin sensitivity. During repeated administration,
no tachyphylaxis was observed. Broglio et al. previously demonstrated that in healthy young
men UAG was able to counteract the insulin resistance induced by AG alone.3 Additionally,
co-administration of AG and UAG was shown to improve insulin sensitivity in GH-defi cient
patients.23 Nevertheless, the present study population is the fi rst that could actually benefi t
from a treatment able to improve insulin sensitivity. Since obesity induces insulin resistance
and consequently causes diabetes mellitus, the present fi ndings could lead towards a new
approach in treating diabetes.
The observed decrease in insulin concentration after acute injection of AG + UAG with unaf-
fected glucose levels suggests an improvement in insulin sensitivity, as stated above. However,
glucose/insulin ratio is only partially correlated with the variation in insulin action and insulin
sensitivity, since insulin levels also depend on secretion, distribution and degradation of insu-
lin.28 Nevertheless, in the present study, we at least replicated the eff ect of AG + UAG on insulin
concentration as previously observed in our study in GH-defi cient subjects.23 Therefore, future
studies evaluating the eff ect of AG + UAG on insulin sensitivity using an euglycaemic insulin
clamp are warranted and indicated.
Co-administration of AG and UAG aff ected insulin concentration in the fi rst hour after
administration only. The most likely explanation of this short-lived eff ect is the observed short
half-life of AG and, to a smaller extent, UAG. Additionally, plasma concentrations of UAG were
comparable 10 min after administration of UAG 200 μg and UAG 100 μg + AG 100 μg respec-
tively. Therefore, the AG plasma peak concentration must have been signifi cantly earlier than
10 min, followed by a rapid degradation of AG to UAG. Since subjects were fasted during the
fi rst hour of the study protocol and insulin concentrations had returned to baseline at breakfast,
no conclusions can be drawn about the acute eff ect of AG + UAG on insulin sensitivity in fed
conditions. Nevertheless, at least no rebound eff ect was observed after breakfast.
In considering co-administration of AG and UAG as a treatment of insulin resistance, it is
important to be aware of the risk of tachyphylaxis. To date, no data are available on the long-
term eff ects of AG and UAG administration. In the present study, AG + UAG was administered on
1.
2.
3.
4.
5.
6.
7.
8.
9.
10.
11.
12.
13.
14.
15.
16.
17.
18.
19.
20.
21.
22.
23.
24.
25.
26.
27.
28.
29.
30.
31.
32.
33.
34.
35.
36.
37.
38.
39.
Chap
ter 4
54
Eff ects of AG and UAG on glucose and insulin
4 consecutive days, while no decrease in eff ect was observed. We found the sustained eff ects
of the combination of AG and UAG after 4 days of once-daily administration suggesting the
absence of acute tachyphylaxis reassuring.
Shortly after the discovery of the orexigenic eff ect of ghrelin, it was hypothesized that obese
subjects would have elevated ghrelin concentrations that could contribute to the pathogen-
esis of obesity.29 On the contrary, total ghrelin concentrations were found to be decreased in
obesity.29 More recent studies, however, have assessed both AG and UAG levels and AG/UAG
ratios. UAG, but not AG, is decreased in obesity, while insulin-resistant obese subjects display a
higher AG/UAG ratio than equally obese insulin-sensitive subjects.30, 31 These data suggest that
relatively high AG levels combined with lower UAG levels might contribute to insulin resistance
in obesity. In the present study, however, we administered UAG and AG in a 1:1 ratio, which
is much higher than in vivo where UAG/AG is about 9:1.32 Since this 1:1 ratio was previously
observed to improve insulin sensitivity,23 we decided to continue using these concentrations.
Nevertheless, future studies are needed to evaluate the eff ect on insulin resistance of co-
administration of AG and UAG in diff erent proportions.
Since the present study did not evaluate the eff ects of AG in morbidly obese subjects, it
could be discussed that the observed decrease in insulin concentration is the result of AG alone
more than of the co-administration of AG and UAG. Three studies have evaluated the eff ect of
ghrelin administration in obesity. One study did not show any change in glucose and insulin
concentrations,33 while two studies reported an increase in glucose concentration with a slight
decrease in insulin levels.9, 21 These results are not in accordance with the present fi ndings that
show a highly signifi cant decrease in insulin concentrations without a reciprocal increase in
glucose concentrations. This diff erence suggests that the present fi ndings do result from the
co-administration of AG and UAG more than of AG alone, which is supported by the study in
GH defi cient subjects as well.23
In the present study, UAG administration had no eff ect on glucose and insulin levels despite
the presence of pharmacological concentrations. It is still unclear whether acute changes in
UAG levels do have intrinsic eff ects on glucose and insulin concentrations. Some reports on
acute eff ects of UAG described an increase in glucose levels,23 while other studies, like the pres-
ent, did not observe any eff ect.3 However, continuous administration of UAG, on the contrary,
seems to improve insulin sensitivity.34 Therefore, possible explanations for the observed eff ects
of co-administration of AG + UAG remain speculative. Since UAG is not able to bind to the GHS-
R1a, it is not likely that antagonism on this receptor plays a role. Additionally, GHS-R1a does not
mediate ghrelin’s eff ects on hepatic glucose output by primary porcine hepatocytes.6 Whether
a yet unidentifi ed receptor to which both AG and UAG are able to bind mediates these eff ects
needs to be studied.
Our study clearly opens new perspectives in the approach of insulin resistance in obesity.
As mentioned before, euglycaemic insulin clamp studies are needed to evaluate whether the
present changes in glucose and insulin concentrations are mainly the result of improvement
1.
2.
3.
4.
5.
6.
7.
8.
9.
10.
11.
12.
13.
14.
15.
16.
17.
18.
19.
20.
21.
22.
23.
24.
25.
26.
27.
28.
29.
30.
31.
32.
33.
34.
35.
36.
37.
38.
39.
Chap
ter 4
55
Eff ects of AG and UAG on glucose and insulin
in insulin sensitivity, as currently expected. Further research is needed to evaluate whether the
present fi ndings can be extrapolated to fed conditions. However, attention must be paid to the
possible adverse eff ects of continuous administration of AG, such as its impact on adipogenesis
and food intake.17 Finally, the eff ects of co-administration of AG and UAG in subjects suff ering
from diabetes should be studied.
In conclusion, the present study demonstrates that co-administration of AG and UAG in a
1:1 molar ratio in fasted morbidly obese subjects without overt diabetes, strongly decreases
insulin concentrations at unchanged glucose levels, suggesting an improvement in insulin
sensitivity. Further studies are needed to provide information on the eff ects in fed conditions
and in diabetic subjects.
1.
2.
3.
4.
5.
6.
7.
8.
9.
10.
11.
12.
13.
14.
15.
16.
17.
18.
19.
20.
21.
22.
23.
24.
25.
26.
27.
28.
29.
30.
31.
32.
33.
34.
35.
36.
37.
38.
39.
Chap
ter 4
56
Eff ects of AG and UAG on glucose and insulin
REFERENCES
1 Kojima M, Hosoda H, Date Y, Nakazato M, Matsuo H, Kangawa K. Ghrelin is a growth-hormone-releasing acylated peptide from stomach. Nature. 1999; 402: 656-60.
2 Hosoda H, Kojima M, Matsuo H, Kangawa K. Ghrelin and des-acyl ghrelin: two major forms of rat ghrelin peptide in gastrointestinal tissue. Biochem Biophys Res Commun. 2000; 279: 909-13.
3 Broglio F, Gottero C, Prodam F, Gauna C, Muccioli G, Papotti M, et al. Non-acylated ghrelin counteracts the metabolic but not the neuroendocrine response to acylated ghrelin in humans. J Clin Endocrinol Metab. 2004; 89: 3062-5.
4 Takaya K, Ariyasu H, Kanamoto N, Iwakura H, Yoshimoto A, Harada M, et al. Ghrelin strongly stimulates growth hormone release in humans. J Clin Endocrinol Metab. 2000; 85: 4908-11.
5 Asakawa A, Inui A, Fujimiya M, Sakamaki R, Shinfuku N, Ueta Y, et al. Stomach regulates energy bal-ance via acylated ghrelin and desacyl ghrelin. Gut. 2005; 54: 18-24.
6 Gauna C, Delhanty PJ, Hofl and LJ, Janssen JA, Broglio F, Ross RJ, et al. Ghrelin stimulates, whereas des-octanoyl ghrelin inhibits, glucose output by primary hepatocytes. J Clin Endocrinol Metab. 2005; 90: 1055-60.
7 Heijboer AC, van den Hoek AM, Parlevliet ET, Havekes LM, Romijn JA, Pijl H, et al. Ghrelin diff erentially aff ects hepatic and peripheral insulin sensitivity in mice. Diabetologia. 2006; 49: 732-8.
8 Thompson NM, Gill DA, Davies R, Loveridge N, Houston PA, Robinson IC, et al. Ghrelin and des-octanoyl ghrelin promote adipogenesis directly in vivo by a mechanism independent of the type 1a growth hormone secretagogue receptor. Endocrinology. 2004; 145: 234-42.
9 Tassone F, Broglio F, Destefanis S, Rovere S, Benso A, Gottero C, et al. Neuroendocrine and metabolic eff ects of acute ghrelin administration in human obesity. J Clin Endocrinol Metab. 2003; 88: 5478-83.
10 Masuda Y, Tanaka T, Inomata N, Ohnuma N, Tanaka S, Itoh Z, et al. Ghrelin stimulates gastric acid secre-tion and motility in rats. Biochem Biophys Res Commun. 2000; 276: 905-8.
11 Date Y, Nakazato M, Murakami N, Kojima M, Kangawa K, Matsukura S. Ghrelin acts in the central nervous system to stimulate gastric acid secretion. Biochem Biophys Res Commun. 2001; 280: 904-7.
12 Vestergaard ET, Andersen NH, Hansen TK, Rasmussen LM, Moller N, Sorensen KE, et al. Cardiovascular eff ects of intravenous ghrelin infusion in healthy young men. Am J Physiol Heart Circ Physiol. 2007; 293: H3020-6.
13 Nagaya N, Kangawa K. Ghrelin improves left ventricular dysfunction and cardiac cachexia in heart failure. Curr Opin Pharmacol. 2003; 3: 146-51.
14 Wren AM, Small CJ, Ward HL, Murphy KG, Dakin CL, Taheri S, et al. The novel hypothalamic peptide ghrelin stimulates food intake and growth hormone secretion. Endocrinology. 2000; 141: 4325-8.
15 Cummings DE. Ghrelin and the short- and long-term regulation of appetite and body weight. Physiol Behav. 2006; 89: 71-84.
16 Williams DL, Cummings DE. Regulation of ghrelin in physiologic and pathophysiologic states. J Nutr. 2005; 135: 1320-5.
17 Tschop M, Smiley DL, Heiman ML. Ghrelin induces adiposity in rodents. Nature. 2000; 407: 908-13. 18 McLaughlin T, Abbasi F, Lamendola C, Frayo RS, Cummings DE. Plasma ghrelin concentrations are
decreased in insulin-resistant obese adults relative to equally obese insulin-sensitive controls. J Clin Endocrinol Metab. 2004; 89: 1630-5.
19 Saad MF, Bernaba B, Hwu CM, Jinagouda S, Fahmi S, Kogosov E, et al. Insulin regulates plasma ghrelin concentration. J Clin Endocrinol Metab. 2002; 87: 3997-4000.
20 Vestergaard ET, Djurhuus CB, Gjedsted J, Nielsen S, Moller N, Holst JJ, et al. Acute eff ects of ghrelin administration on glucose and lipid metabolism. J Clin Endocrinol Metab. 2008; 93: 438-44.
21 Guido M, Romualdi D, De Marinis L, Porcelli T, Giuliani M, Costantini B, et al. Administration of exog-enous ghrelin in obese patients with polycystic ovary syndrome: eff ects on plasma levels of growth hormone, glucose, and insulin. Fertil Steril. 2007; 88: 125-30.
1.
2.
3.
4.
5.
6.
7.
8.
9.
10.
11.
12.
13.
14.
15.
16.
17.
18.
19.
20.
21.
22.
23.
24.
25.
26.
27.
28.
29.
30.
31.
32.
33.
34.
35.
36.
37.
38.
39.
Chap
ter 4
57
Eff ects of AG and UAG on glucose and insulin
22 Broglio F, Arvat E, Benso A, Gottero C, Muccioli G, Papotti M, et al. Ghrelin, a natural GH secretagogue produced by the stomach, induces hyperglycemia and reduces insulin secretion in humans. J Clin Endocrinol Metab. 2001; 86: 5083-6.
23 Gauna C, Meyler FM, Janssen JA, Delhanty PJ, Abribat T, van Koetsveld P, et al. Administration of acyl-ated ghrelin reduces insulin sensitivity, whereas the combination of acylated plus unacylated ghrelin strongly improves insulin sensitivity. J Clin Endocrinol Metab. 2004; 89: 5035-42.
24 Reaven GM. Banting lecture 1988. Role of insulin resistance in human disease. Diabetes. 1988; 37: 1595-607.
25 Maccario M, Grottoli S, Procopio M, Oleandri SE, Rossetto R, Gauna C, et al. The GH/IGF-I axis in obesity: infl uence of neuro-endocrine and metabolic factors. Int J Obes Relat Metab Disord. 2000; 24 Suppl 2: S96-9.
26 National Institutes of Health NH, Lung, and Blood Institute. Clinical Guidelines of the Identifi cation, Evaluation, and Treatment of Overweight and Obesity in Adults: The Evidence Report. Bethesda, Md: Nationale Institutes of Health. 1998.
27 Krebs M, Stingl H, Nowotny P, Weghuber D, Bischof M, Waldhausl W, et al. Prevention of in vitro lipoly-sis by tetrahydrolipstatin. Clin Chem. 2000; 46: 950-4.
28 Ferrannini E, Mari A. How to measure insulin sensitivity. J Hypertens. 1998; 16: 895-906. 29 Tschop M, Weyer C, Tataranni PA, Devanarayan V, Ravussin E, Heiman ML. Circulating ghrelin levels are
decreased in human obesity. Diabetes. 2001; 50: 707-9. 30 Barazzoni R, Zanetti M, Ferreira C, Vinci P, Pirulli A, Mucci M, et al. Relationships between desacylated
and acylated ghrelin and insulin sensitivity in the metabolic syndrome. J Clin Endocrinol Metab. 2007; 92: 3935-40.
31 St-Pierre DH, Karelis AD, Coderre L, Malita F, Fontaine J, Mignault D, et al. Association of acylated and nonacylated ghrelin with insulin sensitivity in overweight and obese postmenopausal women. J Clin Endocrinol Metab. 2007; 92: 264-9.
32 van der Lely AJ, Tschop M, Heiman ML, Ghigo E. Biological, physiological, pathophysiological, and pharmacological aspects of ghrelin. Endocr Rev. 2004; 25: 426-57.
33 Alvarez-Castro P, Isidro ML, Garcia-Buela J, Dieguez C, Casanueva FF, Cordido F. Eff ect of acute ghrelin administration on glycaemia and insulin levels in obese patients. Diabetes Obes Metab. 2006; 8: 555-60.
34 Broglio F PF, Riganti F, Gramaglia E, Benso A, Lucatello B, Abribat T, van der Lely AJ, Ghigo E. Unacyl-ated Ghrelin (UAG) Enhances the Early Insulin Response to Meal, Improves Glucose Metabolism and Decreases Free Fatty Acids Levels in Healthy Volunteers. ENDO 2007, Toronto, Canada, Abstract P2-190. 2007.


Cha pter 5Unacylated ghrelin acts as a potent
insulin secretagogue in glucose-
stimulated conditions
Carlotta Gauna, Rosalie M. Kiewiet, Joop A.M.J.L. Janssen,
Bedette van de Zande, Patric J.D. Delhanty, Ezio Ghigo, Leo J. Hofl and,
Axel P. N. Themmen, and Aart Jan van der Lely
American Journal of Physiology – Endocrinology and Metabolism 2007;
293: E697-E704
1.
2.
3.
4.
5.
6.
7.
8.
9.
10.
11.
12.
13.
14.
15.
16.
17.
18.
19.
20.
21.
22.
23.
24.
25.
26.
27.
28.
29.
30.
31.
32.
33.
34.
35.
36.
37.
38.
39.
Chap
ter 5
60
Eff ects of UAG on insulin release
ABSTRACT
Acylated and unacylated ghrelin (AG and UAG) are gut hormones that exert pleiotropic actions,
including regulation of insulin secretion and glucose metabolism. In this study, we investigated
whether AG and UAG diff erentially regulate portal and systemic insulin levels after a glucose
load. We studied the eff ects of the administration of AG (30 nmol/kg), UAG (3 and 30 nmol/kg),
the ghrelin receptor antagonist [D-Lys3]GHRP-6 (1 μmol/kg), or various combinations of these
compounds on portal and systemic levels of glucose and insulin after an intravenous glucose
tolerance test (IVGTT, D-glucose 1 g/kg) in anesthetized fasted Wistar rats. UAG administration
potently and dose-dependently enhanced the rise of insulin concentration induced by IVGTT
in the portal and, to a lesser extent, the systemic circulation. This UAG-induced eff ect was
completely blocked by the coadministration of exogenous AG at equimolar concentrations.
Similarly to UAG, [D-Lys3]GHRP-6, alone or in combination with AG and UAG, strongly enhanced
the portal insulin response to IVGTT, whereas exogenous AG alone did not exert any further
eff ect. Our data demonstrate that, in glucose-stimulated conditions, exogenous UAG acts as
a potent insulin secretagogue, whereas endogenous AG exerts a maximal tonic inhibition on
glucose-induced insulin release.
1.
2.
3.
4.
5.
6.
7.
8.
9.
10.
11.
12.
13.
14.
15.
16.
17.
18.
19.
20.
21.
22.
23.
24.
25.
26.
27.
28.
29.
30.
31.
32.
33.
34.
35.
36.
37.
38.
39.
Chap
ter 5
61
Eff ects of UAG on insulin release
INTRODUCTION
Ghrelin is a guthormone predominantly produced in the stomach and, to a lesser extent, in
other regions of the gastrointestinal tract.1-3 Ghrelin circulates in the bloodstream in two diff er-
ent forms: acylated (or n-octanoylated) and unacylated (or des-octanoylated or des-acylated).2
Acylated ghrelin (AG) has a unique feature: a posttranslational esterifi cation of a fatty (n-octa-
noic or, to a lesser extent, n-decanoic) acid on serine residue at position 3.2 This acylation is
considered necessary for AG’s actions via the growth hormone secretagogue receptor type 1a
(GHS-R1a), also called ghrelin receptor (GRLN-R).2, 4 However, normally AG accounts for less
than 10% of the total ghrelin in the circulation. The majority of circulating ghrelin is unacylated
(UAG), which binds with high affi nity to a receptor, diff erent from GHS-R1a and yet unknown.2, 5
Both AG and UAG have pleiotropic activities, including regulation of insulin secretion and
glucose metabolism. It has been shown that endogenous AG and UAG are also produced in the
endocrine pancreas, which also expresses the GHS-R1a.6-10 It has been found that endogenous
AG in the pancreas inhibits the glucose-induced insulin release via the GHS-R1a,7 as demon-
strated by the marked increase of insulin response to glucose after blockade of endogenous
AG (i.e., via receptor antagonism, anti-AG antiserum, deletion of the ghrelin gene).1, 7, 11 More-
over, ablation of the ghrelin gene improved glucose tolerance, insulin secretion, and insulin
sensitivity in genetically leptin-defi cient (ob/ob) obese mice.11 Administration of exogenous AG
suppressed further insulin secretion both in fasting and in glucose-stimulated conditions, and
it worsened insulin sensitivity and glucose tolerance after a meal or a glucose load.1, 11-13 UAG
administration neither had eff ects on glucose-induced insulin release in a perfused pancreas
model,1 nor did it induce signifi cant changes in systemic fasting levels of insulin and glucose in
vivo.1, 7, 13, 14 However, UAG increased insulin release in vitro by insulinoma cell lines exposed to
high glucose concentrations,15, 16 and overexpression of (endogenous) UAG in pancreatic islets
improved the insulin sensitivity to an intraperitoneal glucose load in mice.17 Moreover, when
coadministered with AG, UAG completely prevented the AG-induced increase in circulating
glucose levels and worsening of insulin sensitivity.13, 18, 19
Together, these data elucidate the role of AG in the negative regulation of insulin secretion,
insulin sensitivity, and glucose metabolism. On the other hand, they show that an excess of
endogenous UAG improves insulin sensitivity and suggest that UAG, or more likely the ratio
AG/UAG, might be implicated in the modulation of insulin release. However, at present, the
metabolic role of UAG remains to be defi ned. The reported eff ects of AG and UAG on glucose
and insulin levels in vivo are based on measurements of systemic blood samples, whereas both
AG and UAG are secreted into the portal circulation before they reach the systemic circulation.
Moreover, these peptides also have hepatic eff ects. Therefore, we hypothesized that, concern-
ing insulin secretion, assessment of insulin concentration in the portal vein might be more
informative than that in the systemic circulation.
1.
2.
3.
4.
5.
6.
7.
8.
9.
10.
11.
12.
13.
14.
15.
16.
17.
18.
19.
20.
21.
22.
23.
24.
25.
26.
27.
28.
29.
30.
31.
32.
33.
34.
35.
36.
37.
38.
39.
Chap
ter 5
62
Eff ects of UAG on insulin release
The aim of this study was to investigate whether the blockade of endogenous AG action
(i.e., blockade of the GHS-R1a) or the administration of exogenous AG and UAG diff erentially
regulates the portal and systemic insulin response to glucose and/or modulates hepatic insulin
clearance. We therefore studied in rats the eff ects of the administration of AG, UAG, the ghrelin
receptor antagonist [D-Lys3]GHRP-6, or their combinations on portal and peripheral glucose
and insulin levels during an intravenous glucose tolerance test (IVGTT).
MATERIALS AND METHODS
Materials
Plasma glucose levels were measured using a glucose oxidase method (Instruchemie, Delfzijl,
The Netherlands). Rat insulin was measured using a rat insulin ELISA kit (Mercodia, Uppsala,
Sweden). Total and acylated ghrelin were measured using radioimmunoassays (RIAs) from
Linco Research (St. Charles, MO). Rat acylated and unacylated (des-octanoyl) ghrelin, as well
as [D-Lys3]GHRP-6, were obtained from NeoMPS (Strasbourg, France). Pentobarbital sodium
(250 mg/5 ml) was prepared and provided by the hospital pharmacy (Erasmus MC, Rotterdam,
The Netherlands). EDTA-containing tubes were obtained by Greiner Bio-One (Alphen aan den
Rijn, The Netherlands). Silicone catheters (3-French size) were provided by UNO Roestvaststaal
(Zevenaar, The Netherlands); suture needles (Dafi lon 8/0) were by B. Braun Melsungen (Melsun-
gen, Germany).
Animals
Male Wistar rats (age 10–12 wk, weight 350–400 g; Harlan Netherlands, Horst, The Netherlands)
were housed in groups in a temperature-controlled room under a 12:12-h light-dark cycle and
maintained on pelleted chow with free access to water. The animals were housed for at least
1 wk before the start of the experiments to allow for acclimatization. Animal protocols were
in compliance with the principles of laboratory animal care and Dutch regulations on animal
welfare and were approved by the institutional Animal Welfare Committee.
Surgery and Experimental Design
All studies were performed after a fasting period of 18 h (overnight). Studies were performed
under anesthesia, and the rats were euthanized at the end of the experiment.
Animals were anesthetized using an intraperitoneal (ip) injection of pentobarbital sodium
(60 mg/kg induction, 20 mg/kg maintenance administered at the end of the surgical procedure,
before the start of the experimental session). Deep anesthesia was confi rmed by the absence
of refl exes. Animals were kept on a warming mat to maintain core body temperature and were
connected to a breathing apparatus (O2, 1 l/min), to improve oxygenation, for the entire dura-
tion of the experiment (including surgical procedure).
1.
2.
3.
4.
5.
6.
7.
8.
9.
10.
11.
12.
13.
14.
15.
16.
17.
18.
19.
20.
21.
22.
23.
24.
25.
26.
27.
28.
29.
30.
31.
32.
33.
34.
35.
36.
37.
38.
39.
Chap
ter 5
63
Eff ects of UAG on insulin release
The surgical procedure was performed under aseptic conditions, as follows.
Cannulation of the jugular vein. An incision was made just above the right clavicle, the con-
nective and adipose tissues were pushed aside, and the jugular vein was exposed. After the
jugular vein was mobilized, a catheter previously connected to a syringe and fi lled with saline
solution was pushed inside the vessel until it reached the right atrium. Patency of the catheter
was checked by aspirating blood and fl ushing the catheter with saline solution. The free end of
the catheter was used for saline injection, treatment administration, and sampling.
Cannulation of the portal vein. A midline incision was made from the level of the symphysis
pubis to the xiphoid cartilage. The intestines were lifted out and laid next to the animal on
gauze moistened with warm saline solution to minimize dehydration. A purse-string (diameter
1 mm) was made in the wall of the portal vein, opposite the gastroduodenal vein. The center
of the purse-string was cut, and the catheter was inserted into the portal vein and pushed in
for a few millimeters with the tip secured 1 mm caudal to the liver. The patency of the catheter
was checked by aspirating blood and injecting saline. The free end of the cannula was used for
sampling procedure during the experiment.
Treatment Administration and Sampling
Rats (fasted overnight) were assigned to one of the following treatment groups:
1. Saline (1 ml), n = 12.
2. IVGTT, n = 12. IVGTT was performed by injecting D-glucose at a dose of 1 g/kg (50%, 1 ml
maximal volume) through the jugular catheter. The dose of 1 g/kg was chosen taking into
account the reduction of insulin sensitivity caused by abdominal surgery20 and the possible
interference due to anesthesia.21, 22 Pentobarbital sodium was used, since compared with
other anesthetics it has been shown to interfere less with insulin secretion and glucose
metabolism in both the fed and the fasted conditions,21, 22 in accord with our previous
observations (unpublished data).
3. IVGTT + rat AG (30 nmol/kg), n = 7.
4. IVGTT + rat UAG (3 nmol/kg), n = 6.
5. IVGTT + UAG (30 nmol/kg), n = 10.
6. IVGTT + [D-Lys3]GHRP-6 (1 μmol/kg), n = 6.
7. IVGTT + [D-Lys3]GHRP-6 (1 μmol/kg) + AG (30 nmol/kg), n = 6.
8. IVGTT + [D-Lys3]GHRP-6 (1 μmol/kg) + UAG (30 nmol/kg), n = 7.
9. IVGTT + AG (30 nmol/kg) + UAG (30 nmol/kg), n = 7.
After baseline samples had been taken from both catheters, treatments were administered
through the jugular cannula at time 0, and samples were taken from both catheters at 1, 5,
10, 20, 30, and 50 min after treatment administration to measure glucose and insulin levels.
At baseline, total and acylated ghrelin levels were also measured in 24 rats (before they were
1.
2.
3.
4.
5.
6.
7.
8.
9.
10.
11.
12.
13.
14.
15.
16.
17.
18.
19.
20.
21.
22.
23.
24.
25.
26.
27.
28.
29.
30.
31.
32.
33.
34.
35.
36.
37.
38.
39.
Chap
ter 5
64
Eff ects of UAG on insulin release
assigned to diff erent treatment groups). At every time point, the blood volume withdrawn from
each catheter (350 μl) was replaced by an equal volume of saline solution.
Blood samples were collected using ice-cold EDTA-containing tubes, to which aprotinin
(Trasylol, 500,000 KIE, 40 μl/ml) was added. Samples were immediately centrifuged, and plasma
aliquots for AG measurements were acidifi ed with 1 N HCl (1:10 vol/vol). All aliquots were kept
at 4°C until the end of the experiment and then stored at –20°C. Multiple freeze-thaw cycles
were avoided, and aliquots were thawed only for the ghrelin assay. This procedure has been
indicated by Hosoda et al.23 and by Groschl et al.24 as a standard procedure for collection of
blood samples to determine ghrelin concentrations.
At the end of each experiment the animals were killed by exsanguination under deep
anesthesia.
Serum total ghrelin and AG levels (pg/ml) were measured using RIA kits that utilize
125I-labeled ghrelin as a tracer. The specifi city for rat ghrelin (total and AG, respectively) is
100%. Total ghrelin is recognized by polyclonal rabbit antibodies raised against full-length
ghrelin. This antibody recognizes intact and des-octanoyl ghrelin and ghrelin residues 14–28.
The sensitivity of the assay is 93 pg/ml; the intra-assay coeffi cient of variation (CV) averages
6.4%, the interassay CV 16.3%. AG is recognized by a guinea pig anti-ghrelin specifi c for the
ghrelin molecule octanoylated at its Ser3 residue. This antibody recognizes octanoyl ghrelin,
intact and residues 1–10. Cross-reactivity with UAG is <0.1% and with ghrelin fragments (resi-
dues 14–28) is zero. The sensitivity of the assay is 7.8 pg/ml; the intra-assay CV is 7.4% and the
interassay CV is 13.5%.
Insulin was measured using a rat insulin ELISA kit according to the manufacturer’s instruc-
tions. The sensitivity of the assay is 0.07 μg/l.
Calculations
UAG. UAG levels were calculated by subtracting AG from total ghrelin concentrations at every
time point either in the portal or in the peripheral (i.e., right atrium) vein samples.
Hepatic clearance. To estimate whether the liver might play a role in the clearance of ghrelin
produced by the gut, we calculated the percentage of hepatic clearance by using a method
originally proposed by Kaden et al.25 The percentage of hepatic extraction of any given hor-
mone is calculated as (hormone presented to the liver – hormone leaving the liver) x 100/
(hormone presented to the liver). The ratio of the relative contribution of a “hormone presented
to the liver” by the portal vein vs. the hepatic artery (concentration x fl ow) is assumed to be
3:1.26 The percentage of portal hormone extraction is calculated as (hormone concentration
in the portal vein – hormone concentration in hepatic vein) x 100/(hormone concentration
in the portal vein). Since the contribution to posthepatic insulin levels due to tissues that do
not drain in the portal vein is negligible, we assumed that the insulin gradient between portal
vein and right atrium is a valid proxy of hepatic clearance, although in the right atrium insulin
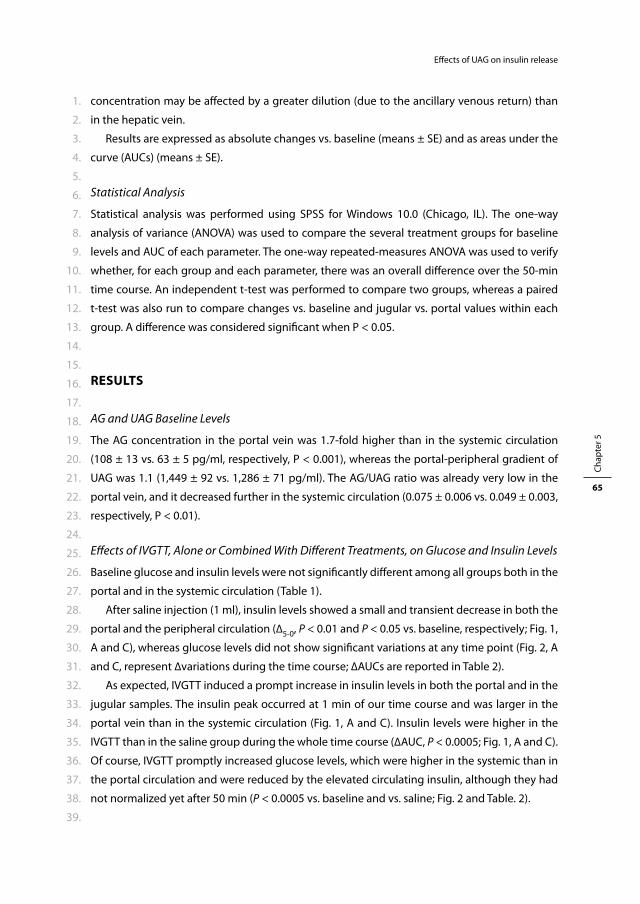
1.
2.
3.
4.
5.
6.
7.
8.
9.
10.
11.
12.
13.
14.
15.
16.
17.
18.
19.
20.
21.
22.
23.
24.
25.
26.
27.
28.
29.
30.
31.
32.
33.
34.
35.
36.
37.
38.
39.
Chap
ter 5
65
Eff ects of UAG on insulin release
concentration may be aff ected by a greater dilution (due to the ancillary venous return) than
in the hepatic vein.
Results are expressed as absolute changes vs. baseline (means ± SE) and as areas under the
curve (AUCs) (means ± SE).
Statistical Analysis
Statistical analysis was performed using SPSS for Windows 10.0 (Chicago, IL). The one-way
analysis of variance (ANOVA) was used to compare the several treatment groups for baseline
levels and AUC of each parameter. The one-way repeated-measures ANOVA was used to verify
whether, for each group and each parameter, there was an overall diff erence over the 50-min
time course. An independent t-test was performed to compare two groups, whereas a paired
t-test was also run to compare changes vs. baseline and jugular vs. portal values within each
group. A diff erence was considered signifi cant when P < 0.05.
RESULTS
AG and UAG Baseline Levels
The AG concentration in the portal vein was 1.7-fold higher than in the systemic circulation
(108 ± 13 vs. 63 ± 5 pg/ml, respectively, P < 0.001), whereas the portal-peripheral gradient of
UAG was 1.1 (1,449 ± 92 vs. 1,286 ± 71 pg/ml). The AG/UAG ratio was already very low in the
portal vein, and it decreased further in the systemic circulation (0.075 ± 0.006 vs. 0.049 ± 0.003,
respectively, P < 0.01).
Eff ects of IVGTT, Alone or Combined With Diff erent Treatments, on Glucose and Insulin Levels
Baseline glucose and insulin levels were not signifi cantly diff erent among all groups both in the
portal and in the systemic circulation (Table 1).
After saline injection (1 ml), insulin levels showed a small and transient decrease in both the
portal and the peripheral circulation (Δ5-0, P < 0.01 and P < 0.05 vs. baseline, respectively; Fig. 1,
A and C), whereas glucose levels did not show signifi cant variations at any time point (Fig. 2, A
and C, represent Δvariations during the time course; ΔAUCs are reported in Table 2).
As expected, IVGTT induced a prompt increase in insulin levels in both the portal and in the
jugular samples. The insulin peak occurred at 1 min of our time course and was larger in the
portal vein than in the systemic circulation (Fig. 1, A and C). Insulin levels were higher in the
IVGTT than in the saline group during the whole time course (ΔAUC, P < 0.0005; Fig. 1, A and C).
Of course, IVGTT promptly increased glucose levels, which were higher in the systemic than in
the portal circulation and were reduced by the elevated circulating insulin, although they had
not normalized yet after 50 min (P < 0.0005 vs. baseline and vs. saline; Fig. 2 and Table. 2).
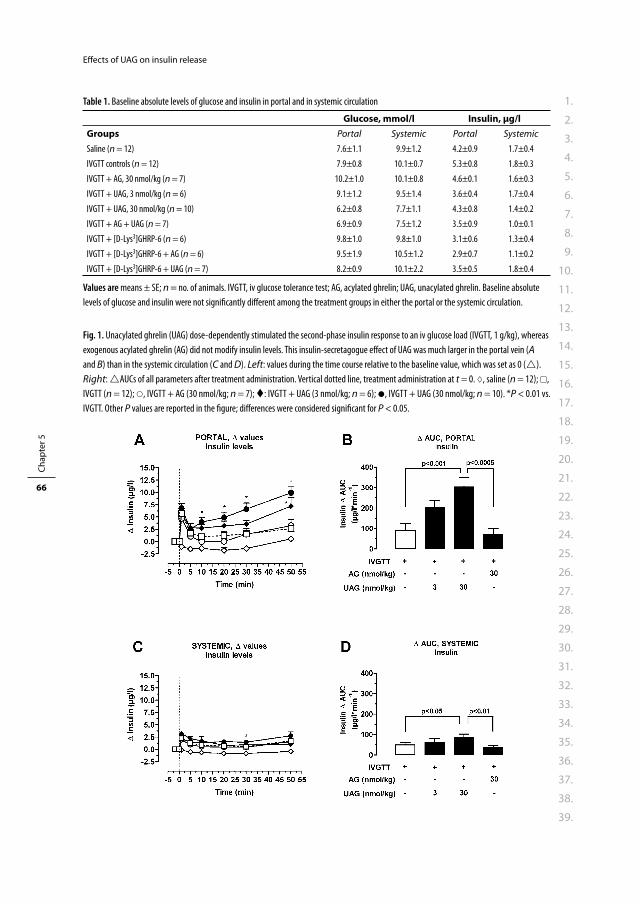
1.
2.
3.
4.
5.
6.
7.
8.
9.
10.
11.
12.
13.
14.
15.
16.
17.
18.
19.
20.
21.
22.
23.
24.
25.
26.
27.
28.
29.
30.
31.
32.
33.
34.
35.
36.
37.
38.
39.
Chap
ter 5
66
Eff ects of UAG on insulin release
Table 1. Baseline absolute levels of glucose and insulin in portal and in systemic circulation
Glucose, mmol/l Insulin, μg/lGroups Portal Systemic Portal Systemic
Saline (n = 12) 7.6±1.1 9.9±1.2 4.2±0.9 1.7±0.4
IVGTT controls (n = 12) 7.9±0.8 10.1±0.7 5.3±0.8 1.8±0.3
IVGTT + AG, 30 nmol/kg (n = 7) 10.2±1.0 10.1±0.8 4.6±0.1 1.6±0.3
IVGTT + UAG, 3 nmol/kg (n = 6) 9.1±1.2 9.5±1.4 3.6±0.4 1.7±0.4
IVGTT + UAG, 30 nmol/kg (n = 10) 6.2±0.8 7.7±1.1 4.3±0.8 1.4±0.2
IVGTT + AG + UAG (n = 7) 6.9±0.9 7.5±1.2 3.5±0.9 1.0±0.1
IVGTT + [D-Lys3]GHRP-6 (n = 6) 9.8±1.0 9.8±1.0 3.1±0.6 1.3±0.4
IVGTT + [D-Lys3]GHRP-6 + AG (n = 6) 9.5±1.9 10.5±1.2 2.9±0.7 1.1±0.2
IVGTT + [D-Lys3]GHRP-6 + UAG (n = 7) 8.2±0.9 10.1±2.2 3.5±0.5 1.8±0.4
Values are means ± SE; n = no. of animals. IVGTT, iv glucose tolerance test; AG, acylated ghrelin; UAG, unacylated ghrelin. Baseline absolute
levels of glucose and insulin were not signifi cantly diff erent among the treatment groups in either the portal or the systemic circulation.
Fig. 1. Unacylated ghrelin (UAG) dose-dependently stimulated the second-phase insulin response to an iv glucose load (IVGTT, 1 g/kg), whereas
exogenous acylated ghrelin (AG) did not modify insulin levels. This insulin-secretagogue eff ect of UAG was much larger in the portal vein (A
and B) than in the systemic circulation (C and D). Left: values during the time course relative to the baseline value, which was set as 0 ().
Right: AUCs of all parameters after treatment administration. Vertical dotted line, treatment administration at t = 0. , saline (n = 12); ,
IVGTT (n = 12); , IVGTT + AG (30 nmol/kg; n = 7); : IVGTT + UAG (3 nmol/kg; n = 6); , IVGTT + UAG (30 nmol/kg; n = 10). *P < 0.01 vs.
IVGTT. Other P values are reported in the fi gure; diff erences were considered signifi cant for P < 0.05.

1.
2.
3.
4.
5.
6.
7.
8.
9.
10.
11.
12.
13.
14.
15.
16.
17.
18.
19.
20.
21.
22.
23.
24.
25.
26.
27.
28.
29.
30.
31.
32.
33.
34.
35.
36.
37.
38.
39.
Chap
ter 5
67
Eff ects of UAG on insulin release
The administration of exogenous AG (30 nmol/kg) did not change the insulin response to
IVGTT signifi cantly, although a small and transient decrease was recorded in portal, but not in
systemic, insulin levels (Fig. 1, A–D). Moreover, the administration of AG did not modify glucose
levels (excursion curves and ΔAUCs) after IVGTT either in the portal or in the systemic samples
(Fig. 2 and Table 2).
Administration of UAG dose-dependently increased the second-phase insulin response to
IVGTT in the portal vein. In fact, after peaking at 1 min, insulin decreased and started gradually
to rise again at 10 min and reached the highest level at 50 min (Δ50-0, IVGTT + UAG 3 nmol/kg vs.
IVGTT, P < 0.004; IVGTT + UAG 30 nmol/kg vs. IVGTT, P < 0.0005; Fig. 1A). The insulin response
to IVGTT during the whole time course (ΔAUC) was clearly and dose-dependently increased by
UAG, although statistical signifi cance was reached only at 30 nmol/kg (P < 0.001 vs. IVGTT; Fig.
1B). In the systemic circulation, the stimulatory eff ect of UAG at 30 nmol/kg was still detectable,
although much less than in the portal vein (ΔAUC, P < 0.05; Fig. 1, C and D). However, portal and
systemic glucose levels after IVGTT were not modifi ed signifi cantly by UAG (Fig. 2 and Table 2).
Fig. 2. Administration of exogenous AG (30 nmol/kg) or UAG (3 and 30 nmol/kg) did not modify glucose levels either in the portal vein (A and
B) or in the peripheral circulation (C and D). Left: values during the time course relative to the baseline value which was set as 0 (). Right:
AUCs of all parameters after treatment administration. Vertical dotted line, treatment administration at t = 0. , saline (n = 12); , IVGTT
(n = 12); , IVGTT + AG (30 nmol/kg; n = 7); , IVGTT + UAG (3 nmol/kg; n = 6), , IVGTT + UAG (30 nmol/kg; n = 10). #P < 0.001 vs.
IVGTT. Diff erences were considered signifi cant for P < 0.05.

1.
2.
3.
4.
5.
6.
7.
8.
9.
10.
11.
12.
13.
14.
15.
16.
17.
18.
19.
20.
21.
22.
23.
24.
25.
26.
27.
28.
29.
30.
31.
32.
33.
34.
35.
36.
37.
38.
39.
Chap
ter 5
68
Eff ects of UAG on insulin release
The GHS-R1a antagonist [D-Lys3]GHRP-6 (1 μmol/kg), like UAG, enhanced the second-phase
insulin response to glucose in the portal vein. Portal insulin levels gradually increased from
20 min (P < 0.05) to 50 min (Δ50-0, [D-Lys3]GHRP-6+IVGTT vs, IVGTT, P < 0.03; Fig. 3A). Portal
insulin ΔAUC was signifi cantly higher (P < 0.01) in rats treated with [D-Lys3]GHRP-6 + IVGTT
than in those that received IVGTT alone (Fig. 3B). In the systemic circulation, the stimulatory
eff ect on insulin release induced by the GHS-R1a antagonist was lost, and the ΔAUC of the
whole time course was similar to that in the IVGTT group. (Fig. 3, C and D). Moreover, the eff ect
exerted by [D-Lys3]GHRP-6 + IVGTT on glucose-induced insulin secretion was not modifi ed by
the simultaneous administration of AG or UAG. Figure 3, A and B, clearly shows that [D-Lys3]
GHRP-6, alone or coadministered with AG or UAG, stimulated the second-phase portal insulin
response to IVGTT and that this eff ect was again similar in extent, pattern, and timing to that
observed after UAG (30 nmol/kg) alone. ΔAUC of portal insulin concentrations in the group
treated with [D-Lys3]GHRP-6, alone or combined with AG and UAG, was similar and higher
than in the control (IVGTT) animals (P < 0.01, P = 0.05, and P < 0.03, respectively). Furthermore,
glucose-stimulated portal insulin levels (ΔAUC) in all the groups treated with [D-Lys3]GHRP-
6, alone or in combination with AG and UAG, were higher (P < 0.005, P < 0.01, and P < 0.04,
respectively) than in animals that received exogenous AG alone (Fig. 3, B and D).
No eff ects were observed on peripheral insulin levels in rats treated with the GHS-R1a
antagonist, alone or in combination with AG or UAG, compared with the IVGTT or the IVGTT+AG
group (Fig. 3, C and D).
Despite the observed increase of insulin levels, after administration of the GHS-R1a antago-
nist [D-Lys3]GHRP-6, alone or in combination with AG or UAG, this was not accompanied by any
signifi cant changes in portal or peripheral glucose levels in terms of AUC (Table 2) and curve
profi le (data not shown).
Interestingly, the coadministration of AG (30 nmol/kg) with UAG (30 nmol/kg) completely
abolished the UAG-mediated increase in the second-phase insulin release both in portal
Table 2. Glucose and insulin (levels AUC) in portal and systemic circulation
Groups Glucose AUC,
mmol·l–1·min
Insulin AUC,
μg·l–1·min
Portal Systemic Portal Systemic
Saline (n = 12) –4±27 14±16 –53±20 –31±11
IVGTT controls (n = 12) 711±65 778±68 91±33 50±11
IVGTT + AG, 30 nmol/kg (n = 7) 604±55 730±44 72±27 40±9
IVGTT + UAG, 3 nmol/kg (n = 6) 693±61 818±60 204±33 63±19
IVGTT + UAG, 30 nmol/kg (n = 10) 716±51 819±46 305±44 P<0.001 88±15 P<0.05
IVGTT + AG + UAG (n = 7) 666±50 855±59 73±35 39±12
IVGTT + [D-Lys3]GHRP-6 (n = 6) 815±65 997±107 280±68 P<0.01 68±18
IVGTT + [D-Lys3]GHRP-6 + AG (n = 6) 785±66 734±74 234±54 P<0.03 69±13
IVGTT + [D-Lys3]GHRP-6 + UAG (n = 7) 652±35 703±67 257±81 P=0.05 60±26
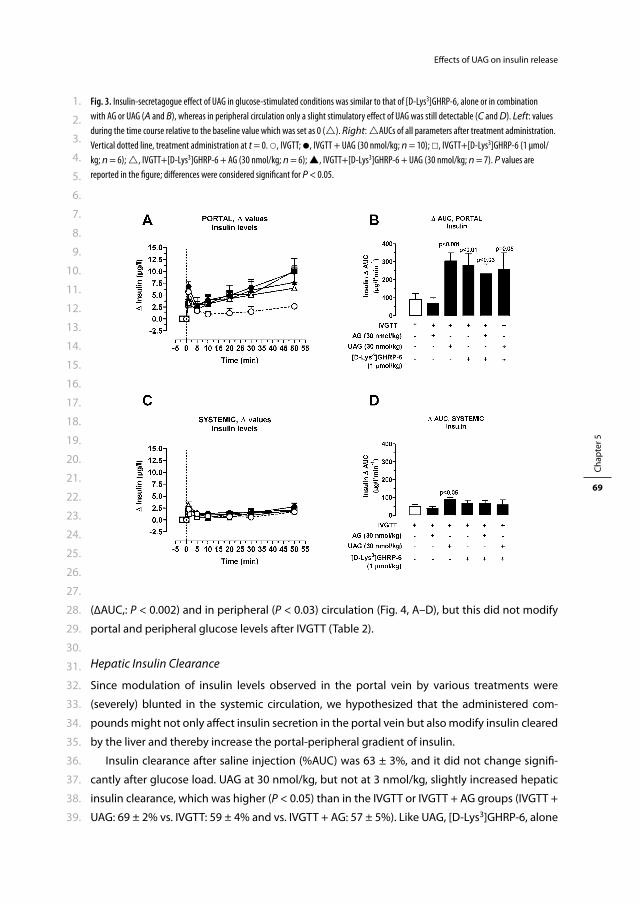
1.
2.
3.
4.
5.
6.
7.
8.
9.
10.
11.
12.
13.
14.
15.
16.
17.
18.
19.
20.
21.
22.
23.
24.
25.
26.
27.
28.
29.
30.
31.
32.
33.
34.
35.
36.
37.
38.
39.
Chap
ter 5
69
Eff ects of UAG on insulin release
(ΔAUC,: P < 0.002) and in peripheral (P < 0.03) circulation (Fig. 4, A–D), but this did not modify
portal and peripheral glucose levels after IVGTT (Table 2).
Hepatic Insulin Clearance
Since modulation of insulin levels observed in the portal vein by various treatments were
(severely) blunted in the systemic circulation, we hypothesized that the administered com-
pounds might not only aff ect insulin secretion in the portal vein but also modify insulin cleared
by the liver and thereby increase the portal-peripheral gradient of insulin.
Insulin clearance after saline injection (%AUC) was 63 ± 3%, and it did not change signifi -
cantly after glucose load. UAG at 30 nmol/kg, but not at 3 nmol/kg, slightly increased hepatic
insulin clearance, which was higher (P < 0.05) than in the IVGTT or IVGTT + AG groups (IVGTT +
UAG: 69 ± 2% vs. IVGTT: 59 ± 4% and vs. IVGTT + AG: 57 ± 5%). Like UAG, [D-Lys3]GHRP-6, alone
Fig. 3. Insulin-secretagogue eff ect of UAG in glucose-stimulated conditions was similar to that of [D-Lys3]GHRP-6, alone or in combination
with AG or UAG (A and B), whereas in peripheral circulation only a slight stimulatory eff ect of UAG was still detectable (C and D). Left: values
during the time course relative to the baseline value which was set as 0 (). Right: AUCs of all parameters after treatment administration.
Vertical dotted line, treatment administration at t = 0. , IVGTT; , IVGTT + UAG (30 nmol/kg; n = 10); , IVGTT+[D-Lys3]GHRP-6 (1 μmol/
kg; n = 6); , IVGTT+[D-Lys3]GHRP-6 + AG (30 nmol/kg; n = 6); , IVGTT+[D-Lys3]GHRP-6 + UAG (30 nmol/kg; n = 7). P values are
reported in the fi gure; diff erences were considered signifi cant for P < 0.05.
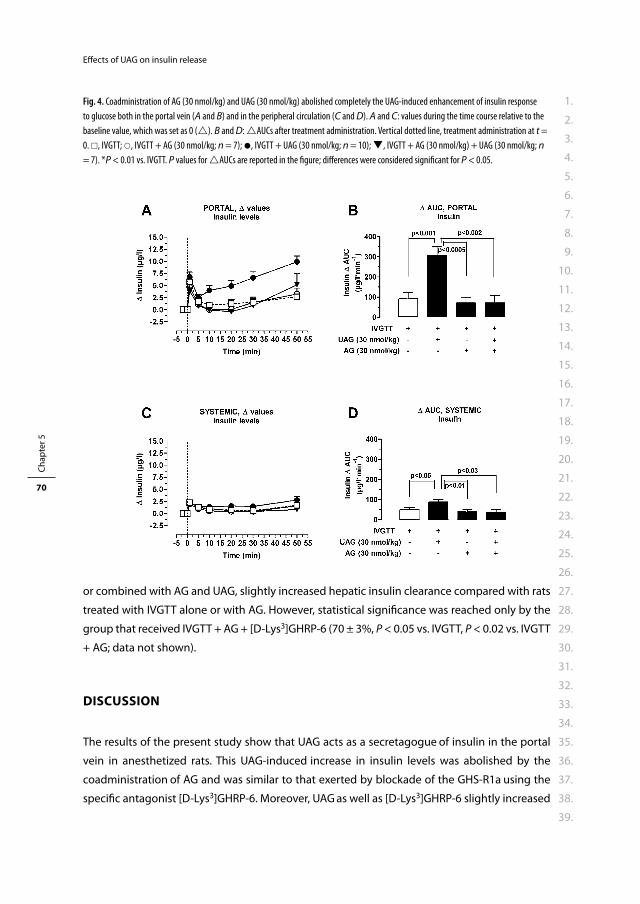
1.
2.
3.
4.
5.
6.
7.
8.
9.
10.
11.
12.
13.
14.
15.
16.
17.
18.
19.
20.
21.
22.
23.
24.
25.
26.
27.
28.
29.
30.
31.
32.
33.
34.
35.
36.
37.
38.
39.
Chap
ter 5
70
Eff ects of UAG on insulin release
or combined with AG and UAG, slightly increased hepatic insulin clearance compared with rats
treated with IVGTT alone or with AG. However, statistical signifi cance was reached only by the
group that received IVGTT + AG + [D-Lys3]GHRP-6 (70 ± 3%, P < 0.05 vs. IVGTT, P < 0.02 vs. IVGTT
+ AG; data not shown).
DISCUSSION
The results of the present study show that UAG acts as a secretagogue of insulin in the portal
vein in anesthetized rats. This UAG-induced increase in insulin levels was abolished by the
coadministration of AG and was similar to that exerted by blockade of the GHS-R1a using the
specifi c antagonist [D-Lys3]GHRP-6. Moreover, UAG as well as [D-Lys3]GHRP-6 slightly increased
Fig. 4. Coadministration of AG (30 nmol/kg) and UAG (30 nmol/kg) abolished completely the UAG-induced enhancement of insulin response
to glucose both in the portal vein (A and B) and in the peripheral circulation (C and D). A and C: values during the time course relative to the
baseline value, which was set as 0 (). B and D: AUCs after treatment administration. Vertical dotted line, treatment administration at t =
0. , IVGTT; , IVGTT + AG (30 nmol/kg; n = 7); , IVGTT + UAG (30 nmol/kg; n = 10); , IVGTT + AG (30 nmol/kg) + UAG (30 nmol/kg; n
= 7). *P < 0.01 vs. IVGTT. P values for AUCs are reported in the fi gure; diff erences were considered signifi cant for P < 0.05.
1.
2.
3.
4.
5.
6.
7.
8.
9.
10.
11.
12.
13.
14.
15.
16.
17.
18.
19.
20.
21.
22.
23.
24.
25.
26.
27.
28.
29.
30.
31.
32.
33.
34.
35.
36.
37.
38.
39.
Chap
ter 5
71
Eff ects of UAG on insulin release
hepatic insulin clearance. This may partly explain why we observed a marked increase in insulin
levels in the portal circulation but not in the peripheral blood.
Our data demonstrate for the fi rst time that UAG potently and dose-dependently enhances
the insulin response to an intravenous glucose load in vivo. This insulin secretagogue eff ect of
UAG was marked in the portal vein, whereas it was barely detectable in the systemic circula-
tion, supporting the hypothesis that UAG plays an important role in glucose metabolism in the
liver. In line with this, previous observations using primary hepatocyte cultures showed that
UAG dose-dependently decreased glucose output and completely prevented the AG-induced
and partially blocked the glucagon-dependent glucose release.27 However, it was also found
that UAG alone does not improve hepatic insulin sensitivity in a euglycemic hyperinsulinemic
clamp model in mice.19 In the present study, we estimated that UAG also slightly increased the
fraction of insulin cleared by the liver, thus contributing to the augmentation of the portal-
peripheral gradient of insulin. Although we did not perform real insulin clearance studies, we
speculate that UAG might also infl uence hepatic insulin metabolism. Therefore, we suggest
that UAG stimulates insulin secretion by pancreatic islets and perhaps also improves insulin
action on target tissues (e.g., the liver). Interestingly, the UAG-enhanced insulin response to
glucose was similar in extent, timing, and pattern to that exerted by [D-Lys3]GHRP-6, a GHS-R1a
antagonist. The eff ect of [D-Lys3]GHRP-6 likely refl ects the blockade of the inhibitory action
of endogenous AG on β-cells. This is in accord with the evidence that endogenous AG toni-
cally restricts glucose-induced insulin release and that pharmacological, immunological, and
genetic blockade of AG action in pancreatic islets enhanced glucose-induced insulin release.1,
7, 11 Nevertheless, by using this model, we could not detect signifi cant eff ects on glucose levels
in any of the treatment groups, making diffi cult any interpretation of these data as variations in
insulin sensitivity. This may be explained by the high glucose load that we administered during
the experiments, the presence of an increased counterregulatory hormonal response in the
studied rats due to abdominal surgery,20 and/or possible eff ects of the anesthesia.21, 22
We show that the administration of (exogenous) AG did not suppress insulin release any
further, suggesting that after a glucose load endogenous AG at low concentrations, which we
reconfi rmed in our model, already exerts a maximal inhibitory eff ect on insulin secretion, at
least under these experimental conditions. Another possible reason is that this maximal sup-
pressive activity is due to autocrine and paracrine eff ects of AG produced in the pancreas. This
would also explain why the coadministration of the GHS-R1a antagonist together with exog-
enous AG elicited the insulin response to glucose load to the same extent as [D-Lys3]GHRP-6
alone, i.e., removing the inhibitory tone of endogenous AG on insulin secretion. Our fi ndings
diff er from previous reports by Dezaki et al.,1 who observed a suppressive eff ect of exogenous
AG on glucose-induced insulin release, which was not modifi ed by UAG in a perfused pancreas
model. However, this discrepancy may be due to the fact that, diff erently from Dezaki et al., we
used an in vivo model.
1.
2.
3.
4.
5.
6.
7.
8.
9.
10.
11.
12.
13.
14.
15.
16.
17.
18.
19.
20.
21.
22.
23.
24.
25.
26.
27.
28.
29.
30.
31.
32.
33.
34.
35.
36.
37.
38.
39.
Chap
ter 5
72
Eff ects of UAG on insulin release
Intriguingly, when exogenous AG was coadministered with UAG, it completely blocked the
insulin secretagogue eff ect of UAG. This fi nding once again reinforces the hypothesis that AG
and UAG, at least at equimolar concentrations, interact with each other and have eff ects on
glucose homeostasis. This is in agreement with previous reports in humans and in rodents,
showing that the coadministration of UAG with AG was able to prevent the AG-induced
decrease in circulating insulin and worsening of insulin sensitivity.12, 13, 18, 19
Although our data do not provide evidence regarding the possible mechanism of action
of UAG, we found a striking similarity between the insulin secretagogue eff ect of UAG and
[D-Lys3]GHRP-6. This observation, coupled with the fi nding that exogenous AG could block the
UAG-induced stimulation on insulin, led us to speculate that UAG may act as an antagonist of
endogenous AG (i.e., removing the suppressive tone of AG on insulin release). However, since
UAG, diff erently from [D-Lys3]GHRP-6, does not block the GHS-R1a,2 we suggest the existence
of a putative UAG receptor (diff erent from GHS-R1a) that mediates the stimulating eff ect of
UAG on insulin. The fact that the actions of UAG and [D-Lys3]GHRP-6 on glucose-stimulated
insulin secretion were neither additive nor synergistic might be explained by two mechanisms:
1) either UAG or [D-Lys3]GHRP-6 exerts a maximal antagonistic activity on endogenous AG; 2)
[D-Lys3]GHRP-6 is not only an (ant)agonist of the GHS-R1a but also an agonist of the putative
UAG receptor. Indeed, the mechanisms of (inter)action of UAG, [D-Lys3]GHRP-6, and AG on insu-
lin release and glucose metabolism, as well as their physiological relevance, need to be further
elucidated and may disclose a ghrelin system far more complex than it is currently known.
In conclusion, our data demonstrate that UAG at pharmacological concentrations is a potent
insulin secretagogue. This, together with our previous observation that UAG blunts glucose
output by primary hepatocytes,27 suggests that UAG action is targeted mainly at the liver. These
eff ects of UAG in the regulation of glucose metabolism might be of therapeutic interest for
those pathological conditions characterized by insulin resistance and impaired insulin release.
Acknowledgements
We thank Piet Uitterlinden and Dr. Yolanda de Rijke for skillful technical assistance and Drs.
Maarten O. van Aken and Kees Schoenderwoerd for helpful scientifi c discussion.
1.
2.
3.
4.
5.
6.
7.
8.
9.
10.
11.
12.
13.
14.
15.
16.
17.
18.
19.
20.
21.
22.
23.
24.
25.
26.
27.
28.
29.
30.
31.
32.
33.
34.
35.
36.
37.
38.
39.
Chap
ter 5
73
Eff ects of UAG on insulin release
REFERENCES
1 Dezaki K, Sone H, Koizumi M, Nakata M, Kakei M, Nagai H, et al. Blockade of pancreatic islet-derived ghrelin enhances insulin secretion to prevent high-fat diet-induced glucose intolerance. Diabetes. 2006; 55: 3486-93.
2 Kojima M, Hosoda H, Date Y, Nakazato M, Matsuo H, Kangawa K. Ghrelin is a growth-hormone-releasing acylated peptide from stomach. Nature. 1999; 402: 656-60.
3 Kojima M, Hosoda H, Kangawa K. Purifi cation and distribution of ghrelin: the natural endogenous ligand for the growth hormone secretagogue receptor. Horm Res. 2001; 56 Suppl 1: 93-7.
4 Davenport AP, Bonner TI, Foord SM, Harmar AJ, Neubig RR, Pin JP, et al. International Union of Phar-macology. LVI. Ghrelin receptor nomenclature, distribution, and function. Pharmacol Rev. 2005; 57: 541-6.
5 van der Lely AJ, Tschop M, Heiman ML, Ghigo E. Biological, physiological, pathophysiological, and pharmacological aspects of ghrelin. Endocr Rev. 2004; 25: 426-57.
6 Date Y, Nakazato M, Hashiguchi S, Dezaki K, Mondal MS, Hosoda H, et al. Ghrelin is present in pancre-atic alpha-cells of humans and rats and stimulates insulin secretion. Diabetes. 2002; 51: 124-9.
7 Dezaki K, Hosoda H, Kakei M, Hashiguchi S, Watanabe M, Kangawa K, et al. Endogenous ghrelin in pancreatic islets restricts insulin release by attenuating Ca2+ signaling in beta-cells: implication in the glycemic control in rodents. Diabetes. 2004; 53: 3142-51.
8 Gnanapavan S, Kola B, Bustin SA, Morris DG, McGee P, Fairclough P, et al. The tissue distribution of the mRNA of ghrelin and subtypes of its receptor, GHS-R, in humans. J Clin Endocrinol Metab. 2002; 87: 2988.
9 Volante M, Allia E, Gugliotta P, Funaro A, Broglio F, Deghenghi R, et al. Expression of ghrelin and of the GH secretagogue receptor by pancreatic islet cells and related endocrine tumors. J Clin Endocrinol Metab. 2002; 87: 1300-8.
10 Wierup N, Yang S, McEvilly RJ, Mulder H, Sundler F. Ghrelin is expressed in a novel endocrine cell type in developing rat islets and inhibits insulin secretion from INS-1 (832/13) cells. J Histochem Cytochem. 2004; 52: 301-10.
11 Sun Y, Asnicar M, Saha PK, Chan L, Smith RG. Ablation of ghrelin improves the diabetic but not obese phenotype of ob/ob mice. Cell Metab. 2006; 3: 379-86.
12 Broglio F, Arvat E, Benso A, Gottero C, Muccioli G, Papotti M, et al. Ghrelin, a natural GH secretagogue produced by the stomach, induces hyperglycemia and reduces insulin secretion in humans. J Clin Endocrinol Metab. 2001; 86: 5083-6.
13 Gauna C, Meyler FM, Janssen JA, Delhanty PJ, Abribat T, van Koetsveld P, et al. Administration of acyl-ated ghrelin reduces insulin sensitivity, whereas the combination of acylated plus unacylated ghrelin strongly improves insulin sensitivity. J Clin Endocrinol Metab. 2004; 89: 5035-42.
14 Broglio F, Benso A, Gottero C, Prodam F, Gauna C, Filtri L, et al. Non-acylated ghrelin does not possess the pituitaric and pancreatic endocrine activity of acylated ghrelin in humans. J Endocrinol Invest. 2003; 26: 192-6.
15 Gauna C, Delhanty PJ, van Aken MO, Janssen JA, Themmen AP, Hofl and LJ, et al. Unacylated ghrelin is active on the INS-1E rat insulinoma cell line independently of the growth hormone secretagogue receptor type 1a and the corticotropin releasing factor 2 receptor. Mol Cell Endocrinol. 2006; 251: 103-11.
16 Granata R, Settanni F, Biancone L, Trovato L, Nano R, Bertuzzi F, et al. Acylated and unacylated ghrelin promote proliferation and inhibit apoptosis of pancreatic beta-cells and human islets: involvement of 3’,5’-cyclic adenosine monophosphate/protein kinase A, extracellular signal-regulated kinase 1/2, and phosphatidyl inositol 3-Kinase/Akt signaling. Endocrinology. 2007; 148: 512-29.
17 Iwakura H, Hosoda K, Son C, Fujikura J, Tomita T, Noguchi M, et al. Analysis of rat insulin II promoter-ghrelin transgenic mice and rat glucagon promoter-ghrelin transgenic mice. J Biol Chem. 2005; 280: 15247-56.
1.
2.
3.
4.
5.
6.
7.
8.
9.
10.
11.
12.
13.
14.
15.
16.
17.
18.
19.
20.
21.
22.
23.
24.
25.
26.
27.
28.
29.
30.
31.
32.
33.
34.
35.
36.
37.
38.
39.
Chap
ter 5
74
Eff ects of UAG on insulin release
18 Broglio F, Gottero C, Prodam F, Gauna C, Muccioli G, Papotti M, et al. Non-acylated ghrelin counteracts the metabolic but not the neuroendocrine response to acylated ghrelin in humans. J Clin Endocrinol Metab. 2004; 89: 3062-5.
19 Heijboer AC, van den Hoek AM, Parlevliet ET, Havekes LM, Romijn JA, Pijl H, et al. Ghrelin diff erentially aff ects hepatic and peripheral insulin sensitivity in mice. Diabetologia. 2006; 49: 732-8.
20 Ross H, Johnston ID, Welborn TA, Wright AD. Eff ect of abdominal operation on glucose tolerance and serum levels of insulin, growth hormone, and hydrocortisone. Lancet. 1966; 2: 563-6.
21 Aynsley-Green A, Biebuyck JF, Alberti KG. Anaesthesia and insulin secretion: the eff ects of diethyl ether, halothane, pentobarbitone sodium and ketamine hydrochloride on intravenous glucose toler-ance and insulin secretion in the rat. Diabetologia. 1973; 9: 274-81.
22 Johansen O, Vaaler S, Jorde R, Reikeras O. Increased plasma glucose levels after Hypnorm anaesthesia, but not after Pentobarbital anaesthesia in rats. Lab Anim. 1994; 28: 244-8.
23 Hosoda H, Doi K, Nagaya N, Okumura H, Nakagawa E, Enomoto M, et al. Optimum collection and storage conditions for ghrelin measurements: octanoyl modifi cation of ghrelin is rapidly hydrolyzed to desacyl ghrelin in blood samples. Clin Chem. 2004; 50: 1077-80.
24 Groschl M, Uhr M, Kraus T. Evaluation of the comparability of commercial ghrelin assays. Clin Chem. 2004; 50: 457-8.
25 Kaden M, Harding P, Field JB. Eff ect of intraduodenal glucose administration on hepatic extraction of insulin in the anesthetized dog. J Clin Invest. 1973; 52: 2016-28.
26 Balks HJ, Jungermann K. Regulation of peripheral insulin/glucagon levels by rat liver. Eur J Biochem. 1984; 141: 645-50.
27 Gauna C, Delhanty PJ, Hofl and LJ, Janssen JA, Broglio F, Ross RJ, et al. Ghrelin stimulates, whereas des-octanoyl ghrelin inhibits, glucose output by primary hepatocytes. J Clin Endocrinol Metab. 2005; 90: 1055-60.


Cha pter 6Bolus administration of obestatin does
not change glucose and insulin levels
neither in the systemic nor in the
portal circulation of the rat
Rosalie M. Kiewiet, Carlotta Gauna, Maarten O. van Aken,
Bedette van de Zande, Aart Jan van der Lely
Peptides 2008; 29: 2144-2149
1.
2.
3.
4.
5.
6.
7.
8.
9.
10.
11.
12.
13.
14.
15.
16.
17.
18.
19.
20.
21.
22.
23.
24.
25.
26.
27.
28.
29.
30.
31.
32.
33.
34.
35.
36.
37.
38.
39.
Chap
ter 6
78
Eff ects of obestatin on glucose and insulin
ABSTRACT
Obestatin is a second peptide derived from the preproghrelin polypeptide. It was originally
thought to have anorexigenic eff ects, thereby functioning as an antagonist of ghrelin. However,
this has been a subject of debate ever since. Since acylated ghrelin strongly induces insulin
resistance, it could be hypothesized that obestatin plays a role in glucose homeostasis as well.
In the present study we evaluated the eff ect of obestatin on glucose and insulin metabolism
in the systemic and portal circulation. Obestatin 200 nmol/kg was administered systemically
as a single intravenous bolus injection to fasted pentobarbital anesthetized adult male Wistar
rats. Up to 50 minutes after administration, blood samples were taken to measure glucose and
insulin concentrations, both in the portal and in the systemic circulation. The eff ect of obestatin
was evaluated in fasted and in glucose-stimulated conditions (IVGTT) and compared to control
groups treated with saline or IVGTT, respectively. Intravenous administration of obestatin did
not have any eff ect on glucose and insulin concentrations, neither systemic nor portal, when
compared to the control groups. Only the glucose peak 1 min after administration of IVGTT
was slightly higher in the obestatin treated rats: 605.8 ± 106.3% vs. 522.2 ± 47.1% in the portal
circulation, respectively (NS), and 800.7 ± 78.7% vs. 549.6 ± 37.0% in the systemic circulation,
respectively (P < 0.02), but it can be debated whether this has any clinical relevance. In the
present study, we demonstrated that intravenously administered obestatin does not infl uence
glucose and insulin concentrations, neither in the portal nor in the systemic circulation.
1.
2.
3.
4.
5.
6.
7.
8.
9.
10.
11.
12.
13.
14.
15.
16.
17.
18.
19.
20.
21.
22.
23.
24.
25.
26.
27.
28.
29.
30.
31.
32.
33.
34.
35.
36.
37.
38.
39.
Chap
ter 6
79
Eff ects of obestatin on glucose and insulin
INTRODUCTION
Ghrelin, a 28-amino acid peptide produced mainly by the stomach, was originally discovered
as a natural ligand of the Growth Hormone Secretagogue Receptor type 1a (GHS-R1a).1 Despite
being primarily identifi ed as a potent GH stimulating factor, ghrelin has been demonstrated
to have a wide spectrum of biological activities, such as stimulation of prolactin and ACTH
secretion, promotion of gastric motility and acid secretion, and modulation of cardiovascular
function.2, 3 One of its most intriguing functions is the long-term and short-term regulation of
energy balance. Continuous administration of ghrelin to rodents induces increased food intake
resulting in weight gain, whereas in humans 24-h plasma profi les show marked preprandial
increases and postprandial decreases in circulating ghrelin concentrations, which suggests an
orexigenic eff ect.4-6
Ghrelin is derived from a 117 amino acid peptide called preproghrelin, which is predomi-
nantly produced in X/A like cells in the stomach.1 In 2005, Zhang et al. identifi ed a second pep-
tide encoded by the GHRL gene, using comparative genomic analysis, and called it obestatin.7
This amidated 23 amino acid peptide and ghrelin appeared to be diff erentially secreted since
fasting and subsequent refeeding in rats induced a rise and subsequent fall in ghrelin concen-
trations, whereas no changes in obestatin concentrations were observed.7 Additionally, acute
intraperitoneal and intracerebroventricular administration of obestatin suppressed food intake,
while daily administration of obestatin suppressed body weight gain and induced delayed
gastric emptying.7 These results suggested that obestatin and ghrelin had opposing eff ects on
food intake and body weight regulation.
Following these initial results, obestatin has been the topic of an ongoing discussion. Many
studies failed to reproduce the inhibiting eff ect on food intake and body weight gain or ques-
tioned its role in energy homeostasis.8-13 Additionally, the hypothesis that obestatin exerted its
eff ect by stimulating the orphan receptor GPR39, was rejected by several groups including the
original authors.14-17 On the other hand, several studies in rodents confi rmed an anorexigenic
eff ect of obestatin, either endogenous or by counteracting the orexigenic eff ect of ghrelin.18, 19
Acylated ghrelin is known to induce insulin resistance.20-22 Therefore, it could be hypoth-
esized that obestatin does aff ect insulin and glucose secretion as well. Recently, two studies
have evaluated glucose and insulin responses to obestatin administration, both measuring
concentrations in the systemic circulation.19, 23 However, a problem that may be encountered
in evaluating the eff ect of obestatin on glucose and insulin metabolism is its short half-life.24
Obestatin is mainly produced in the stomach and might accordingly exert its eff ect primarily
in the portal system.7 Therefore, measurements of systemic insulin and glucose concentrations
may fail to demonstrate this eff ect. Additionally, hepatic eff ects of obestatin may be overlooked
when measuring systemic concentrations of glucose and insulin only.
In the present study, we used a previously validated rat model which allowed us to simulta-
neously measure systemic and portal insulin and glucose concentrations.25, 26 The aim of this
1.
2.
3.
4.
5.
6.
7.
8.
9.
10.
11.
12.
13.
14.
15.
16.
17.
18.
19.
20.
21.
22.
23.
24.
25.
26.
27.
28.
29.
30.
31.
32.
33.
34.
35.
36.
37.
38.
39.
Chap
ter 6
80
Eff ects of obestatin on glucose and insulin
study was to evaluate acute eff ects of intravenous administration of obestatin on glucose and
insulin metabolism in fasted and glucose-stimulated conditions.
MATERIALS AND METHODS
Animals
Male Wistar rats (age: 10-12 weeks; weight: 350-400 g, Harlan Netherlands BV, Horst, The Neth-
erlands) were housed in groups in a temperature-controlled room under a 12-h light/12-h dark
cycle, and maintained on pelleted chow with free access to water. The animals were housed
for at least one week before starting the experiments, in order to allow acclimatization. Animal
protocols were in compliance with the Dutch regulations on animal welfare and approved by
the institutional Animal Welfare Committee.
Surgery and experimental design
All studies were performed after a fasting period of 18 h (overnight). Studies were performed
under anaesthesia and the rats were euthanized at the end of the experiment.
Animals were anaesthetized using an intraperitoneal (ip) injection of sodium pentobarbital
(60 mg/kg induction, 20 mg/kg maintenance administered at the end of the surgical procedure,
before starting the experimental session). Sodium pentobarbital was used, since, compared
to other anaesthetics, it has been shown to interfere less with insulin secretion and glucose
metabolism both in the fed and the fasted conditions.27, 28
Deep anaesthesia was confi rmed by the absence of refl exes. Animals were kept on a warm-
ing mat to maintain core body temperature and were connected to a breathing apparatus (O2,
1 l/min) to improve oxygenation, for the entire duration of the experiment (including surgical
procedure).
The surgical procedure was performed under aseptic conditions, as follows:
Cannulation of the jugular vein: an incision was made just above the right clavicle, the connective
and adipose tissues were pushed aside and the jugular vein was exposed. After the jugular vein
was mobilized, a catheter previously connected to a syringe and fi lled with saline solution was
pushed inside the vessel until it reached the right atrium. Patency of the catheter was checked
by aspirating blood and fl ushing the catheter with saline solution. The free end of the catheter
was used for saline injection, treatment administration and sampling.
Cannulation of the portal vein: a midline incision was made from the level of the symphysis
pubis to the xiphoid cartilage. The intestines were lifted out and laid next to the animal on
gauze moistened with warm saline solution to minimize dehydration. A purse-string (diameter
approximately 1 mm) was made in the wall of the portal vein, opposite to the gastroduodenal
vein. Then the center of the purse-string was cut and the cannula inserted into the portal vein
and pushed in for a few millimetres, with the tip secured about 1 mm caudal to the liver. The
1.
2.
3.
4.
5.
6.
7.
8.
9.
10.
11.
12.
13.
14.
15.
16.
17.
18.
19.
20.
21.
22.
23.
24.
25.
26.
27.
28.
29.
30.
31.
32.
33.
34.
35.
36.
37.
38.
39.
Chap
ter 6
81
Eff ects of obestatin on glucose and insulin
patency of the cannula was checked by aspirating blood and injecting saline. The free end of
the cannula was used for sampling during the experiment.
Treatment administration and sampling
Rats were assigned to one of the following treatment groups:
1. Intravenous saline (1 ml), n = 12.
2. Intravenous obestatin 200 nmol/kg (in 1 ml), n = 7.
3. Intravenous Glucose Tolerance Test (IVGTT), n = 12. IVGTT was performed by injecting
D-glucose at a dose of 1 g/kg (50%, 1 ml maximal volume) through the jugular catheter. The
dose of 1 g/kg was chosen taking in account the reduction of insulin sensitivity caused by
abdominal surgery 29 and the possible interference due to anesthesia.27, 28
4. Intravenous obestatin 200 nmol/kg + IVGTT 1 g/kg (1 ml maximal volume), n = 6.
After baseline samples were taken from both catheters, treatment was administered through
the jugular cannula at time 0 and samples were taken from both catheters at 1, 5, 10, 20, 30
and 50 min after treatment administration to measure glucose and insulin levels. At every
time point, the blood volume withdrawn from each catheter (350 μl) was replaced by an equal
volume of saline solution.
Plasma samples were stored at -20ºC until the assay.
At the end of each experiment the animals were killed by exsanguination under deep anaes-
thesia.
Materials
Plasma glucose levels were measured using a glucose oxidase method (Instruchemie, Delfzijl,
The Netherlands). Rat insulin was measured using a rat insulin ELISA kit (Mercodia, Uppsala,
Sweden). The sensitivity of the assay is 0.07 μg/l, according to manufacturer’s instructions.
Rat obestatin (Phe-Asn-Ala-Pro-Phe-Asp-Val-Gly-Ile-Lys-Leu-Ser-Gly-Ala-Gln-Tyr-Gln-Gln-
His-Gly-Arg-Ala-Leu-NH2) was obtained from NeoMPS (Strasbourg, France).
Sodium pentobarbital (250 mg/5 ml) was provided by the hospital pharmacy. EDTA contain-
ing tubes were obtained by Greiner Bio-One BV (Alphen aan den Rijn, The Netherlands). Silicone
catheters (3-french size) were provided by UNO Roestvaststaal BV (Zevenaar, The Netherlands);
suture needles (Dafi lon 8/0) by B. Braun Melsungen AG (Melsungen, Germany).
Statistical analysis
Results are presented as mean ± S.E.M. unless otherwise specifi ed. P < 0.05 was considered sig-
nifi cant. Group 1 (saline) was used as a control for group 2 (obestatin), and group 3 (IVGTT) was
used as a control for group 4 (IVGTT + obestatin). Diff erences between study groups were cal-
culated using the Mann-Whitney test. Diff erences over time within one group were calculated
using Friedman’s test. Glucose/insulin ratio was calculated as a measure of insulin sensitivity,
since HOMA-IR was considered not to be appropriate in non-homeostatic conditions. Statistic
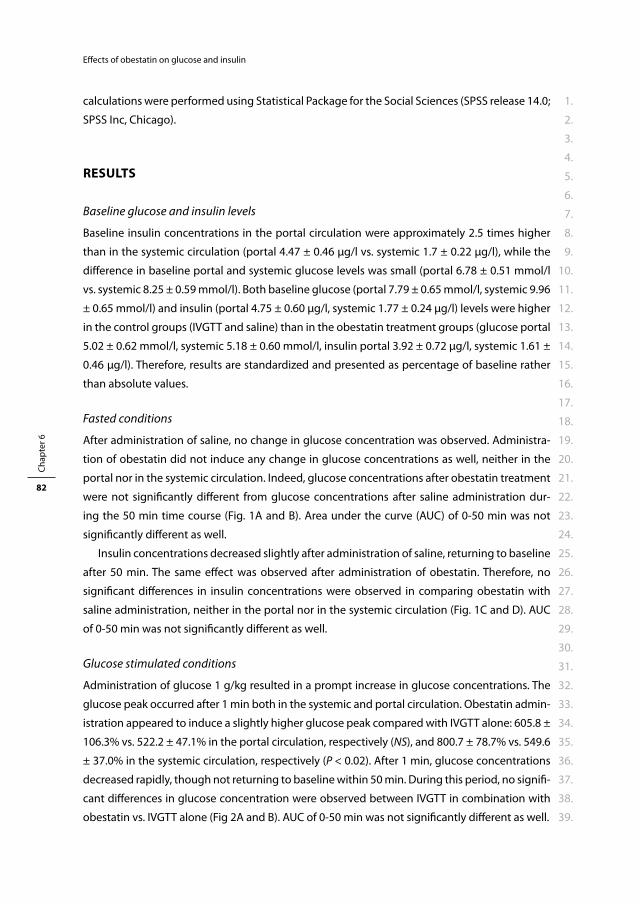
1.
2.
3.
4.
5.
6.
7.
8.
9.
10.
11.
12.
13.
14.
15.
16.
17.
18.
19.
20.
21.
22.
23.
24.
25.
26.
27.
28.
29.
30.
31.
32.
33.
34.
35.
36.
37.
38.
39.
Chap
ter 6
82
Eff ects of obestatin on glucose and insulin
calculations were performed using Statistical Package for the Social Sciences (SPSS release 14.0;
SPSS Inc, Chicago).
RESULTS
Baseline glucose and insulin levels
Baseline insulin concentrations in the portal circulation were approximately 2.5 times higher
than in the systemic circulation (portal 4.47 ± 0.46 μg/l vs. systemic 1.7 ± 0.22 μg/l), while the
diff erence in baseline portal and systemic glucose levels was small (portal 6.78 ± 0.51 mmol/l
vs. systemic 8.25 ± 0.59 mmol/l). Both baseline glucose (portal 7.79 ± 0.65 mmol/l, systemic 9.96
± 0.65 mmol/l) and insulin (portal 4.75 ± 0.60 μg/l, systemic 1.77 ± 0.24 μg/l) levels were higher
in the control groups (IVGTT and saline) than in the obestatin treatment groups (glucose portal
5.02 ± 0.62 mmol/l, systemic 5.18 ± 0.60 mmol/l, insulin portal 3.92 ± 0.72 μg/l, systemic 1.61 ±
0.46 μg/l). Therefore, results are standardized and presented as percentage of baseline rather
than absolute values.
Fasted conditions
After administration of saline, no change in glucose concentration was observed. Administra-
tion of obestatin did not induce any change in glucose concentrations as well, neither in the
portal nor in the systemic circulation. Indeed, glucose concentrations after obestatin treatment
were not signifi cantly diff erent from glucose concentrations after saline administration dur-
ing the 50 min time course (Fig. 1A and B). Area under the curve (AUC) of 0-50 min was not
signifi cantly diff erent as well.
Insulin concentrations decreased slightly after administration of saline, returning to baseline
after 50 min. The same eff ect was observed after administration of obestatin. Therefore, no
signifi cant diff erences in insulin concentrations were observed in comparing obestatin with
saline administration, neither in the portal nor in the systemic circulation (Fig. 1C and D). AUC
of 0-50 min was not signifi cantly diff erent as well.
Glucose stimulated conditions
Administration of glucose 1 g/kg resulted in a prompt increase in glucose concentrations. The
glucose peak occurred after 1 min both in the systemic and portal circulation. Obestatin admin-
istration appeared to induce a slightly higher glucose peak compared with IVGTT alone: 605.8 ±
106.3% vs. 522.2 ± 47.1% in the portal circulation, respectively (NS), and 800.7 ± 78.7% vs. 549.6
± 37.0% in the systemic circulation, respectively (P < 0.02). After 1 min, glucose concentrations
decreased rapidly, though not returning to baseline within 50 min. During this period, no signifi -
cant diff erences in glucose concentration were observed between IVGTT in combination with
obestatin vs. IVGTT alone (Fig 2A and B). AUC of 0-50 min was not signifi cantly diff erent as well.
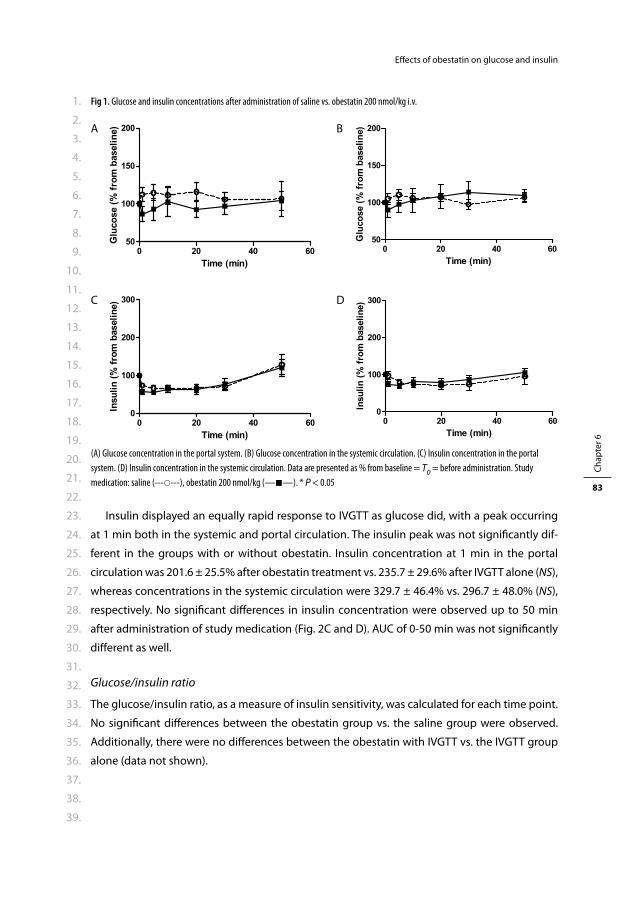
1.
2.
3.
4.
5.
6.
7.
8.
9.
10.
11.
12.
13.
14.
15.
16.
17.
18.
19.
20.
21.
22.
23.
24.
25.
26.
27.
28.
29.
30.
31.
32.
33.
34.
35.
36.
37.
38.
39.
Chap
ter 6
83
Eff ects of obestatin on glucose and insulin
Insulin displayed an equally rapid response to IVGTT as glucose did, with a peak occurring
at 1 min both in the systemic and portal circulation. The insulin peak was not signifi cantly dif-
ferent in the groups with or without obestatin. Insulin concentration at 1 min in the portal
circulation was 201.6 ± 25.5% after obestatin treatment vs. 235.7 ± 29.6% after IVGTT alone (NS),
whereas concentrations in the systemic circulation were 329.7 ± 46.4% vs. 296.7 ± 48.0% (NS),
respectively. No signifi cant diff erences in insulin concentration were observed up to 50 min
after administration of study medication (Fig. 2C and D). AUC of 0-50 min was not signifi cantly
diff erent as well.
Glucose/insulin ratio
The glucose/insulin ratio, as a measure of insulin sensitivity, was calculated for each time point.
No signifi cant diff erences between the obestatin group vs. the saline group were observed.
Additionally, there were no diff erences between the obestatin with IVGTT vs. the IVGTT group
alone (data not shown).
Fig 1. Glucose and insulin concentrations after administration of saline vs. obestatin 200 nmol/kg i.v.
A B
C D
(A) Glucose concentration in the portal system. (B) Glucose concentration in the systemic circulation. (C) Insulin concentration in the portal
system. (D) Insulin concentration in the systemic circulation. Data are presented as % from baseline = T0 = before administration. Study
medication: saline (------), obestatin 200 nmol/kg (——). * P < 0.05
1.
2.
3.
4.
5.
6.
7.
8.
9.
10.
11.
12.
13.
14.
15.
16.
17.
18.
19.
20.
21.
22.
23.
24.
25.
26.
27.
28.
29.
30.
31.
32.
33.
34.
35.
36.
37.
38.
39.
Chap
ter 6
84
Eff ects of obestatin on glucose and insulin
DISCUSSION
In the present study we demonstrated that acute intravenous administration of obestatin does
not change glucose and insulin concentrations in the systemic circulation. This lack of eff ect was
observed in fasted as well as in glucose-stimulated conditions. There was only a slight diff erence
in peak glucose concentrations after IVGTT, but it can be debated whether this has any clini-
cal relevance. Additionally, we measured glucose and insulin directly in the portal vein. These
results, however, were not diff erent from the systemic observations: obestatin does not change
glucose and insulin concentrations in the portal circulation when administered systemically.
Obestatin was originally identifi ed as a second conserved peptide derived from preproghre-
lin.7 Plasma ghrelin and obestatin were demonstrated not to be strictly correlated and were
even diff erentially regulated in fasted and fed conditions,7, 12, 18 which supported the hypothesis
that obestatin was a not a non-functional connective peptide, but had endogenous physiologi-
cal eff ects. Zhang et al. demonstrated that, contrary to the orexigenic and adipogenic eff ects
of acylated ghrelin, intraperitoneal and intracerebroventricular administration of obestatin
suppressed food intake and decreased body weight gain in rodents.7 This observation could
indicate that obestatin and ghrelin function as full antagonists in vivo.
Fig 2. Glucose and insulin concentrations after administration of IVGTT (glucose 1 g/kg) or IVGTT + obestatin 200 nmol/kg i.v.
A B
C D
(A) Glucose concentration in the portal system. (B) Glucose concentration in the systemic circulation. (C) Insulin concentration in the portal
system. (D) Insulin concentration in the systemic circulation. Data are presented as % from baseline = T0 = before administration. Study
medication: IVGTT (------), IVGTT + obestatin 200 nmol/kg (——). * P < 0.05
1.
2.
3.
4.
5.
6.
7.
8.
9.
10.
11.
12.
13.
14.
15.
16.
17.
18.
19.
20.
21.
22.
23.
24.
25.
26.
27.
28.
29.
30.
31.
32.
33.
34.
35.
36.
37.
38.
39.
Chap
ter 6
85
Eff ects of obestatin on glucose and insulin
Since acylated ghrelin induces insulin resistance,20-22 it could be hypothesized that obestatin
does infl uence glucose and insulin homeostasis as well. Two previous studies have extensively
evaluated the eff ects of obestatin administration on glucose and insulin levels in rodents.
Green et al. demonstrated that both glucose and insulin levels were lower in obestatin treated
rats after a standard meal.19 However, since food intake in the obestatin treated group was
signifi cantly lower than in the control group, the observed eff ect might at least be partially
attributed to this diff erence. Indeed, in basal and IPGTT stimulated conditions, no eff ect was
observed.19 Ren et al. did not observe any eff ect on systemic concentrations of glucose and
insulin after intravenous administration of obestatin as well.23 However, obestatin was shown
to reduce insulin response after IVGTT.23 Additionally, two studies did not observe any eff ect on
glucose concentrations after administration of obestatin.12, 13 In summary, previously observed
eff ects of obestatin on glucose and insulin homeostasis were small, if any, and certainly not
strong enough to regard obestatin as an antagonist of ghrelin in this system. The present results
are generally consistent with these observations: we did not observe any eff ect of obestatin on
glucose and insulin concentrations measured in the systemic circulation. However, we did not
only evaluate systemic glucose and insulin concentrations, but measured portal concentrations
as well. Obestatin is reported to have a very short half-life in the circulation, which suggests that
most of its actions occur locally.24 Since obestatin is mainly produced in the stomach and has
been demonstrated in the pancreas as well,30, 31 it might be discussed that its main site of action
is the portal system. Therefore, measuring systemic glucose and insulin concentrations might
fail to establish the local eff ects of obestatin. Nevertheless, in the present study we were not
able to demonstrate any eff ects of obestatin in the portal system as well.
There are some limitations to the present study. At fi rst, the observation that obestatin does
not play a role in glucose and insulin metabolism applies for intravenous administration of
obestatin in a dose of 200 nmol/kg only. These results cannot be extrapolated to diff erent doses
or administration regimens. The original study used a protocol of intraperitoneal and intracere-
broventricular administration of obestatin.7 The protocol of our rat model however, imposed
intravenous administration. We selected the same high dose which was previously described
to be eff ective when administrated intravenously as well as in the intraperitoneal dose-fi nding
study by Lagaud et al.18, 23 However, it still could be that the lack of observed eff ect is due to the
selected dose of obestatin. Secondly, baseline glucose and insulin concentrations were lower
in the study groups compared to the control group. This is most likely due to technical issues,
such as lower perioperative stress in the study group rats than in the control group as a result
of increasing experience in the surgical team, and is assumed not to have caused a bias after
standardization.
In conclusion, intravenous administration of obestatin does not have any eff ect on glucose
and insulin concentrations, neither systemically nor in the portal system. However, additional
(dose-fi nding) studies are necessary to convincingly reject the role of obestatin in glucose and
insulin homeostasis.
1.
2.
3.
4.
5.
6.
7.
8.
9.
10.
11.
12.
13.
14.
15.
16.
17.
18.
19.
20.
21.
22.
23.
24.
25.
26.
27.
28.
29.
30.
31.
32.
33.
34.
35.
36.
37.
38.
39.
Chap
ter 6
86
Eff ects of obestatin on glucose and insulin
REFERENCES
1 Kojima M, Hosoda H, Date Y, Nakazato M, Matsuo H, Kangawa K. Ghrelin is a growth-hormone-releasing acylated peptide from stomach. Nature. 1999; 402: 656-60.
2 Tassone F, Broglio F, Destefanis S, Rovere S, Benso A, Gottero C, et al. Neuroendocrine and metabolic eff ects of acute ghrelin administration in human obesity. J Clin Endocrinol Metab. 2003; 88: 5478-83.
3 van der Lely AJ, Tschop M, Heiman ML, Ghigo E. Biological, physiological, pathophysiological, and pharmacological aspects of ghrelin. Endocr Rev. 2004; 25: 426-57.
4 Cummings DE. Ghrelin and the short- and long-term regulation of appetite and body weight. Physiol Behav. 2006; 89: 71-84.
5 Thompson NM, Gill DA, Davies R, Loveridge N, Houston PA, Robinson IC, et al. Ghrelin and des-octanoyl ghrelin promote adipogenesis directly in vivo by a mechanism independent of the type 1a growth hormone secretagogue receptor. Endocrinology. 2004; 145: 234-42.
6 Wren AM, Small CJ, Ward HL, Murphy KG, Dakin CL, Taheri S, et al. The novel hypothalamic peptide ghrelin stimulates food intake and growth hormone secretion. Endocrinology. 2000; 141: 4325-8.
7 Zhang JV, Ren PG, Avsian-Kretchmer O, Luo CW, Rauch R, Klein C, et al. Obestatin, a peptide encoded by the ghrelin gene, opposes ghrelin’s eff ects on food intake. Science. 2005; 310: 996-9.
8 Depoortere I, Thijs T, Moechars D, De Smet B, Ver Donck L, Peeters TL. Eff ect of peripheral obestatin on food intake and gastric emptying in ghrelin-knockout mice. Br J Pharmacol. 2008; 153: 1550-7.
9 Nogueiras R, Pfl uger P, Tovar S, Arnold M, Mitchell S, Morris A, et al. Eff ects of obestatin on energy balance and growth hormone secretion in rodents. Endocrinology. 2007; 148: 21-6.
10 Seoane LM, Al-Massadi O, Pazos Y, Pagotto U, Casanueva FF. Central obestatin administration does not modify either spontaneous or ghrelin-induced food intake in rats. J Endocrinol Invest. 2006; 29: RC13-5.
11 Yamamoto D, Ikeshita N, Daito R, Herningtyas EH, Toda K, Takahashi K, et al. Neither intravenous nor intracerebroventricular administration of obestatin aff ects the secretion of GH, PRL, TSH and ACTH in rats. Regul Pept. 2007; 138: 141-4.
12 Zizzari P, Longchamps R, Epelbaum J, Bluet-Pajot MT. Obestatin partially aff ects ghrelin stimulation of food intake and growth hormone secretion in rodents. Endocrinology. 2007; 148: 1648-53.
13 Gourcerol G, Coskun T, Craft LS, Mayer JP, Heiman ML, Wang L, et al. Preproghrelin-derived peptide, obestatin, fails to infl uence food intake in lean or obese rodents. Obesity (Silver Spring). 2007; 15: 2643-52.
14 Chartrel N, Alvear-Perez R, Leprince J, Iturrioz X, Reaux-Le Goazigo A, Audinot V, et al. Comment on “Obestatin, a peptide encoded by the ghrelin gene, opposes ghrelin’s eff ects on food intake”. Science. 2007; 315: 766; author reply 66.
15 Holst B, Egerod KL, Schild E, Vickers SP, Cheetham S, Gerlach LO, et al. GPR39 signaling is stimulated by zinc ions but not by obestatin. Endocrinology. 2007; 148: 13-20.
16 Lauwers E, Landuyt B, Arckens L, Schoofs L, Luyten W. Obestatin does not activate orphan G protein-coupled receptor GPR39. Biochem Biophys Res Commun. 2006; 351: 21-5.
17 Zhang JV, Klein C, Ren PG, Kass S, Donck LV, Moechars D et al. Response to comment on Obestatin, a peptide encoded by the ghrelin gene oposes ghrelin’s eff ects on food intake. Science. 2007; 315: 766.
18 Lagaud GJ, Young A, Acena A, Morton MF, Barrett TD, Shankley NP. Obestatin reduces food intake and suppresses body weight gain in rodents. Biochem Biophys Res Commun. 2007; 357: 264-9.
19 Green BD, Irwin N, Flatt PR. Direct and indirect eff ects of obestatin peptides on food intake and the regulation of glucose homeostasis and insulin secretion in mice. Peptides. 2007; 28: 981-7.
20 Broglio F, Arvat E, Benso A, Gottero C, Muccioli G, Papotti M, et al. Ghrelin, a natural GH secretagogue produced by the stomach, induces hyperglycemia and reduces insulin secretion in humans. J Clin Endocrinol Metab. 2001; 86: 5083-6.
21 Gauna C, Delhanty PJ, Hofl and LJ, Janssen JA, Broglio F, Ross RJ, et al. Ghrelin stimulates, whereas des-octanoyl ghrelin inhibits, glucose output by primary hepatocytes. J Clin Endocrinol Metab. 2005; 90: 1055-60.
1.
2.
3.
4.
5.
6.
7.
8.
9.
10.
11.
12.
13.
14.
15.
16.
17.
18.
19.
20.
21.
22.
23.
24.
25.
26.
27.
28.
29.
30.
31.
32.
33.
34.
35.
36.
37.
38.
39.
Chap
ter 6
87
Eff ects of obestatin on glucose and insulin
22 Vestergaard ET, Djurhuus CB, Gjedsted J, Nielsen S, Moller N, Holst JJ, et al. Acute eff ects of ghrelin administration on glucose and lipid metabolism. J Clin Endocrinol Metab. 2008; 93: 438-44.
23 Ren AJ, Guo ZF, Wang YK, Wang LG, Wang WZ, Lin L, et al. Inhibitory eff ect of obestatin on glucose-induced insulin secretion in rats. Biochem Biophys Res Commun. 2008; 369: 969-72.
24 Pan W, Tu H, Kastin AJ. Diff erential BBB interactions of three ingestive peptides: obestatin, ghrelin, and adiponectin. Peptides. 2006; 27: 911-6.
25 Gauna C, Kiewiet RM, Janssen JA, van de Zande B, Delhanty PJ, Ghigo E, et al. Unacylated ghrelin acts as a potent insulin secretagogue in glucose-stimulated conditions. Am J Physiol Endocrinol Metab. 2007; 293: E697-704.
26 Gauna C, Uitterlinden P, Kramer P, Kiewiet RM, Janssen JA, Delhanty PJ, et al. Intravenous glucose administration in fasting rats has diff erential eff ects on acylated and unacylated ghrelin in the portal and systemic circulation: a comparison between portal and peripheral concentrations in anesthe-tized rats. Endocrinology. 2007; 148: 5278-87.
27 Aynsley-Green A, Biebuyck JF, Alberti KG. Anaesthesia and insulin secretion: the eff ects of diethyl ether, halothane, pentobarbitone sodium and ketamine hydrochloride on intravenous glucose toler-ance and insulin secretion in the rat. Diabetologia. 1973; 9: 274-81.
28 Johansen O, Vaaler S, Jorde R, Reikeras O. Increased plasma glucose levels after Hypnorm anaesthesia, but not after Pentobarbital anaesthesia in rats. Lab Anim. 1994; 28: 244-8.
29 Ross H, Johnston ID, Welborn TA, Wright AD. Eff ect of abdominal operation on glucose tolerance and serum levels of insulin, growth hormone, and hydrocortisone. Lancet. 1966; 2: 563-6.
30 Chanoine JP, Wong AC, Barrios V. Obestatin, acylated and total ghrelin concentrations in the perinatal rat pancreas. Horm Res. 2006; 66: 81-8.
31 Granata R, Settanni F, Gallo D, Trovato L, Biancone L, Cantaluppi V, et al. Obestatin promotes survival of pancreatic beta-cells and human islets and induces expression of genes involved in the regulation of beta-cell mass and function. Diabetes. 2008; 57: 967-79.

Ch apter 7Acute eff ects of acylated and
unacylated ghrelin on total and high
molecular weight adiponectin in
morbidly obese subjects
Rosalie M. Kiewiet, Matthew J. Hazell, Maarten O. van Aken,
Kim van der Weerd, Jenny A. Visser, Axel P.N. Themmen and
Aart Jan van der Lely
J Endocrinol Invest, 2010 Oct 15 (Epub ahead of print)

1.
2.
3.
4.
5.
6.
7.
8.
9.
10.
11.
12.
13.
14.
15.
16.
17.
18.
19.
20.
21.
22.
23.
24.
25.
26.
27.
28.
29.
30.
31.
32.
33.
34.
35.
36.
37.
38.
39.
Chap
ter 7
90
Eff ects of AG and UAG on adiponectin
ABSTRACT
Background
Energy homeostasis and body weight are regulated by a highly complex network involving
the brain, the digestive tract and white adipose tissue (WAT). Knowledge about signalling
pathways connecting digestive tract and WAT is limited. Gut hormone ghrelin and adipokine
adiponectin are both decreased in obesity and they share a potent eff ect on insulin sensitivity:
both adiponectin and the combination of acylated (AG) and unacylated ghrelin (UAG) improve
insulin sensitivity.
Aim
In the present study, we evaluated whether acute administration of UAG alone or combined
with AG aff ects adiponectin concentrations.
Subjects and Methods
Eight morbidly obese non-diabetic subjects were treated with either UAG 200μg, UAG 100μg
+ AG 100μg (Comb), or placebo in 3 episodes in a double blind randomized cross-over design.
Study medication was administered as single i.v. bolus injections at 09.00h after an overnight
fast. High molecular weight (HMW) and total adiponectin, glucose, insulin and total and acyl-
ated ghrelin were measured up to one hour after administration.
Results
HMW and total adiponectin concentrations did not change after administration of either UAG
or Comb, nor were they diff erent from placebo. Insulin concentrations decreased signifi cantly
after acute administration of Comb, reaching a minimum at 20 min: 58.2 ± 3.9% of baseline.
Conclusions
Acute intravenous administration of UAG and the combination of UAG and AG in morbidly
obese non-diabetic subjects without overt diabetes does not aff ect total or HMW adiponectin
concentrations, neither directly nor indirectly by changing insulin concentrations.
1.
2.
3.
4.
5.
6.
7.
8.
9.
10.
11.
12.
13.
14.
15.
16.
17.
18.
19.
20.
21.
22.
23.
24.
25.
26.
27.
28.
29.
30.
31.
32.
33.
34.
35.
36.
37.
38.
39.
Chap
ter 7
91
Eff ects of AG and UAG on adiponectin
INTRODUCTION
Energy homeostasis and body weight are regulated by a highly complex network involving the
brain, the digestive tract and white adipose tissue (WAT).1 Hypothalamic neurons respond to
hormones, produced by either the gut or WAT, by modifying the synthesis of neuropeptides
that modulate food intake and energy balance. Multiple pathways connecting the gut and WAT
with the brain have been characterized during the last two decades. Most gut hormones (e.g.
peptide tyrosine-tyrosine (PYY), pancreatic polypeptide (PP), amylin, glucagon-like peptide-1
(GLP-1), and oxyntomodulin) display an anorexigenic eff ect by centrally inhibiting food intake,
reducing adiposity and altering energy expenditure.2-7 On the other hand, ghrelin is at present
the only known orexigenic gut hormone, inducing food intake and adiposity by stimulating
the release of the orexigenic neuropeptides neuropeptide Y (NPY) and Agouti-related peptide
(AgRP).8-11 Central eff ects of leptin are most extensively studied regarding signalling pathways
of WAT to the brain. Leptin acts centrally as a full antagonist of ghrelin, thereby reducing food
intake and body weight gain, and modulating glucose metabolism.12-14 Additionally, central
eff ects of the adipokines adiponectin and resistin have been suggested as well.15-18
While pathways connecting respectively WAT and the gut with the brain have been studied
extensively, direct connections between WAT and the gut are largely unknown. Studies report-
ing correlations between gut hormone concentrations and adipokine concentrations add
little information to our understanding of their interaction, since concentrations could well be
independently infl uenced by another factor. Additionally, those studies reporting results of adi-
pokine administration on gut hormone concentrations and vice versa (mostly leptin vs ghrelin)
do not answer the question whether the observed eff ects are direct or indirect.19-21 As stated
above, both gut hormones and adipokines have centrally mediated eff ects on food intake, body
composition and glucose metabolism. On the other hand, gut hormone concentrations and
adipokine concentrations are largely regulated by energy intake and body composition, pos-
sibly mediated by insulin and glucose levels.8, 16, 22-27 Therefore, it could be hypothesized that
connections between the gut and WAT are either direct, i.e. eff ectuated locally in the gut or WAT,
or indirect, i.e. mediated by central pathways or changes in insulin and glucose concentrations.
The gut hormone ghrelin and the adipokine adiponectin have some striking homologies.
At fi rst, both hormones play an important role in glucose metabolism. Acylated ghrelin (AG),
which is able to bind to the receptor for which ghrelin is the natural ligand (GHS-R1a), has been
shown to induce insulin resistance.28, 29 On the other hand, unacylated ghrelin (UAG), which
lacks a n-octanoyl group necessary for binding to the GHS-R1a, has been suggested to have
an insulin-sensitizing role. At least, it is likely to counterbalance the infl uence of AG on insulin
secretion and glucose levels.30 Finally, the combination of AG and UAG strongly improves insulin
sensitivity.31, 32 Adiponectin has been demonstrated to strongly improve insulin sensitivity as
well.27, 33, 34 It has been suggested that high molecular weight (HMW) adiponectin is the active
isoform, since low levels of HMW adiponectin, have been demonstrated to strongly correlate

1.
2.
3.
4.
5.
6.
7.
8.
9.
10.
11.
12.
13.
14.
15.
16.
17.
18.
19.
20.
21.
22.
23.
24.
25.
26.
27.
28.
29.
30.
31.
32.
33.
34.
35.
36.
37.
38.
39.
Chap
ter 7
92
Eff ects of AG and UAG on adiponectin
with insulin resistance and development of type 2 diabetes.35, 36 Secondly, both hormones are
typically decreased in obesity.23, 25, 26
In the present study, we used human obesity as a model to study the eff ects of acute intrave-
nous administration of UAG and the combination of AG and UAG on adiponectin concentration.
It was hypothesized that ghrelin could have either a direct eff ect on adiponectin concentration,
or an indirect eff ect mediated by a decrease in insulin concentration after coadministration of
AG and UAG, as reported previously.32 On the other hand, since the mechanism responsible for
the signifi cant decrease of insulin concentration at unchanged glucose levels after coadmin-
istration of AG and UAG is still unknown, adiponectin could hypothetically be the mediator of
this improvement in insulin sensitivity.
MATERIALS AND METHODS
Study population
Eight morbidly obese female Caucasian subjects (age 45.4 ± 10.3 (mean ± SD), range 28-62
years, mean Body Mass Index 42.4 ± 4.8 kg/m2) were recruited from an affi liated clinic for bariat-
ric surgery. All were on a waiting list to undergo gastric banding or gastric bypass (criteria: Body
Mass Index (BMI) > 40 kg/m2 or BMI > 35 kg/m2 in combination with relevant comorbidity).37
Exclusion criteria for the study were: overt type 2 diabetes, liver enzyme test abnormalities,
pregnancy and previous bariatric surgery. All subjects gave their written informed consent to
participate in the study, which had been approved by the ethical committee of our hospital.
Study design
The double blind randomized study design consisted of 3 study episodes in which 3 treatment
regimens were administered: 1) UAG 200 μg (UAG), 2) UAG 100 μg in combination with AG 100
μg (Comb), 3) placebo (placebo). Every patient underwent all treatment regimens, which were
separated by a wash out period of 2 weeks at least. Study medication was administered as a
single daily intravenous bolus injection.
After an overnight fast, an indwelling catheter was placed in the forearm and kept patent by
a slowly running saline infusion. At 9.00h study medication was administered as an acute bolus
injection. Blood samples were taken before administration of study medication (T0) and at 20,
45 and 60 min. Subjects were kept fasted during the study period.
Study medication
Both AG and UAG were obtained from Bachem AG, Bubendorf, Switzerland. To prevent deg-
radation of ghrelin vials were stored at -80°C up to 90 min before administration. To prevent
interaction of AG and UAG in vitro two separate samples were administered to the patients,
followed by 5 ml of saline after each infusion.

1.
2.
3.
4.
5.
6.
7.
8.
9.
10.
11.
12.
13.
14.
15.
16.
17.
18.
19.
20.
21.
22.
23.
24.
25.
26.
27.
28.
29.
30.
31.
32.
33.
34.
35.
36.
37.
38.
39.
Chap
ter 7
93
Eff ects of AG and UAG on adiponectin
Assessments
Blood samples for total ghrelin and acylated ghrelin measurements were collected in EDTA
tubes. Samples were stored on ice until centrifugation. After centrifugation serum samples
were stored at -20°C until processed. Acylated and total ghrelin levels were determined using
a commercially available RadioImmunoAssay (Linco Research, St. Charles, Missouri, USA). Intra-
and interassay variation of the AG assay are 7 and 13% respectively, and of the total ghrelin
assay 6% and 16% respectively.
Adiponectin (total and HMW) was measured by an in house ELISA that has been shown
to correlate highly with other commercially available assays for adiponectin (B-Bridge total
adiponectin r = 0.97 and Alpco Diagnostics total adiponectin r = 0.98 and HMW adiponectin r
= 0.98) (Oxford Brookes University, Oxford, England).38 Intra- and interassay variation was 8%
and 10% respectively.
Insulin was measured using a chemiluminescent immunometric assay (Immulite 2000,
Siemens Medical Solutions Diagnostics, Los Angeles, CA, USA). Intra- and interassay variation
was 4% and 5% respectively. Glucose was measured on a Hitachi 917 (Roche Diagnostics,
Mannheim, Germany) by a glucose-oxidase method.
Statistical analysis
Results are presented as mean ± SEM unless otherwise specifi ed. P < 0.05 was considered
signifi cant. Diff erences between the three study periods were calculated using the Friedman
test, the nonparametric equivalent of a one-sample repeated measures design. Areas under
the curve (AUC) were calculated using the trapezoid rule. UAG concentrations were determined
calculating the diff erence between total ghrelin and AG.
Statistic calculations were performed using Statistical Package for the Social Sciences (SPSS
release 14.0; SPSS Inc, Chicago).
RESULTS
Concentrations of AG and UAG
After acute administration of AG 100 μg i.v. (in combination with UAG 100 μg) baseline AG
concentration of 64 pg/ml increased to a peak of 1254 pg/ml after 20 min. The half-life was
short: AG concentrations approached baseline at 60 min after administration (Fig. 1A). Baseline
concentrations of UAG were 844 pg/ml, increasing to 7337 pg/ml and to 7231 pg/ml 20 min
after administration of UAG 200 μg i.v. alone and 100 μg i.v. in combination with AG 100 μg
respectively. At termination of the measurements, 60 min after administration, UAG concentra-
tions had not returned to baseline (Fig. 1B).

1.
2.
3.
4.
5.
6.
7.
8.
9.
10.
11.
12.
13.
14.
15.
16.
17.
18.
19.
20.
21.
22.
23.
24.
25.
26.
27.
28.
29.
30.
31.
32.
33.
34.
35.
36.
37.
38.
39.
Chap
ter 7
94
Eff ects of AG and UAG on adiponectin
Adiponectin
Baseline concentration of total adiponectin was 20.4 ± 1.01 μg/ml. Baseline concentration of
HMW adiponectin was 10.0 ± 0.65 μg/ml, which was 48.1 ± 3.34% of total adiponectin.
Both total and HMW adiponectin concentrations did not change after administration of
either UAG or Comb. Additionally, concentrations of total and HMW adiponectin were never
signifi cantly diff erent from placebo during the study periods (Fig. 2A and 2B). Figure 2 shows
total (2A) and HMW (2B) adiponectin concentrations, as well as HMW/total adiponectin ratio
(2C), throughout the study period displayed as percentage of baseline concentrations.
AUC of total adiponectin (percentage of baseline concentrations, i.e. T0 = 100) from 0 to 60
min was 6097 ± 362.1*min, 6629 ± 420.5*min and 5944 ± 286.3*min after placebo, UAG and
Comb respectively (NS). AUC of HMW adiponectin (percentage of baseline concentrations, i.e.
T0 = 100) from 0 to 60 min was 5766 ± 457.3*min, 7500 ± 736.7*min and 6591 ± 337.6*min after
placebo, UAG and Comb respectively (NS) (data not shown).
Glucose and insulin
Baseline concentration of glucose was 4.4 ± 0.47 mmol/l. Neither UAG nor Comb induced any
signifi cant change in glucose concentrations. Concentrations of glucose were never signifi cantly
diff erent from placebo throughout the study period. Figure 3A shows glucose concentrations
displayed as percentage of baseline concentrations.
Baseline insulin concentration was 184.1 ± 24.0 pmol/l. Administration of UAG did not have
any eff ect on insulin concentration. However, administration of Comb induced a signifi cant
decrease in insulin levels, reaching a minimum after 20 min. Fig. 3B shows that at 20 min, insulin
concentration after Comb is 58.2 ± 3.9% of baseline, while after placebo and UAG administra-
tion insulin concentration is 88.7 ± 7.1% and 92.7 ± 2.6%, respectively (P < 0.05).
Fig. 1 Acylated and unacylated ghrelin
A B
A: Acylated ghrelin concentration
B: Unacylated ghrelin concentration
T0 = administration of study medication: placebo (——), UAG (------), Comb (∙∙∙∙∙∙).

1.
2.
3.
4.
5.
6.
7.
8.
9.
10.
11.
12.
13.
14.
15.
16.
17.
18.
19.
20.
21.
22.
23.
24.
25.
26.
27.
28.
29.
30.
31.
32.
33.
34.
35.
36.
37.
38.
39.
Chap
ter 7
95
Eff ects of AG and UAG on adiponectin
DISCUSSION
Energy homeostasis and body weight are regulated by a highly complex network involving
the brain, the digestive tract and WAT.1 Circulating gut hormones and adipokines connect the
digestive tract and WAT with several parts of the brain such as the hypothalamus and brain stem,
thereby modulating food intake and energy expenditure.1, 10, 17 However, signalling pathways
connecting digestive tract and WAT are less well characterized. Adiponectin and ghrelin concen-
trations are both decreased in obesity.23, 25, 26 Additionally, they both have important eff ects on
insulin sensitivity. Adiponectin strongly improves insulin sensitivity, while AG decreases insulin
sensitivity.28, 34 However, the combination of AG and UAG has been demonstrated to improve
insulin sensitivity as well.31, 32 We evaluated eff ects of an acute intravenous administration of
either UAG alone or in combination with AG on levels of total and HMW adiponectin in human
Fig. 2 Adiponectin
A B
C
A: Total adiponectin concentration, presented as % from baseline.
B: HMW adiponectin concentration, presented as % from baseline.
C: HMW/total adiponectin concentration, presented as % from baseline.
T0 = administration of study medication: placebo (——), UAG (------), Comb (∙∙∙∙∙∙).
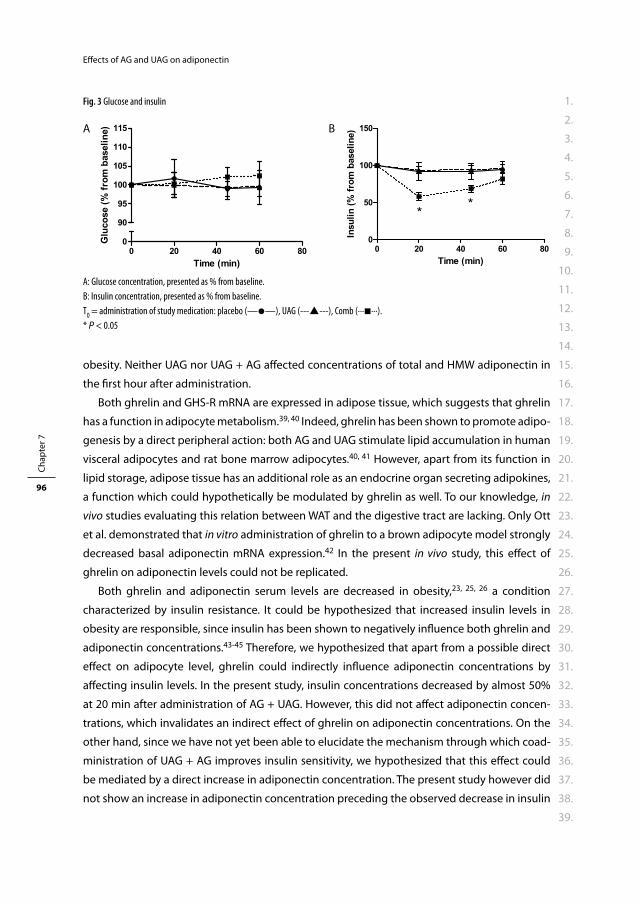
1.
2.
3.
4.
5.
6.
7.
8.
9.
10.
11.
12.
13.
14.
15.
16.
17.
18.
19.
20.
21.
22.
23.
24.
25.
26.
27.
28.
29.
30.
31.
32.
33.
34.
35.
36.
37.
38.
39.
Chap
ter 7
96
Eff ects of AG and UAG on adiponectin
obesity. Neither UAG nor UAG + AG aff ected concentrations of total and HMW adiponectin in
the fi rst hour after administration.
Both ghrelin and GHS-R mRNA are expressed in adipose tissue, which suggests that ghrelin
has a function in adipocyte metabolism.39, 40 Indeed, ghrelin has been shown to promote adipo-
genesis by a direct peripheral action: both AG and UAG stimulate lipid accumulation in human
visceral adipocytes and rat bone marrow adipocytes.40, 41 However, apart from its function in
lipid storage, adipose tissue has an additional role as an endocrine organ secreting adipokines,
a function which could hypothetically be modulated by ghrelin as well. To our knowledge, in
vivo studies evaluating this relation between WAT and the digestive tract are lacking. Only Ott
et al. demonstrated that in vitro administration of ghrelin to a brown adipocyte model strongly
decreased basal adiponectin mRNA expression.42 In the present in vivo study, this eff ect of
ghrelin on adiponectin levels could not be replicated.
Both ghrelin and adiponectin serum levels are decreased in obesity,23, 25, 26 a condition
characterized by insulin resistance. It could be hypothesized that increased insulin levels in
obesity are responsible, since insulin has been shown to negatively infl uence both ghrelin and
adiponectin concentrations.43-45 Therefore, we hypothesized that apart from a possible direct
eff ect on adipocyte level, ghrelin could indirectly infl uence adiponectin concentrations by
aff ecting insulin levels. In the present study, insulin concentrations decreased by almost 50%
at 20 min after administration of AG + UAG. However, this did not aff ect adiponectin concen-
trations, which invalidates an indirect eff ect of ghrelin on adiponectin concentrations. On the
other hand, since we have not yet been able to elucidate the mechanism through which coad-
ministration of UAG + AG improves insulin sensitivity, we hypothesized that this eff ect could
be mediated by a direct increase in adiponectin concentration. The present study however did
not show an increase in adiponectin concentration preceding the observed decrease in insulin
Fig. 3 Glucose and insulin
A B
A: Glucose concentration, presented as % from baseline.
B: Insulin concentration, presented as % from baseline.
T0 = administration of study medication: placebo (——), UAG (------), Comb (∙∙∙∙∙∙).
* P < 0.05
1.
2.
3.
4.
5.
6.
7.
8.
9.
10.
11.
12.
13.
14.
15.
16.
17.
18.
19.
20.
21.
22.
23.
24.
25.
26.
27.
28.
29.
30.
31.
32.
33.
34.
35.
36.
37.
38.
39.
Chap
ter 7
97
Eff ects of AG and UAG on adiponectin
concentration. Therefore, it is less likely that adiponectin mediates the improvement in insulin
sensitivity eff ectuated by administration of UAG + AG.
There are several limitations to the present study. First of all, the design of our study did
not include an arm of AG only, which implicates that no conclusions can be drawn regarding
the eff ect of AG on adiponectin. Secondly, we only studied acute eff ects of UAG and UAG +
AG on adiponectin concentrations. It could be hypothesized that continuous administration
of ghrelin does aff ect adiponectin levels or that the eff ect occurs more than one hour after
acute administration. However, previous in vitro results show that ghrelin-induced decrease in
adiponectin mRNA already occurred 30 minutes after administration.42
In conclusion, the present study shows that acute intravenous administration of unacylated
ghrelin and the combination of unacylated and acylated ghrelin in morbidly obese subjects
without overt diabetes does not acutely aff ect total or HMW adiponectin concentrations,
neither directly nor indirectly by changing insulin concentrations. Studies evaluating eff ects of
acylated ghrelin and long-term eff ects of (continuous) ghrelin administration on adiponectin
concentrations are indicated.
1.
2.
3.
4.
5.
6.
7.
8.
9.
10.
11.
12.
13.
14.
15.
16.
17.
18.
19.
20.
21.
22.
23.
24.
25.
26.
27.
28.
29.
30.
31.
32.
33.
34.
35.
36.
37.
38.
39.
Chap
ter 7
98
Eff ects of AG and UAG on adiponectin
REFERENCES
1 Wynne K, Stanley S, McGowan B, Bloom S. Appetite control. J Endocrinol. 2005; 184: 291-318. 2 Batterham RL, Cowley MA, Small CJ, Herzog H, Cohen MA, Dakin CL, et al. Gut hormone PYY(3-36)
physiologically inhibits food intake. Nature. 2002; 418: 650-4. 3 Asakawa A, Inui A, Yuzuriha H, Ueno N, Katsuura G, Fujimiya M, et al. Characterization of the eff ects of
pancreatic polypeptide in the regulation of energy balance. Gastroenterology. 2003; 124: 1325-36. 4 Larsen PJ, Tang-Christensen M, Jessop DS. Central administration of glucagon-like peptide-1 activates
hypothalamic neuroendocrine neurons in the rat. Endocrinology. 1997; 138: 4445-55. 5 Lutz TA, Mollet A, Rushing PA, Riediger T, Scharrer E. The anorectic eff ect of a chronic peripheral infu-
sion of amylin is abolished in area postrema/nucleus of the solitary tract (AP/NTS) lesioned rats. Int J Obes Relat Metab Disord. 2001; 25: 1005-11.
6 Murphy KG, Dhillo WS, Bloom SR. Gut peptides in the regulation of food intake and energy homeosta-sis. Endocr Rev. 2006; 27: 719-27.
7 Nogueiras R, Lopez M, Dieguez C. Regulation of lipid metabolism by energy availability: a role for the central nervous system. Obes Rev. 2009.
8 Nakazato M, Murakami N, Date Y, Kojima M, Matsuo H, Kangawa K, et al. A role for ghrelin in the central regulation of feeding. Nature. 2001; 409: 194-8.
9 Shintani M, Ogawa Y, Ebihara K, Aizawa-Abe M, Miyanaga F, Takaya K, et al. Ghrelin, an endogenous growth hormone secretagogue, is a novel orexigenic peptide that antagonizes leptin action through the activation of hypothalamic neuropeptide Y/Y1 receptor pathway. Diabetes. 2001; 50: 227-32.
10 van der Lely AJ, Tschop M, Heiman ML, Ghigo E. Biological, physiological, pathophysiological, and pharmacological aspects of ghrelin. Endocr Rev. 2004; 25: 426-57.
11 Wren AM, Small CJ, Ward HL, Murphy KG, Dakin CL, Taheri S, et al. The novel hypothalamic peptide ghrelin stimulates food intake and growth hormone secretion. Endocrinology. 2000; 141: 4325-8.
12 Cheung CC, Clifton DK, Steiner RA. Proopiomelanocortin neurons are direct targets for leptin in the hypothalamus. Endocrinology. 1997; 138: 4489-92.
13 Kamohara S, Burcelin R, Halaas JL, Friedman JM, Charron MJ. Acute stimulation of glucose metabolism in mice by leptin treatment. Nature. 1997; 389: 374-7.
14 Schwartz MW, Seeley RJ, Campfi eld LA, Burn P, Baskin DG. Identifi cation of targets of leptin action in rat hypothalamus. J Clin Invest. 1996; 98: 1101-6.
15 Ahima RS, Lazar MA. Adipokines and the peripheral and neural control of energy balance. Mol Endo-crinol. 2008; 22: 1023-31.
16 Ahima RS, Qi Y, Singhal NS, Jackson MB, Scherer PE. Brain adipocytokine action and metabolic regula-tion. Diabetes. 2006; 55 Suppl 2: S145-54.
17 Qi Y, Takahashi N, Hileman SM, Patel HR, Berg AH, Pajvani UB, et al. Adiponectin acts in the brain to decrease body weight. Nat Med. 2004; 10: 524-9.
18 Tovar S, Nogueiras R, Tung LY, Castaneda TR, Vazquez MJ, Morris A, et al. Central administration of resistin promotes short-term satiety in rats. Eur J Endocrinol. 2005; 153: R1-5.
19 Barazzoni R, Zanetti M, Stebel M, Biolo G, Cattin L, Guarnieri G. Hyperleptinemia prevents increased plasma ghrelin concentration during short-term moderate caloric restriction in rats. Gastroenterol-ogy. 2003; 124: 1188-92.
20 Kamegai J, Tamura H, Shimizu T, Ishii S, Sugihara H, Oikawa S. Eff ects of insulin, leptin, and glucagon on ghrelin secretion from isolated perfused rat stomach. Regul Pept. 2004; 119: 77-81.
21 Lejeune MP, Hukshorn CJ, Saris WH, Westerterp-Plantenga MS. Eff ects of very low calorie diet induced body weight loss with or without human pegylated recombinant leptin treatment on changes in ghrelin and adiponectin concentrations. Physiol Behav. 2007; 91: 274-80.
22 Toshinai K, Mondal MS, Nakazato M, Date Y, Murakami N, Kojima M, et al. Upregulation of Ghrelin expression in the stomach upon fasting, insulin-induced hypoglycemia, and leptin administration. Biochem Biophys Res Commun. 2001; 281: 1220-5.
1.
2.
3.
4.
5.
6.
7.
8.
9.
10.
11.
12.
13.
14.
15.
16.
17.
18.
19.
20.
21.
22.
23.
24.
25.
26.
27.
28.
29.
30.
31.
32.
33.
34.
35.
36.
37.
38.
39.
Chap
ter 7
99
Eff ects of AG and UAG on adiponectin
23 Tschop M, Weyer C, Tataranni PA, Devanarayan V, Ravussin E, Heiman ML. Circulating ghrelin levels are decreased in human obesity. Diabetes. 2001; 50: 707-9.
24 Weigle DS, Duell PB, Connor WE, Steiner RA, Soules MR, Kuijper JL. Eff ect of fasting, refeeding, and dietary fat restriction on plasma leptin levels. J Clin Endocrinol Metab. 1997; 82: 561-5.
25 Arita Y, Kihara S, Ouchi N, Takahashi M, Maeda K, Miyagawa J, et al. Paradoxical decrease of an adipose-specifi c protein, adiponectin, in obesity. Biochem Biophys Res Commun. 1999; 257: 79-83.
26 Hu E, Liang P, Spiegelman BM. AdipoQ is a novel adipose-specifi c gene dysregulated in obesity. J Biol Chem. 1996; 271: 10697-703.
27 Kadowaki T, Yamauchi T. Adiponectin and adiponectin receptors. Endocr Rev. 2005; 26: 439-51. 28 Broglio F, Arvat E, Benso A, Gottero C, Muccioli G, Papotti M, et al. Ghrelin, a natural GH secretagogue
produced by the stomach, induces hyperglycemia and reduces insulin secretion in humans. J Clin Endocrinol Metab. 2001; 86: 5083-6.
29 Gauna C, Delhanty PJ, Hofl and LJ, Janssen JA, Broglio F, Ross RJ, et al. Ghrelin stimulates, whereas des-octanoyl ghrelin inhibits, glucose output by primary hepatocytes. J Clin Endocrinol Metab. 2005; 90: 1055-60.
30 van der Lely AJ. Ghrelin and new metabolic frontiers. Horm Res. 2009; 71 Suppl 1: 129-33. 31 Gauna C, Meyler FM, Janssen JA, Delhanty PJ, Abribat T, van Koetsveld P, et al. Administration of acyl-
ated ghrelin reduces insulin sensitivity, whereas the combination of acylated plus unacylated ghrelin strongly improves insulin sensitivity. J Clin Endocrinol Metab. 2004; 89: 5035-42.
32 Kiewiet RM, van Aken MO, van der Weerd K, Uitterlinden P, Themmen AP, Hofl and LJ, et al. Eff ects of acute administration of acylated and unacylated ghrelin on glucose and insulin concentrations in morbidly obese subjects without overt diabetes. Eur J Endocrinol. 2009; 161: 567-73.
33 Berg AH, Combs TP, Du X, Brownlee M, Scherer PE. The adipocyte-secreted protein Acrp30 enhances hepatic insulin action. Nat Med. 2001; 7: 947-53.
34 Yamauchi T, Kamon J, Waki H, Terauchi Y, Kubota N, Hara K, et al. The fat-derived hormone adiponectin reverses insulin resistance associated with both lipoatrophy and obesity. Nat Med. 2001; 7: 941-6.
35 Nakashima R, Kamei N, Yamane K, Nakanishi S, Nakashima A, Kohno N. Decreased total and high molecular weight adiponectin are independent risk factors for the development of type 2 diabetes in Japanese-Americans. J Clin Endocrinol Metab. 2006; 91: 3873-7.
36 Waki H, Yamauchi T, Kamon J, Ito Y, Uchida S, Kita S, et al. Impaired multimerization of human adipo-nectin mutants associated with diabetes. Molecular structure and multimer formation of adiponectin. J Biol Chem. 2003; 278: 40352-63.
37 National Institutes of Health NH, Lung, and Blood Institute. Clinical Guidelines of the Identifi cation, Evaluation, and Treatment of Overweight and Obesity in Adults: The Evidence Report. Bethesda, Md: Nationale Institutes of Health. 1998.
38 Barber TM, Hazell M, Christodoulides C, Golding SJ, Alvey C, Burling K, et al. Serum levels of retinol-binding protein 4 and adiponectin in women with polycystic ovary syndrome: associations with visceral fat but no evidence for fat mass-independent eff ects on pathogenesis in this condition. J Clin Endocrinol Metab. 2008; 93: 2859-65.
39 Gnanapavan S, Kola B, Bustin SA, Morris DG, McGee P, Fairclough P, et al. The tissue distribution of the mRNA of ghrelin and subtypes of its receptor, GHS-R, in humans. J Clin Endocrinol Metab. 2002; 87: 2988.
40 Rodriguez A, Gomez-Ambrosi J, Catalan V, Gil MJ, Becerril S, Sainz N, et al. Acylated and desacyl ghrelin stimulate lipid accumulation in human visceral adipocytes. Int J Obes (Lond). 2009; 33: 541-52.
41 Thompson NM, Gill DA, Davies R, Loveridge N, Houston PA, Robinson IC, et al. Ghrelin and des-octanoyl ghrelin promote adipogenesis directly in vivo by a mechanism independent of the type 1a growth hormone secretagogue receptor. Endocrinology. 2004; 145: 234-42.
42 Ott V, Fasshauer M, Dalski A, Meier B, Perwitz N, Klein HH, et al. Direct peripheral eff ects of ghrelin include suppression of adiponectin expression. Horm Metab Res. 2002; 34: 640-5.
1.
2.
3.
4.
5.
6.
7.
8.
9.
10.
11.
12.
13.
14.
15.
16.
17.
18.
19.
20.
21.
22.
23.
24.
25.
26.
27.
28.
29.
30.
31.
32.
33.
34.
35.
36.
37.
38.
39.
Chap
ter 7
100
Eff ects of AG and UAG on adiponectin
43 McLaughlin T, Abbasi F, Lamendola C, Frayo RS, Cummings DE. Plasma ghrelin concentrations are decreased in insulin-resistant obese adults relative to equally obese insulin-sensitive controls. J Clin Endocrinol Metab. 2004; 89: 1630-5.
44 Mohlig M, Wegewitz U, Osterhoff M, Isken F, Ristow M, Pfeiff er AF, et al. Insulin decreases human adiponectin plasma levels. Horm Metab Res. 2002; 34: 655-8.
45 Saad MF, Bernaba B, Hwu CM, Jinagouda S, Fahmi S, Kogosov E, et al. Insulin regulates plasma ghrelin concentration. J Clin Endocrinol Metab. 2002; 87: 3997-4000.


Part IIOutcome of surgical treatment of
obesity: gallstones and quality of life

Cha pter 8Gallstone formation after weight loss
following gastric banding in morbidly
obese dutch patients
Rosalie M. Kiewiet, Marc F. Durian, Marc van Leersum,
Fried L.E.M. Hesp, Adrie C.M. van Vliet
Obesity Surgery 2006; 16: 592-596
1.
2.
3.
4.
5.
6.
7.
8.
9.
10.
11.
12.
13.
14.
15.
16.
17.
18.
19.
20.
21.
22.
23.
24.
25.
26.
27.
28.
29.
30.
31.
32.
33.
34.
35.
36.
37.
38.
39.
Chap
ter 8
106
Gallstone formation after gastric banding
ABSTRACT
Background
Obesity is a risk factor for the development of gallstones. Rapid weight loss may be an even
stronger risk factor. We retrospectively assessed the prevalence and risk factors of gallstone
formation after adjustable gastric banding (AGB) in a Dutch population.
Methods
All patients who underwent AGB between Jan 1992 and Dec 2000 for morbid obesity were
invited to take part in this study. Transabdominal ultrasonography of the gallbladder was
performed in those patients without a prior history of cholecystectomy (Group A). Addition-
ally, 45 morbidly obese patients underwent ultrasonography of the gallbladder before weight
reduction surgery (Group B).
Results
120 patients were enrolled in the study (group A). Prior history of cholecystectomy was pres-
ent in 21 patients: 16 before and 5 after AGB. Ultrasonography was performed in 98 patients:
gallstones were present in 26 (26.5%). On multivariate analysis, neither preoperative weight,
nor maximum weight loss, nor the interval between operation and the postoperative ultra-
sonography were determinants of the risk for developing gallstone disease. Prevalence of
gallstones was signifi cantly lower in the morbidly obese patients who had not yet undergone
weight reduction surgery (Group B).
Conclusions
Rapid weight loss induced by AGB is an important risk factor for the development of gallstones.
No additional determinants were found. Every morbidly obese patient undergoing bariatric
surgery must be considered at risk for developing gallstone disease.
1.
2.
3.
4.
5.
6.
7.
8.
9.
10.
11.
12.
13.
14.
15.
16.
17.
18.
19.
20.
21.
22.
23.
24.
25.
26.
27.
28.
29.
30.
31.
32.
33.
34.
35.
36.
37.
38.
39.
Chap
ter 8
107
Gallstone formation after gastric banding
INTRODUCTION
Obesity is a known risk factor for the development of gallstones.1, 2 However, rapid loss of
excess weight may be an even stronger risk factor.3-6 The development of gallstones following
weight loss is likely related to a change in cholesterol metabolism, because the percentage of
cholesterol stones in this population is considerably higher than in the general population.6
The formation of cholesterol stones is the result of three physical conditions: supersaturation
of bile with cholesterol, decreased gallbladder contractions, and acceleration of cholesterol
crystal nucleation.5, 7, 8 Each of these processes may result from weight loss. Consequently, the
amount and rate of weight loss play an important role in gallstone formation as well.8, 9
Morbidly obese individuals are at very high risk for the development of gallstones after
weight reduction surgery. In 22% to 71% of morbidly obese individuals, gallstone disease has
developed after bariatric surgery.3, 10, 11
The prevalence of gallstones after weight reduction surgery was assessed in a Dutch mor-
bidly obese population. We compared the presence of gallstones in two groups of morbidly
obese patients: those who already had undergone weight reduction surgery and those who
had not. The presence of other risk factors for development of gallstones besides rapid weight
loss, was also assessed.
METHODS
Bariatric surgery has been performed in our hospital since Jan 1992. The method used has been
placement of an adjustable gastric band (AGB) to mechanically restrict food intake. Patients
accepted for surgery all met the criteria for morbid obesity: body mass index (BMI) >40 kg/m2,
or BMI >35 kg/m2 in combination with relevant co-morbidity.12
All patients who underwent gastric banding from Jan 1992 to Dec 2000 were invited to take
part in a retrospective study, evaluating weight loss, quality of life, general health and gallstone
formation. In this study, we describe the results considering gallstone formation. At least 1 year
had passed between surgery and participation in the study. Participants were assessed for
preoperative weight, maximum weight loss, present weight, and history of cholecystectomy,
including timing of gallbladder surgery either before or after AGB. Patients without a prior
history of cholecystectomy underwent transabdominal ultrasonography of the gallbladder to
detect gallstones or sludge (Group A).
Because in our study group no data were available regarding the presence of gallstones
before AGB, we created a control group of morbidly obese subjects who had not yet undergone
bariatric surgery (Group B). Consecutive non-selected morbidly obese patients entering the
weight reduction surgery program were evaluated for a history of cholecystectomy, and under-
1.
2.
3.
4.
5.
6.
7.
8.
9.
10.
11.
12.
13.
14.
15.
16.
17.
18.
19.
20.
21.
22.
23.
24.
25.
26.
27.
28.
29.
30.
31.
32.
33.
34.
35.
36.
37.
38.
39.
Chap
ter 8
108
Gallstone formation after gastric banding
went transabdominal ultrasonography. None of these patients had a prior history of weight
reduction surgery.
Statistical analysis was carried out using either analysis of variance or the χ2-test to compare
patient groups. All data are expressed as mean ± standard deviation (SD).
RESULTS
A total of 225 patients underwent AGB in our hospital between 1992 and 2000; 120 of the
patients (53%; 11 male, 109 female) agreed to participate in this study (Group A). Their weight
before AGB was 130.4 ± 17.4 kg, with BMI 44.5 ± 5.6 kg/m2. The average time between AGB and
participation in the study was 56.1 months (range 16-102 months).
All patients reported the same pattern in weight reduction: rapid weight loss in the fi rst year
after surgery with eventual stabilization at a slightly higher level afterwards. Maximum weight
loss was 31.5 ± 11.3% of initial body weight, and BMI at the time of participating in the study
was 34.2 ± 6.1 kg/m2. None of the patients had used ursodeoxycholic acid after AGB.
A history of cholecystectomy was present at the time of evaluation in 21 (17.5%) of 120
patients: 16 (13.3%) before AGB and 5 (4.2%) after AGB. Mean time between AGB and cholecys-
tectomy in the latter patients was 37 months (range 15 to 73 months).
The remaining 98 patients underwent transabdominal ultrasonography of the gallblad-
der (one man refused). Gallstones were detected in 26 (26.5%) of them (2 men, 24 women),
including sludge in 2 (2.0%) who had evidence of gallstones as well. Thus, in Group A the total
prevalence of gallstones after weight reduction surgery was 31 (30.1%) in 103 patients at risk: 5
cases of symptomatic gallstones after AGB who had undergone cholecystectomy, and 26 cases
of gallstones detected on postoperative ultrasonography performed in 98 patients.
Although symptomatic gallstone disease appeared to be present in only 4.9% (5 in 103
who underwent cholecystectomy after AGB), another 2 patients in group A with apparently
“silent” gallstones reported complaints attributable to gallbladder disease. They underwent
cholecystectomy subsequently. Thus, 7 patients out of 31 (22.5%) who had gallstones after AGB
developed symptoms consistent with gallbladder disease.
Table 1 shows that there was no signifi cant diff erence between subjects with or without
evidence of gallstones on ultrasonography regarding age (43.5 ± 11.3 years vs. 41.4 ± 8.0 years),
sex (7.7% male vs 11.1% male), initial body weight (131.8 ± 17.0 kg vs 129.4 ± 17.7 kg) or BMI
(45.0 ± 4.6 vs 44.0 ± 6.1 ). Similarly, neither the total amount of weight loss (30.6 ± 12.9% of
initial body weight vs 31.4 ± 10.5%), nor the time interval between weight reduction surgery
and detection of gallstones (55.4 ± 21.6 months vs 55.5 ± 20.7 months), were determinants of
the risk to develop gallstones.

1.
2.
3.
4.
5.
6.
7.
8.
9.
10.
11.
12.
13.
14.
15.
16.
17.
18.
19.
20.
21.
22.
23.
24.
25.
26.
27.
28.
29.
30.
31.
32.
33.
34.
35.
36.
37.
38.
39.
Chap
ter 8
109
Gallstone formation after gastric banding
Those patients who had undergone cholecystectomy for symptomatic gallstone disease
after AGB tended to be older than those patients who had gallstones identifi ed by ultraso-
nography (49.0 ± 10.3 years vs 43.5 ± 11.3 years), although this diff erence was not statistically
signifi cant.
In the control group B of prospectively nonselected morbidly obese patients entering the
weight reduction surgery program for treatment of their obesity, 45 participants underwent
preoperative transabdominal ultrasonography of the gallbladder. Gallstones were found in
6 patients (13.3%). Table 2 presents the characteristics of this group (group B) compared to
the previously discussed group who already had weight reduction surgery (group A). Group
A patients who had undergone cholecystectomy were excluded, because gallstone formation
after weight reduction surgery could not be studied in this group. The proportion of male
patients in group A was lower than in group B: 9.7% vs 26.7%. There was no signifi cant diff er-
ence in body weight (129.7 ± 17.4 kg in group A vs 129.0 ± 21.8 kg in group B) or BMI (44.2 ± 5.6
kg/m2 in group A vs 43.9 ± 7.4 kg/m2 in group B) before AGB.
At the time of performing ultrasonography, age of the patients was signifi cantly higher in
group A than in group B (42.3 ± 9.1 years vs 38.1 ± 11.5 years, P<0.05). On the other hand,
Table 1. Characteristics of the morbidly obese patients after weight reduction surgery (mean ± SD)
Cholecystectomy (n=21) Ultrasonography (n=98)
Before AGB After AGB Gallstones No gallstones
n = 16 n = 5 n = 26 n = 72
M : F 0 : 16 0 : 5 2 : 24 8 : 64
Age (years) 43.6 (± 9.9) 49.0 (± 10.3) 43.5 (± 11.3) 41.4 (± 8.0)
Preoperative weight (kg) 132.4 (± 14.1) 122.8 (± 16.8) 131.8 (± 17.0) 129.4 (± 17.7)
Preoperative BMI (kg/m2) 45.6 (± 5.0) 43.3 (± 3.3) 45.0 (± 4.6) 44.0 (± 6.1)
Max weight loss (kg) 45.4 (± 19.3) 41.0 (± 23.3) 40.8 (± 19.3) 40.7 (± 15.6)
Max weight loss (% of initial body weight) 33.6 (± 12.3) 32.4 (± 13.7) 30.6 (± 12.9) 31.4 (± 10.5)
Time after surgery (months) 59.2 (± 25.4) 59.6 (± 24.6) 55.4 (± 21.6) 55.5 (± 20.7)
AGB = adjustable gastric banding
Table 2. Characteristics of the morbidly obese patients before and after weight reduction surgery (mean ± SD)
After AGB (group A) Before AGB (group B)
n=103 n=45
M : F 10 : 93 12 : 33
Age (years) 42.3 (± 9.1) 38.1 (± 11.5)
Weight before AGB (kg) 129.7 (± 17.4) 129.0 (± 21.8)
BMI before AGB (kg/m2) 44.2 (± 5.6) 43.9 (± 7.4)
Present weight (kg) 97.7 (± 19.2)
Present BMI (kg/m2) 34.3 (± 6.2)
Gallstones present (%) 31 (30.1%) 6 (13.3%)
AGB = adjustable gastric banding
*Present weight and BMI represents the weight and BMI at the time of transabdominal ultrasonography.
1.
2.
3.
4.
5.
6.
7.
8.
9.
10.
11.
12.
13.
14.
15.
16.
17.
18.
19.
20.
21.
22.
23.
24.
25.
26.
27.
28.
29.
30.
31.
32.
33.
34.
35.
36.
37.
38.
39.
Chap
ter 8
110
Gallstone formation after gastric banding
weight (97.7 ± 19.2 kg in group A vs 129.0 ± 21.8 kg in group B, P<0.001) and BMI (34.3 ± 6.2 vs
43.9 ± 7.4, P<0.001) were signifi cantly lower in group A compared to group B.
The most important fi nding was the diff erence in prevalence of gallstones: 13.3% of mor-
bidly obese patients had gallstones before AGB vs 30.1% in the group after AGB (Table 2). Using
the χ2-test, this diff erence is statistically signifi cant (P<0.05).
DISCUSSION
The prevalence of gallstones after AGB is 30% in our Dutch population of morbidly obese
patients. These results correspond with the reports of others. For example, a study by Miller
et al10 reported an incidence of 22% at 1 year after vertical banded gastroplasty (VBG) or AGB,
increasing to 30% at 2 years after the surgery. Shiff man et al13 described an incidence of gall-
stone formation of 38% within 6 months after Roux-en-Y gastric bypass (RYGBP).
The incidence of gallstone formation after weight loss varies widely: 10% of patients suf-
fering from morbid obesity develop gallstones after a low calorie diet,4, 9, 14 while up to 71% of
morbidly obese patients develop gallstones after RYGBP.11 RYGBP and especially the duodenal
switch operation have the feature of bypass of the duodenum by food, decreased cholecysto-
kinin secretion with gallbladder stasis, and more rapid and greater weight loss.6, 13, 15, 16 Those
bariatric operations are followed by a signifi cantly higher incidence of gallstone formation than
the purely gastric restrictive operations. However, AGB is also followed by supersaturation of
bile with cholesterol due to mobilization of cholesterol from mobilized fat, depressed gallblad-
der emptying due to decreased food intake, and accelerated cholesterol crystal nucleation
from bile stasis.5, 7, 8
It is generally considered that the risk of gallstone formation after weight loss increases
sharply if the rate of weight loss exceeds 1.5 kg/week or if the total amount of weight loss
is >24% of initial body weight.3, 7, 8 Our population of morbidly obese patients treated with
AGB had rapid and considerable weight loss (average 31% of initial body weight), but with the
cholecystokinin mechanism intact. Nevertheless, changes in cholecystokinin secretion due to
decreased food loading still result in decreased gallbladder contraction.
The prevalence of 30.1% gallstone formation after AGB in our study might be an over-
estimation of the true number of patients developing gallstones after AGB, because we do not
know the number of gallstones before AGB in Group A. It is possible that some of group A
patients already had silent gallstones before AGB. Therefore, we assessed the prevalence of
gallstones in a group B, morbidly obese patients who had not yet undergone bariatric surgery.
The prevalence of silent gallstones based on ultrasonography in this group was only 13.3%.
Comparing these fi gures, we can draw two conclusions. First, the majority of the gallstones
likely developed after the AGB. Second, the signifi cant diff erence in prevalence of gallstones in
1.
2.
3.
4.
5.
6.
7.
8.
9.
10.
11.
12.
13.
14.
15.
16.
17.
18.
19.
20.
21.
22.
23.
24.
25.
26.
27.
28.
29.
30.
31.
32.
33.
34.
35.
36.
37.
38.
39.
Chap
ter 8
111
Gallstone formation after gastric banding
these two groups supports the tenet that weight loss is a major risk factor for the formation of
gallstones.
There are some limitations regarding these results. The two patient groups were recruited in
a diff erent way: group A was retrospectively studied AGB patients who were invited to partici-
pate, versus group B was consecutive non-operated patients who were invited to participate
prospectively. The percentage of eligible patients who agreed to participate was higher in the
latter group. Also, the patients in group A were older and more often female than in group
B, which are known risk factors for the development gallstones. Nevertheless, the diff erence
in body weight at the time of ultrasonography was signifi cantly lower in group A who had
undergone AGB.
We compared the 30% prevalence of gallstones after AGB weight loss with the prevalence
in the general Dutch population (not suff ering from morbid obesity) assessed by Thijs et al.17 In
the general population, 4% and 10% of men and 16% and 11% of women at age 30 to 39 years
and 40 to 49 years respectively have gallstone disease, which is lower than in our population
after AGB. The diff erence is far less striking when comparing the general Dutch population with
the morbidly obese patients before AGB (group B) who had a 13% prevalence of gallstones.
On multivariate analysis comparing the patients with and without gallstones after AGB, we
could not identify any determinants of risk to develop gallstones. Age, sex, initial body weight
and amount of weight lost were not signifi cantly diff erent in those who did and those who did
not develop gallstones.9, 13, 18, 19 However, Yang et al,9 Wudel et al11 and Shiff man et al13 describe
a correlation between gallstone formation and amount of weight lost. Papavramidis3 and Al-
Jiff ry7 state that this risk increases sharply if the rate of weight loss exceeds 1.5 to 1.7 kg/week,
while Erlinger found this relationship for weight loss exceeding 24% of initial body weight.8
One explication for the lack of relationship between amount of weight loss and stone forma-
tion in our study might be the rather long period between the AGB operation and the time of
transabdominal ultrasonography, because gallstones are reported to develop in the fi rst weeks
to months after weight reduction surgery3, 6, 7, 10, 11 and the stones may even disappear when
body weight stabilizes.5-7 Figures regarding weight loss in the fi rst postoperative year (in which
weight loss is fastest) were not available.
The percentage of newly formed gallstones after weight reduction surgery which became
symptomatic, leading to cholecystectomy, is more important. Gallstones formed in 30.1% of
our population, of whom 22.5% developed symptomatic gallstone disease, which is consistent
with other fi ndings reporting 12% to 40%.3-5, 10, 11 Nevertheless, the prevalence of symptomatic
gallstone disease in our total population of patients who had undergone AGB was only 6.8%
(7 in 103).
Because symptomatic gallstone disease may be accompanied by signifi cant morbidity,
prevention of gallstone formation after weight reduction surgery may be a consideration. This
involves simultaneous cholecystectomy during weight reduction surgery3, 15, 18, 20, 21 or postop-
erative prophylactic treatment with ursodeoxycholic acid.10, 11, 22
1.
2.
3.
4.
5.
6.
7.
8.
9.
10.
11.
12.
13.
14.
15.
16.
17.
18.
19.
20.
21.
22.
23.
24.
25.
26.
27.
28.
29.
30.
31.
32.
33.
34.
35.
36.
37.
38.
39.
Chap
ter 8
112
Gallstone formation after gastric banding
None of our patients had any prophylaxis, because this was not the practice in the Neth-
erlands in the period that they underwent surgery. Nowadays, both methods have earned
their place. We prefer postoperative treatment with ursodeoxycholic acid, because it is an easy,
cost-eff ective preventative. It would be helpful to compare these methods in a prospectively
randomized controlled trial regarding development of gallstones, morbidity, and cost-eff ec-
tiveness.
In conclusion, we found gallstones in 30% of morbidly obese patients after gastric banding.
This was signifi cantly higher than the prevalence of gallstones in a population of morbidly
obese patients before weight reduction surgery. This fi nding is consistent with the concept
of weight loss being a risk factor for gallstone formation. Additional risk factors for gallstone
formation could not be demonstrated. In 22.5% of the patients who developed gallstones,
symptomatic gallbladder disease was diagnosed, which is 6.8% of the total population who
underwent AGB.
Acknowledgements
The authors wish to thank Prof.dr.Ton J.M. Cleophas for his assistance in statistical analysis.

1.
2.
3.
4.
5.
6.
7.
8.
9.
10.
11.
12.
13.
14.
15.
16.
17.
18.
19.
20.
21.
22.
23.
24.
25.
26.
27.
28.
29.
30.
31.
32.
33.
34.
35.
36.
37.
38.
39.
Chap
ter 8
113
Gallstone formation after gastric banding
REFERENCES
1 Stampfer MJ, Maclure KM, Colditz GA, Manson JE, Willett WC. Risk of symptomatic gallstones in women with severe obesity. Am J Clin Nutr. 1992; 55: 652-8.
2 Dittrick GW, Thompson JS, Campos D, Bremers D, Sudan D. Gallbladder pathology in morbid obesity. Obes Surg. 2005; 15: 238-42.
3 Papavramidis S, Deligianidis N, Papavramidis T, Sapalidis K, Katsamakas M, Gamvros O. Laparoscopic cholecystectomy after bariatric surgery. Surg Endosc. 2003; 17: 1061-4.
4 Liddle RA, Goldstein RB, Saxton J. Gallstone formation during weight-reduction dieting. Arch Intern Med. 1989; 149: 1750-3.
5 Everhart JE. Contributions of obesity and weight loss to gallstone disease. Ann Intern Med. 1993; 119: 1029-35.
6 Deitel M, Petrov I. Incidence of symptomatic gallstones after bariatric operations. Surg Gynecol Obstet. 1987; 164: 549-52.
7 Al-Jiff ry BO, Shaff er EA, Saccone GT, Downey P, Kow L, Toouli J. Changes in gallbladder motility and gallstone formation following laparoscopic gastric banding for morbid obestity. Can J Gastroenterol. 2003; 17: 169-74.
8 Erlinger S. Gallstones in obesity and weight loss. Eur J Gastroenterol Hepatol. 2000; 12: 1347-52. 9 Yang H, Petersen GM, Roth MP, Schoenfi eld LJ, Marks JW. Risk factors for gallstone formation during
rapid loss of weight. Dig Dis Sci. 1992; 37: 912-8. 10 Miller K, Hell E, Lang B, Lengauer E. Gallstone formation prophylaxis after gastric restrictive procedures
for weight loss: a randomized double-blind placebo-controlled trial. Ann Surg. 2003; 238: 697-702. 11 Wudel LJ, Jr., Wright JK, Debelak JP, Allos TM, Shyr Y, Chapman WC. Prevention of gallstone formation
in morbidly obese patients undergoing rapid weight loss: results of a randomized controlled pilot study. J Surg Res. 2002; 102: 50-6.
12 Hubbard VS, Hall WH. Gastrointestinal Surgery for Severe Obesity. Obes Surg. 1991; 1: 257-65. 13 Shiff man ML, Sugerman HJ, Kellum JM, Brewer WH, Moore EW. Gallstone formation after rapid weight
loss: a prospective study in patients undergoing gastric bypass surgery for treatment of morbid obesity. Am J Gastroenterol. 1991; 86: 1000-5.
14 Zapata R, Severin C, Manriquez M, Valdivieso V. Gallbladder motility and lithogenesis in obese patients during diet-induced weight loss. Dig Dis Sci. 2000; 45: 421-8.
15 Fobi M, Lee H, Igwe D, Felahy B, James E, Stanczyk M, et al. Prophylactic cholecystectomy with gastric bypass operation: incidence of gallbladder disease. Obes Surg. 2002; 12: 350-3.
16 Liem RK, Niloff PH. Prophylactic cholecystectomy with open gastric bypass operation. Obes Surg. 2004; 14: 763-5.
17 Thijs C, Knipschild P, van Engelshoven J. The prevalence of gallstone disease in a Dutch population. Scand J Gastroenterol. 1990; 25: 155-60.
18 O’Brien PE, Dixon JB. A rational approach to cholelithiasis in bariatric surgery: its application to the laparoscopically placed adjustable gastric band. Arch Surg. 2003; 138: 908-12.
19 Iglezias Brandao de Oliveira C, Adami Chaim E, da Silva BB. Impact of rapid weight reduction on risk of cholelithiasis after bariatric surgery. Obes Surg. 2003; 13: 625-8.
20 Villegas L, Schneider B, Provost D, Chang C, Scott D, Sims T, et al. Is routine cholecystectomy required during laparoscopic gastric bypass? Obes Surg. 2004; 14: 206-11.
21 Zilberstein B, Pajecki D, Andrade CG, Eshkenazy R, Garcia de Brito AC, Gallafrio ST. Simultaneous gastric banding and cholecystectomy in the treatment of morbid obesity: is it feasible? Obes Surg. 2004; 14: 1331-4.
22 Shiff man ML, Kaplan GD, Brinkman-Kaplan V, Vickers FF. Prophylaxis against gallstone formation with ursodeoxycholic acid in patients participating in a very-low-calorie diet program. Ann Intern Med. 1995; 122: 899-905.

Cha pter 9Quality of life after gastric banding in
morbidly obese dutch patients: long-
term follow-up
Rosalie M. Kiewiet, Marc F. Durian, Luc P.L.H. Cuijpers,
Fried L.E.M. Hesp, Adrie C.M. van Vliet
Obesity Research & Clinical Practice 2008; 2: 151-158

1.
2.
3.
4.
5.
6.
7.
8.
9.
10.
11.
12.
13.
14.
15.
16.
17.
18.
19.
20.
21.
22.
23.
24.
25.
26.
27.
28.
29.
30.
31.
32.
33.
34.
35.
36.
37.
38.
39.
Chap
ter 9
116
Quality of life after gastric banding
ABSTRACT
Objective
The long-term eff ects of gastric banding (AGB) on quality of life (QoL) in a morbidly obese
population were investigated in a cross-sectional study. Additionally, determinants of QoL after
AGB were assessed.
Methods
All patients treated by AGB for morbid obesity in a Dutch hospital were invited to complete the
RAND 36-Item Health Survey. Of 121 participating patients 59 met the criteria for long-term
follow-up (>5 years): 4 male and 55 female, mean age 42.4 ± 9.7 years, mean Body Mass Index
(BMI) before surgery 44.9 ± 5.9 kg/m2. Time since surgery was 74.7 months (range 60-107.6).
The control group consisted of 28 presurgical patients. General and obesity-related parameters
were assessed for correlation with QoL.
Results
Signifi cant diff erences between the preoperative group and Dutch community norm (CN)
values were found on fi ve out of eight QoL subscales, in favor of CN. AGB induced signifi cant
weight loss in the postoperative group: 56.1% excess weight loss (%EWL). This group scored
signifi cantly better than the preoperative group on one out of eight subscales: physical func-
tioning (P = 0.019). Additionally, scores on four out of eight subscales were still signifi cantly
impaired compared to CN. Postoperative BMI and %EWL infl uenced QoL after long-term follow-
up, whereas weight regain had no negative impact.
Conclusions
This study shows that after long-term follow-up subjects treated by gastric banding to induce
weight loss have a slightly better QoL than those who did not undergo surgery yet. QoL remains
impaired in comparison to the general population. After long-term follow-up BMI and weight
loss do infl uence QoL whereas weight regain does not have any negative impact.
1.
2.
3.
4.
5.
6.
7.
8.
9.
10.
11.
12.
13.
14.
15.
16.
17.
18.
19.
20.
21.
22.
23.
24.
25.
26.
27.
28.
29.
30.
31.
32.
33.
34.
35.
36.
37.
38.
39.
Chap
ter 9
117
Quality of life after gastric banding
INTRODUCTION
Obesity is an increasing worldwide health problem. The prevalence has always been the high-
est in the United States, with 32.2% of adults being obese (defi ned as a body mass index (BMI)
> 30 kg/m2) in the period 2003-2004,1 but Europe is following with rates up to 24% among men,
and 36% among women.2 In the Netherlands, 46.5% of the general population (age > 20 years)
is overweight, and 11.3% is obese.3
Especially individuals suff ering from morbid obesity (defi ned as a BMI > 40 kg/m2) are
observed to have a signifi cantly higher morbidity and mortality than the general population. A
wide range of diseases are commonly associated with (morbid) obesity, such as hypertension,
diabetes, hyperlipidemia, sleep apnea, asthma and degenerative joint disease.4-6 Additionally,
morbid obesity has important negative psychosocial consequences. Functional impairment,
increased morbidity and especially social stigmatization typically cause depression, low self-
esteem and anxiety disorders.4, 7-10 As a result of this high prevalence of both physical and
psychological complications, severe obesity clearly is associated with signifi cantly reduced
health-related quality of life (QoL).9, 11-14
Up to the present, bariatric surgery is the only treatment for morbid obesity which results in
substantial and, more important, sustained weight loss. The eff ectiveness of bariatric surgery
traditionally has been measured in percentage of excess body weight lost. However, since major
improvements in general health can be achieved with even modest weight loss,15, 16 absolute
weight change after bariatric surgery seems not the best way to evaluate its eff ects. Addition-
ally, weight loss is not a good measure for postoperative improvement in psychopathology as
well.17, 18 As a result, the eff ectiveness of bariatric surgery is often defi ned as improvement in
health-related QoL. In the fi rst years after surgery, quality of life is strongly improved compared
to preoperative scores.8-11, 19 Indeed, some studies show that quality of life scores just after
surgery are comparable with community norm values, even though BMI is still signifi cantly
higher.7, 20, 21 Nevertheless, after a period of 2 years postoperatively, quality of life has a ten-
dency to worsen.9, 13, 18, 19 It is unclear whether this is the result of waning optimism in a period
of weight stabilization, disappointment about only limited improvement in everyday life or
persistence of pre-surgical problems not related to body weight.18, 22 In addition, weight regain,
which is observed especially in restrictive types of bariatric surgery, might play a negative role.9,
23 Unfortunately, only few studies report follow-up results longer than 5 years postoperatively
describing quality of life.
The objective of this study was to evaluate the long-term eff ects of gastric banding on the
quality of life in morbidly obese patients. Does QoL improve, compared to the preoperative
situation? And if so, is QoL comparable to the general population postoperatively? Addition-
ally, the aim was to identify determinants infl uencing QoL in morbidly obese patients having
undergone gastric banding.
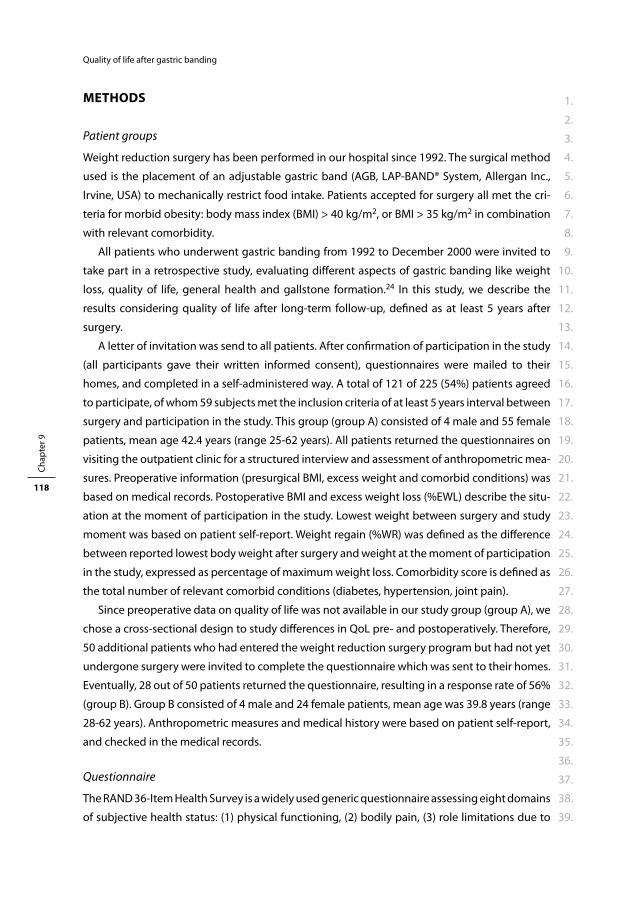
1.
2.
3.
4.
5.
6.
7.
8.
9.
10.
11.
12.
13.
14.
15.
16.
17.
18.
19.
20.
21.
22.
23.
24.
25.
26.
27.
28.
29.
30.
31.
32.
33.
34.
35.
36.
37.
38.
39.
Chap
ter 9
118
Quality of life after gastric banding
METHODS
Patient groups
Weight reduction surgery has been performed in our hospital since 1992. The surgical method
used is the placement of an adjustable gastric band (AGB, LAP-BAND® System, Allergan Inc.,
Irvine, USA) to mechanically restrict food intake. Patients accepted for surgery all met the cri-
teria for morbid obesity: body mass index (BMI) > 40 kg/m2, or BMI > 35 kg/m2 in combination
with relevant comorbidity.
All patients who underwent gastric banding from 1992 to December 2000 were invited to
take part in a retrospective study, evaluating diff erent aspects of gastric banding like weight
loss, quality of life, general health and gallstone formation.24 In this study, we describe the
results considering quality of life after long-term follow-up, defi ned as at least 5 years after
surgery.
A letter of invitation was send to all patients. After confi rmation of participation in the study
(all participants gave their written informed consent), questionnaires were mailed to their
homes, and completed in a self-administered way. A total of 121 of 225 (54%) patients agreed
to participate, of whom 59 subjects met the inclusion criteria of at least 5 years interval between
surgery and participation in the study. This group (group A) consisted of 4 male and 55 female
patients, mean age 42.4 years (range 25-62 years). All patients returned the questionnaires on
visiting the outpatient clinic for a structured interview and assessment of anthropometric mea-
sures. Preoperative information (presurgical BMI, excess weight and comorbid conditions) was
based on medical records. Postoperative BMI and excess weight loss (%EWL) describe the situ-
ation at the moment of participation in the study. Lowest weight between surgery and study
moment was based on patient self-report. Weight regain (%WR) was defi ned as the diff erence
between reported lowest body weight after surgery and weight at the moment of participation
in the study, expressed as percentage of maximum weight loss. Comorbidity score is defi ned as
the total number of relevant comorbid conditions (diabetes, hypertension, joint pain).
Since preoperative data on quality of life was not available in our study group (group A), we
chose a cross-sectional design to study diff erences in QoL pre- and postoperatively. Therefore,
50 additional patients who had entered the weight reduction surgery program but had not yet
undergone surgery were invited to complete the questionnaire which was sent to their homes.
Eventually, 28 out of 50 patients returned the questionnaire, resulting in a response rate of 56%
(group B). Group B consisted of 4 male and 24 female patients, mean age was 39.8 years (range
28-62 years). Anthropometric measures and medical history were based on patient self-report,
and checked in the medical records.
Questionnaire
The RAND 36-Item Health Survey is a widely used generic questionnaire assessing eight domains
of subjective health status: (1) physical functioning, (2) bodily pain, (3) role limitations due to

1.
2.
3.
4.
5.
6.
7.
8.
9.
10.
11.
12.
13.
14.
15.
16.
17.
18.
19.
20.
21.
22.
23.
24.
25.
26.
27.
28.
29.
30.
31.
32.
33.
34.
35.
36.
37.
38.
39.
Chap
ter 9
119
Quality of life after gastric banding
physical health problems, (4) role limitations due to personal or emotional problems, (5) mental
health, (6) social functioning, (7) vitality, and (8) general health. One additional item gives an
indication of perceived change of health over the past year (health change). The RAND 36-Item
Health Survey includes the same items as the MOS 36-item Short-Form Health Survey (SF-36),
but diff ers slightly in its scoring system.25 Transformed scores range from 0 (poor health) to
100 (good health) and were calculated for the 9 domains. The 36-item Health Survey has been
proven to be a useful instrument in assessing quality of life in morbidly obese subjects, before
and after bariatric surgery.12, 26-30
In this study, a validated Dutch version of the RAND 36-Item Health Survey was used.31 Van
der Zee reported a Cronbach’s alpha for internal consistency between 0.71 and 0.92 for dif-
ferent domains, while test-retest reliability varied between 0.58 and 0.82 after 2 months. The
guidelines also provided Dutch community norm (CN) values (N = 1063, 65% female, mean age
44.1 years).
Statistical analysis
Results are reported as mean ± standard deviation (SD). A P-value of <0.05 is considered signifi -
cant. To compare RAND scores in group A vs. CN, and group B vs. CN, a one-sample t-test was
used. Since on exploring the RAND scores in group A and B, they proved not to be normally
distributed, the nonparametric Mann-Whitney test was used to identify diff erences in RAND
scores between the postoperative group (group A) and the preoperative control group (group
B). In the postoperative group (group A) multiple regression analysis was carried out to iden-
tify variables contributing to RAND domain scores. The following variables were tested: age,
gender, time since surgery, preoperative BMI, postoperative BMI, %EWL, %WR and comorbidity
score. Statistic calculations were performed using Statistical Package for the Social Sciences
(SPSS release 14.0; SPSS Inc, Chicago).
RESULTS
Patient characteristics
Patient characteristics of group A and B are described in Table 1. In group A, mean BMI decreased
signifi cantly from 44.9 ± 5.9 kg/m2 preoperatively to 33.3 ± 6.0 kg/m2 at follow-up (P < 0.001),
representing 56.1 ± 27.0% excess weight loss. Mean time since surgery was 74.7 months (range
60 – 107.6). BMI at the time of participation in the study was signifi cantly lower in group A,
compared to group B (P < 0.001). Additionally, the prevalence of diabetes was signifi cantly
lower in group A, compared to group B, whereas the prevalence of hypertension and joint pain
was not signifi cantly diff erent. Both groups did not diff er signifi cantly in age, nor in male to
female ratio. Comparing group A and B with CN, the most important diff erence is the male to
female ratio which was signifi cantly higher in CN.
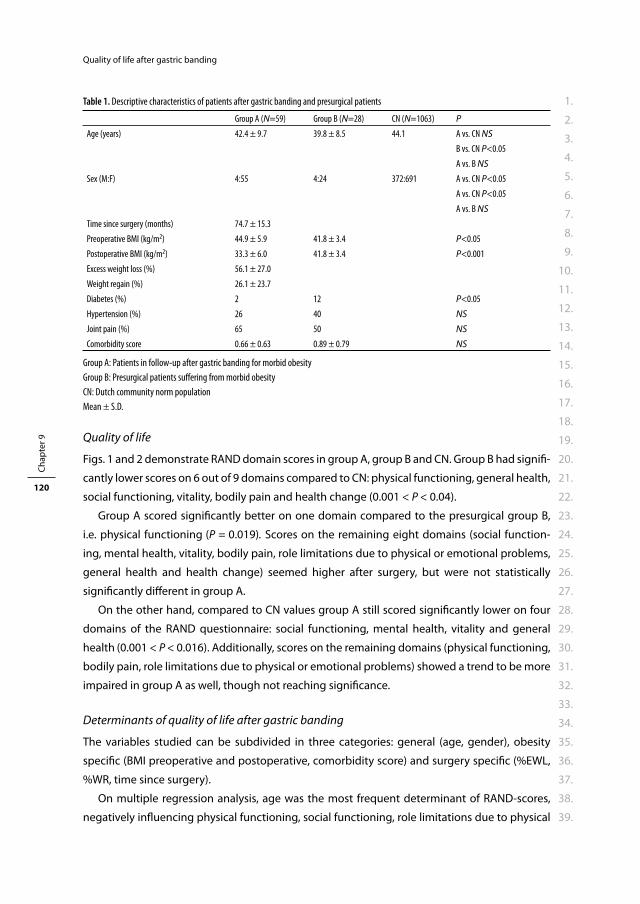
1.
2.
3.
4.
5.
6.
7.
8.
9.
10.
11.
12.
13.
14.
15.
16.
17.
18.
19.
20.
21.
22.
23.
24.
25.
26.
27.
28.
29.
30.
31.
32.
33.
34.
35.
36.
37.
38.
39.
Chap
ter 9
120
Quality of life after gastric banding
Quality of life
Figs. 1 and 2 demonstrate RAND domain scores in group A, group B and CN. Group B had signifi -
cantly lower scores on 6 out of 9 domains compared to CN: physical functioning, general health,
social functioning, vitality, bodily pain and health change (0.001 < P < 0.04).
Group A scored signifi cantly better on one domain compared to the presurgical group B,
i.e. physical functioning (P = 0.019). Scores on the remaining eight domains (social function-
ing, mental health, vitality, bodily pain, role limitations due to physical or emotional problems,
general health and health change) seemed higher after surgery, but were not statistically
signifi cantly diff erent in group A.
On the other hand, compared to CN values group A still scored signifi cantly lower on four
domains of the RAND questionnaire: social functioning, mental health, vitality and general
health (0.001 < P < 0.016). Additionally, scores on the remaining domains (physical functioning,
bodily pain, role limitations due to physical or emotional problems) showed a trend to be more
impaired in group A as well, though not reaching signifi cance.
Determinants of quality of life after gastric banding
The variables studied can be subdivided in three categories: general (age, gender), obesity
specifi c (BMI preoperative and postoperative, comorbidity score) and surgery specifi c (%EWL,
%WR, time since surgery).
On multiple regression analysis, age was the most frequent determinant of RAND-scores,
negatively infl uencing physical functioning, social functioning, role limitations due to physical
Table 1. Descriptive characteristics of patients after gastric banding and presurgical patients
Group A (N=59) Group B (N=28) CN (N=1063) P
Age (years) 42.4 ± 9.7 39.8 ± 8.5 44.1 A vs. CN NS
B vs. CN P<0.05
A vs. B NS
Sex (M:F) 4:55 4:24 372:691 A vs. CN P<0.05
A vs. CN P<0.05
A vs. B NS
Time since surgery (months) 74.7 ± 15.3
Preoperative BMI (kg/m2) 44.9 ± 5.9 41.8 ± 3.4 P<0.05
Postoperative BMI (kg/m2) 33.3 ± 6.0 41.8 ± 3.4 P<0.001
Excess weight loss (%) 56.1 ± 27.0
Weight regain (%) 26.1 ± 23.7
Diabetes (%) 2 12 P<0.05
Hypertension (%) 26 40 NS
Joint pain (%) 65 50 NS
Comorbidity score 0.66 ± 0.63 0.89 ± 0.79 NS
Group A: Patients in follow-up after gastric banding for morbid obesity
Group B: Presurgical patients suff ering from morbid obesity
CN: Dutch community norm population
Mean ± S.D.
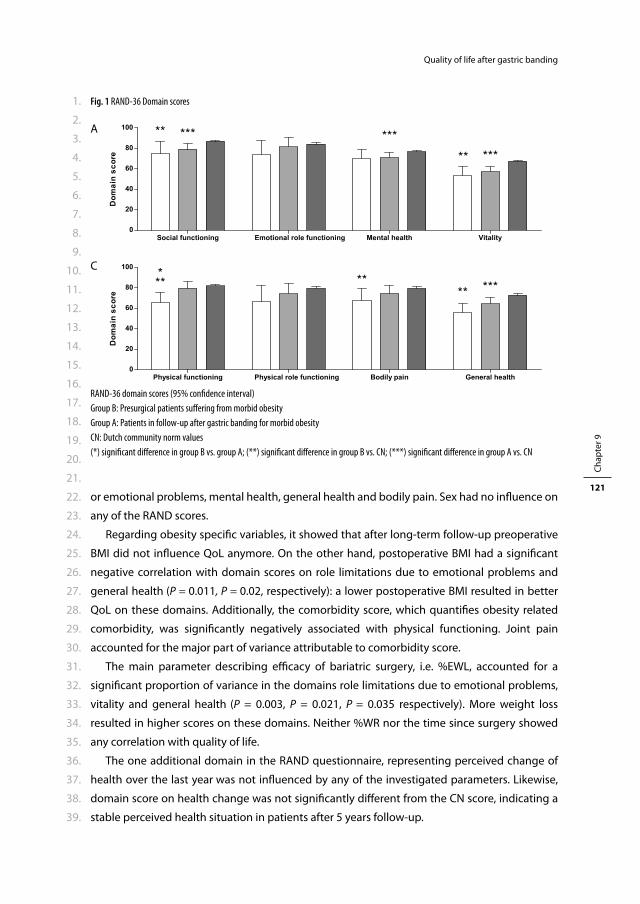
1.
2.
3.
4.
5.
6.
7.
8.
9.
10.
11.
12.
13.
14.
15.
16.
17.
18.
19.
20.
21.
22.
23.
24.
25.
26.
27.
28.
29.
30.
31.
32.
33.
34.
35.
36.
37.
38.
39.
Chap
ter 9
121
Quality of life after gastric banding
or emotional problems, mental health, general health and bodily pain. Sex had no infl uence on
any of the RAND scores.
Regarding obesity specifi c variables, it showed that after long-term follow-up preoperative
BMI did not infl uence QoL anymore. On the other hand, postoperative BMI had a signifi cant
negative correlation with domain scores on role limitations due to emotional problems and
general health (P = 0.011, P = 0.02, respectively): a lower postoperative BMI resulted in better
QoL on these domains. Additionally, the comorbidity score, which quantifi es obesity related
comorbidity, was signifi cantly negatively associated with physical functioning. Joint pain
accounted for the major part of variance attributable to comorbidity score.
The main parameter describing effi cacy of bariatric surgery, i.e. %EWL, accounted for a
signifi cant proportion of variance in the domains role limitations due to emotional problems,
vitality and general health (P = 0.003, P = 0.021, P = 0.035 respectively). More weight loss
resulted in higher scores on these domains. Neither %WR nor the time since surgery showed
any correlation with quality of life.
The one additional domain in the RAND questionnaire, representing perceived change of
health over the last year was not infl uenced by any of the investigated parameters. Likewise,
domain score on health change was not signifi cantly diff erent from the CN score, indicating a
stable perceived health situation in patients after 5 years follow-up.
Fig. 1 RAND-36 Domain scores
A
C
RAND-36 domain scores (95% confi dence interval)
Group B: Presurgical patients suff ering from morbid obesity
Group A: Patients in follow-up after gastric banding for morbid obesity
CN: Dutch community norm values
(*) signifi cant diff erence in group B vs. group A; (**) signifi cant diff erence in group B vs. CN; (***) signifi cant diff erence in group A vs. CN
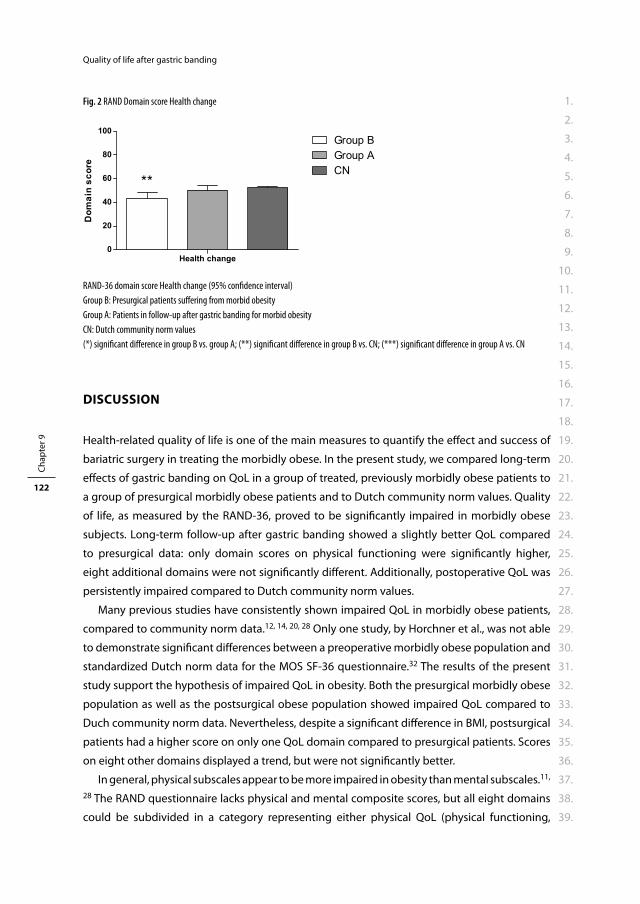
1.
2.
3.
4.
5.
6.
7.
8.
9.
10.
11.
12.
13.
14.
15.
16.
17.
18.
19.
20.
21.
22.
23.
24.
25.
26.
27.
28.
29.
30.
31.
32.
33.
34.
35.
36.
37.
38.
39.
Chap
ter 9
122
Quality of life after gastric banding
DISCUSSION
Health-related quality of life is one of the main measures to quantify the eff ect and success of
bariatric surgery in treating the morbidly obese. In the present study, we compared long-term
eff ects of gastric banding on QoL in a group of treated, previously morbidly obese patients to
a group of presurgical morbidly obese patients and to Dutch community norm values. Quality
of life, as measured by the RAND-36, proved to be signifi cantly impaired in morbidly obese
subjects. Long-term follow-up after gastric banding showed a slightly better QoL compared
to presurgical data: only domain scores on physical functioning were signifi cantly higher,
eight additional domains were not signifi cantly diff erent. Additionally, postoperative QoL was
persistently impaired compared to Dutch community norm values.
Many previous studies have consistently shown impaired QoL in morbidly obese patients,
compared to community norm data.12, 14, 20, 28 Only one study, by Horchner et al., was not able
to demonstrate signifi cant diff erences between a preoperative morbidly obese population and
standardized Dutch norm data for the MOS SF-36 questionnaire.32 The results of the present
study support the hypothesis of impaired QoL in obesity. Both the presurgical morbidly obese
population as well as the postsurgical obese population showed impaired QoL compared to
Duch community norm data. Nevertheless, despite a signifi cant diff erence in BMI, postsurgical
patients had a higher score on only one QoL domain compared to presurgical patients. Scores
on eight other domains displayed a trend, but were not signifi cantly better.
In general, physical subscales appear to be more impaired in obesity than mental subscales.11,
28 The RAND questionnaire lacks physical and mental composite scores, but all eight domains
could be subdivided in a category representing either physical QoL (physical functioning,
Fig. 2 RAND Domain score Health change
RAND-36 domain score Health change (95% confi dence interval)
Group B: Presurgical patients suff ering from morbid obesity
Group A: Patients in follow-up after gastric banding for morbid obesity
CN: Dutch community norm values
(*) signifi cant diff erence in group B vs. group A; (**) signifi cant diff erence in group B vs. CN; (***) signifi cant diff erence in group A vs. CN
1.
2.
3.
4.
5.
6.
7.
8.
9.
10.
11.
12.
13.
14.
15.
16.
17.
18.
19.
20.
21.
22.
23.
24.
25.
26.
27.
28.
29.
30.
31.
32.
33.
34.
35.
36.
37.
38.
39.
Chap
ter 9
123
Quality of life after gastric banding
bodily pain, role limitations due to physical health problems, general health) or mental QoL
(role limitations due to personal or emotional problems, mental health, social functioning,
vitality). Regarding this diff erentiation, we could identify a trend towards more impairment in
mental domain scores in the postoperative group, whereas no diff erentiation could be made
in the preoperative group. Compared to norm data our preoperative and postoperative groups
scored lower on physical functioning, general health, bodily pain, social functioning, vitality,
and general health, social functioning, vitality, mental health respectively. This might indicate
that morbid obesity has a negative impact on both physical and mental QoL. However, a better
QoL after gastric banding compared to presurgical data was seen in one domain represent-
ing physical QoL: physical functioning. Seven domains, i.e. bodily pain, role limitations due
to physical health problems, role limitations due to personal or emotional problems, mental
health, social functioning and vitality, were not signifi cantly diff erent between the pre and
post surgery groups. This suggests that gastric banding has more impact on physical QoL than
mental QoL.
The central issue of the present study was to evaluate the long-term eff ect on QoL of suc-
cessful surgical treatment of morbid obesity. In our population, the results of gastric banding
in terms of weight loss are consistent with other studies concerning purely restrictive types
of bariatric surgery.4, 20, 28, 33, 34 Mean BMI declined signifi cantly from 44.9 ± 5.9 kg/m2 preop-
eratively to 33.3 ± 6.0 kg/m2 at follow-up, representing 56.1 ± 27.0% excess weight loss. Since
obesity is to blame for impaired QoL, improvement could be expected after bariatric surgery.
However, our study shows that despite a signifi cant diff erence in body weight, QoL at least 5
years after gastric banding is only slightly better than in patients not treated for morbid obesity
yet. This means, that after gastric banding, patients still experience impaired QoL comparable
to presurgical patients, though being successful in losing weight. One of the most important
explanations might be that despite signifi cant weight loss, our study population still fulfi ls the
criteria for obesity. Nevertheless, some studies report signifi cant improvement (scores even
exceeding norm values) shortly after surgery, in a period when substantial weight loss could
not be observed yet.7, 33 After longer follow-up, improvement in QoL seems to level off .7, 28,
33, 35 Additionally, both Waters et al. and Van Gemert et al. even report a decrease after 24 and
86 months respectively.13, 22 Due to the cross-sectional design of our study, we are not able to
comment on changes over time. Nevertheless, we conclude that after long-term follow-up the
results of gastric banding on QoL, despite persisting signifi cant weight reduction, are disap-
pointing.
Age was the most important determinant of quality of life in the population after gastric
banding, negatively infl uencing both physical and mental domains: physical functioning, social
functioning, role limitations due to physical or emotional problems, mental health, general
health and bodily pain. Sex did not infl uence QoL in our population. Additionally, presence of
comorbidity negatively infl uenced physical functioning, which could mostly be attributed to
joint pain rather than diabetes or hypertension.
1.
2.
3.
4.
5.
6.
7.
8.
9.
10.
11.
12.
13.
14.
15.
16.
17.
18.
19.
20.
21.
22.
23.
24.
25.
26.
27.
28.
29.
30.
31.
32.
33.
34.
35.
36.
37.
38.
39.
Chap
ter 9
124
Quality of life after gastric banding
Weight loss induced by gastric banding occurs in the fi rst few years after surgery, 13, 22, 33 and
could therefore be expected to have stabilised after fi ve years. Nevertheless, in our population
%EWL still signifi cantly infl uenced QoL (domain scores on role limitations due to emotional
problems, vitality and general health). This means, that the more weight patients lose after
gastric banding, the stronger their QoL improves, even after long-term follow-up. This state-
ment is supported by the fi nding that postoperative BMI accounts for some variance in QoL
as well. However, results from previous studies are inconsistent on this topic. Some authors
demonstrate a signifi cant eff ect of both BMI and %EWL, whereas others only show positive
infl uence of %EWL on physical domain scores.11, 13, 14, 19 Moreover, Dixon denied %EWL as being
a predictor for QoL after bariatric surgery.28 Based on our results, we conclude that more weight
loss and a lower postoperative BMI do positively infl uence long-term quality of life. Addition-
ally, after more than fi ve years of follow-up preoperative BMI does not infl uence QoL anymore.
Since both %EWL and BMI infl uence QoL, it could be expected that %WR has, on the
contrary, a negative infl uence on QoL. It is generally known that especially purely restrictive
types of bariatric surgery are associated with slight weight regain after the fi rst years of gradual
weight loss.9, 23 This phenomenon could theoretically be held responsible for at least some part
of decreasing QoL after long-term follow-up. In our study weight regain was substantially pres-
ent (23.9%), but it did not account for any negative infl uence on quality of life.
There are some limitations to the present study. In the fi rst place, the cross-sectional design
of the study does not allow us to draw conclusions on causality. Although the preoperative and
postoperative population are not signifi cantly diff erent except for characteristics resulting from
gastric banding (BMI and prevalence of diabetes), longitudinal studies are needed to evaluate
change in QoL after surgery. In the second place, response rates were 54% and 56% in the
follow-up and presurgical population respectively. Especially in studies concerning subjective
topics like quality of life, lower response rates might cause signifi cant bias. However, it is not
easy to predict in what way the fi nal results are infl uenced by this response bias. Then, a bias
could have been introduced by using self-reported weight to calculate weight regain. Errors in
reported weight, either deliberately or due to recall problems, might have led to misinterpreta-
tion of the relevance of weight regain in determining QoL. Additionally, group A and B were
signifi cantly diff erent in one domain. However, some additional domains display diff erences
between group A and B, which were not statistically signifi cantly diff erent. This might be due
to the relatively small sample size of the presurgical group (Fig. 1). Additional studies with
larger sample sizes are needed to establish possible diff erences where the present study might
have failed to. Finally, the Dutch community norm population diff ered from our postopera-
tive population in two respects. In the fi rst place, the female to male ratio was higher in our
study population, and since female sex is described to have a negative infl uence on quality of
life, this might have underestimated domain scores in our population.31 Nevertheless, we did
not demonstrate any signifi cant eff ect of sex on quality of life. In the second place, our study

1.
2.
3.
4.
5.
6.
7.
8.
9.
10.
11.
12.
13.
14.
15.
16.
17.
18.
19.
20.
21.
22.
23.
24.
25.
26.
27.
28.
29.
30.
31.
32.
33.
34.
35.
36.
37.
38.
39.
Chap
ter 9
125
Quality of life after gastric banding
population was slightly younger than the Dutch community norm population, which might on
the contrary have caused overestimation of domain scores in our population.
In conclusion, eff ects of gastric banding on quality of life after long-term follow-up are disap-
pointing: diff erences with preoperative quality of life are small - we only observed improvement
in physical functioning - and impairment in comparison to community norm values persist.
This corresponds with weight loss after bariatric surgery: weight decreases signifi cantly, but
patients will still be obese afterwards. Additionally, even after long-term follow-up weight loss
and postoperative BMI do infl uence quality of life, whereas weight regain does not have a nega-
tive impact on quality of life. The present study confi rms the relevance of describing results of
bariatric surgery in terms of quality of life rather than weight loss. To evaluate improvement of
quality of life immediately after surgery and possible deterioration after long-term follow-up
longitudinal studies in larger populations are needed.
1.
2.
3.
4.
5.
6.
7.
8.
9.
10.
11.
12.
13.
14.
15.
16.
17.
18.
19.
20.
21.
22.
23.
24.
25.
26.
27.
28.
29.
30.
31.
32.
33.
34.
35.
36.
37.
38.
39.
Chap
ter 9
126
Quality of life after gastric banding
REFERENCES
1 Ogden J, Clementi C, Aylwin S, Patel A. Exploring the impact of obesity surgery on patients’ health status: a quantitative and qualitative study. Obes Surg. 2005; 15: 266-72.
2 Evans A, Tolonen H, Hense HW, Ferrario M, Sans S, Kuulasmaa K. Trends in coronary risk factors in the WHO MONICA project. Int J Epidemiol. 2001; 30 Suppl 1: S35-40.
3 CBS. www.statline.cbs.nl. 4 Mathus-Vliegen EM, de Weerd S, de Wit LT. Health-related quality-of-life in patients with morbid
obesity after gastric banding for surgically induced weight loss. Surgery. 2004; 135: 489-97. 5 Weiner R, Datz M, Wagner D, Bockhorn H. Quality-of-life outcome after laparoscopic adjustable
gastric banding for morbid obesity. Obes Surg. 1999; 9: 539-45. 6 Lean ME, Han TS, Seidell JC. Impairment of health and quality of life using new US federal guidelines
for the identifi cation of obesity. Arch Intern Med. 1999; 159: 837-43. 7 Dymek MP, Le Grange D, Neven K, Alverdy J. Quality of life after gastric bypass surgery: a cross-
sectional study. Obes Res. 2002; 10: 1135-42. 8 Livingston EH, Fink AS. Quality of life: cost and future of bariatric surgery. Arch Surg. 2003; 138: 383-8. 9 Sarwer DB, Wadden TA, Fabricatore AN. Psychosocial and behavioral aspects of bariatric surgery. Obes
Res. 2005; 13: 639-48. 10 Wadden TA, Sarwer DB, Womble LG, Foster GD, McGuckin BG, Schimmel A. Psychosocial aspects of
obesity and obesity surgery. Surg Clin North Am. 2001; 81: 1001-24. 11 de Zwaan M, Lancaster KL, Mitchell JE, Howell LM, Monson N, Roerig JL, et al. Health-related quality of
life in morbidly obese patients: eff ect of gastric bypass surgery. Obes Surg. 2002; 12: 773-80. 12 de Zwaan M, Mitchell JE, Howell LM, Monson N, Swan-Kremeier L, Roerig JL, et al. Two measures of
health-related quality of life in morbid obesity. Obes Res. 2002; 10: 1143-51. 13 van Gemert WG, Adang EM, Greve JW, Soeters PB. Quality of life assessment of morbidly obese
patients: eff ect of weight-reducing surgery. Am J Clin Nutr. 1998; 67: 197-201. 14 Mathus-Vliegen EM, de Wit LT. Health-related quality of life after gastric banding. Br J Surg. 2007; 94:
457-65. 15 Poobalan A, Aucott L, Smith WC, Avenell A, Jung R, Broom J, et al. Eff ects of weight loss in overweight/
obese individuals and long-term lipid outcomes--a systematic review. Obes Rev. 2004; 5: 43-50. 16 Tuomilehto J, Lindstrom J, Eriksson JG, Valle TT, Hamalainen H, Ilanne-Parikka P, et al. Prevention of
type 2 diabetes mellitus by changes in lifestyle among subjects with impaired glucose tolerance. N Engl J Med. 2001; 344: 1343-50.
17 Mamplekou E, Komesidou V, Bissias C, Papakonstantinou A, Melissas J. Psychological condition and quality of life in patients with morbid obesity before and after surgical weight loss. Obes Surg. 2005; 15: 1177-84.
18 van Hout GC, Boekestein P, Fortuin FA, Pelle AJ, van Heck GL. Psychosocial functioning following bariatric surgery. Obes Surg. 2006; 16: 787-94.
19 Karlsson J, Sjostrom L, Sullivan M. Swedish obese subjects (SOS)--an intervention study of obesity. Two-year follow-up of health-related quality of life (HRQL) and eating behavior after gastric surgery for severe obesity. Int J Obes Relat Metab Disord. 1998; 22: 113-26.
20 Schok M, Geenen R, van Antwerpen T, de Wit P, Brand N, van Ramshorst B. Quality of life after laparo-scopic adjustable gastric banding for severe obesity: postoperative and retrospective preoperative evaluations. Obes Surg. 2000; 10: 502-8.
21 Dixon JB, Anderson M, Cameron-Smith D, O’Brien PE. Sustained weight loss in obese subjects has benefi ts that are independent of attained weight. Obes Res. 2004; 12: 1895-902.
22 Waters GS, Pories WJ, Swanson MS, Meelheim HD, Flickinger EG, May HJ. Long-term studies of mental health after the Greenville gastric bypass operation for morbid obesity. Am J Surg. 1991; 161: 154-7; discussion 57-8.
1.
2.
3.
4.
5.
6.
7.
8.
9.
10.
11.
12.
13.
14.
15.
16.
17.
18.
19.
20.
21.
22.
23.
24.
25.
26.
27.
28.
29.
30.
31.
32.
33.
34.
35.
36.
37.
38.
39.
Chap
ter 9
127
Quality of life after gastric banding
23 Waaddegaard P, Clemmesen T, Jess P. Vertical gastric banding for morbid obesity: a long-term follow-up study. Eur J Surg. 2002; 168: 220-2.
24 Kiewiet RM, Durian MF, van Leersum M, Hesp FL, van Vliet AC. Gallstone formation after weight loss following gastric banding in morbidly obese Dutch patients. Obes Surg. 2006; 16: 592-6.
25 Hays RD, Sherbourne CD, Mazel RM. The RAND 36-Item Health Survey 1.0. Health Econ. 1993; 2: 217-27. 26 Ballantyne GH. Measuring outcomes following bariatric surgery: weight loss parameters, improve-
ment in co-morbid conditions, change in quality of life and patient satisfaction. Obes Surg. 2003; 13: 954-64.
27 Callegari A, Michelini I, Sguazzin C, Catona A, Klersy C. Effi cacy of the SF-36 questionnaire in identify-ing obese patients with psychological discomfort. Obes Surg. 2005; 15: 254-60.
28 Dixon JB, Dixon ME, O’Brien PE. Quality of life after lap-band placement: infl uence of time, weight loss, and comorbidities. Obes Res. 2001; 9: 713-21.
29 Duval K, Marceau P, Lescelleur O, Hould FS, Marceau S, Biron S, et al. Health-related quality of life in morbid obesity. Obes Surg. 2006; 16: 574-9.
30 O’Brien PE, Dixon JB, Laurie C, Skinner S, Proietto J, McNeil J, et al. Treatment of mild to moderate obesity with laparoscopic adjustable gastric banding or an intensive medical program: a randomized trial. Ann Intern Med. 2006; 144: 625-33.
31 VanderZee KI, Sanderman R, Heyink JW, de Haes H. Psychometric qualities of the RAND 36-Item Health Survey 1.0: a multidimensional measure of general health status. Int J Behav Med. 1996; 3: 104-22.
32 Horchner R, Tuinebreijer W. Improvement of physical functioning of morbidly obese patients who have undergone a Lap-Band operation: one-year study. Obes Surg. 1999; 9: 399-402.
33 Freys SM, Tigges H, Heimbucher J, Fuchs KH, Fein M, Thiede A. Quality of life following laparoscopic gastric banding in patients with morbid obesity. J Gastrointest Surg. 2001; 5: 401-7.
34 Horchner R, Tuinebreijer MW, Kelder PH. Quality-of-life assessment of morbidly obese patients who have undergone a Lap-Band operation: 2-year follow-up study. Is the MOS SF-36 a useful instrument to measure quality of life in morbidly obese patients? Obes Surg. 2001; 11: 212-8; discussion 19.
35 Choban PS, Onyejekwe J, Burge JC, Flancbaum L. A health status assessment of the impact of weight loss following Roux-en-Y gastric bypass for clinically severe obesity. J Am Coll Surg. 1999; 188: 491-7.


General discussion, perspectives
and summary


Cha pter 10General Discussion

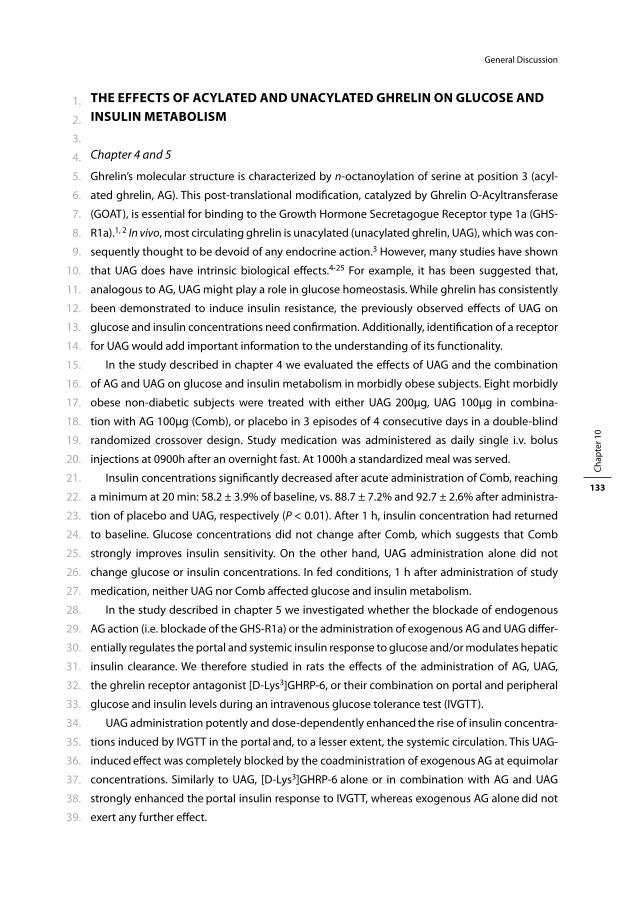
1.
2.
3.
4.
5.
6.
7.
8.
9.
10.
11.
12.
13.
14.
15.
16.
17.
18.
19.
20.
21.
22.
23.
24.
25.
26.
27.
28.
29.
30.
31.
32.
33.
34.
35.
36.
37.
38.
39.
Chap
ter 1
0
133
General Discussion
THE EFFECTS OF ACYLATED AND UNACYLATED GHRELIN ON GLUCOSE AND INSULIN METABOLISM
Chapter 4 and 5
Ghrelin’s molecular structure is characterized by n-octanoylation of serine at position 3 (acyl-
ated ghrelin, AG). This post-translational modifi cation, catalyzed by Ghrelin O-Acyltransferase
(GOAT), is essential for binding to the Growth Hormone Secretagogue Receptor type 1a (GHS-
R1a).1, 2 In vivo, most circulating ghrelin is unacylated (unacylated ghrelin, UAG), which was con-
sequently thought to be devoid of any endocrine action.3 However, many studies have shown
that UAG does have intrinsic biological eff ects.4-25 For example, it has been suggested that,
analogous to AG, UAG might play a role in glucose homeostasis. While ghrelin has consistently
been demonstrated to induce insulin resistance, the previously observed eff ects of UAG on
glucose and insulin concentrations need confi rmation. Additionally, identifi cation of a receptor
for UAG would add important information to the understanding of its functionality.
In the study described in chapter 4 we evaluated the eff ects of UAG and the combination
of AG and UAG on glucose and insulin metabolism in morbidly obese subjects. Eight morbidly
obese non-diabetic subjects were treated with either UAG 200μg, UAG 100μg in combina-
tion with AG 100μg (Comb), or placebo in 3 episodes of 4 consecutive days in a double-blind
randomized crossover design. Study medication was administered as daily single i.v. bolus
injections at 0900h after an overnight fast. At 1000h a standardized meal was served.
Insulin concentrations signifi cantly decreased after acute administration of Comb, reaching
a minimum at 20 min: 58.2 ± 3.9% of baseline, vs. 88.7 ± 7.2% and 92.7 ± 2.6% after administra-
tion of placebo and UAG, respectively (P < 0.01). After 1 h, insulin concentration had returned
to baseline. Glucose concentrations did not change after Comb, which suggests that Comb
strongly improves insulin sensitivity. On the other hand, UAG administration alone did not
change glucose or insulin concentrations. In fed conditions, 1 h after administration of study
medication, neither UAG nor Comb aff ected glucose and insulin metabolism.
In the study described in chapter 5 we investigated whether the blockade of endogenous
AG action (i.e. blockade of the GHS-R1a) or the administration of exogenous AG and UAG diff er-
entially regulates the portal and systemic insulin response to glucose and/or modulates hepatic
insulin clearance. We therefore studied in rats the eff ects of the administration of AG, UAG,
the ghrelin receptor antagonist [D-Lys3]GHRP-6, or their combination on portal and peripheral
glucose and insulin levels during an intravenous glucose tolerance test (IVGTT).
UAG administration potently and dose-dependently enhanced the rise of insulin concentra-
tions induced by IVGTT in the portal and, to a lesser extent, the systemic circulation. This UAG-
induced eff ect was completely blocked by the coadministration of exogenous AG at equimolar
concentrations. Similarly to UAG, [D-Lys3]GHRP-6 alone or in combination with AG and UAG
strongly enhanced the portal insulin response to IVGTT, whereas exogenous AG alone did not
exert any further eff ect.
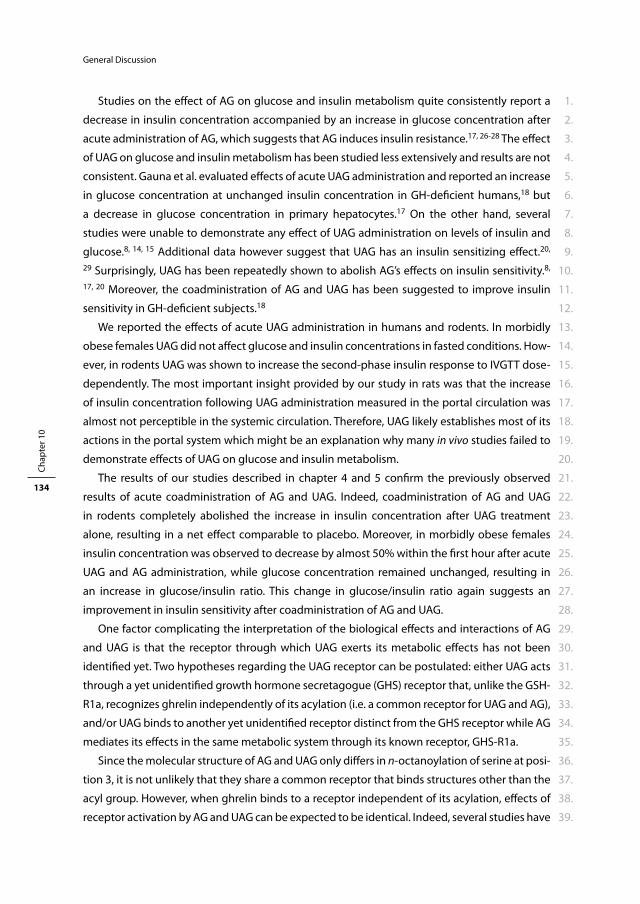
1.
2.
3.
4.
5.
6.
7.
8.
9.
10.
11.
12.
13.
14.
15.
16.
17.
18.
19.
20.
21.
22.
23.
24.
25.
26.
27.
28.
29.
30.
31.
32.
33.
34.
35.
36.
37.
38.
39.
Chap
ter 1
0
134
General Discussion
Studies on the eff ect of AG on glucose and insulin metabolism quite consistently report a
decrease in insulin concentration accompanied by an increase in glucose concentration after
acute administration of AG, which suggests that AG induces insulin resistance.17, 26-28 The eff ect
of UAG on glucose and insulin metabolism has been studied less extensively and results are not
consistent. Gauna et al. evaluated eff ects of acute UAG administration and reported an increase
in glucose concentration at unchanged insulin concentration in GH-defi cient humans,18 but
a decrease in glucose concentration in primary hepatocytes.17 On the other hand, several
studies were unable to demonstrate any eff ect of UAG administration on levels of insulin and
glucose.8, 14, 15 Additional data however suggest that UAG has an insulin sensitizing eff ect.20,
29 Surprisingly, UAG has been repeatedly shown to abolish AG’s eff ects on insulin sensitivity.8,
17, 20 Moreover, the coadministration of AG and UAG has been suggested to improve insulin
sensitivity in GH-defi cient subjects.18
We reported the eff ects of acute UAG administration in humans and rodents. In morbidly
obese females UAG did not aff ect glucose and insulin concentrations in fasted conditions. How-
ever, in rodents UAG was shown to increase the second-phase insulin response to IVGTT dose-
dependently. The most important insight provided by our study in rats was that the increase
of insulin concentration following UAG administration measured in the portal circulation was
almost not perceptible in the systemic circulation. Therefore, UAG likely establishes most of its
actions in the portal system which might be an explanation why many in vivo studies failed to
demonstrate eff ects of UAG on glucose and insulin metabolism.
The results of our studies described in chapter 4 and 5 confi rm the previously observed
results of acute coadministration of AG and UAG. Indeed, coadministration of AG and UAG
in rodents completely abolished the increase in insulin concentration after UAG treatment
alone, resulting in a net eff ect comparable to placebo. Moreover, in morbidly obese females
insulin concentration was observed to decrease by almost 50% within the fi rst hour after acute
UAG and AG administration, while glucose concentration remained unchanged, resulting in
an increase in glucose/insulin ratio. This change in glucose/insulin ratio again suggests an
improvement in insulin sensitivity after coadministration of AG and UAG.
One factor complicating the interpretation of the biological eff ects and interactions of AG
and UAG is that the receptor through which UAG exerts its metabolic eff ects has not been
identifi ed yet. Two hypotheses regarding the UAG receptor can be postulated: either UAG acts
through a yet unidentifi ed growth hormone secretagogue (GHS) receptor that, unlike the GSH-
R1a, recognizes ghrelin independently of its acylation (i.e. a common receptor for UAG and AG),
and/or UAG binds to another yet unidentifi ed receptor distinct from the GHS receptor while AG
mediates its eff ects in the same metabolic system through its known receptor, GHS-R1a.
Since the molecular structure of AG and UAG only diff ers in n-octanoylation of serine at posi-
tion 3, it is not unlikely that they share a common receptor that binds structures other than the
acyl group. However, when ghrelin binds to a receptor independent of its acylation, eff ects of
receptor activation by AG and UAG can be expected to be identical. Indeed, several studies have
1.
2.
3.
4.
5.
6.
7.
8.
9.
10.
11.
12.
13.
14.
15.
16.
17.
18.
19.
20.
21.
22.
23.
24.
25.
26.
27.
28.
29.
30.
31.
32.
33.
34.
35.
36.
37.
38.
39.
Chap
ter 1
0
135
General Discussion
demonstrated identical eff ects and signaling pathways of AG and UAG in cardiomyocytes,4 rat
adipose tissue,22 C2C12 skeletal myoblasts,16 HIT-T15 beta-cells,19 bone marrow adipocytes23
and osteoblasts.13 Most of these cells did not express GHS-R1a,4, 13, 16, 19, 22 and the eff ect of AG
and UAG was not shared with known synthetic GHS-R1a agonists,17, 20, 23 which suggests that
the observed actions are mediated by a receptor that is distinct from GHS-R1a.
However, UAG and AG do not always have corresponding eff ects. For example, as discussed
previously, they can have antagonistic eff ects on glucose metabolism.8, 17 This suggests that
in some metabolic processes UAG and AG have either antagonistic eff ects on one common
receptor or stimulate two diff erent receptors that generate antagonistic eff ects. Gauna et al.
have shown that AG’s eff ects on glucose and insulin concentrations are mediated by GHS-R1a,
since its action is blocked by GHS-R1a antagonists.30 On the other hand, UAG’s eff ects were not
blocked by GHS-R1a antagonists, suggesting that UAG mediates its eff ect through a diff erent
receptor.30 Additionally, Toshinai et al. demonstrated that intracerebroventricular administra-
tion of AG did not induce food intake in GHS-R1a defi cient mice, while UAG did stimulate feed-
ing in the same population, suggesting that the AG eff ect is mediated by GHS-R1a and the UAG
eff ect is mediated by a diff erent receptor.24
In our study described in chapter 5, we demonstrated that the GHS-R1a receptor antagonist
[D-Lys3]GHRP-6 strongly enhanced the portal insulin response to IVGTT. This eff ect is likely
the result of blockade of the inhibitory action of endogenous AG on beta-cells mediated by
GHS-R1a. Administration of UAG alone resulted in an enhanced portal insulin response which
was similar to that exerted by the GHS-R1a receptor blocker and was not aff ected by coad-
ministration with [D-Lys3]GHRP-6. These results again suggest that at least in some metabolic
systems AG’s eff ects are mediated by the GHS-R1a receptor, whereas UAG’s eff ects are mediated
through a diff erent presently unknown receptor.
Future directions
The pathophysiological basis of type 2 diabetes is an increase in insulin resistance. Therefore,
if either UAG or UAG+AG could indeed improve insulin sensitivity, this might be a promising
perspective in the treatment of type 2 diabetes. Presently, data on eff ects of continuous UAG
administration with or without AG are lacking, as are long-term results of this treatment. Addi-
tionally, since most studies have evaluated the eff ects of UAG (with or without AG) in fasted
conditions, studies in fed conditions should be performed. Finally, and most importantly,
studies on the eff ects in patients suff ering from type 2 diabetes are indicated. While a decrease
in insulin concentration unaccompanied by a change in glucose concentration suggests an
improvement in insulin sensitivity, clamp studies are needed to confi rm whether these changes
are indeed the result of an improvement in insulin sensitivity.
At present, interactions of AG and UAG are diffi cult to interpret: they seem to be functional
antagonists in some metabolic systems while in other systems their eff ect is similar. Identifi cation
1.
2.
3.
4.
5.
6.
7.
8.
9.
10.
11.
12.
13.
14.
15.
16.
17.
18.
19.
20.
21.
22.
23.
24.
25.
26.
27.
28.
29.
30.
31.
32.
33.
34.
35.
36.
37.
38.
39.
Chap
ter 1
0
136
General Discussion
of a UAG receptor (which might correspond to a second type of ghrelin receptor, as stated above)
could provide important insight into the regulation and interaction within the ghrelin system.
THE EFFECTS OF OBESTATIN ON GLUCOSE AND INSULIN METABOLISM.
Chapter 6
In 2005 Zhang et al. discovered a second peptide derived from the preproghrelin polypeptide.
Using a bioinformatic approach, they were able to identify a second conserved region in the
ghrelin gene, encoding a 23 amino acid peptide, which they called obestatin. Surprisingly,
acute intracerebroventricular and intraperitoneal administration of obestatin suppressed food
intake, while daily administration of obestatin suppressed body weight gain and induced
delayed gastric emptying. This implicated that obestatin was a functional peptide, and had
endogenous physiological eff ects acting as a full antagonist of ghrelin.31 Since ghrelin is known
to play an important role in glucose and insulin metabolism,17, 26, 28 it could be hypothesized
that obestatin does aff ect insulin and glucose secretion as well.
In the present study we evaluated the eff ects of obestatin on glucose and insulin metabolism
in the systemic and portal circulation. Obestatin 200 nmol/kg was administered systemically as
a single intravenous bolus injection to fasted pentobarbital anesthetized adult male Wistar rats.
Up to 50 min after administration, blood samples were taken to measure glucose and insulin
concentrations, both in the portal and in the systemic circulation. The eff ect of obestatin was
evaluated in fasted and in glucose-stimulated conditions (IVGTT) and compared to control
groups treated with vehicle or IVGTT, respectively.
The results can be described easily: intravenous administration of obestatin did not have
any eff ect on glucose and insulin concentrations, neither in the systemic nor in the portal
circulation, when compared to the control groups.
At fi rst, the discovery of obestatin seemed to open completely new perspectives on ghrelin
metabolism. For example, if indeed ghrelin and obestatin acted as full antagonists, this could be
a valid explanation why ghrelin (gene) defi cient (ghrl-/-) mice display such a mild phenotype.32
However, several serious issues questioning the physiological relevance of obestatin soon
arose. Since ghrelin and obestatin are coexpressed in the same cell types,31, 33, 34 which mecha-
nisms (post-translational or alternative splicing) account for production of either obestatin or
ghrelin and how is cosecretion avoided?35-38 Secondly, concentrations of obestatin, both in the
gastric fundus and in plasma, were very low compared to ghrelin concentrations, and half-life
of obestatin in circulation was very short.39, 40 Finally, obestatin was demonstrated not to infl u-
ence GH secretion, which is one of the most important functions of ghrelin.31
Nevertheless, several studies have been able to confi rm the original results of obestatin on
food intake,41, 42 while other studies showed that obestatin inhibited thirst, improved memory,
regulated sleep, aff ected cell proliferation, increased the secretion of pancreatic juice enzymes,

1.
2.
3.
4.
5.
6.
7.
8.
9.
10.
11.
12.
13.
14.
15.
16.
17.
18.
19.
20.
21.
22.
23.
24.
25.
26.
27.
28.
29.
30.
31.
32.
33.
34.
35.
36.
37.
38.
39.
Chap
ter 1
0
137
General Discussion
promoted survival of pancreatic β-cells, and aff ected glucose-induced insulin secretion.34,
43-53 On the other hand, at least as many studies failed to demonstrate any metabolic eff ect of
obestatin administration in diff erent areas.37, 39, 49, 54-66
The present study adds more negative data on the physiological and pharmacological role
of obestatin: intravenous administration of obestatin does not infl uence glucose and insulin
metabolism, neither systemic, nor in the portal circulation. So, we did not provide any con-
vincing evidence that obestatin is a functional product of the preproghrelin gene. It becomes
increasingly likely that the physiological relevance of obestatin is limited. The before mentioned
issues remain counter-intuitive regarding the characteristics of a physiologically relevant
peptide. Additionally, more negative than positive studies are presently available. Moreover,
some of the studies demonstrated positive results only under highly specifi c conditions, i.e.
anorexic eff ects were observed only with a specifi c diet,54 or with exact timing after obestatin
administration,67 and eff ects on glucose and insulin metabolism displayed a dual or U-shaped
dose-response curve.42, 53 Besides, the study describing a U-shaped dose-response curve was
recently retracted by the original authors due to lack of reproducibility of the data.68 Finally,
the original authors claimed that obestatin was the ligand for the orphan receptor GPR39,
which was convincingly proved to be invalid.57, 67, 69-71 However, one remark should be made:
commercially available obestatin peptides, as currently used in biomedical investigations, were
proven to be highly instable and the quality was claimed to be insuffi cient for in vivo and in vitro
experiments, which could be an explanation for the negative results.72, 73
Future directions
At present, the question whether obestatin is a functional hormone or a non-functional con-
nective peptide remains to be answered. This, however, seems easier said than done. Where
one positive study with results that can be replicated is generally enough to prove an eff ect, the
invalidation of a presumed biological eff ect demands a more thorough approach. At present,
the main points of criticism regarding the negative studies on obestatin are the low quality of
available obestatin samples (was it really obestatin that was used?) and its instability and short
half-life (did obestatin reach the intended site of action?). Besides, information on eff ective
doses is limited as well.
Therefore, additional dose-fi nding studies with obestatin of proven quality should be
performed, although a gold-standard that defi nes this quality is still lacking. Recovery studies
measuring obestatin concentration after administration could be of use. However, instability
of obestatin might underestimate recovered concentrations of obestatin. At fi rst, data should
be obtained on eff ects of obestatin in areas where functionality of ghrelin is widely known, i.e.
GH release, food intake, and glucose and insulin metabolism. If obestatin does not have any
physiological or pharmacological eff ect in these areas, clinical relevance of the peptide will
become increasingly unlikely, despite possible positive eff ects on memory and sleep.
1.
2.
3.
4.
5.
6.
7.
8.
9.
10.
11.
12.
13.
14.
15.
16.
17.
18.
19.
20.
21.
22.
23.
24.
25.
26.
27.
28.
29.
30.
31.
32.
33.
34.
35.
36.
37.
38.
39.
Chap
ter 1
0
138
General Discussion
THE EFFECTS OF ADMINISTRATION OF ACYLATED AND UNACYLATED GHRELIN ON TOTAL AND HIGH MOLECULAR WEIGHT ADIPONECTIN.
Chapter 7
Energy homeostasis and body weight are regulated by a highly complex network involving the
brain, the digestive tract and white adipose tissue (WAT). Hypothalamic neurons respond to
hormones, produced by either the gut (gut hormones) or WAT (adipokines), by modifying the
synthesis of neuropeptides that modulate food intake and energy balance.74 While pathways
connecting respectively WAT and the gut with the brain have been studied extensively, connec-
tions between WAT and the gut are largely unknown.
We evaluated the eff ects of acute intravenous administration of UAG and the combination
of AG and UAG on adiponectin concentration. Eight morbidly obese non-diabetic subjects
were treated with either UAG 200μg, UAG 100μg + AG 100μg (Comb), or placebo in 3 episodes
in a double blind randomized cross-over design. Study medication was administered as single
i.v. bolus injections at 09.00h after an overnight fast. High molecular weight (HMW) and total
adiponectin, glucose, insulin, and total and acylated ghrelin were measured up to one hour
after administration.
HMW and total adiponectin concentrations did not change after administration of either UAG
or Comb, nor were they diff erent from placebo. Insulin concentrations decreased signifi cantly
after acute administration of Comb, reaching a minimum at 20 min: 58.2 ± 3.9% of baseline.
As indicated above, direct connections between WAT and the gut are largely unknown. Stud-
ies reporting correlations between gut hormone concentrations and adipokine concentrations
add little information to our understanding of their interaction, since concentrations could well
be independently infl uenced by another common factor.75, 76 Few studies are available report-
ing eff ects of gut hormone administration on adipokine concentrations and vice versa (mostly
evaluating connections between leptin and ghrelin) and results are not always consistent. For
example, ghrelin mRNA expression in the stomach has been reported to be upregulated upon
leptin administration,77, 78 while other studies report a decrease of ghrelin concentrations at
high leptin levels.79-83 Additionally, intracerebroventricular administration of leptin and ghrelin
has been reported not to infl uence adiponectin levels,77 whereas leptin transgene expression
in the hypothalamus was demonstrated to reduce adiponectin concentrations (indicating
internal adipokine regulation).83
Another factor complicating the evaluation of interaction of the gut and WAT is the com-
plexity of the signalling network regulating energy balance. It could be hypothesized that
adipokines and gut hormones have local eff ects in resp. the gut and WAT, which is supported
by for example the identifi cation of the ghrelin receptor (GHS-R1a) in WAT and the ubiquitous
expression of the leptin receptor and adiponectin receptor.84-86 However, gut hormones and
adipokines could as well indirectly regulate each others concentrations. Namely, both gut
hormones and adipokines have centrally mediated eff ects on food intake, body composition
1.
2.
3.
4.
5.
6.
7.
8.
9.
10.
11.
12.
13.
14.
15.
16.
17.
18.
19.
20.
21.
22.
23.
24.
25.
26.
27.
28.
29.
30.
31.
32.
33.
34.
35.
36.
37.
38.
39.
Chap
ter 1
0
139
General Discussion
and glucose metabolism,6, 87-105 while on the other hand gut hormone concentrations and
adipokine concentrations are largely regulated by energy intake and body composition, which
is possibly mediated by insulin and glucose levels.78, 80, 85, 92, 106-114 Therefore, if any future
study identifi es eff ects of gut hormone administration on adipokine concentration vice versa,
it remains to be established whether it is a direct eff ect, i.e. eff ectuated locally in the gut or
WAT, or an indirect eff ect, i.e. mediated by central pathways or changes in glucose and insulin
concentrations.
We did not demonstrate any acute eff ect of either UAG or Comb on total and HMW adiponec-
tin concentrations, which makes our hypothesis of a direct eff ect of UAG or the combination of
AG and UAG on adiponectin less likely. Additionally, although adiponectin concentrations have
been shown to drop under hyperinsulinaemic conditions,85, 115 the presently observed prompt
and signifi cant decrease of insulin concentration did not acutely aff ect adiponectin concentra-
tions as well. Finally, since ghrelin is known to induce adiposity by stimulating hypothalamic
orexigenic pathways92, 94, 116 and adiponectin has been shown to be decreased in obesity,107,
111 ghrelin might have an indirect negative eff ect on adiponectin concentrations. However, it
is likely that this eff ect, if present, will not be observed within one hour after administration of
ghrelin. Therefore, we cannot comment on this relationship between ghrelin and adiponectin
based on the results of the present study.
Future directions
At present, there is no eff ective medical treatment for obesity available, despite all studies
on agonists acting on the anorexigenic adipokine pathways, on modifying actions of gut
hormones, and on antagonists of the orexigenic ghrelin pathways. One of the problems
encountered in the development of anti-obesity treatment based upon interference with the
homeostatic systems of the gastrointestinal tract, WAT and the brain, is the redundancy of
this network. Intervention in one pathway results in up or down regulation of other pathways
which eventually leads to stabilisation of body weight.74
Increasing knowledge of the pathways within this highly complex network might enable
the development of eff ective anti-obesity treatment by intervening in multiple pathways, such
as combining synergistically acting adipokines and gut hormones, which has been shown to
be highly eff ective in animal studies.117, 118 Therefore, it is important to identify connections
between the gut and WAT, since these are much less known than centrally acting pathways.
However, one should be aware of the possibility that gut hormones and adipokines might
communicate either directly on cellular level, or indirectly, by changes in insulin and glucose
concentrations or by infl uencing body composition via the brain. In vitro studies evaluating cel-
lular eff ects and local receptors could identify direct actions, while in vivo clamp studies could
evaluate eff ects independently of changes in insulin and glucose concentrations. Finally, since
changes in body composition are relatively slow processes, long-term studies are necessary to
evaluate eff ects mediated by changes in energy homeostasis.
1.
2.
3.
4.
5.
6.
7.
8.
9.
10.
11.
12.
13.
14.
15.
16.
17.
18.
19.
20.
21.
22.
23.
24.
25.
26.
27.
28.
29.
30.
31.
32.
33.
34.
35.
36.
37.
38.
39.
Chap
ter 1
0
140
General Discussion
CHOLELITHIASIS AFTER BARIATRIC SURGERY
Chapter 8
Rapid weight loss is an important risk factor for the development of gallstones. Therefore, it is
a major concern to everyone treating morbidly obese patients by bariatric surgery. However,
to be able to defi ne an eff ective management strategy, it is important to have insight into the
incidence of symptomatic and asymptomatic gallstones after bariatric surgery.
We evaluated a population of previously morbidly obese patients, who had been treated by
LAGB 1.3 to 8.5 years earlier, for the prevalence of symptomatic and asymptomatic gallstones.
None of the patients underwent prophylactic cholecystectomy, and ursodeoxycholic acid was
not prescribed, which enabled us to study long-term natural history of gallstone disease after
surgically induced weight loss. Additionally, we compared prevalence of gallstones in this
population with a morbidly obese population on a waiting list for bariatric surgery.
Our population of 120 patients had a maximum weight loss of 31.5 ± 11.3% of initial body
weight induced by LAGB. Sixteen patients had had cholecystectomy before LAGB, 5 afterwards.
Ninety-eight patients underwent transabdominal ultrasonography to evaluate the presence
of gallstones. Gallstones were detected in 26 (26.5%) of the subjects. Thus, the prevalence of
gallstones after LAGB was 31 (30.1%) in 103 patients at risk: 5 cases of symptomatic gallstones
who had already undergone cholecystectomy before participating in the study, and 26 cases
of gallstones detected on ultrasonography. Two patients in this group with apparently “silent”
gallstones reported complaints attributable to gallbladder disease and subsequently under-
went cholecystectomy. In contrast, the prevalence of gallstones in the morbidly obese popula-
tion on a waiting list for bariatric surgery was 13.3%. In conclusion, the prevalence of gallstones
after LAGB was 30.1%, of whom 22.5% became symptomatic (i.e. 6.8% of all patients at risk).
The prevalence of gallstones after LAGB was signifi cantly higher than before LAGB: 30.1% vs.
13.3%, which supports the hypothesis that signifi cant weight loss as a major risk factor for the
development of gallstones.
At present, there is no consensus about the management of gallstone formation after bar-
iatric surgery. Three diff erent policies have been advocated: i) to perform cholecystectomy in
all patients as a routine part of bariatric surgery,119-123 ii) to investigate for gallstones as a part
of the preoperative assessment and proceed to cholecystectomy if stones are present,124, 125 iii)
not to investigate routinely for gallstones, and then treating only symptomatic patients.126-130
Additionally, prophylactic treatment with ursodeoxycholic acid to prevent gallstone formation
after surgery has been proven to be eff ective.126, 131-133
Those who perform routine cholecystectomy in all patients state that their procedure adds
a mean operative time of 15 to 50 min but that hospital stay and perioperative morbidity and
mortality is not signifi cantly higher.119, 121-124 However, following this policy, the majority of
patients undergo surgery for a disease they will never develop. The management strategy of
performing preoperative ultrasonography and performing cholecystectomy during bariatric
1.
2.
3.
4.
5.
6.
7.
8.
9.
10.
11.
12.
13.
14.
15.
16.
17.
18.
19.
20.
21.
22.
23.
24.
25.
26.
27.
28.
29.
30.
31.
32.
33.
34.
35.
36.
37.
38.
39.
Chap
ter 1
0
141
General Discussion
surgery only in patients with gallstones seems to some extent irrational, regarding the results
of the present study, demonstrating that the majority of gallstones develops after surgery.
There is no data available that patients with gallstones before surgery are at a higher risk to
become symptomatic. No factors, other than previous complications of gallstones, seem to
predict complications of gallstones.134 Finally, those who propagate a wait-and-see policy
claim that there is no evidence to treat asymptomatic gallstones in morbidly obese patients
or patients after bariatric surgery diff erently from those in the general population, in which
cholecystectomy is only performed when symptoms are present.130 However, treatment of
symptomatic gallstones might be more diffi cult after bariatric surgery since the anatomical
changes resulting from surgery hinder the endoscopic treatment of gallstones, and laparos-
copy might be more diffi cult after previous surgery.120 Additionally, they risk severe morbidity
due to symptoms of cholelithiasis.
In contrast to most studies evaluating cholelithiasis shortly after bariatric surgery, the pres-
ent study evaluated patients with a mean follow-up of 4.6 years after surgery. In this period, 7
of 103 patients developed symptomatic gallstone disease, i.e. one case in 67.7 patient-years.
Cumulative risk to develop symptoms when having gallstones was 24.4% by 5 years. These
results are not signifi cantly diff erent from the general population.130, 135 Therefore, based on
the present results one could incline towards the wait-and-see policy. Conclusions about the
benefi t of treating patients with ursodeoxycholic acid could not be drawn.
Future directions
The present study does give insight into the prevalence of symptomatic and asymptomatic
gallstone disease after long-term follow-up after bariatric surgery. However, to better defi ne
the optimal management strategy concerning development of gallstone disease after bariatric
surgery, a clinical study comparing concomitant cholecystectomy with a wait-and-see policy
with or without ursodeoxycholic acid should be performed. Based on outcome regarding mor-
bidity (either as a result of concomitant cholecystectomy or of symptomatic gallstone disease),
mortality, and costs, an optimal policy can be established.
QUALITY OF LIFE AFTER BARIATRIC SURGERY
Chapter 9
In individuals suff ering from obesity, quality of life (QoL) is severely impaired compared to
the general population.136-139 It has been shown that bariatric surgery results in a signifi cant
improvement in QoL.137, 139-150 The most important improvement in QoL (up to normalisation
of QoL) is generally reported in the fi rst year after surgery.137, 142, 147 The few available long-term
follow-up studies, however, suggest that this improvement in QoL levels off or even reverts
toward preoperative levels starting from 2 years after surgery.144, 148, 150
1.
2.
3.
4.
5.
6.
7.
8.
9.
10.
11.
12.
13.
14.
15.
16.
17.
18.
19.
20.
21.
22.
23.
24.
25.
26.
27.
28.
29.
30.
31.
32.
33.
34.
35.
36.
37.
38.
39.
Chap
ter 1
0
142
General Discussion
We evaluated QoL in a population of previously morbidly obese patients, who had been
treated by LAGB. Of 120 participants, 59 patients met the criteria for long-term follow-up (i.e. >
5 years). Time since surgery in this subgroup was 74.7 months (range 60-107.6). We compared
QoL in this population with a morbidly obese population on a waiting list for bariatric surgery.
Additionally, we compared both study populations with Dutch community norm values (CN).
General and obesity-related parameters were assessed for correlation with QoL. QoL was mea-
sured using a generic questionnaire (RAND 36-Item Health Survey), which quantifi es QoL in
scores on 9 diff erent domains of physical and psychosocial functioning.151
As expected, QoL in the presurgical group was signifi cantly impaired compared to the Dutch
community: scores were lower on 6 out of 9 domains. However, in the postsurgical group, QoL
was only slightly better. Compared to CN, scores were still signifi cantly impaired on 4 out of 9
domains. Additionally, the postsurgical group scored better on only one domain compared to
the presurgical group.
Several determinants of QoL after long-term follow-up have been identifi ed in the present
study. Age, postoperative BMI and comorbidity have been demonstrated to negatively infl u-
ence QoL, while excess weight loss positively infl uences several domains of QoL. Sex, preopera-
tive BMI, weight regain and the time since surgery did not correlate with any scores of QoL.
The present study confi rms the limited eff ect of LAGB on QoL at long-term follow-up, which
is in accordance with the few available studies on this subject.144, 148, 150 In contrast with the
reported signifi cant improvement shortly after surgery,137, 142, 144, 145, 147 QoL appeared to
decrease with time, reverting towards preoperative levels to the extent that changes were
no longer signifi cant. These results are disappointing, since at present bariatric surgery is the
most eff ective treatment for obesity in terms of persistent weight loss and improvement in
comorbidity.152-154 Therefore, it is important to establish why long-term eff ect on QoL is limited,
in contrast to weight reduction and improvement in comorbidity.
Several explanations for long-term decrease of QoL have been suggested. At fi rst, since
decrease in QoL is generally reported from two years after surgery (the moment that the curve
of weight loss levels off and eventually inverts), weight regain was hypothesized to be an
important factor.148-150 Secondly, it could be the result of waning optimism in a period of weight
stabilization, disappointment about only limited improvement in everyday life or persistence
of pre-surgical problems not related to body weight.149, 150 Finally, it is possible that patients
partly depend on frequent medical and emotional support from their clinic visits to improve
psychologically.150 Unfortunately, defi nite conclusions cannot be drawn yet.
On the other hand, QoL can improve early after bariatric surgery: signifi cant improvement
has been observed as early as 2 to 4 weeks postoperatively, while weight loss in this period
is almost negligible.142 Interestingly, good explanations for this unexpected fi nding have not
been provided yet. It could be hypothesized that patients regard the moment of surgery as a
fi nal resolution of their life-long problem or that the waiting list for surgery is simply too long.
1.
2.
3.
4.
5.
6.
7.
8.
9.
10.
11.
12.
13.
14.
15.
16.
17.
18.
19.
20.
21.
22.
23.
24.
25.
26.
27.
28.
29.
30.
31.
32.
33.
34.
35.
36.
37.
38.
39.
Chap
ter 1
0
143
General Discussion
The present study confi rms that at long-term follow-up after LAGB, QoL is signifi cantly
worse than Dutch norm data. Indeed, QoL is only slightly better compared to morbidly obese
persons who have not yet undergone surgery. The study identifi ed several parameters infl uenc-
ing QoL (age, comorbidity, BMI and percentage excess weight loss) but these parameters do
not establish a good explanation for a decrease in QoL at long-term follow-up.
Future directions
At present, it is unclear why QoL increases rapidly after bariatric surgery, while a decrease
(back to preoperative levels) is observed at long-term follow-up. Valid explanations for both
phenomena are necessary, since our present management of patients undergoing bariatric
surgery appears not to provide them with a gradual and persistent improvement in QoL. QoL
is highly subjective, which makes eff ective and valid evaluations diffi cult. However, answers to
questions like ‘do we need to provide patients with more realistic expectations preoperatively?’
or ‘do we need to intensify long-term follow-up treatment?’ are urgently needed.
1.
2.
3.
4.
5.
6.
7.
8.
9.
10.
11.
12.
13.
14.
15.
16.
17.
18.
19.
20.
21.
22.
23.
24.
25.
26.
27.
28.
29.
30.
31.
32.
33.
34.
35.
36.
37.
38.
39.
Chap
ter 1
0
144
General Discussion
REFERENCES
1 Kojima M, Hosoda H, Date Y, Nakazato M, Matsuo H, Kangawa K. Ghrelin is a growth-hormone-releasing acylated peptide from stomach. Nature. 1999; 402: 656-60.
2 Yang J, Brown MS, Liang G, Grishin NV, Goldstein JL. Identifi cation of the acyltransferase that octanoylates ghrelin, an appetite-stimulating peptide hormone. Cell. 2008; 132: 387-96.
3 Hosoda H, Kojima M, Matsuo H, Kangawa K. Ghrelin and des-acyl ghrelin: two major forms of rat ghrelin peptide in gastrointestinal tissue. Biochem Biophys Res Commun. 2000; 279: 909-13.
4 Baldanzi G, Filigheddu N, Cutrupi S, Catapano F, Bonissoni S, Fubini A, et al. Ghrelin and des-acyl ghrelin inhibit cell death in cardiomyocytes and endothelial cells through ERK1/2 and PI 3-kinase/AKT. J Cell Biol. 2002; 159: 1029-37.
5 Ariyasu H, Takaya K, Iwakura H, Hosoda H, Akamizu T, Arai Y, et al. Transgenic mice overexpressing des-acyl ghrelin show small phenotype. Endocrinology. 2005; 146: 355-64.
6 Asakawa A, Inui A, Fujimiya M, Sakamaki R, Shinfuku N, Ueta Y, et al. Stomach regulates energy bal-ance via acylated ghrelin and desacyl ghrelin. Gut. 2005; 54: 18-24.
7 Bedendi I, Alloatti G, Marcantoni A, Malan D, Catapano F, Ghe C, et al. Cardiac eff ects of ghrelin and its endogenous derivatives des-octanoyl ghrelin and des-Gln14-ghrelin. Eur J Pharmacol. 2003; 476: 87-95.
8 Broglio F, Gottero C, Prodam F, Gauna C, Muccioli G, Papotti M, et al. Non-acylated ghrelin counteracts the metabolic but not the neuroendocrine response to acylated ghrelin in humans. J Clin Endocrinol Metab. 2004; 89: 3062-5.
9 Cassoni P, Ghe C, Marrocco T, Tarabra E, Allia E, Catapano F, et al. Expression of ghrelin and biologi-cal activity of specifi c receptors for ghrelin and des-acyl ghrelin in human prostate neoplasms and related cell lines. Eur J Endocrinol. 2004; 150: 173-84.
10 Cassoni P, Papotti M, Ghe C, Catapano F, Sapino A, Graziani A, et al. Identifi cation, characterization, and biological activity of specifi c receptors for natural (ghrelin) and synthetic growth hormone secretagogues and analogs in human breast carcinomas and cell lines. J Clin Endocrinol Metab. 2001; 86: 1738-45.
11 Chen CY, Chao Y, Chang FY, Chien EJ, Lee SD, Doong ML. Intracisternal des-acyl ghrelin inhibits food intake and non-nutrient gastric emptying in conscious rats. Int J Mol Med. 2005; 16: 695-9.
12 Chen CY, Inui A, Asakawa A, Fujino K, Kato I, Chen CC, et al. Des-acyl ghrelin acts by CRF type 2 recep-tors to disrupt fasted stomach motility in conscious rats. Gastroenterology. 2005; 129: 8-25.
13 Delhanty PJ, van der Eerden BC, van der Velde M, Gauna C, Pols HA, Jahr H, et al. Ghrelin and unacyl-ated ghrelin stimulate human osteoblast growth via mitogen-activated protein kinase (MAPK)/phosphoinositide 3-kinase (PI3K) pathways in the absence of GHS-R1a. J Endocrinol. 2006; 188: 37-47.
14 Dezaki K, Hosoda H, Kakei M, Hashiguchi S, Watanabe M, Kangawa K, et al. Endogenous ghrelin in pancreatic islets restricts insulin release by attenuating Ca2+ signaling in beta-cells: implication in the glycemic control in rodents. Diabetes. 2004; 53: 3142-51.
15 Dezaki K, Sone H, Koizumi M, Nakata M, Kakei M, Nagai H, et al. Blockade of pancreatic islet-derived ghrelin enhances insulin secretion to prevent high-fat diet-induced glucose intolerance. Diabetes. 2006; 55: 3486-93.
16 Filigheddu N, Gnocchi VF, Coscia M, Cappelli M, Porporato PE, Taulli R, et al. Ghrelin and des-acyl ghre-lin promote diff erentiation and fusion of C2C12 skeletal muscle cells. Mol Biol Cell. 2007; 18: 986-94.
17 Gauna C, Delhanty PJ, Hofl and LJ, Janssen JA, Broglio F, Ross RJ, et al. Ghrelin stimulates, whereas des-octanoyl ghrelin inhibits, glucose output by primary hepatocytes. J Clin Endocrinol Metab. 2005; 90: 1055-60.
18 Gauna C, Meyler FM, Janssen JA, Delhanty PJ, Abribat T, van Koetsveld P, et al. Administration of acyl-ated ghrelin reduces insulin sensitivity, whereas the combination of acylated plus unacylated ghrelin strongly improves insulin sensitivity. J Clin Endocrinol Metab. 2004; 89: 5035-42.
1.
2.
3.
4.
5.
6.
7.
8.
9.
10.
11.
12.
13.
14.
15.
16.
17.
18.
19.
20.
21.
22.
23.
24.
25.
26.
27.
28.
29.
30.
31.
32.
33.
34.
35.
36.
37.
38.
39.
Chap
ter 1
0
145
General Discussion
19 Granata R, Settanni F, Biancone L, Trovato L, Nano R, Bertuzzi F, et al. Acylated and unacylated ghrelin promote proliferation and inhibit apoptosis of pancreatic beta-cells and human islets: involvement of 3’,5’-cyclic adenosine monophosphate/protein kinase A, extracellular signal-regulated kinase 1/2, and phosphatidyl inositol 3-Kinase/Akt signaling. Endocrinology. 2007; 148: 512-29.
20 Heijboer AC, van den Hoek AM, Parlevliet ET, Havekes LM, Romijn JA, Pijl H, et al. Ghrelin diff erentially aff ects hepatic and peripheral insulin sensitivity in mice. Diabetologia. 2006; 49: 732-8.
21 Inhoff T, Monnikes H, Noetzel S, Stengel A, Goebel M, Dinh QT, et al. Desacyl ghrelin inhibits the orexigenic eff ect of peripherally injected ghrelin in rats. Peptides. 2008; 29: 2159-68.
22 Muccioli G, Pons N, Ghe C, Catapano F, Granata R, Ghigo E. Ghrelin and des-acyl ghrelin both inhibit isoproterenol-induced lipolysis in rat adipocytes via a non-type 1a growth hormone secretagogue receptor. Eur J Pharmacol. 2004; 498: 27-35.
23 Thompson NM, Gill DA, Davies R, Loveridge N, Houston PA, Robinson IC, et al. Ghrelin and des-octanoyl ghrelin promote adipogenesis directly in vivo by a mechanism independent of the type 1a growth hormone secretagogue receptor. Endocrinology. 2004; 145: 234-42.
24 Toshinai K, Yamaguchi H, Sun Y, Smith RG, Yamanaka A, Sakurai T, et al. Des-acyl ghrelin induces food intake by a mechanism independent of the growth hormone secretagogue receptor. Endocrinology. 2006; 147: 2306-14.
25 Zhang W, Chai B, Li JY, Wang H, Mulholland MW. Eff ect of des-acyl ghrelin on adiposity and glucose metabolism. Endocrinology. 2008; 149: 4710-6.
26 Broglio F, Arvat E, Benso A, Gottero C, Muccioli G, Papotti M, et al. Ghrelin, a natural GH secretagogue produced by the stomach, induces hyperglycemia and reduces insulin secretion in humans. J Clin Endocrinol Metab. 2001; 86: 5083-6.
27 Guido M, Romualdi D, De Marinis L, Porcelli T, Giuliani M, Costantini B, et al. Administration of exog-enous ghrelin in obese patients with polycystic ovary syndrome: eff ects on plasma levels of growth hormone, glucose, and insulin. Fertil Steril. 2007; 88: 125-30.
28 Vestergaard ET, Djurhuus CB, Gjedsted J, Nielsen S, Moller N, Holst JJ, et al. Acute eff ects of ghrelin administration on glucose and lipid metabolism. J Clin Endocrinol Metab. 2008; 93: 438-44.
29 van der Lely AJ. Ghrelin and new metabolic frontiers. Horm Res. 2009; 71 Suppl 1: 129-33. 30 Gauna C, Delhanty PJ, van Aken MO, Janssen JA, Themmen AP, Hofl and LJ, et al. Unacylated ghrelin
is active on the INS-1E rat insulinoma cell line independently of the growth hormone secretagogue receptor type 1a and the corticotropin releasing factor 2 receptor. Mol Cell Endocrinol. 2006; 251: 103-11.
31 Zhang JV, Ren PG, Avsian-Kretchmer O, Luo CW, Rauch R, Klein C, et al. Obestatin, a peptide encoded by the ghrelin gene, opposes ghrelin’s eff ects on food intake. Science. 2005; 310: 996-9.
32 Wortley KE, Anderson KD, Garcia K, Murray JD, Malinova L, Liu R, et al. Genetic deletion of ghrelin does not decrease food intake but infl uences metabolic fuel preference. Proc Natl Acad Sci U S A. 2004; 101: 8227-32.
33 Chanoine JP, Wong AC, Barrios V. Obestatin, acylated and total ghrelin concentrations in the perinatal rat pancreas. Horm Res. 2006; 66: 81-8.
34 Granata R, Settanni F, Gallo D, Trovato L, Biancone L, Cantaluppi V, et al. Obestatin promotes survival of pancreatic beta-cells and human islets and induces expression of genes involved in the regulation of beta-cell mass and function. Diabetes. 2008; 57: 967-79.
35 Garg A. The ongoing saga of obestatin: is it a hormone? J Clin Endocrinol Metab. 2007; 92: 3396-8. 36 Seim I, Collet C, Herington AC, Chopin LK. Revised genomic structure of the human ghrelin gene
and identifi cation of novel exons, alternative splice variants and natural antisense transcripts. BMC Genomics. 2007; 8: 298.
37 Unniappan S, Speck M, Kieff er TJ. Metabolic eff ects of chronic obestatin infusion in rats. Peptides. 2008; 29: 1354-61.
38 Volante M, Rosas R, Ceppi P, Rapa I, Cassoni P, Wiedenmann B, et al. Obestatin in human neuroendo-crine tissues and tumours: expression and eff ect on tumour growth. J Pathol. 2009; 218: 458-66.
1.
2.
3.
4.
5.
6.
7.
8.
9.
10.
11.
12.
13.
14.
15.
16.
17.
18.
19.
20.
21.
22.
23.
24.
25.
26.
27.
28.
29.
30.
31.
32.
33.
34.
35.
36.
37.
38.
39.
Chap
ter 1
0
146
General Discussion
39 Mondal MS, Toshinai K, Ueno H, Koshinaka K, Nakazato M. Characterization of obestatin in rat and human stomach and plasma, and its lack of acute eff ect on feeding behavior in rodents. J Endocrinol. 2008; 198: 339-46.
40 Pan W, Tu H, Kastin AJ. Diff erential BBB interactions of three ingestive peptides: obestatin, ghrelin, and adiponectin. Peptides. 2006; 27: 911-6.
41 Green BD, Irwin N, Flatt PR. Direct and indirect eff ects of obestatin peptides on food intake and the regulation of glucose homeostasis and insulin secretion in mice. Peptides. 2007; 28: 981-7.
42 Lagaud GJ, Young A, Acena A, Morton MF, Barrett TD, Shankley NP. Obestatin reduces food intake and suppresses body weight gain in rodents. Biochem Biophys Res Commun. 2007; 357: 264-9.
43 Camina JP, Campos JF, Caminos JE, Dieguez C, Casanueva FF. Obestatin-mediated proliferation of human retinal pigment epithelial cells: regulatory mechanisms. J Cell Physiol. 2007; 211: 1-9.
44 Carlini VP, Schioth HB, Debarioglio SR. Obestatin improves memory performance and causes anxio-lytic eff ects in rats. Biochem Biophys Res Commun. 2007; 352: 907-12.
45 Kapica M, Zabielska M, Puzio I, Jankowska A, Kato I, Kuwahara A, et al. Obestatin stimulates the secre-tion of pancreatic juice enzymes through a vagal pathway in anaesthetized rats - preliminary results. J Physiol Pharmacol. 2007; 58 Suppl 3: 123-30.
46 Meszarosova M, Sirotkin AV, Grossmann R, Darlak K, Valenzuela F. The eff ect of obestatin on porcine ovarian granulosa cells. Anim Reprod Sci. 2008; 108: 196-207.
47 Pazos Y, Alvarez CJ, Camina JP, Casanueva FF. Stimulation of extracellular signal-regulated kinases and proliferation in the human gastric cancer cells KATO-III by obestatin. Growth Factors. 2007; 25: 373-81.
48 Qader SS, Hakanson R, Rehfeld JF, Lundquist I, Salehi A. Proghrelin-derived peptides infl uence the secretion of insulin, glucagon, pancreatic polypeptide and somatostatin: a study on isolated islets from mouse and rat pancreas. Regul Pept. 2008; 146: 230-7.
49 Ren AJ, Guo ZF, Wang YK, Lin L, Zheng X, Yuan WJ. Obestatin, obesity and diabetes. Peptides. 2009; 30: 439-44.
50 Ren AJ, Guo ZF, Wang YK, Wang LG, Wang WZ, Lin L, et al. Inhibitory eff ect of obestatin on glucose-induced insulin secretion in rats. Biochem Biophys Res Commun. 2008; 369: 969-72.
51 Samson WK, White MM, Price C, Ferguson AV. Obestatin acts in brain to inhibit thirst. Am J Physiol Regul Integr Comp Physiol. 2007; 292: R637-43.
52 Szentirmai E, Krueger JM. Obestatin alters sleep in rats. Neurosci Lett. 2006; 404: 222-6. 53 Egido EM, Hernandez R, Marco J, Silvestre RA. Eff ect of obestatin on insulin, glucagon and somatosta-
tin secretion in the perfused rat pancreas. Regul Pept. 2009; 152: 61-6. 54 Brunetti L, Leone S, Orlando G, Recinella L, Ferrante C, Chiavaroli A, et al. Eff ects of obestatin on feed-
ing and body weight after standard or cafeteria diet in the rat. Peptides. 2009; 30: 1323-7. 55 Depoortere I, Thijs T, Moechars D, De Smet B, Ver Donck L, Peeters TL. Eff ect of peripheral obestatin on
food intake and gastric emptying in ghrelin-knockout mice. Br J Pharmacol. 2008; 153: 1550-7. 56 Gourcerol G, Coskun T, Craft LS, Mayer JP, Heiman ML, Wang L, et al. Preproghrelin-derived peptide,
obestatin, fails to infl uence food intake in lean or obese rodents. Obesity (Silver Spring). 2007; 15: 2643-52. 57 Holst B, Egerod KL, Schild E, Vickers SP, Cheetham S, Gerlach LO, et al. GPR39 signaling is stimulated by
zinc ions but not by obestatin. Endocrinology. 2007; 148: 13-20. 58 Nogueiras R, Pfl uger P, Tovar S, Arnold M, Mitchell S, Morris A, et al. Eff ects of obestatin on energy
balance and growth hormone secretion in rodents. Endocrinology. 2007; 148: 21-6. 59 Seoane LM, Al-Massadi O, Pazos Y, Pagotto U, Casanueva FF. Central obestatin administration does
not modify either spontaneous or ghrelin-induced food intake in rats. J Endocrinol Invest. 2006; 29: RC13-5.
60 Yamamoto D, Ikeshita N, Daito R, Herningtyas EH, Toda K, Takahashi K, et al. Neither intravenous nor intracerebroventricular administration of obestatin aff ects the secretion of GH, PRL, TSH and ACTH in rats. Regul Pept. 2007; 138: 141-4.
61 Zizzari P, Longchamps R, Epelbaum J, Bluet-Pajot MT. Obestatin partially aff ects ghrelin stimulation of food intake and growth hormone secretion in rodents. Endocrinology. 2007; 148: 1648-53.

1.
2.
3.
4.
5.
6.
7.
8.
9.
10.
11.
12.
13.
14.
15.
16.
17.
18.
19.
20.
21.
22.
23.
24.
25.
26.
27.
28.
29.
30.
31.
32.
33.
34.
35.
36.
37.
38.
39.
Chap
ter 1
0
147
General Discussion
62 Annemie VD, Debby VD, Valentijn V, Bart de S, Walter L, Liliane S, et al. Central administration of obestatin fails to show inhibitory eff ects on food and water intake in mice. Regul Pept. 2009; 156: 77-82.
63 De Smet B, Thijs T, Peeters TL, Depoortere I. Eff ect of peripheral obestatin on gastric emptying and intestinal contractility in rodents. Neurogastroenterol Motil. 2007; 19: 211-7.
64 Kobelt P, Wisser AS, Stengel A, Goebel M, Bannert N, Gourcerol G, et al. Peripheral obestatin has no eff ect on feeding behavior and brain Fos expression in rodents. Peptides. 2008; 29: 1018-27.
65 Li ZF, Song SW, Qin YW, Zhang JL, Zhao XX, Zhang BL, et al. Bolus intravenous injection of obestatin does not change blood pressure level of spontaneously hypertensive rat. Peptides. 2009; 30: 1928-30.
66 Rucinski M, Ziolkowska A, Tyczewska M, Malendowicz LK. Expression of prepro-ghrelin and related receptor genes in the rat adrenal gland and evidences that ghrelin exerts a potent stimulating eff ect on corticosterone secretion by cultured rat adrenocortical cells. Peptides. 2009; 30: 1448-55.
67 Zhang JV, Klein C, Ren PG, Kass S, Donck LV, Moechars D et al. Response to comment on Obestatin, a peptide encoded by the ghrelin gene oposes ghrelin’s eff ects on food intake. Science. 2007; 315: 766.
68 Retracted notice to: “Obestatin reduces food intake and suppresses body weight gain in rodents” [Bio-chem. Biophys. Res. Commun. 357(1) (2007) 264-269]. Biochem Biophys Res Commun. 2009; 388: 619.
69 Chartrel N, Alvear-Perez R, Leprince J, Iturrioz X, Reaux-Le Goazigo A, Audinot V, et al. Comment on “Obestatin, a peptide encoded by the ghrelin gene, opposes ghrelin’s eff ects on food intake”. Science. 2007; 315: 766; author reply 66.
70 Lauwers E, Landuyt B, Arckens L, Schoofs L, Luyten W. Obestatin does not activate orphan G protein-coupled receptor GPR39. Biochem Biophys Res Commun. 2006; 351: 21-5.
71 Tremblay F, Perreault M, Klaman LD, Tobin JF, Smith E, Gimeno RE. Normal food intake and body weight in mice lacking the G protein-coupled receptor GPR39. Endocrinology. 2007; 148: 501-6.
72 De Spiegeleer B, Vergote V, Pezeshki A, Peremans K, Burvenich C. Impurity profi ling quality control testing of synthetic peptides using liquid chromatography-photodiode array-fl uorescence and liquid chromatography-electrospray ionization-mass spectrometry: the obestatin case. Anal Biochem. 2008; 376: 229-34.
73 Vergote V, Van Dorpe S, Peremans K, Burvenich C, De Spiegeleer B. In vitro metabolic stability of obestatin: kinetics and identifi cation of cleavage products. Peptides. 2008; 29: 1740-8.
74 Wynne K, Stanley S, McGowan B, Bloom S. Appetite control. J Endocrinol. 2005; 184: 291-318. 75 Kempa A, Krzyzanowska-Swiniarska B, Miazgowski T, Pilarska K. Not insulin but insulin sensitivity,
leptin, and cortisol are major factors regulating serum acylated ghrelin level in healthy women. J Endocrinol Invest. 2007; 30: 659-65.
76 Tolle V, Kadem M, Bluet-Pajot MT, Frere D, Foulon C, Bossu C, et al. Balance in ghrelin and leptin plasma levels in anorexia nervosa patients and constitutionally thin women. J Clin Endocrinol Metab. 2003; 88: 109-16.
77 Kim MS, Namkoong C, Kim HS, Jang PG, Kim Pak YM, Katakami H, et al. Chronic central administration of ghrelin reverses the eff ects of leptin. Int J Obes Relat Metab Disord. 2004; 28: 1264-71.
78 Toshinai K, Mondal MS, Nakazato M, Date Y, Murakami N, Kojima M, et al. Upregulation of Ghrelin expression in the stomach upon fasting, insulin-induced hypoglycemia, and leptin administration. Biochem Biophys Res Commun. 2001; 281: 1220-5.
79 Barazzoni R, Zanetti M, Stebel M, Biolo G, Cattin L, Guarnieri G. Hyperleptinemia prevents increased plasma ghrelin concentration during short-term moderate caloric restriction in rats. Gastroenterol-ogy. 2003; 124: 1188-92.
80 Kalra SP, Ueno N, Kalra PS. Stimulation of appetite by ghrelin is regulated by leptin restraint: periph-eral and central sites of action. J Nutr. 2005; 135: 1331-5.
81 Kamegai J, Tamura H, Shimizu T, Ishii S, Sugihara H, Oikawa S. Eff ects of insulin, leptin, and glucagon on ghrelin secretion from isolated perfused rat stomach. Regul Pept. 2004; 119: 77-81.
1.
2.
3.
4.
5.
6.
7.
8.
9.
10.
11.
12.
13.
14.
15.
16.
17.
18.
19.
20.
21.
22.
23.
24.
25.
26.
27.
28.
29.
30.
31.
32.
33.
34.
35.
36.
37.
38.
39.
Chap
ter 1
0
148
General Discussion
82 Lejeune MP, Hukshorn CJ, Saris WH, Westerterp-Plantenga MS. Eff ects of very low calorie diet induced body weight loss with or without human pegylated recombinant leptin treatment on changes in ghrelin and adiponectin concentrations. Physiol Behav. 2007; 91: 274-80.
83 Ueno N, Dube MG, Inui A, Kalra PS, Kalra SP. Leptin modulates orexigenic eff ects of ghrelin and attenuates adiponectin and insulin levels and selectively the dark-phase feeding as revealed by central leptin gene therapy. Endocrinology. 2004; 145: 4176-84.
84 Gnanapavan S, Kola B, Bustin SA, Morris DG, McGee P, Fairclough P, et al. The tissue distribution of the mRNA of ghrelin and subtypes of its receptor, GHS-R, in humans. J Clin Endocrinol Metab. 2002; 87: 2988.
85 Kadowaki T, Yamauchi T. Adiponectin and adiponectin receptors. Endocr Rev. 2005; 26: 439-51. 86 Ahima RS, Osei SY. Leptin signaling. Physiol Behav. 2004; 81: 223-41. 87 Larsen PJ, Tang-Christensen M, Jessop DS. Central administration of glucagon-like peptide-1 activates
hypothalamic neuroendocrine neurons in the rat. Endocrinology. 1997; 138: 4445-55. 88 Lutz TA, Mollet A, Rushing PA, Riediger T, Scharrer E. The anorectic eff ect of a chronic peripheral infu-
sion of amylin is abolished in area postrema/nucleus of the solitary tract (AP/NTS) lesioned rats. Int J Obes Relat Metab Disord. 2001; 25: 1005-11.
89 Murphy KG, Dhillo WS, Bloom SR. Gut peptides in the regulation of food intake and energy homeosta-sis. Endocr Rev. 2006; 27: 719-27.
90 Nogueiras R, Lopez M, Dieguez C. Regulation of lipid metabolism by energy availability: a role for the central nervous system. Obes Rev. 2009.
91 Batterham RL, Cowley MA, Small CJ, Herzog H, Cohen MA, Dakin CL, et al. Gut hormone PYY(3-36) physiologically inhibits food intake. Nature. 2002; 418: 650-4.
92 Nakazato M, Murakami N, Date Y, Kojima M, Matsuo H, Kangawa K, et al. A role for ghrelin in the central regulation of feeding. Nature. 2001; 409: 194-8.
93 Shintani M, Ogawa Y, Ebihara K, Aizawa-Abe M, Miyanaga F, Takaya K, et al. Ghrelin, an endogenous growth hormone secretagogue, is a novel orexigenic peptide that antagonizes leptin action through the activation of hypothalamic neuropeptide Y/Y1 receptor pathway. Diabetes. 2001; 50: 227-32.
94 Tschop M, Smiley DL, Heiman ML. Ghrelin induces adiposity in rodents. Nature. 2000; 407: 908-13. 95 van der Lely AJ, Tschop M, Heiman ML, Ghigo E. Biological, physiological, pathophysiological, and
pharmacological aspects of ghrelin. Endocr Rev. 2004; 25: 426-57. 96 Wren AM, Seal LJ, Cohen MA, Brynes AE, Frost GS, Murphy KG, et al. Ghrelin enhances appetite and
increases food intake in humans. J Clin Endocrinol Metab. 2001; 86: 5992. 97 Ahima RS. Adipose tissue as an endocrine organ. Obesity (Silver Spring). 2006; 14 Suppl 5: 242S-49S. 98 Ahima RS, Lazar MA. Adipokines and the peripheral and neural control of energy balance. Mol Endo-
crinol. 2008; 22: 1023-31. 99 Cheung CC, Clifton DK, Steiner RA. Proopiomelanocortin neurons are direct targets for leptin in the
hypothalamus. Endocrinology. 1997; 138: 4489-92. 100 Cusin I, Rohner-Jeanrenaud F, Stricker-Krongrad A, Jeanrenaud B. The weight-reducing eff ect of an
intracerebroventricular bolus injection of leptin in genetically obese fa/fa rats. Reduced sensitivity compared with lean animals. Diabetes. 1996; 45: 1446-50.
101 Kamohara S, Burcelin R, Halaas JL, Friedman JM, Charron MJ. Acute stimulation of glucose metabolism in mice by leptin treatment. Nature. 1997; 389: 374-7.
102 Minokoshi Y, Haque MS, Shimazu T. Microinjection of leptin into the ventromedial hypothalamus increases glucose uptake in peripheral tissues in rats. Diabetes. 1999; 48: 287-91.
103 Qi Y, Takahashi N, Hileman SM, Patel HR, Berg AH, Pajvani UB, et al. Adiponectin acts in the brain to decrease body weight. Nat Med. 2004; 10: 524-9.
104 Schwartz MW, Seeley RJ, Campfi eld LA, Burn P, Baskin DG. Identifi cation of targets of leptin action in rat hypothalamus. J Clin Invest. 1996; 98: 1101-6.
105 Tovar S, Nogueiras R, Tung LY, Castaneda TR, Vazquez MJ, Morris A, et al. Central administration of resistin promotes short-term satiety in rats. Eur J Endocrinol. 2005; 153: R1-5.
1.
2.
3.
4.
5.
6.
7.
8.
9.
10.
11.
12.
13.
14.
15.
16.
17.
18.
19.
20.
21.
22.
23.
24.
25.
26.
27.
28.
29.
30.
31.
32.
33.
34.
35.
36.
37.
38.
39.
Chap
ter 1
0
149
General Discussion
106 Ahima RS, Qi Y, Singhal NS, Jackson MB, Scherer PE. Brain adipocytokine action and metabolic regula-tion. Diabetes. 2006; 55 Suppl 2: S145-54.
107 Arita Y, Kihara S, Ouchi N, Takahashi M, Maeda K, Miyagawa J, et al. Paradoxical decrease of an adipose-specifi c protein, adiponectin, in obesity. Biochem Biophys Res Commun. 1999; 257: 79-83.
108 Ariyasu H, Takaya K, Tagami T, Ogawa Y, Hosoda K, Akamizu T, et al. Stomach is a major source of circulating ghrelin, and feeding state determines plasma ghrelin-like immunoreactivity levels in humans. J Clin Endocrinol Metab. 2001; 86: 4753-8.
109 Asakawa A, Inui A, Kaga T, Yuzuriha H, Nagata T, Fujimiya M, et al. A role of ghrelin in neuroendocrine and behavioral responses to stress in mice. Neuroendocrinology. 2001; 74: 143-7.
110 Cummings DE. Ghrelin and the short- and long-term regulation of appetite and body weight. Physiol Behav. 2006; 89: 71-84.
111 Hu E, Liang P, Spiegelman BM. AdipoQ is a novel adipose-specifi c gene dysregulated in obesity. J Biol Chem. 1996; 271: 10697-703.
112 Maff ei M, Halaas J, Ravussin E, Pratley RE, Lee GH, Zhang Y, et al. Leptin levels in human and rodent: measurement of plasma leptin and ob RNA in obese and weight-reduced subjects. Nat Med. 1995; 1: 1155-61.
113 Tschop M, Wawarta R, Riepl RL, Friedrich S, Bidlingmaier M, Landgraf R, et al. Post-prandial decrease of circulating human ghrelin levels. J Endocrinol Invest. 2001; 24: RC19-21.
114 Weigle DS, Duell PB, Connor WE, Steiner RA, Soules MR, Kuijper JL. Eff ect of fasting, refeeding, and dietary fat restriction on plasma leptin levels. J Clin Endocrinol Metab. 1997; 82: 561-5.
115 Basu R, Pajvani UB, Rizza RA, Scherer PE. Selective downregulation of the high molecular weight form of adiponectin in hyperinsulinemia and in type 2 diabetes: diff erential regulation from nondiabetic subjects. Diabetes. 2007; 56: 2174-7.
116 Wren AM, Small CJ, Abbott CR, Dhillo WS, Seal LJ, Cohen MA, et al. Ghrelin causes hyperphagia and obesity in rats. Diabetes. 2001; 50: 2540-7.
117 Karra E, Batterham RL. The role of gut hormones in the regulation of body weight and energy homeo-stasis. Mol Cell Endocrinol. 2009.
118 Unniappan S, Kieff er TJ. Leptin extends the anorectic eff ects of chronic PYY(3-36) administration in ad libitum-fed rats. Am J Physiol Regul Integr Comp Physiol. 2008; 295: R51-8.
119 Nougou A, Suter M. Almost routine prophylactic cholecystectomy during laparoscopic gastric bypass is safe. Obes Surg. 2008; 18: 535-9.
120 Escalona A, Boza C, Munoz R, Perez G, Rayo S, Crovari F, et al. Routine preoperative ultrasonography and selective cholecystectomy in laparoscopic Roux-en-Y gastric bypass. Why not? Obes Surg. 2008; 18: 47-51.
121 Kim JJ, Schirmer B. Safety and effi cacy of simultaneous cholecystectomy at Roux-en-Y gastric bypass. Surg Obes Relat Dis. 2009; 5: 48-53.
122 Fobi M, Lee H, Igwe D, Felahy B, James E, Stanczyk M, et al. Prophylactic cholecystectomy with gastric bypass operation: incidence of gallbladder disease. Obes Surg. 2002; 12: 350-3.
123 Tucker ON, Fajnwaks P, Szomstein S, Rosenthal RJ. Is concomitant cholecystectomy necessary in obese patients undergoing laparoscopic gastric bypass surgery? Surg Endosc. 2008; 22: 2450-4.
124 Hamad GG, Ikramuddin S, Gourash WF, Schauer PR. Elective cholecystectomy during laparoscopic Roux-en-Y gastric bypass: is it worth the wait? Obes Surg. 2003; 13: 76-81.
125 Taylor J, Leitman IM, Horowitz M. Is routine cholecystectomy necessary at the time of Roux-en-Y gastric bypass? Obes Surg. 2006; 16: 759-61.
126 Swartz DE, Felix EL. Elective cholecystectomy after Roux-en-Y gastric bypass: why should asymptom-atic gallstones be treated diff erently in morbidly obese patients? Surg Obes Relat Dis. 2005; 1: 555-60.
127 Fuller W, Rasmussen JJ, Ghosh J, Ali MR. Is routine cholecystectomy indicated for asymptomatic cholelithiasis in patients undergoing gastric bypass? Obes Surg. 2007; 17: 747-51.
1.
2.
3.
4.
5.
6.
7.
8.
9.
10.
11.
12.
13.
14.
15.
16.
17.
18.
19.
20.
21.
22.
23.
24.
25.
26.
27.
28.
29.
30.
31.
32.
33.
34.
35.
36.
37.
38.
39.
Chap
ter 1
0
150
General Discussion
128 Papasavas PK, Gagne DJ, Ceppa FA, Caushaj PF. Routine gallbladder screening not necessary in patients undergoing laparoscopic Roux-en-Y gastric bypass. Surg Obes Relat Dis. 2006; 2: 41-6; discus-sion 46-7.
129 Patel KR, White SC, Tejirian T, Han SH, Russell D, Vira D, et al. Gallbladder management during laparoscopic Roux-en-Y gastric bypass surgery: routine preoperative screening for gallstones and postoperative prophylactic medical treatment are not necessary. Am Surg. 2006; 72: 857-61.
130 O’Brien PE, Dixon JB. A rational approach to cholelithiasis in bariatric surgery: its application to the laparoscopically placed adjustable gastric band. Arch Surg. 2003; 138: 908-12.
131 Everhart JE. Contributions of obesity and weight loss to gallstone disease. Ann Intern Med. 1993; 119: 1029-35.
132 Miller K, Hell E, Lang B, Lengauer E. Gallstone formation prophylaxis after gastric restrictive procedures for weight loss: a randomized double-blind placebo-controlled trial. Ann Surg. 2003; 238: 697-702.
133 Shiff man ML, Kaplan GD, Brinkman-Kaplan V, Vickers FF. Prophylaxis against gallstone formation with ursodeoxycholic acid in patients participating in a very-low-calorie diet program. Ann Intern Med. 1995; 122: 899-905.
134 Erlinger S. Gallstones in obesity and weight loss. Eur J Gastroenterol Hepatol. 2000; 12: 1347-52. 135 Schwesinger WH, Diehl AK. Changing indications for laparoscopic cholecystectomy. Stones without
symptoms and symptoms without stones. Surg Clin North Am. 1996; 76: 493-504. 136 Andersen JR, Aasprang A, Bergsholm P, Sletteskog N, Vage V, Natvig GK. Predictors for health-related
quality of life in patients accepted for bariatric surgery. Surg Obes Relat Dis. 2009; 5: 329-33. 137 Choban PS, Onyejekwe J, Burge JC, Flancbaum L. A health status assessment of the impact of weight
loss following Roux-en-Y gastric bypass for clinically severe obesity. J Am Coll Surg. 1999; 188: 491-7. 138 de Zwaan M, Mitchell JE, Howell LM, Monson N, Swan-Kremeier L, Roerig JL, et al. Two measures of
health-related quality of life in morbid obesity. Obes Res. 2002; 10: 1143-51. 139 Wadden TA, Sarwer DB, Womble LG, Foster GD, McGuckin BG, Schimmel A. Psychosocial aspects of
obesity and obesity surgery. Surg Clin North Am. 2001; 81: 1001-24. 140 de Zwaan M, Lancaster KL, Mitchell JE, Howell LM, Monson N, Roerig JL, et al. Health-related quality of
life in morbidly obese patients: eff ect of gastric bypass surgery. Obes Surg. 2002; 12: 773-80. 141 Dixon JB, Dixon ME, O’Brien PE. Quality of life after lap-band placement: infl uence of time, weight
loss, and comorbidities. Obes Res. 2001; 9: 713-21. 142 Dymek MP, Le Grange D, Neven K, Alverdy J. Quality of life after gastric bypass surgery: a cross-
sectional study. Obes Res. 2002; 10: 1135-42. 143 Herpertz S, Kielmann R, Wolf AM, Langkafel M, Senf W, Hebebrand J. Does obesity surgery improve
psychosocial functioning? A systematic review. Int J Obes Relat Metab Disord. 2003; 27: 1300-14. 144 Karlsson J, Sjostrom L, Sullivan M. Swedish obese subjects (SOS)--an intervention study of obesity.
Two-year follow-up of health-related quality of life (HRQL) and eating behavior after gastric surgery for severe obesity. Int J Obes Relat Metab Disord. 1998; 22: 113-26.
145 Kolotkin RL, Crosby RD, Gress RE, Hunt SC, Adams TD. Two-year changes in health-related quality of life in gastric bypass patients compared with severely obese controls. Surg Obes Relat Dis. 2009; 5: 250-6.
146 Mathus-Vliegen EM, de Weerd S, de Wit LT. Health-related quality-of-life in patients with morbid obesity after gastric banding for surgically induced weight loss. Surgery. 2004; 135: 489-97.
147 Schok M, Geenen R, van Antwerpen T, de Wit P, Brand N, van Ramshorst B. Quality of life after laparo-scopic adjustable gastric banding for severe obesity: postoperative and retrospective preoperative evaluations. Obes Surg. 2000; 10: 502-8.
148 van Gemert WG, Adang EM, Greve JW, Soeters PB. Quality of life assessment of morbidly obese patients: eff ect of weight-reducing surgery. Am J Clin Nutr. 1998; 67: 197-201.
149 van Hout GC, Boekestein P, Fortuin FA, Pelle AJ, van Heck GL. Psychosocial functioning following bariatric surgery. Obes Surg. 2006; 16: 787-94.
1.
2.
3.
4.
5.
6.
7.
8.
9.
10.
11.
12.
13.
14.
15.
16.
17.
18.
19.
20.
21.
22.
23.
24.
25.
26.
27.
28.
29.
30.
31.
32.
33.
34.
35.
36.
37.
38.
39.
Chap
ter 1
0
151
General Discussion
150 Waters GS, Pories WJ, Swanson MS, Meelheim HD, Flickinger EG, May HJ. Long-term studies of mental health after the Greenville gastric bypass operation for morbid obesity. Am J Surg. 1991; 161: 154-7; discussion 57-8.
151 VanderZee KI, Sanderman R, Heyink JW, de Haes H. Psychometric qualities of the RAND 36-Item Health Survey 1.0: a multidimensional measure of general health status. Int J Behav Med. 1996; 3: 104-22.
152 Buchwald H, Avidor Y, Braunwald E, Jensen MD, Pories W, Fahrbach K, et al. Bariatric surgery: a system-atic review and meta-analysis. JAMA. 2004; 292: 1724-37.
153 Buchwald H, Estok R, Fahrbach K, Banel D, Jensen MD, Pories WJ, et al. Weight and type 2 diabetes after bariatric surgery: systematic review and meta-analysis. Am J Med. 2009; 122: 248-56 e5.
154 Sjostrom L, Lindroos AK, Peltonen M, Torgerson J, Bouchard C, Carlsson B, et al. Lifestyle, diabetes, and cardiovascular risk factors 10 years after bariatric surgery. N Engl J Med. 2004; 351: 2683-93.


Sum mary


1.
2.
3.
4.
5.
6.
7.
8.
9.
10.
11.
12.
13.
14.
15.
16.
17.
18.
19.
20.
21.
22.
23.
24.
25.
26.
27.
28.
29.
30.
31.
32.
33.
34.
35.
36.
37.
38.
39.
155
Summary
Obesity has become a worldwide epidemic that threatens to overwhelm both developed and
developing countries, as described in Chapter 1. The major burden of obesity to both patients
and public health as a whole is the signifi cantly increased morbidity and mortality (due to,
for example, type 2 diabetes, hypertension, cancer and psychopathology). It is generally
acknowledged that a decrease in physical activity in combination with relative overeating leads
to a chronic positive energy balance, thereby causing an increase in body weight. However,
other factors that regulate individual susceptibility to obesity in an ‘obesogenic society’ must
be involved as well but only a small part has been identifi ed. For example, genetics have been
shown to play an important role. Genetic mutations and single nucleotide polymorphisms
have been identifi ed that disrupt a highly complex endocrine and neuroendocrine network
that regulates energy homeostasis and body weight. The main sites of (inter-)action in this
network are white adipose tissue (WAT), the digestive tract and the hypothalamus.
In Chapter 2 the physiology of the gut hormone ghrelin, the peptide obestatin, and the
adipokine adiponectin are discussed. Ghrelin is a hormone principally produced in the stomach
and primarily identifi ed as a strong growth hormone secretagogue (GHS). Ghrelin circulates
in two main isoforms: acylated (AG) and unacylated (UAG) ghrelin. Acylation is crucial for its
binding to the known growth hormone secretagogue receptor type 1a (GHS-R1a). Apart from
being a GHS, ghrelin has an important role in energy homeostasis, and in glucose and insulin
metabolism. Ghrelin is derived from the polypeptide preproghrelin. The function of a second
peptide derived from this prohormone, obestatin, is currently hotly debated. Initially, obestatin
was described as a functional antagonist of ghrelin, but subsequent studies were not able to
replicate these results. Like ghrelin, adiponectin plays an important role in glucose and insulin
homeostasis. Therefore, its connection with ghrelin must be identifi ed.
Unfortunately, treatment of obesity is diffi cult. Currently, bariatric surgery is the most eff ec-
tive treatment when quantifi ed in terms of weight loss. However, it is at least equally important
to assess its eff ectiveness in improving comorbidity. Additionally, any side eff ects of surgery
should be acceptable. In Chapter 3 the eff ect of bariatric surgery on quality of life (QoL), and
the risk of patients developing gallstones after bariatric surgery are discussed.
AG has been shown to increase insulin resistance. On the other hand, the eff ect of UAG on
insulin sensitivity is still not elucidated. Intriguingly, coadministration of AG and UAG to growth
hormone (GH) defi cient individuals improves their insulin sensitivity. Chapter 4 describes a
study in which the eff ects of administration of UAG, and the combination of AG and UAG in
morbid obesity, a condition characterized by insulin resistance and low GH levels, is evaluated.
Eight morbidly obese non-diabetic subjects were treated with an intravenous bolus injection
of either UAG (200μg), UAG (100μg) in combination with AG (100μg), or placebo in 3 episodes
of 4 consecutive days in a double-blind randomized crossover design. Administration of a bolus
injection of UAG did not infl uence glucose and insulin concentrations in fasting conditions. How-
ever, coadministration of AG and UAG caused a signifi cant decrease in insulin concentrations,
1.
2.
3.
4.
5.
6.
7.
8.
9.
10.
11.
12.
13.
14.
15.
16.
17.
18.
19.
20.
21.
22.
23.
24.
25.
26.
27.
28.
29.
30.
31.
32.
33.
34.
35.
36.
37.
38.
39.
156
Summary
to 58.2 ± 3.9% of baseline at 20 min. Since glucose concentrations did not change in the fi rst
hour after coadministration of AG and UAG, our data suggest a marked improvement in insulin
sensitivity.
AG and UAG are released principally into the hepatic portal system. Therefore, it is impor-
tant to know whether AG and UAG diff erentially regulate portal and systemic insulin levels.
In the study described in Chapter 5 we evaluated the eff ects of the administration of AG (30
nmol/kg), UAG (3 and 30 nmol/kg), the GHS-R1a antagonist [D-Lys3]GHRP-6 (1 μmol/kg), or
various combinations of these compounds on portal and systemic levels of glucose and insulin
after an intravenous glucose tolerance test (IVGTT, D-glucose 1 g/kg) in anesthetized fasted
Wistar rats. UAG administration potently and dose-dependently enhanced the rise of insulin
concentration induced by IVGTT in the portal and, to a lesser extent, the systemic circulation.
This UAG-induced eff ect was completely blocked by the coadministration of exogenous AG
at equimolar concentrations. Like UAG, [D-Lys3]GHRP-6, alone or in combination with AG and
UAG, strongly enhanced the portal insulin response to IVGTT, whereas exogenous AG alone did
not. These data demonstrate that, in glucose-stimulated conditions, exogenous UAG acts as a
potent insulin secretagogue, whereas endogenous AG inhibits glucose-induced insulin release.
Like ghrelin, obestatin is produced principally in the portal system and has a very short half-
life. It is still unclear if obestatin is a bona fi de hormone (and a functional antagonist of ghrelin),
or simply a non-functional proteolytic derivative of the ghrelin prohormone. Since AG induces
insulin resistance, it could be hypothesized that obestatin plays a role in glucose homeostasis
as well. In the study described in Chapter 6 we evaluated the eff ect of obestatin on glucose
and insulin metabolism in the systemic and portal circulations. Fasted male Wistar rats were
anesthetized with pentobarbital. Obestatin (200 nmol/kg) was administered systemically as
an intravenous bolus injection either in fasted conditions or glucose-stimulated conditions
(IVGTT). Sequential blood samples were then obtained from the portal and jugular veins for 50
min following administration. It was found that obestatin had no eff ect on glucose and insulin
concentrations in the systemic and portal circulations of either fasted or glucose-stimulated
animals.
The brain, the gut and WAT play important roles in regulating energy homeostasis and
body weight. While connections of respectively WAT and the gut with the brain have been
studied extensively, knowledge about signalling pathways connecting the digestive tract and
WAT is relatively limited. Ghrelin and adiponectin share some striking homologies: both are
decreased in obesity and both share a potent eff ect on insulin sensitivity. However, it is not
known if ghrelin and adiponectin regulate each other. The study described in Chapter 7 exam-
ines whether acute administration of UAG alone or combined with AG aff ects total and high
molecular weight (HMW) adiponectin concentrations, either directly or indirectly by changes
in insulin concentration. Eight morbidly obese non-diabetic subjects were treated with either
UAG (200μg), coadministered UAG (100μg) and AG (100μg), or placebo in 3 episodes in a
double blind randomized cross-over design. HMW and total adiponectin concentrations did
1.
2.
3.
4.
5.
6.
7.
8.
9.
10.
11.
12.
13.
14.
15.
16.
17.
18.
19.
20.
21.
22.
23.
24.
25.
26.
27.
28.
29.
30.
31.
32.
33.
34.
35.
36.
37.
38.
39.
157
Summary
not change after administration of either UAG or combined UAG + AG, nor were they diff erent
from placebo. In addition, since a signifi cant decrease in insulin concentration was observed, it
can be concluded that there was no acute indirect eff ect of UAG and UAG + AG on adiponectin
concentrations.
Bariatric surgery is currently the most eff ective long-term treatment for obesity. However,
it has very specifi c complications. For example, because bariatric surgery induces rapid and
substantial weight loss patients are at risk of developing gallstones. A retrospective study is
described in Chapter 8 in which 120 previously morbidly obese subjects who had undergone
laparoscopic adjustable gastric banding (LAGB) and 45 morbidly obese subjects on a waiting
list for bariatric surgery were evaluated for gallstones. Prior history of cholecystectomy was
present in 21 post-LAGB patients; 16 before and 5 after LAGB. Of 98 patients in which ultra-
sonography was performed 26 (26.5%) presented with gallstones. Overall, the prevalence of
gallstones after weight reduction surgery was 31 (30.1%) in 103 patients at risk. In contrast, the
prevalence of gallstones in the morbidly obese population on a waiting list for bariatric surgery
was 13.3% (6 out of 45 patients), which was signifi cantly lower than in the post-surgical group.
Therefore, rapid weight loss induced by LAGB should be regarded as an important risk factor
for the development of gallstones. Multivariate analysis indicated that neither preoperative
weight, nor maximum weight loss, nor the interval between operation and the postoperative
ultrasonography were determinants of the risk for developing gallstone disease.
Eff ectiveness of bariatric surgery can be easily quantifi ed as excess weight loss (EWL). How-
ever, it is important that along with the weight loss comorbidity improves as well. In relation to
this we studied the eff ect of LAGB on quality of life (QoL), specifi cally after long-term follow-up,
as described in Chapter 9. In a cross-sectional design, 59 previously morbidly obese subjects
who had undergone LAGB at least 60 months earlier and 28 morbidly obese subjects on a wait-
ing list for bariatric surgery completed a generic QoL questionnaire, the RAND 36-Item Health
Survey, quantifying QoL. Scores of both groups were compared to Dutch community norm
data (CN). The preoperative group scored signifi cantly lower on fi ve out of eight QoL subscales
compared to CN, while the postoperative group scored signifi cantly lower on four out of eight
QoL subscales compared to CN. The postoperative group scored signifi cantly higher on one
out of eight subscales compared to the preoperative group. Postoperative BMI and %EWL
infl uenced QoL after long-term follow-up, whereas weight regain had no negative impact.
This study indicates that after long-term follow-up subjects treated by LAGB to induce weight
loss have a slightly better QoL than those who had not yet undergone surgery. QoL remains
impaired in comparison to the general population.
In Chapter 10 the results of the studies are placed in a broader perspective and directions for
future research are discussed.


Nederlandse samen vatting

1.
2.
3.
4.
5.
6.
7.
8.
9.
10.
11.
12.
13.
14.
15.
16.
17.
18.
19.
20.
21.
22.
23.
24.
25.
26.
27.
28.
29.
30.
31.
32.
33.
34.
35.
36.
37.
38.
39.
161
Nederlandse samenvatting
OBESITAS
Introductie
In de afgelopen decennia is de prevalentie van overgewicht (gedefi nieerd als een BMI > 25
kg/m2) sterk toegenomen, aanvankelijk in de westerse wereld, maar inmiddels ook in de
rest van de wereld. Dit heeft grote gevolgen voor de maatschappij, daar met name obesitas
(gedefi nieerd als een BMI > 30 kg/m2) gepaard gaat met een aanzienlijke stijging van morbi-
diteit en mortaliteit. Diabetes mellitus type 2, hypertensie, hyperlipidemie, maligniteiten en
psychopathologie, ziektebeelden die sterk geassocieerd zijn met overgewicht, zijn hiervan de
belangrijkste veroorzakers.
Algemeen wordt aangenomen dat een daling van de hoeveelheid lichaamsbeweging
in combinatie met de eenvoudige beschikbaarheid van energierijk voedsel de belangrijkste
oorzaak is van de sterke stijging van de prevalentie van overgewicht en obesitas. Dit lijkt echter
onvoldoende om de sterke interindividuele variatie in lichaamsgewicht in een zg. ‘obesogene
samenleving’ te verklaren. Er komen langzamerhand steeds meer aanwijzingen dat er een
genetische basis is die de gevoeligheid voor overgewicht bepaalt. Inmiddels zijn meerdere
mutaties en SNP’s gedocumenteerd die overgewicht tot gevolg hebben. Deze mutaties leiden
zonder uitzondering tot een verstoring van de complexe endocriene en neuro-endocriene
regulatie van de energiehomeostase. De drie systemen die hierin een belangrijke rol spelen
zijn het centraal zenuwstelsel (met name de hypothalamus), de darm (via de productie van
darmhormonen zoals ghreline, GLP-1, CCK etc) en het vetweefsel (via de productie van adipo-
kines zoals leptine en adiponectine).
Wanneer wordt aangenomen dat de oorzaak van overgewicht en obesitas een gebrek aan
lichaamsbeweging in combinatie met relatief te veel eten is, lijkt behandeling eenvoudig. Aan-
passing van de leefstijl is helaas slechts beperkt eff ectief en de resultaten zijn met name op de
lange termijn teleurstellend. Op dit moment is de meest eff ectieve behandeling de bariatrische
chirurgie. Hierbij wordt door middel van chirurgisch ingrijpen in de anatomie van de darm
mechanische restrictie van de voedselinname of een malabsorptie geïnduceerd. Dit leidt tot
aanzienlijk gewichtsverlies, dat ook op de langere termijn persisteert.
DE EFFECTEN VAN GEACYLEERD EN ONGEACYLEERD GHRELINE OP HET GLUCOSE- EN INSULINEMETABOLISME.
Hoofdstuk 4 en 5
Ghreline is een eiwit, bestaande uit 28 aminozuren, dat in de maag geproduceerd wordt. In 1999
werd dit hormoon geïdentifi ceerd als groeihormoon secretagoog, een eff ect dat gemedieerd
wordt door de Groeihormoon Secretagoog receptor type 1a (GHS-R1a). Karakteristiek voor de
structuur van ghreline is een posttranslationele acylering met een n-octanoylgroep van serine

1.
2.
3.
4.
5.
6.
7.
8.
9.
10.
11.
12.
13.
14.
15.
16.
17.
18.
19.
20.
21.
22.
23.
24.
25.
26.
27.
28.
29.
30.
31.
32.
33.
34.
35.
36.
37.
38.
39.
162
Nederlandse samenvatting
op positie 3, welke noodzakelijk is voor binding aan de GHS-R1a. Naast deze geacyleerde iso-
vorm (geacyleerd ghreline, AG) kent ghreline ook een ongeacyleerde isovorm (ongeacyleerd
ghreline, UAG). Daar UAG niet kan binden aan de GHS-R1a, werd aanvankelijk gedacht dat UAG
biologisch inactief was. Echter, onderzoek heeft aangetoond dat ook UAG een rol van betekenis
speelt in meerdere metabole processen.
Van AG is inmiddels bevestigd dat het insulineresistentie induceert. Het eff ect van UAG
op het glucose- en insulinemetabolisme is daarentegen nog niet onomstotelijk vastgesteld.
Opvallend genoeg is wel aangetoond dat behandeling met de combinatie van AG en UAG het
eff ect van AG op insuline resistentie teniet doet en juist de insulinegevoeligheid bevordert
bij patiënten lijdend aan groeihormoondefi ciëntie. Daar UAG redelijkerwijs niet bindt aan de
GHS-R1a, staat tevens ter discussie via welke receptor het eff ect van ghreline op het glucose- en
insulinemetabolisme gemedieerd wordt.
In hoofdstuk 4 wordt de studie beschreven waarin onderzocht werd wat het eff ect is van
behandeling met UAG en de combinatie van AG en UAG versus placebo op de glucose- en
insulinespiegels bij proefpersonen lijdend aan morbide obesitas (Body Mass Index (BMI) > 40
kg/m2), een conditie gekarakteriseerd door insulineresistentie en lage groeihormoonspiegels.
Geen van de proefpersonen leed aan diabetes mellitus. De medicatie werd toegediend volgens
een gerandomiseerd, dubbelblind, crossover protocol.
Intraveneuze toediening van 200 μg UAG aan de onderzoekspersonen gaf geen verandering
in glucose- en insulineconcentraties ten opzichte van placebo, noch in nuchtere toestand noch
na een maaltijd genuttigd 1 uur na toediening van de medicatie. Intraveneuze toediening van
100 μg UAG + 100 μg AG daarentegen leidde tot een signifi cante daling van de insulinecon-
centratie tot een minimum van 58.2 ± 3.9% van de uitgangswaarde vóór toediening van de
medicatie. Bij deze daling van de insulinespiegel werd geen verandering van glucoseconcen-
tratie geobserveerd. Eén uur na toediening was de insulineconcentratie weer gelijk aan de
uitgangswaarde. UAG + AG werd gedurende vier opeenvolgende dagen toegediend. Ook op
dag 4 was het eff ect onverminderd waarneembaar, hetgeen bevestigt dat in deze periode geen
tachyphylaxie is opgetreden.
Concluderend bevestigt deze studie het reeds eerder geobserveerde eff ect dat intrave-
neuze toediening van de combinatie van AG en UAG acuut en kortdurend een sterke afname
van de insulinespiegel tot gevolg heeft, ditmaal in een groep morbide obese proefpersonen.
Het gelijk blijven van de glucoseconcentratie in dezelfde periode suggereert een toename van
insulinegevoeligheid, hetgeen een belangrijke winst zou kunnen betekenen in deze populatie
lijdend aan morbide obesitas.
De in hoofdstuk 5 beschreven studie heeft gebruik gemaakt van een rattenmodel waarin
het mogelijk is zowel portale als perifere glucose- en insulineconcentraties te meten. Daar
zowel ghreline als insuline primair in het portale systeem worden gesecerneerd, is het niet
1.
2.
3.
4.
5.
6.
7.
8.
9.
10.
11.
12.
13.
14.
15.
16.
17.
18.
19.
20.
21.
22.
23.
24.
25.
26.
27.
28.
29.
30.
31.
32.
33.
34.
35.
36.
37.
38.
39.
163
Nederlandse samenvatting
ondenkbaar dat beïnvloeding van glucose en insuline door AG en UAG met name locaal detec-
teerbaar is en dat perifere meting van glucose- en insulinespiegels een onderschatting van het
eff ect tot gevolg heeft. Ter bestudering van de portale eff ecten van AG en UAG op glucose- en
insulinespiegels tijdens een intraveneuze glucose tolerantie test (IVGTT) werd deze medicatie
afzonderlijk en in combinatie intraveneus toegediend in bovengenoemd rattenmodel. Boven-
dien werd de rol van de GHS-R1a geëvalueerd door middel van bestudering van de eff ecten van
toediening van de GHS-R1a blokker [D-Lys3]GHRP-6 op het glucose-en insulinemetabolisme,
alleen of in combinatie met UAG of AG.
Intraveneuze toediening van UAG induceerde een signifi cante stimulatie van de insuline-
respons op een IVGTT. Dit eff ect werd met name geobserveerd in de portale circulatie, maar
in mindere mate ook in de systemische circulatie. Combinatie van UAG met [D-Lys3]GHRP-6
leidde niet tot een mutatie van het eff ect van UAG. Het eff ect van toediening van [D-Lys3]
GHRP-6 alleen kwam overeen met de toediening van UAG: stimulatie van de insuline respons
op een IVGTT. Toediening van AG daarentegen had geen verandering van glucose- noch van
insulinespiegels tot gevolg. Wel bleek dat wanneer AG gelijktijdig met UAG toegediend werd,
de toename van de insulinerespons zoals geobserveerd na UAG alleen zich niet voordeed.
Bovenstaande resultaten laten zien, dat AG onder fysiologische omstandigheden een maxi-
maal inhiberend eff ect op insulinesecretie heeft, gemedieerd door de GHS-R1a. Toediening van
AG leidde immers niet tot een verandering van glucose- en insulinespiegels, terwijl blokkade
van de GHS-R1a een toename van de insulinerespons op een IVGTT bewerkstelligde. UAG
daarentegen lijkt juist een stimulerend eff ect op de insulinesecretie te hebben via een nog
nader te determineren systeem onafhankelijk van de GHS-R1a. Het eff ect van UAG blijkt zich
met name in het portale systeem af te spelen. Deze bevindingen suggereren dat in het portale
systeem AG en UAG functionele antagonisten zijn waarbij hun eff ecten gemedieerd worden via
verschillende receptoren.
DE EFFECTEN VAN OBESTATINE OP HET GLUCOSE- EN INSULINEMETABOLISME.
Hoofdstuk 6
In 2005 werd een tweede peptide afkomstig van het preproghreline polypeptide geïdentifi -
ceerd. Dit 23 aminozuren lange eiwit leek aanvankelijk een belangrijke rol te vervullen als func-
tionele antagonist van ghreline met betrekking tot het hongergevoel: obestatine bleek een
sterk anorexigeen eff ect te hebben na intraperitoneale en intracerebroventriculaire toediening.
Meerdere vervolgonderzoeken waren echter niet in staat deze oorspronkelijke bevindingen
te reproduceren, zodat er een discussie ontstond of obestatine wel een functioneel hormoon
was of slechts een bijproduct bij de productie van ghreline. Ook op andere gebieden, zoals
1.
2.
3.
4.
5.
6.
7.
8.
9.
10.
11.
12.
13.
14.
15.
16.
17.
18.
19.
20.
21.
22.
23.
24.
25.
26.
27.
28.
29.
30.
31.
32.
33.
34.
35.
36.
37.
38.
39.
164
Nederlandse samenvatting
bij het glucose- en insulinemetabolisme, was er controverse aangaande de functionaliteit van
obestatine.
In de studie beschreven in hoofdstuk 6 werd opnieuw het eerder beschreven rattenmodel
gebruikt ter evaluatie van eventuele biologische eff ecten van obestatine op het glucose- en
insulinemetabolisme. Daar de halfwaardetijd van obestatine erg kort is en het eiwit primair in
het portale systeem gesecerneerd wordt, zouden ook hierbij eff ecten gemist kunnen worden
wanneer uitsluitend glucose- en insulineconcentraties in de perifere circulatie gemeten zouden
worden, analoog aan de in hoofdstuk 5 beschreven situatie met betrekking tot UAG.
Intraveneuze toediening van 200 nmol/kg obestatine als bolusinjectie leidde tot glucose-
en insulineconcentraties niet verschillend van placebo, noch in de perifere circulatie, noch in
de systemische circulatie. Ook toediening van 200 nmol/kg obestatine tijdens een IVGTT leidde
tot veranderingen in glucose- en insulineconcentraties conform de veranderingen zoals die
werden waargenomen na toediening van placebo tijdens een IVGTT.
De bovenbeschreven resultaten ontkrachtigen de hypothese dat obestatine, analoog aan
ghreline, een belangrijk eff ect heeft op het glucose- en insulinemetabolisme. Dit geldt echter
alleen voor de huidige dosering en omstandigheden. De resultaten kunnen niet zonder meer
geëxtrapoleerd worden en eventuele functionaliteit van obestatine in het glucose- en insuline-
metabolisme kan op dit moment (nog) niet defi nitief verworpen worden.
DE EFFECTEN VAN GHRELIN OP ADIPONECTINECONCENTRATIES.
Hoofdstuk 7
Het energiemetabolisme van de mens wordt binnen zeer stricte grenzen gereguleerd. Het
systeem dat hiervoor zorgt draagt, bestaat uit drie componenten: de darm, het vetweefsel
en de hersenen (met name de hypothalamus). De darm produceert darmhormonen, zoals
ghreline, glucagon-like peptide 1 (GLP-1) en peptide tyrosine-tyrosine (PYY), die afhankelijk
van de aanwezigheid van voedsel in de darm gesecerneerd worden. Het vetweefsel produceert
adipokines, zoals leptine en adiponectine. De signalen afkomstig uit de darm en het vetweefsel
worden geïntegreerd op het niveau van de hypothalamus, alwaar hongergevoelens geregu-
leerd worden.
Connecties tussen de darm en de hersenen en tussen het vetweefsel en de hersenen zijn
uitvoerig bestudeerd en beschreven. Over de relatie tussen darmhormonen en adipokines
daarentegen is relatief weinig bekend. Het darmhormoon ghreline en de adipokine adiponec-
tine hebben een aantal opvallende overeenkomsten. Beide zijn verlaagd in geval van obesitas
en beide hebben een belangrijke rol binnen het glucosemetabolisme: adiponectine (met name
de hoog-moleculair gewicht (HMW) isovorm) heeft een gunstig eff ect op de insulinegevoe-
ligheid en voor de rol van ghreline wordt verwezen naar hoofdstuk 4 en 5. Informatie over
wederzijdse beïnvloeding ontbreekt echter vrijwel geheel, hoewel interessante hypotheses
1.
2.
3.
4.
5.
6.
7.
8.
9.
10.
11.
12.
13.
14.
15.
16.
17.
18.
19.
20.
21.
22.
23.
24.
25.
26.
27.
28.
29.
30.
31.
32.
33.
34.
35.
36.
37.
38.
39.
165
Nederlandse samenvatting
over deze onderlinge relaties geponeerd zouden kunnen worden. De beide hormonen zou-
den elkaar direct, op locaal niveau, kunnen beïnvloeden, maar de interactie zou ook indirect
kunnen verlopen, via modifi catie van insulineconcentratie of lichaamsgewicht. Insuline en
lichaamsgewicht worden immers beide beïnvloed door ghreline en adiponectine, terwijl deze
twee factoren anderzijds juist de ghreline-en adiponectineconcentraties beïnvloeden.
Hoofdstuk 7 beschrijft een studie waarin de korte-termijn relatie tussen ghreline en adi-
ponectine geëvalueerd wordt, meer specifi ek de eff ecten van geacyleerd ghreline (UAG) en
de combinatie van ongeacyleerd en geacyleerd ghreline (AG) op de concentraties van totaal
en HMW adiponectine. Daar eerder reeds werd vastgesteld dat de combinatie van UAG en AG
een acute sterke daling van insulineconcentraties induceert, kan tevens een eventueel indirect
eff ect van ghreline op adiponectineconcentraties (via modifi catie van de insulineconcentratie)
geëvalueerd worden. Anderzijds is er nog geen sluitende verklaring voor de daling van insuli-
nespiegels (mogelijk duidend op een toename van de insulinegevoeligheid) na toediening van
UAG + AG (zie hoofdstuk 4). Gezien het feit dat adiponectine een belangrijke rol speelt bij de
regulatie van insulinegevoeligheid, zou dit eff ect theoretisch gemedieerd kunnen worden via
modifi catie van adiponectinespiegels na toediening van UAG + AG.
Concentraties van HMW en totaal adiponectine werden gemeten gedurende 1 uur na de
intraveneuze toediening van 200 μg UAG, 100 μg UAG + 100 μg AG of placebo aan nuchtere
proefpersonen lijdend aan morbide obesitas. Noch UAG alleen, noch de combinatie van UAG +
AG leidde tot verandering van de concentraties van HMW en totaal adiponectine. Er werd geen
verschil geobserveerd met de resultaten na toediening van placebo. De eerder beschreven
daling van de insulinespiegel werd wel geobserveerd, maar ook dit leidde niet tot verandering
van de adiponectinespiegels.
De huidige studie liet geen korte-termijn eff ect zien van intraveneuze toediening van UAG
met of zonder AG op de concentratie van HMW en totaal adiponectine. Ondanks het feit dat
eerder werd vastgesteld dat insuline een belangrijke regulator van de adiponectineconcentra-
tie is, resulteerde een UAG + AG gemedieerde daling van insuline niet in een acute verandering
van adiponectinespiegels. Anderzijds zal ook de hypothese dat de geobserveerde daling van
insulinespiegels na de toediening van UAG + AG gemedieerd wordt door een verandering in
adiponectineconcentraties verworpen moeten worden. Desalteniettemin kan op basis van
deze resultaten een connectie tussen ghreline en adiponectine niet defi nitief verworpen
worden, met name daar het een observatie gericht op acute eff ecten (gedurende 1 uur na
toediening) betreft en vooral indirecte eff ecten een langere looptijd nodig hebben.

1.
2.
3.
4.
5.
6.
7.
8.
9.
10.
11.
12.
13.
14.
15.
16.
17.
18.
19.
20.
21.
22.
23.
24.
25.
26.
27.
28.
29.
30.
31.
32.
33.
34.
35.
36.
37.
38.
39.
166
Nederlandse samenvatting
HET ONTWIKKELEN VAN GALSTENEN NA EEN MAAGBANDOPERATIE.
Hoofdstuk 8
Overgewicht is een bekende risicofactor voor het ontwikkelen van galstenen. Gewichtsverlies
echter is mogelijk zelfs een sterkere risicofactor. Dit is een belangrijke zorg in het kader van
behandeling van obesitas middels bariatrische chirurgie, omdat hierbij een situatie gecre-
eerd wordt, waarin mensen met ernstig overgewicht in korte tijd veel gewicht verliezen en
dientengevolge theoretisch een grote kans hebben op het ontwikkelen van galstenen. Er zijn
eff ectieve profylactische behandelingen voor handen, zoals profylactische cholecystectomie
tijdens bariatrische chirurgie of behandeling met ursodeoxycholzuur. Om een juiste afweging
aangaande nut en noodzaak van profylactische behandeling van galstenen te kunnen maken,
is het van belang geïnformeerd te zijn over de incidentie van cholelithiasis na bariatrische
chirurgie, waarbij tevens onderscheid gemaakt moet worden tussen symptomatisch en asymp-
tomatisch galsteenlijden.
In hoofdstuk 8 wordt een studie beschreven waarin 120 patiënten na maagbandoperatie
(LAGB) worden geëvalueerd voor het optreden van symptomatisch en asymptomatisch
galsteenlijden. Alle patiënten voldeden preoperatief aan de criteria voor morbide obesitas
(BMI > 40 kg/m2 of > 35 kg/m2 in combinatie met relevante comorbiditeit). Deelname aan het
onderzoek vond plaats gemiddeld 4,6 jaar na operatie (varierend van 1,3 tot 8,5 jaar) en het
maximale gewichtsverlies bedroeg 31,5 ± 11,3% van het preoperatieve gewicht. Als controle-
groep functioneerde een groep van patiënten van de wachtlijst voor LAGB.
Een groep van 16 patiënten had reeds voor LAGB een cholecystectomie ondergaan en viel
derhalve af voor evaluatie. Tevens hadden 5 patiënten na LAGB (maar voor deelname aan het
onderzoek) een cholecystectomie ondergaan vanwege symptomatisch galsteenlijden. 98
patiënten ondergingen een echo van de bovenbuik ter evaluatie van de aanwezigheid van
galstenen. Bij 26 (26,5%) van hen werden galstenen vastgesteld, die anamnestisch in 2 geval-
len symptomatisch bleken te zijn. Dit resulteerde in een prevalentie van galstenen na LAGB
van 31 (30,1%) uit 103 patiënten. Van hen waren in totaal 7 (6,8%) patiënten op enig moment
symptomatisch geweest. De prevalentie van galstenen in de patiëntengroep die nog geen
LAGB hadden ondergaan was signifi cant lager: 13,3%.
De prevalentie van galstenen bleek na LAGB signifi cant hoger te zijn dan in een populatie
patiënten lijdend aan morbide obesitas die nog geen bariatrische chirurgie ondergingen.
Slechts 7 van de 31 patiënten ontwikkelden echter klachten in een periode van 4,6 jaar,
hetgeen resulteert in een cumulatief risico van 24,4% na 5 jaar, een percentage dat overeen
komt met het percentage symptomatisch worden van bekende cholelithiasis in de algemene
bevolking. Op dit moment worden asymptomatische galstenen niet behandeld en dit beleid
lijkt dus ook gerechtvaardigd na LAGB. Wel moet hierbij opgemerkt worden, dat de prevalentie
na LAGB signifi cant hoger was dan voor LAGB, hetgeen tevens gewichtsverlies als risicofactor
voor het ontwikkelen van galstenen bevestigt. Om een juiste afweging te kunnen maken
1.
2.
3.
4.
5.
6.
7.
8.
9.
10.
11.
12.
13.
14.
15.
16.
17.
18.
19.
20.
21.
22.
23.
24.
25.
26.
27.
28.
29.
30.
31.
32.
33.
34.
35.
36.
37.
38.
39.
167
Nederlandse samenvatting
met betrekking tot de indicatie van profylactische behandeling van galstenen na bariatrische
chirurgie is uiteindelijk gerandomiseerd onderzoek nodig, waarbij met name morbiditeit en
kosten van de verschillende benaderingen tegen elkaar afgezet moeten worden.
LANGE-TERMIJNEFFECTEN VAN BARIATRISCHE CHIRURGIE OP DE KWALITEIT VAN LEVEN.
Hoofdstuk 9
Het is algemeen bekend dat obesitas gepaard gaat met een verminderde kwaliteit van leven.
Sociale stigmatisatie, een negatief zelfbeeld en een minder goede lichamelijke gezondheid zijn
hier debet aan. Daar bariatrische chirurgie een eff ectieve behandeling is van obesitas, mag
worden aangenomen dat deze behandeling een gunstig eff ect heeft op de kwaliteit van leven.
Opvallend genoeg is inderdaad aangetoond dat reeds kort na de operatie, op een moment
dat er van signifi cant gewichtsverlies nog geen sprake is, de kwaliteit van leven reeds sterk
verbetert. Helaas laten de schaarse lange-termijnstudies in de loop van de tijd na bariatrische
chirurgie echter weer een afname van de kwaliteit van leven zien, ondanks een min of meer
stabiel blijvend gewicht.
In de studie in hoofdstuk 9 werd van 59 patiënten die minimaal 5 jaar tevoren (gemiddeld
74,7 maanden, variërend van 60 tot 107,6 maanden) een maagbandplaatsing hadden onder-
gaan de kwaliteit van leven geëvalueerd. Als objectieve maat voor dit subjectieve gegeven
werd de gevalideerde Nederlandse vertaling van een gestandaardiseerde algemene kwaliteit-
van-levenvragenlijst, de RAND-36, gebruikt. Deze vragenlijst beslaat 9 categorieën aangaand
fysiek en psychosociaal functioneren. Alle patiënten voldeden preoperatief aan de criteria voor
morbide obesitas. Postoperatief daalde hun BMI van 44,9 ± 5,9 kg/m2 naar 33.3 ± 6,0 kg/m2. Als
controlegroepen werden gebruikt een populatie van patiënten lijdend aan morbide obesitas
die op de wachtlijst voor LAGB stonden en de Nederlandse bevolking (aan de hand van eerder
gerapporteerde standaardscores). Tevens werd gezocht naar factoren die de kwaliteit van leven
positief of negatief beïnvloedden.
Morbide obesitas leidde inderdaad tot een sterke afname van de kwaliteit van leven, zoals
weerspiegeld werd in de bevinding dat de groep van de wachtlijst signifi cant slechter scoorde
op 6 van de 9 items vergeleken met de Nederlandse bevolking. Helaas was het resultaat na LAGB
slechts beperkt beter: geopereerde patiënten scoorden op slechts 1 item signifi cant beter dan
de wachtlijstgroep en signifi cant slechter op 4 van de 9 items vergeleken met de Nederlandse
bevolking. Kwaliteit van leven werd in de geopereerde groep negatief beïnvloed door leeftijd,
postoperatieve BMI en comorbiditeit en positief door de mate van gewichtsverlies na LAGB.
Preoperatieve BMI, mate van stijging van het gewicht na initiële daling en de hoeveelheid tijd
verstreken na de operatie hadden geen invloed op de kwaliteit van leven.
1.
2.
3.
4.
5.
6.
7.
8.
9.
10.
11.
12.
13.
14.
15.
16.
17.
18.
19.
20.
21.
22.
23.
24.
25.
26.
27.
28.
29.
30.
31.
32.
33.
34.
35.
36.
37.
38.
39.
168
Nederlandse samenvatting
Concluderend bevestigt deze studie enerzijds dat obesitas een negatief eff ect heeft op de
kwaliteit van leven, en anderzijds dat langere tijd na bariatrische chirurgie de kwaliteit van
leven nog steeds onder de maat is. Daar het een cross-sectionele studie betreft, kan niet gedif-
ferentieerd worden tussen een verslechtering na initiële verbetering of slechts een beperkt
gunstig eff ect van LAGB. De beperkte gegevens uit de literatuur pleiten voor het eerste beloop.
In eerdere studies werd gesuggereerd dat de afname van kwaliteit van leven in de loop der
tijd het gevolg zou zijn van vermindering van intensiteit van medische controle, teleurstelling
over slechts beperkt resultaat of gewichtstoename na initiële daling. De bepalende factoren
zoals in onze studie werden vastgesteld hebben daarentegen opvallend weinig relatie met
het tijdsbeloop na LAGB en lijken, ook op lange termijn, hoofdzakelijk gerelateerd aan de
mate en gevolgen van het overgewicht zelf en het succes van de operatie gekwantifi ceerd
als gewichtsverlies. In vervolgstudies, liefst van longitudinale opzet, zal het vooral belangrijk
zijn vast te stellen welke andere beïnvloedbare factoren de kwaliteit van leven na bariatrische
chirurgie bepalen, zodat hier in de follow up van geopereerde patiënten zo adequaat mogelijk
op ingesprongen kan worden.


List of abbr eviations

1.
2.
3.
4.
5.
6.
7.
8.
9.
10.
11.
12.
13.
14.
15.
16.
17.
18.
19.
20.
21.
22.
23.
24.
25.
26.
27.
28.
29.
30.
31.
32.
33.
34.
35.
36.
37.
38.
39.
173
List of abbreviations
ACTH Adrenocorticotropic hormone
AG Acylated ghrelin
AgRP Agouti-related peptide
AMPK 5’ adenosine monophosphate-activated protein kinase
BMI Body mass index
BPD-DS Biliopancreatic diversion – duodenal switch
CB1 Cannabinoid receptor type 1
CCK Cholecystokinin
EWL Excess weight loss
FFA Free fatty acid
GB Gastric bypass
GH Growth hormone
GHS Growth hormone secretagogue
GHS-R1a Growth hormone secretagogue receptor type 1a
GIP Gastric inhibitory polypeptide
GLP-1 Glucagon-like peptide-1
GOAT Ghrelin O-acyltransferase
GPR39 G-protein coupled receptor 39
HDL High-density lipoprotein
HMW High molecular weight
HOMA-IR Homeostasis model assessment for insulin resistance
IGF-1 Insulin-like growth factor 1
IL-1 Interleukin-1
IL-6 Interleukin-6
IVGTT Intravenous glucose tolerance test
LAGB Laparoscopic adjustable gastric banding
LDL Low-density lipoprotein
LMW Low molecular weight
MC4R Melanocortin 4 receptor
MMW Medium molecular weight
NPY Neuropeptide Y
POMC Pro-opiomelanocortin
PPARα Peroxisome proliferator-activated receptor α
PYY Peptide tyrosine tyrosine
QoL Quality of life
RR Relative risk ratio
SIM1 Single-minded homolog 1
SNP Single nucleotide polymorphism
TG Triglyceride
1.
2.
3.
4.
5.
6.
7.
8.
9.
10.
11.
12.
13.
14.
15.
16.
17.
18.
19.
20.
21.
22.
23.
24.
25.
26.
27.
28.
29.
30.
31.
32.
33.
34.
35.
36.
37.
38.
39.
174
List of abbreviations
TNFα Tumor necrosis factor α
TRKB Neurotrophic tyrosine kinase receptor
UAG Unacylated ghrelin
VBG Vertical banded gastroplasty
WAT White adipose tissue


List of publica tions and presentations

1.
2.
3.
4.
5.
6.
7.
8.
9.
10.
11.
12.
13.
14.
15.
16.
17.
18.
19.
20.
21.
22.
23.
24.
25.
26.
27.
28.
29.
30.
31.
32.
33.
34.
35.
36.
37.
38.
39.
179
List of publications and presentations
PUBLICATIONS
Kiewiet RM, Kruijthoff DJ, van Vliet ACM. Niet zomaar een korst op de arm. Tijdschrift voor Huis-
artsgeneeskunde 2003; 10/11: 272,286.
Kiewiet RM, Ponssen HH, Janssens ENW, Fels PhW. Ventricular fi brillation in hypercalcaemic crisis
due to primary hyperparathyroidism. Neth J Med. 2004; 62: 94-96.
Kiewiet RM, Durian MF, van Leersum M, Hesp WLEM, van Vliet ACM. Gallstone formation after
weight loss following gastric banding in morbidly obese Dutch patients. Obes Surg 2006; 16:
592-596.
Kiewiet RM, van Aken MO, Schepp L, van der Hulst YPM, van der Lelij AJ. Ghreline: van eerste
natuurlijke groeihormoon secretagoog tot multifunctioneel peptide. Ned Tijdschr Klin Chem
Labgeneesk 2007; 32: 12-18.
Gauna C, Kiewiet RM, Janssen JAMJL, van de Zande B, Delhanty PJ, Ghigo E, Hofl and LJ, Them-
men AP, van der Lely AJ. Unacylated ghrelin acts as a potent insulin secretagogue in glucose-
stimulated conditions. Am J Physiol Endocrinol Metab 2007; 293: E697-704.
Gauna C, Uitterlinden P, Kramer P, Kiewiet RM, Janssen JAMJL, Delhanty PJ, van Aken MO, Ghigo E,
Hofl and LJ, Themmen AP, van der Lely AJ. Intravenous glucose administration in fasting rats has
diff erential eff ects on acylated and unacylated ghrelin in the portal and systemic circulation: a
comparison between portal and peripheral concentrations in anesthetized rats. Endocrinology
2007; 148: 5278-5287.
Kiewiet RM, Durian MF, Cuijpers LPLH, Hesp WLEM, van Vliet ACM. Quality of Life after Gastric
Banding in Morbidly Obese Dutch Patients: Long-Term Follow-Up. Obes Res Clin Pract 2008; 2:
151-158.
Kiewiet RM, Gauna C, van Aken MO, van de Zande B, van der Lely AJ. Bolus administration of
obestatin does not change glucose and insulin levels neither in the systemic nor in the portal
circulation of the rat. Peptides 2008; 29: 2144-2149.
Kiewiet RM, van Aken MO, van der Weerd K, Uitterlinden P, Themmen AP, Hofl and LJ, de Rijke YB,
Delhanty PJ, Ghigo E, Abribat T, van der Lely AJ. Eff ects of acute administration of acylated and
unacylated ghrelin on glucose and insulin concentrations in morbidly obese subjects without
overt diabetes. Eur J Endocrinol 2009; 161: 567-573.
1.
2.
3.
4.
5.
6.
7.
8.
9.
10.
11.
12.
13.
14.
15.
16.
17.
18.
19.
20.
21.
22.
23.
24.
25.
26.
27.
28.
29.
30.
31.
32.
33.
34.
35.
36.
37.
38.
39.
180
List of publications and presentations
Kiewiet RM, Hazell MJ, van Aken MO, van der Weerd K, Visser JA, Themmen APN, van der Lely AJ.
Acute eff ects of acylated and unacylated ghrelin on total and HMW adiponectin in morbidly
obese subjects. J Endocrinol Invest, in press
ORAL PRESENTATIONS
2001 Regionale Klinische Avond Inwendige Geneeskunde, Rotterdam, The Netherlands
Een schokkend begin van het nieuwe jaar.
2003 Voorjaarsvergadering Nederlandse Vereniging voor Gastroenterologie, Veldhoven,
The Netherlands
Een vrouw met een cholecystitis en obstructie-icterus.
Internistendagen, Maastricht, The Netherlands
Mediterranean Spotted Fever: a family outbreak.
2005 Wetenschapsdag Albert Schweitzer ziekenhuis, Dordrecht, The Netherlands
Maagbandplaatsing bij patiënten met morbide obesitas: Het risico op ontwikkeling van
galstenen.
2006 Regionale Klinische Avond Inwendige Geneeskunde, Rotterdam, The Netherlands
Een halszaak.
2007 Klinische Endocrinologiedagen, Doorwerth, The Netherlands
Riedel’s thyroiditis: successful treatment with prednisone and tamoxifen.
Endo-Neuro-Psycho Meeting, Doorwerth, The Netherlands
Eff ects of acylated and unacylated ghrelin on glucose and insulin metabolism in morbidly
obese subjects without overt diabetes
2010 Rotterdamse Internistendag, Rotterdam, The Netherlands
Chirurgische behandeling van obesitas.
POSTER PRESENTATIONS
2001 United European Gastroenterology Week, Amsterdam, The Netherlands
Morbid obesity and endoscopic signs of hiatal hernia and refl ux oesophagitis.
1.
2.
3.
4.
5.
6.
7.
8.
9.
10.
11.
12.
13.
14.
15.
16.
17.
18.
19.
20.
21.
22.
23.
24.
25.
26.
27.
28.
29.
30.
31.
32.
33.
34.
35.
36.
37.
38.
39.
181
List of publications and presentations
United European Gastroenterology Week, Amsterdam, The Netherlands
Morbid obesity and the prevalence of elevated liver enzymes.
2005 United European Gastroenterology Week, Copenhagen, Denmark
Gallstone formation after weight reduction surgery in morbidly obese patients.
2008 Annual Meeting of the Endocrine Society (ENDO), San Francisco, USA
Eff ects of acylated and unacylated ghrelin on glucose and insulin metabolism in morbidly
obese subjects without overt diabetes


Dank woord

1.
2.
3.
4.
5.
6.
7.
8.
9.
10.
11.
12.
13.
14.
15.
16.
17.
18.
19.
20.
21.
22.
23.
24.
25.
26.
27.
28.
29.
30.
31.
32.
33.
34.
35.
36.
37.
38.
39.
185
Dankwoord
Dit is een memorabel moment. De laatste pagina van het proefschrift nadert. Er is geen beter
moment om terug te kijken op een lange en atypische onderzoeksperiode. Wat ooit begon als
een ‘klein onderzoekje’ in het Albert Schweitzer ziekenhuis groeide uit tot het promotieonder-
zoek dat nu in boekvorm voor u ligt. Het lijkt ideaal om pas halverwege een onderzoekstraject
te besluiten dat het eigenlijk wel een promotie waard is, want dat betekent dat het grootste
deel al achter de rug is en het eind dus in zicht is. Niettemin kan het eind lang in zicht blijven en
lijkt het soms nauwelijks te naderen. Maar goed, hier is het dan!
In de levensloop van dit proefschrift waren twee momenten van cruciaal belang. Het eerste
moment vond plaats tijdens mijn sollicitatiegesprek naar de functie van AGNIO in het Albert
Schweitzer ziekenhuis te Dordrecht. Dr. A.C.M. van Vliet, beste Adrie, jouw vraag of ik misschien
belangstelling had om onderzoek te doen naar de maagbandpatiënten van de heelkundepoli
en mijn positieve antwoord daarop betekende het begin van wat uiteindelijk deel 2 van dit
proefschrift werd. Behalve een (kritische) onderzoeksbegeleider was je in dezelfde periode ook
een (gedegen) opleider in de Interne Geneeskunde. Je bent het klassieke voorbeeld van een
algemeen internist: je bent thuis in elk deelspecialisme van het vak. De eerste keer dat je mijn
advies vroeg over een endocrinologisch probleem was dan ook een bijzonder moment.
Prof. dr. A.J. van der Lelij, beste Aart Jan, het tweede moment was toen we besloten dat
we ‘iets leuks’ zouden gaan doen met ‘jouw’ ghreline en ‘mijn’ dikke mensen. Dit voornemen
resulteerde in eerste instantie in het project beschreven in hoofdstuk 4. Toen ik had bedacht
dat het mogelijk zou moeten zijn om te promoveren, was je direct enthousiast en kon ik aan-
schuiven bij het rattenproject. Is er een masterplan of komt alles toevallig goed uit? Ik heb
moeten wennen aan je zeer effi ciënte timemanagement systeem: je bent er als je nodig bent,
maar wanneer je inschat niet nodig te zijn, ben je er niet. Ik wist aanvankelijk bijvoorbeeld
niet, dat een antwoord op versie 1 van een artikel kon zijn dat het ‘gewoon goed’ was. Nu, als
perifeer specialist, ben ik soms jaloers op dit talent. Last but not least, dank uiteraard dat je me
in opleiding hebt genomen tot endocrinoloog, iets dat later heel schaars bleek te zijn.
Dr. ir. J.A. Visser, beste Jenny, dank dat je als zijinstromende copromotor direct zo enthousiast
en betrokken was.
De leescommissie, bestaande uit prof. dr. J.F. Lange, prof. dr. J.A. Romijn en Prof.dr.ir. A.P.N.
Themmen, wil ik hartelijk danken voor hun (zeer) snelle beoordeling van het manuscript. Beste
Axel, dankzij jouw Engelse contacten kwam hoofdstuk 7 tot stand, waarvoor dank.
Gedurende alle onderzoeksjaren zijn er veel mensen op mijn pad gekomen die me onder-
steund of gestimuleerd hebben. Ik waag een poging hen te noemen, met het risico mensen te
vergeten. Deze laatste categorie dank ik op deze plaats alvast heel hartelijk…
1.
2.
3.
4.
5.
6.
7.
8.
9.
10.
11.
12.
13.
14.
15.
16.
17.
18.
19.
20.
21.
22.
23.
24.
25.
26.
27.
28.
29.
30.
31.
32.
33.
34.
35.
36.
37.
38.
39.
186
Dankwoord
Geen patiëntgebonden onderzoek zonder patiënten, dus alle mensen die van heinde en
verre kwamen om deel te nemen aan het follow up onderzoek na maagbandplaatsing krijgen
daarvoor alle waardering. Van hen heb ik geleerd wat het betekent om te lijden aan obesitas. Ik
heb veel bewondering voor de acht patiënten die bereid waren om gedurende drie weken vier
dagen per week naar het ziekenhuis te komen voor een onderzoek waar zij zelf geen voordeel
van zouden ondervinden. Daarom heel hartelijk dank!
Het Albert Schweitzer ziekenhuis te Dordrecht was een van de eerste ziekenhuizen in Neder-
land waar bariatrische chirurgie verricht werd, wat mij vervolgens een prachtige studiegroep
opleverde waarin lange-termijneff ecten van maagbandplaatsingen geëvalueerd konden
worden. Dr. W.L.E.M. Hesp startte destijds de bariatrische chirurgie. Beste Fried, je was altijd
enthousiast over mijn project en ik vind het bijzonder dat we nu weer nauw samenwerken in
de obesitaswerkgroep.
Drs. L.P.L.H. Cuijpers, beste Luc, jouw suggestie om de RAND-36 te gebruiken als kwaliteit-
van-levenvragenlijst leverde onderzoeksresultaten die internationaal vergelijkbaar waren,
hetgeen daarom voorspoedig resulteerde in een publicatie.
Drs. M.F. Durian, beste Marc, destijds collega arts-assistent, dank dat je (voor een deel) de
interviews met de maagbandpatiënten overnam toen ik met de opleiding startte en verhuisde
van locatie Amstelwijck naar locatie Dordwijk.
In 2005 arriveerde ik in het Erasmus MC, kort nadat dr. M.O. van Aken er gestart was als stafl id
endocrinologie. Beste Maarten, samen werkten we het protocol voor de ‘ghrelintrial’ uit tot het
lijvige onderzoek dat het geworden is. Dank voor je laagdrempeligheid en positieve instelling.
Ik miste je opmerking ‘heel goed, heel goed’ toen je was vertrokken naar het HagaZiekenhuis,
vlak voordat ik vertrok naar Dordrecht.
Ongeveer 1000 bloedafnames en vele kilometers op en neer naar het lab, dat was jouw
investering in het onderzoek, Kim. De kwaliteit van een onderzoek staat of valt met de nauw-
keurigheid van de uitvoerders, dus daarom was ik heel blij toen jij als afstudeerstudent kwam
om me bij te staan. Gelukkig leverde het jou uiteindelijk ook veel op: het onderzoek waar je
inmiddels al een poos intensief mee bezig bent.
Duizend bloedafnames betekent een veelvoud aan laboratoriumbepalingen. Hans van Toor,
maar vooral Piet Uitterlinden, hebben ‘onder supervisie’ van Yolanda de Rijke deze verricht
op het endolab op de 5e verdieping. Beste Piet, wat bleef je bewonderenswaardig vriendelijk
lachen als ik wéér kwam vragen of het al klaar was. Het boek over de Baltische staten mag je
houden…
Dr. C. Gauna, cara Carlotta, abbiamo passato tante ore insieme nel centro per gli sperimenti
sugli animali in mezzo ai ratti. E' stato sempre bello e ci siamo divertite (tranne quando per
1.
2.
3.
4.
5.
6.
7.
8.
9.
10.
11.
12.
13.
14.
15.
16.
17.
18.
19.
20.
21.
22.
23.
24.
25.
26.
27.
28.
29.
30.
31.
32.
33.
34.
35.
36.
37.
38.
39.
187
Dankwoord
sfortuna i ratti morivano alla fi ne dei prelievi) e nel corso delle settimane siamo diventate una
squadra ben funzionante. I ratti ormai non li sogno più... e tu?
Beste Bedette van de Zande, dank voor je hulp bij de bepaling van de glucose- en insuline-
waarden voor het obestatine-onderzoek. Ik heb zelf immers twee linker ‘labhanden’.
Ezio Ghigo, Thierry Abribat, Patric Delhanty and Leo Hofl and, the co authors who have not been
mentioned yet: thank you very much for your scientifi c input. Dear Patric, thanks for your critical
review of the English summary.
Mijn onderzoeksperiode liep parallel aan mijn opleiding tot internist-endocrinoloog. Ik kijk met
veel plezier terug op mijn opleidingsperiode in het Albert Schweitzer ziekenhuis. Daar werd
een goede basis in de Interne Geneeskunde gelegd. De specialisten die mij destijds opleidden
in het vak, zijn nu mijn maten. Ik vind het heel bijzonder dat ik sinds mijn toetreding tot de
maatschap nooit enig gevoel van ongelijkwaardigheid heb gekregen, terwijl we tevoren zo
lang als meester en gezel hadden samengewerkt. Dank ook voor jullie sportieve reactie toen ik
na mijn toetreden als jonge vrouw in de maatschap direct het grootste vooroordeel bevestigde.
Het academische deel van de opleiding Interne Geneeskunde duurde maar een jaar. De
opleider, prof. dr. J.L.C.M. van Saase, leerde ik pas echt goed kennen tijdens de organisatie van
de Rotterdamse Internistendag. Beste Jan, volgende keer kom ik eens gewoon in de zaal zitten.
De periode op de afdeling endocrinologie werd gekenmerkt door hoogstaande patiënten-
zorg, wetenschap, ‘sterke’ verhalen, frequente congressen en veel gezelligheid. Ik heb me er de
endocrinologie zeer grondig eigen kunnen maken. Aart Jan, Wouter, Richard, Joop en Carola,
dank daarvoor.
Terwijl het einde van het dankwoord nadert, wordt het tijd voor de mensen die letterlijk en
fi guurlijk naast me staan.
Zij die letterlijk naast me staan zijn mijn paranimfen, Marieke Segboer-Joosten en Sebastian
Neggers. Sebastian, we begonnen vrijwel tegelijkertijd met ons aandachtsgebied endocrino-
logie en belandden in hetzelfde schuitje toen jij je stortte op het acromegalie-onderzoek naast
je opleiding. Toen we klaar waren met onze opleiding vertrok ik naar het Albert Schweitzer
ziekenhuis en jij bleef in het Erasmus MC, waar je volgens mij prima op je plaats bent. We zullen
elkaar regelmatig tegen blijven komen: op nascholingen (als collega’s) en bij de bakker (als
bijna-buren). Succes met het afronden van je eigen promotie. Marieke, vriendin sinds de eerste
dag van de Eurekaweek in 1992, hier staan we dan, ruim 18 jaar later. We zijn inmiddels twee
artsexamens, twee specialisaties, twee promoties, twee bruiloften en drie kinderen (waaronder
onze bijna-tweeling) verder en ik ben benieuwd wat er allemaal nog gaat komen.
Zij die fi guurlijk naast me staan zijn mijn ouders. Pappa en mamma, jullie hebben me altijd
gestimuleerd om optimaal gebruik te maken van mijn capaciteiten en wanneer ik er eens toe
neigde de makkelijkere weg te kiezen, wisten jullie me heel subtiel weer op het ‘juiste’ pad te

1.
2.
3.
4.
5.
6.
7.
8.
9.
10.
11.
12.
13.
14.
15.
16.
17.
18.
19.
20.
21.
22.
23.
24.
25.
26.
27.
28.
29.
30.
31.
32.
33.
34.
35.
36.
37.
38.
39.
188
Dankwoord
brengen. Bedankt ook voor alle praktische hulp door de jaren heen. Vooral alle keren dat jullie
de laatste tijd op Max hebben gepast was een typisch voorbeeld van een win-win-win situatie.
En dan tot slot mijn twee mannen. Lieve Rob, we kennen elkaar al zo lang, wat zal ik nog
eens zeggen. Moet ik je bedanken voor je nuchterheid en relativeringsvermogen? Of voor het
feit dat je altijd mijn computerhelpdesk bent? Ik kan denk ik volstaan met de opmerking dat we
nou eenmaal een heel goed team zijn. Wie kan er nou echt samen gezellig behangen? Wij dus!
En voor mijn kleine man Max: “Zoooo, klaaaaarrrr. Pakke, soene, buite!!!”


Curric ulum Vitae


1.
2.
3.
4.
5.
6.
7.
8.
9.
10.
11.
12.
13.
14.
15.
16.
17.
18.
19.
20.
21.
22.
23.
24.
25.
26.
27.
28.
29.
30.
31.
32.
33.
34.
35.
36.
37.
38.
39.
193
Curriculum Vitae
Rosalie Kiewiet-Kemper werd geboren te Dordrecht op 25 juni 1974. Haar VWO-diploma
behaalde zij (cum laude) aan het Gymnasium Camphusianum te Gorinchem in 1992. Aan-
sluitend startte zij met de studie geneeskunde aan de Erasmus Universiteit te Rotterdam. Na
het (cum laude) behalen van het artsexamen in december 1998 was zij van januari 1999 tot
juni 2000 werkzaam als assistent-geneeskundige niet in opleiding op de afdeling Neurologie
van het Erasmus MC te Rotterdam. In juni 2000 werd zij vervolgens assistent-geneeskundige
niet in opleiding op de afdeling Interne Geneeskunde van het Albert Schweitzer ziekenhuis te
Dordrecht. In deze periode werd een begin gemaakt met het onderzoek naar late gevolgen van
maagbandoperaties als behandeling van morbide obesitas onder supervisie van dr. A.C.M. van
Vliet. Op 1 januari 2002 startte zij met de opleiding Interne Geneeskunde in het Albert Schweit-
zer ziekenhuis te Dordrecht (opleider dr. A.C.M. van Vliet). Na 3 jaar werd de opleiding vervolgd
in het Erasmus MC te Rotterdam (opleider prof.dr. J.L.C.M. van Saase). In 2006 trad zij toe tot het
aandachtsgebied Endocrinologie (opleider prof.dr. A.J. van der Lelij, later dr. W.W. de Herder).
In deze periode werd een belangrijk stuk van het onderzoek naar de metabole aspecten van
obesitas verricht. Per 1 januari 2008 werd de opleiding tot internist-endocrinoloog voltooid.
Hierna was zij gedurende 6 maanden werkzaam als internist-endocrinoloog in het Erasmus MC.
Op 1 augustus 2008 trad zij toe tot de maatschap Internisten en Maag-Darm-Leverartsen van
het Albert Schweitzer ziekenhuis te Dordrecht.
Rosalie Kiewiet-Kemper is getrouwd met Rob Kemper. Zij hebben een zoon, Max.
Related Documents