Working group CS Presenter Keynote Speaker Expert Rapporteaur Attendance Co-chair Reptiles and amphibians Charlie Manolis NO Peter Paul van Dijk YES Mark Auliya NO Paola Mosig YES Robert W. G. Jenkins YES Sabine Schoppe YES Solomon Kyalo YES Simon Nemtzov YES Thomasina Oldfield YES Victoria Lichtschein NO Total Participants : 10 Viernes, 05 de Diciembre de 2008 Página 7 de 13

Welcome message from author
This document is posted to help you gain knowledge. Please leave a comment to let me know what you think about it! Share it to your friends and learn new things together.
Transcript

Working group CS
Presenter
Keynote
Speaker
Expert Rapporteaur AttendanceCo-chair
Reptiles and amphibians
Charlie Manolis NO
Peter Paul van Dijk YES
Mark Auliya NO
Paola Mosig YES
Robert W. G. Jenkins YES
Sabine Schoppe YES
Solomon Kyalo YES
Simon Nemtzov YES
Thomasina Oldfield YES
Victoria Lichtschein NO
Total Participants : 10
Viernes, 05 de Diciembre de 2008 Página 7 de 13
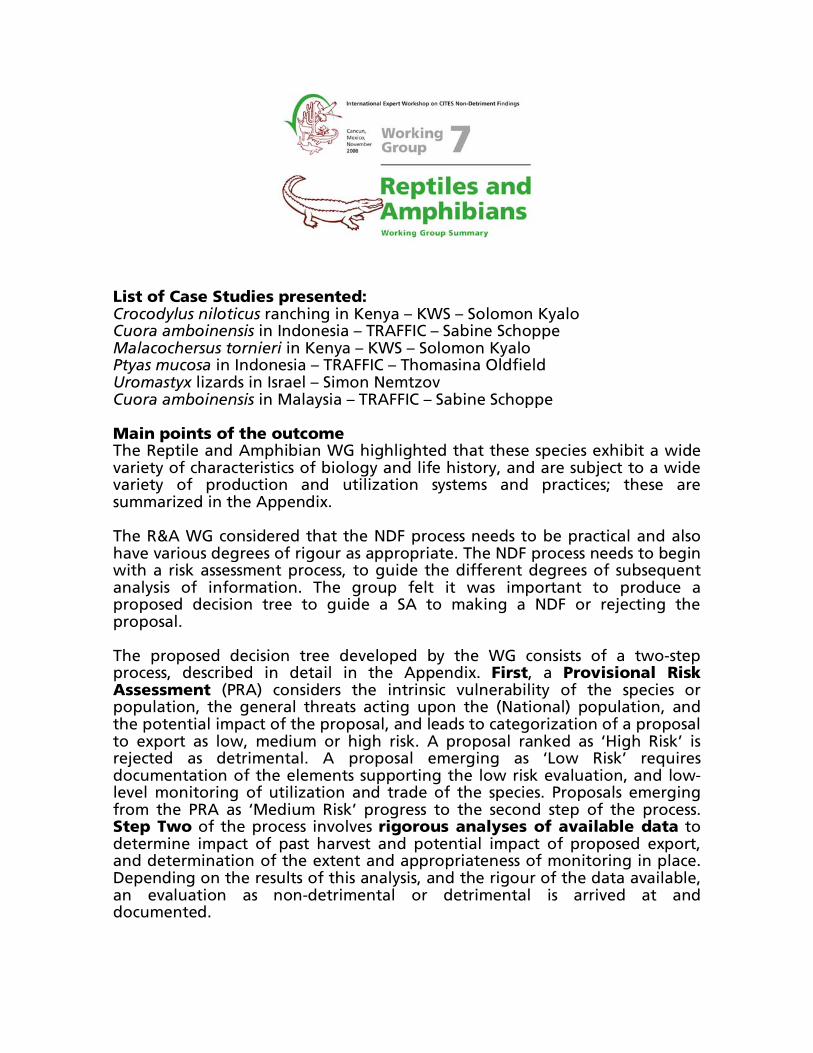
List of Case Studies presented: Crocodylus niloticus ranching in Kenya – KWS – Solomon Kyalo Cuora amboinensis in Indonesia – TRAFFIC – Sabine Schoppe Malacochersus tornieri in Kenya – KWS – Solomon Kyalo Ptyas mucosa in Indonesia – TRAFFIC – Thomasina Oldfield Uromastyx lizards in Israel – Simon Nemtzov Cuora amboinensis in Malaysia – TRAFFIC – Sabine Schoppe Main points of the outcome The Reptile and Amphibian WG highlighted that these species exhibit a wide variety of characteristics of biology and life history, and are subject to a wide variety of production and utilization systems and practices; these are summarized in the Appendix. The R&A WG considered that the NDF process needs to be practical and also have various degrees of rigour as appropriate. The NDF process needs to begin with a risk assessment process, to guide the different degrees of subsequent analysis of information. The group felt it was important to produce a proposed decision tree to guide a SA to making a NDF or rejecting the proposal. The proposed decision tree developed by the WG consists of a two-step process, described in detail in the Appendix. First, a Provisional Risk Assessment (PRA) considers the intrinsic vulnerability of the species or population, the general threats acting upon the (National) population, and the potential impact of the proposal, and leads to categorization of a proposal to export as low, medium or high risk. A proposal ranked as ‘High Risk’ is rejected as detrimental. A proposal emerging as ‘Low Risk’ requires documentation of the elements supporting the low risk evaluation, and low-level monitoring of utilization and trade of the species. Proposals emerging from the PRA as ‘Medium Risk’ progress to the second step of the process. Step Two of the process involves rigorous analyses of available data to determine impact of past harvest and potential impact of proposed export, and determination of the extent and appropriateness of monitoring in place. Depending on the results of this analysis, and the rigour of the data available, an evaluation as non-detrimental or detrimental is arrived at and documented.

The WG concluded by highlighting general issues to improve implementation of the NDF process:
o The need to develop practical, scientifically acceptable monitoring programs, and to avoid incompatible methodologies which prevent consistent long-term assessment.
o The need to summarize and distribute field research methodologies. o The desirability of establishing a repository of NDFs that have been
made, so that they can be consulted by others for comparison and capacity building.
The desirability of setting up web-based tools and information management systems where SAs can easily access pertinent information.

WG7 – FR p.1
WG Members: Peter Paul Van Dijk – Co-chair – IUCN Tortoise and Freshwater Turtle SG; Thomasina Oldfield – Co-chair – TRAFFIC International; Hank Jenkins - Species Management Specialists, Inc.; Solomon Kyalo – Kenya CITES MA/SA; Simon Nemtzov – Israel CITES SA; Sabine Schoppe – TRAFFIC consultant. Additional Occasional Participants: Hesiquio Benitez – Conabio; David Morgan – CITES Secretariat; Colman Ó Criodain – WWF International; Yolanda Barrios and Paola Mosig – Rapporteurs List of Case Studies presented: Crocodylus niloticus ranching in Kenya – KWS – Solomon Kyalo Cuora amboinensis in Indonesia – TRAFFIC – Sabine Schoppe Malacochersus tornieri in Kenya – KWS – Solomon Kyalo Ptyas mucosa in Indonesia – TRAFFIC – Thomasina Oldfield Uromastyx lizards in Israel – Simon Nemtzov Cuora amboinensis in Malaysia – TRAFFIC – Sabine Schoppe Main points of the outcome The Reptile and Amphibian WG highlighted that these species exhibit a wide variety of characteristics of biology and life history, and are subject to a wide variety of production and utilization systems and practices; these are summarized in the Appendix. The R&A WG considered that the NDF process needs to be practical and also have various degrees of rigour as appropriate. The NDF process needs to begin with a risk assessment process, to guide the different degrees of subsequent analysis of information. The group felt it was important to produce a proposed decision tree to guide a SA to making a NDF or rejecting the proposal. The proposed decision tree developed by the WG consists of a two-step process, described in detail in the Appendix. First, a Provisional Risk Assessment (PRA) considers the intrinsic vulnerability of the species or population, the general threats acting upon the (National) population, and the potential impact of the proposal, and leads to categorization of a
WG7 – FR p.2
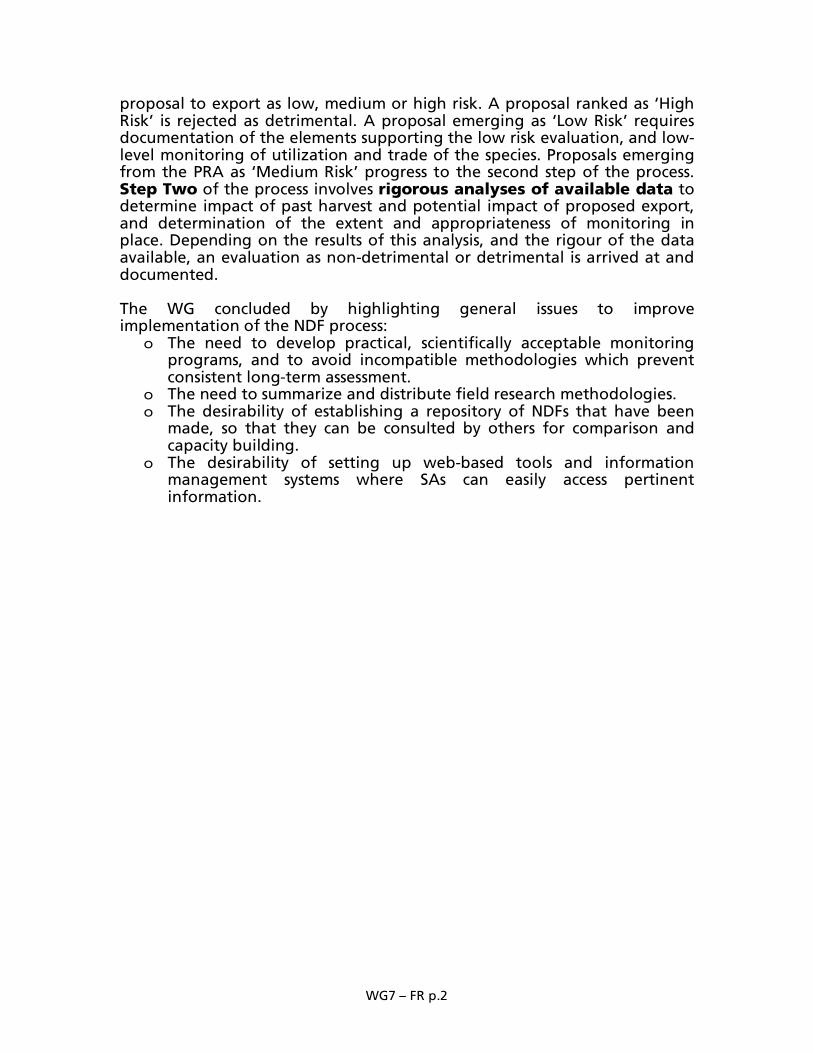
proposal to export as low, medium or high risk. A proposal ranked as ‘High Risk’ is rejected as detrimental. A proposal emerging as ‘Low Risk’ requires documentation of the elements supporting the low risk evaluation, and low-level monitoring of utilization and trade of the species. Proposals emerging from the PRA as ‘Medium Risk’ progress to the second step of the process. Step Two of the process involves rigorous analyses of available data to determine impact of past harvest and potential impact of proposed export, and determination of the extent and appropriateness of monitoring in place. Depending on the results of this analysis, and the rigour of the data available, an evaluation as non-detrimental or detrimental is arrived at and documented. The WG concluded by highlighting general issues to improve implementation of the NDF process:
o The need to develop practical, scientifically acceptable monitoring programs, and to avoid incompatible methodologies which prevent consistent long-term assessment.
o The need to summarize and distribute field research methodologies. o The desirability of establishing a repository of NDFs that have been
made, so that they can be consulted by others for comparison and capacity building.
o The desirability of setting up web-based tools and information management systems where SAs can easily access pertinent information.

WG7 – FR p.3
Figure 1. Outline flow chart of NDF process as developed by WG7 – Reptiles & Amphibians.
Figure 2. Flow chart of 2nd step of NDF process as developed by WG7 – Reptiles & Amphibians.

WG7 – FR p.4
APPENDIX Special considerations for NDFs for Reptiles and Amphibians Reptiles and Amphibians exhibit a wide range of life history aspects, including species with characters that make them particularly susceptible to negative impacts from utilization, such as late maturity, long life span, and limited re-productive output (K-selected, slow), and habitat specialization. Other species display life history traits allowing them to recover from reasonable l.evels of utilization, such as high natural mortality at early life stages, high fecundity, and adaptability to human-altered biotopes. Most species have limited dispersal. Extensive experience of production exists through ranching of crocodilian species and aquaculture of a few turtle and frog species. There is also an extensive history of reptile and amphibian populations and species that have been over-exploited, and/or subjected to the Review of Significant Trade process. The WG considered that an NDF for reptile or amphibian species should consider the following biological and status elements: distribution and geographical variation; population size / density; vulnerability at the stage of harvest; size distribution, population structure; life history traits / reproductive capacity; ecological adaptability; dispersal capability; role in ecosystem; possible status of pest or invasive species.
The NDF should also consider the following data on utilization: Utilized population segment or life history stage (eggs/juveniles/adults, males/females) (size and weight limits); Production systems; Captive breeding / ranching; Nuisance animals; Legal and illegal trade issues; Utilization quantities; Collection methodology; Collection location; Tenure (exclusivity of utilization, jurisdiction over utilization, resource ownership); Closure periods; Effect of utilization. Finally, the WG considered that an appropriate monitoring program for a utilized reptile or amphibian population should evaluate one or more of the following elements:
Changes in Distribution; Changes in density; Changes in population structure; Collection areas (Proportion of total distribution, and change of areas); Catch per unit effort; Legal issues; and Other threats (habitat loss, climate change, pollution, etc.).
The WG recognized that reptiles and amphibians are subject to a variety of export proposals requiring NDFs, including ad-hoc / once-off permit applications and annual quotas. In addition, a number of Crocodile populations are subject to ranching systems following CoP approvals of proposals for downlisting populations from Appendix I to II for purposes of ranching. Trade in specimens from these systems is governed by Res.Conf. 11.16. The acceptance by the CoP of a proposal to downlist a population from Appendix I to II represents an NDF, and impacts and conservation benefits are monitored through the reporting requirements of Res.Conf. 11.16.

WG7 – FR p.5
While much of the WG’s deliberations were informed by the reptile case studies, consideration of some amphibian test cases indicate that our process and conclusions are applicable to amphibians as well. The NDF Process as Developed by the Reptiles and Amphibians Working Group” Step 1 – Provisional Risk Assessment. A ‘quick and dirty’ process to allow SA to make early assessment of the proposal. The Provisional Risk Assessment examines three major areas:
o The intrinsic vulnerability of the species or population. o General threats acting upon the (National) population. o The potential impact of the proposal.
The Intrinsic Vulnerability of the species or population examines its distribution, dispersal, population size / density, reproductive capacity, niche width, and role in the ecosystem. General Threats acting on population that should be considered are levels of domestic use, illegal trade, human-induced impacts (such as habitat loss, pollution, human-animal conflict), invasives, diseases, and any other relevant threats. The potential impact of the proposal to export includes consideration of the quantity or proportion of population targeted, the life stage targeted, the harvest method, harvest purpose, harvest area, effectiveness of regulation and management, and consideration of monitoring data. The Provisional Risk Assessment leads to categorization of a proposal to export as low, medium or high risk. This categorization is made through a simple scoring system, detailed in the full working group report. This scoring system requires further consideration, refinement and evaluation, but the WG felt it was important to demonstrate the concept. We felt that quantifying the initial risk was important as guidance to the SA to indicate those proposals that could be relatively easily processed, and not require the resources inherent in a rigorous NDF analysis. Low Risk – Non-detriment finding made. SA ensures that low level monitoring programme is instituted, comprising monitoring of permits vs. actual take, accumulation of permits, and a ‘low-key’ harvest impact monitoring program (trader interviews, casual field observations). These data should be evaluated for subsequent requests in future years. High Risk – Unacceptable risk, leading to rejection of proposal; any amended proposal requires re-evaluation from the beginning of the provisional risk assessment process. Medium Risk – goes into step 2 of the process. Step 2 – Analysis of available monitoring data and management This part of the process involves determination of the extent and appropriateness of monitoring in place and rigorous analyses of available data to determine impact of past harvest and potential impact of proposed export. For reptile and amphibian species, an appropriate monitoring

WG7 – FR p.6
program is considered to collect, analyse and evaluate data on parameters such as: changes in density, distribution, and demography of the harvested population, harvest location, harvest amount (number and/or weight), harvest method, demographic segments subject to harvest (age, gender), monitoring of permits vs. actual take, and accumulation of permits. If appropriate monitoring is in place, the SA should analyze and evaluate past monitoring data to determine whether previous similar harvests have had negative or no negative impact; if no negative impacts are apparent, a positive NDF can be made for ongoing harvest at a comparable level. If appropriate monitoring is not in place, the MA should ensure that an appropriate monitoring program is established. Once such a monitoring program is committed to, and subject to establishing a precautionary level of permitted harvest or quota, and subject to approval of these measures by the SA, a positive NDF can be made. Once monitoring is in place for an appropriate length of time, the results of the monitoring program should guide/inform the decision process for ongoing or subsequent applications for trade in the species. In cases where the monitoring program documents a negative impact from harvest, the harvest regime must be adjusted by, for example: reduction of quota, imposing or changing minimum or maximum size or other restrictions on size, age or gender of individuals exploited, season closures, closed areas, rotation of harvest areas or other time/area restrictions, revising methods of harvest, measures to address illegal trade and/or other threats, and/or other conservation measures to protect and/or augment populations; support by the proponent for such measures is recommended. A (temporary) zero export quota or cessation of harvest is the other option. A subsequent NDF can only be made when the SA is satisfied that the adjusted harvest regime will represent no threat to the survival of the species in the wild and to recovery of the population to its pre-harvest level.

WG7 – FR p.7
Sources of information on Reptile and Amphibian status, biological research and monitoring methodologies.
IUCN Red List of Threatened Species: http://www.iucnredlist.org
Crocodile information: http://www.flmnh.ufl.edu/cnhc/cbd.html
Turtle taxonomy, plus conservation biology accounts for selected species: http://www.iucn-tftsg.org/checklist/
Reptilian taxonomy and distribution: http://www.reptile-database.org/
Amphibian taxonomy and biology: http://www.globalamphibians.org/
Measuring and Monitoring Biological Diversity - Standard Methods for Amphibians. Edited by W. Ronald Heyer, Maureen A. Donnelly, Roy W. McDiarmid, Lee-Ann C. Hayek, and Mercedes S. Foster. 1994. Smithsonian Institution Press. 384 pages. ISBN 1-56098-284-5.
Sampling Rare or Elusive Species: Concepts, Designs, and Techniques for Estimating Population Parameters. William L. Thompson. 2004. Island Press. 429 pages. ISBN 1559634510, 9781559634519
Occupancy Estimation and Modeling: Inferring Patterns and Dynamics of Species Occurrence. Darryl I. MacKenzie, James D. Nichols, J. Andrew Royle, Kenneth H. Pollock, Larissa L. Bailey, James E. Hines. 2006. Academic Press. 324 pages. ISBN 0120887665, 9780120887668
Handbook of Capture-Recapture Analysis. Edited by Steven C. Amstrup, Trent L. McDonald, Bryan F. J. Manly. 2005. Princeton University Press. 313 pages. ISBN 069108968X, 9780691089683
Working Group 7
Reptiles and Amphibians

Proposed harvest subject to NDF:
• Ad-hoc once-off permit applications
• Annual quota setting
• Ranching systems
subject to Res Conf 11.16 :
NDF is represented by acceptance of proposal
by CoP and monitored by reporting
requirements
WG7 Reptiles & Amphibians

Application for permit or Proposal for quota
No
Risk Assessment:
No negative impact
NDF – YES(initiate / continue
monitoring in case of ongoing harvests)
NDF - NO
Adjust harvest regime
Zero Export Quota / Cease harvest
MA to establish baseline monitoring and set conservative quota / harvest regulations (to be approved by SA)
Low Risk
Medium Risk
NDF - NO
Adjust and resubmit proposal
Is there appropriate monitoring in place?
Analyze and Evaluate past Monitoring Data
Yes
Negative impact of similar harvest
High Risk
WG7 Reptiles & Amphibians

Risk Assessment of proposed harvest
Intrinsic vulnerability of species [population]• Distribution, dispersal
• Population size / density
• Reproductive capacity
• Niche width
• Role in Ecosystem
General Threats acting on population• Illegal trade
• Invasives, diseases, etc.
• Human-induced impacts (habitat loss, pollution)
• Domestic use
Potential Impact of Proposed Harvest• Quantity or proportion of population
• Life stage targeted
• Harvest method
• Harvest purpose
• Harvest area
• Effectiveness of regulation and management
Broad categorization as Low, Medium, or High
Risk WG7 Reptiles & Amphibians

PRE-NDF RISK SCORE Croc. Cuora U.or.U.
aeg.Ptyas Mala. Rana
MI
N
MA
X
1. Intrinsic vulnerability of
the speciesLow =1, High = 5 2 2.5 5 4 1 5 1 1 5
Weight Distribution, dispersal
2 Population size / density
Reproductive capacity
Niche width
2. General threats on the
populationLow =1, High = 5 2.5 4 3 4 3 4 2.5 1 5
Weight Illegal trade
1 Invasives, diseases, etc.
Human-induced impacts (habitat loss, pollution)
Domestic use
3. Potential impact of
proposed harvestLow =1, High = 5 1.5 4 5 3 4 4 3.5 1 5
Weight Quantity or proportion of population
2 Life stage targeted
Harvest method
Harvest purpose Pts.: 5.0 25.0
Harvest area
Effectiveness of regulation and management
Weighted "Pre-NDF Risk Score" 1.9 3.4 4.6 3.6 2.6 4.4 2.3 1.0 5.0
Low Med High High Med High MedLo
wHigh
0
2 0 - 2.0 Low
3.5 2.1 - 3.5 Med
WG7 Reptiles & Amphibians5 3.6 - 5.0 High

Low risk of proposed harvest event
Examples: Ad hoc ‘small’ one-off exports
Annual small harvest of ‘disposable’ life
stage
Likely positive NDF:
Document the data used to arrive at evaluation as ‘low
risk’
Implement ‘casual’ monitoring program:
• Monitor permits vs. actual take & accumulation of
permits
• Implement ‘low-key’ harvest impact monitoring
program
(trader interviews, casual field observations)WG7 Reptiles & Amphibians
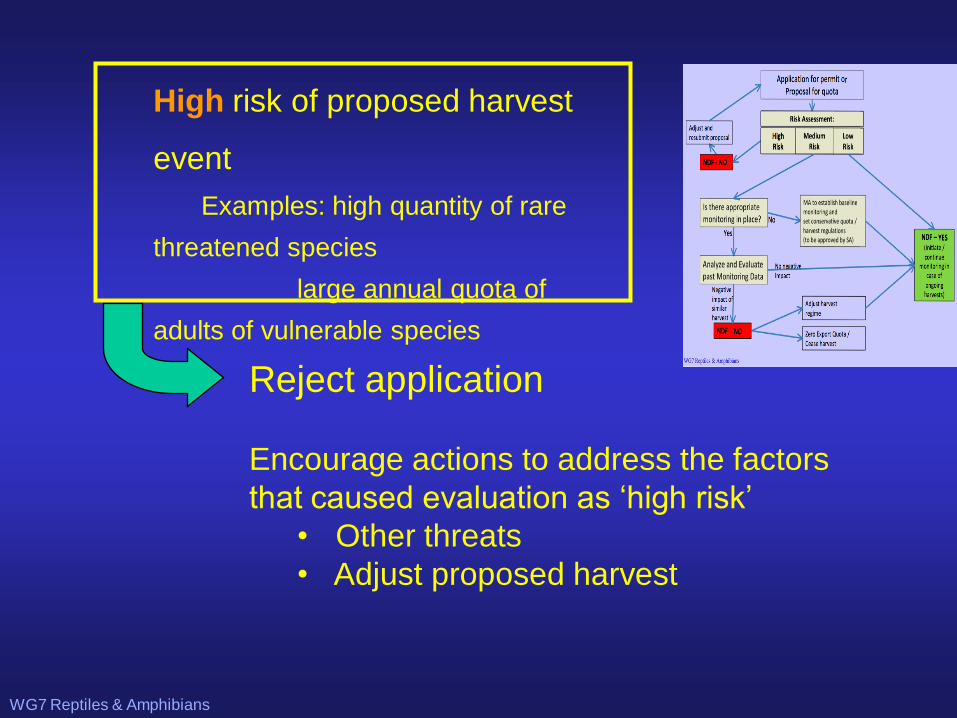
High risk of proposed harvest
event
Examples: high quantity of rare
threatened species
large annual quota of
adults of vulnerable species
Reject application
Encourage actions to address the factors
that caused evaluation as ‘high risk’
• Other threats
• Adjust proposed harvest
WG7 Reptiles & Amphibians

Application for permit or Proposal for quota
No
Risk Assessment:
No negative impact
NDF – YES(initiate / continue
monitoring in case of ongoing harvests)
NDF - NO
Adjust harvest regime
Zero Export Quota / Cease harvest
MA to establish baseline monitoring and set conservative quota / harvest regulations (to be approved by SA)
Low Risk
Medium Risk
NDF - NO
Adjust and resubmit proposal
Is there appropriate monitoring in place?
Analyze and Evaluate past Monitoring Data
Yes
Negative impact of similar harvest
High Risk
WG7 Reptiles & Amphibians
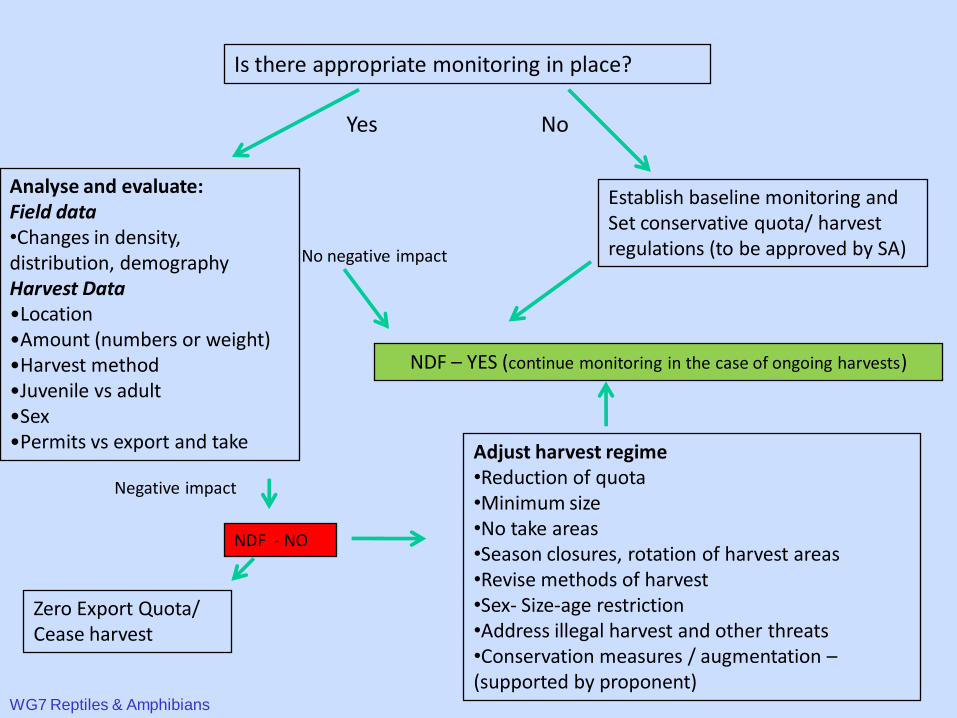
Is there appropriate monitoring in place?
NoYes
Analyse and evaluate: Field data•Changes in density, distribution, demographyHarvest Data•Location •Amount (numbers or weight)•Harvest method•Juvenile vs adult•Sex•Permits vs export and take
No negative impact
NDF – YES (continue monitoring in the case of ongoing harvests)
NDF - NO
Adjust harvest regime•Reduction of quota•Minimum size•No take areas•Season closures, rotation of harvest areas•Revise methods of harvest•Sex- Size-age restriction•Address illegal harvest and other threats•Conservation measures / augmentation –(supported by proponent)
Negative impact
Zero Export Quota/ Cease harvest
Establish baseline monitoring and Set conservative quota/ harvest regulations (to be approved by SA)
WG7 Reptiles & Amphibians
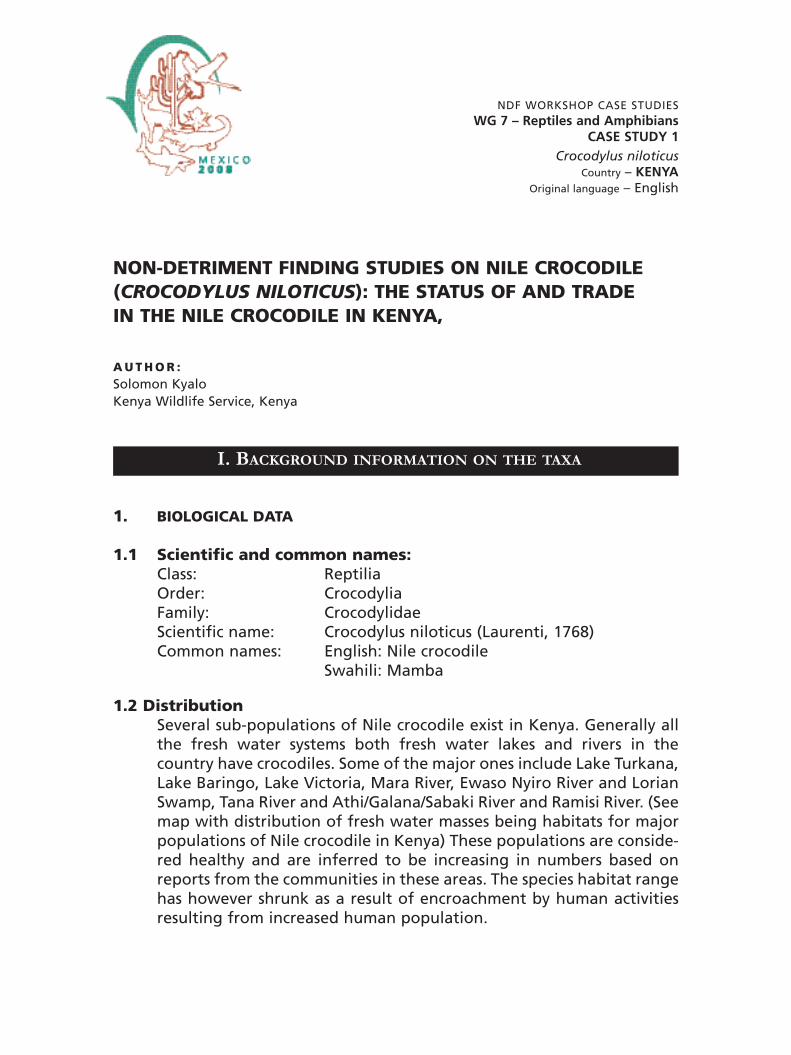
NDF WORKSHOP CASE STUDIESWG 7 – Reptiles and Amphibians
CASE STUDY 1
Crocodylus niloticusCountry – KENYA
Original language – English
NON-DETRIMENT FINDING STUDIES ON NILE CROCODILE(CROCODYLUS NILOTICUS): THE STATUS OF AND TRADEIN THE NILE CROCODILE IN KENYA,
A U T H O R :Solomon KyaloKenya Wildlife Service, Kenya
1. BIOLOGICAL DATA
1.1 Scientific and common names:Class: ReptiliaOrder: CrocodyliaFamily: CrocodylidaeScientific name: Crocodylus niloticus (Laurenti, 1768)Common names: English: Nile crocodile
Swahili: Mamba
1.2 Distribution Several sub-populations of Nile crocodile exist in Kenya. Generally allthe fresh water systems both fresh water lakes and rivers in thecountry have crocodiles. Some of the major ones include Lake Turkana,Lake Baringo, Lake Victoria, Mara River, Ewaso Nyiro River and LorianSwamp, Tana River and Athi/Galana/Sabaki River and Ramisi River. (Seemap with distribution of fresh water masses being habitats for majorpopulations of Nile crocodile in Kenya) These populations are conside-red healthy and are inferred to be increasing in numbers based onreports from the communities in these areas. The species habitat rangehas however shrunk as a result of encroachment by human activitiesresulting from increased human population.
I. BACKGROUND INFORMATION ON THE TAXA

1.3 Biological characteristics
1.3.1 General biological and life history characteristicsNile crocodile (Crocodylus niloticus) is an egg laying reptilian spe-cies. Eggs are laid between August and March in nests with clutch
WG 7 – CASE STUDY 1– p.2

sizes of between 20 -60 eggs. The eggs weigh between 70-110Grams and length between 65-80 cm and width between 40-45 cm.The Nile crocodile is sexually dimorphic with growing upto 30% lar-ger than the females. Males regularly grow to 5m and can weighmore than 500 kg.
1.3.2 Habitat typesThe species occurs in fresh water wetlands, in lakes, rivers, marshesand dams. The dry stream beds, river banks and sandy shores of thewetlands provide preferred nesting sites where eggs are depositedduring laying season usually between September and January.
1.3.3 Role of the species in its ecosystemNile crocodile is a predator species whose diet is very broad and inclu-des aquatic invertebrates, fish, amphibians, birds and other reptiles.Hatchlings eat insects and small aquatic invertebrates. Adults can takea wide range of large vertebrates. The species plays a significant rolein the ecosystem and is responsible for checking populations of otheraquatic species such as the barbell catfish.
The species is a problem animal, killing people and their livestockmore than any other wild animal in many areas where they co-habit.It probably causes more human deaths than any other wild animal inAfrica (Hirschoff et al 1996).
1.4 Population:
1.4.1 Global population sizeGlobal population of Nile crocodile in the wild is estimated between250,000-500,000. This population is distributed throughout Africa andMadagascar in suitable habitats. Its distribution extends from Senegalriver, Lake Chad, Wadai and Sudan to the Kunene and the Okavangodelta. In Madagascar, the species occurs in the Western and Southernparts from Sembrirano to Port Dauphin
1.4.2. Current Global population trends_X__increasing ___decreasing ___stable ____unknown
The general trend for the global population of Nile crocodile is incre-asing although in most cases its range is shrinking as a result of incre-asing human population hence pressure demand for land in the spe-cies habitats
WG 7 – CASE STUDY 1 – p.3

1.5 Conservation status
1.5.1 Global conservation status (according to IUCN Red List):___Critically endangered ___Near Threatened___Endangered _X_Least concern___Vulnerable ___Data deficient
The species was listed under IUCN as Vulnerable in 1990 (Baillie &Groombridge, 1990) and later in 1996 as species of Lower Risk but wasnot subsequently listed in 2000, and 2003.
The species is listed in Appendix I of CITES (threatened with extinc-tion) in most of its range except populations of Botswana, Ethiopia,Kenya, Madagascar, Malawi, Mozambique, Namibia, South Africa,Uganda, The United Republic of Tanzania (subject to an annual exportquota of no more than 1600 wild specimens including hunting quotas,in addition to ranched specimens), Zambia and Zimbabwe that are inAppendix II (not threatened but trade must be controlled) for purpo-ses of ranching in accordance with Resolution Conf. 11.16.
1.5.2 National conservation status for the case study countryThe Tana River has the biggest living population of Nile crocodile(Crocodylus niloticus) in Kenya. The Tana River is the longest river inKenya stretching over a total length of 1,000 km and has the largestcatchments area of about 95,000 km square ; an approximately 17% ofthe Kenya land mass. It flows for most of its course across semi-aridand arid regions meandering through alluvial floodplain of varyingwidth from 2km in the middle to 40km in the lower delta region. Itenters the Indian Ocean through the Ozi River being the main channelnear Kipini. The river has been the source of crocodile eggs for bree-ding operations registered with KWS and CITES in accordance with theprovisions of CITES Resolution Conf. 11.16 on Ranching and Trade inRanched specimens of species transferred from Appendix I to II for ran-ching purposes. Kenya population of Crocodylus niloticus is listed inCITES Appendix II following its transfer from Appendix I in 1995 forranching purposes. CITES ranching requirements stipulate the need forfrequent assessment of crocodile numbers within areas of their exploi-tation to ensure sustainability.
Several crocodile population surveys and assessments have been donein Kenya however only populations of the lower reaches of Tana Riverhave been significantly studied. The objectives of the surveys are fourfold:• Conduct a crocodile count to determine the species population size
within designated section of the water system delineated for thespecies utilization program;
WG 7 – CASE STUDY 1– p.4
• Determine the suitability and viability of the crocodile populationfor ranching purposes,
• Recommend conservation and management strategies for this cro-codile population,
• Recommend possible utilization quotas that are sustainable
Crocodile census is an exercise that requires specialized herpetologicaltraining skills and resources. There are no up-to date comparative stu-dies done to estimate the population of the Nile crocodile in thecountry. The latest census conducted in Kenya was in 1995 and invol-ved Kenya Wildlife Service, the CITES Management Authority andNational Museums of Kenya (NMK), the Scientific Authority for Kenya.The surveys covered the lower reaches of Tana River system. There arefew recent data based on the species monitoring through egg collec-tion for ranching operations but it is evident that Kenya has a largepopulation of the Nile crocodile not under any immediate threat.Planning for a survey of the Nile crocodile in its major distributionareas is underway and data to be generated will be used to update thenational conservation of the species.
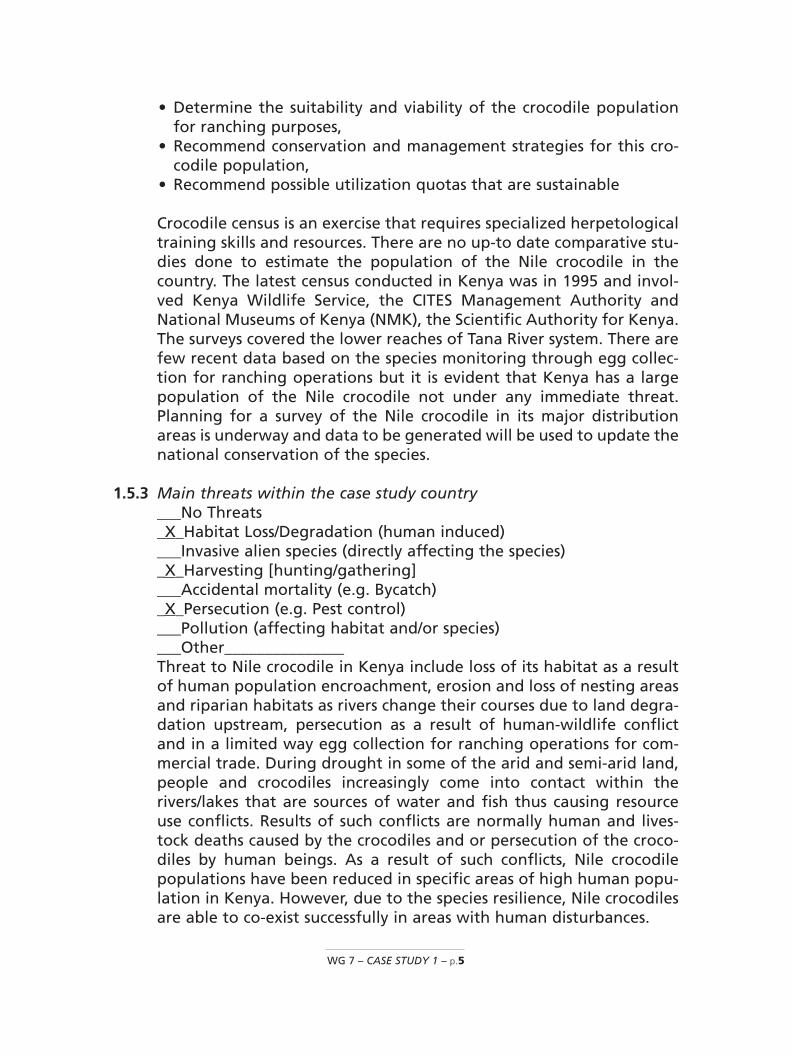
1.5.3 Main threats within the case study country___No Threats_X_Habitat Loss/Degradation (human induced) ___Invasive alien species (directly affecting the species) _X_Harvesting [hunting/gathering] ___Accidental mortality (e.g. Bycatch)_X_Persecution (e.g. Pest control)___Pollution (affecting habitat and/or species) ___Other_______________Threat to Nile crocodile in Kenya include loss of its habitat as a resultof human population encroachment, erosion and loss of nesting areasand riparian habitats as rivers change their courses due to land degra-dation upstream, persecution as a result of human-wildlife conflictand in a limited way egg collection for ranching operations for com-mercial trade. During drought in some of the arid and semi-arid land,people and crocodiles increasingly come into contact within therivers/lakes that are sources of water and fish thus causing resourceuse conflicts. Results of such conflicts are normally human and lives-tock deaths caused by the crocodiles and or persecution of the croco-diles by human beings. As a result of such conflicts, Nile crocodilepopulations have been reduced in specific areas of high human popu-lation in Kenya. However, due to the species resilience, Nile crocodilesare able to co-exist successfully in areas with human disturbances.
WG 7 – CASE STUDY 1 – p.5

2. SPECIES MANAGEMENT WITHIN THE COUNTRY FOR WHICH CASESTUDY IS BEING PRESENTED
2.1 Management Measures
2.1.1 Management historyThe Nile crocodile (Crocodylus niloticus) was listed in CITES Appendix Iat the plenipotentiary conference (Washington D.C, 1973) where CITESwas adopted and signed. It is still included in Appendix I as a specieswhile a number of national populations have been transferred toAppendix II including the Kenya population. All populations ofCrocodylus niloticus are therefore in Appendix I except the popula-tions of Botswana, Ethiopia, Kenya , Madagascar, Namibia, SouthAfrica, Uganda, the United Republic of Tanzania(subject to an annualexport quota of no more than 1,600 wild specimens including huntingtrophies in addition to ranched specimens), Zambia and Zimbabwe.
Kenya did make a successful proposal to transfer its population ofNile crocodile (Crocodylus niloticus) from Appendix I to Appendix II forranching purpose at the Eighth Meeting of the Conference of theParties (CoP8) in 1992. Trade in the species is only with ranching ope-ration specimens. Eggs for the ranching operations are collected inareas outside protected areas and therefore all populations inside pro-tected areas are fully protected from harvesting.
2.1.2 Purpose of the management plan in placeA management plan for Kenya population of Nile crocodile was deve-loped in 1990 to provide for a code of ranching practice and guideli-nes. In accordance with CITES Resolution Conf. 11.16 on ranching andtrade in ranched specimens of species transferred from Appendix I toAppendix II, each Party that has made successful proposal to transfera population of a species in Appendix I to Appendix II for ranchingpurposes should submit to the CITES Secretariat annual reports on allrelevant aspects of each approved ranching operation to include thefollowing:
a) Status of the wild population of the species concernedb) Number of specimens(eggs, young or adults) taken annually from
the wildc) An estimate percentage of the production of the wild population
that is taken for the ranching operationd) Number of animals released back to the wild and their survival
rates estimated on the basis of survey and tagging program if anye) Mortality rates in captivity and causes of such mortality
WG 7 – CASE STUDY 1– p.6
f) Production sales and exports of the products and g) Conservation programs and scientific experiments carried out in
relation to the ranching operation or the wild population concer-ned
There is currently a strong focus by the MA towards ensuring there isimproved compliance and enforcement of the code of practice andproduction standards.
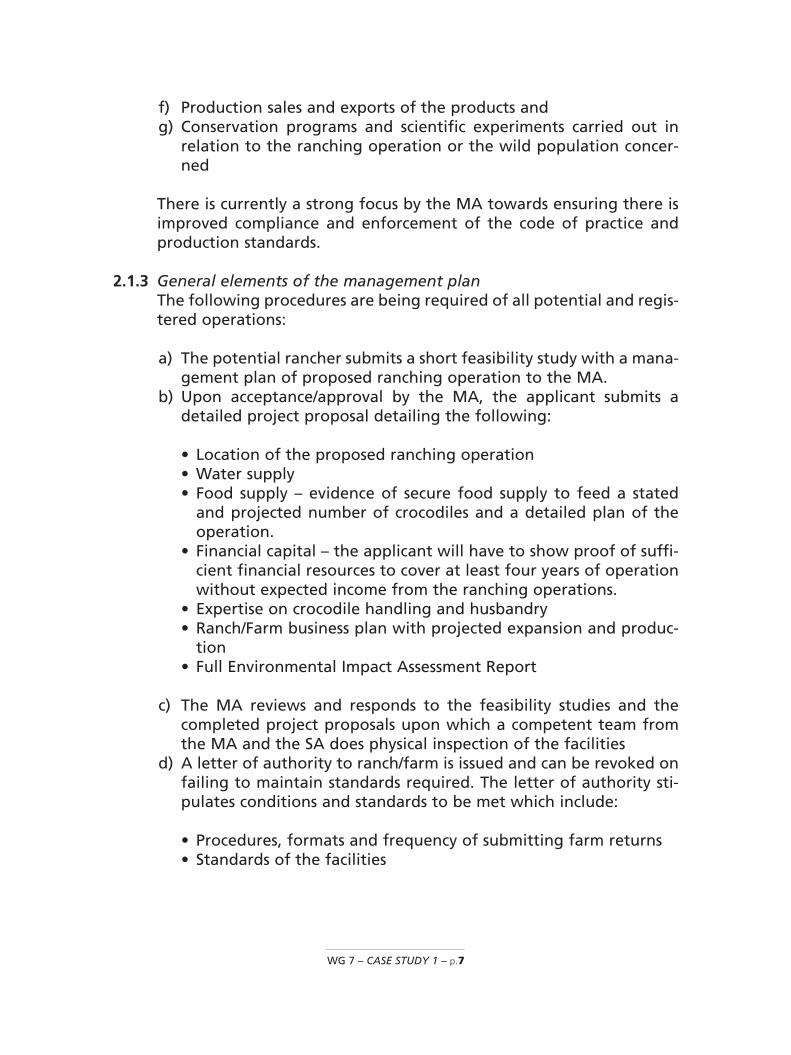
2.1.3 General elements of the management planThe following procedures are being required of all potential and regis-tered operations:
a) The potential rancher submits a short feasibility study with a mana-gement plan of proposed ranching operation to the MA.
b) Upon acceptance/approval by the MA, the applicant submits adetailed project proposal detailing the following:
• Location of the proposed ranching operation• Water supply• Food supply – evidence of secure food supply to feed a stated
and projected number of crocodiles and a detailed plan of theoperation.
• Financial capital – the applicant will have to show proof of suffi-cient financial resources to cover at least four years of operationwithout expected income from the ranching operations.
• Expertise on crocodile handling and husbandry• Ranch/Farm business plan with projected expansion and produc-
tion• Full Environmental Impact Assessment Report
c) The MA reviews and responds to the feasibility studies and thecompleted project proposals upon which a competent team fromthe MA and the SA does physical inspection of the facilities
d) A letter of authority to ranch/farm is issued and can be revoked onfailing to maintain standards required. The letter of authority sti-pulates conditions and standards to be met which include:
• Procedures, formats and frequency of submitting farm returns• Standards of the facilities
WG 7 – CASE STUDY 1 – p.7

2.1.4 Restoration or alleviation measures (see 2.1.2)
2.2 Monitoring system This case study presents the status of the crocodile population inKenya as guided my a Management Plan for the species’ ranching ope-rations based on scientific information generated from populationassessments, regular returns by the ranchers and routine inspections ofthe operations as a monitoring system for the species population.
The information presented in this case study is an analysis of popu-lation surveys, returns of the ranching operations and data collectedthrough physical inspections of the same by a team from the CITESManagement and Scientific Authorities. Valuable information is recei-ved through the Crocodile Producers Association of Kenya (CPAK) anddirectly from individual ranchers/producers.
2.2.1 Methods used to monitor harvestCurrently there are six Nile crocodile ranching operations in Kenyamost of them along the Kenyan coast and one in Kirinyaga districtwithin the proximity of the five hydroelectric dams along the TanaRiver system. Currently, most of the eggs collected for the ranchingoperations are sourced from the Tana River system. Only a small per-centage is currently being collected in Lake Turkana estimated to havea population of 12,000 crocodiles. To ensure continued sustainableexploitation of crocodile resources within the country, the speciespopulation in the Tana River especially the lower reaches has beenregularly assessed and monitored using basic egg collection data andcommunity reporting on incidences of community-crocodile interac-tions in the major species distribution areas. The areas of egg collec-tions are zoned to allow for appropriate levels of monitoring thepopulation, its protection and utilization. Data on the number of eggsper nest and the egg collection efforts (number of egg nests identifiedand collected within the open season for egg collection) is used to pro-vide information on relative size of the crocodile population within agiven segment of the egg collection zone. The sizes of the eggs collec-ted are also used to provide general information on the relative age,sizes and structure of the reproductive female population of the cro-codile in the egg collection zones. Based on data on egg sizes collec-ted and analysed at the Nile crocodile ranching operation, it indicatesthe size of the eggs positively correlates with the size of the femalecrocodile laying the eggs. The data on the number of nests collected isused to estimate the population of female crocodiles that have rea-ched reproductive age at each collection season. This data does nothowever aid to estimate the population of the males and also the
WG 7 – CASE STUDY 1– p.8

reproductive immature population of the crocodiles in the designatedegg collection zones. However, better censuses of the various seg-ments of the crocodile population and especially the adults are cer-tainly necessary. A national survey of the Nile crocodile population wasscheduled for early this year but due to budget constraints, it has beenrescheduled to early 2009. Currently, the designation of specific zonesin the lower reaches of Tana river and also the Lake Turkana for eggcollection focuses on reducing the Nile crocodile population to mitiga-te against crocodile-human conflicts. Approvals on the number of eggsfor collection by each ranching operation are based on projected farmcapacity for production. Once the egg collection permit is issued forspecified number of eggs in specified identified collection zone, thecollection of the eggs is monitored followed by inspection of the faci-lities in the ranching operation to ensure the facility can manage thenumber collected and taking cognizant of the existing stock and theprojected trade. These multiple factors are considered and used todetermine quotas for crocodile egg collection allocated to each of theregistered ranchers and breeders. The total quotas allocated to all theranching operations therefore vary year –on-year as determined bythe capacities of the operations to produce. The quota allocated toeach operation is reviewed in the course of the collection seasonagainst the respective facility expansion. To effectively ensure thisreview, the egg collection is closely monitored through use of thecollection permits and filing of returns. The annual egg collection isused to monitor relative crocodile population abundance in the desig-nated zones and identify trend and problem areas.
Crocodile ranches and farms in Kenya (2008)
S No. Ranch/farm Name Location Ranching/Captivebreeding
1 Nile Crocodiles Mombasa R2 Kenya Crocodile Farm (Mamba Village) Mombasa CB3 Baobab Crocodile Farms1 Mombasa R,CB4 Larfarge Ecosystem2 Mombasa R, CB5 MarkEast Brook Crocodile Farm Malindi CB6 Galaxy Crocodile Farm Sagana R, CB
1 Stock for this farm was obtained from the former Baobab Farm Ltd. now relocated to anew site.
2 This is the new name for the former Baobab Farm Ltd. with a shift from commercial ope-ration to eco-tourism.
WG 7 – CASE STUDY 1 – p.9
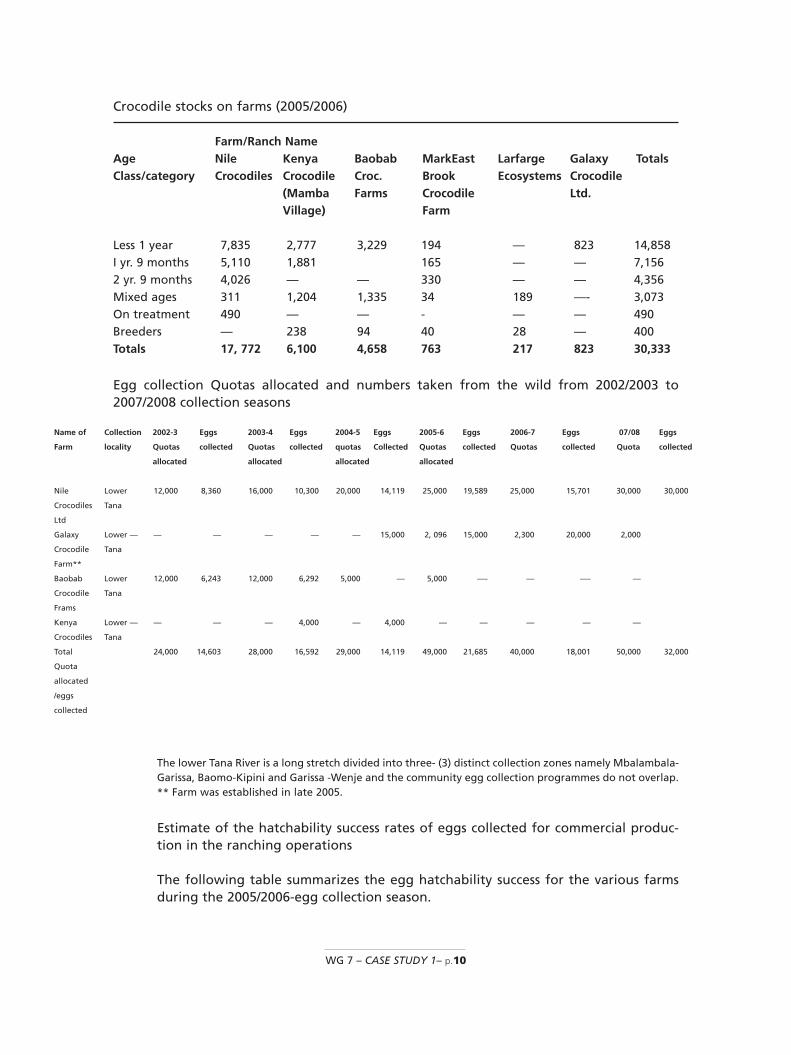
Crocodile stocks on farms (2005/2006)
Farm/Ranch NameAge Nile Kenya Baobab MarkEast Larfarge Galaxy TotalsClass/category Crocodiles Crocodile Croc. Brook Ecosystems Crocodile
(Mamba Farms Crocodile Ltd.Village) Farm
Less 1 year 7,835 2,777 3,229 194 — 823 14,858I yr. 9 months 5,110 1,881 165 — — 7,1562 yr. 9 months 4,026 — — 330 — — 4,356Mixed ages 311 1,204 1,335 34 189 —- 3,073On treatment 490 — — - — — 490Breeders — 238 94 40 28 — 400Totals 17, 772 6,100 4,658 763 217 823 30,333
Egg collection Quotas allocated and numbers taken from the wild from 2002/2003 to2007/2008 collection seasons
The lower Tana River is a long stretch divided into three- (3) distinct collection zones namely Mbalambala-Garissa, Baomo-Kipini and Garissa -Wenje and the community egg collection programmes do not overlap. ** Farm was established in late 2005.
Estimate of the hatchability success rates of eggs collected for commercial produc-tion in the ranching operations
The following table summarizes the egg hatchability success for the various farmsduring the 2005/2006-egg collection season.
WG 7 – CASE STUDY 1– p.10
Name of Collection 2002-3 Eggs 2003-4 Eggs 2004-5 Eggs 2005-6 Eggs 2006-7 Eggs 07/08 Eggs
Farm locality Quotas collected Quotas collected quotas Collected Quotas collected Quotas collected Quota collected
allocated allocated allocated allocated
Nile Lower 12,000 8,360 16,000 10,300 20,000 14,119 25,000 19,589 25,000 15,701 30,000 30,000
Crocodiles Tana
Ltd
Galaxy Lower — — — — — — 15,000 2, 096 15,000 2,300 20,000 2,000
Crocodile Tana
Farm**
Baobab Lower 12,000 6,243 12,000 6,292 5,000 — 5,000 —- — —- —
Crocodile Tana
Frams
Kenya Lower — — — — 4,000 — 4,000 — — — — —
Crocodiles Tana
Total 24,000 14,603 28,000 16,592 29,000 14,119 49,000 21,685 40,000 18,001 50,000 32,000
Quota
allocated
/eggs
collected

Name of Farm Eggs Eggs Hatchlings %collected collected realized Success from farm from wild hatching
rate
Nile Crocodiles Ltd. 19,589 12,303 62.81Galaxy Crocodile Farm 2, 096 823 39.27Lafarge Ecosystem 1124 449 39.95Baobab Crocodile Farms 503 287 57.06Kenya Crocodile Farm 4979 3169 63.65MarkEast Brook Crocodile Farm 366 183 50.00Totals 6972 21685 17214Average %success on farm 52.67Average %success from Wild 51.04Overall Average %success 60.01
Lack of or inadequate experience in egg handling by newly recruitedcommunity egg collectors contributed to low levels of egg hatchabilityfor eggs collected from the wild. Galaxy Crocodile Farm, which recor-ded the lowest hatchability success, suffered from this problem andalso the fact that this was their first operation in the farm. Some of theeggs, however, were not fertile (Dan Haller, Manager Nile Crocodiles,Pers. Comm.) in the lower reaches of Tana River the following are theeggs collection areas: Ozi, Kau, Riketa, Chalaluma, Didewaride, Moa,Kibusu, Biliasa, Matomba, Mikameni, Bubesa, Mnazini and Baomo.
The mortality rate in captivity and causes of such mortalityLoss is more common at the egg collection and hatchling stage hatchlingsand sometimes juveniles are susceptible to skin infections. Such cases aresuccessfully reversed in treatment ponds at the ranching facilities.
2.2.2 Confidence in the use of MonitoringThe MA is responsible for issuance of all permits in accordance with theprovisions of the Wildlife Act CAP 376 of Kenya. Permits for egg collec-tion are issued to the ranching operations and the authority communi-cated to the local authorities and officers of the management Authorityunder which the egg collection areas fall to supervise the collection andfile parallel reports. The resource is communally owned and harvestingis managed and controlled jointly with the community.
2.3 Legal framework and law enforcement
Hunting and dealership in wildlife and wildlife products have beenoutlawed in Kenya by an Act of Parliament since 1977 and 1978 res-
WG 7 – CASE STUDY 1 – p.11

pectively. However, Section 67 of the Wildlife Act allows the Ministerin charge of wildlife to make regulations for the better managementof wildlife farming. Collection of crocodile eggs is treated as hunting.Crocodile eggs and or products are trophies in accordance with theNational law and therefore requires prior permit to collect the eggs ordeal in crocodile trophies such as meat and skins.
Nile Crocodiles are gazetted as prohibited exports unless authori-zed by the Minister in charge of wildlife. Exports of crocodiles andtheir products are therefore subject to approval by the minister res-ponsible for wildlife.
Internationally, trade in Nile crocodile and its products is regulatedunder CITES. The MA reports annually numbers of export permitsissued and quantities of products to the CITES secretariat. Producersmake requests to the MA for tags annually and the MA assigns the tagnumbers and advises the Secretariat. The Secretariat links up the tagsupplier with the producer for the tag supplies and payments.
3. UTILIZATION AND TRADE FOR RANGE STATE FOR WHICH CASE STUDYIS BEING PRESENTED
3.1 Type of use (origin) and destinations (purposes)Utilization of Nile crocodile in Kenya is commercial based on ranchedspecimens in accordance with CITES Res. Conf. 11.16. The parts utilizedinclude meat for food that is utilized locally and sold through outletsauthorized and regulated by the Management authority and the skinthat is solely for export markets for leather industry.
3.2 Harvest:
3.2.1 Harvesting regimeOnly eggs are collected from the wild under authority, incubated andreared in authorized ranches to reach commercial maturity size ofapproximately 1.2 meteres at average age of 3 years. The egg collec-tion is carried out under a community egg collection programme.
3.2.2 Harvest management/ control (quotas, seasons, permits, etc.)Egg collection from the wild by registered operations requires a sepa-rate collection permit and returns are filed with the ManagementAuthority immediately at the close of the collection. Egg collection isregulated using open and closed collection seasons. Egg collection sea-son is between September and March. In the course of the open sea-son, the eggs collected for each ranching operation is reviewed basedon filed returns and physical inspections at the facility and also assess-
WG 7 – CASE STUDY 1– p.12

ment of the capacity of the facility to accommodate and manage theprojected production levels. In order to reduce probable mortalities asa result of disturbance in the nests if some eggs were left uncollectedduring egg collection, all eggs in the identified and selected nests arecollected. At least 33% of identified nests are left undisturbed anduncollected for the population recruitment.
Egg collection involves local communities in the designated zonesof collection currently in the lower reaches of Tana River and LakeTurkana. The MA recommends that the ranchers identify and traincommunity members on methods of egg collection and handling formaximum production and minimal wastage/loss. Community membersare paid on the number and viability upon hatching of collected eggs.Approximately 85% of the crocodile eggs collected are collected bygrass root community members and communities benefit directly fromthe resource. Collectors are trained on egg handling as the eggs aresensitive. The integration of local communities in the egg collectionprogramme has proved to be of positive value to conservation of wildpopulations.
In some instances, the ranchers have introduced extra incentives inthe form of bonus payments dependable on percentage hatchability.Each collector is paid Ksh.10 per egg collected plus a bonus of up to amaximum Ksh.25 on hatching as an incentive. Overall, community cro-codile egg collection programme has helped to turn the human croco-dile conflict problem into a sustainable socio-ecological and economicopportunity, which supports conservation of the resource.
Selectively and based on area assessments, identified adult proble-matic animals are captured and used as breeding stock in selectedauthorized ranches. In return the operations support community deve-lopment projects in the source of breeders as further incentives for in-situ conservation of the crocodile population. The capture of adultrogue crocodiles for ranching purposes is provided for in the crocodi-le management plan. The objective of this element is human-crocodi-le conflict management.
3.3 Legal and illegal trade levelsThe table below shows crocodile skin exports authorized by Kenya MAfor the year 2001- 2005.
WG 7 – CASE STUDY 1 – p.13
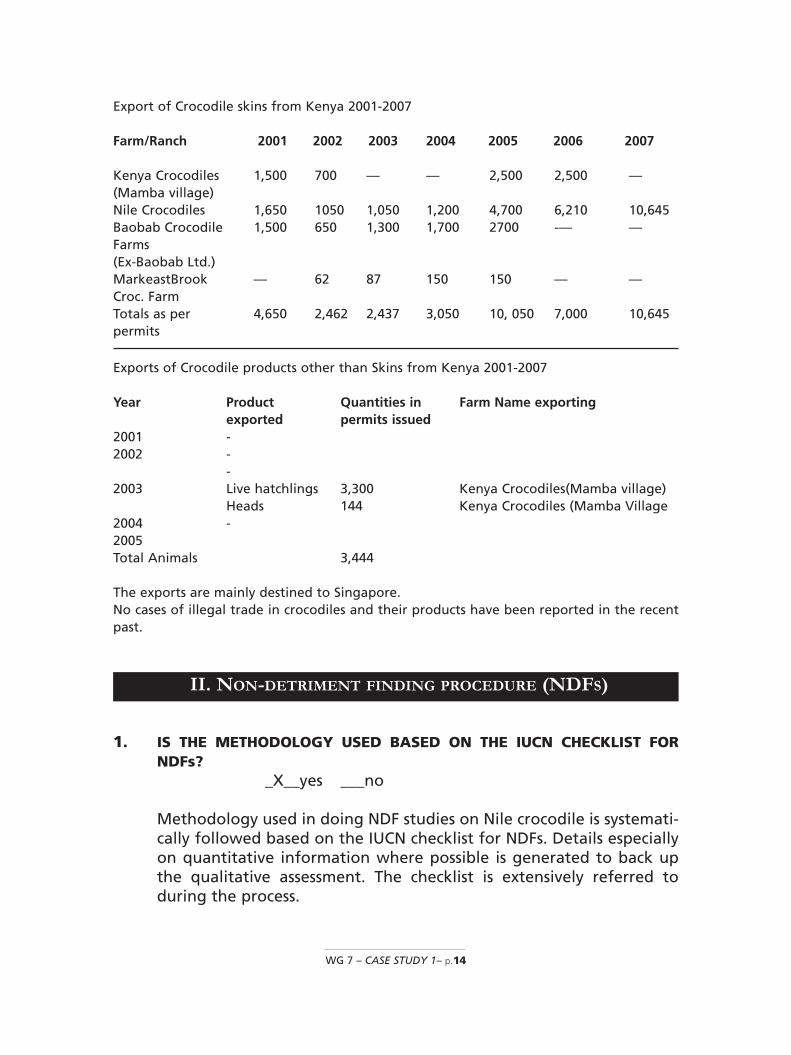
Export of Crocodile skins from Kenya 2001-2007
Farm/Ranch 2001 2002 2003 2004 2005 2006 2007
Kenya Crocodiles 1,500 700 — — 2,500 2,500 —(Mamba village)Nile Crocodiles 1,650 1050 1,050 1,200 4,700 6,210 10,645Baobab Crocodile 1,500 650 1,300 1,700 2700 -— —Farms (Ex-Baobab Ltd.)MarkeastBrook — 62 87 150 150 — —Croc. FarmTotals as per 4,650 2,462 2,437 3,050 10, 050 7,000 10,645permits
Exports of Crocodile products other than Skins from Kenya 2001-2007
Year Product Quantities in Farm Name exportingexported permits issued
2001 -2002 -
-2003 Live hatchlings 3,300 Kenya Crocodiles(Mamba village)
Heads 144 Kenya Crocodiles (Mamba Village2004 -2005Total Animals 3,444
The exports are mainly destined to Singapore.No cases of illegal trade in crocodiles and their products have been reported in the recentpast.
1. IS THE METHODOLOGY USED BASED ON THE IUCN CHECKLIST FORNDFs?
_X__yes ___no
Methodology used in doing NDF studies on Nile crocodile is systemati-cally followed based on the IUCN checklist for NDFs. Details especiallyon quantitative information where possible is generated to back upthe qualitative assessment. The checklist is extensively referred toduring the process.
WG 7 – CASE STUDY 1– p.14
II. NON-DETRIMENT FINDING PROCEDURE (NDFS)
2. CRITERIA, PARAMETERS AND INDICATORS USEDThe concepts in the checklist are referred to when carrying out theNDF process and applied in combination with information on thefollowing elements:The species characteristics:• Distribution• Tolerance to human disturbance• Mortality rate based on hatchability success rate of the collected
eggs as determined by methods of the egg collection and handling
3. MAIN SOURCES OF DATA, INCLUIDING FIELD EVALUATIONSOR SAMPLING METHODOLOGIES AND ANALYSIS USEDThe following are the sources of data for making NDF on Nile crocodi-le in Kenya
• Field assessment of population abundance. Regular assessments ofthe Nile crocodile population are conducted especially in the lowerreaches of Tana River system and Lake Turkana which are the majortwo areas where egg collection is authorized to feed the six registe-red Nile crocodile ranching operations.
• Kenya Wildlife Service Stations daily Occurrence Book recordingincidences of human-crocodile conflicts and returns on egg collec-tion.
• Applications for egg collection quotas and collection sites from theranching operations
• Egg collection permits and filed returns by local communities, KenyaWildlife service Wardens and the ranching operations
• Export permits issued for export of skins to the ranching operations• Reporting by the ranching operations on the performance of the
facilities and physical inspections of the ranching facilities by theWildlife Authorities to assess the production capacities in relation toapplications for egg collection permits
• Routine inspection of the ranching operations by the Managementand Scientific authorities.
4. EVALUATION OF DATA QUANTITY AND QUALITY FOR THE ASSESSMENTData obtained from the sources in c above is analyzed to determineapprovals for levels of harvesting from the wild, areas to be designa-ted for harvesting and compare with applications for exports andlevels of compliance with management plans for the management ofthe species. Data generated from detailed reporting by the ranchingoperations on number of eggs collected against the number of nestsremoved in the wild and those left to maintain the wild population is
WG 7 – CASE STUDY 1 – p.15

evaluated and analysed to provide information on the species popula-tion dynamics the targeted crocodile utilization zones and guide inthe review of the management of the species. The performances ofthe ranching operations especially on the egg hatchability successrates and the production capacity in terms of infrastructure are asses-sed to determine approval for egg collection quotas for the succee-ding year and if need to increase the quotas, identify new areas fordesignation as egg collection zones.
5. MAIN PROBLEMS, CHALLENGES OR DIFFICULTIES FOUNDON THE ELABORATION OF NDFMajor challenge in the elaboration of NDF studies on the Nile crocodi-le has been to get the definite population size of the Nile crocodileespecially in the areas zoned for egg collection in the Tana Riversystem and lately Lake Turkana to be able to understand the popula-tion structure. Censusing Nile crocodile is a relative expensive affairand also requires highly skilled herpetologists. Limited resources bothcapital and human on this aspect pose a big challenge to the unders-tanding of the Kenyan population structure of the Nile crocodile
6. RECOMMENDATIONSThe use of the IUCN Checklist for NDF is quite applicable to the Nilecrocodile species. The checklist is therefore a practical tool for makingNDF on the Nile crocodile (Crocodylus niloticus); however it is impor-tant that quantitative data on the species is generated to provideinformed assessment of the status of the species especially where thechecklist calls for qualitative information. Efforts must therefore bemade to generate the quantitative information as much as possible.Such elements that need this quantitative data include the biologicalstatus to inform on the approximate population size, structure, sexratio and nesting ecology.
WG 7 – CASE STUDY 1– p.16
INTERNATIONAL EXPERT WORKSHOP ON
CITES NON- DETRIMENT FINDINGS
Cancun (México), 17-22 Nov. 2008
PRESENTATION ON
NDF Studies: The Status of and Trade in Nile
Crocodile (Crocodylus niloticus) in Kenya
BY
Solomon N. Kyalo
KENYA

CASE STUDY
The Status of and Trade in Nile crocodile (Crocodylus niloticus) in Kenya- Non –Detriment Findings process
A Case Study presented at the International Expert
Workshop on CITES Non-Detriment Findings, Cancun
(Mexico), 17-22 November 2008

BACKGROUND
The Species- Nile Crocodile (Crocodylus niloticus)
•Include 3 sub-species
Taxonomy:
Class: REPTILIA
Order: Crocodylia
Family: Crocodylidae
Scientific Name: Crocodylus niloticus (Laurenti, 1768)
Common Names : English: Nile Crocodile
: Swahili: Mamba
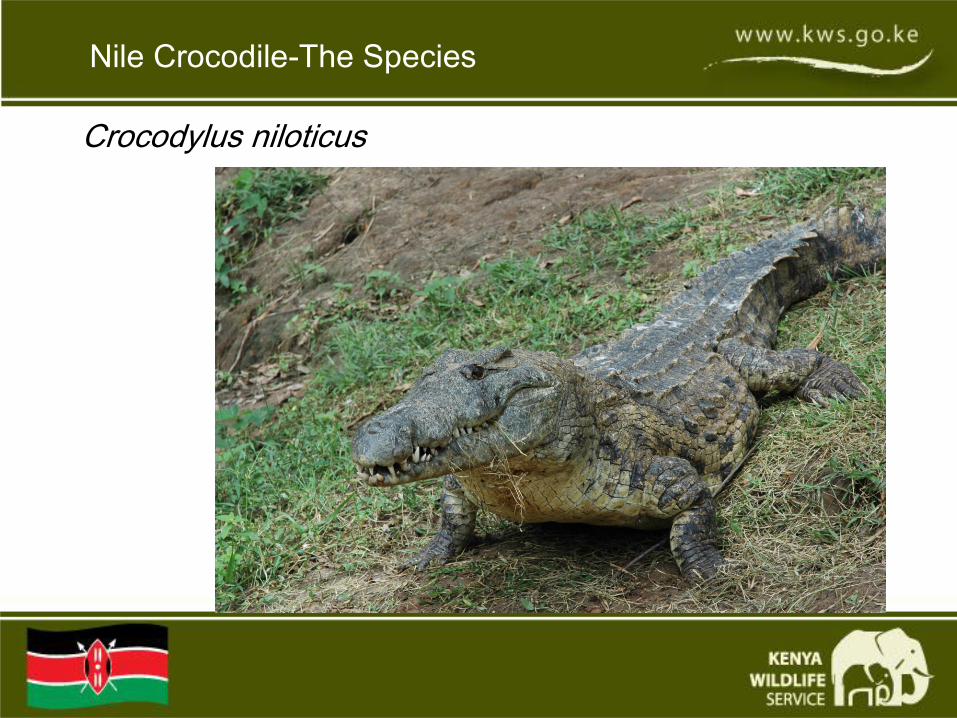
Nile Crocodile-The Species
Crocodylus niloticus

Species Habitat
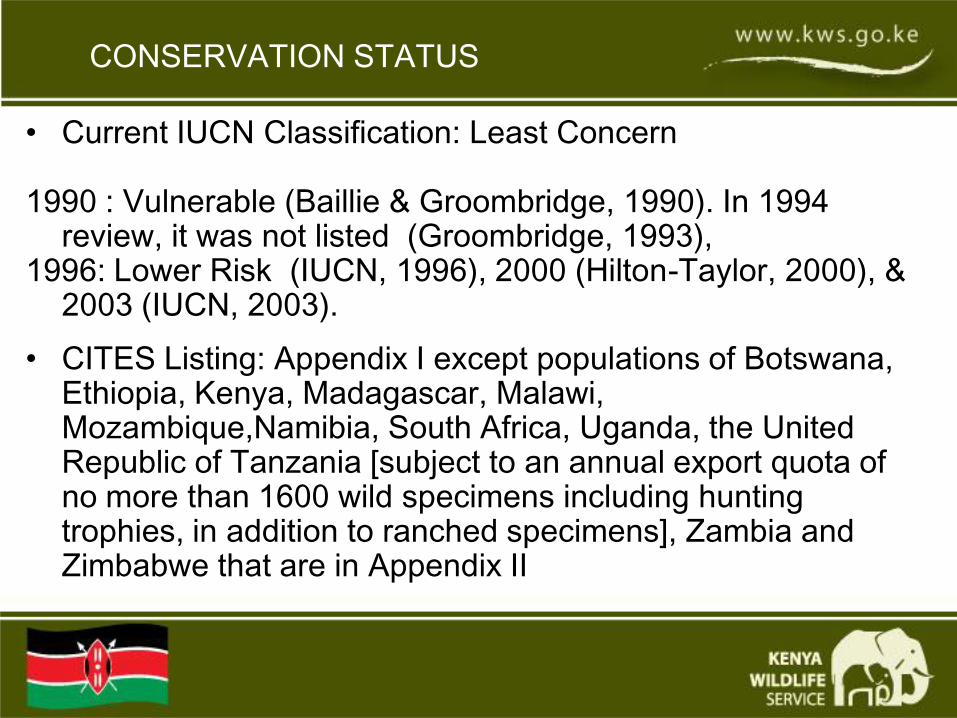
CONSERVATION STATUS
• Current IUCN Classification: Least Concern
1990 : Vulnerable (Baillie & Groombridge, 1990). In 1994 review, it was not listed (Groombridge, 1993),
1996: Lower Risk (IUCN, 1996), 2000 (Hilton-Taylor, 2000), & 2003 (IUCN, 2003).
• CITES Listing: Appendix I except populations of Botswana, Ethiopia, Kenya, Madagascar, Malawi, Mozambique,Namibia, South Africa, Uganda, the United Republic of Tanzania [subject to an annual export quota of no more than 1600 wild specimens including hunting trophies, in addition to ranched specimens], Zambia and Zimbabwe that are in Appendix II

Species distribution-Global overview
•The Nile crocodile is distributed in suitable habitats
throughout Africa and Madagascar
•Wild Population estimated at 250-500,000 specimens
•General population trend: increasing but habitat shrinking

National status- The reason for NDF Process
Purpose:
Determining harvesting levels of specimens of Nile crocodile
(Crocodylus niloticus) from the wild for commercial ranching
and if the harvesting is detrimental to the survival of the
species
Methodology
Data source/references
•Species population surveys
•Assessments of species abundance in different areas designated as
harvesting zones-Egg collection returns
•Reported performance of licensed ranching operations
• Trade levels
•Human-crocodile conflict data
METHODOLOGY-Species distribution
Distribution mapping
• Mapping of the species’ habitats
(all fresh water systems with a special focus on the major
water bodies including: L.Turkana, L. Baringo, L.Victoria,
Mara river, Ewaso nyiro river, Lorian Swamp, Tana River ,
Athi/Galana/Sabaki river & Ramisi river.

Species distribution Mapping

•Regular aerial and nightlight surveys on both the
general and specific population and nest sites,
especially in areas of interest (collection for
utilization and conflict)
Spotlight censusing method
•Counting using nocturnal spot –light count method
(most accurate compared to aerial and day counts)
•Latest count conducted in 1995 for Tana River system (Tana river basin covers 20% of Kenya’s land mass)
Methodology: Population estimates

Spotlight census of the Nile crocodile (Crocodylus niloticus) along the Tana
River, from Garissa to Kipini April 1993. A report for KWS research
Department Nairobi, Kenya. Chira R.M. (1993).
Crocodile egg collection along the Tana River. A report for KWS Research
Department Nairobi, Kenya. Chira R.M. (1994).
Spotlight census of the Nile crocodile (Crocodylus niloticus) along the Tana
River, from Garissa to Kipini, August 1995. A report for KWS Research
Department Nairobi, Kenya. Chira R.M. (1996).
Spotlight census of the Nile crocodile (Crocodylus niloticus) in five Tana
River Dams. A report to Kenya Wildlife Service, Nairobi. Chira R.M.
(1997).
Population estimates

Population estimates
Nightlight surveys on both the general and specific
population and nest sites, especially in areas of
interest (collection for utilization and conflict)
• Population numbers unknownLower reaches of Tana River system & L.Turkana areas of utilization
Tana river system has the biggest living populationL.Turkana population estimated at 12,000 adult specimens

• Records submitted by those collecting eggs, using standard
forms
• Records supplied by the Wildlife Staff on Problematic Animal
Control throughout the country.
Methodology -Population estimates

Population estimates

Population estimates

Threats to Nile crocodile population
•Habitat loss
Human population encroachment,
erosion and loss of nesting areas
•Targeted harvesting for international trade
Egg collection for ranching)
•Persecution
Human-crocodile conflict)
1973- Population listed in CITES Appendix I
1992-Proposal for Appendix II listing for ranching
Current: Population in Appendix II for purposes of ranching in accordance with Res. Conf. 11.16
Nile crocodile Management

Nile Crocodile Management Plan
• maintaining or increasing the species’ overall
numbers (protection);
• Producing a sustainable harvest (utilization);
(Based on 0.5 total adults x 40 x 10% formula)
• Regulating their numbers where appropriate
(control);
• Managing the crocodiles where appropriate for the
benefit of local communities (community benefit).

Policy & Legislation on Nile Crocodiles
Wildlife Act CAP 376: Nile crocodiles from the wild may be
hunted or otherwise utilized under a license issued by the
Wildlife Authority.
Policy : Crocodiles are conserved and encouraged where they
do not conflict with legitimate human interests.
Conservation may include utilization that provides benefits to
local communities.
Challenge: With wide spread population of crocodiles, and
expanding population of humans, there are an increasing
cases of human- crocodile conflicts.

Management Plan for Nile Crocodile
Aims to encourage:
•The management of crocodile populations on a scientific
basis through PAC and ranching;
• The protection of crocodiles within the wild;
•The controlled utilization of crocodiles on ranches in
accordance with CITES Res.Conf. 11.16
All export of products to be in accordance with CITES and the
Wildlife Conservation Act.
Population segment harvested for trade
•Eggs
•Under special authority, rogue Crocodiles as a measure to
reduce crocodile-Human conflict

Eggs harvested for ranching -2002-2007
Year Egg collection
Quota
No. of eggs
collected
Area of
collection
No of
Ranches
2002-3 24,000 14,603 Lower Tana 2
2003-4 28,000 16,592 Lower Tana 3
2004-5 29,000 14,119 Lower Tana 3
2005-6 49,000 21,685 Lower Tana 2
2006-7 40,000 18,001 Lower Tana 2
2007-8 50,000 32,000 Lower tana
&L.Turkana
2

Monitoring System
Wildlife Authority sets minimum standards and code of practice for all
aspects of crocodile production to be observed by the ranchers.
Quotas for egg collection and areas for collection are scientifically
determined at the start of each season.
Authority for ranching carry the following terms and conditions:
a) Locality of egg collection is specified on a map;
b) Period of collection is specified;
c) Number and type of specimens specified, with numbers allocated
limited by farm capacity;
Monitoring System
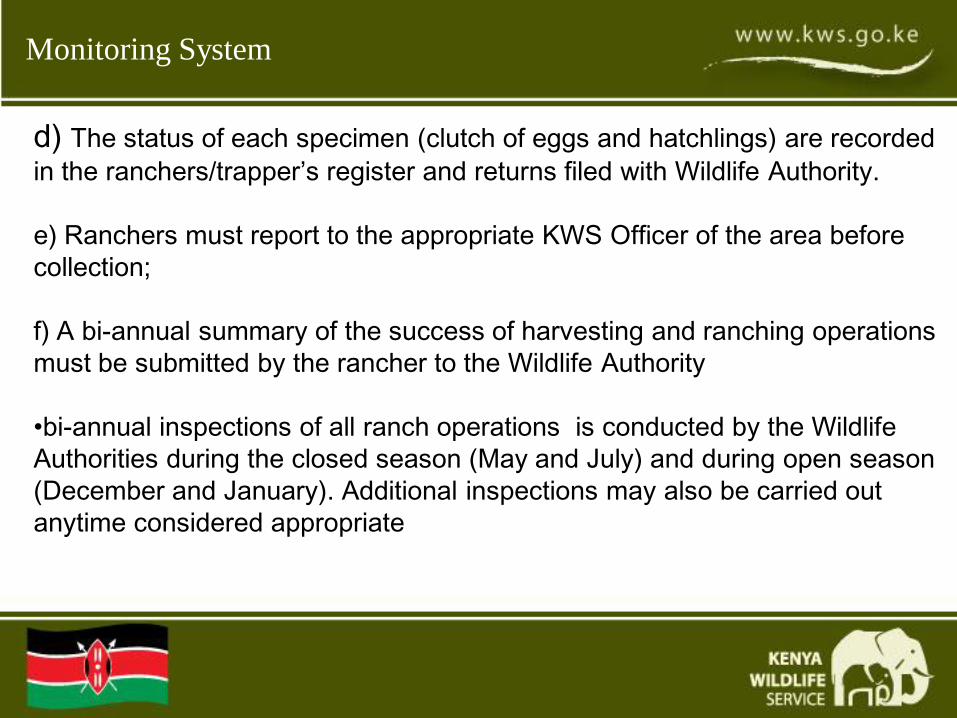
d) The status of each specimen (clutch of eggs and hatchlings) are recorded
in the ranchers/trapper’s register and returns filed with Wildlife Authority.
e) Ranchers must report to the appropriate KWS Officer of the area before
collection;
f) A bi-annual summary of the success of harvesting and ranching operations
must be submitted by the rancher to the Wildlife Authority
•bi-annual inspections of all ranch operations is conducted by the Wildlife
Authorities during the closed season (May and July) and during open season
(December and January). Additional inspections may also be carried out
anytime considered appropriate
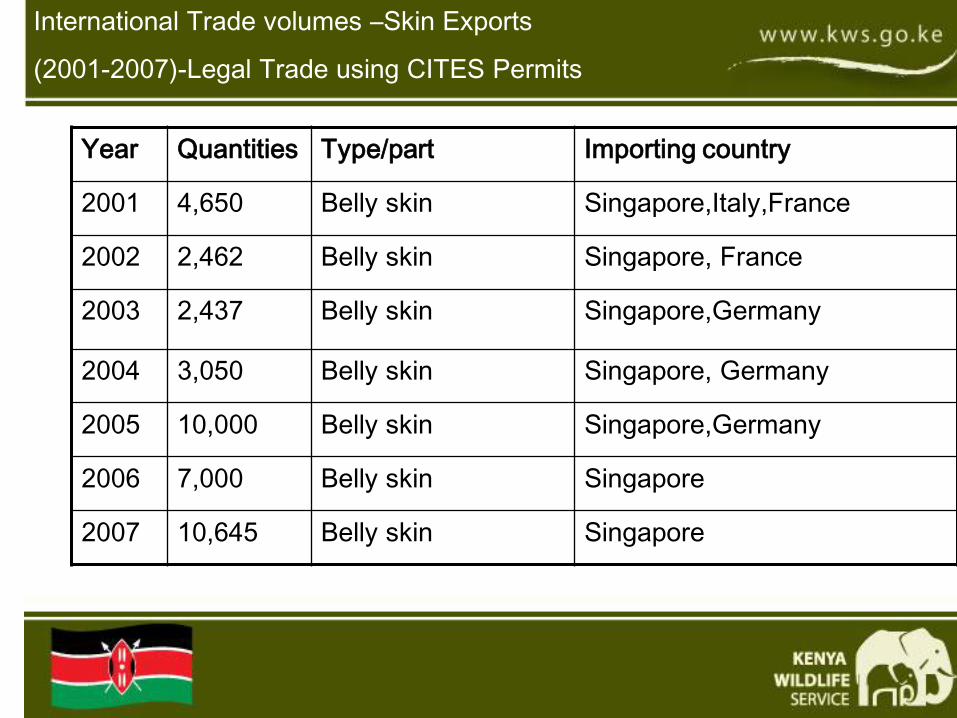
International Trade volumes –Skin Exports
(2001-2007)-Legal Trade using CITES Permits
Year Quantities Type/part Importing country
2001 4,650 Belly skin Singapore,Italy,France
2002 2,462 Belly skin Singapore, France
2003 2,437 Belly skin Singapore,Germany
2004 3,050 Belly skin Singapore, Germany
2005 10,000 Belly skin Singapore,Germany
2006 7,000 Belly skin Singapore
2007 10,645 Belly skin Singapore

Monitoring and controls-Evaluation of data
Conditions tied to harvesting crocodile resources for ranching
•feasibility study to the Wildlife Authority
Prepared detailed project proposal with information on:
a) locality;
b) water supply;
c) food supply;
d) financial resources;
e) expertise;
f) Markets for meat & skin
g) ranch plans.
h) Environmental Impact Assessment (NEMA)

Strategies for species Conservation management
•Use of Problematic/Rogue crocodiles as breeding stock as an
innovative means of control as opposed to elimination for
managing human –crocodile conflicts
•Opening up more egg collection areas in the various species
distribution range to reduce collection pressure in the
traditionally known egg collection zones
•Regular rapid population assessments for purposes of
monitoring change in the species dynamics

CONCLUSION
• Trade in ranched specimens of Nile crocodile should be
encouraged as incentives for in-situ conservation of the
species
•Trade in Nile crocodile specimens should be limited to skins
for exports and meat for local markets under controlled
licensing system
• Use of universal identification tags

THANK
YOU

NDF WORKSHOP CASE STUDIESWG 7 – Reptiles and Amphibians
CASE STUDY 2Cuora amboinensis
Country – INDONESIAOriginal language – English
THE SOUTHEAST ASIAN BOX TURTLECUORA AMBOINENSIS (DAUDIN, 1802)IN INDONESIA
A U T H O R :Sabine SchoppeTRAFFIC Southeast Asia, Kuala Lumpur, Malaysia.
1. BIOLOGICAL DATA
1.1. Scientific and common names:Southeast Asian Box Turtle Cuora amboinensis (Daudin, 1802)Wallacean Box Turtle C. a. amboinensis (Daudin, 1802)Malayan Box Turtle C. a. kamaroma Rummler and Fritz 1991Indonesian Box Turtle C. a. couro (Schweigger, 1812)Burmese Box Turtle C. a. lineata McCord and Philippen, 1998In Indonesia freshwater turtles are generally called ‘Kura Kura’.Specifically depending of province: Kura Kura ambon, Kura Kurakuning, Kura Kura batok, Kura Kura PD, Baning Banya, Kura Kurakatup, Kura kura tangkop, Kangkop.
1.2. DistributionFrom northeastern India and Bangladesh through southeastern Asia toMalay Peninsula; Nicobar Islands, Borneo, Sumatra, Java, Sumbawaand small satellite islands thereof; Moluccas, Sulawesi, Philippines(Fritz and Havas, 2007).
Four subspecies are currently recognized (Rummler and Fritz, 1991;McCord and Philippen, 1998): the Wallacean Box Turtle C. amboinen-sis amboinensis (Daudin, 1802) often referred to as East Indian Box
I. BACKGROUND INFORMATION ON THE TAXA

Turtle, the Malayan Box Turtle C. a. kamaroma Rummler and Fritz1991, the Indonesian Box Turtle C. a. couro (Schweigger, 1812), and theBurmese Box Turtle C. a. lineata McCord and Philippen, 1998.
The Wallacean Box Turtle C. a. amboinensis occurs on the Moluccas,Sulawesi, Philippines (except Sulu Archipelago and perhaps PalawanIsland group) (Fritz and Havas, 2007).
The Malayan Box Turtle Cuora a. kamaroma occurs from northeas-tern India and Bangladesh through southeastern Asia to MalayPeninsula; Nicobar Islands, Borneo, Sulu Archipelago and perhapsPalawan Island group, Philippines (Fritz and Havas, 2007).
The Indonesian Box Turtle C. a. couro occurs on Sumatra, Java,Sumbawa and small satellite islands thereof (Fritz and Havas, 2007).
The Burmese Box Turtle Cuora a. lineata is restricted to Myanmar,and confirmed only from Kachin Province (Fritz and Havas, 2007).
Figure 1: Distribution of the four subspecies of Cuora amboinensis.
Generally, the species is widely distributed in lowland freshwater habi-tats from sea level to about 500 m a.s.l., but locally extinct aroundtrade centres.
WG 7 – CASE STUDY 2– p.2

1.3. Biological characteristics1.3.1. General biological and life history characteristics of the species
• Sex ratio: 1:1 or slightly in favour of females (Schoppe, 2008;Schoppe, in prep.).
• Low reproductive rate. Mean of 15 months to reach subadult hood.Maturity in captivity might be reached after 4 years and 5 months,and in the wild probably in 51/2-6 years (Schoppe, 2008).
• Mean of three clutches with two eggs each resulting in a total of sixeggs per female per year (Schoppe, 2008).
• Incubation period is 67-77 days in the wild and 76-77 days in captivity(Whitaker and Andrews, 1997). In captivity under outdoor conditions(26-30°C) without artificial incubation a range of 60-120 days (n=22,mean 88.8±12.5) was encountered; a prolonged incubation seems tobe related to unfeasible weather conditions (S.Schoppe, unpubl. data).
• Hatching success is about 50% in captivity under outdoor conditions(S.Schoppe, unpubl. data).
• Survival rate of eggs and hatchlings in the wild is not known. [Forthe North American Painted Turtle Chrysemys picta 92% (Wilbur,1975) and 54% mortality, (Mitchell, 1988) were recorded.]
• Life expectancy 25-30 years; a maximum age of 38.2 years was recor-ded for an animal in captivity (Bowler, 1977).
• Generation time can be approximated by taking the median or mid-point between age at maturity and age at mortality. In the case ofthe Southeast Asian Box Turtle, that would be 6 [=age at maturity]+ 1/2 *(30 – 6) [half of reproductive life-span] = 6 + 1/2 * 24 = 6 + 12= 18 years generation time (Schoppe, 2008).
• Individuals of Cuora amboinensis may wander substantial distancesover the course of a lifetime, but the species does not migrate sea-sonally or to any geographically significant extent.
• Habitat generalist, adaptable to man-made habitats, tolerant (Moll,1997; Schoppe, 2008).
1.3.2. Habitat typesThe species is semi-aquatic and inhabits various natural and man-madewetland with soft bottoms and slow or no current (Ernst et al., 2000).
• Natural: swamp and peat swamp forests, marshes, permanent ortemporary wetlands, and shallow lakes.
• Man-made: flooded rice fields, oil palm and rubber plantations thatare either partly flooded or that have an extensive drainage systemas well as in irrigation ditches, canals, orchards, vegetated drainagesystems, ponds and pools near houses.
WG 7 – CASE STUDY 2 – p.3
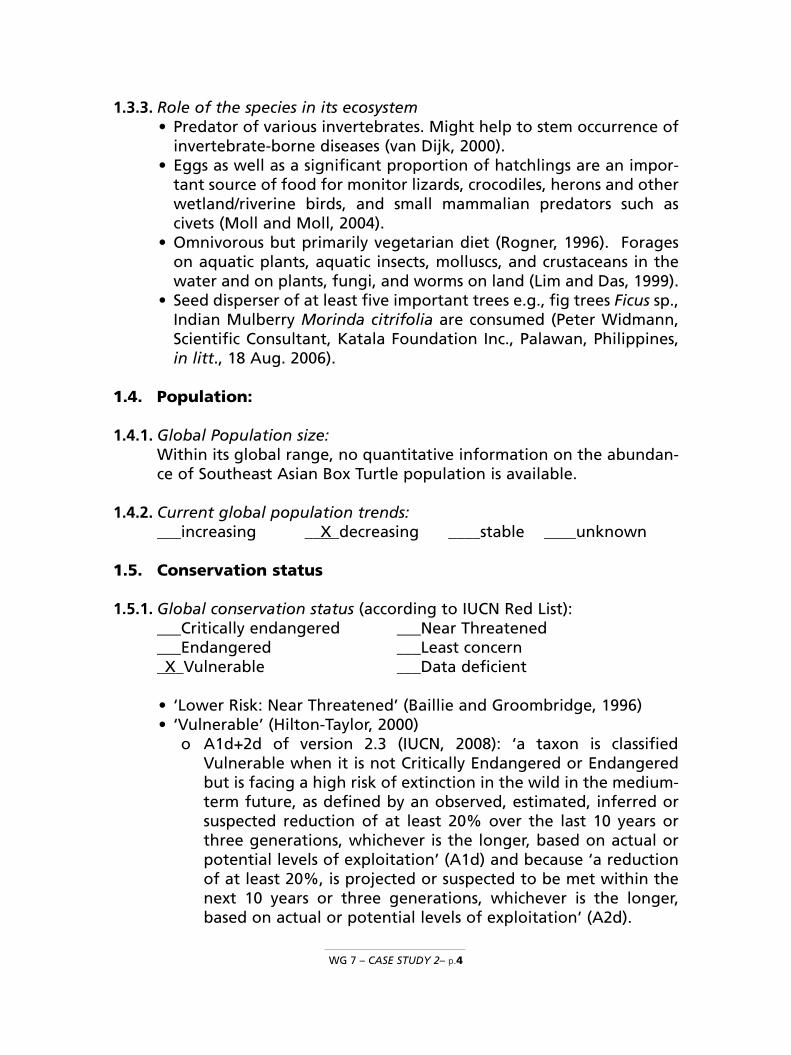
1.3.3. Role of the species in its ecosystem• Predator of various invertebrates. Might help to stem occurrence of
invertebrate-borne diseases (van Dijk, 2000).• Eggs as well as a significant proportion of hatchlings are an impor-
tant source of food for monitor lizards, crocodiles, herons and otherwetland/riverine birds, and small mammalian predators such ascivets (Moll and Moll, 2004).
• Omnivorous but primarily vegetarian diet (Rogner, 1996). Forageson aquatic plants, aquatic insects, molluscs, and crustaceans in thewater and on plants, fungi, and worms on land (Lim and Das, 1999).
• Seed disperser of at least five important trees e.g., fig trees Ficus sp.,Indian Mulberry Morinda citrifolia are consumed (Peter Widmann,Scientific Consultant, Katala Foundation Inc., Palawan, Philippines,in litt., 18 Aug. 2006).
1.4. Population:
1.4.1. Global Population size:Within its global range, no quantitative information on the abundan-ce of Southeast Asian Box Turtle population is available.
1.4.2. Current global population trends:___increasing __X_decreasing ____stable ____unknown
1.5. Conservation status
1.5.1. Global conservation status (according to IUCN Red List):___Critically endangered ___Near Threatened___Endangered ___Least concern_X_Vulnerable ___Data deficient
• ‘Lower Risk: Near Threatened’ (Baillie and Groombridge, 1996)• ‘Vulnerable’ (Hilton-Taylor, 2000)
o A1d+2d of version 2.3 (IUCN, 2008): ‘a taxon is classifiedVulnerable when it is not Critically Endangered or Endangeredbut is facing a high risk of extinction in the wild in the medium-term future, as defined by an observed, estimated, inferred orsuspected reduction of at least 20% over the last 10 years orthree generations, whichever is the longer, based on actual orpotential levels of exploitation’ (A1d) and because ‘a reductionof at least 20%, is projected or suspected to be met within thenext 10 years or three generations, whichever is the longer,based on actual or potential levels of exploitation’ (A2d).
WG 7 – CASE STUDY 2– p.4
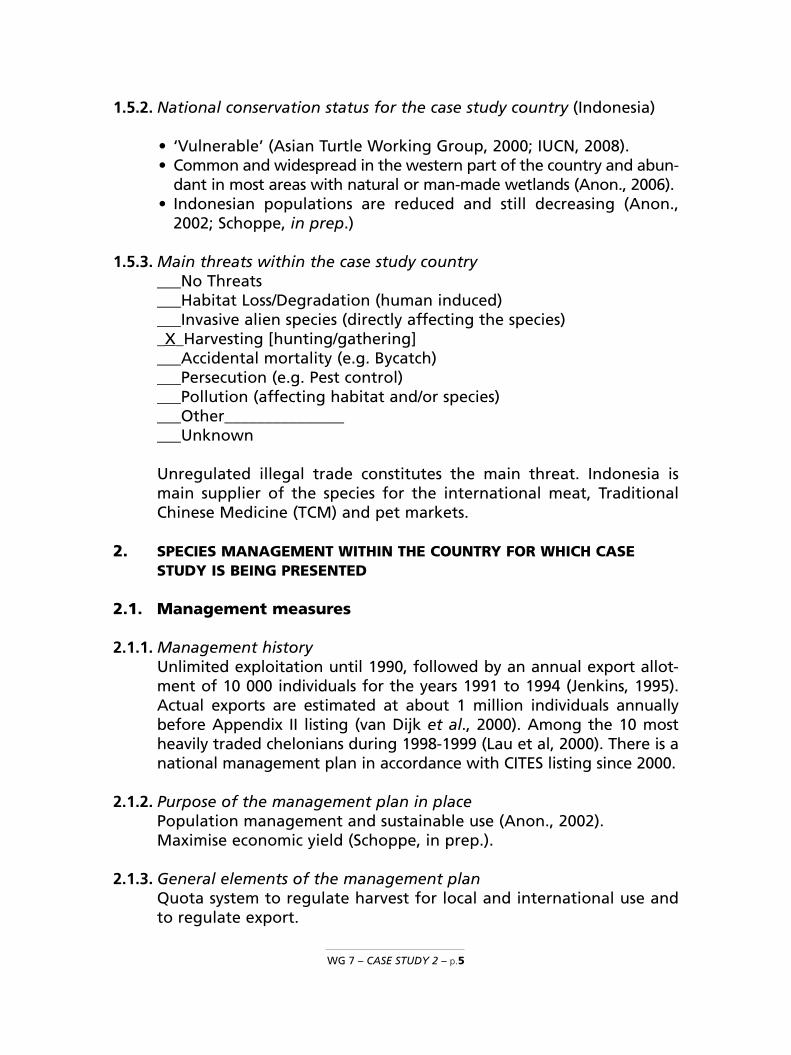
1.5.2. National conservation status for the case study country (Indonesia)
• ‘Vulnerable’ (Asian Turtle Working Group, 2000; IUCN, 2008).• Common and widespread in the western part of the country and abun-
dant in most areas with natural or man-made wetlands (Anon., 2006).• Indonesian populations are reduced and still decreasing (Anon.,
2002; Schoppe, in prep.)
1.5.3. Main threats within the case study country___No Threats___Habitat Loss/Degradation (human induced) ___Invasive alien species (directly affecting the species) _X_Harvesting [hunting/gathering] ___Accidental mortality (e.g. Bycatch)___Persecution (e.g. Pest control)___Pollution (affecting habitat and/or species) ___Other__________________Unknown
Unregulated illegal trade constitutes the main threat. Indonesia ismain supplier of the species for the international meat, TraditionalChinese Medicine (TCM) and pet markets.
2. SPECIES MANAGEMENT WITHIN THE COUNTRY FOR WHICH CASESTUDY IS BEING PRESENTED
2.1. Management measures
2.1.1. Management historyUnlimited exploitation until 1990, followed by an annual export allot-ment of 10 000 individuals for the years 1991 to 1994 (Jenkins, 1995).Actual exports are estimated at about 1 million individuals annuallybefore Appendix II listing (van Dijk et al., 2000). Among the 10 mostheavily traded chelonians during 1998-1999 (Lau et al, 2000). There is anational management plan in accordance with CITES listing since 2000.
2.1.2. Purpose of the management plan in placePopulation management and sustainable use (Anon., 2002).Maximise economic yield (Schoppe, in prep.).
2.1.3. General elements of the management planQuota system to regulate harvest for local and international use andto regulate export.
WG 7 – CASE STUDY 2 – p.5

2.1.4. Restoration or alleviation measuresRecommended for large-scale captive breeding for consumption tradeby the CITES MA, but neither implemented nor further developed.Captive breeding of the Southeast Asian Box Turtle for commercial pro-fit is at present not economically feasible in a country of export, wherecaptive bred animals incur high air freight rates (Schoppe, in prep.). Thefeasibility of captive breeding for the pet trade should be assessed.
2.2. Monitoring system
2.2.1. Methods used to monitor harvestNational monitoring of exports based on issued export permits.
2.2.2. Confidence in the use of monitoringLow (Anon., 2002) to no confidence (Schoppe, 2007; in prep.).
2.3. Legal framework and law enforcement:The species is not protected under Indonesian wildlife laws. Harvestand export became regulated with the listing of the species in CITESAppendix II in the year 2000. Before CITES listing export was unregu-lated and enormous.
The species may only be exported live. The export of dead animals,parts (carapace or plastron) or derivatives is illegal under the IndonesianMinistry Decree 447 (Anon., 2003) and the Indonesian quota (Anon., 2007).
Indonesia has a substantive enough legislative framework in placeto govern the management of wildlife harvest and trade. TheIndonesian CITES MA has a very detailed, complex and difficult licen-sing and permit system. Unfortunately, the enforcement of these lawsand regulations is very weak.
The fact that some freshwater turtle species fall under the jurisdic-tion of the PHKA (Directorate General of Forest Protection and NatureConservation under the Ministry of Forestry of the Republic ofIndonesia) while others are under the management of the DKP(Indonesian Department of Marine Affairs and Fisheries), has led toconsiderable confusion and resulting weakness in law enforcement.
3. UTILIZATION AND TRADE FOR RANGE STATE FOR WHICH CASE STUDYIS BEING PRESENTED.
3.1. Type of use (origin) and destinations (purposes) All specimens for domestic and international use are wild caught. Thespecies is used for human food consumption, Traditional ChineseMedicine, merit release (a Chinese tradition of releasing one or seve-
WG 7 – CASE STUDY 2– p.6

ral turtles to a temple or to the wild believing that this will bring longlife to the person releasing) and as pet. As with other reptiles, about10% of the total harvest quota, in the case of C. amboinensis 2000individuals, are allotted for local uses annually, although local utiliza-tion is negligible.
The animals’ heads, as well as their shells are frequently sold as atonic after childbirth. Flesh is believed to be a cure for nocturnal uri-nation in bed by children. Eating the flesh or when using the fleshand/or parts of the dry plastron (rarely the carapace) in producingTraditional Chinese Medicine is believed to cure asthma and cancer.
In Indonesia, the main users are ethnic Chinese while the majorityof Indonesians (75%) are Muslim and not allowed to consume or keepfreshwater turtles. Destinations for the meat and the shell (in TCM) areEast Asian countries, mainly Hong Kong SAR and mainland China andSingapore, Taiwan POC, and Viet Nam. Pet importing countries areEurope, Japan and the United States of America.
3.2. Harvest
3.2.1. Harvesting regimeAll extractive, year-around, disregarding size but larger (adult) indivi-duals are preferred for the consumption / TCM trade, and smaller onesfor the pet trade. Collection occurs all over the species range, disregar-ding designated collection areas and provincial quotas. Populations innational protected areas are exploited to lesser extent but since lawenforcement is weak, exploitation also occurs in protected areas.Animals are either hand captured or collected with baited traps duringdarkness.
3.2.2. Harvest management/ control (quotas, seasons, permits, etc.)Since 2000, harvest has been regulated through an export quotasystem. Export quota was 6000 in the year 2000, then increased to 18000 (harvest quota is 20 000) in the following years until the present.The quota is cautious according to CITES SA (Anon., 2002).
According to the Ministry of Forestry “ a quota system shall bebased on scientific data or information from population inventories ormonitoring”. In the case of lack of data, information may be gatheredbased on: a) habitat and population condition of the said species; b)other scientific and technical information concerning population andhabitat of the said species; c) actual harvest (realisation) of previousyears; and d) traditional knowledge (Anon., 2003).
The basis for the quota setting of C. amboinensis is questionable.The distribution of the national quota among provinces is neither rela-
WG 7 – CASE STUDY 2 – p.7
ted to local abundance nor to sustainability of trade. Locations for har-vest or capture are not carefully selected based on biological and eco-logical assessments.
3.3. Legal and illegal trade levels: Legal trade. Annually 18 000 individuals are allotted for export.Between 2000-2006, an annual average of 10 771 individuals weresend as pets to Europe (average 1604), Japan (average 1619), and theUS (average 7547). The remainder, an annual average of 7228 indivi-duals were exported to East Asia. Officially, this ratio 60% pet tradeand 40 % meat trade is continued until today.
Illegal trade. A conservative estimate is that illegal trade amountsto 10 times the volume of legal trade (Schoppe, in prep.). This coverslive specimens and the shell trade. Illegal trade is extensive and inclu-des all levels and kinds of traders such as collectors, middlemen, sup-pliers and exporters of registered and unregistered companies. Theinternational destinations of illegal shipments of the live SoutheastAsian Box Turtle are Hong Kong SAR, mainland China, Singapore andMalaysia.
The import of plastron to East Asia is legal and does not need to bedeclared other than under CITES regulations (which may be ignored)if the plastron derives from CITES-listed species. Taiwan POC aloneimported 403 583 kg of hard-shelled turtle shells between 1992 and1998 from Indonesia (Chen et. al., 2000). Among these, the SoutheastAsian Box Turtle is the most common species and constitutes togetherwith two other species more than 75% of the total amount (Chen et.al., 2000). Between 2002 and 2006 exports of shell from Indonesia toTaiwan POC increased to an annual mean of 86 625 kg plastron or atotal of 433 125 kg (Tien-Hsi Chen, Associate Researcher, NationalMuseum of Marine Science and Technology, Keelung, Taiwan POC, inlitt., 8. April 2007). Indonesia is the main supplier of turtle to the TCMmarket in Taiwan POC, representing 42.1% and 35.7% of the shellimports to Taiwan POC in 1992-98 and 2002-06, respectively.
Export in dead specimens, parts and derivatives of the SoutheastAsian Box Turtle from Indonesia has increased since the species beca-me listed in Appendix II (Schoppe, in prep.). Live turtle trade quantitymay have decreased but the volume of turtle shell traded increased(Tien-Hsi Chen, Associate Researcher, National Museum of MarineScience and Technology, Keelung, Taiwan POC, in litt., 8. April 2007). Illegal trade represents the major threat to the survival of theSoutheast Asian Box Turtle.
WG 7 – CASE STUDY 2– p.8

Based on surveys conducted in the main source and trade centres inIndonesia in 2006, TRAFFIC SEA proposes the following NDF methodo-logy.
1. IS THE METHODOLOGY USED BASED ON THE IUCN CHECKLIST FORNDFs?
___partly_yes ___noIn April 2002, Environment Australia funded a species managementworkshop with members of the Indonesian CITES MA and SA. Duringthis workshop the IUCN risk-assessment checklist was presented andmembers were trained on how to compile available information oncertain species. The purpose was to evaluate the utility of the checklistin assisting the Scientific Authority of Indonesia in making non-detri-mental findings in the future. One of the working groups came upwith a radar graph for the Southeast Asian Box Turtle (Anon., 2002).
Figure 2: Risk-assessment of the Southeast Asian Box Turtle in Indonesia conductedby the Indonesia CITES SA in 2000 (Anon., 2002).
WG 7 – CASE STUDY 2 – p.9
II. NON-DETRIMENT FINDING PROCEDURE (NDFS)

After extensive fieldwork in 2006, TRAFFIC Southeast Asia used therisk assessment checklist and came up with a radar graph too(Schoppe, 2007) (Figure 3).
Figure 3: Risk-assessment of the Southeast Asian Box Turtle in Indonesia conductedby the TRAFFIC SEA in 2006.
Low confidence in the harvest management was identified as a majorissue by both assessors.
2. CRITERIA, PARAMETERS AND/OR INDICATORS USED
• Reproduction biology of the species• Past and current trade levels,• Mean size of individuals and size-frequency distribution in the wild
and in trade;• Extent of illegal trade,• Abundance of the species in an unexploited area in the wild,• Abundance in harvest in an exploited area,• Effectiveness and implementation of legislation pertaining to fres-
hwater turtle conservation in Indonesia.
WG 7 – CASE STUDY 2– p.10

3. MAIN SOURCES OF DATA, INCLUDING FIELD EVALUATIONOR SAMPLING METHODOLOGIES AND ANALYSIS USEDFieldwork was conducted in central trade areas: Java, Sulawesi,Sumatra and Kalimantan from March to July 2006. Published andunpublished material on the habitat, role in the ecosystems, reproduc-tion and growth, and morphology of the Southeast Asian Box Turtle ingeneral and on the three Indonesian subspecies specifically was com-piled, enriched with observations during field surveys in Indonesia andanalysed. Major findings are that the species has a low reproductiverate (age at maturity is 5.6 years, mean of six eggs per year with 50%hatching success), which makes it vulnerable for exploitation.
Individuals encountered in the wild were measured and means andstandard deviation and range of median carapace length determined(Table 1). These data may serve as baseline data for further compara-tive studies. A smaller mean size of individuals in trade compared tothe mean size in the wild is related to overexploitation of larger sizeclasses.
Table 1: Mean ± standard deviation and range in median carapace length (mm) ofthree subspecies of the Southeast Asian Box Turtle encountered in the wild in 2006.
Subspecies Wild
Cuora a. kamaroma 165.9±31.3 (65.5-215-0), n=678Cuora a. amboinensis 134.5±44.6 (51.5-200.0), n=68Cuora a. couro Not available
Information on management issues of CITES Appendix II-listed specieswas obtained from CITES online references (www.cites.org).Information on national and provincial legislation in place to regulatethe harvest and trade in the Southeast Asian Box Turtle was compiledfrom relevant offices such as the CITES Management Authority, con-cerned NGOs such as Wildlife Fund for Nature (WWF) – Indonesia,Wetland International Indonesia, and academic institutions. Theenforcement of these laws was examined and analysed based on inter-views with law enforcement officers as well as traders. Results showthat law enforcement is rather weak, and illegal trade a major issue.
To compare current trade levels with the past, trade data derivedfrom CITES annual reports, CITES Trade Database maintained by UNEP-WCMC, herpetologists, traders, seizure records, and press releaseswere compiled and analyzed. Results show that the species remainsamong the most abundantly traded freshwater turtles. Such excessiveexploitation over a large period of time cannot be sustainable.
WG 7 – CASE STUDY 2 – p.11

Local utilization was assessed based on wet and pet market surveys,pet shops surveys and interviews with owners or labourers at reptileselling/keeping outlets. Exporting companies and suppliers to exporterswho claimed to supply also the local market were also surveyed. Resultsrevealed that local utilization is negligible. Local market price of juve-niles ranged from USD 0.3-13.6 (mean USD 3.84); those of adults ran-ged from USD 2.7-10.9 (mean USD 5.33) per individual in 2006.
At all premises of turtle traders – whether legal or illegal – the stockof the Southeast Asian Box Turtle present at the day of visit was asses-sed in terms of abundance, size, weight and sex. Efforts were made tomeasure at least 10 individuals (5 female and 5 male) randomly selec-ted, or if possible 10% of the stock. Results provide mean and standarddeviation and range in median carapace length for all three subspecies(Table 2). Data should serve as baseline data for comparison with laterstudies. A significant decrease in mean median carapace length indica-tes unsustainable exploitation.
Table 2: Mean ± standard deviation and range in median carapace length (mm) ofthree subspecies of the Southeast Asian Box Turtle encountered in trade in 2006.
Subspecies Trade
Cuora a. kamaroma 171.7±28.3 (56.6-215.0), n=701Cuora a. amboinensis 149.9±24.9 (121.5-190), n=20Cuora a. couro 131.1±40.3 (55.6-214.0), n=200
Sex ratio of C. amboinensis should be 1:1 or slightly in favour of fema-les (1:1.1-1.3). A skewed sex ratio can be related to over-exploitation.
Pet exporters or their company managers in Java were interviewedfollowing a semi-structured questionnaire format, asking questionsabout prices, volumes, trends, etc. Results indicate a decrease in abun-dance and local extinction of the species around centres of trade. Pettraders paid between USD 1.74 and 2.17 per individual to poacher in2006. The sold one individual for USD 3.5-8.0 to their foreign buyers.
Captive breeding was assessed based on surveys of companies thatclaimed to breed the Southeast Asian Box Turtle. Data were validatedthrough the help of captive breeding reports obtained from provin-cial and national offices of the Ministry of Forestry. Results revealedthat nobody currently breeds the species in Indonesia because it is noteconomically feasible for the consumption trade. If individuals decla-red as captive bred appear in trade, origin should be investigated sincethe probability is high that they are traded without valid permits.
A survey of a wild population in a natural habitat – a peat swampforest - was conducted in the National Park “Taman National Rawa
WG 7 – CASE STUDY 2– p.12
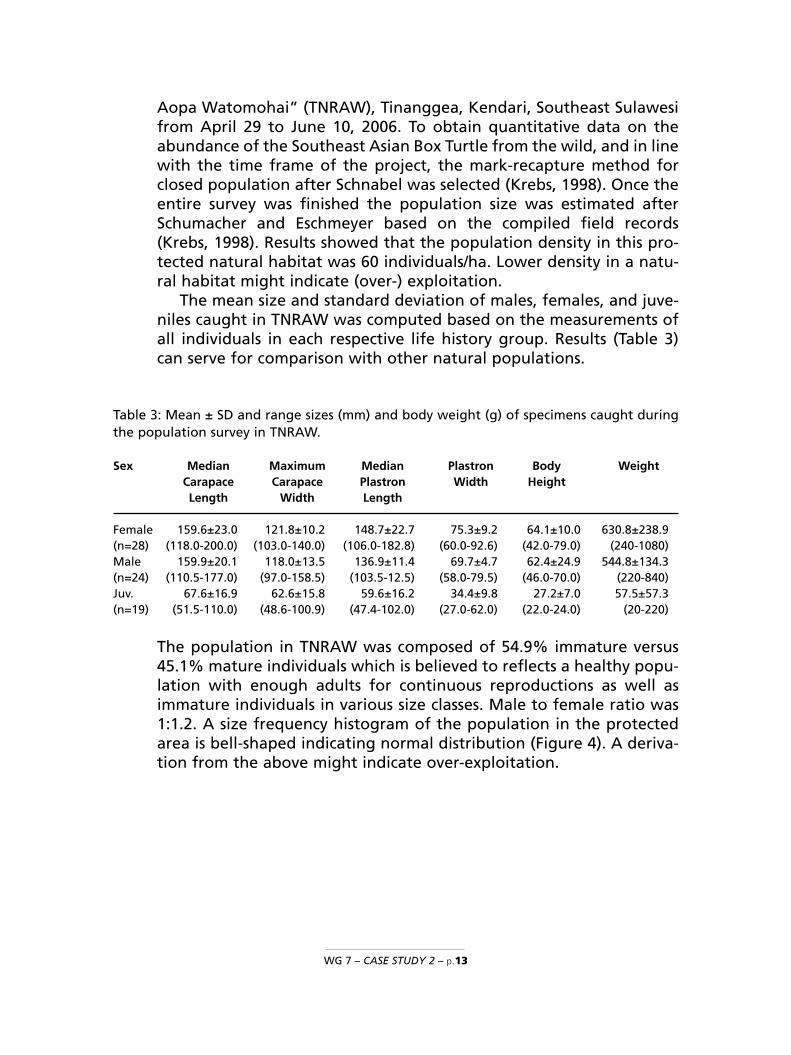
Aopa Watomohai” (TNRAW), Tinanggea, Kendari, Southeast Sulawesifrom April 29 to June 10, 2006. To obtain quantitative data on theabundance of the Southeast Asian Box Turtle from the wild, and in linewith the time frame of the project, the mark-recapture method forclosed population after Schnabel was selected (Krebs, 1998). Once theentire survey was finished the population size was estimated afterSchumacher and Eschmeyer based on the compiled field records(Krebs, 1998). Results showed that the population density in this pro-tected natural habitat was 60 individuals/ha. Lower density in a natu-ral habitat might indicate (over-) exploitation.
The mean size and standard deviation of males, females, and juve-niles caught in TNRAW was computed based on the measurements ofall individuals in each respective life history group. Results (Table 3)can serve for comparison with other natural populations.
Table 3: Mean ± SD and range sizes (mm) and body weight (g) of specimens caught duringthe population survey in TNRAW.
Sex Median Maximum Median Plastron Body WeightCarapace Carapace Plastron Width HeightLength Width Length
Female 159.6±23.0 121.8±10.2 148.7±22.7 75.3±9.2 64.1±10.0 630.8±238.9(n=28) (118.0-200.0) (103.0-140.0) (106.0-182.8) (60.0-92.6) (42.0-79.0) (240-1080)Male 159.9±20.1 118.0±13.5 136.9±11.4 69.7±4.7 62.4±24.9 544.8±134.3(n=24) (110.5-177.0) (97.0-158.5) (103.5-12.5) (58.0-79.5) (46.0-70.0) (220-840)Juv. 67.6±16.9 62.6±15.8 59.6±16.2 34.4±9.8 27.2±7.0 57.5±57.3(n=19) (51.5-110.0) (48.6-100.9) (47.4-102.0) (27.0-62.0) (22.0-24.0) (20-220)
The population in TNRAW was composed of 54.9% immature versus45.1% mature individuals which is believed to reflects a healthy popu-lation with enough adults for continuous reproductions as well asimmature individuals in various size classes. Male to female ratio was1:1.2. A size frequency histogram of the population in the protectedarea is bell-shaped indicating normal distribution (Figure 4). A deriva-tion from the above might indicate over-exploitation.
WG 7 – CASE STUDY 2 – p.13
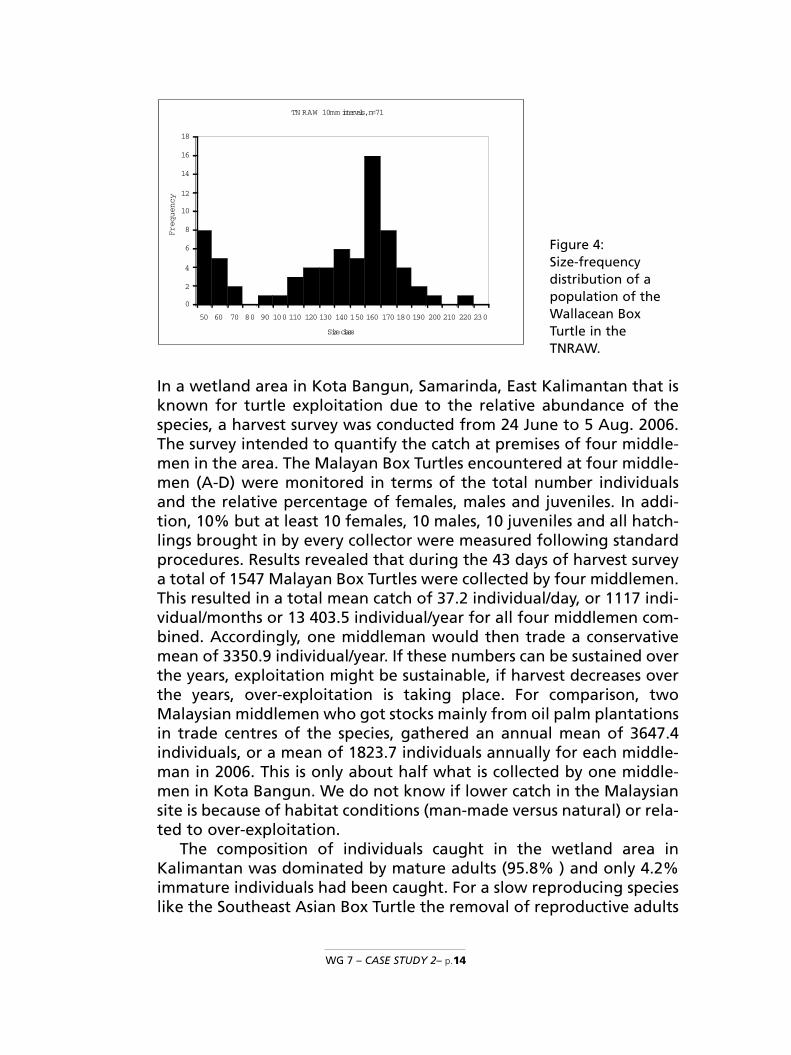
Figure 4:Size-frequency distribution of apopulation of theWallacean BoxTurtle in theTNRAW.
In a wetland area in Kota Bangun, Samarinda, East Kalimantan that isknown for turtle exploitation due to the relative abundance of thespecies, a harvest survey was conducted from 24 June to 5 Aug. 2006.The survey intended to quantify the catch at premises of four middle-men in the area. The Malayan Box Turtles encountered at four middle-men (A-D) were monitored in terms of the total number individualsand the relative percentage of females, males and juveniles. In addi-tion, 10% but at least 10 females, 10 males, 10 juveniles and all hatch-lings brought in by every collector were measured following standardprocedures. Results revealed that during the 43 days of harvest surveya total of 1547 Malayan Box Turtles were collected by four middlemen.This resulted in a total mean catch of 37.2 individual/day, or 1117 indi-vidual/months or 13 403.5 individual/year for all four middlemen com-bined. Accordingly, one middleman would then trade a conservativemean of 3350.9 individual/year. If these numbers can be sustained overthe years, exploitation might be sustainable, if harvest decreases overthe years, over-exploitation is taking place. For comparison, twoMalaysian middlemen who got stocks mainly from oil palm plantationsin trade centres of the species, gathered an annual mean of 3647.4individuals, or a mean of 1823.7 individuals annually for each middle-man in 2006. This is only about half what is collected by one middle-men in Kota Bangun. We do not know if lower catch in the Malaysiansite is because of habitat conditions (man-made versus natural) or rela-ted to over-exploitation.
The composition of individuals caught in the wetland area inKalimantan was dominated by mature adults (95.8% ) and only 4.2%immature individuals had been caught. For a slow reproducing specieslike the Southeast Asian Box Turtle the removal of reproductive adults
WG 7 – CASE STUDY 2– p.14
TN RAW 10mm intervals,n=71
0
2
4
6
8
10
12
14
16
18
50 60 70 80 90 100 110 120 130 140 150 160 170 180 190 200 210 220 230
Sizeclass
Frequency

from one or a few small populations has significant effects on thepopulation structure, recruitment and population genetics.
The harvest impact on the Southeast Asian Box Turtle was assessedin selected sites in South Sulawesi, Sumatra and Kalimantan.Qualitative surveys on the impact harvesting has had or is having onthe populations were carried out through interviews with local resi-dents, store owners, market vendors, collectors, traders, farmers andrecreational fishermen. Interviews were not systematic nor were ques-tionnaires or lead questions used. Interviews were rather informal andsemi-structured in nature, aimed at getting information on the localdistribution, abundance now and five to 10 years ago, and threats.Results show generally over-exploitation and even local extinctionnear and in trade centres, acquisition of individuals from provinceswithout quota (illegal harvest), and that the species is more commonin remote areas that were exploited to lesser extent in the recent past(Figure 5).
Figure 5: Map of Indonesia showing the abundance and exploitation of the Southeast AsianBox Turtle based on interviews and surveys conducted in Java, Sulawesi, Sumatra, andKalimantan in 2006.
WG 7 – CASE STUDY 2 – p.15

4. EVALUATION OF DATA QUANTITY AND QUALITY FOR THE ASSESSMENT• Major deficiency is the lack of past density / population size data to
compare present results with. • Abundance data are needed from more areas preferably from each
major island, and there preferably from various habitats (man-madehabitat, exploited; man-made habitat, not exploited; natural habit,exploited; natural habitat, not exploited).
• The quantity and quality of trade data gathered during this surveyis believed to be sufficient enough to identify current issues and pro-blems correctly.
5. MAIN PROBLEMS, CHALLENGES OR DIFFICULTIES FOUND ON THE ELA-BORATION OF NDF• The enormous amount of illegally traded individuals and the long
chain of people involved in the illegal business. • The degree of corruption. • The large size of Indonesia and the wide range of distribution of the
species.
6. RECOMMENDATIONS
• Illegal trade constitutes the main threat to the survival of the spe-cies and should be stopped before any other management schemescan take place.
• Surveys need to be conducted to determine the exact distribution ofthe species and its abundance in Indonesia.
• A NDF assessment without abundance data and population dyna-mics will remain a compromise unless further bolstered by subse-quently available information incorporated into a monitoringsystem that supports an ‘adaptive management’ framework.
• In the absence of quantitative data on local populations of theSoutheast Asian Box Turtle criteria that might indicate changes inthe local abundance should be assessed. Indicators of change thatwere developed by TRAFFIC SEA after fieldwork in 2006 are(Schoppe, 2007):
1. If collection areas are getting increasingly further away fromurban trade centres.
2. If catch-per-unit-effort (CPUE) has decreased.3. If collection of the species under investigation (and of other tur-
tle species) is a fulltime business for collectors/trappers.4. If threats other than trade are getting more severe.
WG 7 – CASE STUDY 2– p.16
5. If there are frequent, periodical changes in the (international)market price.
6. If the State/provincial/regional annual harvest quota is far frombeing realized.
7. If harvest and export quotas are always realized (actual recordedvolumes) to the maximum volume.
8. If average size of individuals is reduced.9. If traded specimens are mainly adults.
10.If the population structure of traded individuals is significantly infavour of one life history stage.
11.If the sex ratio is significantly different from 1:1.
• The suggested abundance indicators are relatively easy to obtain.Potential sources of information are collectors, middlemen, sup-pliers, exporters, data from importing countries, the CITESManagement and Scientific Authorities in the country of export,published or unpublished reports, and grey literature.
• The above indicators should be assessed on an annual basis at thesame time of the year and at the same sites. Recommended are sitesin trade centres such as Makassar, Medan, Pekanbaru, Tembilahanand Banjarmasin.
WG 7 – CASE STUDY 2 – p.17

REFERENCESANON., 2002. Species Management Workshop funded by Environment Australia. Cibinong,
Indonesia, 15-17 April 2002.ANON., 2003. Administration directive of harvest or capture and distribution of specimens
of wild plants and animal species. Decree of the Ministry of Forestry No. 447/Kpts-II/2003. Republik of Indonesia. Unofficial English Version.
ANON., 2006. Convention on International Trade in Endangered Species of Wild Fauna andFlora. Fifty-fourth meeting of the Standing Committee, Geneva (Switzerland), 2-6October 2006. SC54 Doc. 42.
ANON., 2007. Kuota pengambilan tumbuhan alam dan penangkapan satwa liar untukperiode tahun 2007. Keputusan Direktur Jenderal Perlindungan Hutan Dan KonservasiAlam.
ASIAN Turtle Working Group, 2000. Cuora amboinensis. In: IUCN 2006. 2006 IUCN Red Listof Threatened Species. www.iucnredlist.org. Downloaded on 10 January 2007.
BAILLIE, J. and Groombridge, B., 1996. 1996 IUCN Red List of Threatened Animals. IUCN,Gland, Switzerland.
BOWLER, J.K., 1977. Longevity of reptiles and amphibians in North American collections asof 1 November, 1975. Society for the Study of Amphibians and Reptiles, MiscellaneousPublications, Herpetological Circular 6: 1-32.
CHEN, T.-H., J.-C. Lin, an H.-C. Chang, 2000. Current status and utilization of Chelonians inTaiwan. In van Dijk, P.P., Stuart, B.L. and A.G.J. Rhodin (eds.). Asian Turtle Trade:Proceedings of a Workshop on Conservation and Trade of Freshwater Turtles andTortoises in Asia. Chelonian Research Monographs, 2: 45-51.
FRITZ, U. and P. Havas, 2007. Checklist of Chelonians of the World. Vertebrate Zoology 57:149-368.
HILTON-TAYLOR, C., 2000. 2000 IUCN Red List of Threatened Species. IUCN, Gland,Switzerland and Cambridge, UK.
IUCN 2008. 2008 IUCN Red List of Threatened Species. <http://www.iucnredlist.org/>.Downloaded on 11 October 2008. Jenkins M.D., 1995. Tortoises and Freshwater Turtles:The trade in Southeast Asia. TRAFFIC International, United Kingdom, 48 pp.
JENKINS M.D., 1995. Tortoises and Freshwater Turtles: The trade in Southeast Asia. TRAFFICInternational, United Kingdom, 48 pp.
KREBS, C.J., 1998, Ecological Methodology, 2nd edition. (New York: Harper Collins), 654pp.LAU, M., Chan, B., Crow, P. and G. Ades, 2000. Trade and conservation of turtles and tortoi-
ses in the Hong Kong Special Administrative Region, People’s Republic of China. In vanDijk, P.P., Stuart, B.L. and A.G.J. Rhodin (eds.). Asian Turtle Trade: Proceedings of aWorkshop on Conservation and Trade of Freshwater Turtles and Tortoises in Asia.Chelonian Research Monographs, 2: 39-44.
LIM, B.L. and I. Das, 1999. Turtles of Borneo and Peninsular Malaysia. Natural HistoryPublications, Borneo, 151pp.
MCCORD, W.P. and H.-D. Philippen, 1998. A new subspecies of box turtle, Cuora amboinen-sis lineata, from Northern Myanmar (Burma), with remarks on the distribution and geo-graphic variation of the species. Reptile Hobbyist, p. 51-58.
Mitchell, J.C., 1988. Population ecology and life histories of the freshwater turtlesChrysemys picta and Sternotherus odoratus in an urban lake. HerpetologicalMonograph, 2: 40-61.
MOLL, D. and E.O. Moll, 2004. The Ecology, Exploitation, and Conservation o River Turtles.Oxford University Press, 393pp.
WG 7 – CASE STUDY 2– p.18
MOLL, E.O., and J. Vijaya, 1986. Distributional records for some Indian turtles. J. BombayNatur. Hist. Soc., 83: 57-62.
MOLL, E.O., 1997. Effects of habitat alteration on river turtles of tropical Asia with empha-sis on sand mining and dams. In J. Van Abbema (ed.), Proceedings: Conservation,Restoration, and Management of Tortoises and Turtles - An International Conference,pp. 37–41. July 1993, State University of New York, Purchase. New York Turtle andTortoise Society, New York, 494 pp.
ROGNER, M., 1996. Schildkröten, Vol. 1 and 2. Heiro-Verlag, Hürtgenwald, Germany, 49 pp. RUMMLER, H.-J. and U. Fritz, 1991. Geographische Variabilitaet der Amboina-
Scharnierschildkroete Cuora amboinensis (Daudin, 1802), mit Beschreibung einer neuenUnterart, C. a. kamaroma subsp. nov. Salamandra, 27(1): 17-45.
SCHOPPE, S., in prep., Status, trade dynamics and management of the Southeast Asian BoxTurtle Cuora amboinensis in Indonesia. TRAFFIC Southeast Asia, Technical Report, KualaLumpur, Malaysia.
SCHOPPE, S., 2008, Science in CITES: The biology and ecology of the South East Asian BoxTurtle Cuora amboinensis and its local uses and trade in Malaysia. TRAFFIC SoutheastAsia, Technical Report, Kuala Lumpur, Malaysia.
SCHOPPE, S., 2007, Non-Detrimental Finding Methodology for the Trade of Southeast AsianFreshwater Turtles and Tortoises (Fam. Geoemydidae). Unpublished Report for TRAFFICSoutheast Asia, Kuala Lumpur, Malaysia, 19 pp.
VAN DIJK, P.P., 2000. The Status of Turtles in Asia. In van Dijk, P.P., Stuart, B.L. and A.G.J.Rhodin (eds.). Asian Turtle Trade: Proceedings of a Workshop on Conservation and Tradeof Freshwater Turtles and Tortoises in Asia. Chelonian Research Monographs, 2: 15-18.
VAN DIJK, P.P., Iskandar, D.T., Palasuwan, T, Rhodin, A.G.J., Samedi, Sharma, D.S.K.,Shepherd, C.R., Tisen, O.B. and V.R. Genorupa, 2000. Turtle trade in Southeast Asia:Regional Summary (Indonesia, Malaysia, Papua New Guinea, and Thailand). In van Dijk,P.P., Stuart, B.L. and A.G.J. Rhodin (eds.). Asian Turtle Trade: Proceedings of a Workshopon Conservation and Trade of Freshwater Turtles and Tortoises in Asia. ChelonianResearch Monographs, 2: 145-147.
WHITAKER, R. and H.V. Andrews, 1997. Captive breeding of Indian turtles and tortoises atthe Centre for Herpetology/Madras Crocodile Bank. In J. Van Abbema (ed.),Proceedings: Conservation, Restoration, and Management of Tortoises and Turtles - AnInternational Conference, pp. 166–170. July 1993, State University of New York,Purchase. New York Turtle and Tortoise Society, New York, 494 pp.
WILBUR, H.M., 1975. The evolutionary and mathematical demography of the turtlesChrysemys picta. Ecology, 56: 64-77.
WG 7 – CASE STUDY 2 – p.19

WG7 CS2-S p. 1
NDF WORKSHOP WG 7 – Reptiles and Amphibians
CASE STUDY 2 SUMMARY Cuora amboinensis
Country – Indonesia Original language – English
THE SOUTHEAST ASIAN BOX TURTLECUORA AMBOINENSIS (DAUDIN, 1802) IN INDONESIA
AUTHOR: Sabine Schoppe
The Southeast Asian Box Turtle Cuora amboinensis is a widely distributed freshwater turtle native to Southeast Asia. The species occurs in natural and man-made wetlands. The global and national conservation status of the species is “Vulnerable”. Since 2000 export has been managed through a quota system with the purpose of population management and sustainable use.
TRAFFIC South East Asia (SEA) proposes a NDF methodology using criteria that were assessed during fieldwork in 2006: legislation and enforcement; trade levels; extent of illegal trade; reproduction biology; composition of wild populations and individuals in trade; abundance in a protected area; and abundance in harvest in an exploited area. Results show that Indonesia has a substantive legislative framework in place to govern the management of wildlife harvest and trade. Law enforcement is however rather weak. The species remains among the most abundantly traded freshwater turtles in Asia. The species is used for human food consumption, Traditional Chinese Medicine, merit release and as pet. In Indonesia it has the highest harvest quota (20 000) of all hard-shelled turtles. All specimens are wild caught, year around. Ten percent (2000 individuals) are allotted for local utilization but local use is negligible with ethnic Chinese as the main user group. The export quota of 18 000 individuals is divided among 14 pet exporters (1/3 of quota, preferably large adults) and four meat/TCM exporters (2/3 of quota, preferably small individuals). Destinations for the meat and the shell trade are East Asian countries, mainly Hong Kong SAR and mainland China and Singapore. Pet importing countries are Europe, Japan and the United States of America. A conservative estimate is that illegal trade amounts to 10 times the volume of legal trade. The slow reproductive rate of the species makes it very vulnerable for exploitation and at the same time makes captive breeding an unfeasible endeavour, which is therefore not practiced in the country.
Individuals encountered in the wild and in trade were measured and means calculated. These data may serve as baseline data for further comparative studies. Since larger size classes are targeted for the large-scale consumption trade a smaller mean size of individuals in trade compare to the mean size in the wild may be related to over-exploitation of larger size classes. A survey to assess the abundance of the species in a protected area, revealed an estimated density of 60 ind./ha. These data may serve as baseline data, and lower density in a similar natural habitat might

WG7 CS2-S p. 2
indicate over-exploitation. If off-take is sustainable population density will be lower but stable. A continual decline in density would indicate over-exploitation. The wild population was composed of 54.9% immature versus 45.1% mature individuals; sex ratio was M1:F1.2. A size frequency histogram of the population in the protected area is bell-shaped indicating normal distribution. A deviation from the above might indicate over-exploitation. For example, in a natural wetland with long exploitation history in East Kalimantan, 95.8% of the catch were adults, and sex ratio was 1M:1.03F. To determine the abundance in the exploited natural wetland a 43-day lasting harvest survey was conducted. Results indicate that one middleman can trade a conservative mean of 3350.9 individual/year. If catch per unit effort (CPUE) can be sustained over the years, exploitation might be sustainable, if CPUE decreases over the years, over-exploitation is taking place. The assessment of the harvest impact on the species all over Java, Sulawesi, Sumatra and Kalimantan showed over-exploitation and even local extinction near and in trade centres, acquisition of individuals from provinces without quota, and that the species is more common in remote areas that were exploited to lesser extent in the recent past.
Major problems found in the elaboration of the NDF are the lack of past
density / population size data to compare present results with; the enormous amount of illegally traded individuals and the long chain of people involved in the illegal business. In the absence of quantitative data on local populations of the Southeast Asian Box Turtle criteria that might indicate changes in the local abundance that should be assessed on a regular basis are recommended.
NDF WORKSHOP CASE STUDIESWG 7 – Reptiles and Amphibians
CASE STUDY 3
Malacochersus tornieri
Country – KENYAOriginal language – English
CONSERVATION, MANAGEMENT AND CONTROL OF TRADE IN PANCAKE TORTOISE MALACOCHERSUSTORNIERI (SIEBENROCK, 1903) IN KENYA: THE NON-DETRIMENT FINDING STUDIES CASE STUDY
A U H T O R .Solomon KyaloKenya Wildlife Service, Kenya
1. BIOLOGICAL DATA
1.1. TaxonomyClass: ReptiliaOrder: TestudinataFamily: TestudinidaeScientific name: Maalacochersus tornieri (Siebenrock, 1903) Common names: English: Pancake tortoise
Swahili: Kobe
WG 7 – CASE STUDY 3 – p.1
I. BACKGROUND INFORMATION ON THE TAXA

1.2. Distribution of Pancake tortoise (Malacochersus tornieri)population in KenyaPancake tortoise is a rock crevice-dwellinsg tortoise and inhabitspatchy microhabitats of rock outcrops and kopjes discontinuously dis-tributed throughout the drylands of Kenya. Its distribution overlapswith that of Precambrian rocks of the basement complex systemmainly in agro-climatic zone V. The distribution ranges from south-eastern to northern parts of the country and covers seven districtsnamely: – Kitui and Mwingi (Greater Kitui), Tharaka,(greater Meru),Mbeere (greater Embu), Samburu, Isiolo and Marsabit.
The species distribution range is characterized mostly by thorn—bush land, thickets, Acacia— Commiphora woodland and grassland.Altitude influences distribution of optimal microhabitats for the spe-cies. The distribution is therefore patchy with aggregated populations.
The populations are discontinuously scattered from southeastern tonorthern parts of the country from Kitui to Samburu districts respecti-vely with Kiasa and Ithumba hills within Tsavo East National Park northof Galana river as the southern limit and Ngurunit area on the easternslopes of Ndotto Mountains with a small spill over population inMarsabit district as the northern limit of the species distribution.Pancake tortoise prefers well-sheltered rock crevices with the inhabi-ted rock crevices orientation varying from horizontal to vertical incli-nation. This accounts for the species patchy and discontinuous distri-bution. The limited suitable rock crevices regulate population size anddistribution.
The species occurs in both protected and non-protected areaswithin its range. However the population in protected areas is propor-tionally very small (less than 5%) in comparison with that outside esti-mated to account for over 95% of the country’s species population.
Generally, Pancake tortoise population distribution in Kenya cantherefore be grouped into two; southern sub-population whose distri-bution covers Kitui, Mwingi, Tharaka and Mbeere and the northernsub- population covering Samburu, Isiolo and Marsabit districts.
WG 7 – CASE STUDY 3– p.2

FIG. 2 Map Showing Distribution of pancake tortoise overlapping with precambrian rocksand agroecological zone V in Kenya 2002.
WG 7 – CASE STUDY 3 – p.3

FIG. 3 Map Showing Distribution of pancake tortoise inkitui & Mwingi (greater kitui) dis-tricts 2002.
WG 7 – CASE STUDY 3– p.4

FIG. 5 Map Showing Distribution of pancake tortoise in isiolo marsabit and samburu districts 2002.
WG 7 – CASE STUDY 3 – p.5

1.3 Biological characteristics
1.2.1. Life HistoryPancake tortoise, Malacochersus tornieri is a small soft shelled dorso-ventrally flattened rock crevice inhabitant. The shell is flattened andflexible and enables it to push and wedge itself in rock crevices. Thisunique appearance and behavior makes the species popular in theinternational pet trade.
Body structure (morphology) of Pancake tortoise
Horn colored adult specimen (With carapace geometric pattern lost)
Carapace abnormality ((4th vertebral scute divided into three)
Plastron segment showing “V” shaped caudal/ posterior scute
WG 7 – CASE STUDY 3– p.6
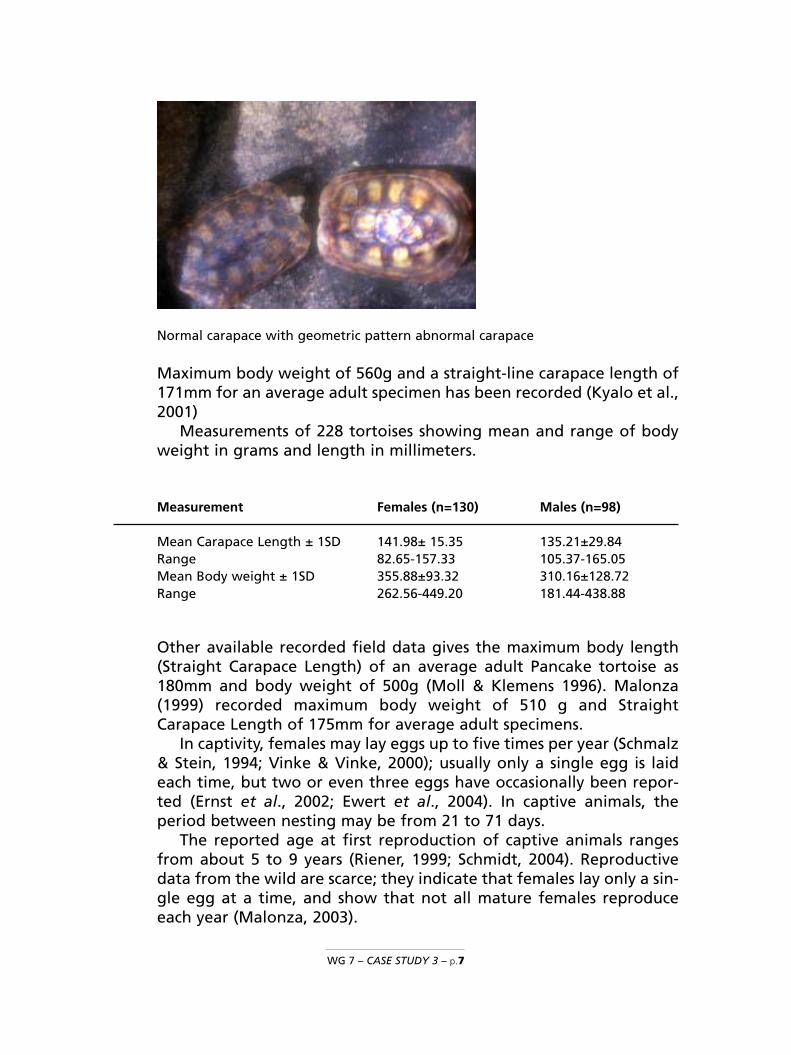
Normal carapace with geometric pattern abnormal carapace
Maximum body weight of 560g and a straight-line carapace length of171mm for an average adult specimen has been recorded (Kyalo et al.,2001)
Measurements of 228 tortoises showing mean and range of bodyweight in grams and length in millimeters.
Measurement Females (n=130) Males (n=98)
Mean Carapace Length ± 1SD 141.98± 15.35 135.21±29.84Range 82.65-157.33 105.37-165.05Mean Body weight ± 1SD 355.88±93.32 310.16±128.72Range 262.56-449.20 181.44-438.88
Other available recorded field data gives the maximum body length(Straight Carapace Length) of an average adult Pancake tortoise as180mm and body weight of 500g (Moll & Klemens 1996). Malonza(1999) recorded maximum body weight of 510 g and StraightCarapace Length of 175mm for average adult specimens.
In captivity, females may lay eggs up to five times per year (Schmalz& Stein, 1994; Vinke & Vinke, 2000); usually only a single egg is laideach time, but two or even three eggs have occasionally been repor-ted (Ernst et al., 2002; Ewert et al., 2004). In captive animals, theperiod between nesting may be from 21 to 71 days.
The reported age at first reproduction of captive animals rangesfrom about 5 to 9 years (Riener, 1999; Schmidt, 2004). Reproductivedata from the wild are scarce; they indicate that females lay only a sin-gle egg at a time, and show that not all mature females reproduceeach year (Malonza, 2003).
WG 7 – CASE STUDY 3 – p.7
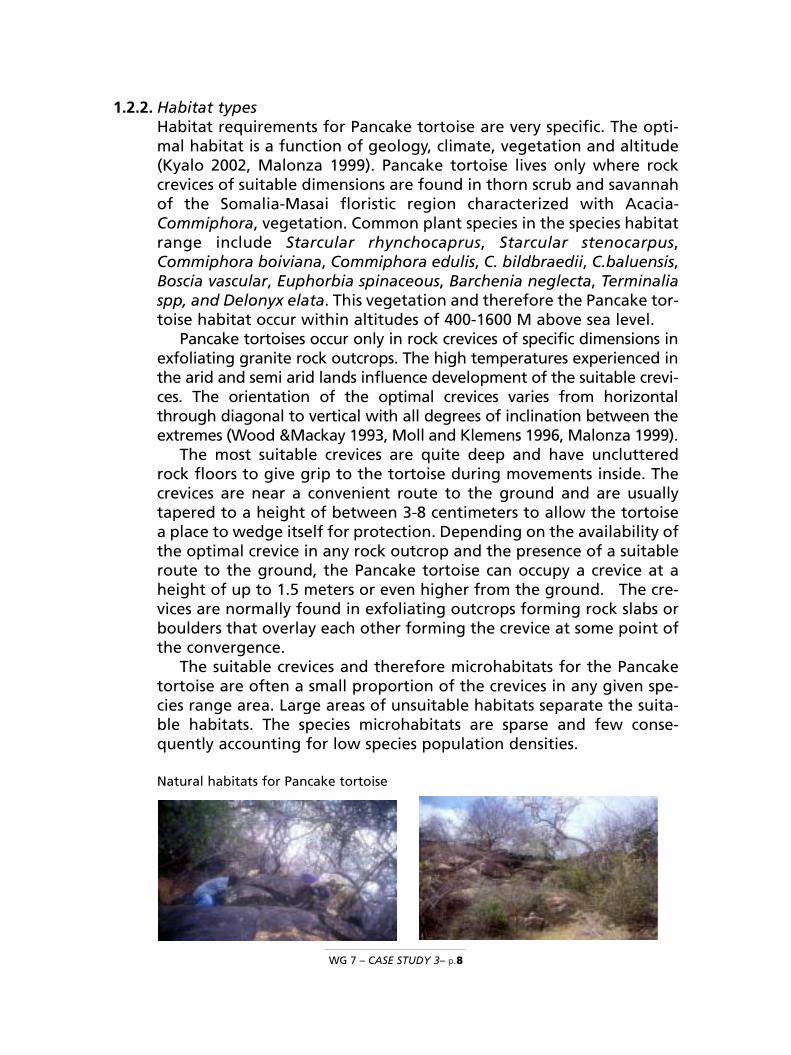
1.2.2. Habitat typesHabitat requirements for Pancake tortoise are very specific. The opti-mal habitat is a function of geology, climate, vegetation and altitude(Kyalo 2002, Malonza 1999). Pancake tortoise lives only where rockcrevices of suitable dimensions are found in thorn scrub and savannahof the Somalia-Masai floristic region characterized with Acacia-Commiphora, vegetation. Common plant species in the species habitatrange include Starcular rhynchocaprus, Starcular stenocarpus,Commiphora boiviana, Commiphora edulis, C. bildbraedii, C.baluensis,Boscia vascular, Euphorbia spinaceous, Barchenia neglecta, Terminaliaspp, and Delonyx elata. This vegetation and therefore the Pancake tor-toise habitat occur within altitudes of 400-1600 M above sea level.
Pancake tortoises occur only in rock crevices of specific dimensions inexfoliating granite rock outcrops. The high temperatures experienced inthe arid and semi arid lands influence development of the suitable crevi-ces. The orientation of the optimal crevices varies from horizontalthrough diagonal to vertical with all degrees of inclination between theextremes (Wood &Mackay 1993, Moll and Klemens 1996, Malonza 1999).
The most suitable crevices are quite deep and have unclutteredrock floors to give grip to the tortoise during movements inside. Thecrevices are near a convenient route to the ground and are usuallytapered to a height of between 3-8 centimeters to allow the tortoisea place to wedge itself for protection. Depending on the availability ofthe optimal crevice in any rock outcrop and the presence of a suitableroute to the ground, the Pancake tortoise can occupy a crevice at aheight of up to 1.5 meters or even higher from the ground. The cre-vices are normally found in exfoliating outcrops forming rock slabs orboulders that overlay each other forming the crevice at some point ofthe convergence.
The suitable crevices and therefore microhabitats for the Pancaketortoise are often a small proportion of the crevices in any given spe-cies range area. Large areas of unsuitable habitats separate the suita-ble habitats. The species microhabitats are sparse and few conse-quently accounting for low species population densities.
Natural habitats for Pancake tortoise
WG 7 – CASE STUDY 3– p.8
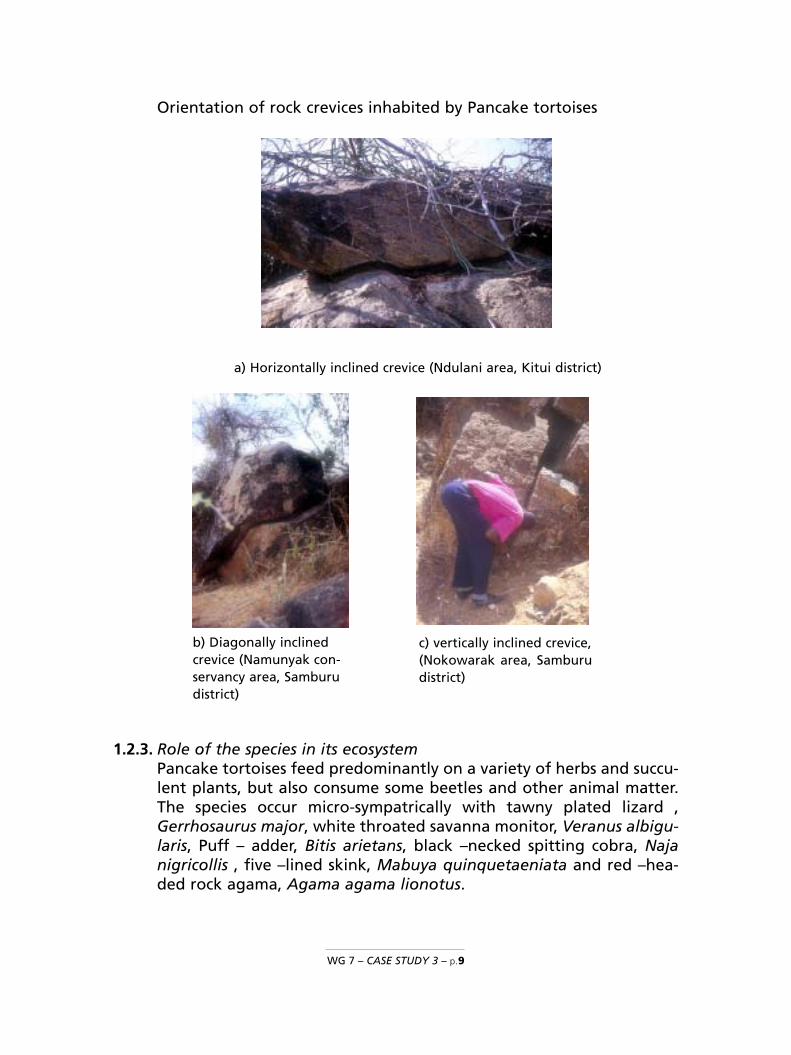
Orientation of rock crevices inhabited by Pancake tortoises
a) Horizontally inclined crevice (Ndulani area, Kitui district)
1.2.3. Role of the species in its ecosystemPancake tortoises feed predominantly on a variety of herbs and succu-lent plants, but also consume some beetles and other animal matter.The species occur micro-sympatrically with tawny plated lizard ,Gerrhosaurus major, white throated savanna monitor, Veranus albigu-laris, Puff – adder, Bitis arietans, black –necked spitting cobra, Najanigricollis , five –lined skink, Mabuya quinquetaeniata and red –hea-ded rock agama, Agama agama lionotus.
WG 7 – CASE STUDY 3 – p.9
b) Diagonally inclinedcrevice (Namunyak con-servancy area, Samburudistrict)
c) vertically inclined crevice,(Nokowarak area, Samburudistrict)

1.3. Population
1.3.1. Global population sizeThe global population of Pancake tortoise in the wild is not known.This species occurs in fragmented populations in Kenya, Tanzania andrecently in 2004 established to occur in North-eastern Zambia.
1.3.2. Current Global population trends___increasing ____decreasing _X__stable ____unknown
The current global population is reduced but stable
1.4. Conservation status
1.4.1. Global conservation status___Critically endangered ___Near Threatened___Endangered ___Least concern_X_Vulnerable ___Data deficient
M.tornieri is listed under IUCN as Vulnerable species (IUCN 1996). Allwild populations of Malacochersus tornieri were first listed inAppendix II of the Convention on International Trade in EndangeredSpecies of Wild Fauna and Flora (CITES) on July 1975 calling for contro-lled trade of the species through use of permits.
Currently, there is a trade moratorium on specimens collected fromthe wild and therefore legal trade in the species only involves speci-mens bred in captivity.
1.4.2. National conservation statusThe Pancake tortoise is uncommon considering that the population isrestricted to only areas with optimal habitat characteristics it specifi-cally requires. The species abundance and density is a function of thehabitat quality. Well-oriented rock crevices, high vegetation cover overthe rock outcrop and less human habitat destruction are characteris-tics of high quality habitat for the species.
The abundance of Pancake tortoise qualitatively varies from area toarea depending on the availability and number of suitable microhabi-tats. The species population densities differ from one site to the other.This change in densities is a function of habitat preference. Suitablecrevices accommodate solitary, pair as well as multiple assemblages ofPancake tortoise.
In undisturbed habitats with well-vegetated rock outcrops, fre-quency of encounter and occurrence of multiple assemblages and the-
WG 7 – CASE STUDY 3– p.10
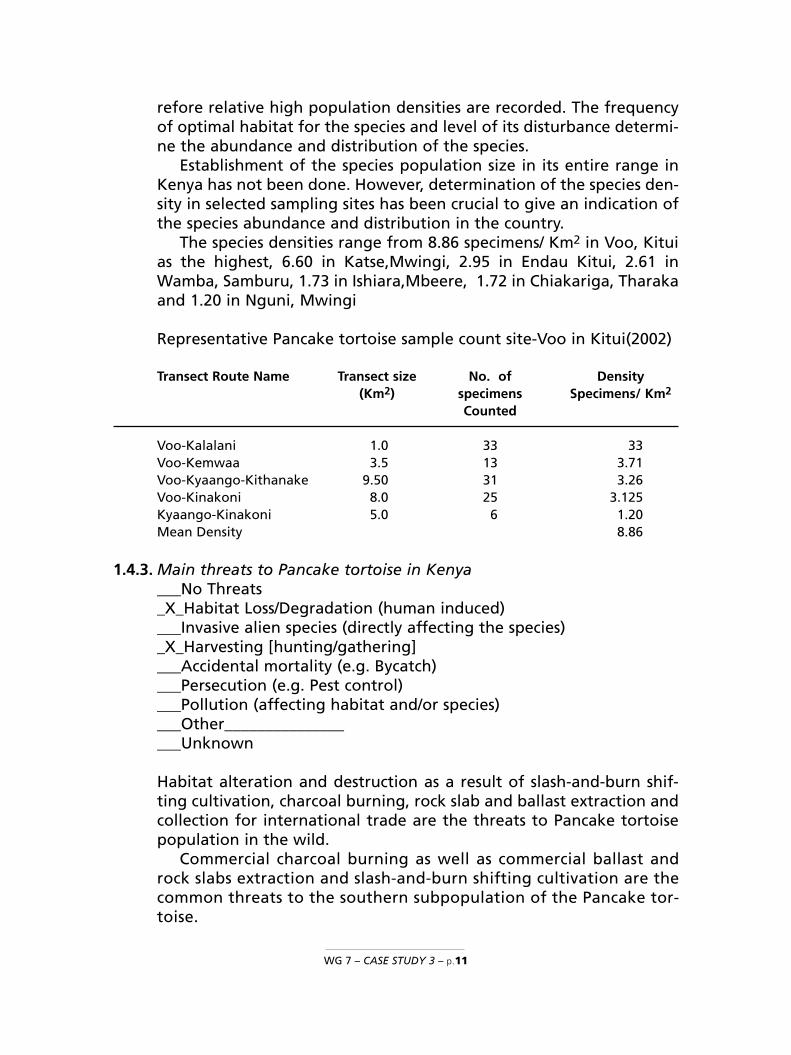
refore relative high population densities are recorded. The frequencyof optimal habitat for the species and level of its disturbance determi-ne the abundance and distribution of the species.
Establishment of the species population size in its entire range inKenya has not been done. However, determination of the species den-sity in selected sampling sites has been crucial to give an indication ofthe species abundance and distribution in the country.
The species densities range from 8.86 specimens/ Km2 in Voo, Kituias the highest, 6.60 in Katse,Mwingi, 2.95 in Endau Kitui, 2.61 inWamba, Samburu, 1.73 in Ishiara,Mbeere, 1.72 in Chiakariga, Tharakaand 1.20 in Nguni, Mwingi
Representative Pancake tortoise sample count site-Voo in Kitui(2002)
Transect Route Name Transect size No. of Density(Km2) specimens Specimens/ Km2
Counted
Voo-Kalalani 1.0 33 33Voo-Kemwaa 3.5 13 3.71Voo-Kyaango-Kithanake 9.50 31 3.26Voo-Kinakoni 8.0 25 3.125Kyaango-Kinakoni 5.0 6 1.20Mean Density 8.86
1.4.3. Main threats to Pancake tortoise in Kenya___No Threats_X_Habitat Loss/Degradation (human induced) ___Invasive alien species (directly affecting the species) _X_Harvesting [hunting/gathering] ___Accidental mortality (e.g. Bycatch)___Persecution (e.g. Pest control)___Pollution (affecting habitat and/or species) ___Other__________________Unknown
Habitat alteration and destruction as a result of slash-and-burn shif-ting cultivation, charcoal burning, rock slab and ballast extraction andcollection for international trade are the threats to Pancake tortoisepopulation in the wild.
Commercial charcoal burning as well as commercial ballast androck slabs extraction and slash-and-burn shifting cultivation are thecommon threats to the southern subpopulation of the Pancake tor-toise.
WG 7 – CASE STUDY 3 – p.11
Exploitation of the Pancake Tortoise for international trade is theonly significant human utilization of the species. Pancake tortoiseshave been popular display animals in zoos and among private hobb-yists. Trade in the species has been significant in recent decades suchthat when compounded with the threat of habitat alteration and loss,the species is now rated “vulnerable” on the IUCN Red List. Collectionof specimens of the species for international trade has been identifiedas a major threat to the species population in areas around Nguni,Mataka and Katse in Mwingi district and in Kianjeru, Mbeere district
In Samburu, Isiolo and Marsabit districts where the local people arenomadic pastoralist, the species is not threatened per se as there is lit-tle habitat destruction caused by livestock grazing; a land use practicewhich has insignificant threat to the species survival.
2. MANAGEMENT OF PANCAKE TORTOISE IN KENYA
2.1. Management Measures
2.1.1. Management historyInternational trade in the species has been regulated under CITESAppendix II since 1975. In Kenya, trade in specimens of the species isrestricted to those from breeding operations. No collection of the spe-cies from the wild for commercial trade is currently allowed.
In 2000, Kenya put forward to the CITES 11th Conference of theParties a proposal for inclusion of the species in CITES Appendix I. Thisproposal was however withdrawn following results of findings of theCITES Animals Committee mission to Tanzania in 1998 and further dueto recommendations for development of strict management measuresfor captive breeding and trade of the species. These strict manage-ment measures complement the CITES trade regulation and manage-ment with the aim to meet legitimate demand for the species withanimals produced in a manner that minimizes impact on wild popula-tions and provides financial returns to the species range State.
At the 12th Conference of the Parties in 2002, and based on infor-mation generated through a national survey in 2001-2002 of the spe-cies population distribution in Kenya, Kenya proposed introduction ofa CITES resolution that would direct the Animals Committee to:
1) review the biology, genetic variability, conservation status and dis-tribution of this species in the wild;
2) assess the current production systems of this species with the aimof advising on adequate control, management and monitoringpractices;
WG 7 – CASE STUDY 3– p.12

3) consider appropriate identification and marking systems for speci-mens in trade and for breeding stocks in captivity in the rangeStates; and
4) advise on training and capacity-building needs to manage and con-trol trade in this species.
Most of the Pancake tortoise populations occur in the south easternKenya where habitat alteration is a major problem. Efforts are beingenhanced towards generation of the best scientific information aboutthe species to elaborate on its conservation management plan inclu-ding establishment of a system of publicly and /or privately ownednature reserves as a process towards providing for strictly controlledsustainable harvesting from the system to allow for incentives for con-servation and management of the species in-situ.
2.1.2. Species Management Plan & its purposeOne of the recommendations put forward based on the results of theNon- detriment finding studies was
Through adoption of a decision by the CITES Conference of theParties,a) only specimens of not more than 8cm and from the breeding ope-
rations should be allowed into the trade in order to control ille-gal collection of juveniles of the species from the wild.
a) considering that Pancake tortoise occupies a very specific type ofhabitat, the breeding operations should replicate as much as pos-sible the natural habitat of the species
b) the ratio of hatchlings to adult females in a breeding operationshould reflect the known reproduction rate of the species in itsnatural habitat unless manipulation of conditions in the breedingoperations scientifically prove otherwise.
AT NATIONAL LEVEL:• Efforts should be made to have community programmes planned
and initiated to create awareness on Pancake tortoise and threats tothe species, promote the importance of the species to the local peo-ple and help to counteract the already identified threats to the sur-vival of the species in the non-protected areas.
• Establishment and promotion of Pancake tortoise conservancyareas/sanctuaries/nature reserves that may be private or communitybased managed as the preferred option to that of breeding in cap-tivity considering the biology of the species. Recommended areasfor pilot projects include Voo and Endau in Kitui, Katse in Mwingiand Ciangera in Mbeere districts.
WG 7 – CASE STUDY 3 – p.13

• Research studies should be promoted, guided and supported togenerate more scientific information on Pancake tortoise. Theresearch mainly to focus on the species ecology/and or behaviorshould be highly applied with strong implications for the speciesconservation and management. Data on population dynamics,social and reproductive behavior, home range size, movement pat-terns or on reproduction growth and mortality rates should begenerated as much as possible as this information is important forPopulation Viability Analysis, population modeling and to conser-vation planning.
• Research work to generate Genetic baseline information onPancake tortoise should be initiated and promoted to help in spe-cies identification, individual identity, parent offspring relationshipestablishment and population identification. Different populationsof the same species of animal can be genetically distinct and thesedifferences can be exploited to determine the geographic origin ofthe individual. DNA samples of Pancake tortoises to be collectedthrough this research will help build the database needed to makeDNA typing possible and use it to unravel wildlife crimes involvingillegal trade in Pancake tortoise.
• Research and Monitoring programmes should be supported tomonitor trends of the natural and introduced populations ofPancake tortoise.
• More and long-term surveys should be supported to determine thepopulation size of Pancake tortoise in the identified distributionareas both in the protected and non-protected.
• More research work should be supported to establish whether apopulation of the species exists in the inaccessed areas of BisanadiNational Reserve, Garbatula and Shaba hills in Isiolo district thatcould link the species population in the south with that in thenorth.
• range States for the Pancake tortoise should initiate and promotejoint surveys and monitoring of the species in an effort to determi-ne the species’ population status across its entire range and developcommon management programmes for the species.
2.1.3. General elements of the Management PlanApart from the recommended management measures (see 2.1.2), nospecific management plan for the species has been prepared.However, there are procedures for authorizing wildlife captive bree-ding operations in Kenya and these procedures also apply in regard tothe Pancake tortoise.
WG 7 – CASE STUDY 3– p.14

2.2. Monitoring system All the authorized wildlife breeding operations are routinely inspec-ted to ensure enforcement and compliance. The breeding operationsare required as a matter of procedure to file with the managementAuthority quarterly returns on the performances of the operations.
2.2.1. Methods used to monitor harvestExcept removal of specimens of Pancake tortoise as breeding stockupon authorization of a breeding operation to breed the species,removal from the wild of specimens of Pancake tortoise is prohibited.Upon authorization and licensing of the breeding operations, routineinspections of the breeding facilities are conducted by the WildlifeAuthorities
2.2.2. Confidence in the use of MonitoringThe MA is responsible for issuance of all authorities and permits forwildlife breeding and trade in accordance with the provisions of theWildlife Act CAP 376 of Kenya. Authority for establishment of a bree-ding operation for Pancake tortoise and capture of the initial bree-ding stock is issued by the Management Authority. The authorizationto capture the breeding stock is issued only when the ManagementAuthority is satisfied that the applicant for a breeding operation hasput in place appropriate breeding facility that replicates the naturalhabitat of the species for its success in captivity.
2.3. Legal framework and law enforcementHunting and dealership in wildlife and wildlife products have beenoutlawed in Kenya by an Act of Parliament since 1977 and 1978 res-pectively. However, Section 67 of the Wildlife Act allows the Ministerin charge of wildlife to make regulations for the better managementof wildlife farming.
Within the provisions of Section 67 of the Wildlife Act, trade in spe-cimens of Pancake tortoise bred in captivity is allowed. Trade in wildcollected specimens of Pancake tortoise is therefore prohibited by law.
3. UTILIZATION OF AND TRADE IN PANCAKE TORTOISE IN KENYA
3.1. Type of utilizationUtilization of Pancake tortoise in Kenya is for international live pettrade mainly to Asia and America. Traded specimens are sourced fromauthorized breeding operations.
WG 7 – CASE STUDY 3 – p.15

3.2. Harvest
3.2.1. Harvesting regimeRemoval from the wild of Pancake tortoise is allowed only for bree-ding stock in authorized and licensed breeding operations.Consequently, limited number of adult specimens in the ratio 1:3males and females is collected from the wild.
3.2.2. Harvest Management/ControlInternational trade is likely to occur at unsustainable levels if there isno adequately functioning mechanism to advise on the matter ofdetriment, the “non-detriment” finding is incorrect as a result ofinsufficient information on the species, or export permits are issuedcontrary to the advice on matter of detriment.
Kenya banned all trade in wild caught specimens of the species in1981. This saw increased exports of specimens of the species fromTanzania. A moratorium on exports of M.tornieri for Tanzania wasplaced in 1992 pending results of an assessment on significant tradein the species. The assessment followed a seizure of several ship-ments of the species. The trade assessment found out there wasextensive collection of Pancake tortoise in its entire range inTanzania and that the species had been severely threatened (Klemens & Moll 1995)
Following the moratorium, Tanzania allowed operations to breedspecimens of the species for trade. This followed in 1993 establishmentof tortoise breeding farms to breed Pancake tortoise among other tor-toise species for commercial purposes (Kyalo &Malonza 2001)
In 1995 Kenya licensed establishment of one breeding operationand later in 2005 another both in the known Pancake tortoise range.A third breeding operation but outside the species natural range wasestablished in 1998 to breed the species for trade. The three opera-tions are regulated and monitored by the wildlife authority to ensurecompliance.
3.3. Legal and illegal trade levelsBetween 1996-2005 the licensed breeding operations have legallyexporting using CITES Permits approximately 1,300 live specimens ofPancake tortoise from Kenya.
Despite the moratorium on trade in wild collected specimens ofPancake tortoise and the permit system to control trade in the species,there have been illegal trafficking of specimens of Pancake tortoise forinternational market. The trafficking has been from both range andnon -range States.
WG 7 – CASE STUDY 3– p.16

Cases of illegal trade in the species have been reported and seizu-res of live specimens made. Confiscation of a consignment of 209 spe-cimens in Uganda in 2001 and another of 36 from Tanzania in 2007 isa clear indication that there is demand for specimens of the species inthe international market.
The aims of the Convention on International Trade in EndangeredSpecies of wild Fauna and Flora –CITES are to protect species from thedetrimental effects of over exploitation for international trade andensure sustainable utilization of others. Determining when internatio-nal trade is likely to prove non -detrimental to the survival of the spe-cies is essential.
Inadequate application of stricter measures to control the tradeespecially exports of Pancake tortoise specimens from the breedingoperations across the species range can easily render efforts to controlillegal trade in specimens of the species from the wild futile.
1. IS THE METHODOLOGY USED BASED ON THE IUCN CHECKLIST FORNDFs?
_X_yes ___no
Methodology used in doing NDF studies on Pancake tortoise has beenbasically undertaking of a national survey in 2001-2002 to establishthe species population distribution and status using the IUCN checklistfor NDFs. The checklist was extensively referred to during the process.
2. CRITERIA, PARAMETERS AND INDICATORS USEDThe concepts in the checklist were referred to when carrying out theNDF process and applied in combination with information on thefollowing elements:The species characteristics:
• Distribution• Tolerance to human disturbance such as habitat alteration and con-
version into agriculture and destruction of the habitat as a result ofrock ballast harvesting
• Ease with which to breed in captivity• Species habitat requirements
WG 7 – CASE STUDY 3 – p.17
II. NON-DETRIMENT FINDING PROCEDURE (NDFS)

3. MAIN SOURCES OF DATAThe following are the sources of data for making NDF on Pancake tor-toise in Kenya• Field assessment of population abundance. Regular assessments of
the identified and mapped fragmented populations as establishedduring the national survey in 2001-2002
• Applications to breed and for exports of live specimens by the bree-ding operations
• Authorities to capture breeding stocks and the returns filed by thebreeders with Kenya Wildlife Service
• Export permits issued for export of live specimens of Pancake tortoise • Reporting by the breeding operations on the performance of the
facilities and physical inspections of the breeding facilities by theWildlife Authorities to assess the levels of production
• Routine inspection of the breeding operations by the Managementand Scientific authorities.
4. EVALUATION OF DATA QUANTITY AND QUALITY FOR THE ASSESSMENTData generated from detailed reporting by the breeding operations onlevels of successful recruitment in the breeding operations against thenumber of specimens approved for removal from the wild as breedingstocks is evaluated and analyzed to provide information on the speciespopulation dynamics. The information is also used to monitor compliance.
5. MAIN PROBLEMS, CHALLENGES OR DIFFICULTIES ON ELABORATION OF NDFMajor challenge in the elaboration of NDF studies on the Pancake tor-toise has been to get the definite population size of the species consi-dering its biology, behavior, habitat characteristics and remoteness ofits distribution range.
6. RECOMMENDATIONSThe use of the IUCN Checklist for NDF is quite applicable to the Pancaketortoise species. The checklist is therefore a practical tool for making NDFon the species however, it is important that quantitative data on the spe-cies is generated to provide informed assessment of the status of the spe-cies especially where the checklist calls for qualitative information andalso assist in making decision on possible alternative management systemsuch as allowing limited off-take from the wild especially as incentives tocommunities supporting the in-situ conservation of the species by fore-going other land use systems. Efforts must therefore be made to genera-te the quantitative information as much as possible. Such elements thatneed this quantitative data include the biological status to inform on theapproximate population size, structure, sex ratio and nesting ecology.
WG 7 – CASE STUDY 3– p.18
INTERNATIONAL EXPERTS WORKSHOP ON CITES NON- DETRIMENT FINDINGS
Cancun (México), 17-22 Nov. 2008
PRESENTATION ON
Kenya Case Study on Pancake tortoise (Malacochersus tornieri)
BYSolomon N. Kyalo
KENYA

CASE STUDY
Conservation Status and Management of Pancake Tortoise ( Malacochersus tornieri, (SiebenRock, 1903) in Kenya-Non –Detriment Finding Studies process
A Case Study presented at the International Expert Workshop on CITES Non-Detriment Findings, Cancun (Mexico), 17-22 November 2008

BACKGROUND
The Species- Pancake tortoise (Malacochersus tornieri)
•Land tortoise
Taxonomy:
Class: REPTILIA
Order: Testudinata
Family: Testudinidae
Geographical Distribution
Kenya, Tanzania & Zambia *(2003)

CONSERVATION STATUS
• IUCN Classification: Vulnerable
• CITES Listing: Appendix II
Objectives
Understanding the Factors affecting Conservation and Management of Malacochersus tornieri in Kenya: TheNDF Studies
Data source/references
•Species distribution maps
•Assessments of species abundance in different areas of distribution
•Assessments of threats to the species population
• Trade levels
•Recommended management strategies and practical options for Mitigating threats to the species
METHODOLOGY FOR NDF
Distribution mapping
•Administrative blocks(districts) under Agro-climate Zone V overlapping with Precambrian rock system
(Habitats are a function of interplay of exfoliating granite rocks of Precambrian rock type in Arid and semi-arid climate) and characterized by rock outcrops &kopjes with crevices
•Information from collectors

Lake
District Boundaries Agroecological Zone V Precambrian Rock
LEGEND N
1:5500000SCALE:
GIS WORK BY MO SES M ALOB A
DAT A SORCE : ACT DAT AB ASE 1999
FIG: 1 MAP SHOWING OVERLAPPING DISTRIBUTION OF PRECAMBRIAN ROCKS AND AGROECOLOGICAL ZONE V IN KENYA
Isio loSam bu ru
M eru
Lai ki pi a
Ga riss a
Tan a R iv e r
Ki tu i
Tu rkan a
M arsa bit
W a ji r
Tai ta Ta v eta
Ka ji ad o
N arok
Em bu
M ach akos
M aku en i
4° 4
°
2° 2
°
0° 0
°
2° 2
°
4° 4
°
34°
34°
36°
36°
38°
38°
40°
40°
42°
42°
0
0
200000
200000
400000
400000
600000
600000
800000
800000
-40
00
00
-400
000
-200
000
-200
000
0
0
20
00
00 2
000
00
40
000
0 40
000
0
60
000
0 600
000
Map of Kenya showing overlapping distribution of Precambrian rocks & Agro
ecological Zone V
Extent of Distribution
•From known species’ range (Nguni & Nuu, Mwingi) to unknown
•4 Disjointed field surveys to 10 districts undertaken
•Occurrence or non occurrence confirmed with the following:
Search for Live specimens
Search for feacal materials at entrance of crevices
Interviews with locals
GPS Germin 12 x used to record locality coordinates and altitude
Population estimates
•Counting using systematic search and seize sampling method (Karns 1986) and Hayer et al (1994)
•Strip transects used (varying lengths between 2-20 km and 0.5 width) depending on distribution of patchy microhabitats.
Body measurements- Straight Carapace Length (SCL)
Materials/Equipment
•Global positioning System –GPS Germin 12 x for recording distribution areas and altitude
•2 m long strong and flexible hooked wire for retrieving in humane way specimens from crevices
•Vernier Calipers for measuring SCL along the midline
•1000g spring balance calibrated into 10g intervals for measuring live specimen weight
•Trade data from UNEP-WCMC to determine volumes of trade & trends for the period 1975 to 2001
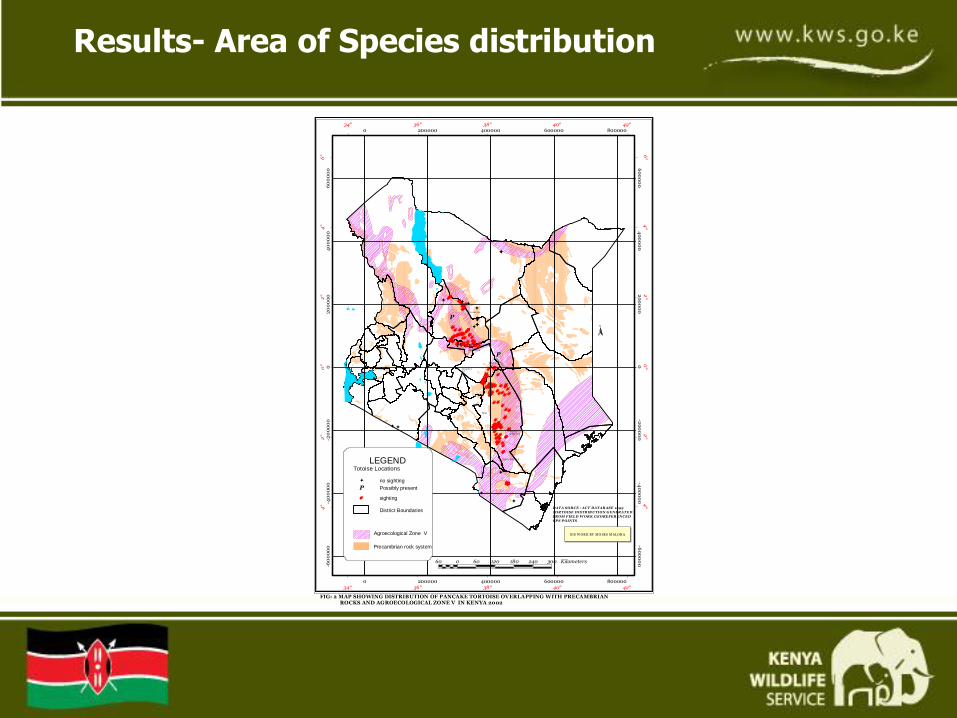
Results- Area of Species distribution
OOOOOOOOOOOOOOOOOOOOOOOOO
OOOOOO
O
OO
O
O
O
O
O
O
OOOOOOO
O
O
OO
O
OO
OOOO
O
OOO
OOO
OOOOOOOOOOOOO
OOOOOO
OOOOOOOOOOOOOOOO OOOOOOOOOOOOOOOOOOO
OOOO
OOO
OOOOOOOO
OO
OOOOOOOOOOOOOOOOOOOO
OOOOOOO
OO
OOOO
OOOOOOOOO
Kitui
SOUTH KITUI N.R
TSAVO EAST N.P
LOSAI N.R
AMBURU N.R
SHABA N.R
BUFFALOSPRINGS N.R
MER U N.P
MT.KENYA N.P
BIS
AN
AD
I N.R
FIG: 2 MAP SHOWING DISTRIBUTION OF PANCAKE TORTOISE OVERLAPPING WITH PRECAMBRIAN ROCKS AND AGROECOLOGICAL ZONE V IN KENYA 2002
N
60 0 60 120 180 240 300 Kilometers
4°
4°
2°
2°
0° 0
°
2° 2
°
4° 4
°
6° 6
°
34°
34°
36°
36°
38°
38°
40°
40°
42°
42°0
0
200000
200000
400000
400000
600000
600000
800000
800000
-60
00
00
-60
00
00
-40
00
00
-40
00
00
-20
00
00
-20
00
00
0
0
20
00
00
20
00
00
40
00
00
40
00
00
60
00
00
60
00
00
Totoise Locations
no sighting
sightingO
District Boundaries
Agroecological Zone V
Precambrian rock system
LEGEND
GIS WORK BY MO SES M ALOB A
DAT A SORCE : ACT DAT AB ASE 1999
TORTOISE DISTRIB UTION GENERAT ED
FROM F IEL D W ORK GEOREFERENCED
GPS POINTS
P
P
P
Possibly presentP

Two disjointedly sub-populations exit in Kenya:
•Northern sub-population ( North of Nyambene Hills, Meru)
•Southern Sub-population (South of Nyambene Hills, Meru)
Species distribution
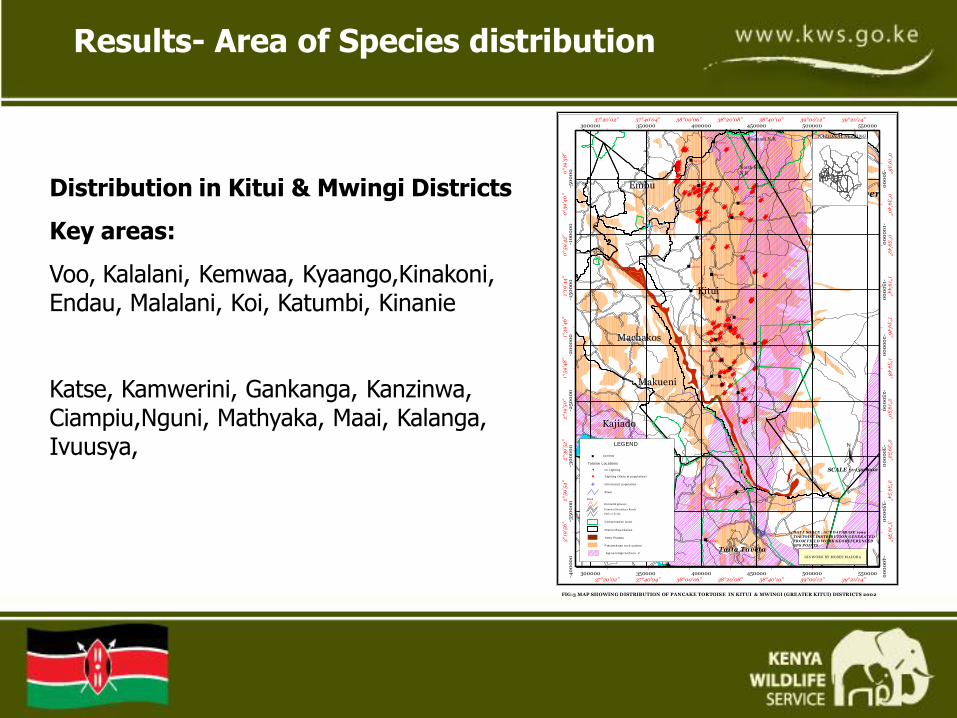
Results- Area of Species distribution
OOOOOO
O
OO
O
OOO
O
OO
O
O
OO
O
O
OOO
O
O O
O
OO
OO
OO
OOOOOOOOO OOOOO
OO OOOOOOO
O OOOOO OOO O
OO
OO
OO
OOOOOOO
OO
OOOOOOOO
OOO
OOOO
%
%
%
%
%
%
%
%
%
%
%
%
%
%
%
%%
%
%
%
%
%
%
%
Tana River
Kitui
Taita Taveta
Kajiado
Embu
Machakos
Makueni
North KituiN.R
Bisanadi N.R
Voo
Zo mbe
W aita
Mu tha
Kaimu
Katse
Usu eni
Simisi
Ngw ate
Mw ingi
Mu tom o
Mu titu
Mu thu e
Kaw elu
Kasala
Iku tha
Tharaka
Ngom eni
Ithu m b a
Chematu
Kathungu
Kaku nike
Maktau
FIG:3 MAP SHOWING DISTRIBUTION OF PANCAKE TORTOISE IN KITUI & MWINGI (GREATER KITUI) DISTRICTS 2002
N
3°1
9'5
6" 3
°19'5
6"
2°5
9'5
4" 2
°59
'54
"
2°3
9'5
2" 2
°39
'52
"
2°1
9'5
0" 2
°19'5
0"
1°5
9'4
8" 1°5
9'4
8"
1°3
9'4
6" 1°3
9'4
6"
1°19
'44
" 1°19'4
4"
0°5
9'4
2" 0
°59
'42
"
0°3
9'4
0" 0
°39
'40
"
0°1
9'3
8" 0
°19'3
8"
37°20'02"
37°20'02"
37°40'04"
37°40'04"
38°00'06"
38°00'06"
38°20'08"
38°20'08"
38°40'10"
38°40'10"
39°00'12"
39°00'12"
39°20'14"
39°20'14"300000
300000
350000
350000
400000
400000
450000
450000
500000
500000
550000
550000-4
00
00
0
-40
00
00
-35
00
00
-35
00
00
-30
00
00
-30
00
00
-25
00
00
-25
00
00
-20
00
00
-20
00
00
-15
00
00
-150
00
0
-10
00
00
-100
00
0
-50
00
0
-50
00
0
Totoise Locations
no s ighting
Sighting (Natural popula tion)O
Introduced populationO
River
Conservation Area
Distr ict Boundaries
Yatta P lateau
Precam br ian roc k s ystem
Agroecological Z one V
LEGEND
Divided H ig hways
Primary/Se cond ary Roads
Path or Trails
Road
% Centres
NATIONAL SETTING
1:1500000SCALE :
DAT A SORCE : ACT DAT AB ASE 1999
TORTOISE DISTRIB UTION GENERAT ED
FROM F IEL D W ORK GEOREFERENCED
GPS POINTS
GIS WORK BY MO SES M ALOB A
Distribution in Kitui & Mwingi Districts
Key areas:
Voo, Kalalani, Kemwaa, Kyaango,Kinakoni, Endau, Malalani, Koi, Katumbi, Kinanie
Katse, Kamwerini, Gankanga, Kanzinwa, Ciampiu,Nguni, Mathyaka, Maai, Kalanga, Ivuusya,

Results- Area of Species distribution
OO
O
OOO OO
O
OOOOO O
OOO
O
O
O
O
OO
OO
OOO
O
OO
OOOOO
OO
OOOOOOOOOOOOO
OOO
OOO
O
OO
OOO
O
%
%
%
%
%
%
%
%
%
%
Samburu
Laikipia
Losai N.R
Marsabit N.R
BuffaloSpring N.R
SamburuN.R
ShabaN.R
Wamba
Kauro
Mukawa
Maralal
Baragoi
Lodosoit
South Horr
Archers Post
Illaut
Ngurunit
N
1:1150000SCALE
P
P
PP
P
P
P
P
P
P
P
P
P P
0°3
0' 0
°30
'
1°0
0' 1°0
0'
1°3
0' 1°3
0'
2°0
0' 2
°00
'
2°3
0' 2
°30
'
36°30'
36°30'
37°00'
37°00'
37°30'
37°30'
38°00'
38°00'200000
200000
250000
250000
300000
300000
350000
350000
50
00
0
50
00
0
100
00
0
100
00
0
150
00
0
150
00
0
20
00
00
20
00
00
25
00
00
25
00
00
30
00
00
30
00
00
FIG: 5 MAP SHOWING DISTRIBUTION OF PANCAKE TORTOISE IN ISIOLO MARSABIT AND SAMBURU DISTRICTS 2002
P
PP
Totoise Locations
no sigh ting
Sigh tin gO
Lake
Con se rvation Are a
Dist rict Bou nd arie s
Preca mb ria n rock system
Ag ro ecolog ica l Zo ne V
LEGEND
PP Po ssibly prese nt
Road
Div ided H igh ways
Path or Trails
Primary/Se condary Roads
% Cen tres
GIS WORK BY MO SES M ALOB A
DAT A SORCE : ACT DAT AB ASE 1999
TORTOISE DISTRIB UTION GENERAT ED
FROM F IEL D W ORK GEOREFERENCED
GPS POINTS
NATIONAL SETTING
Distribution in Isiolo, Marsabit & Samburu districts
Areas:
Wamba, Sware, Archers Post, Namunyak conservancy,
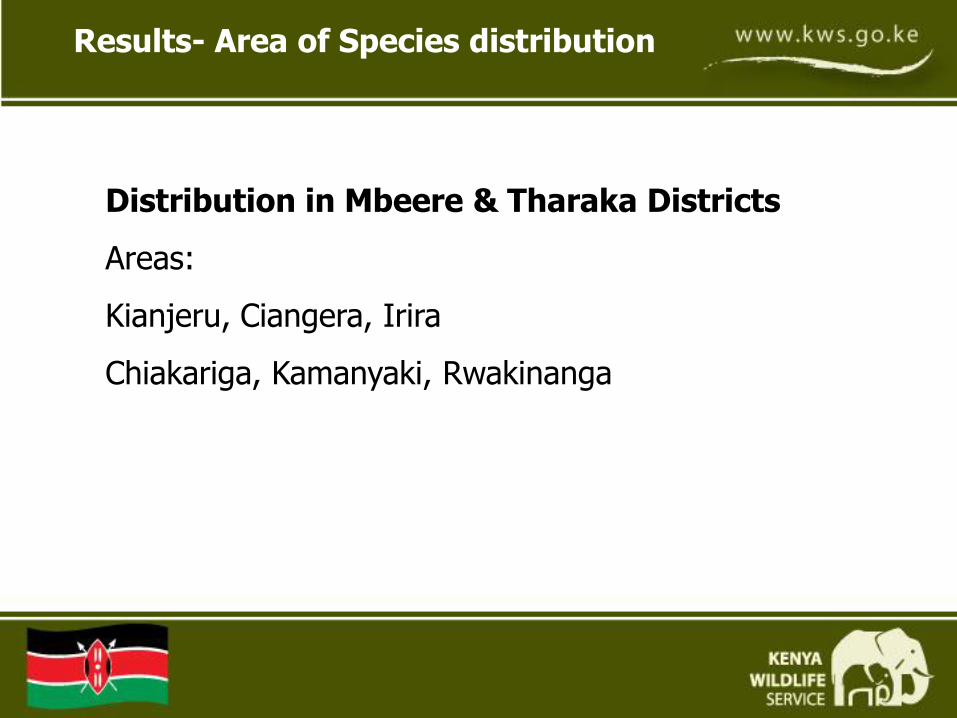
Results- Area of Species distribution
Distribution in Mbeere & Tharaka Districts
Areas:
Kianjeru, Ciangera, Irira
Chiakariga, Kamanyaki, Rwakinanga

Distribution: Protected Area Vs. Non-Protected Area
•Species population in Protected Area is estimated 5% of total population
•95% of total population in the wild is in Non-Protected Areas
District Protected Area & level of protection
Kitui Tsavo East N.P (North of Galana river
South Kitui N.R
Isiolo Buffalo Springs N.R, Shaba N.R
Samburu Samburu N.R
Marsabit Losai N.R
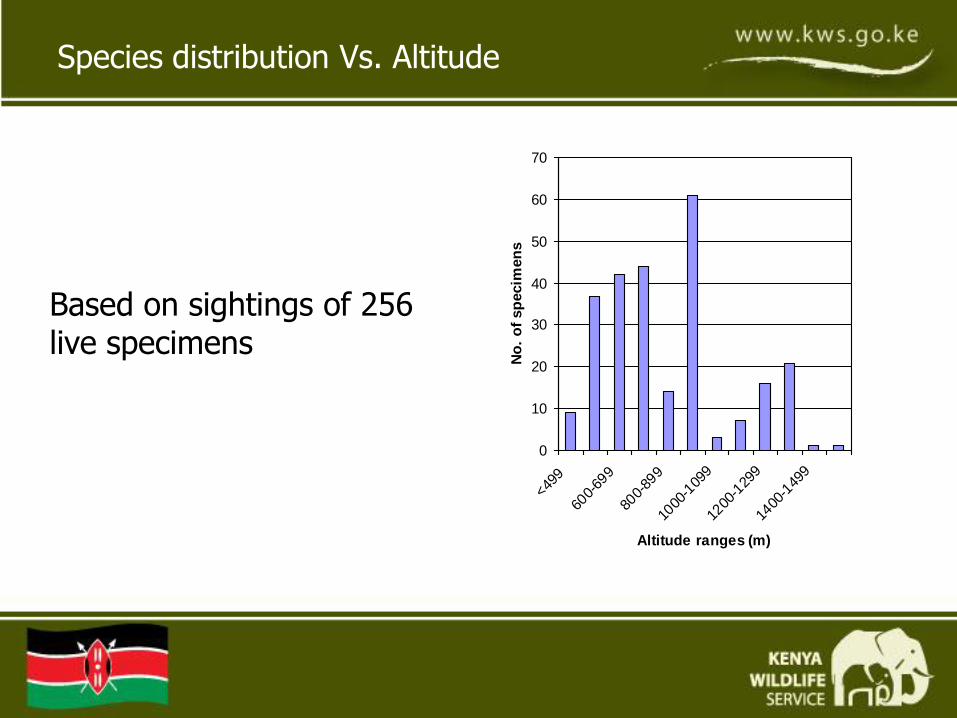
0
10
20
30
40
50
60
70
<499
600-
699
800-
899
1000
-109
9
1200
-129
9
1400
-149
9
Altitude ranges (m)
No
. o
f sp
ecim
en
s
Species distribution Vs. Altitude
Based on sightings of 256 live specimens

Species population Abundance &Density
Species abundance and density is a function of habitat quality.
•Well oriented rock crevices, high vegetation cover over the rock outcrop and less human habitat destruction are indicators of high quality habitat
•7 sites in 4 districts sampled on densities giving the following results

Transect Name & District
Transect area size in KM sq.
No. of specimens counted
Mean Density
Specimens/area
Wamba, Samburu 20 49 2.61
Chiakariga, Tharaka 17.5 32 1.72
Ishiara, Mbeere 7.5 13 1.73
Katse, Mwingi 20 132 6.6
Nguni, Mwingi 15 29 1.2
Endau, Kitui 10.5 27 2.95
Voo, Kitui 27 108 8.86
Species population density variation

There was significant difference (t-test for dependent samples, one tailed; n=8, t=114.06, d.f =7, P=<0.05)
High abundance and density is attributed to high density of rock outcrops and kopjes with suitable crevices.
Low density especially in Nguni is as a result of past collection for commercial purposes.
Analysis on population density

Species body measurements (weight &Length)
Measurement Females (n=130) Males (n=98)
-------------------------------------------------------------------------------------------------
Mean Carapace Length 1SD 141.98 15.35 135.21 29.84
Range 82.65-157.33 105.37-165.05
Mean Body weight 1SD 355.88 93.32 310.16 128.72
Range 262.56-449.20 181.44-438.88
•No significant difference in mean body weight &SCL between sexes
•There is significant positive linear correlation between SCL &Bodyweight (r=0.9196 , df= 226, two tailed n1=228,n2=228,P<0.01)

Habitat characteristics, selection & preference
•Pancake tortoise specimens only found in suitable rock crevices in rock outcrops and kopjes in Arid and semi arid areas dominated by Acacia-Commiphora vegetation
•Granitic outcrops with shelter underneath exfoliating rock slabs provide the best habitats
•Frequency and location of the suitable habitats determine abundance and distribution of the species

Threats to Pancake Tortoise Conservation
Habitat alteration and destruction
•Slash and burn shifting cultivation ( around rock outcrops and kopjes)
•Charcoal burning
•Rock slab and ballast harvesting
Predation
International trade for pet industry
•Illegal trade
Southern sub-population is the most threatened population

International Trade volumes Kenya & Tanzania Exports
(1975-2001)-Legal Trade using CITES Permits
Country of Import No.of specimens reported imported
No. of specimens reported exported
Kenya 3,016 928
United Republic of Tanzania
11,458 6,683

Illegal Trade in Pancake tortoise specimens
Several seizures of shipments reported :
•1992- seizure of specimens of Pancake tortoise illegally traded prompted placement of a moratorium on exports of specimens of the species
•2001- 209 specimens seized in Kampala, Uganda
Specimens repatriated to Kenya & released into Tsavo N.P ( Monitored population)
•2007(August) -36 specimens seized at JKIA coming from TZ . Specimens kept in rescue centre in
Kenya for Education

NDF STUDIES RECOMMENDATIONS
• Trade in wild collected specimens of Pancake tortoise should be prohibited however, captive breeding for commercial purposes should be encouraged as incentives for insitu conservation
• Trade in specimens from captive breeding operations should be limited to a maximum of Straight carapace length of 8 cm
(Decision of the CoP12 in 2002) based on proposal by Kenya following the NDF studies)

Strategies for species Conservation management
•In-situ conservation ( refuge/nature reserves either publicly or privately owned), the case of Voo Reptiles Sanctuary
•Moratorium on trade in wild specimens in force
•Ex-situ conservation (captive breeding operations) e.g Mathemba tortoise farm, Voo Reptiles farm and Nguni Kalanga C Tortoise Farm
•Any sustainable harvesting from the wild for commercial purposes to be based on scientifically determined quotas.

THANK
YOU

NDF WORKSHOP CASE STUDIESWG 7 – Reptiles and Amphibians
CASE STUDY 4
Ptyas mucosusCountry – INDONESIA
Original language – English
CASE STUDY ON PTYAS MUCOSUS – A PROPOSEDNDF METHOD FOR INDONESIA (JAVA)
A U T H O R :TRAFFICThis case study has been prepared by TRAFFIC and is based on a study funded by the CITES Secretariat and
carried out by the IUCN Species Programme - Species Trade and Use Unit and TRAFFIC Southeast Asia.
Information was collected from harvesters and those involved in sale of the species, which supplements informa-
tion from previous studies on the species.
1. BIOLOGICAL DATA
1.1. Scientific and common namesOriental Rat Snake Ptyas mucosus (listed in the CITES Appendices asPtyas mucosus but recent comments by David and Das (2004) highligh-ted the fact that the gender of the genus Ptyas is feminine while thename mucosus is masculine. In accordance with the International Codeof Zoological Nomenclature (ICZN) the species name should be correc-ted to Ptyas mucosa).
1.2. DistributionThe Oriental Rat Snake has an extensive geographical distribution inAsia. From west to east, it occurs in Iran, Turkmenistan, Afghanistan,Pakistan, India (incl. Andaman Isl.), Sri Lanka, Nepal, Bangladesh,Myanmar, China (incl. Hainan and Hong Kong), Thailand, Lao PDR,Cambodia, Viet Nam, Malaysia, Singapore and Indonesia (Mantheyand Grossmann, 1997). See figure 1. All range states exceptTurkmenistan are Parties to CITES.
I. BACKGROUND INFORMATION ON THE TAXA

Figure 1: Geographical distribution of the Oriental Rat Snake.
1.3. Biological characteristics:
1.3.1. General biological and life history characteristics of the speciesThe Oriental Rat Snake is a medium-sized, active, non-venomous, diur-nal snake associated with open habitats including agricultural systems;much of the diet consists of commensal rodents and amphibians. Thespecies has a wide distribution through much of Asia, from Iran toChina and Southeast Asia.
• Medium sized snake, reaching about 2.5 m in length and 5-10 cm ingirth. Males grow longer than females, and have larger heads, lon-ger tails and greater body mass than females of the same length
• Reaches maturity at ~ 9 months ~120 cm for females • Clutch size average 13• May lay 2 clutches per year. • Widespread generalist – thrives in human modified environment • Unknown density and population trends• No major threats known.
WG 7 – CASE STUDY 4– p.2
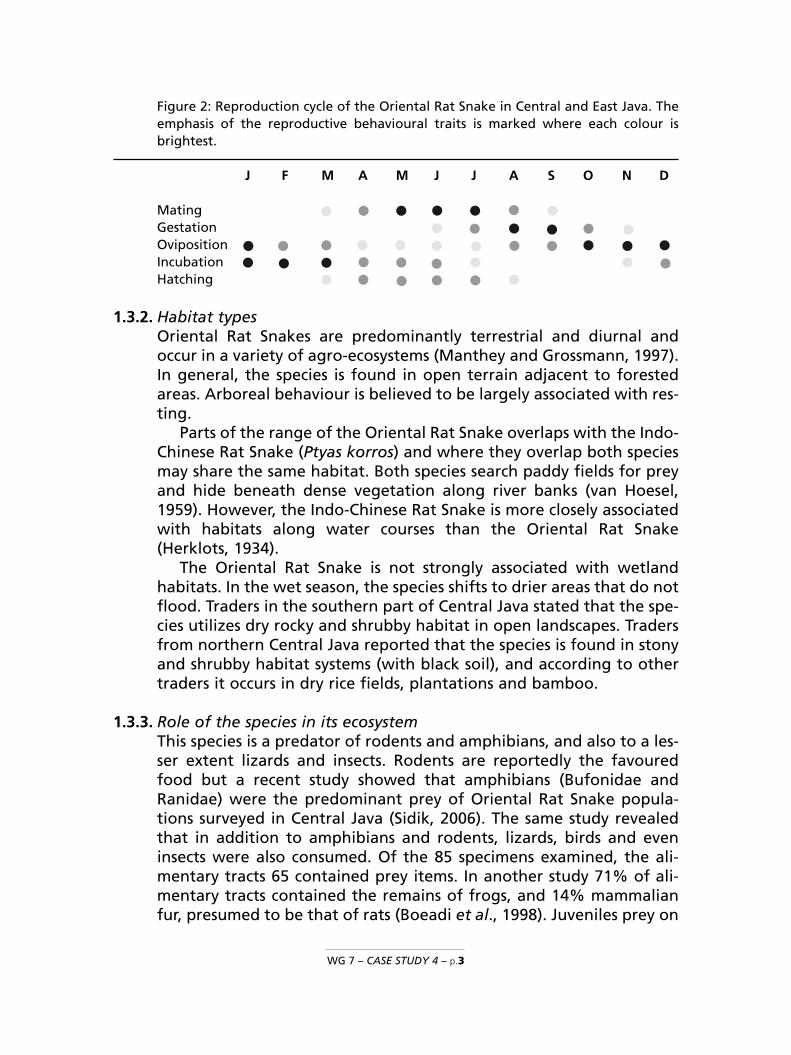
Figure 2: Reproduction cycle of the Oriental Rat Snake in Central and East Java. Theemphasis of the reproductive behavioural traits is marked where each colour isbrightest.
J F M A M J J A S O N D
MatingGestationOvipositionIncubationHatching
1.3.2. Habitat types Oriental Rat Snakes are predominantly terrestrial and diurnal andoccur in a variety of agro-ecosystems (Manthey and Grossmann, 1997).In general, the species is found in open terrain adjacent to forestedareas. Arboreal behaviour is believed to be largely associated with res-ting.
Parts of the range of the Oriental Rat Snake overlaps with the Indo-Chinese Rat Snake (Ptyas korros) and where they overlap both speciesmay share the same habitat. Both species search paddy fields for preyand hide beneath dense vegetation along river banks (van Hoesel,1959). However, the Indo-Chinese Rat Snake is more closely associatedwith habitats along water courses than the Oriental Rat Snake(Herklots, 1934).
The Oriental Rat Snake is not strongly associated with wetlandhabitats. In the wet season, the species shifts to drier areas that do notflood. Traders in the southern part of Central Java stated that the spe-cies utilizes dry rocky and shrubby habitat in open landscapes. Tradersfrom northern Central Java reported that the species is found in stonyand shrubby habitat systems (with black soil), and according to othertraders it occurs in dry rice fields, plantations and bamboo.
1.3.3. Role of the species in its ecosystemThis species is a predator of rodents and amphibians, and also to a les-ser extent lizards and insects. Rodents are reportedly the favouredfood but a recent study showed that amphibians (Bufonidae andRanidae) were the predominant prey of Oriental Rat Snake popula-tions surveyed in Central Java (Sidik, 2006). The same study revealedthat in addition to amphibians and rodents, lizards, birds and eveninsects were also consumed. Of the 85 specimens examined, the ali-mentary tracts 65 contained prey items. In another study 71% of ali-mentary tracts contained the remains of frogs, and 14% mammalianfur, presumed to be that of rats (Boeadi et al., 1998). Juveniles prey on
WG 7 – CASE STUDY 4 – p.3

frogs and smaller reptiles, and shift to mammalian prey as they growlarger (Lim and Lee Tat-Mong, 1989).
1.4. Population:
1.4.1. Global Population sizeNo quantitative population information is available for the speciesglobally. No IUCN Red List assessment has been carried out for this spe-cies.
1.4.2. Current global population trends___increasing __possibly decreasing ____ stable _X__unknown
1.5. Conservation status
1.5.1. Global conservation status (according to IUCN Red List)Not assessed
1.5.2. National conservation status for the case study countryLittle is known about the population status of the species in Java orother Indonesian islands. No quantitative data on the change inOriental Rat Snake populations in Java appear to be available, nor anyevidence of population increase during the period of the trade sus-pension recommended by the CITES Standing Committee between1993 and 2005 (see Section 2.1.1), possibly in part because significantcollection for illegal export continued.
According to CITES SC53 Inf Doc. 3, Sustainability of Rat Snake(Ptyas mucosus) Harvests in Indonesia: A Discussion of Issues, submit-ted to the CITES Standing Committee by the CITES ManagementAuthority of Indonesia for review to consider the lifting of the tradesuspension, harvesting has largely been restricted to Java, and therewas no evidence to suggest that its abundance has been reduced sig-nificantly, with snakes still being readily caught by villagers.
However differing opinions were expressed during this study; sometraders considered that the species is now less common than in therecent past, whereas others claimed that the Oriental Rat Snake is justas common now as in previous years. One trader said he had been una-ble to purchase any Oriental Rat Snakes since the beginning of 2007,as none was available in the market due to a decline of the species inthe wild. One trader in southern central Java, who has been an activesnake trader for around 30 years, stated that he could previously buy300 specimens/day in the main harvesting area, but presently onlybuys about 25 specimens/day from within a 10km radius; he attributes
WG 7 – CASE STUDY 4– p.4
this decline to the increase of snake harvesters in the region.According to eight small-scale harvesters and collectors, who havebeen active between seven and 35 years, the local abundance ofOriental Rat Snakes, particularly in Central Java, has decreased notice-ably. In contrast, five collectors reported that the species is still com-mon in “in the wild” owing to a good market price, remarking that“when the price is good, there are many snakes”.
1.5.3. Main threats within the case study country_X_No Threats___Habitat Loss/Degradation (human induced) ___Invasive alien species (directly affecting the species) _X_Harvesting [hunting/gathering] ___Accidental mortality (e.g. Bycatch)___Persecution (e.g. Pest control)___Pollution (affecting habitat and/or species) ___Other________________X_Unknown
2. SPECIES MANAGEMENT WITHIN THE COUNTRY FOR WHICH CASESTUDY IS BEING PRESENTED.(Indonesia, specifically Java)
2.1. Management measures
2.1.1. Management history • Commercial harvesting of P. mucosus began in the late 1970s.• Ptyas mucosus was listed in Appendix III of CITES by India in 1984.• In 1986, Indonesia banned the export of raw P. mucosus skins, in
favour of tanned skins• In January 1990, P. mucosus was listed in Appendix II of CITES.• Annual exports of P. mucosus from Indonesia declined from around
1.8 million skins in 1986, to around 581,000 in 1989.• In March 1992, the CITES “Review of Significant Trade” reported that
the collection for trade was the major suspected cause of decline insome populations of P. mucosus (globally), although given the lack ofcomprehensive data, particularly from Indonesia, there was no wayof ascertaining if current levels of trade were having a substantialimpact (WCMC and IUCN/SSC Trade Specialist Group,1992). TheIndonesian CITES Management Authority was requested by the CITESAnimals Committee to advise the Secretariat of the scientific basis forits harvest quotas and should introduce a system to ensure that thenumber of skins permitted for export does not exceed those quotas.
WG 7 – CASE STUDY 4 – p.5

• In November 1992, the Indonesian CITES Management Authoritywas advised by the CITES Secretariat that the information receivedwas not sufficient, and additional information was requested
• In July 1993, the Indonesian CITES Management Authority indicatedthat quotas were based on previous trade data, and that increasingamounts of habitat were being made available to P. mucosusthrough regional development. However, this was not considered bythe CITES Secretariat to be a scientific basis for the quotas.
• In August 1993 this latter view was supported by the Chairman of theCITES Animals Committee, who also pointed out that import statisticsfor P. mucosus from Indonesia exceeded exports reported by Indonesia.
• In November 1993, the CITES Standing Committee recommended toall Parties that they suspend imports of P. mucosus from Indonesiauntil the relevant recommendations of the CITES AnimalsCommittee had been implemented (CITES Notification 775).
• The suspension of imports from Indonesia was withdrawn at SC53(2005) after the Secretariat and Standing Committee were satisfiedwith the control measures proposed by the CITES ManagementAuthority in SC53 Inf3.
2.1.2. Purpose of the management plan in placeNo formal management plan is in place other than setting of exportquotas and imposing a ceiling on exploitation.
2.1.3. General elements of the management planNo formal management plan is in place other than setting of exportquotas. Quotas are allocated between West Central and East Java (seeTable 1).
2.1.4. Restoration or alleviation measuresNone reported in detail; the Indonesian CITES Management Authorityindicated in 1993 that increasing amounts of habitat were being madeavailable to P. mucosus through regional development.
2.2. Monitoring system
2.2.1. Methods used to monitor harvestNumbers of specimens exported.
2.2.2. Confidence in the use of monitoringLittle confidence in export permits issued as a measure of total harvestpressure as any illegal trade is not captured. The extent of illegal tradeis not known.
WG 7 – CASE STUDY 4– p.6
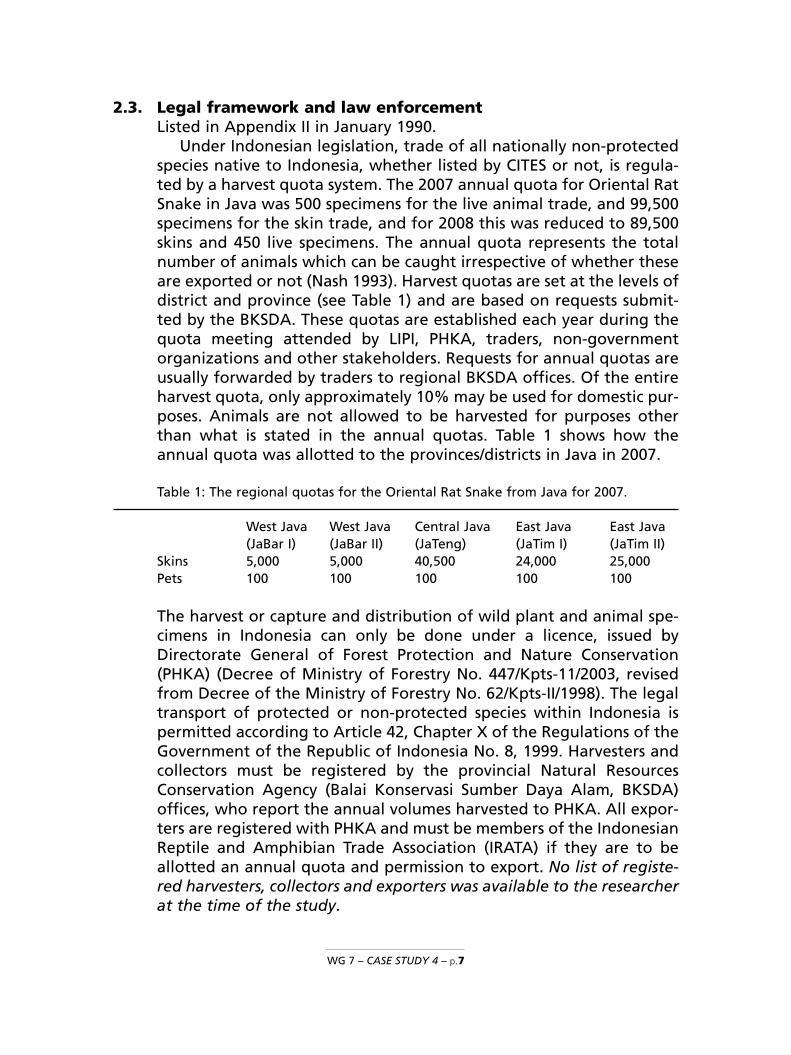
2.3. Legal framework and law enforcementListed in Appendix II in January 1990.
Under Indonesian legislation, trade of all nationally non-protectedspecies native to Indonesia, whether listed by CITES or not, is regula-ted by a harvest quota system. The 2007 annual quota for Oriental RatSnake in Java was 500 specimens for the live animal trade, and 99,500specimens for the skin trade, and for 2008 this was reduced to 89,500skins and 450 live specimens. The annual quota represents the totalnumber of animals which can be caught irrespective of whether theseare exported or not (Nash 1993). Harvest quotas are set at the levels ofdistrict and province (see Table 1) and are based on requests submit-ted by the BKSDA. These quotas are established each year during thequota meeting attended by LIPI, PHKA, traders, non-governmentorganizations and other stakeholders. Requests for annual quotas areusually forwarded by traders to regional BKSDA offices. Of the entireharvest quota, only approximately 10% may be used for domestic pur-poses. Animals are not allowed to be harvested for purposes otherthan what is stated in the annual quotas. Table 1 shows how theannual quota was allotted to the provinces/districts in Java in 2007.
Table 1: The regional quotas for the Oriental Rat Snake from Java for 2007.
West Java West Java Central Java East Java East Java(JaBar I) (JaBar II) (JaTeng) (JaTim I) (JaTim II)
Skins 5,000 5,000 40,500 24,000 25,000Pets 100 100 100 100 100
The harvest or capture and distribution of wild plant and animal spe-cimens in Indonesia can only be done under a licence, issued byDirectorate General of Forest Protection and Nature Conservation(PHKA) (Decree of Ministry of Forestry No. 447/Kpts-11/2003, revisedfrom Decree of the Ministry of Forestry No. 62/Kpts-II/1998). The legaltransport of protected or non-protected species within Indonesia ispermitted according to Article 42, Chapter X of the Regulations of theGovernment of the Republic of Indonesia No. 8, 1999. Harvesters andcollectors must be registered by the provincial Natural ResourcesConservation Agency (Balai Konservasi Sumber Daya Alam, BKSDA)offices, who report the annual volumes harvested to PHKA. All expor-ters are registered with PHKA and must be members of the IndonesianReptile and Amphibian Trade Association (IRATA) if they are to beallotted an annual quota and permission to export. No list of registe-red harvesters, collectors and exporters was available to the researcherat the time of the study.
WG 7 – CASE STUDY 4 – p.7

Although appropriate national legislation to control the trade inIndonesian wildlife is in place, it appears that this legislation is notbeing effectively enforced. There was a lack of knowledge of quotasat the harvester and trader level, suggesting that setting of quotas haslittle influence on the quantity of specimens harvested.
3. UTILIZATION AND TRADE FOR RANGE STATE FOR WHICH CASE STUDYIS BEING PRESENTED
3.1. Type of use (origin) and destinations (purposes) Wild harvest for legal trade in skins and illegal meat and gall bladdertrade, which may be partially a by-product of the skin trade. The mainmarkets for skins are Europe, Singapore Hong Kong and Taiwan PoC.Singapore is also a re-exporter of skins and processed skins e.g. leatherproducts, handbags, wallets, pairs of shoes etc to various destinations.China is believed to be the main market for snake meat (Saputra,2008).
3.2. Harvest:
3.2.1. Harvesting regime All specimens in trade from Indonesia are wild-caught. Snakes areeither captured by experienced harvesters or opportunistically by sea-sonal rice farmers. Snake capture is secondary to farming activities andappears to be carried out in an ad hoc manner. Probably in no casedoes harvest of this species provide full time annual employment. Invery rare cases, Oriental Rat Snakes are killed for local consumption, orsimply out of fear.
Skins are to be exported allowed under quotas as are a smallamount of live specimens for the pet trade, although there seems tobe little demand for the latter and the quota has generally not beenmet. Currently there is no export quota for dead specimens or meat,but it appears that there has been substantial demand for and illegalexport of meat, which started during the ban on skin export and appa-rently continues (Saputra, 2007/8).
Adult snakes are harvested for their skins. One trader said that sma-ller specimens are traded as the non-CITES listed lookalike speciesPtyas korros (Saputra, 2008).
REPORTED HARVEST SEASONS
The Oriental Rat Snake is most commonly encountered during the wetseason and capture rates are highest during this period. According toseveral traders, activity levels increase with the onset of the wet sea-
WG 7 – CASE STUDY 4– p.8
son (the first heavy rains after the dry season). In East Java the wet sea-son typically occurs between December and April, and in Central Javabetween October and December and February to April, depending onthe geographical location. Other traders also reported that the speciesis common in the field in the transition from the wet to the dry season(May and June). Higher activity levels in snakes were reported eitherwhen rainy days change to bright days or on cloudy days after severalbright and hot days. Traders said that during the dry season (May toAugust) the species is extremely scarce, and another collector estima-ted that the capture of the Oriental Rat Snake decreases by 50-60% inthe dry season. During the dry season the people work in the rice fieldsso that less manpower is available to capture snakes during the riceharvest, and so the study species is less common in trade during the dryseason. Farmers harvest out of the crop growing season – mainlyNovember to January. The number of snakes caught by dedicated har-vesters vs farmers is not known.
3.2.2. Harvest management/ control (quotas, seasons, permits, etc.)See section 2.3 above for quota information.
All harvesters and collectors must be registered by the regionalBKSDA offices and require a license issued by PHKA. However, thestudy shows that most harvesters collect rat snakes and other reptilesas a side business and hence do not possess a license. One major tra-der who illegally exports frozen meat of Oriental Rat Snakes statedthat LIPI gives a low quota for many species even though Indonesia hasso many species; such statements indicates lack of understanding ofthe potential impact of trade and of the need to manage use andtrade to ensure sustainability.
3.3. Legal and illegal trade levels Commercial harvesting of P. mucosus began in the late 1970s.
Reported legal trade according to the CITES trade database is sum-marised in figure 2. Most trade from Indonesia has been in skins.According to Indonesian regulations skins must be tanned beforeexport.
WG 7 – CASE STUDY 4 – p.9

Figure 2: CITES reported imports and exports of Ptyas mucosus skins from Indonesia(1989 – 2007). Leather products and small numbers of live individuals have beenomitted from this graph. Reports for 2007 were not complete at the time this graphwas produced.
ILLEGAL TRADESoutheast Asian snake species are commonly found in Chinese foodmarkets, and the cross-border trade of wildlife in general is currentlyon a dramatic scale (Lee et al., 2004). During winter the level of snakemeat consumption in China increases as many consumers believe it tohave a warming effect. The demand in China for snake meat exceedslocal supply during the cold season, and so additional sources of sna-kes, including Oriental Rat Snakes are required. Indonesia is one of themajor sources supplying the demand from China for Oriental RatSnakes and other species (Saputra, 2008).
According to Saputra (2008), the 12 year suspension of trade inskins from Indonesian populations of the Oriental Rat Snake triggeredthe illegal export of meat with some other traders claiming thatduring this time skins were stockpiled. He estimated that 50,000 to100,000 snakes were exported annually, the equivalent of 30 to 60tons or tonnes of meat per year and about 50,000 to 100,000 gall blad-ders. According to traders interviewed, illegal export of meat and gall
WG 7 – CASE STUDY 4– p.10
0
100000
200000
300000
400000
500000
600000
700000
1989
1991
1993
1995
1997
1999
2001
2003
2005
2007
Ye ar
Num
ber
ofsk
ins
repo
rted
Reported exports
Reported imports

bladders has continued since the ban on skin and live specimens waslifted. It is believed that those involved in the meat trade may declaresmaller specimens of the Oriental Rat Snake as the Indo-Chinese RatSnake, a species not listed under CITES (Saputra, 2008); the frozen, coi-led-up, skinned or whole specimens cannot be easily identified by thelocal authorities. As it is reported that some export of snakes is ofwhole (un-skinned specimens), the estimated annual volume of theseillegal exports suggests that this is not solely a spin-off from the skintrade, but is a distinct branch of trade, which could have a significantimpact on wild populations. Saputra (2007) stated that whole frozensnakes are sometimes declared as frozen fish.
1. IS THE METHODOLOGY USED BASED ON THE IUCN CHECKLIST FORNDFs?
__yes ___no
During the study the elements of the IUCN checklist were consideredand a risk assessment carried out using the list. These elements and therelative importance of these in making a non-detriment finding havebeen considered further in the proposed method.
2. CRITERIA, PARAMETERS AND/OR INDICATORS USEDSpecies biology & ecology (Species resilience)
• Medium sized snake• Reaches maturity at ~ 9 months ~120 cm for females • Clutch size average 13• May lay 2 clutches per year. • No correlation between body size and clutch size and frequency has
been found.• Widespread – probably most common in Central and East Java, areas
with lower rainfall. • Generalist – thrives in human modified environment • Unknown density and population trends; further data is required. • No major additional threats known.
Current conclusion: It is likely that due to its biology and ecology thatthe species has a fairly high resilience to harvesting.
WG 7 – CASE STUDY 4 – p.11
II. NON-DETRIMENT FINDING PROCEDURE (NDFS)

MANAGING HARVEST
Ability to set correct quotas and adaptively manage harvest• No quantitative data are available for domestic demand therefore
the total offtake is unknown, although domestic demand is believedto be low. Quotas currently allow for 10% of quota as domestic use.
• Export quotas could be set for all products in demand based on theharvest quota for number of specimens. It appears that the speciesis not in demand for the pet trade, therefore a live trade quota isnot necessary.
• Size restrictions to ensure specimens have reached maturity andreproduced could be set for export (eg minimum 140 cm total snakelength). Snake skins are stretched when drying and would not be areliable measure of snake length or maturity.
• Seasonal restrictions are not appropriate as there may be two bree-ding seasons and harvest takes place around agricultural activities.
• Due to lack of reliable population estimates it is essential that anyharvest or export quota systems is adaptively managed based onmonitoring of the species and harvest.
Conditions of harvest and ability to change these• Widespread harvest in natural and agricultural habitat, • Some harvesting is done by dedicated harvesters and some harves-
ting is done by farmers• Farmers harvest out of crop growing season – mainly November to
January. Snake capture is secondary to farming activities and appe-ars to be carried out in an ad hoc manner.
• Dedicated snake harvesters mainly harvest the Oriental Rat Snakeduring the wet season when snakes are most commonly encounte-red.
• Cost of harvesting – low but may be increasing as there is some evi-dence catch per unit effort (CPUE) is decreasing. Very low for ad hocharvesting by farm workers
• Species is effectively an open-access resource.• Little is known on the areas subject to harvest and intensity of har-
vest in different areas. Intensity of collection in different areasshould be mapped and monitored to show shifting patterns in har-vesting, which could indicate localised depletion.
Capacity to control harvest/ trade• Widespread harvesting in natural habitat and farmland makes it
almost impossible to enforce harvesting restrictions; establishing aharvest permit system (see SC53 Inf3) would be unlikely to be effec-tive.
WG 7 – CASE STUDY 4– p.12
• Not all products in demand are legally exported and there seems tobe no effective control measure in place to combat this. There areallegations that illegal meat trade was substantial during the tradeban on skins. This is believed to have continued and currently levelsof illegal international trade in meat are thought to be high.Enforcement is hampered by inability to easily distinguish meat ofsmall P. mucosus from P. korros. Results of this study suggest thatillegal trade may result in some additional harvest of the snakesrather that as a by-product of the skin trade. Some meat may bebeing traded as P. korros, which is not controlled under CITES. It ispossible, although difficult, to differentiate between skins of thetwo species. Shipments of P. korros are of skinned, semi-skinned orwhole specimens, usually frozen. The appearance of a skinned P.mucosus would be difficult to distinguish from a skinned P. korros.Increased enforcement is needed to reduce illegal trade.
• It appears that harvest quotas are currently not communicatedthrough the trade chain so a reduction in export quota is unlikely toresult in a reduction in harvesting. There is no evidence that there isimplementation of a system of harvest permits issued by the Headof BKSDA and this is unlikely to be implementable given many ofthe harvesters are farmers.
Current conclusion: Currently insufficient data is available on distribu-tion, population and harvest areas to be sure that a quota is set at anon-detrimental level; quotas should be set and adaptively managedbased on field and harvest monitoring. Currently there is little kno-wledge about quotas at harvester and small scale collector level sho-wing poor communication. Setting export or harvest quotas is unlikelyto reduce harvest given the low cost and ad hoc nature of some har-vesting (farmers) and apparent illegal trade. Without baseline andongoing field monitoring data it would be extremely difficult to deter-mine whether harvest is non-detrimental. However, such data wouldbe time consuming and expensive to collect given the widespreadnature of the species and differences in activity through the year.Domestic and illegal trade levels are currently unknown. If quotaswere enforceable suggest revising (export quota was reduced by10,000 for year 2008) until baseline monitoring has taken place.
MONITORING IMPACT
Species monitoring• Ongoing field studies should be established in a sample of harvested
and unharvested populations to monitor density changes throughsurveys for catch per unit effort (CPUE), sex ratio, size. To date there
WG 7 – CASE STUDY 4 – p.13

are no reliable baselines from which to monitor change as data todate are from harvested specimens rather than field surveys: — Density estimates – monitoring snake species through trapping
or catching – may not give accurate measures, however ongoingmonitoring should identify changes. Continuing decline in den-sity would indicate detrimental harvest and lack of recruitment.
— Catch per unit effort (CPUE) estimates from Sugardjito et al.(1998) are for harvesters and there is no indication as to whetherthis represents all snakes encountered or only harvested snakes,which may have been a sub-set of the former if specimens weretaken selectively. Decreasing CPUE would indicate harvest islikely to be detrimental.
— Size estimates from Sugardjito et al. (1998), Boeadi (2007) andthis study are from different times of the year. Declining avera-ge size in the wild could be one possible indication of unsustai-nable harvest. Particular attention should be paid to proportionof individuals above the size of maturity and to identify pro-blems with recruitment.
— Sex ratio changes at sites from a baseline and for times of year(so far according to Kopstein (1938) hatching ratio (m: f) = 1: 1.7but capture ratio 1:1.4 which may be a result of differences in sexsurvival naturally or preference for capture of (larger) males.Further information on natural sex ratio and reproductive suc-cess/ recruitment under altered conditions of altered sex ratiowould be beneficial in adaptively managing the harvest.
HARVEST MONITORING
• Harvest monitoring - a year’s baseline should be established fromwhich to monitor change for each of the following measures ensu-ring regular and standard monitoring systems are in place:— Catch per unit effort for harvesters (difficult for casual harvesters
e.g. farmers). Continuing decline would indicate that the popu-lation was reducing.
— Sex ratio changes (so far according to Kopstein (1938) hatchingratio = 1: 1.7 in captivity but wild captures 1:1.4, Sugurdjito et al.(1998) found sex ratio of harvested specimens 1: 0.6, which mayreflect harvesters preferentially harvesting males, which are onaverage larger). An increase in female to male ratio might indi-cate a reduction in average male size and reduction in differen-tiation between size of females and males. However, cautionshould be taken when comparing sex ratios for different timesof year as it is likely that there are differences in activity levelsfor each sex through the year.
WG 7 – CASE STUDY 4– p.14

— Size differences should be compared by sex against monthly ave-rages. Ptyas mucosus growth is rapid
— Size should be well above size of mature females i.e. above120cm (the size at which females first reproduce according to tra-ders interviewed). As a precaution a minimum total length couldbe set at 140 cm (although according to Kopstein (1938) thiswould still represent immature specimens). Ongoing reductionin size of harvested specimens would indicate that the popula-tion was reducing.
— Harvesting area and pressure should be mapped in order tomonitor shifting patterns in exploitation which could indicatelocalise depletion.
Current conclusion: According to this study the average size for bothmale and female (ratio unknown) = 189.51 cm (n= 60) and thereforelikely to be above the age of maturity according to trader’s knowled-ge and Kopstein’s estimations. If this measure was based on a muchlarger sample of harvested specimens from a representative sample oftraders (including illegal traders) it could be concluded that offtakecurrently allows individuals to grow to maturity and to reproducebefore harvest takes place. However given that legal export is in theorder of a hundred thousand specimens and there is thought to beconsiderable illegal harvest and export a much larger sample would benecessary to determine non-detriment with any confidence. A muchmore representative sample along with additional information onCPUE would be necessary to make this finding with any confidence.Although sampling would not monitor the illegally traded specimens,sampling of size and CPUE (including harvesting area changes) shoulddemonstrate declining population if this is the case.
3. MAIN SOURCES OF DATA, INCLUDING FIELD EVALUATIONOR SAMPLING METHODOLOGIES AND ANALYSIS USEDField monitoring and harvest monitoring would be essential formaking a non-detriment finding and for adaptive management ofharvest of the species. See Section 2 for data to be collected throughspecies and harvest monitoring.
4. EVALUATION OF DATA QUANTITY AND QUALITY FOR THE ASSESSMENTCurrently there is insufficient data or data collection to set robust quo-tas, monitor harvest or impact of harvest on the wild population.Because of the apparently large illegal trade in the species, monitoringlegal harvest and use of proxy indicators such as changes in averagesize of harvested specimens might mask any unsustainable harvesting
WG 7 – CASE STUDY 4 – p.15

practices by illegal traders, although average size in conjunction withCPUE would give a better indication of sustainability of harvesting.
Data necessary to make a robust non-detriment finding would betime consuming and expensive but there is potential to involveIndonesian higher degree students working in collaboration withoverseas students on long-term studies of biology and population.
Given the difficulties in setting and enforcing quotas, managementneeds to be adaptive and the impact of harvest through monitoringfield populations, harvesting patterns and harvested individualsshould guide future management and quota setting.
5. MAIN PROBLEMS, CHALLENGES OR DIFFICULTIES FOUNDON THE ELABORATION OF NDFThe lack of data available on the species and current/ past populationmake it difficult to assess impact of harvest in the past and to assessimpact in the future. Harvest areas are poorly known.
The above proposed method of making a non-detriment findingfor Ptyas mucosus has focused on Java, the main, or possibly only,exporting island of Indonesia. It is likely, although surveys would benecessary to confirm this, that the species occurs on other islands. Ineffect therefore a large proportion of the species’ range in Indonesiais not subject to harvest, although these areas cannot without humanintervention act as a source if Java were to be acting as a sink.
6. RECOMMENDATIONS• Studies of the species’ biology should be carried out throughout the
year. Further investigation of reproductive size and reproductive sta-tus of harvested specimens would help in confirming the age ofmaturity to ensure that any minimum catch size is appropriate.
• Meat and gall bladder quotas could be set to the equivalent (or lessfor precaution) of the number of skins allowed for harvest with noadditional capture. This may also increase the value to the harvester.Alternatively harvest quota for specimens could be set with no sti-pulations on export products.
• Increased enforcement is needed to reduce illegal trade.• Field and harvest monitoring should be established including map-
ping of harvest pressure. IRATA has suggested that obtaining soundbiological and monitoring data may be enabled through interna-tional cooperation, possibly with Indonesian higher degree stu-dents working in collaboration with overseas students on long-term studies.
• Consider; listing P. korros as a lookalike species to aid the control ofthe meat trade, legalising the meat trade, and trade in gall bladders
WG 7 – CASE STUDY 4– p.16

as a by-products of the skin trade. Quotas equivalent of lower thanthe skin trade could be set. Minimum size (length for skins andweight for meat) could be set, if there was capacity to enforce these.
CONCLUSIONS
The Indonesia Management Authority (in SC53 Inf 3) proposed a tho-rough method to assess harvesting and adaptively manage exportquotas and harvesting in order to ensure that Ptyas mucosus export isnot detrimental to the species on Java. In reality the harvesting andtrade chain may not be conducive to the approach of export/ tradequota setting to control the harvest; the present system for allocationof quotas does not seem to be resulting in any harvest control with lit-tle knowledge of quotas at the field level. It seems that enforcementof harvest quotas and prevention of illegal trade is currently not wor-king and may be very difficult to manage. However, the species is likelyto be fairly resilient and therefore despite high levels of illegal tradeit is feasible that the current level of harvesting is not detrimental tothe species, although only further research can confirm whethercurrent exploitation levels are sustainable or not. From the limited sur-vey of snake length it would seem that snakes are harvested at sizeswell after females mature. However this could be a result of harvesterstravelling further to collect larger sized snakes having over-harvestedin areas more easily accessible; this could be ascertained through abetter understanding of collection pressure, the spatial location ofcollection areas, and the timing of collection. Monitoring of changesin these is necessary in conjunction with monitoring of harvested spe-cimens.
This study has shown that monitoring (field and harvest) would becrucial in adaptively managing the species’ harvest and in allowing adetermination that harvest was not detrimental. Much informationhas come from collectors and traders and a strong collaboration withthem should help facilitate monitoring as could collaboration withuniversities.
The above proposed method of making a non-detriment findingfor Ptyas mucosus has focused on Java, the main, or possibly only,exporting island of Indonesia. The species occurs on other Indonesianislands, including Sumatra and Sulawesi. However, as the harvestquota is established and split between regions of Java, in effect a largeproportion of the species’ range in Indonesia presumably not subjectto harvest, although these areas cannot, without human intervention,act as a source if Java were to be acting as a sink.
WG 7 – CASE STUDY 4 – p.17
REFERENCESSAPUTRA G. (2007 and 2008) Chair IRATA in litt. to Mark Auliya, TRAFFIC Southeast Asia,
Malaysia. BOEADI, Shine, R. Sugardjito, J., Amir, M., & Sinaga, M.H. (1998): Biology of the
Commercially-Harvested Rat Snake (Ptyas mucosus) and Cobra (Naja sputatrix) in CentralJava. – Mertensiella 9: 99-104.
BOEADI (2007) in litt. to Mark Auliya, TRAFFIC Southeast Asia, Malaysia. DAVID, P. and Das I. (2004): On the grammar of the gender of Ptyas Fitzinger, 1843
(Serpentes: Colubridae). – Hamadryad 28: 113-116. HERKLOTS, G.A.C. (1934): Land snakes of Hong Kong. PART II. - The Hong Kong Naturalist,
pp. 23-30. KOPSTEIN, F. (1938): Ein Beitrag zur Eierkunde und zur Fortpflanzung der Malaiischen
Reptilien. – Raffles Bull. Mus. 14: 81-167.LEE, K.S., Lau, M.W.N. & Chan B.P.L. (2004): Wild Animal Trade Monitoring In Selected
Markets in Guangzhou and Shenzhen, South China 2000-2003. - AJL Design Ltd., HongKong.
LIM, F.L.K. & Lee Tat-Mong, M. (1989). Fascinating Snakes of Southeast Asia – AnIntroduction. – Tropical Press, Kuala Lumpur, 124 pp.
MANTHEY, U. and Grossmann W. (1997). Amphibien und Reptilien Südostasiens. – Naturund Tier Verlag, Münster, 512 pp.
SIDIK, I. (2006) Analisis Isi Perut Dan Ukuran Tubuh Ular Jali (Ptyas mucosus). Zoo Indonesia.Jurnal Fauna Tropika. Vol.15(2):121-127.
SUGARDJITO, J., Boeadi, Amir M. & Sinaga M. H. (1998): Assessment of Harvest Levels andStatus of the Spitting Cobra (Naja sputatrix) and the Rat Snake (Ptyas mucosus) inCentral Java. – Mertensiella 9: 105-110.
VAN HOESEL, J.K.P. (1959): Ophidia Javanica. – Museum Zoologicum Bogoriense,Pertjetakan Archipel, Bogor, 188 pp.
WCMC and IUCN/SSC Trade Specialist Group (1992) Review of significant trade in animalspecies included in CITES Appendix II: Detailed reviews of 24 priority species.
WG 7 – CASE STUDY 4– p.18

TRAFFIC is a joint programme of and
Ptyas mucosus – a proposed NDF method for Indonesia (Java)
Prepared by
TRAFFIC
Presented by
Thomasina Oldfield
TRAFFIC is a joint programme of and
Acknowledgements
This case study is based on a study funded by
the CITES Secretariat.
Study carried out by TRAFFIC Southeast Asia
with the IUCN Species Programme.
Data from trader interviews and from samples of
harvested specimens supplements literature on
this species.
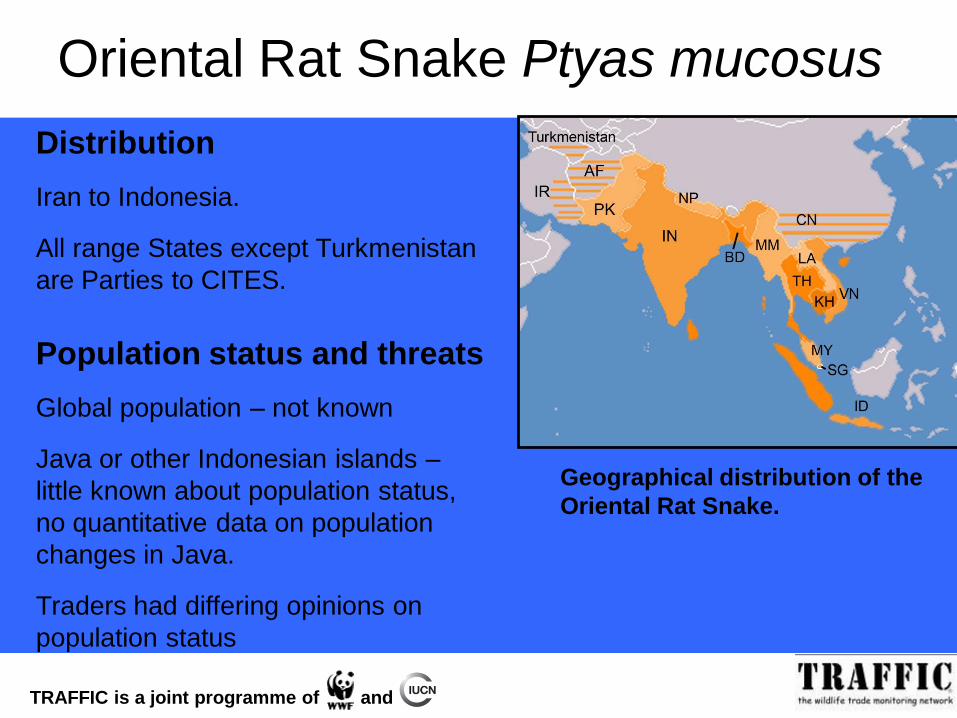
TRAFFIC is a joint programme of and
Oriental Rat Snake Ptyas mucosus
Geographical distribution of the
Oriental Rat Snake.
Distribution
Iran to Indonesia.
All range States except Turkmenistan
are Parties to CITES.
Population status and threats
Global population – not known
Java or other Indonesian islands –
little known about population status,
no quantitative data on population
changes in Java.
Traders had differing opinions on
population status

TRAFFIC is a joint programme of and
Management history
• Commercial harvesting of P. mucosus began in the late 1970s.
• Listed in Appendix III by India in 1984.
• 1986, Indonesia banned the export of raw P. mucosus skins
• Exports declined from ~ 1.9 m skins in 1986 to ~ 600,000 in 1989.
• 1990, P. mucosus was listed in Appendix II of CITES.
• 1992, CITES RST - lack of data to ascertain impact of trade. Indonesian MA requested to advise on the scientific basis for harvest quotas and introduce a system to ensure quotas are not exceeded.
• July 1993, the MA indicated that quotas were based on previous trade data and increasing amounts of habitat available through regional development. Not considered to be a scientific basis for the quotas.
• In August 1993 AC Chairman also noted import statistics for P. mucosus from Indonesia exceeded exports reported by Indonesia.
• November 1993 Standing Committee recommended import suspension until AC recommendations had been implemented.
• 2005 – SC withdrew import suspension recommendation. Secretariat and SC satisfied with the control measures proposed by the CITES MA.

TRAFFIC is a joint programme of and
UTILIZATION AND TRADEIndonesian harvest and export from Java only.
Harvest quotas set for skin and pet trade for Java.
Wild harvest for legal trade in skins and illegal meat and gall bladder trade, which may be partially a by-product of the skin trade.
Main markets for skins; Europe, Singapore, Hong Kong & Taiwan PoC. Singapore also a re-exporter of skins and processed skins
China is believed to be the main market for snake meat.

TRAFFIC is a joint programme of and
Legal trade levels
• Commercial harvesting of P. mucosus began in the late 1970s.
• Reported legal trade according to the CITES trade database is summarised in figure.
• Most trade from Indonesia has been in skins.
• 1886 ~1.9m, 1989 ~600,000,1999 –stockpiled, 2006 below the quota.
• According to Indonesian regulations skins must be tanned before export.
0
100000
200000
300000
400000
500000
600000
700000
1989
1991
1993
1995
1997
1999
2001
2003
2005
2007
Year
Nu
mb
er
of
skin
s r
ep
ort
ed
(1997 im
po
rts a
s liv
e s
pecim
en
s)
Reported exports
Reported imports
Figure: CITES reported imports and exports of Ptyas mucosus skins from Indonesia (1989 – 2007). Leather products and small numbers of live individuals have been omitted from this graph.

TRAFFIC is a joint programme of and
Illegal trade
Southeast Asian snake species are commonly found in Chinese food markets
Demand for snake meat in China exceeds local supply during the cold season; additional sources of snakes are required.
Indonesia is one of the major sources supplying the demand from China for Oriental Rat Snakes and other species.
12 year suspension of skins trade triggered the illegal export of meat. Estimates of 50,000 to 100,000 snakes exported annually, (equivalent of 30 to 60 tons meat yr-1, 50,000 to 100,000 gall bladders).
According to traders interviewed illegal export of meat and gall has continued since the ban lifted.
Specimens of Oriental Rat Snake traded as the Indo-Chinese Rat Snake Ptyas korros (not CITES-listed). Some export of whole (un-skinned specimens), meat trade not solely a by-product from the skin trade. Whole frozen snakes are sometimes declared as frozen fish.

TRAFFIC is a joint programme of and
Proposed NDF method
• SPECIES BIOLOGY & ECOLOGY (Species resilience to harvest)
• MANAGING HARVEST– Ability to set correct quotas and adaptively manage
harvest
– Conditions of harvest and ability to change these
– Capacity to control harvest/ trade
• MONITORING IMPACT– Species monitoring
– Harvest monitoring
TRAFFIC is a joint programme of and
SPECIES BIOLOGY & ECOLOGY
(Species resilience to harvest)
• Medium sized snake reaching about 2.5 m in length and 5-10 cm in girth
• Males longer than females
• Reaches maturity at ~ 9 months ~120 cm for females
• Clutch size average 13
• May lay 2 clutches per year.
• No correlation between body size and clutch size and frequency.
• Widespread – probably most common in Central and East Java, areas with lower rainfall.
• Generalist – thrives in human modified environment
• Unknown density and population trends
• No major additional threats known.
Current conclusion: It is likely that due to its biology and ecology that
the species has a fairly high resilience to harvesting.

TRAFFIC is a joint programme of and
MANAGING HARVEST
Ability to set correct quotas and adaptively manage harvest
• Total offtake is unknown
• No quantitative data available for domestic demand but believed to be low. Quotas currently allow for 10% of quota as domestic use.
• Lack of reliable population estimates therefore adaptive management of harvest/export quota systems essential, based on species and harvest monitoring.
• No demand for pet trade; quota not necessary.
• Export quotas could be set for all products in demand based on the harvest quota for number of specimens.
• Seasonal restrictions not appropriate - possibly two breeding seasons, harvest takes place around agricultural activities.

TRAFFIC is a joint programme of and
MANAGING HARVEST Ability to set correct quotas and adaptively manage harvest
• Size restrictions to ensure specimens have reached maturity and
reproduced could be set for export (e.g. minimum 140 cm total
snake length).
100
110
120
130
140
150
160
170
1994/95 1996/96 1998 2007
cm
female
male
both sexes
0
20
40
60
80
100
120
140
160
180
200
9
19
23
33
48
49
56
66
74
88
90
105
120
180
195
240
315
420
435
465
510
600
660
days
tota
l le
ng
th (
cm
)
Male
Female
TRAFFIC is a joint programme of and
Conditions of harvest and ability to
control/change these
• Widespread harvest in natural and agricultural habitat.
• Some dedicated harvesters and some harvesting by farmers
• Dedicated snake harvesters mainly harvest the Oriental Rat Snake during the wet season when snakes are most commonly encountered.
• Farmers harvest out of crop growing season – mainly November to January. Snake capture secondary to farming activities and appears to be carried out in an ad hoc manner.
• Cost of harvesting – low but may be increasing as there is some evidence catch per unit effort (CPUE) is decreasing. Very low for ad hoc harvesting by farm workers
• Species is effectively an open-access resource.
• Difficult to enforce harvesting restrictions; harvest permit system unlikely to be effective.
TRAFFIC is a joint programme of and
Capacity to control harvest/ trade
• Not all products in demand are legally exported. Believed illegal meat trade was substantial during the trade ban on skins. Current levels of illegal international trade thought to be high. No effective control measure in place to combat this.
• Difficult, to differentiate between skins and meat of P. mucosus and P. korros (not controlled under CITES) are of skinned, semi-skinned or whole specimens, usually frozen. Believed some additional harvest of the snakes rather that as a by-product of the skin trade. Increased enforcement is needed to reduce illegal trade.
• Harvest quotas are currently not communicated through the trade chain so a reduction in export quota is unlikely to result in a reduction in harvesting.
• Little is known on harvest areas. Intensity of collection in different areas should be mapped and monitored to show shifting patterns in harvesting, which could indicate localised depletion.
TRAFFIC is a joint programme of and
MANAGING HARVEST
Current conclusion:
• Currently insufficient data is available on distribution, population and harvest areas to be sure that a quota is set at a non-detrimental level.
• Quotas should be set and adaptively managed based on field and harvest monitoring.
• Setting export or harvest quotas is unlikely to reduce harvest given the low cost and ad hoc nature of some harvesting (farmers) and apparent illegal trade. But currently there is little knowledge about quotas at harvester and small scale collector level showing poor communication.
• Suggest revising quotas (export quota was reduced by 10,000 for year 2008) until baseline surveys taken place (If quotas were enforceable).

TRAFFIC is a joint programme of and
MONITORING IMPACT - Species
Species monitoring
Establish ongoing field studies in a sample of harvested and unharvested populations. Currently no reliable baselines from which to monitor change as existing data are from harvested specimens rather than field surveys
— Density estimates and ongoing monitoring should identify changes. Continuing decline in density would indicate detrimental harvest and lack of recruitment.
— Catch per unit effort (CPUE). Decreasing CPUE would indicate harvest is likely to be detrimental.
— Size estimates. Declining average size in the wild could be one possible indication of unsustainable harvest. Particular attention should be paid to proportion of individuals above the size of maturity and to identify problems with recruitment.
— Sex ratio changes - at sampled sites for times of year. Further information on natural sex ratio and reproductive success/ recruitment under altered conditions of altered sex ratio would be beneficial in adaptively managing the harvest.

TRAFFIC is a joint programme of and
MONITORING IMPACT - Harvest
Harvest monitoring
Establish harvest monitoring. A year’s baseline needed from which to monitor change for the following measures ensuring regular and standard monitoring systems are in place:
— Catch per unit effort (difficult for casual harvesters e.g. farmers). Continuing decline would indicate that the population was reducing.
— Sex ratio changes. An increase in female to male ratio might indicate a reduction in average male size and reduction in differentiation between size of females and males. Caution should be taken when comparing sex ratios for different times of year in case of differences in activity levels for each sex through the year.
— Size differences should be compared by sex against monthly averages.
— Size should be well above size of mature females i.e. above 120 cm. Ongoing reduction in size of harvested specimens would indicate that the population was reducing.
— Harvesting area and pressure should be mapped in order to monitor shifting patterns in exploitation which could indicate localised depletion.
TRAFFIC is a joint programme of and
MONITORING IMPACT
Current conclusion:
Currently no reliable baselines from the field or harvested specimens from which to monitor change.
Sample average size for both male and female (ratio unknown) = 189.51 cm (n= 60), therefore likely to be above the age of maturity. If this measure was based on a much larger sample of harvested specimens from a representative sample of traders (including illegal traders) it could be concluded that offtake currently allows individuals to grow to maturity and to reproduce before harvest takes place. A much larger sample would be necessary to determine non-detriment with any confidence.
Sampling of size and CPUE (including harvesting area changes) should demonstrate declining population if this is the case.
TRAFFIC is a joint programme of and
RECOMMENDATIONS
• Studies of the species’ biology should be carried out throughout the year. Further investigation of reproductive size and reproductive status of harvested specimens would help in confirming the age of maturity to ensure that any minimum catch size is appropriate.
• Establish field and harvest monitoring, including mapping of harvest pressure.
• Consider
– listing P. korros as a lookalike species to aid the control of the meat trade,
– legalising the meat trade, and trade in gall bladders as a by-products of the skin trade. Quotas equivalent of lower than the skin trade could be set. This may also increase the value to the harvester. Alternatively harvest quota for specimens could be set with no stipulations on export products.
– Setting minimum size (length for skins and weight for meat) if there was capacity to enforce these (TSEA and IRATA concerns).

TRAFFIC is a joint programme of and
Conclusions
Monitoring (field and harvest) crucial in adaptively managing the species’ harvest and in allowing a determination that harvesting is not detrimental.
Much information has come from collectors and traders and a strong collaboration with them should help facilitate monitoring as could collaboration with universities.
Proposed method of making a NDF for Ptyas mucosus has focused on Java, the main, or possibly only, exporting island of Indonesia. The species occurs on other Indonesian islands, including Sumatra and Sulawesi. In effect a large proportion of the species’ range in Indonesia presumably not subject to harvest, although these areas cannot, without human intervention, act as a source if Java were to be acting as a sink.
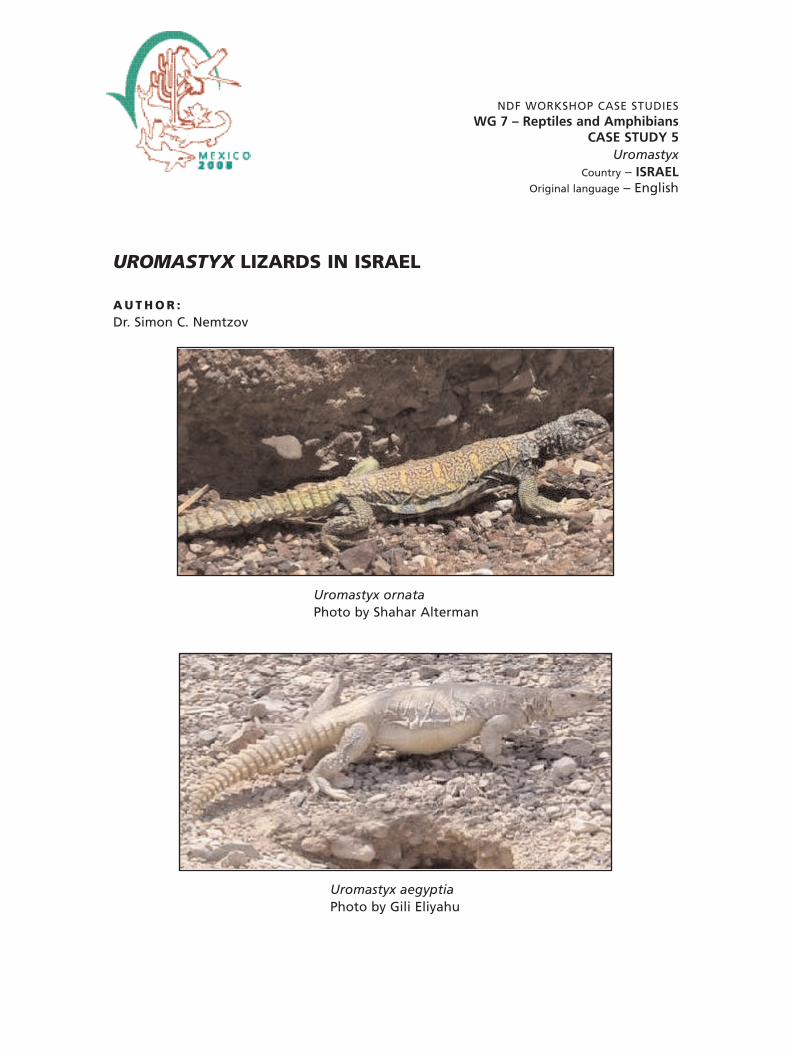
NDF WORKSHOP CASE STUDIESWG 7 – Reptiles and Amphibians
CASE STUDY 5Uromastyx
Country – ISRAELOriginal language – English
UROMASTYX LIZARDS IN ISRAEL
A U T H O R :Dr. Simon C. Nemtzov
Uromastyx ornataPhoto by Shahar Alterman
Uromastyx aegyptiaPhoto by Gili Eliyahu

Two species of Uromastyx lizards occur in Israel. The Egyptian mastigu-re (U. aegyptia), and the Ornate mastigure (U. ornata)1. In the early2000’s some Israeli entrepreneurs approached the Israeli governmentagency responsible for wildlife management and enforcement, theIsrael Nature and Parks Authority (INPA), requesting permits for collec-tion and/or breeding of Uromastyx lizards in Israel for commercial pur-poses, i.e. to export live individuals for the international pet trade.
The INPA conducted a study to see if an NDF could be made foreither or both of the species of Uromastyx. The final result was a rejec-tion of the proposals for both species because the scale of collectionrequested would have been detrimental to these species; in otherwords a finding of non-detriment could not be made.
This case study will cover how the determination was made foreach of the two species separately, but first some general informationon the genus Uromastyx.
The taxonomy of the genus has been somewhat confused over theyears, with subspecies being promoted and new species or subspeciesbeing described (Knapp, 2004). In this paper I use the scientific namesas they appear in the CITES standard reference for this genus: Wilms(2001), which was designated for the first time in 2002 at CoP 12 [see:CoP12 Doc. 10.3 (Rev.)]. According to this standard reference, there are16 species in this genus, including U. ornata as a separate species. Mostauthors consider ornata as a subspecies of U. ocellata, so usually speci-mens of ornata were apparently traded as U. ocellata. Therefore,there are almost no data in the UNEP-WCMC trade database for tradein U. ornata.
Due to the confusion about the species’ names before a standardnomenclature reference for the genus was established in 2002, therewas (and still is) some confusion about whether a particular speciesoccurs in a particular range state or not. For example, Egypt is not lis-ted as a range state for U. acanthinura, however the country hasreported exports for this species, and in October 1991 the Egyptiangovernment declared an export ban on U. acanthinura, U. aegyptia, U.ocellata and U. ornata from its country (CITES Notification No. 662,dated 16 January 1992).
WG 7 – CASE STUDY 5– p.2
I. BACKGROUND INFORMATION ON THE TAXA
1 Alternative common names in English for Uromastyx lizards are: Dabb or Dhabb lizards orSpiny-tailed lizards. In the literature, one can also find alternative spellings of the scientificspecific names, such as aegyptius or ornatus. Here I follow the scientific names in the CITESstandard reference for the genus Uromastyx (Wilms, 2001).

Little is known about this genus in the wild and there are far morepublications concerning husbandry and captive breeding of Uromastyxthan concerning their ecology and behavior in the wild (Highfield &Slimani, 1998). Uromastyx are generalist herbivores, they are diurnaland usually live in groups of several individuals occupying very exten-sive territories (Zug, 1993). Typical populations range from about 1 to10 animals per ha (Highfield & Slimani, 1998) depending on the spe-cies and habitat. Uromastyx are generally very colorful lizards whosesize varies with species and can reach up to about 75 cm (including thetail) in the largest individuals. They can live over 20 years in the wild(Bouskila & Amitai, 2001), reach sexual maturity around four years old,and lay between 10 and 40 eggs per year, depending on the individua-l’s size and species.
In most places, the habitats of Uromastyx are not directly threate-ned, as they mainly comprise desert which is usually of no commercialvalue (but this is not the case in Israel, see below). Uromastyx lizardshave been in international trade for several decades and collecting isconsidered the major threat to many of the populations in the wild(Highfield & Slimani, 1998; Knapp, 2004). The scale of exploitation,including domestic utilization for food and traditional medicine (e.g.,Walls, 1996) can lead to local depletions.
Concern about the sustainability of trade in these species led to theinclusion of all Uromastyx species in Appendix II of CITES in 1977. Inaddition, a number of trade restrictions specific to certain species orcountries, have been applied to Uromastyx since then.
The Animals Committee has discussed concerns about the trade inUromastyx a number of times, especially as part of the Significant TradeReview process, most recently at AC 15 in 1999 and AC 22 in 2006.
IUCN’s Red List (IUCN 2007) currently contains only one Uromastyxspecies (i.e., the newly described species U. alfredschmidti, which is lis-ted as Near Threatened), however a new IUCN Global ReptileAssessment will apparently be released in the next year or two.
1. BIOLOGICAL DATA
1.1 Scientific and common namesScientific name: Uromastyx aegyptia; English common names:Egyptian mastigure, Egyptian dabb-lizard, Egyptian spiny tailed lizard.In Hebrew: Chardon-zav mazui.
1.2. DistributionThe global distribution of U. aegyptia includes Sudan, Egypt (includingthe Sinai Peninsula), Saudi Arabia, Jordan, Israel and Iraq. The species’
WG 7 – CASE STUDY 5 – p.3

range in Israel (see map on page 4) includes: the eastern Judean Desert(Nahal Hever alluvial fan), the Arava Valley, and the central and sou-thern Negev Desert (Bouskila & Amitai, 2001). An isolated population,in the western Negev Desert, is separated from all other populationsin Israel by the unsuitable area of the Negev highlands. This smallpopulation is thus connected only to other conspecific populationsacross the border in the Sinai Peninsula of Egypt. The total area of thespecies’ habitat in Israel is approx. 4,000 km2, but much of this is mar-ginal habitat with few individuals.
1.3 Biological characteristics
1.3.1 General biological and life history characteristics of the speciesU. aegyptia is the largest species in the genus with adults weighing upto 2 kg and reaching up to 75 cm in total length. They live in deepburrows (up to 10 m in length, and 1.8 m in depth) that are in use formany years. These burrows require heavy investments for their cons-truction, and the survival of the lizards depends on them as shelterfrom predators and from the extreme conditions in the desert(Bouskila, 1983, 1986). They hibernate in these burrows duringDecember and January (Mendelssohn & Bouskila, 1989).
Juveniles and adults are predominantly herbivorous, feedingmainly on leaves, buds, fruits, seeds and flowers of plants. Annuals areeaten during the spring, if winter rains were enough to support ger-mination. During dry years and during the summer (when no rainoccurs), the lizards depend on perennial plants; in the wadis in theArava Valley, Acacia trees comprise the main summer food source(Bouskila, 1984; Bouskila, 1987; Foley et al., 1992; Mendelssohn &Bouskila, 1989). In other areas that lack Acacia trees, they feed onperennial shrubs. They tend to use burrows that are close to summersources of food, apparently because foraging far from their burrowexposes them to predation (Bouskila & Molco, 2002). They are mostlysolitary and spend most of their time during the day near the burrow.
Robinson (1995) found population densities of U. aegyptia of 4.4-6.3 individuals per ha in an arid but productive environment inKuwait. Bouskila (1984) reported an average of 3.4 adult individualsper ha in the northern part of the Arava Valley of Israel. Bouskila &Molco (2002) reported 10 individuals per ha near Eilat in the southernpart of the Arava Valley. Gottleib & Vidan (2007) found an averagedensity of 18.5 U. aegyptia burrows per ha in the central part of theArava Valley, with an average of 51% of them in active use.
U. aegyptia reaches sexual maturity at the age of 4-6 years(Mendelssohn & Bouskila, 1989). Longevity in nature is more than 20
WG 7 – CASE STUDY 5– p.4

years (Bouskila & Amitai, 2001). Bouskila (1984) observed matingduring May; the females lay one clutch of eggs (clutch size: 17- 41eggs) in May or June in deep burrows (up to 3 m long) that they dug;the eggs hatch at the end of August. Females did not lay eggs everyyear (Bouskila, 1984).
Juveniles are very susceptible to predation, and many of them arekilled during their first year by birds (e.g., shrikes), by varanid lizardsand by snakes. The predators of adults are mainly raptors, but alsowolves, dogs and humans (Bouskila, 1984).
WG 7 – CASE STUDY 5 – p.5

1.3.2 Habitat typesU. aegyptia is a large herbivorous lizard active all year round, espe-cially during the summer, which in Israel is the dry season, and they arethus limited in their distribution to those areas that provide somegreen vegetation during the summer (Arbel, 1984; Bouskila, 1984;Bouskila & Amitai, 2001; Mendelssohn & Bouskila, 1989). The typicalhabitat for this species is alluvial fans, gravel plains, and wide wadis indesert areas. Most of their habitat has < 80 mm mean annual rainfall,and they are always found in areas with < 150 mm mean annual rain-fall.
1.3.3 Role of the species in its ecosystemU. aegyptia has a central role in the desert plains as a physical ecos-ystem engineer in that the lizard modifies in a substantial way thephysical characteristics of its habitat, and the modification has impor-tant implications on other organisms in the ecological system (Bouskila& Molco, 2002). The large burrows of U. aegyptia provide shelter formany organisms that would not be able to dig through the harddesert crust to escape the harsh conditions in the desert. These inclu-de snakes, geckos, spiders and many arthropods. In addition, the accu-mulation of soil from deep layers near the entrance of the burrow pro-vides an ameliorated substrate for plants that normally may sufferfrom the high concentration of salt near the ground surface. In addi-tion to the role as an ecosystem engineer, U. aegyptia serves as prey tovariety of predators and acts as an herbivore in the ecosystem(Bouskila, 1984, 1986). The species was the principal prey of the gol-den eagle (Aquila chrysaetos) when three pairs of this endangeredraptor established breeding territories in the Arava Valley in the 1970's(B. Shalmon, pers. comm.).
1.4 Population
1.4.1 Global Population sizeThere are no reliable estimates of global population size, and popu-lation densities apparently differ greatly among the different rangestates.
Israel contains less than 20% of the world population of this species(Dolev & Perevelotsky, 2004), but there is no reliable population esti-mate for the whole country. As stated above, the species range inIsrael covers up to about 4,000 kmÇ, but their density is rather low inmost of this area which is apparently only marginal habitat. By extra-polating and estimating densities the country’s population of this spe-cies may be as low as a few thousand adults.
WG 7 – CASE STUDY 5– p.6

1.4.2 Current global population trends___increasing _X_decreasing ____ stable ____unknown
The world population is apparently decreasing due to unsustainablecollection from the wild (IUCN, in prep.). There are currently no exportquotas for this species (CITES, 2008).
1.5 Conservation status
1.5.1 Global conservation status (according to IUCN Red List)___Critically endangered ___Near Threatened___Endangered ___Least concern___Vulnerable ___Data deficient
The species is not listed in the IUCN Red List 2008 (as of October 2008),but a new assessment by IUCN of many reptile groups is expected tobe released next year.
1.5.2 National conservation status for the case study countryThe Red Book of Vertebrates in Israel (Dolev & Perevelotsky, 2004) liststhe Regional Threat Category of U. aegyptia as Near Threatened.
1.5.3 Main threats within the case study country___ No Threats_X_ Habitat Loss/Degradation (human induced) ___ Invasive alien species (directly affecting the species) _X_ Harvesting [hunting/gathering] _X_ Accidental mortality (e.g. Bycatch)___ Persecution (e.g. Pest control)___ Pollution (affecting habitat and/or species) ___ Other__________________ Unknown
Threat and Disturbance factorsa. Habitat destruction: in particular by the expansion of low-water use
agriculture and of military training in desert areas (Bouskila &Amitai, 2001; Bouskila & Molco, 2002). In addition to reducing thehabitat available for the species, these factors cause fragmentationof the existing populations.
b. Poaching: They are illegally trapped and eaten in the Arava Valleyby foreign agricultural laborers, mostly those from Thailand(Hawlena, 2000; Bouskila & Molco, 2002; Yom-Tov, 2003; Nemtzov,2007; Leader & Boldo, 2008) (see photo on page 9).
WG 7 – CASE STUDY 5 – p.7
c. They are illegally trapped and eaten by local Bedouins, who tradi-tionally used the skin as water canteens (Arbel, 1984; Bouskila &Amitai, 2001).
d. All-terrain vehicles and off-road vehicles used by agriculture wor-kers and also for recreation, damage the burrows and their surroun-dings, and can cause diversion of flood waters into some of theburrows.
e. They are killed by cars on roads, particularly males during themating season (Bouskila & Amitai, 2001).
In Israel, U. aegyptia habitat has been greatly reduced by the spreadof modern agriculture into desert regions, relying on innovative low-water-use agricultural techniques. Large regions of arid areas and U.aegyptia habitat in the Arava Valley have now been converted to agri-culture, with much of the land being covered with plastic hothouses(Hawlena, 2000) (see photo on page 9). Plans are progressing also toconvert U. aegyptia habitat in the western Negev Desert to agricultu-ral land.
Until the mid 1990’s U. aegyptia were sometimes reported as anagricultural pest causing damage to crops in the Arava Valley (Moran& Keidar, 1993), but such damage no longer occurs (Nemtzov, 2002)since the population in that area has been greatly reduced and mostof the crops there are no longer grown outdoors.
Two studies of U. aegyptia in the northern (Hawlena, 2000) and thecentral Arava Valley (Gottleib & Vidam, 2007) have shown markedreductions in the sub-populations of this species in Israel as a functionof distance to agricultural regions. This is due mainly to negativeimpact of poaching by agricultural workers, and by loss of habitatfrom construction of structures for low-water use agriculture in closedhothouses.
2. SPECIES MANAGEMENT WITHIN THE COUNTRY FOR WHICH CASESTUDY IS BEING PRESENTED
2.1 Management measures
2.1.1 Management historyUntil the early 1990’s there were reports of agricultural damage by U.aegyptia in the Arava Valley. Problem animals were sometimes trap-ped and translocated further away from the agricultural areas. Thespecies has never been “managed” but rather its habitat is protectedas a way to encourage its survival in the wild.
WG 7 – CASE STUDY 5– p.8

2.1.2 Purpose of the management plan in placeThe current efforts on behalf of this species are directed at preventingpoaching and further loss of habitat.
2.1.3 General elements of the management planThe current “management” program related to conservation of thisspecies is to try to prevent further loss of habitat, as well as educationand enforcement against poaching by Thai agricultural workers.
2.1.4 Restoration or alleviation measuresN/A
2.2 Monitoring system
2.2.1 Methods used to monitor harvestThere is no legal harvest, so no monitoring of harvest is done.
2.2.2 Confidence in the use of monitoring
2.3 Legal framework and law enforcement: Provide details ofnational and international legislation relating to the conserva-tion of the speciesThe species is fully protected in Israel under a variety of laws and regu-lations. The species is listed as “protected wildlife” under the WildlifeProtection Law of 1955 (and its regulations of 1994) and as a “protec-ted natural asset” under the National Parks, Nature Reserves andNational Monuments Law of 1998 (and its regulations of 2002 and2005). Specimens (including live individuals as well as all parts andderivatives) may not be disturbed, harmed, captured, held, bred incaptivity, moved, or traded without a written permit from the IsraelNature and Parks Authority. In addition, much of the habitat of thisspecies in Israel is in protected areas (nature reserves) where no faunaor flora may be disturbed or collected.
Internationally, all Uromastyx species have been listed in AppendixII of the CITES Convention since 1977.
3. UTILIZATION AND TRADE FOR RANGE STATE FOR WHICHCASE STUDY IS BEING PRESENTED
3.1 Type of use (origin) and destinations (purposes) (e.g. commer-cial, medicinal, subsistence hunting, sport hunting, trophies,pet, food). Specify the types and extent of all known uses of
WG 7 – CASE STUDY 5 – p.9
the species. Indicate the extent to which utilization is from cap-tive-bred, artificially propagated, or wild specimensOutside of Israel, the species has been trapped and sold for the inter-national pet trade, and is also grown in captivity. There are records inthe past of domestic use of the species for traditional medicine and forfood and leather by local Bedouins before the establishment of theState of Israel in 1948 and the enactment of Israel's Wildlife ProtectionLaw in 1955. There has never been any legal trapping or collectingallowed in Israel. There are many records of illegal poaching for foodin recent years by farm workers from Thailand.
3.2. Harvest
3.2.1 Harvesting regime (extractive versus non extractive harvesting,demographic segment harvested, harvesting effort, harvestingmethod, harvest season)The species is not legally harvested.
3.2.2 Harvest management/ control (quotas, seasons, permits, etc.)N/A
3.3 Legal and illegal trade levels: To the extent possible, quantifythe level of legal and illegal use nationally and export and des-cribe its nature. Although U. aegyptia are fully protected by Israeli law and may not becaptured or harmed without a permit, there is apparently much illegalpoaching, mainly by snare traps set by agricultural workers fromThailand (photo, right) who are employed in the Arava Valley (HarelBen Shahar, pers. comm.; Yom-Tov, 2003; Nemtzov, 2007; Leader &Boldo, 2008). Close to agricultural areas their population has beenlocally decimated, but the extent of the poaching has not been quan-tified.
During the years when there was an export quota from Egypt forthis species, there may have been small amounts of smuggling of wildcaught specimens out of Israel and into Egypt. If this occurred it wasapparently not on a large commercial scale.
WG 7 – CASE STUDY 5– p.10
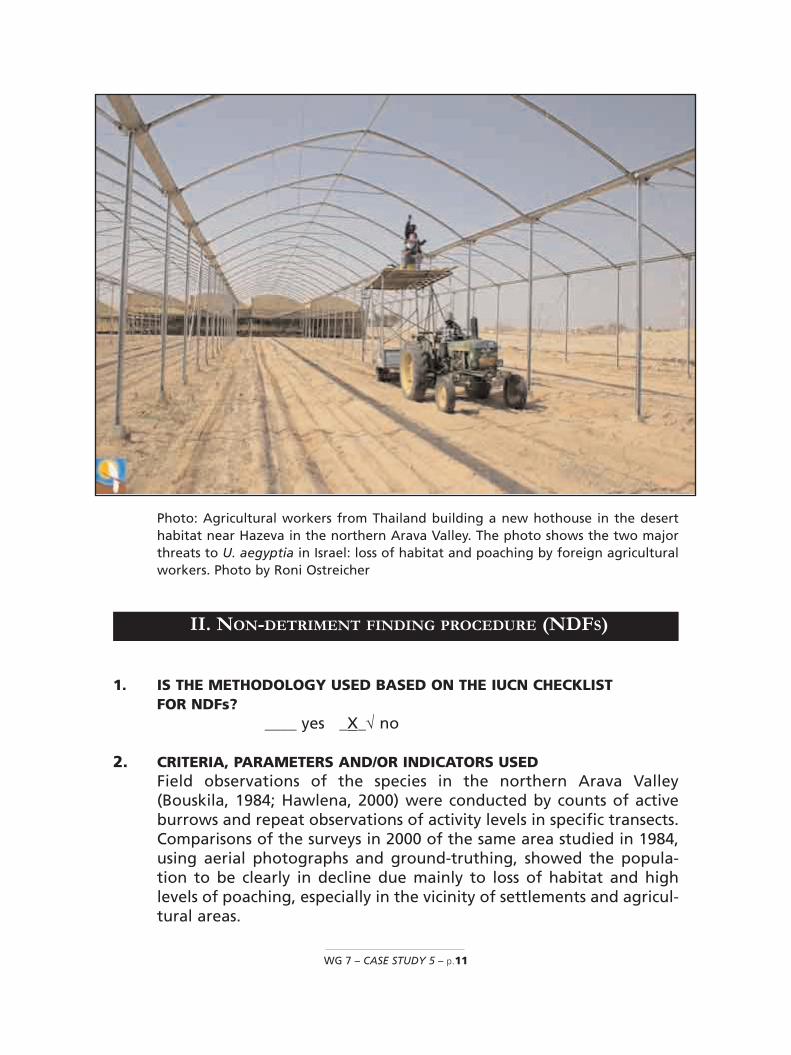
1. IS THE METHODOLOGY USED BASED ON THE IUCN CHECKLISTFOR NDFs?
____ yes _X_√ no
2. CRITERIA, PARAMETERS AND/OR INDICATORS USEDField observations of the species in the northern Arava Valley(Bouskila, 1984; Hawlena, 2000) were conducted by counts of activeburrows and repeat observations of activity levels in specific transects.Comparisons of the surveys in 2000 of the same area studied in 1984,using aerial photographs and ground-truthing, showed the popula-tion to be clearly in decline due mainly to loss of habitat and highlevels of poaching, especially in the vicinity of settlements and agricul-tural areas.
WG 7 – CASE STUDY 5 – p.11
II. NON-DETRIMENT FINDING PROCEDURE (NDFS)
Photo: Agricultural workers from Thailand building a new hothouse in the deserthabitat near Hazeva in the northern Arava Valley. The photo shows the two majorthreats to U. aegyptia in Israel: loss of habitat and poaching by foreign agriculturalworkers. Photo by Roni Ostreicher

Because there were no reliable demographic data available to con-duct a detailed MSY study, the evaluation was based on a determina-tion of the general state of the country’s population of this species.The life history characteristics of this species show that it relies on longadult longevity coupled with low juvenile survivorship (r strategy).Collecting adults from the wild from a species employing such a stra-tegy is not generally conducive to sustainable harvest (Schlaepfer etal., 2005).
Because the policy of the INPA is to employ an extremely low levelof tolerance to risk of extinction, the agency uses a precautionaryapproach in all areas of evaluation of the exploitation of wildlife (see:Milner-Gulland & Akcakaya, 2001).
Based on this precautionary approach the agency could not set aminimum number of animals that could be collected from the wildwith no detrimental effect on the population. There was therefore nojustification in allowing any collecting, since sustainable harvest canonly be done on a population at steady-state or one that is increasingbut not on one in decline.
3. MAIN SOURCES OF DATA, INCLUDING FIELD EVALUATION ORSAMPLING METHODOLOGIES AND ANALYSIS USEDMultiyear comparison of field observations and surveys were conduc-ted in transects.
4. EVALUATION OF DATA QUANTITY AND QUALITY FOR THE ASSESSMENTThe quality of the data was determined to be reliable as it was collec-ted only by authorized and experiences scientists and rangers.
5. MAIN PROBLEMS, CHALLENGES OR DIFFICULTIES FOUNDON THE ELABORATION OF NDFThere were no demographic data available on birth or death rates, oron immigration that would have allowed us to use even a simplepopulation model to determine population trends. All results werebased on comparison of survey data.
6. RECOMMENDATIONSThere does not appear to be any level of collection of individuals fromthe wild that could be deemed sustainable, as the wild population isin decline and their r strategy makes them poor candidates for exploi-tation. This determination was not made on the basis of a sound scien-tific analysis of the population's demographics or on any kind of arith-metic algorithm. But even a simple algorithm, such as Robinson andRoberts (1991), which is based on only four parameters, to estimate of
WG 7 – CASE STUDY 5– p.12
the possibility of sustainable harvest, has many problems (Milner-Gulland & Akcakaya, 2001).
If the INPA were to wish to determine whether the decision not toissue an NDF was correct, they should conduct a more comprehensivesurvey of the species including collection of demographic data and usean appropriate model, such as suggested by Milner-Gulland &Akcakaya (2001). Also, repeat surveys every three to five years of thesame area will allow multi-year comparisons of the population's sta-tus.
1. BIOLOGICAL DATA
1.1 Scientific and common names: Uromastyx ornata In English: OrnateMastigure. In Hebrew: Chardon-zav hadur
1.2 Distribution (Specify the currently known range of the species.If possible, provide information to indicate whether or not thedistribution of the species is continuous, or to what degree itis fragmented. If possible, include a map)The species U. ornata is endemic to the Arabo-Sinaian region: sou-thern Israel, the Sinai Peninsula (Egypt), and north-west Saudi-Arabia(Bouskila & Amitai, 2001). Its range in Israel includes the EilatMountains and Mt. Timna. The total area of the species’ habitat inIsrael is approx. 270 km2.
1.3 Biological characteristics
1.3.1 Provide a summary of general biological and life history characteristicsof the species (e.g. reproduction, recruitment, survival rate, migration,sex ratio, regeneration or reproductive strategies, tolerance towardhumans)Very little has been published about the ecology and behavior of U.ornata in the wild, and most of what is known is from unpublished sur-veys and internal reports of the Israel Nature and Parks Authority.
This species is much smaller than U. aegyptia with adults reachingup to 40 cm and weighing up to 300g (Mendelssohn & Bouskila, 1989).U. ornata lives in very dry areas (with < 20 mm mean annual rainfall)in rocky habitats rich in holes and crevices. They are active all year-round, but most activity is in the hottest part of the day during the
WG 7 – CASE STUDY 5 – p.13
I. BACKGROUND INFORMATION ON THE TAXA

hottest months. Most activity is on the rocky slopes of the wadis, withdescents to the floor of the wadi only for chasing invaders for feedingor for reproduction (including courtship and nesting), and also for anunusual and unexplained behaviour wherein the male flips the fema-le onto her back (Molco & Ben-David, 2000).
U. ornata may be solitary or live in small groups, but never withmore than one adult male (Mendelssohn & Bouskila, 1989). Dominantmales attack and chase other males from their home range, but theydo not maintain exclusive territories. Often a dominant male occupiesa segment of the slope in a wadi, where several females, and even asubordinate male, may use the same area. From spring to the begin-ning of winter, the dominant male often approaches a female, turnsher over on her back, and walks in circles on its belly. The meaning ofthis unique behavior is not clear yet, but it is likely to be related tothe bond between the dominant male and the females in his homerange (Bouskila & Molco, pers. comm.; Molco & Ben-David, 2000). Thefemale digs a burrow in the floor of the wadi, where she lays on eclutch of 7-17 eggs in June. The eggs hatch after about 60 days in thebeginning of August. Juveniles disperse within 4 days after hatching.Juveniles reach sexual maturity at the age of 2 years (Mendelssohn &Bouskila 1989).
The food of U. ornata is mainly composed of flowers, fruits and lea-ves of Ochradenus baccatus and other bushes; they shelter in rock cre-vices on steep slopes of wadis, but they descend the slopes for feedingin the wadi (Bouskila & Amitai 2001; Molco & Ben-David, 2000;Bouskila & Molco, pers. comm.).
1.3.2 Habitat types: Specify the types of habitats occupied by the speciesand, when relevant, the degree of habitat specificityThe species is specific to extreme desert (<20 mm mean annual rain-fall), in steep, rocky, hot wadis that hold Acacia trees and O. baccatusbushes (Mendelssohn & Bouskila, 1989; Bouskila & Amitai 2001, Molco& Ben-David 2000).
1.3.3 Role of the species in its ecosystemThe role of this species in its ecosystem has not been studied directly,but it is reasonable to view it as similar to that of other Uromastyx spe-cies (above); it is probably less of an ecosystem engineer in that doesnot create burrows in the hard desert floor, but it does dig nestingburrows for laying eggs and it clears burrows in rocky crevices that areapparently exploited by many other species.
WG 7 – CASE STUDY 5– p.14
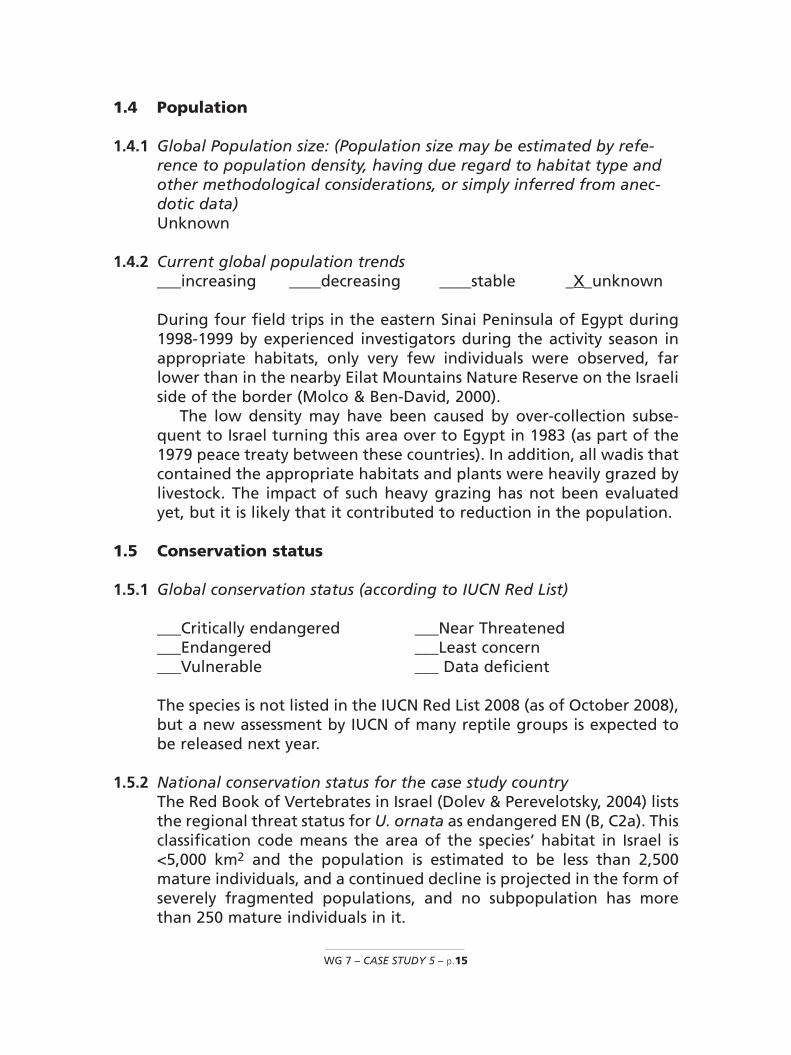
1.4 Population
1.4.1 Global Population size: (Population size may be estimated by refe-rence to population density, having due regard to habitat type andother methodological considerations, or simply inferred from anec-dotic data)Unknown
1.4.2 Current global population trends___increasing ____decreasing ____stable _X_unknown
During four field trips in the eastern Sinai Peninsula of Egypt during1998-1999 by experienced investigators during the activity season inappropriate habitats, only very few individuals were observed, farlower than in the nearby Eilat Mountains Nature Reserve on the Israeliside of the border (Molco & Ben-David, 2000).
The low density may have been caused by over-collection subse-quent to Israel turning this area over to Egypt in 1983 (as part of the1979 peace treaty between these countries). In addition, all wadis thatcontained the appropriate habitats and plants were heavily grazed bylivestock. The impact of such heavy grazing has not been evaluatedyet, but it is likely that it contributed to reduction in the population.
1.5 Conservation status
1.5.1 Global conservation status (according to IUCN Red List)
___Critically endangered ___Near Threatened___Endangered ___Least concern___Vulnerable ___ Data deficient
The species is not listed in the IUCN Red List 2008 (as of October 2008),but a new assessment by IUCN of many reptile groups is expected tobe released next year.
1.5.2 National conservation status for the case study countryThe Red Book of Vertebrates in Israel (Dolev & Perevelotsky, 2004) liststhe regional threat status for U. ornata as endangered EN (B, C2a). Thisclassification code means the area of the species’ habitat in Israel is<5,000 km2 and the population is estimated to be less than 2,500mature individuals, and a continued decline is projected in the form ofseverely fragmented populations, and no subpopulation has morethan 250 mature individuals in it.
WG 7 – CASE STUDY 5 – p.15

1.5.3 Main threats within the case study country___No Threats_X Habitat Loss/Degradation (human induced) ___Invasive alien species (directly affecting the species) ___Harvesting [hunting/gathering]___Accidental mortality (e.g. Bycatch)___Persecution (e.g. Pest control)___Pollution (affecting habitat and/or species) ___Other__________________Unknown
Threat and Disturbance factorsa. Potential trade impact: Despite protection in Israel and in Egypt, U.
ornata has a great demand in the international pet trade and theymay be collected by illegal traders and reptile collectors (Bouskila &Molco, 2002). No illegal collection in Israel has been recorded, butthe potential is certainly there.
b. Habitat loss: The global population is apparently small, and sub-populations can be easily fragmented by mountain ranges whichare not used by the species or by utilization of their habitat byhumans for recreational or other activities (Bouskila & Molco, 2002).This is not a severe threat in Israel, as most of their habitat is pro-tected and is also unsuitable for most uses by people (e.g. agricul-ture or real estate).
c. All-terrain vehicles and off-road vehicles that are driven in thewadis in Southern Israel disturb the animals and cause damage tobushes and trees which are their main food sources. This is a locali-zed threat and likely to increase, but it is not severe as most of thehabitat is protected and such activities are concentrated in a fewdesignated 4X4 routes.
2. SPECIES MANAGEMENT WITHIN THE COUNTRY FOR WHICH CASESTUDY IS BEING PRESENTED
2.1 Management measures
2.1.1 Management historyA survey of the species in the Eilat Mountains in the late 1970’s sho-wed apparently very low population numbers. Subsequently, 162 indi-viduals were translocated during 1980 and 1981 from the southernSinai Peninsula to the Eilat Mountains to augment the population
WG 7 – CASE STUDY 5– p.16
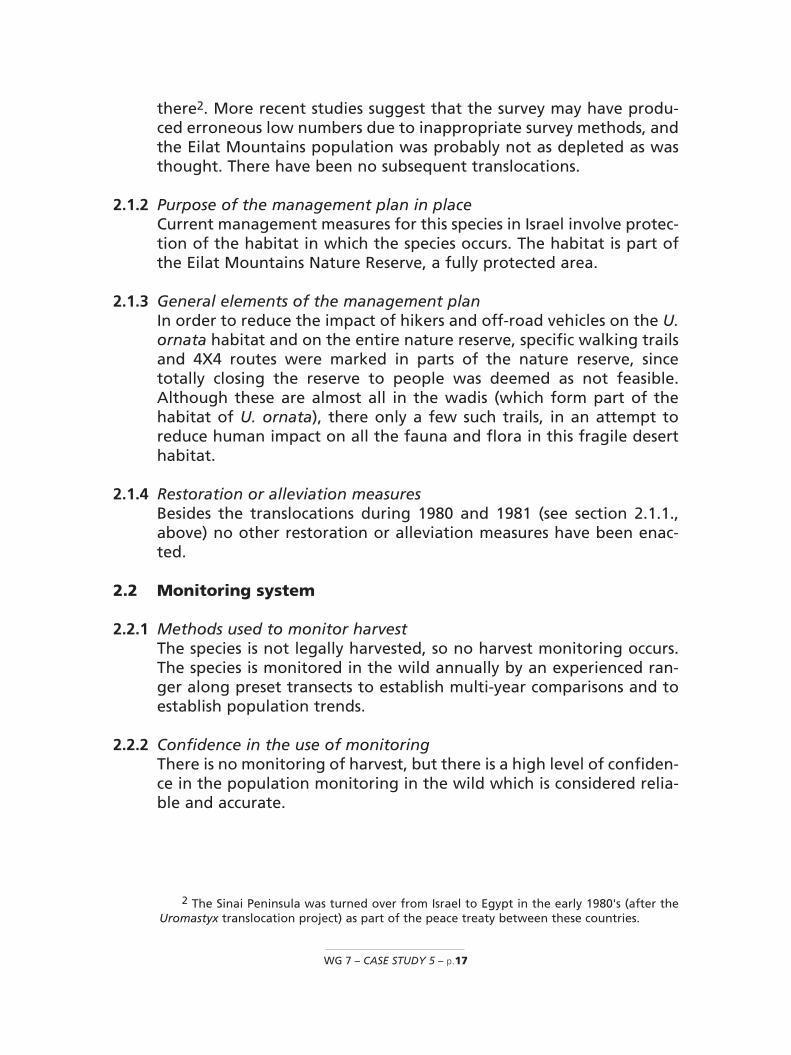
there2. More recent studies suggest that the survey may have produ-ced erroneous low numbers due to inappropriate survey methods, andthe Eilat Mountains population was probably not as depleted as wasthought. There have been no subsequent translocations.
2.1.2 Purpose of the management plan in placeCurrent management measures for this species in Israel involve protec-tion of the habitat in which the species occurs. The habitat is part ofthe Eilat Mountains Nature Reserve, a fully protected area.
2.1.3 General elements of the management planIn order to reduce the impact of hikers and off-road vehicles on the U.ornata habitat and on the entire nature reserve, specific walking trailsand 4X4 routes were marked in parts of the nature reserve, sincetotally closing the reserve to people was deemed as not feasible.Although these are almost all in the wadis (which form part of thehabitat of U. ornata), there only a few such trails, in an attempt toreduce human impact on all the fauna and flora in this fragile deserthabitat.
2.1.4 Restoration or alleviation measuresBesides the translocations during 1980 and 1981 (see section 2.1.1.,above) no other restoration or alleviation measures have been enac-ted.
2.2 Monitoring system
2.2.1 Methods used to monitor harvestThe species is not legally harvested, so no harvest monitoring occurs.The species is monitored in the wild annually by an experienced ran-ger along preset transects to establish multi-year comparisons and toestablish population trends.
2.2.2 Confidence in the use of monitoringThere is no monitoring of harvest, but there is a high level of confiden-ce in the population monitoring in the wild which is considered relia-ble and accurate.
WG 7 – CASE STUDY 5 – p.17
2 The Sinai Peninsula was turned over from Israel to Egypt in the early 1980's (after theUromastyx translocation project) as part of the peace treaty between these countries.

2.3 Legal framework and law enforcement: Provide details of natio-nal and international legislation relating to the conservation ofthe species.The species is fully protected in Israel under a variety of laws and regu-lations. The species is listed as “protected wildlife” under the WildlifeProtection Law of 1955 (and its regulations of 1994) and as a “protec-ted natural asset” under the National Parks, Nature Reserves andNational Monuments Law of 1998 (and its regulations of 2002 and2005).
Specimens (including live individuals as well as all parts and deriva-tives) may not be disturbed, harmed, captured, held, bred in captivity,moved, nor bought or sold, nor offered for sale (without a writtenpermit from the Israel Nature and Parks Authority). In addition, all thehabitat of this species in Israel is in protected areas (nature reserves)where all fauna and flora are fully protected and may not be distur-bed or collected.
Internationally, all Uromastyx species are listed in Appendix II of theCITES Convention since 1977.
3. UTILIZATION AND TRADE FOR RANGE STATE FOR WHICH CASE STUDYIS BEING PRESENTEDThere is no legal use of U. ornata individuals or parts and derivativesin Israel. No specimens may be taken from the wild, and there is nolegal captive breeding or trade (domestic or international).
Because the species’ natural habitat is small and away from agricul-tural areas, and because the animals are relatively rare, there is appa-rently no poaching by farm workers, and there is apparently no illegaltrade. As stated above, U. ornata has a great demand in the interna-tional pet trade so the potential for illegal collection and smugglingexists. There have been few if any cases of poachers or reptile collec-tors taking U. ornata in Israel.
3.1 Type of use (origin) and destinations (purposes) (e.g. commer-cial, medicinal, subsistence hunting, sport hunting, trophies,pet, food). Specify the types and extent of all known uses of thespecies. Indicate the extent to which utilization is from captive-bred, artificially propagated, or wild specimensA very limited number of permits have been issued in the past for avery few individuals to be held in Israel in mini-zoos in non-commer-cial educational institutions.
3.2 HarvestThe species is not legally harvested in Israel.
WG 7 – CASE STUDY 5– p.18
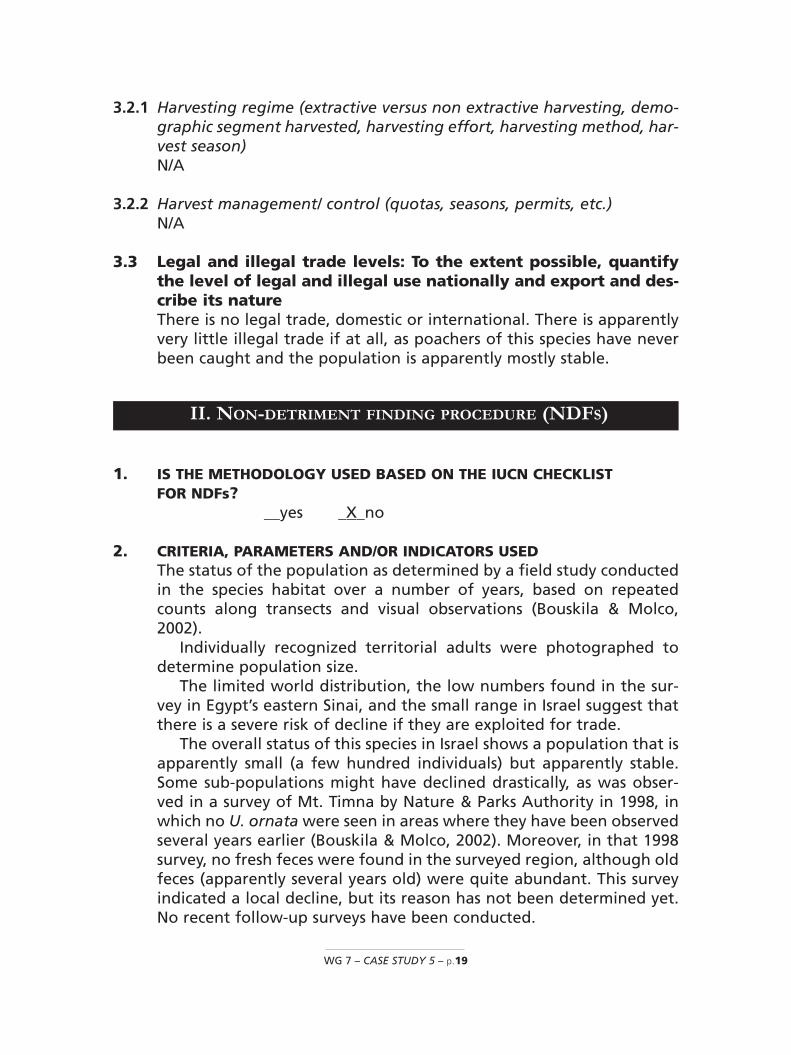
3.2.1 Harvesting regime (extractive versus non extractive harvesting, demo-graphic segment harvested, harvesting effort, harvesting method, har-vest season)N/A
3.2.2 Harvest management/ control (quotas, seasons, permits, etc.)N/A
3.3 Legal and illegal trade levels: To the extent possible, quantifythe level of legal and illegal use nationally and export and des-cribe its natureThere is no legal trade, domestic or international. There is apparentlyvery little illegal trade if at all, as poachers of this species have neverbeen caught and the population is apparently mostly stable.
1. IS THE METHODOLOGY USED BASED ON THE IUCN CHECKLISTFOR NDFs?
__yes _X_no
2. CRITERIA, PARAMETERS AND/OR INDICATORS USEDThe status of the population as determined by a field study conductedin the species habitat over a number of years, based on repeatedcounts along transects and visual observations (Bouskila & Molco,2002).
Individually recognized territorial adults were photographed todetermine population size.
The limited world distribution, the low numbers found in the sur-vey in Egypt’s eastern Sinai, and the small range in Israel suggest thatthere is a severe risk of decline if they are exploited for trade.
The overall status of this species in Israel shows a population that isapparently small (a few hundred individuals) but apparently stable.Some sub-populations might have declined drastically, as was obser-ved in a survey of Mt. Timna by Nature & Parks Authority in 1998, inwhich no U. ornata were seen in areas where they have been observedseveral years earlier (Bouskila & Molco, 2002). Moreover, in that 1998survey, no fresh feces were found in the surveyed region, although oldfeces (apparently several years old) were quite abundant. This surveyindicated a local decline, but its reason has not been determined yet.No recent follow-up surveys have been conducted.
WG 7 – CASE STUDY 5 – p.19
II. NON-DETRIMENT FINDING PROCEDURE (NDFS)
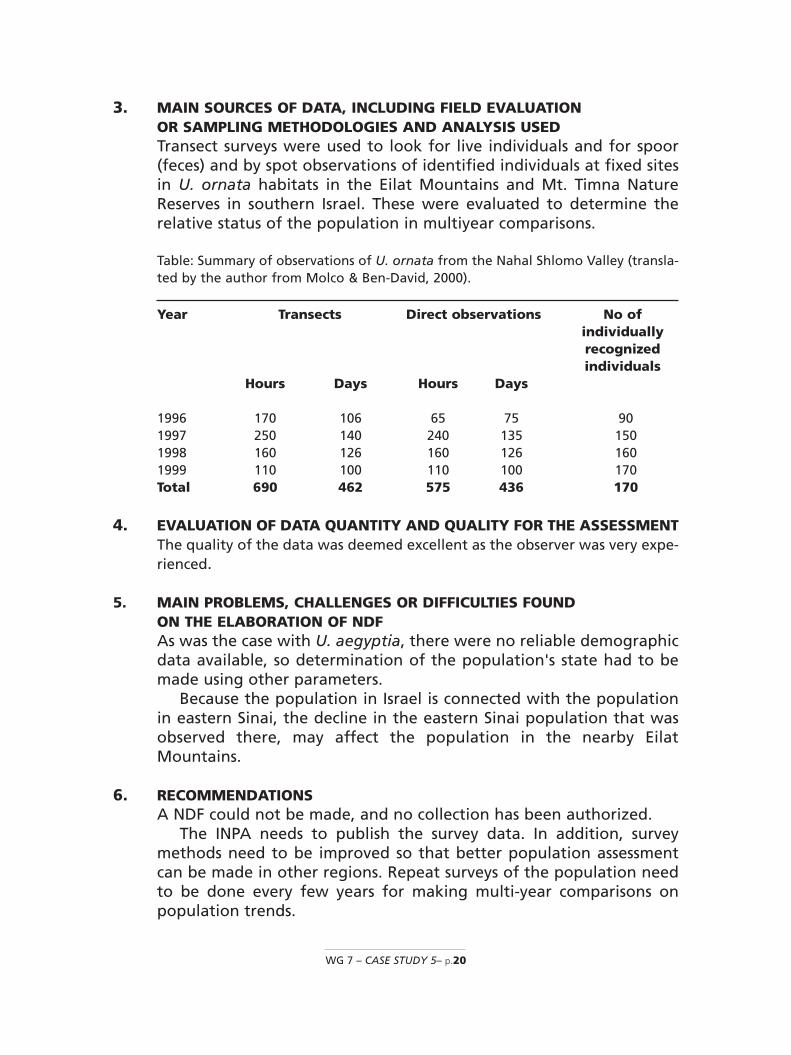
3. MAIN SOURCES OF DATA, INCLUDING FIELD EVALUATIONOR SAMPLING METHODOLOGIES AND ANALYSIS USEDTransect surveys were used to look for live individuals and for spoor(feces) and by spot observations of identified individuals at fixed sitesin U. ornata habitats in the Eilat Mountains and Mt. Timna NatureReserves in southern Israel. These were evaluated to determine therelative status of the population in multiyear comparisons.
Table: Summary of observations of U. ornata from the Nahal Shlomo Valley (transla-ted by the author from Molco & Ben-David, 2000).
Year Transects Direct observations No ofindividuallyrecognizedindividuals
Hours Days Hours Days
1996 170 106 65 75 901997 250 140 240 135 1501998 160 126 160 126 1601999 110 100 110 100 170Total 690 462 575 436 170
4. EVALUATION OF DATA QUANTITY AND QUALITY FOR THE ASSESSMENTThe quality of the data was deemed excellent as the observer was very expe-rienced.
5. MAIN PROBLEMS, CHALLENGES OR DIFFICULTIES FOUNDON THE ELABORATION OF NDFAs was the case with U. aegyptia, there were no reliable demographicdata available, so determination of the population's state had to bemade using other parameters.
Because the population in Israel is connected with the populationin eastern Sinai, the decline in the eastern Sinai population that wasobserved there, may affect the population in the nearby EilatMountains.
6. RECOMMENDATIONSA NDF could not be made, and no collection has been authorized.
The INPA needs to publish the survey data. In addition, surveymethods need to be improved so that better population assessmentcan be made in other regions. Repeat surveys of the population needto be done every few years for making multi-year comparisons onpopulation trends.
WG 7 – CASE STUDY 5– p.20
REFERENCESARBEL A. (1984). Vol. 5: Reptiles and Amphibians. In: Alon A. (ed.) Plants and Animals of the
Land of Israel: An Illustrated Encyclopedia. Ministry of Defence & the Society forProtection of Nature in Israel [in Hebrew].
BOUSKILA, A.(1983). The burrows of the dabb-lizard Uromastyx aegyptius. Israel Journal ofZoology 32:151-152.
BOUSKILA A.(1984). Habitat selection, in particular burrow location, in the dabb-lizardUromastyx aegyptius, near Hazeva. M.Sc. Thesis, Hebrew University of Jerusalem [inHebrew].
BOUSKILA A.(1986). Habitat selection in the desert lizard Uromastyx aegyptius and its rela-tion to the autecological hypothesis, pp. 119-128 in: Z. Dubinsky and Y. Steinberger(eds.), Environmental Quality and Ecosystem Stability, Volume III A/B, Bar-Ilan UniversityPress, Ramat-Gan, Israel.
BOUSKILA A.(1987). Feeding in the herbivorous lizard Uromastyx aegyptius near Hazeva.Israel Journal of Zoology 33:122.
BOUSKILA A. & P. Amitai (2001). Handbook of Amphibians & Reptiles of Israel. KeterPublishing, Jerusalem, Israel [in Hebrew].
BOUSKILA A. & D. Molco (2002). Status of Spiny-tailed lizards (Uromastyx spp.) in Israel.Unpublished report for the Israel Nature and Parks Authority.
CITES (2008). Export quotas for specimens of species included in the CITES Appendices for2008 (Last updated 16/09/08). Downloaded from the CITES website (www.cites.org).
DOLEV, A. & A. Perevelotsky (2004). The Red Book of Vertebrate Species in Israel. IsraelNature and Parks Authority and the Society for the Protection of Nature in Israel,Jerusalem.
FOLEY W. J., A. Bouskila, A. Shkolnik & I. Choshniak (1992). Microbial digestion in the her-bivorous lizard Uromastyx aegyptius (Agamidae). Journal of Zoology 226: 387-398.
FRANKE J. & Telecky T.M. (2001). Reptiles as Pets: An Examination of the Trade in LiveReptiles in the United States. Humane Society of the United States, Washington, DC.
GOTTLEIB, A. & E. Vidan (2007). Survey of Egyptian mastigure burrows in the Arava regionin regards to edge effects of agriculture on the population. Unpublished report of theIsrael Nature and Parks Authority [in Hebrew].
HAWLENA, D. (2000). Status of U. aegyptius burrows near Hazeva in the northern AravaValley. Unpublished report of the Israel Nature and Parks Authority [in Hebrew].
HIGHFIELD, A.C. & T. Slimani (1998). The Spiny-Tailed Lizard at home – Uromastyx acanthi-nurus in southern Morocco. Reptiles Magazine, 6&7.
IUCN (2007). Red List of Endangered Species (accessed on the internet on 14 September2008).
IUCN (in prep.). Global Reptile Assessment species accounts.KNAPP, A. (2004). An Assessment of the International Trade in Spiny-Tailed Lizards
Uromastyx with a Focus on the Role of the European Union. TRAFFIC – Europe. LEADER, N. & A. Boldo (2008). Damage to Nature Caused by Poaching by Thai Workers: Data
from Thai Trap Surveys for the Years 2002-2007. Unpublished report of the Israel Natureand Parks Authority [in Hebrew].
MENDELSSOHN, H. & A. Bouskila. (1989). Comparative ecology of Uromastyx aegyptius andUromastyx ornatus in Southern Israel and Southern Sinai. First World Congress ofHerpetology, Univ. of Kent, Canterbury, UK. [Abstract].
MILNER-GULLAND, E.J. & H. R. Akcakaya (2001). Sustainability indices for exploited popula-tions under uncertainty. Trends in Ecology and Evolution 16: 686-692.
WG 7 – CASE STUDY 5 – p.21

MOLCO, D. & Ben-David, O. (2000). The ecology and biology of Uromastyx ornatus, sum-ming-up 4 years of observations (1996 - 1999). Unpublished report of the Israel Natureand Parks Authority [in Hebrew].
MORAN, S. & Keidar, H. (1993). Checklist of vertebrate damage to agriculture in Israel. CropProtection 12:173-182.
NEMTZOV, S.C. 2002. Management of wildlife-human conflicts in Israel: a wide variety ofvertebrate pest problems in a difficult and compact environment. Pp. 348-353 in: R.M.Timm & R.H. Schmidt, eds., Proceedings of the 20th Vertebrate Pest Conference,University of California: Davis.
NEMTZOV, S.C. (2007). Status of Poaching by Workers from Thailand. [in Hebrew].ROBINSON, M.D. (1995). Food plants and energetics of the herbivorous lizard, Uromastyx
aegyptius microlepis, in Kuwait. Journal of the University of Kuwait (Science) 22: 255-261.
ROSSER, A.R. & Haywood, M.J. (Compilers). (2002). Guidance for CITES Scientific Authorities:Checklist to assist in making non-detriment findings for Appendix II exports. IUCN,Gland, Switzerland and Cambridge, UK.
SCHLAEPFER, M.A., C. Hoover & C.K. Dodd Jr. (2005). Challenges in Evaluating the Impact ofthe Trade in Amphibians and Reptiles on Wild Populations. Bioscience 55: 256-264.
WALLS, J.G. (1996). Uromastyx and Butterfly Agamids. TFH Publications.WILMS, T. (2001). Dornschwanzagamen: Lebensweise, Pflege und Zucht. Herpeton, Verlag
Elke Köhler, Offenbach.YOM-TOV, Y. (2003). Poaching of Israeli wildlife by guest workers. Biological Conservation
110: 11–20.ZUG, G.R. (1993). Herpetology: An Introductory Biology of Amphibians and Reptiles.
Academic Press Inc, San Diego, California.
WG 7 – CASE STUDY 5– p.22
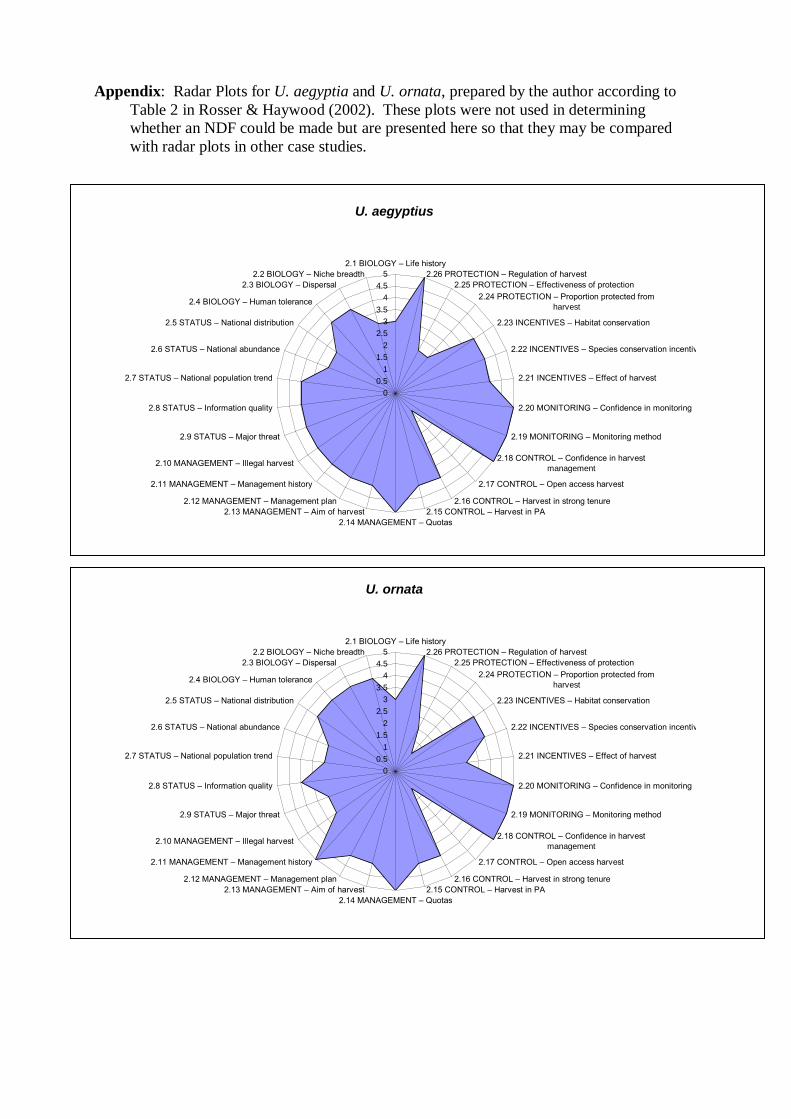
Appendix: Radar Plots for U. aegyptia and U. ornata, prepared by the author according to
Table 2 in Rosser & Haywood (2002). These plots were not used in determining
whether an NDF could be made but are presented here so that they may be compared
with radar plots in other case studies.
U. aegyptius
0
0.5
1
1.5
2
2.5
3
3.5
4
4.5
5
2.1 BIOLOGY – Life history
2.2 BIOLOGY – Niche breadth
2.3 BIOLOGY – Dispersal
2.4 BIOLOGY – Human tolerance
2.5 STATUS – National distribution
2.6 STATUS – National abundance
2.7 STATUS – National population trend
2.8 STATUS – Information quality
2.9 STATUS – Major threat
2.10 MANAGEMENT – Illegal harvest
2.11 MANAGEMENT – Management history
2.12 MANAGEMENT – Management plan
2.13 MANAGEMENT – Aim of harvest
2.14 MANAGEMENT – Quotas
2.15 CONTROL – Harvest in PA
2.16 CONTROL – Harvest in strong tenure
2.17 CONTROL – Open access harvest
2.18 CONTROL – Confidence in harvest
management
2.19 MONITORING – Monitoring method
2.20 MONITORING – Confidence in monitoring
2.21 INCENTIVES – Effect of harvest
2.22 INCENTIVES – Species conservation incentive
2.23 INCENTIVES – Habitat conservation
2.24 PROTECTION – Proportion protected from
harvest
2.25 PROTECTION – Effectiveness of protection
2.26 PROTECTION – Regulation of harvest
U. ornata
0
0.5
1
1.5
2
2.5
3
3.5
4
4.5
5
2.1 BIOLOGY – Life history
2.2 BIOLOGY – Niche breadth
2.3 BIOLOGY – Dispersal
2.4 BIOLOGY – Human tolerance
2.5 STATUS – National distribution
2.6 STATUS – National abundance
2.7 STATUS – National population trend
2.8 STATUS – Information quality
2.9 STATUS – Major threat
2.10 MANAGEMENT – Illegal harvest
2.11 MANAGEMENT – Management history
2.12 MANAGEMENT – Management plan
2.13 MANAGEMENT – Aim of harvest
2.14 MANAGEMENT – Quotas
2.15 CONTROL – Harvest in PA
2.16 CONTROL – Harvest in strong tenure
2.17 CONTROL – Open access harvest
2.18 CONTROL – Confidence in harvest
management
2.19 MONITORING – Monitoring method
2.20 MONITORING – Confidence in monitoring
2.21 INCENTIVES – Effect of harvest
2.22 INCENTIVES – Species conservation incentive
2.23 INCENTIVES – Habitat conservation
2.24 PROTECTION – Proportion protected from
harvest
2.25 PROTECTION – Effectiveness of protection
2.26 PROTECTION – Regulation of harvest

Uromastyx lizards in
Israel
Dr. Simon NemtzovWildlife Ecologist and
Scientific Authority
Israel Nature & Parks Authority
Jerusalem, Israel

AFRICA
EUROPEASIA
Where is Israel?

Israel
Size: ~20,000 km² (smaller than the Netherlands)
Population: < 7 million
At the intersection of 3 continents (diverse
ecotones)
Strict laws for wildlife protection
Very low hunting pressure
Sea of Galilee - Lake Kinneret
An extremely rich diversity of rich populations of wild fauna and flora

Biogeography
of Israel
Southern half: mostly
desert
Northern half: forests
Center: narrow transition
zone with many cities
100 km

Wildlife biodiversity in Israel 16 species of Carnivores:
Striped hyena (Hyena hyena)
5 species of canids: wolf (Canis lupus), 3 foxes, golden jackal (C. aureus)
5 sp. of mustelids: 2 badgers, beech marten, marbled polecat, otter (Lutra lutra)
Egyptian mongoose (Herpestes ichneumon)
4 species of felids

Wildlife biodiversity in Israel 16 species of Carnivores
4 species of felids:
Leopard (Panthera pardus)
Caracal (Felis caracal)
Wild cat (Felis silvestris)Jungle cat (Felis chaus)
(Sand cat (Felis margarita))

Garrulus glandarius
Corvus monedula
Pyrrhocorax graculus
Corvus frugilegus
Corvus corone
Corvus corax
Corvus ruficollis
Corvus splendens
Israel biodiversity
for example, 8 species of corvids

Israel’s Wildlife Trade Policy
1. Protect native wildlife
─ no invasive species allowed
─ limited exploitation of native species
2. Contribute to protection of wildlife
overseas
– import only captive-bred individuals
– no import from range states
– no trade in endangered species (those
designated by IUCN as Endangered or
Vulnerable)
White oryx reintroduced
in Israel

Uromastyx
English names: mastigure, spiny-tailed lizard, dhabb lizard, uro
Taxonomy: Fam. Agamidae
CITES standard ref.: Wilms (2001) – 16 species
CITES App. II since 1977
IUCN Red List: Only 1 sp. EN
GRA not complete

Species of Uromastyx in Israel
U. aegyptia - Egyptian mastigure
– Largest species in the genus (~ 75 cm)
– Distribution from Libya to Oman
– Lives in dry wadis and alluvial plains
– Important physical ecosystem engineer

Species of Uromastyx in Israel
U. ornata - Ornate mastigure
– Much smaller than U. aegyptia (~40 cm)
– Distribution: Egypt, Israel, Saudi Arabia
– Lives on rocky slopes in extreme desert
with < 20 mm rainfall
– Most active in > 40 C


ThreatsU. aegyptia
Loss of habitat: Desert converted to
intense low-water-use agriculture
Poaching by Thai farm workers

Threats
U. ornata
Small range (~ 270 km²)
Very small population (~200 individ’s)
Off-road vehicles 4X4 and ATV

NDF – U. aegyptia
Comparative surveys in Arava Valley:
1984, 2000 (2007)
Methods:
– Determine population density
– Aerial photographs of burrows
– Ground-truthing of activity using transects
– Multi-year comparisons
– No demography
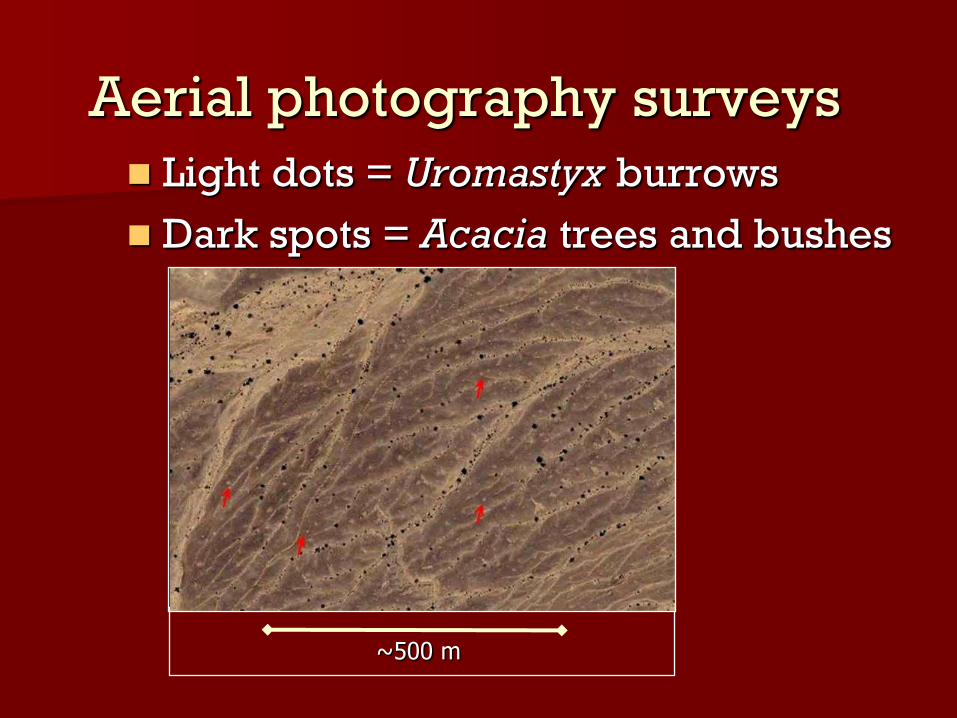
Aerial photography surveys
Light dots = Uromastyx burrows
Dark spots = Acacia trees and bushes
~500 m

Nature
Reserve
boundary
Highway
Nature
Reserve
boundary
Agricultural
area
Multi-year comparisons

Multi-year comparisons
0
10
20
30
40
50
60
70
80
90
1984 2000 2007
Pe
rce
nt
Percent of burrows that are active
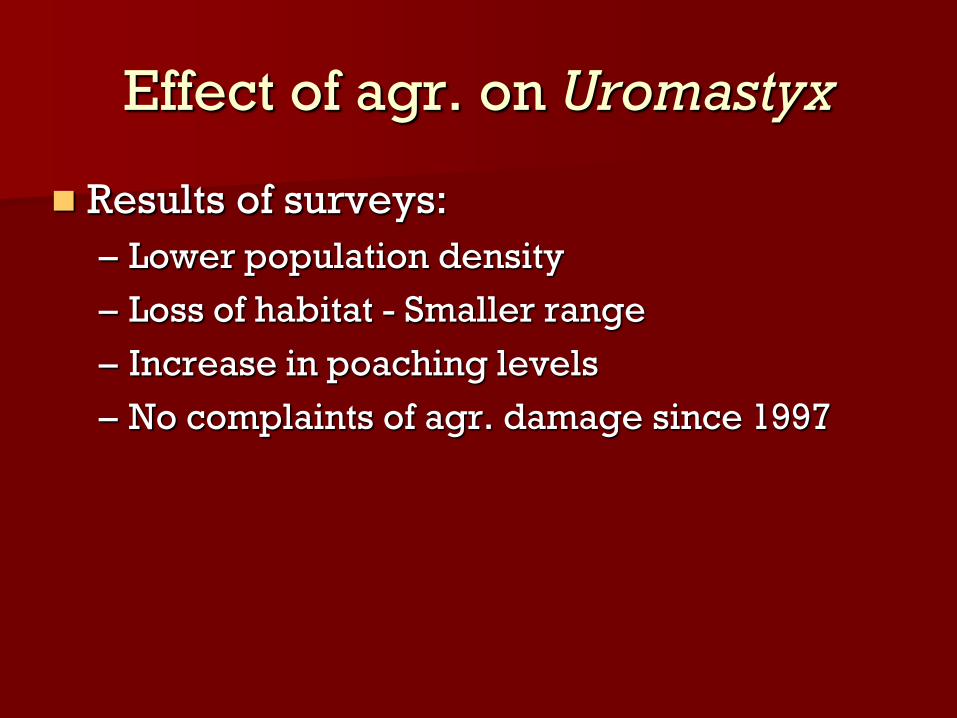
Effect of agr. on Uromastyx
Results of surveys:
– Lower population density
– Loss of habitat - Smaller range
– Increase in poaching levels
– No complaints of agr. damage since 1997

NDF – U. aegyptia
Population is not increasing or stable,
but is shrinking
Further losses expected
No safe level of exploitation could be
assessed
U. ornata
Total population ~ 200 individuals
In 2000: Stable but small pop.
No NDF possible
Since 2000, population has shrunk even
more, due to severe drought and
diminished food sources

Conclusions
No demographic data, or population
modeling of harvest, or estimate of MSY.
Non-scientific determination showed that
the populations were “in trouble”
Final ruling based on precautionary
principle in keeping with wildlife
conservation policy.

WG 7 – Case Study 6 – p.1
NDF WORKSHOP CASE STUDIES WG 7 – Reptiles and Amphibians
CASE STUDY 6 Cuora amboinensis
Country – MALAYSIA Original Language – English
THE SOUTHEAST ASIAN BOX TURTLE CUORA AMBOINENSIS (DAUDIN, 1802) IN MALAYSIA
AUTHOR: Sabine Schoppe* *TRAFFIC Southeast Asia, Kuala Lumpur, Malaysia.
I. BACKGROUND INFORMATION ON THE TAXON
1. BIOLOGICAL DATA
1.1. Scientific and common names: Southeast Asian Box Turtle Cuora amboinensis (Daudin, 1802) Wallacean Box Turtle C. a. amboinensis (Daudin, 1802) Malayan Box Turtle C. a. kamaroma (Rummler and Fritz, 1991) Indonesian Box Turtle C. a. couro (Schweigger, 1812) Burmese Box Turtle C. a. lineata (McCord and Philippen, 1998) In Malay the species is called Kura Katap, Kura Kura, or Kura kura patah.
1.2. Distribution.
From northeastern India and Bangladesh through southeastern Asia to the Malay Peninsula; on the Nicobar Islands (India); Borneo, Sumatra, Java, Sumbawa and small satellite islands thereof, the Moluccas, and Sulawesi (Indonesia); and the Philippines (Fritz and Havas, 2007). Four subspecies are currently recognized (Rummler and Fritz, 1991; McCord and Philippen, 1998): the Wallacean Box Turtle Cuora amboinensis amboinensis (Daudin, 1802) often referred to as East Indian Box Turtle; the Malayan Box Turtle C. a. kamaroma (Rummler and Fritz 1991); the Indonesian Box Turtle C. a. couro (Schweigger, 1812); and the Burmese Box Turtle C. a. lineata (McCord and Philippen, 1998). The Malayan Box Turtle Cuora a. kamaroma occurs from northeastern India and Bangladesh, through southeastern Asia to the Malay Peninsula; on the Nicobar Islands; Borneo; and Sulu Archipelago and perhaps the Palawan Island group (Philippines) (Fritz and Havas, 2007). This is the only subspecies that occurs in Malaysia. (Figure 1).

WG 7 – Case Study 6 – p.2
Figure 1: Distribution of Cuora amboinensis.
Generally, the species is widely distributed in lowland freshwater habitats from sea level to about 500 m above sea level.
1.3. Biological characteristics 1.3.1. General biological and life history characteristics of the species
• Sex ratio: 1:1 or slightly in favour of females (Schoppe, in press;
Schoppe, in prep.). Males are generally slightly smaller and lighter than females (Rummler and Fritz, 1991; Schoppe, in press; Schoppe, in prep.).
• Low reproductive rate. Mean of 15 months to reach subadulthood. Maturity in captivity might be reached after four years and five months, and in the wild probably after five-and-a-half to six years (Schoppe, in press).
• Mean of three clutches with two eggs each, per year, resulting in a total of six eggs per female, per year (Schoppe, in press).
• Incubation period is 67–77 days in the wild and 76–77 days in captivity (Whitaker and Andrews, 1997). At 25–30°C, Lim and Das (1999) recorded incubation periods of 70–100 days. In captivity under outdoor conditions (26–30°C) without artificial incubation, a range of 60–120 days (n=22, mean 88.8±12.5) was encountered; a prolonged incubation seems to be related to unsuitable weather conditions (S. Schoppe, unpubl. data).
• Hatching success is about 50% in captivity under outdoor conditions (S. Schoppe, unpubl. data).
• Survival rate of eggs and hatchlings in the wild is not known. [For the North American Painted Turtle Chrysemys picta, which has a similar life

WG 7 – Case Study 6 – p.3
history, 92% (Wilbur, 1975) and 54% mortality (Mitchell, 1988) were recorded.]
• Life expectancy is 25–30 years; a maximum age of 38.2 years was recorded for an animal in captivity (Bowler, 1977).
• Generation time can be approximated by taking the median or mid-point between age at maturity and age at mortality. Accordingly, generation time of the Southeast Asian Box Turtle is approximately 18 years (Schoppe, in press).
• Individuals of Cuora amboinensis may wander substantial distances over the course of a lifetime, but the species does not migrate seasonally or to any geographically significant extent.
• Habitat generalist, adaptable to human-modified habitats, tolerant (Moll, 1997; Schoppe, in press).
1.3.2. Habitat types
The species is semi-aquatic and inhabits various natural and man-made wetland habitats with soft substrates and slow or no current (Ernst et al., 2000). • Natural habitats: swamp and peat swamp forests, Melaleuca swamps,
marshes, permanent or temporary wetlands, and shallow lakes. • Human-modified habitats: flooded rice fields, oil palm and rubber
plantations that are either partly flooded or that have an extensive drainage system as well as in irrigation ditches, canals, orchards, vegetated drainage systems, ponds and pools near houses.
1.3.3. Role of the species in its ecosystem
• Omnivorous but primarily vegetarian diet (Rogner, 1996). Forages on aquatic plants, aquatic insects, molluscs and crustaceans in the water and on plants, fungi, and worms on land (Lim and Das, 1999). Predator of various invertebrates. Might help to stem occurrence of invertebrate-borne diseases (van Dijk, 2000).
• Eggs as well as a significant proportion of hatchlings are an important source of food for monitor lizards, crocodiles, herons and other wetland/riverine birds, and small mammalian predators, such as civets (Moll and Moll, 2004).
• Seed disperser of at least five important trees, e.g. fig trees Ficus spp. and Indian Mulberry Morinda citrifolia, are consumed (P. Widmann, Scientific Consultant, Katala Foundation Inc., Palawan, Philippines, in litt. to S. Schoppe, 18 Aug. 2006).
1.4. Population
1.4.1. Global Population size
Within its global range, no quantitative information on the abundance of Southeast Asian Box Turtle population is available.
1.4.2. Current global population trends
___increasing _x_ decreasing (IUCN, 2008) ____stable ___unknown
1.5. Conservation status
1.5.1. Global conservation status (according to IUCN, 2008)

WG 7 – Case Study 6 – p.4
___Critically endangered ___Endangered _x__Vulnerable
___Near Threatened ___Least concern ___ Data deficient
• Vulnerable since 2000 (Hilton-Taylor, 2000): A1d+2d of version 2.3 (IUCN, 2008): “a taxon is classified Vulnerable when it is not Critically Endangered or Endangered but is facing a high risk of extinction in the wild in the medium-term future, as defined by an observed, estimated, inferred or suspected reduction of at least 20% over the last 10 years or three generations, whichever is the longer, based on actual or potential levels of exploitation” (A1d) and because “a reduction of at least 20%, is projected or suspected to be met within the next 10 years or three generations, whichever is the longer, based on actual or potential levels of exploitation” (A2d).
• Previously assessed as Lower Risk: Near Threatened (Baillie and Groombridge, 1996)
1.5.2. National conservation status for Malaysia, the case study country
• The most common turtle in the wild and in markets in Borneo and in Peninsular Malaysia (Lim and Das, 1999).
• Abundant in States that still have swamps and man-made wetlands (Sharma and Tisen, 2000).
• Reduced in multiple locations (Sharma, 1999; Sharma and Tisen, 2000) • Common and vulnerable in Selangor (Azrina and Lim, 1999). • Vulnerable (Asian Turtle Working Group, 2000; IUCN, 2008). • Reduced and still decreasing (Schoppe, 2007). • Extremely vulnerable to over-exploitation owing to lack of specific
legislation regulating exploitation (Jenkins, 1995; Gregory and Sharma, 1997; Azrina and Lim, 1999; Sharma, 1999; Shepherd et al., 2004).
1.5.3. Main threats within the case study country
___No threats __x_Habitat loss/degradation (human-induced) ___Invasive alien species (directly affecting the species) __x_Harvesting [hunting/gathering] ___Accidental mortality (e.g. by-catch) ___Persecution (e.g. pest control) __x_Pollution (affecting habitat and/or species) ___Other_______________ ___Unknown Over-exploitation and pollution of water ways (Lim and Das, 1999). Over-exploitation for local use and international trade, and the continuous clearing of Melaleuca swamps on the east coast to give way for costal development projects (Sharma and Tisen, 2000).
2. SPECIES MANAGEMENT WITHIN THE COUNTRY FOR WHICH CASE STUDY
IS BEING PRESENTED
2.1. Management measures
2.1.1. Management history • Unregulated international trade before 2000. • Listed in CITES Appendix II in 2000.

WG 7 – Case Study 6 – p.5
• Quota-regulated, 2000–2004 (see 2.1.2). • Unregulated harvest for local use and trade in Peninsular Malaysia
(Schoppe, in press). In Sabah and Sarawak, collection for local use requires permits.
2.1.2. Purpose of the management plan in place Population management and sustainable use before trade ban.
2.1.3. General elements of the management plan Quota system to regulate harvest for international trade from 2000 to 2004. The basis for the establishment of export quotas was the realized export of the previous year and observed stocks in collection centres (Anon., 2003). A harvest ban was declared in 2004 and an export ban in 2005.
2.1.4. Restoration or alleviation measures When the Malaysian CITES Management Authority (MA) suspended harvest for export in 2004, it urged traders to set up breeding operations and to replace wild-caught supply (Anon., 2004). Considering, however, the life history of the Southeast Asian Box Turtle, the species does not meet the qualifications needed for breeding wildlife for commercial trade that were set by the MA (PERHILITAN, 1992). Captive breeding of the Southeast Asian Box Turtle for commercial purposes is at present not economically feasible (Schoppe, in press).
2.2. Monitoring system
2.2.1. Methods used to monitor harvest
National monitoring of exports based on export permits issued (Schoppe, 2007).
2.2.2. Confidence in the use of monitoring Low (Schoppe, 2007).
2.3. Legal framework and law enforcement
Management of freshwater turtles and tortoises for local use is the responsibility of the State and without State regulations the federal government has no jurisdiction over the turtles. None of the 11 Malaysian States regulates in any way the exploitation of the Southeast Asian Box Turtle (Gregory and Sharma, 1997; Sharma and Tisen, 2000). Export became regulated with the listing of the species in CITES Appendix II in 2000. Peninsular Malaysia has no specific CITES implementation legislation, but an amendment of the Protection of Wildlife Act 1972 in 1991 added CITES Appendix I, II and III animals to the schedules of protected animals whose export should be regulated (Anon., 1991). The Wildlife Conservation Enactment 1997 in Sabah (Anon., 1997) and the Wildlife Protection Ordinance 1998 in Sarawak (Anon., 1998) on the other hand include Appendix II-listed species like the Southeast Asian Box Turtle under their respective schedules of protected species and therewith disallow hunting, killing and trading without a licence.
3. UTILIZATION AND TRADE FOR RANGE STATE FOR WHICH CASE STUDY IS
BEING PRESENTED

WG 7 – Case Study 6 – p.6
3.1. Type of use (origin) and destinations (purposes). • Origin of specimens: all are wild-caught. Captive breeding has not
been established. • Type of local use: human food, traditional Chinese medicine (TCM) and
merit release. In TCM, the heads, as well as the shells, are used as a tonic after childbirth. Flesh is believed to cure nocturnal urination in bed by children. Eating the flesh or using the flesh and/or parts of the dry plastron (rarely the carapace) is believed to cure asthma and cancer. Merit release is a tradition of releasing one or several turtles to a temple or to the wild, believing that this will bring long life to the person releasing. Use is also by zoos, for parks, and as pets (Lim and Das, 1999; Sharma and Tisen, 2000; Schoppe, in press).
• Extent of local use: in Malaysia, the main users are indigenous groups (Orang Asli in Peninsular Malaysia, Bedayuh and Iban in Sarawak), Thai communities along the Malaysian-Thai border, and ethnic Chinese (Schoppe, in press). The first two groups mainly use the species for food consumption while ethnic Chinese use it mainly for merit release. These ethnic groups make together about 35% (11% indigenous and 24% ethnic Chinese) of the Malayan populace of approximately 25 million (CIA, 2007). The species has always been intensively captured for the local meat trade (Sharma and Tisen, 2000). In the 1990s, turtle meat traders in northern Peninsular Malaysia (Kelantan and Perlis) used to buy hundreds of individuals from trappers weekly (Sharma and Tisen, 2000). Trappers could bring in an average of 14 individuals per trapper, per day.
• Destinations, purpose, and extent of international trade: mainly East Asian countries, and to much lesser extent Europe and the USA.
1. As tonic food and TCM (Hong Kong SAR, mainland China, Singapore, Viet Nam, Taiwan POC) (Lim and Das, 1999; Sharma and Tisen, 2000; Schoppe, in press). Exported turtles may pass through several countries (Thailand, Myanmar, Lao PDR) there are few main final destinations for turtles traded for consumption from Malaysia: China, Hong Kong and Singapore (Schoppe, in press). In the years before the species was listed in Appendix II of CITES, international trade was unregulated and poorly documented. In 1995, Hong Kong reported the import of 25 196 individuals and, from January to August 1996, there are records for 15 818 live turtles from Malaysia (S.K.H. Lee in litt. to German CITES Scientific Authority, 1996). Records from PERHILITAN, the Malaysian MA, indicate that the Southeast Asian Box Turtle contributed 18.49% or 456 541 wild-caught individuals to the total number of freshwater turtles exported, January–October 1999 (Sharma and Tisen, 2000). In September 1999, one exporter in Perak reported buying more than 800 Southeast Asian Box Turtles daily from middlemen for export to Shenzhen, China (Sharma and Tisen, 2000). Exact numbers of exporters are not known for those years, but nine exporters were identified in 2006 when export was banned. CITES annual report data from the UNEP-WCMC CITES Trade Database (2008) have records from importing East Asian (Hong Kong, China and Singapore) countries and territories amounting to 330 099 individuals and 390 kg, 2000–2006 (Table 1).

WG 7 – Case Study 6 – p.7
Table 1: Reported imports of Southeast Asian Box Turtles from Malaysia by Hong Kong, China and Singapore.
Year 2000 2001 2002 2003 2004 2005 2006 Total 2000-06
No. of individuals 40 800 31 900 22 200 127 922 73 308 33 969 0 330 099
Kg 0 0 0 0 0 390 0 390 In 2006, approximately 70-80% of all illegally traded Southeast Asian Box Turtles were exported to China and the remainder to Singapore, but exact volumes are not known (Schoppe, in press).
2. Pet trade to Japan, the USA and Europe. The relative amount that can be inferred to have been traded for the pet industry was 5–10% of the total number of individuals reported as exported from Malaysia in CITES annual report data. A total of 12 785 individuals were reported as imports from Malaysia, 2000–2004, and it appears from CITES annual reports that these countries stopped importing after Malaysia’s export ban (Table 2).
Table 2: Reported imports of Southeast Asian Box Turtles from Malaysia by the USA, Japan and Europe.
Year 2000 2001 2002 2003 2004 2005 2006 Total 2000-06 No. of individuals 3181 4708 2256 1655 985 0 0 12 785
3.2. Harvest: 3.2.1. Harvesting regime
All extractive, year-around, disregarding size but larger (adult) individuals are preferred for the consumption / TCM trade (Schoppe, in press). Animals are either hand captured or collected with baited traps during darkness. Collection is opportunistic, part-time, or full-time, in relation to demand. Collection for export seems to be limited to Peninsular Malaysia, while local use is the driver of harvest in Sabah and Sarawak. Populations in national protected areas are exploited to a lesser extent, but only very few lowland swamp/marsh areas are protected—only 3% of the total protected areas in Malaysia, amounting to 1 563 181 ha, are peat swamp forests (PERHILITAN, 1992).
3.2.2. Harvest management/ control From 1998 to 2002 export of Appendix II-listed turtle species had been regulated through national export quotas, which were replaced by administrative quotas in 2003 (Anon., 2004). Export quotas are ones that are communicated to the CITES Secretariat and are binding for export while administrative quotas are PERHILITAN’s internal quotas (L.K. Seong, Assistant Director, Law and Enforcement Division, PERHILITAN, pers. comm. to NDF workshop participants, Kuala Lumpur, 20 August 2007). The export quota for the species was 50 000 in 2001 and 2002, and an administrative quota was set at 15 000 in 2003 (Anon., 2002). In 2004, the administrative quota remained at 15 000 individuals but only wild-caught specimens from existing stocks that had been collected and inventoried in 2003 were allowed to be exported. Harvest from the wild for export was banned in 2004. An export ban (zero quota) has been in place since 2005 (Anon., PERHILITAN, pers. comm. to S. Schoppe, 17 July 2006). According to the
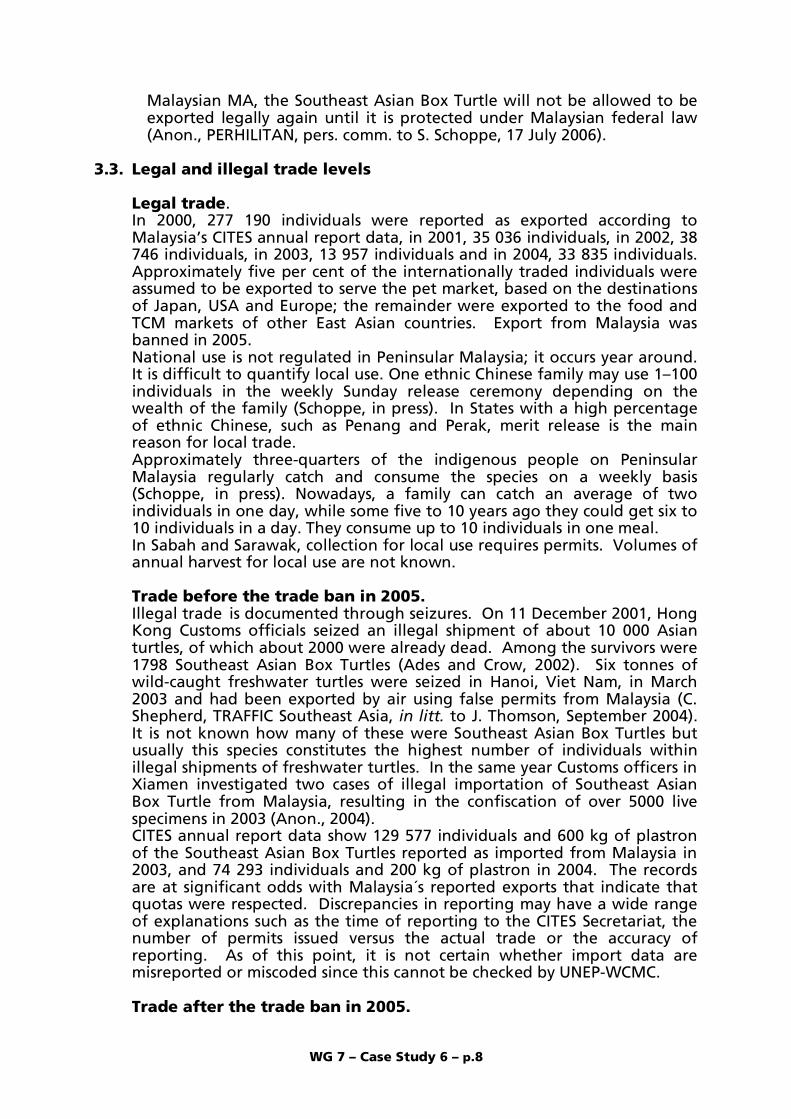
WG 7 – Case Study 6 – p.8
Malaysian MA, the Southeast Asian Box Turtle will not be allowed to be exported legally again until it is protected under Malaysian federal law (Anon., PERHILITAN, pers. comm. to S. Schoppe, 17 July 2006).
3.3. Legal and illegal trade levels Legal trade. In 2000, 277 190 individuals were reported as exported according to Malaysia’s CITES annual report data, in 2001, 35 036 individuals, in 2002, 38 746 individuals, in 2003, 13 957 individuals and in 2004, 33 835 individuals. Approximately five per cent of the internationally traded individuals were assumed to be exported to serve the pet market, based on the destinations of Japan, USA and Europe; the remainder were exported to the food and TCM markets of other East Asian countries. Export from Malaysia was banned in 2005. National use is not regulated in Peninsular Malaysia; it occurs year around. It is difficult to quantify local use. One ethnic Chinese family may use 1–100 individuals in the weekly Sunday release ceremony depending on the wealth of the family (Schoppe, in press). In States with a high percentage of ethnic Chinese, such as Penang and Perak, merit release is the main reason for local trade. Approximately three-quarters of the indigenous people on Peninsular Malaysia regularly catch and consume the species on a weekly basis (Schoppe, in press). Nowadays, a family can catch an average of two individuals in one day, while some five to 10 years ago they could get six to 10 individuals in a day. They consume up to 10 individuals in one meal. In Sabah and Sarawak, collection for local use requires permits. Volumes of annual harvest for local use are not known. Trade before the trade ban in 2005. Illegal trade is documented through seizures. On 11 December 2001, Hong Kong Customs officials seized an illegal shipment of about 10 000 Asian turtles, of which about 2000 were already dead. Among the survivors were 1798 Southeast Asian Box Turtles (Ades and Crow, 2002). Six tonnes of wild-caught freshwater turtles were seized in Hanoi, Viet Nam, in March 2003 and had been exported by air using false permits from Malaysia (C. Shepherd, TRAFFIC Southeast Asia, in litt. to J. Thomson, September 2004). It is not known how many of these were Southeast Asian Box Turtles but usually this species constitutes the highest number of individuals within illegal shipments of freshwater turtles. In the same year Customs officers in Xiamen investigated two cases of illegal importation of Southeast Asian Box Turtle from Malaysia, resulting in the confiscation of over 5000 live specimens in 2003 (Anon., 2004). CITES annual report data show 129 577 individuals and 600 kg of plastron of the Southeast Asian Box Turtles reported as imported from Malaysia in 2003, and 74 293 individuals and 200 kg of plastron in 2004. The records are at significant odds with Malaysia´s reported exports that indicate that quotas were respected. Discrepancies in reporting may have a wide range of explanations such as the time of reporting to the CITES Secretariat, the number of permits issued versus the actual trade or the accuracy of reporting. As of this point, it is not certain whether import data are misreported or miscoded since this cannot be checked by UNEP-WCMC. Trade after the trade ban in 2005.

WG 7 – Case Study 6 – p.9
In 2005, no live specimens were exported according to records of the MA in Malaysia and in accordance with the ban on export, but importing countries (China and Singapore) reported the import of 33 969 individuals and 390 kg of plastron from Malaysia. In 2006, suppliers to the export market in Selangor could collect an annual mean of 1823.7 individuals; multiplying with the confirmed number of suppliers in Peninsular Malaysia (=12) arrives at an estimate of 21 884 illegally exported Southeast Asian Box Turtles, by the 12 suppliers, per year (Schoppe, in press). Surveys in Indonesia indicate that among the six main routes for illegal international trade, three go to Malaysia: 1) Medan via Belawan (boat) to Hong Kong and Penang (consumption trade), Tanjung Balai (boat) to Hong Kong, China, and Malaysia (consumption trade); and Pekanbaru (boat) to Malaysia and Singapore (consumption trade) (Schoppe, in prep.). Based on interviews with 18 illegal Indonesian traders, a conservative mean of 19 160 kg or 23 950 individuals1 of Southeast Asian Box Turtles are gathered weekly for the illegal export to Malaysia, China, Hong Kong and Singapore (Schoppe, in prep.). It is not known how many of these go to Malaysia. No trade has been reported between Malaysia and Indonesia within the CITES annual report data. In Sabah and Sarawak the species is commonly encountered as pet and for local consumption, respectively but none of the people keeping or selling or purchasing the species had ever filed a harvest permit (Schoppe, in press).
II. NON DETRIMENT FINDING PROCEDURE (NDFS)
Based on surveys conducted in the main source and trade centres in Malaysia in 2006 (Schoppe, in press), TRAFFIC Southeast Asia proposes the following NDF methodology.
1. IS THE METHODOLOGY USED BASED ON THE IUCN CHECKLIST FOR NDFS?
_partly_yes ___no After extensive fieldwork in 2006, TRAFFIC Southeast Asia used the risk assessment checklist and came up with a radar graph (Schoppe, 2007) (Figure 2). The high number of outlying points in the radar graph can be interpreted as low confidence in the probability that the harvest in sustainable.
1 Based on an average weight of 800g per individual.
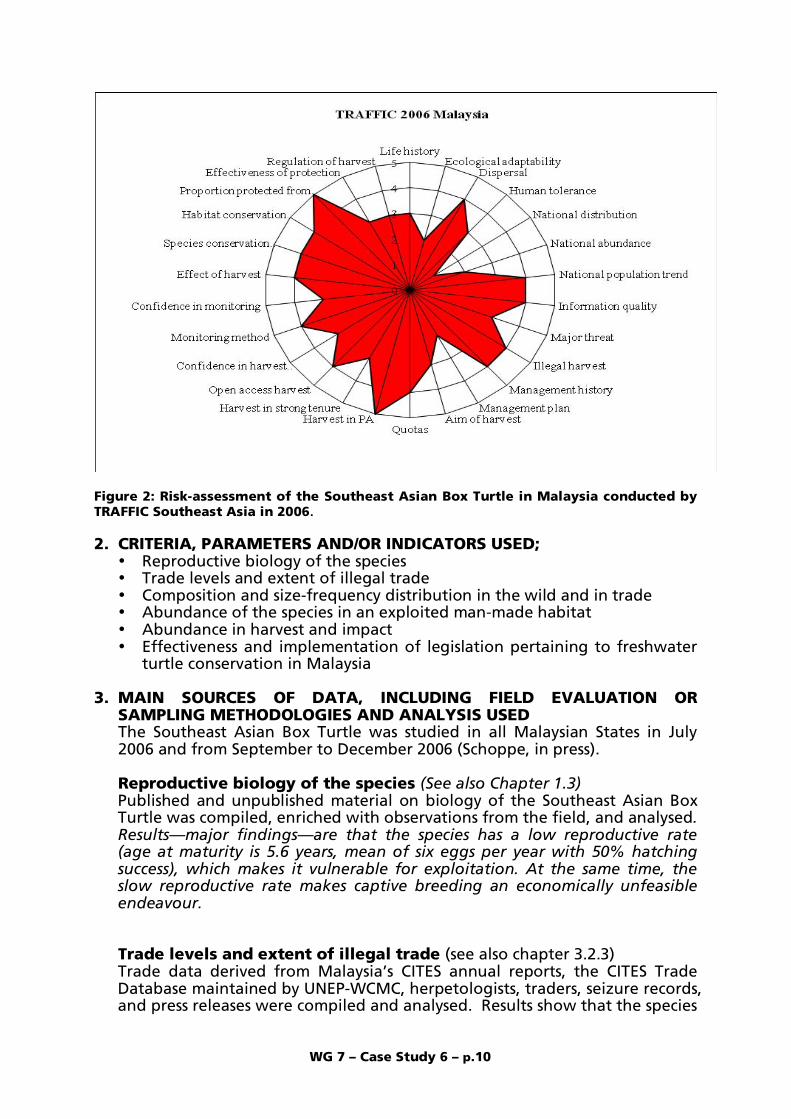
WG 7 – Case Study 6 – p.10
Figure 2: Risk-assessment of the Southeast Asian Box Turtle in Malaysia conducted by TRAFFIC Southeast Asia in 2006. 2. CRITERIA, PARAMETERS AND/OR INDICATORS USED;
• Reproductive biology of the species • Trade levels and extent of illegal trade • Composition and size-frequency distribution in the wild and in trade • Abundance of the species in an exploited man-made habitat • Abundance in harvest and impact • Effectiveness and implementation of legislation pertaining to freshwater
turtle conservation in Malaysia 3. MAIN SOURCES OF DATA, INCLUDING FIELD EVALUATION OR
SAMPLING METHODOLOGIES AND ANALYSIS USED The Southeast Asian Box Turtle was studied in all Malaysian States in July 2006 and from September to December 2006 (Schoppe, in press). Reproductive biology of the species (See also Chapter 1.3) Published and unpublished material on biology of the Southeast Asian Box Turtle was compiled, enriched with observations from the field, and analysed. Results—major findings—are that the species has a low reproductive rate (age at maturity is 5.6 years, mean of six eggs per year with 50% hatching success), which makes it vulnerable for exploitation. At the same time, the slow reproductive rate makes captive breeding an economically unfeasible endeavour. Trade levels and extent of illegal trade (see also chapter 3.2.3) Trade data derived from Malaysia’s CITES annual reports, the CITES Trade Database maintained by UNEP-WCMC, herpetologists, traders, seizure records, and press releases were compiled and analysed. Results show that the species
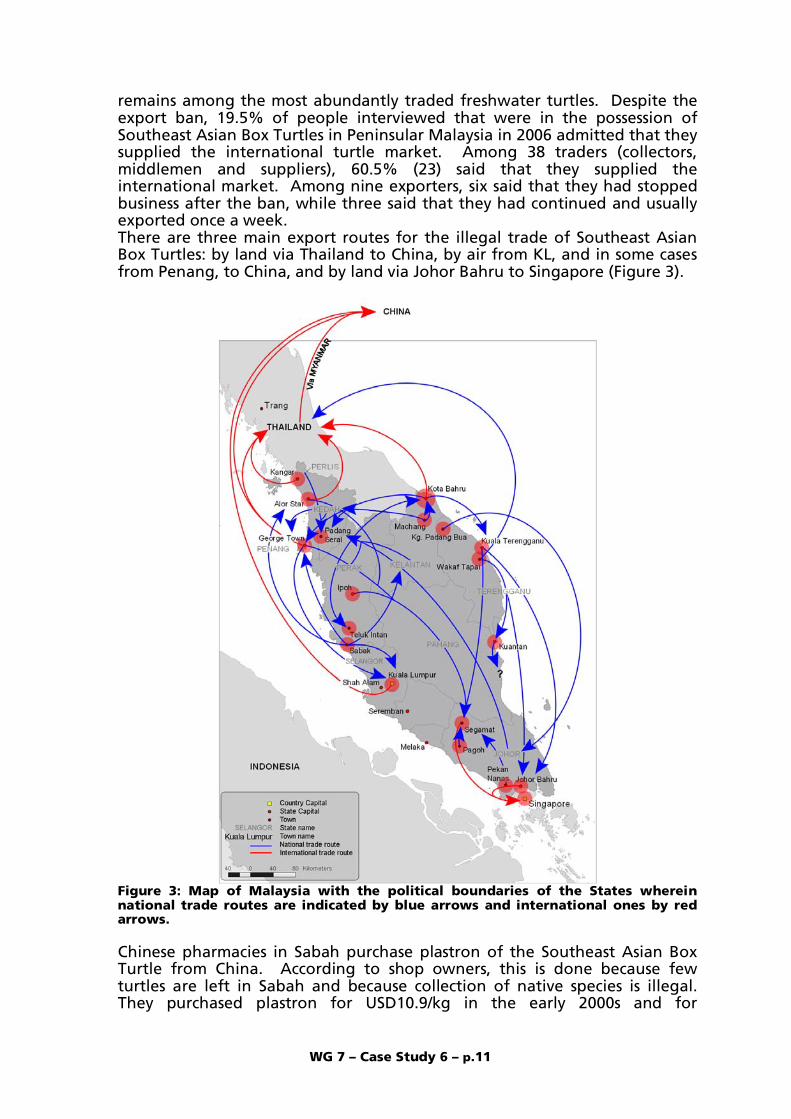
WG 7 – Case Study 6 – p.11
remains among the most abundantly traded freshwater turtles. Despite the export ban, 19.5% of people interviewed that were in the possession of Southeast Asian Box Turtles in Peninsular Malaysia in 2006 admitted that they supplied the international turtle market. Among 38 traders (collectors, middlemen and suppliers), 60.5% (23) said that they supplied the international market. Among nine exporters, six said that they had stopped business after the ban, while three said that they had continued and usually exported once a week. There are three main export routes for the illegal trade of Southeast Asian Box Turtles: by land via Thailand to China, by air from KL, and in some cases from Penang, to China, and by land via Johor Bahru to Singapore (Figure 3).
Figure 3: Map of Malaysia with the political boundaries of the States wherein national trade routes are indicated by blue arrows and international ones by red arrows. Chinese pharmacies in Sabah purchase plastron of the Southeast Asian Box Turtle from China. According to shop owners, this is done because few turtles are left in Sabah and because collection of native species is illegal. They purchased plastron for USD10.9/kg in the early 2000s and for
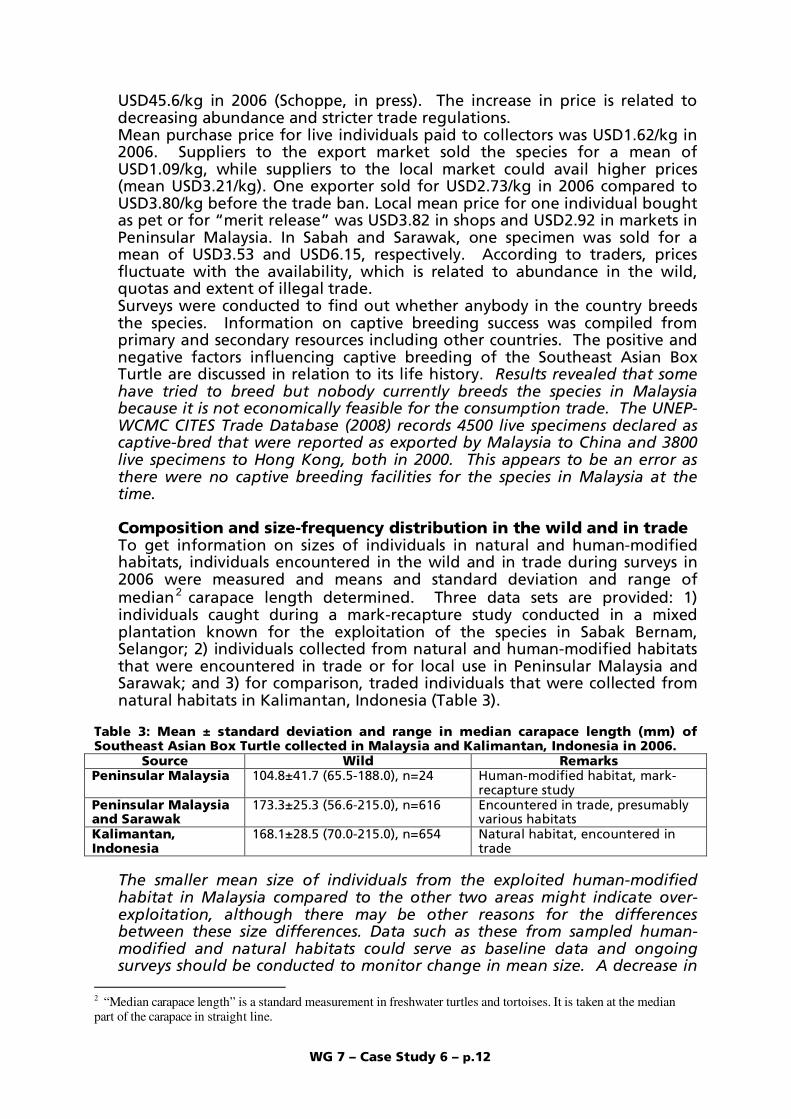
WG 7 – Case Study 6 – p.12
USD45.6/kg in 2006 (Schoppe, in press). The increase in price is related to decreasing abundance and stricter trade regulations. Mean purchase price for live individuals paid to collectors was USD1.62/kg in 2006. Suppliers to the export market sold the species for a mean of USD1.09/kg, while suppliers to the local market could avail higher prices (mean USD3.21/kg). One exporter sold for USD2.73/kg in 2006 compared to USD3.80/kg before the trade ban. Local mean price for one individual bought as pet or for “merit release” was USD3.82 in shops and USD2.92 in markets in Peninsular Malaysia. In Sabah and Sarawak, one specimen was sold for a mean of USD3.53 and USD6.15, respectively. According to traders, prices fluctuate with the availability, which is related to abundance in the wild, quotas and extent of illegal trade. Surveys were conducted to find out whether anybody in the country breeds the species. Information on captive breeding success was compiled from primary and secondary resources including other countries. The positive and negative factors influencing captive breeding of the Southeast Asian Box Turtle are discussed in relation to its life history. Results revealed that some have tried to breed but nobody currently breeds the species in Malaysia because it is not economically feasible for the consumption trade. The UNEP-WCMC CITES Trade Database (2008) records 4500 live specimens declared as captive-bred that were reported as exported by Malaysia to China and 3800 live specimens to Hong Kong, both in 2000. This appears to be an error as there were no captive breeding facilities for the species in Malaysia at the time. Composition and size-frequency distribution in the wild and in trade To get information on sizes of individuals in natural and human-modified habitats, individuals encountered in the wild and in trade during surveys in 2006 were measured and means and standard deviation and range of median2 carapace length determined. Three data sets are provided: 1) individuals caught during a mark-recapture study conducted in a mixed plantation known for the exploitation of the species in Sabak Bernam, Selangor; 2) individuals collected from natural and human-modified habitats that were encountered in trade or for local use in Peninsular Malaysia and Sarawak; and 3) for comparison, traded individuals that were collected from natural habitats in Kalimantan, Indonesia (Table 3).
Table 3: Mean ± standard deviation and range in median carapace length (mm) of Southeast Asian Box Turtle collected in Malaysia and Kalimantan, Indonesia in 2006.
Source Wild Remarks Peninsular Malaysia 104.8±41.7 (65.5-188.0), n=24 Human-modified habitat, mark-
recapture study Peninsular Malaysia and Sarawak
173.3±25.3 (56.6-215.0), n=616 Encountered in trade, presumably various habitats
Kalimantan, Indonesia
168.1±28.5 (70.0-215.0), n=654 Natural habitat, encountered in trade
The smaller mean size of individuals from the exploited human-modified habitat in Malaysia compared to the other two areas might indicate over-exploitation, although there may be other reasons for the differences between these size differences. Data such as these from sampled human-modified and natural habitats could serve as baseline data and ongoing surveys should be conducted to monitor change in mean size. A decrease in
2 “Median carapace length” is a standard measurement in freshwater turtles and tortoises. It is taken at the median part of the carapace in straight line.
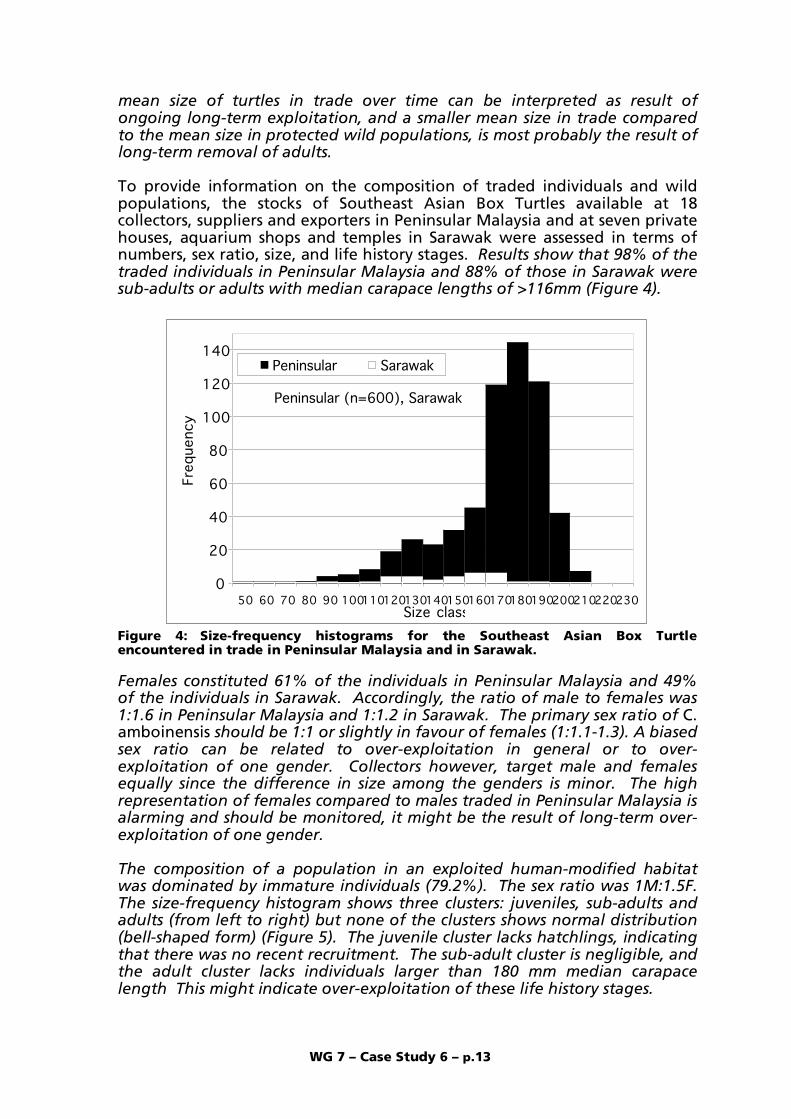
WG 7 – Case Study 6 – p.13
mean size of turtles in trade over time can be interpreted as result of ongoing long-term exploitation, and a smaller mean size in trade compared to the mean size in protected wild populations, is most probably the result of long-term removal of adults. To provide information on the composition of traded individuals and wild populations, the stocks of Southeast Asian Box Turtles available at 18 collectors, suppliers and exporters in Peninsular Malaysia and at seven private houses, aquarium shops and temples in Sarawak were assessed in terms of numbers, sex ratio, size, and life history stages. Results show that 98% of the traded individuals in Peninsular Malaysia and 88% of those in Sarawak were sub-adults or adults with median carapace lengths of >116mm (Figure 4).
Peninsular (n=600), Sarawak (n=33)
0
20
40
60
80
100
120
140
50 60 70 80 90 100110120130140150160170180190200210220230Size classes
Fre
quency
Peninsular Sarawak
Figure 4: Size-frequency histograms for the Southeast Asian Box Turtle encountered in trade in Peninsular Malaysia and in Sarawak. Females constituted 61% of the individuals in Peninsular Malaysia and 49% of the individuals in Sarawak. Accordingly, the ratio of male to females was 1:1.6 in Peninsular Malaysia and 1:1.2 in Sarawak. The primary sex ratio of C. amboinensis should be 1:1 or slightly in favour of females (1:1.1-1.3). A biased sex ratio can be related to over-exploitation in general or to over-exploitation of one gender. Collectors however, target male and females equally since the difference in size among the genders is minor. The high representation of females compared to males traded in Peninsular Malaysia is alarming and should be monitored, it might be the result of long-term over-exploitation of one gender. The composition of a population in an exploited human-modified habitat was dominated by immature individuals (79.2%). The sex ratio was 1M:1.5F. The size-frequency histogram shows three clusters: juveniles, sub-adults and adults (from left to right) but none of the clusters shows normal distribution (bell-shaped form) (Figure 5). The juvenile cluster lacks hatchlings, indicating that there was no recent recruitment. The sub-adult cluster is negligible, and the adult cluster lacks individuals larger than 180 mm median carapace length This might indicate over-exploitation of these life history stages.

WG 7 – Case Study 6 – p.14
Oil palm plantation, 10 mm intervals, n=24
0
1
2
3
4
5
6
7
50 60 70 80 90 100110 120130140150160170180190
Size class
Fre
quency
Figure 5: Size-frequency distribution of a population in an exploited plantation in Sabak Bernam, Selangor. A mark-recapture survey after Schnabel (Krebs, 1998) to estimate population size was conducted in a mixed banana-oil palm plantation in Batu Dua Sepintas, Sabak Bernam, Selangor. The study was conducted daily for more than five consecutive weeks (38 days). Turtles were collected mainly with baited funnel traps that were checked every morning between 7-10:00 am. In addition, Visual Encounter Surveys were sporadically conducted in the early morning and in the late afternoon/ after dusk. A total of 42 funnel traps were set along the approximately 2200 m of drainage that surrounded the study site. All Southeast Asian Box Turtles encountered were marked, measured and released. A total of 24 Southeast Asian Box Turtles were caught; the population density was 0.82 individuals/ha. It is highly probable that this number is too low to sustain reproduction and recruitment. Population size should be monitored over time. This is only the second known assessment of the population density of the Southeast Asian Box Turtle. The only other data from the same species are from Sulawesi, Indonesia. In Sulawesi, the population size of the species was assessed in a peat swamp forest, which is part of a national protected area. The study area in Sulawesi measured only two hectares and a total of 71 individuals were caught and the density was 60 individuals/ha (Schoppe, in prep.).
Abundance of the species in harvested and un-harvested, natural and human-modified habitats Information on the abundance of the Southeast Asian Box Turtle in the wild and therewith also on the impact the harvest has had was gathered through interviews conducted with local residents, store owners, market vendors, collectors, traders, farmers and recreational fishermen in all Malaysian states. Results indicate that populations are over-exploited or even locally extinct in every State. This is especially true for populations around trade centres, such as cities. All interviewees indicated that the species was less common in 2006 compared to some five to 10 years ago (Schoppe, in press).
Abundance in harvest and impact Abundance in harvest of the Southeast Asian Box Turtles at two out of 17 identified traders’ premises in Peninsular Malaysia was monitored for five consecutive weeks from 21 November to 27 December 2006, in Sabak Bernam, Selangor. During the 38 days of survey, 385 Southeast Asian Box Turtles were encountered at these two suppliers. It is assumed that these constitute 100% of the stock that was traded by the two suppliers. The total mean catch of

WG 7 – Case Study 6 – p.15
the two suppliers was 10.1 individuals/day, or 303.9 individuals/months or 3647.4 individuals/year. Accordingly, one supplier would then collect a conservative mean of 1823.7 individuals/year. For comparison, traders who source specimens from a natural wetland area in East Kalimantan, can collect about twice the amount (3350.9 individuals/year/trader). Generally, data are believed to be comparable, because the traders in both areas stated that the survey period fell in a lean collection time, either due to seasonality, as in West Kalimantan, or due to low prices, as in Malaysia. Accordingly, exploitation will be even higher during peak seasons. The much lower catch in Malaysia might be related to habitat (most are collected from plantations) or to over-exploitation and should be closely monitored. If catch-per-unit-effort (CPUE) in the survey site in Malaysia can be sustained over the years, harvesting might be sustainable; decreasing CPUE over the years would indicate that over-exploitation is taking place. Effectiveness and implementation of legislation pertaining to freshwater turtle conservation in Malaysia Information on management issues of CITES Appendix II-listed species was obtained from CITES online references (www.cites.org). Information on national and State legislation in place to regulate the harvest and trade in the Southeast Asian Box Turtle was compiled from relevant offices, such as the MAs of Peninsular Malaysia, Sarawak and Sabah and concerned NGOs, such as WWF Malaysia, Wetland International Malaysia, and academic institutions. The enforcement of these laws was examined and analysed, based on interviews with law enforcement officers as well as traders. Results show that law enforcement is rather weak and illegal trade a major issue.
4. EVALUATION OF DATA QUANTITY AND QUALITY FOR THE ASSESSMENT • A major deficiency is the lack of past density/population size data with
which to compare present results. • Abundance data are needed from more areas, preferably from each major
island, and preferably from a range of habitats (man-made habitat, exploited; man-made habitat, not exploited; natural habit, exploited; natural habitat, not exploited).
• The quantity and quality of trade data gathered during this survey is believed to be sufficient to identify current issues and problems correctly.
5. MAIN PROBLEMS, CHALLENGES OR DIFFICULTIES FOUND IN THE ELABORATION OF NDFS • Cuora amboinensis has four morphologically and geographically distinct
subspecies: the NDF process, however, needs to be at species level, since CITES does not distinguish taxa at subspecies level.
6. RECOMMENDATIONS • It appears that the large illegal trade constitutes the main threat to the
survival of the species. • Surveys need to be conducted to determine the exact distribution of the
species and its abundance in Malaysia. Population size should be monitored over time.
• Mean sizes of individual should be monitored over time. A significant decrease in mean median carapace length would indicate unsustainable exploitation considering that the larger individuals are mainly targeted for export

WG 7 – Case Study 6 – p.16
• A NDF assessment without abundance data and population dynamics will remain a compromise unless further bolstered by subsequently available information incorporated into a monitoring system that supports an ‘adaptive management’ framework.
• In the absence of quantitative data on local populations of the Southeast Asian Box Turtle, criteria that might indicate changes in the local abundance should be assessed. Indicators of change that were developed by TRAFFIC after fieldwork in 2006 are (Schoppe, 2007): 1. collection areas getting increasingly far away from urban trade centres 2. decreasing CPUE 3. threats other than trade getting more severe. 4. reduced average size of individuals 5. traded specimens are mainly adults. 6. the population structure of traded individuals is significantly in favour
of one life history stage 7. the sex ratio of any population significantly different from 1:1 8. the State/provincial/regional annual harvest quota is far from being
realized (provided that trade under a quota system is re-opened).
• In addition, potential indicators of illegal trade should be monitored: 1. If collection of the species under investigation (and of other turtle
species) is a full-time business for collectors/trappers, then there is probability that there is a high demand for the consumption trade.
2. Sudden changes in the international market prices are usually indicators of illegal activity. The price paid to legal sources of the species by main importing countries decreases once an illegal shipment has arrived and undercuts market prices.
• The suggested abundance indicators are relatively easy to obtain. Potential sources of information are collectors, traders, data from importing countries, the CITES Management and Scientific Authorities in the country of export, published or unpublished reports, and grey literature.
• The above indicators should be assessed on an annual basis at the same time of the year and at the same sites. Recommended are sites that are significant trading centres around harvest locations such as Selangor, Johor, Kedah, Perak and Penang.
REFERENCES Ades, G. and P. Crow, 2002. The Asian Turtle Rescue Operation: Temporary
holding and placement at Kadoorie Farm and Botanic Garden, Hong Kong. Turtle and Tortoise Newsletter 6: 2–7.
Anon., 1991. Amendment to the Protection of Wild Life Act No. 76 of 1972. Law of Malaysia.
Anon., 1997. Wildlife Conservation Enactment 1997. Sabah Anon., 1998. Laws of Sarawak, Chapter 26. Wildlife Protection Ordinance 1998.
The Sarawak Government Gazette, 33 pp. Anon., 2002. Convention on International Trade in Endangered Species of Wild
Fauna and Flora. Eighteenth meeting of the Animals Committee, San Jose (Costa Rica), 8–12 April 2002. AC18 Summary record.
Anon., 2003. Convention on International Trade in Endangered Species of Wild Fauna and Flora. Nineteenth meeting of the Animals Committee, Geneva (Switzerland), 18–21 August 2003. AC19 Summary record.
WG 7 – Case Study 6 – p.17
Anon., 2004. Convention on International Trade in Endangered Species of Wild Fauna and Flora. Thirteenth meeting of the Conference of the Parties, Bangkok (Thailand), 2–14 October 2004. CoP13 Doc. 33, 10 pp.
Asian Turtle Working Group, 2000. Cuora amboinensis. In: IUCN 2006. 2006 IUCN Red List of Threatened Species. www.iucnredlist.org. Downloaded on 10 January 2007.
Azrina, L.A. and B.L. Lim, 1999. Legislative status of Chelonian species in Selangor, Peninsular Malaysia. Malayan Nature Journal 53(3): 253–261.
Baillie, J. and Groombridge, B., 1996. 1996 IUCN Red List of Threatened Animals. IUCN, Gland, Switzerland.
Bowler, J.K., 1977. Longevity of reptiles and amphibians in North American collections as of 1 November, 1975. Society for the Study of Amphibians and Reptiles, Miscellaneous Publications, Herpetological Circular 6: 1-32.
CIA, 2007. CIA – The World Factbook – Malaysia. https://www.cia.gov/library/publications/the-world-factbook/print/my.html
Ernst, C.H., Altenburg, R.G.M. and R.W. Barbour, 2000 Ernst, C.H., Altenburg, R.G.M. and R.W. Barbour (2000). Turtles of the World. World Biodiversity Series. Biodiversity Center of ETI, ETI/NLBIF, online version as of January 6, 2006, www.nlbif.eti.uva.nl/bis/turtles.php
Fritz, U. and P. Havas, 2007. Checklist of Chelonians of the World. Vertebrate Zoology 57: 149-368.
Gregory, R. and D.S.K. Sharma, 1997. Review of legislation affecting marine and freshwater turtles, terrain, and tortoise conservation and management in Malaysia: recommendations for change. WWF Tabung Alam Malaysia Project Report, 45 pp.
Hilton-Taylor, C., 2000. 2000 IUCN Red List of Threatened Species. IUCN, Gland, Switzerland and Cambridge, UK.
IUCN 2008. 2008 IUCN Red List of Threatened Species. <http://www.iucnredlist.org/>. Downloaded on 11 October 2008.
Jenkins M.D., 1995. Tortoises and Freshwater Turtles: The Trade in Southeast Asia. TRAFFIC International, Cambridge, UK. Pp. 48.
Krebs, C.J., 1998. Ecological Methodology, 2nd edition. (New York: Harper Collins), 654 pp.
Lim, B.L. and I. Das, 1999. Turtles of Borneo and Peninsular Malaysia. Natural History Publications, Borneo, 151pp.
McCord, W.P. and H.-D. Philippen, 1998. A new subspecies of box turtle, Cuora amboinensis lineata, from Northern Myanmar (Burma), with remarks on the distribution and geographic variation of the species. Reptile Hobbyist. Pp. 51-58.
Mitchell, J.C., 1988. Population ecology and life histories of the freshwater turtles Chrysemys picta and Sternotherus odoratus in an urban lake. Herpetological Monograph 2: 40-61.
Moll, E.O., 1976. West Malaysian turtles: Utilization and conservation. Herp. Review 7: 163–166.
Moll, D. and E.O. Moll, 2004. The Ecology, Exploitation, and Conservation of River Turtles. Oxford University Press. Pp. 393.
PERHILITAN, 1992. Department of Wildlife and National Parks 1992. Wildlife Plan for Peninsular Malaysia. Department of Wildlife and National Parks, Kuala Lumpur, Malaysia, 66 pp.
Rogner, M., 1996. Schildkröten, Vol. 1 and 2. Heiro-Verlag, Hürtgenwald, Germany, 49 pp.
Rummler, H.-J. and U. Fritz, 1991. Geographische Variabilitaet der Amboina-Scharnierschildkroete Cuora amboinensis (Daudin, 1802), mit

WG 7 – Case Study 6 – p.18
Beschreibung einer neuen Unterart, C. a. kamaroma subsp. nov. Salamandra, 27(1): 17-45.
Schoppe, S., 2007. Non-detrimental finding methodology for the trade of Southeast Asian freshwater turtles and tortoises (Fam. Geoemydidae). Unpublished report for TRAFFIC Southeast Asia. Pp. 19.
Schoppe, S. (in prep.). Status, trade dynamics and management of the Southeast Asian Box Turtle Cuora amboinensis in Indonesia. A TRAFFIC Southeast Asia report.
Schoppe, S., (in press). Science in CITES: The Biology and ecology of the Southeast Asian Box Turtle Cuora amboinensis and its local uses and trade in Malaysia. A TRAFFIC Southeast Asia report.
Sharma, D.S.K., 1999. Tortoise and Freshwater Turtle Trade and Utilisation in Peninsular Malaysia. TRAFFIC Southeast Asia, Petaling Jaya, Selangor, Malaysia, 39 pp.
Sharma, D.S.K. and O.B. Tisen, 2000. Freshwater turtle and tortoise utilization and conservation status in Malaysia. In: van Dijk, P.P., Stuart, B.L. and A.G.J. Rhodin (Eds). Asian Turtle van Dijk, P.P., 2000. The Status of Turtles in Asia. In: van Dijk, P.P., Stuart, B.L. and A.G.J. Rhodin (eds.). Asian Turtle Trade: Proceedings of a Workshop on Conservation and Trade of Freshwater Turtles and Tortoises in Asia. Chelonian Research Monographs, 2: 15-18.
Shepherd, C.R., Burgess, E.A. and M. Loo, 2004. Demand Driven: The trade of Indian Star Tortoises Geochelone elegans in Peninsular Malaysia. TRAFFIC Southeast Asia, Kuala Lumpur, Malaysia. .
UNEP-WCMC CITES Trade Database, 2008. CITES trade statistics derived from the CITES Trade Database. UNEP World Conservation Monitoring Centre, Cambridge, UK. http://sea-bov.unep-wcmc.org/citestrade/
van Dijk, P.P., 2000. The Status of Turtles in Asia. In: van Dijk, P.P., Stuart, B.L. and A.G.J. Rhodin (eds.). Asian Turtle Trade: Proceedings of a Workshop on Conservation and Trade of Freshwater Turtles and Tortoises in Asia. Chelonian Research Monographs 2: 15-18.
Whitaker, R. and H.V. Andrews, 1997. Captive breeding of Indian turtles and tortoises at the Centre for Herpetology/Madras Crocodile Bank. In: J. Van Abbema (Ed.), Proceedings: Conservation, Restoration, and Management of Tortoises and Turtles - An International Conference, pp. 166–170. July 1993, State University of New York, Purchase. New York Turtle and Tortoise Society, New York, 494 pp.
Wilbur, H.M., 1975. The evolutionary and mathematical demography of the turtles Chrysemys picta. Ecology 56: 64-77.

NDF WORKSHOP WG 7 – Reptiles and Amphibians
CASE STUDY 6 SUMMARY Cuora amboinensis
Country – Malaysia Original language – English
THE SOUTHEAST ASIAN BOX TURTLE CUORA AMBOINENSIS IN MALAYSIA
AUTHOR: Sabine Schoppe, TRAFFIC Southeast Asia.
The Southeast Asian Box Turtle Cuora amboinensis is a widely distributed freshwater turtle native to Southeast Asia. The species occurs in natural and man-made wetlands. The global and national conservation status of the species is “Vulnerable”. From 1998-2004 export has been managed through a quota system with the purpose of population management and sustainable use. Malaysia used to be after Indonesia the second most important source of specimens to the international market, mainly to supply East Asian tonic food and TCM markets, but also European, Japanese and USA pet markets. In 2005, the CITES Managed Authority banned export. TRAFFIC Southeast Asia (SEA) proposes a NDF methodology using criteria that were assessed during fieldwork in 2006: legislation and enforcement; trade levels; extent of illegal trade; reproduction biology; composition of wild populations and individuals in trade; abundance in an exploited man-made habitat; and abundance in harvest. Results show that the species is not covered by Malaysian State and consequently also not by federal legislation. All specimens are wild caught, year around and disregarding size but large individuals are preferred. Main local users are indigenous people and Thai along northern border towns who use the species for food, and ethnic Chinese who mainly use the species in religious ceremonies. Export is only regulated through CITES regulations, and awareness and law enforcement is rather weak, and illegal international trade a major issue. There are three main export routes with final destinations in China (70%) and Singapore (30%). Despite export ban since 2005, 19.5% of people in the possession of the species, supply the export market. Among 38 traders, 60.5% export, and only the remainder supply the local market. Most or all individuals for the international market are sourced out from Peninsular Malaysia only. The slow reproductive rate of the species makes it very vulnerable for exploitation and at the same time makes captive breeding an unfeasible endeavour, which is therefore not practiced in the country. Individuals encountered in the wild and in trade were measured and means calculated. These data may serve as baseline data for further comparative studies. Since larger size classes are targeted for the large-scale consumption trade a smaller mean size of individuals in trade compare to the mean size in the wild may be related to over-exploitation of larger size classes. A survey to assess the abundance of the species in an exploited man-made habitat revealed an estimated density of 0.82 ind./ha. These data may serve as baseline data. Generally, if off-take is sustainable population density will be lower but stable. The encountered low density cannot possibly be sustainable but indicates over-exploitation. The population was composed of 79.2% immature versus 20.8% mature

individuals; sex ratio was M1:F1.5. The size-frequency distribution of the population is not normally distributed indicating most probably over-exploitation. To determine the abundance in harvest a 38-day lasting harvest survey was conducted at two middlemen in Selangor. Results indicate that one middleman can trade a conservative mean of 1823.7 individual/year. If catch per unit effort (CPUE) can be sustained over the years, exploitation might be sustainable, if CPUE decreases over the years, over-exploitation is taking place. Ninety-eight percent of the catch of those traders was composed of larger individuals; sex ratio was 1M:1.6F. Such dominance of adults and females in harvest should be closely monitored for potential over-exploitation. The assessment of the harvest impact on the species all over the country indicate that populations are over-exploited or even locally extinct in every State, especially around trade centres and near cities.
Major problems found in the elaboration of the NDF are the lack of past density / population size data to compare present results with; the enormous amount of illegally traded individuals and the long chain of people involved in the illegal business. In the absence of quantitative data on local populations of the Southeast Asian Box Turtle criteria that might indicate changes in the local abundance that should be assessed on a regular basis are recommended.

TRAFFIC is a joint programme of and
The Southeast Asian Box
Turtle Cuora amboinensis
(Daudin, 1802)
Sabine Schoppe, TRAFFIC
Southeast Asia, Kuala Lumpur,
Malaysia
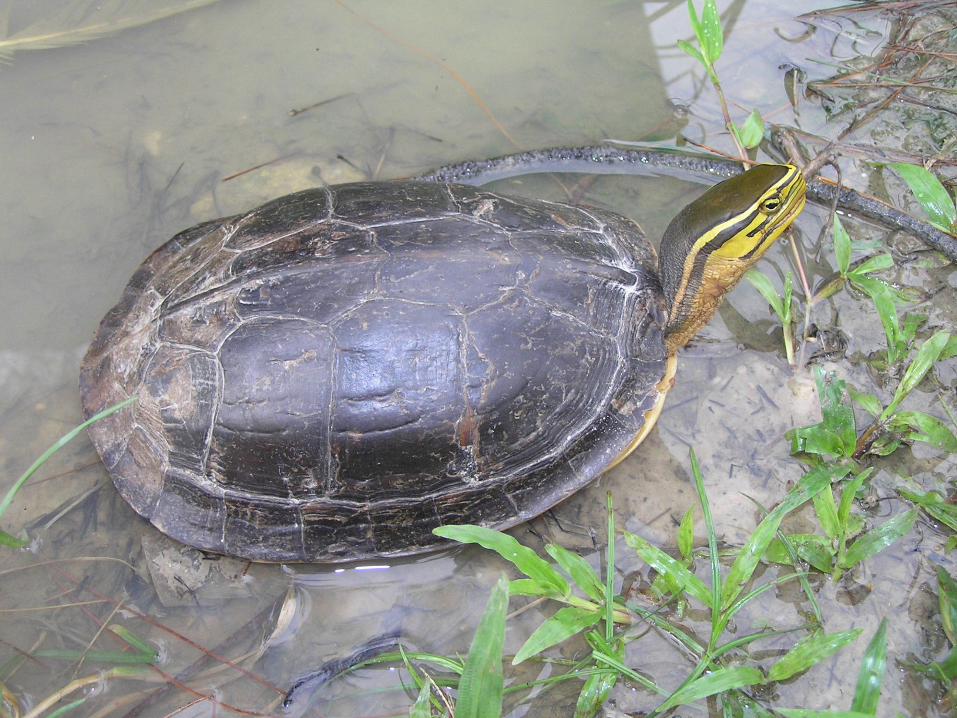
TRAFFIC is a joint programme of and

TRAFFIC is a joint programme of and
Outline
1. Names, Distribution, General Bio and Eco
2. Case Study from ID 3. Case Study from MY
Species Management Species Management
Utilization and Trade Utilization and Trade
Non-detrimental
finding procedure
Non-detrimental
finding procedure
4. Evaluation of Data
5. Problems and Challenges
6. Recommendations
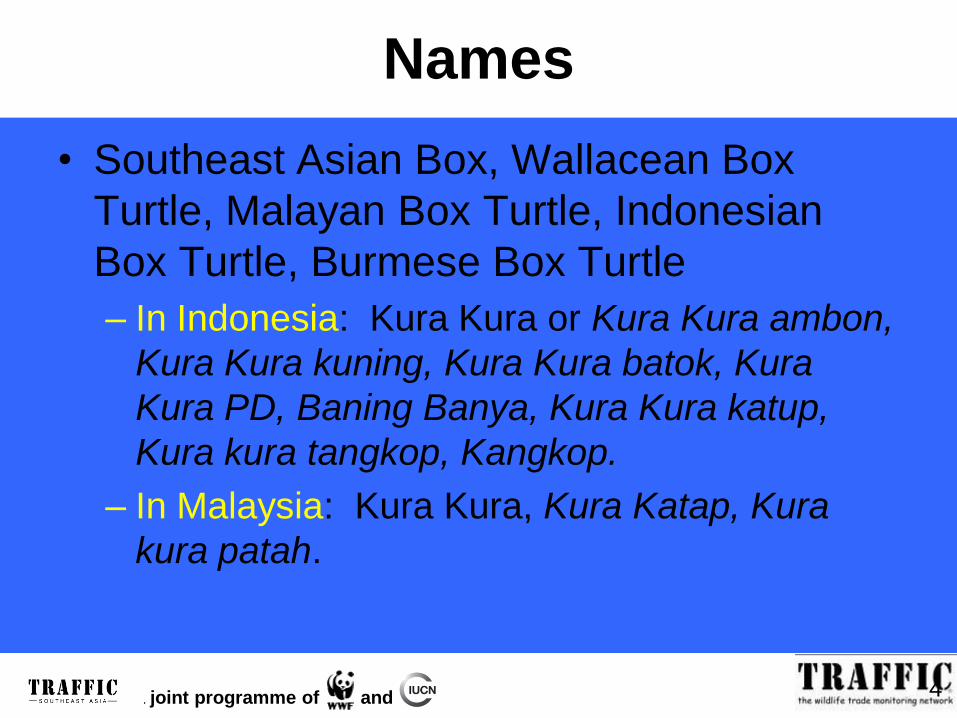
TRAFFIC is a joint programme of and
Names
• Southeast Asian Box, Wallacean Box
Turtle, Malayan Box Turtle, Indonesian
Box Turtle, Burmese Box Turtle
– In Indonesia: Kura Kura or Kura Kura ambon,
Kura Kura kuning, Kura Kura batok, Kura
Kura PD, Baning Banya, Kura Kura katup,
Kura kura tangkop, Kangkop.
– In Malaysia: Kura Kura, Kura Katap, Kura
kura patah.
4
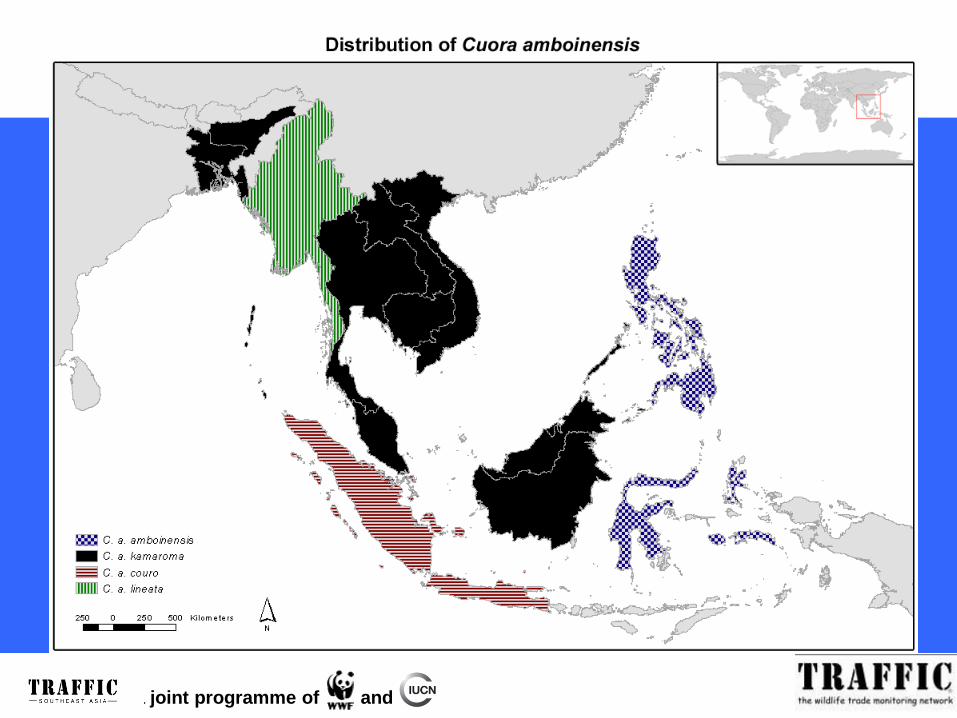
TRAFFIC is a joint programme of and

TRAFFIC is a joint programme of and
Biological Characteristics
• Primary sex ratio about 1:1;
• Males slightly smaller/lighter than females;
• Low reproductive rate;
• Incubation 67-120 days;
• Hatching success ca. 50% in captivity;
• Survival rate not known;
• Life expectancy 25-30 years;
• Generation time is 18 years;
• Does not migrate seasonally or geographically.

TRAFFIC is a joint programme of and
Habitat
• Semi-aquatic;
• Natural and man-made wetlands:
– Swamp and peat swamp forests, Melaleuca
swamps, permanent or temporary wetlands,
and shallow lakes.
– Flooded rice fields, oil palm and rubber
plantations, irrigation ditches, canals, orchards,
vegetated drainage systems, ponds and pools;
• Habitat generalist, adaptable to man-made
habitats, tolerant.
TRAFFIC is a joint programme of and
Role in the Ecosystem• Omnivorous but primarily vegetarian;
• Forages on aquatic plants, aquatic insects,
molluscs, and crustaceans in the water and on
plants, fungi, and worms on land ;
• Being a predator of various invertebrates it might
help to stem occurrence of invertebrate-borne
diseases;
• Seed disperser;
• Eggs and hatchlings are an important source of
food for vertebrates.

TRAFFIC is a joint programme of and
Global Population Size and Conservation
Status
• No quantitative information available;
• Decreasing trend;
• Low risk / near threatened from
1996 to 1999;
• Vulnerable since 2000;
• CITES Appendix II in 2000.
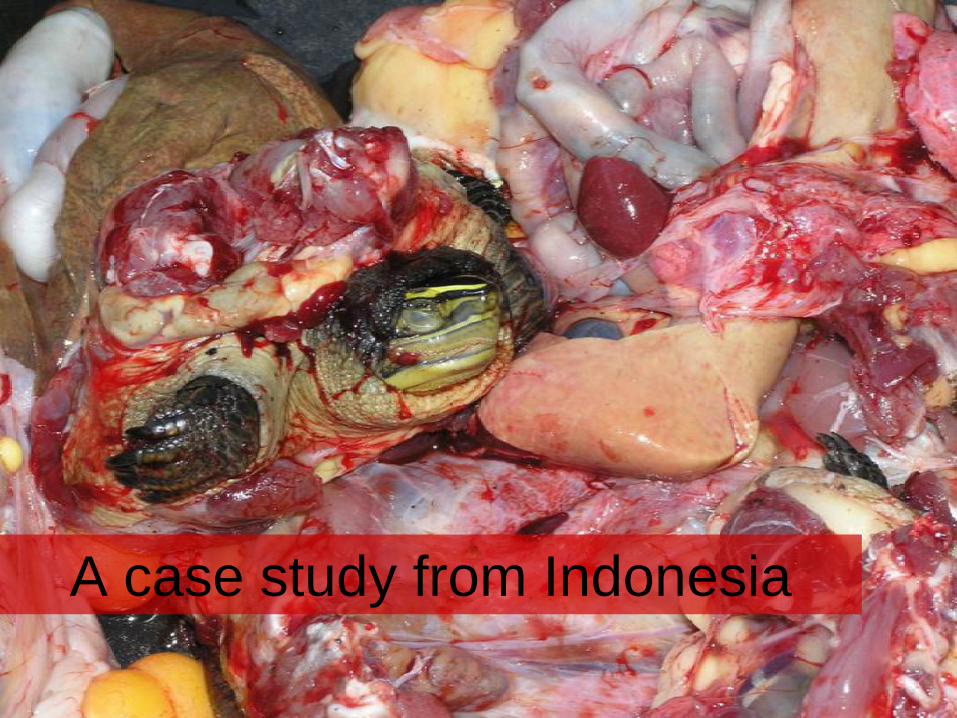
A case study from Indonesia

TRAFFIC is a joint programme of and
National Conservation Status
• Vulnerable (IUCN, 2008);
• Common and widespread in the western
part of the country and abundant in most
areas with natural or man-made wetlands
(Anon., 2006);
• Reduced and still decreasing (Anon., 2002;
Schoppe, in prep.).

TRAFFIC is a joint programme of and
Main Threats
• Harvesting
• Unregulated illegal trade
• Main supplier for
international meat & TCM,
and pet markets.

TRAFFIC is a joint programme of and
Management
• Unlimited exploitation until 1990 (Jenkins,’95).
• 1991-94: annual export allotment of 10 000
ind. (Jenkins, ‘95).
• Among 10 most heavily traded turtles 1998-99
(Lau et al., 2000).
• Management plan in accordance with CITES
listing.
– Sustainable use (Anon., 2002).
• Quota system to regulate harvest and export.
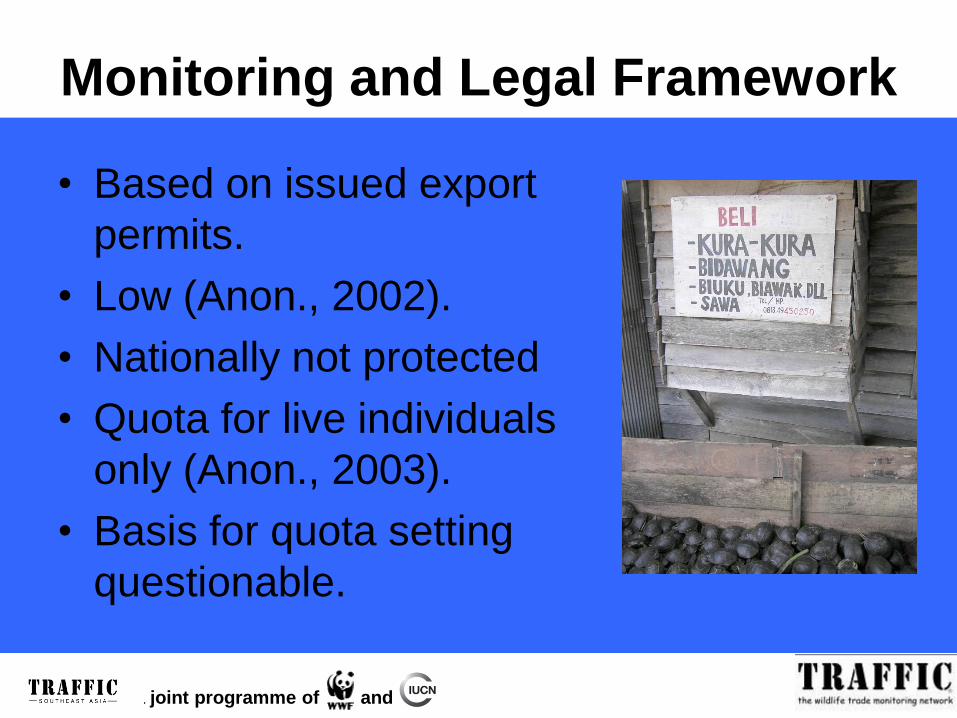
TRAFFIC is a joint programme of and
Monitoring and Legal Framework
• Based on issued export
permits.
• Low (Anon., 2002).
• Nationally not protected
• Quota for live individuals
only (Anon., 2003).
• Basis for quota setting
questionable.

TRAFFIC is a joint programme of and
Utilization and Trade
• All wild caught;
• Tonic food, TCM (childbirth, nocturnal
urination, asthma, cancer), merit release,
and as pet;
– 10% of harvest quota for local use
• Mainly ethnic Chinese;
– 90% export: China, Hong Kong, Singapore,
Taiwan, Viet Nam, Europe, Japan, USA
• Tonic food and TCM,
• Pet.
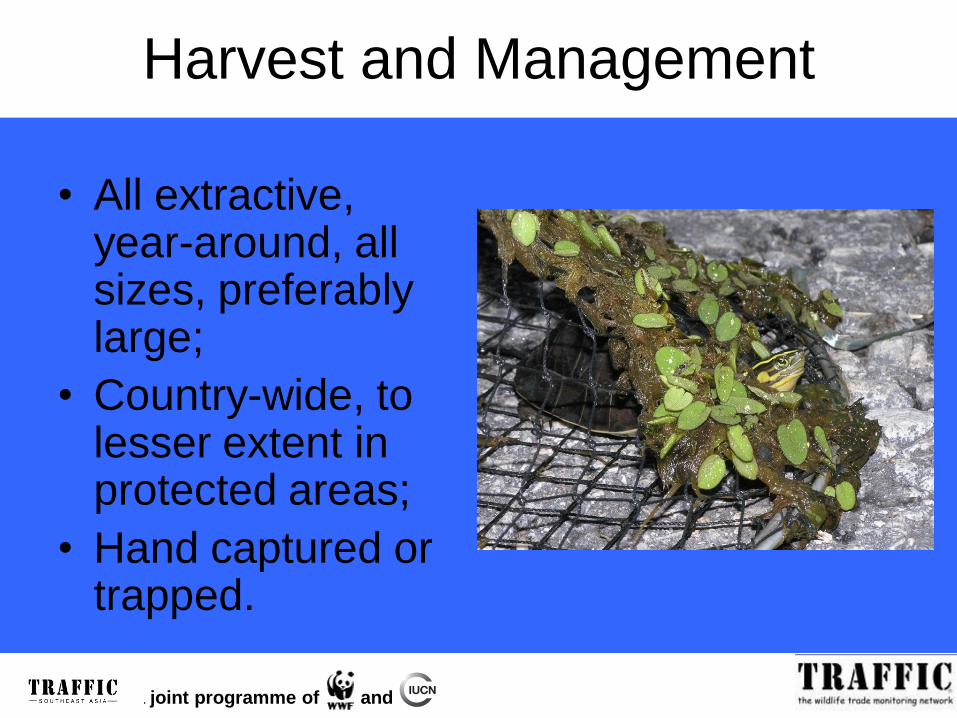
TRAFFIC is a joint programme of and
Harvest and Management
• All extractive, year-around, all sizes, preferably large;
• Country-wide, to lesser extent in protected areas;
• Hand captured or trapped.

TRAFFIC is a joint programme of and
Legal and illegal trade levels
• Legal trade (20 000 live ind.)
– Annually 18 000 individuals for export
– 30% pet trade and 70% meat/TCM trade
• Illegal trade
– Hong Kong , China, Singapore and
Malaysia
– Live and shell, especially plastron
– Increase in plastron trade since 2000

Non-detrimental Finding procedure
Based on surveys conducted in the main
source and trade centres in Indonesia in
2006, TRAFFIC SEA proposes the following
NDF methodology

TRAFFIC is a joint programme of and
Risk-assessment checklist
• In April 2002, by
members of the
Indonesian CITES MA
and SA (Anon., 2002).
• After fieldwork in
2006, by TRAFFIC
SEA (Schoppe, 2007).
Low confidence in harvest management,
Data deficiency.

0
1
2
3
4
5
Life historyEcological adaptability
Dispersal
Human tolerance
National distribution
National abundance
National population trend
Information quality
Major threat
Illegal harvest
Management history
Management planAim of harvest
QuotasHarvest in PA
Harvest in strong tenure
Open access harvest
Confidence in harvest
management
Monitoring method
Confidence in monitoring
Effect of harvest
Species conservation
incentive
Habitat conservation
incentive
Proportion protected from
harvest
Effectiveness of protectionRegulation of harvest
CITES MA & SA 2002

0
1
2
3
4
5
Life historyEcological adaptability
Dispersal
Human tolerance
National distribution
National abundance
National population trend
Information quality
Major threat
Illegal harvest
Management history
Management planAim of harvest
QuotasHarvest in PA
Harvest in strong tenure
Open access harvest
Confidence in harvest
management
Monitoring method
Confidence in monitoring
Effect of harvest
Species conservation
incentive
Habitat conservation
incentive
Proportion protected from
harvest
Effectiveness of protectionRegulation of harvest
TRAFFIC SEA 2006

TRAFFIC is a joint programme of and
Criteria, parameters and/or indicators
1. Legislation and enforcement;
2. Trade levels;
3. Extent of illegal trade;
4. Reproduction biology;
5. Composition of wild populations and of
individuals in trade;
6. Abundance in an unexploited area;
7. Abundance in harvest and impact.

Methodology and Findings
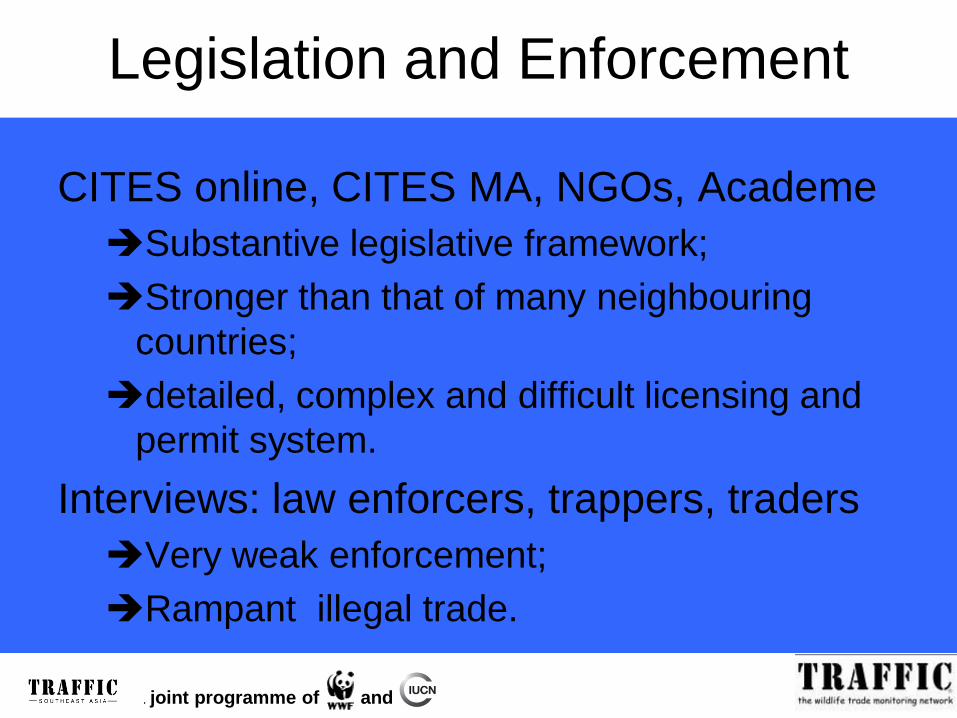
TRAFFIC is a joint programme of and
Legislation and Enforcement
CITES online, CITES MA, NGOs, Academe
Substantive legislative framework;
Stronger than that of many neighbouring
countries;
detailed, complex and difficult licensing and
permit system.
Interviews: law enforcers, trappers, traders
Very weak enforcement;
Rampant illegal trade.

TRAFFIC is a joint programme of and
Trade Levels
CITES annual reports, UNEP-WCMC CITES
Trade Database, traders, researchers, seizure
records, and press releases:
Remains among the most abundantly traded
freshwater turtles;
Highest harvest quota of all hard-shelled turtles:
20 000 (2001-today).
Such excessive exploitation over a large period
of time cannot be sustainable.

TRAFFIC is a joint programme of and
Local Utilization
Interviews at markets, pet shops, traders:
10% allotted;
Negligible local use;
Price of juveniles ranged from USD 0.3-
13.6 (mean USD 3.84) per individual;
Price of adults ranged from USD 2.7-10.9
(mean USD 5.33)/ind.

TRAFFIC is a joint programme of and
4 companies;
1/3 of quota;
Large individuals,
preferably adults
(≥160mm MeCL)
Legal international Trade
Pet Trade14 companies;
2/3 of quota;
Preferably small
(≥100mm MeCL);
Decrease & local
extinction;
Purchase price:
USD1.74-2.17/ind.;
Sales price:
USD3.5-8.0/ind.
Meat & TCM Trade
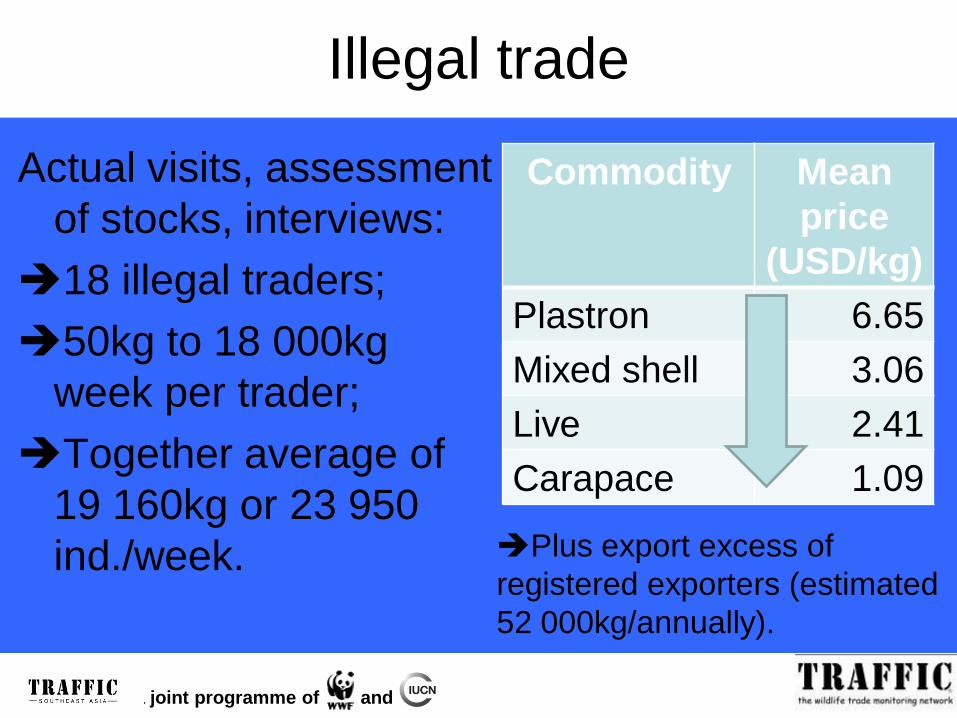
TRAFFIC is a joint programme of and
Illegal trade
Actual visits, assessment
of stocks, interviews:
18 illegal traders;
50kg to 18 000kg
week per trader;
Together average of
19 160kg or 23 950
ind./week.
Commodity Mean
price
(USD/kg)
Plastron 6.65
Mixed shell 3.06
Live 2.41
Carapace 1.09
Plus export excess of
registered exporters (estimated
52 000kg/annually).

Malaysia
Hong KongChina
Singapore

TRAFFIC is a joint programme of and
Reproduction biology
• Published and unpublished material enriched
with observations during field surveys:
6 eggs/year 3 hatchling ? adults;
age at maturity 5-6 years
Vulnerable for exploitation

TRAFFIC is a joint programme of and
Captive breeding
Surveys of companies, and captive
breeding reports
nobody currently breeds;
economically not feasible for
consumption trade;
Individuals declared captive bred
should be investigated.

TRAFFIC is a joint programme of and
Baseline data on size
Mean ± SD and range in MeCL of C. amboinensis from different
sources
Subspecies Size Remarks
C. a. kamaroma 165.9±31.3
(65.5-215-0), n=678
Flood plain, trade
C. a. amboinensis 134.5±44.6
(51.5-200.0), n=68
Peat swamp forest,
protected, mark-recapture
C. a. amboinensis 149.9±24.9
(121.5-190), n=20
Natural wetlands (marsh),
trade
C. a. couro 131.1±40.3
(55.6-214.0), n=200
Man-made habitats,
plantations, trade

TRAFFIC is a joint programme of and
Monitor Trends in Size
Larger size classes are targeted for the consumption trade.
A smaller mean size in trade compare to the wild is related to over-exploitation of larger size classes.
A significant decrease in mean size over time would indicate unsustainable exploitation considering that the larger individuals are mainly targeted for export.
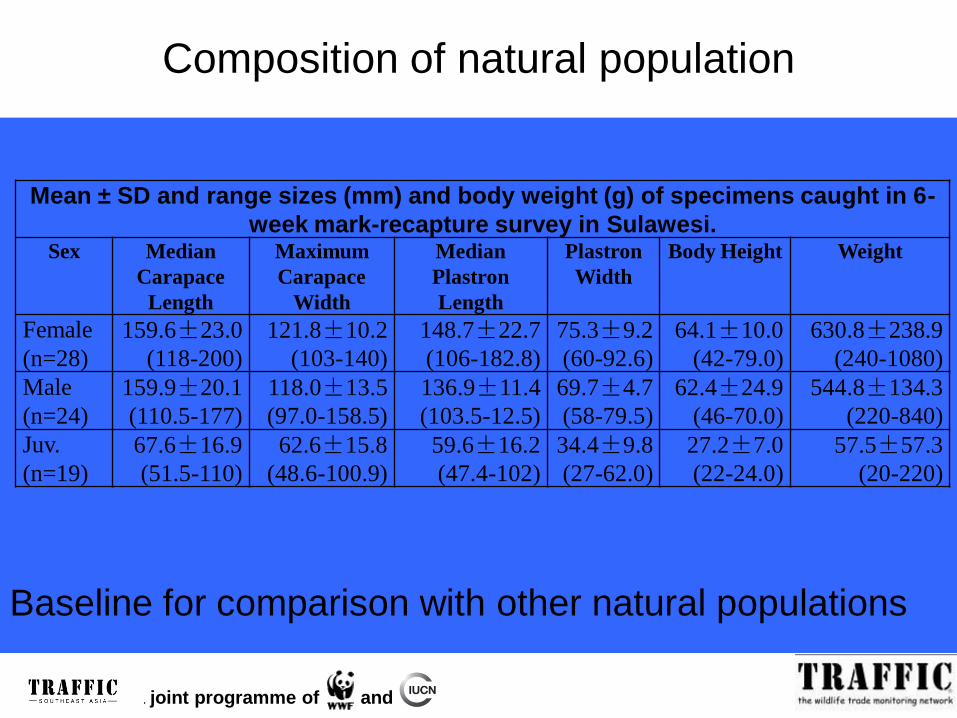
TRAFFIC is a joint programme of and
Composition of natural population
Mean ± SD and range sizes (mm) and body weight (g) of specimens caught in 6-
week mark-recapture survey in Sulawesi.Sex Median
Carapace
Length
Maximum
Carapace
Width
Median
Plastron
Length
Plastron
Width
Body Height Weight
Female
(n=28)
159.6±23.0
(118-200)
121.8±10.2
(103-140)
148.7±22.7
(106-182.8)
75.3±9.2
(60-92.6)
64.1±10.0
(42-79.0)
630.8±238.9
(240-1080)
Male
(n=24)
159.9±20.1
(110.5-177)
118.0±13.5
(97.0-158.5)
136.9±11.4
(103.5-12.5)
69.7±4.7
(58-79.5)
62.4±24.9
(46-70.0)
544.8±134.3
(220-840)
Juv.
(n=19)
67.6±16.9
(51.5-110)
62.6±15.8
(48.6-100.9)
59.6±16.2
(47.4-102)
34.4±9.8
(27-62.0)
27.2±7.0
(22-24.0)
57.5±57.3
(20-220)
Baseline for comparison with other natural populations

TRAFFIC is a joint programme of and
Size-frequency in the wild
TNRAW 10mm intervals, n=71
0
2
4
6
8
10
12
14
16
18
50 60 70 80 90 100 110 120 130 140 150 160 170 180 190 200 210 220 230
Size class
Fre
quen
cy
• 54.9%
immature
• 45.1%
mature
• Normal
distribution
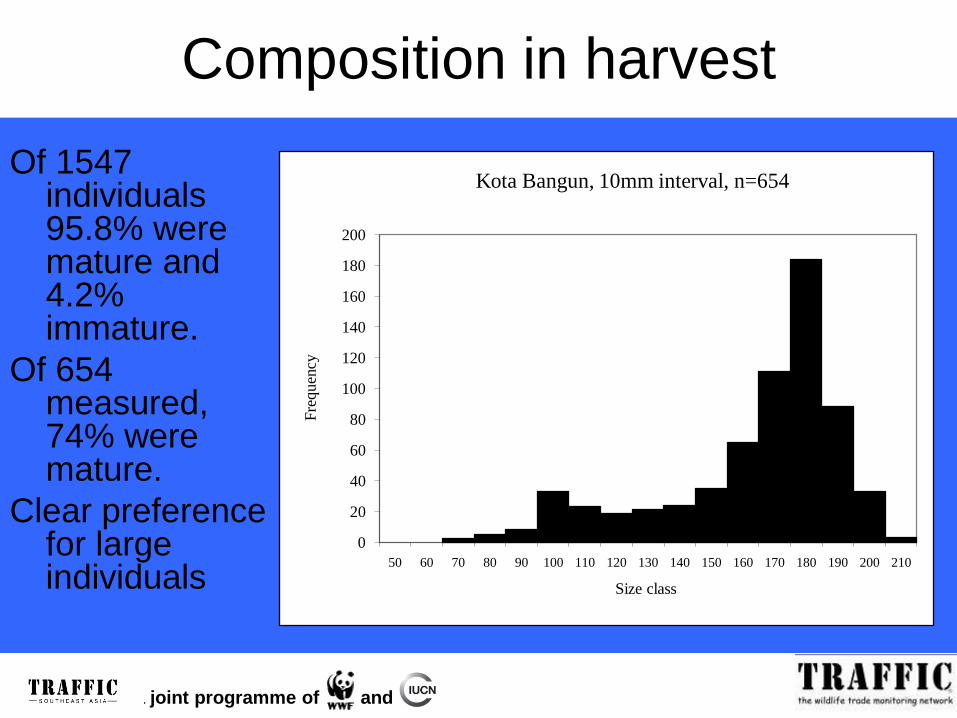
TRAFFIC is a joint programme of and
Composition in harvest
Of 1547 individuals 95.8% were mature and 4.2% immature.
Of 654 measured, 74% were mature.
Clear preference for large individuals
0
20
40
60
80
100
120
140
160
180
200
50 60 70 80 90 100 110 120 130 140 150 160 170 180 190 200 210
Fre
quen
cy
Size class
Kota Bangun, 10mm interval, n=654
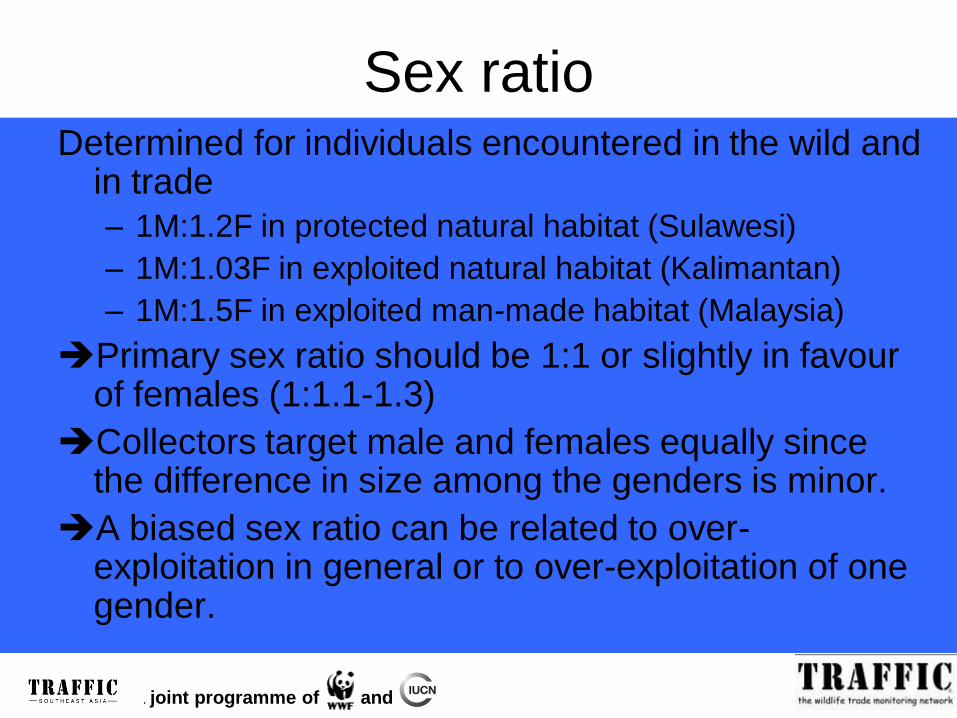
TRAFFIC is a joint programme of and
Sex ratio Determined for individuals encountered in the wild and
in trade
– 1M:1.2F in protected natural habitat (Sulawesi)
– 1M:1.03F in exploited natural habitat (Kalimantan)
– 1M:1.5F in exploited man-made habitat (Malaysia)
Primary sex ratio should be 1:1 or slightly in favour of females (1:1.1-1.3)
Collectors target male and females equally since the difference in size among the genders is minor.
A biased sex ratio can be related to over-exploitation in general or to over-exploitation of one gender.

TRAFFIC is a joint programme of and
Abundance in the wild
Mark-recapture survey in a peat swamp forest
in National Park in Kendari, SE Sulawesi,
from 29.04.-10.06.2006
Population size estimate after Schumacher
and Eschmeyer (Krebs, 1998).
71 individuals caught
120 estimated population size
60 individuals/ha is estimated density

TRAFFIC is a joint programme of and
Abundance in harvest
• Natural wetland in Kalimantan, known for exploitation
• Stocks of 4 middlemen from 24.06-05.08.2006
Middleman TotalMean number
/ day
Mean number /
month
Mean number /
year
A 546 12.7 380.9 4571.2
B 844 19.6 588.8 7066.0
C 85 2.7 79.7 956.3
D 72 2.3 67.5 810.0Total A-D 1547 37.2 1117.0 13 403.5Mean A-D 386.8 9.3 279.2 3350.9
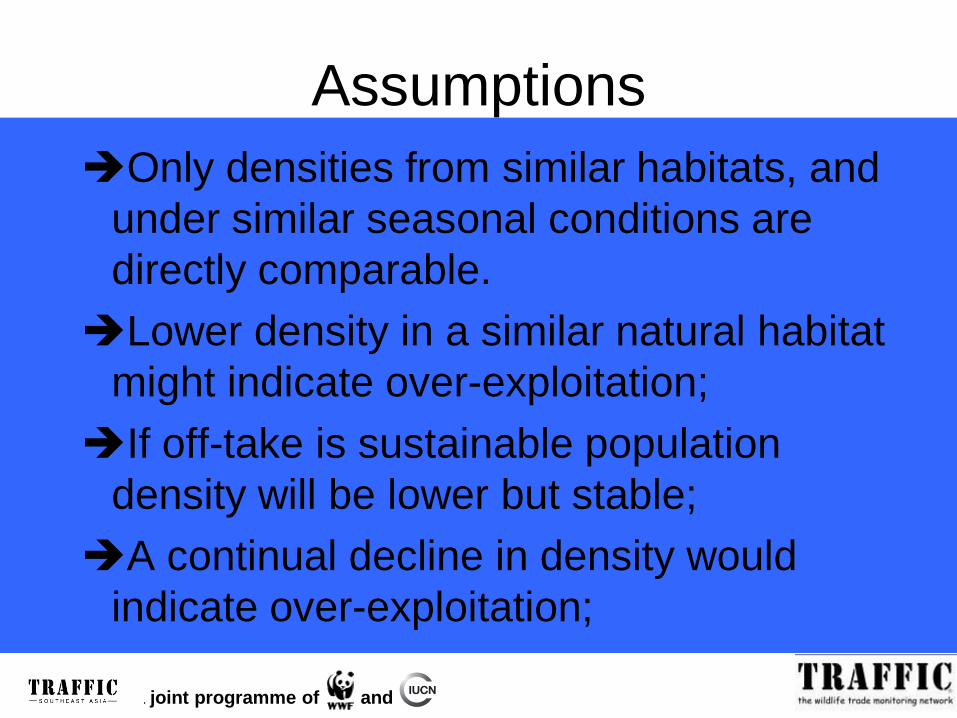
TRAFFIC is a joint programme of and
Assumptions
Only densities from similar habitats, and
under similar seasonal conditions are
directly comparable.
Lower density in a similar natural habitat
might indicate over-exploitation;
If off-take is sustainable population
density will be lower but stable;
A continual decline in density would
indicate over-exploitation;

TRAFFIC is a joint programme of and
Monitoring of Trends
Exploited man-made habitat in Malaysia:
annual mean of 1824 individuals
man-made versus natural habitat ?
Catch (CPUE) stable
sustainable
CPUE decreases
over-exploitation
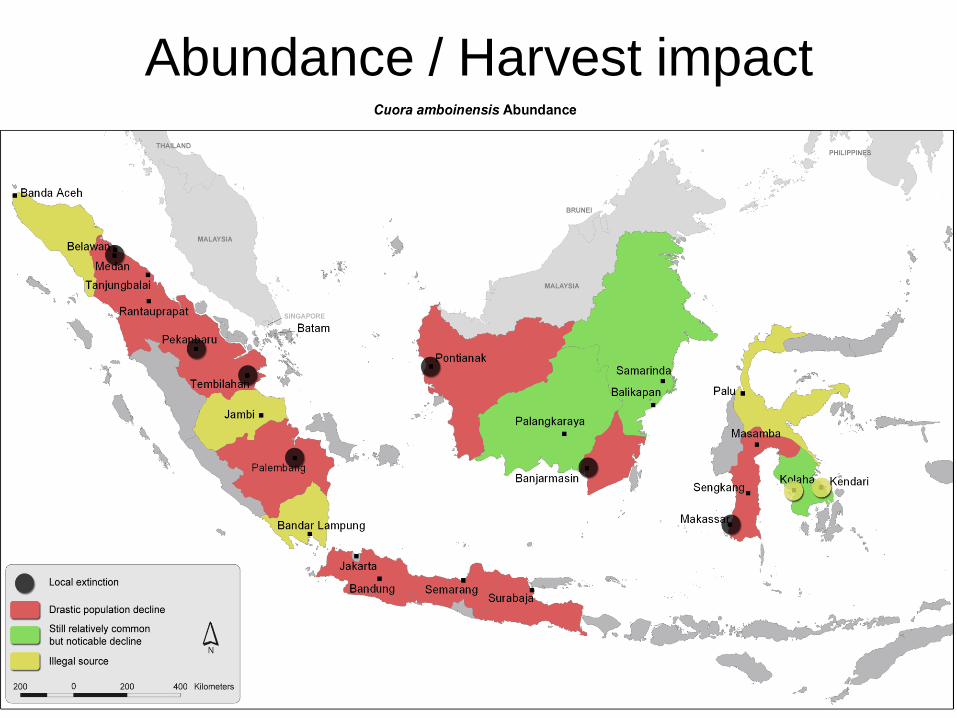
Abundance / Harvest impact
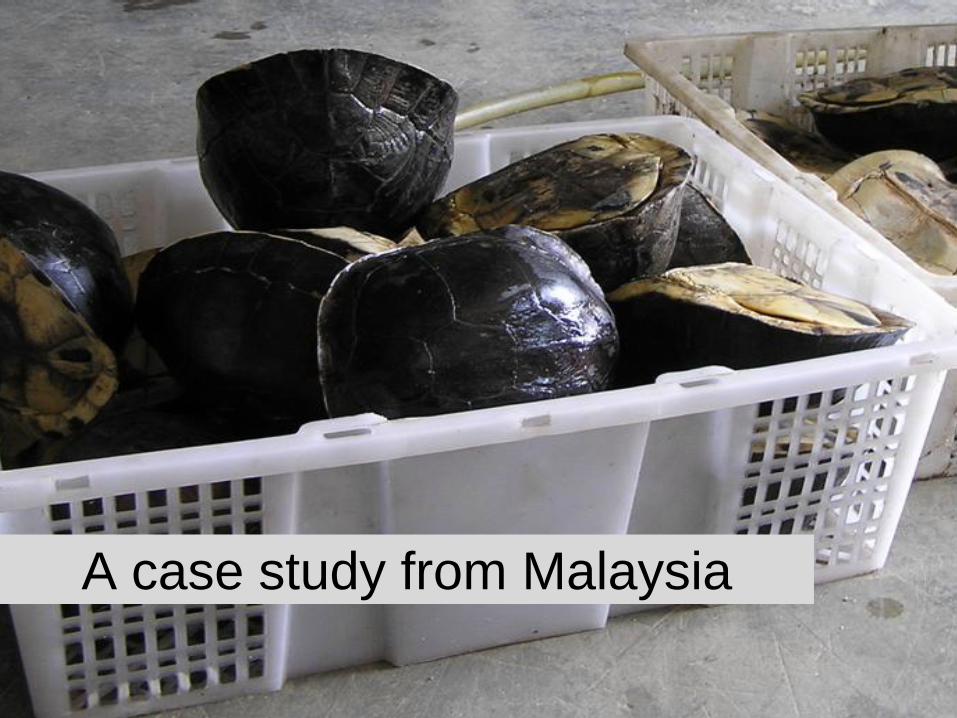
A case study from Malaysia

TRAFFIC is a joint programme of and
National Conservation Status
• Vulnerable (IUCN, 2008);
• Most common turtle in the wild and in markets (Lim and Das, 1999);
• Abundant in States with wetlands (Sharma and Tisen, 2000);
• Reduced in multiple locations (Sharma, 1999; Sharma and Tisen, 2000);
• Common and vulnerable (Azrina and Lim, 1999);
• Reduced and still decreasing (Schoppe, 2007);
• Extremely vulnerable to over-exploitation (Jenkins, 1995, Gregory and Sharma, 1997; ...)
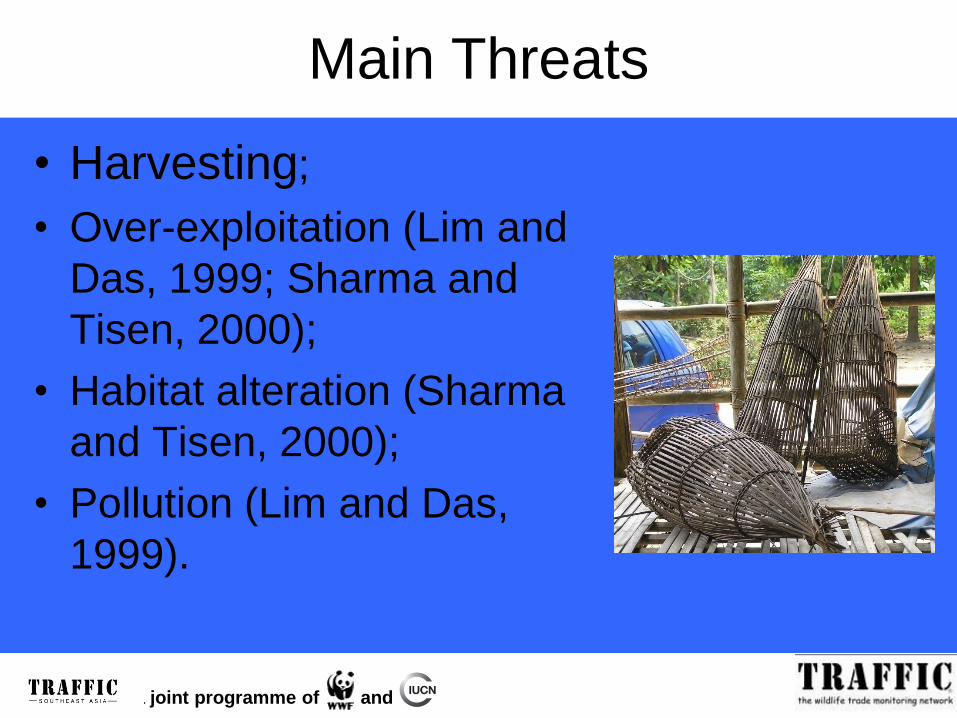
TRAFFIC is a joint programme of and
Main Threats
• Harvesting;
• Over-exploitation (Lim and
Das, 1999; Sharma and
Tisen, 2000);
• Habitat alteration (Sharma
and Tisen, 2000);
• Pollution (Lim and Das,
1999).

TRAFFIC is a joint programme of and
Management History and Purpose
• Unregulated international trade before 2000;
• Ongoing unregulated harvest for local use in
Peninsular; permit regulated in Sabah and
Sarawak;
• Quota system to regulate harvest for
international trade from 2000-2004;
• Population management and sustainable
use.

TRAFFIC is a joint programme of and
Elements of Management Plan
• Based on realized export of previous
year and stocks in collection centres;
• Harvest ban in 2004;
• Recommended for large-scale captive
breeding;
• Export ban since 2005.
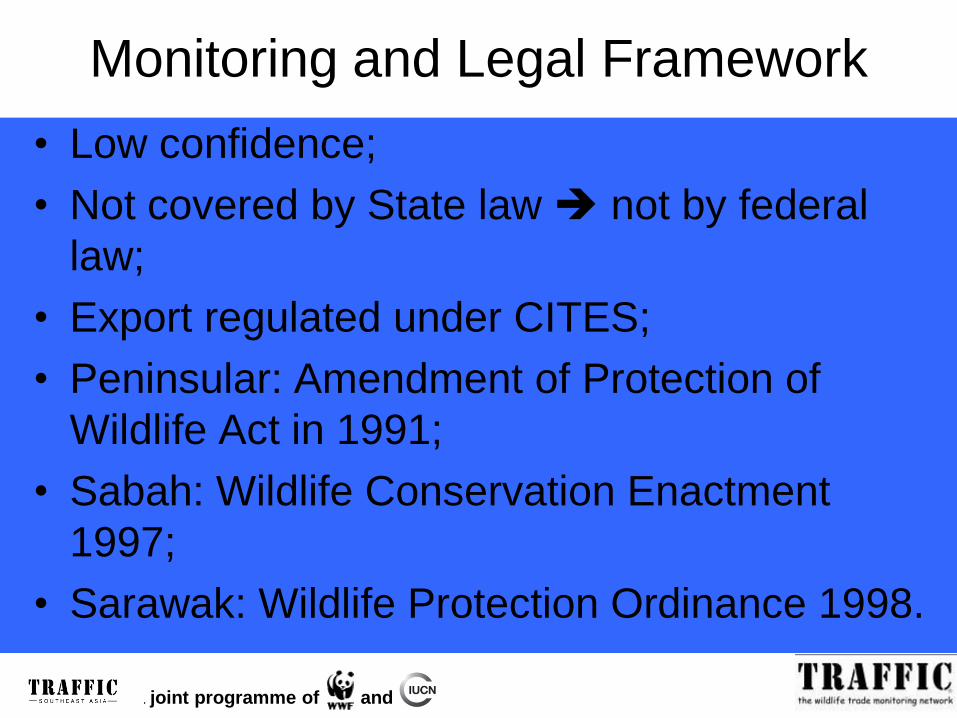
TRAFFIC is a joint programme of and
Monitoring and Legal Framework
• Low confidence;
• Not covered by State law not by federal
law;
• Export regulated under CITES;
• Peninsular: Amendment of Protection of
Wildlife Act in 1991;
• Sabah: Wildlife Conservation Enactment
1997;
• Sarawak: Wildlife Protection Ordinance 1998.

TRAFFIC is a joint programme of and
Utilization and Trade
• All wild caught;
• Meat, TCM, merit release, pet;
• Extensive but unknown volumes for local use (11% indigenous people, Thai, 35% ethnic Chinese);
• Extensive export to East Asia
– 456 541 exported in 1999,
– 333 099 imported between 2000-2005.
• Pet trade to Europe, Japan and USA:
– 12 785 imported between 2000-2004.

TRAFFIC is a joint programme of and
Harvest and Management
• All extractive, year-around, all sizes
but preferably adults;
• Hand captured or trapped;
• Source of export limited to Peninsular;
• Country-wide but to lesser extent in
protected areas.

TRAFFIC is a joint programme of and
Legal trade
Export
Year Reported exports
2000 277 190
2001 35 036
2002 38 746
2003 13 957
2004 33 835
Tonic Food & TCM to East Asia; pet
trade to Europe, Japan, USA (~5%)
Local use
• Not regulated in
Peninsular
– Difficult to quantify;
– 1-100 per religious
ceremony;
– 10 per meal;
• Permits required for
Sabah and Sarawak
– Consumption and pet

TRAFFIC is a joint programme of and
Illegal trade before ban in 2005
• Seizure records:
– 11.12.2001: Hong Kong Customs seized 10 000
Asian turtles (Ades and Crow, 2002).
– March 2003: 6t seized in Hanoi (C. Shepherd,
TRAFFIC SEA, in litt. to J. Thomson, 09.’02).
– 2003: Customs in Xiamen confiscated 5000
SEA Box Turtle from Malaysia (Anon., 2004).
• Reported imports (CN, HK, SG):
– 2003: 129 577 ind. & 600kg
– 2004: 74 293 ind. & 200kg (CITES trade statistics).
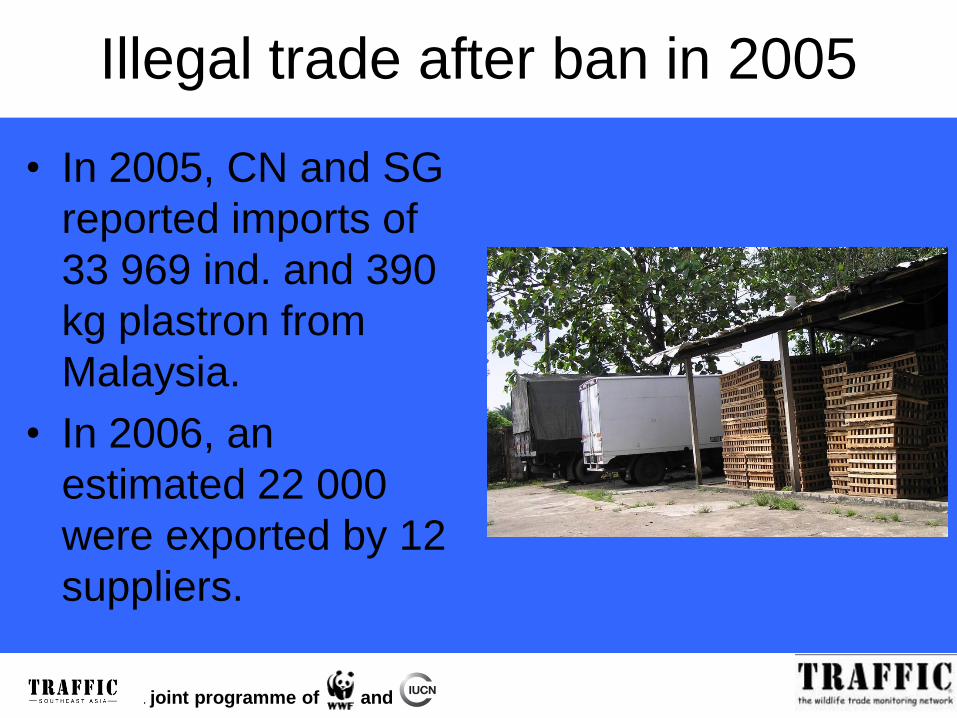
TRAFFIC is a joint programme of and
Illegal trade after ban in 2005
• In 2005, CN and SG
reported imports of
33 969 ind. and 390
kg plastron from
Malaysia.
• In 2006, an
estimated 22 000
were exported by 12
suppliers.
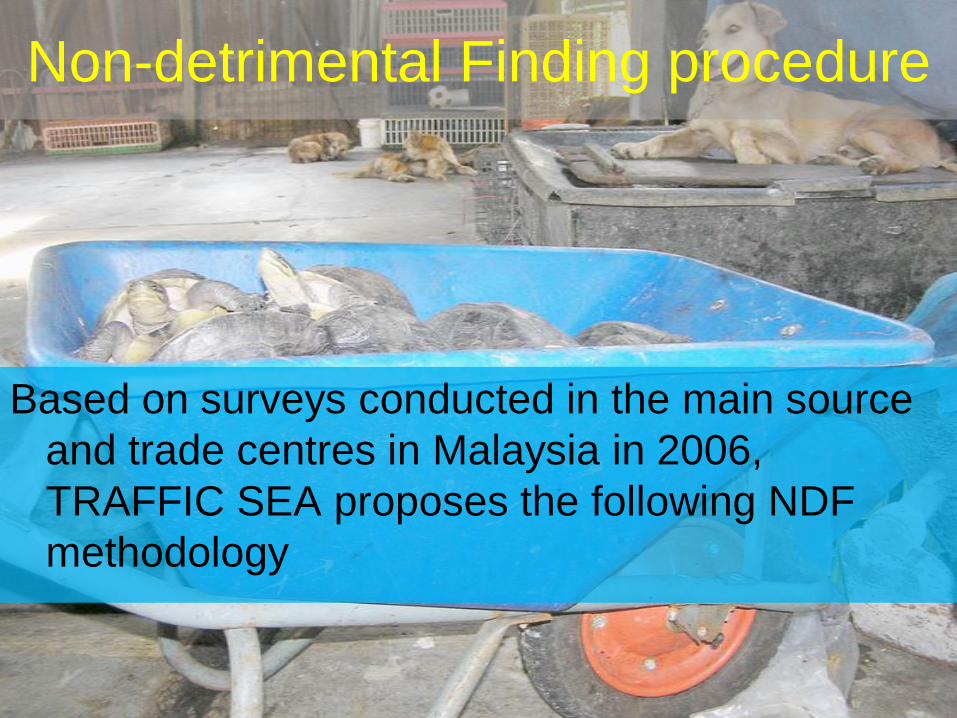
Non-detrimental Finding procedure
Based on surveys conducted in the main source
and trade centres in Malaysia in 2006,
TRAFFIC SEA proposes the following NDF
methodology

Risk-assessment checklist
Low confidence in the harvest management
0
1
2
3
4
5
Life historyEcological adaptability
Dispersal
Human tolerance
National distribution
National abundance
National population trend
Information quality
Major threat
Illegal harvest
Management history
Management plan
Aim of harvestQuotas
Harvest in PA
Harvest in strong tenure
Open access harvest
Confidence in harvest …
Monitoring method
Confidence in monitoring
Effect of harvest
Species conservation …
Habitat conservation …
Proportion protected …
Effectiveness of protection
Regulation of harvest
TRAFFIC 2006

TRAFFIC is a joint programme of and
Survey Sites
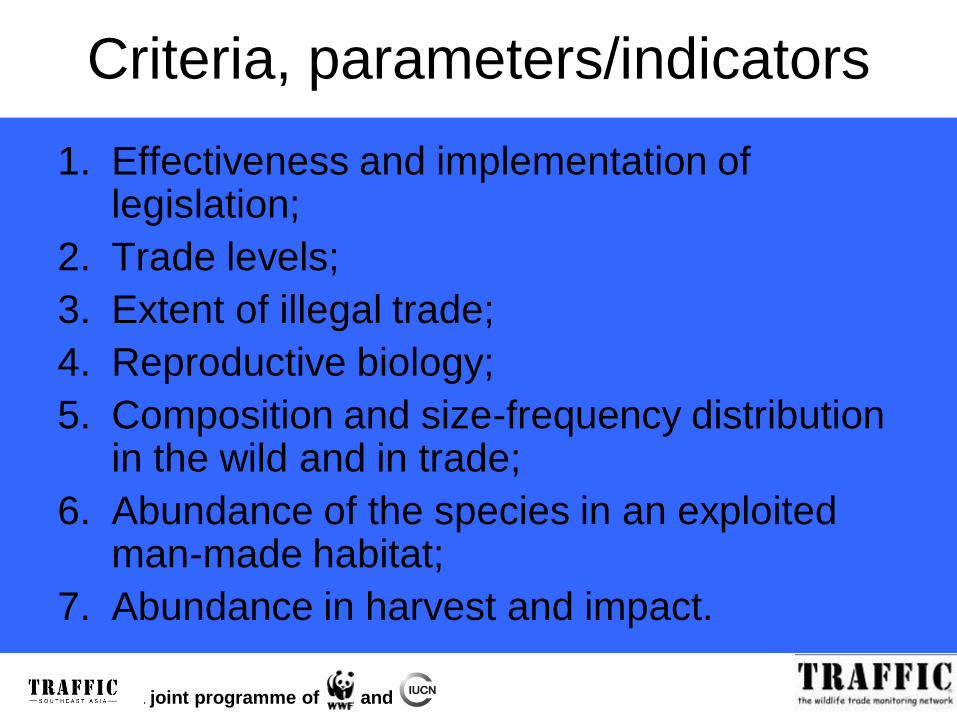
TRAFFIC is a joint programme of and
Criteria, parameters/indicators
1. Effectiveness and implementation of legislation;
2. Trade levels;
3. Extent of illegal trade;
4. Reproductive biology;
5. Composition and size-frequency distribution in the wild and in trade;
6. Abundance of the species in an exploited man-made habitat;
7. Abundance in harvest and impact.

TRAFFIC is a joint programme of and
Legislation / Enforcement / Trade levels
• CITES MA annual reports,
• CITES Trade Database,
• Herpetologists,
• Traders,
• Seizure records,
• Press releases, and
• Actual surveys.

TRAFFIC is a joint programme of and
Legislation and Enforcement
Weak enforcement;
Illegal trade major issue:
• Among the 6 main routes for illegal
international trade from Indonesia, 3 go to
Malaysia (Schoppe, in prep.):
1. Medan to Hong Kong and Penang,
2. Tanjung Balai to Hong Kong, China, and
Malaysia; and
3. Pekanbaru to Malaysia and Singapore.
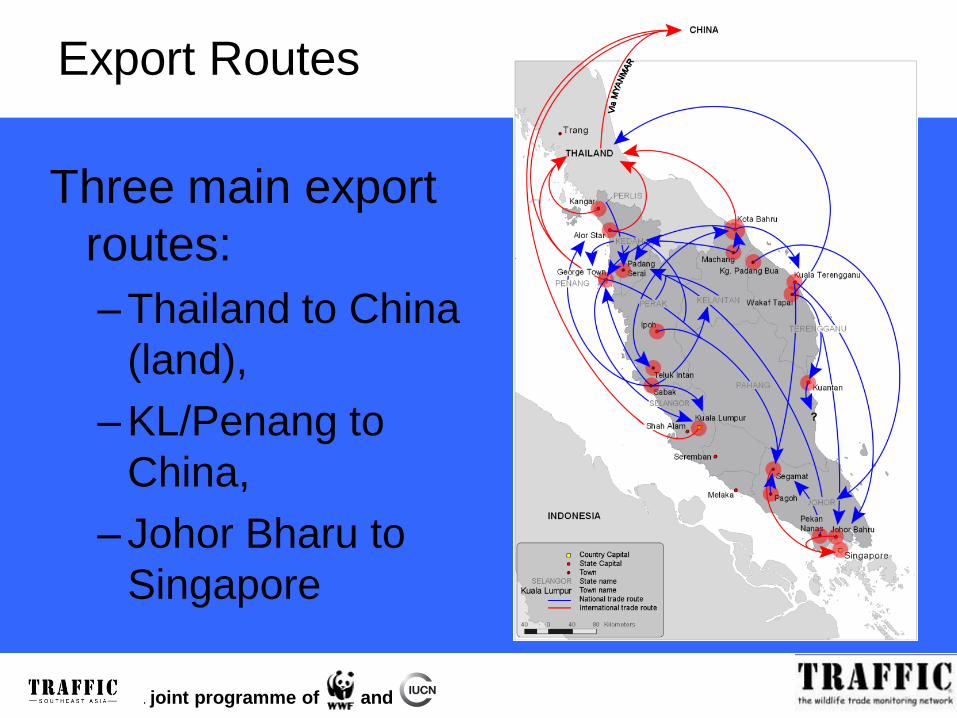
TRAFFIC is a joint programme of and
Export Routes
Three main export
routes:
– Thailand to China
(land),
– KL/Penang to
China,
– Johor Bharu to
Singapore

TRAFFIC is a joint programme of and
Trade levels
• Remains among most abundantly traded
turtle species;
• 19.5% admitted that they are involved in
international trade in Peninsular;
• 23 of 38 traders supply the international
market;
• Among 9 exporters, 6 stopped and 3
continued after ban.

TRAFFIC is a joint programme of and
Reproduction biology / breeding
• Published and unpublished material enriched with observations during field surveys:
Low reproductive rate:
Vulnerable for exploitation;
Captive breeding tried but not economically feasible;
Reports of captive bred ind. must be erroneous.

TRAFFIC is a joint programme of and
Baseline data on size
Mean ± SD and range in median carapace length (mm) of C.
amboinensis collected in Malaysia and Indonesia in 2006.
Source Wild Remarks
Peninsular 104.8±41.7
(65.5-188.0), n=24
Human-modified (plantation),
mark-recapture study
Peninsular Malaysia
and Sarawak173.3±25.3
(56.6-215.0), n=616
Presumably various habitats,
trade
Kalimantan,
Indonesia168.1±28.5
(70.0-215.0), n=654
Natural flood plain, trade
A decrease in mean size in trade over time is probably result of
ongoing long-term exploitation,
Smaller mean size in trade compared to protected wild is
probably results of long-term removal of adults.

TRAFFIC is a joint programme of and
Size-frequency in Trade
Peninsular (n=600), Sarawak (n=33)
0
20
40
60
80
100
120
140
50 60 70 80 90 100 110 120 130 140 150 160 170 180 190 200 210 220 230
Size classes
Fre
qu
ency
Peninsular Sarawak
18 traders in PM, 7 private individuals, shops and
temples in Sarawak
98%
88%

TRAFFIC is a joint programme of and
0
1
2
3
4
5
6
7
50 60 70 80 90 100 110 120 130 140 150 160 170 180 190
Fre
quen
cy
Size class
Oil palm plantation, 10 mm intervals, n=24
adults
Size-frequency in an exploited plantation
Mark recapture survey in Selangor
juveniles

TRAFFIC is a joint programme of and
Sex ratio
• 1M:1.6F Peninsular Malaysia, trade;
• 1M:1.2F Sarawak, trade:
• 1M:1.5F Peninsular, mark-recapture,
plantation.
Is harvest exceeding sustainable levels?
Does the sex ratio changes over time?
monitor sex ratio!

TRAFFIC is a joint programme of and
Abundance in the wild
Mark-recapture survey in a 29ha plantation
in Selangor for 38 days
Population size estimate after Schumacher
and Eschmeyer (Krebs, 1998)
• 24 individuals caught
• 24 estimated population size
• 0.82 individuals/ha estimated density
probably too low to sustain reproduction!

TRAFFIC is a joint programme of and
Abundance in harvest
• The purchase of 2 suppliers was assessed
for 38 days in Selangor
• Mainly (all) from plantations
Supplier Total Mean/day Mean/month Mean/year
I 208 5.5 164.2 1970.5
II 177 4.7 139.7 1676.8Total I & II 385 10.1 303.9 3647.4Mean I & II 192.5 5.1 152.0 1823.7

TRAFFIC is a joint programme of and
Catch per unit effort (CPUE)
• In an exploited but natural habitat in
Indonesia one trader can collect about
twice as many (3351 ind./year).
• Is catch lower due to habitat conditions?
man-made versus natural habitat
• Catch per unit effort (CPUE) stable
sustainable
• CPUE decreases over-exploitation

TRAFFIC is a joint programme of and
Abundance as result of harvest impact
• Interviews with residents, farmers,
plantation workers, collectors, traders, etc.
Populations are over-exploited or
locally extinct in every State
Most especially around trade centres /
cities
Less common than 5-10 years ago.

TRAFFIC is a joint programme of and
Evaluation, Problems and
Recommendation
Indonesia and Malaysia

TRAFFIC is a joint programme of and
Evaluation
• Lack of density / population size
• Lack of abundance data from different
habitats and under different
exploitation pressure
• Current issues and problems were
sufficiently indentified and quantified
TRAFFIC is a joint programme of and
Problems and Challenges
• Enormous extent of illegal trade
• Long chain of people involved in the illegal
business
• Lack of exact distribution and abundance
data
• Four distinct subspecies, but the NDF
needs to be for the species level

TRAFFIC is a joint programme of and
Conclusions & Recommendations
• Stop illegal trade
• Surveys to determine the exact distribution
and abundance
• NDF without abundance data and
population dynamics remains a
compromise unless further bolstered by
subsequently available information
incorporated into a monitoring system that
supports an ‘adaptive management’
framework.

TRAFFIC is a joint programme of and
In the absence of quantitative data
Indicators of change should be assessed:
1.If collection areas are getting
increasingly further away from urban
trade centres.
2.If catch-per-unit-effort (CPUE) is
decreasing.
3.If threats other than trade are getting
more severe.

TRAFFIC is a joint programme of and
Indicators of change (cont.)
4. If average size of individuals is
reduced.
5. If the population structure of traded
individuals is significantly in favour
of one life history stage.
6. If the sex ratio of any population is
significantly different from 1:1.
TRAFFIC is a joint programme of and
Potential indicators of illegal trade
• If collection of the species is fulltime
business for collectors/trappers.
• Sudden changes in the international market
prices are usually indicators of illegal
activity.
– Price paid to legal sources by main importing
countries decreases once an illegal shipment
has arrived and undercut market prices.

TRAFFIC is a joint programme of and
How, where and when?
• Potential sources of information:
– collectors, middlemen, suppliers, exporters,
– data from importing countries,
– CITES MA and SA,
– published or unpublished reports, and
– grey literature.
• At trade centres, annually, at the same time
of the year and at the same sites

TRAFFIC is a joint programme of and
Acknowledgement
• CITES Secretariat and Workshop Organizers
• Chairs of working group
• TRAFFIC International and Southeast Asia
• British High Commission in Kuala Lumpur, and the US State Department
• My colleagues at TSEA, local counterparts, research assistants, guides and translators, and traders
• GOs and NGOs, the academe and private persons
• IUCN/SSC Tortoise and Freshwater Turtle Specialist Group
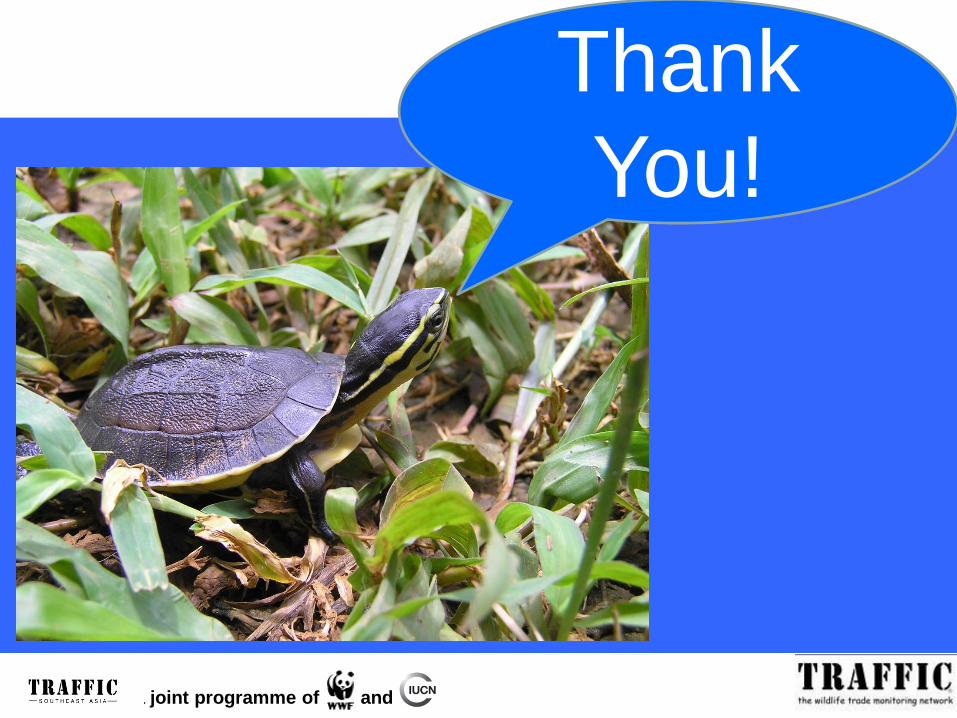
TRAFFIC is a joint programme of and
Thank
You!
Related Documents