Research Reprogramming of miRNA networks in cancer and leukemia Stefano Volinia, 1,2,3 Marco Galasso, 1 Stefan Costinean, 2 Luca Tagliavini, 1 Giacomo Gamberoni, 1 Alessandra Drusco, 2 Jlenia Marchesini, 1 Nicoletta Mascellani, 1 Maria Elena Sana, 1 Ramzey Abu Jarour, 4 Caroline Desponts, 4 Michael Teitell, 5 Raffaele Baffa, 6 Rami Aqeilan, 2 Marilena V. Iorio, 7 Cristian Taccioli, 2 Ramiro Garzon, 2 Gianpiero Di Leva, 2 Muller Fabbri, 2 Marco Catozzi, 1 Maurizio Previati, 1 Stefan Ambs, 8 Tiziana Palumbo, 2 Michela Garofalo, 2 Angelo Veronese, 2 Arianna Bottoni, 2 Pierluigi Gasparini, 2 Curtis C. Harris, 8 Rosa Visone, 2 Yuri Pekarsky, 2 Albert de la Chapelle, 2 Mark Bloomston, 2 Mary Dillhoff, 2 Laura Z. Rassenti, 9 Thomas J. Kipps, 9 Kay Huebner, 2 Flavia Pichiorri, 2 Dido Lenze, 10 Stefano Cairo, 11 Marie-Annick Buendia, 11 Pascal Pineau, 12 Anne Dejean, 12 Nicola Zanesi, 2 Simona Rossi, 13 George A. Calin, 13 Chang-Gong Liu, 13 Jeff Palatini, 2 Massimo Negrini, 1 Andrea Vecchione, 14 Anne Rosenberg, 15 and Carlo M. Croce 2,16 1–15 [A complete list of author affiliations appears at the end of the paper before the Acknowledgments section.] We studied miRNA profiles in 4419 human samples (3312 neoplastic, 1107 nonmalignant), corresponding to 50 normal tissues and 51 cancer types. The complexity of our database enabled us to perform a detailed analysis of microRNA (miRNA) activities. We inferred genetic networks from miRNA expression in normal tissues and cancer. We also built, for the first time, specialized miRNA networks for solid tumors and leukemias. Nonmalignant tissues and cancer networks displayed a change in hubs, the most connected miRNAs. hsa-miR-103/106 were downgraded in cancer, whereas hsa-miR-30 became most prom- inent. Cancer networks appeared as built from disjointed subnetworks, as opposed to normal tissues. A comparison of these nets allowed us to identify key miRNA cliques in cancer. We also investigated miRNA copy number alterations in 744 cancer samples, at a resolution of 150 kb. Members of miRNA families should be similarly deleted or amplified, since they repress the same cellular targets and are thus expected to have similar impacts on oncogenesis. We correctly identified hsa-miR-17/92 family as amplified and the hsa-miR-143/145 cluster as deleted. Other miRNAs, such as hsa-miR-30 and hsa-miR-204, were found to be physically altered at the DNA copy number level as well. By combining differential expression, genetic networks, and DNA copy number alterations, we confirmed, or discovered, miRNAs with comprehensive roles in cancer. Finally, we experimentally validated the miRNA network with acute lymphocytic leukemia originated in Mir155 transgenic mice. Most of miRNAs deregulated in these transgenic mice were located close to hsa-miR-155 in the cancer network. [Supplemental material is available online at http://www.genome.org. The microarray data from this study have been submitted to ArrayExpress (http://www.ebi.ac.uk/microarray-as/ae) under accessionnos. E-TABM-969–E-TABM-975.] Characterization of genes that control the timing of larval de- velopment in Caenorhabditis elegans revealed two small regulatory RNAs, lin-4 and let-7 (Reinhart et al. 2000). Soon thereafter, lin-4 and let-7 were reported to represent a new class of small RNAs, named microRNAs (miRNAs) (Lagos-Quintana et al. 2001; Lau et al. 2001; Lee and Ambros 2001). miRNAs have since been found in plants, green algae, viruses, and animals (Griffiths-Jones et al. 2008). The number of mature miRNAs in the human genome has now surpassed 1000 (Ruby et al. 2006, 2007; Landgraf et al. 2007). Baek et al. (2008) used quantitative mass spectrometry to measure the proteome response as a function of miRNA activity. Although some targets were repressed without changes in mRNA levels, those translationally repressed by more than a third also displayed mRNA destabilization and, for the most highly repressed targets, mRNA destabilization usually was the major component of re- pression. In the same manner, another group (Selbach et al. 2008) showed that a single miRNA can repress the production of hun- dreds of proteins, typically in a mild fashion. They too demon- strated that miRNAs down-regulate target mRNA levels. Evolutionarily conserved among distant organisms, miRNAs are involved in a variety of biological processes, including cell cycle regulation, differentiation, development, metabolism, neuronal patterning, and aging (Bartel 2009). Alterations in miRNA ex- pression are also involved in the initiation, progression, and me- tastasis of human tumors (Spizzo et al. 2009). Germline mutations in the hsa-miR-15a and hsa-miR-16-1 cluster are associated with familial chronic lymphocytic leukemia (CLL), whereas a common SNP in pre-hsa-miR-146a decreases mature miRNA expression and predisposes to papillary thyroid carcinoma. Furthermore, Mir155 16 Corresponding author. E-mail [email protected]; fax (614) 292-4110. Article is online at http://www.genome.org/cgi/doi/10.1101/gr.098046.109. 20:589–599 Ó 2010 by Cold Spring Harbor Laboratory Press; ISSN 1088-9051/10; www.genome.org Genome Research 589 www.genome.org

Welcome message from author
This document is posted to help you gain knowledge. Please leave a comment to let me know what you think about it! Share it to your friends and learn new things together.
Transcript
Research
Reprogramming of miRNA networksin cancer and leukemiaStefano Volinia,1,2,3 Marco Galasso,1 Stefan Costinean,2 Luca Tagliavini,1
Giacomo Gamberoni,1 Alessandra Drusco,2 Jlenia Marchesini,1 Nicoletta Mascellani,1
Maria Elena Sana,1 Ramzey Abu Jarour,4 Caroline Desponts,4 Michael Teitell,5
Raffaele Baffa,6 Rami Aqeilan,2 Marilena V. Iorio,7 Cristian Taccioli,2 Ramiro Garzon,2
Gianpiero Di Leva,2 Muller Fabbri,2 Marco Catozzi,1 Maurizio Previati,1 Stefan Ambs,8
Tiziana Palumbo,2 Michela Garofalo,2 Angelo Veronese,2 Arianna Bottoni,2
Pierluigi Gasparini,2 Curtis C. Harris,8 Rosa Visone,2 Yuri Pekarsky,2 Albert de la Chapelle,2
Mark Bloomston,2 Mary Dillhoff,2 Laura Z. Rassenti,9 Thomas J. Kipps,9 Kay Huebner,2
Flavia Pichiorri,2 Dido Lenze,10 Stefano Cairo,11 Marie-Annick Buendia,11 Pascal Pineau,12
Anne Dejean,12 Nicola Zanesi,2 Simona Rossi,13 George A. Calin,13 Chang-Gong Liu,13
Jeff Palatini,2 Massimo Negrini,1 Andrea Vecchione,14 Anne Rosenberg,15
and Carlo M. Croce2,16
1–15[A complete list of author affiliations appears at the end of the paper before the Acknowledgments section.]
We studied miRNA profiles in 4419 human samples (3312 neoplastic, 1107 nonmalignant), corresponding to 50 normal tissuesand 51 cancer types. The complexity of our database enabled us to perform a detailed analysis of microRNA (miRNA)activities. We inferred genetic networks from miRNA expression in normal tissues and cancer. We also built, for the first time,specialized miRNA networks for solid tumors and leukemias. Nonmalignant tissues and cancer networks displayed a change inhubs, the most connected miRNAs. hsa-miR-103/106 were downgraded in cancer, whereas hsa-miR-30 became most prom-inent. Cancer networks appeared as built from disjointed subnetworks, as opposed to normal tissues. A comparison of thesenets allowed us to identify key miRNA cliques in cancer. We also investigated miRNA copy number alterations in 744 cancersamples, at a resolution of 150 kb. Members of miRNA families should be similarly deleted or amplified, since they repress thesame cellular targets and are thus expected to have similar impacts on oncogenesis. We correctly identified hsa-miR-17/92family as amplified and the hsa-miR-143/145 cluster as deleted. Other miRNAs, such as hsa-miR-30 and hsa-miR-204, werefound to be physically altered at the DNA copy number level as well. By combining differential expression, genetic networks,and DNA copy number alterations, we confirmed, or discovered, miRNAs with comprehensive roles in cancer. Finally, weexperimentally validated the miRNA network with acute lymphocytic leukemia originated in Mir155 transgenic mice. Most ofmiRNAs deregulated in these transgenic mice were located close to hsa-miR-155 in the cancer network.
[Supplemental material is available online at http://www.genome.org. The microarray data from this study have beensubmitted to ArrayExpress (http://www.ebi.ac.uk/microarray-as/ae) under accession nos. E-TABM-969–E-TABM-975.]
Characterization of genes that control the timing of larval de-
velopment in Caenorhabditis elegans revealed two small regulatory
RNAs, lin-4 and let-7 (Reinhart et al. 2000). Soon thereafter, lin-4
and let-7 were reported to represent a new class of small RNAs,
named microRNAs (miRNAs) (Lagos-Quintana et al. 2001; Lau
et al. 2001; Lee and Ambros 2001). miRNAs have since been found
in plants, green algae, viruses, and animals (Griffiths-Jones et al.
2008). The number of mature miRNAs in the human genome has
now surpassed 1000 (Ruby et al. 2006, 2007; Landgraf et al. 2007).
Baek et al. (2008) used quantitative mass spectrometry to measure
the proteome response as a function of miRNA activity. Although
some targets were repressed without changes in mRNA levels,
those translationally repressed by more than a third also displayed
mRNA destabilization and, for the most highly repressed targets,
mRNA destabilization usually was the major component of re-
pression. In the same manner, another group (Selbach et al. 2008)
showed that a single miRNA can repress the production of hun-
dreds of proteins, typically in a mild fashion. They too demon-
strated that miRNAs down-regulate target mRNA levels.
Evolutionarily conserved among distant organisms, miRNAs
are involved in a variety of biological processes, including cell cycle
regulation, differentiation, development, metabolism, neuronal
patterning, and aging (Bartel 2009). Alterations in miRNA ex-
pression are also involved in the initiation, progression, and me-
tastasis of human tumors (Spizzo et al. 2009). Germline mutations
in the hsa-miR-15a and hsa-miR-16-1 cluster are associated with
familial chronic lymphocytic leukemia (CLL), whereas a common
SNP in pre-hsa-miR-146a decreases mature miRNA expression and
predisposes to papillary thyroid carcinoma. Furthermore, Mir155
16Corresponding author.E-mail [email protected]; fax (614) 292-4110.Article is online at http://www.genome.org/cgi/doi/10.1101/gr.098046.109.
20:589–599 � 2010 by Cold Spring Harbor Laboratory Press; ISSN 1088-9051/10; www.genome.org Genome Research 589www.genome.org
transgenic mice show proliferation of pre-B cells and develop
lymphoblastic leukemia/high-grade lymphoma. Mice overex-
pressing mmu-miR-17/92 in lymphocytes develop lymphopro-
liferative disease and autoimmunity. hsa-miR-10b, hsa-miR-373,
and hsa-miR-520c have been reported to promote tumor invasion
and metastasis; whereas, research has shown hsa-miR-335, hsa-
miR-206, and hsa-miR-126 to be suppressors of breast cancer me-
tastasis. Moreover, reduced expression of Dicer and Drosha miRNA
processors has been observed in various human cancers. Several
transcription factors regulate the expression of miRNAs, e.g., the
tumor suppressor protein TP53 regulates the expression of hsa-
miR-34 family members; MYC is a negative regulator of miRNA
expression; STAT3 regulates hsa-miR-21; and TWIST1 trans-activates
hsa-miR-10b transcription. The consequences of altered patterns
of miRNA expression are just starting to be understood (Spizzo
et al. 2009). Insensitivity to anti-growth signals is achieved by in-
hibition of E2F transcription factors caused by overexpression of
the hsa-miR-17/92 cluster on chromosome 13q31.1 and by over-
expression of the hsa-miR-106b/25 cluster on chromosome
7q22.1. Modulation of apoptosis may occur by direct regulation of
miRNAs that are: proapoptotic (TP53 and hsa-miR-34 family) or by
targeting of anti-apoptotic proteins (BCL2, MCL1 proteins, and
the hsa-miR-15/16 cluster).
Much of the current effort in miRNA studies is focused on the
elucidation of their function. Typically miRNAs have been studied
by using the gene profiling approach. Each miRNA has been
studied for its single contribution to differential expression or to
a compact predictive signature. However, the effect of miRNAs on
cell pathology and physiology is likely to be complex for two rea-
sons: (1) their activity is exerted in a one-to-many fashion, such
that each miRNA can control translation of tens or even hundreds
of different coding messengers and (2) a single messenger can be
controlled by more than one miRNA. Thus, we propose a paradigm
shift to the study of miRNAs in cancer by applying a systems bi-
ology approach. For this purpose we built miRNA gene networks
by using our very large expression miRNA database.
Previously, Yoon and De Micheli (2005) and Tran et al. (2008)
used computational methods to predict miRNA regulatory mod-
ules. Yoon based his approach solely on miRNA:mRNA inter-
actions as predicted by TargetScan, without expression data. Tran
and colleagues studied the correlation between the expression of
121 miRNAs and their 801 targets (as predicted by PicTar) in 89
human cancer samples.
We built our miRNA networks exclusively from miRNA ex-
pression data. Here, we report the first miRNA network from nor-
mal tissues. In parallel, we built miRNA networks for coupled
cancerous and noncancerous tissues. By comparing normal to
cancer networks we attained a second goal: the identification of
cancer variations in miRNA networks. Finally, we superimposed
DNA variations onto expression data to generate a comprehensive
miRNA alteration map in cancer.
Results and Discussion
The miRNA network in normal tissues
We assayed mature miRNAs in 17 groups of normal human tissues,
from a total of 1107 chips. Tissue specificity was calculated by
using the information content (IC) according to Landgraf et al.
(2007) who measured expression levels by sequencing cloned
miRNAs. The most tissue-specific miRNAs are the members of the
hsa-miR-302 cluster, as shown in Supplemental Figure 1 and Sup-
plemental Tables I and III. hsa-miR-302a/b/c were expressed in
embryonic samples.
Complexity of genetic regulatory mechanisms in higher or-
ganisms is thought to also be achieved through controlled and
coordinated networks of miRNAs. We exploited our microarray
database to generate miRNA networks based exclusively on ex-
pression data. We applied Banjo (Smith et al. 2006) to infer the
Bayesian network for normal tissues. miRNA relations were mod-
eled as graphs where nodes represent the miRNAs and colored
edges the relationships between them. The node degree distribu-
tion of the normal miRNA network is illustrated in Supplemental
Figure 3A. The exponential decrease of both absolute frequency
and inverse cumulative frequency curves shows that there were
a lot more poorly connected nodes than highly connected (hubs).
More than 40% of the nodes had degrees of 1 and almost 75% had
degrees of #2. The normal tissues miRNA graph thus presented
a scale free behavior. The highest degree hub was hsa-miR-16,
followed by hsa-miR-215.
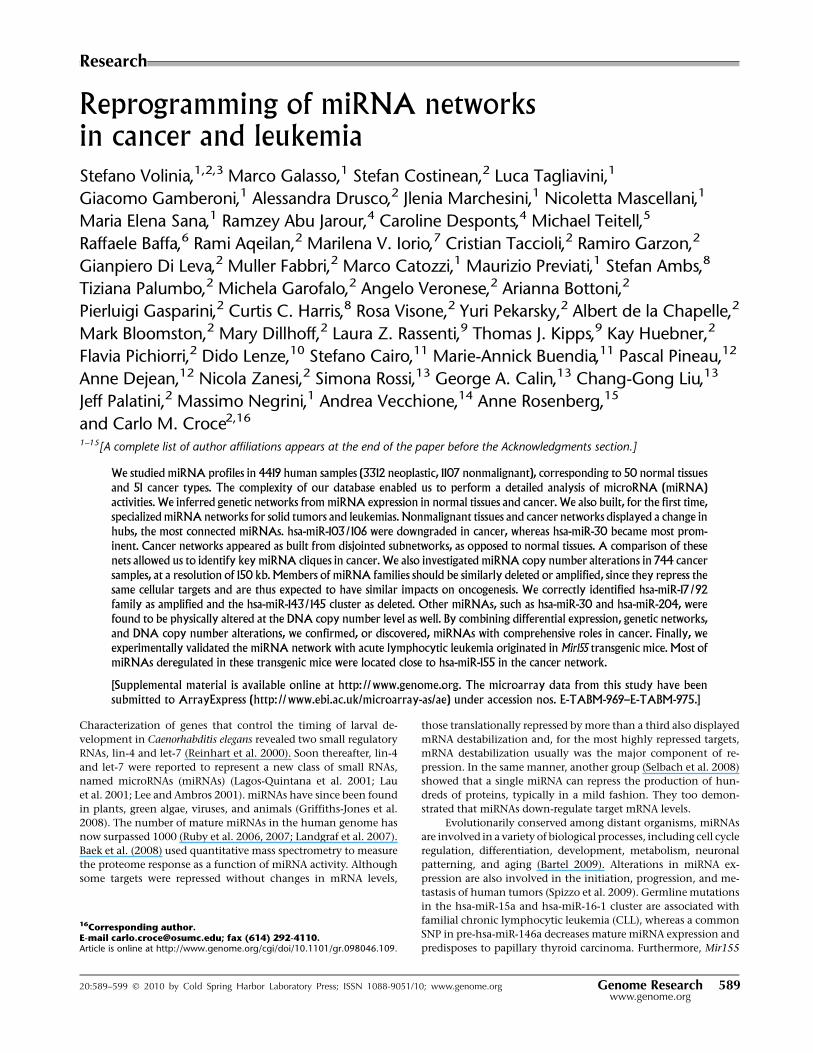
To discover miRNA groups with highly related expression
patterns we extracted coherent groups of nodes by adopting clus-
tering algorithms. Other researchers have developed algorithms
to extract clusters (i.e., groups of densely connected nodes) from
biological nets and we chose the MCL graph-based algorithm
(Enright et al. 2002). This algorithm, which was implemented in
Neat, (Brohee et al. 2008) has been shown to enable good perfor-
mance in extracting coregulated genes from transcriptomes. Figure
1 displays the miRNA network of normal tissues, obtained from
over 1000 samples and 50 cell types/tissues. We used all of the
expressed miRNAs to build the Bayesian networks (rather than
only the differentially expressed ones). The MCL clusters with high
coexpression patterns throughout normal tissues are linked by spe-
cific colored edges. miRNAs are generally connected as expected
from the published literature. For example, hsa-miR-133a/b was
in a cluster with hsa-miR-1 (light orange) and all were involved
in skeletal muscle proliferation and differentiation (Chen et al.
2006). A close cluster is hsa-miR-10a/b and hsa-miR-214 (green).
hsa-miR-214 is expressed during early segmentation stages in so-
mites and can modulate the expression of genes regulated by
Hedgehog. Inhibition of hsa-miR-214 results in a reduction or loss
of slow-muscle cell types (Flynt et al. 2007). Perhaps not surpris-
ingly these muscle/differentiation clusters are linked to hsa-miR-
143/145, a miRNA capable of pushing ES cells to differentiate (Xu
et al. 2009). The top, right proliferation cluster hsa-miR-106a/b/93
(Petrocca et al. 2008) to hsa-miR-20a/17 and to hsa-miR-25/92a
(MYC-associated) includes hsa-miR-223 (Spizzo et al. 2009) and is
involved in cell cycle progression (Ivanovska et al. 2008). The hsa-
miR-145 node links the proliferation clusters described above to
the muscle differentiation clusters. This link might explain why
the loss of hsa-miR-145 in cancer leads to an undifferentiated cel-
lular state. The hsa-miR-29 family, that targets the anti-apoptotic
protein MCL1 and plays a role in the TP53 pathway (Park et al.
2009) is linked to hsa-miR-30 and to hsa-miR-15/16, miRNAs
that target the anti-apoptotic protein BCL2 (Spizzo et al. 2009).
Overexpression of hsa-miR-29a leads to epithelial-to-mesenchymal
transition (EMT) and metastasis, in cooperation with oncogenic
Ras signaling (Gebeshuber et al. 2009). hsa-miR-221-222, regula-
tors of the cell cycle, together with hsa-miR-206, hsa-miR-155
(pre-B cell proliferation), and hsa-miR-130a/b are in a yellow cluster
(Spizzo et al. 2009). In the top center of the graph, hsa-miR-194
and hsa-miR-192 connect to hsa-miR-215, within a purple cluster
associated with TP53 activation (Braun et al. 2008). In a close
branch the hsa-miR-200 family, hsa-miR-203 and hsa-miR-205 are
590 Genome Researchwww.genome.org
Volinia et al .
directly involved in TGF-beta-mediated EMT and differentiation
(Spizzo et al. 2009). hsa-miR-181 family members are involved in
B- and T-lineage and myoblast differentiation (Chen et al. 2004;
Naguibneva et al. 2006; Li et al. 2007). hsa-miR-181, hsa-miR-200,
hsa-miR-205, and hsa-miR-215 are all linked to hsa-miR-145. Thus,
the loss of the hsa-miR-145 hub might also impact the TP53/EMT/
differentiation branch. Another important hub appears to be hsa-
miR-16, which is located in the other half of the net and co-
ordinates hsa-miR-29 and hsa-miR-221/206/155/130 clusters. The
hsa-miR-16 hub also feeds the hsa-miR-26/let-7/hsa-miR-302
branch. hsa-miR-26 is a key gene in hepatocellular carcinoma and
its expression is associated with survival and response to adjuvant
therapy with interferon alpha (Ji et al. 2009). Let-7 regulates Ras
and hsa-miR-302 are expressed in ES cells and other early embry-
onic tissues.
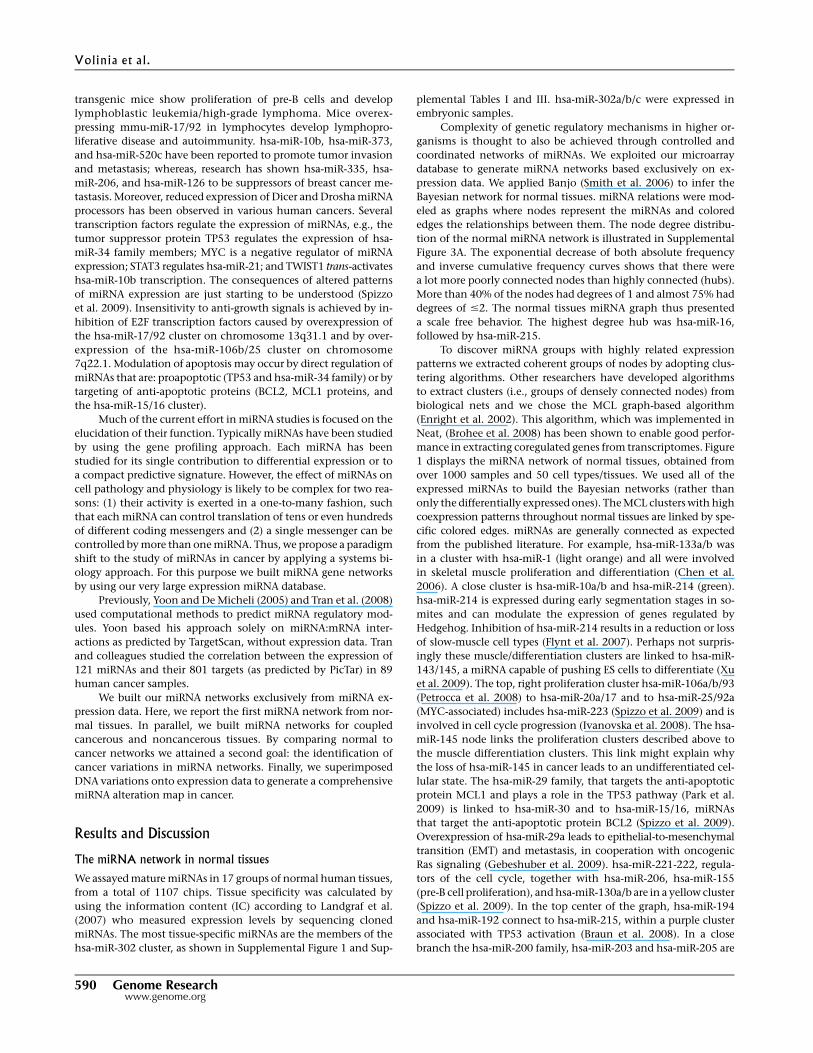
The miRNA networks in solid cancers are reprogrammed
In previous research, we studied six types of solid cancer in about
500 different samples (Volinia et al. 2006). Here, we expanded our
study to 51 types of cancer in 3312 samples (2532 solid cancers and
780 leukemia samples). The results of miRNA differential expres-
sion in solid cancers are listed in Table 1 and in Supplemental Ta-
bles IV and V. They confirm our earlier report and the established
miRNA profiling in cancer. For example, hsa-miR-21 and hsa-miR-
17/20/25/92/103/106/146a were overexpressed, whereas hsa-miR-
203/205 and hsa-miR-143/145 were down-regulated. The KEGG
pie chart in Figure 2 and the corresponding network graphs (Sup-
plemental Figs. 5, 6) show the functional effect of differentially
expressed miRNAs on cellular pathways. The large majority of
the affected pathways is related to cancer or signal transduction
(i.e., Wnt, VEGF, TGF-beta, insulin, phosphatidylinositol signal-
ing, focal adhesion, and colorectal cancer). We also applied the IC
measure to identify cancer-specific miRNAs. The ICs were almost
as high as those measured for the normal tissues, indicating that
there were miRNAs with high cancer-type specificity (Supple-
mental Fig. 4; Supplemental Table VI).
We generated a global miRNA expression network for solid
cancers (Fig. 3). It is important to note that, to build the Bayesian
net, we used all the expressed and varying miRNAs as input, rather
than only using the differentially expressed ones (miRNAs with
low variation were excluded from the analysis). The node degree
distribution of the solid cancer miRNA network is illustrated in
Supplemental Figure 3B. Like the normal tissues miRNA graph, the
solid cancer net also presented a scale-free behavior. In cancer, the
most connected hub was hsa-miR-30c (degree 10), followed by hsa-
miR-16 (degree 6). Whereas, in nonmalignant tissues, hsa-miR-16
was the most connected node (degree 8) and hsa-miR-30c had only
a low degree of 3. Opposite behavior had TP53 regulated hsa-miR-
215 (degree 6 in normal tissues and degree 3 in cancer) and hsa-
miR-103/106a (degree 5 in normal tissues and only degree 1 in
cancer). The exchanges of hubs between nonmalignant and cancer
tissues were the first notable sign of divergences in their respective
miRNA programs. The MCL clustering algorithm was employed to
map the subnetworks with high coexpression patterns (these MCL
clusters, or cliques, are linked by specific colored edges). Addi-
tionally, we color-coded the miRNA nodes according to their dif-
ferential expression in tumors (red, overexpressed; green, down-
regulated). Neighbors preferentially appeared with the same trend,
such that clustered miRNAs were either overexpressed or down-
regulated. For example, hsa-miR-17/20a (chr 13q31.3), hsa-miR-
106a/b (chr Xq26.2 and chr 7q22.1), and hsa-miR-93 (chr 7q22.1)
were all up-regulated in cancers. Conversely, hsa-miR-143/145 (chr
5q32), hsa-miR-133a/b (chr 18q11.2, chr 20q13.3 and chr 6p12.2),
Figure 1. The miRNA network in normal tissues (1107 samples, 50 tissues, 115 miRNAs). The network was inferred for all expressed and varyingmiRNAs, without preselecting for differential expression. Standard Banjo parameters were adopted with a q6 discretization policy. The consensus graphdepicted here was obtained from the best 100 nets (after searching through 8.3 3 109 networks). MCL graph-based clustering algorithm was applied toclusters extraction (miRNAs with highly related expression pattern have edges of the same color); thus, different clusters in the network are linked bydifferent color edges. yEd graph editor (yFiles software) was employed for graphs visualization. See text for further discussion.
microRNA networks are rewired in cancer
Genome Research 591www.genome.org
hsa-miR-214 (chr 1q24.3), and hsa-miR-138 (chr 3p21.33 and chr
16q13), all in the same coexpression clique, were down-regulated.
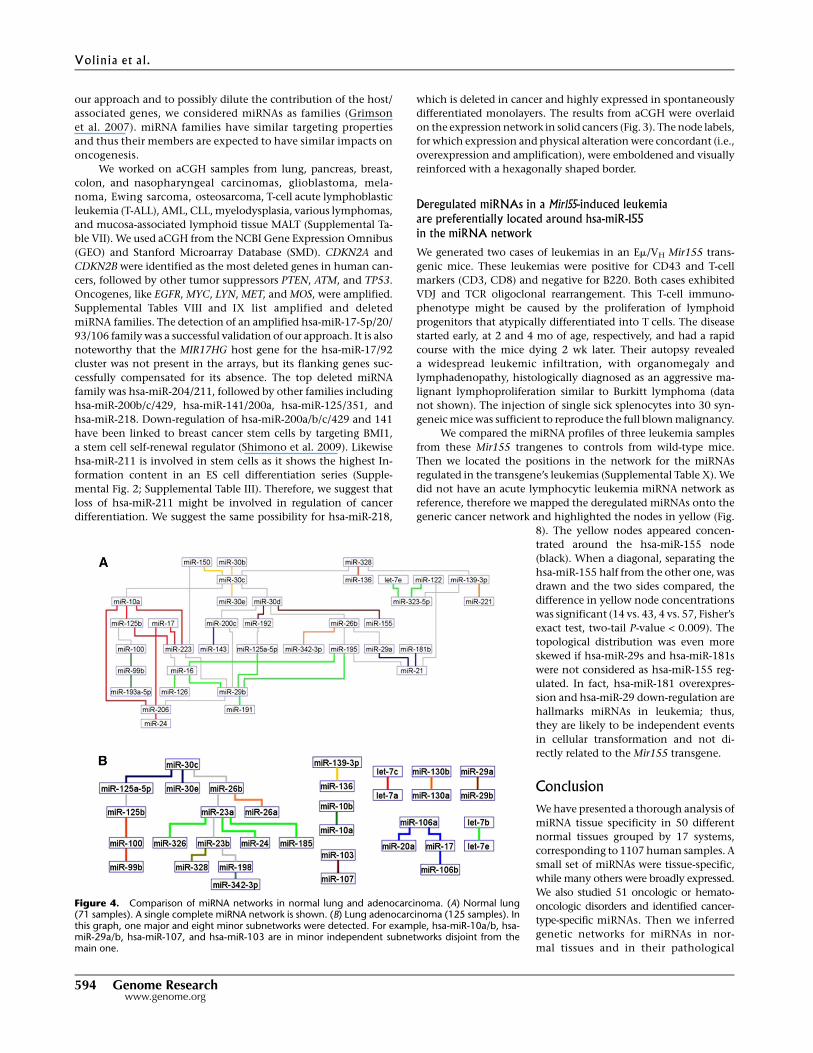
To individually investigate cancer types (lung, colon, breast,
prostate) we built graphs for normal and cancer tissues and applied
MCL to extract miRNA coexpression clusters. Normal lung miR-
Nome was represented by a single complete miRNA network (Fig.
4A), while adenocarcinomas were by one major and eight un-
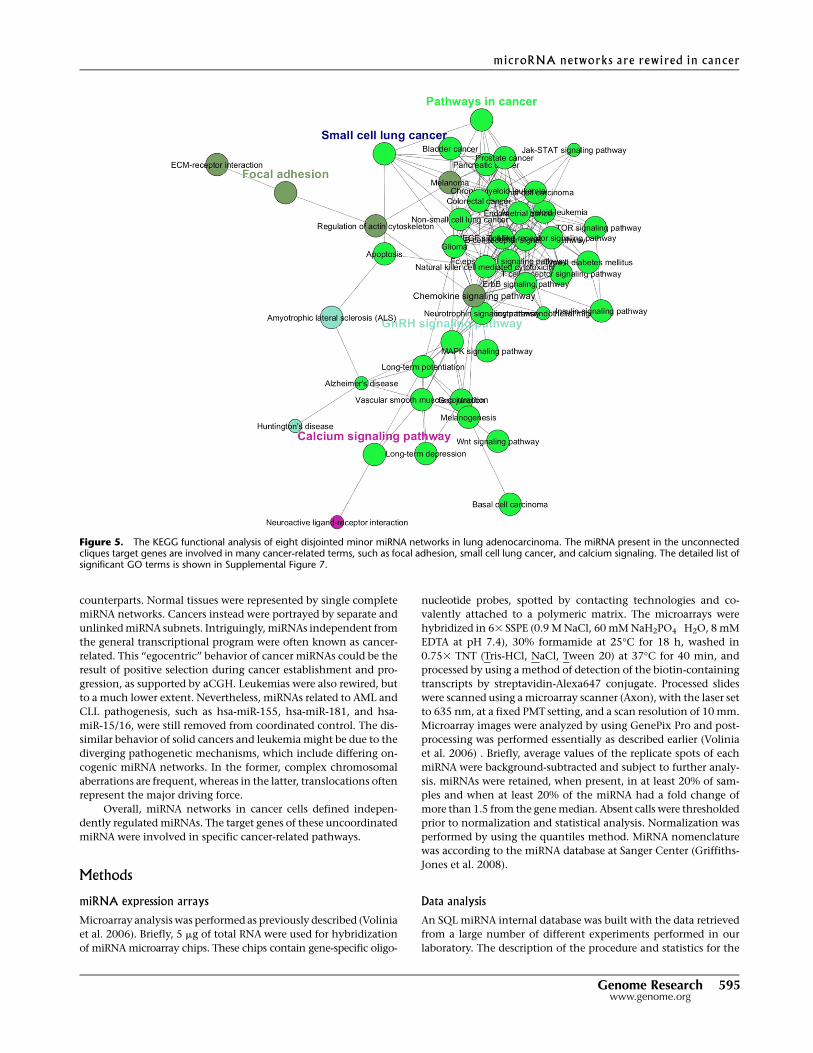
connected subnetworks (Fig. 4B). KEGG functional analysis of the
miRNAs in the eight minor subnetworks unconnected in cancer
showed that they target genes involved in cancer-related pathways
(Fig. 5). Strikingly, a similar situation of disjointed miRNA cliques
was also present in the other cancers we studied, which included:
colon, breast, and prostate cancers (Supplemental Figs. 8–10, re-
spectively). In particular, we identified a number of notable, and
often common, miRNAs in the unconnected cancer clusters. hsa-
miR-10a/b was identified in lung, colon, and breast cancers (Ma
et al. 2007), miR 26a/b in colon and prostate cancers (Kota et al.
2009), hsa-miR-29a/b in breast, colon, and lung cancers (Mott et al.
2007; Gebeshuber et al. 2009), hsa-miR-181 family members in
colon and breast cancers (Spizzo et al. 2009), and hsa-miR-107/
hsa-miR-103 in breast, prostate, lung, and colon cancers (Volinia
et al. 2006). The let-7c/a miRNAs were prominent in colon, lung,
and prostate cancers (Johnson et al. 2005) and hsa-miR-106a/b
(Petrocca et al. 2008), linked to hsa-miR-17 and hsa-miR-20, in
colon and lung cancers. Other miRNA cliques included hsa-miR-
200c (Korpal and Kang 2008), linked to TP53-associated hsa-miR-
192/215 (Braun et al. 2008; Georges et al. 2008), in a colon sub-
network. Thus, miRNA networks were reprogrammed in solid
cancer, and the expression of a few notable miRNAs was inde-
pendent from the major network. The single graph in the overall
solid cancer net can be explained only by the same miRNAs having
variable roles in a range of cancers, such that a miRNA regulates
different targets in different cell types. The cell type and context
specific action of miRNAs has been described often (Spizzo et al.
2009). An extreme example for such a double play is the apparently
controversial role of hsa-miR-29, which acts as a tumor suppressor
in leukemia and an oncogene in solid tumors (Gebeshuber et al.
2009).
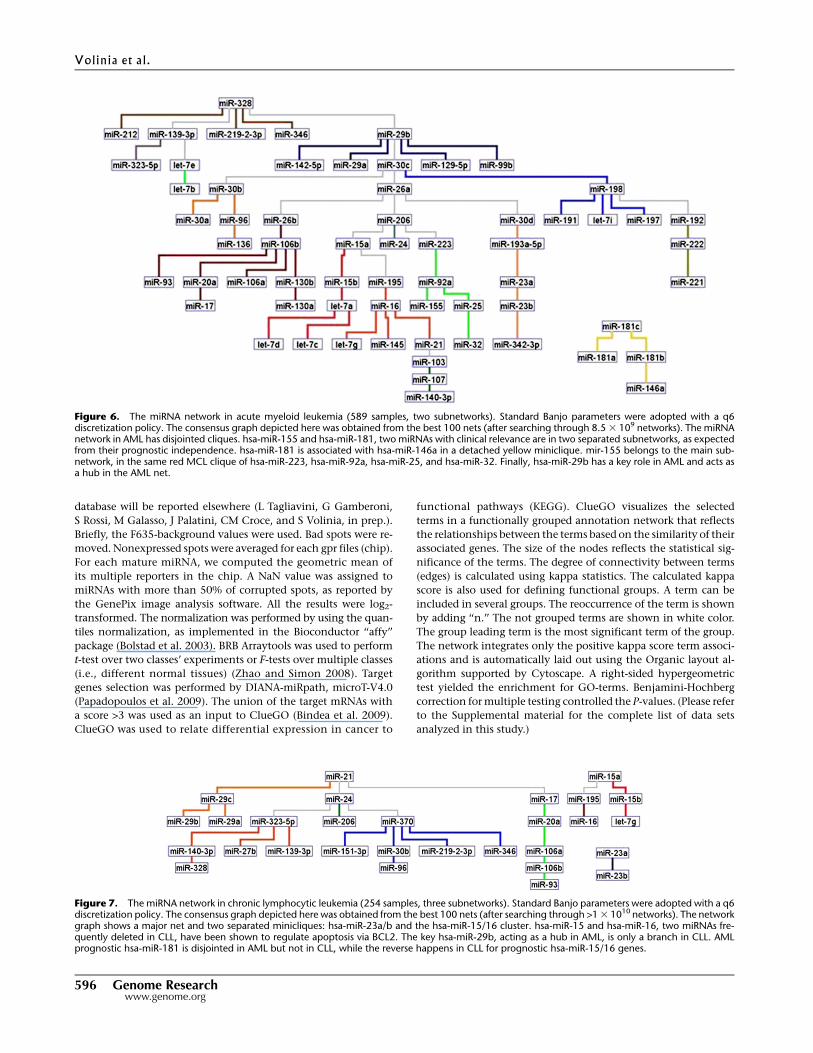
Leukemias confirm that miRNA networksare aberrant in neoplasia
In addition to looking at miRNA networks in solid cancers, we
generated the networks for two hematological cancers, acute my-
eloid leukemia (AML) and chronic lymphocytic leukemia (CLL).
Both of these leukemias have been well characterized in terms of
miRNA profiles and their relations to prognosis. The miRNA net-
work in AML also had disjointed cliques (Fig. 6). The most prom-
inent finding here was that hsa-miR-155 and hsa-miR-181, two
miRNAs with clinical relevance (Debernardi et al. 2007; Marcucci
et al. 2008a,b), were positioned in two separated subnetworks, as
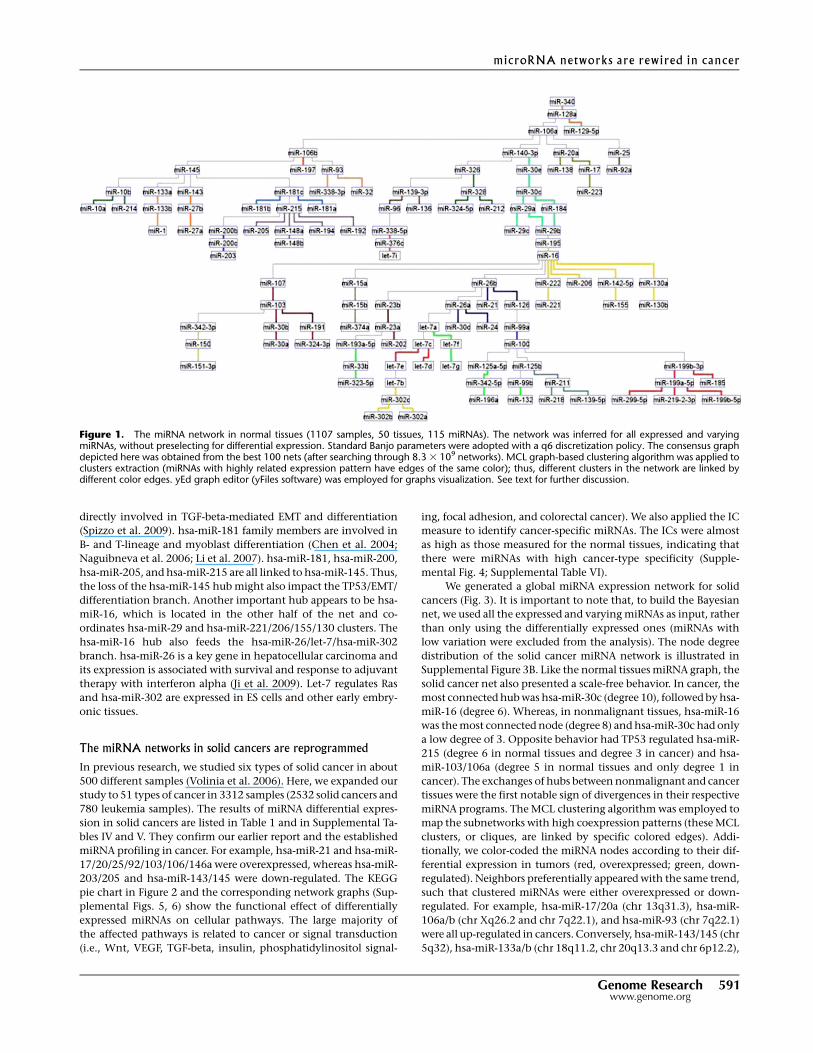
Table 1. Differentially regulated miRNA in solid cancers
ParametricP-value FDR
Intensities insolid cancers
Intensities innormal tissues Fold-change miRNA
Chromosomallocation
<1 3 10�7 <1 3 10�7 967 617.9 1.57 hsa-miR-21 17q23.1<1 3 10�7 <1 3 10�7 1378.2 917.7 1.5 hsa-miR-25 7q22.1<1 3 10�7 <1 3 10�7 902.7 626.3 1.44 hsa-miR-20a 13q31.3<1 3 10�7 <1 3 10�7 925.7 646.9 1.43 hsa-miR-17 13q31.3<1 3 10�7 <1 3 10�7 652.3 469 1.39 hsa-miR-106a Xq26.2<1 3 10�7 <1 3 10�7 410 297.8 1.38 hsa-miR-106b 7q22.1
1.30 3 10�6 1.1 3 10�05 918.8 697.9 1.32 hsa-miR-146a 5q34<1 3 10�7 <1 3 10�7 11893.3 9370.9 1.27 hsa-miR-92a 13q31.3,Xq26.2
1.60 3 10�6 1.2 3 10�5 2354.9 1919.4 1.23 hsa-miR-103 5q35.1,20p13<1 3 10�7 <1 3 10�7 289.4 237.8 1.22 hsa-miR-130b 22q11.21<1 3 10�7 <1 3 10�7 452.7 372 1.22 hsa-miR-93 7q22.1
3.90 3 10�6 2.7 3 10�5 2116.4 1743.6 1.21 hsa-miR-107 10q23.31<1 3 10�7 <1 3 10�7 297.7 248 1.2 hsa-miR-30e 1p34.2
7.4 3 10�6 4.8 3 10�5 225.6 259.4 0.87 hsa-miR-138 16q13,3p21.331 3 10�7 1 3 10�6 220.5 260.2 0.85 hsa-miR-326 11q13.4
3.7 3 10�6 2.6 3 10�5 419.9 507.8 0.83 hsa-miR-193a 17q11.22 3 10�7 1.8 3 10�6 382.5 471.2 0.81 hsa-miR-206 6p12.23 3 10�6 2.2 3 10�05 273.7 349.6 0.78 hsa-miR-205 1q32.2
<1 3 10�7 <1 3 10�7 714.9 1015.1 0.70 hsa-miR-145 5q32<1 3 10�7 <1 3 10�7 275.7 403.0 0.68 hsa-miR-203 14q32.33
Solid cancer samples numbering 2532 vs. 806 corresponding normal samples, at least one class with intensity >250, P-value < 1 3 10�5.
Figure 2. Cellular pathways regulated by differentially expressed miRNAsin cancer. KEGG analysis by ClueGO (Bindea et al. 2009) of pathways(score = 3, P-value < 1 3 10�3) simultaneously targeted by both up-reg-ulated and down-regulated miRNAs (listed in Table 1; Supplemental Ta-bles IV, V). The KEGG pie-chart shows the functional effect of differentiallyexpressed miRNAs on cellular pathways in cancer. The large majority ofthe affected pathways is related to cancer or signal transduction (i.e., Wnt,VEGF, TGF-beta, insulin, and phosphatidylinositol signaling, focal adhe-sion, and colorectal cancer). Target genes selection was performed withDIANA-miRpath, microT-V4.0 (Papadopoulos et al. 2009). The union ofthe target mRNAs with a score above 3 was used as an input to ClueGO.Right-sided hypergeometric test yielded the enrichment for GO terms.Benjamini-Hochberg correction for multiple testing controlled the P-values.GO term fusion was applied for redundancy reduction.
Volinia et al .
592 Genome Researchwww.genome.org
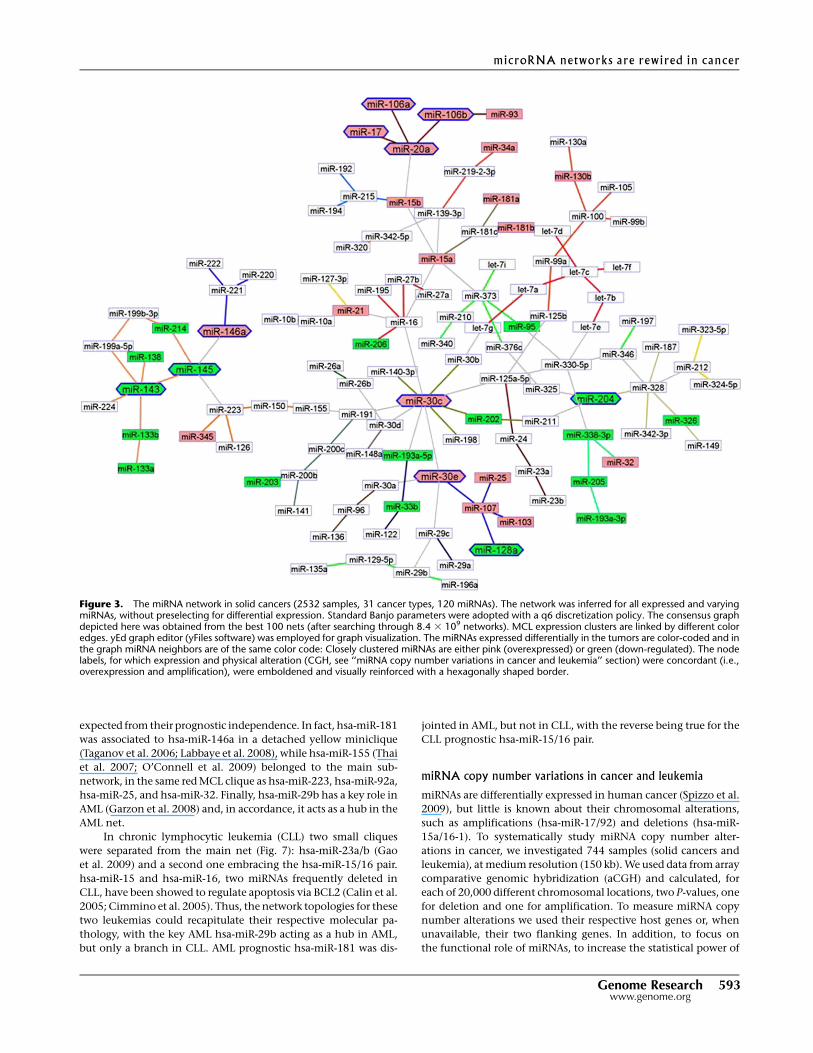
expected from their prognostic independence. In fact, hsa-miR-181
was associated to hsa-miR-146a in a detached yellow miniclique
(Taganov et al. 2006; Labbaye et al. 2008), while hsa-miR-155 (Thai
et al. 2007; O’Connell et al. 2009) belonged to the main sub-
network, in the same red MCL clique as hsa-miR-223, hsa-miR-92a,
hsa-miR-25, and hsa-miR-32. Finally, hsa-miR-29b has a key role in
AML (Garzon et al. 2008) and, in accordance, it acts as a hub in the
AML net.
In chronic lymphocytic leukemia (CLL) two small cliques
were separated from the main net (Fig. 7): hsa-miR-23a/b (Gao
et al. 2009) and a second one embracing the hsa-miR-15/16 pair.
hsa-miR-15 and hsa-miR-16, two miRNAs frequently deleted in
CLL, have been showed to regulate apoptosis via BCL2 (Calin et al.
2005; Cimmino et al. 2005). Thus, the network topologies for these
two leukemias could recapitulate their respective molecular pa-
thology, with the key AML hsa-miR-29b acting as a hub in AML,
but only a branch in CLL. AML prognostic hsa-miR-181 was dis-
jointed in AML, but not in CLL, with the reverse being true for the
CLL prognostic hsa-miR-15/16 pair.
miRNA copy number variations in cancer and leukemia
miRNAs are differentially expressed in human cancer (Spizzo et al.
2009), but little is known about their chromosomal alterations,
such as amplifications (hsa-miR-17/92) and deletions (hsa-miR-
15a/16-1). To systematically study miRNA copy number alter-
ations in cancer, we investigated 744 samples (solid cancers and
leukemia), at medium resolution (150 kb). We used data from array
comparative genomic hybridization (aCGH) and calculated, for
each of 20,000 different chromosomal locations, two P-values, one
for deletion and one for amplification. To measure miRNA copy
number alterations we used their respective host genes or, when
unavailable, their two flanking genes. In addition, to focus on
the functional role of miRNAs, to increase the statistical power of
Figure 3. The miRNA network in solid cancers (2532 samples, 31 cancer types, 120 miRNAs). The network was inferred for all expressed and varyingmiRNAs, without preselecting for differential expression. Standard Banjo parameters were adopted with a q6 discretization policy. The consensus graphdepicted here was obtained from the best 100 nets (after searching through 8.4 3 109 networks). MCL expression clusters are linked by different coloredges. yEd graph editor (yFiles software) was employed for graph visualization. The miRNAs expressed differentially in the tumors are color-coded and inthe graph miRNA neighbors are of the same color code: Closely clustered miRNAs are either pink (overexpressed) or green (down-regulated). The nodelabels, for which expression and physical alteration (CGH, see ‘‘miRNA copy number variations in cancer and leukemia’’ section) were concordant (i.e.,overexpression and amplification), were emboldened and visually reinforced with a hexagonally shaped border.
microRNA networks are rewired in cancer
Genome Research 593www.genome.org
our approach and to possibly dilute the contribution of the host/
associated genes, we considered miRNAs as families (Grimson
et al. 2007). miRNA families have similar targeting properties
and thus their members are expected to have similar impacts on
oncogenesis.
We worked on aCGH samples from lung, pancreas, breast,
colon, and nasopharyngeal carcinomas, glioblastoma, mela-
noma, Ewing sarcoma, osteosarcoma, T-cell acute lymphoblastic
leukemia (T-ALL), AML, CLL, myelodysplasia, various lymphomas,
and mucosa-associated lymphoid tissue MALT (Supplemental Ta-
ble VII). We used aCGH from the NCBI Gene Expression Omnibus
(GEO) and Stanford Microarray Database (SMD). CDKN2A and
CDKN2B were identified as the most deleted genes in human can-
cers, followed by other tumor suppressors PTEN, ATM, and TP53.
Oncogenes, like EGFR, MYC, LYN, MET, and MOS, were amplified.
Supplemental Tables VIII and IX list amplified and deleted
miRNA families. The detection of an amplified hsa-miR-17-5p/20/
93/106 family was a successful validation of our approach. It is also
noteworthy that the MIR17HG host gene for the hsa-miR-17/92
cluster was not present in the arrays, but its flanking genes suc-
cessfully compensated for its absence. The top deleted miRNA
family was hsa-miR-204/211, followed by other families including
hsa-miR-200b/c/429, hsa-miR-141/200a, hsa-miR-125/351, and
hsa-miR-218. Down-regulation of hsa-miR-200a/b/c/429 and 141
have been linked to breast cancer stem cells by targeting BMI1,
a stem cell self-renewal regulator (Shimono et al. 2009). Likewise
hsa-miR-211 is involved in stem cells as it shows the highest In-
formation content in an ES cell differentiation series (Supple-
mental Fig. 2; Supplemental Table III). Therefore, we suggest that
loss of hsa-miR-211 might be involved in regulation of cancer
differentiation. We suggest the same possibility for hsa-miR-218,
which is deleted in cancer and highly expressed in spontaneously
differentiated monolayers. The results from aCGH were overlaid
on the expression network in solid cancers (Fig. 3). The node labels,
for which expression and physical alteration were concordant (i.e.,
overexpression and amplification), were emboldened and visually
reinforced with a hexagonally shaped border.
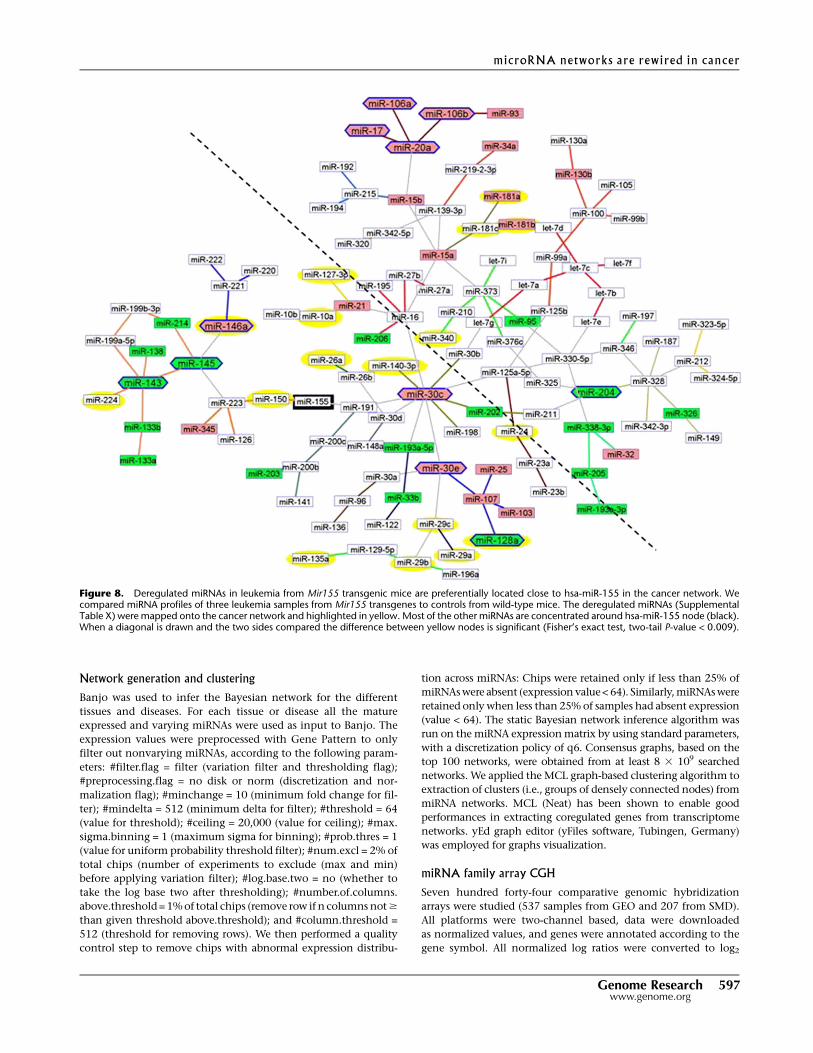
Deregulated miRNAs in a Mir155-induced leukemiaare preferentially located around hsa-miR-155in the miRNA network
We generated two cases of leukemias in an Em/VH Mir155 trans-
genic mice. These leukemias were positive for CD43 and T-cell
markers (CD3, CD8) and negative for B220. Both cases exhibited
VDJ and TCR oligoclonal rearrangement. This T-cell immuno-
phenotype might be caused by the proliferation of lymphoid
progenitors that atypically differentiated into T cells. The disease
started early, at 2 and 4 mo of age, respectively, and had a rapid
course with the mice dying 2 wk later. Their autopsy revealed
a widespread leukemic infiltration, with organomegaly and
lymphadenopathy, histologically diagnosed as an aggressive ma-
lignant lymphoproliferation similar to Burkitt lymphoma (data
not shown). The injection of single sick splenocytes into 30 syn-
geneic mice was sufficient to reproduce the full blown malignancy.
We compared the miRNA profiles of three leukemia samples
from these Mir155 trangenes to controls from wild-type mice.
Then we located the positions in the network for the miRNAs
regulated in the transgene’s leukemias (Supplemental Table X). We
did not have an acute lymphocytic leukemia miRNA network as
reference, therefore we mapped the deregulated miRNAs onto the
generic cancer network and highlighted the nodes in yellow (Fig.
8). The yellow nodes appeared concen-
trated around the hsa-miR-155 node
(black). When a diagonal, separating the
hsa-miR-155 half from the other one, was
drawn and the two sides compared, the
difference in yellow node concentrations
was significant (14 vs. 43, 4 vs. 57, Fisher’s
exact test, two-tail P-value < 0.009). The
topological distribution was even more
skewed if hsa-miR-29s and hsa-miR-181s
were not considered as hsa-miR-155 reg-
ulated. In fact, hsa-miR-181 overexpres-
sion and hsa-miR-29 down-regulation are
hallmarks miRNAs in leukemia; thus,
they are likely to be independent events
in cellular transformation and not di-
rectly related to the Mir155 transgene.
ConclusionWe have presented a thorough analysis of
miRNA tissue specificity in 50 different
normal tissues grouped by 17 systems,
corresponding to 1107 human samples. A
small set of miRNAs were tissue-specific,
while many others were broadly expressed.
We also studied 51 oncologic or hemato-
oncologic disorders and identified cancer-
type-specific miRNAs. Then we inferred
genetic networks for miRNAs in nor-
mal tissues and in their pathological
Figure 4. Comparison of miRNA networks in normal lung and adenocarcinoma. (A) Normal lung(71 samples). A single complete miRNA network is shown. (B) Lung adenocarcinoma (125 samples). Inthis graph, one major and eight minor subnetworks were detected. For example, hsa-miR-10a/b, hsa-miR-29a/b, hsa-miR-107, and hsa-miR-103 are in minor independent subnetworks disjoint from themain one.
Volinia et al .
594 Genome Researchwww.genome.org
counterparts. Normal tissues were represented by single complete
miRNA networks. Cancers instead were portrayed by separate and
unlinked miRNA subnets. Intriguingly, miRNAs independent from
the general transcriptional program were often known as cancer-
related. This ‘‘egocentric’’ behavior of cancer miRNAs could be the
result of positive selection during cancer establishment and pro-
gression, as supported by aCGH. Leukemias were also rewired, but
to a much lower extent. Nevertheless, miRNAs related to AML and
CLL pathogenesis, such as hsa-miR-155, hsa-miR-181, and hsa-
miR-15/16, were still removed from coordinated control. The dis-
similar behavior of solid cancers and leukemia might be due to the
diverging pathogenetic mechanisms, which include differing on-
cogenic miRNA networks. In the former, complex chromosomal
aberrations are frequent, whereas in the latter, translocations often
represent the major driving force.
Overall, miRNA networks in cancer cells defined indepen-
dently regulated miRNAs. The target genes of these uncoordinated
miRNA were involved in specific cancer-related pathways.
Methods
miRNA expression arrays
Microarray analysis was performed as previously described (Volinia
et al. 2006). Briefly, 5 mg of total RNA were used for hybridization
of miRNA microarray chips. These chips contain gene-specific oligo-
nucleotide probes, spotted by contacting technologies and co-
valently attached to a polymeric matrix. The microarrays were
hybridized in 63 SSPE (0.9 M NaCl, 60 mM NaH2PO4 �H2O, 8 mM
EDTA at pH 7.4), 30% formamide at 25°C for 18 h, washed in
0.753 TNT (Tris-HCl, NaCl, Tween 20) at 37°C for 40 min, and
processed by using a method of detection of the biotin-containing
transcripts by streptavidin-Alexa647 conjugate. Processed slides
were scanned using a microarray scanner (Axon), with the laser set
to 635 nm, at a fixed PMT setting, and a scan resolution of 10 mm.
Microarray images were analyzed by using GenePix Pro and post-
processing was performed essentially as described earlier (Volinia
et al. 2006) . Briefly, average values of the replicate spots of each
miRNA were background-subtracted and subject to further analy-
sis. miRNAs were retained, when present, in at least 20% of sam-
ples and when at least 20% of the miRNA had a fold change of
more than 1.5 from the gene median. Absent calls were thresholded
prior to normalization and statistical analysis. Normalization was
performed by using the quantiles method. MiRNA nomenclature
was according to the miRNA database at Sanger Center (Griffiths-
Jones et al. 2008).
Data analysis
An SQL miRNA internal database was built with the data retrieved
from a large number of different experiments performed in our
laboratory. The description of the procedure and statistics for the
Figure 5. The KEGG functional analysis of eight disjointed minor miRNA networks in lung adenocarcinoma. The miRNA present in the unconnectedcliques target genes are involved in many cancer-related terms, such as focal adhesion, small cell lung cancer, and calcium signaling. The detailed list ofsignificant GO terms is shown in Supplemental Figure 7.
microRNA networks are rewired in cancer
Genome Research 595www.genome.org
database will be reported elsewhere (L Tagliavini, G Gamberoni,
S Rossi, M Galasso, J Palatini, CM Croce, and S Volinia, in prep.).
Briefly, the F635-background values were used. Bad spots were re-
moved. Nonexpressed spots were averaged for each gpr files (chip).
For each mature miRNA, we computed the geometric mean of
its multiple reporters in the chip. A NaN value was assigned to
miRNAs with more than 50% of corrupted spots, as reported by
the GenePix image analysis software. All the results were log2-
transformed. The normalization was performed by using the quan-
tiles normalization, as implemented in the Bioconductor ‘‘affy’’
package (Bolstad et al. 2003). BRB Arraytools was used to perform
t-test over two classes’ experiments or F-tests over multiple classes
(i.e., different normal tissues) (Zhao and Simon 2008). Target
genes selection was performed by DIANA-miRpath, microT-V4.0
(Papadopoulos et al. 2009). The union of the target mRNAs with
a score >3 was used as an input to ClueGO (Bindea et al. 2009).
ClueGO was used to relate differential expression in cancer to
functional pathways (KEGG). ClueGO visualizes the selected
terms in a functionally grouped annotation network that reflects
the relationships between the terms based on the similarity of their
associated genes. The size of the nodes reflects the statistical sig-
nificance of the terms. The degree of connectivity between terms
(edges) is calculated using kappa statistics. The calculated kappa
score is also used for defining functional groups. A term can be
included in several groups. The reoccurrence of the term is shown
by adding ‘‘n.’’ The not grouped terms are shown in white color.
The group leading term is the most significant term of the group.
The network integrates only the positive kappa score term associ-
ations and is automatically laid out using the Organic layout al-
gorithm supported by Cytoscape. A right-sided hypergeometric
test yielded the enrichment for GO-terms. Benjamini-Hochberg
correction for multiple testing controlled the P-values. (Please refer
to the Supplemental material for the complete list of data sets
analyzed in this study.)
Figure 6. The miRNA network in acute myeloid leukemia (589 samples, two subnetworks). Standard Banjo parameters were adopted with a q6discretization policy. The consensus graph depicted here was obtained from the best 100 nets (after searching through 8.5 3 109 networks). The miRNAnetwork in AML has disjointed cliques. hsa-miR-155 and hsa-miR-181, two miRNAs with clinical relevance are in two separated subnetworks, as expectedfrom their prognostic independence. hsa-miR-181 is associated with hsa-miR-146a in a detached yellow miniclique. mir-155 belongs to the main sub-network, in the same red MCL clique of hsa-miR-223, hsa-miR-92a, hsa-miR-25, and hsa-miR-32. Finally, hsa-miR-29b has a key role in AML and acts asa hub in the AML net.
Figure 7. The miRNA network in chronic lymphocytic leukemia (254 samples, three subnetworks). Standard Banjo parameters were adopted with a q6discretization policy. The consensus graph depicted here was obtained from the best 100 nets (after searching through >1 3 1010 networks). The networkgraph shows a major net and two separated minicliques: hsa-miR-23a/b and the hsa-miR-15/16 cluster. hsa-miR-15 and hsa-miR-16, two miRNAs fre-quently deleted in CLL, have been shown to regulate apoptosis via BCL2. The key hsa-miR-29b, acting as a hub in AML, is only a branch in CLL. AMLprognostic hsa-miR-181 is disjointed in AML but not in CLL, while the reverse happens in CLL for prognostic hsa-miR-15/16 genes.
Volinia et al .
596 Genome Researchwww.genome.org
Network generation and clustering
Banjo was used to infer the Bayesian network for the different
tissues and diseases. For each tissue or disease all the mature
expressed and varying miRNAs were used as input to Banjo. The
expression values were preprocessed with Gene Pattern to only
filter out nonvarying miRNAs, according to the following param-
eters: #filter.flag = filter (variation filter and thresholding flag);
#preprocessing.flag = no disk or norm (discretization and nor-
malization flag); #minchange = 10 (minimum fold change for fil-
ter); #mindelta = 512 (minimum delta for filter); #threshold = 64
(value for threshold); #ceiling = 20,000 (value for ceiling); #max.
sigma.binning = 1 (maximum sigma for binning); #prob.thres = 1
(value for uniform probability threshold filter); #num.excl = 2% of
total chips (number of experiments to exclude (max and min)
before applying variation filter); #log.base.two = no (whether to
take the log base two after thresholding); #number.of.columns.
above.threshold = 1% of total chips (remove row if n columns not $
than given threshold above.threshold); and #column.threshold =
512 (threshold for removing rows). We then performed a quality
control step to remove chips with abnormal expression distribu-
tion across miRNAs: Chips were retained only if less than 25% of
miRNAs were absent (expression value < 64). Similarly, miRNAs were
retained only when less than 25% of samples had absent expression
(value < 64). The static Bayesian network inference algorithm was
run on the miRNA expression matrix by using standard parameters,
with a discretization policy of q6. Consensus graphs, based on the
top 100 networks, were obtained from at least 8 3 109 searched
networks. We applied the MCL graph-based clustering algorithm to
extraction of clusters (i.e., groups of densely connected nodes) from
miRNA networks. MCL (Neat) has been shown to enable good
performances in extracting coregulated genes from transcriptome
networks. yEd graph editor (yFiles software, Tubingen, Germany)
was employed for graphs visualization.
miRNA family array CGH
Seven hundred forty-four comparative genomic hybridization
arrays were studied (537 samples from GEO and 207 from SMD).
All platforms were two-channel based, data were downloaded
as normalized values, and genes were annotated according to the
gene symbol. All normalized log ratios were converted to log2
Figure 8. Deregulated miRNAs in leukemia from Mir155 transgenic mice are preferentially located close to hsa-miR-155 in the cancer network. Wecompared miRNA profiles of three leukemia samples from Mir155 transgenes to controls from wild-type mice. The deregulated miRNAs (SupplementalTable X) were mapped onto the cancer network and highlighted in yellow. Most of the other miRNAs are concentrated around hsa-miR-155 node (black).When a diagonal is drawn and the two sides compared the difference between yellow nodes is significant (Fisher’s exact test, two-tail P-value < 0.009).
microRNA networks are rewired in cancer
Genome Research 597www.genome.org
ratios, with the cancer value at the numerator and the control
value at the denominator. Bootstrap analysis was used (10,000
random swaps of cancer and control channels) to obtain P-values
and confidence limits for deletion and amplifications. We in-
vestigated 306 miRNA loci; 168 miRNA loci were associated to
a host gene, and 138 miRNA loci to flanking genes. miRNA families
were defined according to TargetScan. The threshold P-value for
a miRNA family was set at 0.05 to the number of family members, n
(0.05n). To control for multiple testing, we performed 100 boot-
strapping cycles and used the results to calculate the false discovery
rate (FDR). The resampling analysis was executed by randomly
assigning the original P-values to the miRNA loci, while all family
structures and chromosomal locations were kept unchanged. The
FDR was defined as the percentage of families in the simulation
evaluating better (lower P-values) than in the original test. Since
the number of family member was variable (from a minimum of
2 to 7), FDRs were computed for each family according to its size
(n, number of miRNA members).
List of Affiliations1Data Mining for Analysis of Microarrays, Department of Mor-
phology and Embryology, Universita degli Studi, Ferrara 44100,
Italy; 2Comprehensive Cancer Center, Ohio State University, Co-
lumbus, Ohio 43210, USA; 3Biomedical Informatics, Ohio State
University, Columbus, Ohio 43210, USA; 4Department of
Chemistry, The Scripps Research Institute, La Jolla, California
92037, USA; 5Department of Pathology, David Geffen School of
Medicine at UCLA, Los Angeles, California 90095, USA; 6De-
partment of Urology, Thomas Jefferson University, Kimmel Cancer
Center, Philadelphia, Pennsylvania 19107, USA; 7Istituto Tumori,
Milano 20133, Italy; 8Laboratory of Human Carcinogenesis, Na-
tional Institutes of Health, Bethesda, Maryland 20892, USA;9Department of Medicine, Moores Cancer Center, University of
California, San Diego, La Jolla, California 92093, USA; 10Institut
fur Pathologie, Charite-Universitatsmedizin, Berlin 10117, Ger-
many; 11Oncogenesis and Molecular Virology Unit, Institut
Pasteur, Paris Cedex 05 75251, France; 12Nuclear Organization
and Oncogenesis Unit/INSERM U993, Institut Pasteur, Paris
Cedex 15 75724, France; 13Experimental Therapeutics & Cancer
Genetics, MD Anderson Cancer Center, Houston, Texas 77030,
USA; 14Division of Pathology, II University of Rome ‘‘La Sapi-
enza,’’ Ospedale Santo Andrea, Rome 00189, Italy; 15Department
of Surgery, Thomas Jefferson University Medical College, Phila-
delphia, Pennsylvania 19107, USA.
AcknowledgmentsS.V. is supported by AIRC (IG 8588), PRIN MIUR 2008, and RegioneEmilia Romagna PRRIITT BioPharmaNet grants; A.V. is supportedby AIRC (IG 5573). Microarray analyses were performed using BRB-ArrayTools developed by Richard Simon and the BRB-ArrayToolsDevelopment Team, GenePattern (Broad Institute), BioConductorand R.
References
Baek D, Villen J, Shin C, Camargo FD, Gygi SP, Bartel DP. 2008. The impact ofmicroRNAs on protein output. Nature 455: 64–71.
Bartel DP. 2009. MicroRNAs: Target recognition and regulatory functions.Cell 136: 215–233.
Bindea G, Mlecnik B, Hackl H, Charoentong P, Tosolini M, Kirilovsky A,Fridman WH, Pages F, Trajanoski Z, Galon J. 2009. ClueGO: A Cytoscapeplug-in to decipher functionally grouped gene ontology and pathwayannotation networks. Bioinformatics 25: 1091–1093.
Bolstad BM, Irizarry RA, Astrand M, Speed TP. 2003. A comparison ofnormalization methods for high density oligonucleotide array databased on variance and bias. Bioinformatics 19: 185–193.
Braun CJ, Zhang X, Savelyeva I, Wolff S, Moll UM, Schepeler T, Orntoft TF,Andersen CL, Dobbelstein M. 2008. p53-Responsive micrornas 192 and215 are capable of inducing cell cycle arrest. Cancer Res 68: 10094–10104.
Brohee S, Faust K, Lima-Mendez G, Vanderstocken G, van Helden J. 2008.Network Analysis Tools: From biological networks to clusters andpathways. Nat Protoc 3: 1616–1629.
Calin GA, Ferracin M, Cimmino A, Di Leva G, Shimizu M, Wojcik SE, IorioMV, Visone R, Sever NI, Fabbri M, et al. 2005. A MicroRNA signatureassociated with prognosis and progression in chronic lymphocyticleukemia. N Engl J Med 353: 1793–1801.
Chen CZ, Li L, Lodish HF, Bartel DP. 2004. MicroRNAs modulatehematopoietic lineage differentiation. Science 303: 83–86.
Chen JF, Mandel EM, Thomson JM, Wu Q, Callis TE, Hammond SM,Conlon FL, Wang DZ. 2006. The role of microRNA-1 and microRNA-133 in skeletal muscle proliferation and differentiation. Nat Genet 38:228–233.
Cimmino A, Calin GA, Fabbri M, Iorio MV, Ferracin M, Shimizu M, WojcikSE, Aqeilan RI, Zupo S, Dono M, et al. 2005. hsa-miR-15 and hsa-miR-16 induce apoptosis by targeting BCL2. Proc Natl Acad Sci 102:13944–13949.
Debernardi S, Skoulakis S, Molloy G, Chaplin T, Dixon-McIver A, Young BD.2007. MicroRNA hsa-miR-181a correlates with morphological sub-classof acute myeloid leukaemia and the expression of its target genes inglobal genome-wide analysis. Leukemia 21: 912–916.
Enright AJ, Van Dongen S, Ouzounis CA. 2002. An efficient algorithm forlarge-scale detection of protein families. Nucleic Acids Res 30: 1575–1584.
Flynt AS, Li N, Thatcher EJ, Solnica-Krezel L, Patton JG. 2007. Zebrafish hsa-miR-214 modulates Hedgehog signaling to specify muscle cell fate. NatGenet 39: 259–263.
Gao P, Tchernyshyov I, Chang TC, Lee YS, Kita K, Ochi T, Zeller KI, De MarzoAM, Van Eyk JE, Mendell JT, et al. 2009. c-Myc suppression of hsa-miR-23a/benhances mitochondrial glutaminase expression and glutaminemetabolism. Nature 458: 762–765.
Garzon R, Garofalo M, Martelli MP, Briesewitz R, Wang L, Fernandez-Cymering C, Volinia S, Liu CG, Schnittger S, Haferlach T, et al. 2008.Distinctive microRNA signature of acute myeloid leukemia bearingcytoplasmic mutated nucleophosmin. Proc Natl Acad Sci 105: 3945–3950.
Gebeshuber CA, Zatloukal K, Martinez J. 2009. hsa-miR-29a suppressestristetraprolin, which is a regulator of epithelial polarity and metastasis.EMBO Rep 10: 400–405.
Georges SA, Biery MC, Kim SY, Schelter JM, Guo J, Chang AN, Jackson AL,Carleton MO, Linsley PS, Cleary MA, et al. 2008. Coordinated regulationof cell cycle transcripts by p53-Inducible microRNAs, hsa-miR-192and hsa-miR-215. Cancer Res 68: 10105–10112.
Griffiths-Jones S, Saini HK, van Dongen S, Enright AJ. 2008. miRBase:Tools for microRNA genomics. Nucleic Acids Res 36: D154–D158.
Grimson A, Farh KK, Johnston WK, Garrett-Engele P, Lim LP, Bartel DP.2007. MicroRNA targeting specificity in mammals: Determinantsbeyond seed pairing. Mol Cell 27: 91–105.
Ivanovska I, Ball AS, Diaz RL, Magnus JF, Kibukawa M, Schelter JM,Kobayashi SV, Lim L, Burchard J, Jackson AL, et al. 2008. MicroRNAs inthe hsa-miR-106b family regulate p21/CDKN1A and promote cell cycleprogression. Mol Cell Biol 28: 2167–2174.
Ji J, Shi J, Budhu A, Yu Z, Forgues M, Roessler S, Ambs S, Chen Y, Meltzer PS,Croce CM, et al. 2009. MicroRNA expression, survival, and response tointerferon in liver cancer. N Engl J Med 361: 1437–1447.
Johnson SM, Grosshans H, Shingara J, Byrom M, Jarvis R, Cheng A,Labourier E, Reinert KL, Brown D, Slack FJ. 2005. RAS is regulated by thelet-7 microRNA family. Cell 120: 635–647.
Korpal M, Kang Y. 2008. The emerging role of hsa-miR-200 family ofmicroRNAs in epithelial-mesenchymal transition and cancer metastasis.RNA Biol 5: 115–119.
Kota J, Chivukula RR, O’Donnell KA, Wentzel EA, Montgomery CL, HwangHW, Chang TC, Vivekanandan P, Torbenson M, Clark KR, et al. 2009.Therapeutic microRNA delivery suppresses tumorigenesis in a murineliver cancer model. Cell 137: 1005–1017.
Labbaye C, Spinello I, Quaranta MT, Pelosi E, Pasquini L, Petrucci E, BiffoniM, Nuzzolo ER, Billi M, Foa R, et al. 2008. A three-step pathwaycomprising PLZF/hsa-miR-146a/CXCR4 controls megakaryopoiesis. NatCell Biol 10: 788–801.
Volinia et al .
598 Genome Researchwww.genome.org
Lagos-Quintana M, Rauhut R, Lendeckel W, Tuschl T. 2001. Identification ofnovel genes coding for small expressed RNAs. Science 294: 853–858.
Landgraf P, Rusu M, Sheridan R, Sewer A, Iovino N, Aravin A, Pfeffer S, RiceA, Kamphorst AO, Landthaler M, et al. 2007. A mammalian microRNAexpression atlas based on small RNA library sequencing. Cell 129: 1401–1414.
Lau NC, Lim LP, Weinstein EG, Bartel DP. 2001. An abundant class of tinyRNAs with probable regulatory roles in Caenorhabditis elegans. Science294: 858–862.
Lee RC, Ambros V. 2001. An extensive class of small RNAs in Caenorhabditiselegans. Science 294: 862–864.
Li QJ, Chau J, Ebert PJ, Sylvester G, Min H, Liu G, Braich R, Manoharan M,Soutschek J, Skare P, et al. 2007. hsa-miR-181a is an intrinsic modulatorof T cell sensitivity and selection. Cell 129: 147–161.
Ma L, Teruya-Feldstein J, Weinberg RA. 2007. Tumour invasion andmetastasis initiated by microRNA-10b in breast cancer. Nature 449: 682–688.
Marcucci G, Maharry K, Radmacher MD, Mrozek K, Vukosavljevic T, PaschkaP, Whitman SP, Langer C, Baldus CD, Liu CG, et al. 2008a. Prognosticsignificance of, and gene and microRNA expression signaturesassociated with, CEBPA mutations in cytogenetically normal acutemyeloid leukemia with high-risk molecular features: A cancer andleukemia group B study. J Clin Oncol 26: 5078–5087.
Marcucci G, Radmacher MD, Maharry K, Mrozek K, Ruppert AS, Paschka P,Vukosavljevic T, Whitman SP, Baldus CD, Langer C, et al. 2008b.MicroRNA expression in cytogenetically normal acute myeloidleukemia. N Engl J Med 358: 1919–1928.
Mott JL, Kobayashi S, Bronk SF, Gores GJ. 2007. mir-29 regulates Mcl-1protein expression and apoptosis. Oncogene 26: 6133–6140.
Naguibneva I, Ameyar-Zazoua M, Polesskaya A, Ait-Si-Ali S, Groisman R,Souidi M, Cuvellier S, Harel-Bellan A. 2006. The microRNA hsa-miR-181targets the homeobox protein Hox-A11 during mammalian myoblastdifferentiation. Nat Cell Biol 8: 278–284.
O’Connell RM, Chaudhuri AA, Rao DS, Baltimore D. 2009. Inositolphosphatase SHIP1 is a primary target of hsa-miR-155. Proc Natl Acad Sci106: 7113–7118.
Papadopoulos GL, Alexiou P, Maragkakis M, Reczko M, Hatzigeorgiou AG.2009. DIANA-mirPath: Integrating human and mouse microRNAs inpathways. Bioinformatics 25: 1991–1993.
Park SY, Lee JH, Ha M, Nam JW, Kim VN. 2009. hsa-miR-29 miRNAs activatep53 by targeting p85a and CDC42. Nat Struct Mol Biol 16: 23–29.
Petrocca F, Visone R, Onelli MR, Shah MH, Nicoloso MS, de Martino I,Iliopoulos D, Pilozzi E, Liu CG, Negrini M, et al. 2008. E2F1-regulatedmicroRNAs impair TGFb-dependent cell-cycle arrest and apoptosis ingastric cancer. Cancer Cell 13: 272–286.
Reinhart BJ, Slack FJ, Basson M, Pasquinelli AE, Bettinger JC, Rougvie AE,Horvitz HR, Ruvkun G. 2000. The 21-nucleotide let-7 RNA regulatesdevelopmental timing in Caenorhabditis elegans. Nature 403: 901–906.
Ruby JG, Jan C, Player C, Axtell MJ, Lee W, Nusbaum C, Ge H, Bartel DP.2006. Large-scale sequencing reveals 21U-RNAs and additionalmicroRNAs and endogenous siRNAs in C. elegans. Cell 127: 1193–1207.
Ruby JG, Stark A, Johnston WK, Kellis M, Bartel DP, Lai EC. 2007. Evolution,biogenesis, expression, and target predictions of a substantiallyexpanded set of Drosophila microRNAs. Genome Res 17: 1850–1864.
Selbach M, Schwanhausser B, Thierfelder N, Fang Z, Khanin R, Rajewsky N.2008. Widespread changes in protein synthesis induced by microRNAs.Nature 455: 58–63.
Shimono Y, Zabala M, Cho RW, Lobo N, Dalerba P, Qian D, Diehn M, Liu H,Panula SP, Chiao E, et al. 2009. Downregulation of miRNA-200c linksbreast cancer stem cells with normal stem cells. Cell 138: 592–603.
Smith VA, Yu J, Smulders TV, Hartemink AJ, Jarvis ED. 2006. Computationalinference of neural information flow networks. PLoS Comput Biol 2:e161. doi: 10.1371/journal.pcbi.0020161.
Spizzo R, Nicoloso MS, Croce CM, Calin GA. 2009. SnapShot: MicroRNAs incancer. Cell 137: 586–586.e1.
Taganov KD, Boldin MP, Chang KJ, Baltimore D. 2006. NF-kB-dependentinduction of microRNA hsa-miR-146, an inhibitor targeted to signalingproteins of innate immune responses. Proc Natl Acad Sci 103: 12481–12486.
Thai TH, Calado DP, Casola S, Ansel KM, Xiao C, Xue Y, Murphy A,Frendewey D, Valenzuela D, Kutok JL, et al. 2007. Regulation of thegerminal center response by microRNA-155. Science 316: 604–608.
Tran DH, Satou K, Ho TB. 2008. Finding microRNA regulatory modules inhuman genome using rule induction. BMC Bioinformatics 9: S5. doi:10.1186/1471-2105-9-S12-S5.
Volinia S, Calin GA, Liu CG, Ambs S, Cimmino A, Petrocca F, Visone R, IorioM, Roldo C, Ferracin M, et al. 2006. A microRNA expression signatureof human solid tumors defines cancer gene targets. Proc Natl Acad Sci103: 2257–2261.
Xu N, Papagiannakopoulos T, Pan G, Thomson JA, Kosik KS. 2009.MicroRNA-145 regulates OCT4, SOX2, and KLF4 and repressespluripotency in human embryonic stem cells. Cell 137: 647–658.
Yoon S, De Micheli G. 2005. Prediction of regulatory modules comprisingmicroRNAs and target genes. Bioinformatics 21: ii93–ii100.
Zhao Y, Simon R. 2008. BRB-ArrayTools data archive for human cancer geneexpression: A unique and efficient data sharing resource. Cancer Inform6: 9–15.
Received July 3, 2009; accepted in revised form February 8, 2010.
microRNA networks are rewired in cancer
Genome Research 599www.genome.org
Related Documents