Original Article Reproducibility of the Determination of Anaerobic Threshold in Patients with Heart Failure Danielle Aparecida Gomes Pereira 1,2 , Danielle Soares Rocha Vieira 1 , Giane Amorim Ribeiro Samora 1,2 , Fernanda Lima Lopes 1 , Maria Clara Norman Alencar 1 , Susan Martins Lage 1 , Verônica Franco Parreira 1 , Marcelo Velloso 1 , Maria da Consolação Vieira Moreira 1 , Raquel Rodrigues Britto 1 Universidade Federal de Minas Gerais-UFMG 1 ; Centro Universitário de Belo Horizonte-UNI-BH 2 , Belo Horizonte, MG - Brazil Abstract Background: The anaerobic threshold (AT) provides information on functional capacity in heart failure (HF). However, the visual determination of the AT by ventilatory methods is subjective, being susceptible to differences between examiners. Objective: To evaluate the inter- and intra-examiner reproducibility in the determination of the AT in patients with mild to moderate HF, using visual-graphic and V-slope methods. To compare and correlate the results. Methods: After performing a cardiopulmonary exercise test on a treadmill, visual-graphic and V-slope methods were used for the analysis of the AT. To assess the reproducibility, three examiners determined the AT twice by each method, on different days. For statistical analysis, we used intra-class correlation coefficient (ICC) with p <0.05. Results: We evaluated a total of 16 subjects, with a mean age of 45.9 ± 9.7 years, left ventricle ejection fraction of 20.5 ± 8.1%, and peak exercise oxygen consumption of 20.6 ± 7.8 ml/kg•min -1 . The intra-examiner reproducibility was high in both methods for the three examiners, with ICC values between 0.87 and 0.99. The inter-examiner reproducibility was moderate in both visual-graphic method (ICC = 0.69) and V-slope method (ICC = 0.64). When comparing methods, the ICC found was 0.91. Conclusions: AT determination by visual-graphic and V-slope methods showed high and moderate inter- and intra- examiner reproducibility, respectively. Moreover, both methods showed good agreement when compared with each other. These results suggest that both methods can be used in a reproducible way in AT assessment of patients with mild to moderate HF. (Arq Bras Cardiol 2010;94(6) : 724-730) Key Words: Reproducibility of results; anaerobic threshold; heart failure; exercise test. Mailing address: Danielle Aparecida Gomes Pereira • Departamento de Fisioterapia - UFMG - Campus Pampulha - Av. Antônio Carlos, 6627 - Pampulha - 31270-901 - Belo Horizonte, MG - Brazil E-mail: [email protected], [email protected] Manuscript received May 16, 2009; revised manuscript received August 28, 2009; accepted December 21, 2009. Introduction In subjects with heart failure (HF), measurements of cardiopulmonary variables during exercise, using maximal exercise testing with direct analysis of expired gases, are considered as reference for the evaluation of functional capacity 1,2 . Directly measured oxygen consumption is an accurate method for clinical assessment of the aerobic capacity 1-4 . When an individual reaches its physiological limit in an exercise test, this indicates that the maximum oxygen consumption (VO 2 max) has been reached 1,2 . The measurement of the VO 2 max is determined when the oxygen consumption reaches a plateau, indicating that the maximum capacity has been reached by the lack of increase in VO 2, even with further increase in the load 1,2 . The VO 2 max is affected by age, gender, medical condition, or medication use 2-4 . In HF, this plateau is rarely reached, and the peak exercise oxygen consumption achieved without reaching a plateau (VO 2peak ) is used to determine the functional capacity 1,2,5,6 . Since the determination of the maximum stress in HF patients can be subjective, and as daily activities do not require maximal capacity, other variables in the test, such as the anaerobic threshold (AT), may be useful in assessing functional capacity 1,7 . AT is defined as the work level or the oxygen consumption above which aerobic energy production is supplemented by anaerobic metabolism, leading to increased blood lactate levels 8-12 . The dissociation of the lactic acid leads to the release of H + ions, which are buffered in the bloodstream by bicarbonate, generating the production of more carbon dioxide (VCO 2 ) and an increased ventilatory response 1,8-13 . Therefore, there is a ventilatory threshold coincident with the AT 13,14 , which is detected by gas analysis using spirometry. 15 Both VO 2peak and AT determined by the ventilatory method are considered valid and reproducible in healthy subjects 1,5,14,16 . However, as the determination of maximum stress can be subjective in individuals with HF 1,16 , AT can be an alternative option comparable to the VO 2peak to predict 724

Welcome message from author
This document is posted to help you gain knowledge. Please leave a comment to let me know what you think about it! Share it to your friends and learn new things together.
Transcript

Original Article
Reproducibility of the Determination of Anaerobic Threshold in Patients with Heart Failure
Danielle Aparecida Gomes Pereira1,2, Danielle Soares Rocha Vieira1, Giane Amorim Ribeiro Samora1,2, Fernanda Lima Lopes1, Maria Clara Norman Alencar1, Susan Martins Lage1, Verônica Franco Parreira1, Marcelo Velloso1, Maria da Consolação Vieira Moreira1, Raquel Rodrigues Britto1
Universidade Federal de Minas Gerais-UFMG1; Centro Universitário de Belo Horizonte-UNI-BH2, Belo Horizonte, MG - Brazil
AbstractBackground: The anaerobic threshold (AT) provides information on functional capacity in heart failure (HF). However, the visual determination of the AT by ventilatory methods is subjective, being susceptible to differences between examiners.
Objective: To evaluate the inter- and intra-examiner reproducibility in the determination of the AT in patients with mild to moderate HF, using visual-graphic and V-slope methods. To compare and correlate the results.
Methods: After performing a cardiopulmonary exercise test on a treadmill, visual-graphic and V-slope methods were used for the analysis of the AT. To assess the reproducibility, three examiners determined the AT twice by each method, on different days. For statistical analysis, we used intra-class correlation coefficient (ICC) with p <0.05.
Results: We evaluated a total of 16 subjects, with a mean age of 45.9 ± 9.7 years, left ventricle ejection fraction of 20.5 ± 8.1%, and peak exercise oxygen consumption of 20.6 ± 7.8 ml/kg•min-1. The intra-examiner reproducibility was high in both methods for the three examiners, with ICC values between 0.87 and 0.99. The inter-examiner reproducibility was moderate in both visual-graphic method (ICC = 0.69) and V-slope method (ICC = 0.64). When comparing methods, the ICC found was 0.91.
Conclusions: AT determination by visual-graphic and V-slope methods showed high and moderate inter- and intra-examiner reproducibility, respectively. Moreover, both methods showed good agreement when compared with each other. These results suggest that both methods can be used in a reproducible way in AT assessment of patients with mild to moderate HF. (Arq Bras Cardiol 2010;94(6) : 724-730)
Key Words: Reproducibility of results; anaerobic threshold; heart failure; exercise test.
Mailing address: Danielle Aparecida Gomes Pereira • Departamento de Fisioterapia - UFMG - Campus Pampulha - Av. Antônio Carlos, 6627 - Pampulha - 31270-901 - Belo Horizonte, MG - Brazil E-mail: [email protected], [email protected] Manuscript received May 16, 2009; revised manuscript received August 28, 2009; accepted December 21, 2009.
IntroductionIn subjects with heart failure (HF), measurements of
cardiopulmonary variables during exercise, using maximal exercise testing with direct analysis of expired gases, are considered as reference for the evaluation of functional capacity1,2. Directly measured oxygen consumption is an accurate method for clinical assessment of the aerobic capacity1-4. When an individual reaches its physiological limit in an exercise test, this indicates that the maximum oxygen consumption (VO2max) has been reached1,2. The measurement of the VO2max is determined when the oxygen consumption reaches a plateau, indicating that the maximum capacity has been reached by the lack of increase in VO2, even with further increase in the load1,2. The VO2max is affected by age, gender, medical condition, or medication use2-4. In HF,
this plateau is rarely reached, and the peak exercise oxygen consumption achieved without reaching a plateau (VO2peak) is used to determine the functional capacity1,2,5,6.
Since the determination of the maximum stress in HF patients can be subjective, and as daily activities do not require maximal capacity, other variables in the test, such as the anaerobic threshold (AT), may be useful in assessing functional capacity1,7. AT is defined as the work level or the oxygen consumption above which aerobic energy production is supplemented by anaerobic metabolism, leading to increased blood lactate levels8-12. The dissociation of the lactic acid leads to the release of H+ ions, which are buffered in the bloodstream by bicarbonate, generating the production of more carbon dioxide (VCO2) and an increased ventilatory response1,8-13. Therefore, there is a ventilatory threshold coincident with the AT13,14, which is detected by gas analysis using spirometry.15
Both VO2peak and AT determined by the ventilatory method are considered valid and reproducible in healthy subjects1,5,14,16. However, as the determination of maximum stress can be subjective in individuals with HF1,16, AT can be an alternative option comparable to the VO2peak to predict
724

Original Article
Arq Bras Cardiol 2010;94(6) : 724-730
Pereira et alAnaerobic threshold reproducibility
Table 1 - Clinical characteristics of 16 patients with HF evaluated by the maximal exercise test with expired gas analysis
Number of individuals
Gender (male/female) n 12 / 4
HF origin* n (%)
Idiopathic 7 (43.75%)
Myocardial infarction 4 (25%)
Chagas 3 (18.75%)
Peripartum 2 (12.5%)
NYHA classification† n (%)
Classe II 13 (81.25%)
Classe III 3 (18.75%)
Medicamentos em uso n (%)
Betablocker 16 (100%)
Diuretics 13 (81.25%)
ACE inhibitor ‡ 11 (68.75%)
Digitalis 8 (50%)
AT1 receptor inhibitor 6 (37.5%)
aerobic performance1,8,13,16-18. Moreover, AT may be useful in determining the intensity of the training prescription in rehabilitation programs, in evaluating the effects of training, and in assessing the prognosis of patients with HF4,8. In HF patients, the accumulation of lactate may occur earlier, leading to a shorter duration of the exercise test, a fact which according to some authors1,12 can complicate AT determination. Moreover, the visual determination of AT by ventilatory methods is subjective, being susceptible to differences between examiners8. Thus, the objectives of this study were: 1) to assess the inter- and intra-examiner reproducibility in AT assessment of patients with mild to moderate HC using visual-graphic and V-slope methods; and 2) to compare and correlate the results found by both methods.
Methods
SubjectsThe study was approved by the Ethics and Research
Committee of the institution, and all volunteers signed an Informed Consent. Inclusion criteria were: Individuals with HF in New York Heart Association (NYHA) Class II and III, regardless of gender and ethnicity, in stage C of HF19,20, who did not practice regular physical activity, aged between 25 and 59 years, who showed clinical stability for at least two months, with ejection left ventricle fraction at rest ≤ 45%, and who had shown no acute-phase inflammatory diseases; renal failure; orthopedic or neurological dysfunctions limiting ambulation; history of pulmonary disease; unstable angina; uncontrolled arrhythmias; or peripheral arterial disease. Respecting these criteria, 16 subjects were included, with a mean age of 45.9 ± 9.7 years, BMI of 26.5 ± 5.1 kg/m2, left ventricle ejection fraction of 20.5 ± 8.1%, selected from the heart failure outpatient clinic of the institution. Table 1 shows the clinical characteristics of 16 HF patients, assessed by the maximal exercise test with expired gas analysis. Most of the sample was composed of men (75%), mostly with idiopathic HF (43.75%) in NYHA class II (81.25%).
Experimental ProtocolThe maximal exercise test with expired gas analysis
(CPX Ultima™, Medical Graphics, USA) was performed on a treadmill (Millennium Classic CI™, Inbramed/Inbrasport, Brazil) with a ramp protocol21-24. The ramp protocol was developed with base on the values of minimum and maximum speed defined by the study of Barbosa and Sobral22 for each decade of age and gender, so that the stress test had a duration of at least 8 minutes. A fourth-order polynomial extrapolation was performed to determine reference values for each age and gender, and the increment was calculated every 10 seconds, so that the stress test had a duration of 12 to 15 minutes12. The increments used as reference for the ramp protocol are described in Tables 2 and 3. The tests were performed at room temperature, at 20 ± 2o C, and relative humidity between 50% and 70%24.
For AT analysis, two methods were used: 1. the visual-graphic method, in which VCO2 and VO2 were plotted as a function of time (Fig. 1); and 2. the V-slope method, in
which VCO2 was plotted as a function of VO2 (Fig. 2). In both methods, the AT was assessed in charts with eight-breath moving average15. In the visual-graphic method, AT was defined as the point at which there was a break in the linearity of the response of VCO2 compared to VO2, as a function of time15; and in the V-slope method, AT was determined as the point from which there was a change in the slope of the curve1,5,12-14. To evaluate reproducibility, three investigators with prior training in both methods determined the AT independently. AT was assessed twice by each method by each examiner on different days.
Statistical analysis The Shapiro Wilk test was performed to analyze the data
distribution. The intra-class correlation coefficient (ICC) for consistency and the ICC for agreement were used to assess intra- and inter-examiner reproducibility in the second evaluation, respectively. To compare the mean values of VO2 determined by the three examiners in the second evaluation, we applied the paired t test. To contrast the two methods, the average AT values of the second evaluation conducted by the three examiners were calculated by both the visual-graphic method and the V-slope method, and subsequently the ICC for agreement was applied. The p-value was considered significant at p < 0.05. For data analysis, we used the SPSS™ (SPSS Inc., USA), version 13.0.
ResultsOne of the examiners could not identify the AT of two
patients in both methods. Thus, data from 14 patients were taken into account for the reproducibility analysis. Table 4
725
Original Article
Arq Bras Cardiol 2010;94(6) : 724-730
Pereira et alAnaerobic threshold reproducibility
Table 2 - Increments used as reference for the ramp protocol in men
Age Minimum speed Maximum speed Speed increase Minimum slope angle Maximum slope angle Slope angle increase
25 3.6 7.9 0.047 6.0 15.9 0.110
26 3.6 7.9 0.047 6.0 15.9 0.110
27 3.6 7.8 0.047 6.0 15.9 0.110
28 3.6 7.8 0.047 6.0 15.9 0.110
29 3.6 7.7 0.046 6.0 16.0 0.110
30 3.5 7.7 0.046 6.0 16.0 0.111
31 3.5 7.6 0.046 6.0 16.0 0.111
32 3.5 7.6 0.045 6.0 16.1 0.112
33 3.5 7.6 0.045 6.0 16.1 0.112
34 3.5 7.5 0.045 6.0 16.1 0.113
35 3.5 7.5 0.045 6.0 16.1 0.113
36 3.4 7.4 0.044 5.9 16.2 0.114
37 3.4 7.4 0.044 5.9 16.2 0.114
38 3.4 7.3 0.044 5.8 16.2 0.115
39 3.4 7.3 0.043 5.8 16.2 0.115
40 3.3 7.2 0.043 5.7 16.2 0.116
41 3.3 7.2 0.043 5.7 16.2 0.116
42 3.3 7.1 0.043 5.6 16.1 0.117
43 3.3 7.1 0.042 5.5 16.1 0.118
44 3.2 7.0 0.042 5.5 16.1 0.118
45 3.2 7.0 0.042 5.4 16.0 0.119
46 3.2 6.9 0.042 5.3 16.0 0.119
47 3.2 6.9 0.041 5.2 15.9 0.120
48 3.1 6.8 0.041 5.1 15.9 0.120
49 3.1 6.8 0.041 4.9 15.8 0.120
50 3.1 6.7 0.040 4.8 15.7 0.121
51 3.1 6.7 0.040 4.7 15.6 0.121
52 3.0 6.6 0.040 4.6 15.5 0.121
53 3.0 6.5 0.039 4.4 15.4 0.122
54 3.0 6.5 0.039 4.3 15.2 0.122
55 2.9 6.4 0.039 4.1 15.1 0.122
56 2.9 6.4 0.038 4.0 14.9 0.122
57 2.9 6.3 0.038 3.8 14.8 0.122
58 2.8 6.2 0.038 3.6 14.6 0.122
59 2.8 6.2 0.037 3.4 14.4 0.122
Speed - km/hour; angle - degrees; speed increase - km/hour; angle increase - degrees.
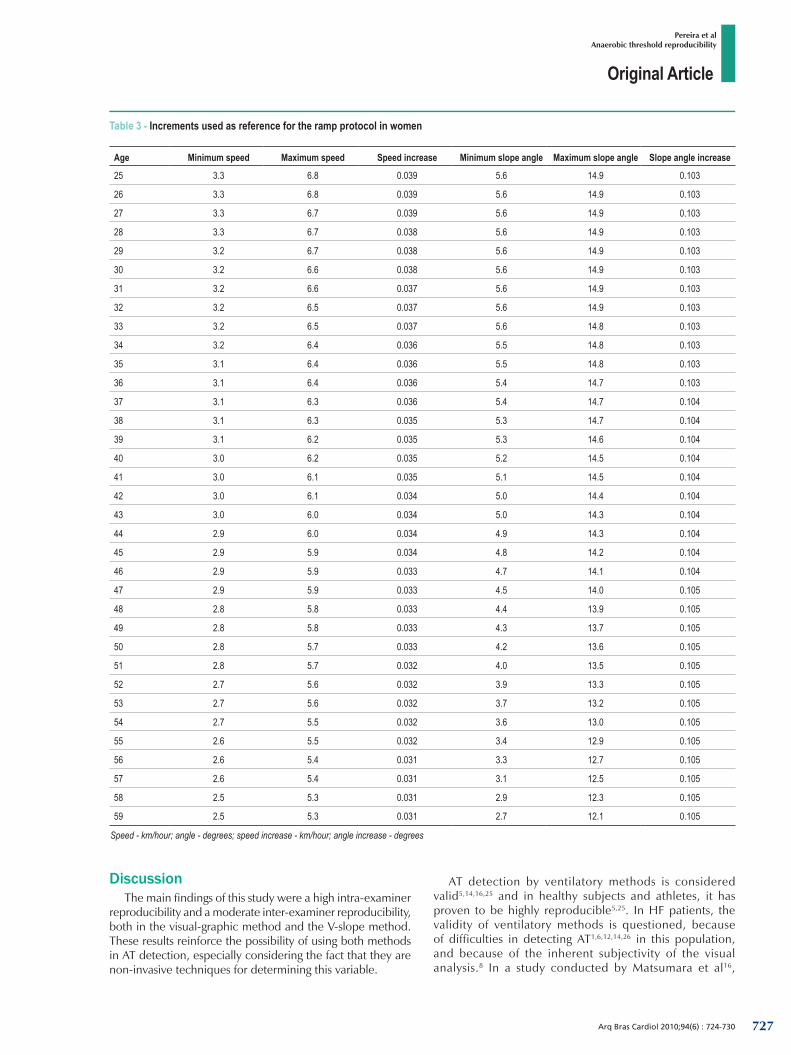
shows the intra-examiner reproducibility. The ICC values were high, ranging from 0.87 to 0.99, indicating high reproducibility of both methods for the three examiners. The inter-examiner reproducibility was moderate in both visual-graphic method (ICC = 0.69, p = 0.0001) and V-slope method (ICC = 0.64, p = 0.0001). The VO2peak reached at maximal exercise test was 20.6 ± 7.8 ml/kg•min-1. The mean values of VO2 in AT
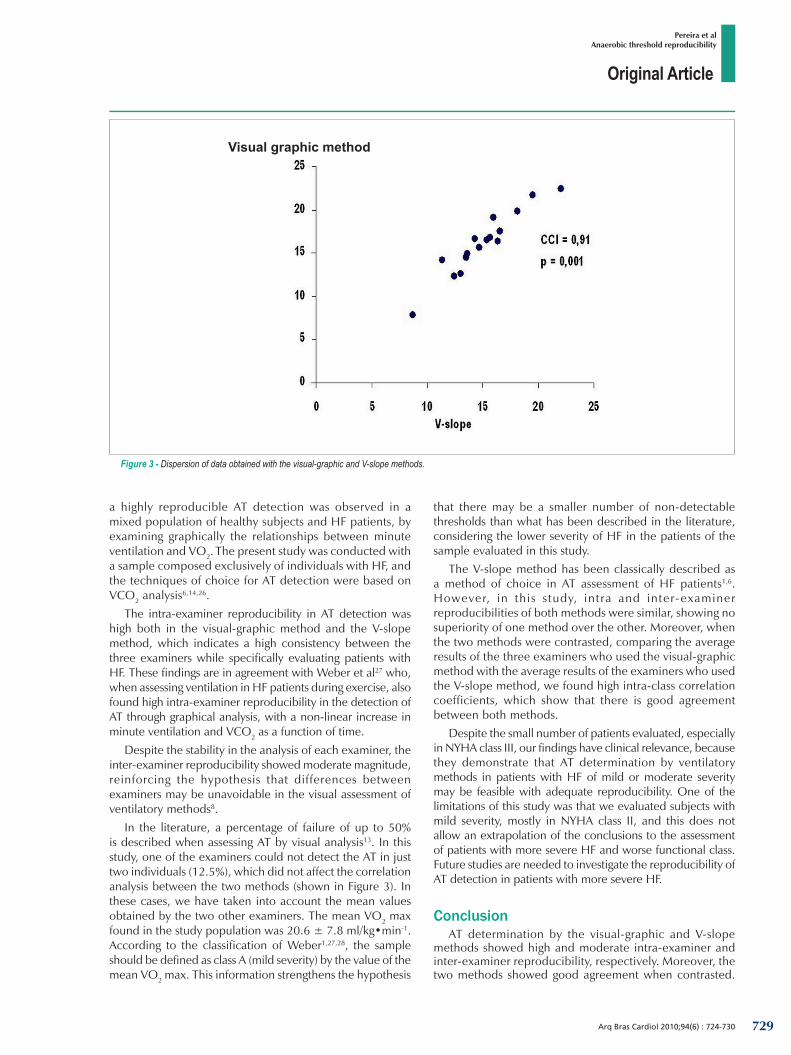
determined by the three examiners were 15.10 ± 3.20 ml/kg•min-1 and 16.15 ± 3.63 ml/kg•min-1 for the visual-graphic and V-slope methods, respectively. These values showed no statistical difference when compared (p = 0.09) with each other. Figure 3 shows the data dispersion graph obtained with both methods. Comparing the two methods, the ICC found was 0.91 (p = 0.001).
726
Original Article
Arq Bras Cardiol 2010;94(6) : 724-730
Pereira et alAnaerobic threshold reproducibility
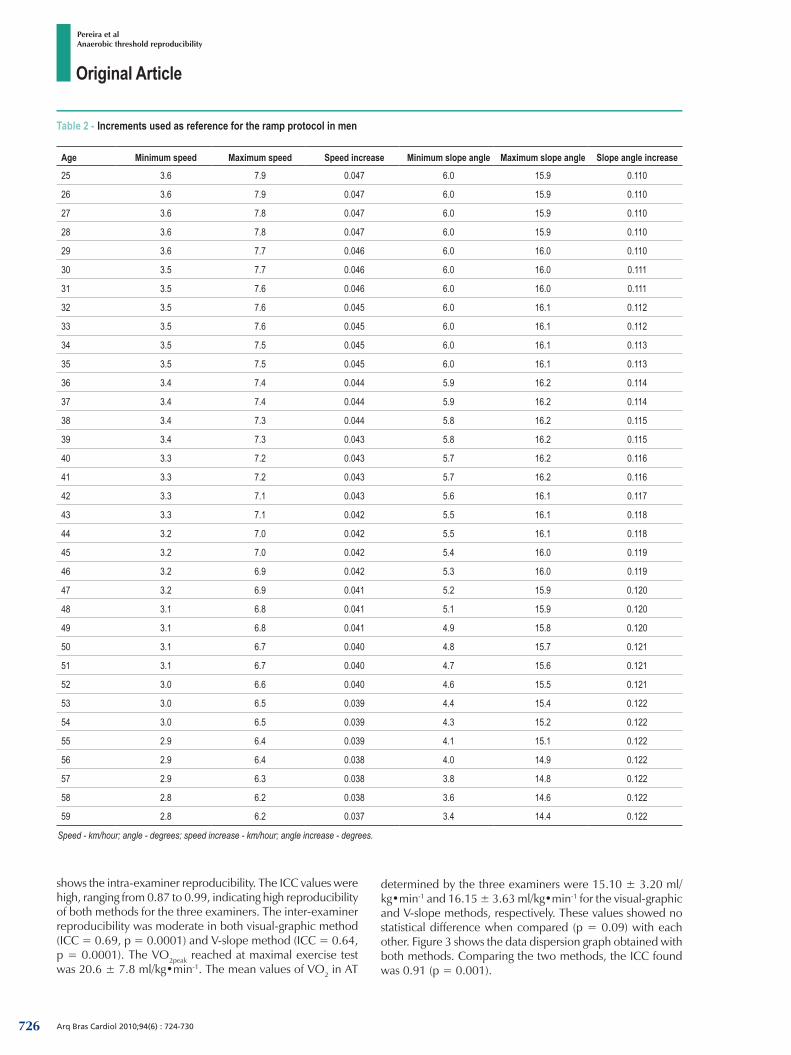
Table 3 - Increments used as reference for the ramp protocol in women
Age Minimum speed Maximum speed Speed increase Minimum slope angle Maximum slope angle Slope angle increase
25 3.3 6.8 0.039 5.6 14.9 0.103
26 3.3 6.8 0.039 5.6 14.9 0.103
27 3.3 6.7 0.039 5.6 14.9 0.103
28 3.3 6.7 0.038 5.6 14.9 0.103
29 3.2 6.7 0.038 5.6 14.9 0.103
30 3.2 6.6 0.038 5.6 14.9 0.103
31 3.2 6.6 0.037 5.6 14.9 0.103
32 3.2 6.5 0.037 5.6 14.9 0.103
33 3.2 6.5 0.037 5.6 14.8 0.103
34 3.2 6.4 0.036 5.5 14.8 0.103
35 3.1 6.4 0.036 5.5 14.8 0.103
36 3.1 6.4 0.036 5.4 14.7 0.103
37 3.1 6.3 0.036 5.4 14.7 0.104
38 3.1 6.3 0.035 5.3 14.7 0.104
39 3.1 6.2 0.035 5.3 14.6 0.104
40 3.0 6.2 0.035 5.2 14.5 0.104
41 3.0 6.1 0.035 5.1 14.5 0.104
42 3.0 6.1 0.034 5.0 14.4 0.104
43 3.0 6.0 0.034 5.0 14.3 0.104
44 2.9 6.0 0.034 4.9 14.3 0.104
45 2.9 5.9 0.034 4.8 14.2 0.104
46 2.9 5.9 0.033 4.7 14.1 0.104
47 2.9 5.9 0.033 4.5 14.0 0.105
48 2.8 5.8 0.033 4.4 13.9 0.105
49 2.8 5.8 0.033 4.3 13.7 0.105
50 2.8 5.7 0.033 4.2 13.6 0.105
51 2.8 5.7 0.032 4.0 13.5 0.105
52 2.7 5.6 0.032 3.9 13.3 0.105
53 2.7 5.6 0.032 3.7 13.2 0.105
54 2.7 5.5 0.032 3.6 13.0 0.105
55 2.6 5.5 0.032 3.4 12.9 0.105
56 2.6 5.4 0.031 3.3 12.7 0.105
57 2.6 5.4 0.031 3.1 12.5 0.105
58 2.5 5.3 0.031 2.9 12.3 0.105
59 2.5 5.3 0.031 2.7 12.1 0.105
Speed - km/hour; angle - degrees; speed increase - km/hour; angle increase - degrees
DiscussionThe main findings of this study were a high intra-examiner
reproducibility and a moderate inter-examiner reproducibility, both in the visual-graphic method and the V-slope method. These results reinforce the possibility of using both methods in AT detection, especially considering the fact that they are non-invasive techniques for determining this variable.
AT detection by ventilatory methods is considered valid5,14,16,25 and in healthy subjects and athletes, it has proven to be highly reproducible5,25. In HF patients, the validity of ventilatory methods is questioned, because of difficulties in detecting AT1,6,12,14,26 in this population, and because of the inherent subjectivity of the visual analysis.8 In a study conducted by Matsumara et al16,
727

Original Article
Arq Bras Cardiol 2010;94(6) : 724-730
Pereira et alAnaerobic threshold reproducibility
Table 4 – Intra-examiner reproducibility
CCI* visual graphic method p CCI V-slope method p
Examiner 1 0.95 † 0.00001 0.94 † 0.001
Examiner 2 0.94 † 0.00001 0.99 † 0.0001
Examiner 3 0.87 † 0.0001 0.92 † 0.0001
*ICC - intra-class correlation coefficient; † p < 0.05.
Figure 1 - Overview of the visual-graphic method, plotting VCO2 and VO2 as a function of time. VO2 - oxygen consumption in ml/min; VCO2 - carbon dioxide production in ml/min; LA - anaerobic threshold; tempo - time.
Figure 2 - Overview of the V-slope method, plotting VCO2 as a function of VO2. VO2 - oxygen consumption in ml/min; VCO2 - carbon dioxide production in ml/min; LA - anaerobic threshold.
728
Original Article
Arq Bras Cardiol 2010;94(6) : 724-730
Pereira et alAnaerobic threshold reproducibility
a highly reproducible AT detection was observed in a mixed population of healthy subjects and HF patients, by examining graphically the relationships between minute ventilation and VO2. The present study was conducted with a sample composed exclusively of individuals with HF, and the techniques of choice for AT detection were based on VCO2 analysis6,14,26.
The intra-examiner reproducibility in AT detection was high both in the visual-graphic method and the V-slope method, which indicates a high consistency between the three examiners while specifically evaluating patients with HF. These findings are in agreement with Weber et al27 who, when assessing ventilation in HF patients during exercise, also found high intra-examiner reproducibility in the detection of AT through graphical analysis, with a non-linear increase in minute ventilation and VCO2 as a function of time.
Despite the stability in the analysis of each examiner, the inter-examiner reproducibility showed moderate magnitude, reinforcing the hypothesis that differences between examiners may be unavoidable in the visual assessment of ventilatory methods8.
In the literature, a percentage of failure of up to 50% is described when assessing AT by visual analysis13. In this study, one of the examiners could not detect the AT in just two individuals (12.5%), which did not affect the correlation analysis between the two methods (shown in Figure 3). In these cases, we have taken into account the mean values obtained by the two other examiners. The mean VO2 max found in the study population was 20.6 ± 7.8 ml/kg•min-1. According to the classification of Weber1,27,28, the sample should be defined as class A (mild severity) by the value of the mean VO2 max. This information strengthens the hypothesis
Figure 3 - Dispersion of data obtained with the visual-graphic and V-slope methods.
Visual graphic method
that there may be a smaller number of non-detectable thresholds than what has been described in the literature, considering the lower severity of HF in the patients of the sample evaluated in this study.
The V-slope method has been classically described as a method of choice in AT assessment of HF patients1,6. However, in this study, intra and inter-examiner reproducibilities of both methods were similar, showing no superiority of one method over the other. Moreover, when the two methods were contrasted, comparing the average results of the three examiners who used the visual-graphic method with the average results of the examiners who used the V-slope method, we found high intra-class correlation coefficients, which show that there is good agreement between both methods.
Despite the small number of patients evaluated, especially in NYHA class III, our findings have clinical relevance, because they demonstrate that AT determination by ventilatory methods in patients with HF of mild or moderate severity may be feasible with adequate reproducibility. One of the limitations of this study was that we evaluated subjects with mild severity, mostly in NYHA class II, and this does not allow an extrapolation of the conclusions to the assessment of patients with more severe HF and worse functional class. Future studies are needed to investigate the reproducibility of AT detection in patients with more severe HF.
ConclusionAT determination by the visual-graphic and V-slope
methods showed high and moderate intra-examiner and inter-examiner reproducibility, respectively. Moreover, the two methods showed good agreement when contrasted.
729
Original Article
Arq Bras Cardiol 2010;94(6) : 724-730
Pereira et alAnaerobic threshold reproducibility
References1. Arena R, Myers J, Williams MA, Gulati M, Kligfield P, Baladi GJ, et al.
Assessment of functional capacity in clinical and research settings: a scientific statement from American Heart Association Committee on Exercise, Rehabilitation, and Prevention of the Council on Clinical Cardiology and the Council on Cardiovascular Nursing. Circulation. 2007; 116 (3): 329-43.
2. Arena R, Myers J, Guazzi M. The clinical importance of cardiopulmonary exercise testing and aerobic training in patients with heart failure. Rev Bras Fisioter. 2008; 12 (2): 75-87.
3. César MA, Montesano FT, Diniz RVZ, Almeida DR, Tebexreni AS, Barros TL. Respostas cardiopulmonares ao exercício em pacientes com insuficiência cardíaca congestiva de diferentes faixas etárias. Arq Bras Cardiol. 2006; 86 (1): 14-8.
4. Braga AMFW, Rondon MUPB, Negrão CE, Wajngarten M. Predictive value of ventilatory and metabolic variables for risk of death in patients with cardiac failure. Arq Bras Cardiol. 2006; 86 (6): 451-8.
5. Gaskill SE, Ruby BC, Walker AJ, Sanchez OA, Serfass RC, Leon AS. Validity and reliability of combining three methods to determine ventilatory threshold. Med Sci Sports Exerc. 2001; 33 (11): 1841-8.
6. Ingle L. Theoretical rationale and practical recommendations for cardiopulmonary exercise testing with chronic heart failure. Heart Fail Rev. 2007; 12 (1): 12-22.
7. Bentley DJ, Newell J, Bishop D. Incremental exercise test design and analysis: implications for performance diagnostics in endurance athletes. Sports Med. 2007; 37 (7): 575-86.
8. Bosquet L, Léger L, Legros P. Methods to determine aerobic endurance. Sports Med. 2002; 32 (11): 675-700.
9. Duvillard SPV. Exercise lactate levels: simulation and reality of aerobic and anaerobic metabolism. Eur J Physiol. 2001; 86 (1): 3-5.
10. Svedahl K, MacIntosh BR. Anaerobic threshold: the concept and methods of measurement. Can J Apl Physiol. 2003; 28 (2): 299-323.
11. Wasserman K, Koike A. Is the anaerobic threshold truly anaerobic. Chest. 1992; 101 (5): 211S-218S.
12. Wasserman K. Determinants and detection of anaerobic threshold and consequences of exercise above it. Circulation. 1987; 76 (Suppl.V): V1-V29.
13. Wasserman K, Mcilroy MB. Detecting the threshold of anaerobic metabolism in cardiac patients during exercise. Am J Cardiol. 1964; 14: 844-52.
14. Beaver WL, Wasserman K, Whipp BJ. A new method for detecting anaerobic threshold by gas exchange. J Appl Physiol. 1986; 60 (6): 2020-7.
15. Higa MN, Silva E, Neves VFC, Catai AM, Gallo JRL, Silva de Sá MF. Comparison of anaerobic threshold determined by visual and mathematical methods in healthy women. Braz J Med Biol Res. 2007; 40 (4): 501-8.
16. Matsumara N, Nishijima H, Kojima S, Hashimoto F, Minami M, Yasuda H. Determination of anaerobic threshold for assessment of functional state in patients with chronic heart failure. Circulation. 1983; 68 (2): 360-7.
17. Gitt AK, Wasserman K, Kilkowski C, Kleeemann A, Kilkowski A, Bangert M, et al. Exercise anaerobic threshold and ventilatory efficiency identify heart failure patients for high risk of early death. Circulation. 2002; 106 (24): 3079-84.
18. Meyer T, George G, Schwaab B, Hildebirandt K, Walldorf J, Schafer C, et al. An alternative approach for exercise prescription and efficacy testing in patients with chronic heart failure: a randomized controlled training study. Am Heart J. 2005; 149 (5): 926e1-926e7.
19. Hunt SA, Abraham WT, Chin MH, Feldman AM, Francis GS, Garriats TG, et al. ACC/AHA 2005 guideline update for the diagnosis and management of chronic heart failure in the adult: a report of the American College of Cardiology/American Heart Association. Task force on practice guidelines (writing committee to update the 2001 guidelines for the evaluation and management of heart failure): developed in collaboration with the American College of Chest Physicians and the International Society for Heart and Lung Transplantation: endorsed by the heart rhythm society. Circulation. 2005; 112 (12): e154-235.
20. Barretto ACP, Drumond Neto C, Mady C, Albuquerque DC, Brindeiro Filho D, Braile DM, et al. / Sociedade Brasileira de Cardiologia. Revisão das II Diretrizes da Sociedade Brasileira de Cardiologia para o diagnóstico e tratamento da insuficiência cardíaca. Arq Bras Cardiol. 2002; 79 (supl 4): 1-30.
21. Costa RVC, Nóbrega ACL, Serra SM, Rego S, Wajngarten M. Influence of skeletal muscle mass on ventilatory and hemodynamic variables during exercise in patients with chronic heart failure. Arq Bras Cardiol. 2003; 81 (6): 581-5.
22. Barbosa OS, Sobral DCF. Uma nova proposta para orientar a velocidade e inclinação no protocolo em rampa na esteira ergométrica. Arq Bras Cardiol. 2003; 81 (1): 48-53.
23. Brito FS, Vilas Boas F, Castro I, Oliveira JA, Guimarães JI, Stein R, et al. II Diretrizes da Sociedade Brasileira de Cardiologia sobre teste ergométrico. Arq Bras Cardiol. 2002; 78 (supl. 2): 1-17.
24. Guimarães JI, Stein R, Vilas Boas F. Normatização de técnicas e equipamentos para realização de exames em ergometria e ergoespirometria. Arq Bras Cardiol. 2003; 80 (4): 458-64.
25. Amann M, Subudhi AW, Walker J, Eisenman P, Shultz B, Foster C. An evaluation of the predictive validity and reliability of ventilatory threshold. Med Sci Sports Exerc. 2004; 36 (10): 1716-22.
26. Myers J. Applications of cardiopulmonary exercise testing in the management of cardiovascular and pulmonary disease. Int J Sports Med. 2005; 26 (supl 1): S49-S55.
27. Weber KT, Kinasewitz GT, Janicki JS, Fishman AP. Oxygen utilization and ventilation during exercise in patients with chronic cardiac failure. Circulation. 1982; 65 (6): 1213-23.
28. Weber KT, Janicki JS, McElroy PA. Determination of aerobic capacity and the severity of chronic cardiac and circulatory failure. Circulation. 1987; 76 (Suppl VI): VI40-45.
These results suggest that both methods can be used in a reproducible way, in AT assessment of patients with mild to moderate HF.
Potential Conflict of InterestNo potential conflict of interest relevant to this article was
reported.
Sources of FundingThis study was partially funded by FAPEMIG and CNPq.
Study AssociationThis article is part of the thesis of doctoral submitted by
Danielle Aparecida Gomes Pereira, from Universidade Federal de Minas Gerais.
730
Related Documents