REPRODUCTIVE BIOLOGY OF THE DEEP-WATER GORGONIAN CORAL ACANELLA ARBUSCULA FROM THE NORTHWEST ATLANTIC by Lindsay I. Beazley Submitted in partial fulfilment of the requirements for the degree of Master of Science at Dalhousie University Halifax, Nova Scotia February 2011 © Copyright by Lindsay I. Beazley, 2011

Welcome message from author
This document is posted to help you gain knowledge. Please leave a comment to let me know what you think about it! Share it to your friends and learn new things together.
Transcript
REPRODUCTIVE BIOLOGY OF THE DEEP-WATER GORGONIAN CORAL
ACANELLA ARBUSCULA FROM THE NORTHWEST ATLANTIC
by
Lindsay I. Beazley
Submitted in partial fulfilment of the requirements
for the degree of Master of Science
at
Dalhousie University
Halifax, Nova Scotia
February 2011
© Copyright by Lindsay I. Beazley, 2011
ii
DALHOUSIE UNIVERSITY
DEPARTMENT OF BIOLOGY
The undersigned hereby certify that they have read and recommend to the Faculty of
Graduate Studies for acceptance a thesis entitled “REPRODUCTIVE BIOLOGY OF
THE DEEP-WATER GORGONIAN CORAL ACANELLA ARBUSCULA FROM THE
NORTHWEST ATLANTIC” by Lindsay I. Beazley in partial fulfillment of the
requirements for the degree of Master of Science.
Dated: February 11, 2011
Supervisor: _________________________________
Readers: _________________________________
_________________________________
_________________________________
iii
DALHOUSIE UNIVERSITY
DATE: February 11, 2011
AUTHOR: Lindsay I. Beazley
TITLE: REPRODUCTIVE BIOLOGY OF THE DEEP-WATER GORGONIAN
CORAL ACANELLA ARBUSCULA FROM THE NORTHWEST
ATLANTIC
DEPARTMENT OR SCHOOL: Department of Biology
DEGREE: MSc CONVOCATION: May YEAR: 2011
Permission is herewith granted to Dalhousie University to circulate and to have copied for
non-commercial purposes, at its discretion, the above title upon the request of individuals
or institutions. I understand that my thesis will be electronically available to the public.
The author reserves other publication rights, and neither the thesis nor extensive extracts
from it may be printed or otherwise reproduced without the author‟s written permission.
The author attests that permission has been obtained for the use of any copyrighted
material appearing in the thesis (other than the brief excerpts requiring only proper
acknowledgement in scholarly writing), and that all such use is clearly acknowledged.
_______________________________
Signature of Author
iv
Table of Contents
List of Tables ................................................................................................................... vii
List of Figures ..................................................................................................................... x
Abstract ........................................................................................................................... xiii
List of Abbreviations and Symbols Used ........................................................................ xiv
Acknowledgements .......................................................................................................... xvi
Chapter 1: Introduction ....................................................................................................... 1
1.1. General Introduction .................................................................................................... 1
Chapter 2. Reproductive Biology of Acanella arbuscula ................................................... 7
2.1. Introduction .................................................................................................................. 7
2.2. Materials and Methods ............................................................................................... 12
2.21. Study Areas and Sample Collection .............................................................. 12
2.22. Histological Preparation and Examination .................................................... 20
2.23. Intra-Colony Variation in Polyp Fecundity and Gamete Size ....................... 21
2.24. Statistical Analyses ........................................................................................ 24
2.3. Results ........................................................................................................................ 28
2.31. General Reproductive Characteristics ............................................................ 28
2.32. Gametogenesis ............................................................................................... 29
2.33. Gamete Size-Frequency Distributions ........................................................... 33
2.34. Intra-Colony Variation in Polyp Fecundity and Gamete Size ....................... 35
v
2.35. Size at First Reproduction and Influence of Colony Height on Polyp
Fecundity and Gamete Size .................................................................................... 44
2.4. Discussion and Conclusion ........................................................................................ 44
2.41. General Features of Reproduction ................................................................. 44
2.42. Cycle of Gametogenesis ................................................................................ 51
2.43. Intra-Colony Variation in Polyp Fecundity and Gamete Size ....................... 54
2.44. Size at First Reproduction and Influence of Colony Height on Polyp
Fecundity and Gamete Size .................................................................................... 57
2.45. Conclusion ..................................................................................................... 60
Chapter 3. Spatial and Depth Variability in Reproduction of Acanella arbuscula .......... 62
3.1. Introduction ................................................................................................................ 62
3.2. Materials and Methods ............................................................................................... 68
3.21. Study Areas and Sample Collection .............................................................. 68
3.22. Histological Preparation and Examination .................................................... 72
3.23. Environmental Characteristics of each Study Area ....................................... 73
3.24. Statistical Analyses ........................................................................................ 74
3.3. Results ........................................................................................................................ 76
3.31. Spatial Variability in Reproduction ............................................................... 76
3.32. Depth Variability in Reproduction ................................................................. 87
3.33. Comparison of Chlorophyll a Concentration between Areas ........................ 89
vi
3.4. Discussion and Conclusion ........................................................................................ 93
3.41. Spatial Variability in Reproduction ............................................................... 93
3.42. Depth Variability in Reproduction ............................................................... 100
3.43. Conclusion ................................................................................................... 102
Chapter 4: Conclusion ..................................................................................................... 103
4.1. General Conclusion .................................................................................................. 103
Reference List ................................................................................................................. 108
Appendix A. Interaction Plots and Model Comparison for Factors Colony and Zone ... 124
Appendix B. Interaction Plots for Factors Colony and Branch Segment ........................ 127
vii
List of Tables
Table 2.1 Summary of major reproductive characteristics of deep-water octocoral
studies in the primary literature ......................................................................................... 10
Table 2.2 Collection details and sex of Acanella arbuscula colonies collected
between 2007 and 2010 from The Gully and Flemish Cap ............................................... 17
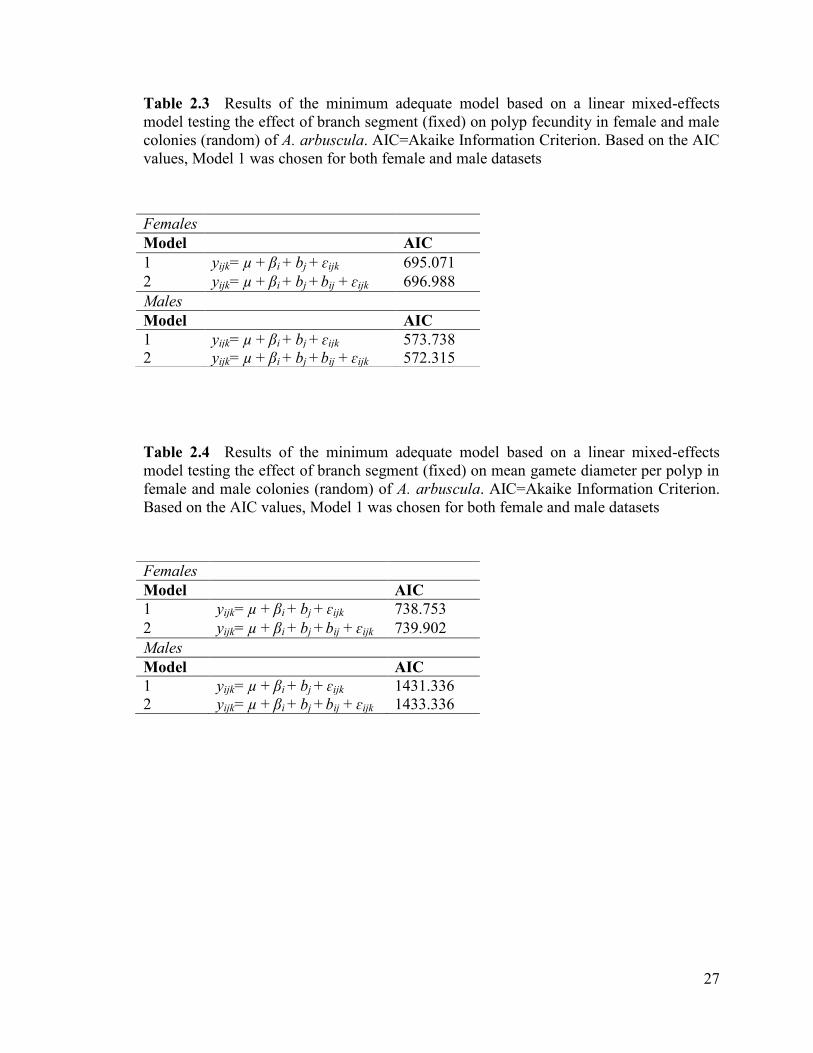
Table 2.3 Results of the minimum adequate model based on a linear mixed-
effects model testing the effect of branch segment (fixed) on polyp fecundity
in female and male colonies (random) of A. arbuscula. AIC=Akaike
Information Criterion. Based on the AIC values, Model 1 was chosen for
both female and male datasets ........................................................................................... 27
Table 2.4 Results of the minimum adequate model based on a linear mixed-
effects model testing the effect of branch segment (fixed) on mean gamete
diameter per polyp in female and male colonies (random) of A. arbuscula.
AIC=Akaike Information Criterion. Based on the AIC values, Model 1
was chosen for both female and male datasets .................................................................. 27
Table 2.5 Percent (%) frequency of the five stages of oogenesis in female
colonies of A. arbuscula collected in June and July. n= number of oocytes.
Log likelihood ratio (G-test) test of independence testing null hypothesis
of equality of proportions between months. Asterisk (*) indicates significance
at α=0.05 ............................................................................................................................ 38
Table 2.6 Percent (%) frequency of the four stages of spermatogenesis in
male colonies of A. arbuscula collected in May through August. n= number
of sperm cysts. Log likelihood ratio (G-test) test of independence with
Williams‟ correction of continuity testing null hypothesis of equality
of proportions between months. Asterisk (*) indicates significance at α=0.05 ................. 38
Table 2.7 ANOVA for a mixed-effects model testing differences in female
polyp fecundity (square root transformed) between branch segments of
A. arbuscula. Tukey‟s Honestly Significant Difference (HSD) post-hoc
test shows comparison of means and relationship where P=proximal,
C=central, D=distal. Asterisk (*) indicates significance at α=0.05 ................................... 41
Table 2.8 ANOVA for a mixed-effects model testing differences in male
polyp fecundity (square root transformed) between branch segments of
A. arbuscula. Tukey‟s Honestly Significant Difference (HSD) post-hoc test
shows comparison of means and relationship where P=proximal, C=central,
D=distal. Asterisk (*) indicates significance at α=0.05 ..................................................... 41
viii
Table 2.9 ANOVA for a mixed-effects model testing differences in
mean oocyte diameter (µm) (square root transformed) between branch
segments of A. arbuscula. Asterisk (*) indicates significance at α=0.05 .......................... 42
Table 2.10 ANOVA for a mixed-effects model testing differences in
mean spermatic cyst diameter (µm) (not transformed) between branch
segments of A. arbuscula. Tukey‟s Honestly Significant Difference (HSD)
post-hoc test shows comparison of means and relationship, where P=proximal,
C=central, D=distal. Asterisk (*) indicates significance at α=0.05 ................................... 42
Table 2.11 Percent (%) frequency of the five stages of oogenesis across the
proximal, central, and distal branch segments. n= number of oocytes. Log
likelihood ratio (G-test) test of independence testing null hypothesis of
equality of proportions between branch segments ............................................................. 43
Table 2.12 Percent (%) frequency of the four stages of spermatogenesis
across the proximal, central, and distal branch segments. n= number of sperm
cysts. Log likelihood ratio (G-test) test of independence with Williams‟
correction of continuity testing null hypothesis of equality of proportions
between branch segments .................................................................................................. 43
Table 2.13 Maximum oocyte diameters (µm) comparable to A. arbuscula
for some gorgonian corals studied in shallow- (i.e. <200 m) and deep-water
(i.e. >200 m) habitats ......................................................................................................... 50
Table 3.1 Collection details of Acanella arbuscula colonies collected between
2007 and 2010 from The Gully and Flemish Cap .............................................................. 70
Table 3.2 ANOVA for one-way model testing differences in mean polyp
fecundity (not transformed) per polyp per female colony between The Gully
and Flemish Cap ................................................................................................................ 79
Table 3.3 ANOVA for one-way model testing differences in mean polyp
fecundity (not transformed) per polyp per male colony between The Gully
and Flemish Cap ................................................................................................................ 79
Table 3.4 ANOVA for one-way model testing differences in mean oocyte
diameter (µm) (not transformed) per polyp per colony between The Gully
and Flemish Cap ................................................................................................................ 81
Table 3.5 ANOVA for one-way model testing differences in mean
spermatic cyst diameter (µm) (not transformed) per polyp per colony between
The Gully and Flemish Cap ............................................................................................... 81
ix
Table 3.6 Mean number of fertile and unfertile polyps per colony for female
and male colonies collected in The Gully (both 2007 and 2010) and Flemish Cap .......... 84
x
List of Figures
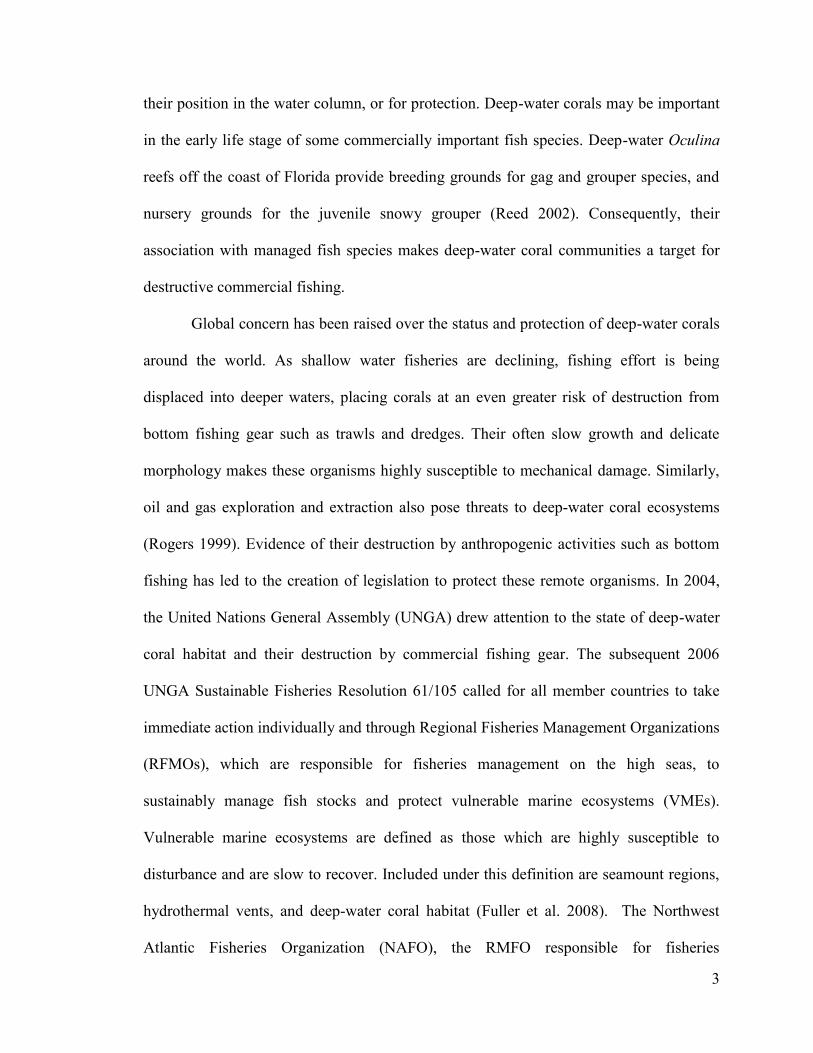
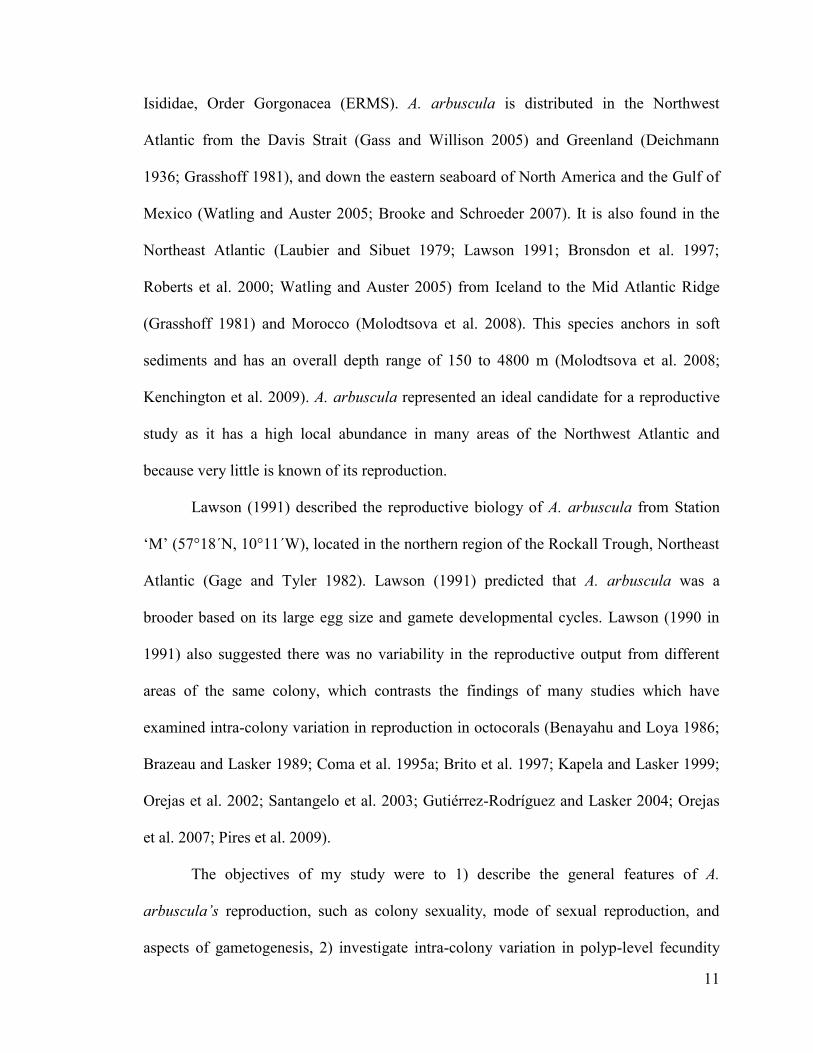
Fig. 2.1 a Acanella arbuscula colony in Desbarres Canyon, southwest Grand Banks,
at 824 m depth. b Polyp of A. arbuscula showing elongate spicules extended
towards the tentacles .......................................................................................................... 13
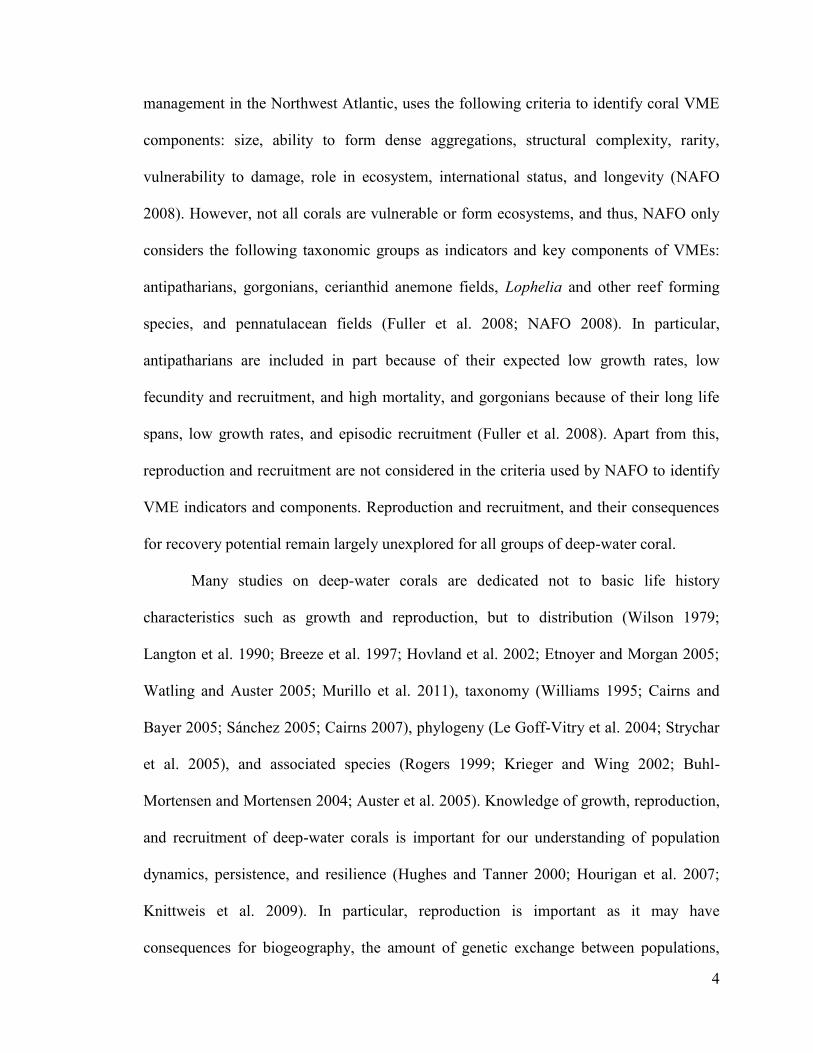
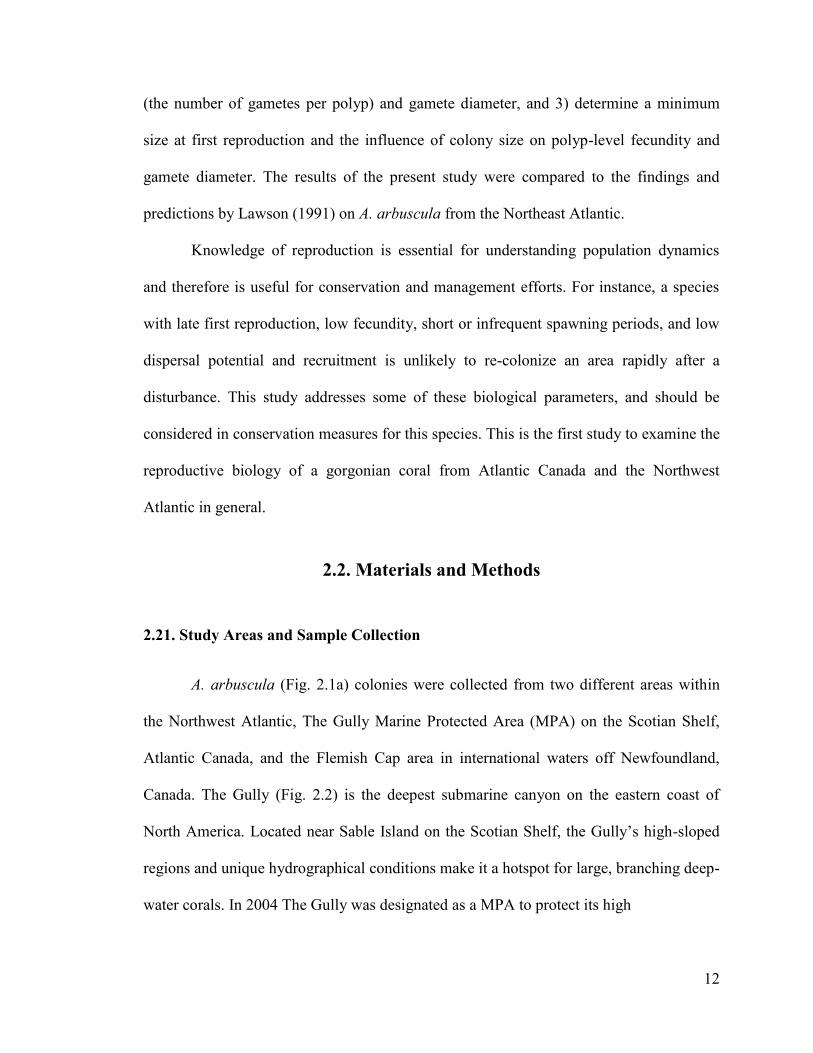
Fig. 2.2 The Gully MPA on the Scotian shelf showing the locations of each
dive where collections of A. arbuscula were made using ROPOS in 2007 and
2010. Red line indicated Canadian exclusive economic zone (EEZ) ............................... 14
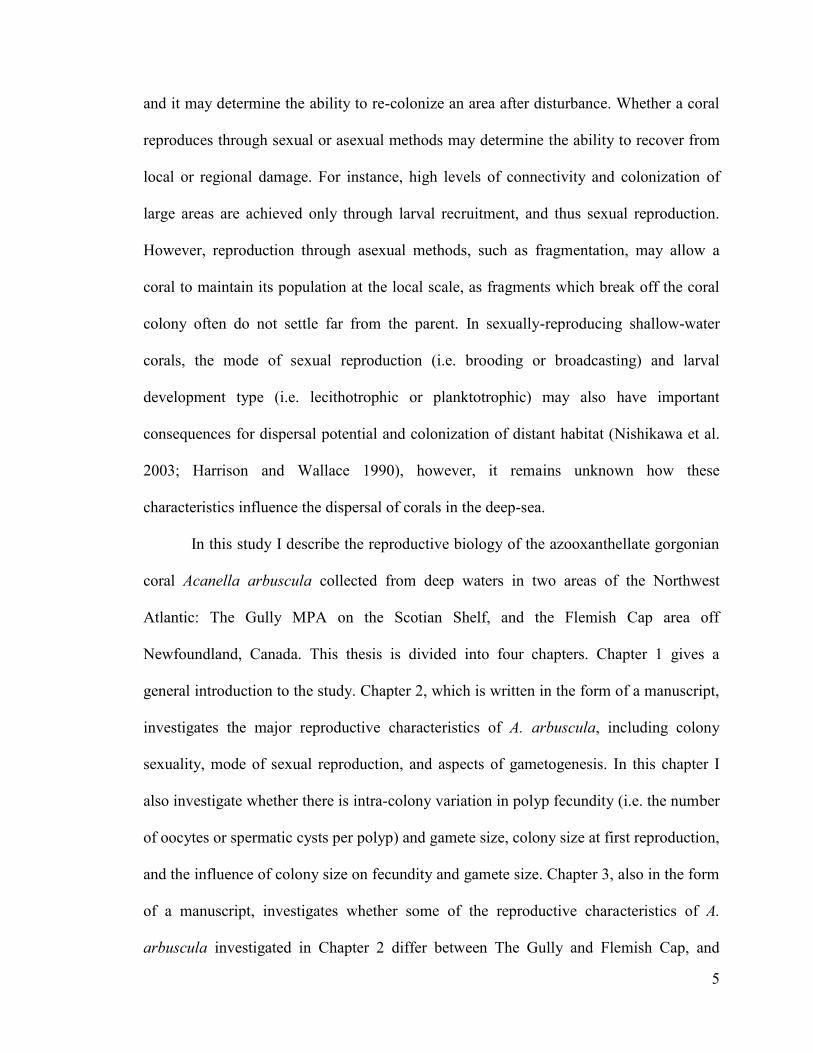
Fig. 2.3 The Flemish Cap and Grand Banks regions showing the locations
of each dive where collections of A. arbuscula were made during the NAFO
surveys in 2009. Red line indicated Canadian exclusive economic zone
(EEZ); French EEZ represents Saint-Pierre et Miquelon .................................................. 16
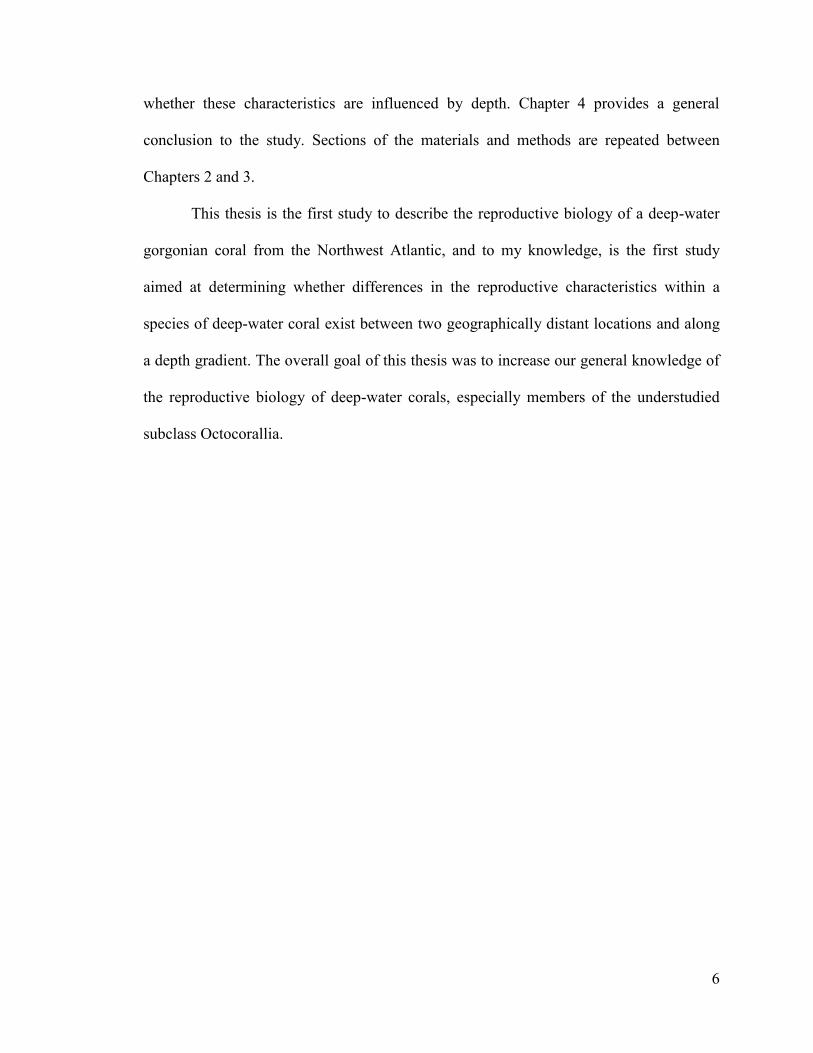
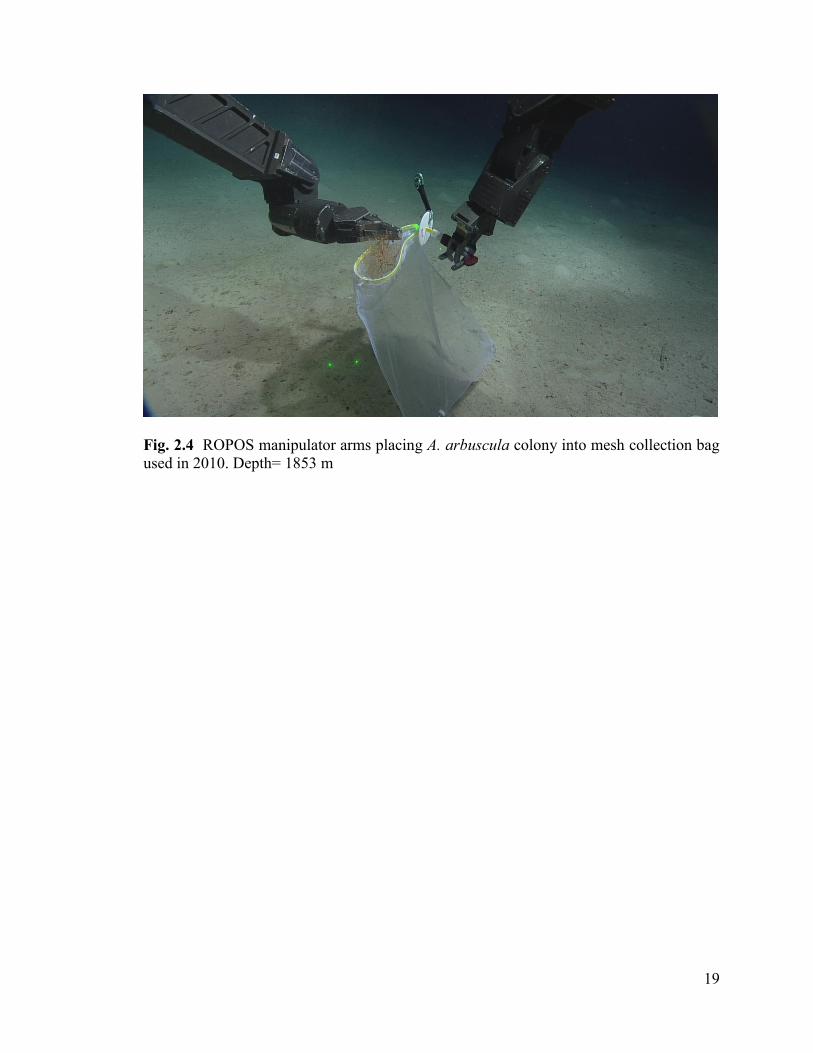
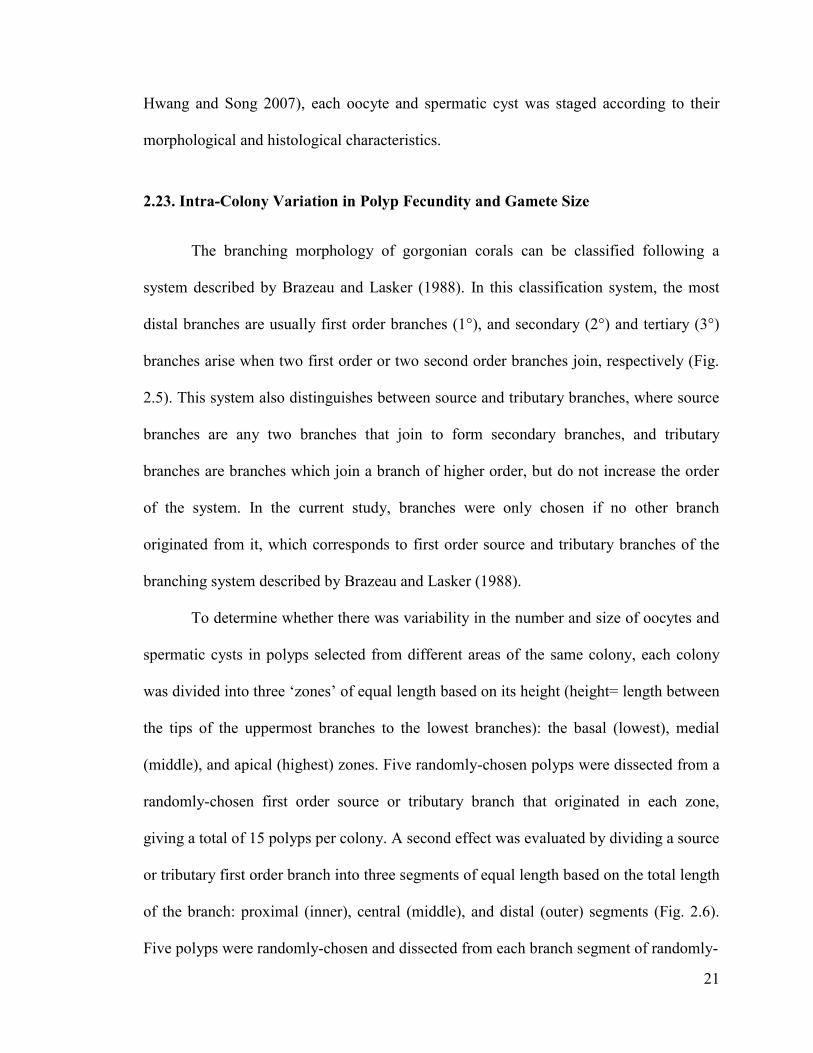
Fig. 2.4 ROPOS manipulator arms placing Acanella arbuscula colony
into mesh collection bags used in 2010. Depth= 1853 m .................................................. 19
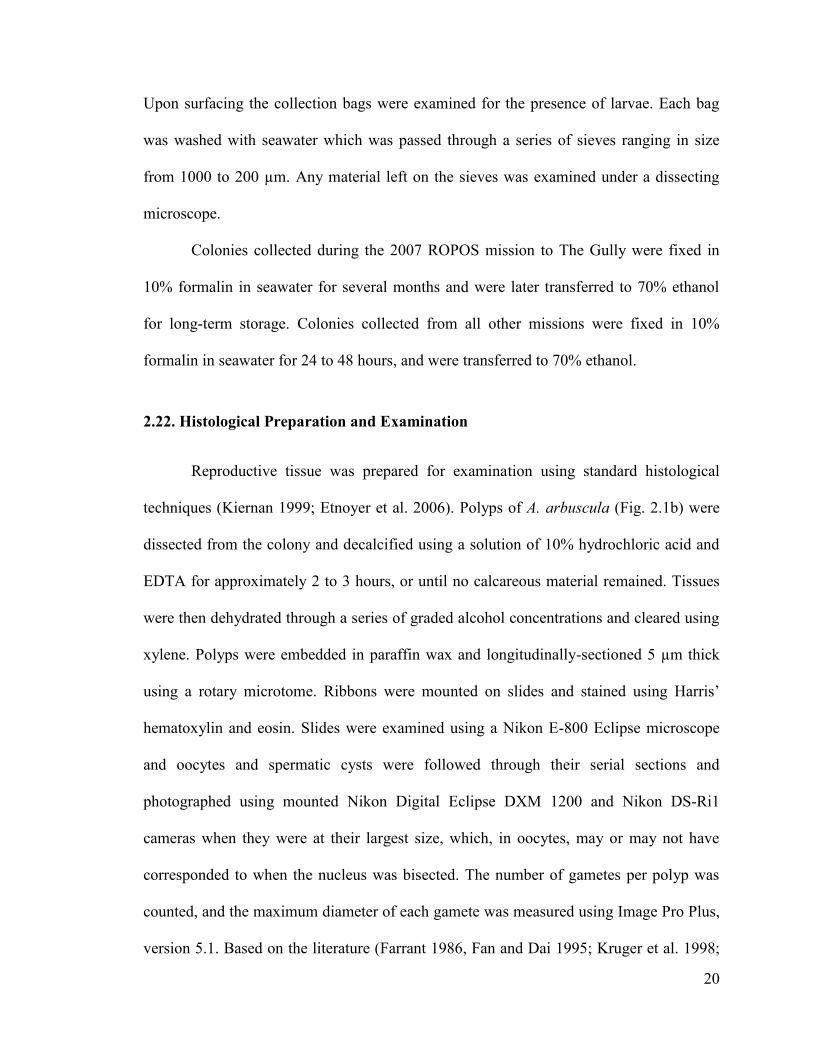
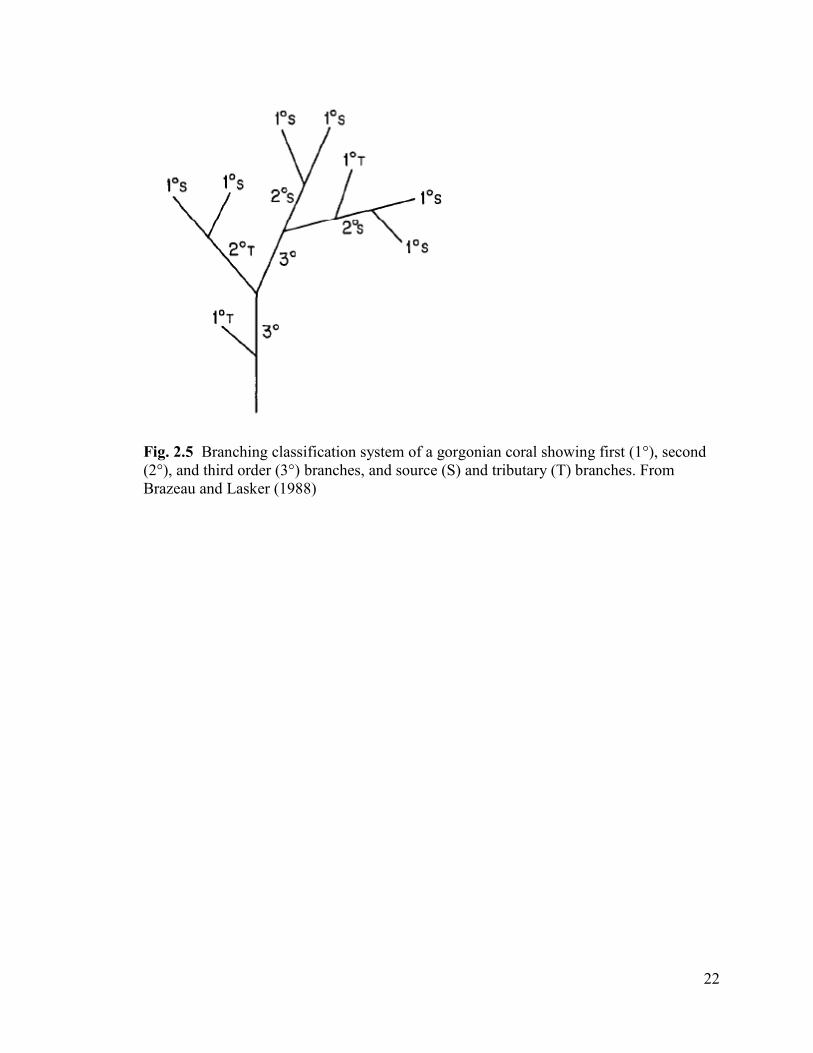
Fig. 2.5 Branching classification system of a gorgonian coral showing first
(1°), second (2°), and third order (3°) branches, and source (S) and tributary
(T) branches. From Brazeau and Lasker (1988) ............................................................... 22
Fig. 2.6 Division of source (S) and tributary (T) first order (1°) branches
into three segments: proximal (P), central (C), and distal (D) .......................................... 23
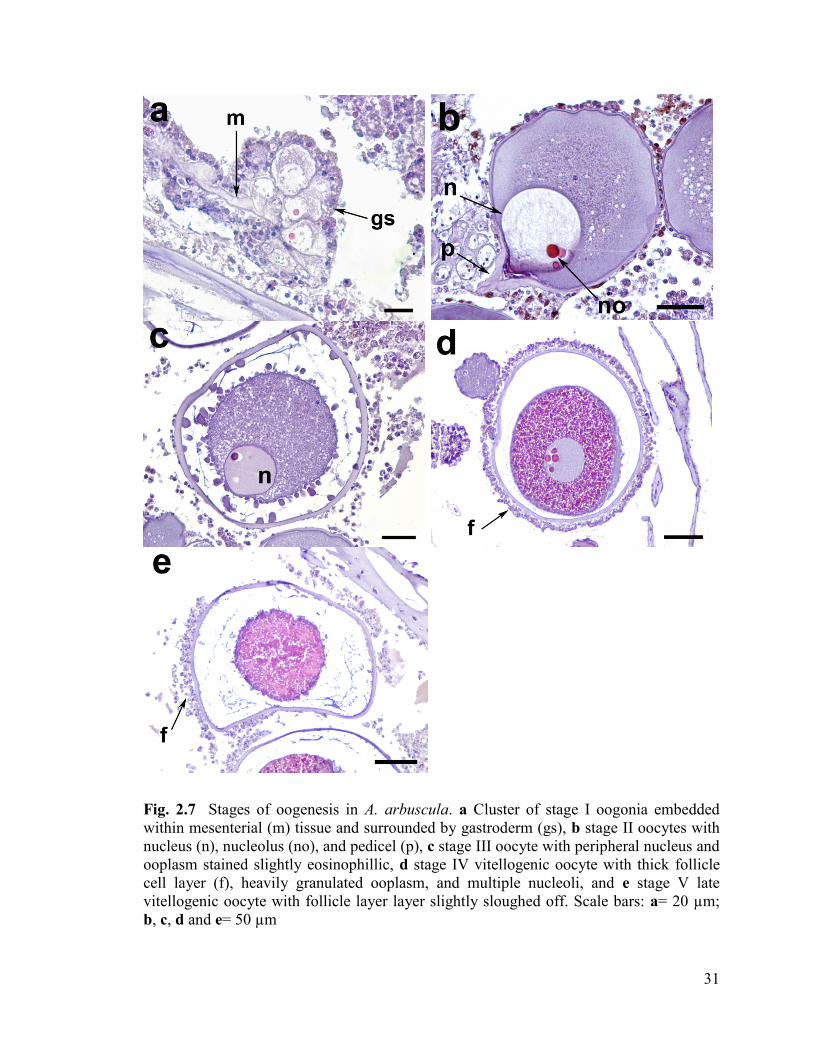
Fig. 2.7 Stages of oogenesis in A. arbuscula. a Cluster of stage I oogonia
embedded within mesenterial (m) tissue and surrounded by gastroderm (gs),
b stage II oocytes with nucleus (n), nucleolus (no), and pedicel (p), c stage III
oocyte with peripheral nucleus and ooplasm stained slightly eosinophillic, d
stage IV vitellogenic oocyte with thick follicle cell layer (f), heavily granulated
ooplasm, and multiple nucleoli, and e stage V late vitellogenic oocyte with
cortical layer slightly sloughed off. Scale bars: a= 20 µm; b, c, d and e= 50 µm ............. 31
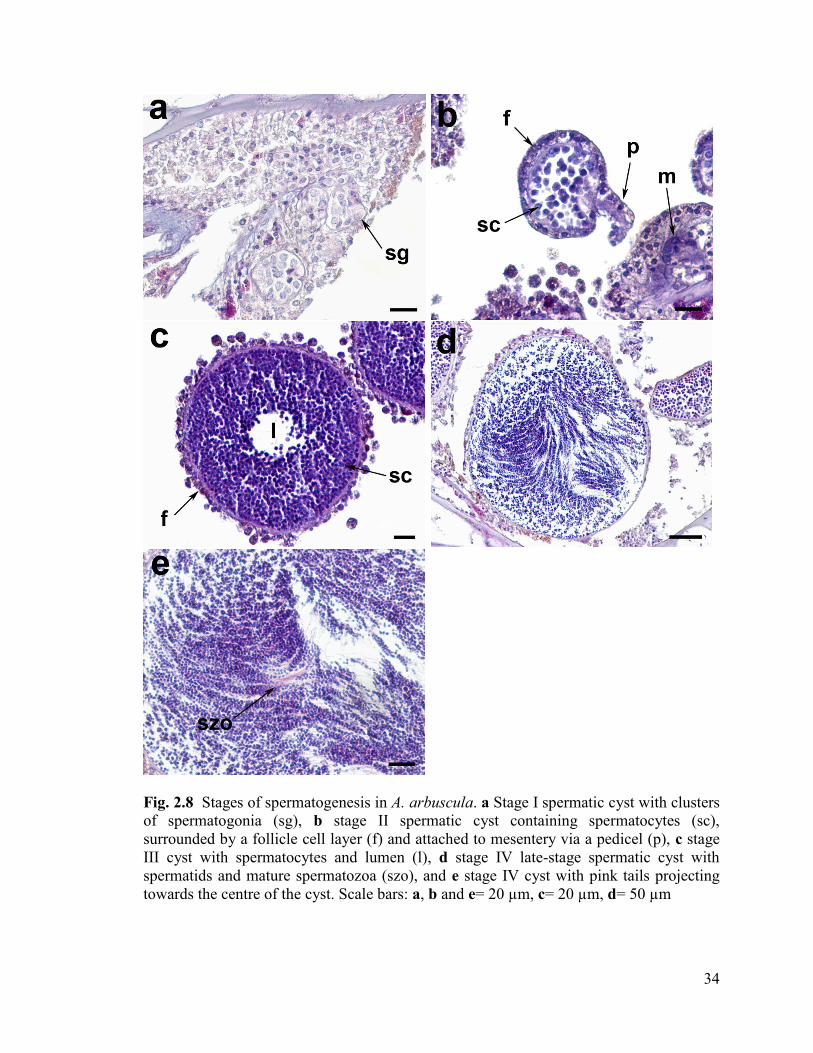
Fig. 2.8 Stages of spermatogenesis in A. arbuscula. a Stage I spermatic cyst
with clusters of spermatogonia (sg), b stage II spermatic cyst containing
spermatocytes (sc) and attached to mesentery via a pedicel (p) and
surrounded by a follicle cell layer (f), c stage III cyst with spermatocytes
and lumen (l), d stage IV late-stage spermatic cyst with spermatids
and mature spermatozoa (szo), and e stage IV cyst with pink tails projecting
towards the centre of the cyst. Scale bars: a, b and e= 20 µm, c= 20 µm, d= 50 µm ....... 34
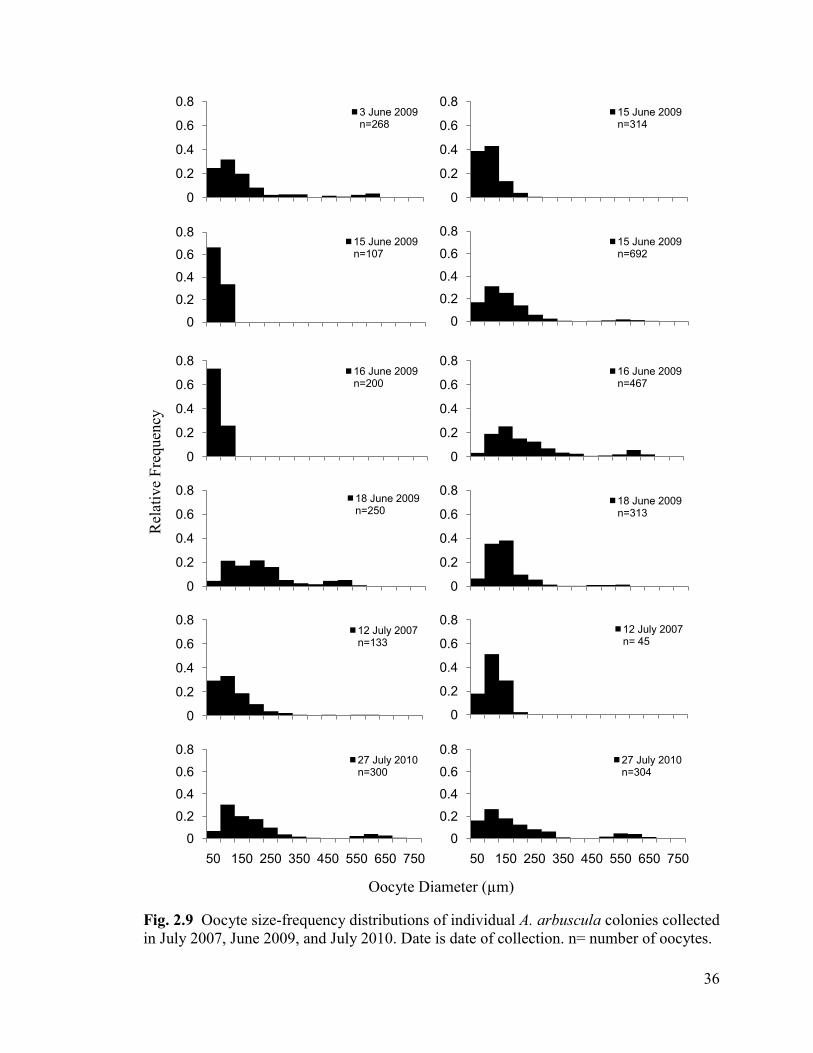
Fig. 2.9 Oocyte size-frequency distributions of individual A. arbuscula colonies
collected in July 2007, June 2009, and July 2010. n= number of oocytes ......................... 36
xi
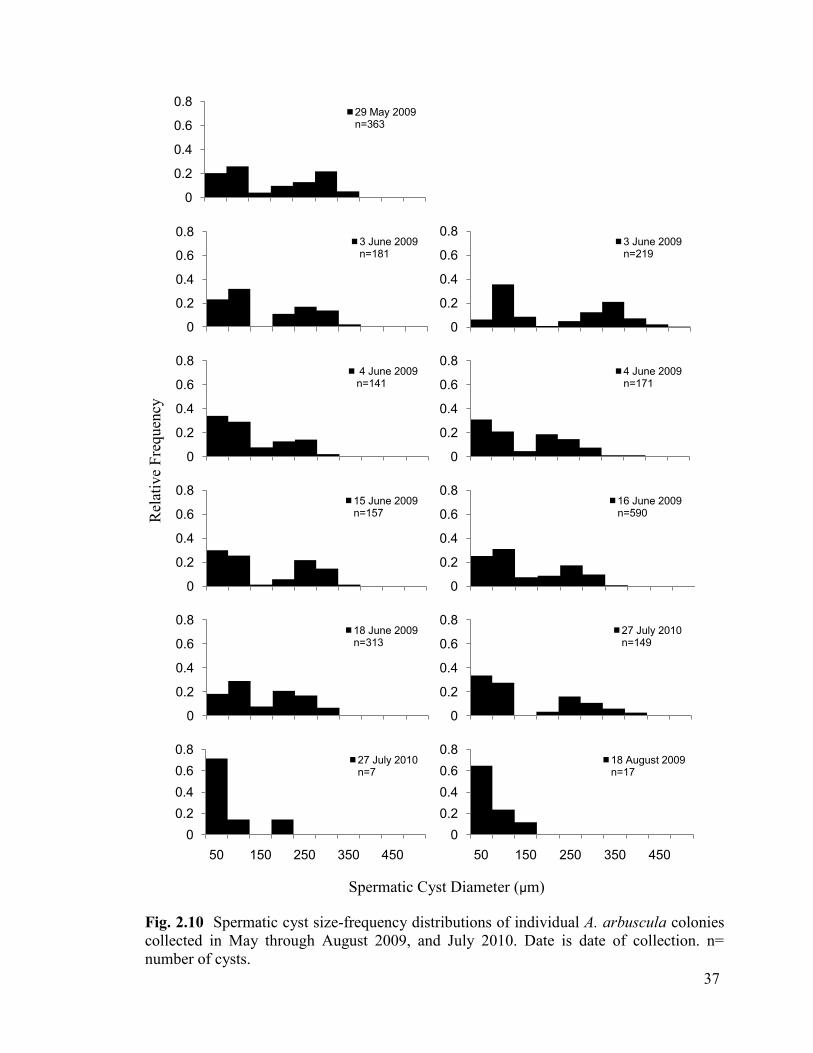
Fig. 2.10 Spermatic cyst size-frequency distributions of individual A. arbuscula
colonies collected in May through August 2009, and July 2010. n= number of cysts ..... 37
Fig. 2.11 a Mean number of gametes per polyp between the proximal
(light grey), central (dark grey), and distal (black) branch positions for female
and male A. arbuscula colonies. b Mean gamete diameter per polyp between the
proximal (light grey), central (dark grey), and distal (black) branch positions
for female and male colonies. Error bars are ± 1 SE ......................................................... 40
Fig. 2.12 a Mean polyp fecundity per colony for female (grey) and male
(black) A. arbuscula colonies as a function of colony height (cm).
b Mean gamete diameter (µm) per polyp per colony for female (grey) and
male (black) A. arbuscula colonies as a function of colony height (cm).
Colour of regression line, equation, R2
and P value corresponds to colour of sex ............ 45
Fig. 2.13 Percent (%) of mature (Stage IV and Stage V) oocytes
(square root transformed) per colony as a function of colony height (cm) ....................... 46
Fig. 3.1 a Mean polyp fecundity per colony for female and male A. arbuscula
colonies collected in The Gully (both 2007 and 2010), and in the Flemish Cap.
b Mean gamete diameter (µm) per colony for female and male A. arbuscula
colonies collected in The Gully (both 2007 and 2010) and in the Flemish Cap.
Error bars are ± 1 SE .......................................................................................................... 78
Fig. 3.2 Box plots of mean polyp fecundity per colony for female colonies of
Acanella arbuscula collected from The Gully in 2007 (2 colonies) and 2010
(2 colonies), and the Flemish Cap (8 colonies) in 2009. Black diamonds represent
the median and stars the mean ........................................................................................... 80
Fig. 3.3 Box plots of mean oocyte diameter (µm) per polyp per colony for
female colonies of Acanella arbuscula collected from The Gully in 2007
(2 colonies) and 2010 (2 colonies), and the Flemish Cap (8 colonies) in 2009.
Black diamonds represent the median and stars the mean ................................................. 82
Fig. 3.4 Oocyte size-frequency distributions of A. arbuscula colonies
collected in the Flemish Cap (June) and The Gully (both July 2007 and 2010).
n= number of oocytes ......................................................................................................... 85
Fig. 3.5 Spermatic cyst size-frequency distributions of A. arbuscula colonies
collected in the Flemish Cap (May, June, August) and The Gully (July 2010).
n= number of spermatic cysts ............................................................................................ 86
xii
Fig. 3.6 a Log +1 mean polyp fecundity per colony for female A. arbuscula
colonies collected in The Gully in 2007 and 2010, and in the Flemish Cap.
b Log +1 mean polyp fecundity for male A. arbuscula colonies collected in
The Gully in 2007 and Flemish Cap in 2009 ..................................................................... 88
Fig. 3.7 a Mean oocyte diameter (µm) per polyp per colony for female
A. arbuscula colonies collected in The Gully in 2007 and 2010, and in the Flemish
Cap as a function of depth (m). b Mean sperm cyst diameter (µm) per
polyp per colony for male A. arbuscula colonies collected in The Gully and Flemish
Cap as a function of depth (m) .......................................................................................... 90
Fig. 3.8 Percent (%) of mature (Stage 4 and Stage 5) oocytes (square root
transformed) per colony as a function of depth (m) .......................................................... 91
Fig. 3.9 Mean monthly surface chlorophyll a (mg/m-3
) concentration in
The Gully and Flemish Cap from 2000 to 2004. Error bars are ± 1 SD ............................ 92
xiii
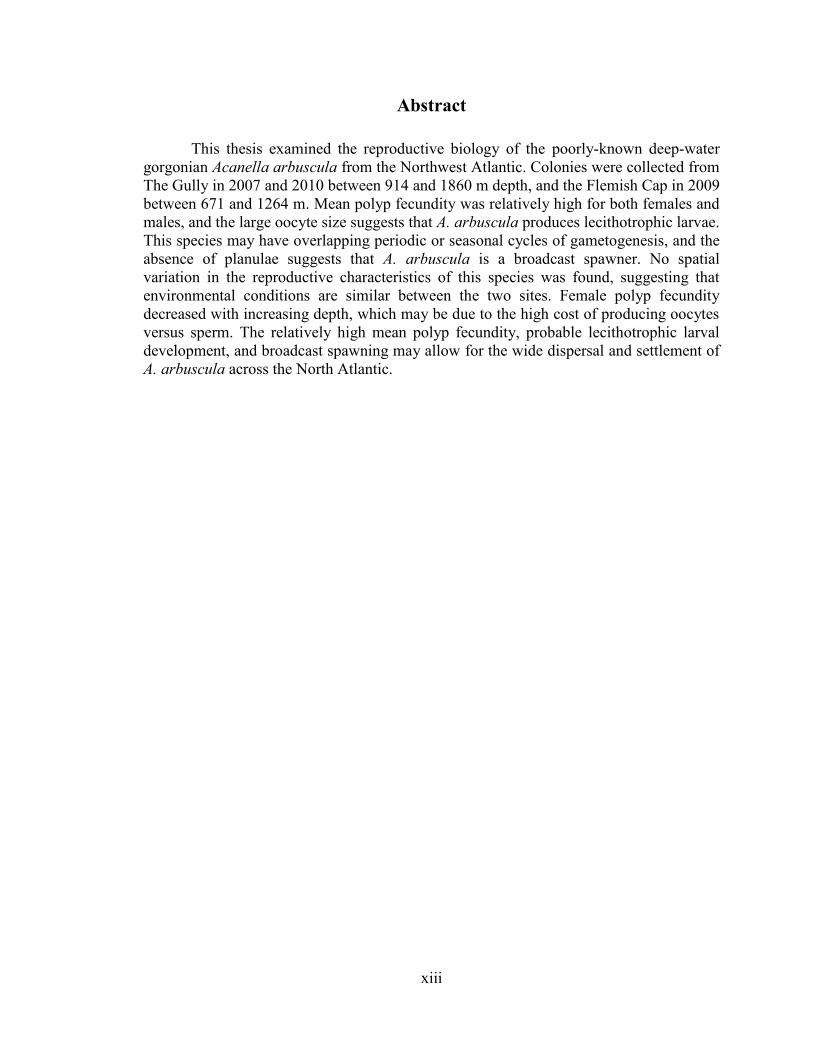
Abstract
This thesis examined the reproductive biology of the poorly-known deep-water
gorgonian Acanella arbuscula from the Northwest Atlantic. Colonies were collected from
The Gully in 2007 and 2010 between 914 and 1860 m depth, and the Flemish Cap in 2009
between 671 and 1264 m. Mean polyp fecundity was relatively high for both females and
males, and the large oocyte size suggests that A. arbuscula produces lecithotrophic larvae.
This species may have overlapping periodic or seasonal cycles of gametogenesis, and the
absence of planulae suggests that A. arbuscula is a broadcast spawner. No spatial
variation in the reproductive characteristics of this species was found, suggesting that
environmental conditions are similar between the two sites. Female polyp fecundity
decreased with increasing depth, which may be due to the high cost of producing oocytes
versus sperm. The relatively high mean polyp fecundity, probable lecithotrophic larval
development, and broadcast spawning may allow for the wide dispersal and settlement of
A. arbuscula across the North Atlantic.
xiv
List of Abbreviations and Symbols Used
α Significance Level
AIC Akaike Information Criterion
ANOVA Analysis of Variance
χ2 Chi-Square Statistic
CTD Conductivity, Temperature, and Depth Sensor
df Degrees of Freedom
EDTA Ethylenediaminetetraacetic acid
EEZ Exclusive Economic Zone
ERMS European Register of Marine Species
ε Experimental Error
F F Statistic
β Effect due to i-th level of Fixed Factor
b Effect due to j-th level of Random Factor
µ Grand Mean
GMT Greenwich Mean Time
HSD Tukey‟s Honestly Significant Difference
µm Micrometre
MAM Minimum Adequate Model
mg m-3
Milligrams per Cubic Metre
MPA Marine Protected Area
n Sample Size
NAFO Northwest Atlantic Fisheries Organization
xv
P P Value
R2 Coefficient of Determination
RFMO Regional Fisheries Management Organization
ROPOS Remotely Operated Platform for Ocean Science
ROV Remotely Operated Vehicle
SD Standard Deviation of the Mean
SE Standard Error of the Mean
SeaWiFS Sea-Viewing Wide Field-of-View Sensor
t T Statistic
UNGA United Nations General Assembly
VME Vulnerable Marine Ecosystem
y Response (Polyp Fecundity or Mean Gamete Diameter)
xvi
Acknowledgements
First and foremost, I would like to thank my supervisor Ellen Kenchington for
providing me with the wonderful opportunity to study this unique environment, both as an
honours student during my undergraduate degree and now as a master‟s student. These
two projects have allowed me to gain invaluable hands-on experience, for which I am
greatly indebted. Ellen always managed to squeeze me in on important research cruises,
which is a rare opportunity for students at any level of research.
I would also like to thank my internal supervisor, Roger Croll, and my committee
member, Anna Metaxas for their invaluable input throughout this project, and for meeting
with me individually at my request. I would like to thank Stephen Smith, Anna Metaxas,
and Bob Farmer for getting me through the statistical analysis portion of the project,
especially Bob Farmer, who whenever we met our conversations turned into a statistical
discussion of some sorts.
I would like to thank Kevin MacIsaac, Andrew McMillan, and Megan Best for
collecting specimens of A. arbuscula for me on the NEREIDA cruises in 2009, and for
following my strict “pickling” schedule. Thanks to Andrew Cogswell for all his input
throughout the project, from help in microscopy to the support and encouragement he
provided when I needed it. Thanks to Barry MacDonald for creating the mesh collection
bags used to collect A. arbuscula in 2010. Thanks to Brian Petrie, who helped me explore
DFO‟s Ocean Management Databases, and Robert Benjamin and Pierre Clement, who
both helped me with the ROPOS databases and CTD data. Thanks to Cam Lirette, who
helped me with my GIS work and plotting in ArcMap. To the rest of the “Kenchington
Crew”, thanks for making my experience at DFO a great one. I have thoroughly enjoyed
working with each and every one of you, and hope it will continue into the future.
Thanks to the crew of the C.C.G.S. Hudson and ROPOS. Both have been
instrumental in the collection of my study species. I am indebted to the ROPOS crew,
who put up with using my mesh collection bags in 2010.
I would like to thank the Faculty of Graduate Studies at Dalhousie for awarding
me with a travel grant that allowed me to present my research to the deep-sea biology
community. My research was funded by the International Governance Strategy (IGS) and
Cox Fisheries Research Scientist awards to Ellen Kenchington.
1
Chapter 1. Introduction
1.1. General Introduction
The existence of corals in the deep ocean has been known since the mid 1700‟s.
Originally discovered by fishermen, deep-living corals were documented scientifically in
1752 upon the discovery of reef-forming species off the coast of Norway (Hovland 2008).
Despite knowledge of their existence for over 250 years, much of what we know about
deep-water corals has been acquired within the last two decades (Roberts and Hirshfield
2004). Recent advancements in marine technology, including the use of ROVs and
submersibles, have allowed scientists to not only observe these organisms in their natural
habitat, but to sample and study them.
The terms „deep-water coral‟, „deep-sea coral‟, and „cold-water coral‟ are all used
in the literature to identify and distinguish corals living at depth from their shallow-water,
tropical counterparts. However, these terms are ambiguous, and are often not true
descriptors of the geographic and depth range of these organisms. For instance, the depth
range of several corals spans from shallow waters (i.e. less than 200 m) to the deep-sea,
but are still referred to as “deep-water” corals (Krieger and Wing 2002; Försterra et al.
2005; Stone 2006). Similarly, the term „cold-water‟ coral is often mistaken for coral
species distributed in high latitude regions, despite the fact that waters in the deep ocean
are generally cold no matter what latitude. In all cases, these terms refer to corals that lack
symbiotic zooxanthellae found in shallow, tropical corals, and thus they derive their
energy by suspension feeding from the water column. This thesis adopts the term „deep-
water‟ coral to indicate corals that are azooxanthellate, and occur in, but may not be
restricted to, depths below the continental shelf (~200 m) at any latitude.
2
Deep-water corals are organized into several orders and families within the classes
Anthozoa and Hydrozoa (Phylum Cnidaria; European Register of Marine Species
(ERMS): http://www.marbef.org/data/erms.php). They occur as solitary, colonial, and
reef-building forms. Under the Class Anthozoa deep-water corals are organized in two
different subclasses and one superorder: 1) the Octocorallia, which includes orders
Alcyonacea (soft corals), Gorgonacea (sea fans), and Pennatulacea (sea pens), and 2) the
Hexacorallia, which includes the Scleractinia (stony corals) and Zoanthidea (zoanthids),
and 3) the superorder Ceriantipatharia, which includes the Order Antipatharia (black
corals). Deep-water corals under the Class Hydrozoa include members of the families
Stylasteridae and Hydractiniidae (Bouillon et al. 1997; Cairns 2007). Deep-water corals
are widely distributed in the world‟s oceans, commonly between depths of 200 to 1500 m
(Mortensen and Buhl-Mortensen 2005), but have been recorded down to 6000 m (Baco
2007). They are found in aggregations along the edge of the continental shelf, banks, and
seamounts, and within deep channels and canyons which concentrate their food source
(Breeze et al. 1997; MacIsaac et al. 2001; Rogers 2004).
Little information exists on the functional role of corals in the deep ocean. In
some cases they provide structural habitat for a diversity of organisms, from
commercially important fish species to invertebrates (Rogers 1999; Husebø et al. 2002;
Krieger and Wing 2002; Roberts and Hirshfield 2004). Many studies have documented a
high diversity of associated species, comparable to that of shallow-water coral reefs. For
instance, Rogers (1999) recorded over 850 associated sponge, crustacean, mollusc and
fish species on or in Lophelia pertusa reefs in the Northeast Atlantic. Krieger and Wing
(2002) identified 10 megafauna taxa associated with Primnoa spp. in the Gulf of Alaska
that were using the corals for either food, to enhance suspension feeding by elevating
3
their position in the water column, or for protection. Deep-water corals may be important
in the early life stage of some commercially important fish species. Deep-water Oculina
reefs off the coast of Florida provide breeding grounds for gag and grouper species, and
nursery grounds for the juvenile snowy grouper (Reed 2002). Consequently, their
association with managed fish species makes deep-water coral communities a target for
destructive commercial fishing.
Global concern has been raised over the status and protection of deep-water corals
around the world. As shallow water fisheries are declining, fishing effort is being
displaced into deeper waters, placing corals at an even greater risk of destruction from
bottom fishing gear such as trawls and dredges. Their often slow growth and delicate
morphology makes these organisms highly susceptible to mechanical damage. Similarly,
oil and gas exploration and extraction also pose threats to deep-water coral ecosystems
(Rogers 1999). Evidence of their destruction by anthropogenic activities such as bottom
fishing has led to the creation of legislation to protect these remote organisms. In 2004,
the United Nations General Assembly (UNGA) drew attention to the state of deep-water
coral habitat and their destruction by commercial fishing gear. The subsequent 2006
UNGA Sustainable Fisheries Resolution 61/105 called for all member countries to take
immediate action individually and through Regional Fisheries Management Organizations
(RFMOs), which are responsible for fisheries management on the high seas, to
sustainably manage fish stocks and protect vulnerable marine ecosystems (VMEs).
Vulnerable marine ecosystems are defined as those which are highly susceptible to
disturbance and are slow to recover. Included under this definition are seamount regions,
hydrothermal vents, and deep-water coral habitat (Fuller et al. 2008). The Northwest
Atlantic Fisheries Organization (NAFO), the RMFO responsible for fisheries
4
management in the Northwest Atlantic, uses the following criteria to identify coral VME
components: size, ability to form dense aggregations, structural complexity, rarity,
vulnerability to damage, role in ecosystem, international status, and longevity (NAFO
2008). However, not all corals are vulnerable or form ecosystems, and thus, NAFO only
considers the following taxonomic groups as indicators and key components of VMEs:
antipatharians, gorgonians, cerianthid anemone fields, Lophelia and other reef forming
species, and pennatulacean fields (Fuller et al. 2008; NAFO 2008). In particular,
antipatharians are included in part because of their expected low growth rates, low
fecundity and recruitment, and high mortality, and gorgonians because of their long life
spans, low growth rates, and episodic recruitment (Fuller et al. 2008). Apart from this,
reproduction and recruitment are not considered in the criteria used by NAFO to identify
VME indicators and components. Reproduction and recruitment, and their consequences
for recovery potential remain largely unexplored for all groups of deep-water coral.
Many studies on deep-water corals are dedicated not to basic life history
characteristics such as growth and reproduction, but to distribution (Wilson 1979;
Langton et al. 1990; Breeze et al. 1997; Hovland et al. 2002; Etnoyer and Morgan 2005;
Watling and Auster 2005; Murillo et al. 2011), taxonomy (Williams 1995; Cairns and
Bayer 2005; Sánchez 2005; Cairns 2007), phylogeny (Le Goff-Vitry et al. 2004; Strychar
et al. 2005), and associated species (Rogers 1999; Krieger and Wing 2002; Buhl-
Mortensen and Mortensen 2004; Auster et al. 2005). Knowledge of growth, reproduction,
and recruitment of deep-water corals is important for our understanding of population
dynamics, persistence, and resilience (Hughes and Tanner 2000; Hourigan et al. 2007;
Knittweis et al. 2009). In particular, reproduction is important as it may have
consequences for biogeography, the amount of genetic exchange between populations,
5
and it may determine the ability to re-colonize an area after disturbance. Whether a coral
reproduces through sexual or asexual methods may determine the ability to recover from
local or regional damage. For instance, high levels of connectivity and colonization of
large areas are achieved only through larval recruitment, and thus sexual reproduction.
However, reproduction through asexual methods, such as fragmentation, may allow a
coral to maintain its population at the local scale, as fragments which break off the coral
colony often do not settle far from the parent. In sexually-reproducing shallow-water
corals, the mode of sexual reproduction (i.e. brooding or broadcasting) and larval
development type (i.e. lecithotrophic or planktotrophic) may also have important
consequences for dispersal potential and colonization of distant habitat (Nishikawa et al.
2003; Harrison and Wallace 1990), however, it remains unknown how these
characteristics influence the dispersal of corals in the deep-sea.
In this study I describe the reproductive biology of the azooxanthellate gorgonian
coral Acanella arbuscula collected from deep waters in two areas of the Northwest
Atlantic: The Gully MPA on the Scotian Shelf, and the Flemish Cap area off
Newfoundland, Canada. This thesis is divided into four chapters. Chapter 1 gives a
general introduction to the study. Chapter 2, which is written in the form of a manuscript,
investigates the major reproductive characteristics of A. arbuscula, including colony
sexuality, mode of sexual reproduction, and aspects of gametogenesis. In this chapter I
also investigate whether there is intra-colony variation in polyp fecundity (i.e. the number
of oocytes or spermatic cysts per polyp) and gamete size, colony size at first reproduction,
and the influence of colony size on fecundity and gamete size. Chapter 3, also in the form
of a manuscript, investigates whether some of the reproductive characteristics of A.
arbuscula investigated in Chapter 2 differ between The Gully and Flemish Cap, and
6
whether these characteristics are influenced by depth. Chapter 4 provides a general
conclusion to the study. Sections of the materials and methods are repeated between
Chapters 2 and 3.
This thesis is the first study to describe the reproductive biology of a deep-water
gorgonian coral from the Northwest Atlantic, and to my knowledge, is the first study
aimed at determining whether differences in the reproductive characteristics within a
species of deep-water coral exist between two geographically distant locations and along
a depth gradient. The overall goal of this thesis was to increase our general knowledge of
the reproductive biology of deep-water corals, especially members of the understudied
subclass Octocorallia.
7
Chapter 2. Reproductive Biology of Acanella arbuscula
2.1. Introduction
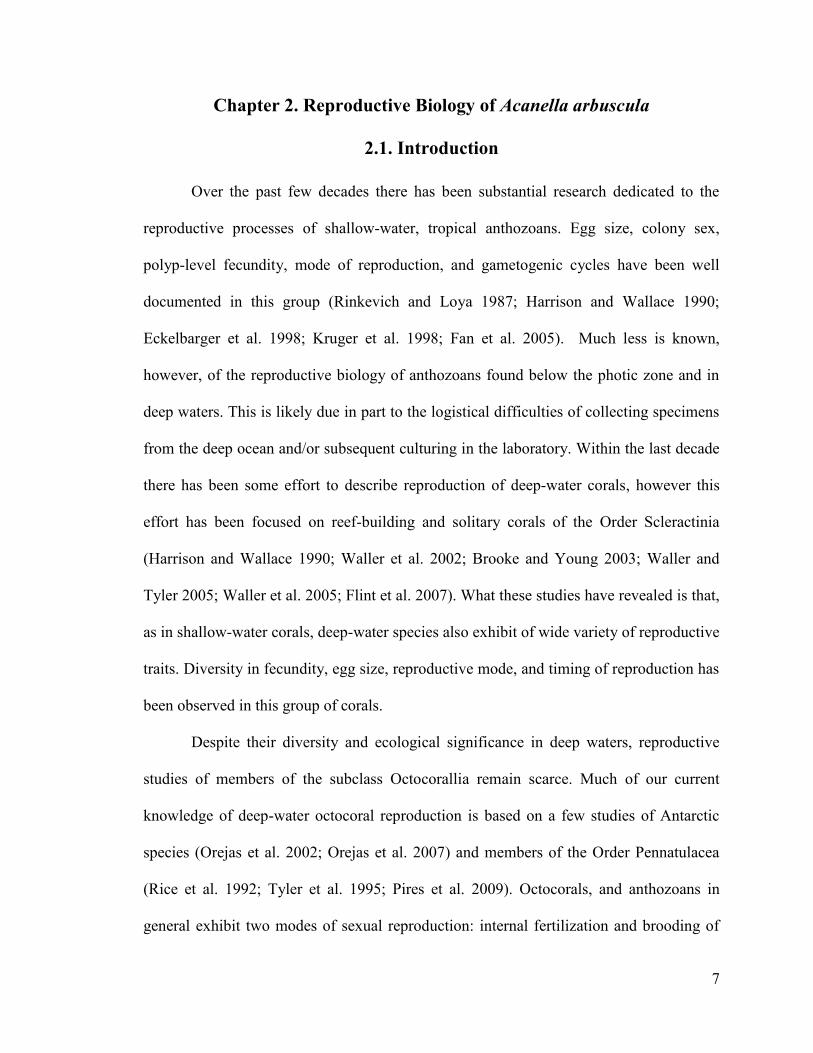
Over the past few decades there has been substantial research dedicated to the
reproductive processes of shallow-water, tropical anthozoans. Egg size, colony sex,
polyp-level fecundity, mode of reproduction, and gametogenic cycles have been well
documented in this group (Rinkevich and Loya 1987; Harrison and Wallace 1990;
Eckelbarger et al. 1998; Kruger et al. 1998; Fan et al. 2005). Much less is known,
however, of the reproductive biology of anthozoans found below the photic zone and in
deep waters. This is likely due in part to the logistical difficulties of collecting specimens
from the deep ocean and/or subsequent culturing in the laboratory. Within the last decade
there has been some effort to describe reproduction of deep-water corals, however this
effort has been focused on reef-building and solitary corals of the Order Scleractinia
(Harrison and Wallace 1990; Waller et al. 2002; Brooke and Young 2003; Waller and
Tyler 2005; Waller et al. 2005; Flint et al. 2007). What these studies have revealed is that,
as in shallow-water corals, deep-water species also exhibit of wide variety of reproductive
traits. Diversity in fecundity, egg size, reproductive mode, and timing of reproduction has
been observed in this group of corals.
Despite their diversity and ecological significance in deep waters, reproductive
studies of members of the subclass Octocorallia remain scarce. Much of our current
knowledge of deep-water octocoral reproduction is based on a few studies of Antarctic
species (Orejas et al. 2002; Orejas et al. 2007) and members of the Order Pennatulacea
(Rice et al. 1992; Tyler et al. 1995; Pires et al. 2009). Octocorals, and anthozoans in
general exhibit two modes of sexual reproduction: internal fertilization and brooding of
8
planula larvae, and broadcast spawning with external fertilization of gametes. Brooding
may occur in one of two ways: internally in the gastrovascular cavity, or siphonozooids of
some species (Anthomastus ritteri, Cordes et al. 2001; Corallium secundum and C.
lauuense, Waller and Baco 2007), or on the surface of the colony (Parerythropodjum
fulvum fulvum, Benayahu and Loya 1983; Briareum asbestinum, Brazeau and Lasker
1990; Paramuricea clavata, Coma et al. 1995b; Pseudopterogorgia elisabethae,
Gutiérrez-Rodríguez and Lasker 2004). Larvae of many brooding shallow-water corals
have short competency periods and often settle and metamorphose into an adult
approximately 1-2 days after release, whereas broadcast spawning species tend to settle 4-
6 days after larval development, thus increasing their potential for long distance dispersal
(Harrison and Wallace 1990). For instance, Nishikawa et al. (2003) found that the pre-
competency periods of planulae were shorter for the brooder Stylophora pistillata than for
broadcast spawner Acropora tenuis, the settlement peak after spawning occurred earlier
for S. pistillata than for A. tenuis, and the competency period was longer for A. tenuis
than for S. pistillata, suggesting that broader dispersal is more likely for broadcaster A.
tenuis than for brooder S. pistillata. Large differences in settlement times between
brooders and broadcasters have been recorded in deep-water species. For instance,
planulae of the deep-water brooding coral Anthomastus ritteri settled 2-3 days after
release (Cordes et al. 2001), whereas larvae of the broadcaster Oculina varicosa settled
21 days after spawning (Brooke and Young 2003). In octocorals, the frequency of
brooding versus broadcast spawning appears to be taxon-specific. For instance, brooding
appears to be a common mode of reproduction in the Alcyonacea (Benayahu and Loya
1983; Brazeau and Lasker 1990; Cordes et al. 2001; Hwang and Song 2007; Sun et al.
2010). In contrast, all members of the Pennatulacea appear to broadcast their gametes
9
(Chia and Crawford 1973; Eckelbarger et al. 1998; Edwards and Moore 2008; Pires et al.
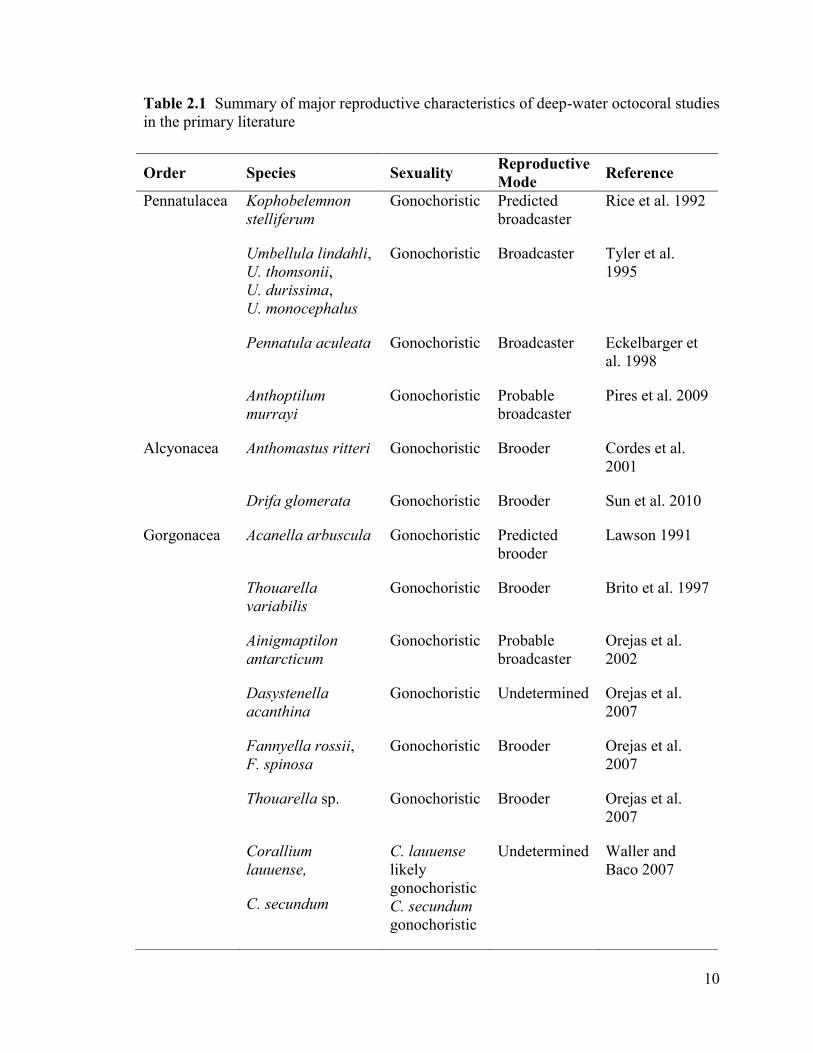
2009). Of the deep-water octocorals studied to date (summarized in Table 2.1), the
Pennatulacea and Alcyonacea appear to follow this pattern, however, in the Gorgonacea a
clear pattern can not be determined as some species brood, and the reproductive mode
remains unconfirmed or undetermined for others. Shallow-water gorgonians display
similar proportions of internal brooders, external brooders, and broadcast spawners (Ribes
et al. 2007). Both hermaphroditism and gonochorism have been reported in shallow-water
gorgonians, however, gonochorism is more prevalent. To date, no hermaphroditic deep-
water gorgonian, or octocoral in general, has been discovered.
In Atlantic Canada there are at least 45 species of deep-water coral, and a large
portion are members of the subclass Octocorallia (Cogswell et al. 2009). Three areas on
the Scotian shelf contain high concentrations of these organisms and are designated as
either conservation areas or marine protected areas (MPAs): the Gully MPA, the
Northeast Channel Coral Conservation Area, and the Lophelia Coral Conservation Area,
commonly known as the Stone Fence. Despite the high diversity and abundance of
octocorals in Atlantic Canada, the reproductive biology of only one octocoral from this
region has been documented in the primary literature. This is the work of Sun et al.
(2010) on the alcyonacean Drifa glomerata, which revealed that this species is a
gonochoristic brooder. Of these 45 species, approximately 10 are gorgonian corals, and
yet, there is no knowledge of their reproductive biology beyond anecdotal observations.
The overall goal of my study was to increase our general knowledge of the
reproductive biology of the poorly known subclass Octocorallia, and in particular, of
gorgonian corals from the Northwest Atlantic. My study focused on the reproductive
biology of the small branching coral Acanella arbuscula (Johnston 1862) of the family
10
Table 2.1 Summary of major reproductive characteristics of deep-water octocoral studies
in the primary literature
Order Species Sexuality Reproductive
Mode Reference
Pennatulacea Kophobelemnon
stelliferum
Gonochoristic Predicted
broadcaster
Rice et al. 1992
Umbellula lindahli,
U. thomsonii,
U. durissima,
U. monocephalus
Gonochoristic Broadcaster Tyler et al.
1995
Pennatula aculeata Gonochoristic Broadcaster Eckelbarger et
al. 1998
Anthoptilum
murrayi
Gonochoristic Probable
broadcaster
Pires et al. 2009
Alcyonacea Anthomastus ritteri Gonochoristic Brooder Cordes et al.
2001
Drifa glomerata Gonochoristic Brooder Sun et al. 2010
Gorgonacea Acanella arbuscula Gonochoristic Predicted
brooder
Lawson 1991
Thouarella
variabilis
Gonochoristic Brooder Brito et al. 1997
Ainigmaptilon
antarcticum
Gonochoristic Probable
broadcaster
Orejas et al.
2002
Dasystenella
acanthina
Gonochoristic Undetermined Orejas et al.
2007
Fannyella rossii,
F. spinosa
Gonochoristic Brooder Orejas et al.
2007
Thouarella sp. Gonochoristic Brooder Orejas et al.
2007
Corallium
lauuense,
C. secundum
C. lauuense
likely
gonochoristic
C. secundum
gonochoristic
Undetermined Waller and
Baco 2007
11
Isididae, Order Gorgonacea (ERMS). A. arbuscula is distributed in the Northwest
Atlantic from the Davis Strait (Gass and Willison 2005) and Greenland (Deichmann
1936; Grasshoff 1981), and down the eastern seaboard of North America and the Gulf of
Mexico (Watling and Auster 2005; Brooke and Schroeder 2007). It is also found in the
Northeast Atlantic (Laubier and Sibuet 1979; Lawson 1991; Bronsdon et al. 1997;
Roberts et al. 2000; Watling and Auster 2005) from Iceland to the Mid Atlantic Ridge
(Grasshoff 1981) and Morocco (Molodtsova et al. 2008). This species anchors in soft
sediments and has an overall depth range of 150 to 4800 m (Molodtsova et al. 2008;
Kenchington et al. 2009). A. arbuscula represented an ideal candidate for a reproductive
study as it has a high local abundance in many areas of the Northwest Atlantic and
because very little is known of its reproduction.
Lawson (1991) described the reproductive biology of A. arbuscula from Station
„M‟ (57°18´N, 10°11´W), located in the northern region of the Rockall Trough, Northeast
Atlantic (Gage and Tyler 1982). Lawson (1991) predicted that A. arbuscula was a
brooder based on its large egg size and gamete developmental cycles. Lawson (1990 in
1991) also suggested there was no variability in the reproductive output from different
areas of the same colony, which contrasts the findings of many studies which have
examined intra-colony variation in reproduction in octocorals (Benayahu and Loya 1986;
Brazeau and Lasker 1989; Coma et al. 1995a; Brito et al. 1997; Kapela and Lasker 1999;
Orejas et al. 2002; Santangelo et al. 2003; Gutiérrez-Rodríguez and Lasker 2004; Orejas
et al. 2007; Pires et al. 2009).
The objectives of my study were to 1) describe the general features of A.
arbuscula’s reproduction, such as colony sexuality, mode of sexual reproduction, and
aspects of gametogenesis, 2) investigate intra-colony variation in polyp-level fecundity
12
(the number of gametes per polyp) and gamete diameter, and 3) determine a minimum
size at first reproduction and the influence of colony size on polyp-level fecundity and
gamete diameter. The results of the present study were compared to the findings and
predictions by Lawson (1991) on A. arbuscula from the Northeast Atlantic.
Knowledge of reproduction is essential for understanding population dynamics
and therefore is useful for conservation and management efforts. For instance, a species
with late first reproduction, low fecundity, short or infrequent spawning periods, and low
dispersal potential and recruitment is unlikely to re-colonize an area rapidly after a
disturbance. This study addresses some of these biological parameters, and should be
considered in conservation measures for this species. This is the first study to examine the
reproductive biology of a gorgonian coral from Atlantic Canada and the Northwest
Atlantic in general.
2.2. Materials and Methods
2.21. Study Areas and Sample Collection
A. arbuscula (Fig. 2.1a) colonies were collected from two different areas within
the Northwest Atlantic, The Gully Marine Protected Area (MPA) on the Scotian Shelf,
Atlantic Canada, and the Flemish Cap area in international waters off Newfoundland,
Canada. The Gully (Fig. 2.2) is the deepest submarine canyon on the eastern coast of
North America. Located near Sable Island on the Scotian Shelf, the Gully‟s high-sloped
regions and unique hydrographical conditions make it a hotspot for large, branching deep-
water corals. In 2004 The Gully was designated as a MPA to protect its high
13
a
b
Fig. 2.1 a A. arbuscula colony in Desbarres Canyon, southwest Grand Banks, at 824 m
depth. b Polyp of A. arbuscula showing elongate spicules extended towards the retracted
tentacles
14
Fig. 2.2 The Gully MPA on the Scotian Shelf showing the locations of each dive where
collections of A. arbuscula were made using ROPOS in 2007 and 2010. Insert shows
close up of Gully and sampling locations. Red line indicates Canadian exclusive
economic zone (EEZ)
15
concentration of deep-water corals and an endangered population of northern bottlenose
whales that resides there.
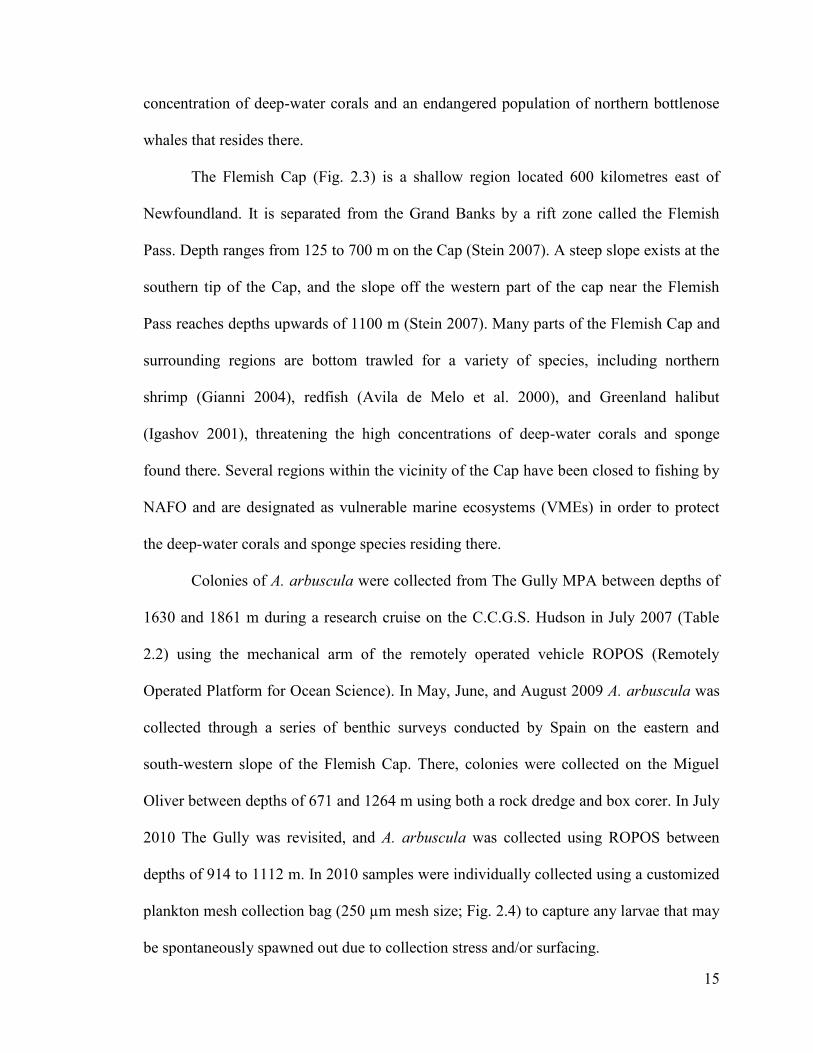
The Flemish Cap (Fig. 2.3) is a shallow region located 600 kilometres east of
Newfoundland. It is separated from the Grand Banks by a rift zone called the Flemish
Pass. Depth ranges from 125 to 700 m on the Cap (Stein 2007). A steep slope exists at the
southern tip of the Cap, and the slope off the western part of the cap near the Flemish
Pass reaches depths upwards of 1100 m (Stein 2007). Many parts of the Flemish Cap and
surrounding regions are bottom trawled for a variety of species, including northern
shrimp (Gianni 2004), redfish (Avila de Melo et al. 2000), and Greenland halibut
(Igashov 2001), threatening the high concentrations of deep-water corals and sponge
found there. Several regions within the vicinity of the Cap have been closed to fishing by
NAFO and are designated as vulnerable marine ecosystems (VMEs) in order to protect
the deep-water corals and sponge species residing there.
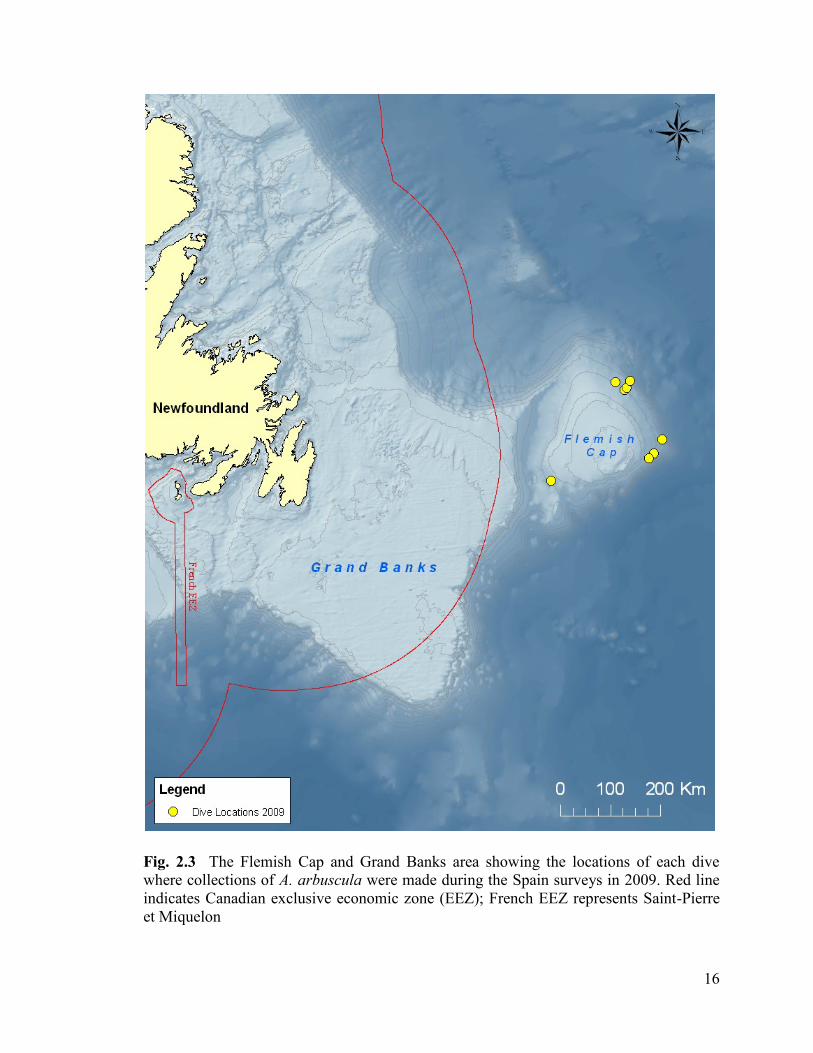
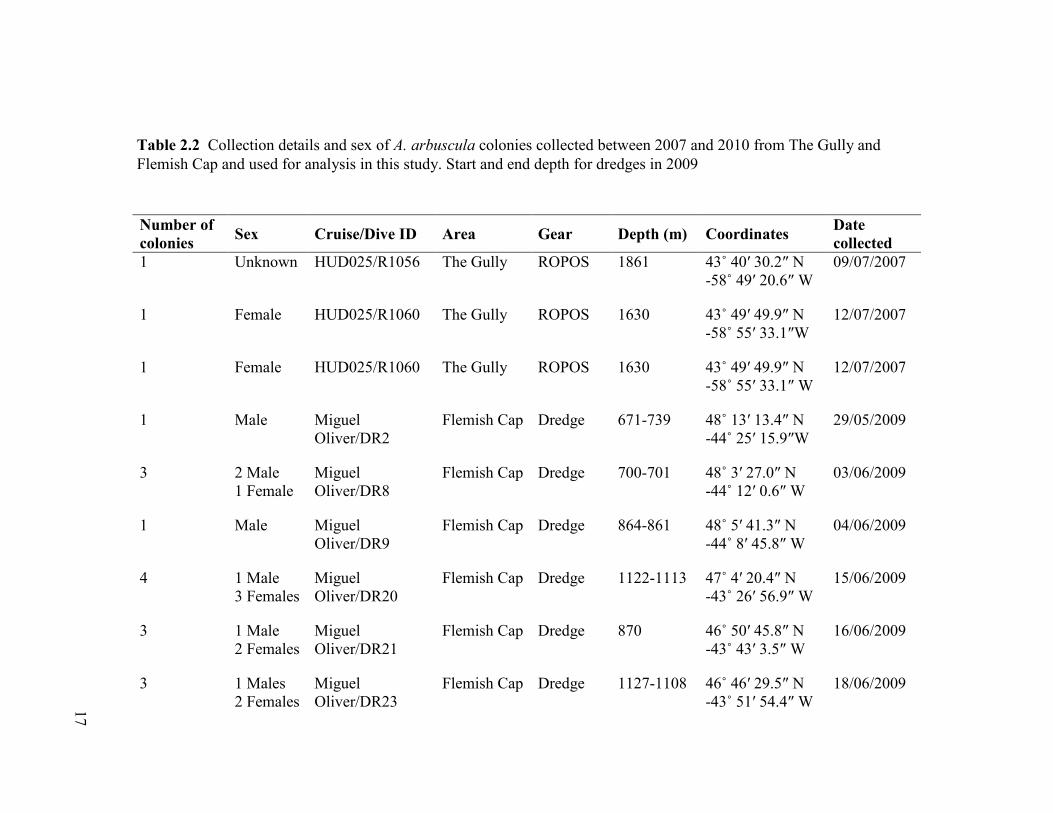
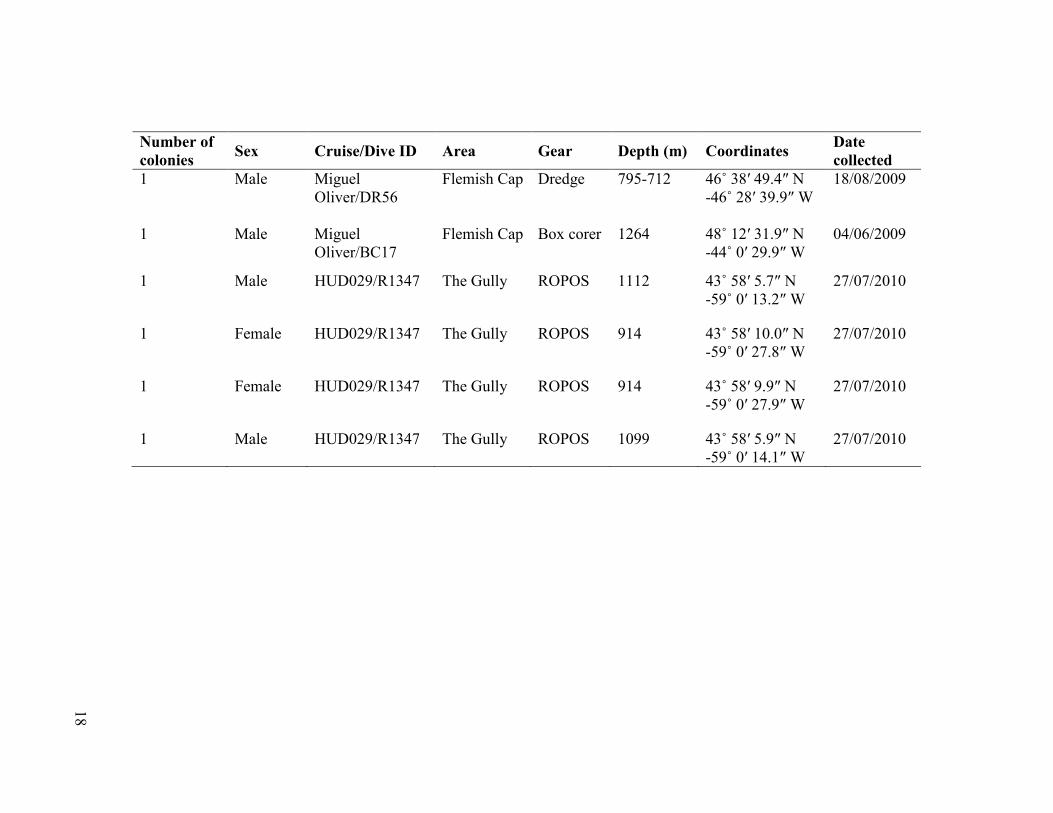
Colonies of A. arbuscula were collected from The Gully MPA between depths of
1630 and 1861 m during a research cruise on the C.C.G.S. Hudson in July 2007 (Table
2.2) using the mechanical arm of the remotely operated vehicle ROPOS (Remotely
Operated Platform for Ocean Science). In May, June, and August 2009 A. arbuscula was
collected through a series of benthic surveys conducted by Spain on the eastern and
south-western slope of the Flemish Cap. There, colonies were collected on the Miguel
Oliver between depths of 671 and 1264 m using both a rock dredge and box corer. In July
2010 The Gully was revisited, and A. arbuscula was collected using ROPOS between
depths of 914 to 1112 m. In 2010 samples were individually collected using a customized
plankton mesh collection bag (250 µm mesh size; Fig. 2.4) to capture any larvae that may
be spontaneously spawned out due to collection stress and/or surfacing.
16
Fig. 2.3 The Flemish Cap and Grand Banks area showing the locations of each dive
where collections of A. arbuscula were made during the Spain surveys in 2009. Red line
indicates Canadian exclusive economic zone (EEZ); French EEZ represents Saint-Pierre
et Miquelon
17
Number of
colonies Sex Cruise/Dive ID Area Gear Depth (m) Coordinates
Date
collected
1 Unknown HUD025/R1056 The Gully ROPOS 1861 43˚ 40′ 30.2″ N
-58˚ 49′ 20.6″ W
09/07/2007
1 Female HUD025/R1060 The Gully ROPOS 1630 43˚ 49′ 49.9″ N
-58˚ 55′ 33.1″W
12/07/2007
1 Female HUD025/R1060 The Gully ROPOS 1630 43˚ 49′ 49.9″ N
-58˚ 55′ 33.1″ W
12/07/2007
1 Male Miguel
Oliver/DR2
Flemish Cap Dredge 671-739 48˚ 13′ 13.4″ N
-44˚ 25′ 15.9″W
29/05/2009
3 2 Male
1 Female
Miguel
Oliver/DR8
Flemish Cap Dredge 700-701 48˚ 3′ 27.0″ N
-44˚ 12′ 0.6″ W
03/06/2009
1 Male Miguel
Oliver/DR9
Flemish Cap Dredge 864-861 48˚ 5′ 41.3″ N
-44˚ 8′ 45.8″ W
04/06/2009
4 1 Male
3 Females
Miguel
Oliver/DR20
Flemish Cap Dredge 1122-1113 47˚ 4′ 20.4″ N
-43˚ 26′ 56.9″ W
15/06/2009
3 1 Male
2 Females
Miguel
Oliver/DR21
Flemish Cap Dredge 870 46˚ 50′ 45.8″ N
-43˚ 43′ 3.5″ W
16/06/2009
3 1 Males
2 Females
Miguel
Oliver/DR23
Flemish Cap Dredge 1127-1108 46˚ 46′ 29.5″ N
-43˚ 51′ 54.4″ W
18/06/2009
Table 2.2 Collection details and sex of A. arbuscula colonies collected between 2007 and 2010 from The Gully and
Flemish Cap and used for analysis in this study. Start and end depth for dredges in 2009
17
18
Number of
colonies Sex Cruise/Dive ID Area Gear Depth (m) Coordinates
Date
collected
1 Male Miguel
Oliver/DR56
Flemish Cap Dredge 795-712 46˚ 38′ 49.4″ N
-46˚ 28′ 39.9″ W
18/08/2009
1 Male Miguel
Oliver/BC17
Flemish Cap Box corer 1264 48˚ 12′ 31.9″ N
-44˚ 0′ 29.9″ W
04/06/2009
1 Male HUD029/R1347 The Gully ROPOS 1112 43˚ 58′ 5.7″ N
-59˚ 0′ 13.2″ W
27/07/2010
1 Female HUD029/R1347 The Gully ROPOS 914 43˚ 58′ 10.0″ N
-59˚ 0′ 27.8″ W
27/07/2010
1 Female HUD029/R1347 The Gully ROPOS 914 43˚ 58′ 9.9″ N
-59˚ 0′ 27.9″ W
27/07/2010
1 Male HUD029/R1347 The Gully ROPOS 1099 43˚ 58′ 5.9″ N
-59˚ 0′ 14.1″ W
27/07/2010
18
19
Fig. 2.4 ROPOS manipulator arms placing A. arbuscula colony into mesh collection bag
used in 2010. Depth= 1853 m
20
Upon surfacing the collection bags were examined for the presence of larvae. Each bag
was washed with seawater which was passed through a series of sieves ranging in size
from 1000 to 200 µm. Any material left on the sieves was examined under a dissecting
microscope.
Colonies collected during the 2007 ROPOS mission to The Gully were fixed in
10% formalin in seawater for several months and were later transferred to 70% ethanol
for long-term storage. Colonies collected from all other missions were fixed in 10%
formalin in seawater for 24 to 48 hours, and were transferred to 70% ethanol.
2.22. Histological Preparation and Examination
Reproductive tissue was prepared for examination using standard histological
techniques (Kiernan 1999; Etnoyer et al. 2006). Polyps of A. arbuscula (Fig. 2.1b) were
dissected from the colony and decalcified using a solution of 10% hydrochloric acid and
EDTA for approximately 2 to 3 hours, or until no calcareous material remained. Tissues
were then dehydrated through a series of graded alcohol concentrations and cleared using
xylene. Polyps were embedded in paraffin wax and longitudinally-sectioned 5 µm thick
using a rotary microtome. Ribbons were mounted on slides and stained using Harris‟
hematoxylin and eosin. Slides were examined using a Nikon E-800 Eclipse microscope
and oocytes and spermatic cysts were followed through their serial sections and
photographed using mounted Nikon Digital Eclipse DXM 1200 and Nikon DS-Ri1
cameras when they were at their largest size, which, in oocytes, may or may not have
corresponded to when the nucleus was bisected. The number of gametes per polyp was
counted, and the maximum diameter of each gamete was measured using Image Pro Plus,
version 5.1. Based on the literature (Farrant 1986, Fan and Dai 1995; Kruger et al. 1998;
21
Hwang and Song 2007), each oocyte and spermatic cyst was staged according to their
morphological and histological characteristics.
2.23. Intra-Colony Variation in Polyp Fecundity and Gamete Size
The branching morphology of gorgonian corals can be classified following a
system described by Brazeau and Lasker (1988). In this classification system, the most
distal branches are usually first order branches (1°), and secondary (2°) and tertiary (3°)
branches arise when two first order or two second order branches join, respectively (Fig.
2.5). This system also distinguishes between source and tributary branches, where source
branches are any two branches that join to form secondary branches, and tributary
branches are branches which join a branch of higher order, but do not increase the order
of the system. In the current study, branches were only chosen if no other branch
originated from it, which corresponds to first order source and tributary branches of the
branching system described by Brazeau and Lasker (1988).
To determine whether there was variability in the number and size of oocytes and
spermatic cysts in polyps selected from different areas of the same colony, each colony
was divided into three „zones‟ of equal length based on its height (height= length between
the tips of the uppermost branches to the lowest branches): the basal (lowest), medial
(middle), and apical (highest) zones. Five randomly-chosen polyps were dissected from a
randomly-chosen first order source or tributary branch that originated in each zone,
giving a total of 15 polyps per colony. A second effect was evaluated by dividing a source
or tributary first order branch into three segments of equal length based on the total length
of the branch: proximal (inner), central (middle), and distal (outer) segments (Fig. 2.6).
Five polyps were randomly-chosen and dissected from each branch segment of randomly-
22
Fig. 2.5 Branching classification system of a gorgonian coral showing first (1°), second
(2°), and third order (3°) branches, and source (S) and tributary (T) branches. From
Brazeau and Lasker (1988)
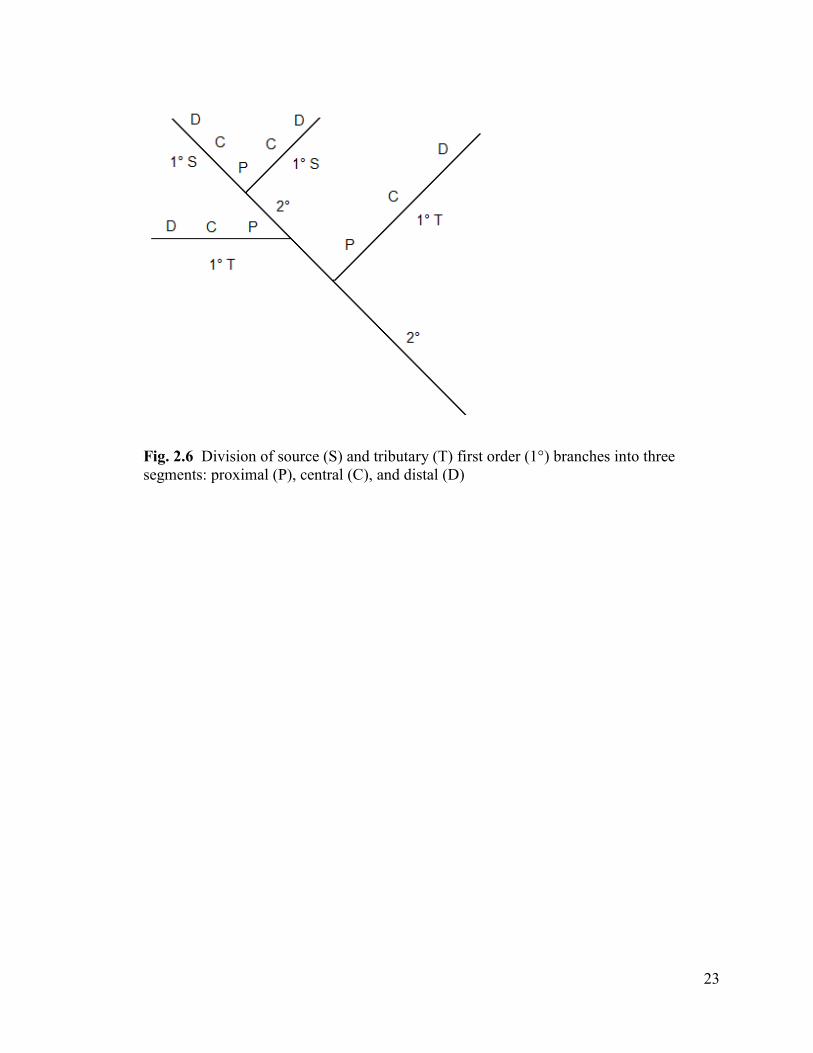
23
Fig. 2.6 Division of source (S) and tributary (T) first order (1°) branches into three
segments: proximal (P), central (C), and distal (D)
24
chosen branches from the colony, without respect to which zone the branch originated in,
giving a total of 15 polyps per colony. In all cases, no broken branches were used in this
study.
Although the majority of A. arbuscula colonies have two to three orders of
branching (personal observation), only polyps from source and tributary first-order
branches were used to study both the colony „zone‟ and „branch segment‟ effects. This
may impose a limitation to the study, especially when making inferences of whole-colony
fecundity. However, Beiring and Lasker (2000) and Santangelo et al. (2003) found no
significant differences in fecundity and fertility between first and second order polyps in
the gorgonians Plexaura flexuosa and Corallium rubrum, respectively.
Preliminary analysis of three male and four female colonies revealed no
significant differences between zone and polyp fecundity (Figs. 1, 2, Tables 1, 2,
Appendix A) (ANOVA: oocytes (square root transformed): F(2,54)= 0.280, P= 0.757;
spermatic cysts (not transformed): F(2,40)= 0.953, P= 0.394), or mean gamete diameter
(ANOVA: oocytes (not transformed): F(2,47)= 0.098, P= 0.906; spermatic cysts (not
transformed): F(2,39)= 0.036, P= 0.965). Consequently, factor zone was removed from the
study, and only the branch segment effect was examined in subsequent colonies.
2.24. Statistical Analyses
A chi-square (2) test was used to determine whether the sex ratio (ratio of males
to females) of the Flemish Cap colonies was significantly different from 1:1. Although it
is not ideal to calculate deviance from a 1:1 sex ratio using samples collected over wide
spatial (Gori et al. 2007) and depth ranges (Benayahu and Loya 1983), sample sizes were
25
too small at any particular location and depth, and therefore all samples collected across
the Flemish Cap area were combined. Due to the small sample size of The Gully
collections (2 females in 2007, 2 males and 2 females in 2010) the sex ratio was not tested
for deviance from 1:1.
The percent frequency of each of the five stages of oogenesis and four stages of
spermatogenesis between collection months and branch segments was determined. A Log
likelihood ratio (G-test) test of independence was used to test the null hypothesis of
equality of frequencies between months and branch segments. If any cells contained zero
values, the William‟s correction of continuity was applied (Gotelli and Ellison 2004).
Intra-colony variation in fecundity and gamete size was investigated in a
replicated blocked design. In the analysis for differences in polyp fecundity between
branch segments, branch segment was included as a fixed effect, and to incorporate any
between-colony variability in polyp fecundity and increase the generalizability of the
results, colony was included as a random (block) effect:
Model 1: yijk= µ + βi + bj + ɛijk,
where yijk is the response (polyp fecundity), µ is the grand mean, βi is the effect of branch
segment (fixed), bj is the effect of colony (random), ɛijk is the experimental error, i= 1, 2,
3, j= 1,... 12, k= 1,...5 for females, and i= 1, 2, 3, j= 1,...11, k= 1,...5 for males.
Replication in the number of polyps allowed for investigation of the presence interactions
(see Pinheiro and Bates 2000) between colony and branch segment (i.e. to assess whether
differences between branch segments was different for different colonies). Within each
colony, polyp fecundity was averaged between the 5 polyps per branch segment, giving 3
fecundity values, one for each branch segment. Mean fecundity per branch segment was
26
plotted for each colony, and interactions between branch segment and colony were
deemed present if the lines were not parallel (Appendix B, Fig. 1). When possible
interactions were present (i.e. in all cases), a second model was fit with branch segment as
a fixed effect, and „branch segment nested within colony‟ as a random interaction term:
Model 2: yijk= µ + βi + bj + bij + ɛijk
where yijk is the response (polyp fecundity), µ is the grand mean, βi is the effect of branch
segment (fixed), bj is the effect of colony (random), bij is the interaction term (random),
ɛijk is the experimental error, i= 1, 2, 3, j= 1,... 12, k= 1,...5 for females, and i= 1, 2, 3, j=
1,...11, k= 1,...5 for males. The Akaike Information Criterion (AIC) was used to compare
and select between the two models. The model with the lowest AIC value gives the best
fit to the data (Pinheiro and Bates 2000; Zuur et al. 2009). If the difference in AIC values
between the two models was less than two, the models were deemed to have
approximately equal weight in the data (Burnham and Anderson 2002; Schwarz 2010).
As the difference in AIC values between Model 1 and Model 2 was less than two, the
simpler Model 1 was chosen as the minimum adequate model for the analysis of polyp
fecundity by branch segment for both female and male colonies (Table 2.3). In the test for
differences in gamete diameter between branch segments, all gamete measurements per
polyp were averaged to avoid pseudo-replication (Underwood 1997), and a linear mixed
model was fit according to the procedure above (see Appendix B, Fig. 2). Model 1 was
also chosen as the AIC values were within two values of Model 2 (Table 2.4) for both
female and male colonies. The same model fitting procedure was applied to determine
differences in polyp fecundity and gamete diameter between the three colony zones (see
Materials and Methods; Appendix A).
27
Table 2.3 Results of the minimum adequate model based on a linear mixed-effects
model testing the effect of branch segment (fixed) on polyp fecundity in female and male
colonies (random) of A. arbuscula. AIC=Akaike Information Criterion. Based on the AIC
values, Model 1 was chosen for both female and male datasets
Table 2.4 Results of the minimum adequate model based on a linear mixed-effects
model testing the effect of branch segment (fixed) on mean gamete diameter per polyp in
female and male colonies (random) of A. arbuscula. AIC=Akaike Information Criterion.
Based on the AIC values, Model 1 was chosen for both female and male datasets
Females
Model AIC
1 yijk= µ + βi + bj + ɛijk 695.071
2 yijk= µ + βi + bj + bij + ɛijk 696.988
Males
Model AIC
1 yijk= µ + βi + bj + ɛijk 573.738
2 yijk= µ + βi + bj + bij + ɛijk 572.315
Females
Model AIC
1 yijk= µ + βi + bj + ɛijk 738.753
2 yijk= µ + βi + bj + bij + ɛijk 739.902
Males
Model AIC
1 yijk= µ + βi + bj + ɛijk 1431.336
2 yijk= µ + βi + bj + bij + ɛijk 1433.336
28
An analysis of variance (ANOVA) was used to assess the overall effect of branch
segment on mean polyp fecundity and mean gamete diameter. If significance was
detected, Tukey's Honestly Significant Difference (HSD) test was used post-hoc to
determine which pairs were significantly different from one another. All dependent
variables were tested for the ANOVA assumptions of normality and homogeneity of
variances using the Shapiro-Wilk test for normality and the Levene‟s test, respectively. If
non-normality and heterogeneity were detected, the dependent variables were square-root
transformed to meet the assumptions. Regression models were used to examine the
influence of colony height on polyp fecundity, mean gamete diameter per polyp, and the
percentage of mature (stage IV and V) oocytes per colony. Significance of the
relationship was determined using Pearson‟s product-moment correlation once both the
dependent and independent variables were examined for normality using the Shapiro-
Wilk test of normality. Any non-normal variable was subsequently square root
transformed closer to normality and the relationship tested for significance. All statistical
analyses were carried out in R version 2.10.0 (R Development Core Team, 2009,
http://www.R-project.org; package nlme for mixed model analysis).
2.3. Results
2.31. General Reproductive Characteristics
A total of 26 A. arbuscula colonies were collected from the Gully and Flemish
Cap areas. All examined colonies were gonochoristic at both the polyp and colony level.
Of the 26 colonies, 13 were female, 12 male, and 1 contained no gametes and so sex was
indeterminable. The sex ratio of the Flemish Cap (9 female and 10 male) population was
29
not significantly different from 1:1 (21= 0.053, P= 0.819). Two colonies from the
Flemish Cap, 1 male and 1 female, were not used for fecundity estimates or for
measurements of gamete size due to their poor histological preservation, giving 24 usable
colonies (12 female and 11 male).
On average, female polyps contained 18.8 ± 16.2 (mean ± SD) oocytes, with
fecundity reaching a maximum of 75 oocytes in one polyp. Mean oocyte diameter was
136.1 ± 125.1 µm, with the largest oocyte 702.4 µm in diameter. In males, polyps
contained an average of 14.0 ± 14.4 spermatic cysts per polyp, with a maximum of 92
cysts in one polyp. Mean spermatic cyst diameter was 135.3 ± 97.9 µm, with the largest
spermatic cyst reaching 462.1 µm in diameter.
2.32. Gametogenesis
Oogenesis
Oogenesis can be divided into five stages in A. arbuscula. Oocytes of all stages
were often observed simultaneously within the same polyp.
Stage I: Oogonia (Fig. 2.7a, 19.9 ± 5.1 µm, (Mean Diameter ± SD), n= 282)
The earliest female gametes (oogonia) were observed in clusters embedded in the
mesoglea of the mesenteries. These oogonia had a high nucleus:ooplasm ratio, with a
translucent nucleus and often visible, single nucleolus. The ooplasm was basophilic and
translucent.
Stage II: Pre-vitellogenic oocytes (Fig. 2.7b, 114.9 ± 64.9 µm, n= 2837)
30
Stage II oocytes were observed within the gastrovascular cavity but connected to
the mesenteries via a pedicel (Cordes et al. 2001; Gutiérrez-Rodríguez and Lasker 2004),
and often occurred in bundles. The nucleus:ooplasm ratio decreased in stage II oocytes,
and the ooplasm stained basophilic. Often, more than one darkly-stained nucleolus was
visible in the nucleus. The ooplasm of later stage II oocytes contained multiple vacuoles.
The development of a follicle cell layer began at this stage.
Stage III: Onset of vitellogenesis (Fig. 2.7c, 311.0 ± 75.2 µm, n= 67)
By stage III, vitellogenesis had begun. The ooplasm was heavily granulated and
stained slightly eosinophilic. These oocytes were observed free within the gastrovascular
cavity. Occasionally, stage III spermatic cysts were observed within the pharynx or above
it near the tentacles. The nucleus was large and often resided at the periphery of the
ooplasm, and more than one nucleolus was often visible. A follicle cell layer was often
observed around stage III oocytes.
Stage IV: Vitellogenic oocytes (Fig. 2.7d, 538.9 ± 66.6 µm, n= 118)
Stage IV oocytes were heavily granulated due to the presence of numerous yolk
droplets, and consequently the ooplasm stained a conspicuous pink colour (highly
eosinophilic). The nucleus was often located near the periphery of the ooplasm, and may
have contained more than one darkly-stained nucleolus. A thick follicle cell layer
surrounded stage IV oocytes.
Stage V: Late-vitellogenic oocytes (Fig. 2.7e, 526.3 ± 71.9 µm, n= 89)
The large yolk droplets observed in Stage IV oocytes became flattened in stage V.
If visible, the nucleus was crescent-shaped, however, often the nuclear envelope had
31
Fig. 2.7 Stages of oogenesis in A. arbuscula. a Cluster of stage I oogonia embedded
within mesenterial (m) tissue and surrounded by gastroderm (gs), b stage II oocytes with
nucleus (n), nucleolus (no), and pedicel (p), c stage III oocyte with peripheral nucleus and
ooplasm stained slightly eosinophillic, d stage IV vitellogenic oocyte with thick follicle
cell layer (f), heavily granulated ooplasm, and multiple nucleoli, and e stage V late
vitellogenic oocyte with follicle layer layer slightly sloughed off. Scale bars: a= 20 µm;
b, c, d and e= 50 µm
32
begun to break down and the nucleus was barely visible or not visible at all. Stage V
oocytes were surrounded by a thick follicle cell layer and were often irregularly-shaped
due to tight packing within the polyp.
No embryos or planula larvae were observed in any of the histological slides from
any colony. Similarly, inspection of the mesh collection bags used in 2010 to collect A.
arbuscula revealed no embryos or planula larvae, suggesting that they were not aborted
during the collection process.
Spermatogenesis
Spermatogenesis can be divided into four stages. Each spermatic cyst contained
many spermatogenic cells which differentiated relatively synchronously. Spermatic cysts
of all stages were often observed simultaneously within a single polyp, however, only one
stage IV spermatic cyst was observed out of all the samples.
Stage I: Spermatogonia (Fig. 2.8a, 24.8 ± 17.4 µm (Mean Diameter ± SD), n= 205)
Stage I consisted of loosely packed aggregations of spermatogonia either
embedded within the mesoglea of the mesenteries, or attached to the mesenteries via a
pedicel. The mesogleal layer surrounding stage I spermatic cysts was not distinct.
Stage II: Spermatic cyst with spermatocytes (Fig. 2.8b, 73.7 ± 39.6 µm, n= 1194)
Stage II spermatic cysts consisted of aggregations of loosely packed
spermatocytes and occasional spermatogonia. A follicle cell layer began to develop at this
stage. Stage II spermatic cysts were observed either attached to the mesenteries via a
pedicel or free within the gastrovascular cavity.
33
Stage III: Maturing spermatic cyst with spermatocytes (Fig. 2.8c, 244.3 ± 51.7 µm, n=
892)
Stage III spermatic cysts consisted of darkly-stained spermatocytes densely
packed and arranged around a distinct lumen in the centre of the cyst. Tails were
occasionally observed in the centre of the lumen. A thick follicle cell layer was present,
and these cysts were found floating freely in the gastrovascular cavity.
Stage IV: Late-stage spermatic cyst with spermatids and spermatozoa (Fig. 2.8d and e, n=
1, Measurement=297.8 µm)
Only one stage IV spermatic cyst was found in a proximally-located polyp from a
sample collected in May 2009. The spermatic cyst consisted of spermatids and
spermatozoa with heads located near the periphery, and pink-stained spermatozoa tails
projecting towards the centre of the lumen (Fig. 2.8e). A thick follicle cell layer was not
observed around this cyst, however, it may have been sloughed off due to collection or
histological stress.
2.33. Gamete Size-Frequency Distributions
The oocyte size-frequency distributions of individual colonies showed variable
patterns within and between collection months and years. The majority of oocyte size-
frequency distributions (Fig. 2.9) were similar in shape, possessing a right-
skewed/bimodal pattern with a large mode of smaller oocytes (approximately ≤400 µm)
and a small mode of larger oocytes (approximately >400 µm). Exceptions to this pattern
included four colonies collected on July 12 2007, June 15 2009, and June 15 and 16, 2009
which all lacked a second mode. The majority of male colonies exhibited a bimodal
distribution pattern, with one mode of cysts ≤100 to 150 µm and one >100 to 150 µm
34
Fig. 2.8 Stages of spermatogenesis in A. arbuscula. a Stage I spermatic cyst with clusters
of spermatogonia (sg), b stage II spermatic cyst containing spermatocytes (sc),
surrounded by a follicle cell layer (f) and attached to mesentery via a pedicel (p), c stage
III cyst with spermatocytes and lumen (l), d stage IV late-stage spermatic cyst with
spermatids and mature spermatozoa (szo), and e stage IV cyst with pink tails projecting
towards the centre of the cyst. Scale bars: a, b and e= 20 µm, c= 20 µm, d= 50 µm
35
(Fig. 2.10). These modes were present in equal proportions in most colonies. A colony
collected on July 27 2010 showed evidence of bimodality, suggested by the small peak at
150 µm, however, a colony collected in August completely lacked a second peak of
spermatic cysts, and displayed a right-skewed pattern.
The percent frequency of the five stages of oogenesis significantly differed
between colonies collected in June and July (Table 2.5). Colonies collected in June had a
higher percent frequency of stage I oogonia compared to colonies collected in July. Both
months had a similar frequency of stage II oocytes, whereas colonies collected in June
had a higher frequency of maturing (stage III and IV) oocytes. Samples collected in July
had a higher frequency of late-stage mature oocytes (stage V) than samples collected in
June.
In male colonies, the percent frequency of the four stages of spermatogenesis
differed significantly between colonies collected in May to August (Table 2.6). The
percent frequency of stage I spermatic cysts increased from May to July, and was absent
in August. Similar frequencies of stage II cysts occurred between May and June, with a
decrease in July. In August, 100% of the spermatic cysts were stage II. Stage III
spermatic cysts occurred in similar frequencies between May and July, but were absent in
August. Only one stage IV spermatic cyst was found in one colony collected in May
2009.
2.34. Intra-Colony Variation in Polyp Fecundity and Gamete Size
Polyp fecundity significantly differed between the three branch segments in
female colonies (Table 2.7). Tukey‟s HSD post-hoc test revealed that fecundity was
36
Fig. 2.9 Oocyte size-frequency distributions of individual A. arbuscula colonies collected
in July 2007, June 2009, and July 2010. Date is date of collection. n= number of oocytes.
0
0.2
0.4
0.6
0.83 June 2009 n=268
0
0.2
0.4
0.6
0.815 June 2009 n=314
0
0.2
0.4
0.6
0.815 June 2009 n=107
0
0.2
0.4
0.6
0.815 June 2009 n=692
0
0.2
0.4
0.6
0.816 June 2009 n=200
0
0.2
0.4
0.6
0.816 June 2009 n=467
0
0.2
0.4
0.6
0.818 June 2009 n=250
0
0.2
0.4
0.6
0.818 June 2009 n=313
0
0.2
0.4
0.6
0.812 July 2007 n=133
0
0.2
0.4
0.6
0.812 July 2007 n= 45
0
0.2
0.4
0.6
0.8
50 150 250 350 450 550 650 750
27 July 2010 n=300
0
0.2
0.4
0.6
0.8
50 150 250 350 450 550 650 750
27 July 2010 n=304
Oocyte Diameter (µm)
Rel
ativ
e F
requen
cy
37
0
0.2
0.4
0.6
0.829 May 2009 n=363
0
0.2
0.4
0.6
0.83 June 2009 n=181
0
0.2
0.4
0.6
0.83 June 2009 n=219
0
0.2
0.4
0.6
0.84 June 2009 n=141
0
0.2
0.4
0.6
0.84 June 2009 n=171
0
0.2
0.4
0.6
0.815 June 2009 n=157
0
0.2
0.4
0.6
0.816 June 2009 n=590
0
0.2
0.4
0.6
0.818 June 2009 n=313
0
0.2
0.4
0.6
0.827 July 2010 n=149
0
0.2
0.4
0.6
0.8
50 150 250 350 450
27 July 2010 n=7
0
0.2
0.4
0.6
0.8
50 150 250 350 450
18 August 2009 n=17
Spermatic Cyst Diameter (µm)
Rel
ativ
e F
requen
cy
Fig. 2.10 Spermatic cyst size-frequency distributions of individual A. arbuscula colonies
collected in May through August 2009, and July 2010. Date is date of collection. n=
number of cysts.
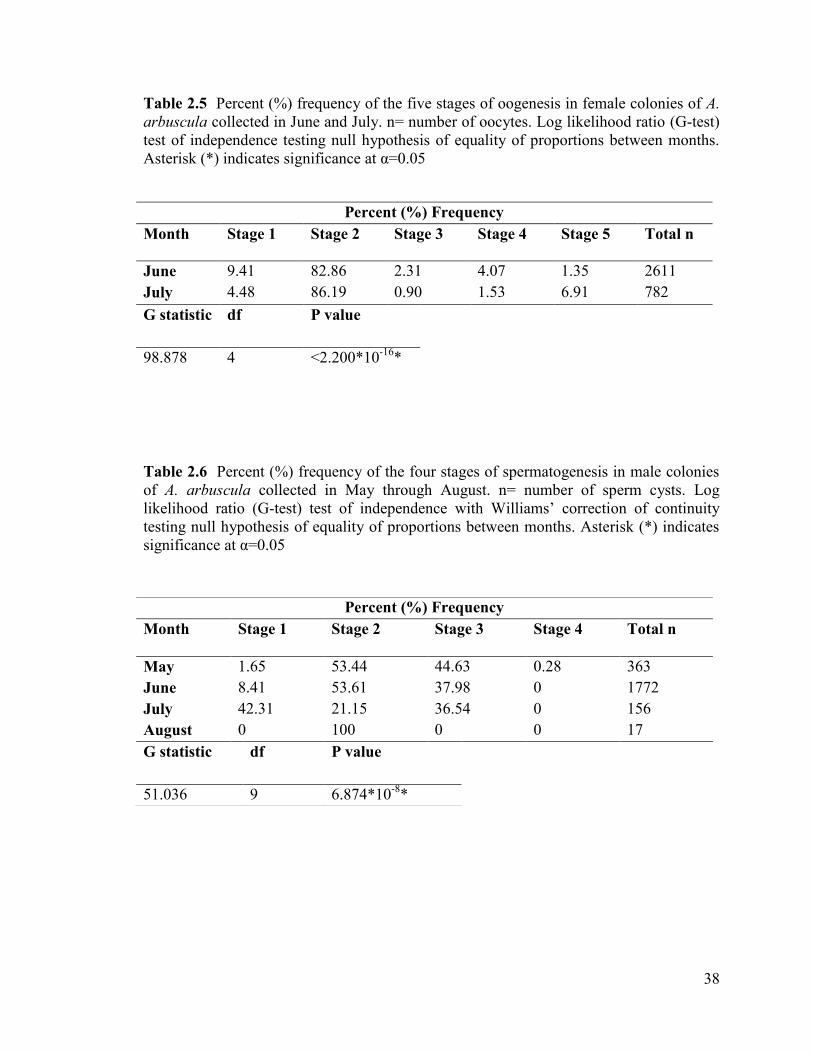
38
Table 2.5 Percent (%) frequency of the five stages of oogenesis in female colonies of A.
arbuscula collected in June and July. n= number of oocytes. Log likelihood ratio (G-test)
test of independence testing null hypothesis of equality of proportions between months.
Asterisk (*) indicates significance at α=0.05
Table 2.6 Percent (%) frequency of the four stages of spermatogenesis in male colonies
of A. arbuscula collected in May through August. n= number of sperm cysts. Log
likelihood ratio (G-test) test of independence with Williams‟ correction of continuity
testing null hypothesis of equality of proportions between months. Asterisk (*) indicates
significance at α=0.05
Percent (%) Frequency
Month Stage 1 Stage 2 Stage 3 Stage 4 Total n
May 1.65 53.44 44.63 0.28 363
June 8.41 53.61 37.98 0 1772
July 42.31 21.15 36.54 0 156
August 0 100 0 0 17
G statistic
df P value
51.036 9 6.874*10-8
*
Percent (%) Frequency
Month Stage 1 Stage 2 Stage 3 Stage 4 Stage 5 Total n
June 9.41 82.86 2.31 4.07 1.35 2611
July 4.48 86.19 0.90 1.53 6.91 782
G statistic
df P value
98.878 4 <2.200*10-16
*
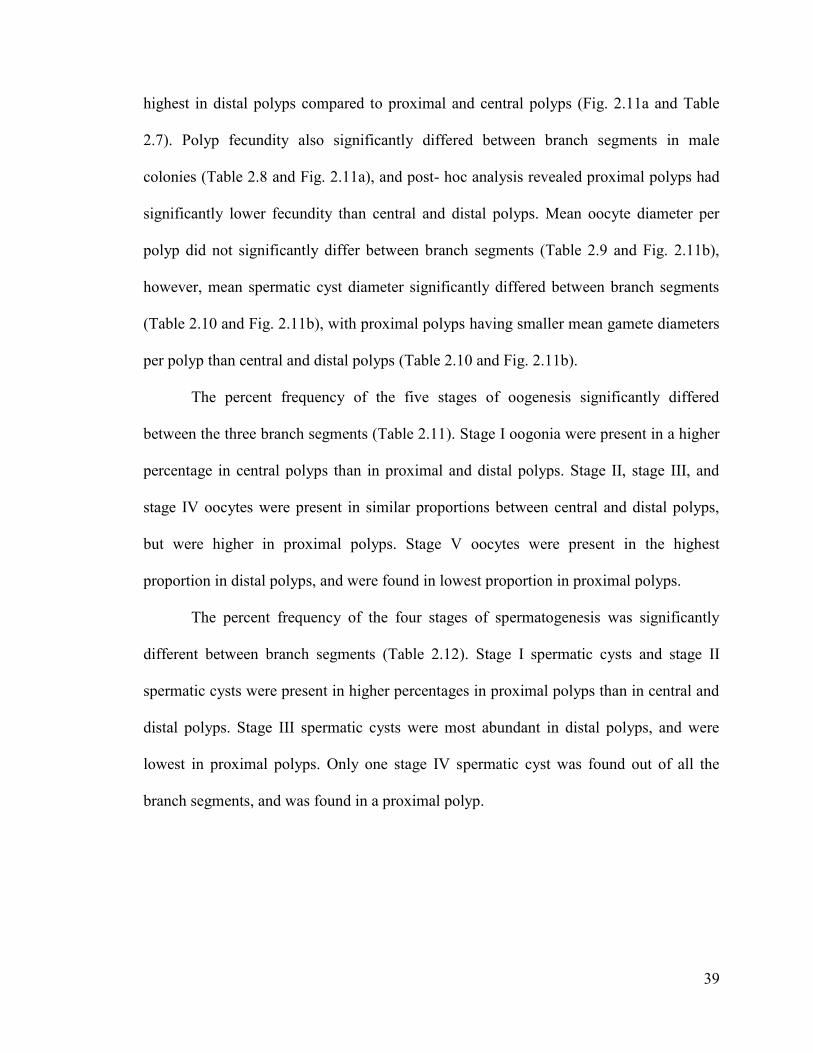
39
highest in distal polyps compared to proximal and central polyps (Fig. 2.11a and Table
2.7). Polyp fecundity also significantly differed between branch segments in male
colonies (Table 2.8 and Fig. 2.11a), and post- hoc analysis revealed proximal polyps had
significantly lower fecundity than central and distal polyps. Mean oocyte diameter per
polyp did not significantly differ between branch segments (Table 2.9 and Fig. 2.11b),
however, mean spermatic cyst diameter significantly differed between branch segments
(Table 2.10 and Fig. 2.11b), with proximal polyps having smaller mean gamete diameters
per polyp than central and distal polyps (Table 2.10 and Fig. 2.11b).
The percent frequency of the five stages of oogenesis significantly differed
between the three branch segments (Table 2.11). Stage I oogonia were present in a higher
percentage in central polyps than in proximal and distal polyps. Stage II, stage III, and
stage IV oocytes were present in similar proportions between central and distal polyps,
but were higher in proximal polyps. Stage V oocytes were present in the highest
proportion in distal polyps, and were found in lowest proportion in proximal polyps.
The percent frequency of the four stages of spermatogenesis was significantly
different between branch segments (Table 2.12). Stage I spermatic cysts and stage II
spermatic cysts were present in higher percentages in proximal polyps than in central and
distal polyps. Stage III spermatic cysts were most abundant in distal polyps, and were
lowest in proximal polyps. Only one stage IV spermatic cyst was found out of all the
branch segments, and was found in a proximal polyp.
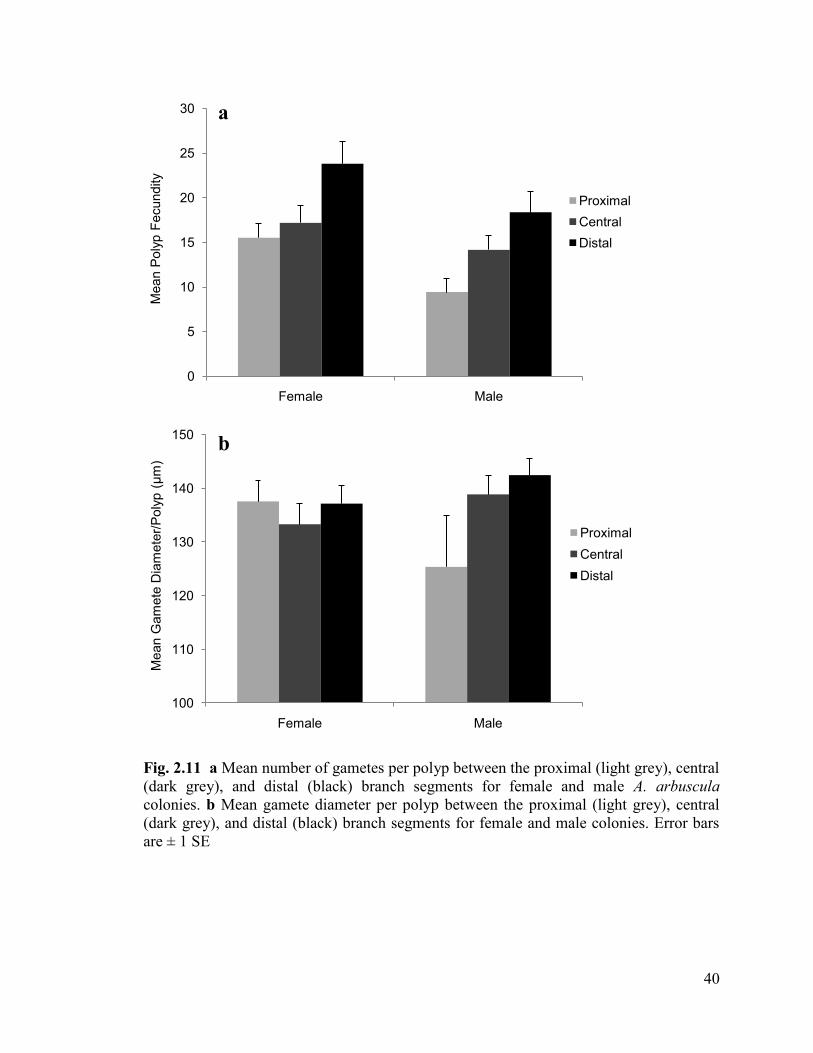
40
Fig. 2.11 a Mean number of gametes per polyp between the proximal (light grey), central
(dark grey), and distal (black) branch segments for female and male A. arbuscula
colonies. b Mean gamete diameter per polyp between the proximal (light grey), central
(dark grey), and distal (black) branch segments for female and male colonies. Error bars
are ± 1 SE
0
5
10
15
20
25
30
Female Male
Mean P
oly
p F
ecundity
Proximal
Central
Distal
100
110
120
130
140
150
Female Male
Mean G
am
ete
Dia
mete
r/P
oly
p (
µm
)
Proximal
Central
Distal
b
a
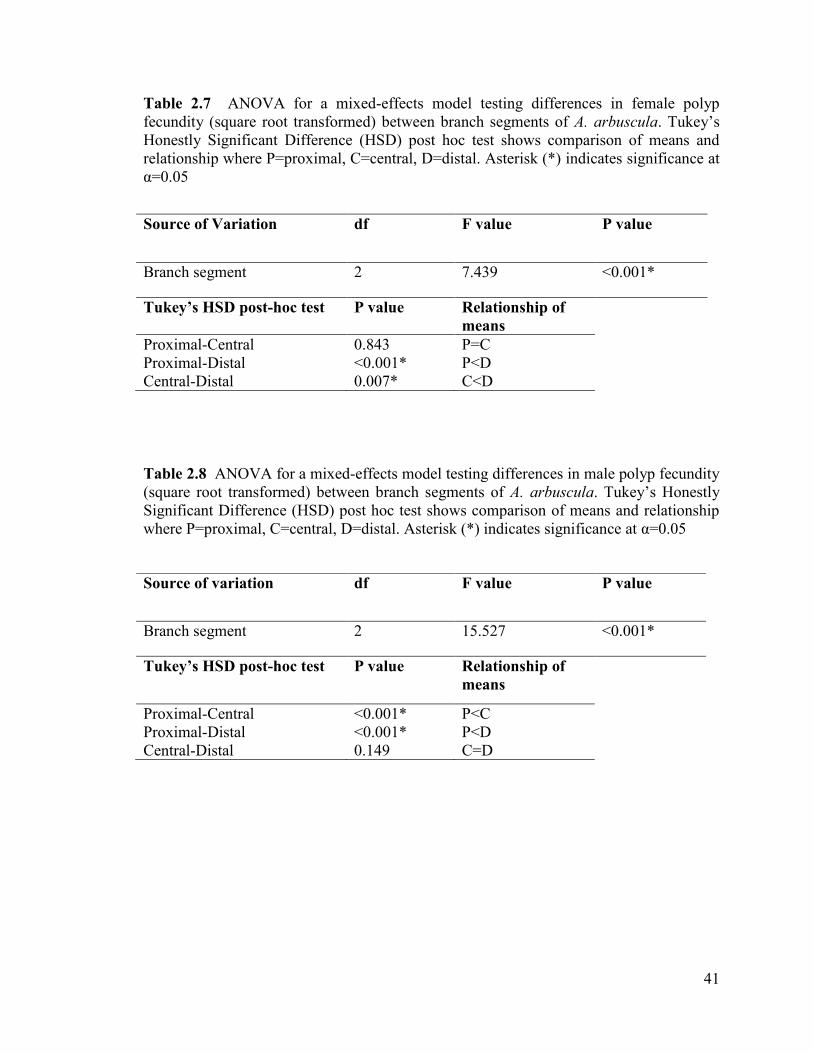
41
Table 2.7 ANOVA for a mixed-effects model testing differences in female polyp
fecundity (square root transformed) between branch segments of A. arbuscula. Tukey‟s
Honestly Significant Difference (HSD) post hoc test shows comparison of means and
relationship where P=proximal, C=central, D=distal. Asterisk (*) indicates significance at
α=0.05
Table 2.8 ANOVA for a mixed-effects model testing differences in male polyp fecundity
(square root transformed) between branch segments of A. arbuscula. Tukey‟s Honestly
Significant Difference (HSD) post hoc test shows comparison of means and relationship
where P=proximal, C=central, D=distal. Asterisk (*) indicates significance at α=0.05
Source of Variation df F value P value
Branch segment 2 7.439 <0.001*
Tukey’s HSD post-hoc test P value Relationship of
means
Proximal-Central 0.843 P=C
Proximal-Distal <0.001* P<D
Central-Distal 0.007* C<D
Source of variation df F value P value
Branch segment 2 15.527 <0.001*
Tukey’s HSD post-hoc test P value Relationship of
means
Proximal-Central <0.001* P<C
Proximal-Distal <0.001* P<D
Central-Distal 0.149 C=D
42
Table 2.9 ANOVA for a mixed-effects model testing differences in mean oocyte
diameter (µm) (square root transformed) between branch segments of A. arbuscula.
Asterisk (*) indicates significance at α=0.05
Table 2.10 ANOVA for a mixed-effects model testing differences in mean spermatic
cyst diameter (µm) (not transformed) between branch segments of A. arbuscula. Tukey‟s
Honestly Significant Difference (HSD) post hoc test shows comparison of means and
relationship, where P=proximal, C=central, D=distal. Asterisk (*) indicates significance
at α=0.05
Source of Variation df F value P value
Branch segment 2 0.844 0.432
Source of Variation df F value P value
Branch segment 2 6.741 0.002*
Tukey’s HSD post hoc test P value Relationship of
means
Proximal-Central 0.017* P<C
Proximal-Distal 0.002* P<D
Central-Distal 0.760 C=D
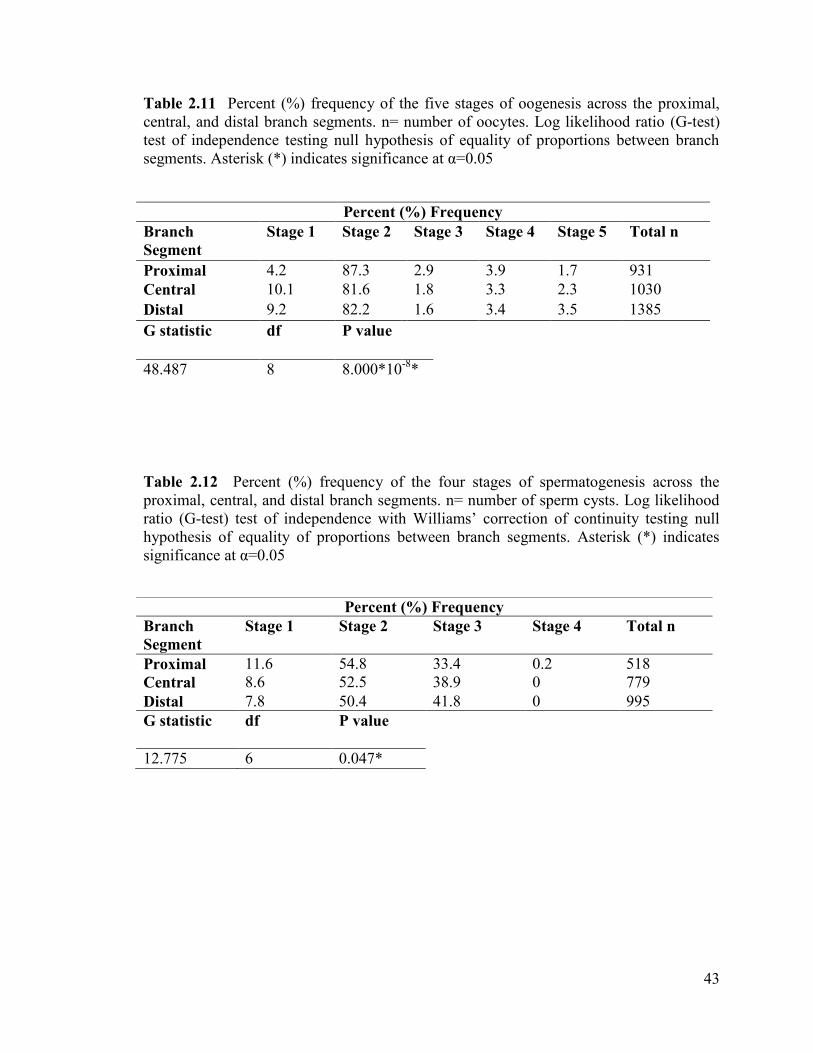
43
Table 2.11 Percent (%) frequency of the five stages of oogenesis across the proximal,
central, and distal branch segments. n= number of oocytes. Log likelihood ratio (G-test)
test of independence testing null hypothesis of equality of proportions between branch
segments. Asterisk (*) indicates significance at α=0.05
Table 2.12 Percent (%) frequency of the four stages of spermatogenesis across the
proximal, central, and distal branch segments. n= number of sperm cysts. Log likelihood
ratio (G-test) test of independence with Williams‟ correction of continuity testing null
hypothesis of equality of proportions between branch segments. Asterisk (*) indicates
significance at α=0.05
Percent (%) Frequency
Branch
Segment
Stage 1 Stage 2 Stage 3 Stage 4 Stage 5 Total n
Proximal 4.2 87.3 2.9 3.9 1.7 931
Central 10.1 81.6 1.8 3.3 2.3 1030
Distal 9.2 82.2 1.6 3.4 3.5 1385
G statistic df P value
48.487 8 8.000*10-8
*
Percent (%) Frequency
Branch
Segment
Stage 1 Stage 2 Stage 3 Stage 4 Total n
Proximal 11.6 54.8 33.4 0.2 518
Central 8.6 52.5 38.9 0 779
Distal 7.8 50.4 41.8 0 995
G statistic df P value
12.775 6 0.047*
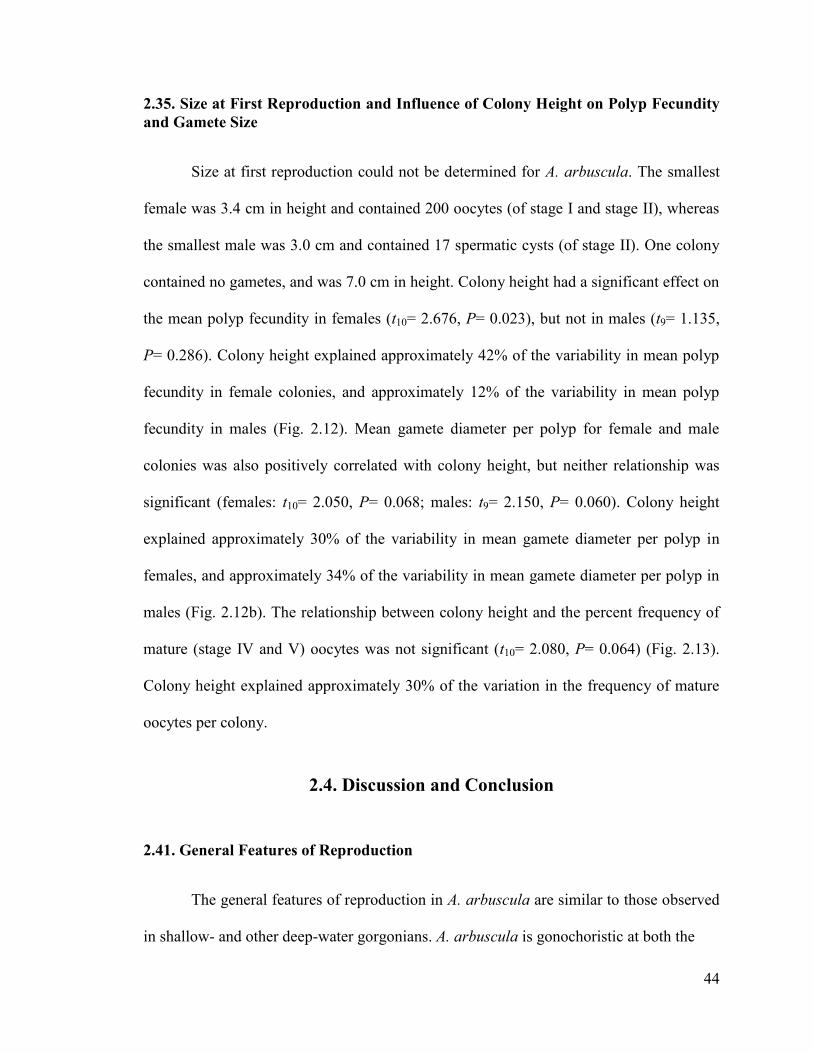
44
2.35. Size at First Reproduction and Influence of Colony Height on Polyp Fecundity
and Gamete Size
Size at first reproduction could not be determined for A. arbuscula. The smallest
female was 3.4 cm in height and contained 200 oocytes (of stage I and stage II), whereas
the smallest male was 3.0 cm and contained 17 spermatic cysts (of stage II). One colony
contained no gametes, and was 7.0 cm in height. Colony height had a significant effect on
the mean polyp fecundity in females (t10= 2.676, P= 0.023), but not in males (t9= 1.135,
P= 0.286). Colony height explained approximately 42% of the variability in mean polyp
fecundity in female colonies, and approximately 12% of the variability in mean polyp
fecundity in males (Fig. 2.12). Mean gamete diameter per polyp for female and male
colonies was also positively correlated with colony height, but neither relationship was
significant (females: t10= 2.050, P= 0.068; males: t9= 2.150, P= 0.060). Colony height
explained approximately 30% of the variability in mean gamete diameter per polyp in
females, and approximately 34% of the variability in mean gamete diameter per polyp in
males (Fig. 2.12b). The relationship between colony height and the percent frequency of
mature (stage IV and V) oocytes was not significant (t10= 2.080, P= 0.064) (Fig. 2.13).
Colony height explained approximately 30% of the variation in the frequency of mature
oocytes per colony.
2.4. Discussion and Conclusion
2.41. General Features of Reproduction
The general features of reproduction in A. arbuscula are similar to those observed
in shallow- and other deep-water gorgonians. A. arbuscula is gonochoristic at both the
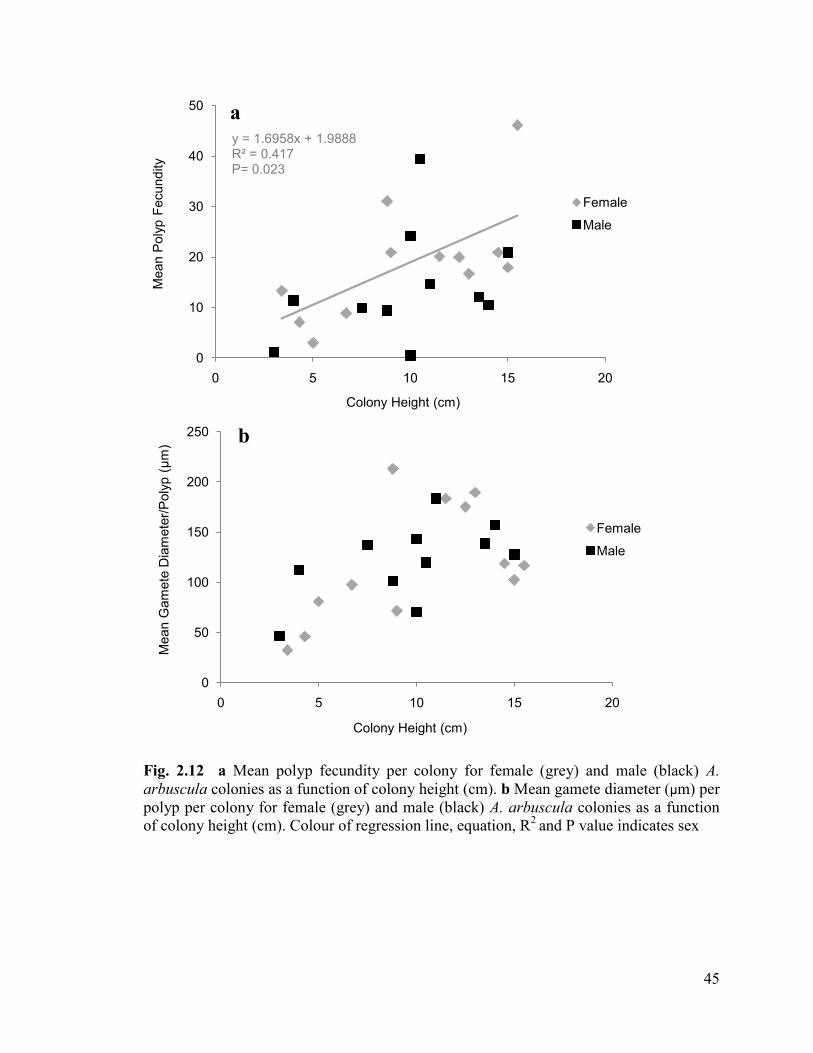
45
y = 1.6958x + 1.9888R² = 0.417P= 0.023
0
10
20
30
40
50
0 5 10 15 20
Mean P
oly
p F
ecundity
Colony Height (cm)
Female
Male
0
50
100
150
200
250
0 5 10 15 20
Mean G
am
ete
Dia
mete
r/P
oly
p (
µm
)
Colony Height (cm)
Female
Male
Fig. 2.12 a Mean polyp fecundity per colony for female (grey) and male (black) A.
arbuscula colonies as a function of colony height (cm). b Mean gamete diameter (µm) per
polyp per colony for female (grey) and male (black) A. arbuscula colonies as a function
of colony height (cm). Colour of regression line, equation, R2
and P value indicates sex
b
a
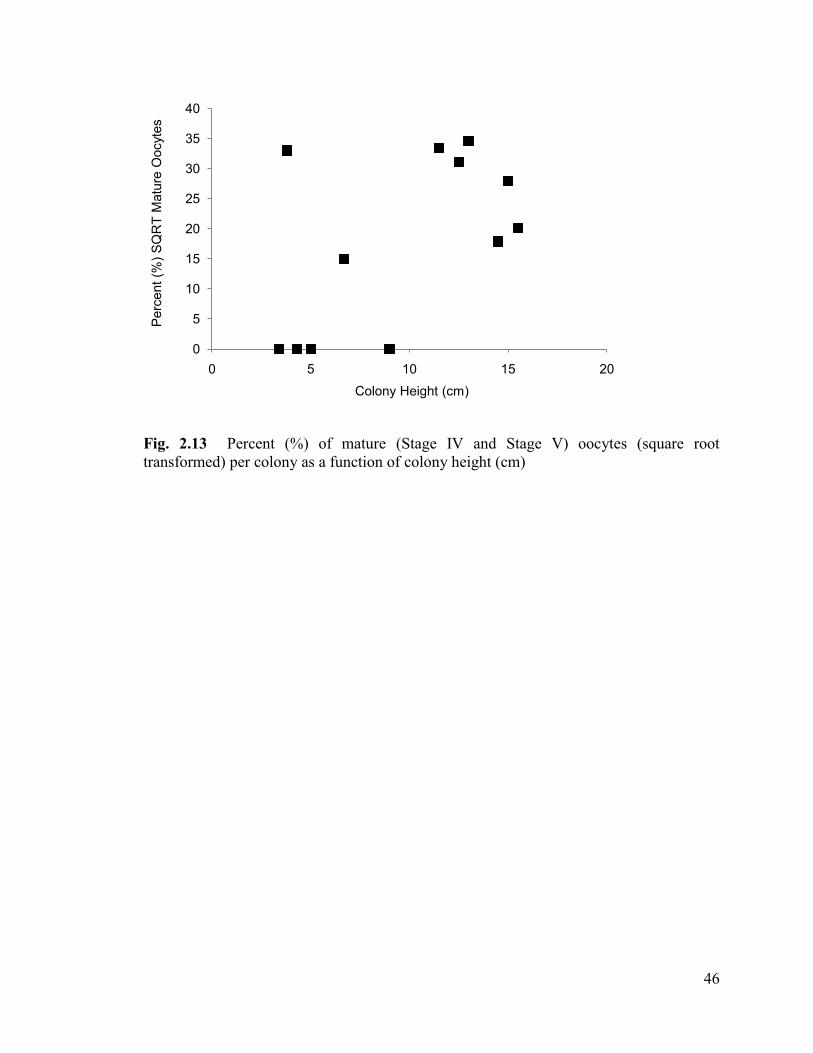
46
Fig. 2.13 Percent (%) of mature (Stage IV and Stage V) oocytes (square root
transformed) per colony as a function of colony height (cm)
0
5
10
15
20
25
30
35
40
0 5 10 15 20
Perc
ent (%
) S
QR
T M
atu
re O
ocyte
s
Colony Height (cm)
47
polyp and colony level, which is the dominant pattern of sexuality in members of the
Octocorallia (Brazeau and Lasker 1990; Kruger et al. 1998; Ben-Yosef and Benayahu
1999; Orejas et al. 2002; Santengelo et al. 2003; Gutiérrez-Rodríguez and Lasker 2004;
Hwang and Song 2007; Orejas et al. 2007; Edwards and Moore 2008; Pires et al. 2009).
Sequential hermaphroditism is unlikely as colonies of a wide size range were examined.
Lawson (1991) also reported separate male and female colonies of A. arbuscula from
Station „M‟ in the Rockall Trough, Northeast Atlantic. The sex ratio of the Flemish Cap
samples of A. arbuscula was not significantly different from 1:1. Deviations in the sex
ratio of octocorals are most commonly caused by a higher proportion of females to males
(Brazeau and Lasker 1989; Babcock 1990; Ben-Yosef and Benayahu 1999; Santangelo et
al. 2003). The only octocorals known to have a male-biased sex ratio are the gorgonians
Briareum asbestinum from the Caribbean (Brazeau and Lasker 1990) and Paramuricea
clavata from the Mediterranean (Gori et al. 2007), and the tropical soft corals Xenia
macrospiculata from the Gulf of Eilat (Benayahu and Loya 1984) and Capnella
gaboensis from Australia (Farrant 1986). Cerrano et al. (2005) noted a shift in the sex
ratio from parity to male-biased in the Mediterranean gorgonian Paramuricea clavata
after a thermal anomaly in 1999 that caused mass mortality of the benthic community.
The authors attributed the biased sex ratio to differential responses of each sex to the
perturbation. Greater contribution of one sex to the population via asexual reproduction
may also produce a skewed sex ratio (Benayahu and Loya 1984; Coffroth and Lasker
1998). The 1:1 sex ratio observed in A. arbuscula is common among octocorals, and in
terms of the division of resources allocated to sexual reproduction, this sex ratio
represents the predicted optimal resource allocation in populations with random mating
(Pianka 1978; Leigh et al. 1985; Edwards and Moore 2008; West 2009).
48
Many shallow-water tropical gorgonians studied to date have low polyp fecundity
compared to members of the Alcyonacea and Pennatulacea (Simpson 2009). In general,
these interspecific differences are thought to be a function of the smaller length of
gorgonian polyps (Brazeau and Lasker 1989). This pattern of lower polyp fecundity in the
Gorgonacea compared to the Alcyonacea and Pennatulacea also holds true for some deep-
water octocorals. For instance, the Antarctic deep-water gorgonian Thouarella variabilis
produces only one mature oocyte per polyp at a time (Brito et al. 1997). Similarly, the
average number of oocytes per polyp was 1.2 ± 0.1 (± SE) and 1.1 ± 0.1 for the Antarctic
deep-water gorgonians Dasystenella acanthina and Thouarella sp., respectively, and 1.5
± 0.1 and 1.4 ± 0.1 for Fannyella rossii and F. spinosa, respectively. In comparison, the
deep-water pennatulacean Anthoptilum murrayi had an average of 47 ± 12.4 (± SD)
oocytes and 36.6 ± 3.6 spermatic cysts per polyp and 31465 ± 5080 oocytes and 19871 ±
5793 spermatic cysts per colony (Pires et al. 2009). A large colony of the deep-water
alcyonacean Anthomastus ritteri could contain in excess of 4000 oocytes and larvae at
any one time (Cordes et al. 2001). Polyps of A. arbuscula contained high numbers of
oocytes (18.8 ± 16.2; mean ± SD) and spermatic cysts (14.0 ± 14.4) per polyp compared
to other deep-water gorgonians, although, it remains unknown whether all of these
oocytes will reach maturity as some immature oocytes may be resorbed to provide
nutrients for mature oocytes (Harrison and Wallace 1990; Sier and Olive 1994; Loya et
al. 2004; Mercier et al. 2010). Despite the common belief that many deep-sea benthos
exhibit low fecundity (Gage and Tyler 1991), the results of the current study and those on
other deep-water corals (Waller et al. 2008) show that fecundity of these organisms is
comparable to that of their tropical, zooxanthellate counterparts.
49
The maximum oocyte size observed in A. arbuscula (702.4 µm) is comparable to
that of some shallow- (zooxanthellate and azooxanthellate) and deep-water gorgonians
(Table 2.13). However, much larger oocyte diameters have been recorded for the deep-
water Antarctic gorgonian Dasystenella acanthina (1200 µm, Orejas et al. 2007) and for
other deep-water octocorals (1200 µm in Anthoptilum murrayi, Pires et al. 2009). Oocyte
diameters ranging from ~4800 to ~5200 µm have been recorded for deep-water
scleractinian cup corals of the genus Flabellum (Waller et al. 2008). In A. arbuscula from
the Northeast Atlantic, the maximum oocyte diameter recorded was 730 µm (Lawson
1991), which is comparable to the findings of the present study. Both shallow and deep-
water corals with large oocytes often have non-feeding, lecithotrophic larvae (Chia and
Crawford 1973; Hartnoll 1975; Cordes et al. 2001; Mercier et al. 2010). It was previously
believed that species with lecithotrophic larvae spend less time in the plankton and
therefore have limited dispersal capabilities (Young 2003), however, a lecithotrophic
strategy may better allow for long-distance dispersal in the oligotrophic regions of the
deep-sea (Young et al 1997). The large oocyte diameters observed in A. arbuscula
suggest that this species has a lecithotrophic larval type, which could explain its wide
distribution range within the North Atlantic. Nonetheless, further study on the larval
development mode is required to confirm this.
Lawson (1991) predicted that A. arbuscula from the Northeast Atlantic was a
brooder, based on the gonad developmental cycles and large oocyte diameters observed.
However, no planula larvae were found in any of the colonies in this study. We now
know that large oocyte diameters do not necessarily indicate a brooding strategy
(Eckelbarger et al. 1998; Kruger et al. 1998; Orejas et al. 2007; Edwards and Moore
2009; Mercier et al. 2010). Levitan (2006) suggested that a large egg size increases the
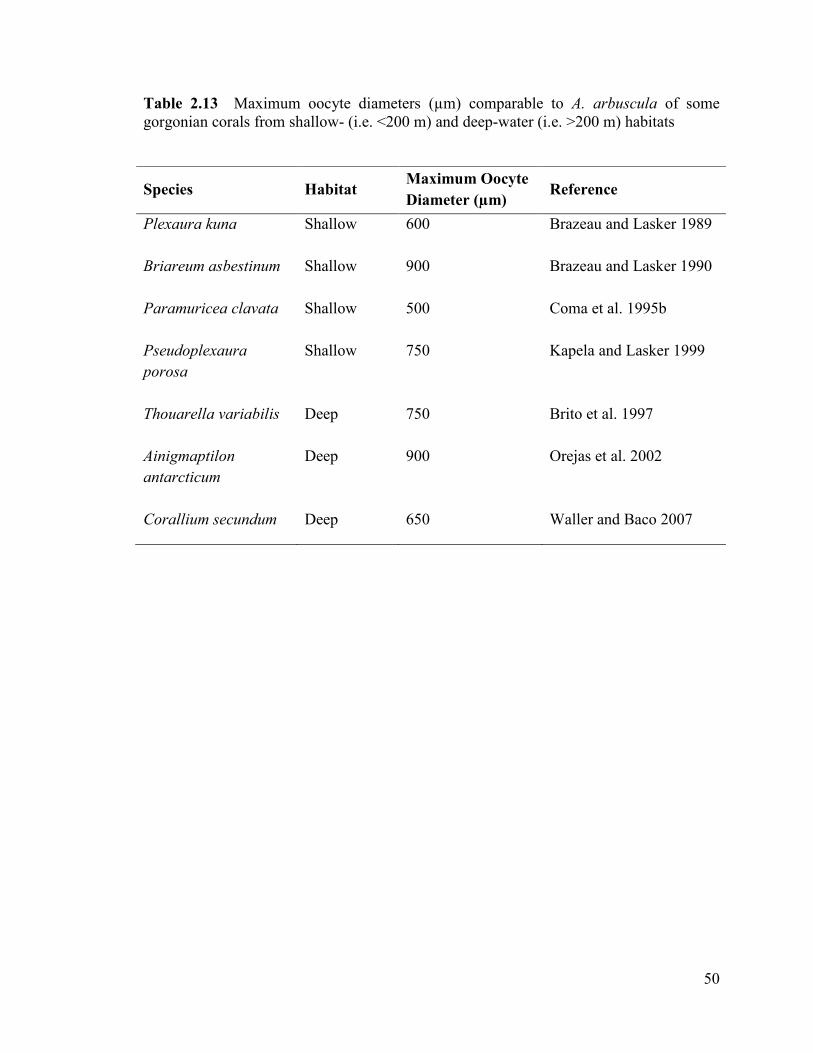
50
Table 2.13 Maximum oocyte diameters (µm) comparable to A. arbuscula of some
gorgonian corals from shallow- (i.e. <200 m) and deep-water (i.e. >200 m) habitats
Species Habitat Maximum Oocyte
Diameter (µm) Reference
Plexaura kuna Shallow 600
Brazeau and Lasker 1989
Briareum asbestinum Shallow 900
Brazeau and Lasker 1990
Paramuricea clavata Shallow 500
Coma et al. 1995b
Pseudoplexaura
porosa
Shallow 750 Kapela and Lasker 1999
Thouarella variabilis
Deep 750 Brito et al. 1997
Ainigmaptilon
antarcticum
Deep 900 Orejas et al. 2002
Corallium secundum Deep 650 Waller and Baco 2007
51
chance of fertilization, and would be advantageous for broadcast spawners. In the present
study, no embryos or planula larvae were observed in the histological slides, suggesting
that A. arbuscula is a broadcast spawner. It is possible that embryos or larvae were
extruded through the mouth of the polyp during collection stress and/or surfacing from
the deep-sea. This is supported by the discovery of immature male spermatic cysts (stage
III) in the pharynx or above it near the tentacles in the histology sections. However, no
embryos or planulae were found in the mesh collection bags used in 2010. Also, the
chance of observing planula larvae within the polyps is greater if the polyps contain
oocytes in various stages of maturity (Waller et al. 2002), which provides further support
that A. arbuscula is a broadcast spawner.
2.42. Cycle of Gametogenesis
The presence of oocytes and spermatic cysts in different stages of development in
the same polyp suggests that A. arbuscula has a continuous cycle of gametogenesis (Brito
et al. 1997; Cordes et al. 2001; Waller and Baco 2007; Pires et al. 2009). Alternatively,
this pattern may represent overlapping periodic or prolonged, seasonal cycles of
gametogenesis (Kruger et al. 1998; Orejas et al. 2007). Polyps with oocytes in various
stages of development were also observed in the Antarctic deep-water gorgonian
Thouarella variabilis, and it was suggested that this species has a continuous or two year
cycle of oogenesis (Brito et al. 1997). The majority of oocyte size-frequency distributions
(Fig. 2.9) of individual A. arbuscula colonies displayed two modes, which may
correspond to two different generations of oocytes (Pires et al. 2009), suggesting
overlapping periodic or seasonal gametogenic cycles over continuous gametogenesis. The
majority of spermatic cyst size-frequency distributions also showed a bimodal pattern
52
(Fig. 2.10). Orejas et al. (2007) observed bimodality in the oocyte size-frequency
distributions of the deep-water gorgonians Dasystenella acanthina and Thouarella sp.,
and suggested these species have overlapping and long (1-2 year) cycles of oocyte
development, possibly with undetermined seasonal spawning events. A gametogenic
cycle of 2 years was also documented in the deep-water Antarctic primnoid
Ainigmaptilon antarcticum (Orejas et al. 2002). The cause of extended gametogenic
cycles in corals remains uncertain (Edwards and Moore 2009). Previous studies have
suggested that an extended oogenic cycle is required to produce large oocytes, however, a
prolonged oogenic cycle has been reported in a azooxanthellate coral with relatively small
oocytes (Balanophyllia elegans, Fadlallah and Pearse 1982). It is possible that in the deep
ocean where resources are limited, two successive spring/summer periods when food
abundance is highest may be required to complete gametogenesis (Orejas et al. 2007).
However, many shallow, zooxanthellate corals also have prolonged cycles of oogenesis
(Benayahu and Loya 1986; Benayahu 1989; Brazeau and Lasker 1989; Coma et al.
1995b; Kruger et al. 1998; Ribes et al. 2007; Edwards and Moore 2008). Alternatively,
Benayahu and Loya (1986) suggested that extended cycles of oogenesis are found in
species with high fecundity, synchronized oocyte maturation, and brief spawning periods.
Further investigation into the driving forces of the duration of the gametogenic cycle in
both shallow- and deep-water corals is warranted.
Bimodality of oocyte size-frequency distributions and seasonal development and
spawning of oocytes has been reported for several deep-water anemones (Van-Praet
1990; Van-Praet et al. 1990). Van-Praet et al. (1990) observed bimodality in two species
of deep-water anemone, Phelliactis hertwigi and P. robusta, and related the variability in
the number of the larger size class of oocytes to their seasonal disappearance. This
53
pattern is similar to that observed in colonies of A. arbuscula. In A. arbuscula, periodicity
or seasonality is suggested from the percent frequency of the developmental stages of
oocytes and spermatic cysts, but is not evident from the individual gamete size-frequency
distributions. For example, the percent frequency of stage IV oocytes decreased from ~4
to ~1.5% from June to July (Table 2.5), and the percent frequency of stage V oocytes
increased from ~1.4 to 7% from June to July, suggesting a shift towards more late-
vitellogenic oocytes in July. Also, stage 1 oogonia decreased in frequency from June to
July (4.5% compared to 9.5% in June). These results suggest that a spawning event might
have occurred during or after July. In males however, a spawning event may have
occurred earlier than July. Only one spermatic cyst with mature spermatozoa was
observed in a sample collected in May (Table 2.6). In male colonies, spawning is usually
close when spermatozoa tails are present in the spermatic cysts (Brazeau and Lasker
1989). It is possible that a spawning event occurred during or just before samples were
collected in May, which would explain why only one mature spermatic cyst with
spermatozoa tails was present. Alternatively, stage III spermatic cysts may mature
quickly into stage IV spermatic cysts (Harrison and Wallace 1990) and are released,
which could explain why no stage IV cysts were present past May.
A. arbuscula from the Northeast Atlantic exhibited seasonal cycles of
gametogenesis and spawning. Lawson (1991) observed an increase in mean spermatic
cyst and oocyte diameters throughout the year, with the largest spermatic cysts occurring
in September. In females, a cohort of smaller oocytes was present year-round, with
medium and large oocytes increasing in frequency throughout the year. The largest
numbers of large (>0.45 µm) oocytes occurred in October, the time at which Lawson
(1991) hypothesized that spermatic cysts were spawned. Lawson (1991) related this
54
seasonal cycle of gametogenesis to the sinking of the spring phytoplankton bloom in late
May to August, and hypothesized that A. arbuscula may use this food source as a cue to
initiate vitellogenesis. Alternatively, Lawson (1991) suggested that the timing of release
of larvae may be linked with the arrival of the bloom to the sea floor, suggesting larvae or
newly-settled polyps would benefit from the increased resources. In the present study, the
pattern of gametogenesis and spawning of A. arbuscula remains unclear. The presence of
two cohorts of oocytes suggests it is possible that A. arbuscula maintains a pool of pre-
vitellogenic oocytes throughout the year, with maturation and spawning of only a small
portion of the cohort occurring periodically, or seasonally as in A. arbuscula from the
Northeast Atlantic. Monthly sampling throughout the year combined with laboratory
experiments are required to confirm the duration and cycle of gametogenesis and
spawning in this species.
2.43. Intra-Colony Variation in Polyp Fecundity and Gamete Size
Intra-colony variation in reproduction has been documented both in tropical
zooxanthellate and deep-water corals (Benayahu and Loya 1986; Brazeau and Lasker
1989; Coma et al. 1995a; Brito et al. 1997; Sakai 1998; Kapela and Lasker 1999; Orejas
et al. 2002; Santangelo et al. 2003; Gutiérrez-Rodríguez and Lasker 2004; Orejas et al.
2007; Pires et al. 2009). However, polyp fecundity and mean gamete diameters per polyp
in both females and males did not significantly differ between the three colony zones (i.e.
apical, medial, and basal) in A. arbuscula. In constrast, Orejas et al. (2002) found that
polyps from the apical and medial zones had significantly higher fecundities than basally-
located polyps in the deep-water primnoid coral Ainigmaptilon antarcticum, and related
this pattern to possible elevated prey capture rates in more apically-located polyps, and/or
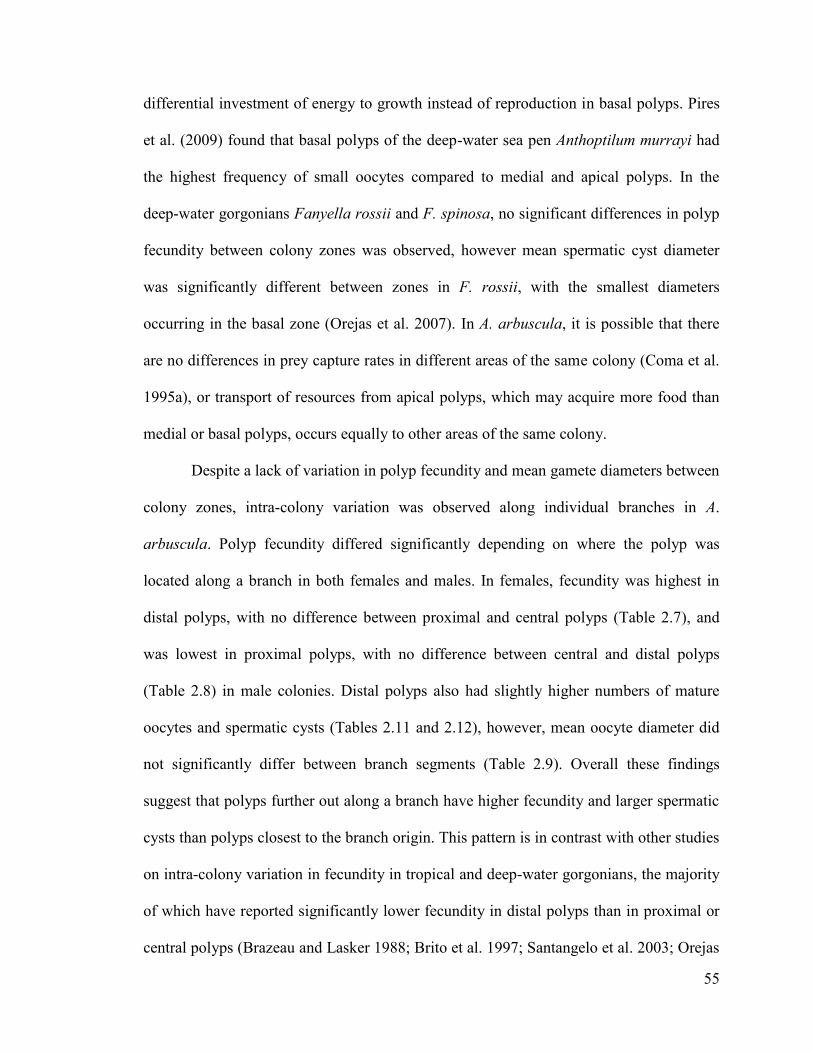
55
differential investment of energy to growth instead of reproduction in basal polyps. Pires
et al. (2009) found that basal polyps of the deep-water sea pen Anthoptilum murrayi had
the highest frequency of small oocytes compared to medial and apical polyps. In the
deep-water gorgonians Fanyella rossii and F. spinosa, no significant differences in polyp
fecundity between colony zones was observed, however mean spermatic cyst diameter
was significantly different between zones in F. rossii, with the smallest diameters
occurring in the basal zone (Orejas et al. 2007). In A. arbuscula, it is possible that there
are no differences in prey capture rates in different areas of the same colony (Coma et al.
1995a), or transport of resources from apical polyps, which may acquire more food than
medial or basal polyps, occurs equally to other areas of the same colony.
Despite a lack of variation in polyp fecundity and mean gamete diameters between
colony zones, intra-colony variation was observed along individual branches in A.
arbuscula. Polyp fecundity differed significantly depending on where the polyp was
located along a branch in both females and males. In females, fecundity was highest in
distal polyps, with no difference between proximal and central polyps (Table 2.7), and
was lowest in proximal polyps, with no difference between central and distal polyps
(Table 2.8) in male colonies. Distal polyps also had slightly higher numbers of mature
oocytes and spermatic cysts (Tables 2.11 and 2.12), however, mean oocyte diameter did
not significantly differ between branch segments (Table 2.9). Overall these findings
suggest that polyps further out along a branch have higher fecundity and larger spermatic
cysts than polyps closest to the branch origin. This pattern is in contrast with other studies
on intra-colony variation in fecundity in tropical and deep-water gorgonians, the majority
of which have reported significantly lower fecundity in distal polyps than in proximal or
central polyps (Brazeau and Lasker 1988; Brito et al. 1997; Santangelo et al. 2003; Orejas
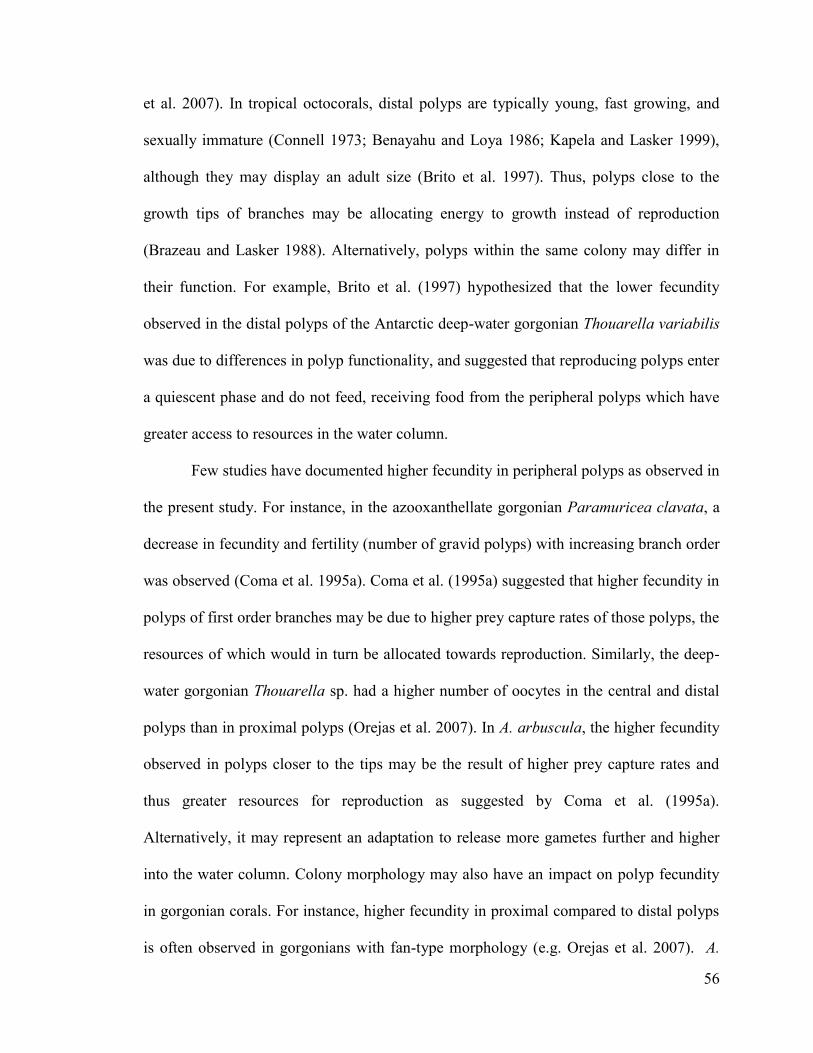
56
et al. 2007). In tropical octocorals, distal polyps are typically young, fast growing, and
sexually immature (Connell 1973; Benayahu and Loya 1986; Kapela and Lasker 1999),
although they may display an adult size (Brito et al. 1997). Thus, polyps close to the
growth tips of branches may be allocating energy to growth instead of reproduction
(Brazeau and Lasker 1988). Alternatively, polyps within the same colony may differ in
their function. For example, Brito et al. (1997) hypothesized that the lower fecundity
observed in the distal polyps of the Antarctic deep-water gorgonian Thouarella variabilis
was due to differences in polyp functionality, and suggested that reproducing polyps enter
a quiescent phase and do not feed, receiving food from the peripheral polyps which have
greater access to resources in the water column.
Few studies have documented higher fecundity in peripheral polyps as observed in
the present study. For instance, in the azooxanthellate gorgonian Paramuricea clavata, a
decrease in fecundity and fertility (number of gravid polyps) with increasing branch order
was observed (Coma et al. 1995a). Coma et al. (1995a) suggested that higher fecundity in
polyps of first order branches may be due to higher prey capture rates of those polyps, the
resources of which would in turn be allocated towards reproduction. Similarly, the deep-
water gorgonian Thouarella sp. had a higher number of oocytes in the central and distal
polyps than in proximal polyps (Orejas et al. 2007). In A. arbuscula, the higher fecundity
observed in polyps closer to the tips may be the result of higher prey capture rates and
thus greater resources for reproduction as suggested by Coma et al. (1995a).
Alternatively, it may represent an adaptation to release more gametes further and higher
into the water column. Colony morphology may also have an impact on polyp fecundity
in gorgonian corals. For instance, higher fecundity in proximal compared to distal polyps
is often observed in gorgonians with fan-type morphology (e.g. Orejas et al. 2007). A.
57
arbuscula is radially bushy with many internal branches. Hosting the largest number of
gametes in peripherally-located polyps may aid in their release further into the water
column and reduce passive deflection and inhibition by other branches on the colony.
Predation on gorgonian polyps is common in tropical waters (Harmelin-Vivien
and Bouchon-Navaro 1983; Ruesink and Harvell 1990; Goh et al. 1999), and may
negatively affect the reproductive output of a coral (Lasker 1985; Rotjan and Lewis
2009). For instance, the butterflyfish Chaetodon capistratus concentrates its feeding on
Plexaura kuna colonies when the polyps contained visible ripe gonads (Lasker 1985).
Rotjan and Lewis (2009) observed that Caribbean parrotfish selectively grazed on polyps
of the gorgonian Montastraea annularis with high total reproductive effort. Shallow,
tropical corals may host the largest numbers of gametes closer to the interior of the
colony to avoid predation on the most gravid polyps. In the deep-sea, predation pressure
on coral polyps is likely not as significant as in shallow waters, and thus, there may not be
the selective pressure to host large numbers of gametes near the interior of the colony as
in tropical gorgonians. Nonetheless, not all deep-water corals host more gametes in distal
polyps than in proximal polyps (see Orejas et al. 2007). A combination of these factors
likely caused the unique pattern of intra-colony variation in reproduction observed in this
species.
2.44. Size at First Reproduction and Influence of Colony Height on Polyp Fecundity
and Gamete Size
It is well documented that shallow-water corals delay reproduction until the
colony reaches a minimum size (Brazeau and Lasker 1989; Coma et al. 1995a; Sakai
1998; Kapela and Lasker 1999; Beiring and Lasker 2000; Santangelo et al. 2003;
58
Gutiérrez-Rodríguez and Lasker 2004; Tsounis et al. 2006). Newly-settled corals are
susceptible to high mortality rates (Babcock 1991; Lasker et al. 1998), and are believed to
allocate their resources to growth instead of reproduction in order to grow rapidly out of
the size classes that are most vulnerable. In A. arbuscula, all colonies collected were
reproductive, so a minimum size at first reproduction could not be determined. The
smallest female collected was 3.4 cm in height and contained 200 oocytes, whereas the
smallest male was 3.0 cm in height and contained 17 spermatic cysts, suggesting that
sexual maturity in A. arbuscula occurs when colony size is less than ~3 cm. However,
these two colonies did not contain mature oocytes or spermatic cysts, suggesting they
may have just reached sexual maturity. A colony that contained no gametes was 7.0 cm in
height, however, it was collected from the deepest site (1861 m), which may explain its
infertility (see Chapter 3). Deep-water corals may not have the selective pressures to grow
quickly out of the smaller size classes, which could explain why the smallest A. arbuscula
colonies were reproductive. The few studies which have examined growth in deep-water
corals have generally documented slow growth rates in comparison to shallow,
zooxanthellate corals (Gladfelter et al. 1978; Bak 1983; Huston 1985; Yoshioka and
Yoshioka 1991; Andrews et al. 2002; Roark et al. 2006; Sherwood and Edinger 2009;
Hamel et al. 2010). This study did not sample the full size range of A. arbuscula, and
colonies smaller than 3 cm must be examined in order to determine their reproductive
status and actual size at first reproduction.
The positive relationship between polyp fecundity and colony height, and gamete
diameter and colony height observed in both female and male A. arbuscula (Fig. 2.12)
colonies is common among shallow-water corals (Coma et al. 1995a; Kapela and Lasker
1999; Beiring and Lasker 2000; Tsounis et al. 2006), although the relationship was
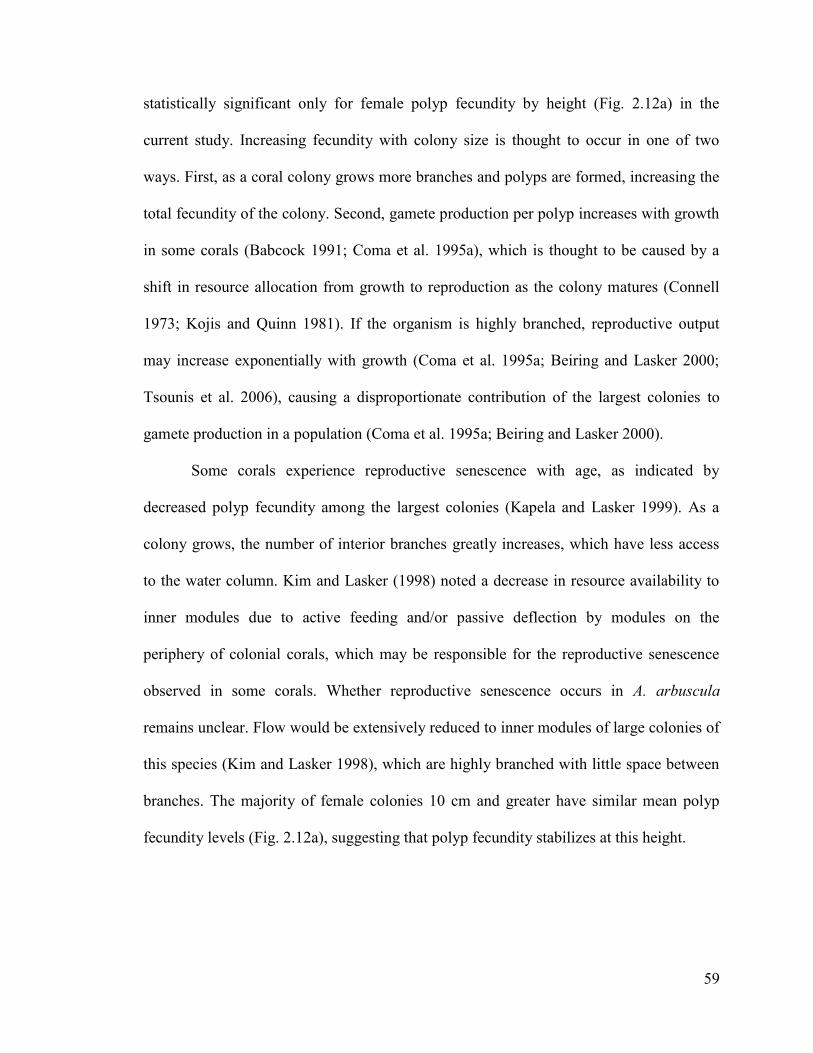
59
statistically significant only for female polyp fecundity by height (Fig. 2.12a) in the
current study. Increasing fecundity with colony size is thought to occur in one of two
ways. First, as a coral colony grows more branches and polyps are formed, increasing the
total fecundity of the colony. Second, gamete production per polyp increases with growth
in some corals (Babcock 1991; Coma et al. 1995a), which is thought to be caused by a
shift in resource allocation from growth to reproduction as the colony matures (Connell
1973; Kojis and Quinn 1981). If the organism is highly branched, reproductive output
may increase exponentially with growth (Coma et al. 1995a; Beiring and Lasker 2000;
Tsounis et al. 2006), causing a disproportionate contribution of the largest colonies to
gamete production in a population (Coma et al. 1995a; Beiring and Lasker 2000).
Some corals experience reproductive senescence with age, as indicated by
decreased polyp fecundity among the largest colonies (Kapela and Lasker 1999). As a
colony grows, the number of interior branches greatly increases, which have less access
to the water column. Kim and Lasker (1998) noted a decrease in resource availability to
inner modules due to active feeding and/or passive deflection by modules on the
periphery of colonial corals, which may be responsible for the reproductive senescence
observed in some corals. Whether reproductive senescence occurs in A. arbuscula
remains unclear. Flow would be extensively reduced to inner modules of large colonies of
this species (Kim and Lasker 1998), which are highly branched with little space between
branches. The majority of female colonies 10 cm and greater have similar mean polyp
fecundity levels (Fig. 2.12a), suggesting that polyp fecundity stabilizes at this height.
60
2.45. Conclusion
In conclusion, the reproductive traits of the deep-water gorgonian A. arbuscula are
similar to those observed in tropical, shallow- and deep-water octocorals. A. arbuscula is
gonochoristic with a sex ratio not significantly different from 1:1. This species appears to
have overlapping periodic or seasonal cycles of gametogenesis, and the absence of
embryos and planulae within the polyps suggests that A. arbuscula is a broadcast
spawner. In contrast to many tropical gorgonians, polyp fecundity was highest among the
distal polyps, which may be caused by a combination of factors, such as colony
morphology and low predation pressure compared to shallow water habitats.
Although height at first reproduction is small (<3 cm), the axial growth rate of A.
arbuscula is low (>0.30 cm/year-1
, Sherwood and Edinger 2009), suggesting it may take
many years of growth to reach reproductive maturity. This study has shown that the
relationship between colony height and mean polyp fecundity is positive and significant,
with larger colonies producing more oocytes than smaller ones. Thus, it may take many
years to reach a size that ensures high reproductive success (Torrents et al. 2005). These
characteristics, along with possible infrequent spawning events, suggest that A. arbuscula
may have a low potential to recover from disturbance. However, the mean polyp
fecundity of this species is quite high compared to other deep-water gorgonians,
suggesting that this species may experience high reproductive success in general. Dense
patches of this coral have been observed in certain areas of the Northwest Atlantic
(Beazley 2008), which may also enhance the fertilization success of a sessile
gonochoristic species with a 1:1 sex ratio (Pires et al. 2009). These features, along with
the probable lecithotrophic larval development and broadcast spawning reproductive
61
mode, may allow for the wide dispersal and settlement of A. arbuscula across the North
Atlantic.
62
Chapter 3. Spatial and Depth Variability in Reproduction of
Acanella arbuscula
3.1. Introduction
The development and spawning of gametes or planulae in corals occurs either
continually, periodically, or seasonally, and may or may not be synchronized between
members of the same population. In sessile gonochoristic corals, synchronous spawning
of gametes into the water column is important to maximize fertilization success (Oliver
and Babcock 1992), and brief, synchronous spawning events are common among
shallow-living, reef-building species (Kojis and Quinn 1982; Harrison et al. 1984;
Babcock et al. 1986; Harrison and Wallace 1990).
In shallow waters, environmental factors can be responsible for the synchronous
development and spawning of gametes in corals. For example, temperature, photoperiod,
lunar phase, wind intensity, tidal cycle, rainfall, and food supply have been linked to the
timing of gametogenesis and/or spawning of shallow-water corals (Kojis and Quinn 1982;
Shelsinger and Loya 1985; Babcock et al. 1986; Farrant 1986; Harrison and Wallace
1990; Richmond and Hunter 1990; Mendes and Woodley 2002; van Woesik 2010). These
factors may control reproduction on various temporal scales. Babcock et al. (1986)
suggested that sea surface temperature controls the time of year when corals spawn on the
Great Barrier Reef, the lunar and tidal cycles control the time of month, and the diurnal
light cycle controls the time of day. Although these factors are well established as
proximate cues to reproduction (Oliver et al. 1988), much less is known of the ultimate
evolutionary forces driving synchronous gametogenesis and spawning (van Woesik
2010).
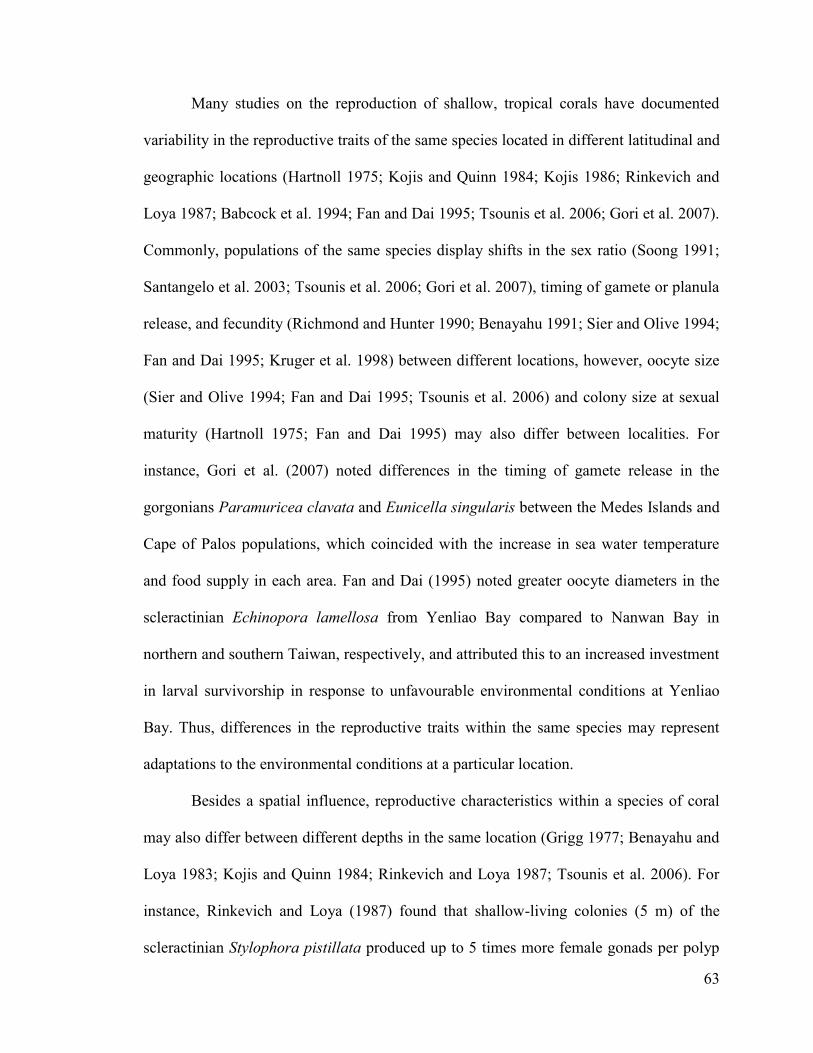
63
Many studies on the reproduction of shallow, tropical corals have documented
variability in the reproductive traits of the same species located in different latitudinal and
geographic locations (Hartnoll 1975; Kojis and Quinn 1984; Kojis 1986; Rinkevich and
Loya 1987; Babcock et al. 1994; Fan and Dai 1995; Tsounis et al. 2006; Gori et al. 2007).
Commonly, populations of the same species display shifts in the sex ratio (Soong 1991;
Santangelo et al. 2003; Tsounis et al. 2006; Gori et al. 2007), timing of gamete or planula
release, and fecundity (Richmond and Hunter 1990; Benayahu 1991; Sier and Olive 1994;
Fan and Dai 1995; Kruger et al. 1998) between different locations, however, oocyte size
(Sier and Olive 1994; Fan and Dai 1995; Tsounis et al. 2006) and colony size at sexual
maturity (Hartnoll 1975; Fan and Dai 1995) may also differ between localities. For
instance, Gori et al. (2007) noted differences in the timing of gamete release in the
gorgonians Paramuricea clavata and Eunicella singularis between the Medes Islands and
Cape of Palos populations, which coincided with the increase in sea water temperature
and food supply in each area. Fan and Dai (1995) noted greater oocyte diameters in the
scleractinian Echinopora lamellosa from Yenliao Bay compared to Nanwan Bay in
northern and southern Taiwan, respectively, and attributed this to an increased investment
in larval survivorship in response to unfavourable environmental conditions at Yenliao
Bay. Thus, differences in the reproductive traits within the same species may represent
adaptations to the environmental conditions at a particular location.
Besides a spatial influence, reproductive characteristics within a species of coral
may also differ between different depths in the same location (Grigg 1977; Benayahu and
Loya 1983; Kojis and Quinn 1984; Rinkevich and Loya 1987; Tsounis et al. 2006). For
instance, Rinkevich and Loya (1987) found that shallow-living colonies (5 m) of the
scleractinian Stylophora pistillata produced up to 5 times more female gonads per polyp
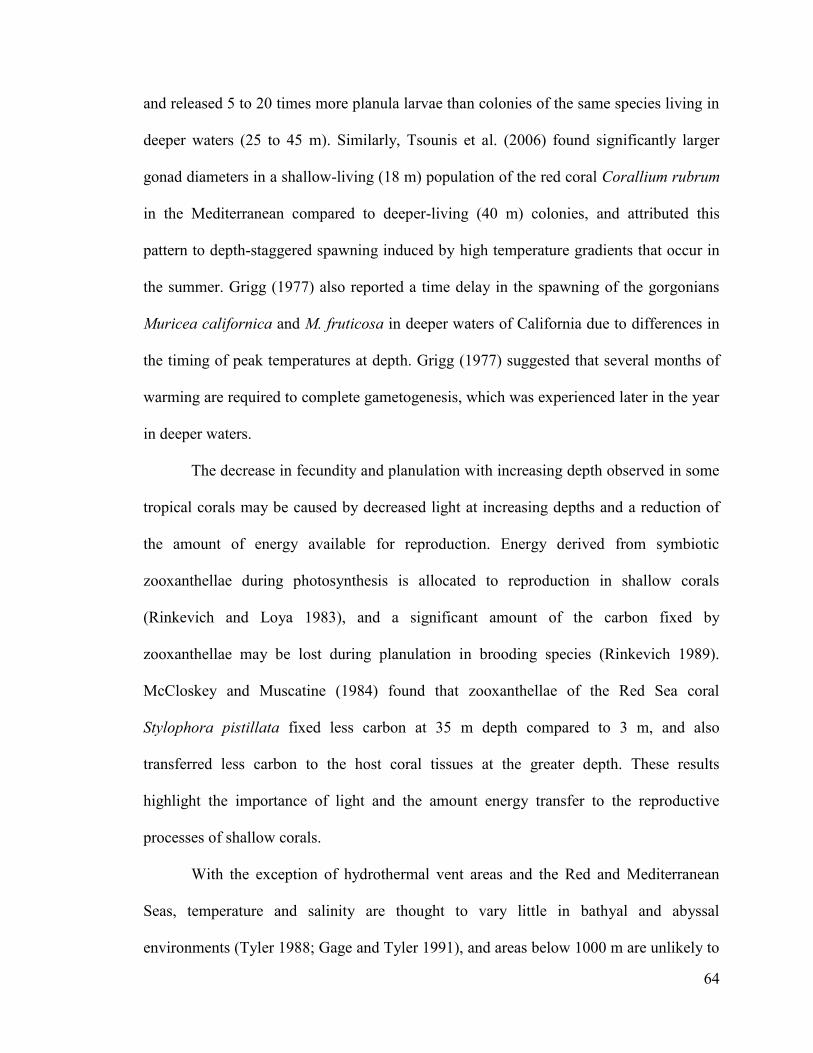
64
and released 5 to 20 times more planula larvae than colonies of the same species living in
deeper waters (25 to 45 m). Similarly, Tsounis et al. (2006) found significantly larger
gonad diameters in a shallow-living (18 m) population of the red coral Corallium rubrum
in the Mediterranean compared to deeper-living (40 m) colonies, and attributed this
pattern to depth-staggered spawning induced by high temperature gradients that occur in
the summer. Grigg (1977) also reported a time delay in the spawning of the gorgonians
Muricea californica and M. fruticosa in deeper waters of California due to differences in
the timing of peak temperatures at depth. Grigg (1977) suggested that several months of
warming are required to complete gametogenesis, which was experienced later in the year
in deeper waters.
The decrease in fecundity and planulation with increasing depth observed in some
tropical corals may be caused by decreased light at increasing depths and a reduction of
the amount of energy available for reproduction. Energy derived from symbiotic
zooxanthellae during photosynthesis is allocated to reproduction in shallow corals
(Rinkevich and Loya 1983), and a significant amount of the carbon fixed by
zooxanthellae may be lost during planulation in brooding species (Rinkevich 1989).
McCloskey and Muscatine (1984) found that zooxanthellae of the Red Sea coral
Stylophora pistillata fixed less carbon at 35 m depth compared to 3 m, and also
transferred less carbon to the host coral tissues at the greater depth. These results
highlight the importance of light and the amount energy transfer to the reproductive
processes of shallow corals.
With the exception of hydrothermal vent areas and the Red and Mediterranean
Seas, temperature and salinity are thought to vary little in bathyal and abyssal
environments (Tyler 1988; Gage and Tyler 1991), and areas below 1000 m are unlikely to
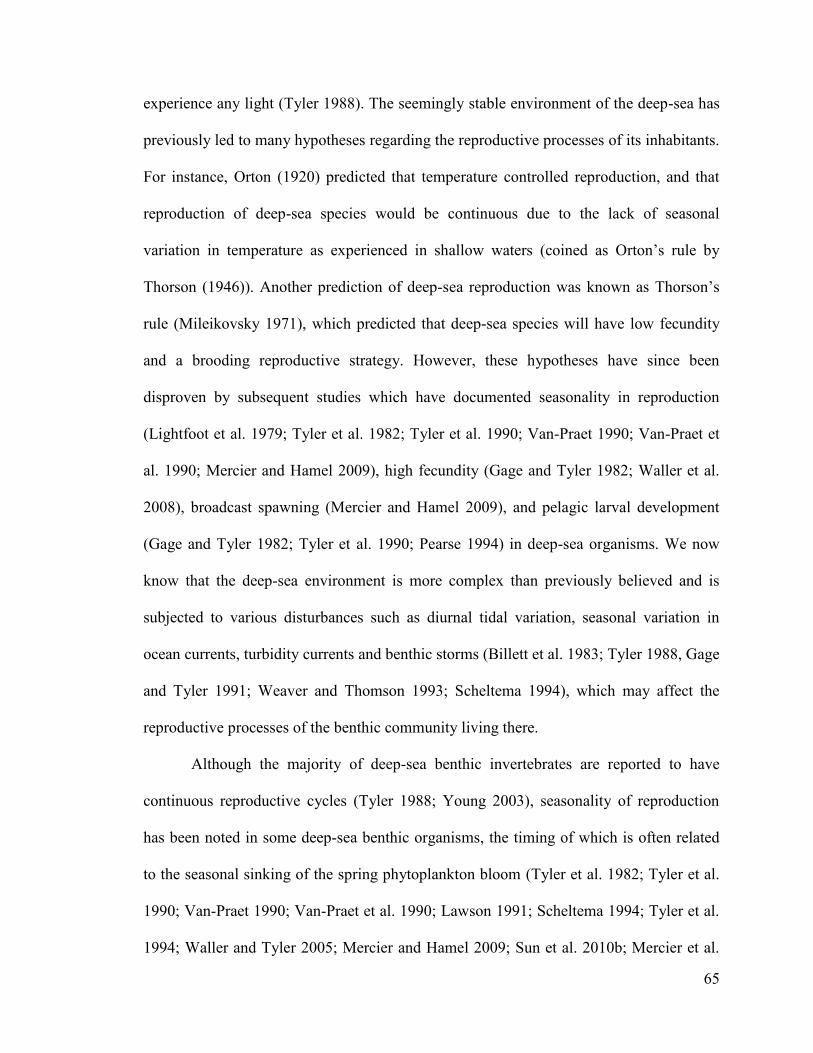
65
experience any light (Tyler 1988). The seemingly stable environment of the deep-sea has
previously led to many hypotheses regarding the reproductive processes of its inhabitants.
For instance, Orton (1920) predicted that temperature controlled reproduction, and that
reproduction of deep-sea species would be continuous due to the lack of seasonal
variation in temperature as experienced in shallow waters (coined as Orton‟s rule by
Thorson (1946)). Another prediction of deep-sea reproduction was known as Thorson‟s
rule (Mileikovsky 1971), which predicted that deep-sea species will have low fecundity
and a brooding reproductive strategy. However, these hypotheses have since been
disproven by subsequent studies which have documented seasonality in reproduction
(Lightfoot et al. 1979; Tyler et al. 1982; Tyler et al. 1990; Van-Praet 1990; Van-Praet et
al. 1990; Mercier and Hamel 2009), high fecundity (Gage and Tyler 1982; Waller et al.
2008), broadcast spawning (Mercier and Hamel 2009), and pelagic larval development
(Gage and Tyler 1982; Tyler et al. 1990; Pearse 1994) in deep-sea organisms. We now
know that the deep-sea environment is more complex than previously believed and is
subjected to various disturbances such as diurnal tidal variation, seasonal variation in
ocean currents, turbidity currents and benthic storms (Billett et al. 1983; Tyler 1988, Gage
and Tyler 1991; Weaver and Thomson 1993; Scheltema 1994), which may affect the
reproductive processes of the benthic community living there.
Although the majority of deep-sea benthic invertebrates are reported to have
continuous reproductive cycles (Tyler 1988; Young 2003), seasonality of reproduction
has been noted in some deep-sea benthic organisms, the timing of which is often related
to the seasonal sinking of the spring phytoplankton bloom (Tyler et al. 1982; Tyler et al.
1990; Van-Praet 1990; Van-Praet et al. 1990; Lawson 1991; Scheltema 1994; Tyler et al.
1994; Waller and Tyler 2005; Mercier and Hamel 2009; Sun et al. 2010b; Mercier et al.
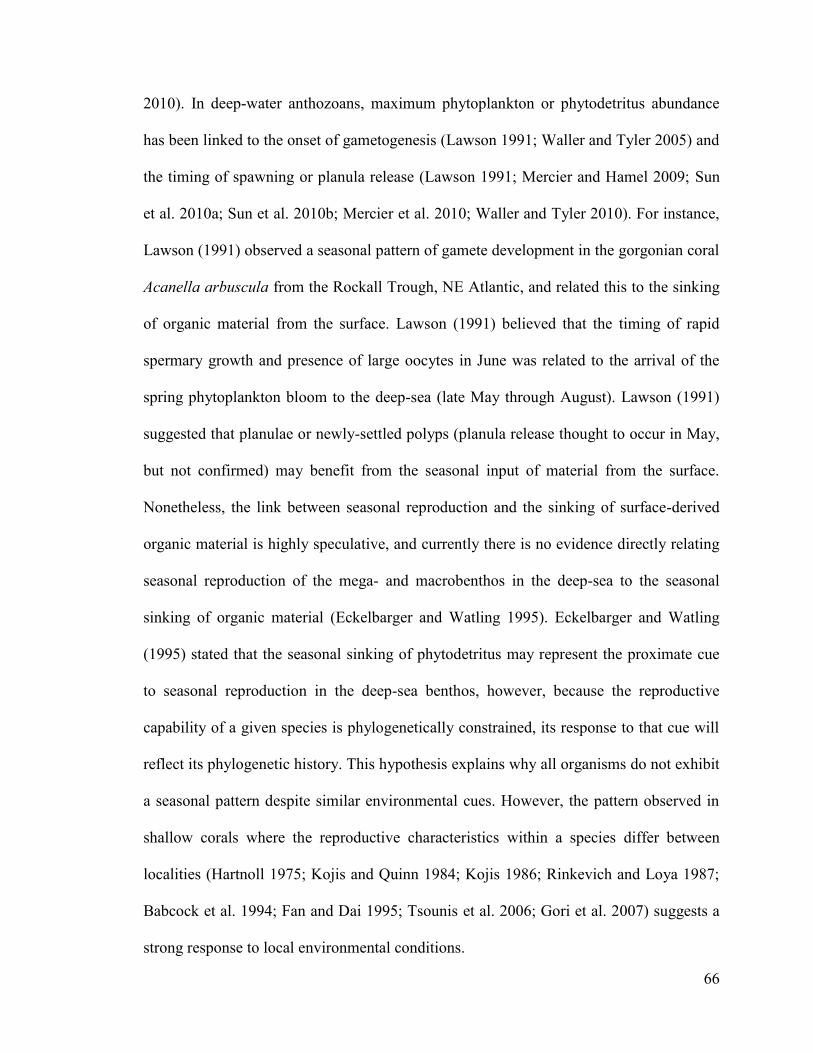
66
2010). In deep-water anthozoans, maximum phytoplankton or phytodetritus abundance
has been linked to the onset of gametogenesis (Lawson 1991; Waller and Tyler 2005) and
the timing of spawning or planula release (Lawson 1991; Mercier and Hamel 2009; Sun
et al. 2010a; Sun et al. 2010b; Mercier et al. 2010; Waller and Tyler 2010). For instance,
Lawson (1991) observed a seasonal pattern of gamete development in the gorgonian coral
Acanella arbuscula from the Rockall Trough, NE Atlantic, and related this to the sinking
of organic material from the surface. Lawson (1991) believed that the timing of rapid
spermary growth and presence of large oocytes in June was related to the arrival of the
spring phytoplankton bloom to the deep-sea (late May through August). Lawson (1991)
suggested that planulae or newly-settled polyps (planula release thought to occur in May,
but not confirmed) may benefit from the seasonal input of material from the surface.
Nonetheless, the link between seasonal reproduction and the sinking of surface-derived
organic material is highly speculative, and currently there is no evidence directly relating
seasonal reproduction of the mega- and macrobenthos in the deep-sea to the seasonal
sinking of organic material (Eckelbarger and Watling 1995). Eckelbarger and Watling
(1995) stated that the seasonal sinking of phytodetritus may represent the proximate cue
to seasonal reproduction in the deep-sea benthos, however, because the reproductive
capability of a given species is phylogenetically constrained, its response to that cue will
reflect its phylogenetic history. This hypothesis explains why all organisms do not exhibit
a seasonal pattern despite similar environmental cues. However, the pattern observed in
shallow corals where the reproductive characteristics within a species differ between
localities (Hartnoll 1975; Kojis and Quinn 1984; Kojis 1986; Rinkevich and Loya 1987;
Babcock et al. 1994; Fan and Dai 1995; Tsounis et al. 2006; Gori et al. 2007) suggests a
strong response to local environmental conditions.
67
The goals of my study were to 1) determine whether spatial variability existed in
the main features of reproduction (i.e. sexuality, sex ratio, mode of reproduction, polyp
fecundity, gamete size, colony size at first reproduction) of the deep-water gorgonian
coral Acanella arbuscula collected from two areas in the Northwest Atlantic, and 2)
determine whether polyp fecundity, gamete size, and the percentage of mature oocytes
differed along a depth gradient, as shown in other shallow- and deep-water corals
(Rinkevich and Loya 1987; Waller et al. 2002; Tsounis et al. 2006; Flint et al. 2007;
Mercier et al. 2010; Waller and Tyler 2010). Characteristics of A. arbuscula‟s
reproductive biology examined in Chapter 2 are re-examined and compared between
sampling locations in this chapter. Clues to the timing and duration of gametogenesis and
potential spawning in relation to certain environmental conditions were only briefly
discussed due to the poor temporal resolution of the collections in this study.
This study is important for the management and conservation of deep-water
corals. Corals that show spatial variability in their reproductive characteristics may
require individual management strategies based on their location. Destructive fishing
practices such as trawling and dredging are moving into deeper habitats and threatening
the deep-water corals living there, a consequence which is not fully understood. Species
that show variability in their reproductive characteristics with depth, especially fecundity,
are at greater risk, as shallower populations may be removed by human activities, leaving
deeper populations without the capacity to re-populate. This is the first study aiming to
directly compare the reproduction of a deep-water gorgonian coral between two
geographically distant locations and along a depth gradient deeper than 200 m.
68
3.2. Materials and Methods
3.21. Study Areas and Sample Collection
A. arbuscula colonies were collected from two areas in the Northwest Atlantic:
The Gully Marine Protected Area (MPA) located on the Scotian shelf, and the Flemish
Cap region off Newfoundland, Canada (Table 3.1). The Gully is located approximately
40 km east of Sable Island on the edge of the Scotian shelf. It is the largest submarine
canyon on the eastern seaboard of North America, being more than 70 km long and 20
km wide, with depths reaching upwards of 2700 m in the main canyon (Fader and Strang
2002). Nine feeder canyons and channels extend from the Sable Island Bank into the
western flank of The Gully. The seabed consists of both hard and soft sediments, with
shallow areas composed of sediments ranging from silty sand to gravel and winnowed till
(Gordon and Fenton 2001), with the deepest portion, the thalweg, composed of sand and
mud sediments (Fader and Strang 2002). Water currents and their interaction within The
Gully are greatly influenced by its unique formation and steep topography. The Labrador
Current reaches and mixes with the Nova Scotia Current flowing out of the Gulf of St.
Lawrence at the Laurentian Channel, moving cooler waters in a south westerly direction
along the Scotian shelf. Part of these waters are veered into The Gully, and flow in along
the eastern side and out along the western side, creating a partial gyre near the surface
that is present in the summer, fall, and winter (Rutherford and Breeze 2002). This
circulation pattern is thought to aid in the local retention of nutrients, fuelling greater
primary productivity in The Gully than on the adjacent shelf (Strain and Yeats 2005).
Near-bottom currents are thought to carry weakly suspended material, such as plankton
69
and marine snow, from the surrounding banks and trough of The Gully down into deeper
regions of the canyon. Despite the apparent retention of material in The Gully, the
submarine canyon does not appear to have much greater phytoplankton biomass (as
measured by chlorophyll concentration) than other areas on the Scotian Shelf as a whole
(Head and Harrison 1998; Kepkay et al. 2001), which, as suggested by Strain and Yeats
(2005), may be due to a reduction in phytoplankton biomass caused by the greater
abundance of organisms in high trophic levels.
The Flemish Cap is a shallow region located 600 kilometres east of
Newfoundland. It is separated from the Grand Banks by a rift zone called the Flemish
Pass. On the Cap, depth ranges from approximately 125 to 700 (Stein 2007). A steep
slope exists at the southern tip of the Cap, and the slope off the western part of the Cap
near the Flemish Pass reaches depths upwards of 1100 m (Stein 2007). Circulation on and
around the Flemish Cap is dominated by two major currents: the Labrador Current and
the North Atlantic Current. The Labrador Current brings cold (3-4°C) and low salinity
(34-35) waters from the north to the south through the Flemish Pass and to the east and
southeast around the northern and eastern slopes of the Cap (Colbourne and Foote 2000).
The North Atlantic Current transports relatively warm (>4°C), high salinity (>34.8)
waters along the southeast slope of the Grand Banks and Flemish Cap and to the northeast
(Colbourne and Foote 2000). These two water masses create an anticyclonic gyre directly
on the Cap, trapping water with elevated temperatures and dissolved inorganic nutrients,
creating the potential to host elevated primary and secondary production on the Cap
(Maillet et al. 2005). Despite the higher concentrations of nutrients on the Cap,
phytoplankton biomass is largely confined to the adjacent shelf during the spring,
however, biomass is higher in the summer and autumn months on the Flemish Cap
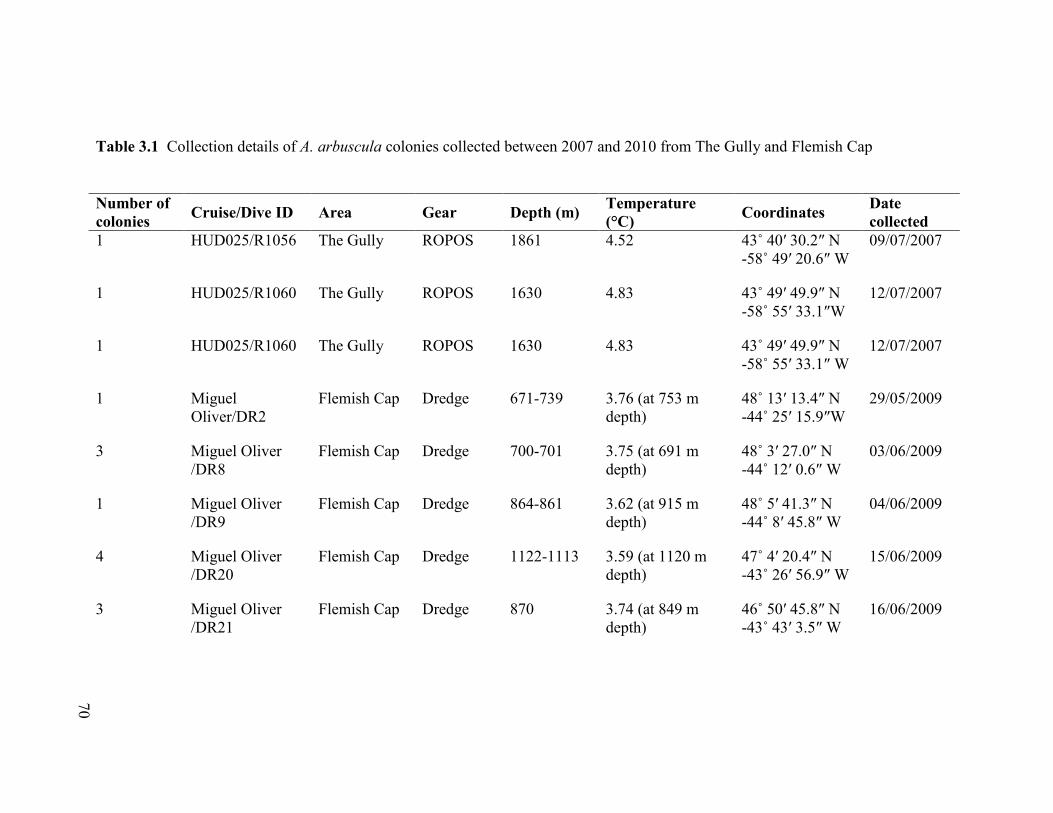
70
Table 3.1 Collection details of A. arbuscula colonies collected between 2007 and 2010 from The Gully and Flemish Cap
Number of
colonies Cruise/Dive ID Area Gear Depth (m)
Temperature
(°C) Coordinates
Date
collected
1 HUD025/R1056 The Gully ROPOS 1861 4.52 43˚ 40′ 30.2″ N
-58˚ 49′ 20.6″ W
09/07/2007
1 HUD025/R1060 The Gully ROPOS 1630 4.83 43˚ 49′ 49.9″ N
-58˚ 55′ 33.1″W
12/07/2007
1 HUD025/R1060 The Gully ROPOS 1630 4.83 43˚ 49′ 49.9″ N
-58˚ 55′ 33.1″ W
12/07/2007
1 Miguel
Oliver/DR2
Flemish Cap Dredge 671-739 3.76 (at 753 m
depth)
48˚ 13′ 13.4″ N
-44˚ 25′ 15.9″W
29/05/2009
3 Miguel Oliver
/DR8
Flemish Cap Dredge 700-701 3.75 (at 691 m
depth)
48˚ 3′ 27.0″ N
-44˚ 12′ 0.6″ W
03/06/2009
1 Miguel Oliver
/DR9
Flemish Cap Dredge 864-861 3.62 (at 915 m
depth)
48˚ 5′ 41.3″ N
-44˚ 8′ 45.8″ W
04/06/2009
4 Miguel Oliver
/DR20
Flemish Cap Dredge 1122-1113 3.59 (at 1120 m
depth)
47˚ 4′ 20.4″ N
-43˚ 26′ 56.9″ W
15/06/2009
3 Miguel Oliver
/DR21
Flemish Cap Dredge 870 3.74 (at 849 m
depth)
46˚ 50′ 45.8″ N
-43˚ 43′ 3.5″ W
16/06/2009
70
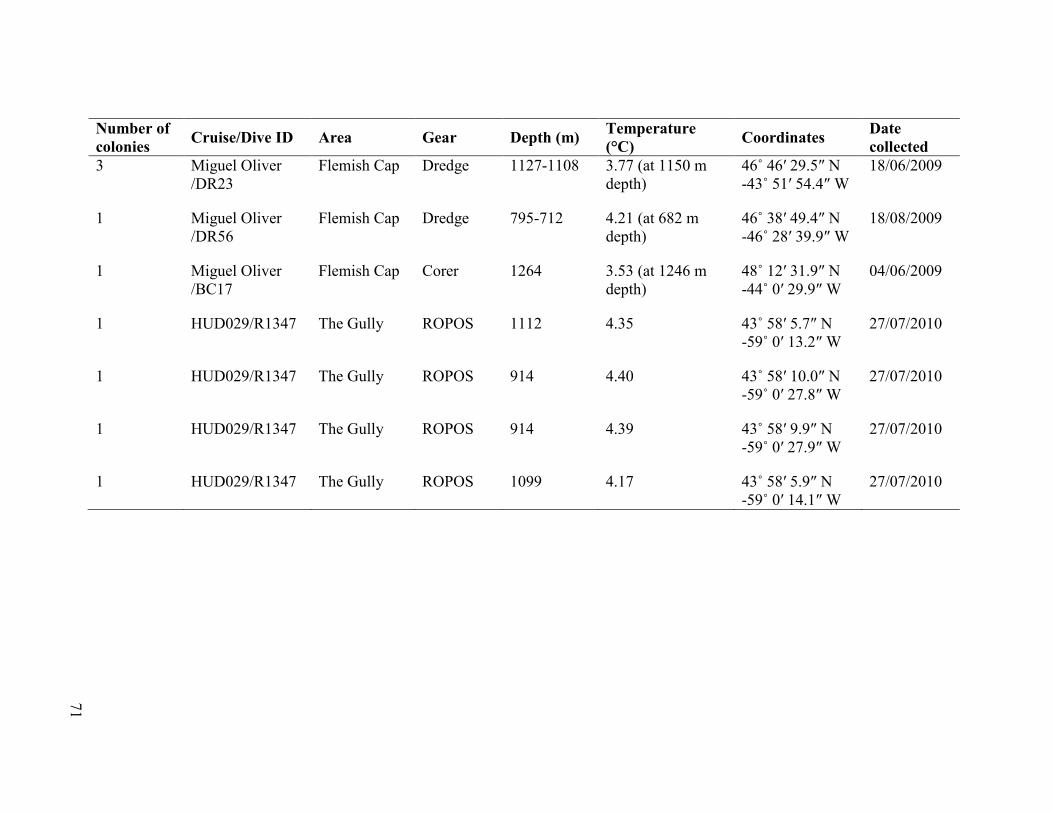
71
Number of
colonies Cruise/Dive ID Area Gear Depth (m)
Temperature
(°C) Coordinates
Date
collected
3 Miguel Oliver
/DR23
Flemish Cap Dredge 1127-1108 3.77 (at 1150 m
depth)
46˚ 46′ 29.5″ N
-43˚ 51′ 54.4″ W
18/06/2009
1 Miguel Oliver
/DR56
Flemish Cap Dredge 795-712 4.21 (at 682 m
depth)
46˚ 38′ 49.4″ N
-46˚ 28′ 39.9″ W
18/08/2009
1 Miguel Oliver
/BC17
Flemish Cap Corer 1264 3.53 (at 1246 m
depth)
48˚ 12′ 31.9″ N
-44˚ 0′ 29.9″ W
04/06/2009
1 HUD029/R1347 The Gully ROPOS 1112 4.35 43˚ 58′ 5.7″ N
-59˚ 0′ 13.2″ W
27/07/2010
1 HUD029/R1347 The Gully ROPOS 914 4.40 43˚ 58′ 10.0″ N
-59˚ 0′ 27.8″ W
27/07/2010
1 HUD029/R1347 The Gully ROPOS 914 4.39 43˚ 58′ 9.9″ N
-59˚ 0′ 27.9″ W
27/07/2010
1 HUD029/R1347 The Gully ROPOS 1099 4.17 43˚ 58′ 5.9″ N
-59˚ 0′ 14.1″ W
27/07/2010
71
72
and slope waters than on the Grand Banks (Maillet et al. 2005). Surface blooms on the
Flemish Cap and slope waters generally form in early March and extend well into June
and July (Maillet et al. 2005).
Colonies of A. arbuscula were collected from The Gully MPA during a research
cruise on the C.C.G.S. Hudson in July 2007. The remotely operated vehicle ROPOS was
deployed, and colonies were collected using the mechanical arm of the ROV at depths
between 1630 and 1861 m. In May through August 2009 A. arbuscula colonies were
collected through a series of benthic surveys conducted by Spain on the eastern and
southwestern slope of the Flemish Cap. There, colonies were collected between depths of
670 and 1264 m using both a rock dredge and box corer. In July 2010 The Gully was
revisited, and colonies were collected using ROPOS between depths of 914 to 1112 m. In
order to acquire information on A. arbuscula‟s reproduction from shallower depths where
it was not collected in 2007, a specific depth range (between 500 and 1500 m) was
targeted to collect A. arbuscula from The Gully in 2010.
Colonies collected during the 2007 ROPOS mission to The Gully were fixed in
10% seawater-buffered formalin for several months and were later transferred to 70%
ethanol for long-term storage. Colonies collected from all other missions were fixed in
10% seawater-buffered formalin for 24 to 48 hours, and were then transferred to 70%
ethanol.
3.22. Histological Preparation and Examination
Reproductive tissue was prepared for examination using standard histological
techniques (Kiernan 1999; Etnoyer et al. 2006). Fifteen randomly-chosen A. arbuscula
polyps were dissected from randomly-chosen branches of a colony and decalcified using
73
a solution of 10% hydrochloric acid and EDTA for approximately 2 to 3 hours, or until no
calcareous material remained. Tissues were then dehydrated through a series of graded
alcohol concentrations and cleared using xylene. Polyps were embedded in paraffin wax
and longitudinally-sectioned 5 µm thick using a rotary microtome. Ribbons were
mounted on slides and stained using Harris‟ hematoxylin and eosin. Slides were
examined using a Nikon E-800 Eclipse microscope and oocytes and spermatic cysts were
followed through their serial sections and photographed using mounted Nikon Digital
Eclipse DXM 1200 and Nikon DS-Ri1 cameras when they were at their largest size,
which may or may not have corresponded to when the nucleus was bisected in the
oocytes. The number of gametes per polyp was counted, and the maximum diameter of
each gamete was measured using Image Pro Plus software, version 5.1.
3.23. Environmental Characteristics of each Study Area
Temperature data were collected every second using three temperature probes
attached to ROPOS in 2007. The average temperature of the three probes at the GMT
(Greenwich Mean Time) when A. arbuscula was collected was calculated. In 2010,
temperature data were collected every second by ROPOS using a pumping CTD
(Conductivity, Temperature, Depth) sensor (SBE 19plus, Sea-Bird) attached to the ROV.
The temperature corresponding to the GMT time when a sample was collected was
extracted. During the Spain surveys in 2009, temperature data were collected 8
times/second using a Sea-Bird CTD (SBE 25) at the end of each dredge or box core.
Temperature for the deepest depth of each CTD cast was used.
Sea surface phytoplankton biomass, as measured by chlorophyll a concentration,
was estimated from January to December from years 1998 to 2004 for both The Gully
74
and Flemish Cap regions using the Ocean Colour Database (OCDB) provided by The
Department of Fisheries and Oceans, Canada: http://www2.mar.dfo-
mpo.gc.ca/science/ocean/database/data_query.html. This database maintains SeaWiFS
Local Area Coverage 1.5 x 1.5 km-resolution semi-monthly composites for the North
Atlantic from September 2007 to December 2004. The semi-monthly composites (taken
on the 15th and last day of each month) were averaged, giving a single chlorophyll a
concentration for each month. For The Gully, chlorophyll a concentration was estimated
using the system polygon provided by the database for that region (Scotian Shelf polygon
8). For the Flemish Cap, instead of estimating chlorophyll a for the entire NAFO 3 M
area, this area was divided into a smaller rectangle to encompass only the area occupied
by the Flemish Cap (46.0 to 50.0 N, 47.0 to 42.0 W).
3.24. Statistical Analyses
Deviance from parity in the sex ratio (ratio of males to females) of The Gully and
Flemish Cap populations of A. arbuscula was individually tested using a chi-square (2)
test. Polyp-fecundity values for each of the 15 polyps examined per colony were averaged
to get a single polyp fecundity estimate per colony. All gamete diameters were averaged
for each polyp to avoid pseudo-replication, and averaged across the 15 polyps per colony,
giving a single gamete diameter value per colony. Differences in mean polyp fecundity
per colony and mean gamete diameter per polyp per colony between The Gully and
Flemish Cap were examined using the following linear model:
yij= µ + βi + ɛij,
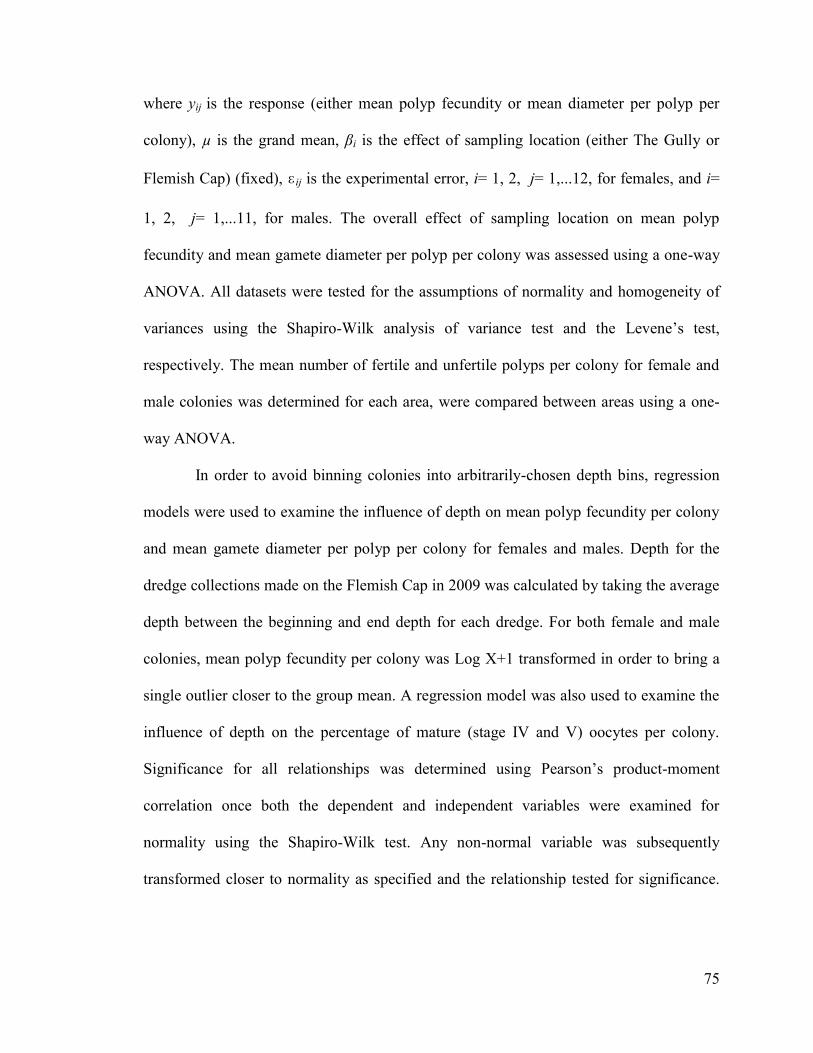
75
where yij is the response (either mean polyp fecundity or mean diameter per polyp per
colony), µ is the grand mean, βi is the effect of sampling location (either The Gully or
Flemish Cap) (fixed), ɛij is the experimental error, i= 1, 2, j= 1,...12, for females, and i=
1, 2, j= 1,...11, for males. The overall effect of sampling location on mean polyp
fecundity and mean gamete diameter per polyp per colony was assessed using a one-way
ANOVA. All datasets were tested for the assumptions of normality and homogeneity of
variances using the Shapiro-Wilk analysis of variance test and the Levene‟s test,
respectively. The mean number of fertile and unfertile polyps per colony for female and
male colonies was determined for each area, were compared between areas using a one-
way ANOVA.
In order to avoid binning colonies into arbitrarily-chosen depth bins, regression
models were used to examine the influence of depth on mean polyp fecundity per colony
and mean gamete diameter per polyp per colony for females and males. Depth for the
dredge collections made on the Flemish Cap in 2009 was calculated by taking the average
depth between the beginning and end depth for each dredge. For both female and male
colonies, mean polyp fecundity per colony was Log X+1 transformed in order to bring a
single outlier closer to the group mean. A regression model was also used to examine the
influence of depth on the percentage of mature (stage IV and V) oocytes per colony.
Significance for all relationships was determined using Pearson‟s product-moment
correlation once both the dependent and independent variables were examined for
normality using the Shapiro-Wilk test. Any non-normal variable was subsequently
transformed closer to normality as specified and the relationship tested for significance.
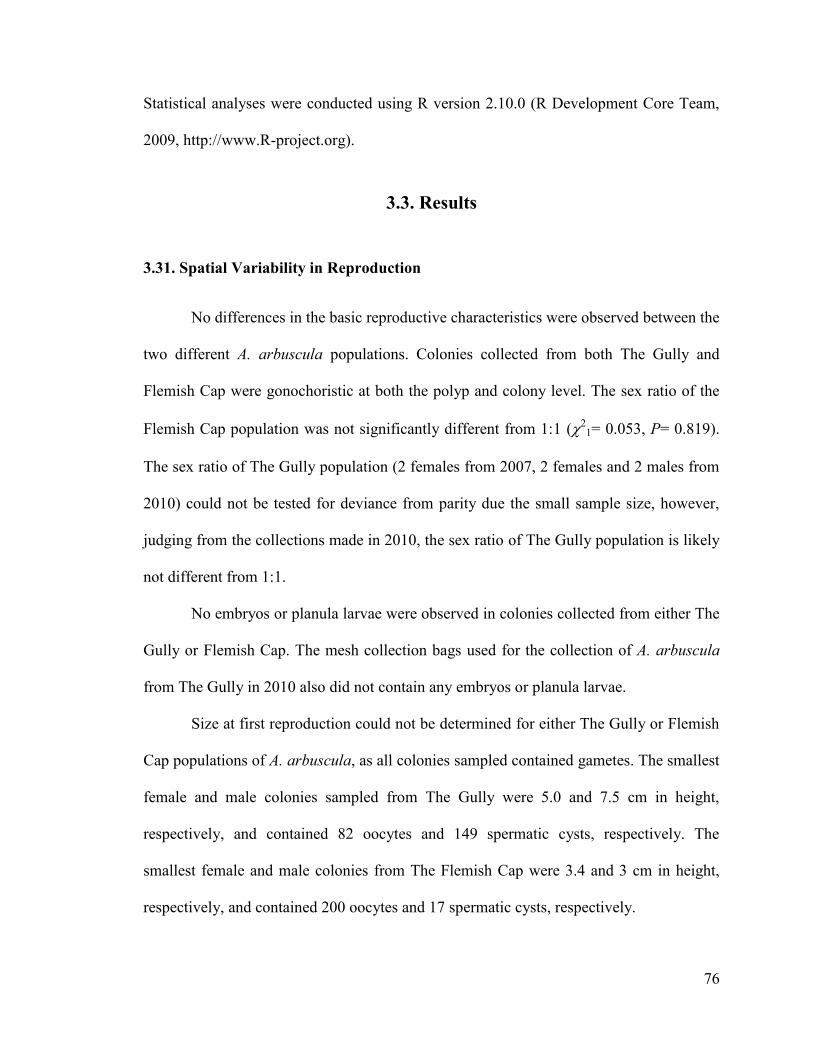
76
Statistical analyses were conducted using R version 2.10.0 (R Development Core Team,
2009, http://www.R-project.org).
3.3. Results
3.31. Spatial Variability in Reproduction
No differences in the basic reproductive characteristics were observed between the
two different A. arbuscula populations. Colonies collected from both The Gully and
Flemish Cap were gonochoristic at both the polyp and colony level. The sex ratio of the
Flemish Cap population was not significantly different from 1:1 (21= 0.053, P= 0.819).
The sex ratio of The Gully population (2 females from 2007, 2 females and 2 males from
2010) could not be tested for deviance from parity due the small sample size, however,
judging from the collections made in 2010, the sex ratio of The Gully population is likely
not different from 1:1.
No embryos or planula larvae were observed in colonies collected from either The
Gully or Flemish Cap. The mesh collection bags used for the collection of A. arbuscula
from The Gully in 2010 also did not contain any embryos or planula larvae.
Size at first reproduction could not be determined for either The Gully or Flemish
Cap populations of A. arbuscula, as all colonies sampled contained gametes. The smallest
female and male colonies sampled from The Gully were 5.0 and 7.5 cm in height,
respectively, and contained 82 oocytes and 149 spermatic cysts, respectively. The
smallest female and male colonies from The Flemish Cap were 3.4 and 3 cm in height,
respectively, and contained 200 oocytes and 17 spermatic cysts, respectively.
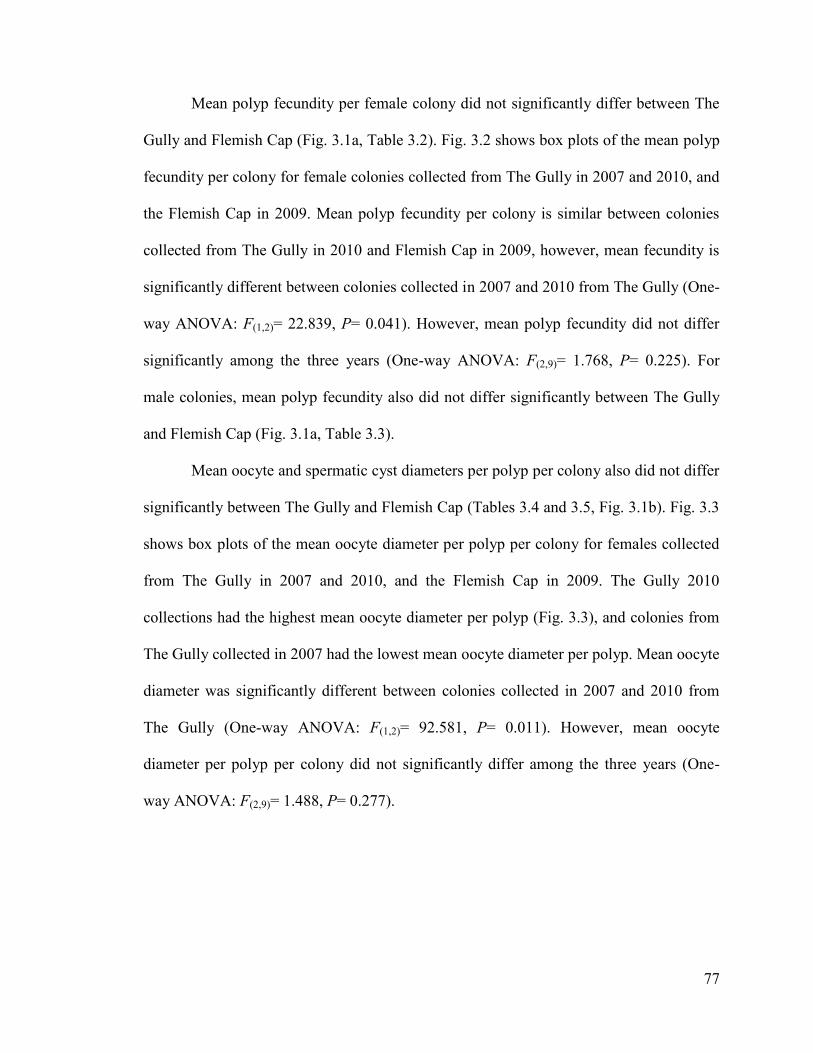
77
Mean polyp fecundity per female colony did not significantly differ between The
Gully and Flemish Cap (Fig. 3.1a, Table 3.2). Fig. 3.2 shows box plots of the mean polyp
fecundity per colony for female colonies collected from The Gully in 2007 and 2010, and
the Flemish Cap in 2009. Mean polyp fecundity per colony is similar between colonies
collected from The Gully in 2010 and Flemish Cap in 2009, however, mean fecundity is
significantly different between colonies collected in 2007 and 2010 from The Gully (One-
way ANOVA: F(1,2)= 22.839, P= 0.041). However, mean polyp fecundity did not differ
significantly among the three years (One-way ANOVA: F(2,9)= 1.768, P= 0.225). For
male colonies, mean polyp fecundity also did not differ significantly between The Gully
and Flemish Cap (Fig. 3.1a, Table 3.3).
Mean oocyte and spermatic cyst diameters per polyp per colony also did not differ
significantly between The Gully and Flemish Cap (Tables 3.4 and 3.5, Fig. 3.1b). Fig. 3.3
shows box plots of the mean oocyte diameter per polyp per colony for females collected
from The Gully in 2007 and 2010, and the Flemish Cap in 2009. The Gully 2010
collections had the highest mean oocyte diameter per polyp (Fig. 3.3), and colonies from
The Gully collected in 2007 had the lowest mean oocyte diameter per polyp. Mean oocyte
diameter was significantly different between colonies collected in 2007 and 2010 from
The Gully (One-way ANOVA: F(1,2)= 92.581, P= 0.011). However, mean oocyte
diameter per polyp per colony did not significantly differ among the three years (One-
way ANOVA: F(2,9)= 1.488, P= 0.277).
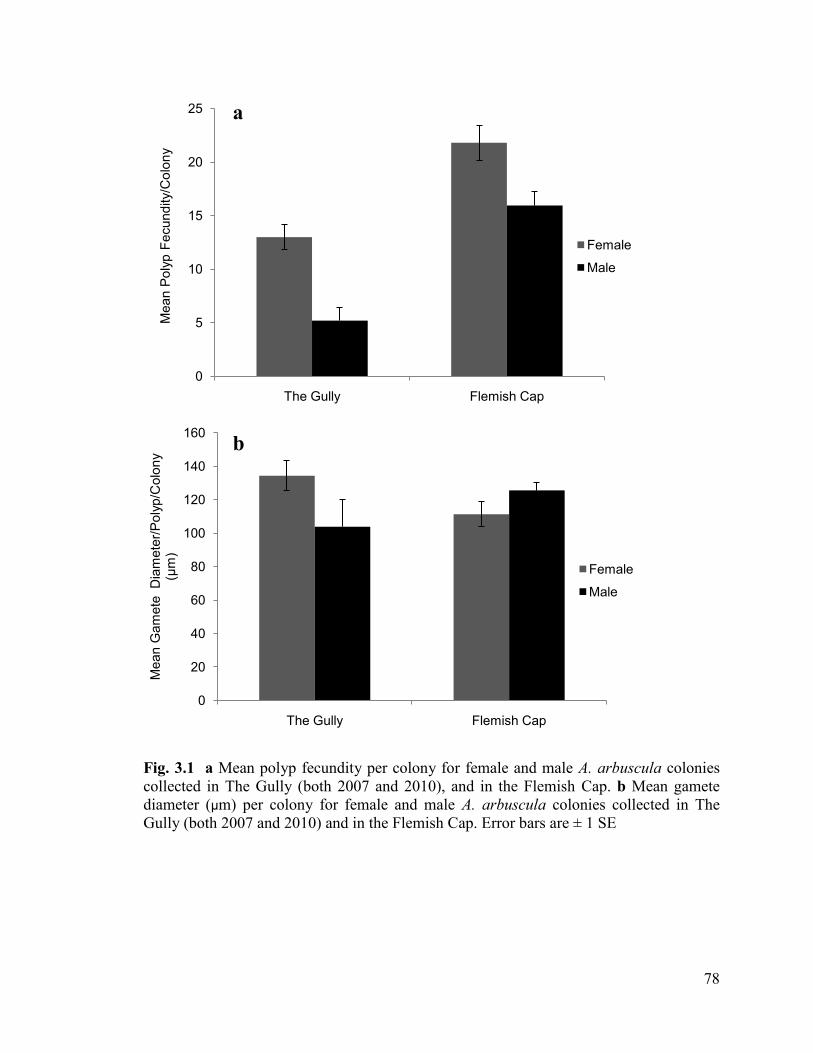
78
Fig. 3.1 a Mean polyp fecundity per colony for female and male A. arbuscula colonies
collected in The Gully (both 2007 and 2010), and in the Flemish Cap. b Mean gamete
diameter (µm) per colony for female and male A. arbuscula colonies collected in The
Gully (both 2007 and 2010) and in the Flemish Cap. Error bars are ± 1 SE
0
5
10
15
20
25
The Gully Flemish Cap
Mean P
oly
p F
ecundity/C
olo
ny
Female
Male
0
20
40
60
80
100
120
140
160
The Gully Flemish Cap
Mean G
am
ete
D
iam
ete
r/P
oly
p/C
olo
ny
(µm
)
Female
Male
a
b
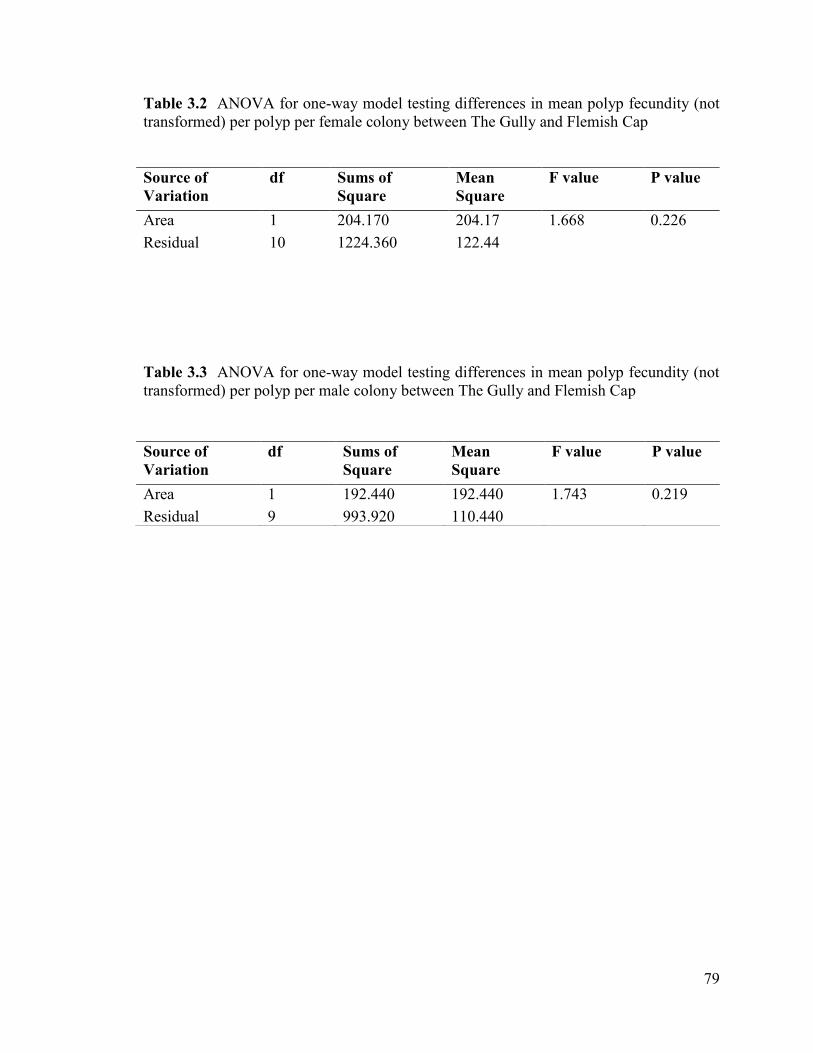
79
Table 3.2 ANOVA for one-way model testing differences in mean polyp fecundity (not
transformed) per polyp per female colony between The Gully and Flemish Cap
Table 3.3 ANOVA for one-way model testing differences in mean polyp fecundity (not
transformed) per polyp per male colony between The Gully and Flemish Cap
Source of
Variation
df Sums of
Square
Mean
Square
F value P value
Area 1 204.170 204.17 1.668 0.226
Residual 10 1224.360 122.44
Source of
Variation
df Sums of
Square
Mean
Square
F value P value
Area 1 192.440 192.440 1.743 0.219
Residual 9 993.920 110.440
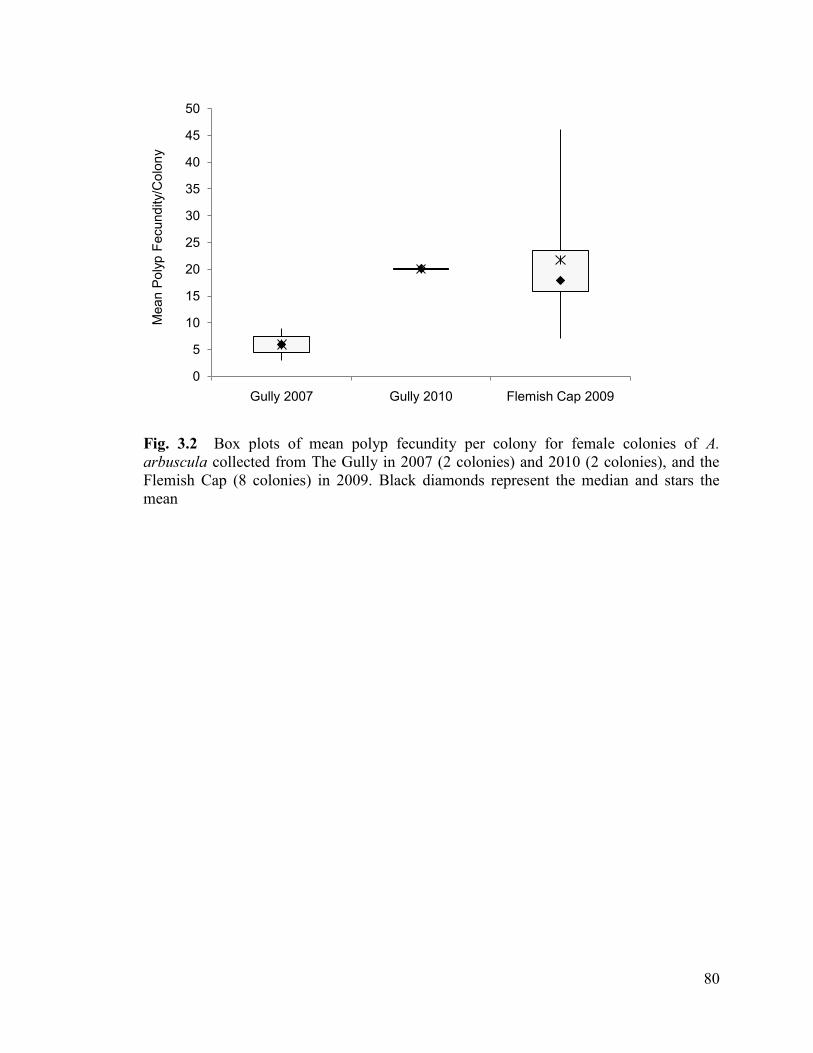
80
Fig. 3.2 Box plots of mean polyp fecundity per colony for female colonies of A.
arbuscula collected from The Gully in 2007 (2 colonies) and 2010 (2 colonies), and the
Flemish Cap (8 colonies) in 2009. Black diamonds represent the median and stars the
mean
0
5
10
15
20
25
30
35
40
45
50
Gully 2007 Gully 2010 Flemish Cap 2009
Mean P
oly
p F
ecundity/C
olo
ny
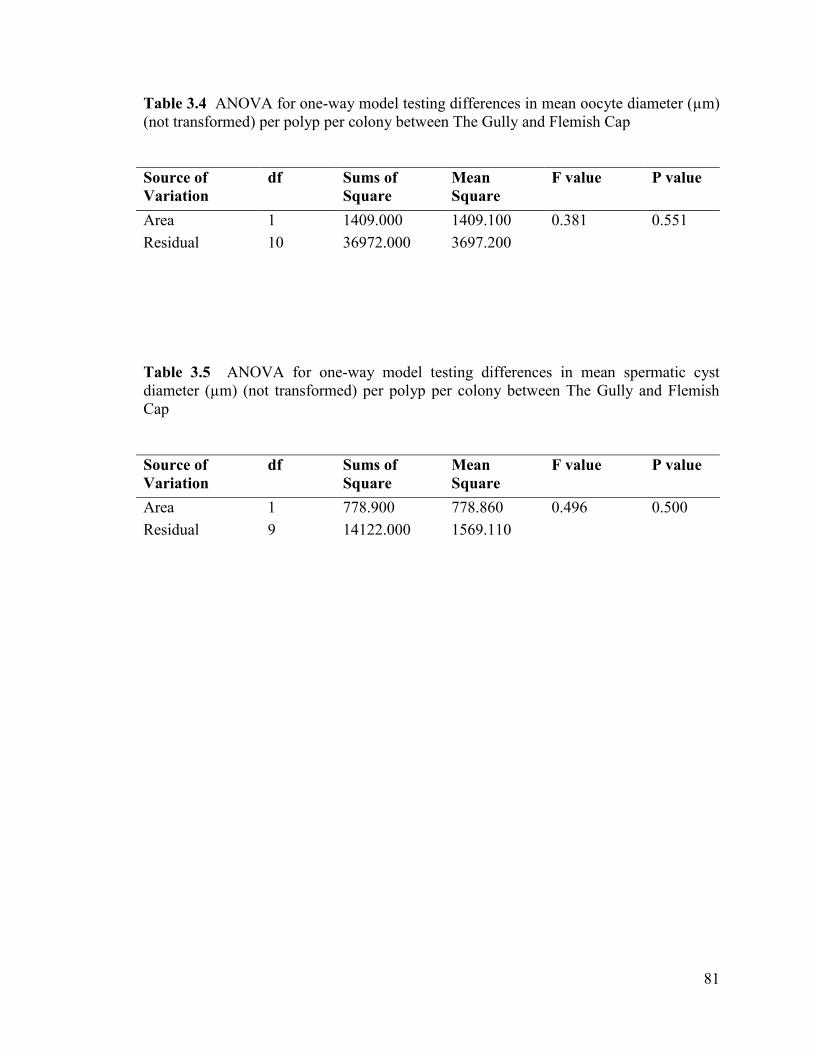
81
Table 3.4 ANOVA for one-way model testing differences in mean oocyte diameter (µm)
(not transformed) per polyp per colony between The Gully and Flemish Cap
Table 3.5 ANOVA for one-way model testing differences in mean spermatic cyst
diameter (µm) (not transformed) per polyp per colony between The Gully and Flemish
Cap
Source of
Variation
df Sums of
Square
Mean
Square
F value P value
Area 1 1409.000 1409.100 0.381 0.551
Residual 10 36972.000 3697.200
Source of
Variation
df Sums of
Square
Mean
Square
F value P value
Area 1 778.900 778.860 0.496 0.500
Residual 9 14122.000 1569.110
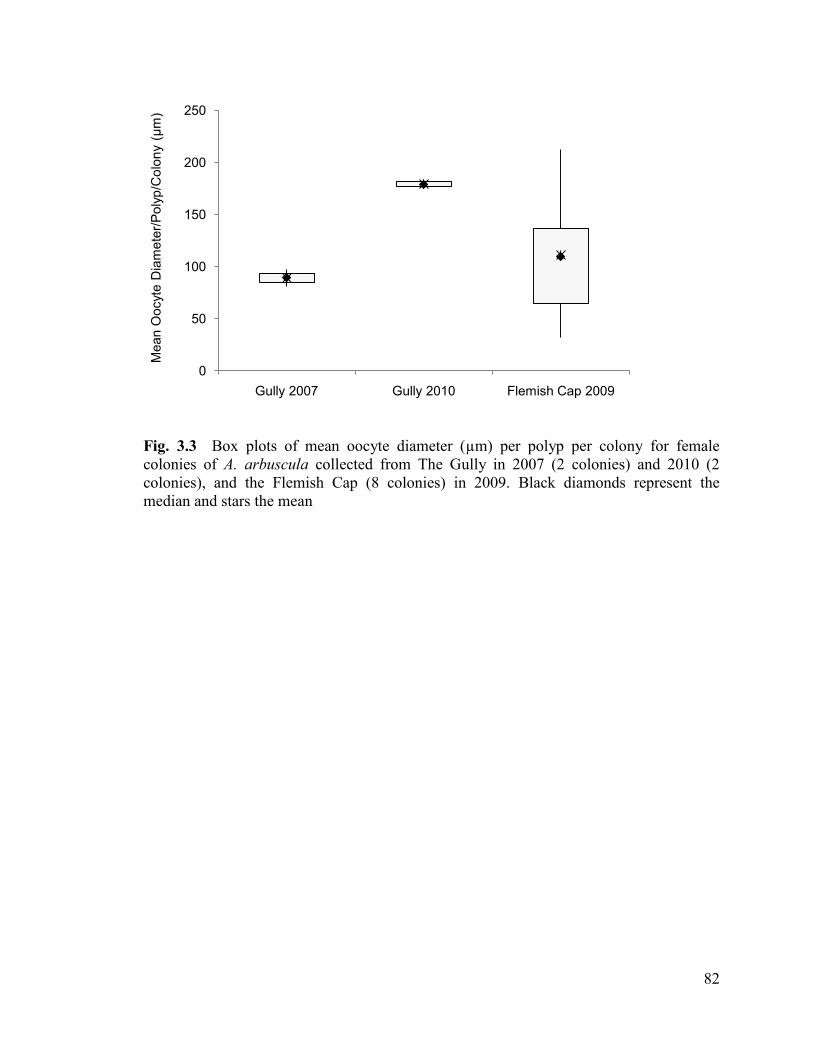
82
Fig. 3.3 Box plots of mean oocyte diameter (µm) per polyp per colony for female
colonies of A. arbuscula collected from The Gully in 2007 (2 colonies) and 2010 (2
colonies), and the Flemish Cap (8 colonies) in 2009. Black diamonds represent the
median and stars the mean
0
50
100
150
200
250
Gully 2007 Gully 2010 Flemish Cap 2009
Mean O
ocyte
Dia
mete
r/P
oly
p/C
olo
ny (
µm
)
83
The mean number of fertile polyps per female colony was high for both The Gully
and Flemish Cap (Table 3.6), and was not significantly different between the two areas
(F(1,11)= 0.233, P= 0.639). Male colonies collected from The Gully had similar mean
fertile and unfertile polyps per colony, whereas the Flemish Cap colonies had a high
mean number of fertile polyps per colony. However, no significant differences were
detected between the mean number of fertile polyps in male colonies between The Gully
and Flemish Cap (One-way ANOVA: F(1,9)= 2.363, P= 0.159).
The oocyte size-frequency distribution of colonies collected from the Flemish Cap
in June displayed a bimodal pattern, with a single large mode of oocytes ≤400 µm in
diameter, and small mode of oocytes ranging from 401 to 750 µm in diameter (Fig. 3.4).
Colonies collected from The Gully in July also displayed a bimodal pattern, with a single
large mode of oocytes ≤400 µm in diameter, and a smaller mode of oocytes ranging in
size from 500 to 650 µm (Fig. 3.4). The frequency of the larger mode of oocytes collected
from The Gully was greater than that of the larger mode from the Flemish Cap, however,
the largest oocyte was from a colony collected from the Flemish Cap.
Male colonies collected from the Flemish Cap in May and June also displayed a
bimodal pattern in their spermatic cyst size-frequency distributions, with one mode of
small (≤100 µm) spermatic cysts and one mode of larger cysts ranging from 101 to 350
µm in May, and 101 to 500 µm in June (Fig. 3.5). In the June samples the single mode of
larger spermatic cysts displayed a prominent right-skewed pattern with larger spermatic
cysts compared to the single large mode in the May samples. The size-frequency
distribution of colonies collected from The Gully in July also displayed a bimodal pattern,
with a large mode of small (≤100 µm) cysts and a small mode of larger cysts ranging
from 150 to 400 µm in diameter (Fig. 3.5). The smaller mode of large cysts had a more
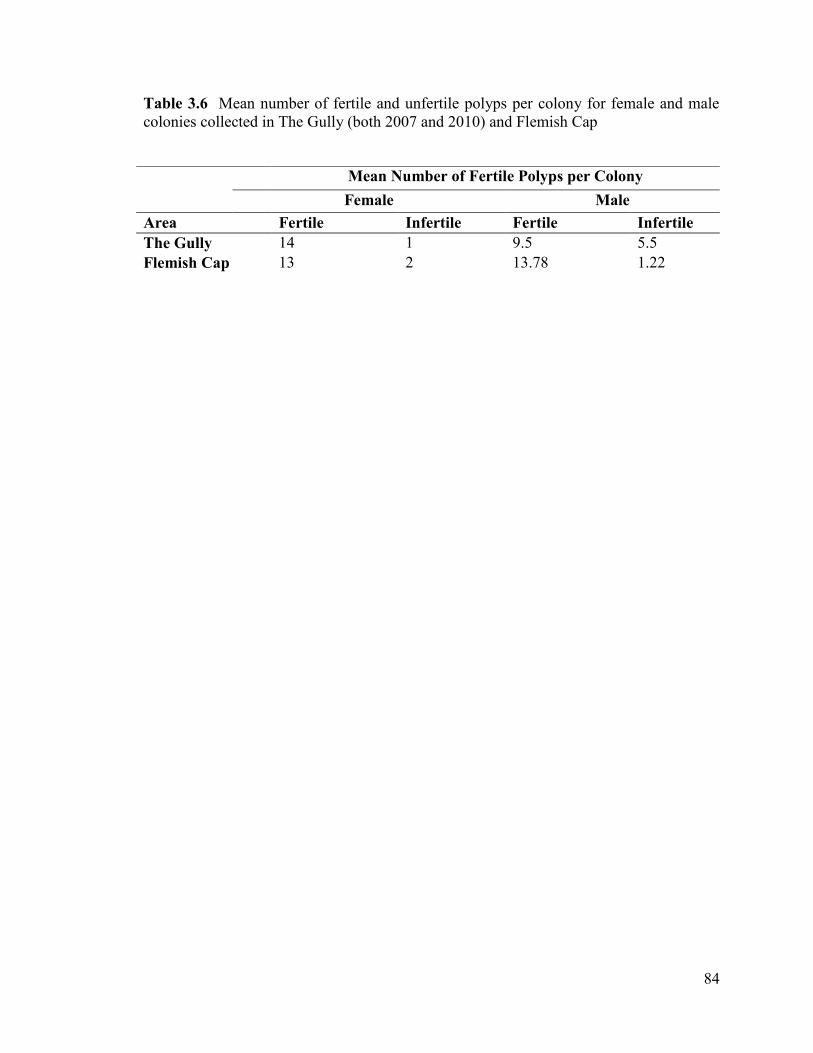
84
Table 3.6 Mean number of fertile and unfertile polyps per colony for female and male
colonies collected in The Gully (both 2007 and 2010) and Flemish Cap
Mean Number of Fertile Polyps per Colony
Female Male
Area Fertile Infertile Fertile Infertile
The Gully 14 1 9.5 5.5
Flemish Cap 13 2 13.78 1.22
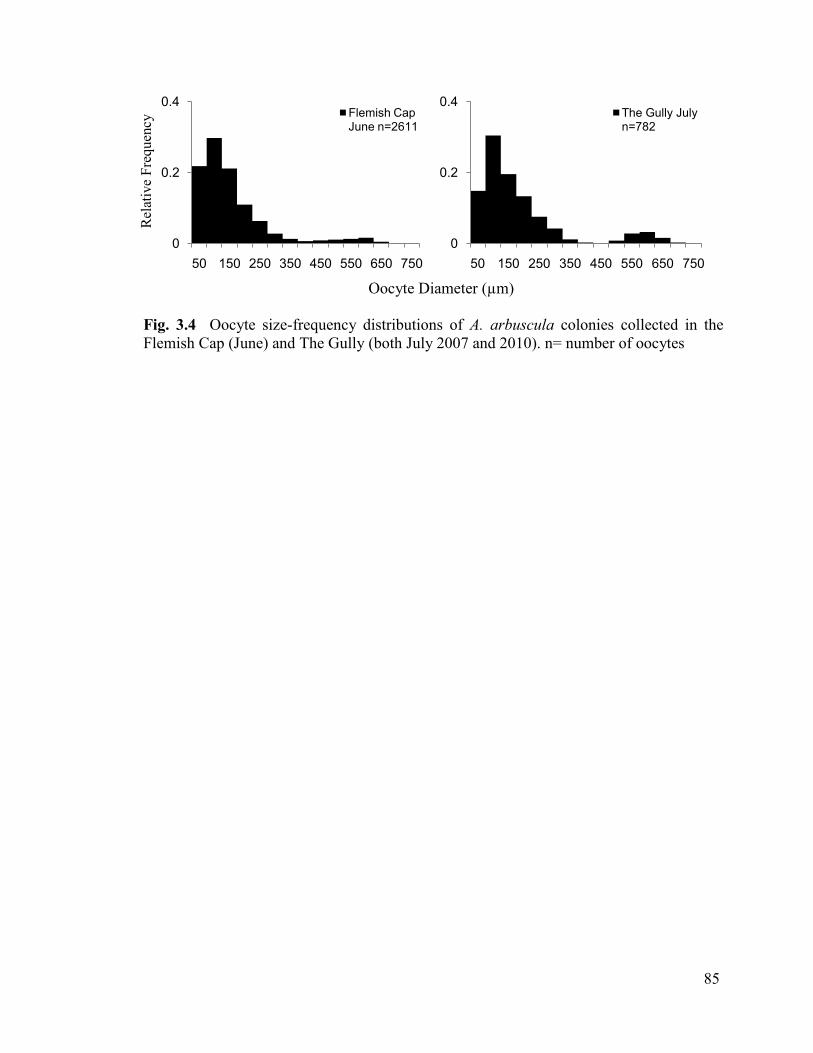
85
Fig. 3.4 Oocyte size-frequency distributions of A. arbuscula colonies collected in the
Flemish Cap (June) and The Gully (both July 2007 and 2010). n= number of oocytes
0
0.2
0.4
50 150 250 350 450 550 650 750
Flemish Cap June n=2611
0
0.2
0.4
50 150 250 350 450 550 650 750
The Gully July n=782
Rel
ativ
e F
req
uen
cy
Oocyte Diameter (µm)
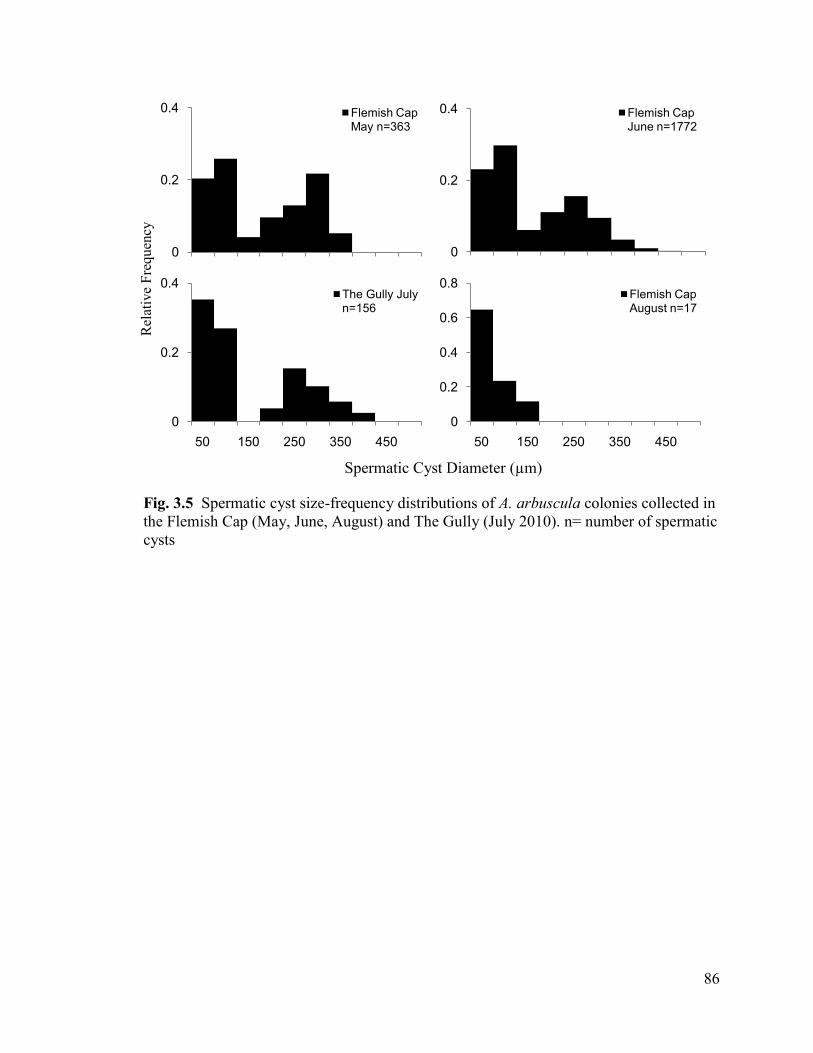
86
Fig. 3.5 Spermatic cyst size-frequency distributions of A. arbuscula colonies collected in
the Flemish Cap (May, June, August) and The Gully (July 2010). n= number of spermatic
cysts
0
0.2
0.4 Flemish Cap May n=363
0
0.2
0.4 Flemish Cap June n=1772
0
0.2
0.4
50 150 250 350 450
The Gully July n=156
0
0.2
0.4
0.6
0.8
50 150 250 350 450
Flemish Cap August n=17
Rel
ativ
e F
req
uen
cy
Spermatic Cyst Diameter (µm)
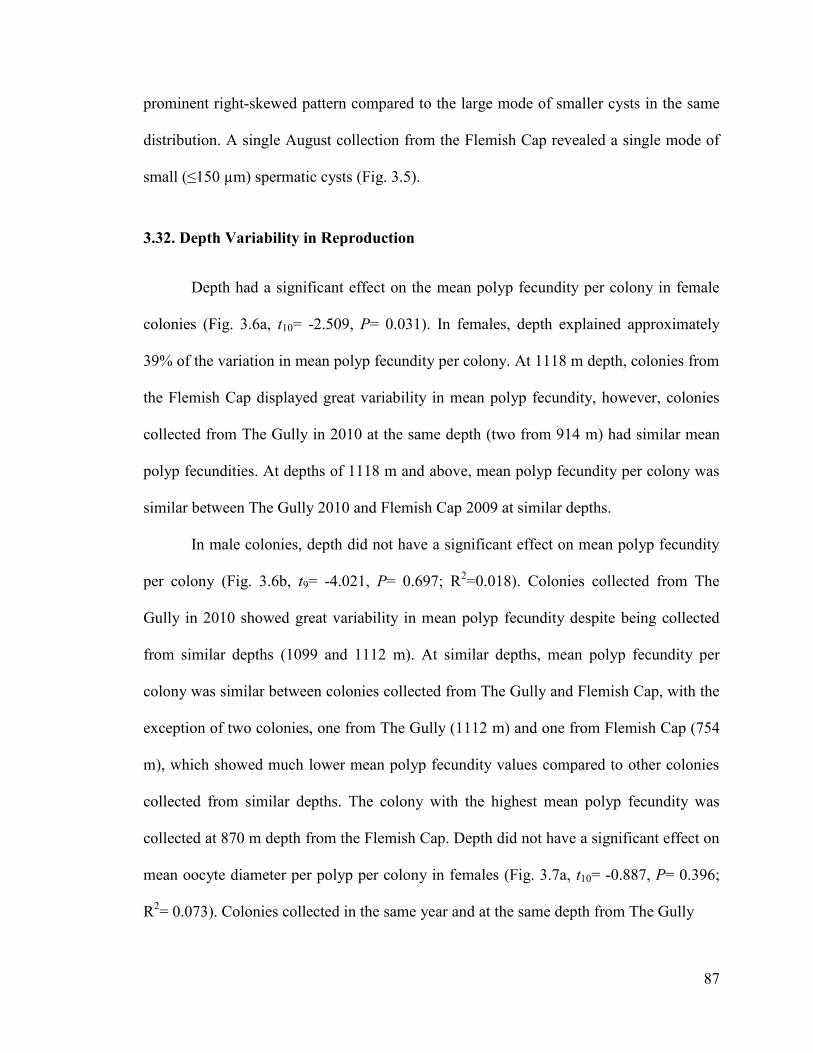
87
prominent right-skewed pattern compared to the large mode of smaller cysts in the same
distribution. A single August collection from the Flemish Cap revealed a single mode of
small (≤150 µm) spermatic cysts (Fig. 3.5).
3.32. Depth Variability in Reproduction
Depth had a significant effect on the mean polyp fecundity per colony in female
colonies (Fig. 3.6a, t10= -2.509, P= 0.031). In females, depth explained approximately
39% of the variation in mean polyp fecundity per colony. At 1118 m depth, colonies from
the Flemish Cap displayed great variability in mean polyp fecundity, however, colonies
collected from The Gully in 2010 at the same depth (two from 914 m) had similar mean
polyp fecundities. At depths of 1118 m and above, mean polyp fecundity per colony was
similar between The Gully 2010 and Flemish Cap 2009 at similar depths.
In male colonies, depth did not have a significant effect on mean polyp fecundity
per colony (Fig. 3.6b, t9= -4.021, P= 0.697; R2=0.018). Colonies collected from The
Gully in 2010 showed great variability in mean polyp fecundity despite being collected
from similar depths (1099 and 1112 m). At similar depths, mean polyp fecundity per
colony was similar between colonies collected from The Gully and Flemish Cap, with the
exception of two colonies, one from The Gully (1112 m) and one from Flemish Cap (754
m), which showed much lower mean polyp fecundity values compared to other colonies
collected from similar depths. The colony with the highest mean polyp fecundity was
collected at 870 m depth from the Flemish Cap. Depth did not have a significant effect on
mean oocyte diameter per polyp per colony in females (Fig. 3.7a, t10= -0.887, P= 0.396;
R2= 0.073). Colonies collected in the same year and at the same depth from The Gully
88
Fig. 3.6 a Log +1 mean polyp fecundity per colony for female A. arbuscula colonies
collected in The Gully in 2007 and 2010, and in the Flemish Cap. b Log +1 mean polyp
fecundity for male A. arbuscula colonies collected in The Gully in 2007 and Flemish Cap
in 2009
y = -0.0014x + 4.3645R² = 0.386P= 0.031
0
0.5
1
1.5
2
2.5
3
3.5
4
4.5
0 500 1000 1500 2000
Log M
ean P
oly
p F
ecundity +
1
Depth (m)
Gully 2007
Gully2010
Flemish Cap 2009
0
0.5
1
1.5
2
2.5
3
3.5
4
500 700 900 1100 1300 1500
Log M
ean P
oly
p F
ecundity +
1
Depth (m)
Gully 2010
Flemish Cap 2009
a
b
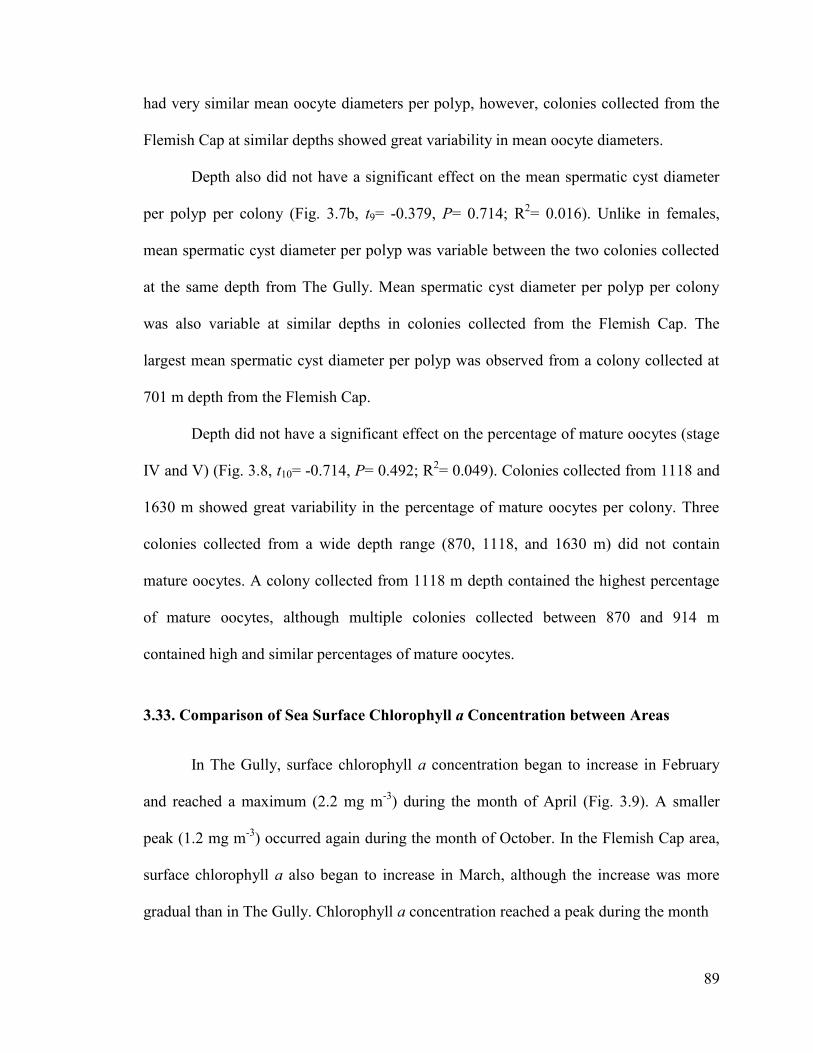
89
had very similar mean oocyte diameters per polyp, however, colonies collected from the
Flemish Cap at similar depths showed great variability in mean oocyte diameters.
Depth also did not have a significant effect on the mean spermatic cyst diameter
per polyp per colony (Fig. 3.7b, t9= -0.379, P= 0.714; R2= 0.016). Unlike in females,
mean spermatic cyst diameter per polyp was variable between the two colonies collected
at the same depth from The Gully. Mean spermatic cyst diameter per polyp per colony
was also variable at similar depths in colonies collected from the Flemish Cap. The
largest mean spermatic cyst diameter per polyp was observed from a colony collected at
701 m depth from the Flemish Cap.
Depth did not have a significant effect on the percentage of mature oocytes (stage
IV and V) (Fig. 3.8, t10= -0.714, P= 0.492; R2= 0.049). Colonies collected from 1118 and
1630 m showed great variability in the percentage of mature oocytes per colony. Three
colonies collected from a wide depth range (870, 1118, and 1630 m) did not contain
mature oocytes. A colony collected from 1118 m depth contained the highest percentage
of mature oocytes, although multiple colonies collected between 870 and 914 m
contained high and similar percentages of mature oocytes.
3.33. Comparison of Sea Surface Chlorophyll a Concentration between Areas
In The Gully, surface chlorophyll a concentration began to increase in February
and reached a maximum (2.2 mg m-3
) during the month of April (Fig. 3.9). A smaller
peak (1.2 mg m-3
) occurred again during the month of October. In the Flemish Cap area,
surface chlorophyll a also began to increase in March, although the increase was more
gradual than in The Gully. Chlorophyll a concentration reached a peak during the month
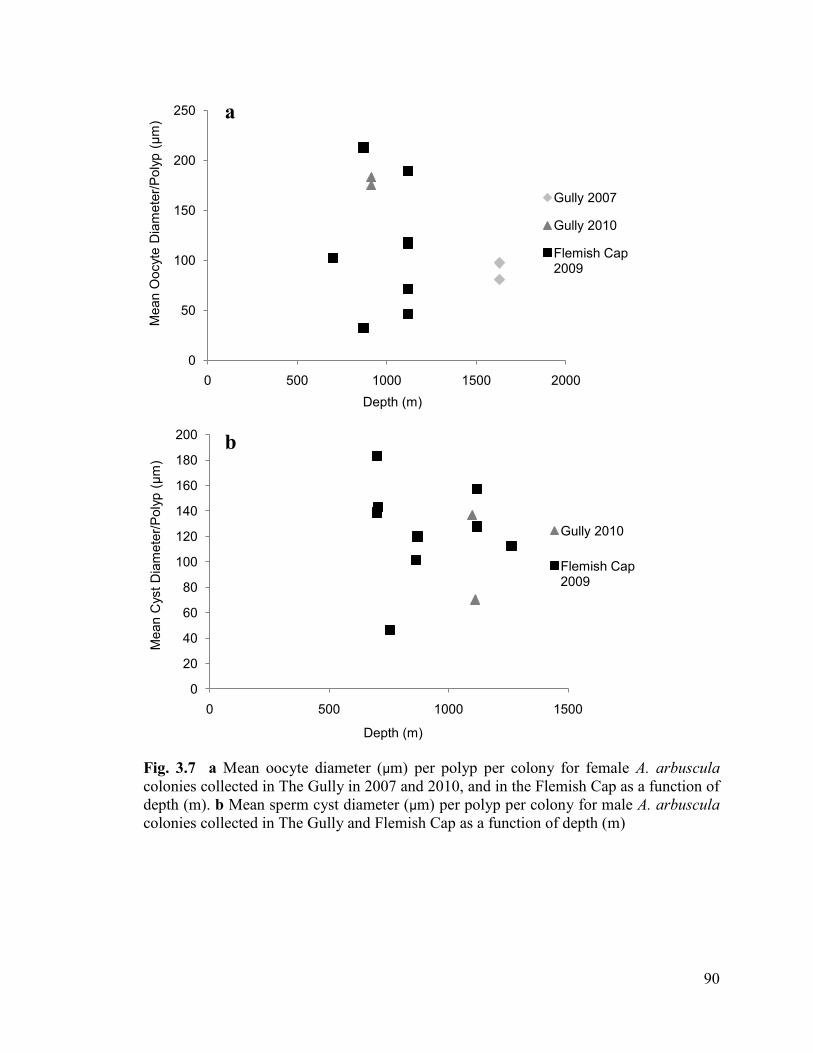
90
Fig. 3.7 a Mean oocyte diameter (µm) per polyp per colony for female A. arbuscula
colonies collected in The Gully in 2007 and 2010, and in the Flemish Cap as a function of
depth (m). b Mean sperm cyst diameter (µm) per polyp per colony for male A. arbuscula
colonies collected in The Gully and Flemish Cap as a function of depth (m)
0
50
100
150
200
250
0 500 1000 1500 2000
Mean O
ocyte
Dia
mete
r/P
oly
p (
µm
)
Depth (m)
Gully 2007
Gully 2010
Flemish Cap 2009
0
20
40
60
80
100
120
140
160
180
200
0 500 1000 1500
Mean C
yst
Dia
mete
r/P
oly
p (
µm
)
Depth (m)
Gully 2010
Flemish Cap 2009
a
b
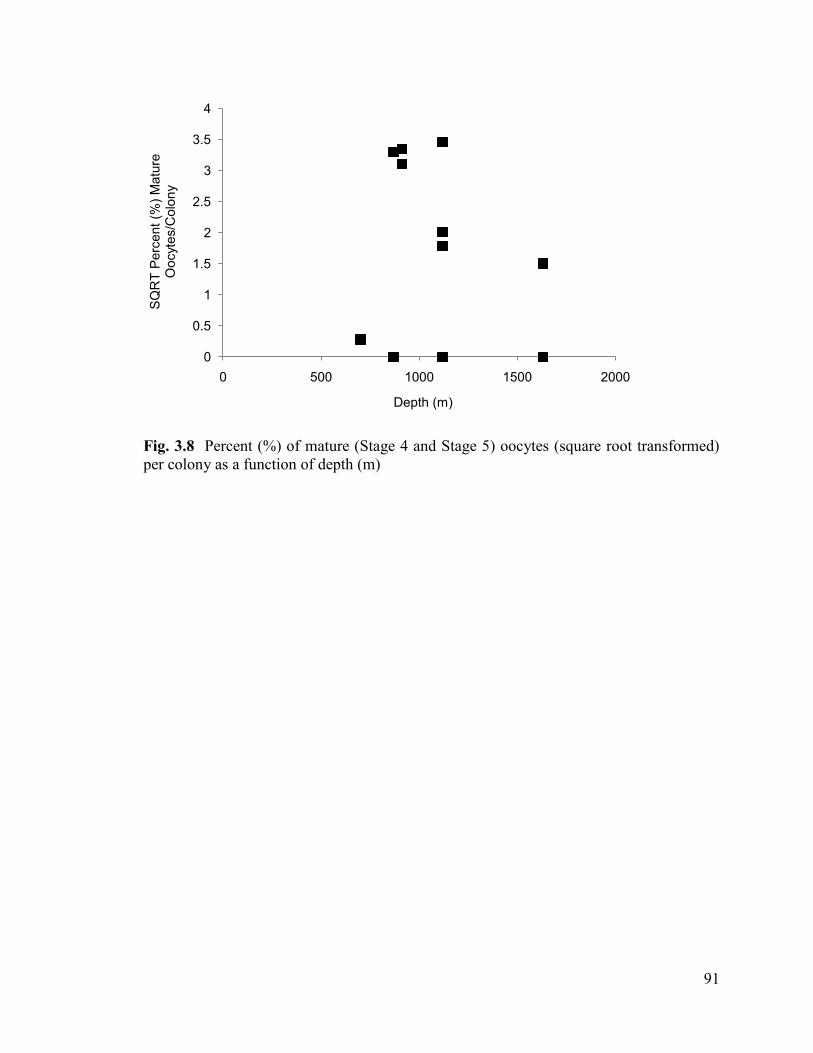
91
Fig. 3.8 Percent (%) of mature (Stage 4 and Stage 5) oocytes (square root transformed)
per colony as a function of depth (m)
0
0.5
1
1.5
2
2.5
3
3.5
4
0 500 1000 1500 2000
SQ
RT
Perc
ent
(%)
Matu
re
Oocyte
s/C
olo
ny
Depth (m)
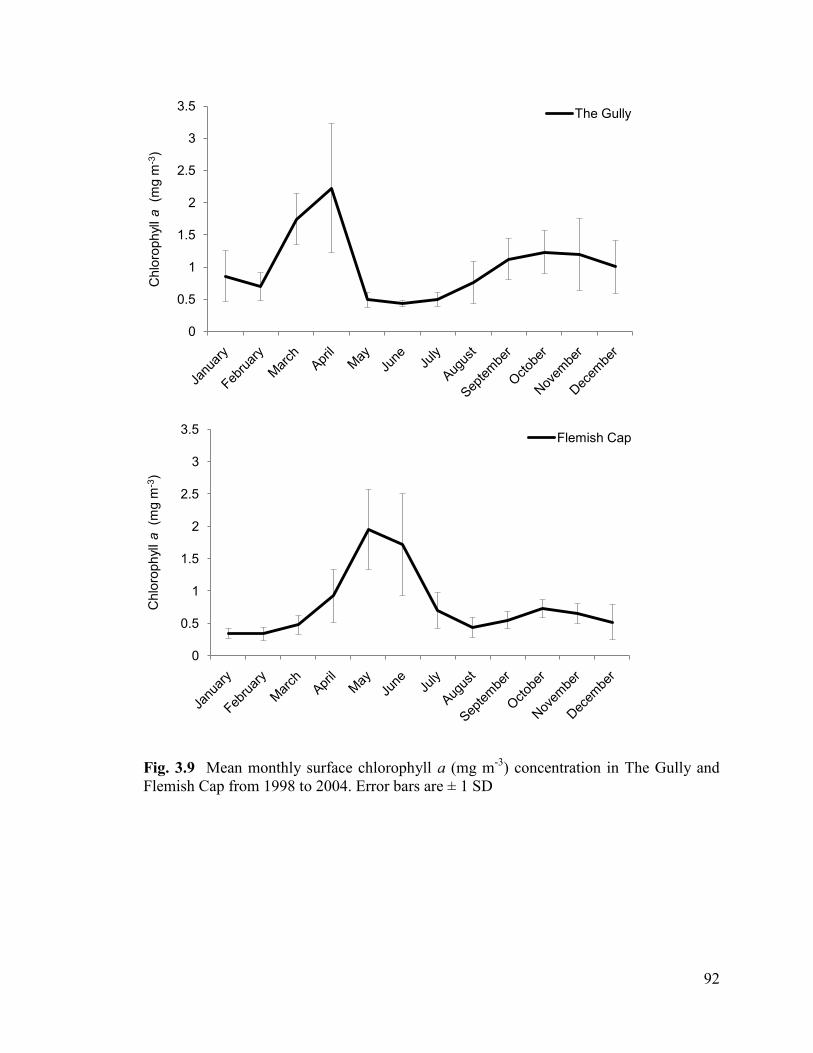
92
Fig. 3.9 Mean monthly surface chlorophyll a (mg m-3
) concentration in The Gully and
Flemish Cap from 1998 to 2004. Error bars are ± 1 SD
0
0.5
1
1.5
2
2.5
3
3.5
Chlo
rophyl
l a
(mg m
-3)
The Gully
0
0.5
1
1.5
2
2.5
3
3.5
Chlo
rophyl
l a
(mg m
-3)
Flemish Cap
93
of May (2.0 mg m-3
), and remained high for the month of June (1.7 mg m-3
). A second
peak (0.7 mg m-3
) occurred during the month of October in this area.
3.4. Discussion and Conclusion
3.41. Spatial Variability in Reproduction
Reproductive characteristics of shallow-water corals, such as the sex ratio, timing
of gametogenesis, the release of gametes or planulae, polyp fecundity, and gamete size
have been shown to vary within the same species located in different areas, and this
variability is most often related to differences in local environmental conditions. The
results of this study did not show any variability in the reproductive characteristics
examined between populations of A. arbuscula from The Gully MPA on the Scotian Shelf
and the Flemish Cap area off Newfoundland, two areas located approximately 1200 km
apart.
In corals, sexuality (i.e. hermaphroditism or gonochorism) is commonly reported
to vary in members of the same genus (see Hartnoll 1977, Soong 1991) located in
different geographic areas, but rarely within the same species (see Benayahu et al. 1990).
In the present study, no variability in the sexuality of A. arbuscula was found between
colonies from The Gully and the Flemish Cap, and colonies from both areas were
gonochoristic at both the polyp and colony level. It is possible that corals which have
shown different patterns of sexuality in different locations are sequential hermaphrodites
that appear gonochoristic (Harrison and Wallace 1990). With the large total sample size
and wide size range of the colonies examined, sequential hermaphroditism is unlikely in
A. arbuscula from these two areas.
94
The 1:1 sex ratio observed in the Flemish Cap population of A. arbuscula
represents the stable sex ratio of sessile gonochoristic organisms (Ribes et al. 2007) and is
common among both tropical and deep-water octocorals (Brazeau and Lasker 1990;
Kruger et al. 1998; Ben-Yosef and Benayahu 1999; Orejas et al. 2002; Santengelo et al.
2003; Gutiérrez-Rodríguez and Lasker 2004; Hwang and Song 2007; Orejas et al. 2007;
Edwards and Moore 2008; Pires et al. 2009). Despite the inability to calculate deviance
from parity in the sex ratio of The Gully population, the collections made in this area in
2010 (2 females and 2 males) suggest that the sex ratio is also not different from 1:1.
Tsounis et al. (2006) suggested that differences in the sex ratio of Corallium rubrum
between Costa Brava, Spain (1:1) and the Calafuria coast, Italy (1:1.37, from Santangelo
et al. 2003) may be explained by different population densities and thus larval recruitment
strategies between the areas. Based on this hypothesis, population density and larval
recruitment may be similar between populations from The Gully and Flemish Cap.
In the Scleractinia, both brooding and broadcast spawning have been documented
within the same population and in distantly-located populations of the same species
(Harrison and Wallace 1990; Sakai 1997; Nishikawa and Sakai 2003). However, Harrison
and Wallace (1990) suggested that some reports of both brooding and broadcast spawning
within a species may be incorrect and have likely resulted from taxonomic
misidentification, abnormal conditions, or misinterpretation. Ward (1992) reported both
asexual brooding via parthenogenesis and broadcast spawning in individuals of
Pocillopora damicornis in Western Australia, but noted that brooding was more prevalent
than broadcasting on reefs that experienced greater disturbance. Alternatively, Glynn et
al. (1991) found that this species only broadcasts gametes in the Eastern Pacific. Both
brooding and broadcast spawning have been reported in deep-water corals (Cordes et al.
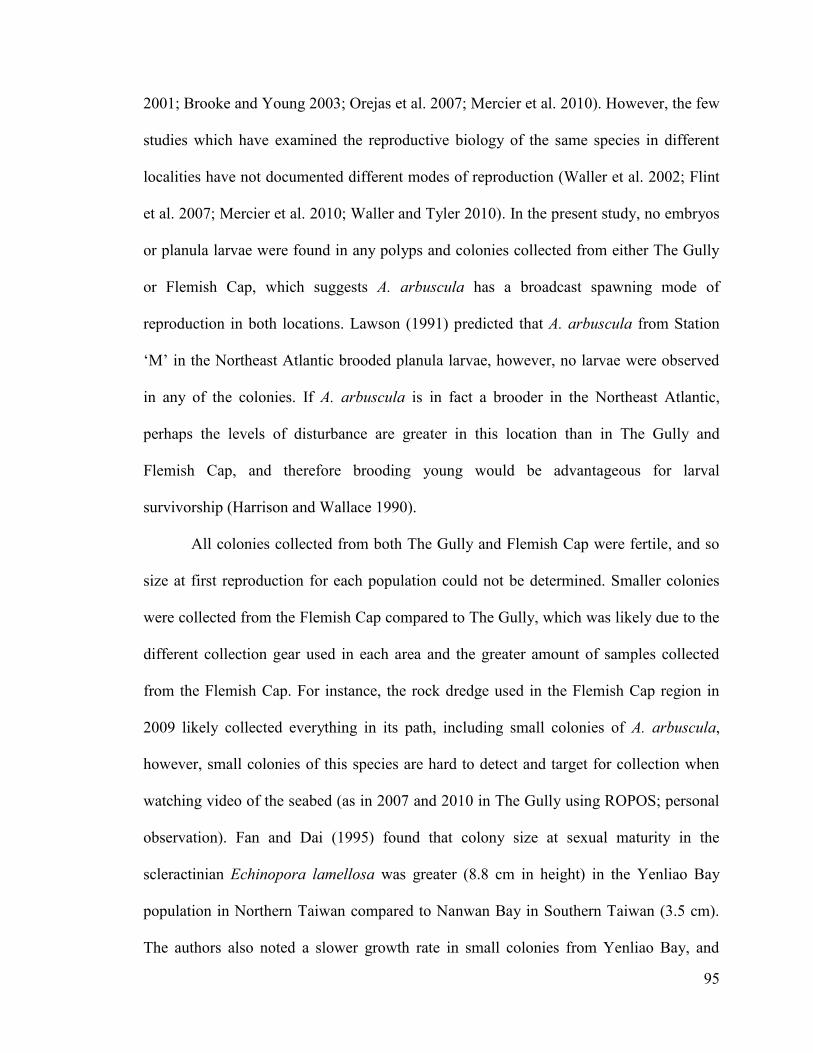
95
2001; Brooke and Young 2003; Orejas et al. 2007; Mercier et al. 2010). However, the few
studies which have examined the reproductive biology of the same species in different
localities have not documented different modes of reproduction (Waller et al. 2002; Flint
et al. 2007; Mercier et al. 2010; Waller and Tyler 2010). In the present study, no embryos
or planula larvae were found in any polyps and colonies collected from either The Gully
or Flemish Cap, which suggests A. arbuscula has a broadcast spawning mode of
reproduction in both locations. Lawson (1991) predicted that A. arbuscula from Station
„M‟ in the Northeast Atlantic brooded planula larvae, however, no larvae were observed
in any of the colonies. If A. arbuscula is in fact a brooder in the Northeast Atlantic,
perhaps the levels of disturbance are greater in this location than in The Gully and
Flemish Cap, and therefore brooding young would be advantageous for larval
survivorship (Harrison and Wallace 1990).
All colonies collected from both The Gully and Flemish Cap were fertile, and so
size at first reproduction for each population could not be determined. Smaller colonies
were collected from the Flemish Cap compared to The Gully, which was likely due to the
different collection gear used in each area and the greater amount of samples collected
from the Flemish Cap. For instance, the rock dredge used in the Flemish Cap region in
2009 likely collected everything in its path, including small colonies of A. arbuscula,
however, small colonies of this species are hard to detect and target for collection when
watching video of the seabed (as in 2007 and 2010 in The Gully using ROPOS; personal
observation). Fan and Dai (1995) found that colony size at sexual maturity in the
scleractinian Echinopora lamellosa was greater (8.8 cm in height) in the Yenliao Bay
population in Northern Taiwan compared to Nanwan Bay in Southern Taiwan (3.5 cm).
The authors also noted a slower growth rate in small colonies from Yenliao Bay, and
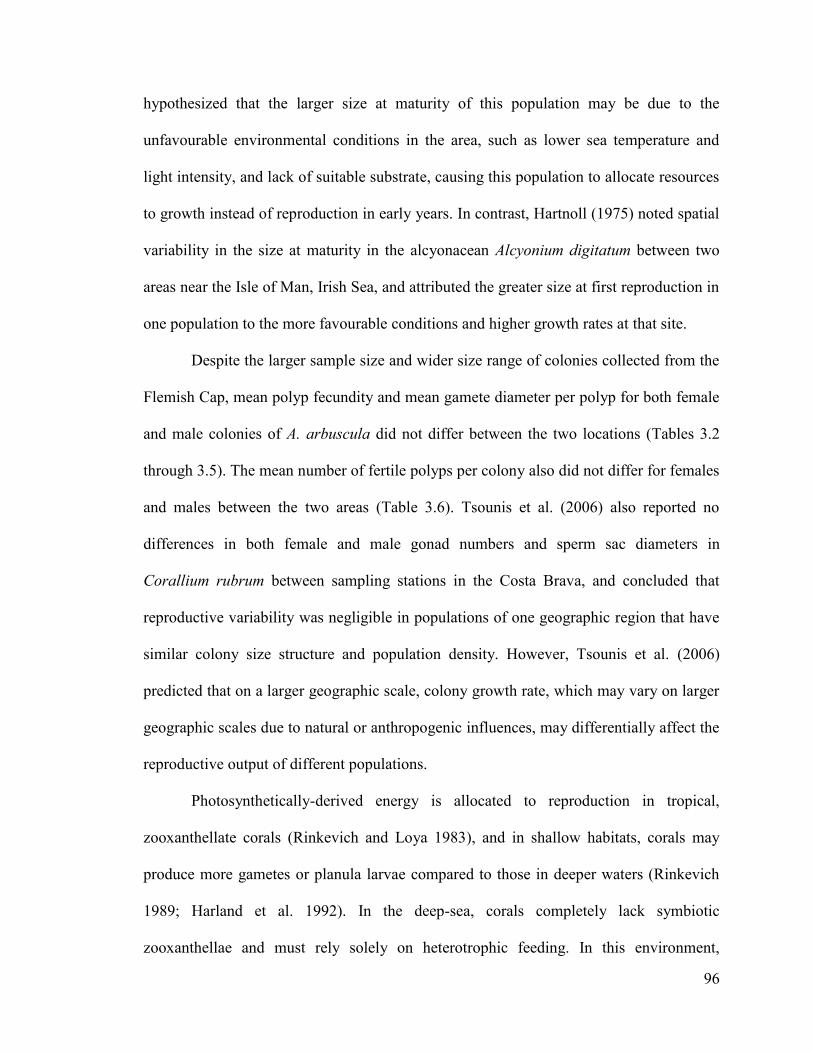
96
hypothesized that the larger size at maturity of this population may be due to the
unfavourable environmental conditions in the area, such as lower sea temperature and
light intensity, and lack of suitable substrate, causing this population to allocate resources
to growth instead of reproduction in early years. In contrast, Hartnoll (1975) noted spatial
variability in the size at maturity in the alcyonacean Alcyonium digitatum between two
areas near the Isle of Man, Irish Sea, and attributed the greater size at first reproduction in
one population to the more favourable conditions and higher growth rates at that site.
Despite the larger sample size and wider size range of colonies collected from the
Flemish Cap, mean polyp fecundity and mean gamete diameter per polyp for both female
and male colonies of A. arbuscula did not differ between the two locations (Tables 3.2
through 3.5). The mean number of fertile polyps per colony also did not differ for females
and males between the two areas (Table 3.6). Tsounis et al. (2006) also reported no
differences in both female and male gonad numbers and sperm sac diameters in
Corallium rubrum between sampling stations in the Costa Brava, and concluded that
reproductive variability was negligible in populations of one geographic region that have
similar colony size structure and population density. However, Tsounis et al. (2006)
predicted that on a larger geographic scale, colony growth rate, which may vary on larger
geographic scales due to natural or anthropogenic influences, may differentially affect the
reproductive output of different populations.
Photosynthetically-derived energy is allocated to reproduction in tropical,
zooxanthellate corals (Rinkevich and Loya 1983), and in shallow habitats, corals may
produce more gametes or planula larvae compared to those in deeper waters (Rinkevich
1989; Harland et al. 1992). In the deep-sea, corals completely lack symbiotic
zooxanthellae and must rely solely on heterotrophic feeding. In this environment,
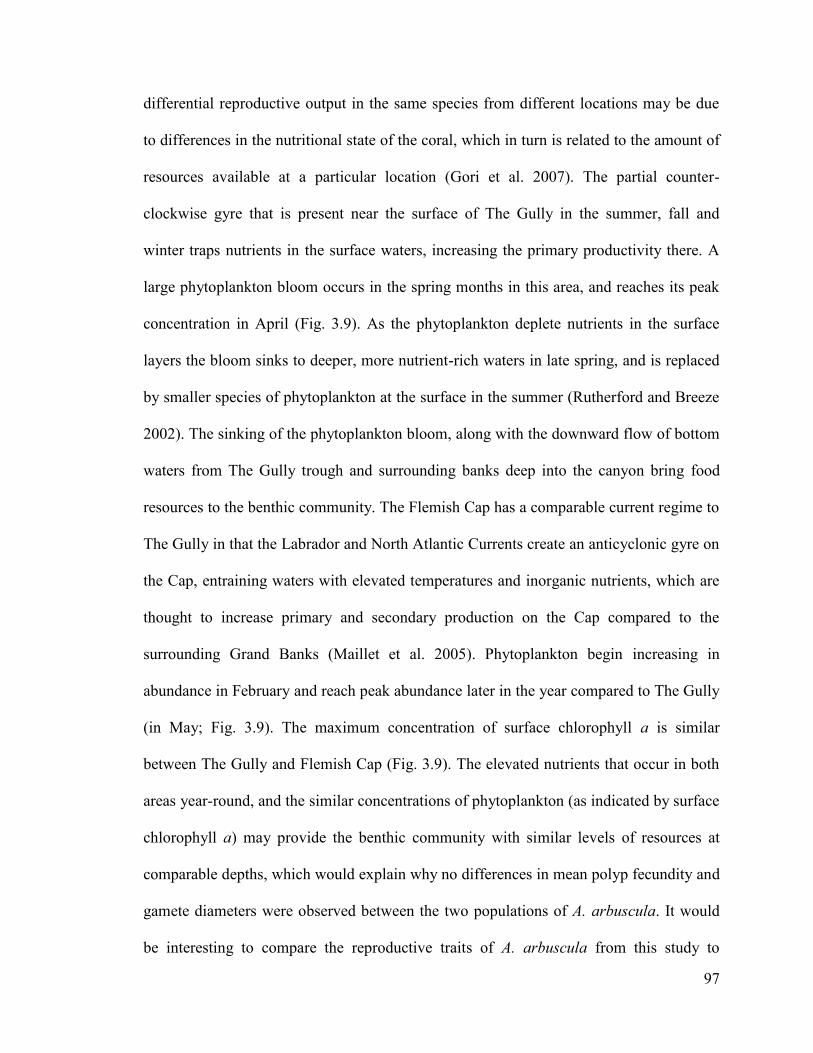
97
differential reproductive output in the same species from different locations may be due
to differences in the nutritional state of the coral, which in turn is related to the amount of
resources available at a particular location (Gori et al. 2007). The partial counter-
clockwise gyre that is present near the surface of The Gully in the summer, fall and
winter traps nutrients in the surface waters, increasing the primary productivity there. A
large phytoplankton bloom occurs in the spring months in this area, and reaches its peak
concentration in April (Fig. 3.9). As the phytoplankton deplete nutrients in the surface
layers the bloom sinks to deeper, more nutrient-rich waters in late spring, and is replaced
by smaller species of phytoplankton at the surface in the summer (Rutherford and Breeze
2002). The sinking of the phytoplankton bloom, along with the downward flow of bottom
waters from The Gully trough and surrounding banks deep into the canyon bring food
resources to the benthic community. The Flemish Cap has a comparable current regime to
The Gully in that the Labrador and North Atlantic Currents create an anticyclonic gyre on
the Cap, entraining waters with elevated temperatures and inorganic nutrients, which are
thought to increase primary and secondary production on the Cap compared to the
surrounding Grand Banks (Maillet et al. 2005). Phytoplankton begin increasing in
abundance in February and reach peak abundance later in the year compared to The Gully
(in May; Fig. 3.9). The maximum concentration of surface chlorophyll a is similar
between The Gully and Flemish Cap (Fig. 3.9). The elevated nutrients that occur in both
areas year-round, and the similar concentrations of phytoplankton (as indicated by surface
chlorophyll a) may provide the benthic community with similar levels of resources at
comparable depths, which would explain why no differences in mean polyp fecundity and
gamete diameters were observed between the two populations of A. arbuscula. It would
be interesting to compare the reproductive traits of A. arbuscula from this study to
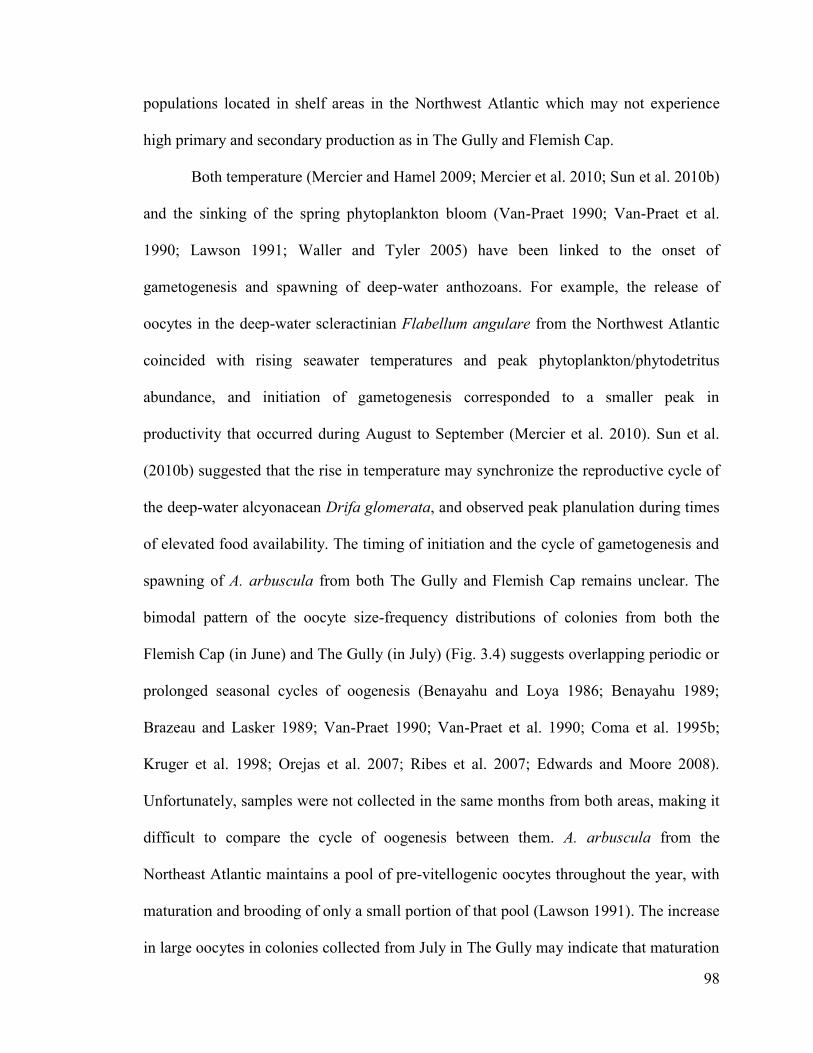
98
populations located in shelf areas in the Northwest Atlantic which may not experience
high primary and secondary production as in The Gully and Flemish Cap.
Both temperature (Mercier and Hamel 2009; Mercier et al. 2010; Sun et al. 2010b)
and the sinking of the spring phytoplankton bloom (Van-Praet 1990; Van-Praet et al.
1990; Lawson 1991; Waller and Tyler 2005) have been linked to the onset of
gametogenesis and spawning of deep-water anthozoans. For example, the release of
oocytes in the deep-water scleractinian Flabellum angulare from the Northwest Atlantic
coincided with rising seawater temperatures and peak phytoplankton/phytodetritus
abundance, and initiation of gametogenesis corresponded to a smaller peak in
productivity that occurred during August to September (Mercier et al. 2010). Sun et al.
(2010b) suggested that the rise in temperature may synchronize the reproductive cycle of
the deep-water alcyonacean Drifa glomerata, and observed peak planulation during times
of elevated food availability. The timing of initiation and the cycle of gametogenesis and
spawning of A. arbuscula from both The Gully and Flemish Cap remains unclear. The
bimodal pattern of the oocyte size-frequency distributions of colonies from both the
Flemish Cap (in June) and The Gully (in July) (Fig. 3.4) suggests overlapping periodic or
prolonged seasonal cycles of oogenesis (Benayahu and Loya 1986; Benayahu 1989;
Brazeau and Lasker 1989; Van-Praet 1990; Van-Praet et al. 1990; Coma et al. 1995b;
Kruger et al. 1998; Orejas et al. 2007; Ribes et al. 2007; Edwards and Moore 2008).
Unfortunately, samples were not collected in the same months from both areas, making it
difficult to compare the cycle of oogenesis between them. A. arbuscula from the
Northeast Atlantic maintains a pool of pre-vitellogenic oocytes throughout the year, with
maturation and brooding of only a small portion of that pool (Lawson 1991). The increase
in large oocytes in colonies collected from July in The Gully may indicate that maturation
99
of the second mode has occurred from June to July. The spring phytoplankton bloom
occurs later in the Flemish Cap area than in The Gully, and would likely reach the bottom
in the summer months as opposed to late spring in The Gully (Rutherford and Breeze
2002). No female colonies were collected from this area in July or August, and so it is
unknown whether the larger cohort is still present during those months (absence may
indicate a spawning event).
Male colonies collected during May and June from the Flemish Cap, and from
The Gully in July also displayed a bimodal pattern. The single cohort of spermatic cysts
in the male colony collected in August from the Flemish Cap suggests that a spawning
event may have occurred between June and August, which would approximately coincide
with when the phytoplankton bloom reaches the seabed. However, this colony is small (3
cm in height), which may also explain why the second mode of larger cysts was absent
from the colony (see Chapter 2).
Only one mature spermatic cyst with spermatozoa was observed in a colony
collected in May (from Chapter 2), not in later months, which may indicate that spawning
occurred between May and June. However, maturation and spawning of spermatic cysts
may have occurred rapidly (Harrison and Wallace 1990) in A. arbuscula, which could
explain why no mature cysts were observed in colonies collected past May.
Without laboratory experiments it is impossible to determine the effects of
temperature on the reproductive traits and timing of reproduction in the two A. arbuscula
populations. Bottom temperature close to the point of collection was similar for colonies
collected from The Gully and Flemish Cap (Table 3.1), however, temperatures were
slightly higher in The Gully overall, even at deeper depths. Consistent, monthly sampling
coupled with laboratory experiments on live colonies is required to determine the cycle of
100
gametogenesis and spawning of A. arbuscula, and whether these cycles are influenced by
environmental factors such as temperature.
3.42. Depth Variability in Reproduction
Approximately 1% of open ocean primary production reaches the seabed between
4000 and 5000 m depth, compared to the nearly 50% of coastal production that reaches
the seabed in coastal/continental shelf areas (Walsh et al. 1981). As corals experience
trade-offs between reproduction and growth/regeneration (Rinkevich 1996), it is expected
that as resources decrease with increasing depth, the reproductive output of a species may
also decrease. Decreasing fecundity with increasing depth has been noted in several
studies of deep-water corals (Waller et al. 2002; Flint et al. 2007; Mercier et al. 2010;
Waller and Tyler 2010), however, comparisons were made not only between different
depths, but also between different geographic locations. For instance, Flint et al. (2007)
noted that the scleractinian Fungiacyanthus marenzelleri from Station „M‟ in the
Northeast Pacific at 4100 m depth had a mean potential fecundity approximately half of
that noted in the same species from 2100 m depth from Station „M‟ in the Northeast
Atlantic (Waller et al. 2002). Flint et al. (2007) hypothesized that the lower fecundity at
4100 m may have been caused by reduced food availability at the greater depth. However,
the spatial scale at which these two studies were conducted was large, and the different
fecundity values may be caused by different environmental characteristics experienced at
each site.
In the present study, polyp fecundity showed a significant decreasing trend with
increasing depth in female colonies of A. arbuscula, but not in male colonies (Fig. 3.6a,
b). A colony collected from The Gully in 2007 at 1861 m depth did not contain any
101
gametes, which suggests a recent spawning event may have occurred, or that
gametogenesis was not occurring during the time of collection at these depths. Gamete
diameters of both sexes, and the percentage of mature oocytes (Fig. 3.8) also did not show
trends with depth (Fig. 3.7a, b). The differential response of polyp fecundity between the
sexes to changes in depth may be explained by different energy requirements to produce
oocytes and sperm. For instance, the production of lipid-rich oocytes is thought to be
more energetically costly than the production of sperm in marine invertebrates (Hughes
and Hall 1996; Ramirez Llodra 2002). Thus, females may be more sensitive to decreasing
food availability with depth than males.
Within The Gully, female colonies collected in 2007 and 2010 displayed
significant differences in mean polyp fecundity and oocyte diameters (Fig. 3.2 and 3.3).
However, colonies collected in 2007 were collected from deeper depths than those in
2010 (Fig. 3.6a), which may be responsible for the lower fecundity and smaller oocyte
diameters compared to 2010.
Variability in mean polyp fecundity and gamete diameters in colonies collected at
similar depths from the Flemish Cap may be explained by variability in the size of the
colonies. Colony height explained 42% and 12% of the variability in mean polyp
fecundity in females and males, respectively in this species (Chapter 2). Height was
similar between colonies collected in the same year from The Gully (5.0 and 6.7 from
2007, and 11.5 and 12.5 cm in 2010), whereas height was more variable between colonies
collected from the Flemish Cap at 1118 m (ranging from 4.3 to 15.5 cm). The heights of
two male colonies collected from The Gully which displayed variability in mean polyp
fecundity were 7.5 and 10.0 cm. For where data existed, there was little variation in mean
polyp fecundity and oocyte diameters per polyp in females between The Gully and
102
Flemish Cap collected from similar depths (Fig. 3.6a and 3.7a), which further emphasizes
no differences in the reproductive biology between the two populations of A. arbuscula at
these depths.
3.43. Conclusion
This study did not find any spatial variability in the reproductive characteristics
between The Gully and Flemish Cap populations of the deep-water gorgonian A.
arbuscula. Similar environmental conditions between The Gully and Flemish Cap may be
responsible for the similar reproductive traits between the two populations. However, this
study does not suggest that the reproductive biology of this species is the same in all
geographic locations. Future studies should examine the reproductive biology of this
species on shelf areas in the Northwest Atlantic which are thought to experience different
levels of inorganic nutrients and thus phytoplankton levels than The Gully and Flemish
Cap, as the availability of resources may significantly impact female reproductive output
(as suggested in the depth analysis).
The significant, decreasing relationship between polyp fecundity and depth in
female colonies suggests that this species may be more vulnerable to destructive fishing
practices in shallower waters. However, the relationship between depth and reproduction
must be further examined with more samples collected over a large depth gradient. With
the depletion of shallow fish stocks and increasing fishing effort being displaced into
deeper waters, bottom fishing may be removing colonies that have the highest fecundities
and are thus contributing the most to the population. Thus, this species may have a
reduced capacity to re-populate shallow populations removed by fishing gear.
103
Chapter 4. Conclusion
4.1. General Conclusion
The seemingly stable environment of the deep-sea encouraged many hypotheses
regarding the life-history characteristics of its inhabitants. One theory predicted that the
deep-sea benthos would exhibit life history traits closely resembling K-selected species
from shallow waters (Young 2003). However, life history traits of deep-sea organisms are
diverse and span across the r/K selection continuum; some species show long life
expectancy, low adult mortality, and low rates of fecundity and recruitment, or high rates
of growth, high fecundity and recruitment, and short life spans, while others display
attributes characteristic of both r- and K-selection (Gage 1994; Levin et al. 1994;
Eckelbarger and Watling 1995). However, where comparisons of closely related taxa are
made, those found in the deeper environment tend to have lower fecundities, slower rates
of growth and longer life spans (Gage and Tyler 1991; Gage 1994), and the majority of
organisms are reported to have asynchronous or continuous cycles of reproduction (Tyler
1988; Young 2003), suggesting adaptations to the deep-sea environment.
Since the formulation of Orton‟s and Thorson‟s Rules, both of which predicted
uniformity of reproduction in the deep-sea benthos, many studies have documented a
diversity of reproductive strategies in the deep-sea, as varied as those observed in shallow
waters. Also surprising, was the discovery that the reproductive strategies (e.g., mode of
sexual reproduction, gonochorism or hermaphroditism) observed in shallow-water
organisms were also employed by deep-water species. As in other deep-sea organisms, no
one reproductive strategy is characteristic of deep-water anthozoans; combinations of
gonochorism, hermaphroditism, planktotrophy, lecithotrophy, brooding, and broadcast
104
spawning have all been documented in this group. However, it remains unknown to
which degree phylogeny shapes the reproductive strategies of these organisms. For
instance, the mode of reproduction (i.e. brooding or broadcast spawning) may vary
among members of the same order, as in the Gorgonacea (Table 2.1), however all
members of the Order Pennatulacea from both shallow and deep habitats, broadcast
spawn their gametes. Within some species, the mode of reproduction has been shown to
vary in different locations (Harrison and Wallace 1990), indicating adaptations to local
environmental conditions. Characteristics of the reproductive biology of the deep-water
gorgonian A. arbuscula examined in this thesis are similar to those of other deep-water
(see Table 2.1) and shallow, zooxanthellate octocorals. Like all other deep-water
octocorals and the majority of deep-water scleractinians studied to date, A. arbuscula has
separate male and female colonies. Similarly, sex ratios not different from 1:1, and
probable broadcast spawning have also been reported in other deep-water octocorals. The
relatively high polyp fecundity and small size (<3 cm) at first reproduction are indicative
of opportunistic r-selected species, however, this species has a slow growth rate
(Sherwood and Edinger 2009) and likely long life span, characteristic of K-selection.
Thus, the results of this thesis show that certain life history attributes of A. arbuscula are
indicative of both r- and K-selected organisms, a feature also observed in some shallow-
water gorgonians (Grigg 1977). However, the decreasing pattern of polyp fecundity with
increasing depth in females suggests constraints on reproduction due to decreased
resource availability experienced with increasing depth.
The paucity of information on the life history characteristics of deep-water
gorgonians in this region calls for an increase in their research, however, care must be
taken when sampling polyps from colonies. In order to avoid removing entire colonies
105
from the seabed, studies of both shallow- (Ribes et al. 2007) and deep-water (personal
observation) gorgonians attempt to remove only a portion of the colony, often the distal
tips of branches. Other methods of collection include trawling, however, the majority of
branching corals become fragmented from the gear. Many habitat-forming branching
corals are abundant in certain areas of the Northwest Atlantic, including Paragorgia
arborea and Primnoa resedaeformis. These species are included by NAFO as indicators
and key components of vulnerable marine ecosystems, yet there is little information on
their reproductive biology. The depth range of P. arborea and P. resedaeformis is
relatively shallow, ranging from 200 to 1300 m and 150 to 1150 m for each species,
respectively (Kenchington et al. 2009), and consequently, both have been caught as
bycatch by deep-water fisheries (Breeze et al. 1997; Edinger et al. 2007). I suggest that
future studies on gorgonian reproduction should focus on poorly known species such as
P. arborea and P. resedaeformis, and when possible (i.e. using ROVs for collection), test
for differences in fecundity along branches and between branch orders. Comparisons
between the different colony morphologies (fan-shaped P. arborea colonies versus bushy
colonies of A. arbuscula and P. resedaeformis) may provide clues as to whether the
pattern of intra-colony variation in fecundity observed in A. arbuscula is due to colony
morphology or represents an adaptation to the deep-sea environment that is present in
some deep-water gorgonians. If only fragments of these corals are analyzed, care must be
taken when making inferences of whole colony fecundity.
The biggest limitation to this study was the small temporal resolution of the
collections. Samples were collected in the late spring/summer months, which made it
impossible to fully describe the cycle of gametogenesis, and to predict when this species
releases its gametes. Also, samples were not collected during the same months from both
106
The Gully and Flemish Cap, making it difficult to compare certain aspects of A.
arbuscula‟s reproductive biology between the areas. Often, the cost of conducting
research cruises is expensive, making it difficult to conduct multiple surveys throughout
the year. Also, the majority of cruises in Atlantic Canada only operate in the summer
months when the weather conditions permit the usage of ROVs and other benthic survey
equipment. In Atlantic Canada, benthic trawl surveys are conducted outside of the
summer months (usually in March and October), and studies which have successfully
collected deep-water corals during these surveys (see Mercier et al. 2010; Sun et al.
2010b) collected species that may not be as susceptible to damage from the equipment
(e.g. soft corals and scleractinian cup corals). In the present study, some A. arbuscula
colonies were collected via trawling in March, however, the samples were too damaged to
examine using histology. With all the logistical difficulties in collecting organisms from
this environment, any collections that can be made, and information that can be acquired
from those collections, will greatly contribute to the overall knowledge of these
organisms.
Overall, the results of this study suggest that A. arbuscula has high polyp
fecundity compared to other deep-water gorgonians, and may have the potential to rapidly
re-colonize an area after disturbance via larval dispersal. Currently it remains unknown
whether colonies of A. arbuscula reproduce via asexual reproduction, but this could
represent a means of local recovery from anthropogenic disturbance. Trawling has been
shown to damage colonies of the deep-water reef forming coral Lophelia pertusa, and
fragment them down to a size that is no longer capable of reproducing sexually, but is
able to re-populate via asexual fragmentation (Le Goff-Vitry and Rogers 2005; Waller
and Tyler 2005). As colonies of A. arbuscula are small and somewhat flexible, trawling is
107
likely to affect them differently than reef-building species, by completely removing them
from their habitat or burying them under sediment, instead of creating multiple fragments
that are able to regenerate whole colonies.
It is not known how far larvae of A. arbuscula can disperse, and whether
populations of this species are connected via larval dispersal. Investigation into the
genetic connectivity between populations may provide insight into the recoverability of
populations of A. arbuscula from anthropogenic events. For instance, if genetic exchange
exists between populations, then loss of some populations may not compromise the
overall genetic diversity of the species (Le Goff-Vitry et al. 2004). Nonetheless, recent
studies have shown high levels of inbreeding within subpopulations of other deep-water
corals (Le Goff-Vitry et al. 2004; Baco and Shank 2005; Le Goff-Vitry and Rogers 2005),
suggesting the prevalence of self-recruitment and restricted gene flow over connectivity.
The gyre circulation that exists in both The Gully and Flemish Cap may help retain larvae
and prevent dispersal to other areas, promoting self-sustaining populations of A.
arbuscula. I suggest that future studies on A. arbuscula and other deep-water corals
should examine the dispersal capabilities, population structure, and level of differentiation
between populations in order to create effective policy for their conservation
management.
108
Reference List
Andrews AH, Cordes EE, Mahoney MM, Munk K, Coale KH, Cailliet GM, Heifetz J
(2002) Age, growth and radiometric age validation of a deep-sea, habitat-forming
gorgonian (Primnoa resedaeformis) from the Gulf of Alaska. Hydrobiol
471:101-110
Auster P, Moore J, Heinonen K, Watling L (2005) A habitat classification scheme for
seamount landscapes: assessing the functional role of deep-water corals as fish
habitat. In: Freiwald A, Roberts JM (eds) Cold-water corals and ecosystems.
Springer-Verlag, Berlin Heidelberg, pp 761-769
Avila de Melo A, Alpoim R, Saborido-Rey F (2000) A comparative assessment of redfish
in NAFO Division 3M based on beaked redfish (S. mentella and S. fasciatus)
commercial, by-catch and survey data. NAFO SCR Doc., No.34, Serial No.
N4263, 55 p
Babcock RC (1990) Reproduction and development of the blue coral Heliopora coerulea
(Alcyonaria: Coenothecalia). Mar Biol 401:475-481
Babcock RC (1991) Comparative demography of three species of scleractinian corals
using age- and size- dependent classifications. Ecol Monogr 61(3):225-244
Babcock RC, Willis BL, Simpson CJ (1994) Mass spawning of corals on a high latitude
coral reef. Coral Reefs 13:161-169
Babcock RC, Bull GD, Harrison PL, Heyward AJ, Oliver JK, Wallace CC, Willis BL
(1986) Synchronous spawning of 105 scleractinian coral species on the Great
Barrier Reef. Mar Biol 90:379-394
Baco A (2007) Exploration for deep-sea corals on North Pacific seamounts and islands.
Oceanography 22: 108-117
Baco A, Shank TM (2005) Population genetic structure of the Hawaiian precious coral
Corallium lauuense (Octocorallia: Corallidae) using microsatellites. In: Freiwald
A, Roberts JM (eds) Cold-water corals and ecosystems. Springer-Verlag, Berlin
Heidelberg, pp 663-678
Bak RPM (1983) Neoplasia, regeneration and growth in the reef-building coral Acropora
palmata. Mar Biol 77:221-227
Battaglene SC, Seymour JE, Ramofafia C, Lane I (2002) Spawning induction of three
tropical sea cumcumbers, Holothuria scabra, H. fuscogilva and Actinopyga
mauritiana. Aquac 207:29-47
109
Beazley L (2008) Reproductive strategy as the determinant of spatial structure of deep-
water corals in the Northeast Channel. Honours Thesis, Dalhousie University
Beiring EA, Lasker HR (2000) Egg production by colonies of a gorgonian coral. Mar
Ecol Prog Ser 196:169-177
Benayahu Y (1989) Reproductive cycle and developmental processes during
embryogenesis of Clavularia hamra (Cnidaria: Octocorallia). Acta Zool, Stockh
70:29-36
Benayahu Y (1991) Reproduction and developmental pathways of Red Sea Xeniidae
(Octocorallia, Alcyonacea). Hydrobiol 216:125-130
Benayahu Y, Loya Y (1983) Surface brooding in the red sea soft coral Parerythropodium
fulvum fulvum (Forskål, 1775). Biol Bull 165:353-369
Benayahu Y, Loya Y (1984) Life history on the red sea soft coral Xenia macrospiculata
Gohar, 1940. II. Planulae shedding and post larval development. Biol Bull 166:44-
53
Benayahu Y, Loya Y (1986) Sexual reproduction of a soft coral: synchronous and brief
annual spawning of Sarcophyton glaucum (Quoy & Gaimard, 1833). Biol Bull
170:32-42
Benayahu Y, Weil D, Kleinman M (1990) Radiation of broadcasting and brooding
patterns in coral reef alcyonaceans. Adv Intertebr Reprod 5:323-328
Ben-Yosef DZ, Benayahu Y (1999) The gorgonian coral Acabaria biserialis: life history
of a successful colonizer of artificial substrata. Mar Biol 135:473-481
Billett DSM, Lampitt RS, Rice AL, Mantoura RFC (1983) Seasonal sedimentation of
phytoplankton to the deep-sea benthos. Nat 302:520-522
Bouillon J, Medel D, Peña Cantero AL (1997) The taxonomic status of the genus
Stylactaria Stechow, 1921 (Hydroidomedusae, Anthomedusae, Hydractiniidae),
with the description of a new species. Sci Mar 61:471-486
Brazeau DA, Lasker HR (1988) Inter- and intra-specific variation in gorgonian colony
morphology: quantifying branching patterns in arborescent animals. Coral Reefs
7:139-143
Brazeau DA, Lasker HR (1989) The reproductive cycle and spawning in a Caribbean
gorgonian. Biol Bull 176:1-7
Brazeau DA and Lasker HR (1990) Sexual reproduction and external brooding by the
Caribbean gorgonian Briareum asbestinum. Mar Biol 104:465-474
110
Breeze H, Davis DS, Butler M, Kostylev V (1997) Distribution and status of deep-sea
corals off Nova Scotia. Marine Issue Comm Spec Publ 1. Ecology Action Centre,
Halifax, NS
Brito TAS, Tyler PA, Clarke A (1997) Reproductive biology of the Antarctic octocoral
Thouarella variabilis Wright and Studer, 1889. In: den Hartog JC, van Ofwegen
LP, van der Spoel S (eds) Proceedings of the 6th
international conference on
coelenterate biology. Nationaal Naturhistorisch Museum, Leiden, pp 63-69
Brooke S, Schroeder WW (2007) State of deep coral ecosystems in the Gulf of Mexico
region: Texas to the Florida Straits. In: Lumsden SE, Hourigan TF, Bruckner AW,
Dorr G (eds). The state of deep coral ecosystems of the United States. NOAA
Technical Memo. CRCP-3. Silver and Spring MD, pp 271-306
Brooke S, Young CM (2003) Reproductive ecology of a deep-water scleractinian coral,
Oculina varicosa, from the southeast Florida shelf. Con Shelf Res 23:847-858
Bronsdon SK, Rogers AD, Tyler PA, Rice AL, Gage JD (1997) Genetic study of the
extent and consequences of sexual and asexual reproduction in the deep-sea
epizoic anemones Amphianthus inornata and Kadosactis commensalism
(Cnidaria: Anthozoa). Mar Biol 128:231-239
Buhl-Mortensen L, Mortensen PB (2004) Crustaceans associated with the deep-water
gorgonian corals Paragorgia arborea (L., 1758) and Primnoa resedaeformis
(Gunn., 1763). J Nat Hist 38:1233-1247
Burnham KP, Anderson DR (2002) Model selection and multimodel inference: a
practical guide information-theoretic approach, 2nd edn. Springer
Science+Business Media, Inc, New York
Cairns SD (2007) Deep-water corals: an overview with special reference to diversity and
distribution of deep-water scleractinian corals. Bull Mar Sci 81:311-322
Cairns SD, Bayer FM (2005) A review of the genus Primnoa (Octocorallia: Gorgonacea:
Primnoidae), with the description of two new species. Bull Mar Sci 77:225-256
Cerrano C, Arillo A, Azzini F, Calcinai B, Castellano L, Muti C, Valisano L, Zega G,
Bavestrello G (2005) Gorgonian population recovery after a mass mortality event.
Aquat Conserv: Mar Freshw Ecosyst 15:147-157
Chia FS, Crawford BJ (1973) Some observations on gametogenesis, larval development
and substratum selection of the sea pen Ptilosarcus guerneyi. Mar Biol 23:73-82
Cogswell AT, Kenchington ELR, Lirette CG, MacIsaac K, Best MM, Beazley LI,
Vickers J (2009) The current state of knowledge concerning the distribution of
coral in the Maritime Provinces. Can Tech Rep Fish Aquat Sci 2855: v + 66 p
111
Colbourne EB, Foote KD (2000) Variability of the stratification and circulation on the
Flemish Cap during the decades of the 1950s-1990s. J Northw Atl Fish Sci
26:103-122
Coffroth MA, Lasker HR (1998) Population structure of a clonal gorgonian coral: the
interplay between clonal reproduction and disturbance. Evol 52:316–330
Coma R, Zabala M, Gili J (1995a) Sexual reproductive effort in the Mediterranean
gorgonian Paramuricea clavata. Mar Ecol Prog Ser 117:185-192
Coma R, Ribes M, Zabala M, Gili J (1995b) Reproduction and cycle of gonadal
development in the Mediterranean gorgonian Paramuricea clavata. Mar Ecol
Prog Ser 117:173-183
Connell JH (1973) Population ecology of reef building corals. In: Jones OA, Endean R
(ed.) Biology and geology of corals reefs, Vol 2. Academic Press, New York, pp
205-245
Cordes EE, Nybakken JW, VanDykhuizen G (2001) Reproduction and growth of
Anthomastus ritteri (Octocorallia: Alcyonacea) from Monterey Bay, California,
USA. Mar Biol 138:491-501
Deichmann E (1936) The Alcyonaria of the western part of the Atlantic Ocean. Mem
Mus Comp Zool 53. Cambridge US, Harvard College
Eckelbarger KJ, Watling L (1995) Role of phylogenetic constraints in determining
reproductive patterns in deep-sea invertebrates. Invertebr Biol 114:256-269
Eckelbarger KJ, Tyler PA, Langton RW (1998) Gonadal morphology and gametogenesis
in the sea pen Pennatula aculeata (Anthozoa: Pennatulacea) from the Gulf of
Maine. Mar Biol 132:677-690
Edinger E, Baker K, Devillers R, Wareham V (2007) Coldwater corals off Newfoundland
and Labrador: distribution and fisheries impacts. WWF-Canada, 41 p
Edwards DCB, Moore CG (2008) Reproduction in the sea pen Pennatula phosphorea
(Anthozoa: Pennatulacea) from the west coast of Scotland. Mar Biol 155:303-314
Edwards DCB, Moore CG (2009) Reproduction in the sea pen Funiculina
quadrangularis (Anthozoa: Pennatulacea) from the west coast of Scotland. Estuar
Coast Shelf Sci 82:161-168
Etnoyer P, Morgan L (2005) Habitat-forming deep-sea corals in the Northeast Pacific
Ocean. In: Freiwald A, Roberts JM (eds) Cold-water corals and ecosystems.
Springer-Verlag, Berlin Heidelberg, pp 331-343
112
Etnoyer P, Cairns SD, Sanchez JA, Reed JK, Lopez JV, Schroeder WW, Brooke SD,
Watling L, Baco-Taylor A, Williams GC, Lindner A, France SC, Bruckner AW
(2006) Deep-sea coral collection protocols. NOAA Technical Memorandum
NMFS-OPR-2, Silver Spring, MD, 53 p
Fader GBJ, Strang J (2002) An interpretation of multibeam bathymetry from the Gully,
outer Scotian Shelf: materials, habitats, slopes, features and processes. In: Gordon
DC, Fenton DG (eds) Advances in understanding The Gully ecosystem: a
summary of research projects conducted at the Bedford Institute of Oceanography
(1999-2001). Can Tech Rep Fish Aquat Sci 2377, pp 5-16
Fadlallah, Y.H. and J.S. Pearse. 1982. Sexual reproduction in solitary corals:
Overlapping oogeneic and brooding cycles, and benthic planulas in Balanophyllia
elegans. Mar Biol 71:223-231
Fan TY, Dai CF (1995) Reproductive ecology of the scleractinian coral Echinopora
lamellosa in northern and southern Taiwan. Mar Biol 123:565-572
Fan T, Chou Y, Dai C (2005) Sexual reproduction of the Alcyonacean coral Lobophytum
pauciflorum in southern Taiwan. Bull Mar Sci 76:143-154
Farrant PA (1986) Gonad development and the planulae of the temperature Australian
soft coral Capnella gaboensis. Mar Biol 92:381-392
Flint HC, Waller RG, Tyler, PA (2007) Reproductive ecology of Fungiacyathus
marenzelleri from 4100 m depth in the northeast Pacific Ocean. Mar Biol 151:
843-849
Försterra G, Beuck L, Häussermann V, Freiwald A (2005) Shallow-water Desmophyllum
dianthus (Scleractinia) from Chile: characteristics of the biocoenoses, the
bioeroding community, heterotrophic interactions and (paleo)- bathymetric
implications. In: Freiwald A, Roberts JM (eds) Cold-water corals and
ecosystems. Springer- Verlag, Berlin Heidelberg, pp 937-977
Fuller SD, Murillo Perez FJ, Wareham V, Kenchington E (2008) Vulnerable marine
ecosystems dominated by deep-water corals and sponges in the NAFO convention
area. NAFO SCR Doc. No. 22, Serial No. N5524, 24 p
Gage JD (1994) Recruitment ecology and age structure of deep-sea invertebrate
populations. In: Young CM, Eckelbarger KJ (eds) Reproduction, larval biology,
and recruitment of the deep-sea benthos. Columbia University Press, New York,
pp 223-242
Gage JD, Tyler PA (1982) Growth and reproduction of the deep-sea brittlestar
Ophiomusium lymani Wyville Thomson. Oceanol Acta 5:73-83
113
Gage JD, Tyler PA (1991) Deep-sea biology: A natural history of organisms at the Deep-
sea floor. Cambridge University Press, Cambridge
Gass SE, Willison JHM (2005) An assessment of the distribution of deep-sea corals in
Atlantic Canada by using both scientific and local forms of knowledge. In:
Freiwald A, Roberts JM (eds) Cold-water corals and ecosystems. Springer-
Verlag, Berlin Heidelberg, pp 223-245
Gianni M (2004) High Seas Bottom Trawl Fisheries and their Impacts on the Biodiversity
of Vulnerable Deep-Sea Ecosystems: Option for International Action. A report
prepared for IUCN/The World Conservation Union, Natural Resources Defense
Council, WWF International and Conservation International, 91 p
Gladfelter EH, Monahan RK, Gladfelter WB (1978) Growth rates of five reef-building
corals in the Northeastern Caribbean. Bull Mar Sci 28:728-734
Glynn PW, Gassman NJ, Eakin CM, Cortes J, Smith DB, Guzman HM (1991) Reef coral
reproduction in the eastern Pacific: Costa Rica, Panama, and Galapagos Islands
(Ecuador). I. Pocilloporidae. Mar Biol 109:355-368
Goh NKC, Ng PKL, Chou LM (1999) Notes on the shallow water gorgonian-associated
fauna on coral reefs in Singapore. Bull Mar Sci 65:259-282
Gordon GC, Fenton DG (2001) Advances in understanding The Gully ecosystem: a
summary of research projects conducted at the Bedford Institute of Oceanography
(1999-2001). Can Tech Rep Fish Aquat Sci 2377, 87 p
Gori A, Linares C, Rossi S, Coma R, Gili J (2007) Spatial variability in the reproductive
cycle of the gorgonians Paramuricea clavata and Eunicella singularis (Anthozoa,
Octocorallia) in the Western Mediterranean Sea. Mar Biol 151:1571-1584
Gotelli NJ, Ellison AM (2004) A primer of ecological statistics. Sinauer Associates, Inc,
Massachusetts
Grasshoff M (1981) Die Gorgonaria, Pennatularia, und Antipatharia des Tiefwassers der
Biskaya (Cnidaria, Anthozoa). Bull Mus Natl Hist Nat Paris, 4e sér 3:731-766
Grigg RW (1977) Population dynamics of two gorgonian corals. Ecol 58:278-290
Gutiérrez-Rodríguez C, Lasker HR (2004) Reproductive biology, development, and
planula behaviour in the Caribbean gorgonian Pseudopterogorgia elisabethae.
Invertebr Biol 123:54-67
Hall VR, Hughes TP (1996) Reproductive strategies of modular organisms: comparative
studies of reef-building corals. Ecol 77:950-963
114
Hamel J, Sun Z, Mercier A (2010) Influence of size and seasonal factors on the growth of
the deep-sea coral Flabellum alabastrum in mesocosm. Coral Reefs 29:521-252
Harland AD, Davies PS, Fixter LM (1992) Lipid content of some Caribbean corals in
relation to depth and light. Mar Biol 113:357-361
Harmelin-Vivien ML, Bouchen-Navaro Y (1983) Feeding diets and significance of coral
feeding among chaetodontid fishes in Moorea (French Polynesia). Coral Reefs
2:199-127
Harriot VJ (1983) Reproductive ecology of four scleractinian species at Lizard Island,
Great Barrier Reef. Coral Reefs 2:9-18
Harrison PL, Wallace CC (1990) Reproduction, dispersal and recruitment of scleractinian
corals. In: Dubinsky Z (ed) Ecosystems of the world: coral reefs. Elsevier Science
Publishers BV, Amsterdam, pp 133–208
Harrison PL, Babcock RC, Bull GD, Oliver JK Wallace CC, Willis BL (1984) Mass
spawning in tropical reef corals. Sci 223:1186-1189
Hartnoll RG (1975) The annual cycle of Alcyonium digitatum. Estuar Coast Shelf Sci 3:
71-78
Hartnoll RG (1977) Reproductive strategy in two British species of Alcyonium. In:
Keegan et al. (eds) Biology of benthic organisms. Pergamon Press, Oxford, pp
321-328
Head EJH, Harrison WG (1998) Biological oceanography- plankton. In: Fenton DG,
Harrison WG (eds) The Gully: a scientific review of its environment and
ecosystem. Canadian Stock Assessment Secretariat Research Document -98/83,
pp 71-106
Hourigan TF, Lumsden SE, Dorr G, Bruckner AW, Brooke S, Stone RP (2007)
Introduction and national overview. In: Lumsden SE, Hourigan TF, Bruckner
AW, Dorr G (eds) The state of deep coral ecosystems of the United States. U.S.
Department of Commerce, NOAA Technical Memorandum CRCP-3, 365 p
Hovland M (2008) Deep-water coral reefs. Unique biodiversity hot-spots. Praxis
Publishing Ltd, Chichester, UK
Hovland M, Vasshus S, Indreeide A, Austdal L, Nilsen Ø (2002) Mapping and imaging
deep-sea coral reefs off Norway, 1982-2000. Hydrobiol 471:13-17
Hughes TP, Tanner JE (2000) Recruitment failure, life histories, and long-term decline of
Caribbean corals. Ecol 81:2250-2263
115
Husebø Å, Nottestad L, Fosså JH, Furevik DM, Jorgensen SB (2002) Distribution and
abundance of fish in deep-sea coral habitats. Hydrobiol 471:91-99
Huston M (1985) Variation in coral growth rates with depth at Discovery Bay, Jamaica.
Coral Reefs 4:19-25
Hwang S, Song J (2007) Reproductive biology and larval development of the temperate
soft coral Dendronephthya gigantea (Alcyonacea: Neththeidae). Mar Biol
152:273-284
Igashov TM (2001) Comparative analysis of length-age composition of Greenland halibut
(Reinhardtius hippoglossoides) from the commercial catches taken by Russia,
Spain and Portugal in the Flemish Pass (Divisions 3LM) in 1998-2000. NAFO
SCR Doc. 01/13 Ser. No. N4381, 5 p
Kenchington E, Best M, Cogswell A, MacIsaac K, Murillo-Perez FJ, MacDonald B,
Wareham V, Fuller SD, Jørgensbye HIØ, Skyla V, Thompson AB (2009) Coral
identification guide NAFO Area. Sci Coun Stud 42:1-35
Kapela W, Lasker HR (1999) Size-dependent reproduction in the Caribbean gorgonian
Pseudoplexaura porosa. Mar Biol 135:107-114
Kepkay PE, Harrison WG, Bugden JBC, Porter CJ (2002) Seasonal plankton production
in The Gully ecosystem. In: Gordon DC, Fenton DG (eds) Advances in
understanding The Gully ecosystem: a summary of research projects conducted at
the Bedford Institute of Oceanography (1999-2001). Can Tech Rep Fish Aquat
Sci 2377, pp 61-68
Kiernan JA (2003) Histological and Histochemical Methods, Theory and Practice. 3rd
edn. Butterworth Heinemann, Oxford
Kim K, Lasker HR (1998) Allometry of resource capture in colonial cnidarians and
constraints on modular growth. Funct Ecol 12:646-654
Knittweis L, Jompa J, Richter C, Wolff M (2009) Population dynamics of the mushroom
coral Heliofungia actiniformis in the Spermonde Archipelago, South Sulawesi,
Indonesia. Coral Reefs 28:793-804
Kojis BL (1986) Sexual reproduction in Acropora (Isopora) (Coelenterata: Scleractinia).
II. Latitudinal variation in A. palifera from the Great Barrier Reef and Papua New
Guinea. Mar Biol 91:311-318
Kojis BL, Quinn NJ (1981) Aspects of sexual reproduction and larval development in the
shallow water hermatypic coral, Goniastrea australensis (Edwards and Haime,
1857). Bull Mar Sci 31:558-573
116
Kojis BL, Quinn NJ (1982) Reproductive ecology of two Faviid corals (Coelenterata:
Scleractinia). Mar Ecol Prog Ser 8:251-255
Kojis BL, Quinn NJ (1984) Seasonal and depth variation in fecundity of Acropora
palifera at two reefs in Papua New Guinea. Coral Reefs 3:165-172
Krieger KJ, Wing BL (2002) Megafauna associations with deepwater corals (Primnoa
spp.) in the Gulf of Alaska. Hydrobiol 471:83-90
Kruger A, Schleyer MH, Benayahu Y (1998) Reproduction in Anthelia glauca
(Octocorallia: Xeniidae). I. Gametogenesis and larval brooding. Mar Biol
131:423-432
Langton RW, Langton EW, Theroux RB, Uzmann JR (1990) Distribution, behaviour and
abundance of sea pens, Pennatula aculeata, in the Gulf of Maine. Mar Biol
107:463-469
Lasker HR (1985) Prey preferences and browsing pressure of the butterflyfish Chaetodon
capistratus on Caribbean gorgonians. Mar Ecol Prog Ser 21:213-220
Lasker HR, Kim K, Coffroth MA (1998) Production, survival and recruitment of a
plexaurid gorgonian. Mar Ecol Prog Ser 162:111-123
Laubier L, Sibuet M (1979) Ecology of the benthic communities of the deep North East
Atlantic. Ambio Spec Rep 6:37-42
Lawson GS (1991) Preliminary evidence for seasonal reproduction in the deep-sea
gorgonian Acanella arbuscula. Porcup Newsl 5:29-35
Le Goff-Vitry MC, Rogers AD (2005) Molecular ecology of Lophelia pertusa in the NE
Atlantic. In: Freiwald A, Roberts JM (eds) Cold-water corals and ecosystems.
Springer-Verlag, Berlin Heidelberg, pp 653-662
Le Goff-Vitry MC, Pybus OG, Rogers AD (2004) Genetic structure of the deep-sea coral
Lophelia pertusa in the northeast Atlantic revealed by microsatellites and internal
transcribed spacer sequences. Mol Ecol 13: 537-549
Leigh EG, Herre EA, Fischer EA (1985) Sex allocation in animals. Exp 41:1265-1276
Levin LA, Plaia GR, Huggett CL (1994) The influence of natural organic enhancement of
life histories and community structure of bathyal polychaetes. In: Young CM,
Eckelbarger KJ (eds) Reproduction, larval biology, and recruitment of the deep-
sea benthos. Columbia University Press, New York, pp 261-283
Levitan DR (2006) The relationship between egg size and fertilization success in
broadcast spawning marine invertebrates. Integr Comp Biol 46: 298-311
117
Lightfoot RH, Tyler PA, Gage JD (1979) Seasonal reproduction in deep-sea bivalves and
brittlestars. Deep-Sea Res 26:967-973
Lindquist N, Hay ME (1996). Palatability and chemical defence of marine invertebrate
larvae. Ecol Monogr 66:431-450
Loya Y, Lubinevsky H, Rosenfeld M, Kramarsky-Winter E (2004) Nutrient enrichment
caused by in situ fish farms at Eilat, Red Sea is detrimental to coral reproduction.
Mar Pollut Bull 49:344-353
MacIsaac KC, Bourbonnais C, Kenchington ELR, Gordon D, Gass SE (2001)
Observations on the occurrence and habitat preference of corals in Atlantic
Canada. In: Willison JHM, Hall J, Gass SE, Kenchington ELR, Butler M, Doherty
P (eds) Proceedings of the first international symposium on deep-sea corals.
Ecology Action Centre and Nova Scotia Museum, Halifax, pp 58-75
Maillet GL, Pepin P, Craig DC, Fraser S, Lane D (2005) Overview of biological and
chemical conditions with comparisons of the Grand Banks shelf and slope waters
during 1996-2003. J Northw Atl Fish Sci 37:29-45
McCloskey LR, Muscatine L (1984) Production and respiration in the Red Sea coral
Stylophora pistillata as a function of depth. Proc R Soc Lond B 222:215-230
Mendes JM, Woodley JD (2002) Timing of reproduction in Montastrea annularis:
relationship to environmental variables. Mar Ecol Prog Ser 227:241-251
Mercier A, Hamel J (2009) Reproductive periodicity and host-specific settlement and
growth of a deep-water symbiotic sea anemone. Can J Zool 87:967-980
Mercier A, Sun Z, Hamel, J (2010) Reproductive periodicity, spawning and development
of the deep-sea scleractinian coral Flabellum angulare. Mar Biol
doi:10.1007/s0022701015657
Mileikovsky SA (1971) Types of larval development in marine bottom invertebrates,
their distribution and ecological significance: a re-evaluation. Mar Biol 10:193-
213
Molodtsova TN, Sanamtan NP, Keller NB (2008) Anthozoa from the northern Mid-
Atlantic Ridge and Charlie-Gibbs Fracture Zone. Mar Biol Res 4:112-130
Mortensen PB, Buhl-Mortensen L (2005) Deep-water corals and their habitats in The
Gully, a submarine canyon off Atlantic Canada. In: Freiwald A, Roberts JM (eds)
Cold-water corals and ecosystems. Springer-Verlag, Berlin Heidelberg, pp 247-277
Murillo FJ, Muñoz PD, Altuna A, Serrano A (2011) Distribution of deep-water corals of
the Flemish cap, Flemish Pass, and the Grand Banks of Newfoundland
118
(Northwest Atlantic Ocean): interaction with fishing activities. ICES J Mar Sci
68:319-332
NAFO (2008) Report of the NAFO SC WGEAFM, response to fisheries commission
request. NAFO SCS Doc. No. 24, Serial No. N5592, 19 p
Nishikawa A, Katoh M, Sakai K (2003) Larval settlement rates and gene flow of
broadcast-spawning (Acropora tenuis) and planula-brooding (Stylophora
pistillata) corals. Mar Ecol Prog Ser 256:87-97
Oliver J, Babcock R (1992) Aspects of the fertilization of broadcast spawning corals:
sperm dilution effects and in situ measurements of fertilization. Biol Bull
183:409-417
Oliver JK, Babcock RC, Harrison PL, Willis BL (1988) Geographic extent of mass coral
spawning: clues to ultimate causal factors. In: Choat et al. (eds) Proceedings of
the 6th
international coral reef symposium, Vol 2. Townsville, Australia, pp 803-
810
Orejas C, Gili JM, López-González PJ, Hasemann C, Arntz WE (2007) Reproductive
patterns of four Antarctic octocorals in the Weddell Sea: an inter-specific, shape,
and latitudinal comparison. Mar Biol 150:551-563
Orejas C, López-González PJ, Gili JM, Teixidó N, Gutt J, Arntz WE (2002) Distribution
and reproductive ecology of the Antarctic octocoral Ainigmaptilon antarcticum in
the Weddell Sea. Mar Ecol Prog Ser 231:101-114
Orton JH (1920) Sea temperature, breeding and distribution in marine animals. J Mar
Biol Assoc UK 12:339-366
Pearse JS (1994) Cold-water echinoderms break Orton‟s and Thorson‟s “rules”. In:
Young CM, Eckelbarger K (eds) Invertebrate reproduction, larval biology and
recruitment in the deep-sea benthos. Columbia University Press, New York, pp
26-43
Pianka ER (1978) Principles of population ecology. In: Evolutionary ecology, 2nd edn.
Harper & Row, Publishers, New York, pp 151-156
Pinheiro JC, Bates DM (2000) Mixed-effects models in S and S-Plus. Springer, New
York
Pires DO, Castro CB, Silva JC (2009) Reproductive biology of the deep-sea
pennatulacean Anthoptilum murrayi (Cnidaria, Octocorallia). Mar Ecol Prog Ser
397:103-112
Ramirez Llodra E (2002) Fecundity and life-history strategies in marine invertebrates.
Adv Mar Biol 43:87-170
119
Reed JK (2002) Deep-water Oculina coral reefs of Florida: biology, impacts, and
management. Hydrobiol 471: 43-55
Ribes M, Coma R, Rossi S, Micheli M (2007) Cycle of gonadal development in
Eunicella singularis (Cnidaria: Octocorallis): trends in sexual reproduction in
gorgonians. Invertebr Biol 126:307-317
Rice AL, Tyler PA, Paterson GJL (1992) The pennatulid Kophobelemnon stelliferum
(Cnidaria: Octocorallia) in the Porcupine Seabight (North-east Atlantic Ocean). J
Mar Biol Ass UK 72:417-434
Richmond RH, Hunter CL (1990) Reproduction and recruitment of corals: comparisons
among the Caribbean, the tropical Pacific, and the Red Sea. Mar Ecol Prog Ser
60:185-203
Rinkevich B (1989) The contribution of photosynthetic products to coral reproduction.
Mar Biol 101:259-263
Rinkevich B (1996) Do reproduction and regeneration in damaged corals compete for
energy allocation? Mar Ecol Prog Ser 143:297-302
Rinkevich B, Loya Y (1983) Short-term fate of phytosynthetic products in a hermatypic
coral. J Exp Mar Biol Ecol 73:175-184
Rinkevich B, Loya Y (1987) Variability in the pattern of sexual reproduction of the coral
Stylophora pistillata at Eilat, Red Sea: A long-term study. Biol Bull 173:335-344
Roark EB, Guilderson TP, Dunbar RB, Ingram BL (2006) Radiocarbon-based ages and
growth rates of Hawaiian deep-sea corals. Mar Ecol Prog Ser 327:1-14
Roberts S, Hirshfield M (2004) Deep-sea corals: out of sight, but no longer out of mind.
Front Ecol Environ 2:123-130
Roberts JM, Harvey SM, Lamont PA, Gage JD, Humphery JD (2000) Seabed
photography, environmental assessment and evidence for deep-water trawling on
the continental margin west of the Hebrides. Hydrobiol 441:173-183
Rogers AD (1999) The biology of Lophelia pertusa (Linnaeus,1758) and other deep-
water reef-forming corals and impacts from human activities. Int Rev Hydrobiol 84: 315–406
Rogers AD (2004) The biology, ecology and vulnerability of deep-water coral reefs.
International Union for Conservation of Nature & Natural Resources (IUCN), 13 p
Rotjan RD, Lewis SM (2009) Predators selectively graze reproductive structures in a clonal
marine organism. Mar Biol 156:569-577
120
Ruesink JL, Harvell CD (1990) Specialist predation on the Caribbean gorgonian Plexaurella
spp. by Cyphoma signatum (Gastropoda). Mar Ecol Prog Ser 65:265-272
Rutherford, RJ, Breeze H (2002) The Gully ecosystem. Can Manuscr Rep Fish Aquat Sci
2615, 28 p
Sakai K (1997) Gametogenesis, spawning, and planula brooding by the reef coral
Goniastrea aspera (Scleractinia) in Okinawa, Japan. Mar Ecol Prog Ser 151:67-
72
Sakai K (1998) Effect of colony size, polyp size, and budding mode on egg production in
a colonial coral. Biol Bull 195:319-325
Sánchez JA (2005) Systematics of the bubblegum corals (Cnidaria: Octocorallia:
Paragorgiidae) with description of new species from New Zealand and the Eastern
Pacific. Zootaxa 1014:1-72
Santangelo G, Carletti E, Maggi E, Bramanti L (2003) Reproduction and population
sexual structure of the overexploited Mediterrenean red coral Corallium rubrum.
Mar Ecol Prog Ser 248:99-108
Scheltema RS (1994) Adaptations for reproduction among deep-sea benthic molluscs: an
appraisal of the existing evidence. In: Young CM, Eckelbarger KJ (eds)
Reproduction, larval biology, and recruitment of the deep-sea benthos. Columbia
University Press, New York, pp 44-75
Schwarz CJ (2010) Sampling, regression, experimental design and analysis for
environmental scientists, biologists, and resource managers.
www.stat.sfu.ca/~cschwarz/Stat-650/Notes/PDF/MLE-AIC.pdf. Accessed 16
September 2010
Sherwood OA, Edinger EN (2009) Ages and growth rates of some deep-sea gorgonian
and antipatharian corals of Newfoundland and Labrador. Can J Fish Aquat Sci
66:142-152
Shlesinger Y, Loya Y (1985) Coral community reproductive patterns: Red Sea versus the
Great Barrier Reef. Sci 228:1333-1335
Sier CJS, Olive PW (1994) Reproduction and reproductive variability in the coral
Pocillopora verrucosa from the Republic of Maldives. Mar Biol 118:713-722
Simpson A (2009) Reproduction in octocorals (Subclass Octocorallia): a review of
published literature. Version 16 July 2009
http://www.ucs.louisiana.edu/~scf4101/Bambooweb/ Accessed 15 October
2010
121
Soong K (1991) Sexual reproductive patterns of shallow-water reef corals in Panama.
Bull Mar Sci 49:832-846
Stein M (2007) Oceanography of the Flemish Cap and adjacent waters. J Northw Atl Fish
Sci 37:135-146
Stone RP (2006) Coral habitat in the Aleutian Islands of Alaska: depth distribution, fine-
scale species associations, and fisheries interactions. Coral Reefs 25:229-238
Strain PM, Yeats PA (2005) Nutrients in The Gully, Scotian Shelf, Canada. Atmos-
Ocean 43:145-161
Strychar KB, Hamilton LC, Kenchington EL, Scott DB (2005) Genetic circumscription
of deep-water coral species in Canada using 18S rDNA. In: Freiwald A, Roberts
JM (eds) Cold-water corals and ecosystems. Springer-Verlag, Berlin Heidelberg,
pp 679-690
Sun Z, Hamel J, Mercier A (2010a) Planulation periodicity, settlement preferences and
growth of two deep-sea octocorals from the northwest Atlantic. Mar Ecol Prog
Ser 410:71-87
Sun Z, Hamel J, Edinger E, Mercier A (2010b) Reproductive biology of the deep-sea
octocoral Drifa glomerata in the Northwest Atlantic. Mar Biol 157:863-873
Thorson G (1946) Reproduction and larval development of Danish marine bottom
invertebrates, with special reference to the planktonic larvae in the Sound
(Oresund). Medd Dan Fisk Havunders (Ser Plankton) 4:1-523
Torrents, O, Garrabou J, Marschal C, Harmelin JG (2005) Age and size at first
reproduction in the commercially exploited red coral Corallium rubrum (L.) in the
Marseilles area (France, NW Mediterranean). Biol Conserv 121:391-397
Tsounis G, Rossi S, Aranguren M, Gili J, Arntz W (2006) Effects of spatial variability
and colony size on the reproductive output and gonadal development cycle of the
Mediterranean red coral (Corallium rubrum L.). Mar Biol 148:513-527
Tyler PA (1988) Seasonality in the deep sea. Oceanogr Mar Biol Ann Rev 26:227-258
Tyler PA, Billett DSM, Gage JD (1990) Seasonal reproduction in the seastar Dytaster
grandis from 4000 m in the north-east Atlantic Ocean. J Mar Biol Assoc UK
70:173-180
Tyler PA, Campos-Creasy LS, Giles LA (1994) Environmental control of quasi-
continuous and seasonal reproduction in deep-sea benthic invertebrates. In:
Young CM, Eckelbarger KJ (eds) Reproduction, larval biology, and recruitment
of the deep-sea benthos. Columbia University Press, New York, pp 158-178
122
Tyler PA, Pain SL, Gage JD (1982) The reproductive biology of the deep-sea asteroid
Bathybiaster vexillifer. J Mar Biol Assoc UK 62:57-69
Tyler PA, Bronsdon SK, Young CM, Rice AL (1995) Ecology and gametogenic biology
of the genus Umbellula (Pennatulacea) in the North Atlantic Ocean. Int. Revu ges.
Hydrobiol. 80:187-199
Underwood AJ (1997) Experiments in ecology: their logical design and interpretation
using analysis of variance. Cambridge University Press, Cambridge
Van-Praet M (1990) Gametogenesis and the reproductive cycle in the deep-sea anemone
Paracalliactis stephensoni (Cnidaria: Actiniaria). J Mar Ass UK 70:163-172
Van-Praet M, Rice AL, Thurston MH (1990) Reproduction in two deep-sea anemones
(Actiniaria); Phelliactis hertwigi and P. robusta. Prog Oceanog 24:207-222
van Woesik R (2010) Calm before the spawn: global coral spawning patterns are
explained by regional wind fields. Proc R Soc B 277:715-722
Ward S (1992) Evidence for broadcast spawning as well as brooding in the scleractinian
coral Pocillopora damicornis. Mar Biol 112:641-646
Watling L, Auster PJ (2005) Distribution of deep-water Alcyonacea off the northeast
coast of the United States. In: Freiwald A, Roberts JM (eds) Cold-water Corals
and Ecosystems. Springer-Verlag, Berlin Heidelberg, pp 279-296
Waller RG, Baco AR (2007) Reproductive morphology of three species of deep-water
precious corals from the Hawaiian Archipelago: Gerardia sp., Corallium
secundum, and Corallium lauuense. Bull Mar Sci 81:533-542
Waller RG, Tyler PA (2005) The reproductive biology of two deep-water, reef-building
scleractinians from the NE Atlantic Ocean. Coral Reefs 24:514-522
Waller RG, Tyler PA (2010) Reproductive patterns in two deep-water solitary corals
from the north-east Atlantic- Flabellum alabastrum and F. angulare (Cnidaria:
Anthozoa: Scleractinia). J Mar Biol Assoc UK First View:1-7
Waller RG, Tyler PA, Gage JD (2002) Reproductive ecology of the deep-sea
scleractinian coral Fungiacyathus marenzelleri (Vaughan, 1906) in the northeast
Atlantic Ocean. Coral Reefs 21:325-331
Waller RG, Tyler PA, Gage JD (2005) Sexual reproduction in three hermaphroditic deep-
sea Caryophyllia species (Anthozoa:Scleractinia) from the NE Atlantic Ocean.
Coral Reefs 24:594-602
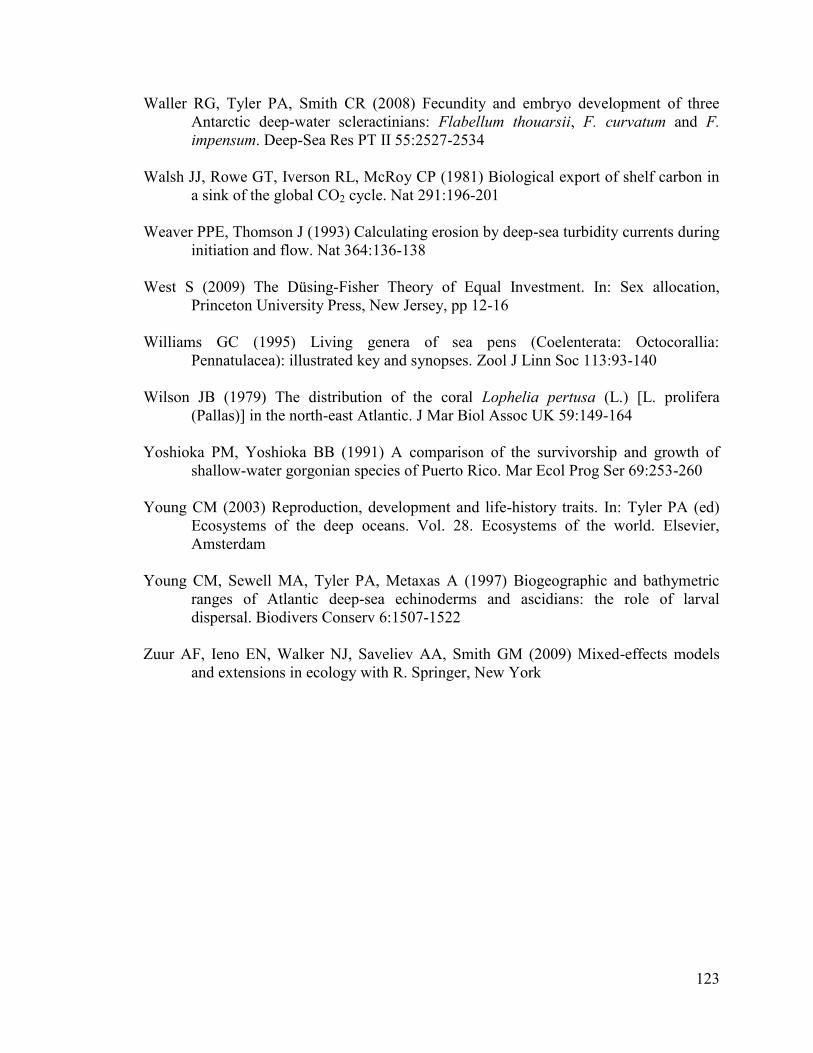
123
Waller RG, Tyler PA, Smith CR (2008) Fecundity and embryo development of three
Antarctic deep-water scleractinians: Flabellum thouarsii, F. curvatum and F.
impensum. Deep-Sea Res PT II 55:2527-2534
Walsh JJ, Rowe GT, Iverson RL, McRoy CP (1981) Biological export of shelf carbon in
a sink of the global CO2 cycle. Nat 291:196-201
Weaver PPE, Thomson J (1993) Calculating erosion by deep-sea turbidity currents during
initiation and flow. Nat 364:136-138
West S (2009) The Düsing-Fisher Theory of Equal Investment. In: Sex allocation,
Princeton University Press, New Jersey, pp 12-16
Williams GC (1995) Living genera of sea pens (Coelenterata: Octocorallia:
Pennatulacea): illustrated key and synopses. Zool J Linn Soc 113:93-140
Wilson JB (1979) The distribution of the coral Lophelia pertusa (L.) [L. prolifera
(Pallas)] in the north-east Atlantic. J Mar Biol Assoc UK 59:149-164
Yoshioka PM, Yoshioka BB (1991) A comparison of the survivorship and growth of
shallow-water gorgonian species of Puerto Rico. Mar Ecol Prog Ser 69:253-260
Young CM (2003) Reproduction, development and life-history traits. In: Tyler PA (ed)
Ecosystems of the deep oceans. Vol. 28. Ecosystems of the world. Elsevier,
Amsterdam
Young CM, Sewell MA, Tyler PA, Metaxas A (1997) Biogeographic and bathymetric
ranges of Atlantic deep-sea echinoderms and ascidians: the role of larval
dispersal. Biodivers Conserv 6:1507-1522
Zuur AF, Ieno EN, Walker NJ, Saveliev AA, Smith GM (2009) Mixed-effects models
and extensions in ecology with R. Springer, New York
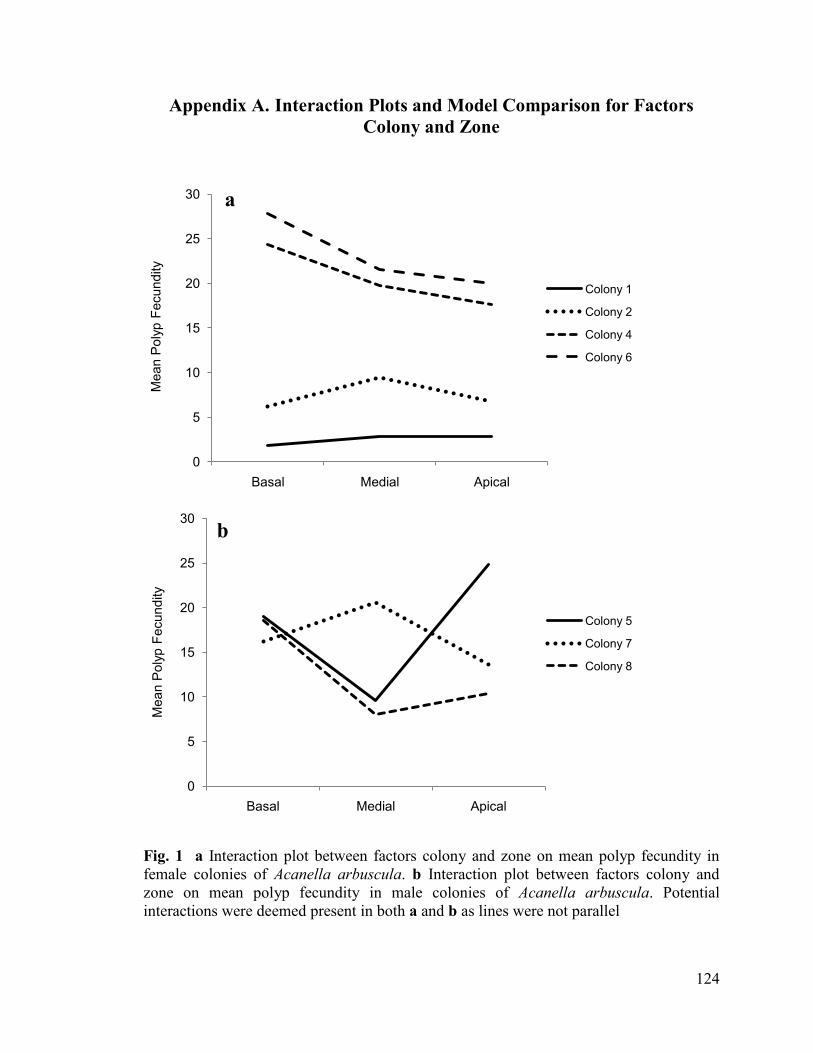
124
Appendix A. Interaction Plots and Model Comparison for Factors
Colony and Zone
Fig. 1 a Interaction plot between factors colony and zone on mean polyp fecundity in
female colonies of Acanella arbuscula. b Interaction plot between factors colony and
zone on mean polyp fecundity in male colonies of Acanella arbuscula. Potential
interactions were deemed present in both a and b as lines were not parallel
0
5
10
15
20
25
30
Basal Medial Apical
Mean P
oly
p F
ecundity
Colony 1
Colony 2
Colony 4
Colony 6
0
5
10
15
20
25
30
Basal Medial Apical
Mean P
oly
p F
ecundity
Colony 5
Colony 7
Colony 8
a
b
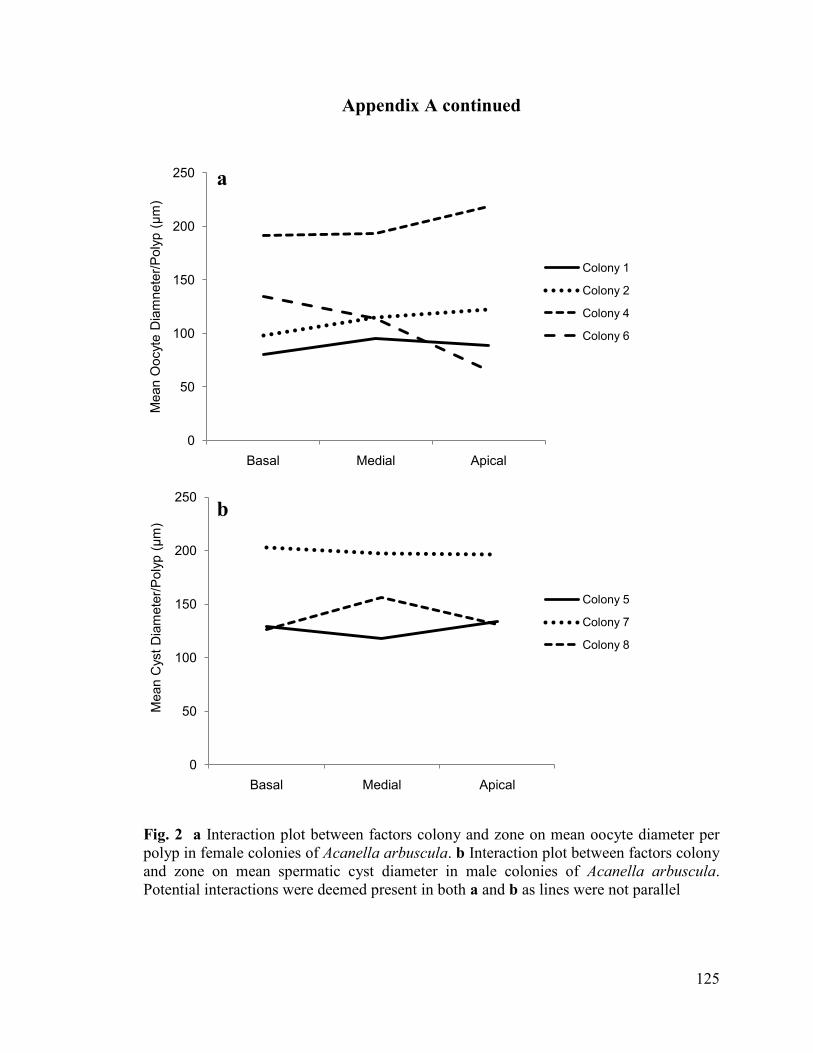
125
Appendix A continued
Fig. 2 a Interaction plot between factors colony and zone on mean oocyte diameter per
polyp in female colonies of Acanella arbuscula. b Interaction plot between factors colony
and zone on mean spermatic cyst diameter in male colonies of Acanella arbuscula.
Potential interactions were deemed present in both a and b as lines were not parallel
0
50
100
150
200
250
Basal Medial Apical
Mean O
ocyt
e D
iam
nete
r/P
oly
p (
µm
)
Colony 1
Colony 2
Colony 4
Colony 6
0
50
100
150
200
250
Basal Medial Apical
Mean C
yst
Dia
mete
r/P
oly
p (
µm
)
Colony 5
Colony 7
Colony 8
a
b
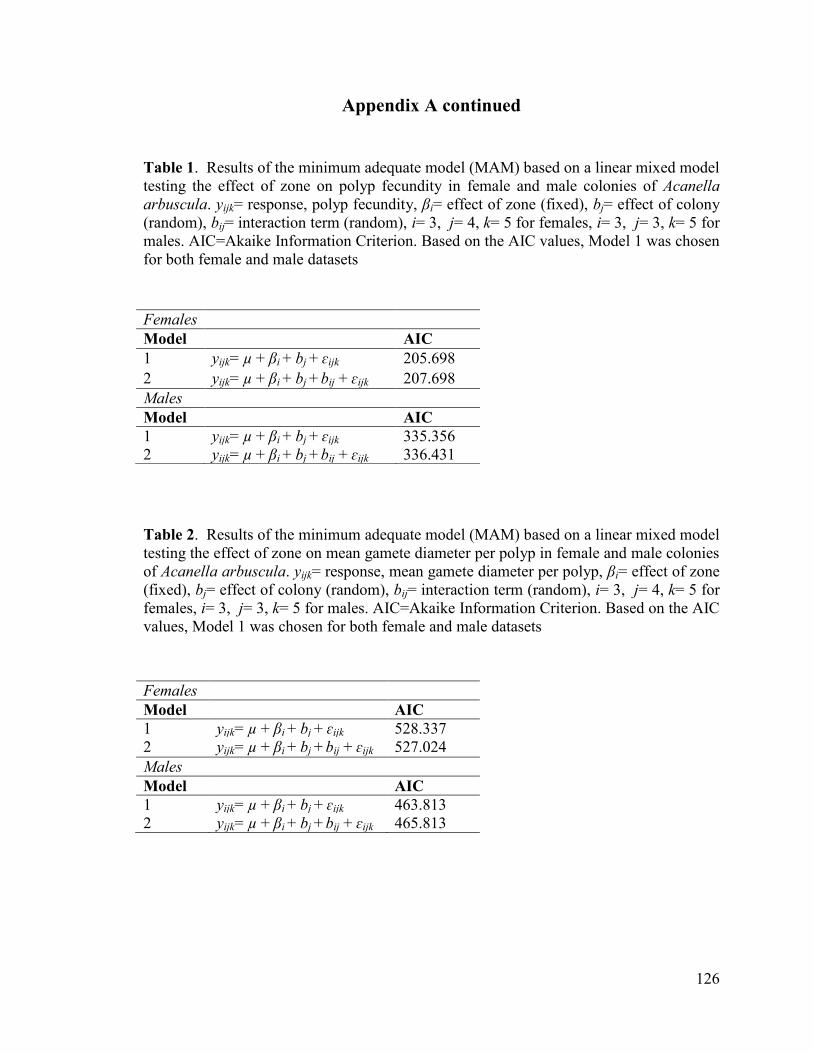
126
Appendix A continued
Table 1. Results of the minimum adequate model (MAM) based on a linear mixed model
testing the effect of zone on polyp fecundity in female and male colonies of Acanella
arbuscula. yijk= response, polyp fecundity, βi= effect of zone (fixed), bj= effect of colony
(random), bij= interaction term (random), i= 3, j= 4, k= 5 for females, i= 3, j= 3, k= 5 for
males. AIC=Akaike Information Criterion. Based on the AIC values, Model 1 was chosen
for both female and male datasets
Table 2. Results of the minimum adequate model (MAM) based on a linear mixed model
testing the effect of zone on mean gamete diameter per polyp in female and male colonies
of Acanella arbuscula. yijk= response, mean gamete diameter per polyp, βi= effect of zone
(fixed), bj= effect of colony (random), bij= interaction term (random), i= 3, j= 4, k= 5 for
females, i= 3, j= 3, k= 5 for males. AIC=Akaike Information Criterion. Based on the AIC
values, Model 1 was chosen for both female and male datasets
Females
Model AIC
1 yijk= µ + βi + bj + ɛijk 205.698
2 yijk= µ + βi + bj + bij + ɛijk 207.698
Males
Model AIC
1 yijk= µ + βi + bj + ɛijk 335.356
2 yijk= µ + βi + bj + bij + ɛijk 336.431
Females
Model AIC
1 yijk= µ + βi + bj + ɛijk 528.337
2 yijk= µ + βi + bj + bij + ɛijk 527.024
Males
Model AIC
1 yijk= µ + βi + bj + ɛijk 463.813
2 yijk= µ + βi + bj + bij + ɛijk 465.813
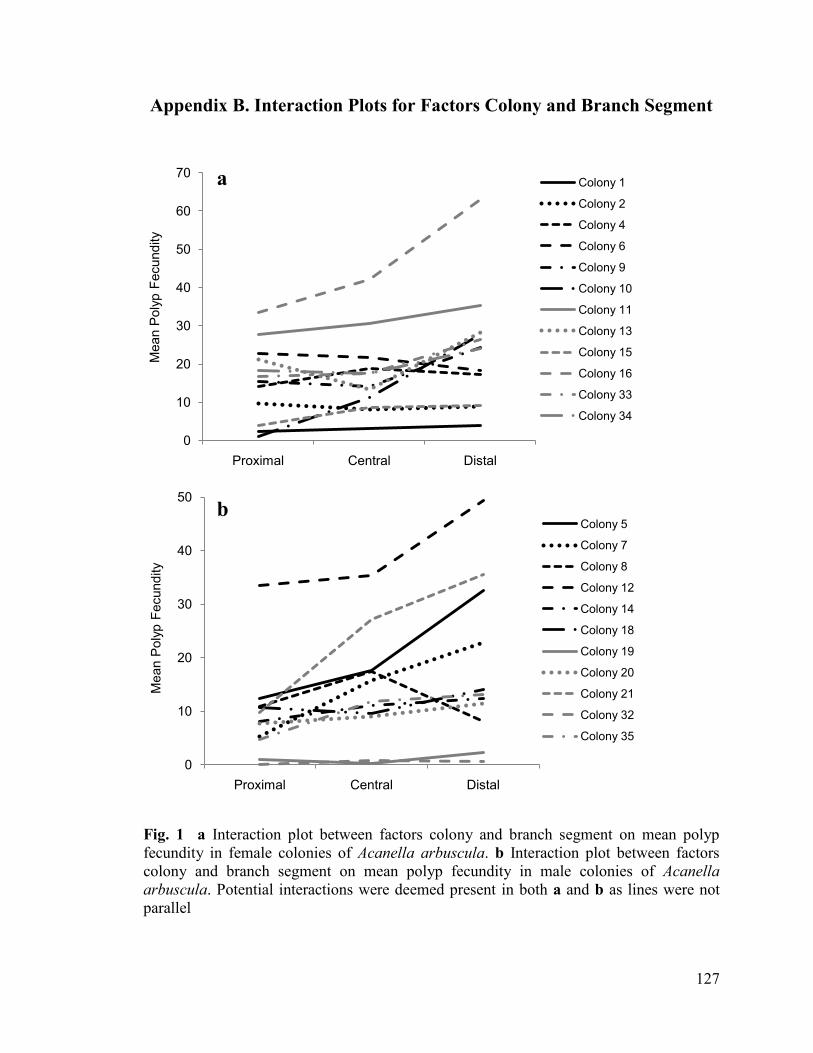
127
Appendix B. Interaction Plots for Factors Colony and Branch Segment
Fig. 1 a Interaction plot between factors colony and branch segment on mean polyp
fecundity in female colonies of Acanella arbuscula. b Interaction plot between factors
colony and branch segment on mean polyp fecundity in male colonies of Acanella
arbuscula. Potential interactions were deemed present in both a and b as lines were not
parallel
0
10
20
30
40
50
60
70
Proximal Central Distal
Mean P
oly
p F
ecundity
Colony 1
Colony 2
Colony 4
Colony 6
Colony 9
Colony 10
Colony 11
Colony 13
Colony 15
Colony 16
Colony 33
Colony 34
0
10
20
30
40
50
Proximal Central Distal
Mean P
oly
p F
ecundity
Colony 5
Colony 7
Colony 8
Colony 12
Colony 14
Colony 18
Colony 19
Colony 20
Colony 21
Colony 32
Colony 35
b
a
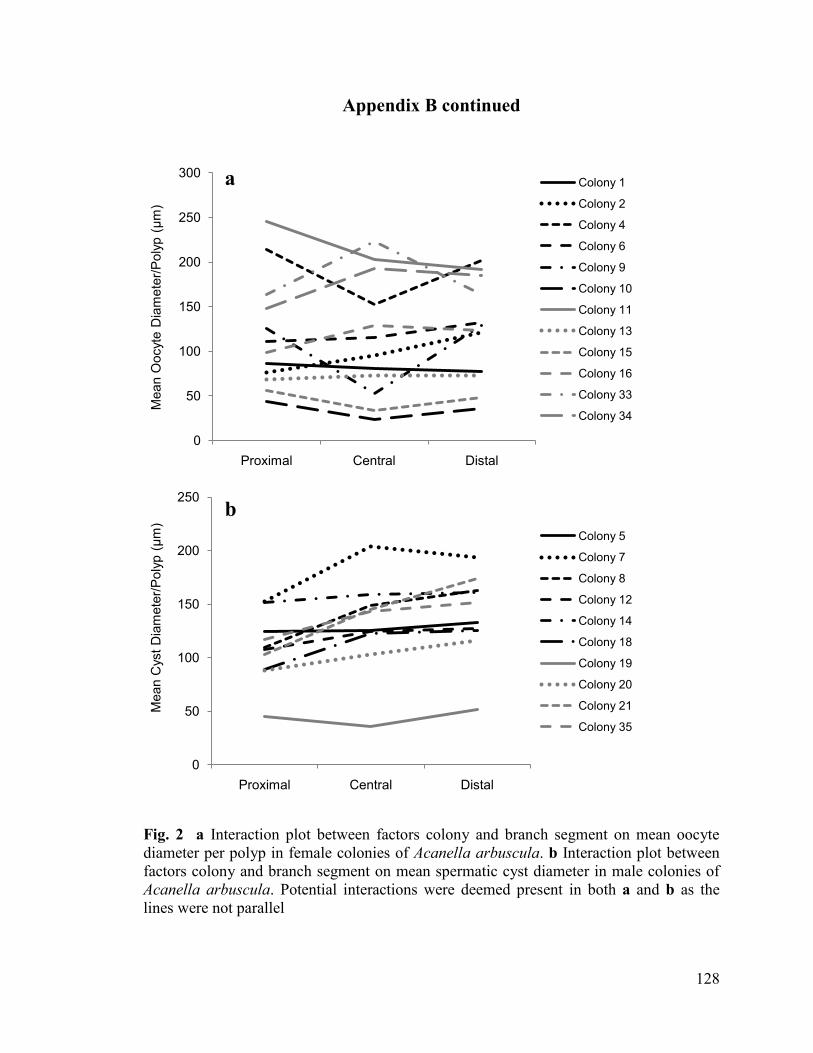
128
Appendix B continued
Fig. 2 a Interaction plot between factors colony and branch segment on mean oocyte
diameter per polyp in female colonies of Acanella arbuscula. b Interaction plot between
factors colony and branch segment on mean spermatic cyst diameter in male colonies of
Acanella arbuscula. Potential interactions were deemed present in both a and b as the
lines were not parallel
0
50
100
150
200
250
300
Proximal Central Distal
Mean O
ocyte
Dia
mete
r/P
oly
p (
µm
)
Colony 1
Colony 2
Colony 4
Colony 6
Colony 9
Colony 10
Colony 11
Colony 13
Colony 15
Colony 16
Colony 33
Colony 34
0
50
100
150
200
250
Proximal Central Distal
Mean C
yst
Dia
mete
r/P
oly
p (
µm
)
Colony 5
Colony 7
Colony 8
Colony 12
Colony 14
Colony 18
Colony 19
Colony 20
Colony 21
Colony 35
b
a
Related Documents