CONCEPT DEVELOPMENT Mathematics Assessment Project CLASSROOM CHALLENGES A Formative Assessment Lesson Representing Functions of Everyday Situations Mathematics Assessment Resource Service University of Nottingham & UC Berkeley For more details, visit: http://map.mathshell.org © 2015 MARS, Shell Center, University of Nottingham May be reproduced, unmodified, for non-commercial purposes under the Creative Commons license detailed at http://creativecommons.org/licenses/by-nc-nd/3.0/ - all other rights reserved

Welcome message from author
This document is posted to help you gain knowledge. Please leave a comment to let me know what you think about it! Share it to your friends and learn new things together.
Transcript
CONCEPT DEVELOPMENT
Mathematics Assessment Project
CLASSROOM CHALLENGES A Formative Assessment Lesson
Representing
Functions of
Everyday Situations
Mathematics Assessment Resource Service
University of Nottingham & UC Berkeley
For more details, visit: http://map.mathshell.org © 2015 MARS, Shell Center, University of Nottingham May be reproduced, unmodified, for non-commercial purposes under the Creative Commons license detailed at http://creativecommons.org/licenses/by-nc-nd/3.0/ - all other rights reserved

Teacher guide Representing Functions of Everyday Situations T-1
Representing Functions of Everyday Situations
MATHEMATICAL GOALS This lesson unit is intended to help you assess how well students are able to: • Articulate verbally the relationships between variables arising in everyday contexts. • Translate between everyday situations and sketch graphs of relationships between variables. • Interpret algebraic functions in terms of the contexts in which they arise. • Reflect on the domains of everyday functions and in particular whether they should be discrete or
continuous.
COMMON CORE STATE STANDARDS This lesson relates to the following Standards for Mathematical Content in the Common Core State Standards for Mathematics:
F-IF: Interpret functions that arise in applications in terms of a context. Analyze functions using different representations. F-LE: Construct and compare linear, quadratic, and exponential models and solve problems. Interpret expressions for functions in terms of the situation they model. A-SSE: Interpret the structure of expressions.
This lesson also relates to all the Standards for Mathematical Practice in the Common Core State Standards for Mathematics, with a particular emphasis on Practices 1, 2, 4, 5, and 7:
1. Make sense of problems and persevere in solving them. 2. Reason abstractly and quantitatively. 3. Construct viable arguments and critique the reasoning of others. 4. Model with mathematics. 5. Use appropriate tools strategically. 6. Attend to precision. 7. Look for and make use of structure. 8. Look for and express regularity in repeated reasoning.
INTRODUCTION The lesson unit is structured in the following way: • Before the lesson, students work alone on a task designed to reveal their current understanding.
You review their solutions and create questions for them to consider to help improve their work. • In the lesson, students work in small groups on a collaborative task, matching situations, sketch
graphs, and algebraic functions. They refine the graphs and interpret the formulas to answer questions. Students then discuss as a whole-class what has been learned and the strategies used.
• In a follow-up lesson, students review their responses to the original task and the questions posed. They use what they have learned to complete a similar task; Another Four Situations.
MATERIALS REQUIRED • Each student will need a copy of Four Situations and Another Four Situations and a mini-
whiteboard, pen, and eraser. • Each small group of students will need cut-up card sets: Everyday Situations 1, 2, and 3; Graphs
1 and 2; and Algebraic Functions, poster paper, glue, and a graphing calculator to check answers. • There is a projector resource to support whole-class discussions. You may also want to copy the
card sets onto transparencies to be used on an overhead projector.
TIME NEEDED Approximately 20 minutes before the lesson, an 80-minute lesson (or two 45-minute lessons), and 20 minutes in a follow-up lesson.

Teacher guide Representing Functions of Everyday Situations T-2
BEFORE THE LESSON
Assessment task: Four Situations (20 minutes) Have the students complete this task, in class or for homework, a few days before the formative assessment lesson. This will give you an opportunity to assess the work and to find out the kinds of difficulties students have with it. You should then be able to target your help more effectively in the subsequent lesson.
Give each student a copy of the Four Situations task.
Read through the questions and try to answer them as carefully as you can.
You are not to use a graphing calculator to do this task.
It is important that, as far as possible, students are allowed to answer the questions without your assistance.
Students should not worry too much if they cannot understand or do everything because, in the next lesson they will engage in a similar task that should help them. Explain to students that by the end of the next lesson, they should expect to answer questions such as these confidently. This is their goal.
Assessing students’ responses Collect students’ responses to the task and note what their work reveals about their current levels of understanding and their different approaches.
We suggest that you do not score students’ work. The research shows that this will be counterproductive, as it will encourage students to compare their scores and will distract their attention from what they can do to improve their mathematics.
Instead, help students to make further progress by summarizing their difficulties as a series of questions. Some suggestions for these are given in the Common issues table on the next page. These have been drawn from difficulties observed in trials of this unit.
Functions and Everyday Situations Student Materials Beta Version April 2012
© 2012 MARS University of Nottingham S-1
Four Situations 1. Sketch a graph to model each of the following situations. Think about the shape of the graph and whether it should be a continuous line or not.
A: Candle
Each hour a candle burns down the same amount.
x = the number of hours that have elapsed.
y = the height of the candle in inches.
B: Letter
When sending a letter, you pay quite a lot for letters weighing up to an ounce. You then pay a smaller, fixed amount for each additional ounce (or part of an ounce.)
x = the weight of the letter in ounces.
y = the cost of sending the letter in cents.
C: Bus
A group of people rent a bus for a day. The total cost of the bus is shared equally among the passengers.
x = the number of passengers.
y = the cost for each passenger in dollars.
D: Car value
My car loses about half of its value each year.
x = the time that has elapsed in years.
y = the value of my car in dollars.
!
"
!
"
!
"
!
"
Functions and Everyday Situations Student Materials Alpha Version January 2012
© 2012 MARS University of Nottingham S-2
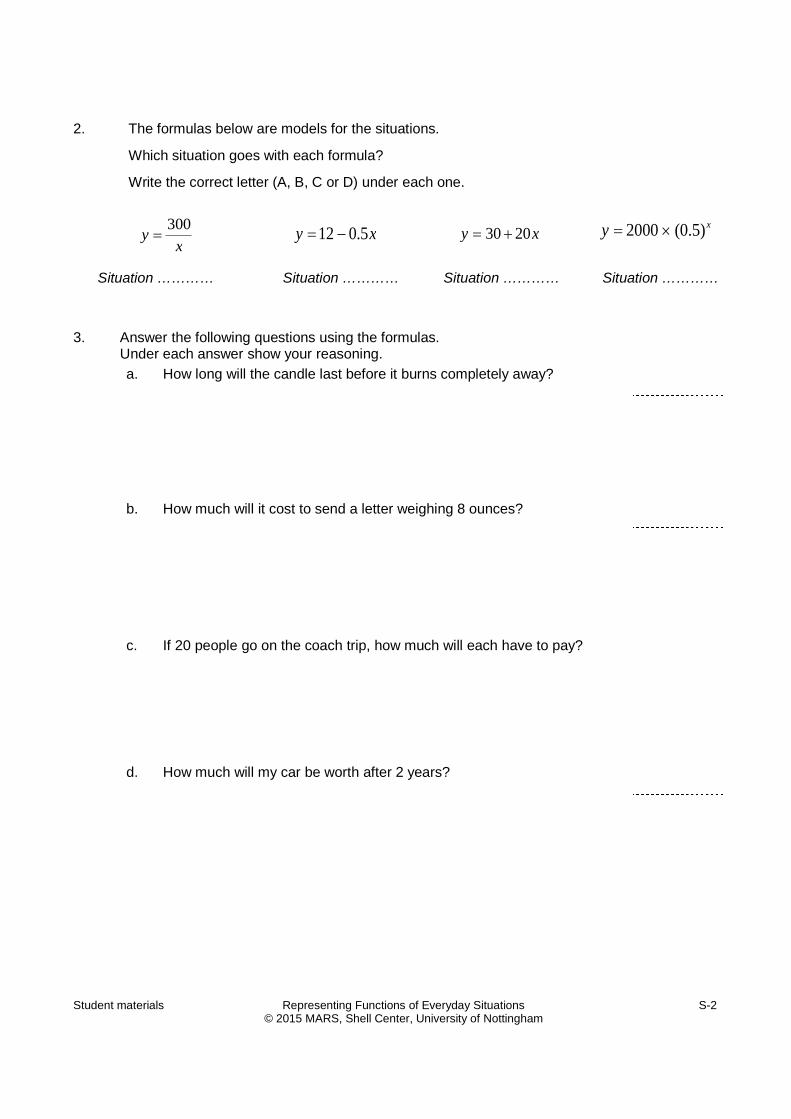
2. The formulas below are models for the situations.
Which situation goes with each formula?
Write the correct letter (A, B, C or D) under each one.
!
y =300x
!
y =12 " 0.5x
!
y = 50 + 20x
!
y = 2000 " (0.5)x
Situation !!!!
Situation !!!!
Situation !!!!
Situation !!!!
3. Answer the following questions using the formulas. Under each answer show your reasoning.
a. How long will the candle last before it burns completely away?
b. How much will it cost to send a letter weighing 8 ounces?
c. If 20 people go on the coach trip, how much will each have to pay?
d. How much will my car be worth after 2 years?
Teacher guide Representing Functions of Everyday Situations T-3
We suggest you make a list of your own questions, based on your students’ work. We recommend you either: • write one or two questions on each student’s work, or • give each student a printed version of your list of questions and highlight the appropriate
questions for individual students. If you do not have time to do this, you could select a few questions that will be of help to the majority of students, and write these on the board when you return the work to the students in the follow-up lesson.
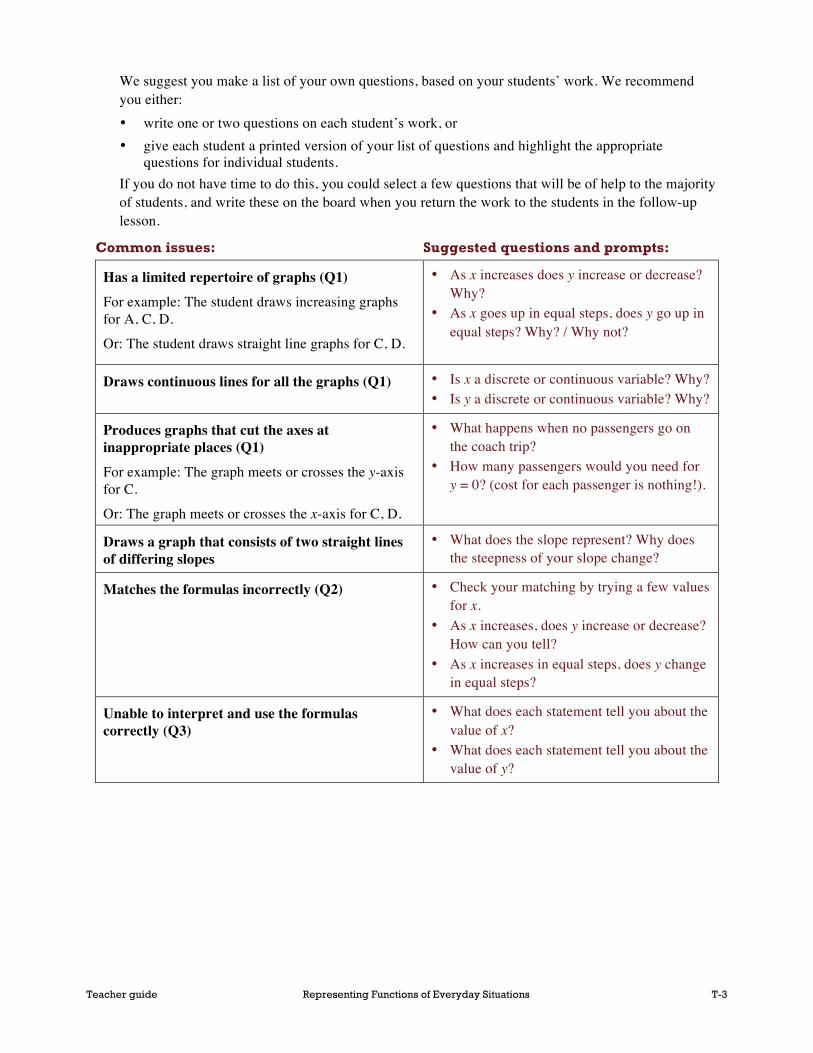
Common issues: Suggested questions and prompts:
Has a limited repertoire of graphs (Q1) For example: The student draws increasing graphs for A, C, D.
Or: The student draws straight line graphs for C, D.
• As x increases does y increase or decrease? Why?
• As x goes up in equal steps, does y go up in equal steps? Why? / Why not?
Draws continuous lines for all the graphs (Q1) • Is x a discrete or continuous variable? Why? • Is y a discrete or continuous variable? Why?
Produces graphs that cut the axes at inappropriate places (Q1) For example: The graph meets or crosses the y-axis for C.
Or: The graph meets or crosses the x-axis for C, D.
• What happens when no passengers go on the coach trip?
• How many passengers would you need for y = 0? (cost for each passenger is nothing!).
Draws a graph that consists of two straight lines of differing slopes
• What does the slope represent? Why does the steepness of your slope change?
Matches the formulas incorrectly (Q2) • Check your matching by trying a few values for x.
• As x increases, does y increase or decrease? How can you tell?
• As x increases in equal steps, does y change in equal steps?
Unable to interpret and use the formulas correctly (Q3)
• What does each statement tell you about the value of x?
• What does each statement tell you about the value of y?

Teacher guide Representing Functions of Everyday Situations T-4
SUGGESTED LESSON OUTLINE
Whole-class introduction (20 minutes) Give each student a mini-whiteboard, pen, and eraser. Maximize participation in the whole-class discussion by asking all students to show you a solution on their mini-whiteboards.
Use Slide P-1 to write or project the following situation:
Ask the students to sketch a graph that describes this situation:
Look at this situation carefully. Can you sketch a graph to show how y will depend on x?
Show me your answer on your mini-whiteboard and be prepared to give an explanation for what you have drawn.
Students may well come up with a range of answers. If this is the case, draw a few on the board and discuss which are appropriate models for the situation. Help students to develop their ideas until they are able to fully understand the most appropriate graph.
Some students, for example may draw a linear graph:
If this is the case, spend some time discussing the meaning of a linear graph. It is likely that students who have viewed the problem as a linear situation understand that the more workers that are involved, the less time it will take to paint the bridge. Explore the specific features of the graph and encourage students who have drawn non-linear graphs to participate in the discussion as well. It may be helpful to label some points on the graph:
What does point P tell you? [If only a few paint the bridge, it will take a long time.]
What about point Q? [A lot of workers will take a shorter time.]
What about the points R and S, where the line crosses the axes?
How can we change this graph so that it is a better model of the situation?
This kind of questioning should help students to see that the graph should not cross the axes. However, some students may simply suggest erasing the ends of the graph as a way of making it a
Functions and Everyday Situations Projector Resources
Painting the Bridge
P-1 © 2012 MARS, University of Nottingham Alpha Version January 2012 Projector resources:
Painting the Bridge
1
Painting the bridge A group of workers are planning to paint a bridge.
x = the number of workers
y = the length of time it will take the workers to paint the bridge
x
y
Number of workers
Tim
e to
pai
nt b
ridge
RP
QS
x
y
Number of workers
Tim
e to
pai
nt b
ridge

Teacher guide Representing Functions of Everyday Situations T-5
better model of the situation. Help students to understand why a curved graph is a more appropriate model. It might be appropriate to consider what happens to the amount of time taken to paint the bridge as the number of workers varies:
Suppose we know the time it takes for a specific number of workers to paint the bridge.
What would happen if we doubled the number of workers that paint the bridge? [You would halve the time it takes.]
What would this look like on the graph?
If we halved the number of workers, what would this look like?
Will these points be in a straight line?
What shape will these points make?
If some students in the class have successfully drawn a curved graph, encourage them to explain their reasoning to the rest of the class. Emphasize that strictly speaking the graph should not be continuous, as it does not make sense to have fractions of people painting a bridge. The domain of the graph should be discrete.
Once students are happy with the shape of the graph, ask them to think about an appropriate function that describes it.
Can you suggest a possible algebraic function that will fit this graph? [ ]
If students are struggling to come up with a possible function, consider a specific situation. Drawing up a table of values may also help students to see the relationship between x and y.
If it takes 20 people 5 years to paint a bridge, how long would it take 10 people? [10 years.]
How long would it take 50 people? [2 years.]
What would the function be in this case? [xy =100 or y = 100/x.]
Explain to students that during this lesson they are going to be considering a number of similar situations and thinking about the graphs and algebraic functions that can be used to model them.
Collaborative activity (1): matching situations to graphs (20 minutes) Organize the class into groups of two or three students.
Give each group the cut-up card sets: Everyday Situations 1, 2 and 3, and Graphs 1 and 2. Do not give out graphing calculators!
Explain how students are to work collaboratively. Slide P-2 of the projector resource summarizes these instructions:
Take turns to match a situation card to one of the sketch graphs. If you place a card, explain why that situation matches that graph. Everyone in your group should agree on and be able to explain your choice. If you think the graph could be improved in any way, say how it should be changed. For example you may think that it should be discrete rather than continuous. There are two blank graphs for you to complete! Arrange pairs side by side (not on top of one another) so I can see them as I walk around.
€
y =Ax
x
y
Number of workers
Tim
e to
pai
nt b
ridge

Teacher guide Representing Functions of Everyday Situations T-6
You may want to check that everyone understands each situation before students begin on the task. Tell students to ignore the questions on the situation cards for the moment.
The purpose of this structured group work is to make students engage with each other’s reasoning and take responsibility for the understanding of the group. Encourage students not to rush, but spend time justifying fully the pairing of the cards.
Whilst students work on the collaborative activity you have two tasks, to notice students’ approaches and difficulties and to support student reasoning:
Note different student approaches to the task Notice how students make a start on the task, where they get stuck, and how they interpret the situations. Do they sort the cards in any way before they try to match them? If so, what is their strategy? How do students go about completing the blank cards? Notice whether students are addressing the difficulties they experienced in the assessment task. You may want to use the questions in the Common issues table to help to address any misconceptions.
If students are struggling to get started on the task suggest that they focus on Situations A, B, C and D and see if they can find graphs to match these four situations first.
If you find that students are having difficulty imagining a situation, then talk it through with them. Ask them to describe orally what happens to y as x changes.
Support student reasoning Try not to make suggestions that move students towards a particular approach to the task. Instead, ask questions that help students clarify their thinking. It is important that students are encouraged to engage with their partner’s explanations and take responsibility for each other’s understanding.
Peter, you matched this graph with this situation. Gail, can you explain why Peter matched these two cards?
Prompt students to think and reason more deeply:
What happens to the temperature of the boiling kettle if you leave it standing?
Is the water in the kettle cooling at a constant rate?
When the kettle is very hot, does it cool down more quickly or more slowly than when it is nearly at room temperature? Why?
Which graph best shows this relationship?
Try out some values for this situation.
Encourage students to label their axes with the descriptions. Organizing their values into a table may help students to see a relationship between x and y.
Extending the lesson over two days If you are taking two days to complete the unit you might want to end the first lesson here. Before the end of the lesson, ask students to make a note of the cards they have successfully matched so far. Then, at the start of the second day, allow the students time to recreate their matches and familiarize themselves with their work, before they add in the Algebraic Functions cards.
Collaborative activity (2): matching situations and graphs to formulas (20 minutes) When students have had a chance to match up the situations and graphs, give each group the cut-up cards: Algebraic Functions, a large sheet of paper to make a poster, and a glue stick.
Now match these cards to the pairs you already have on the table.

Teacher guide Representing Functions of Everyday Situations T-7
You should be able to do this without using a graphing calculator.
After you have matched the function, try to answer the question on the right hand side of the situations card.
Students should be able to match the linear functions more easily, but may find the others much more challenging. Encourage them to use ‘strategic substitutions’ (not graphing calculators) to make their decisions:
Can you group these functions in a way that will help you match them?
Which of these functions are linear? Non-linear? Which are increasing/ decreasing?
Where does this function cross the x-axis / y-axis? Where does this function reach its maximum/ minimum value?
Show me a function that never crosses the x-axis. How do you know? Show me a function that intersects the origin. How do you know? Show me a function that has two x-intercepts. How do you know?
Support the students as in the first collaborative activity.
When students have matched an algebraic function card to the other two, allow them to check their answers using graphing calculators, then encourage them to try to answer the question on the situations card by looking at the form of the algebraic function. For example:
OK, you think that the function that shows how the height of the golf ball changes is:
How can we answer the question: “When does the ball hit the ground?” [Let y = 0.]
At this point, the cards may be stuck down and the questions answered on the poster.
Whole-class discussion (20 minutes) Organize a discussion about what has been learned and the different strategies students have used to match the cards. You may, first, want to select cards that most groups matched correctly to encourage good explanations, before selecting one or two cards that groups found difficult to match. It is likely that some groups will not have matched all the cards. The aim of this discussion is to encourage contributions from everyone in the class, rather than merely checking for correct matches.
Give me a situation/graph/algebraic function that was easy to match. Why was this?
Once one group has justified their choice for a particular match, ask students from other groups to contribute ideas of alternative matches/approaches. The intention is that you focus on getting students to understand and share their reasoning and explore the different approaches used within the class.
Did anyone find this situation/graph/algebraic function difficult to match or use a different strategy to the one explained?
When discussing a match, encourage students to listen carefully to each other’s explanations and comment on which explanation was easier to follow.
Did anyone manage to match a graph with the Folding Paper situation? Which graph did you choose? Why did you decide this graph best matched this situation?
Can anyone explain this match in a different way?
Did anyone choose a different graph for the Folding Paper situation?
Which explanation is easiest to understand?
€
y = 30x − 5x 2

Teacher guide Representing Functions of Everyday Situations T-8
Explore the situation in as much depth as possible, rather than just discussing the answer to the question on the card. Consider features of the graph as well as exploring in detail the ways in which the algebraic function relates to the situation.
In what ways could we improve graph G3 as a model for the Folding Paper situation? [The graph should be a series of discrete points as the number of folds can only be whole numbers. It should also stop at x = 8 as you cannot physically fold paper more than 8 times.]
Which algebraic function best matches graph G3? [A12: .]
What does the 1000 stand for in this function? [The thickness of the paper in inches.]
How thick would the paper be if you could fold it ten times? [about 1 inch.]
How thick would the paper be if you could fold it 50 times? [17 million miles!]
There will not be time to discuss all of the cards in this way and it is not necessary to do so. A discussion of a few cards that maximizes student involvement and encourages a thoughtful discussion and reflection of students’ work is recommended.
Follow-up lesson: Another Four Situations (20 minutes) Return the original assessment task Four Situations to the students, together with a copy of the task Another Four Situations.
If you have not added questions to individual pieces of work, then write your list of questions on the board. Students should select from this list only those questions they think are appropriate to their own work.
Look at your original response and the questions (on the board/written on your script.)
Answer these questions and revise your response. You may want to make notes on your mini-whiteboard.
Now look at the new task sheet, Another Four Situations.
Using what you have learned, answer the questions on this new task.
Some teachers give this for homework.
€
y =2x
1000
Teacher guide Representing Functions of Everyday Situations T-9
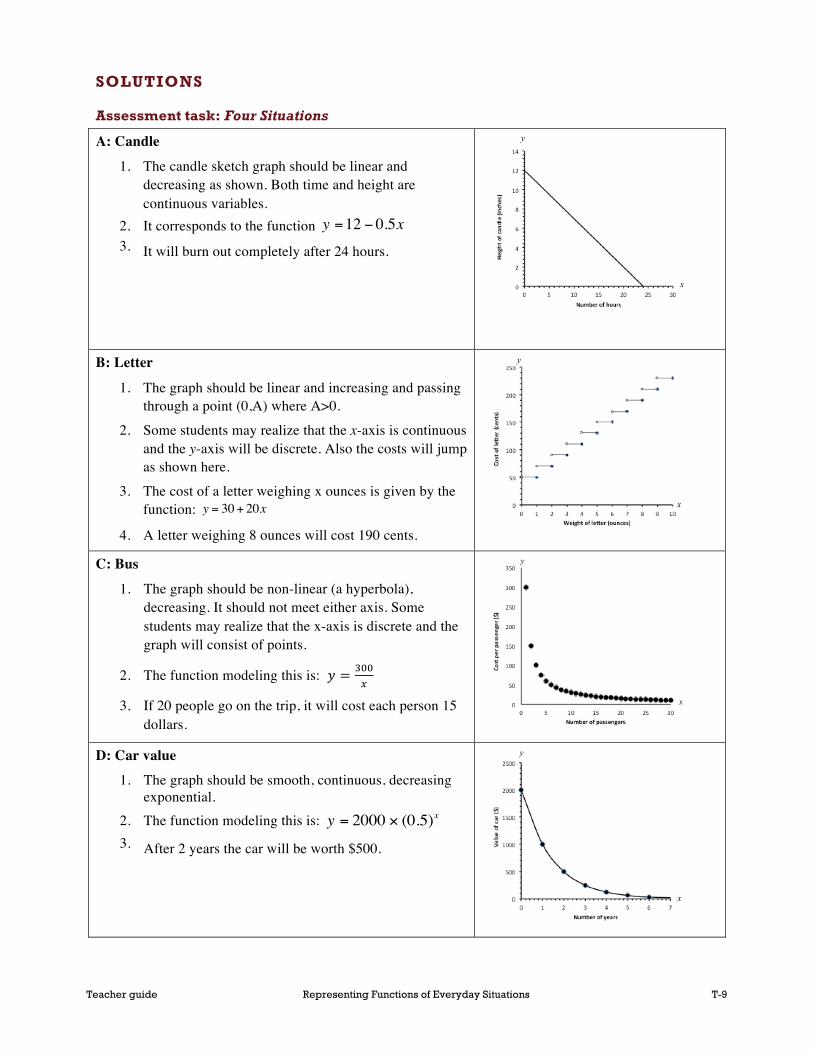
SOLUTIONS
Assessment task: Four Situations
A: Candle
1. The candle sketch graph should be linear and decreasing as shown. Both time and height are continuous variables.
2. It corresponds to the function 3. It will burn out completely after 24 hours.
B: Letter
1. The graph should be linear and increasing and passing through a point (0,A) where A>0.
2. Some students may realize that the x-axis is continuous and the y-axis will be discrete. Also the costs will jump as shown here.
3. The cost of a letter weighing x ounces is given by the function: y = 30+ 20x
4. A letter weighing 8 ounces will cost 190 cents.
C: Bus
1. The graph should be non-linear (a hyperbola), decreasing. It should not meet either axis. Some students may realize that the x-axis is discrete and the graph will consist of points.
2. The function modeling this is: 𝑦 = !""!
3. If 20 people go on the trip, it will cost each person 15 dollars.
D: Car value 1. The graph should be smooth, continuous, decreasing
exponential. 2. The function modeling this is: 3. After 2 years the car will be worth $500.
€
y =12 − 0.5x
y
x
y
x
y
x
€
y = 2000 × (0.5)x
y
x

Teacher guide Representing Functions of Everyday Situations T-10
Collaborative activity: making posters Students may change the shape of some of the curves or show the graph as discrete rather than continuous.
Situation Graph Formula
A. Plumber
A plumber charges a fixed fee for coming to your house, then charges a fixed amount per hour on top of this.
x = the time the job takes in hours.
y = the total cost of the plumber’s time in dollars.
G2 y
x
Step function is better
A3
Plumber charges $180 for a 3-hour job.
B. Cycling
A cyclist travels along a direct route from town A to town B.
x = the distance of the cyclist from town A in miles.
y = the distance of the cyclist from town B in miles.
G10 y
x
A4
Towns are 100 miles apart.
C. Movie subscription
You get two movies free, but then you get charged at a fixed rate per movie.
x = the number of movies seen.
y = the total money spent in dollars.
G4 y
x
Graph to be drawn on by student. Discrete points would be better.
A1
The fixed rate per movie is $5.
D. Internet café
An internet café charges a fixed amount per minute to use the internet.
x = the number of minutes spent on the internet.
y = the cost of using the internet in dollars.
G7 y
x
A2
$8 will buy 6 minutes.
E. Cooling kettle
A kettle of boiling water cools in a warm kitchen.
x = the time that has elapsed in minutes.
y = the temperature of the kettle in degrees Celsius.
G9 y
x
A11
As the water cools it approaches the room temperature of 20°C.
0"
50"
100"
150"
200"
250"
300"
350"
400"
0" 1" 2" 3" 4" 5" 6" 7" 8" 9"
€
y = 40x + 60
0"
20"
40"
60"
80"
100"
120"
0" 20" 40" 60" 80" 100" 120"
y = −x+100
0"
10"
20"
30"
40"
50"
60"
0" 2" 4" 6" 8" 10" 12" 14"
y = 5x −10
0"
1"
2"
3"
4"
5"
6"
7"
8"
9"
10"
0" 2" 4" 6" 8" 10" 12" 14"
€
y =3x4
0"
1000"
2000"
3000"
4000"
5000"
6000"
7000"
0" 1" 2" 3" 4" 5" 6" 7" 8" 9" 10"
€
y = 20 + 80 × (0.27)x

Teacher guide Representing Functions of Everyday Situations T-11
F. Ferris wheel
A ferris wheel turns round and round.
x = the time that has elapsed in seconds.
y = the height of a seat from the ground in meters.
G11 y
x
A10
The starting point is x = 0 and y = 30. After one complete turn y = 30.The Ferris wheel is at this height at x = 10 (half a turn) and x = 20 (complete turn).
It takes 20 seconds for the Ferris wheel to turn once.
G. Folding paper A piece of paper is folded in half. It is then folded in half again, and again….
x = the number of folds.
y = the thickness of the paper in inches.
G3 y
x
A12
Folding it ten times results in thickness of about an inch. This is impossible! x ≤ 8 in practice (try it!). The student may change the
shape of the curve. Paper can be folded up to 8 times. Discrete points would be better.
H. Speed of golf shot
A golfer hits a ball.
x = the time that has elapsed in seconds.
y = the speed of the ball in meters per second.
G8 y
x
A7
Speed is a minimum after 3 seconds.
I. Test drive
A car drives along a test track.
x = the average speed of the car in meters per second.
y = the time it takes to travel the length of the track in seconds.
G1 y
x
A5
Distance = speed × time = y × x.
The track is 200 meters long.
J. Balloon
A man blows up a balloon.
x = volume of air he has blown in cubic inches.
y = diameter of the balloon in inches.
G6 y
x
A6
x = 1,000.
Diameter of balloon is about 1 foot (12.5 inches). If puffs are allowed the
graph will show steps. At some point the balloon will pop.
!"
#!"
$!"
%!"
&!"
'!"
(!"
)!"
!" '" #!" #'" $!" $'" %!" %'" &!"
€
y = 30 + 30sin(18x)
0"
50"
100"
150"
200"
250"
300"
0" 1" 2" 3" 4" 5" 6" 7" 8" 9" 10"
€
y =2x
1000
!"
#"
$!"
$#"
%!"
%#"
&!"
&#"
'!"
'#"
!" $" %" &" '" #" ("
€
y = 10 (x − 3)2 + 7
0"
20"
40"
60"
80"
100"
120"
140"
160"
180"
200"
0" 5" 10" 15" 20" 25" 30"
y = 200x
0"
0.5"
1"
1.5"
2"
2.5"
3"
3.5"
4"
4.5"
0" 5" 10" 15" 20" 25" 30"
€
y =54
x3

Teacher guide Representing Functions of Everyday Situations T-12
K. Height of golf shot.
A golfer hits a ball.
x = the time that has elapsed in seconds.
y = the height of the ball in meters.
G5 y
x
A9
The ball hits the ground when:
5x(6 − x) = 0; x = 0 or x = 6.
Ball hits ground after 6 seconds.
L. Film projector
A film is shown on a screen using a small projector.
x = the distance from the projector to the screen in feet.
y = the area of the picture in square feet.
G12 y
x
A8
When projector is 10 feet away, area of picture is 25 square feet.
Assessment task: Another Four Situations
A: Photographer 1. The graph should be linear and
increasing and passing through a point (0,A) where A>0.
Some students may realize that the x-axis is continuous and the y-axis will be discrete. The charges will jump as shown here.
2. It corresponds to the function y = 50(1+ x)
3. The photographer will charge $400 for a 7 hour 'shoot'.
B: Football
1. The graph should be linear and increasing and passing through a point (1,0). Some students may realize that both the x-axis and the y-axis are discrete.
2. The function modeling this is:y = 2x − 2
3. When there are 20 teams in the league, each team will play 38 games.
!"
#"
$!"
$#"
%!"
%#"
&!"
&#"
'!"
'#"
#!"
!" $" %" &" '" #" ("
€
y = 30x− 5x2
0"
20"
40"
60"
80"
100"
120"
0" 2" 4" 6" 8" 10" 12" 14" 16" 18" 20"
€
y =14
x2
0 1 2 3 4 5 6 70
100
200
300
400
Cha
rge
for t
he s
hoot
Time on shoot
Tem
pera
ture
of c
offe
e(d
egre
es c
elci
us)
Time (minutes)��
���
���
���
���
��
��
���
���
�� � ��� �� ��� �� ��� �� ���
��
��������
��������������������
�
�� ���������� �����������

Teacher guide Representing Functions of Everyday Situations T-13
C: Cup of coffee 1. The graph should be smooth,
continuous, decreasing exponential. 2. The function modeling this is:
€
y = 20 + 70 × (0.3)x 3. After 3 minutes, the temperature of the
coffee will be 21.89°C.
D: Saving up 1. The graph should be non-linear (a
hyperbola), decreasing. It should not meet either axis. Some students may realize that the y-axis is discrete and the graph will consist of points.
2. The function modeling this is: y = 100x
3. It will take Tanya 20 weeks to save for the coat.
!"#!"$!"%!"&!"'!"(!")!"*!"+!"#!!"
!" #" $" %" &" '" (" )" *" +" #!"
!"#$"
%&'(%")*+),*-
"")
)./"0%""1)2"314(15)
!4#").#46('"15)
��
���
���
���
���
��
��
�� ��� ��� �� ��� ����
���������� ��������������
�����
�� �����������������������
Tim
e ta
ken
to s
ave
$100
(wee
ks)
Amount saved each week ($)

Student materials Representing Functions of Everyday Situations S-1© 2015 MARS, Shell Center, University of Nottingham
Four Situations
1. Sketch a graph to model each of the following situations.Think about the shape of the graph and whether it should be a continuous line or not.
A: Candle
Each hour a candle burns down the sameamount.
x = the number of hours that have elapsed.
y = the height of the candle in inches.
B: Letter
When sending a letter, you pay quite a lot forletters weighing up to an ounce. You thenpay a smaller, fixed amount for eachadditional ounce (or part of an ounce.)
x = the weight of the letter in ounces.
y = the cost of sending the letter in cents.
C: Bus
A group of people rent a bus for a day. Thetotal cost of the bus is shared equally amongthe passengers.
x = the number of passengers.
y = the cost for each passenger in dollars.
D: Car value
My car loses about half of its value eachyear.
x = the time that has elapsed in years.
y = the value of my car in dollars.
x
y
x
y
x
y
x
y
Student materials Representing Functions of Everyday Situations S-2© 2015 MARS, Shell Center, University of Nottingham
2. The formulas below are models for the situations.
Which situation goes with each formula?
Write the correct letter (A, B, C or D) under each one.
y = 30 + 20x
Situation ………… Situation ………… Situation ………… Situation …………
3. Answer the following questions using the formulas.Under each answer show your reasoning.
a. How long will the candle last before it burns completely away?
b. How much will it cost to send a letter weighing 8 ounces?
c. If 20 people go on the coach trip, how much will each have to pay?
d. How much will my car be worth after 2 years?
y =300
xy =12 - 0.5x y = 2000 ´ (0.5)x

Student materials Representing Functions of Everyday Situations S-3© 2015 MARS, Shell Center, University of Nottingham
Everyday Situations 1
A. Plumber
A plumber charges a fixed fee for coming toyour house, then charges a fixed amount perhour on top of this.
x = the time the job takes in hours.
y = the total cost of the plumber’s time indollars.
How much does the plumbercharge for a 3-hour job?
B. Cycling
A cyclist travels along a direct route from town Ato town B.
x = the distance of the cyclist from town A inmiles.
y = the distance of the cyclist from town B inmiles.
How far apart are the towns?
C. Movie subscription
You get two movies free, but then you getcharged at a fixed rate per movie.
x = the number of movies seen.
y = the total money spent in dollars. What is the fixed rate permovie?
D. Internet café
An internet café charges a fixed amount perminute to use the internet.
x = the number of minutes spent on theinternet.
y = the cost of using the internet in dollars.How many minutes will $8buy?

Student materials Representing Functions of Everyday Situations S-4© 2015 MARS, Shell Center, University of Nottingham
Everyday Situations 2
E. Cooling kettle
A kettle of boiling water cools in a warm kitchen.
x = the time that has elapsed in minutes.
y = the temperature of the kettle in degreesCelsius.
What is the temperature ofthe room?
F. Ferris wheel
A Ferris wheel turns round and round.
x = the time that has elapsed in seconds.
y = the height of a seat from the ground inmeters.
How long does it take theFerris wheel to turn once?
G. Folding paper
A piece of paper is folded in half. It is then foldedin half again, and again…
x = the number of folds.
y = the thickness of the paper in inches. How thick would the paperbe if you could fold it 10times?
H. Speed of golf shot
A golfer hits a ball.
x = the time that has elapsed in seconds.
y = the speed of the ball in meters per second.When is the ball travellingmost slowly?
Student materials Representing Functions of Everyday Situations S-5© 2015 MARS, Shell Center, University of Nottingham
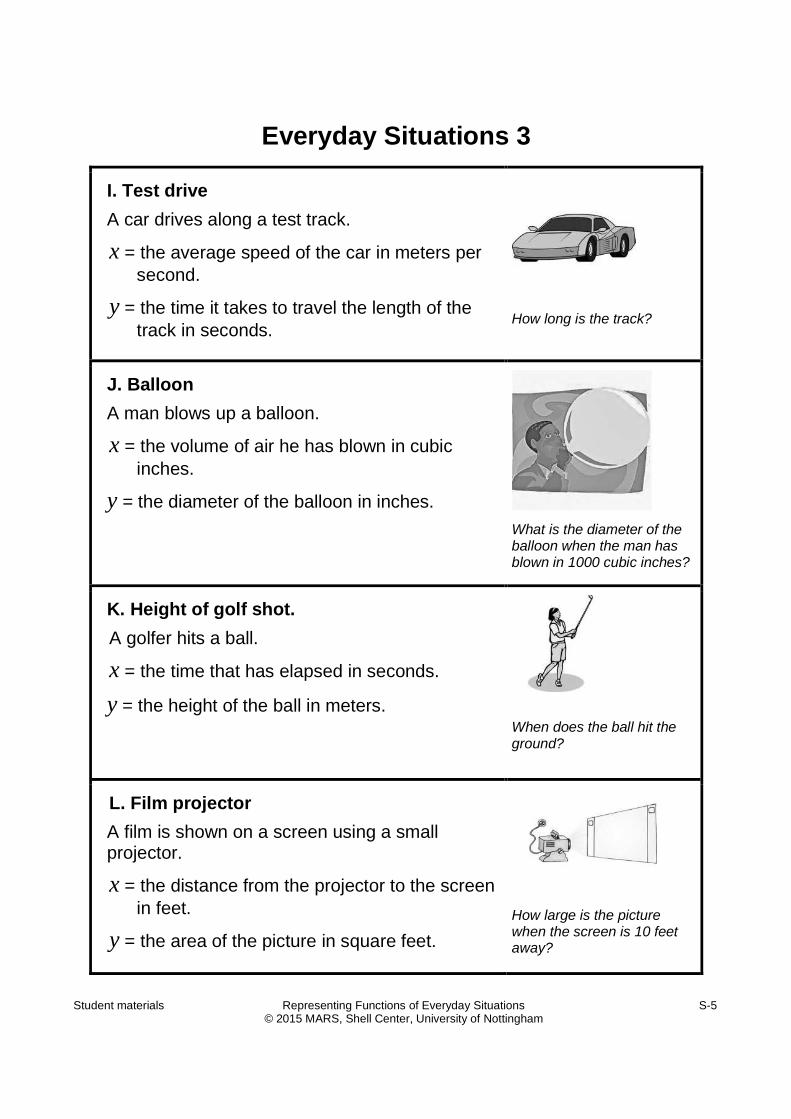
Everyday Situations 3
I. Test drive
A car drives along a test track.
x = the average speed of the car in meters persecond.
y = the time it takes to travel the length of thetrack in seconds.
How long is the track?
J. Balloon
A man blows up a balloon.
x = the volume of air he has blown in cubicinches.
y = the diameter of the balloon in inches.
What is the diameter of theballoon when the man hasblown in 1000 cubic inches?
K. Height of golf shot.
A golfer hits a ball.
x = the time that has elapsed in seconds.
y = the height of the ball in meters.When does the ball hit theground?
L. Film projector
A film is shown on a screen using a smallprojector.
x = the distance from the projector to the screenin feet.
y = the area of the picture in square feet.
How large is the picturewhen the screen is 10 feetaway?
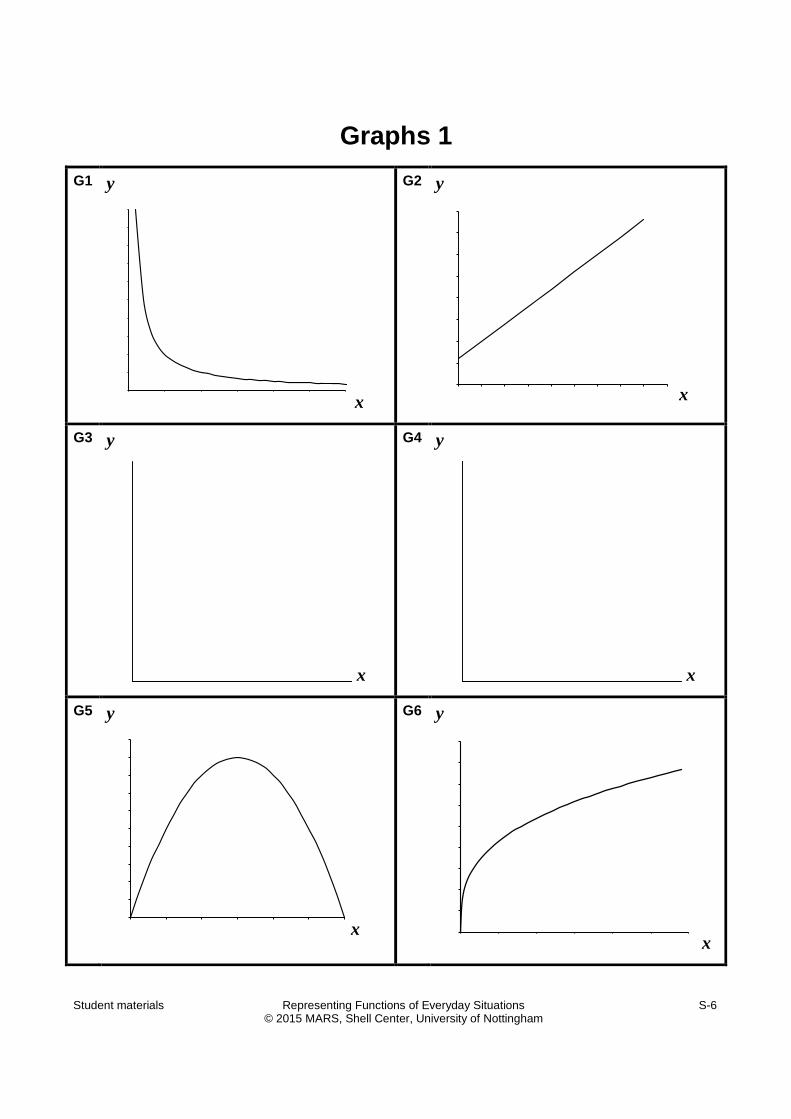
Student materials Representing Functions of Everyday Situations S-6© 2015 MARS, Shell Center, University of Nottingham
Graphs 1
G1 y
x
G2 y
x
G3 y
x
G4 y
x
G5 y
x
G6 y
x
0
20
40
60
80
100
120
140
160
180
200
0 5 10 15 20 25 30
0
50
100
150
200
250
300
350
400
0 1 2 3 4 5 6 7 8 9
! "
#"
$! "
$#"
%! "
%#"
&! "
&#"
' ! "
' #"
#! "
! " $" %" &" ' " #" ( "0
0.5
1
1.5
2
2.5
3
3.5
4
4.5
0 5 10 15 20 25 30

Student materials Representing Functions of Everyday Situations S-7© 2015 MARS, Shell Center, University of Nottingham
Graphs 2
G7 y
x
G8 y
x
G9 y
x
G10 y
x
G11 y
x
G12 y
x
0
1
2
3
4
5
6
7
8
9
10
0 2 4 6 8 10 12 14
! "
#"
$! "
$#"
%! "
%#"
&! "
&#"
' ! "
' #"
! " $" %" &" ' " #" ( "
0
1000
2000
3000
4000
5000
6000
7000
0 1 2 3 4 5 6 7 8 9 100
20
40
60
80
100
120
0 20 40 60 80 100 120
! "
#! "
$! "
%! "
&! "
' ! "
( ! "
) ! "
! " ' " #! " #' " $! " $' " %! " %' " &! "
0
20
40
60
80
100
120
0 2 4 6 8 10 12 14 16 18 20

Student materials Representing Functions of Everyday Situations S-8© 2015 MARS, Shell Center, University of Nottingham
Algebraic Functions
A1A2
A3 A4
A5A6
A7A8
A9 A10
A11 A12
y = 5x -10 y =3x
4
y = 40x + 60 y = -x +100
y =200
xy =
5
4x3
y =10 (x - 3)2 + 7 y =1
4x 2
y = 30x - 5x 2 y = 30 + 30sin(18x)
y = 20 + 80 ´ (0.27) xy =
2x
1000

Student materials Representing Functions of Everyday Situations S-9© 2015 MARS, Shell Center, University of Nottingham
Another Four Situations
1. Sketch a graph to model each of the following situations.Think about the shape of the graph and whether it should be a continuous line or not.
A: Photographer
For each ‘shoot’ a photographer charges afixed fee for expenses, then a fixedamount for each hour (or part of an hour.)
x = the time a ‘shoot’ takes in hours.
y = the total amount the photographercharges.
B: Football
In a football league, each team plays allother teams twice.
x = the number of teams.
y = the number of games played by oneteam.
C: Cup of coffee
A cup of coffee cools in a warm diner.
x = the time that has elapsed in minutes.
y = the temperature of the coffee indegrees Celsius.
D: Saving up
Tanya saves a fixed amount each weekuntil she has enough money in the bank tobuy a coat.
x = the amount saved each week.
y = the time that it takes Tanya to saveenough for the coat.
x
y
x
y
x
y
x
y

Student materials Representing Functions of Everyday Situations S-10© 2015 MARS, Shell Center, University of Nottingham
2. The formulas below are models for the situations.
Which situation goes with each formula?
Write the correct letter (A, B, C or D) under each one.
y = 20 + 70 ´ (0.3)x y =100
xy = 2x - 2 y = 50(1+ x)
Situation ………… Situation ………… Situation ………… Situation …………
3. Answer the following questions using the formulas.Under each answer show your reasoning.
a. How much will the photographer charge for a 7-hour ‘shoot’?
b. If there are 20 teams in the league, how many games will each teamplay?
c. What will be the temperature of the coffee after 3 minutes?
d. If Tanya saves $5 a week, how long will it take her to save for the coat?
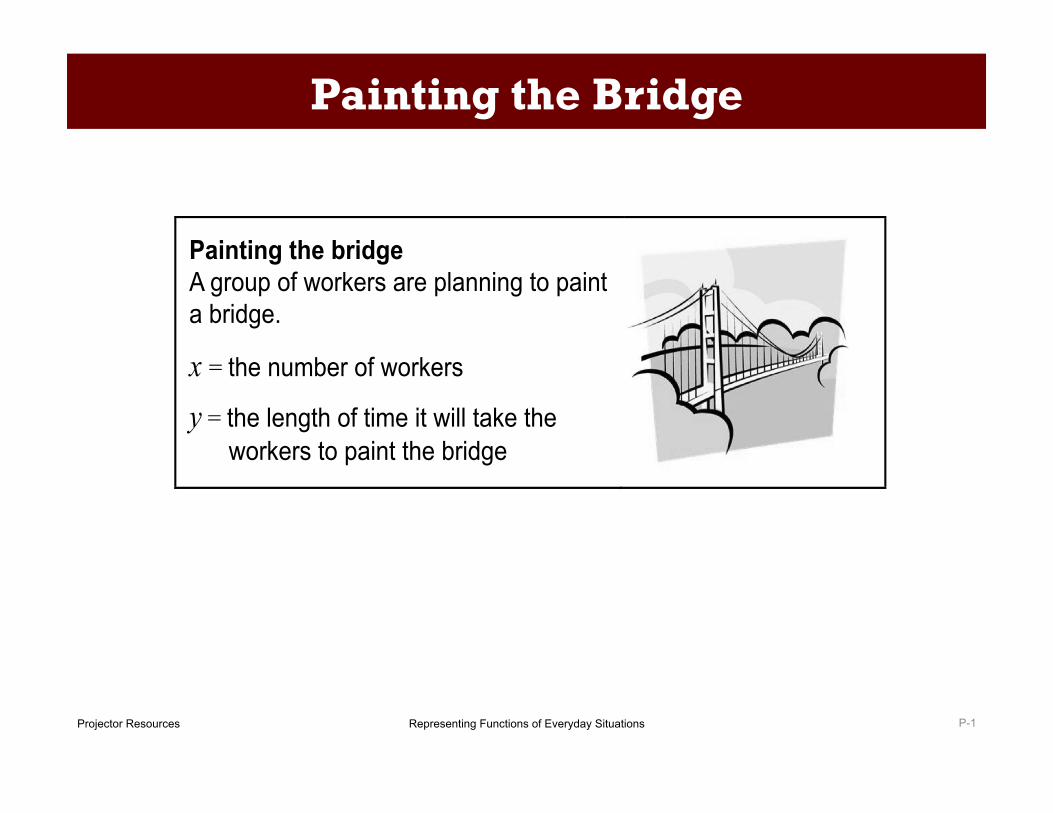
Representing Functions of Everyday Situations Projector Resources
Painting the Bridge
P-1 © 2012 MARS, University of Nottingham Alpha Version January 2012 Projector resources:
Painting the Bridge
1
Painting the bridge A group of workers are planning to paint a bridge.
x = the number of workers
y = the length of time it will take the workers to paint the bridge
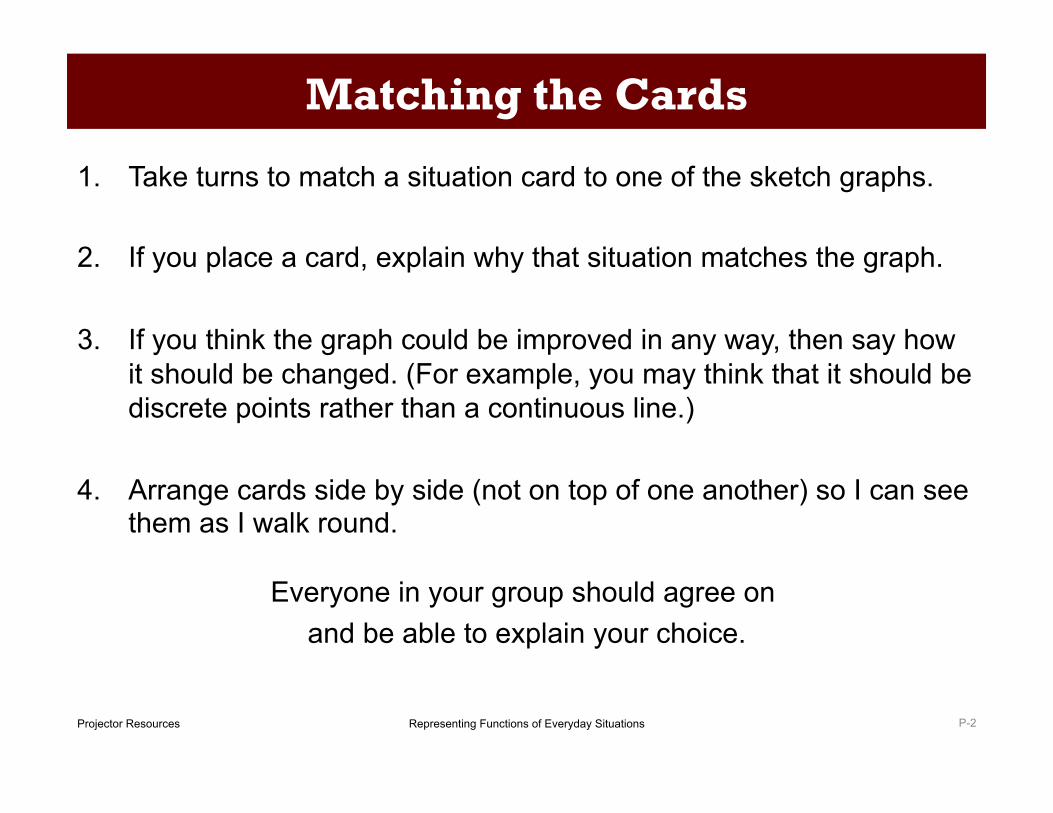
Representing Functions of Everyday Situations Projector Resources
Matching the Cards
1. Take turns to match a situation card to one of the sketch graphs.
2. If you place a card, explain why that situation matches the graph.
3. If you think the graph could be improved in any way, then say how it should be changed. (For example, you may think that it should be discrete points rather than a continuous line.)
4. Arrange cards side by side (not on top of one another) so I can see them as I walk round.
Everyone in your group should agree on and be able to explain your choice.
P-2

© 2015 MARS, Shell Center, University of Nottingham This material may be reproduced and distributed, without modification, for non-commercial purposes, under the Creative Commons License detailed at http://creativecommons.org/licenses/by-nc-nd/3.0/
All other rights reserved. Please contact [email protected] if this license does not meet your needs.
Mathematics Assessment Project
Classroom Challenges
These materials were designed and developed by the Shell Center Team at the Center for Research in Mathematical Education
University of Nottingham, England:
Malcolm Swan, Nichola Clarke, Clare Dawson, Sheila Evans, Colin Foster, and Marie Joubert
with Hugh Burkhardt, Rita Crust, Andy Noyes, and Daniel Pead
We are grateful to the many teachers and students, in the UK and the US, who took part in the classroom trials that played a critical role in developing these materials
The classroom observation teams in the US were led by David Foster, Mary Bouck, and Diane Schaefer
This project was conceived and directed for The Mathematics Assessment Resource Service (MARS) by
Alan Schoenfeld at the University of California, Berkeley, and Hugh Burkhardt, Daniel Pead, and Malcolm Swan at the University of Nottingham
Thanks also to Mat Crosier, Anne Floyde, Michael Galan, Judith Mills, Nick Orchard, and Alvaro Villanueva who contributed to the design and production of these materials
This development would not have been possible without the support of Bill & Melinda Gates Foundation
We are particularly grateful to Carina Wong, Melissa Chabran, and Jamie McKee
The full collection of Mathematics Assessment Project materials is available from
http://map.mathshell.org
Related Documents