REPRESENTATIVE FARMS ECONOMIC OUTLOOK FOR THE DECEMBER 2006 FAPRI/AFPC BASELINE AFPC Briefing Paper 06-8 James W. Richardson Joe L. Outlaw George M. Knapek J. Marc Raulston Brian K. Herbst Roland J. Fumasi David P. Anderson Steven L. Klose Agricultural and Food Policy Center Department of Agricultural Economics Texas Agricultural Experiment Station Texas Cooperative Extension Texas A&M University December 2006 College Station, Texas 77843-2124 Telephone: (979) 845-5913 Fax: (979) 845-3140 Web Site: http://www.afpc.tamu.edu/

Welcome message from author
This document is posted to help you gain knowledge. Please leave a comment to let me know what you think about it! Share it to your friends and learn new things together.
Transcript
REPRESENTATIVE FARMS ECONOMIC OUTLOOK FOR THE DECEMBER 2006
FAPRI/AFPC BASELINE
AFPC Briefing Paper 06-8
James W. Richardson Joe L. Outlaw
George M. Knapek J. Marc Raulston Brian K. Herbst
Roland J. Fumasi David P. Anderson
Steven L. Klose
Agricultural and Food Policy Center Department of Agricultural Economics Texas Agricultural Experiment Station
Texas Cooperative Extension Texas A&M University
December 2006
College Station, Texas 77843-2124 Telephone: (979) 845-5913
Fax: (979) 845-3140 Web Site: http://www.afpc.tamu.edu/
EXECUTIVE SUMMARY
The Agricultural and Food Policy Center (AFPC) at Texas A&M University develops and maintains data to simulate 100 representative crop, dairy, and livestock operations in major production areas in 28 states. The chief purpose of this analysis is to project those farms’ economic viability by region and commodity for 2006 through 2011. The data necessary to simulate the economic activity of these operations is developed through ongoing cooperation with panels of agricultural producers in each of these states. The Food and Agricultural Policy Research Institute (FAPRI) provided projected prices, policy variables, and input inflation rates in their December 2006 Baseline. Under the December 2006 Baseline, 25 of the 65 crop farms are considered in good liquidity condition (less than a 25 percent chance of negative ending cash in 2011). Five crop farms have between a 25 percent and a 50 percent likelihood of negative ending cash. The remaining 35 crop farms have greater than a 50 percent chance of negative ending cash. Additionally, 33 of the 65 crop farms are considered in good equity position (less than a 25 percent chance of decreasing real net worth during the study period). Eight crop farms have between a 25 percent and 50 percent likelihood of losing real net worth, and 24 crop farms have greater than a 50 percent probability of decreasing real net worth. The following discussion provides an overall evaluation by commodity considering both liquidity and equity measures.
• FEEDGRAIN FARMS: Thirteen of the 19 feedgrain farms are in good overall financial condition. Two can be considered to be in marginal condition, and four are in poor condition.
• WHEAT FARMS: Eight of the 11 wheat farms are classified in good financial
condition, two are marginal, and one is in poor condition.
• COTTON FARMS: Four of the 20 cotton farms are classified in good condition, four are in marginal condition, and 12 are in poor condition. Also, 11 of these farms have more than a 50 percent chance of losing real net worth by 2011.
• RICE FARMS: One of the 15 rice farms is in good condition, one is classified in
marginal condition, and 13 farms are projected to be in poor financial condition through 2011.
• DAIRY FARMS: Seven of the 23 dairy farms are in good overall financial
condition. Seven are considered to be in marginal condition, and nine are in poor condition.
• BEEF CATTLE RANCHES: Six of the 12 cattle ranches are classified in good
financial condition, five are classified in marginal condition, and one is projected in poor condition.
REPRESENTATIVE FARMS ECONOMIC OUTLOOK FOR THEDECEMBER 2006 FAPRI/AFPC BASELINE
The farm level economic impacts of the Farm Security and Rural Investment Act of 2002 on representative crop and livestock operations are projected in this report. The analysis was conducted over the 2004-2011 planning horizon using FLIPSIM, AFPC’s whole farm simulation model. Data to simulate farming operations in the nation’s major production regions came from two sources:
• Producer panel cooperation to develop economic information to describe and simulate representative crop, livestock, and dairy farms, and
• Projected prices, policy variables, and input inflation rates from the Food and Agricultural Policy Research Institute (FAPRI) December 2006 Baseline.
The FLIPSIM policy simulation model incorporates the historical risk faced by farmers for prices and production. This report presents the results of the December 2006 Baseline in a risk context using selected simulated probabilities and ranges for annual net cash farm income values. The probability of a farm experiencing negative ending cash reserves and the probability of a farm losing real net worth are included as indicators of the cash flow and equity risks facing farms through the year 2011.
Definitions of Variables in the Summary Tables
• Overall Financial Position, 2006-2011 -- As a means of summarizing the representative farms’ economic efficiency, liquidity, and solvency position, AFPC classifies each farm as being in either a good (green), marginal (yellow) or poor (red) position. AFPC defines a farm is in a good financial position when it has less than a 25 percent chance each of a negative ending cash position and less than a 25 percent chance of losing real net worth. If the probabilities of these events are between 25 and 50 percent the farm is classified as marginal. A probability greater than 50 percent places the farm in a poor financial position.
• Receipts -- 2006-2011 average of cash receipts from all farm related sources, including market sales, CCP and direct payments, marketing loan gains/LDPs, crop insurance indemnities, and other receipts.
• Payments -- 2006-2011 average of annual counter cyclical payments, direct payments, and marketing loan gains/LDPs for crops and the MILC program payment for dairy farms.
• NCFI -- 2006-2011 average net cash farm income equals average total receipts minus average total cash expenses.
• Reserve 2011 -- equals total cash on hand at the end of year 2011. Ending cash equals beginning cash reserves plus net cash farm income and interest earned on cash reserves less principal payments, federal taxes (income and self employment), state income taxes, family living withdrawals, and actual machinery replacement costs (not depreciation).
• Net Worth 2011 -- equity equals total assets including land minus total debt from all sources and is reported at the end of 2011.
• CRNW -- annualized percentage change in the operator’s net worth from January 1, 2006 through December 31, 2011, after adjusting for inflation.

Table 1. FAPRI December 2006 Baseline Projections of Crop and Livestock Prices, 2004-2011
2004 2005 2006 2007 2008 2009 2010 2011
Crop Prices
Corn ($/bu.) 2.06 2.00 2.89 3.00 3.02 3.07 3.08 3.09
Wheat ($/bu.) 3.40 3.42 4.27 4.13 4.11 4.18 4.22 4.27
Cotton ($/lb.) 0.4160 0.4770 0.4674 0.5029 0.5185 0.5192 0.5196 0.5212
Sorghum ($/bu.) 1.79 1.86 2.83 2.82 2.82 2.88 2.89 2.92
Soybeans ($/bu.) 5.74 5.66 5.66 6.38 6.70 6.69 6.64 6.53
Barley ($/bu.) 2.48 2.53 2.94 3.07 3.09 3.10 3.08 3.07
Oats ($/bu.) 1.48 1.63 1.88 1.86 1.88 1.91 1.92 1.93
Rice ($/cwt.) 7.33 7.62 9.10 8.12 8.18 8.55 8.59 8.61
Soybean Meal ($/ton) 174.45 166.12 160.40 176.08 179.02 175.23 170.10 166.02
All Hay ($/ton) 92.00 98.20 107.72 106.26 105.53 105.88 106.36 106.67
Peanuts ($/ton) 378.00 346.00 357.00 408.01 436.66 441.96 435.23 431.30
Cattle Prices
Feeder Cattle ($/cwt) 111.79 120.02 118.63 111.05 102.86 96.51 92.15 88.90
Fat Cattle ($/cwt) 84.75 87.28 85.62 85.30 84.20 82.83 80.30 78.47
Culled Cows ($/cwt) 52.35 54.36 48.44 48.04 46.83 44.95 42.96 41.43
Milk Price
U.S. All Milk Price ($/cwt) 16.13 15.14 12.85 13.89 14.12 14.23 14.3 14.43
Source: Food and Agricultural Policy Research Institute (FAPRI) at the University of Missouri-Columbia and Iowa State University.
Table 2. FAPRI December 2006 Baseline Assumed Rates of Change in Input Prices, Annual Interest Rates, and Annual Changes in Land Values, 2005-2011
2005 2006 2007 2008 2009 2010 2011
Annual Rate of Change for Input Prices Paid
Seed Prices (%) 6.33 2.98 2.43 0.92 0.94 1.09 1.05
All Fertilizer Prices (%) 18.63 1.59 -5.27 -0.60 -2.15 -3.14 -6.98
Herbicide Prices (%) 2.65 1.15 1.51 -0.47 -1.01 -0.74 -0.22
Insecticide Prices (%) -1.39 0.68 -0.14 -1.87 -0.81 0.72 1.25
Fuel and Lube Prices (%) 38.89 14.95 -2.36 -0.45 -0.93 -0.78 -1.51
Machinery Prices (%) 6.79 3.94 3.95 2.43 1.46 1.62 1.91
Wages (%) 3.13 1.68 1.87 2.44 2.82 3.01 3.13
Supplies (%) 5.51 5.04 5.40 3.83 2.25 1.39 0.76
Repairs (%) 4.20 3.34 2.15 1.44 1.33 1.40 1.59
Services (%) 3.23 4.02 2.58 0.28 -0.35 0.06 0.55
Taxes (%) 0.80 2.44 5.73 2.68 -1.11 0.87 0.94
PPI Items (%) 6.87 3.28 2.07 0.58 -0.04 0.30 0.23
PPI Total (%) 6.06 3.50 2.16 0.99 0.40 0.59 0.62
Annual Change in Consumer Price Index (%) 3.38 3.27 2.18 2.01 1.79 1.76 1.84
Annual Interest Rates
Long-Term (%) 5.43 6.02 6.13 6.35 6.58 6.55 6.61
Intermediate-Term (%) 4.40 4.87 4.96 5.14 5.33 5.30 5.35
Savings Account (%) 1.51 1.67 1.70 1.76 1.82 1.82 1.83
Annual Rate of Change for U.S. Land Prices (%) 21.32 15.15 6.47 4.09 1.51 0.66 1.39
Source: Food and Agricultural Policy Research Institute (FAPRI) at the University of Missouri-Columbia and Iowa State University.
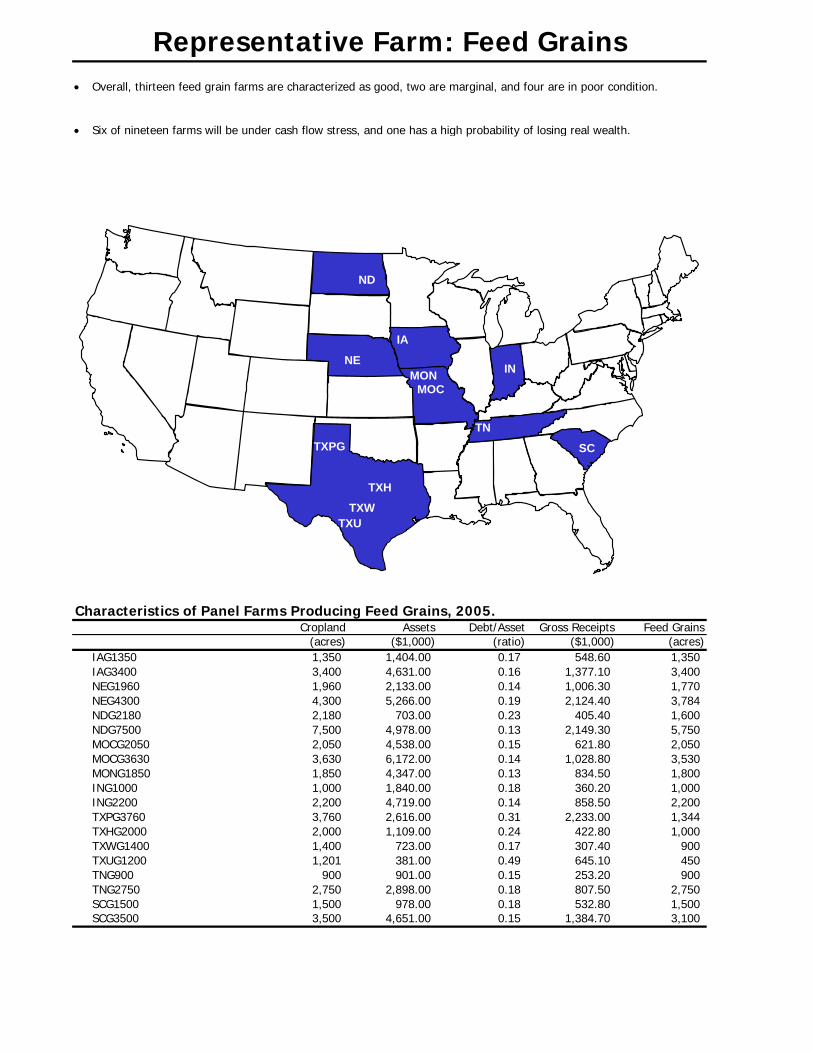
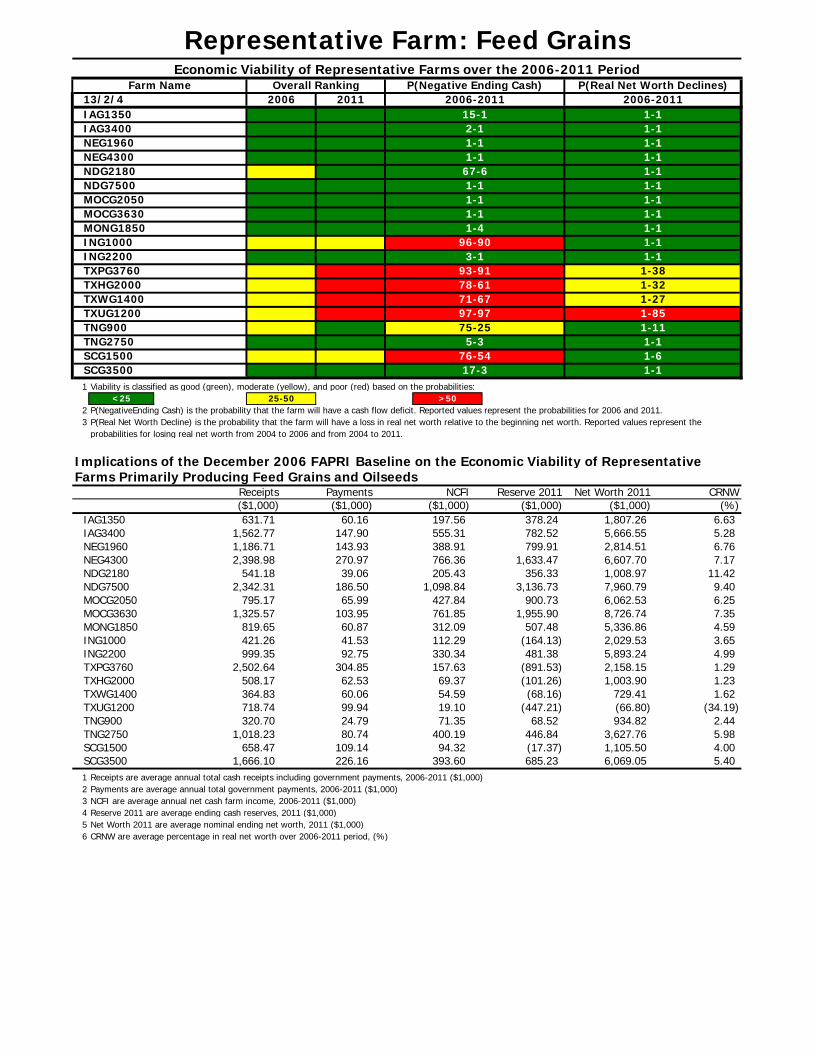
• Overall, thirteen feed grain farms are characterized as good, two are marginal, and four are in poor condition.
• Six of nineteen farms will be under cash flow stress, and one has a high probability of losing real wealth.
Characteristics of Panel Farms Producing Feed Grains, 2005.Cropland Assets Debt/Asset Gross Receipts Feed Grains
(acres) ($1,000) (ratio) ($1,000) (acres)IAG1350 1,350 1,404.00 0.17 548.60 1,350IAG3400 3,400 4,631.00 0.16 1,377.10 3,400NEG1960 1,960 2,133.00 0.14 1,006.30 1,770NEG4300 4,300 5,266.00 0.19 2,124.40 3,784NDG2180 2,180 703.00 0.23 405.40 1,600NDG7500 7,500 4,978.00 0.13 2,149.30 5,750MOCG2050 2,050 4,538.00 0.15 621.80 2,050MOCG3630 3,630 6,172.00 0.14 1,028.80 3,530MONG1850 1,850 4,347.00 0.13 834.50 1,800ING1000 1,000 1,840.00 0.18 360.20 1,000ING2200 2,200 4,719.00 0.14 858.50 2,200TXPG3760 3,760 2,616.00 0.31 2,233.00 1,344TXHG2000 2,000 1,109.00 0.24 422.80 1,000TXWG1400 1,400 723.00 0.17 307.40 900TXUG1200 1,201 381.00 0.49 645.10 450TNG900 900 901.00 0.15 253.20 900TNG2750 2,750 2,898.00 0.18 807.50 2,750SCG1500 1,500 978.00 0.18 532.80 1,500SCG3500 3,500 4,651.00 0.15 1,384.70 3,100
Representative Farm: Feed Grains
IA
MONMOC
TN
SC
TXH
INNE
TXWTXU
TXPG
ND
1 Viability is classified as good (green), moderate (yellow), and poor (red) based on the probabilities:<25
2 P(NegativeEnding Cash) is the probability that the farm will have a cash flow deficit. Reported values represent the probabilities for 2006 and 2011.3 P(Real Net Worth Decline) is the probability that the farm will have a loss in real net worth relative to the beginning net worth. Reported values represent the
probabilities for losing real net worth from 2004 to 2006 and from 2004 to 2011.
Implications of the December 2006 FAPRI Baseline on the Economic Viability of Representative Farms Primarily Producing Feed Grains and Oilseeds
Net Worth 2011 CRNW($1,000) (%)
1,807.26 6.635,666.55 5.282,814.51 6.766,607.70 7.171,008.97 11.427,960.79 9.406,062.53 6.258,726.74 7.355,336.86 4.592,029.53 3.655,893.24 4.992,158.15 1.291,003.90 1.23
729.41 1.62(66.80) (34.19)934.82 2.44
3,627.76 5.981,105.50 4.006,069.05 5.40
1 Receipts are average annual total cash receipts including government payments, 2006-2011 ($1,000)2 Payments are average annual total government payments, 2006-2011 ($1,000)3 NCFI are average annual net cash farm income, 2006-2011 ($1,000)4 Reserve 2011 are average ending cash reserves, 2011 ($1,000)5 Net Worth 2011 are average nominal ending net worth, 2011 ($1,000)6 CRNW are average percentage in real net worth over 2006-2011 period, (%)
Representative Farm: Feed GrainsFarm Name
13/2/4IAG1350
2006-20111-1
Overall Ranking2011
P(Negative Ending Cash)
IAG3400NEG1960NEG4300NDG2180NDG7500MOCG2050MOCG3630MONG1850
TNG900TNG2750
ING1000
SCG1500SCG3500
ING2200TXPG3760TXHG2000TXWG1400TXUG1200
1-11-11-11-11-11-11-11-11-1
1-321-271-85
1-11-38
1-111-11-61-1
($1,000)Receipts
25-50
NCFI
>50
Reserve 2011($1,000)
631.711,562.771,186.712,398.98
541.182,342.31
795.171,325.57
819.65421.26
508.17364.83
999.352,502.64
718.74320.70
1,018.23658.47
1,666.10
Payments($1,000)
60.16147.90143.93270.9739.06
186.5065.99
103.9560.87
24.7980.74
IAG1350IAG3400
109.14226.16
41.53
62.5360.0699.94
92.75304.85
NDG2180NDG7500MOCG2050MOCG3630
400.1994.32
393.60
54.5919.10
NEG4300
SCG1500SCG3500
ING1000
TXHG2000TXWG1400TXUG1200
ING2200TXPG3760
MONG1850
Economic Viability of Representative Farms over the 2006-2011 Period
TNG900TNG2750
2006
NEG1960
761.85312.09
71.35 68.52
481.38
1,955.90507.48
(164.13)
157.6369.37
446.84(17.37)685.23
(891.53)(101.26)(68.16)
(447.21)
71-6797-97
1-11-11-11-4
75-25
2006-201115-12-11-11-1
67-6
93-91
96-90
78-61
3-1
197.56555.31388.91766.36
($1,000)
5-376-5417-3
378.24782.52799.91
1,633.47356.33
3,136.73205.43
1,098.84
112.29330.34
900.73427.84
P(Real Net Worth Declines)

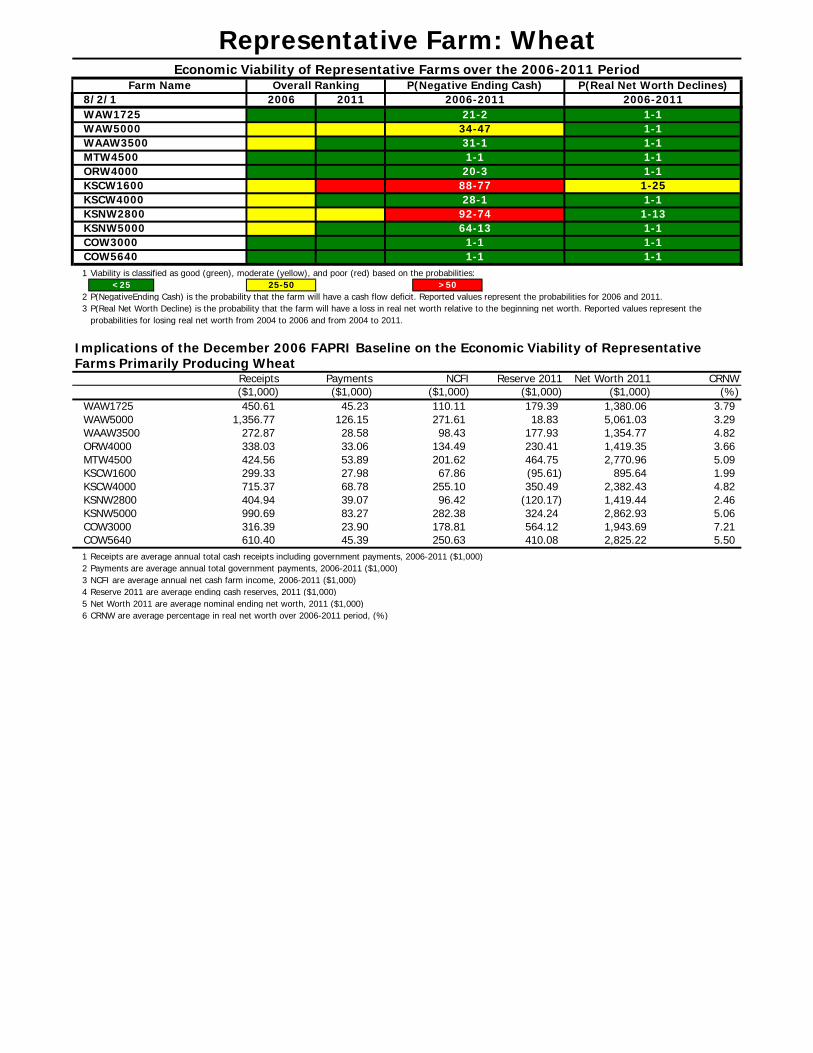
• Eight wheat farms are projected to be in good overall financial condition with two in marginal condition and one in poor condition.
• Two of the eleven wheat farms will feel severe liquidity pressure over the period.
• One wheat farm has a 25 percent or greater chance of losing real equity.
Characteristics of Panel Farms Producing Wheat, 2005.Cropland Assets Debt/Asset Gross Receipts Wheat
(acres) ($1,000) (ratio) ($1,000) (acres)WAW1725 1,725 1,236.00 0.17 379.90 1,121WAW5000 5,000 4,511.00 0.16 1,160.40 2,915WAAW3500 3,500 1,098.00 0.14 227.20 1,500ORW4000 3,600 1,217.00 0.13 291.50 1,600MTW4500 4,500 2,245.00 0.15 329.00 2,475KSCW1600 1,600 1,043.00 0.28 221.80 1,072KSCW4000 4,000 2,063.00 0.20 535.90 2,000KSNW2800 2,800 1,443.00 0.23 354.80 1,400KSNW5000 5,000 2,419.00 0.22 791.80 2,325COW3000 3,000 1,352.00 0.13 266.50 970COW5640 5,640 2,228.00 0.15 505.80 1,900
Representative Farm: Wheat
WA
COKSN
KSC
MT
ORWAA
1 Viability is classified as good (green), moderate (yellow), and poor (red) based on the probabilities:<25
2 P(NegativeEnding Cash) is the probability that the farm will have a cash flow deficit. Reported values represent the probabilities for 2006 and 2011.3 P(Real Net Worth Decline) is the probability that the farm will have a loss in real net worth relative to the beginning net worth. Reported values represent the
probabilities for losing real net worth from 2004 to 2006 and from 2004 to 2011.
Implications of the December 2006 FAPRI Baseline on the Economic Viability of Representative Farms Primarily Producing Wheat
Net Worth 2011 CRNW($1,000) (%)
1,380.06 3.795,061.03 3.291,354.77 4.821,419.35 3.662,770.96 5.09
895.64 1.992,382.43 4.821,419.44 2.462,862.93 5.061,943.69 7.212,825.22 5.50
1 Receipts are average annual total cash receipts including government payments, 2006-2011 ($1,000)2 Payments are average annual total government payments, 2006-2011 ($1,000)3 NCFI are average annual net cash farm income, 2006-2011 ($1,000)4 Reserve 2011 are average ending cash reserves, 2011 ($1,000)5 Net Worth 2011 are average nominal ending net worth, 2011 ($1,000)6 CRNW are average percentage in real net worth over 2006-2011 period, (%)
COW5640
($1,000)
WAW5000 1,356.77
25-50
Representative Farm: WheatEconomic Viability of Representative Farms over the 2006-2011 Period
Farm Name Overall Ranking P(Negative Ending Cash)2006-2011
1-18/2/1 2006 2011 2006-2011WAW1725 21-2
1-1WAAW3500 31-1 1-1WAW5000 34-47
1-1ORW4000 20-3 1-1MTW4500 1-1
1-25KSCW4000 28-1 1-1KSCW1600 88-77
1-13KSNW5000 64-13 1-1KSNW2800 92-74
COW3000 1-1 1-11-1 1-1
>50
Receipts Payments NCFI Reserve 2011($1,000) ($1,000) ($1,000)
179.39126.15 271.61 18.83
WAW1725 450.61 45.23 110.11
177.93ORW4000 338.03 33.06 134.49 230.41WAAW3500 272.87 28.58 98.43
464.75KSCW1600 299.33 27.98 67.86 (95.61)MTW4500 424.56 53.89 201.62
350.49KSNW2800 404.94 39.07 96.42 (120.17)KSCW4000 715.37 68.78 255.10
324.24COW3000 316.39 23.90 178.81 564.12KSNW5000 990.69 83.27 282.38
410.08COW5640 610.40 45.39 250.63
P(Real Net Worth Declines)
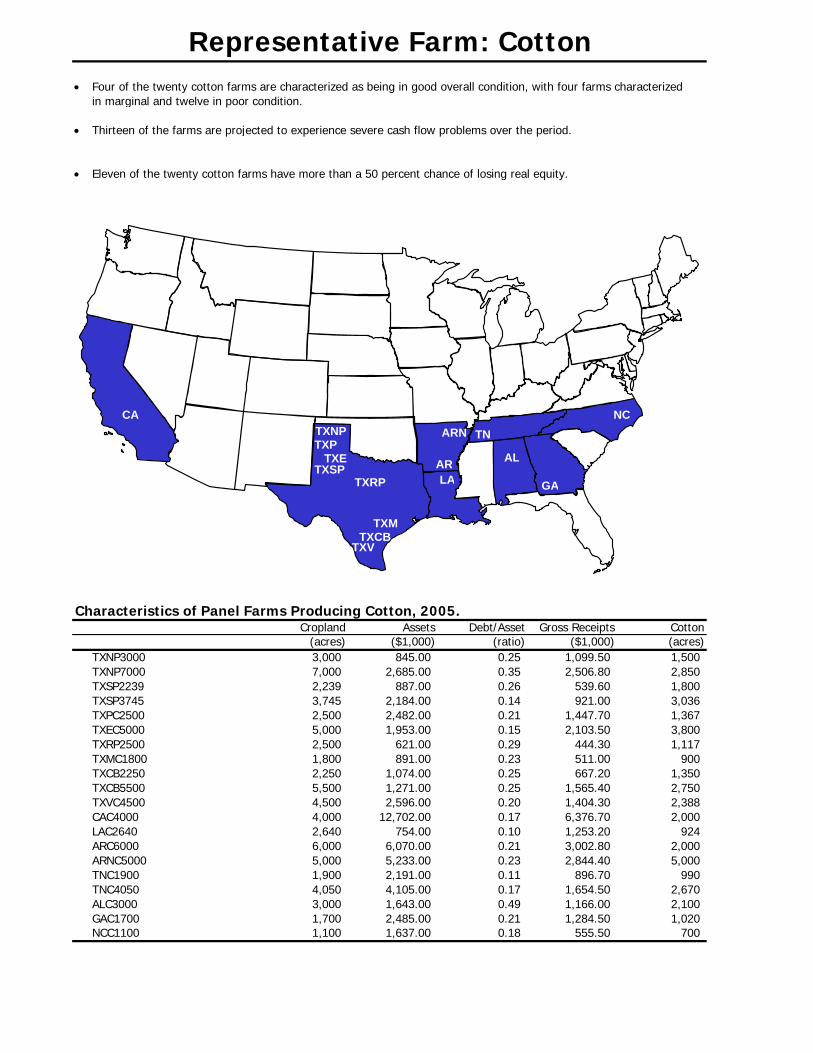
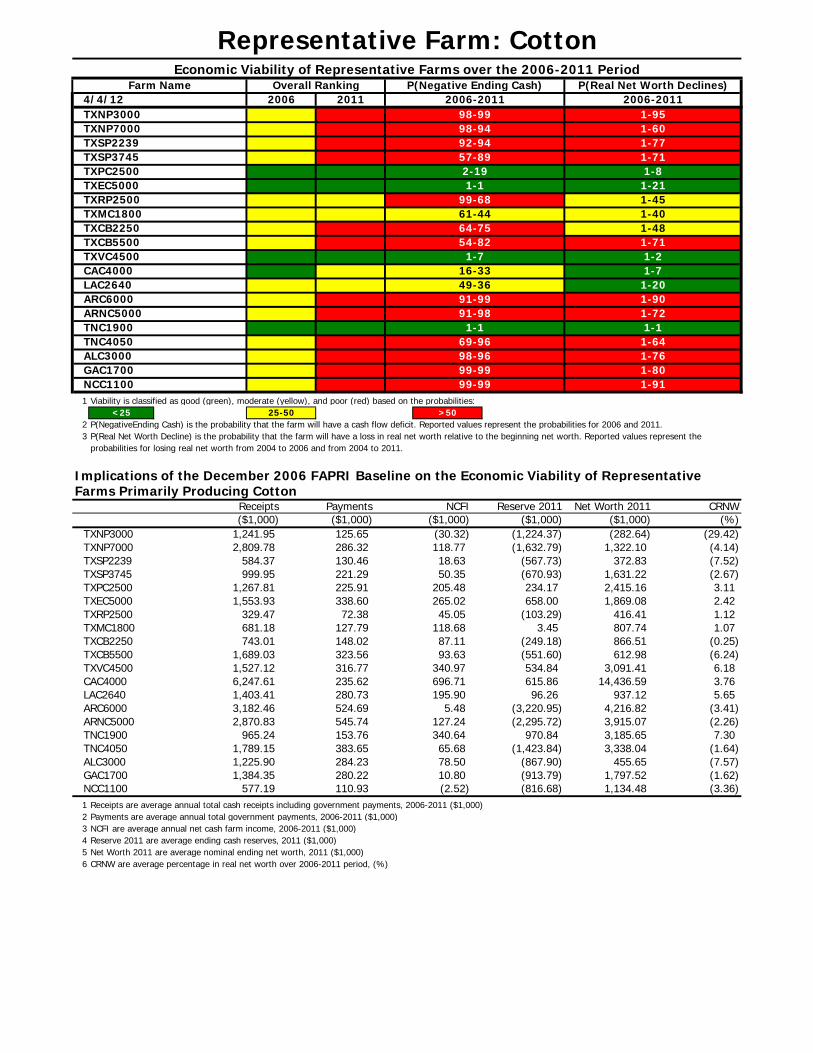
• Four of the twenty cotton farms are characterized as being in good overall condition, with four farms characterizedin marginal and twelve in poor condition.
• Thirteen of the farms are projected to experience severe cash flow problems over the period.
• Eleven of the twenty cotton farms have more than a 50 percent chance of losing real equity.
Characteristics of Panel Farms Producing Cotton, 2005.Cropland Assets Debt/Asset Gross Receipts Cotton
(acres) ($1,000) (ratio) ($1,000) (acres)TXNP3000 3,000 845.00 0.25 1,099.50 1,500TXNP7000 7,000 2,685.00 0.35 2,506.80 2,850TXSP2239 2,239 887.00 0.26 539.60 1,800TXSP3745 3,745 2,184.00 0.14 921.00 3,036TXPC2500 2,500 2,482.00 0.21 1,447.70 1,367TXEC5000 5,000 1,953.00 0.15 2,103.50 3,800TXRP2500 2,500 621.00 0.29 444.30 1,117TXMC1800 1,800 891.00 0.23 511.00 900TXCB2250 2,250 1,074.00 0.25 667.20 1,350TXCB5500 5,500 1,271.00 0.25 1,565.40 2,750TXVC4500 4,500 2,596.00 0.20 1,404.30 2,388CAC4000 4,000 12,702.00 0.17 6,376.70 2,000LAC2640 2,640 754.00 0.10 1,253.20 924ARC6000 6,000 6,070.00 0.21 3,002.80 2,000ARNC5000 5,000 5,233.00 0.23 2,844.40 5,000TNC1900 1,900 2,191.00 0.11 896.70 990TNC4050 4,050 4,105.00 0.17 1,654.50 2,670ALC3000 3,000 1,643.00 0.49 1,166.00 2,100GAC1700 1,700 2,485.00 0.21 1,284.50 1,020NCC1100 1,100 1,637.00 0.18 555.50 700
Representative Farm: Cotton
TN
TXSPTXRP
TXCB
ARLA
AL
NC
GA
TXM
TXE
TXV
TXPTXNP
CAARN
1 Viability is classified as good (green), moderate (yellow), and poor (red) based on the probabilities:<25
2 P(NegativeEnding Cash) is the probability that the farm will have a cash flow deficit. Reported values represent the probabilities for 2006 and 2011.3 P(Real Net Worth Decline) is the probability that the farm will have a loss in real net worth relative to the beginning net worth. Reported values represent the
probabilities for losing real net worth from 2004 to 2006 and from 2004 to 2011.
Implications of the December 2006 FAPRI Baseline on the Economic Viability of Representative Farms Primarily Producing Cotton
Net Worth 2011 CRNW($1,000) (%)(282.64) (29.42)
1,322.10 (4.14)372.83 (7.52)
1,631.22 (2.67)2,415.16 3.111,869.08 2.42
416.41 1.12807.74 1.07866.51 (0.25)612.98 (6.24)
3,091.41 6.1814,436.59 3.76
937.12 5.654,216.82 (3.41)3,915.07 (2.26)3,185.65 7.303,338.04 (1.64)
455.65 (7.57)1,797.52 (1.62)1,134.48 (3.36)
1 Receipts are average annual total cash receipts including government payments, 2006-2011 ($1,000)2 Payments are average annual total government payments, 2006-2011 ($1,000)3 NCFI are average annual net cash farm income, 2006-2011 ($1,000)4 Reserve 2011 are average ending cash reserves, 2011 ($1,000)5 Net Worth 2011 are average nominal ending net worth, 2011 ($1,000)6 CRNW are average percentage in real net worth over 2006-2011 period, (%)
TXVC4500CAC4000
TXCB5500
Representative Farm: CottonEconomic Viability of Representative Farms over the 2006-2011 Period
Farm Name Overall Ranking P(Negative Ending Cash)2006-2011
TXNP3000 98-99 1-954/4/12 2006 2011 2006-2011
1-60TXSP2239 92-94 1-77TXNP7000 98-94
1-71TXPC2500 2-19 1-8TXSP3745 57-89
1-21TXRP2500 99-68 1-45TXEC5000 1-1
1-40TXCB2250 64-75 1-48TXMC1800 61-44
1-7
1-711-7 1-2
16-33
54-82
1-20ARC6000 91-99 1-90LAC2640 49-36
1-72TNC1900 1-1 1-1ARNC5000 91-98
1-64ALC3000 98-96 1-76TNC4050 69-96
1-80NCC1100 99-99 1-91GAC1700 99-99
25-50 >50
Receipts Payments NCFI Reserve 2011($1,000) ($1,000) ($1,000) ($1,000)
(1,224.37)TXNP7000 2,809.78 286.32 118.77 (1,632.79)TXNP3000 1,241.95 125.65 (30.32)
(567.73)TXSP3745 999.95 221.29 50.35 (670.93)TXSP2239 584.37 130.46 18.63
234.17TXEC5000 1,553.93 338.60 265.02 658.00TXPC2500 1,267.81 225.91 205.48
(103.29)TXMC1800 681.18 127.79 118.68 3.45TXRP2500 329.47 72.38 45.05
(249.18)TXCB5500 1,689.03 323.56 93.63 (551.60)TXCB2250 743.01 148.02 87.11
534.84CAC4000 6,247.61 235.62 696.71 615.86TXVC4500 1,527.12 316.77 340.97
96.26ARC6000 3,182.46 524.69 5.48 (3,220.95)LAC2640 1,403.41 280.73 195.90
(2,295.72)TNC1900 965.24 153.76 340.64 970.84ARNC5000 2,870.83 545.74 127.24
(1,423.84)ALC3000 1,225.90 284.23 78.50 (867.90)TNC4050 1,789.15 383.65 65.68
(816.68)GAC1700 1,384.35 280.22 10.80NCC1100 577.19 110.93 (2.52)
P(Real Net Worth Declines)
(913.79)
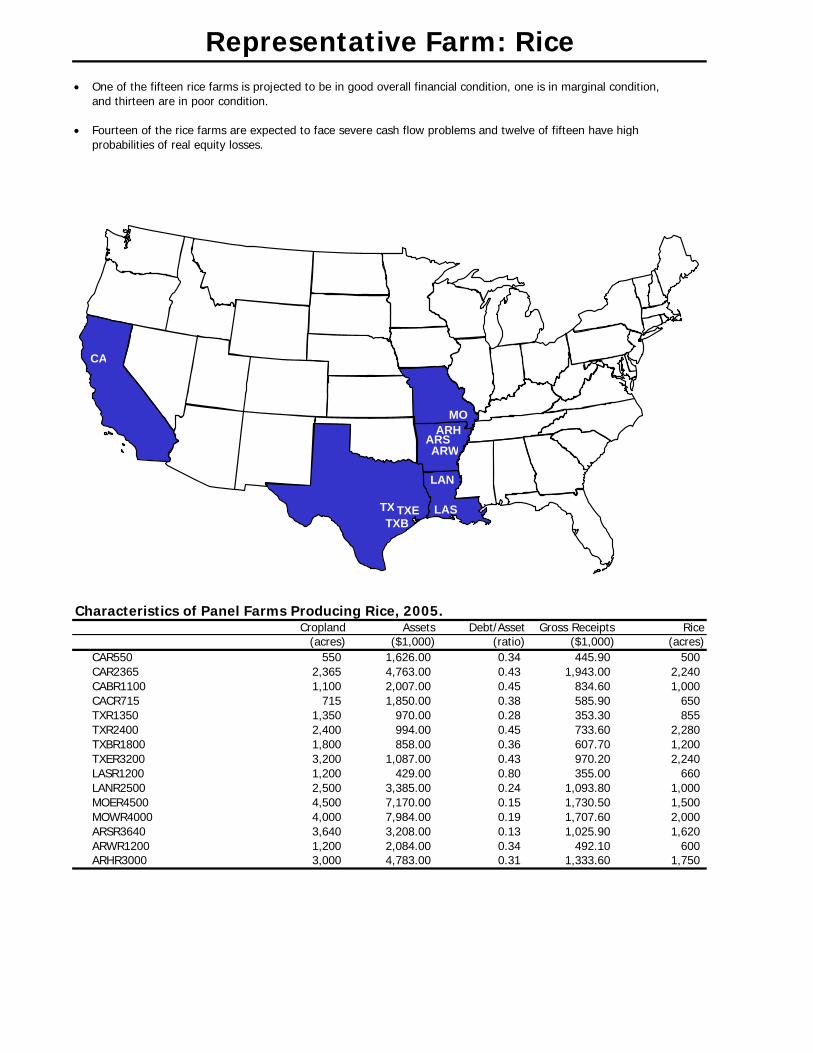
• One of the fifteen rice farms is projected to be in good overall financial condition, one is in marginal condition,and thirteen are in poor condition.
• Fourteen of the rice farms are expected to face severe cash flow problems and twelve of fifteen have high probabilities of real equity losses.
Characteristics of Panel Farms Producing Rice, 2005.Cropland Assets Debt/Asset Gross Receipts Rice
(acres) ($1,000) (ratio) ($1,000) (acres)CAR550 550 1,626.00 0.34 445.90 500CAR2365 2,365 4,763.00 0.43 1,943.00 2,240CABR1100 1,100 2,007.00 0.45 834.60 1,000CACR715 715 1,850.00 0.38 585.90 650TXR1350 1,350 970.00 0.28 353.30 855TXR2400 2,400 994.00 0.45 733.60 2,280TXBR1800 1,800 858.00 0.36 607.70 1,200TXER3200 3,200 1,087.00 0.43 970.20 2,240LASR1200 1,200 429.00 0.80 355.00 660LANR2500 2,500 3,385.00 0.24 1,093.80 1,000MOER4500 4,500 7,170.00 0.15 1,730.50 1,500MOWR4000 4,000 7,984.00 0.19 1,707.60 2,000ARSR3640 3,640 3,208.00 0.13 1,025.90 1,620ARWR1200 1,200 2,084.00 0.34 492.10 600ARHR3000 3,000 4,783.00 0.31 1,333.60 1,750
Representative Farm: Rice
CA
TXB
MO
ARW
LAS
LAN
ARH
TX TXE
ARS
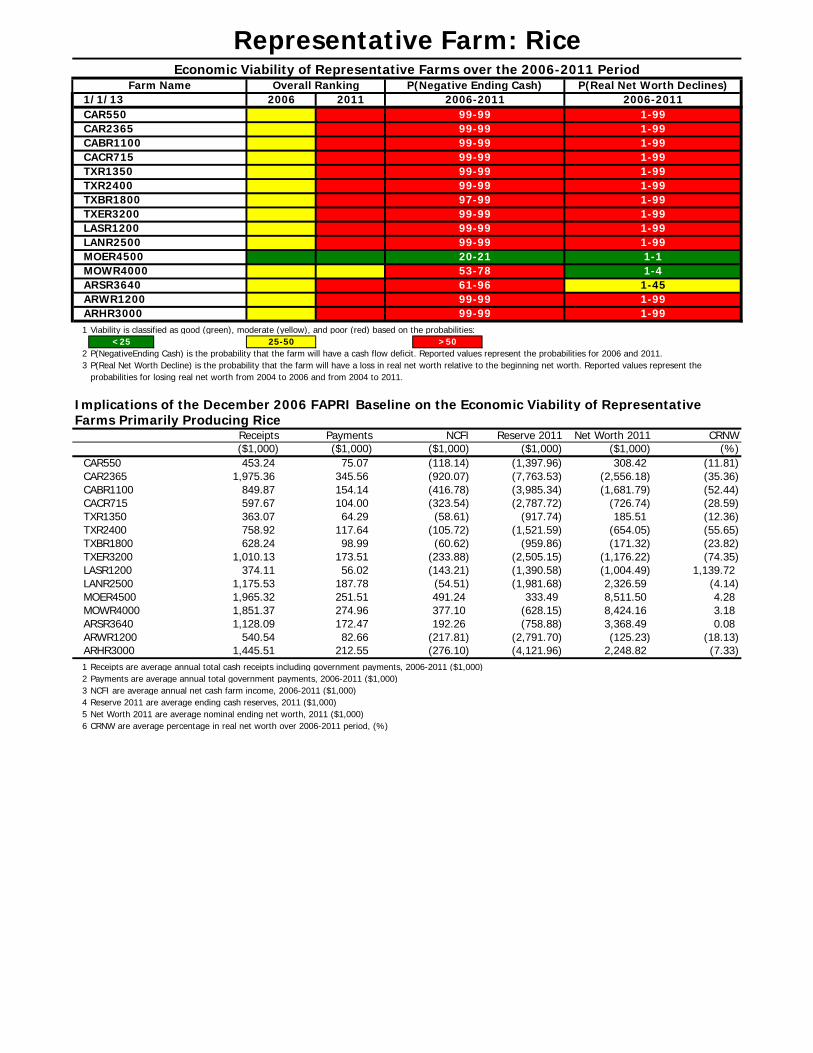
1 Viability is classified as good (green), moderate (yellow), and poor (red) based on the probabilities:<25
2 P(NegativeEnding Cash) is the probability that the farm will have a cash flow deficit. Reported values represent the probabilities for 2006 and 2011.3 P(Real Net Worth Decline) is the probability that the farm will have a loss in real net worth relative to the beginning net worth. Reported values represent the
probabilities for losing real net worth from 2004 to 2006 and from 2004 to 2011.
Implications of the December 2006 FAPRI Baseline on the Economic Viability of Representative Farms Primarily Producing Rice
Net Worth 2011 CRNW($1,000) (%)308.42 (11.81)
(2,556.18) (35.36)(1,681.79) (52.44)
(726.74) (28.59)185.51 (12.36)
(654.05) (55.65)(171.32) (23.82)
(1,176.22) (74.35)(1,004.49) 1,139.722,326.59 (4.14)8,511.50 4.288,424.16 3.183,368.49 0.08(125.23) (18.13)
2,248.82 (7.33)1 Receipts are average annual total cash receipts including government payments, 2006-2011 ($1,000)2 Payments are average annual total government payments, 2006-2011 ($1,000)3 NCFI are average annual net cash farm income, 2006-2011 ($1,000)4 Reserve 2011 are average ending cash reserves, 2011 ($1,000)5 Net Worth 2011 are average nominal ending net worth, 2011 ($1,000)6 CRNW are average percentage in real net worth over 2006-2011 period, (%)
MOER4500MOWR4000
($1,000)
CAR2365 1,975.36
2006-2011CAR550 99-99 1-991/1/13 2006 2011 2006-2011
1-99CABR1100 99-99 1-99CAR2365 99-99
1-99TXR1350 99-99 1-99CACR715 99-99
1-99TXBR1800 97-99 1-99TXR2400 99-99
1-99LASR1200 99-99 1-99TXER3200 99-99
LANR2500 99-99 1-9920-21 1-153-78 1-4
1-45ARWR1200 99-99 1-99ARSR3640 61-96
1-99ARHR3000 99-99
25-50 >50
Receipts Payments NCFI Reserve 2011($1,000) ($1,000) ($1,000)
(1,397.96)345.56 (920.07) (7,763.53)
CAR550 453.24 75.07 (118.14)
(3,985.34)CACR715 597.67 104.00 (323.54) (2,787.72)CABR1100 849.87 154.14 (416.78)
(917.74)TXR2400 758.92 117.64 (105.72) (1,521.59)TXR1350 363.07 64.29 (58.61)
(959.86)TXER3200 1,010.13 173.51 (233.88) (2,505.15)TXBR1800 628.24 98.99 (60.62)
(1,390.58)LANR2500 1,175.53 187.78 (54.51) (1,981.68)LASR1200 374.11 56.02 (143.21)
333.49MOWR4000 1,851.37 274.96 377.10 (628.15)MOER4500 1,965.32 251.51 491.24
(758.88)ARWR1200 540.54 82.66 (217.81) (2,791.70)ARSR3640 1,128.09 172.47 192.26
(4,121.96)ARHR3000 1,445.51 212.55 (276.10)
P(Real Net Worth Declines)
Representative Farm: RiceEconomic Viability of Representative Farms over the 2006-2011 Period
Farm Name Overall Ranking P(Negative Ending Cash)
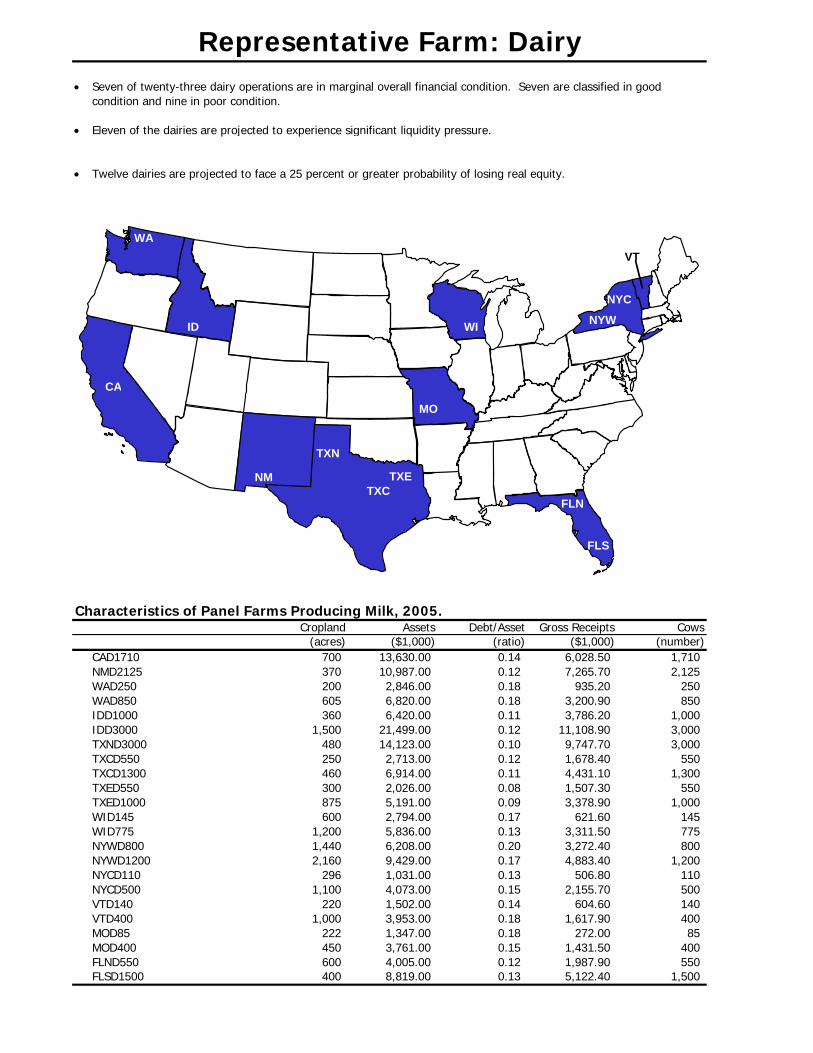
• Seven of twenty-three dairy operations are in marginal overall financial condition. Seven are classified in goodcondition and nine in poor condition.
• Eleven of the dairies are projected to experience significant liquidity pressure.
• Twelve dairies are projected to face a 25 percent or greater probability of losing real equity.
Characteristics of Panel Farms Producing Milk, 2005.Cropland Assets Debt/Asset Gross Receipts Cows
(acres) ($1,000) (ratio) ($1,000) (number)CAD1710 700 13,630.00 0.14 6,028.50 1,710NMD2125 370 10,987.00 0.12 7,265.70 2,125WAD250 200 2,846.00 0.18 935.20 250WAD850 605 6,820.00 0.18 3,200.90 850IDD1000 360 6,420.00 0.11 3,786.20 1,000IDD3000 1,500 21,499.00 0.12 11,108.90 3,000TXND3000 480 14,123.00 0.10 9,747.70 3,000TXCD550 250 2,713.00 0.12 1,678.40 550TXCD1300 460 6,914.00 0.11 4,431.10 1,300TXED550 300 2,026.00 0.08 1,507.30 550TXED1000 875 5,191.00 0.09 3,378.90 1,000WID145 600 2,794.00 0.17 621.60 145WID775 1,200 5,836.00 0.13 3,311.50 775NYWD800 1,440 6,208.00 0.20 3,272.40 800NYWD1200 2,160 9,429.00 0.17 4,883.40 1,200NYCD110 296 1,031.00 0.13 506.80 110NYCD500 1,100 4,073.00 0.15 2,155.70 500VTD140 220 1,502.00 0.14 604.60 140VTD400 1,000 3,953.00 0.18 1,617.90 400MOD85 222 1,347.00 0.18 272.00 85MOD400 450 3,761.00 0.15 1,431.50 400FLND550 600 4,005.00 0.12 1,987.90 550FLSD1500 400 8,819.00 0.13 5,122.40 1,500
Representative Farm: Dairy
WA
ID
CA
NM TXETXC
MO
FLS
FLN
WI
NYC
NYW
VT
TXN
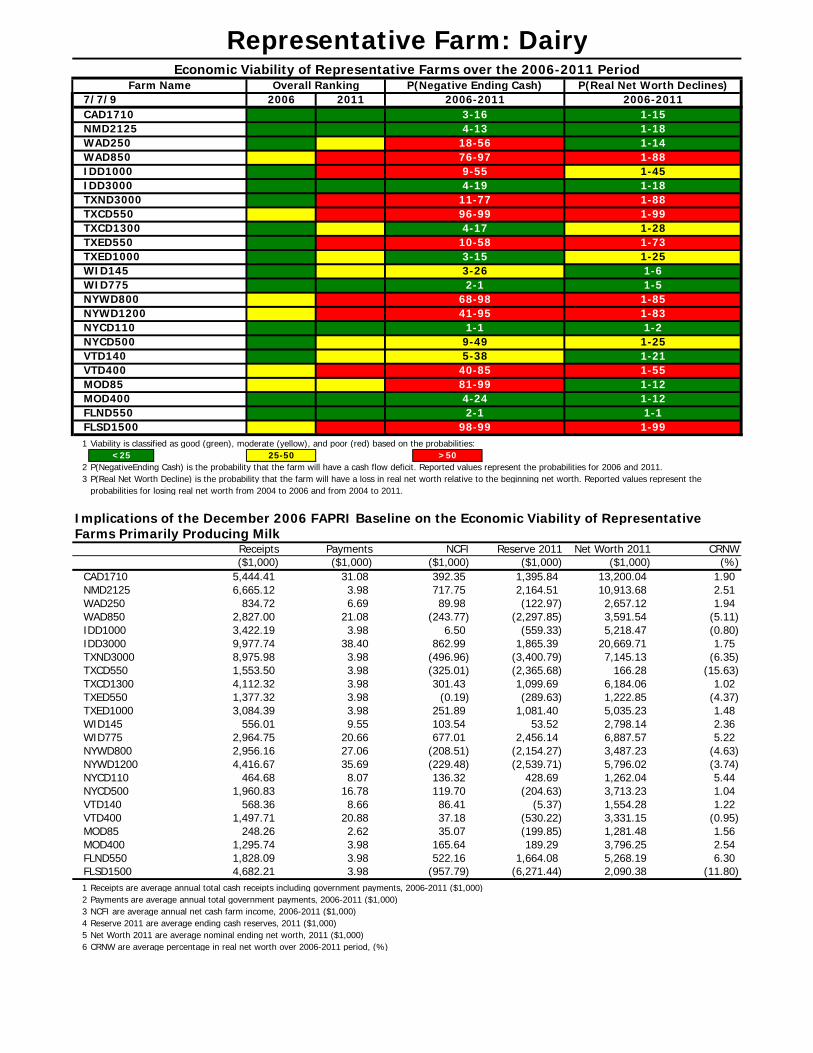
1 Viability is classified as good (green), moderate (yellow), and poor (red) based on the probabilities:<25
2 P(NegativeEnding Cash) is the probability that the farm will have a cash flow deficit. Reported values represent the probabilities for 2006 and 2011.3 P(Real Net Worth Decline) is the probability that the farm will have a loss in real net worth relative to the beginning net worth. Reported values represent the
probabilities for losing real net worth from 2004 to 2006 and from 2004 to 2011.
Implications of the December 2006 FAPRI Baseline on the Economic Viability of Representative Farms Primarily Producing Milk
Net Worth 2011 CRNW($1,000) (%)
13,200.04 1.9010,913.68 2.512,657.12 1.943,591.54 (5.11)5,218.47 (0.80)
20,669.71 1.757,145.13 (6.35)
166.28 (15.63)6,184.06 1.021,222.85 (4.37)5,035.23 1.482,798.14 2.366,887.57 5.223,487.23 (4.63)5,796.02 (3.74)1,262.04 5.443,713.23 1.041,554.28 1.223,331.15 (0.95)1,281.48 1.563,796.25 2.545,268.19 6.302,090.38 (11.80)
1 Receipts are average annual total cash receipts including government payments, 2006-2011 ($1,000)2 Payments are average annual total government payments, 2006-2011 ($1,000)3 NCFI are average annual net cash farm income, 2006-2011 ($1,000)4 Reserve 2011 are average ending cash reserves, 2011 ($1,000)5 Net Worth 2011 are average nominal ending net worth, 2011 ($1,000)6 CRNW are average percentage in real net worth over 2006-2011 period, (%)
TXED1000WID145
TXED550
Representative Farm: DairyEconomic Viability of Representative Farms over the 2006-2011 Period
Farm Name Overall Ranking P(Negative Ending Cash) P(Real Net Worth Declines)2006-2011
CAD1710 3-16 1-157/7/9 2006 2011 2006-2011
1-18WAD250 18-56 1-14NMD2125 4-13
1-88IDD1000 9-55 1-45WAD850 76-97
1-18TXND3000 11-77 1-88IDD3000 4-19
1-99TXCD1300 4-17 1-28TXCD550 96-99
1-6
1-733-15 1-253-26
10-58
1-5NYWD800 68-98 1-85WID775 2-1
1-83NYCD110 1-1 1-2NYWD1200 41-95
1-25VTD140 5-38 1-21NYCD500 9-49
1-55MOD85 81-99 1-12VTD400 40-85
1-12FLND550 2-1 1-1MOD400 4-24
1-99FLSD1500 98-99
25-50 >50
Receipts Payments NCFI Reserve 2011($1,000) ($1,000) ($1,000) ($1,000)
1,395.84NMD2125 6,665.12 3.98 717.75 2,164.51CAD1710 5,444.41 31.08 392.35
(122.97)WAD850 2,827.00 21.08 (243.77) (2,297.85)WAD250 834.72 6.69 89.98
(559.33)IDD3000 9,977.74 38.40 862.99 1,865.39IDD1000 3,422.19 3.98 6.50
(3,400.79)TXCD550 1,553.50 3.98 (325.01) (2,365.68)TXND3000 8,975.98 3.98 (496.96)
1,099.69TXED550 1,377.32 3.98 (0.19) (289.63)TXCD1300 4,112.32 3.98 301.43
1,081.40WID145 556.01 9.55 103.54 53.52TXED1000 3,084.39 3.98 251.89
2,456.14NYWD800 2,956.16 27.06 (208.51) (2,154.27)WID775 2,964.75 20.66 677.01
(2,539.71)NYCD110 464.68 8.07 136.32 428.69NYWD1200 4,416.67 35.69 (229.48)
(204.63)VTD140 568.36 8.66 86.41 (5.37)NYCD500 1,960.83 16.78 119.70
(530.22)MOD85 248.26 2.62 35.07 (199.85)VTD400 1,497.71 20.88 37.18
189.29FLND550 1,828.09 3.98 522.16 1,664.08MOD400 1,295.74 3.98 165.64
(6,271.44)FLSD1500 4,682.21 3.98 (957.79)

• Six of twelve cow-calf operations are projected to be in good overall financial condition. Five are expected to be in marginal condition and one is in poor condition.
• Six of the operations will face significant liquidity pressure over the period, as their likelihoods of experiencing negative ending cash exceed 50 percent.
• One operation is projected to have more than a 50 percent chance of losing real equity over the period.
Characteristics of Panel Farms Producing Beef Cattle, 2005.Cropland Assets Debt/Asset Gross Receipts Cows
(acres) ($1,000) (ratio) ($1,000) (number)CAB500 0 11,416.00 0.01 316.90 500NVB700 1,300 3,969.00 0.02 382.40 700MTB500 0 3,803.00 0.01 322.50 500WYB335 330 2,785.00 0.02 250.40 335COB250 450 12,834.00 0.01 199.70 250NMB240 0 4,560.00 0.01 299.10 240SDB450 1,150 3,466.00 0.02 290.90 450MOB240 240 2,247.00 0.01 230.00 250MOCB400 40 3,233.00 0.01 288.70 400TXRB500 0 5,695.00 0.01 449.90 500TXSB175 0 2,448.00 0.01 206.60 250FLB1155 5,400 13,215.00 0.01 647.80 1,155
Representative Farm: Cow/Calf
MT
WY
CO
MO
NV
NM
FL
MOC
CA
SD
TXS
TXR
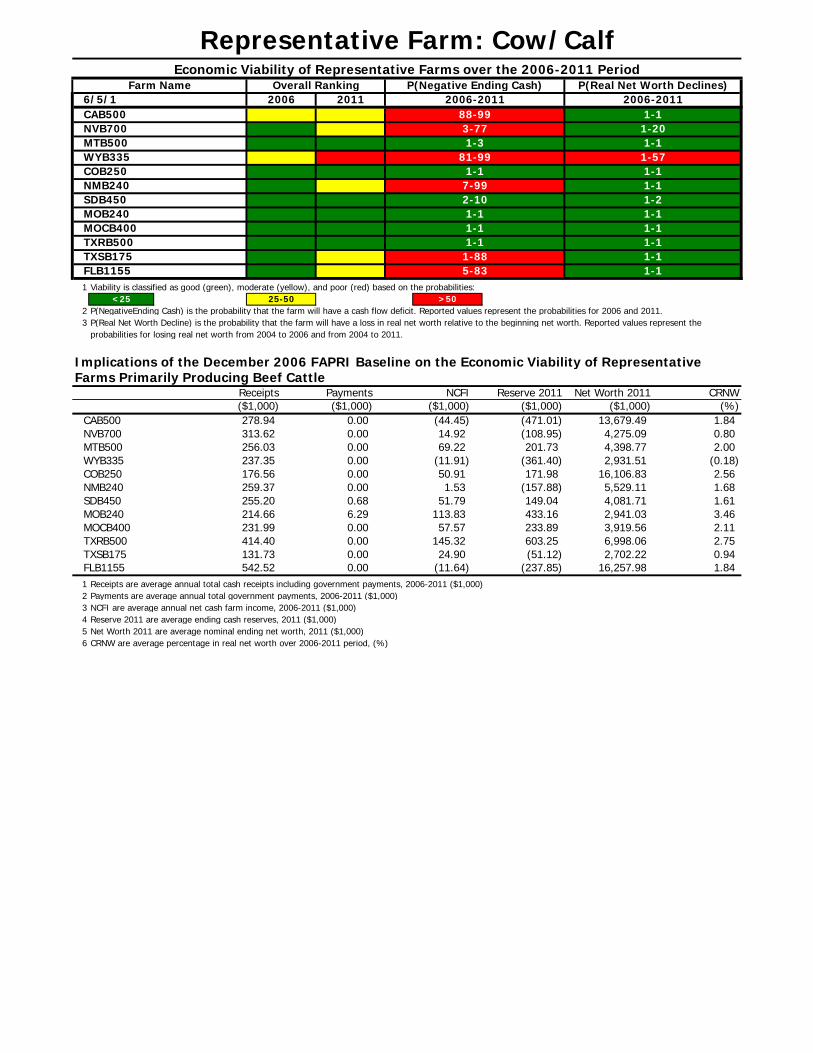
1 Viability is classified as good (green), moderate (yellow), and poor (red) based on the probabilities:<25
2 P(NegativeEnding Cash) is the probability that the farm will have a cash flow deficit. Reported values represent the probabilities for 2006 and 2011.3 P(Real Net Worth Decline) is the probability that the farm will have a loss in real net worth relative to the beginning net worth. Reported values represent the
probabilities for losing real net worth from 2004 to 2006 and from 2004 to 2011.
Implications of the December 2006 FAPRI Baseline on the Economic Viability of Representative Farms Primarily Producing Beef Cattle
Net Worth 2011 CRNW($1,000) (%)
13,679.49 1.844,275.09 0.804,398.77 2.002,931.51 (0.18)
16,106.83 2.565,529.11 1.684,081.71 1.612,941.03 3.463,919.56 2.116,998.06 2.752,702.22 0.94
16,257.98 1.841 Receipts are average annual total cash receipts including government payments, 2006-2011 ($1,000)2 Payments are average annual total government payments, 2006-2011 ($1,000)3 NCFI are average annual net cash farm income, 2006-2011 ($1,000)4 Reserve 2011 are average ending cash reserves, 2011 ($1,000)5 Net Worth 2011 are average nominal ending net worth, 2011 ($1,000)6 CRNW are average percentage in real net worth over 2006-2011 period, (%)
TXSB175FLB1155
Representative Farm: Cow/CalfEconomic Viability of Representative Farms over the 2006-2011 Period
Farm Name Overall Ranking P(Negative Ending Cash) P(Real Net Worth Declines)2006-2011
CAB500 88-99 1-16/5/1 2006 2011 2006-2011
1-20MTB500 1-3 1-1NVB700 3-77
1-57COB250 1-1 1-1WYB335 81-99
1-1SDB450 2-10 1-2NMB240 7-99
1-1MOCB400 1-1 1-1MOB240 1-1
TXRB500 1-1
1-1
1-11-88 1-15-83
25-50 >50
Receipts Payments NCFI Reserve 2011($1,000) ($1,000) ($1,000) ($1,000)
(471.01)NVB700 313.62 0.00 14.92 (108.95)CAB500 278.94 0.00 (44.45)
201.73WYB335 237.35 0.00 (11.91) (361.40)MTB500 256.03 0.00 69.22
171.98NMB240 259.37 0.00 1.53 (157.88)COB250 176.56 0.00 50.91
149.04MOB240 214.66 6.29 113.83 433.16SDB450 255.20 0.68 51.79
233.89TXRB500 414.40 0.00 145.32 603.25MOCB400 231.99 0.00 57.57
(51.12)FLB1155 542.52 0.00 (11.64) (237.85)TXSB175 131.73 0.00 24.90
Related Documents