Representative Consulting Activities •Lead Bank Selection: pages 2-3 •Database Management: pages 4-8 •Market Research –Domestic Premium Chocolate & Frozen Pizza Markets: pages 9-12 –Grocery Store Chains: pages 13-30

Representative Consulting Activities Lead Bank Selection: pages 2-3 Database Management: pages 4-8 Market Research –Domestic Premium Chocolate & Frozen.
Dec 29, 2015
Welcome message from author
This document is posted to help you gain knowledge. Please leave a comment to let me know what you think about it! Share it to your friends and learn new things together.
Transcript
Representative Consulting Activities
•Lead Bank Selection: pages 2-3
•Database Management: pages 4-8
•Market Research
–Domestic Premium Chocolate & Frozen Pizza Markets: pages 9-12
–Grocery Store Chains: pages 13-30
2
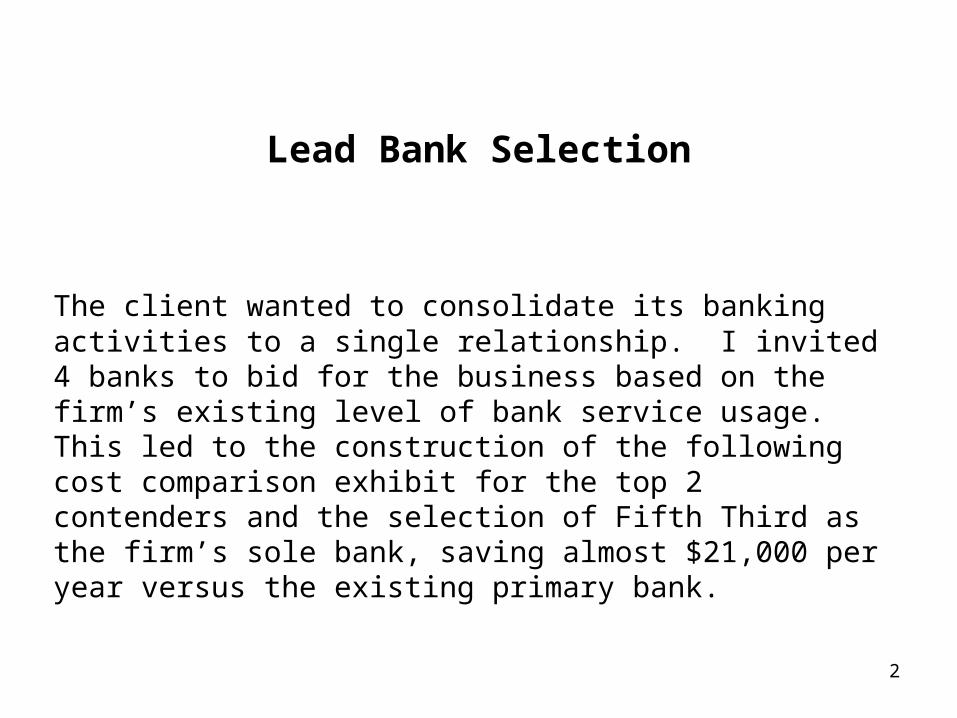
Lead Bank Selection
The client wanted to consolidate its banking activities to a single relationship. I invited 4 banks to bid for the business based on the firm’s existing level of bank service usage. This led to the construction of the following cost comparison exhibit for the top 2 contenders and the selection of Fifth Third as the firm’s sole bank, saving almost $21,000 per year versus the existing primary bank.
3
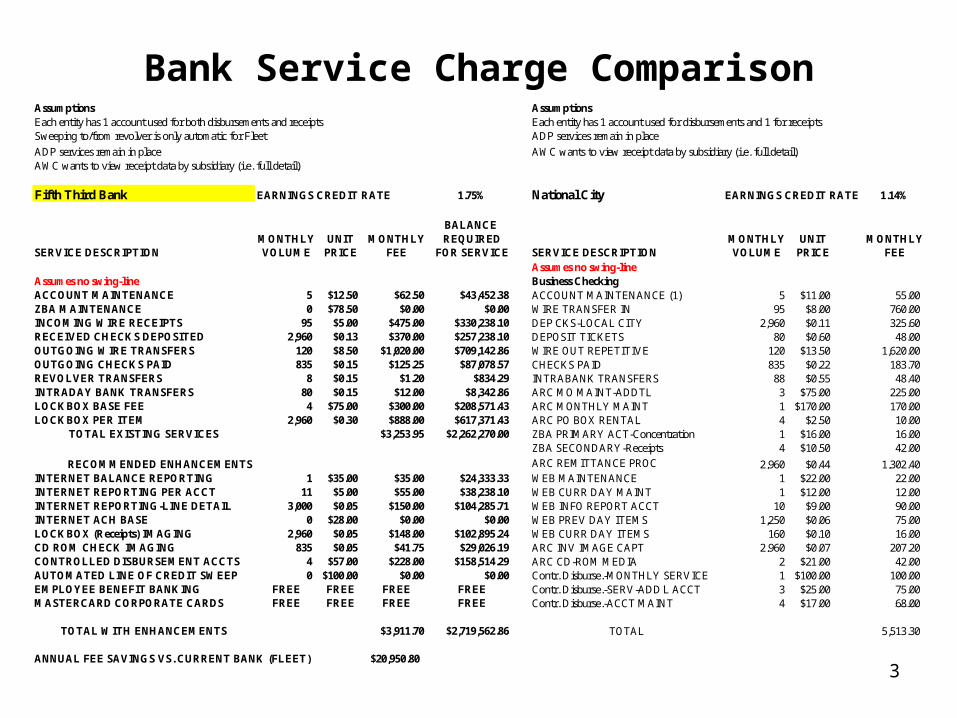
Bank Service Charge ComparisonAssumptions AssumptionsEach entity has 1 account used for both disbursements and receipts Each entity has 1 account used for disbursements and 1 for receiptsSweeping to/from revolver is only automatic for Fleet ADP services remain in place
ADP services remain in place AWC wants to view receipt data by subsidiary (i.e. full detail)AWC wants to view receipt data by subsidiary (i.e. full detail)
Fifth Third Bank EARNINGS CREDIT RATE 1.75% National City EARNINGS CREDIT RATE 1.14%
BALANCE MONTHLY UNIT MONTHLY REQUIRED MONTHLY UNIT MONTHLY
SERVICE DESCRIPTION VOLUME PRICE FEE FOR SERVICE SERVICE DESCRIPTION VOLUME PRICE FEEAssumes no swing-line
Assumes no swing-line Business Checking ACCOUNT MAINTENANCE 5 $12.50 $62.50 $43,452.38 ACCOUNT MAINTENANCE (1) 5 $11.00 55.00ZBA MAINTENANCE 0 $78.50 $0.00 $0.00 WIRE TRANSFER IN 95 $8.00 760.00INCOMING WIRE RECEIPTS 95 $5.00 $475.00 $330,238.10 DEP CKS-LOCAL CITY 2,960 $0.11 325.60RECEIVED CHECKS DEPOSITED 2,960 $0.13 $370.00 $257,238.10 DEPOSIT TICKETS 80 $0.60 48.00OUTGOING WIRE TRANSFERS 120 $8.50 $1,020.00 $709,142.86 WIRE OUT REPETITIVE 120 $13.50 1,620.00OUTGOING CHECKS PAID 835 $0.15 $125.25 $87,078.57 CHECKS PAID 835 $0.22 183.70REVOLVER TRANSFERS 8 $0.15 $1.20 $834.29 INTRABANK TRANSFERS 88 $0.55 48.40INTRADAY BANK TRANSFERS 80 $0.15 $12.00 $8,342.86 ARC MO MAINT-ADDTL 3 $75.00 225.00LOCKBOX BASE FEE 4 $75.00 $300.00 $208,571.43 ARC MONTHLY MAINT 1 $170.00 170.00LOCKBOX PER ITEM 2,960 $0.30 $888.00 $617,371.43 ARC PO BOX RENTAL 4 $2.50 10.00
TOTAL EXISTING SERVICES $3,253.95 $2,262,270.00 ZBA PRIMARY ACT-Concentration 1 $16.00 16.00ZBA SECONDARY-Receipts 4 $10.50 42.00
RECOMMENDED ENHANCEMENTS ARC REMITTANCE PROC 2,960 $0.44 1,302.40INTERNET BALANCE REPORTING 1 $35.00 $35.00 $24,333.33 WEB MAINTENANCE 1 $22.00 22.00INTERNET REPORTING PER ACCT 11 $5.00 $55.00 $38,238.10 WEB CURR DAY MAINT 1 $12.00 12.00INTERNET REPORTING-LINE DETAIL 3,000 $0.05 $150.00 $104,285.71 WEB INFO REPORT ACCT 10 $9.00 90.00INTERNET ACH BASE 0 $28.00 $0.00 $0.00 WEB PREV DAY ITEMS 1,250 $0.06 75.00LOCKBOX (Receipts) IMAGING 2,960 $0.05 $148.00 $102,895.24 WEB CURR DAY ITEMS 160 $0.10 16.00CD ROM CHECK IMAGING 835 $0.05 $41.75 $29,026.19 ARC INV IMAGE CAPT 2,960 $0.07 207.20CONTROLLED DISBURSEMENT ACCTS 4 $57.00 $228.00 $158,514.29 ARC CD-ROM MEDIA 2 $21.00 42.00AUTOMATED LINE OF CREDIT SWEEP 0 $100.00 $0.00 $0.00 Contr. Disburse.-MONTHLY SERVICE 1 $100.00 100.00EMPLOYEE BENEFIT BANKING FREE FREE FREE FREE Contr. Disburse.-SERV-ADD'L ACCT 3 $25.00 75.00MASTERCARD CORPORATE CARDS FREE FREE FREE FREE Contr. Disburse.-ACCT MAINT 4 $17.00 68.00
TOTAL WITH ENHANCEMENTS $3,911.70 $2,719,562.86 TOTAL 5,513.30
ANNUAL FEE SAVINGS VS. CURRENT BANK (FLEET) $20,950.80
4
Database Management and Associated Reporting
The client, a medical device developer and manufacturer, wanted the capability to monitor all contracts with surgeons retained to undertake studies of its products’ capabilities. The resultant database covered 145 contracts and included almost 4,800 data points. I summarized this into 10 reports which included the following, along with a detailed procedures guide to enable the firm’s personnel to maintain the database:
5
Acceptance by YearAcceptance
YearArea
Yearly Count of Contracts
Accepted by Area
Yearly % of Contracts
Accepted by Area
Amount of Funding by
Area
% of Funding by Area
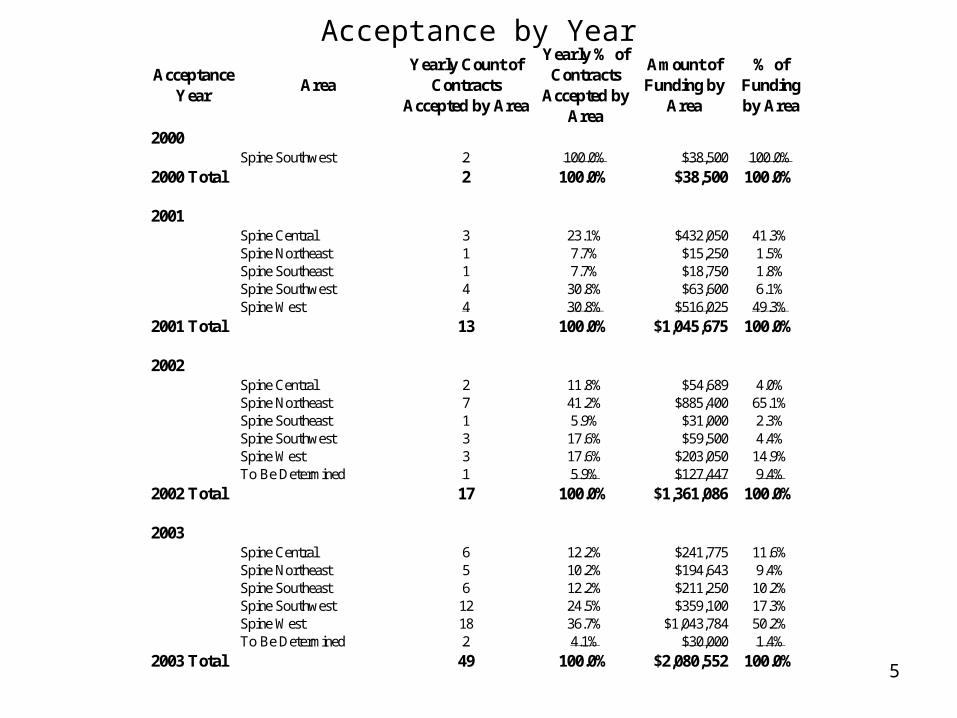
2000Spine Southwest 2 100.0% $38,500 100.0%
2000 Total 2 100.0% $38,500 100.0%
2001Spine Central 3 23.1% $432,050 41.3%Spine Northeast 1 7.7% $15,250 1.5%Spine Southeast 1 7.7% $18,750 1.8%Spine Southwest 4 30.8% $63,600 6.1%Spine West 4 30.8% $516,025 49.3%
2001 Total 13 100.0% $1,045,675 100.0%
2002Spine Central 2 11.8% $54,689 4.0%Spine Northeast 7 41.2% $885,400 65.1%Spine Southeast 1 5.9% $31,000 2.3%Spine Southwest 3 17.6% $59,500 4.4%Spine West 3 17.6% $203,050 14.9%To Be Determined 1 5.9% $127,447 9.4%
2002 Total 17 100.0% $1,361,086 100.0%
2003Spine Central 6 12.2% $241,775 11.6%Spine Northeast 5 10.2% $194,643 9.4%Spine Southeast 6 12.2% $211,250 10.2%Spine Southwest 12 24.5% $359,100 17.3%Spine West 18 36.7% $1,043,784 50.2%To Be Determined 2 4.1% $30,000 1.4%
2003 Total 49 100.0% $2,080,552 100.0%
6
Acceptance by Year(Continued)
Acceptance Year
AreaYearly Count of
Contracts Accepted by Area
Yearly % of Contracts
Accepted by Area
Amount of Funding by
Area
% of Funding by Area
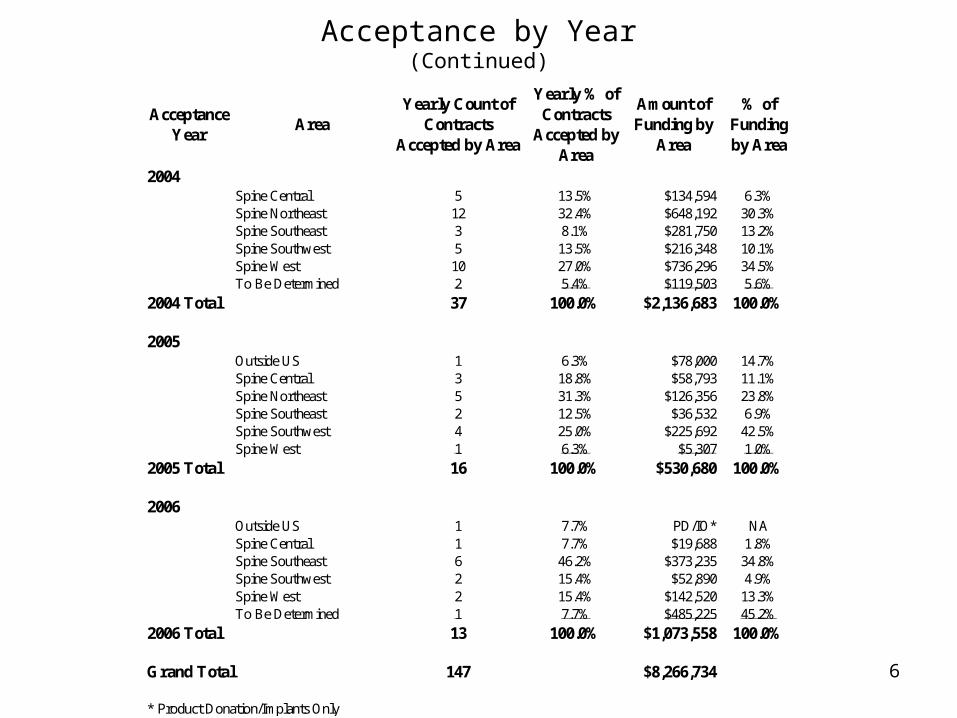
2004Spine Central 5 13.5% $134,594 6.3%Spine Northeast 12 32.4% $648,192 30.3%Spine Southeast 3 8.1% $281,750 13.2%Spine Southwest 5 13.5% $216,348 10.1%Spine West 10 27.0% $736,296 34.5%To Be Determined 2 5.4% $119,503 5.6%
2004 Total 37 100.0% $2,136,683 100.0%
2005Outside US 1 6.3% $78,000 14.7%Spine Central 3 18.8% $58,793 11.1%Spine Northeast 5 31.3% $126,356 23.8%Spine Southeast 2 12.5% $36,532 6.9%Spine Southwest 4 25.0% $225,692 42.5%Spine West 1 6.3% $5,307 1.0%
2005 Total 16 100.0% $530,680 100.0%
2006Outside US 1 7.7% PD/IO* NASpine Central 1 7.7% $19,688 1.8%Spine Southeast 6 46.2% $373,235 34.8%Spine Southwest 2 15.4% $52,890 4.9%Spine West 2 15.4% $142,520 13.3%To Be Determined 1 7.7% $485,225 45.2%
2006 Total 13 100.0% $1,073,558 100.0%
Grand Total 147 $8,266,734
* Product Donation/Implants Only
7
Distribution by Type of Study/DepartmentType of Study
Count of Studies by Type
% of Studies by Type
Amount of Funding *
% of Funding
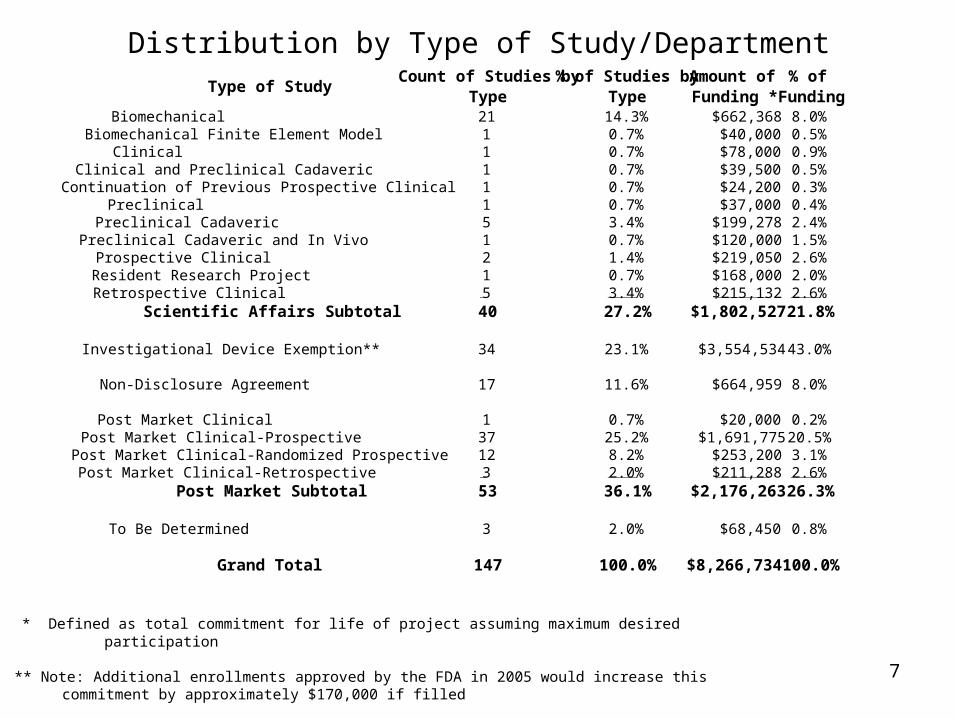
Biomechanical 21 14.3% $662,368 8.0%Biomechanical Finite Element Model 1 0.7% $40,000 0.5%Clinical 1 0.7% $78,000 0.9%Clinical and Preclinical Cadaveric 1 0.7% $39,500 0.5%Continuation of Previous Prospective Clinical 1 0.7% $24,200 0.3%Preclinical 1 0.7% $37,000 0.4%Preclinical Cadaveric 5 3.4% $199,278 2.4%Preclinical Cadaveric and In Vivo 1 0.7% $120,000 1.5%Prospective Clinical 2 1.4% $219,050 2.6%Resident Research Project 1 0.7% $168,000 2.0%Retrospective Clinical 5 3.4% $215,132 2.6%
Scientific Affairs Subtotal 40 27.2% $1,802,527 21.8%
Investigational Device Exemption** 34 23.1% $3,554,534 43.0%
Non-Disclosure Agreement 17 11.6% $664,959 8.0%
Post Market Clinical 1 0.7% $20,000 0.2%Post Market Clinical-Prospective 37 25.2% $1,691,775 20.5%Post Market Clinical-Randomized Prospective 12 8.2% $253,200 3.1%Post Market Clinical-Retrospective 3 2.0% $211,288 2.6%
Post Market Subtotal 53 36.1% $2,176,263 26.3%
To Be Determined 3 2.0% $68,450 0.8%
Grand Total 147 100.0% $8,266,734 100.0%
* Defined as total commitment for life of project assuming maximum desiredparticipation
** Note: Additional enrollments approved by the FDA in 2005 would increase this commitment by approximately $170,000 if filled

8
Distribution by Region
RegionCount of Region's
Contracts
% of Total # of Contracts
Amount of Funding
% of Total Funding
Cascade 2 1.4% $108,300 1.3%Central 6 4.1% $130,093 1.6%Cumberland 1 0.7% $31,000 0.4%Desert Southwest 2 1.4% $37,950 0.5%Florida 10 6.8% $316,150 3.8%Gateway 2 1.4% $35,600 0.4%Great Lakes 13 8.8% $449,057 5.4%Gulf Coast 1 0.7% $46,500 0.6%Liberty 10 6.8% $434,347 5.3%Lone Star 10 6.8% $700,364 8.5%Metropolitan 5 3.4% $583,500 7.1%Mid America 7 4.8% $249,475 3.0%Mid Atlantic 10 6.8% $494,605 6.0%New England 1 0.7% $72,500 0.9%North Star 5 3.4% $184,848 2.2%Northwest 3 2.0% $177,206 2.1%Old Dominion 4 2.7% $212,191 2.6%Outside US 2 1.4% $78,000 0.9%Ozarks 3 2.0% $58,700 0.7%Pacific 9 6.1% $511,991 6.2%Piedmont 3 2.0% $225,176 2.7%Rocky Mountain 10 6.8% $863,927 10.5%San Diego 7 4.8% $303,775 3.7%South Carolina 1 0.7% $168,000 2.0%Southern 3 2.0% $64,632 0.8%To Be Determined 6 4.1% $762,175 9.2%Upstate New York 4 2.7% $284,888 3.4%West 7 4.8% $681,784 8.2%
Grand Total 147 100.0% $8,266,734 100.0%
9
Market Research
Review of Domestic Premium Chocolate and Frozen Pizza
Markets
10
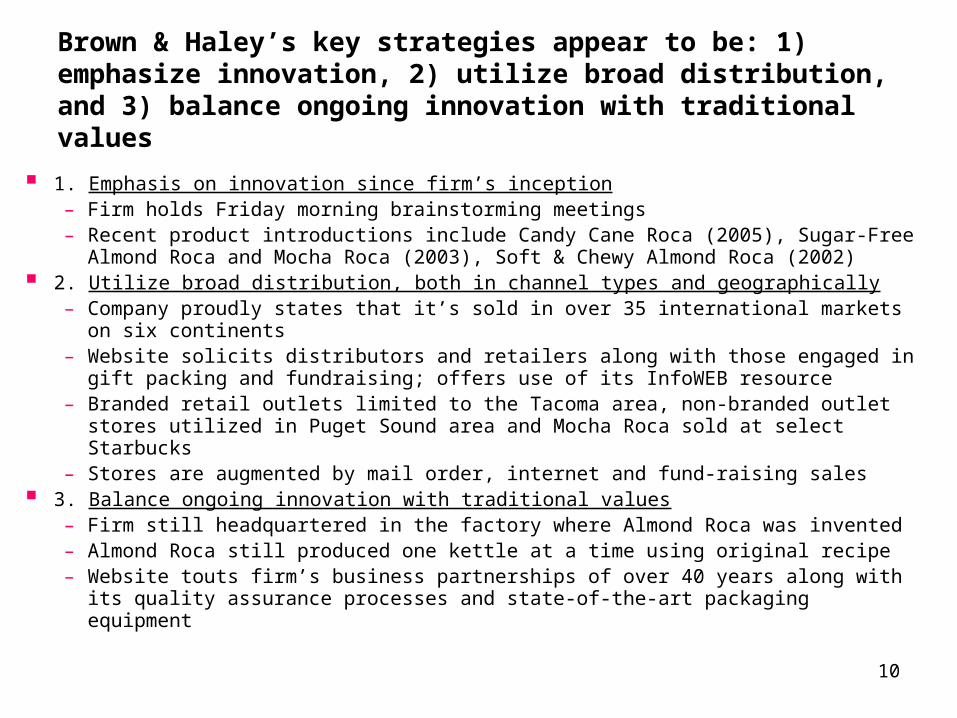
Brown & Haley’s key strategies appear to be: 1) emphasize innovation, 2) utilize broad distribution, and 3) balance ongoing innovation with traditional values
1. Emphasis on innovation since firm’s inception– Firm holds Friday morning brainstorming meetings– Recent product introductions include Candy Cane Roca (2005), Sugar-Free
Almond Roca and Mocha Roca (2003), Soft & Chewy Almond Roca (2002) 2. Utilize broad distribution, both in channel types and geographically
– Company proudly states that it’s sold in over 35 international markets on six continents
– Website solicits distributors and retailers along with those engaged in gift packing and fundraising; offers use of its InfoWEB resource
– Branded retail outlets limited to the Tacoma area, non-branded outlet stores utilized in Puget Sound area and Mocha Roca sold at select Starbucks
– Stores are augmented by mail order, internet and fund-raising sales 3. Balance ongoing innovation with traditional values
– Firm still headquartered in the factory where Almond Roca was invented– Almond Roca still produced one kettle at a time using original recipe– Website touts firm’s business partnerships of over 40 years along with its
quality assurance processes and state-of-the-art packaging equipment
11
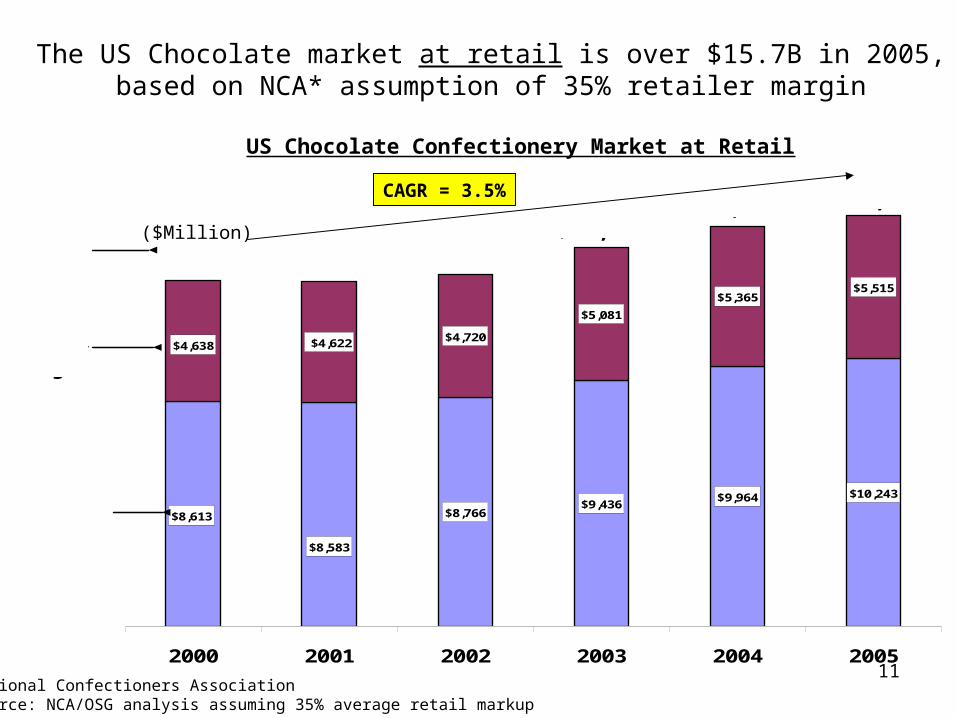
$10,243
$8,613
$9,964 $9,436
$8,766
$8,583
$5,515
$4,638
$5,365
$5,081
$4,720 $4,622
2000 2001 2002 2003 2004 2005
$13,251$14,517
$13,486
$15,329
$13,205
$15,758
Retail Market
35% Retailer Margin
Wholesale Market
The US Chocolate market at retail is over $15.7B in 2005, based on NCA* assumption of 35% retailer margin
* National Confectioners Association Source: NCA/OSG analysis assuming 35% average retail markup
CAGR = 3.5%
US Chocolate Confectionery Market at Retail
($Million)

12
Kraft achieved market leadership in 1992. Since 2000: Kraft, Nestle and All Other gained share, while Schwan’s and General
Mills lost
Source: AC Nielsen scanned 3 outlet > $2 MM
38.4%37.5%
26.9%
30.6%
19.6%18.3%
7.9%9.6%
7.2%
5.0%
0%
5%
10%
15%
20%
25%
30%
35%
40%
45%
1988 1989 1990 1991 1992 1993 1994 1995 1996 1997 1998 1999 2000 2001 2002 2003 2004 2005
Mar
ket
Sh
are
Kraft
Nestle
General Mills
All Other
Schwan's
+0.9 pp
00-05Share
+1.3 pp
-3.7 pp
+2.2 pp
-1.7 pp
1988-2005 Frozen Pizza Competitor Shares
Kraft Leads
G MillsLeads
Schwan’sLeads
13
Market Research
Review of Major Grocery Store Chains

14
Financial OverviewSize and Profitability of Competitors
Source: Company Annual Reports, 10-Ks
Sales ($B)Sales 5
Year CAGROperating Margin*
Sales ($B)
Sales 5 Year CAGR
Operating Margin*
Wal-Mart $345.0 11.4% 4.9% Target $59.5 8.4% 8.6%Tesco* $68.8 18.0% 5.6% Publix $21.8 7.3% 7.1%Kroger $66.1 5.7% 3.4% Whole Foods $5.6 19.8% 5.7%Costco $60.2 11.6% 2.7% Tesco* $68.8 18.0% 5.6%Target $59.5 8.4% 8.6% Wal-Mart $345.0 11.4% 4.9%Albertson's** $40.4 2.6% 3.1% Safeway $40.2 3.1% 4.0%Safeway $40.2 3.1% 4.0% Royal Ahold $39.0 1.5% 3.9%Royal Ahold $39.0 1.5% 3.9% Supervalu $37.4 13.0% 3.5%Supervalu $37.4 13.0% 3.5% Kroger $66.1 5.7% 3.4%Sainsbury $28.0 4.3% 2.1% Albertson's** $40.4 2.6% 3.1%Publix $21.8 7.3% 7.1% Costco $60.2 11.6% 2.7%A&P* $6.9 -7.7% -0.1% Sainsbury $28.0 4.3% 2.1%Whole Foods $5.6 19.8% 5.7% Wild Oats* $1.1 6.0% 1.6%Wegmans $4.1 7.2% NA Pathmark $4.1 0.5% 0.8%Pathmark $4.1 0.5% 0.8% A&P* $6.9 -7.7% -0.1%Wild Oats* $1.1 6.0% 1.6% Wegmans $4.1 7.2% NAShopRite NA NA NA ShopRite NA NA NA
* Adjusted where appropriate
** Data for 2005
15
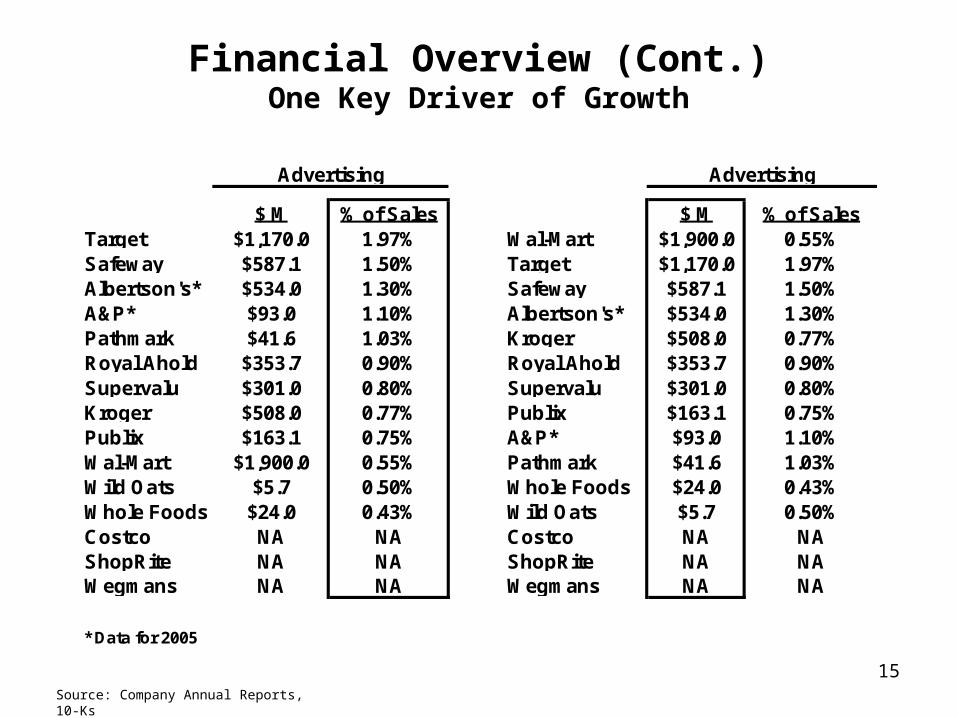
Financial Overview (Cont.)One Key Driver of Growth
Source: Company Annual Reports, 10-Ks
$ M % of Sales $ M % of SalesTarget $1,170.0 1.97% Wal-Mart $1,900.0 0.55%Safeway $587.1 1.50% Target $1,170.0 1.97%Albertson's* $534.0 1.30% Safeway $587.1 1.50%A&P* $93.0 1.10% Albertson's* $534.0 1.30%Pathmark $41.6 1.03% Kroger $508.0 0.77%Royal Ahold $353.7 0.90% Royal Ahold $353.7 0.90%Supervalu $301.0 0.80% Supervalu $301.0 0.80%Kroger $508.0 0.77% Publix $163.1 0.75%Publix $163.1 0.75% A&P* $93.0 1.10%Wal-Mart $1,900.0 0.55% Pathmark $41.6 1.03%Wild Oats $5.7 0.50% Whole Foods $24.0 0.43%Whole Foods $24.0 0.43% Wild Oats $5.7 0.50%Costco NA NA Costco NA NAShopRite NA NA ShopRite NA NAWegmans NA NA Wegmans NA NA
* Data for 2005
Advertising Advertising
16
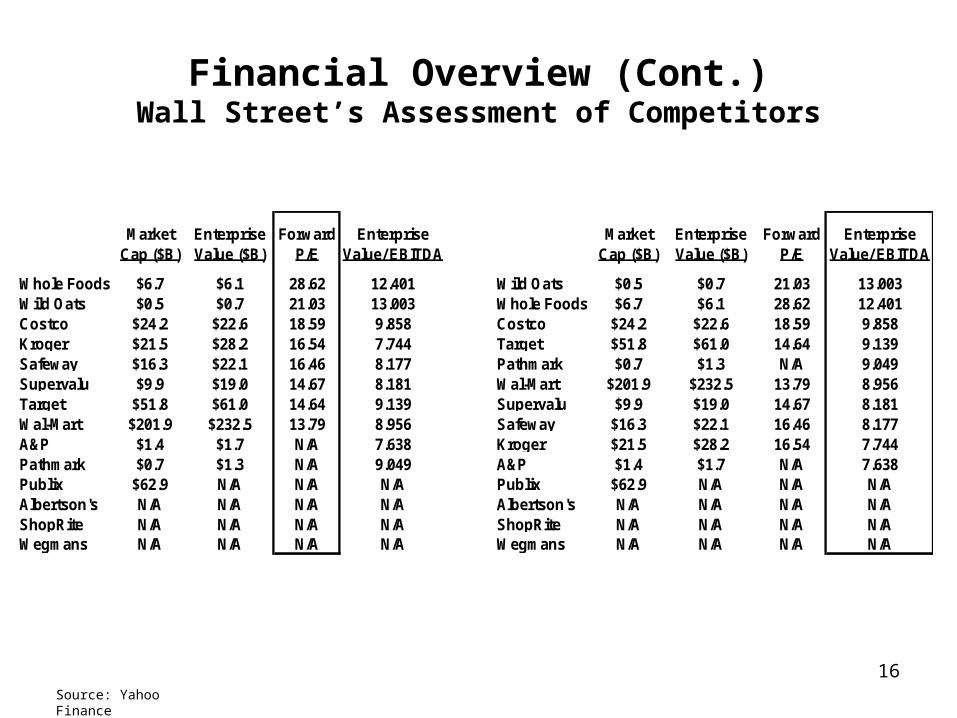
Financial Overview (Cont.)Wall Street’s Assessment of Competitors
Source: Yahoo Finance
Market Cap ($B)
Enterprise Value ($B)
Forward P/E
Enterprise Value/ EBITDA
Market Cap ($B)
Enterprise Value ($B)
Forward P/E
Enterprise Value/ EBITDA
Whole Foods $6.7 $6.1 28.62 12.401 Wild Oats $0.5 $0.7 21.03 13.003Wild Oats $0.5 $0.7 21.03 13.003 Whole Foods $6.7 $6.1 28.62 12.401Costco $24.2 $22.6 18.59 9.858 Costco $24.2 $22.6 18.59 9.858Kroger $21.5 $28.2 16.54 7.744 Target $51.8 $61.0 14.64 9.139Safeway $16.3 $22.1 16.46 8.177 Pathmark $0.7 $1.3 N/A 9.049Supervalu $9.9 $19.0 14.67 8.181 Wal-Mart $201.9 $232.5 13.79 8.956Target $51.8 $61.0 14.64 9.139 Supervalu $9.9 $19.0 14.67 8.181Wal-Mart $201.9 $232.5 13.79 8.956 Safeway $16.3 $22.1 16.46 8.177A&P $1.4 $1.7 N/A 7.638 Kroger $21.5 $28.2 16.54 7.744Pathmark $0.7 $1.3 N/A 9.049 A&P $1.4 $1.7 N/A 7.638Publix $62.9 N/A N/A N/A Publix $62.9 N/A N/A N/AAlbertson's N/A N/A N/A N/A Albertson's N/A N/A N/A N/AShopRite N/A N/A N/A N/A ShopRite N/A N/A N/A N/AWegmans N/A N/A N/A N/A Wegmans N/A N/A N/A N/A
17
Whole Foods Market General Background
• Founded in 1980 in Austin, Texas• Announced the acquisition of Whole Oats Markets for $565 million on 2/21/07
– All the information that follows excludes the impact of this event• Currently the world’s leading retailer of natural and organic foods• Operates 186 stores in North America and the United Kingdom• Approximately 42,000 employees, 36,000 of which are full time• Sales for the fiscal year ended 9/24/06 were $5.6 billion• Capital expenditures for the year totaled $340 million (over 60% used for new store
development)• Average store is 34,000 square feet and generates $31 million in annual sales
Source: Whole Foods 10-Ks, Company website
18
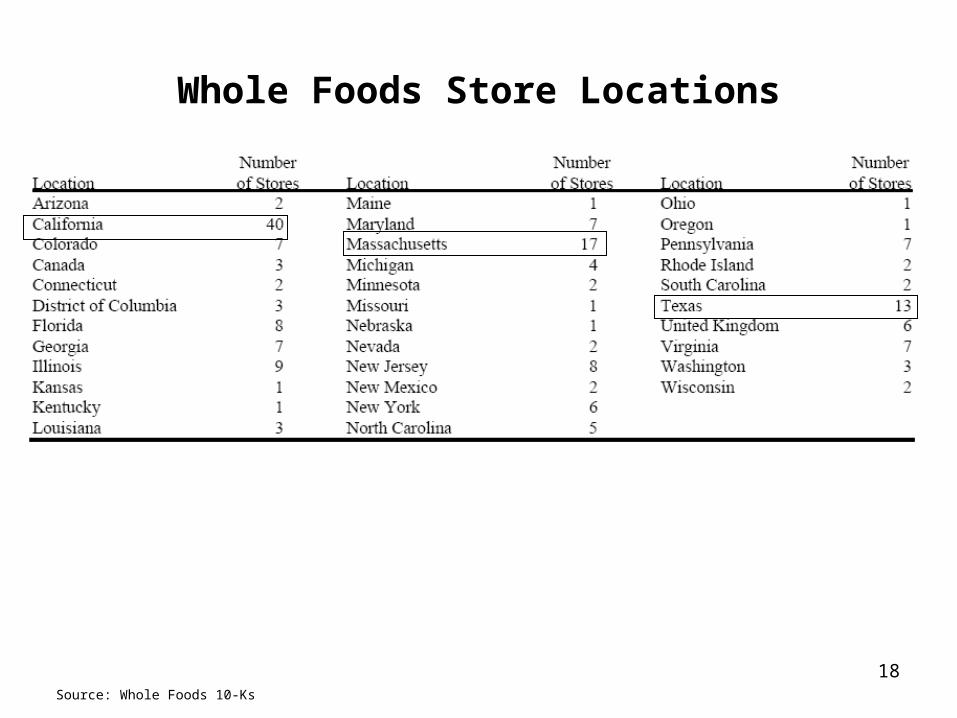
Whole Foods Store Locations
Source: Whole Foods 10-Ks
19
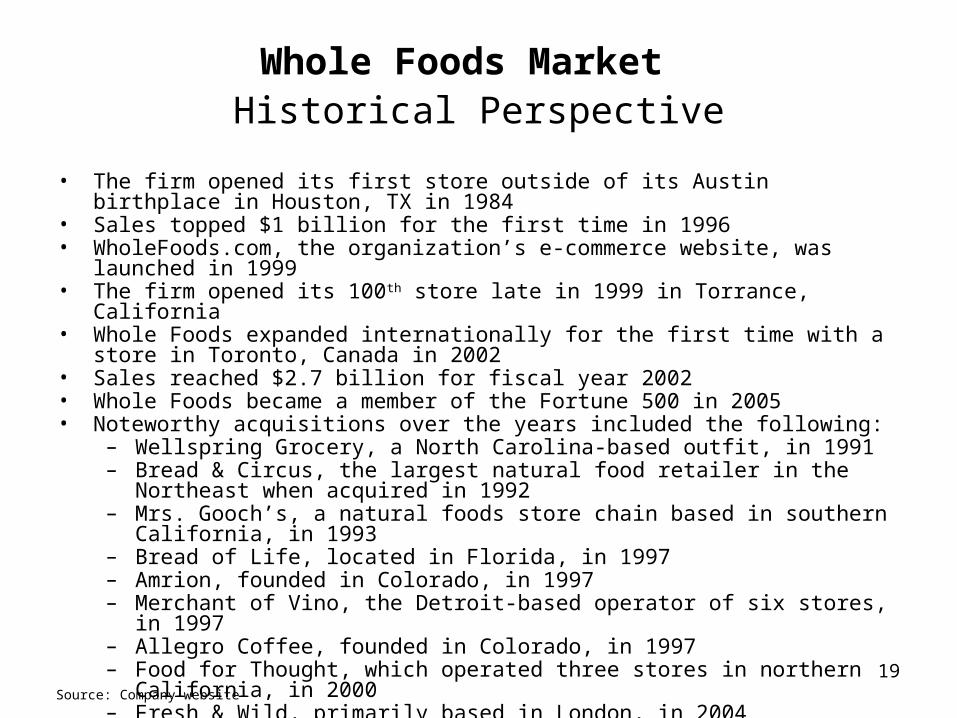
Whole Foods Market Historical Perspective
• The firm opened its first store outside of its Austin birthplace in Houston, TX in 1984• Sales topped $1 billion for the first time in 1996• WholeFoods.com, the organization’s e-commerce website, was launched in 1999• The firm opened its 100th store late in 1999 in Torrance, California• Whole Foods expanded internationally for the first time with a store in Toronto,
Canada in 2002• Sales reached $2.7 billion for fiscal year 2002• Whole Foods became a member of the Fortune 500 in 2005• Noteworthy acquisitions over the years included the following:
– Wellspring Grocery, a North Carolina-based outfit, in 1991– Bread & Circus, the largest natural food retailer in the Northeast when acquired
in 1992– Mrs. Gooch’s, a natural foods store chain based in southern California, in 1993– Bread of Life, located in Florida, in 1997– Amrion, founded in Colorado, in 1997– Merchant of Vino, the Detroit-based operator of six stores, in 1997– Allegro Coffee, founded in Colorado, in 1997– Food for Thought, which operated three stores in northern California, in 2000– Fresh & Wild, primarily based in London, in 2004
Source: Company website
20
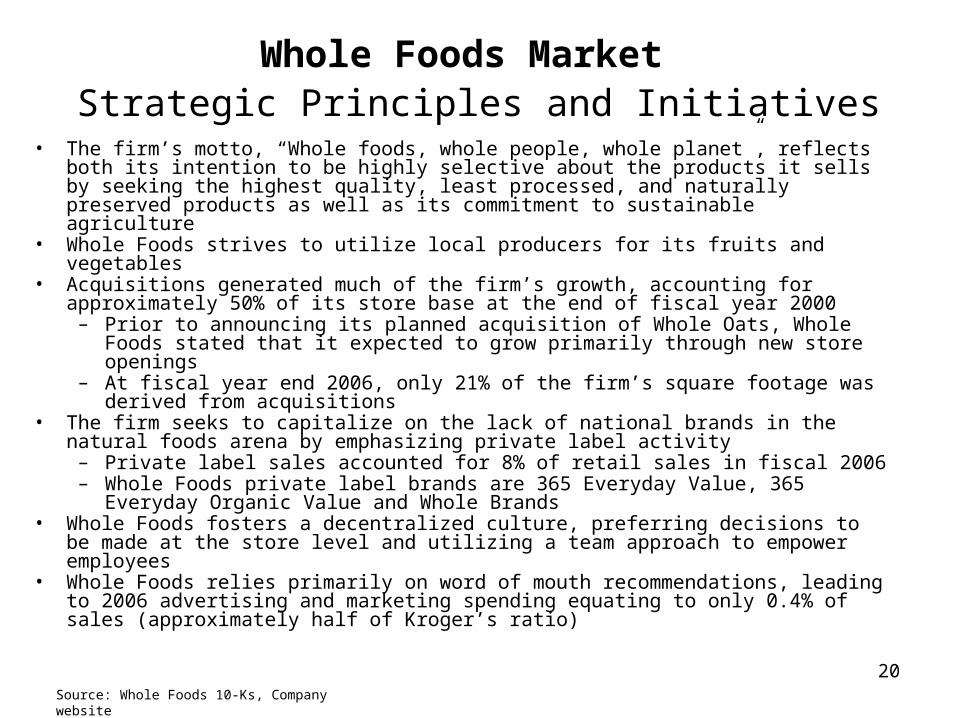
Whole Foods Market Strategic Principles and Initiatives
• The firm’s motto, “Whole foods, whole people, whole planet”, reflects both its intention to be highly selective about the products it sells by seeking the highest quality, least processed, and naturally preserved products as well as its commitment to sustainable agriculture
• Whole Foods strives to utilize local producers for its fruits and vegetables• Acquisitions generated much of the firm’s growth, accounting for approximately 50% of
its store base at the end of fiscal year 2000– Prior to announcing its planned acquisition of Whole Oats, Whole Foods stated
that it expected to grow primarily through new store openings– At fiscal year end 2006, only 21% of the firm’s square footage was derived from
acquisitions• The firm seeks to capitalize on the lack of national brands in the natural foods arena by
emphasizing private label activity– Private label sales accounted for 8% of retail sales in fiscal 2006– Whole Foods private label brands are 365 Everyday Value, 365 Everyday Organic
Value and Whole Brands• Whole Foods fosters a decentralized culture, preferring decisions to be made at the
store level and utilizing a team approach to empower employees• Whole Foods relies primarily on word of mouth recommendations, leading to 2006
advertising and marketing spending equating to only 0.4% of sales (approximately half of Kroger’s ratio)
Source: Whole Foods 10-Ks, Company website
21Source: Whole Foods 10-Ks; FY ending September
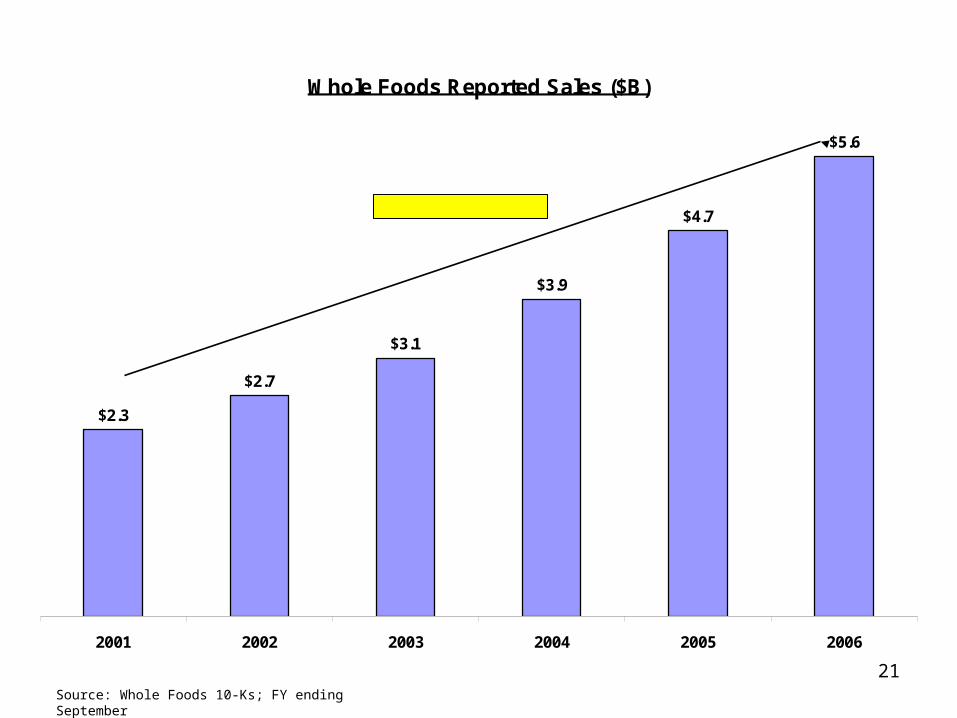
Whole Foods Reported Sales ($B)
$2.3
$2.7
$3.1
$3.9
$4.7
$5.6
2001 2002 2003 2004 2005 2006
5 Year CAGR=19.8%
22
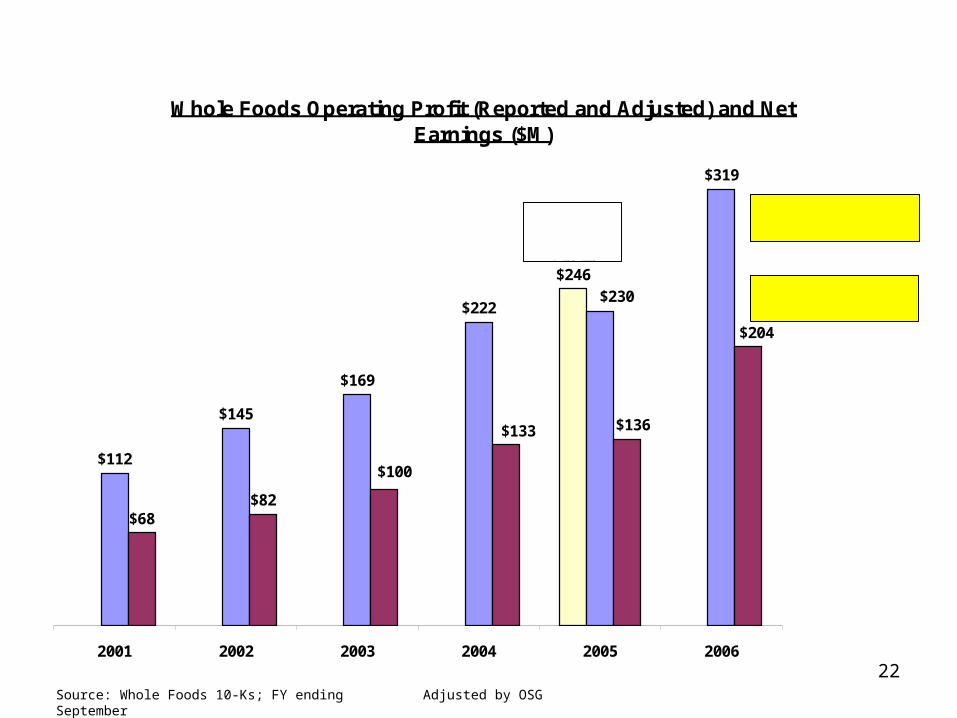
Whole Foods Operating Profit (Reported and Adjusted) and Net Earnings ($M)
$246
$112
$145
$169
$222
$319
$68$82
$230
$204
$136$133
$100
2001 2002 2003 2004 2005 2006
Operating Profit5 Year CAGR=23.4%
Net Earnings5 Year CAGR=24.6%
Adjusted Operating
Profit
Source: Whole Foods 10-Ks; FY ending September Adjusted by OSG
23Adjusted by OSGSource: Whole Foods 10-Ks; FY ending September
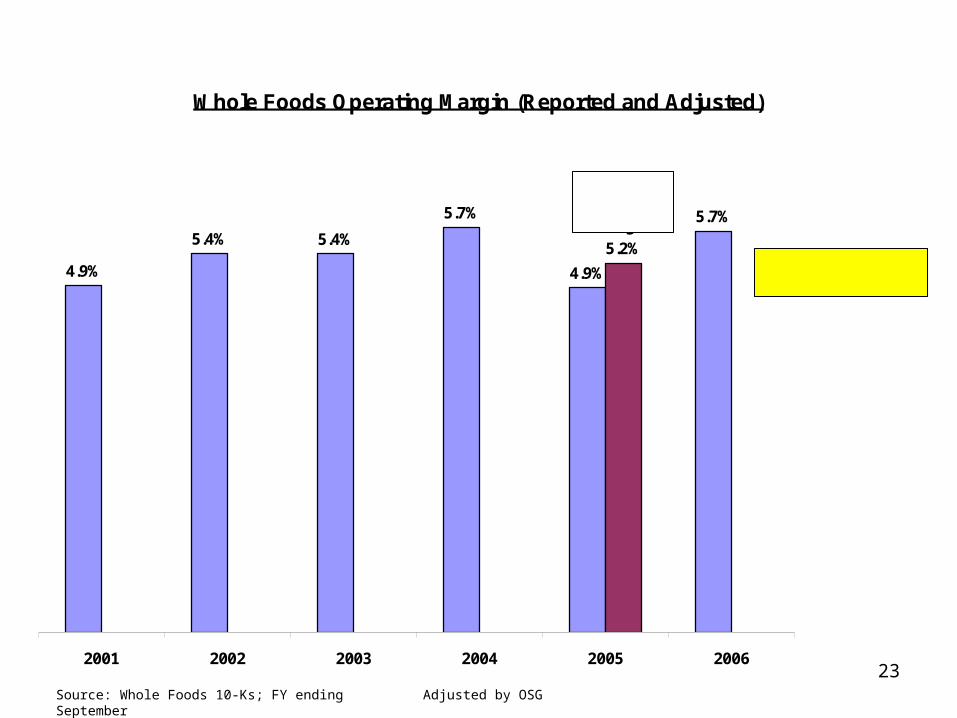
Whole Foods Operating Margin (Reported and Adjusted)
4.9%
5.4% 5.4%
5.7%
4.9%
5.7%
5.2%
2001 2002 2003 2004 2005 2006
Operating Margin5 Year CAGR=3.0%
Adjusted Operating
Margin
24Source: Whole Foods 10-Ks, FY ending September
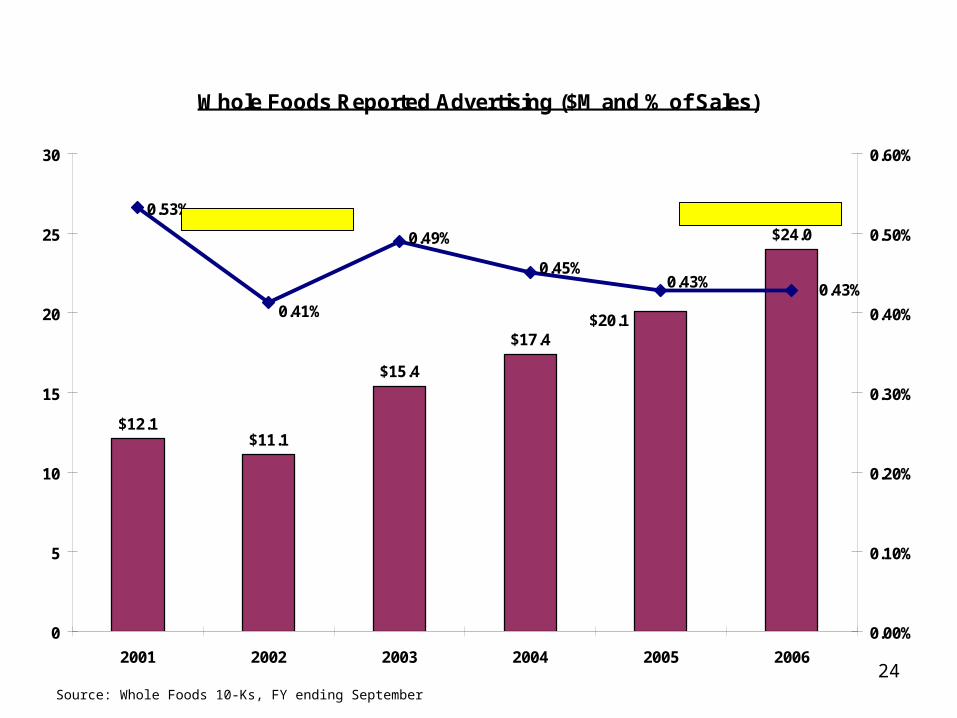
Whole Foods Reported Advertising ($M and % of Sales)
$12.1$11.1
$15.4
$17.4
$24.0
$20.1
0.53%
0.49%
0.41%0.43%0.43%
0.45%
0
5
10
15
20
25
30
2001 2002 2003 2004 2005 2006
0.00%
0.10%
0.20%
0.30%
0.40%
0.50%
0.60%
5 Year CAGR=14.7%5 Year CAGR=(4.3%)
25
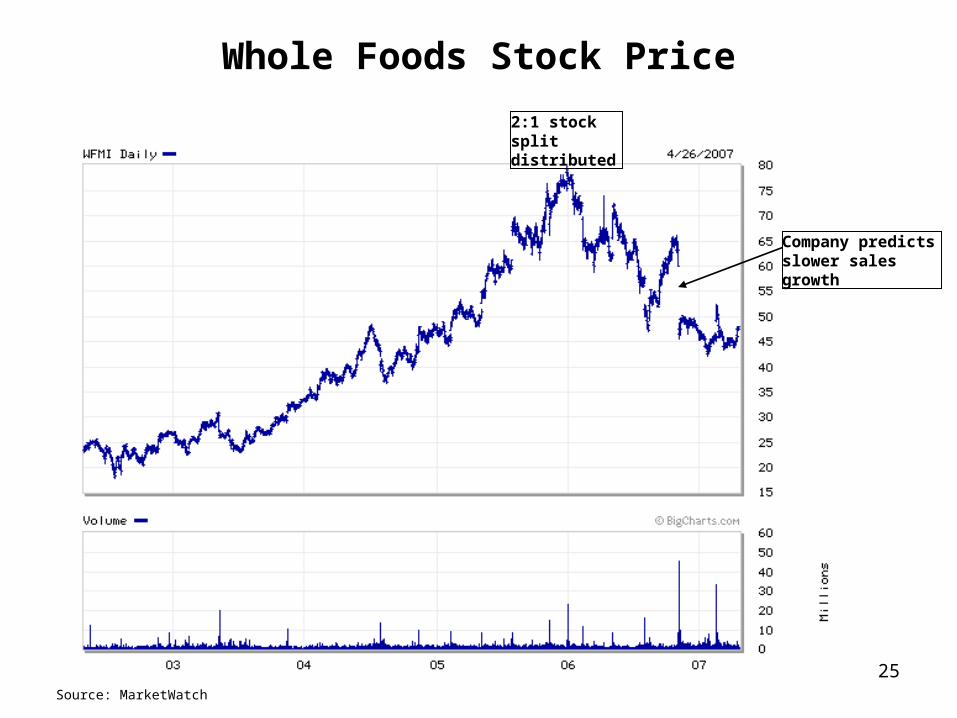
Whole Foods Stock Price
Source: MarketWatch
2:1 stock split distributed
Company predicts slower sales growth
26
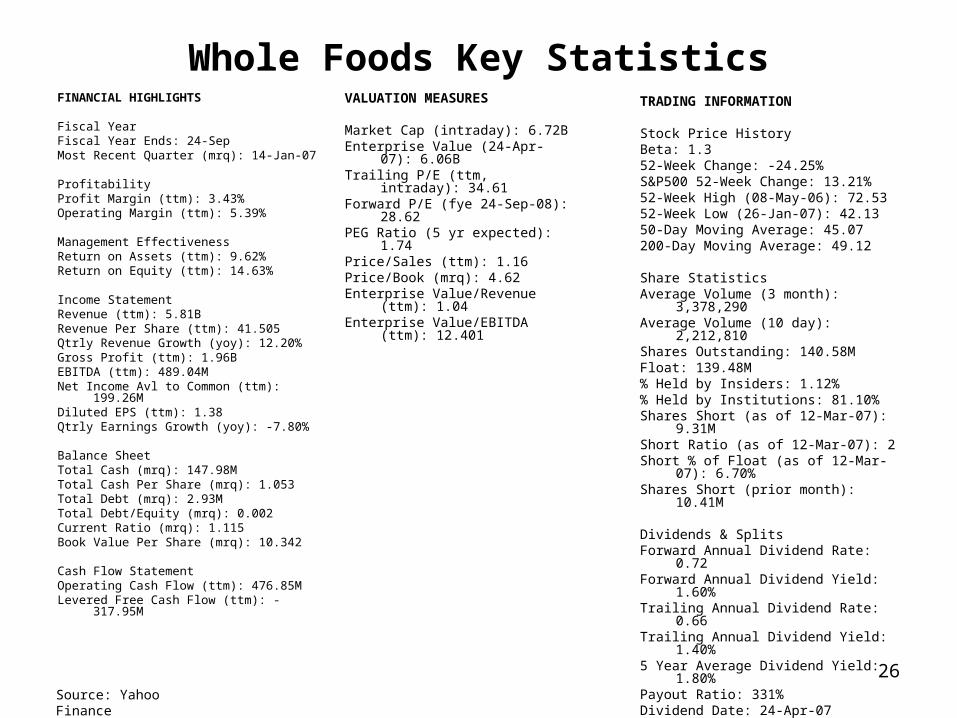
Whole Foods Key StatisticsFINANCIAL HIGHLIGHTS Fiscal Year Fiscal Year Ends: 24-Sep Most Recent Quarter (mrq): 14-Jan-07 Profitability Profit Margin (ttm): 3.43% Operating Margin (ttm): 5.39% Management Effectiveness Return on Assets (ttm): 9.62% Return on Equity (ttm): 14.63% Income Statement Revenue (ttm): 5.81B Revenue Per Share (ttm): 41.505 Qtrly Revenue Growth (yoy): 12.20% Gross Profit (ttm): 1.96B EBITDA (ttm): 489.04M Net Income Avl to Common (ttm): 199.26M Diluted EPS (ttm): 1.38 Qtrly Earnings Growth (yoy): -7.80% Balance Sheet Total Cash (mrq): 147.98M Total Cash Per Share (mrq): 1.053 Total Debt (mrq): 2.93M Total Debt/Equity (mrq): 0.002 Current Ratio (mrq): 1.115 Book Value Per Share (mrq): 10.342 Cash Flow Statement Operating Cash Flow (ttm): 476.85M Levered Free Cash Flow (ttm): -317.95M
TRADING INFORMATION Stock Price History Beta: 1.3 52-Week Change: -24.25% S&P500 52-Week Change: 13.21% 52-Week High (08-May-06): 72.53 52-Week Low (26-Jan-07): 42.13 50-Day Moving Average: 45.07 200-Day Moving Average: 49.12 Share Statistics Average Volume (3 month): 3,378,290 Average Volume (10 day): 2,212,810 Shares Outstanding: 140.58M Float: 139.48M % Held by Insiders: 1.12% % Held by Institutions: 81.10% Shares Short (as of 12-Mar-07): 9.31M Short Ratio (as of 12-Mar-07): 2 Short % of Float (as of 12-Mar-07): 6.70% Shares Short (prior month): 10.41M
Dividends & Splits Forward Annual Dividend Rate: 0.72 Forward Annual Dividend Yield: 1.60% Trailing Annual Dividend Rate: 0.66Trailing Annual Dividend Yield: 1.40% 5 Year Average Dividend Yield: 1.80% Payout Ratio: 331% Dividend Date: 24-Apr-07 Ex-Dividend Date: 11-Apr-07 Last Split Factor (new per old): 2:1 Last Split Date: 28-Dec-05
VALUATION MEASURES Market Cap (intraday): 6.72B Enterprise Value (24-Apr-07): 6.06B Trailing P/E (ttm, intraday): 34.61 Forward P/E (fye 24-Sep-08): 28.62 PEG Ratio (5 yr expected): 1.74 Price/Sales (ttm): 1.16 Price/Book (mrq): 4.62 Enterprise Value/Revenue (ttm): 1.04Enterprise Value/EBITDA (ttm): 12.401
Source: Yahoo Finance
27
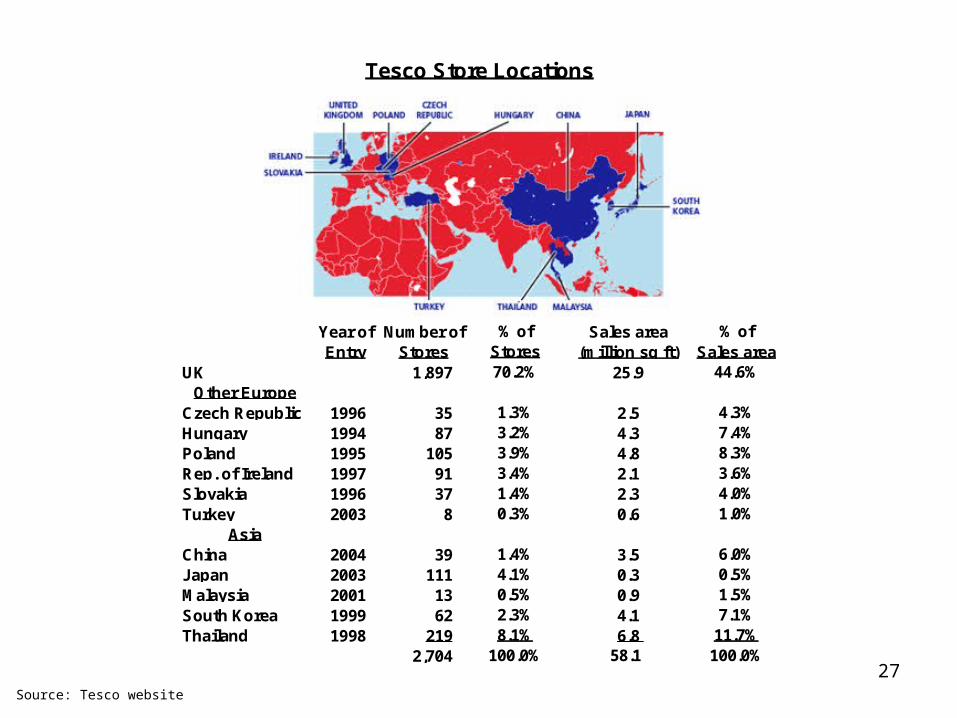
Year of Number of % of Sales area % ofEntry Stores Stores (million sq ft) Sales area
UK 1,897 70.2% 25.9 44.6%Other Europe
Czech Republic 1996 35 1.3% 2.5 4.3%Hungary 1994 87 3.2% 4.3 7.4%Poland 1995 105 3.9% 4.8 8.3%Rep. of Ireland 1997 91 3.4% 2.1 3.6%Slovakia 1996 37 1.4% 2.3 4.0%Turkey 2003 8 0.3% 0.6 1.0%
AsiaChina 2004 39 1.4% 3.5 6.0%Japan 2003 111 4.1% 0.3 0.5%Malaysia 2001 13 0.5% 0.9 1.5%South Korea 1999 62 2.3% 4.1 7.1%Thailand 1998 219 8.1% 6.8 11.7%
2,704 100.0% 58.1 100.0%
Tesco Store Locations
Source: Tesco website
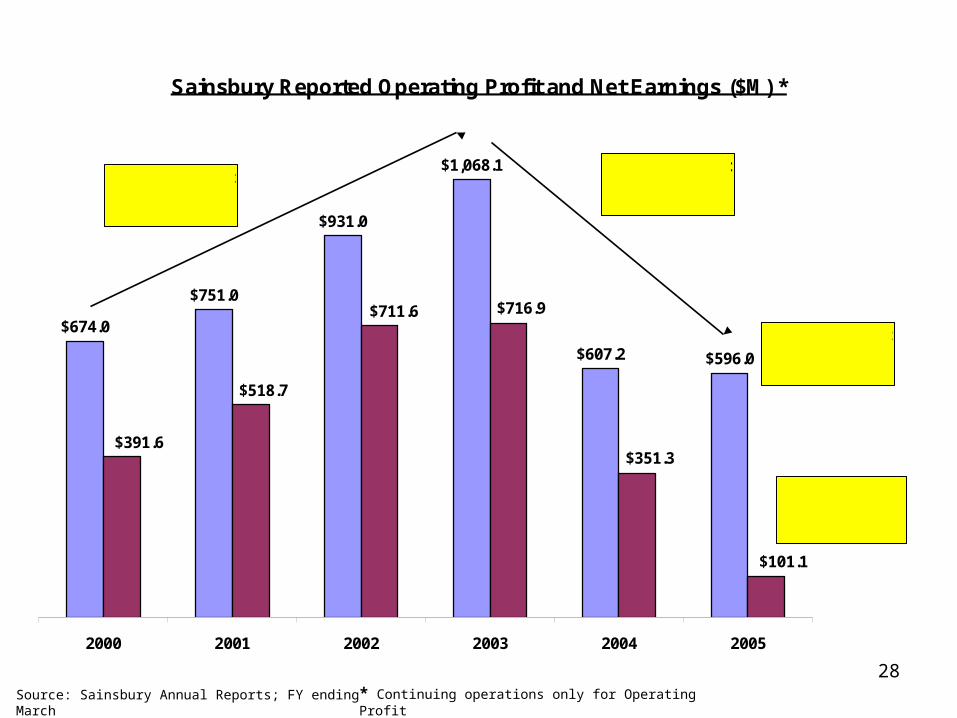
28Source: Sainsbury Annual Reports; FY ending March * Continuing operations only for Operating Profit
Sainsbury Reported Operating Profit and Net Earnings ($M) *
$674.0
$751.0
$931.0
$1,068.1
$607.2 $596.0
$101.1
$351.3
$716.9$711.6
$518.7
$391.6
2000 2001 2002 2003 2004 2005
Net Earnings5 Year
CAGR=(23.7%)
Operating Profit 5 Year
CAGR=(2.4%)
Operating Profit 2 Year
CAGR=(25.3%)
Operating Profit 3 Year
CAGR=16.6%

29
Supervalu Strategic Principles and Initiatives
• Supervalu’s mission is to serve its customers better than anyone else could through a combination of quality, variety and convenience
• The firm utilizes three retail formats to achieve the combination of price, service and selection that best caters to local tastes
– Combination stores: complete grocery and drug stores that often include meat, seafood, and deli departments while offering cosmetics and general merchandise (60,000 square feet, 50,000 SKUs)
– Food stores: grocery offerings similar to the combo store but on a more limited basis, no pharmacy (40,000 square feet, 40,000 SKUs)
– Limited assortment food stores: extreme value grocery stores stocking high volume food items in a single size and limited general merchandise (15,000 square feet, 1,400 SKUs)
• Supervalu expects future growth in square footage to largely come from selective openings of new stores in important markets where it has a significant market share
• The firm offers three quality tiers in its private label brands:– Premium (essentia, Wild Harvest): unique, top-quality products– First tier (Albertsons, Acme, Shaw’s, Flavorite): quality items equivalent to national
brands at competitive prices– Value brands (Shopper’s Value, Good Day): quality alternatives to national brands
at substantial savings• The firm continues to dedicate significant attention to its supply chain operations
– These supply Supervalu’s 2,500 retail stores and a similar number of independent grocers in 48 states, generating $9.4 billion in revenue and garnering $103 million of the 2006 capital budget
Source: Supervalu 10-Ks, website
30
• In 1998, the firm began a top-down process of investing in research, people and systems
• The overall goals were to improve quality, upgrade packaging, consolidate brands and introduce sub-brands
– Broadly speaking, Supervalu adopted a national brand approach to PL• The firm first focused on quality when it learned from research that its PL products
had an 87% pass rate against specifications and generated 5 consumer complaints per $500k of sales
– Supervalu adopted targets of a 95% pass rate and 2.5 complaints per $500k– Ahead of schedule, it achieved a 96.5% pass rate and 1.97 complaints per $500k– By year end 2004, this had improved to 97%/1.65
• Individual categories were studied for penetration levels and upside potential as judged against the best in class PL share
• Extensive consumer research was utilized to determine what shoppers wanted in terms of packaging, pack size and ingredients
• The firm also sought to improve SKU rationalization, consolidating slower moving brands into successful ones
• Significant research was employed to improve packaging under the theory that the quality not only has to be in the package, but on it as well
Supervalu’s reinvention of its private label program
Source: Private Label Buyer
Related Documents