Representation of Ecological Systems within the Protected Areas Network of the Continental United States Jocelyn L. Aycrigg 1 *, Anne Davidson 1 , Leona K. Svancara 2 , Kevin J. Gergely 3 , Alexa McKerrow 4 , J. Michael Scott 5 1 National Gap Analysis Program, Department of Fish and Wildlife Sciences, University of Idaho, Moscow, Idaho, United States of America, 2 Idaho Department of Fish and Game, Moscow, Idaho, United States of America, 3 United States Geological Survey Gap Analysis Program, Boise, Idaho, United States of America, 4 United States Geological Survey Gap Analysis Program, Raleigh, North Carolina, United States of America, 5 Department of Fish and Wildlife Sciences, University of Idaho, Moscow, Idaho, United States of America Abstract If conservation of biodiversity is the goal, then the protected areas network of the continental US may be one of our best conservation tools for safeguarding ecological systems (i.e., vegetation communities). We evaluated representation of ecological systems in the current protected areas network and found insufficient representation at three vegetation community levels within lower elevations and moderate to high productivity soils. We used national-level data for ecological systems and a protected areas database to explore alternative ways we might be able to increase representation of ecological systems within the continental US. By following one or more of these alternatives it may be possible to increase the representation of ecological systems in the protected areas network both quantitatively (from 10% up to 39%) and geographically and come closer to meeting the suggested Convention on Biological Diversity target of 17% for terrestrial areas. We used the Landscape Conservation Cooperative framework for regional analysis and found that increased conservation on some private and public lands may be important to the conservation of ecological systems in Western US, while increased public-private partnerships may be important in the conservation of ecological systems in Eastern US. We have not assessed the pros and cons of following the national or regional alternatives, but rather present them as possibilities that may be considered and evaluated as decisions are made to increase the representation of ecological systems in the protected areas network across their range of ecological, geographical, and geophysical occurrence in the continental US into the future. Citation: Aycrigg JL, Davidson A, Svancara LK, Gergely KJ, McKerrow A, et al. (2013) Representation of Ecological Systems within the Protected Areas Network of the Continental United States. PLoS ONE 8(1): e54689. doi:10.1371/journal.pone.0054689 Editor: Kimberly Patraw Van Niel, University of Western Australia, Australia Received March 22, 2012; Accepted December 17, 2012; Published January 23, 2013 This is an open-access article, free of all copyright, and may be freely reproduced, distributed, transmitted, modified, built upon, or otherwise used by anyone for any lawful purpose. The work is made available under the Creative Commons CC0 public domain dedication. Funding: The National Gap Analysis Program at the University of Idaho is supported by the United States Geological Society Gap Analysis Program under grant #G08A00047. The url: gapanalysis.usgs.gov. The agreement mentioned above supported JA and AD to do the study design, data collection and analysis as well as the decision to publish and preparation of the manuscript. LS was supported by Idaho Department of Fish and Game to help with the study design, data analysis, and preparation of the manuscript. AM and KG were funded by United States Geological Survey GAP to help with study design, data collection and analysis. KG is the program officer for this agreement and he has been involved with the study design, data collection, and data analysis for this manuscript. JMS is retired and he helped with the study design, decision to publish and preparation of the manuscript. The funders had a role in the study design, data collection, and data analysis, but not in the decision to publish or preparation of the manuscript. Competing Interests: The authors have declared that no competing interests exist. * E-mail: [email protected] Introduction Traditionally, a mix of opportunity, available resources, and agency-specific conservation priorities are the foundation upon which networks of protected areas are developed over time [1–4]. This has led to a protected areas network in the continental US cultivated for multiple purposes including protecting biological resources, such as vegetation communities [5–8]. Often, to respond to conservation issues, such as habitat loss, the protected areas network is expanded by establishing new protected areas or enlarging existing ones [9–13]. However, with increasing land-use intensification the opportunities for expanding such networks are dwindling [4,14]. Furthermore, with the imminence of climate change along with increased loss and fragmentation of vegetation communities, the exigency of protecting areas that represent the full suite of vegetation communities and therefore the species found therein, has increased [15–17]. The conservation community has increasingly focused on landscape levels for national decision making, but the lack of relevant and consistent data at a national scale has been an impediment [18–20]. Most public land management agencies, even those with the broadest authorities to protect natural resources have yet to implement ecosystem-scale approaches, perhaps due to lack of relevant data [21,22]. However, the impediment that once prevented a national-scale approach to protected areas management in the continental US has recently been overcome with the availability of national-level data for vegetation communities, classified to ecological systems [23], and a protected areas database for the US [24]. Ecological systems are groups of vegetation communities that occur together within PLOS ONE | www.plosone.org 1 January 2013 | Volume 8 | Issue 1 | e54689

Welcome message from author
This document is posted to help you gain knowledge. Please leave a comment to let me know what you think about it! Share it to your friends and learn new things together.
Transcript
Representation of Ecological Systems within theProtected Areas Network of the Continental UnitedStatesJocelyn L. Aycrigg1*, Anne Davidson1, Leona K. Svancara2, Kevin J. Gergely3, Alexa McKerrow4, J.
Michael Scott5
1National Gap Analysis Program, Department of Fish and Wildlife Sciences, University of Idaho, Moscow, Idaho, United States of America, 2 Idaho Department of Fish and
Game, Moscow, Idaho, United States of America, 3United States Geological Survey Gap Analysis Program, Boise, Idaho, United States of America, 4United States
Geological Survey Gap Analysis Program, Raleigh, North Carolina, United States of America, 5Department of Fish and Wildlife Sciences, University of Idaho, Moscow,
Idaho, United States of America
Abstract
If conservation of biodiversity is the goal, then the protected areas network of the continental US may be one of our bestconservation tools for safeguarding ecological systems (i.e., vegetation communities). We evaluated representation ofecological systems in the current protected areas network and found insufficient representation at three vegetationcommunity levels within lower elevations and moderate to high productivity soils. We used national-level data forecological systems and a protected areas database to explore alternative ways we might be able to increase representationof ecological systems within the continental US. By following one or more of these alternatives it may be possible toincrease the representation of ecological systems in the protected areas network both quantitatively (from 10% up to 39%)and geographically and come closer to meeting the suggested Convention on Biological Diversity target of 17% forterrestrial areas. We used the Landscape Conservation Cooperative framework for regional analysis and found that increasedconservation on some private and public lands may be important to the conservation of ecological systems in Western US,while increased public-private partnerships may be important in the conservation of ecological systems in Eastern US. Wehave not assessed the pros and cons of following the national or regional alternatives, but rather present them aspossibilities that may be considered and evaluated as decisions are made to increase the representation of ecologicalsystems in the protected areas network across their range of ecological, geographical, and geophysical occurrence in thecontinental US into the future.
Citation: Aycrigg JL, Davidson A, Svancara LK, Gergely KJ, McKerrow A, et al. (2013) Representation of Ecological Systems within the Protected Areas Network ofthe Continental United States. PLoS ONE 8(1): e54689. doi:10.1371/journal.pone.0054689
Editor: Kimberly Patraw Van Niel, University of Western Australia, Australia
Received March 22, 2012; Accepted December 17, 2012; Published January 23, 2013
This is an open-access article, free of all copyright, and may be freely reproduced, distributed, transmitted, modified, built upon, or otherwise used by anyone forany lawful purpose. The work is made available under the Creative Commons CC0 public domain dedication.
Funding: The National Gap Analysis Program at the University of Idaho is supported by the United States Geological Society Gap Analysis Program under grant#G08A00047. The url: gapanalysis.usgs.gov. The agreement mentioned above supported JA and AD to do the study design, data collection and analysis as well asthe decision to publish and preparation of the manuscript. LS was supported by Idaho Department of Fish and Game to help with the study design, data analysis,and preparation of the manuscript. AM and KG were funded by United States Geological Survey GAP to help with study design, data collection and analysis. KG isthe program officer for this agreement and he has been involved with the study design, data collection, and data analysis for this manuscript. JMS is retired andhe helped with the study design, decision to publish and preparation of the manuscript. The funders had a role in the study design, data collection, and dataanalysis, but not in the decision to publish or preparation of the manuscript.
Competing Interests: The authors have declared that no competing interests exist.
* E-mail: [email protected]
Introduction
Traditionally, a mix of opportunity, available resources, and
agency-specific conservation priorities are the foundation upon
which networks of protected areas are developed over time [1–4].
This has led to a protected areas network in the continental US
cultivated for multiple purposes including protecting biological
resources, such as vegetation communities [5–8]. Often, to
respond to conservation issues, such as habitat loss, the protected
areas network is expanded by establishing new protected areas or
enlarging existing ones [9–13]. However, with increasing land-use
intensification the opportunities for expanding such networks are
dwindling [4,14]. Furthermore, with the imminence of climate
change along with increased loss and fragmentation of vegetation
communities, the exigency of protecting areas that represent the
full suite of vegetation communities and therefore the species
found therein, has increased [15–17].
The conservation community has increasingly focused on
landscape levels for national decision making, but the lack of
relevant and consistent data at a national scale has been an
impediment [18–20]. Most public land management agencies,
even those with the broadest authorities to protect natural
resources have yet to implement ecosystem-scale approaches,
perhaps due to lack of relevant data [21,22]. However, the
impediment that once prevented a national-scale approach to
protected areas management in the continental US has recently
been overcome with the availability of national-level data for
vegetation communities, classified to ecological systems [23], and
a protected areas database for the US [24]. Ecological systems are
groups of vegetation communities that occur together within
PLOS ONE | www.plosone.org 1 January 2013 | Volume 8 | Issue 1 | e54689
similar physical environments and are influenced by similar
ecological processes (e.g., fire or flooding), substrates (e.g.,
peatlands), and environmental gradients (e.g., montane, alpine
or subalpine zones) [23,25]. Ecological systems represent vegeta-
tion communities with spatial scales of tens to thousands of
hectares and temporal scales of 50–100 years. They represent the
habitat upon which vertebrate species rely for survival. The
Protected Areas Database of the US (PAD-US) represents public
land ownership and conservation lands (e.g., federal and state
lands), including privately protected areas that are voluntarily
provided (e.g. The Nature Conservancy) [24]. Each land parcel
within PAD-US is assigned a protection status that denotes both
the intended level of biodiversity protection and indicates other
natural, recreational and cultural uses (Table 1) [24]. Together,
these databases provide the foundation for assessing the represen-
tation of vegetation communities in the continental US within the
protected areas network and thereby informing decision making at
the national level.
The protected areas network within the continental US is often
viewed as one of our best conservation tools for securing
vegetation communities and the species they support into the
future [26–29]. An inherent assumption behind a network of
protected areas is that protection of vegetation communities will
also protect the species that rely on them, including invertebrate
and vertebrate species, many of which little is known of their life
history or habitat requirements [11,30,31]. For our analysis, we
narrowly defined a protected area as an area of land having
permanent protection from conversion of natural land cover and
a mandated management plan in operation to maintain a natural
state within which disturbance events may or may not be allowed
to proceed without interference and/or be mimicked through
management (Table 1) [24]. Furthermore, we defined a protected
areas network as a system of protected areas that increase the
effectiveness of in situ biodiversity conservation [32]. Lastly, we
defined biodiversity as a hierarchy from genes to communities
encompassing the interdependent structural, functional, and
compositional aspects of nature [33].
The questions of how much of a vegetation community to
protect and what approach is best for systematically protecting
vegetation communities have been discussed at length [34,35]. No
single solution or specific amount of area has been established to
meet both policy targets and biological conservation needs [35].
Most recently the Convention on Biological Diversity set a target
of 17% for terrestrial areas in the Aichi Biodiversity Targets
described within the Strategic Plan 2011–2020 [36]. The Aichi
Biodiversity Targets also attempt to address biological needs by
stating that areas protected should be ecologically representative
[36]. Representation of vegetation communities is often put forth
as a goal of conservation planning because the aim is to protect
something of everything in order to conserve the evolutionary
potential of the entire protected areas network [34,37,38]. The US
has not explicitly addressed the representation of vegetation
communities within the protected areas network; however,
Canada has used representation targets to structure their protected
areas network [39–41]. Even though climate change will likely
alter what is represented within Canada’s protected areas network,
starting from a representative group of protected vegetation
communities provides a foundation for climate change adaptation
[40,41].
Numerous assessments of the US protected areas network and
its effectiveness at conserving vegetation communities have all
concluded the network is falling short [15,20,42–48]. Each
assessment used the best data available at the time, but in all
cases, extent, resolution, and consistency of the data were limited.
Shelford [42] conducted the first assessment of protected areas in
the US in 1926. His aim was to study the native biota of North
America, which started with inventorying the existing protected
areas and how their vegetation communities had been modified
from pre-settlement conditions. Later, Scott et al. [15] found that
302 of 499 (,60%) mapped vegetation communities within the
US had ,10% representation within protected areas. Dietz and
Czech [20] found the median percentage of area protected within
the continental US was 4% for the ecological analysis units they
defined.
We recently have had the opportunity to evaluate the
representation (i.e., saving some of everything) and redundancy
(i.e., saving more than one of everything) of ecological systems
within the existing protected areas network for the continental US.
This opportunity was possible because of the availability of
a complete ecological systems database for the continental US and
a comprehensive database of the current protected areas network.
Hence, we can now assess how well the protected areas network
Table 1. Description of protection status categories in the Protected Areas Database for US [24].
Protection status Description Example
Lands managed to maintainbiodiversity (i.e., protected areasnetwork)
An area of land having permanent protection from conversion ofnatural land cover and a mandated management plan in operationto maintain a natural state within which disturbance events mayor may not be allowed to proceed without interference and/orbe mimicked through management.
Yellowstone National Park, Wyoming
Lands managed for multiple-use,including conservation
An area having permanent protection from conversion of naturalland cover for the majority of the area, but subject to extractive usesof either a broad low-intensity type (e.g., logging) or localized intensetype (e.g., mining). Protection of federally listed endangered andthreatened species throughout the area may be conferred.
Kaibab National Forest, Arizona
Lands with no permanent protectionfrom conversion, but may be managedfor conservation
An area with no known public or private institution mandates orlegally recognized easements or deed restrictions held by the managingentity to prevent conversion of natural habitats to anthropogenichabitat types. Conversion to unnatural land cover throughout isgenerally allowed and management intent is unknown.
Fort Irwin, California
Protection status denotes the intended level of biodiversity protection and indicates other natural, recreational, and cultural uses. These designations emphasize themanaging entity rather than the land owner because the focus is on long-term management intent. Therefore an area gets a designation of permanently protectedbecause that is the long-term management intent.doi:10.1371/journal.pone.0054689.t001
Ecological Systems in Protected Areas of US
PLOS ONE | www.plosone.org 2 January 2013 | Volume 8 | Issue 1 | e54689
encompasses the ecological and evolutionary patterns and pro-
cesses that maintain ecological systems and thereby the species
that depend on them [37]. Additionally, based on the Aichi
Biodiversity Targets within the Strategic Plan 2011–2020 of the
Convention on Biological Diversity, we can evaluate the current
protected areas network in the continental US in context of
meeting the suggested 17% target for terrestrial areas [36].
If the current protected areas network is falling short of
conserving vegetation communities then what potential alterna-
tives might be available to address those shortfalls? One such
alternative is to replace protected areas that contribute minimally
to conservation of vegetation communities with those with greater
conservation value [49]. The goal would be to increase the overall
biodiversity protection of the entire protected areas network. This
approach proposed by Fuller et al. [49] could be attractive
because the sale of protected areas with less conservation value
could go towards acquiring new ones. Fuller et al. [49] proposed
this approach in Australia where a protected areas network has
been systematically designed with broad representation of
Australia’s vegetation types [49]. The protected areas network in
the continental US has not been systematically designed [2,4].
Would this approach be feasible if the criteria for determining the
contribution to conservation (i.e., cost-effectiveness analysis) could
be agreed upon consistently across the continental US?
Another alternative to address the current protected areas
network’s shortfall could be to expand the network in area and
number of protected areas [9,11,13]. A national assessment would
be needed to identify vegetation communities not represented or
under-represented within the existing protected areas network and
a national conservation plan would be developed to prioritize
acquisition of these vegetation communities to increase their
representation on protected lands [50,51]. There are approxi-
mately 300 million hectares of public and private lands with no
permanent protection on which native vegetation communities
occur [23,24]. Could the representation of vegetation communities
within the protected areas network be increased by prioritizing
acquisition within these lands with no permanent protection?
A third alternative for addressing the protected areas network’s
shortcomings might be to increase the emphasis of maintaining
biodiversity on some public and private lands currently managed
for multiple-use (Table 1). Swaty et al. [52] found that in addition
to the 29% of the continental US land area that has been
converted by human use; there were an additional 23% of non-
converted lands with altered vegetation structure and composition,
which likely are lands managed for multiple-use. The protected
areas network is comprised of approximately 50 million hectares in
the continental US, while there are about 140 million hectares of
public and private lands managed for multiple-use [24]. Vegeta-
tion communities that are currently not represented or un-
derrepresented within the current protected areas network may
have representation on the approximately 140 million hectares of
land managed for multiple-use [20,24]. Could, therefore, an
emphasis on maintaining biodiversity on a strategically targeted
subset of lands managed for multiple-use be used to effectively
expand the representation of vegetation communities within the
entire protected areas network?
From a conservation management perspective for the US, the
Department of Interior (DOI) has established a framework of
Landscape Conservation Cooperatives (LCC) with the mission of
landscape-level planning and management [53]. This national
framework further supports the need for nationally consistent
databases and analyses. We focused our analysis on alternative
ways to potentially increase the representation of ecological
systems in the protected areas network of the continental US.
Specifically we asked (1) how well are ecological systems
represented in the protected areas network relative to their
occurrence in the continental US, including with regards to soil
productivity and elevation, (2) how alternative approaches may
potentially increase the representation of ecological systems in the
protected areas network, and (3) how Landscape Conservation
Cooperatives (LCC), the new landscape unit for conservation
initiatives, can be used to regionally assess conservation status of
ecological systems.
Materials and Methods
Data DescriptionWe used the National Gap Analysis Program (GAP) Land
Cover [23] and US Geological Survey GAP’s (USGS-GAP)
Protected Areas Database of the US (PAD-US 1.0) [24] as the
national datasets for our analyses. The land cover data contains 3
nested hierarchical levels of vegetation communities. Level I
contains 8 groupings, based on generalized vegetative physiogno-
my (e.g., grassland, shrubland, forest), while Level II has 43
groupings representing general groups of ecological systems based
on physiognomy and abiotic factors (e.g., lowland grassland and
prairie, alpine sparse and barren). The third hierarchical level
contains 551 map classes, including 518 ecological systems. We
focused on the non-modified, non-aquatic classes at each level
(Level I: 5 classes, Level II: 37 classes, and Level III: 518 ecological
systems).
The National GAP Land Cover was compiled from the
Southwest, Southeast, Northwest, and California GAP land cover
data completed during 2004–2009 [23]. We incorporated data
from LANDFIRE (www.landfire.gov) for the Midwest and
Northeast. These national land cover data were based on
consistent satellite imagery (Landsat Thematic Mapper (TM)
and Enhanced Thematic Mapper (ETM)) acquired between 1999
and 2001 in conjunction with digital elevation model (DEM)
derived datasets (e.g., elevation, landform) and a common
classification system (i.e., ecological systems) to model natural
and semi-natural vegetation [54–56]. The resolution is 30-m and
typically the minimum mapping unit is 1 ha. Regional accuracy
assessments and validations have been conducted and, based on
those, in general, forest and some shrub ecological systems
typically had higher accuracies than rare and small patch
ecological systems, such as wetlands [57,58].
PAD-US (Version 1.0) consists of federal, state, and voluntarily
provided privately protected area boundaries and information
including ownership, management, and protection status [24].
Protection status is assigned to denote the intended level of
biodiversity protection and indicate other natural, recreational,
and cultural uses (Table 1) [24]. In assigning protection status, the
emphasis is on the managing entity rather than the owner and
focuses on long-term management intent instead of short-term
processes [11]. The criteria for assigning protection status includes
perceived permanence of biodiversity protection, amount of area
protected with a 5% allowance of total area for intensive human
use, protection of single vs. multiple features, and the type of
management and degree to which it is mandated [59]. The
protection status ranges from lands managed to maintain bio-
diversity to lands with little or no biodiversity protection (Table 1).
Lands managed for multiple-use, including conservation, are
permanently protected, but allow for extractive uses, such as
mining and logging. In the continental US, lands with no
permanent protection are considered any land parcel not
designated either of the other protection status categories. We
included only lands permanently protected and managed to
Ecological Systems in Protected Areas of US
PLOS ONE | www.plosone.org 3 January 2013 | Volume 8 | Issue 1 | e54689
maintain biodiversity in our definition of the protected areas
network.
We also used elevation data obtained from the National
Elevation Dataset (NED) [60] and soil productivity. The National
Elevation Dataset, a seamless dataset with a resolution of
approximately 30 m, was the best available raster elevation data
for the continental US [60]. We divided the National Elevation
Dataset into 8 classes ranging from 0 to 4500 meters at 500-meter
intervals. Soil productivity classes for the continental US were
based on STATSGO data (http://soils.usda.gov/survey/
geography/statsgo/). These data were reclassified into 8 soil
productivity classes based on land capability classes (http://soils.
usda.gov/technical/handbook) and ranged from very high to very
low productivity.
To apply our analysis and results to current conservation
management in the continental US, we used the LCC framework
[53]. LCCs represent large area conservation-science partnerships
between DOI and other federal agencies, states, tribes, non-
governmental organizations (NGOs), universities, and other public
and private stakeholders. Their intent is to inform resource
management decisions to address landscape-level stressors, such as
land use change, invasive species, and climate change [53].
Data AnalysisThe PAD-US 1.0 [24] and LCC data [53] were converted to
grids (i.e., 30630 m cells) and combined with the National GAP
Land Cover [23] using ArcGIS 9.3.1 (ESRI, Redlands, CA). To
assess the protection of ecological systems relative to their
occurrence, we calculated a frequency distribution of protected
area sizes within the existing protected areas network. To evaluate
how the size range of protected areas would change with the
inclusion of land managed for multiple-use, we calculated
a frequency distribution of the protected areas network with lands
managed for multiple-use added in (Table 1). We also calculated
the amount of area of land managed for multiple-use needed to
meet the 17% Aichi Biodiversity Target. To assess least protected
or most endangered ecosystems, we summarized within each
hierarchical level of the National GAP Land Cover (i.e., Levels I,
II, and ecological systems) the number, size, protection status, and
ownership of land parcels within PAD-US, as well as their
distribution among LCCs. At the broadest level (Level I), we
calculated percent availability versus percent protected to gain
insight into the representation of each system in the protected
areas network. We used a comparison index line (i.e., 1:1 line) to
indicate the relationship between percent availability and percent
protected [61]. Similarly, we calculated the percent area of
ecological systems protected (i.e., managed to maintain bio-
diversity), managed for multiple-use, and not permanently
protected for soil productivity and elevation ranges by combining
these data with PAD-US [24] using ERDAS Imagine 9.3 (Table 1).
The diversity of ecological systems across and redundancy
within LCCs was calculated by counting the number of ecological
systems occurring within each LCC. Diversity was defined as the
number of ecological systems within each LCC, while redundancy
was defined as the number of LCCs in which a single ecological
system occurred [37]. For example, if an ecological system
occurred in 2 LCCs, its redundancy value was 2. Unique
ecological systems were those that occurred in a single LCC.
Furthermore, we calculated the number and percent area
protected of ecological systems by each protection status within
each LCC. To assess whether lands were being protected at the
same rate as those converted to human dominated classes, such as
developed areas, cultivated croplands, orchards, vineyards,
quarries, mines, gravel pits, oil wells, and pastures, we calculated
the conservation risk index (CRI) for each LCC by dividing
percent area converted by percent area managed to maintain
biodiversity or percent area managed to maintain biodiversity and
for multiple-use [23,62]. Finally, we summarized CRI values by
protection status.
Results
The current protected areas network in the continental US
covers approximately 10% of the total area in which ecological
systems occur. Across about 30,000 protected areas, the mean size
of an individual protected area was 1942 ha with a size range of
approximately 25–2,500,000 hectares over all protected areas.
The analysis of representation of the network shows that the
distribution of ecological systems managed to maintain bio-
diversity (i.e., the distribution of the protected areas network) is
skewed towards high elevation and low productivity soils
(Figure 1A). Overall 68% of all 518 ecological systems have
,17% of their area protected, which is a target suggested by the
Aichi Biodiversity Target of the Convention of Biological Diversity
[36] and most of the ecological systems with ,17% protected
occur at low elevation and in areas with moderate to high
productivity soils (Figures 1B and 1C, Table S1).
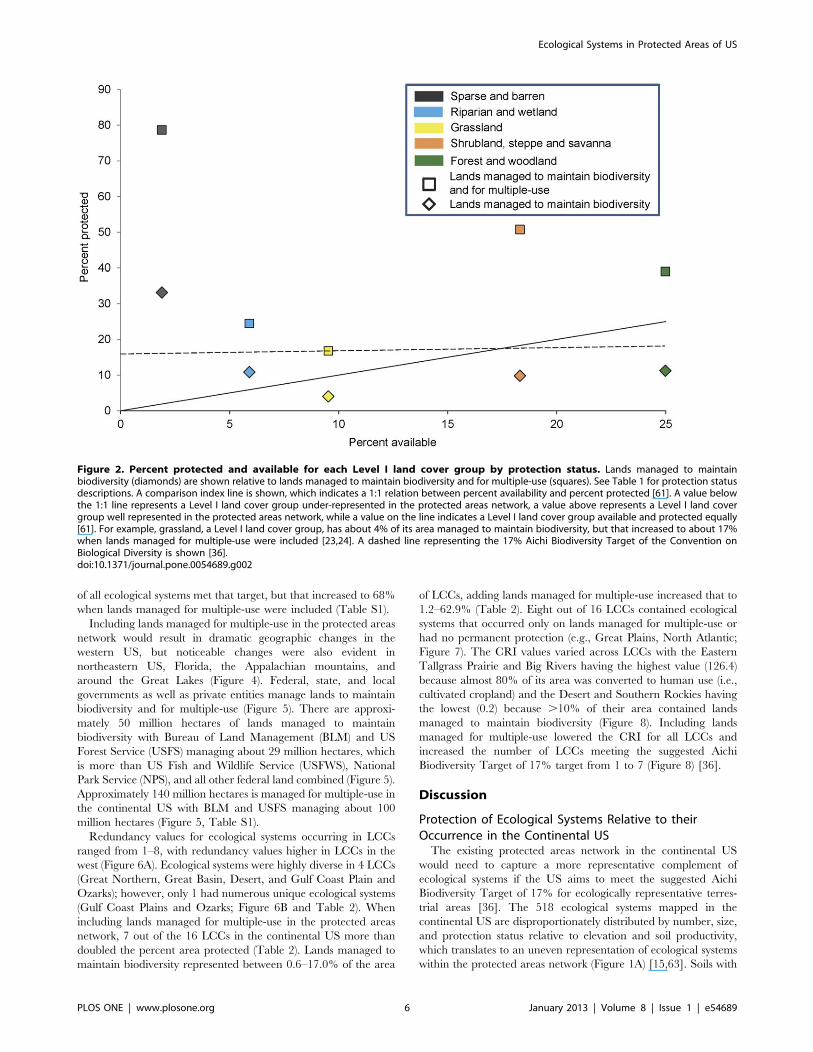
In examining the percent available versus percent protected for
lands managed to maintain biodiversity, only two of the five Level
I land cover groups (sparse and barren; riparian and wetland )
occurred above the 1:1 line indicating a greater percentage of
these groups are protected in relation to their availability (Figure 2).
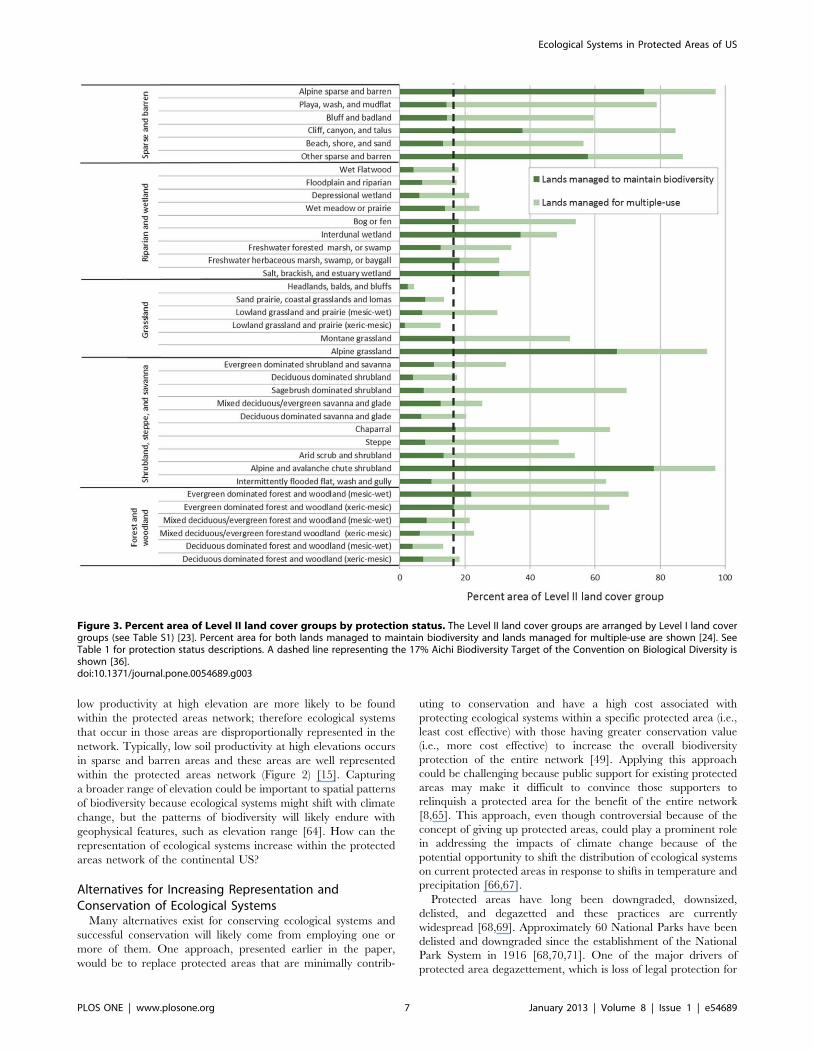
Representation of Level II land cover groups was lowest for
lowland grassland and prairie (xeric-mesic), but most groups had
,17% protected (Figure 3). Out of 37 Level II groups, 11 fell at or
above the 17% Aichi Biodiversity Target [36].
Ecological systems on lands managed for multiple-use and on
lands with no permanent protection comprised 29% and 61%,
respectively, of the total area of the continental US in which
ecological systems occur. When lands managed for multiple-use
were included as part of the protected areas network, the overall
number of protected areas increased to about 88,000 with a size
range of approximately 25–117,757,000 hectares.
When both lands managed to maintain biodiversity and for
multiple-use were included all five Level I land cover groups
occurred above the 1:1 line and all five occurred at or above the
suggested 17% Aichi Biodiversity Target (Figure 2) [36]. The
largest increases were within the shrubland, steppe, and savanna
group, forest and woodland group, and sparse and barren group.
The percent area of Level II land cover groups increased for all 37
groups when lands managed for multiple-use were added to lands
managed to maintain biodiversity (Figure 3). The largest increases
in percent area occurred within the lowland grassland and prairie
(xeric-mesic) and sagebrush dominated shrubland. Out of 37 Level
II groups, 33 fell at or above the 17% Aichi Biodiversity Target
[36] when both lands managed to maintain biodiversity and
multiple-use were included (Figure 3).
To meet the suggested 17% Aichi Biodiversity Target [36],
approximately 9 million hectares (6.4%) of the 140 million
hectares of public and private lands managed for multiple-use or
34 million hectares (11.3%) of the 300 million hectares of lands
with no permanent protection would need to emphasize main-
taining biodiversity or be acquired as part of the protected areas
network (Table S1). Including lands managed for multiple-use
with lands managed to maintain biodiversity, 98% of all ecological
systems increased their percent area protected (Table S1). Using
the suggested 17% Aichi Biodiversity Target [36], we found 32%
Ecological Systems in Protected Areas of US
PLOS ONE | www.plosone.org 4 January 2013 | Volume 8 | Issue 1 | e54689
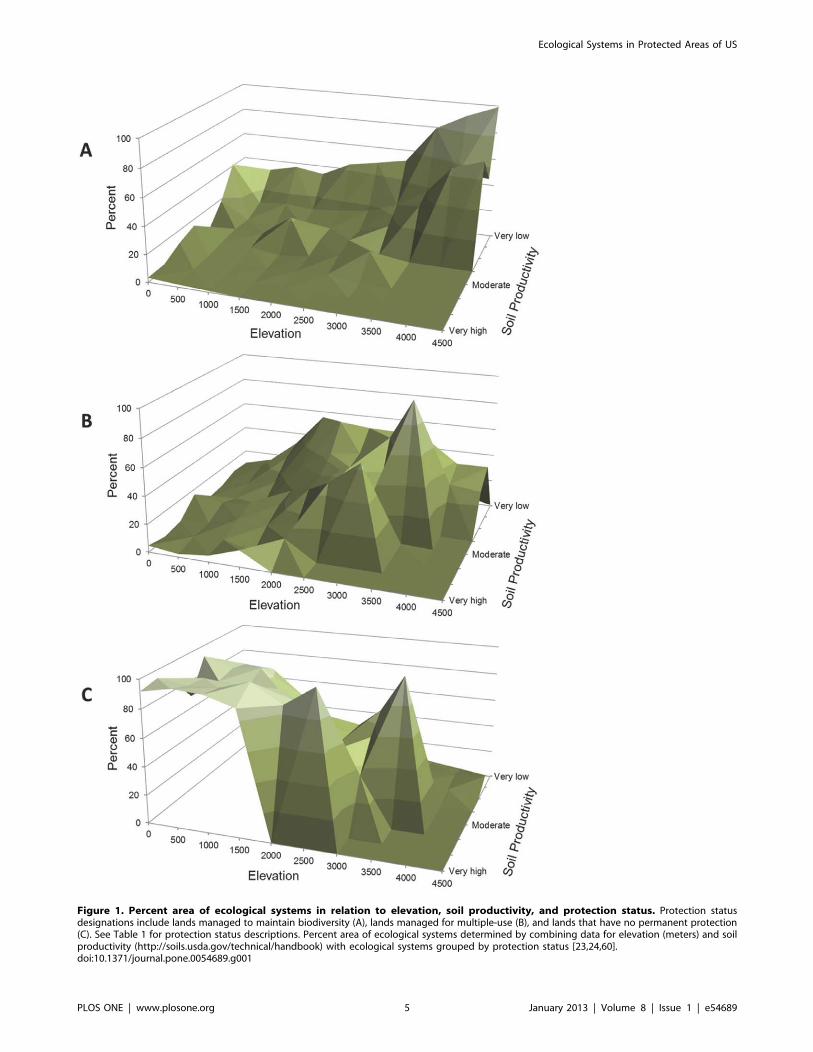
Figure 1. Percent area of ecological systems in relation to elevation, soil productivity, and protection status. Protection statusdesignations include lands managed to maintain biodiversity (A), lands managed for multiple-use (B), and lands that have no permanent protection(C). See Table 1 for protection status descriptions. Percent area of ecological systems determined by combining data for elevation (meters) and soilproductivity (http://soils.usda.gov/technical/handbook) with ecological systems grouped by protection status [23,24,60].doi:10.1371/journal.pone.0054689.g001
Ecological Systems in Protected Areas of US
PLOS ONE | www.plosone.org 5 January 2013 | Volume 8 | Issue 1 | e54689
of all ecological systems met that target, but that increased to 68%
when lands managed for multiple-use were included (Table S1).
Including lands managed for multiple-use in the protected areas
network would result in dramatic geographic changes in the
western US, but noticeable changes were also evident in
northeastern US, Florida, the Appalachian mountains, and
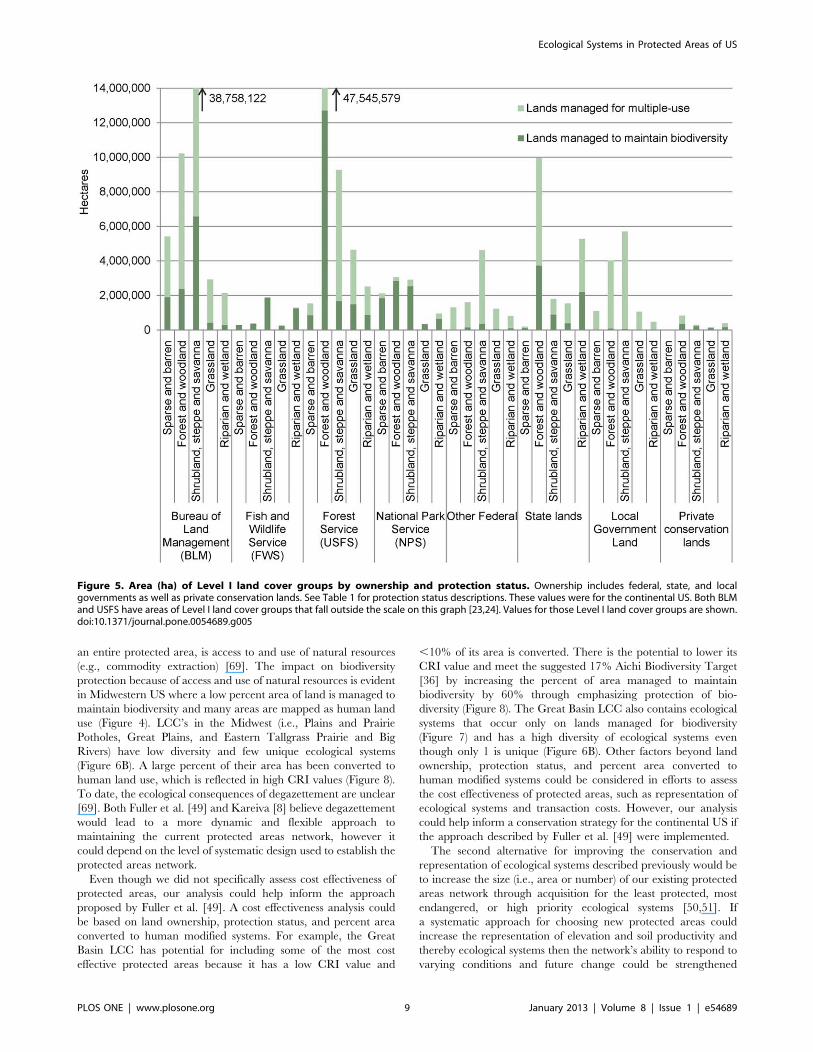
around the Great Lakes (Figure 4). Federal, state, and local
governments as well as private entities manage lands to maintain
biodiversity and for multiple-use (Figure 5). There are approxi-
mately 50 million hectares of lands managed to maintain
biodiversity with Bureau of Land Management (BLM) and US
Forest Service (USFS) managing about 29 million hectares, which
is more than US Fish and Wildlife Service (USFWS), National
Park Service (NPS), and all other federal land combined (Figure 5).
Approximately 140 million hectares is managed for multiple-use in
the continental US with BLM and USFS managing about 100
million hectares (Figure 5, Table S1).
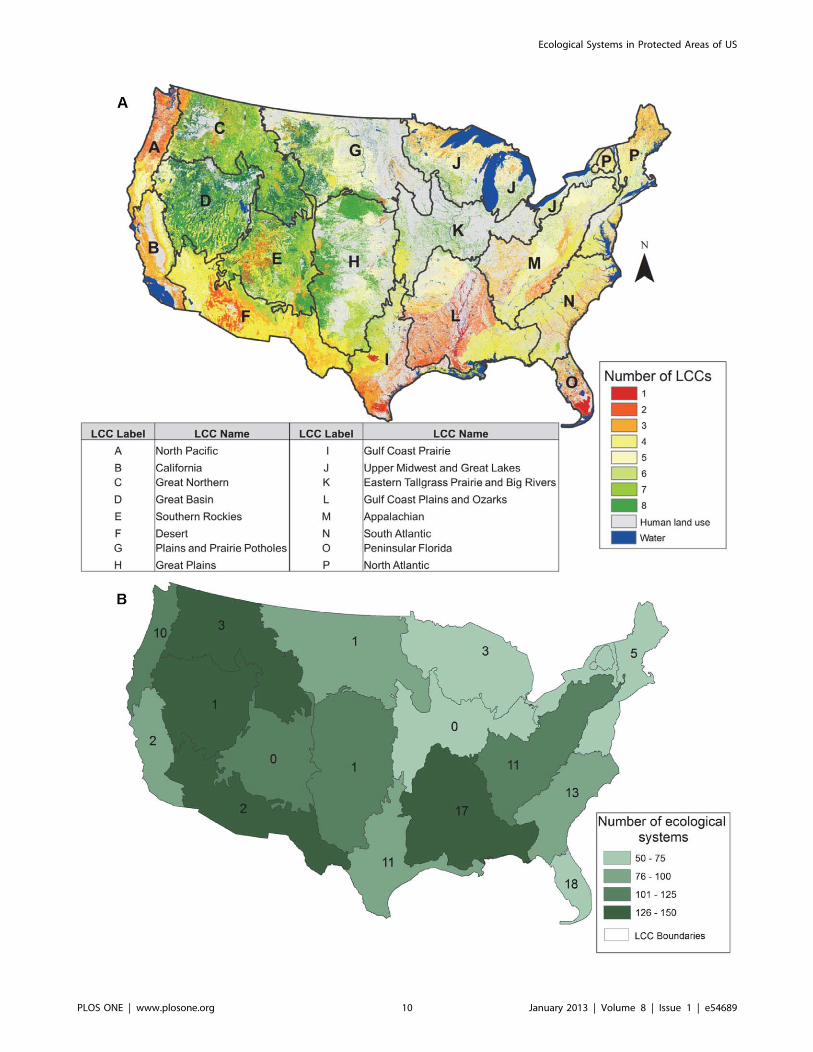
Redundancy values for ecological systems occurring in LCCs
ranged from 1–8, with redundancy values higher in LCCs in the
west (Figure 6A). Ecological systems were highly diverse in 4 LCCs
(Great Northern, Great Basin, Desert, and Gulf Coast Plain and
Ozarks); however, only 1 had numerous unique ecological systems
(Gulf Coast Plains and Ozarks; Figure 6B and Table 2). When
including lands managed for multiple-use in the protected areas
network, 7 out of the 16 LCCs in the continental US more than
doubled the percent area protected (Table 2). Lands managed to
maintain biodiversity represented between 0.6–17.0% of the area
of LCCs, adding lands managed for multiple-use increased that to
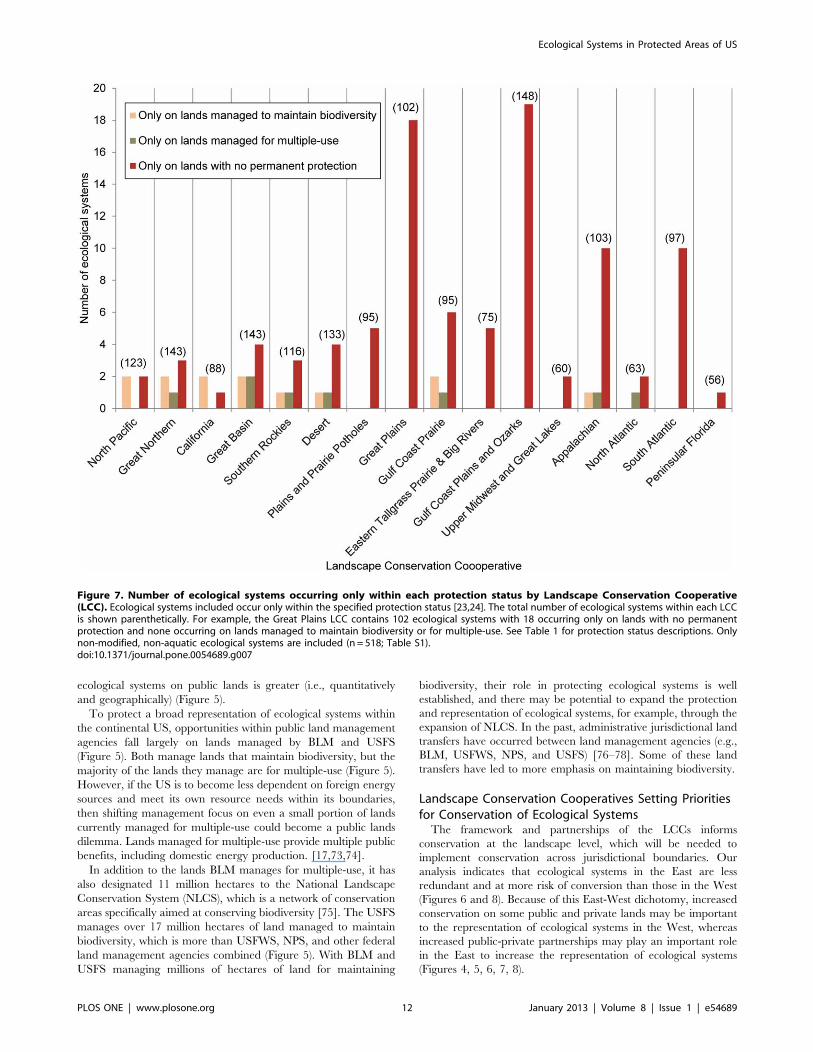
1.2–62.9% (Table 2). Eight out of 16 LCCs contained ecological
systems that occurred only on lands managed for multiple-use or
had no permanent protection (e.g., Great Plains, North Atlantic;
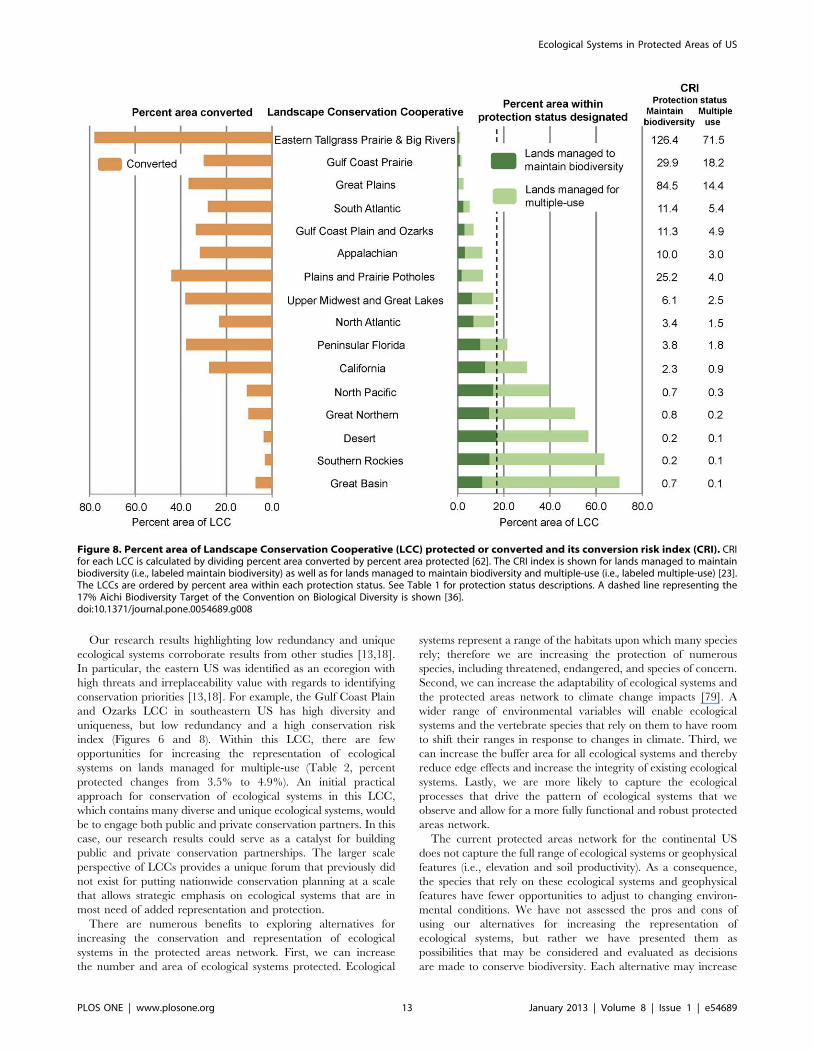
Figure 7). The CRI values varied across LCCs with the Eastern
Tallgrass Prairie and Big Rivers having the highest value (126.4)
because almost 80% of its area was converted to human use (i.e.,
cultivated cropland) and the Desert and Southern Rockies having
the lowest (0.2) because .10% of their area contained lands
managed to maintain biodiversity (Figure 8). Including lands
managed for multiple-use lowered the CRI for all LCCs and
increased the number of LCCs meeting the suggested Aichi
Biodiversity Target of 17% target from 1 to 7 (Figure 8) [36].
Discussion
Protection of Ecological Systems Relative to theirOccurrence in the Continental USThe existing protected areas network in the continental US
would need to capture a more representative complement of
ecological systems if the US aims to meet the suggested Aichi
Biodiversity Target of 17% for ecologically representative terres-
trial areas [36]. The 518 ecological systems mapped in the
continental US are disproportionately distributed by number, size,
and protection status relative to elevation and soil productivity,
which translates to an uneven representation of ecological systems
within the protected areas network (Figure 1A) [15,63]. Soils with
Figure 2. Percent protected and available for each Level I land cover group by protection status. Lands managed to maintainbiodiversity (diamonds) are shown relative to lands managed to maintain biodiversity and for multiple-use (squares). See Table 1 for protection statusdescriptions. A comparison index line is shown, which indicates a 1:1 relation between percent availability and percent protected [61]. A value belowthe 1:1 line represents a Level I land cover group under-represented in the protected areas network, a value above represents a Level I land covergroup well represented in the protected areas network, while a value on the line indicates a Level I land cover group available and protected equally[61]. For example, grassland, a Level I land cover group, has about 4% of its area managed to maintain biodiversity, but that increased to about 17%when lands managed for multiple-use were included [23,24]. A dashed line representing the 17% Aichi Biodiversity Target of the Convention onBiological Diversity is shown [36].doi:10.1371/journal.pone.0054689.g002
Ecological Systems in Protected Areas of US
PLOS ONE | www.plosone.org 6 January 2013 | Volume 8 | Issue 1 | e54689
low productivity at high elevation are more likely to be found
within the protected areas network; therefore ecological systems
that occur in those areas are disproportionally represented in the
network. Typically, low soil productivity at high elevations occurs
in sparse and barren areas and these areas are well represented
within the protected areas network (Figure 2) [15]. Capturing
a broader range of elevation could be important to spatial patterns
of biodiversity because ecological systems might shift with climate
change, but the patterns of biodiversity will likely endure with
geophysical features, such as elevation range [64]. How can the
representation of ecological systems increase within the protected
areas network of the continental US?
Alternatives for Increasing Representation andConservation of Ecological SystemsMany alternatives exist for conserving ecological systems and
successful conservation will likely come from employing one or
more of them. One approach, presented earlier in the paper,
would be to replace protected areas that are minimally contrib-
uting to conservation and have a high cost associated with
protecting ecological systems within a specific protected area (i.e.,
least cost effective) with those having greater conservation value
(i.e., more cost effective) to increase the overall biodiversity
protection of the entire network [49]. Applying this approach
could be challenging because public support for existing protected
areas may make it difficult to convince those supporters to
relinquish a protected area for the benefit of the entire network
[8,65]. This approach, even though controversial because of the
concept of giving up protected areas, could play a prominent role
in addressing the impacts of climate change because of the
potential opportunity to shift the distribution of ecological systems
on current protected areas in response to shifts in temperature and
precipitation [66,67].
Protected areas have long been downgraded, downsized,
delisted, and degazetted and these practices are currently
widespread [68,69]. Approximately 60 National Parks have been
delisted and downgraded since the establishment of the National
Park System in 1916 [68,70,71]. One of the major drivers of
protected area degazettement, which is loss of legal protection for
Figure 3. Percent area of Level II land cover groups by protection status. The Level II land cover groups are arranged by Level I land covergroups (see Table S1) [23]. Percent area for both lands managed to maintain biodiversity and lands managed for multiple-use are shown [24]. SeeTable 1 for protection status descriptions. A dashed line representing the 17% Aichi Biodiversity Target of the Convention on Biological Diversity isshown [36].doi:10.1371/journal.pone.0054689.g003
Ecological Systems in Protected Areas of US
PLOS ONE | www.plosone.org 7 January 2013 | Volume 8 | Issue 1 | e54689
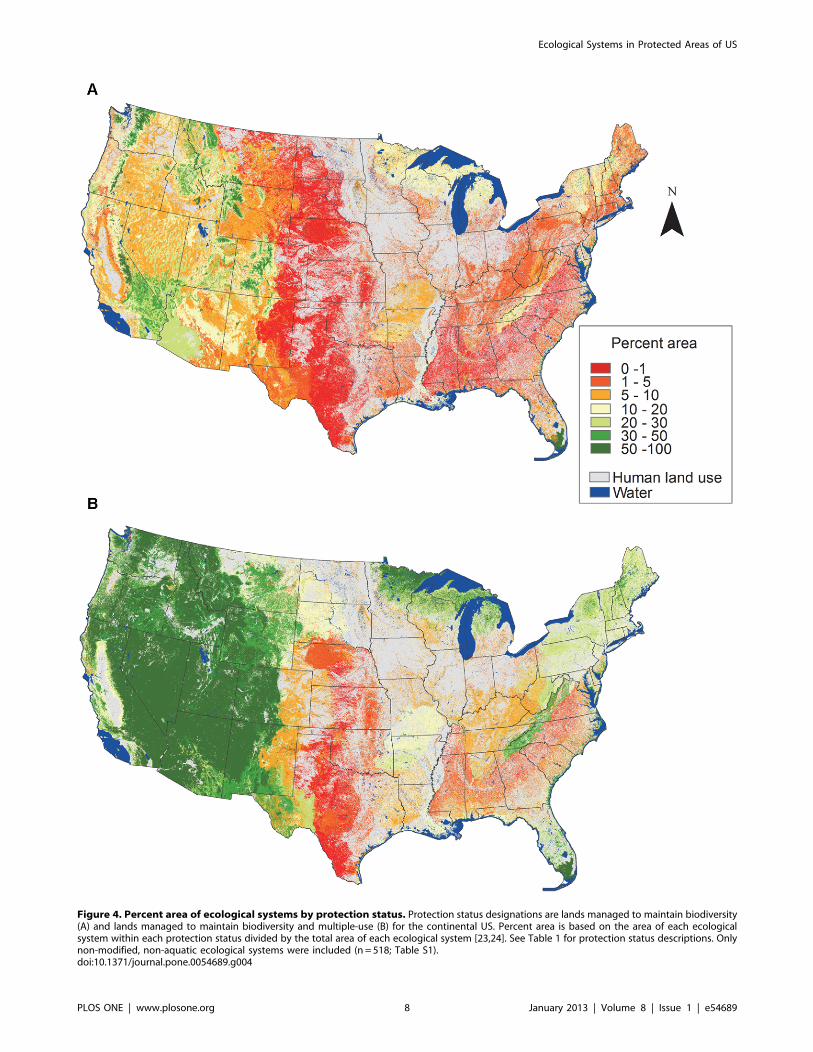
Figure 4. Percent area of ecological systems by protection status. Protection status designations are lands managed to maintain biodiversity(A) and lands managed to maintain biodiversity and multiple-use (B) for the continental US. Percent area is based on the area of each ecologicalsystem within each protection status divided by the total area of each ecological system [23,24]. See Table 1 for protection status descriptions. Onlynon-modified, non-aquatic ecological systems were included (n = 518; Table S1).doi:10.1371/journal.pone.0054689.g004
Ecological Systems in Protected Areas of US
PLOS ONE | www.plosone.org 8 January 2013 | Volume 8 | Issue 1 | e54689
an entire protected area, is access to and use of natural resources
(e.g., commodity extraction) [69]. The impact on biodiversity
protection because of access and use of natural resources is evident
in Midwestern US where a low percent area of land is managed to
maintain biodiversity and many areas are mapped as human land
use (Figure 4). LCC’s in the Midwest (i.e., Plains and Prairie
Potholes, Great Plains, and Eastern Tallgrass Prairie and Big
Rivers) have low diversity and few unique ecological systems
(Figure 6B). A large percent of their area has been converted to
human land use, which is reflected in high CRI values (Figure 8).
To date, the ecological consequences of degazettement are unclear
[69]. Both Fuller et al. [49] and Kareiva [8] believe degazettement
would lead to a more dynamic and flexible approach to
maintaining the current protected areas network, however it
could depend on the level of systematic design used to establish the
protected areas network.
Even though we did not specifically assess cost effectiveness of
protected areas, our analysis could help inform the approach
proposed by Fuller et al. [49]. A cost effectiveness analysis could
be based on land ownership, protection status, and percent area
converted to human modified systems. For example, the Great
Basin LCC has potential for including some of the most cost
effective protected areas because it has a low CRI value and
,10% of its area is converted. There is the potential to lower its
CRI value and meet the suggested 17% Aichi Biodiversity Target
[36] by increasing the percent of area managed to maintain
biodiversity by 60% through emphasizing protection of bio-
diversity (Figure 8). The Great Basin LCC also contains ecological
systems that occur only on lands managed for biodiversity
(Figure 7) and has a high diversity of ecological systems even
though only 1 is unique (Figure 6B). Other factors beyond land
ownership, protection status, and percent area converted to
human modified systems could be considered in efforts to assess
the cost effectiveness of protected areas, such as representation of
ecological systems and transaction costs. However, our analysis
could help inform a conservation strategy for the continental US if
the approach described by Fuller et al. [49] were implemented.
The second alternative for improving the conservation and
representation of ecological systems described previously would be
to increase the size (i.e., area or number) of our existing protected
areas network through acquisition for the least protected, most
endangered, or high priority ecological systems [50,51]. If
a systematic approach for choosing new protected areas could
increase the representation of elevation and soil productivity and
thereby ecological systems then the network’s ability to respond to
varying conditions and future change could be strengthened
Figure 5. Area (ha) of Level I land cover groups by ownership and protection status. Ownership includes federal, state, and localgovernments as well as private conservation lands. See Table 1 for protection status descriptions. These values were for the continental US. Both BLMand USFS have areas of Level I land cover groups that fall outside the scale on this graph [23,24]. Values for those Level I land cover groups are shown.doi:10.1371/journal.pone.0054689.g005
Ecological Systems in Protected Areas of US
PLOS ONE | www.plosone.org 9 January 2013 | Volume 8 | Issue 1 | e54689
Ecological Systems in Protected Areas of US
PLOS ONE | www.plosone.org 10 January 2013 | Volume 8 | Issue 1 | e54689
(Figure 1) [15,63]. Our results were similar to Scott et al. [15]
because we found that ecological systems at lower elevations and
higher soil productivity were under-represented within the current
protected areas network (Figure 1). These areas could be
prioritized if acquisition of new protected areas was employed
for increasing protection of ecological systems. The least protected
ecological systems and potentially most endangered (see Figure 8)
are within all the Level I land cover groups except sparse and
barren (Figures 2, 3, and 5, Table S1) and are located mostly in the
Midwestern US (Figure 4). Prioritizing acquisition of the Level I
land cover groups within the Midwestern US would increase the
overall representation of ecological systems in the continental US.
However, the feasibility of land acquisition for conservation is
continually a challenge as resources for obtaining new protected
areas are dwindling and competition for undeveloped private land
is limiting expansion opportunities [4,14]. Furthermore, the
support of policy makers for creating new protected areas could
be perceived as ephemeral [72]. The idea of increasing the
amount of protected land is attractive in part because of the
perceived permanence associated with that protection. In other
words, expanding the protected areas network reduces the risk of
more land being converted to a state from which it might not
recover (i.e., urban development), even though the immediate
benefit to conservation is dependent upon management strategies
employed.
A third alternative for improving the current protected areas
network might be to take stock of our management within the
current protected areas network and to evaluate the potential role
of lands managed for multiple-use in conserving ecological
systems. Our analysis found that increasing the emphasis on
maintaining biodiversity on lands currently managed for multiple-
use, which are permanently protected, but allow for extractive uses
(e.g., mining and logging), offers an alternative for increasing the
representation of ecological systems. However, much of the land
managed for multiple-use has undergone ecosystem alteration and
increased management or restoration may be needed to recover
existing ecological systems [52]. If we increased the emphasis on
maintaining biodiversity on some public and private lands
managed for multiple-use, the total percent area of ecological
systems protected could increase up to 39% in the continental US
(lands managed to maintain biodiversity: 10%; lands managed for
multiple-use: 29%). Geographically, the greatest potential for
increased emphasis on maintaining biodiversity on lands managed
for multiple-use is in the West, but also in the Northeast, South,
and Midwest (Figure 4). To meet the suggested Aichi Biodiversity
Target of 17% [36] increased emphasis on maintaining bio-
diversity would need to occur on 6.4% of the lands managed for
multiple-use (Table S1). Even though lands managed for multiple-
use occur on both public (i.e., federal, state, and local government)
and private (i.e., non-governmental organization) lands, the
potential for conservation efforts to increase the protection of
Figure 6. Redundancy, diversity, and uniqueness of ecological systems within Landscape Conservation Cooperatives (LCC).Redundancy measures the number of LCC’s in which a single ecological system occurs (A) [23]. The higher the number of LCC’s in which an ecologicalsystems occurs the more redundancy displayed by that ecological system. For example, if an ecological system occurs in 2 LCCs, it has a redundancyvalue of 2. Diversity is the total number of ecological systems occurring with an LCC, which is shown by color shading of LCCs (B). Uniqueness is thenumber of ecological systems that occur in a single LCC, which is indicated by the number within each LCC (B). For example, the Great Northern LCCencompasses 126–150 ecological systems total, most of these occur in a total of 7 or 8 LCCs, but 3 are unique and only found in this LCC. Only non-modified, non-aquatic ecological systems were included (n = 518; Table S1). Each LCC is assigned a letter, which indicates the name of the LCC.doi:10.1371/journal.pone.0054689.g006
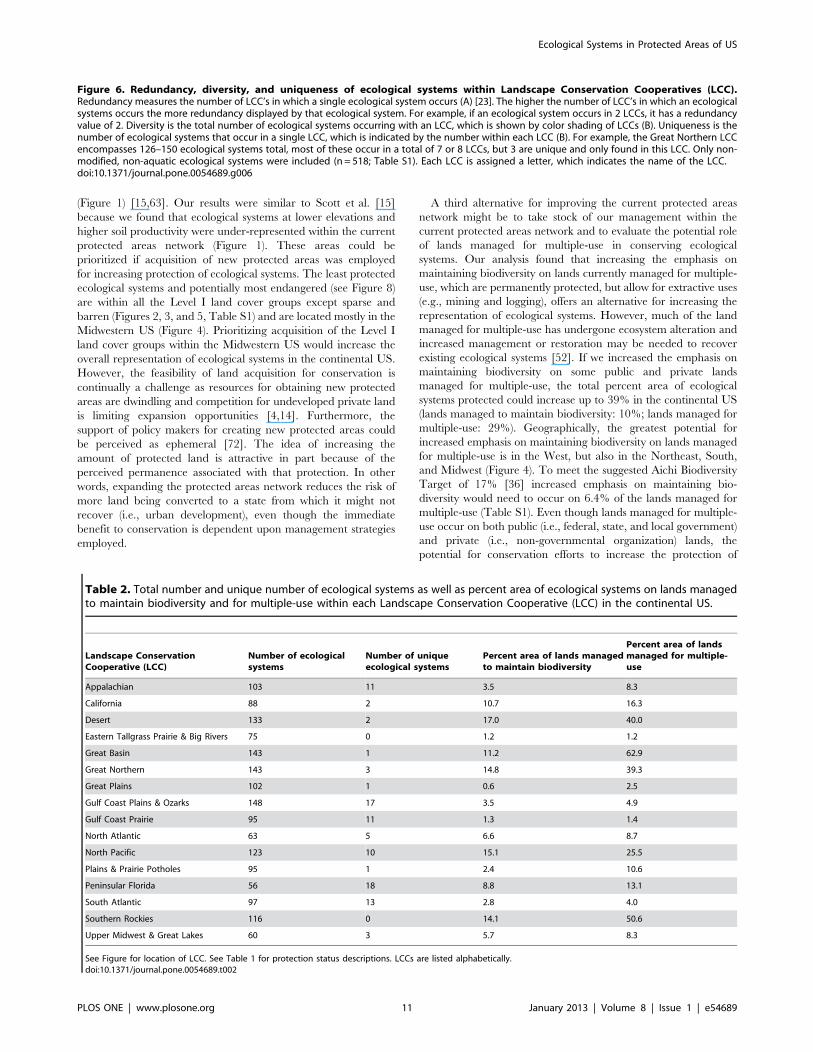
Table 2. Total number and unique number of ecological systems as well as percent area of ecological systems on lands managedto maintain biodiversity and for multiple-use within each Landscape Conservation Cooperative (LCC) in the continental US.
Landscape ConservationCooperative (LCC)
Number of ecologicalsystems
Number of uniqueecological systems
Percent area of lands managedto maintain biodiversity
Percent area of landsmanaged for multiple-use
Appalachian 103 11 3.5 8.3
California 88 2 10.7 16.3
Desert 133 2 17.0 40.0
Eastern Tallgrass Prairie & Big Rivers 75 0 1.2 1.2
Great Basin 143 1 11.2 62.9
Great Northern 143 3 14.8 39.3
Great Plains 102 1 0.6 2.5
Gulf Coast Plains & Ozarks 148 17 3.5 4.9
Gulf Coast Prairie 95 11 1.3 1.4
North Atlantic 63 5 6.6 8.7
North Pacific 123 10 15.1 25.5
Plains & Prairie Potholes 95 1 2.4 10.6
Peninsular Florida 56 18 8.8 13.1
South Atlantic 97 13 2.8 4.0
Southern Rockies 116 0 14.1 50.6
Upper Midwest & Great Lakes 60 3 5.7 8.3
See Figure for location of LCC. See Table 1 for protection status descriptions. LCCs are listed alphabetically.doi:10.1371/journal.pone.0054689.t002
Ecological Systems in Protected Areas of US
PLOS ONE | www.plosone.org 11 January 2013 | Volume 8 | Issue 1 | e54689
ecological systems on public lands is greater (i.e., quantitatively
and geographically) (Figure 5).
To protect a broad representation of ecological systems within
the continental US, opportunities within public land management
agencies fall largely on lands managed by BLM and USFS
(Figure 5). Both manage lands that maintain biodiversity, but the
majority of the lands they manage are for multiple-use (Figure 5).
However, if the US is to become less dependent on foreign energy
sources and meet its own resource needs within its boundaries,
then shifting management focus on even a small portion of lands
currently managed for multiple-use could become a public lands
dilemma. Lands managed for multiple-use provide multiple public
benefits, including domestic energy production. [17,73,74].
In addition to the lands BLM manages for multiple-use, it has
also designated 11 million hectares to the National Landscape
Conservation System (NLCS), which is a network of conservation
areas specifically aimed at conserving biodiversity [75]. The USFS
manages over 17 million hectares of land managed to maintain
biodiversity, which is more than USFWS, NPS, and other federal
land management agencies combined (Figure 5). With BLM and
USFS managing millions of hectares of land for maintaining
biodiversity, their role in protecting ecological systems is well
established, and there may be potential to expand the protection
and representation of ecological systems, for example, through the
expansion of NLCS. In the past, administrative jurisdictional land
transfers have occurred between land management agencies (e.g.,
BLM, USFWS, NPS, and USFS) [76–78]. Some of these land
transfers have led to more emphasis on maintaining biodiversity.
Landscape Conservation Cooperatives Setting Prioritiesfor Conservation of Ecological SystemsThe framework and partnerships of the LCCs informs
conservation at the landscape level, which will be needed to
implement conservation across jurisdictional boundaries. Our
analysis indicates that ecological systems in the East are less
redundant and at more risk of conversion than those in the West
(Figures 6 and 8). Because of this East-West dichotomy, increased
conservation on some public and private lands may be important
to the representation of ecological systems in the West, whereas
increased public-private partnerships may play an important role
in the East to increase the representation of ecological systems
(Figures 4, 5, 6, 7, 8).
Figure 7. Number of ecological systems occurring only within each protection status by Landscape Conservation Cooperative(LCC). Ecological systems included occur only within the specified protection status [23,24]. The total number of ecological systems within each LCCis shown parenthetically. For example, the Great Plains LCC contains 102 ecological systems with 18 occurring only on lands with no permanentprotection and none occurring on lands managed to maintain biodiversity or for multiple-use. See Table 1 for protection status descriptions. Onlynon-modified, non-aquatic ecological systems are included (n = 518; Table S1).doi:10.1371/journal.pone.0054689.g007
Ecological Systems in Protected Areas of US
PLOS ONE | www.plosone.org 12 January 2013 | Volume 8 | Issue 1 | e54689
Our research results highlighting low redundancy and unique
ecological systems corroborate results from other studies [13,18].
In particular, the eastern US was identified as an ecoregion with
high threats and irreplaceability value with regards to identifying
conservation priorities [13,18]. For example, the Gulf Coast Plain
and Ozarks LCC in southeastern US has high diversity and
uniqueness, but low redundancy and a high conservation risk
index (Figures 6 and 8). Within this LCC, there are few
opportunities for increasing the representation of ecological
systems on lands managed for multiple-use (Table 2, percent
protected changes from 3.5% to 4.9%). An initial practical
approach for conservation of ecological systems in this LCC,
which contains many diverse and unique ecological systems, would
be to engage both public and private conservation partners. In this
case, our research results could serve as a catalyst for building
public and private conservation partnerships. The larger scale
perspective of LCCs provides a unique forum that previously did
not exist for putting nationwide conservation planning at a scale
that allows strategic emphasis on ecological systems that are in
most need of added representation and protection.
There are numerous benefits to exploring alternatives for
increasing the conservation and representation of ecological
systems in the protected areas network. First, we can increase
the number and area of ecological systems protected. Ecological
systems represent a range of the habitats upon which many species
rely; therefore we are increasing the protection of numerous
species, including threatened, endangered, and species of concern.
Second, we can increase the adaptability of ecological systems and
the protected areas network to climate change impacts [79]. A
wider range of environmental variables will enable ecological
systems and the vertebrate species that rely on them to have room
to shift their ranges in response to changes in climate. Third, we
can increase the buffer area for all ecological systems and thereby
reduce edge effects and increase the integrity of existing ecological
systems. Lastly, we are more likely to capture the ecological
processes that drive the pattern of ecological systems that we
observe and allow for a more fully functional and robust protected
areas network.
The current protected areas network for the continental US
does not capture the full range of ecological systems or geophysical
features (i.e., elevation and soil productivity). As a consequence,
the species that rely on these ecological systems and geophysical
features have fewer opportunities to adjust to changing environ-
mental conditions. We have not assessed the pros and cons of
using our alternatives for increasing the representation of
ecological systems, but rather we have presented them as
possibilities that may be considered and evaluated as decisions
are made to conserve biodiversity. Each alternative may increase
Figure 8. Percent area of Landscape Conservation Cooperative (LCC) protected or converted and its conversion risk index (CRI). CRIfor each LCC is calculated by dividing percent area converted by percent area protected [62]. The CRI index is shown for lands managed to maintainbiodiversity (i.e., labeled maintain biodiversity) as well as for lands managed to maintain biodiversity and multiple-use (i.e., labeled multiple-use) [23].The LCCs are ordered by percent area within each protection status. See Table 1 for protection status descriptions. A dashed line representing the17% Aichi Biodiversity Target of the Convention on Biological Diversity is shown [36].doi:10.1371/journal.pone.0054689.g008
Ecological Systems in Protected Areas of US
PLOS ONE | www.plosone.org 13 January 2013 | Volume 8 | Issue 1 | e54689
the representation of ecological systems, which can lead to
protecting and securing habitat across a broader range of
ecological, geographical, and geophysical occurrence of species.
And may provide the greatest opportunity for evolutionary
processes to persist regardless of imminent changes in the near,
intermediate, and long term.
Supporting Information
Table S1 Area (ha) and percent area of ecologicalsystems by protection status nested into Level I and IIland cover groups [23,24]. All 5 Level I groups, 37 Level II
groups, and 518 ecological systems are listed. See Table 1 for
protection status descriptions. Only non-modified, non-aquatic
ecological systems are included (n= 518).
(XLSX)
Acknowledgments
We thank C. Conway, D. Weinstein, R. White, and 2 anonymous
reviewers for their comments that improved this manuscript. We also thank
M. Croft, L. Duarte, J. Lonneker, K. Mallory, A. Radel, and G. Wilson for
their help. Any use of trade, product, or firm names is for descriptive
purposes only and does not imply endorsement by the US Government.
Author Contributions
Conceived and designed the experiments: JMS LS JA AD KG. Analyzed
the data: AD JA. Wrote the paper: JLA LS AM AD JS KG.
References
1. Miller KR (1982) Parks and protected areas: considerations for the future.
Ambio 11: 315–317.
2. Pressey RL (1994) Ad hoc reservations: forward and backward steps in
developing representative reserve systems? Conserv Biol 8: 662–668.
3. Margules CR, Pressey RL (2000) Systematic conservation planning. Nature 405:
243–253.
4. Fairfax SK, Gwin L, King MA, Raymond L, Watt LA (2005) Buying nature:
The limits of land acquisition as a conservation strategy, 1780–2004.
Cambridge: The MIT Press. 357 p.
5. Pressey RL, Humphries CJ, Margules CR, Vane-Wright RI, Williams PH (1993)
Beyond opportunism: key principles for systematic reserve selection. Trends Ecol
Evol 8: 124–128.
6. Ando A, Camm J, Polasky S, Solow A (1998) Species distributions, land values,
and efficient conservation. Science 279: 2126–2128.
7. van Jaarsveld AS, Freitag S, Chown SL, Muller C, Koch S, et al. (1998)
Biodiversity assessment and conservation strategies. Science 279: 2106–2108.
8. Kareiva P (2010) Trade-in to trade-up. Nature 466: 322–323.
9. Harrison J, Miller K, McNeely J (1982) The world coverage of protected areas:
development goals and environmental needs. Ambio 11: 238–245.
10. Ehrlich PR, Wilson EO (1991) Biodiversity studies: science and policy. Science
253: 758–762.
11. Scott JM, Davis F, Csuti B, Noss R, Butterfield B, et al. (1993) Gap analysis:
a geographic approach to protection of biological diversity. Wildlife Monographs
123: 1–41.
12. Chape S, Blyth S, Fish L, Fox P, Spalding M (2003) 2003 United Nations list of
protected areas. Available: http://www.unep.org/pdf/un-list-protected-areas.
pdf. Access 29 February 2012.
13. Rodrigues ASL, Akcakaya HR, Andelman SJ, Bakarr MI, Boitani L, et al. (2004)
Global gap analysis: priority regions for expanding the global protected-area
network. Bioscience 54: 1092–1100.
14. McDonald RI (2009) The promise and pitfalls of systematic conservation
planning. Proc Natl Acad Sci U S A 106: 15101–15102.
15. Scott JM, Davis FW, McGhee RG, Wright RG, Groves C, et al. (2001) Nature
preserves: do they capture the full range of America’s biological diversity? Ecol
Appl 11: 999–1007.
16. Baron JS, Griffith B, Joyce LA, Kareiva P, Keller BD, et al. (2008) Preliminary
review of adaptation options for climate-sensitive ecosystems and resources.
Available: http://library.globalchange.gov/products/assessments/sap-4-4-
preliminary-review-of-adaptation-options-for-climate-sensitive-ecosystems-and-
resources. Accessed 29 February 2012.
17. Glicksman RL (2008) Ecosystem resilience to disruptions linked to global climate
change: An adaptive approach to federal land management. Neb Law Rev 87:
833–892.
18. Brooks TM, Bakarr MI, Boucher T, Da Fonseca GAB, Hilton-Taylor C, et al.
(2004) Coverage provided by the global protected-area system: is it enough?
Bioscience 54: 1081–1091.
19. Estes JE, Mooneyhan DW (1994) Of maps and myths. Photogramm Eng
Remote Sensing 60: 517–524.
20. Dietz RW, Czech B (2005) Conservation deficits for the continental United
States: an ecosystem gap analysis. Conserv Biol 19: 1478–1487.
21. Noss RF, Cooperrider AY (1994) Saving Nature’s legacy. Washington DC:
Island Press. 416 p.
22. The President’s Council of Advisors on Science and Technology (PCAST) (2011)
Sustaining environmental capital: protecting society and the economy. Avail-
able: http://www.whitehouse.gov/administration/eop/ostp/pcast/docsreports.
Accessed 2011 July 29.
23. US Geological Survey, Gap Analysis Program (USGS-GAP) (2010) National
GAP Land Cover, Version 1. Available: http://gapanalysis.usgs.gov. Accessed
29 July 2011.
24. US Geological Survey, Gap Analysis Program (USGS-GAP) (2010) Protected
Areas Database of the United States, Version 1.0. Available: http://gapanalysis.
usgs.gov. Accessed 2011 July 29.
25. Comer P, Faber-Langendoen D, Evans R, Gawler S, Josse C, et al. (2003)
Ecological systems of the United States: a working classification of US terrestrial
systems. Available: http://www.natureserve.org/library/usEcologicalsystems.
pdf. Accessed 29 July 2011.
26. Redford KH, Richter BD (1999) Conservation of biodiversity in a world of use.
Conserv Biol 13: 1246–1256.
27. Sanderson EW, Jaiteh M, Levy MA, Redford KH, Wannebo AV, et al. (2002)
The human footprint and the last of the wild. Bioscience 52: 891–904.
28. Hobbs RJ, Arico S, Aronson J, Baron JS, Bridgewater P, et al. (2006) Novel
ecosystems: theoretical and management aspects of the new ecological world
order. Global Ecol Biogeogr 15: 1–7.
29. Sodhi NS, Butler R, Laurance WF, Gibson L (2011) Conservation successes at
micro-, meso-, and macroscales. Trends Ecol Evol 26: 585–594.
30. Noss RF, LaRoe III ET, Scott JM (1995) Endangered ecosystems of the United
States: A preliminary assessment of loss and degradation. Available: http://
biology.usgs.gov/pubs/ecosys.htm. Accessed 2010 July 22.
31. Bunce RGH, Bogers MMB, Evans D, Halada L, Jongman RHG, et al. (2012).
The significance of habitats as indicators of biodiversity and their links to species.
Ecol Indic http://dx.doi.org/10.1016/j.ecolind.2012.07.014. Accessed 2012
August 31.
32. Dudley N (2008) Guidelines for applying protected area management categories.
Available: http://data.iucn.org/dbtw-wpd/edocs/paps-016.pdf. Accessed 2012
February 29.
33. Noss RF (1990) Indicators for monitoring biodiversity: a hierarchical approach.
Conserv Biol 4: 355–364.
34. Tear TH, Kareiva P, Angermeier PL, Comer P, Czech B, et al. (2005) How
much is enough? The recurrent problem of setting measurable objectives in
conservation. Bioscience 55: 835–849.
35. Svancara LK, Brannon R, Scott JM, Groves CR, Noss RF, et al. (2005) Policy-
driven versus evidence-based conservation: a review of political targets and
biological needs. Bioscience 55: 989–995.
36. Convention on Biological Diversity Strategic Plan for Biodiversity 2011–><2020
including Aichi Biodiversity Targets. Available:.Accessed 2012 February 29.
37. Shaffer ML, Stein BA (2000) Safeguarding our precious heritage. In: Stein BA,
Kutner LS, Adams JS, editors. Precious heritage: the status of biodiversity in the
United States. New York: Oxford University Press. 301–321.
38. Groves CR (2003) Drafting a conservation blueprint: a practioner’s guide to
planning for biodiversity. Washington DC: Island Press. 458 p.
39. Scott D, Malcolm JR, Lemieux C (2002) Climate change and modelled biome
representation in Canada’s national park system: implications for system
planning and park mandates. Global Ecol Biogeogr 11: 475–484.
40. Lemieux CJ, Scott DJ (2005) Climate change, biodiversity conservation and
protected area planning in Canada. Can Geogr 49: 384–399.
41. Lemieux CJ, Beechey TJ, Gray PA (2011) Prospects for Canada’s protected
areas in an era of rapid climate change. Land use policy Available: doi:10.1016/
j.landusepol.2011.03.008. Accessed 2011 April 29.
42. Shelford VE (1926) Naturalist’s guide to the Americas. Baltimore: The Williams
and Wilkins Company. 761 p.
43. Crumpacker DW, Hodge SW, Friedley D, Gregg WP (1988) A preliminary
assessment of the status of major terrestrial and wetland ecosystems on Federal
and Indian lands in the United States. Conserv Biol 2: 103–115.
44. Caicco SL, Scott JM, Butterfield B, Csuti B (1995) A gap analysis of the
management status of the vegetation of Idaho (USA). Conserv Biol 9: 498–511.
45. Davis FW, Stine PA, Stoms DM, Borchert MI, Hollander AD (1995) Gap
analysis of the actual vegetation of California 1. The Southwestern Region.
Madrono 42: 40–78.
Ecological Systems in Protected Areas of US
PLOS ONE | www.plosone.org 14 January 2013 | Volume 8 | Issue 1 | e54689
46. Stoms DM, Davis FW, Driese KL, Cassidy KM, Murray MP (1998) Gap
analysis of the vegetation of the intermountain semi-desert ecoregion. GreatBasin Nat 58:199–216.
47. Scott JM, Murray M, Wright RG, Csuti B, Morgan P, et al. (2001)
Representation of natural vegetation in protected areas: capturing thegeographic range. Biodivers Conserv 10: 1297–1301.
48. Wright RG, Scott JM, Mann S, Murray M (2001) Identifying unprotected andpotentially at risk plant communities in the western USA. Biol Conserv 98: 97–
106.
49. Fuller RA, McDonald-Madden E, Wilson KA, Carwardine J, Grantham HS, etal. (2010) Replacing underperforming protected areas achieves better conser-
vation outcomes. Nature 466: 365–367.50. Langhammer PF, Bakarr MI, Bennun LA, Brooks TM, Clay RP, et al. (2007)
Identification and gap analysis of key biodiversity areas: targets for comprehen-sive protected area systems. Available: data.iucn.org/dbtw-wpd/edocs/pag-
015.pdf. Accessed 2012 February 29.
51. Kark S, Levin N, Grantham HS, Possingham HP (2009) Between-countrycollaboration and consideration of costs increase conservation planning
efficiency in the Mediterranean Basin. Proc Natl Acad Sci U S A 106: 15368–15373.
52. Swaty R, Blankenship K, Hagen S, Fargione J, Smith J, et al. (2011) Accounting
for ecosystem alteration doubles estimates of conservation risk in theconterminous United States. PLoS ONE 6: 1–10. DOI: 10.1371/journal.-
pone.0023002.53. Millard MJ, Czarnecki CA, Morton JM, Brandt LA, Shipley FS, et al. (2012) A
national geographic framework for guiding conservation on a landscape scale.Journal of Fish and Wildlife Management 3: 175–183.
54. Lowry Jr JH, Ramsey RD, Boykin K, Bradford D, Comer P, et al. (2007) Land
cover classification and mapping. In: Prior-Magee JS, et al., editors. SouthwestRegional Gap Analysis Final Report. Available: http://fws-nmcfwru.nmsu.edu/
swregap/report/swregap%20final%20report.pdf. Accessed 2011 November 16.55. Zhu Z, Vogelmann J, Ohlen D, Kost J, Chen X, et al. (2006) Mapping existing
vegetation composition and structure for the LANDFIRE Prototype Project. In:
Rollins MG, Frame CK, editors. The LANDFIRE prototype project: nationallyconsistent and locally relevant geospatial data for wildland fire management
Available: http://www.treesearch.fs.fed.us/pubs/24700. Accessed 2011 January18.
56. Rollins MG (2009) LANDFIRE: a nationally consistent vegetation, wildland fire,and fuel assessment. International Journal of Wildland Fire 18: 235–249.
57. Sanborn (2006) GAP zone 1 vegetation mapping final report. Available: http://
gap.uidaho.edu. Accessed 2011 July 29.58. Lowry J, Ramsey RD, Thomas K, Schrupp D, Sajwaj T, et al. (2007) Mapping
moderate-scale land-cover over very large geographic areas within a collabora-tive framework: a case study of the Southwest Regional Gap Analysis Project
(SWReGAP). Remote Sens Environ 108: 59–73.
59. Crist PJ, Prior-Magee JS, Thompson BC (1996) Land management statuscategorization in gap analysis: a potential enhancement. In Brackney ES,
Jennings MD, editors. Gap Analysis Bulletin 5. Available: http://www.gap.uidaho.edu/bulletins/5/LMSCiGA.html. Accessed 2010 March 29.
60. U. S. Geological Survey (2006) National elevation dataset. Available: http://ned.usgs.gov/. Accessed 2011 July 29.
61. Hazen HD, Anthamatten PJ (2004) Representation of ecological regions by
protected areas at the global scale. Physical Geography 25: 499–512.
62. Hoekstra JM, Boucher TM, Ricketts TH, Roberts C (2005) Confronting a biome
crisis: global disparities of habitat loss and protection. Ecol Lett 8: 23–29.
63. Groves CR, Kutner LS, Stoms DM, Murray MP, Scott JM, et al. (2000) Owning
up to our responsibilities: who owns land important for biodiversity? In: Stein
BA, Kutner LS, Adams JS, editors. Precious heritage: The status of biodiversity
in the United States. New York: Oxford University Press. 399 p.
64. Andersen MG, Ferree CE (2010) Conserving the stage: climate change and the
geophysical underpinnings of species diversity. PLoS ONE 5: 1–10.
DOI:10.737/journal.pone.0011554.
65. Tversky A, Kahneman D (1974) Judgment under uncertainty: heuristics and
biases. Science 185: 1124–1131.
66. Parmesan C (2006) Ecological and evolutionary responses to recent climate
change. Annu Rev Ecol Evol Syst 37: 637–669.
67. Parmesan C, Yohe G (2003) A globally coherent fingerprint of climate change
impacts across natural systems. Nature 421: 37–42.
68. Retti DR (1995) Our National Park System: caring for America’s greatest
natural and historic treasures. Urbana: University of Illinois Press. 293 p.
69. Mascia MB, Pailler S (2011) Protected area downgrading, downsizing, and
degazettement (PADDD) and its conservation implications. Conservation Letters
4: 9–20.
70. Hogenauer AK (1991) Gone, but not forgotten: The delisted units of the US
National Park System. The George Wright Forum 7: 2–19.
71. Hogenauer AK (1991) An update to ‘‘Gone, but not forgotten: The delisted units
of the US National Park System. The George Wright Forum 8: 26–28.
72. US Department of Interior and US Department of Agriculture (2005) National
Land Acquisition Plan. Available: http://www.fs.fed.us/land/staff/LWCF/
F i n a l % 2 0 D O I -
USDA%20Land%20Acquisition%20Report%20to%20Congress.pdf. Accessed
2012 September 5.
73. Loomis JB (1993) Integrated public lands management. New York: Columbia
University Press 474 p.
74. Thomas JW, Sienkiewicz A (2005) The relationship between science and
democracy: public land policies, regulation, and management. Public Land and
Resources Law Review 26: 39–69.
75. Darst CR, Huffman KA, Jarvis J (2009) Conservation significance of America’s
newest system of protected areas: National Landscape Conservation System.
Natural Areas Journal 29: 224–254.
76. Towns E, Cook JE (1998) USDA, Forest Service, USDI, National Park Service:
Notice of Transfer of Administrative Jurisdiction, Coconino National Forest and
Walnut Canyon National Monument. Available: http://www.gpo.gov/fdsys/
pkg/FR-1998-08-25/pdf/98-22723.pdf. Accessed 2012 August 31.
77. Stobaugh J (2003) Notice of Proposed Withdrawal and Opportunity for Public
Meeting: Nevada. Available: http://www.gpo.gov/fdsys/pkg/FR-2003-07-09/
pdf/03-17392.pdf. Accessed 2012 August 31.
78. Allred CS (2007) Public Land Order No. 7675: Transfer of Administrative
Jurisdiction, Petrified Forest National Park Expansion, Arizona. Available:
http://www.gpo.gov/fdsys/pkg/FR-2007-05-18/pdf/E7-9586.pdf. Accessed
2012 August 31.
79. Kujala H, Araujo MB, Thuiller W, Cabeza M (2011) Misleading results from
conventional gap analysis – messages from the warming north. Biol Conserv
144: 2450–2458.
Ecological Systems in Protected Areas of US
PLOS ONE | www.plosone.org 15 January 2013 | Volume 8 | Issue 1 | e54689
Related Documents