Representasi Data Multimedia (Digital Audio, Image and Video) Iwan Sonjaya http://iwankuliah.wordpress.com/ [email protected]

Welcome message from author
This document is posted to help you gain knowledge. Please leave a comment to let me know what you think about it! Share it to your friends and learn new things together.
Transcript
Representasi Data Multimedia(Digital Audio, Image and Video)
Iwan Sonjayahttp://iwankuliah.wordpress.com/

Digital Media In computers, audio, image and video are
stored as files just like other text files.
For images, these files can have an extension like– BMP, JPG, GIF, TIF, PNG, PPM, …
For audios, the file extensions include– WAV, MP3, …
The videos files usually have extensions:– AVI, MOV, …

An Digital Image Example Let’s open an image file is its “raw” format:
P6: (this is a ppm image)Resolution: 512x512Depth: 255 (8bits per pixel in each channel)

An image containsa header anda bunch of (integer) numbers.

Digital Media Capturing To get a digital image, an audio or a video clip, we need
some media capturing device such as– a digital camera or a scanner, – a digital audio recorder, – or a digital camcorder.
All these devices have to complete tasks:– Sampling: To convert a continuous media into discrete
formats.– Digitization: To convert continuous samples into finite
number of digital numbers.– There are probably some further compression process.
An Audio Signal

Sampling for an Audio Signal
0 10 20 30 40 50 60 70 80 90 100-1
-0.8
-0.6
-0.4
-0.2
0
0.2
0.4
0.6
0.8
1
t
Ampl
itude
Sampling period Ts,fs =1/Ts
Signal Period T, f = 1/T
Intuitively T should >= 2Ts

fs = 2.5f
fs = 1.67f
0 10 20 30 40 50 60 70 80 90 100-1
-0.8
-0.6
-0.4
-0.2
0
0.2
0.4
0.6
0.8
1
t
Ampl
itude
Original signal
A new component is added
This is denotedas aliasing.
0 10 20 30 40 50 60 70 80 90 100-1
-0.8
-0.6
-0.4
-0.2
0
0.2
0.4
0.6
0.8
1
t
Ampli
tude
0 10 20 30 40 50 60 70 80 90 100-1
-0.8
-0.6
-0.4
-0.2
0
0.2
0.4
0.6
0.8
1
t
Ampli
tude
0 10 20 30 40 50 60 70 80 90 100-1
-0.8
-0.6
-0.4
-0.2
0
0.2
0.4
0.6
0.8
1
t
Ampli
tude
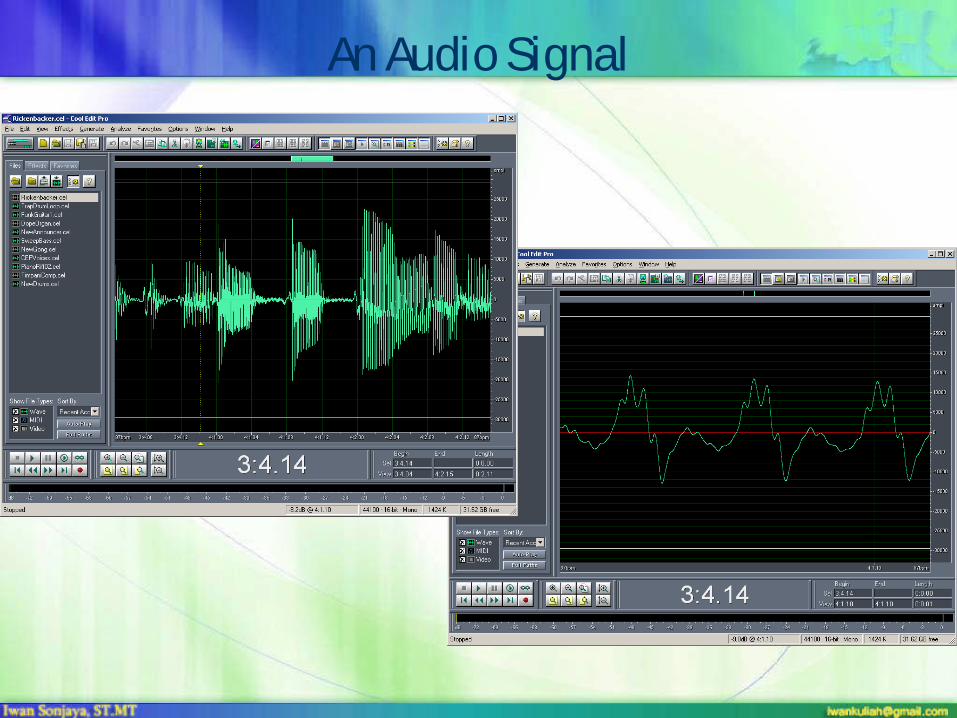
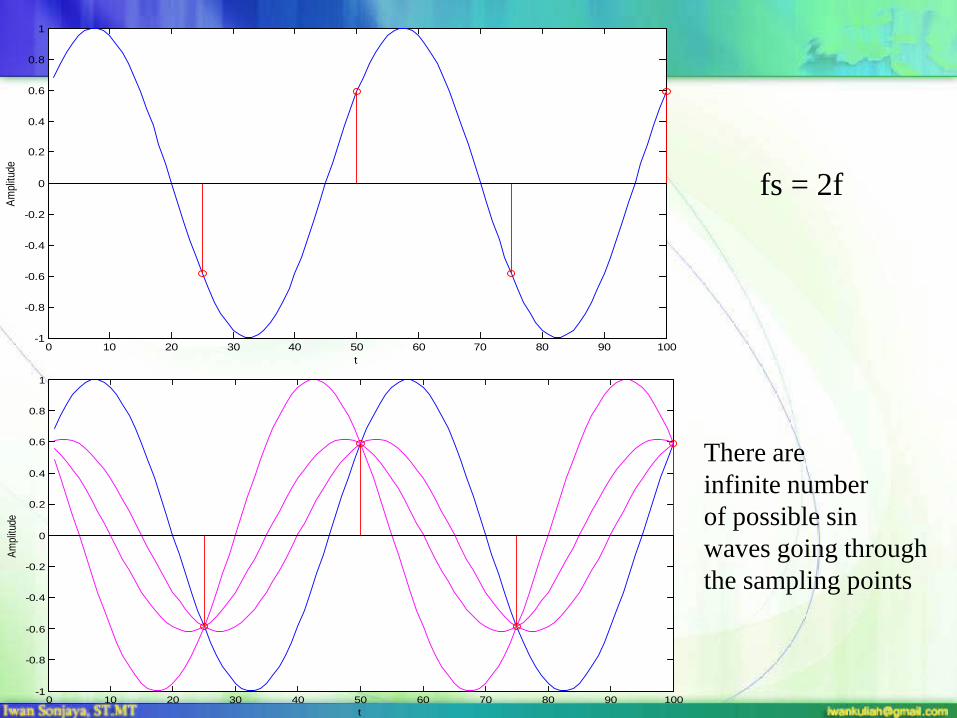
fs = 2f
There are infinite numberof possible sinwaves going throughthe sampling points
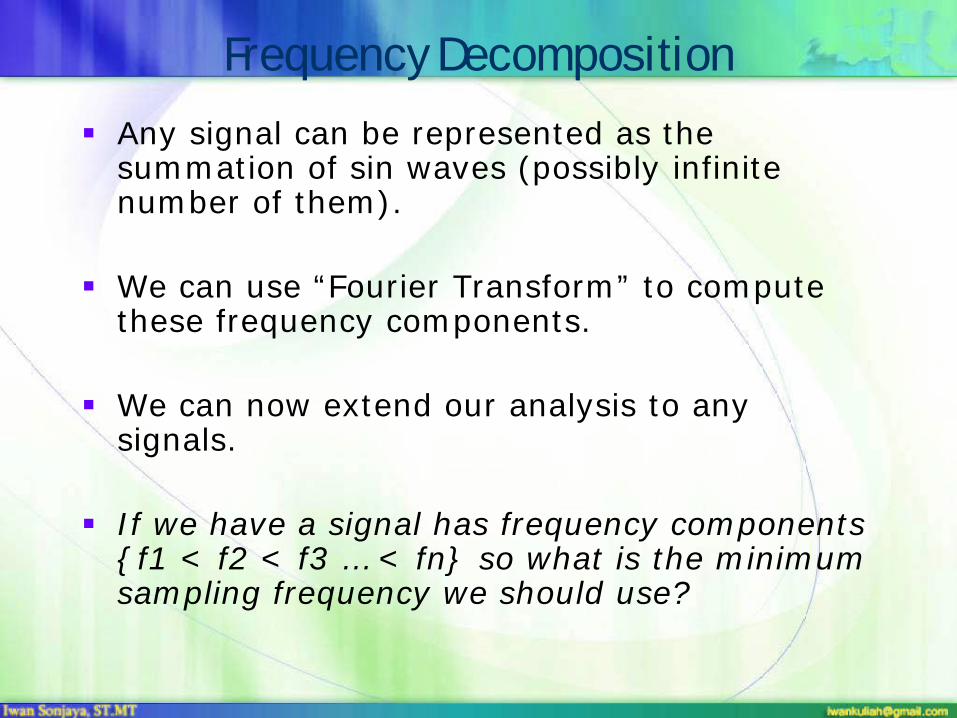
Frequency Decomposition Any signal can be represented as the
summation of sin waves (possibly infinite number of them).
We can use “Fourier Transform” to compute these frequency components.
We can now extend our analysis to any signals.
If we have a signal has frequency components {f1 < f2 < f3 … < fn} so what is the minimum sampling frequency we should use?

Nyquist Theorem Nyquist theorem
– The necessary condition of reconstructing a continuous signal from the sampling version is that the sampling frequency
fs > 2fmax
fmax is the highest frequency component in the signal.
– If a signal’s frequency components are restricted in [f1, f2], we need fs >2 (f2-f1).

Image Sampling The sampling theorem applies to 2D signal
(images) too.
Sampling on a grid Sampling problem
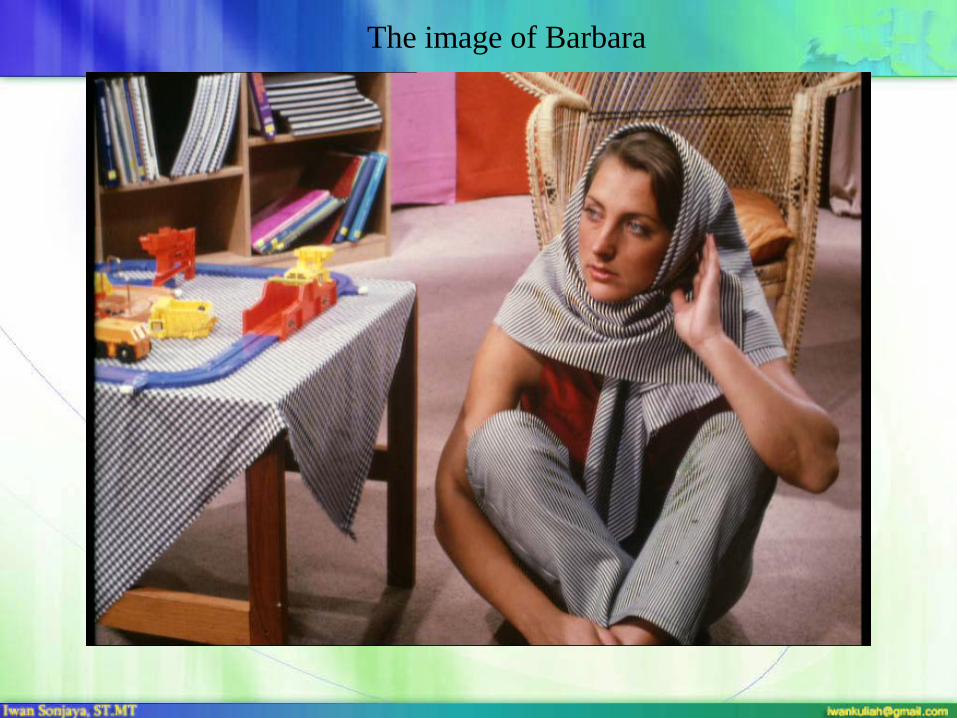
The image of Barbara
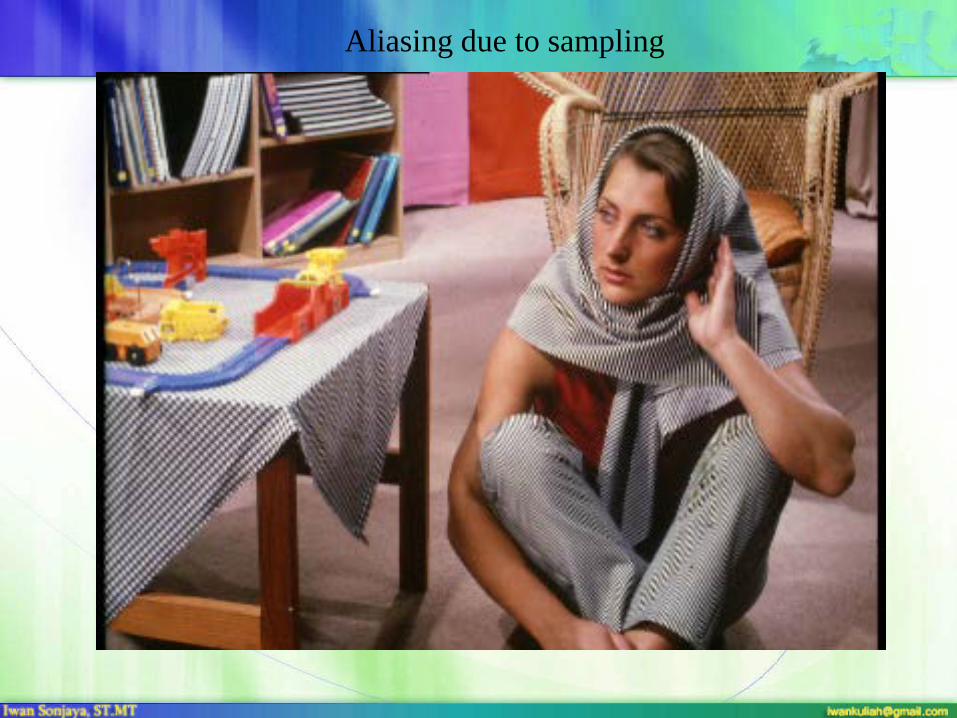
Aliasing due to sampling
Digitization The samples are continuous and have infinite number of
possible values.
The digitization process approximates these values with a fixed number of numbers.
To represent N numbers, we need log2N bits.
So, what determines the number of bits we need for an audio clip or an image?
Digital Audio You often hear that an audio is 16bits at 44kHz.
44KHz is the sampling frequency. Music has more high frequency components than speech. 8kHz sampling is good enough for telephone quality speech.
16bits means each sample is represented as a 16bit integer.
Digital audio could have more than one channels.

Digital Images
An image contains 2D samples of a surface, which can be representedas matrices. Each sample in an image is called a pixel.
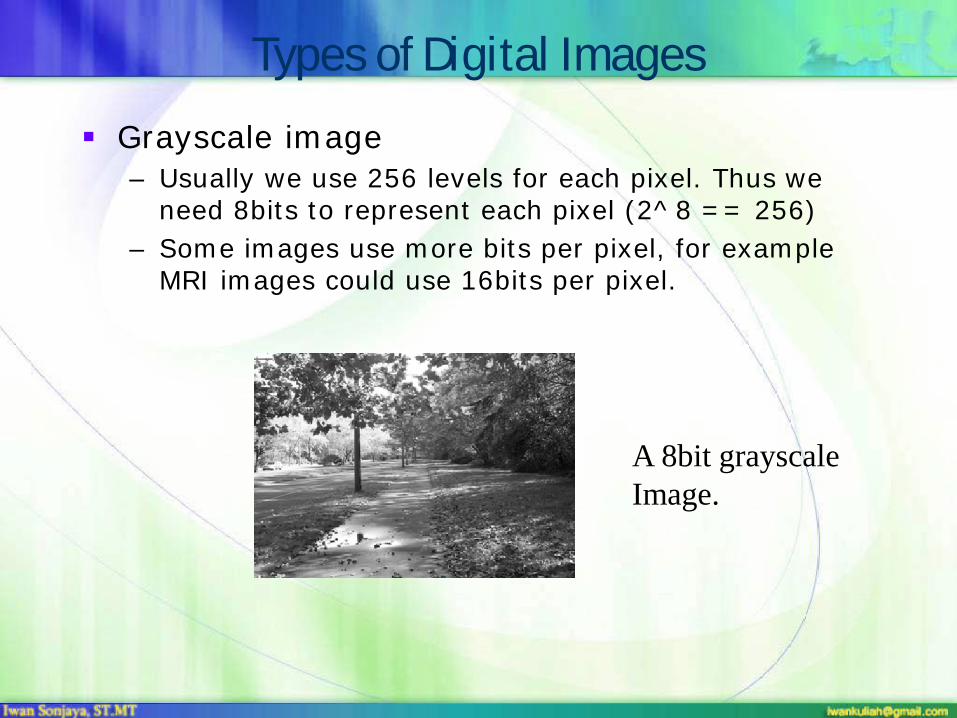
Types of Digital Images Grayscale image
– Usually we use 256 levels for each pixel. Thus we need 8bits to represent each pixel (2^8 == 256)
– Some images use more bits per pixel, for example MRI images could use 16bits per pixel.
A 8bit grayscaleImage.
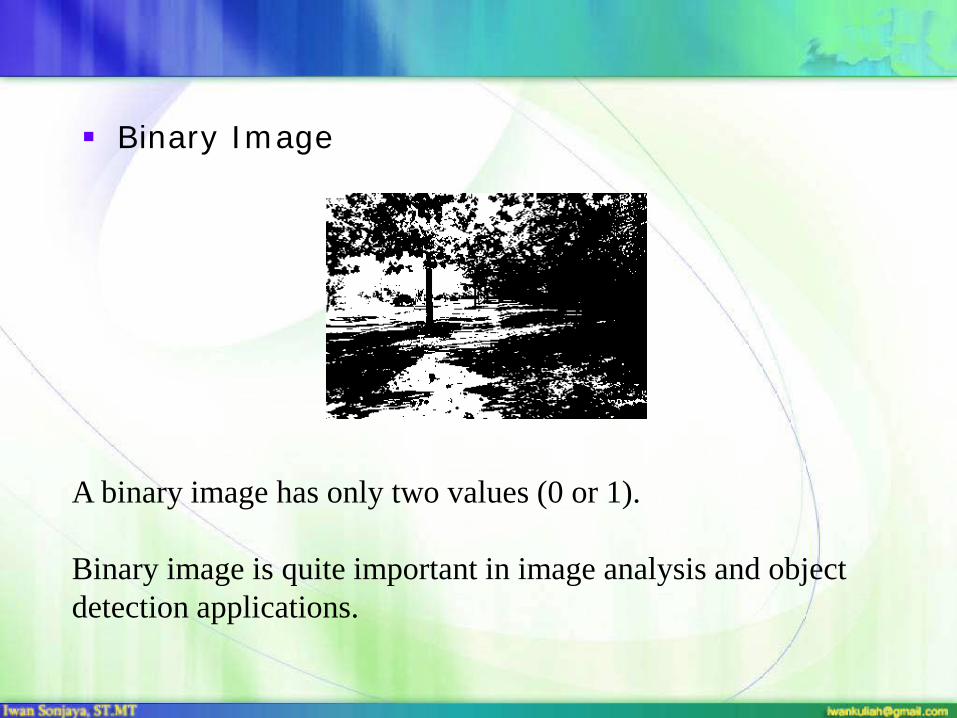
Binary Image
A binary image has only two values (0 or 1).
Binary image is quite important in image analysis and objectdetection applications.
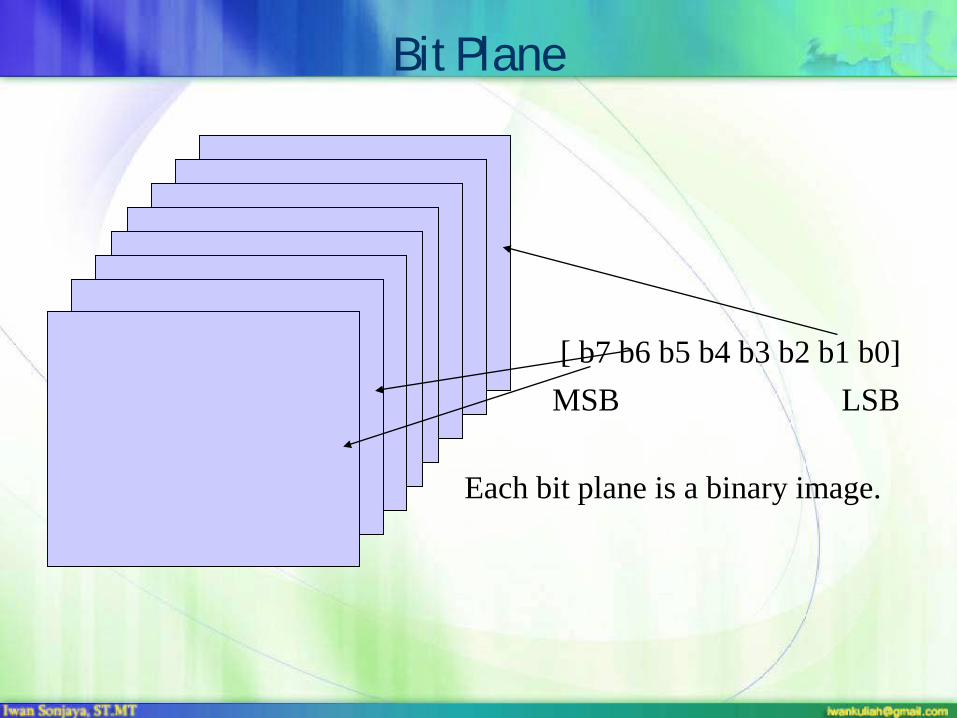
Bit Plane
[ b7 b6 b5 b4 b3 b2 b1 b0]MSB LSB
Each bit plane is a binary image.
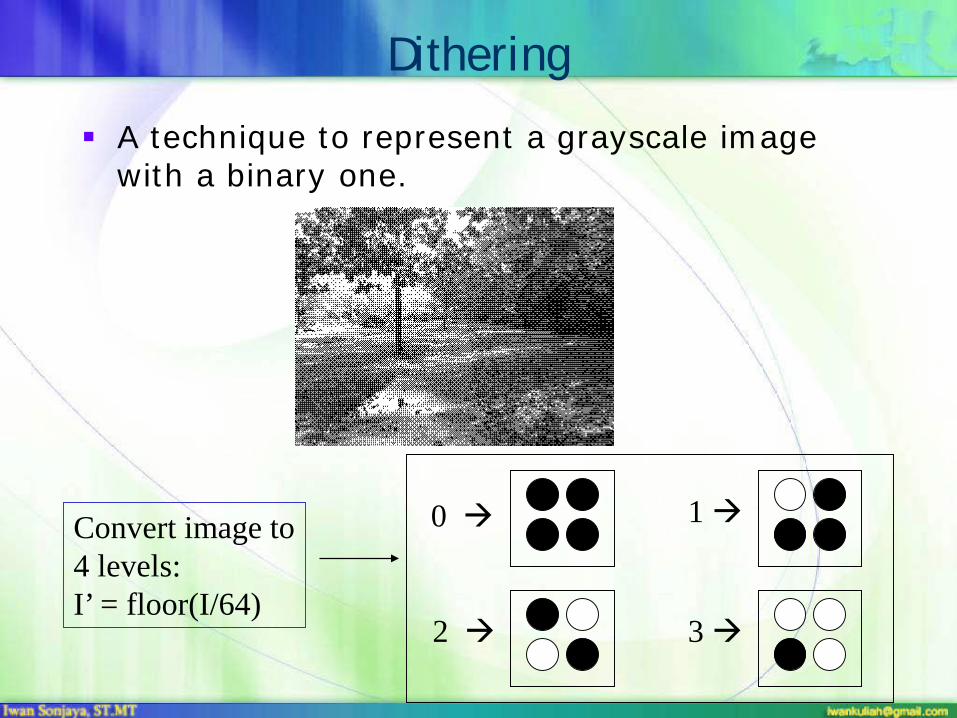
Dithering A technique to represent a grayscale image
with a binary one.
0 1
2 3
Convert image to4 levels: I’ = floor(I/64)
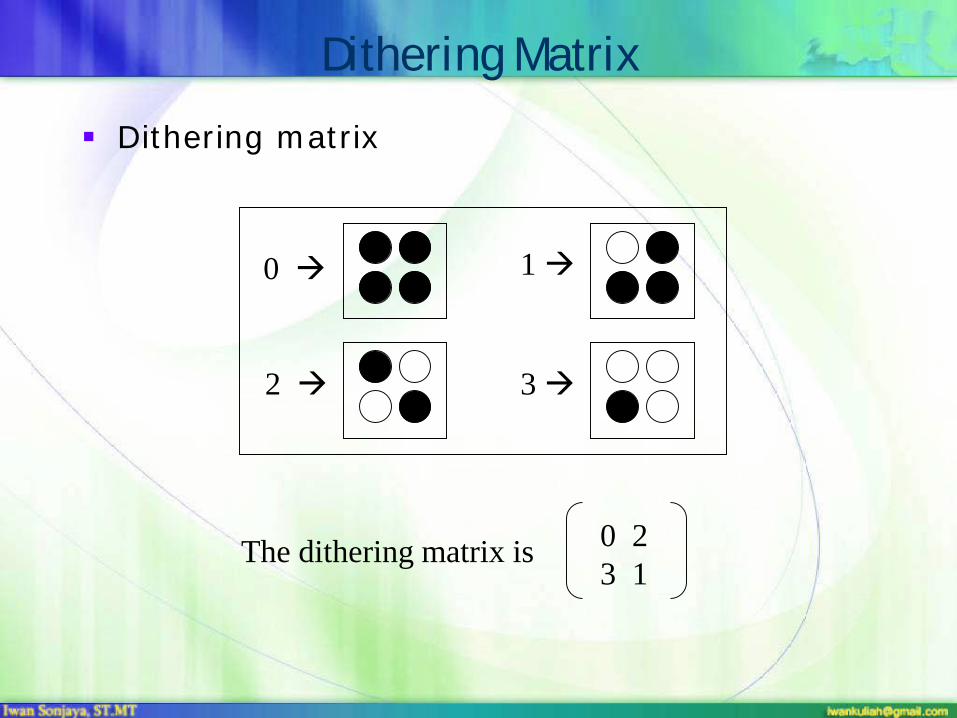
Dithering Matrix Dithering matrix
0 1
2 3
0 23 1
The dithering matrix is

Color Image
r
g
b
There are other color spacesLike YUV, HSV etc.
24 bit image
Color Table
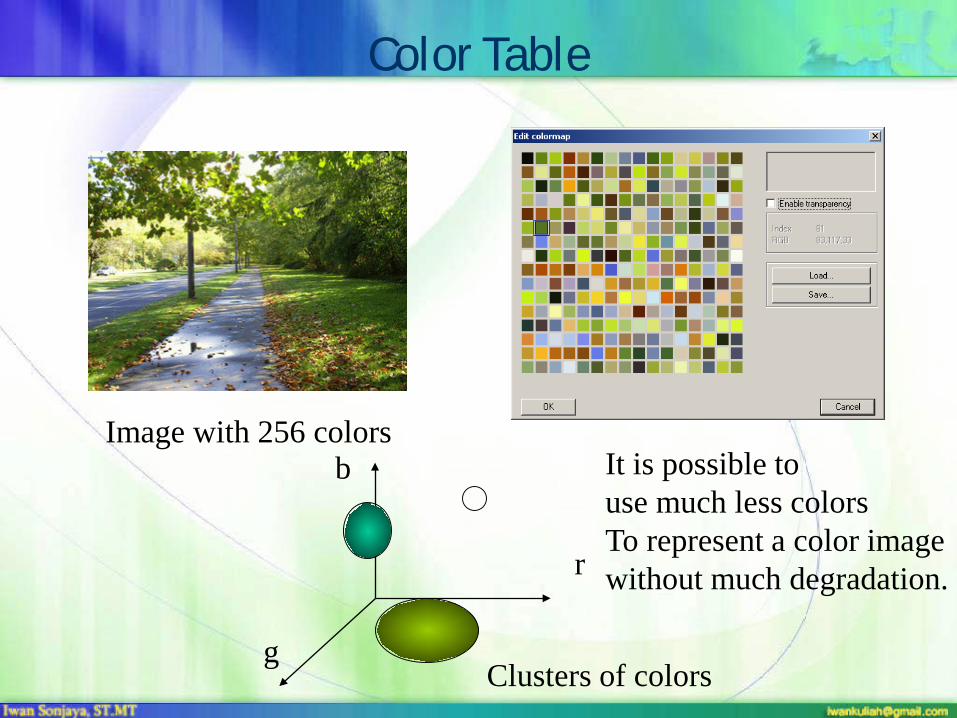
Image with 256 colors
r
g
b
Clusters of colors
It is possible touse much less colorsTo represent a color imagewithout much degradation.
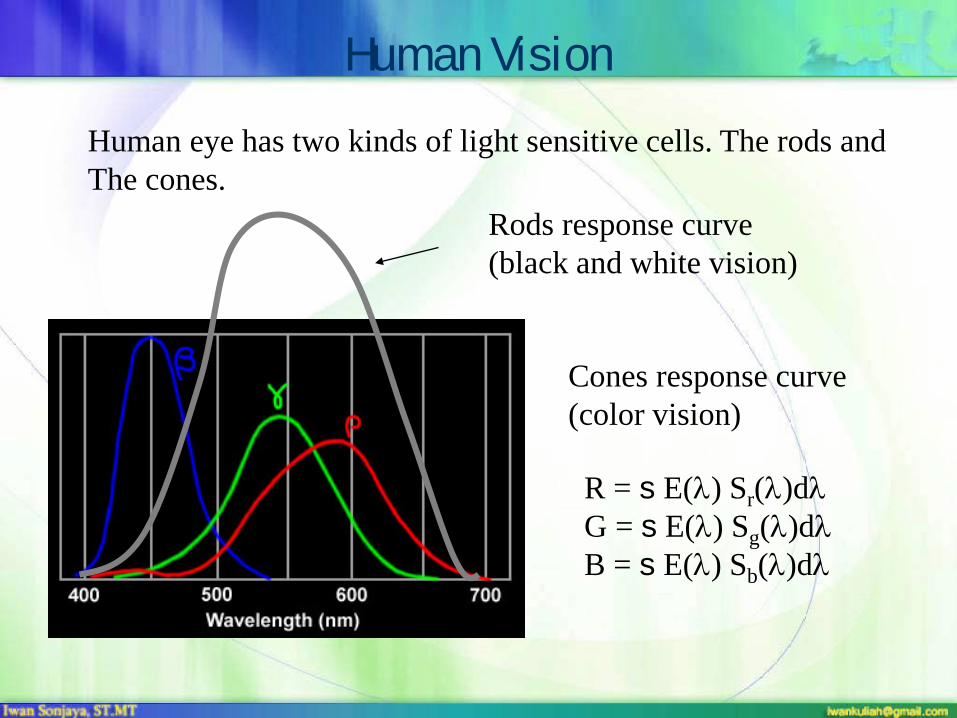
Human VisionHuman eye has two kinds of light sensitive cells. The rods andThe cones.
Rods response curve(black and white vision)
Cones response curve(color vision)
R = s E(λ) Sr(λ)dλG = s E(λ) Sg(λ)dλB = s E(λ) Sb(λ)dλ
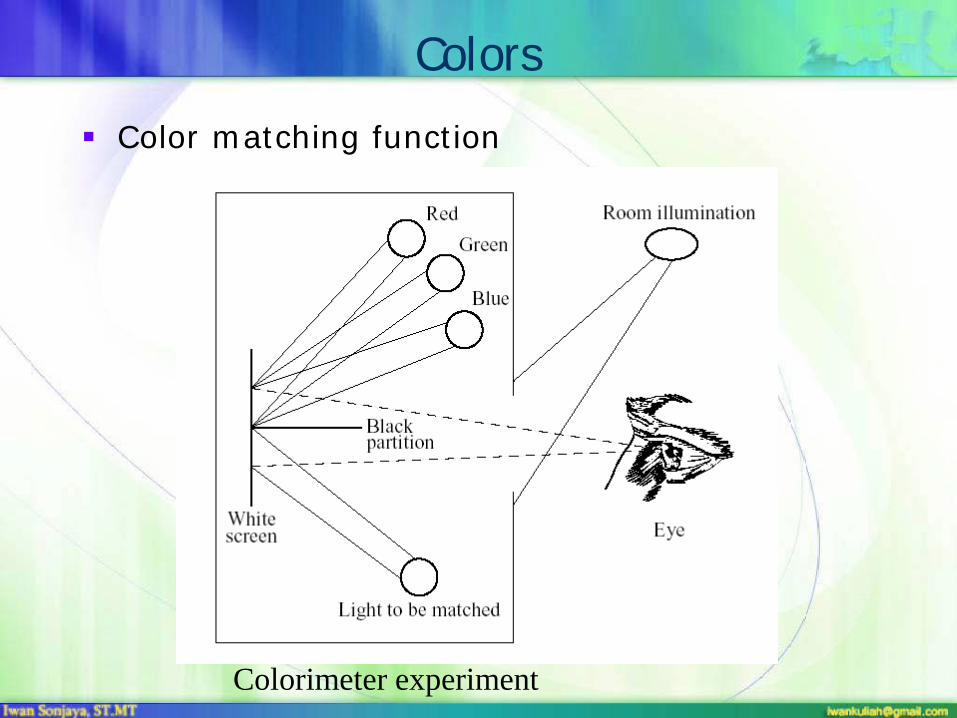
Colors Color matching function
Colorimeter experiment

CIE Color Matching Functions The amounts of R, G, B lighting sources to
form single wavelength light forms the color matching curves.
CIE color matching curves CIE standard color matching functions.
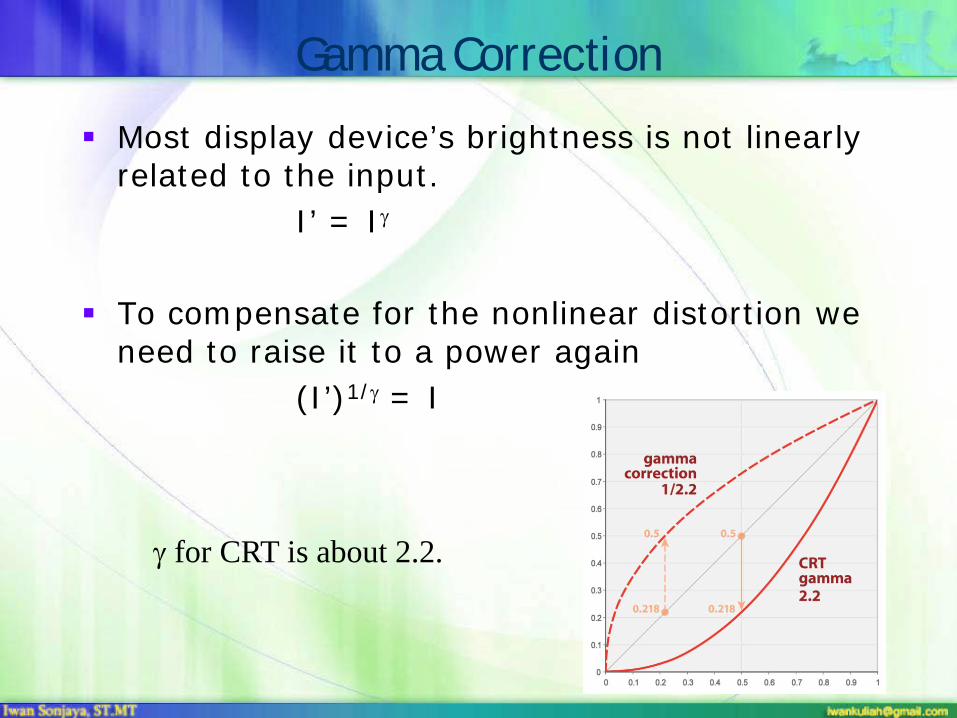
Gamma Correction Most display device’s brightness is not linearly
related to the input.I’ = Iγ
To compensate for the nonlinear distortion we need to raise it to a power again
(I’)1/γ = I
γ for CRT is about 2.2.
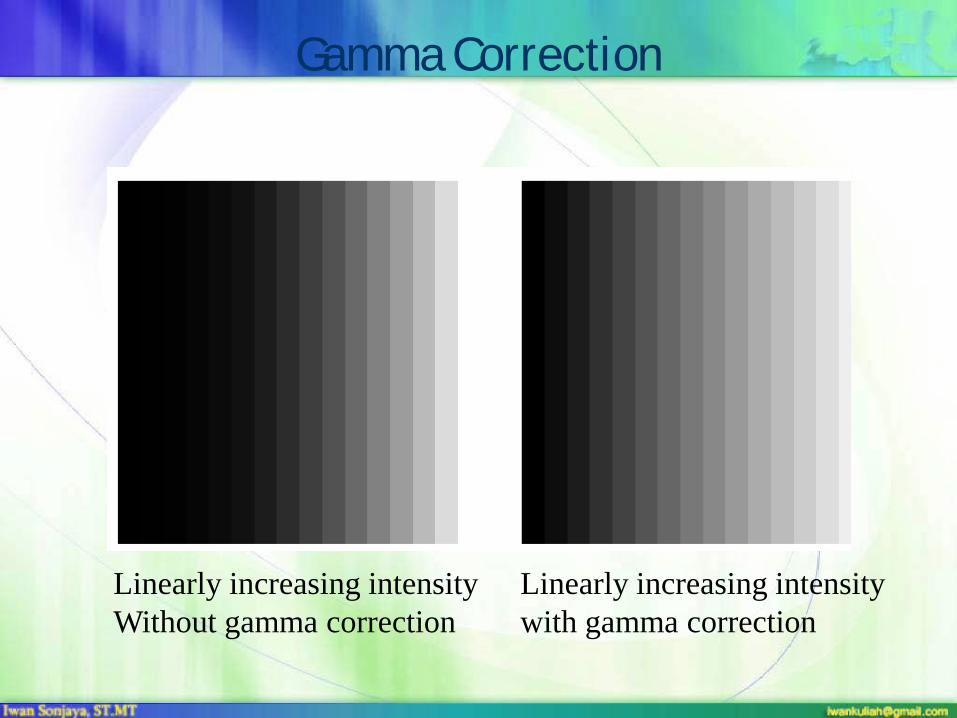
Gamma Correction
Linearly increasing intensityWithout gamma correction
Linearly increasing intensitywith gamma correction
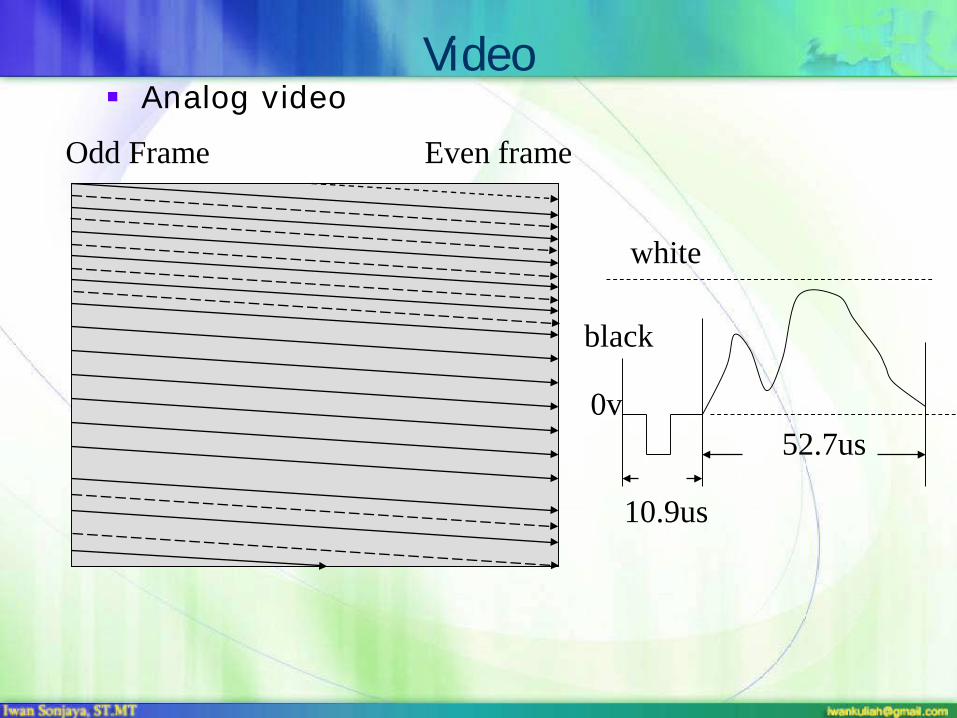
Video Analog video
Even frameOdd Frame
52.7us
10.9us
0v
white
black
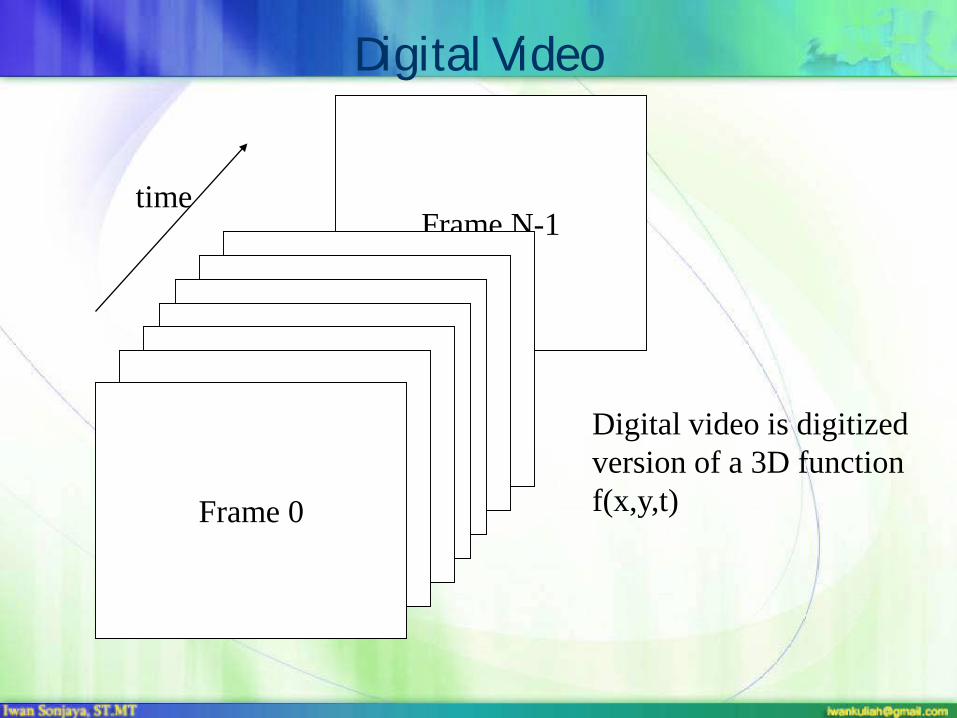
Digital Video
Frame N-1
Frame 0
time
Digital video is digitizedversion of a 3D functionf(x,y,t)
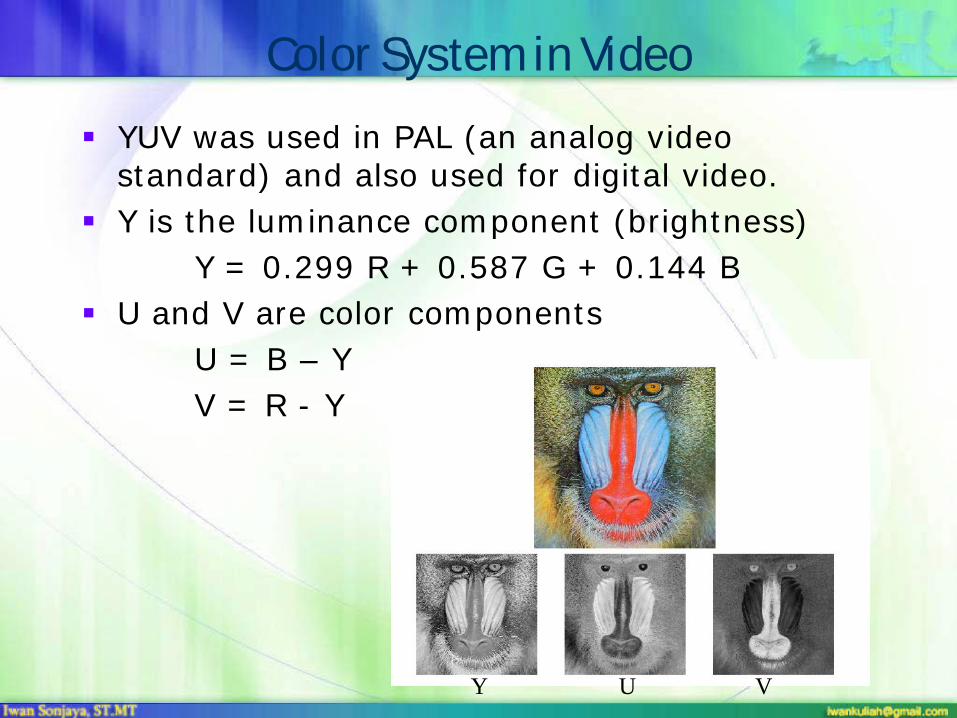
Color System in Video YUV was used in PAL (an analog video
standard) and also used for digital video. Y is the luminance component (brightness)
Y = 0.299 R + 0.587 G + 0.144 B U and V are color components
U = B – YV = R - Y
Y U V
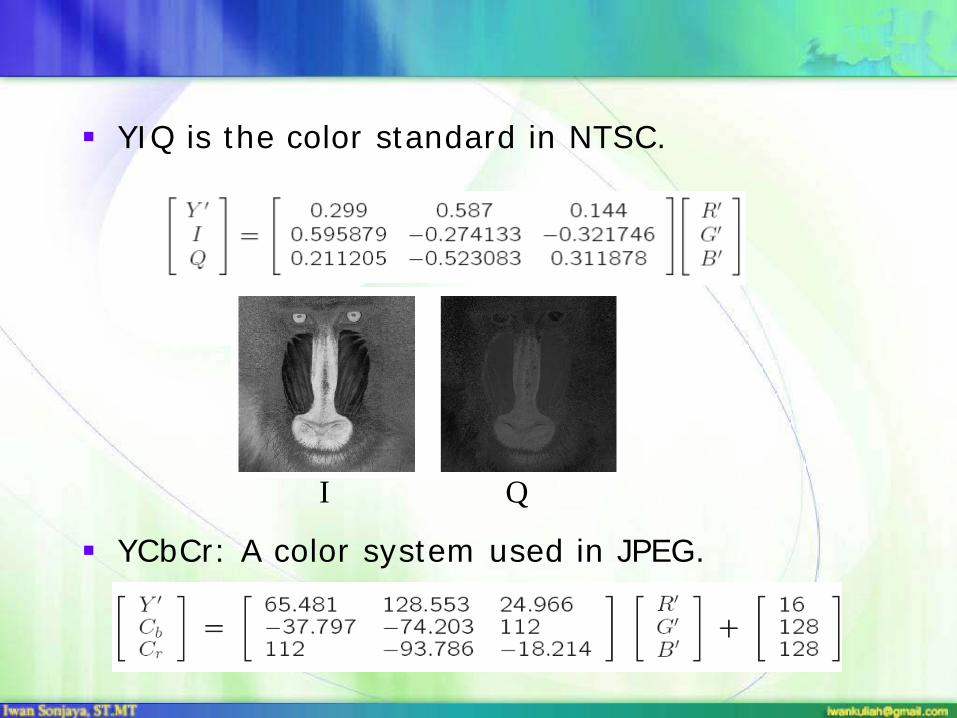
YIQ is the color standard in NTSC.
YCbCr: A color system used in JPEG.
I Q
Related Documents