Report Special Eurobarometer Attitudes towards Alcohol Fieldwork October - November 2006 Publication March 2007 Special Eurobarometer 272b / Wave 66.2 – TNS Opinion & Social This survey was requested by Directorate General SANCO and coordinated by Directorate General COMMUNICATION This document does not represent the point of view of the European Commission. The interpretations and opinions contained in it are solely those of the authors. European Commission

Welcome message from author
This document is posted to help you gain knowledge. Please leave a comment to let me know what you think about it! Share it to your friends and learn new things together.
Transcript

Report
Special Eurobarometer
Attitudes towards Alcohol Fieldwork October - November 2006
Publication March 2007
Spe
cial
Eur
obar
omet
er 2
72b
/ Wav
e 66
.2 –
TN
S O
pini
on &
Soc
ial
This survey was requested by Directorate General SANCO and coordinated by Directorate General COMMUNICATION
This document does not represent the point of view of the European Commission. The interpretations and opinions contained in it are solely those of the authors.
European Commission
Special EUROBAROMETER 272 Alcohol
1
Table of content
PRESENTATION ............................................................................................ 2
1. Alcohol drinking habits ........................................................................ 3 1.1. Frequency of alcohol consumption ...................................................... 3 1.2. Amount of alcohol consumption.........................................................10 1.3. Gender differences in alcohol consumption pattern...............................14
2. Responsibility for and prevention from alcohol related harm............. 15 2.1. Who is responsible for protection from the harmful effects of alcohol consumption? ............................................................................................15 2.2. Does price influence alcohol-drinking habits?.......................................17 2.3. EU citizens’ view on warnings on alcohol bottles and adverts .................23
3. Alcohol consumption and special groups ........................................... 25 3.1. Alcohol consumption and drivers .......................................................25 3.2. Alcohol consumption and young people ..............................................31
CONCLUSION.............................................................................................. 35
ANNEXES Technical note Questionnaire Tables
Special EUROBAROMETER 272 Alcohol
2
PRESENTATION One of today’s major life-style related health determinants is alcohol. Europe is the continent where per capita alcohol consumption is the highest in the world. In established market economies such as the EU Member States the burden of disease and injury attributable to alcohol is estimated to be situated between 8 and 10%.1 For this reason, combating harmful and hazardous alcohol consumption is not only a public health priority in several Member States but also at the European Union level. Nevertheless, health problems constitute only one dimension of detrimental impacts caused by harmful alcohol consumption and thus negative social consequences have also to be considered: violence, hooliganism, crime, family problems, social exclusion, problems at the workplace and drink driving. All these are areas where political action is needed both at the national and at the European level. In order to obtain a picture of EU citizens’ alcohol drinking habits and their attitudes towards measures potentially influencing alcohol related harm, the Health and Consumer Protection Directorate-General of the European Commission commissioned a poll on these issues. Interviews were conducted face-to-face in peoples’ homes, in their national language, between the 6th of October and the 8th of November 2006. The countries surveyed include the twenty-five Member States of the European Union, the two acceding countries (Bulgaria and Romania), one of the two candidate countries (Croatia) as well as the Turkish Cypriot Community (TCC). The methodology used is that of the Standard Eurobarometer polls, managed by the Commission’s Directorate-General for Communication (Unit: “Opinion polls and Media Monitoring”). In the annex, a technical note details the interview techniques used by the institutes of the TNS Opinion & Social network, as well as statistical levels of confidence. In this report, we will analyse first EU citizens’ alcohol drinking habits in terms of frequency and the amount consumed. Secondly, we will explore respondents’ estimations of the role of individual/public responsibility in the prevention of harmful consequences, and the influence of the price factor on alcohol consumption. Finally, we will look at citizens’ attitudes towards certain legal concepts which aim to prevent alcohol-related harm affecting vulnerable groups on the one hand, and also to alcohol related road accidents on the other hand. For each theme addressed, this analysis2 looks at the:
• European Union as a whole; • Individual countries; • Socio-demographic variables.
Other variables which are systematically cross-tabulated with the results for each question include: alcohol consumption during the last 12 months (results for QB10a), opinion on the idea of putting warnings on alcohol bottles and adverts to warn pregnant women and drivers of dangers of drinking alcohol (results for QB17) and the assessments of the responsibility of individuals and public authorities in protecting individuals from alcohol related harm (QB18).
1 http://ec.europa.eu/health/ph_determinants/life_style/alcohol_en.htm 2 In some cases, due to the rounding of figures, displayed sums can show a difference of one point compared with the sum of the individual cells. Also, it should be noted that the total percentages shown in the tables of this report may exceed 100% where the respondent is allowed to give several answers to a particular question.
Special EUROBAROMETER 272 Alcohol
3
1. Alcohol drinking habits 1.1. Frequency of alcohol consumption
- More respondents have drunk alcohol but less often than 3 years ago, although there are considerable gender and age differences -
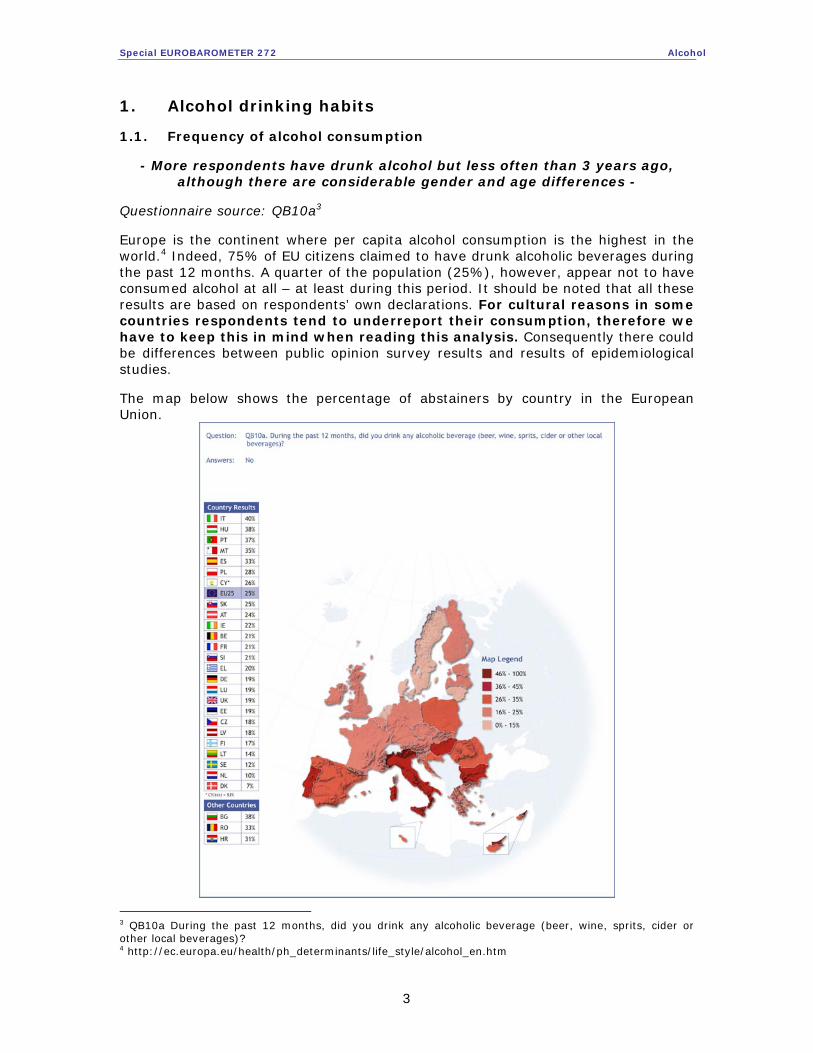
Questionnaire source: QB10a3 Europe is the continent where per capita alcohol consumption is the highest in the world.4 Indeed, 75% of EU citizens claimed to have drunk alcoholic beverages during the past 12 months. A quarter of the population (25%), however, appear not to have consumed alcohol at all – at least during this period. It should be noted that all these results are based on respondents’ own declarations. For cultural reasons in some countries respondents tend to underreport their consumption, therefore we have to keep this in mind when reading this analysis. Consequently there could be differences between public opinion survey results and results of epidemiological studies. The map below shows the percentage of abstainers by country in the European Union.
3 QB10a During the past 12 months, did you drink any alcoholic beverage (beer, wine, sprits, cider or other local beverages)? 4 http://ec.europa.eu/health/ph_determinants/life_style/alcohol_en.htm

Special EUROBAROMETER 272 Alcohol
4
Although country results about alcohol consumers vary between 60% for Italy to 93% for Denmark, the majority in all Member States and acceding/candidate countries seem to indulge in drinking some kind of alcoholic beverage. Most probably due to religious motives the majority (53%) in the Turkish Cypriot Community declared they had not drunk any alcohol in the past 12 months. In socio-demographic terms gender, socio-economic status and - to some extent - age seems to be determining factors. Significantly more men (84%) than women (68%) said they had drunk alcohol in the past year. Higher proportions of respondents who had continued their education to the highest level (84%) and managers (88%) claimed to have consumed alcohol than other groups. Among all socio-demographic groups house persons (43%) responded the most frequently that they have not drunk any alcohol during the past 12 months. An important proportion of respondents finishing their full-time education by the age 15 (37%) and those aged 55 and over (33%) also seem to refrain from alcohol. It can be noted that these two categories are often linked, as more of the older respondent group left school at an earlier age compared to the EU average. Interestingly, more of those who stress the responsibility of individuals in terms of protection from alcohol-related harm have consumed alcoholic beverages in the past year (80% have drunk alcohol compared to the EU average 75%). Meanwhile, more of those who believe public authorities should intervene claim not to have drunk any alcohol (29% have not drunk compared to the EU average 25%).
QB10a During the past 12 months, did you drink any alcoholic beverage (beer, wine, sprits, cider or other local beverages)?
Yes No Yes No
EU25 75% 25% EU25 75% 25%
Sex Education (End of)
Male 84% 16% 15 63% 37%
Female 68% 32% 16-19 80% 20%
Age 20+ 84% 16%
15-24 75% 25% Still Studying 72% 28%
25-39 81% 19% Respondent occupation scale
40-54 81% 19% Self- employed 81% 19%
55 + 67% 33% Managers 88% 12%
Put warnings on alcohol bottles and adverts Other white collars 82% 18%
Agree 74% 26% Manual workers 84% 16%
Disagree 84% 16% House persons 57% 43%
Protection from alcohol related harm Unemployed 74% 26%
Individuals are responsible 80% 20% Retired 67% 33%
Public authorities must intervene 71% 29% Students 72% 28%
Special EUROBAROMETER 272 Alcohol
5
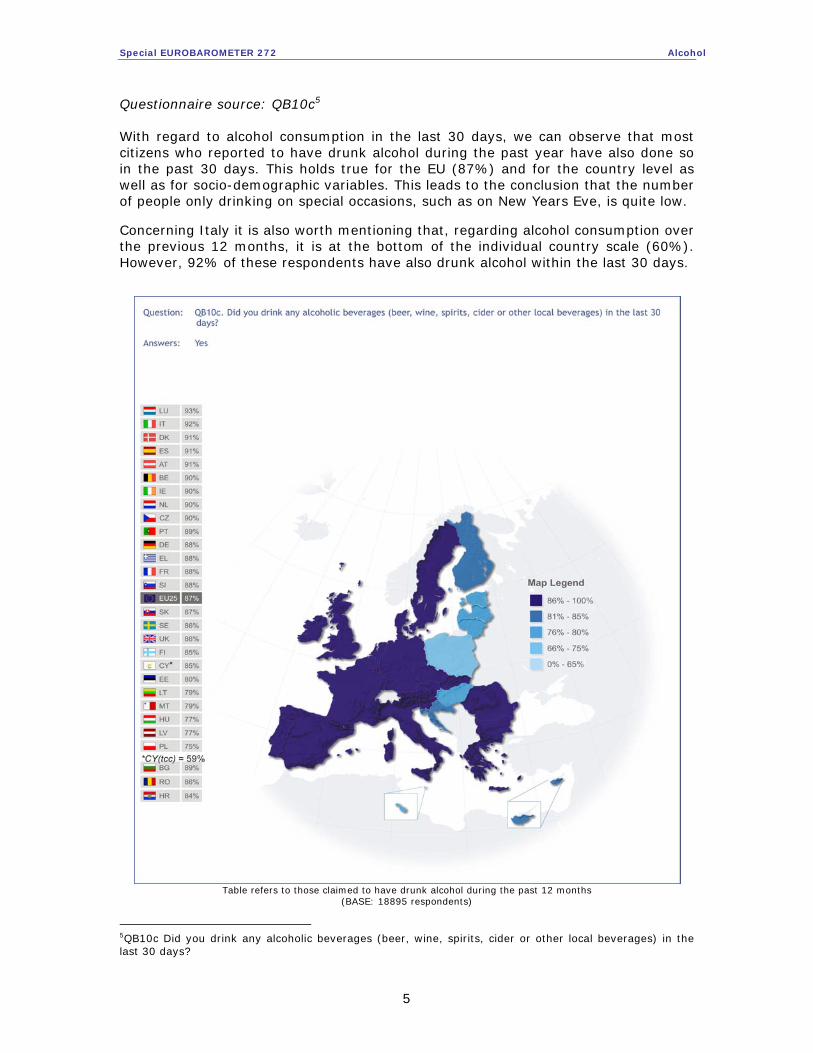
Questionnaire source: QB10c5 With regard to alcohol consumption in the last 30 days, we can observe that most citizens who reported to have drunk alcohol during the past year have also done so in the past 30 days. This holds true for the EU (87%) and for the country level as well as for socio-demographic variables. This leads to the conclusion that the number of people only drinking on special occasions, such as on New Years Eve, is quite low. Concerning Italy it is also worth mentioning that, regarding alcohol consumption over the previous 12 months, it is at the bottom of the individual country scale (60%). However, 92% of these respondents have also drunk alcohol within the last 30 days.
Table refers to those claimed to have drunk alcohol during the past 12 months
(BASE: 18895 respondents)
5QB10c Did you drink any alcoholic beverages (beer, wine, spirits, cider or other local beverages) in the last 30 days?
Special EUROBAROMETER 272 Alcohol
6
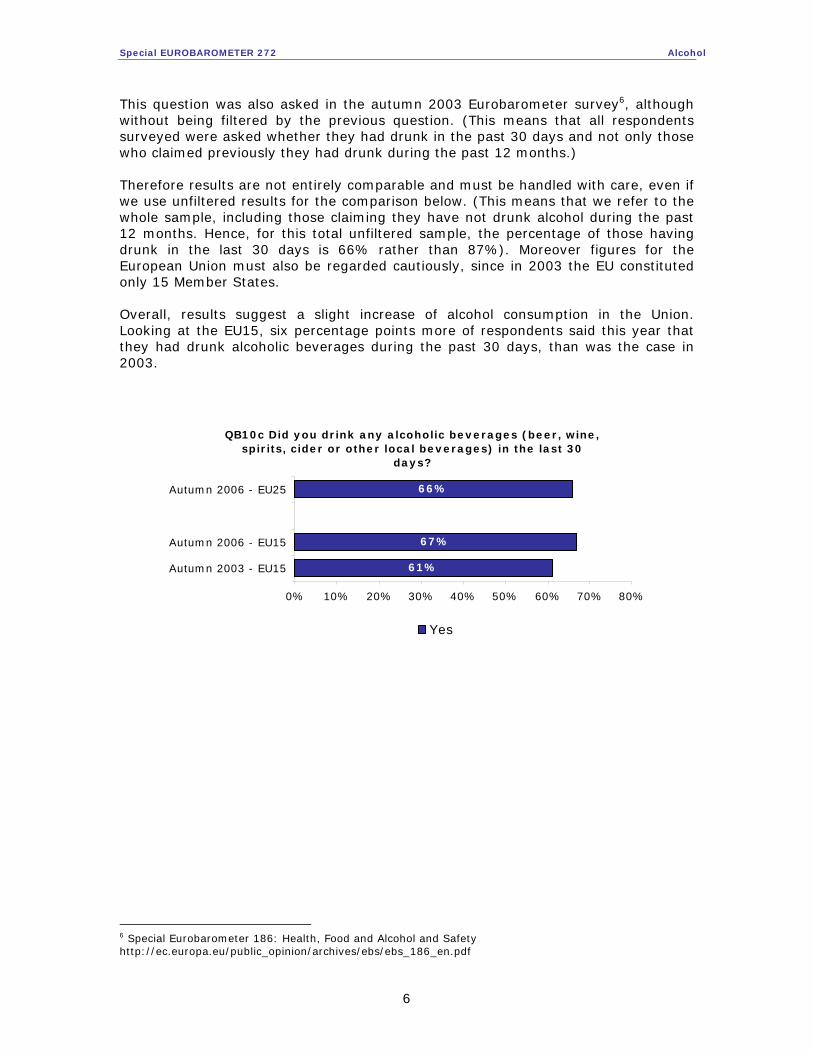
This question was also asked in the autumn 2003 Eurobarometer survey6, although without being filtered by the previous question. (This means that all respondents surveyed were asked whether they had drunk in the past 30 days and not only those who claimed previously they had drunk during the past 12 months.) Therefore results are not entirely comparable and must be handled with care, even if we use unfiltered results for the comparison below. (This means that we refer to the whole sample, including those claiming they have not drunk alcohol during the past 12 months. Hence, for this total unfiltered sample, the percentage of those having drunk in the last 30 days is 66% rather than 87%). Moreover figures for the European Union must also be regarded cautiously, since in 2003 the EU constituted only 15 Member States. Overall, results suggest a slight increase of alcohol consumption in the Union. Looking at the EU15, six percentage points more of respondents said this year that they had drunk alcoholic beverages during the past 30 days, than was the case in 2003.
QB10c Did you drink any alcoholic beverages (beer, wine, spirits, cider or other local beverages) in the last 30
days?
66%
67%
61%
0% 10% 20% 30% 40% 50% 60% 70% 80%
Autumn 2006 - EU25
Autumn 2006 - EU15
Autumn 2003 - EU15
Yes
6 Special Eurobarometer 186: Health, Food and Alcohol and Safety http://ec.europa.eu/public_opinion/archives/ebs/ebs_186_en.pdf
Special EUROBAROMETER 272 Alcohol
7
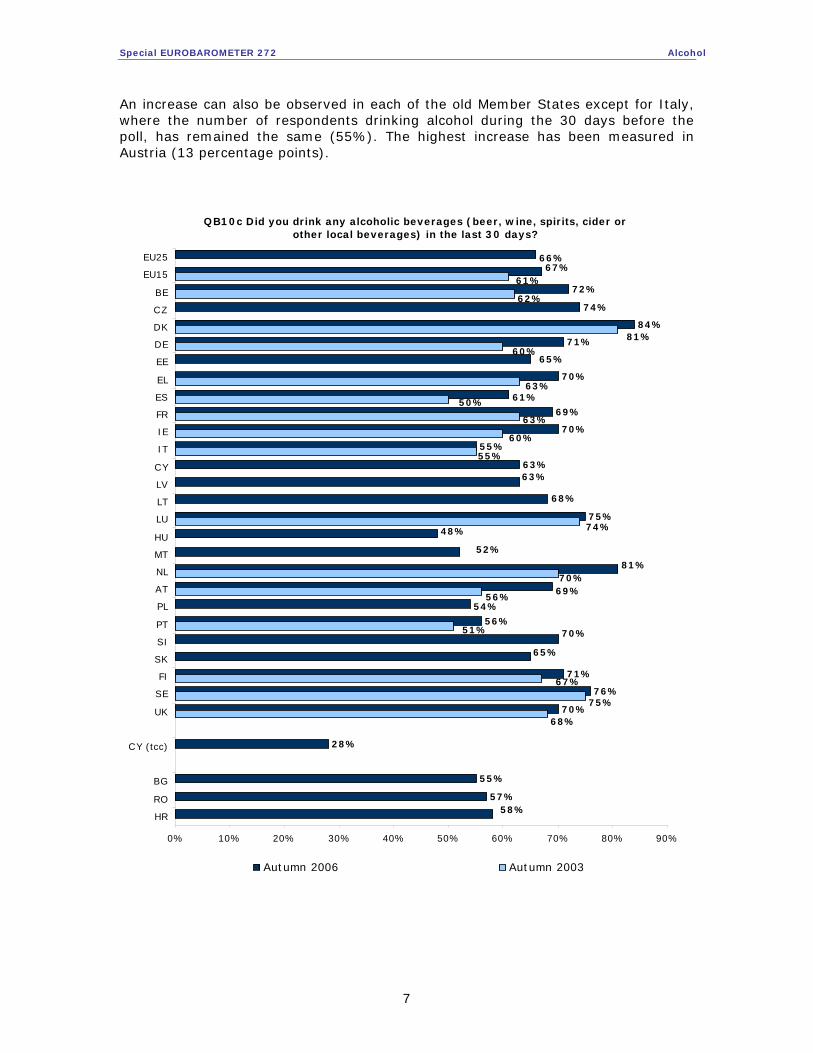
An increase can also be observed in each of the old Member States except for Italy, where the number of respondents drinking alcohol during the 30 days before the poll, has remained the same (55%). The highest increase has been measured in Austria (13 percentage points).
QB10c Did you drink any alcoholic beverages (beer, wine, spirits, cider or other local beverages) in the last 30 days?
72%
74%
84%
71%
70%
69%
70%
55%
63%
75%
56%
71%
76%
70%
28%
55%
57%
65%
61%
67%
58%
48%
68%
63%
66%
52%
81%
69%
54%
70%
65%
60%
81%
62%
61%
74%
63%
50%
63%
55%
60%
70%
67%
75%
68%
56%
51%
0% 10% 20% 30% 40% 50% 60% 70% 80% 90%
EU25
EU15
BE
CZ
DK
DE
EE
EL
ES
FR
IE
IT
CY
LV
LT
LU
HU
MT
NL
AT
PL
PT
SI
SK
FI
SE
UK
CY (tcc)
BG
RO
HR
Autumn 2006 Autumn 2003
Special EUROBAROMETER 272 Alcohol
8
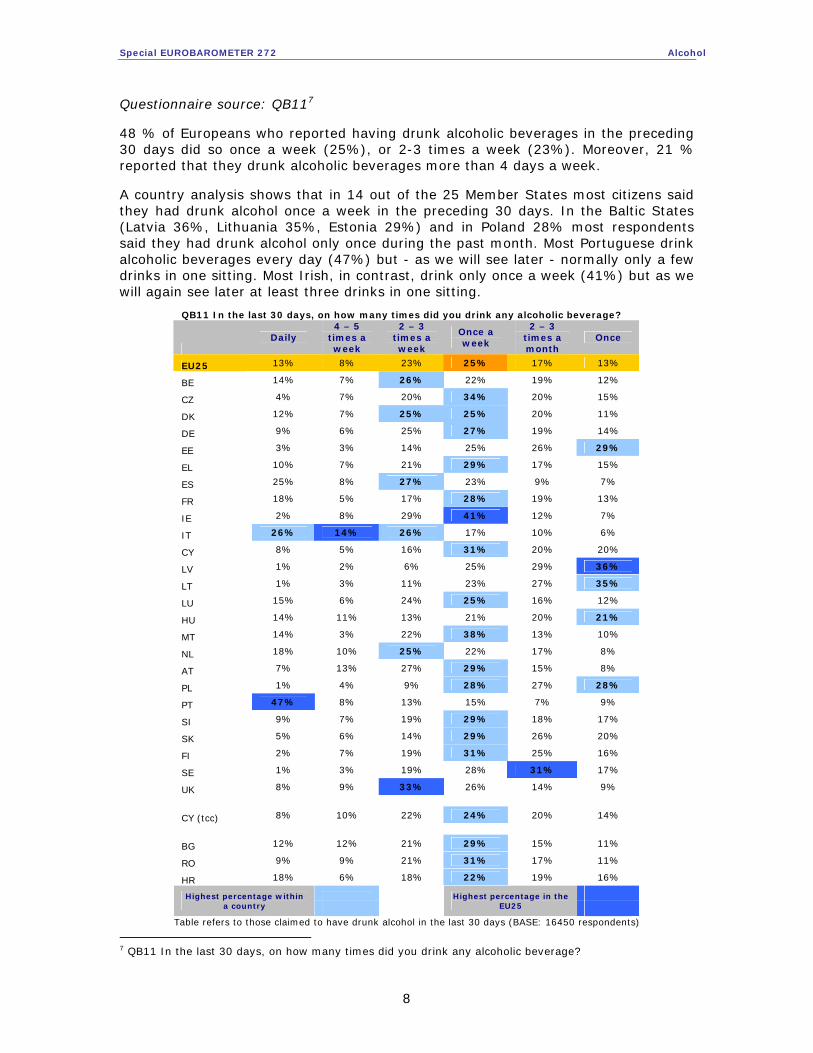
Questionnaire source: QB117 48 % of Europeans who reported having drunk alcoholic beverages in the preceding 30 days did so once a week (25%), or 2-3 times a week (23%). Moreover, 21 % reported that they drunk alcoholic beverages more than 4 days a week. A country analysis shows that in 14 out of the 25 Member States most citizens said they had drunk alcohol once a week in the preceding 30 days. In the Baltic States (Latvia 36%, Lithuania 35%, Estonia 29%) and in Poland 28% most respondents said they had drunk alcohol only once during the past month. Most Portuguese drink alcoholic beverages every day (47%) but - as we will see later - normally only a few drinks in one sitting. Most Irish, in contrast, drink only once a week (41%) but as we will again see later at least three drinks in one sitting.
QB11 In the last 30 days, on how many times did you drink any alcoholic beverage?
Daily
4 – 5 times a week
2 – 3 times a week
Once a week
2 – 3 times a month
Once
EU25 13% 8% 23% 25% 17% 13%
BE 14% 7% 26% 22% 19% 12%
CZ 4% 7% 20% 34% 20% 15%
DK 12% 7% 25% 25% 20% 11%
DE 9% 6% 25% 27% 19% 14%
EE 3% 3% 14% 25% 26% 29%
EL 10% 7% 21% 29% 17% 15%
ES 25% 8% 27% 23% 9% 7%
FR 18% 5% 17% 28% 19% 13%
IE 2% 8% 29% 41% 12% 7%
IT 26% 14% 26% 17% 10% 6%
CY 8% 5% 16% 31% 20% 20%
LV 1% 2% 6% 25% 29% 36%
LT 1% 3% 11% 23% 27% 35%
LU 15% 6% 24% 25% 16% 12%
HU 14% 11% 13% 21% 20% 21%
MT 14% 3% 22% 38% 13% 10%
NL 18% 10% 25% 22% 17% 8%
AT 7% 13% 27% 29% 15% 8%
PL 1% 4% 9% 28% 27% 28%
PT 47% 8% 13% 15% 7% 9%
SI 9% 7% 19% 29% 18% 17%
SK 5% 6% 14% 29% 26% 20%
FI 2% 7% 19% 31% 25% 16%
SE 1% 3% 19% 28% 31% 17%
UK 8% 9% 33% 26% 14% 9%
CY (tcc) 8% 10% 22% 24% 20% 14%
BG 12% 12% 21% 29% 15% 11%
RO 9% 9% 21% 31% 17% 11%
HR 18% 6% 18% 22% 19% 16%
Highest percentage within a country
Highest percentage in the EU25
Table refers to those claimed to have drunk alcohol in the last 30 days (BASE: 16450 respondents)
7 QB11 In the last 30 days, on how many times did you drink any alcoholic beverage?
Special EUROBAROMETER 272 Alcohol
9
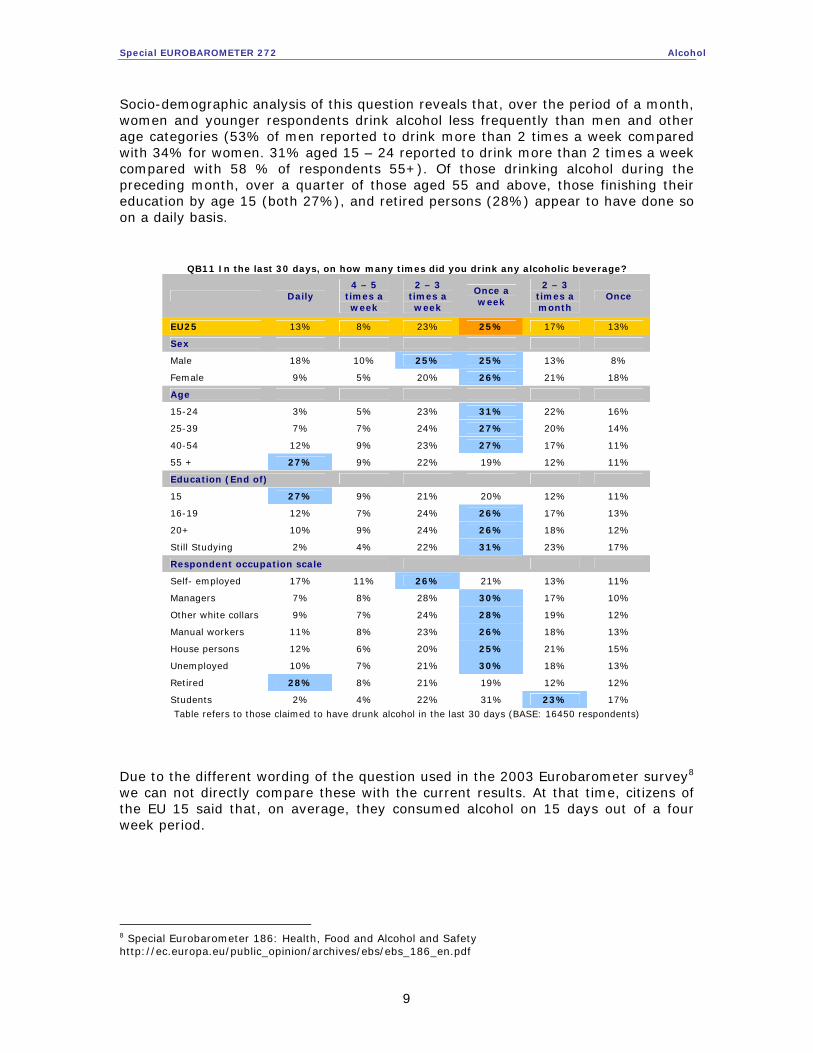
Socio-demographic analysis of this question reveals that, over the period of a month, women and younger respondents drink alcohol less frequently than men and other age categories (53% of men reported to drink more than 2 times a week compared with 34% for women. 31% aged 15 – 24 reported to drink more than 2 times a week compared with 58 % of respondents 55+). Of those drinking alcohol during the preceding month, over a quarter of those aged 55 and above, those finishing their education by age 15 (both 27%), and retired persons (28%) appear to have done so on a daily basis.
QB11 In the last 30 days, on how many times did you drink any alcoholic beverage?
Daily 4 – 5
times a week
2 – 3 times a week
Once a week
2 – 3 times a month
Once
EU25 13% 8% 23% 25% 17% 13%
Sex
Male 18% 10% 25% 25% 13% 8%
Female 9% 5% 20% 26% 21% 18%
Age
15-24 3% 5% 23% 31% 22% 16%
25-39 7% 7% 24% 27% 20% 14%
40-54 12% 9% 23% 27% 17% 11%
55 + 27% 9% 22% 19% 12% 11%
Education (End of)
15 27% 9% 21% 20% 12% 11%
16-19 12% 7% 24% 26% 17% 13%
20+ 10% 9% 24% 26% 18% 12%
Still Studying 2% 4% 22% 31% 23% 17%
Respondent occupation scale
Self- employed 17% 11% 26% 21% 13% 11%
Managers 7% 8% 28% 30% 17% 10%
Other white collars 9% 7% 24% 28% 19% 12%
Manual workers 11% 8% 23% 26% 18% 13%
House persons 12% 6% 20% 25% 21% 15%
Unemployed 10% 7% 21% 30% 18% 13%
Retired 28% 8% 21% 19% 12% 12%
Students 2% 4% 22% 31% 23% 17%
Table refers to those claimed to have drunk alcohol in the last 30 days (BASE: 16450 respondents) Due to the different wording of the question used in the 2003 Eurobarometer survey8 we can not directly compare these with the current results. At that time, citizens of the EU 15 said that, on average, they consumed alcohol on 15 days out of a four week period.
8 Special Eurobarometer 186: Health, Food and Alcohol and Safety http://ec.europa.eu/public_opinion/archives/ebs/ebs_186_en.pdf
Special EUROBAROMETER 272 Alcohol
10
1.2. Amount of alcohol consumption
- Most EU citizens usually drink 1-2 drinks at once but the– youngest interviewed reported a higher percentage of “binge drinking”
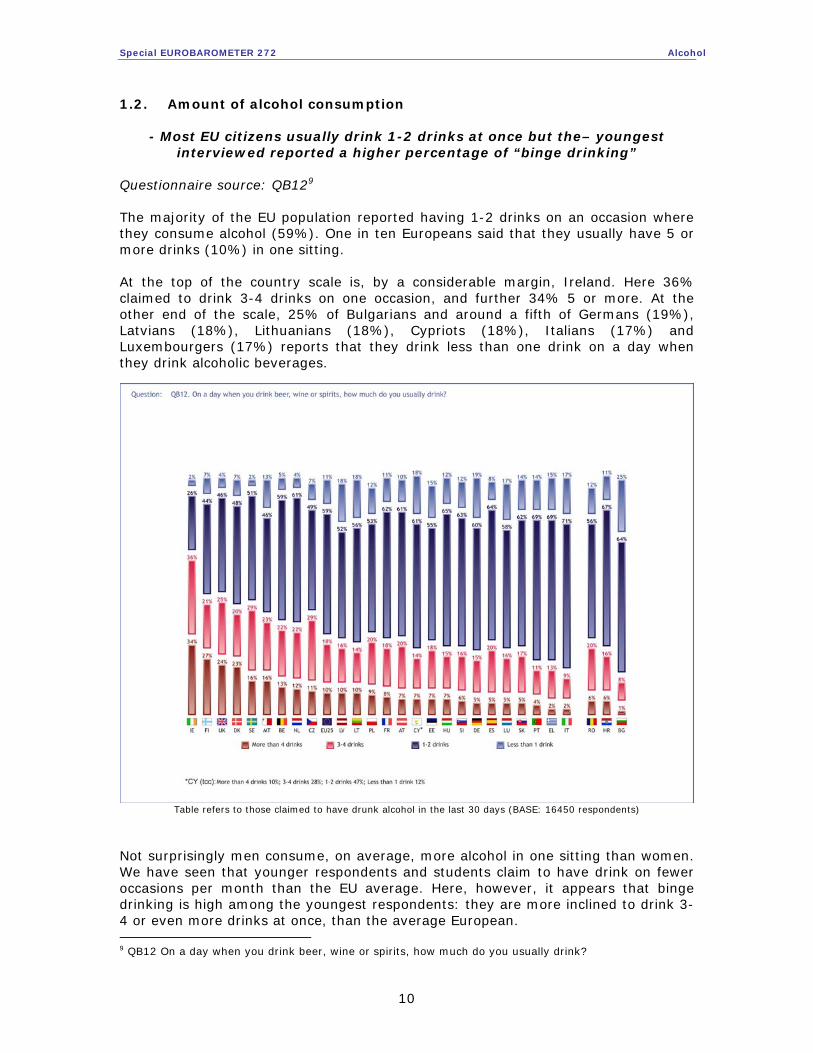
Questionnaire source: QB129 The majority of the EU population reported having 1-2 drinks on an occasion where they consume alcohol (59%). One in ten Europeans said that they usually have 5 or more drinks (10%) in one sitting. At the top of the country scale is, by a considerable margin, Ireland. Here 36% claimed to drink 3-4 drinks on one occasion, and further 34% 5 or more. At the other end of the scale, 25% of Bulgarians and around a fifth of Germans (19%), Latvians (18%), Lithuanians (18%), Cypriots (18%), Italians (17%) and Luxembourgers (17%) reports that they drink less than one drink on a day when they drink alcoholic beverages.
Table refers to those claimed to have drunk alcohol in the last 30 days (BASE: 16450 respondents)
Not surprisingly men consume, on average, more alcohol in one sitting than women. We have seen that younger respondents and students claim to have drink on fewer occasions per month than the EU average. Here, however, it appears that binge drinking is high among the youngest respondents: they are more inclined to drink 3-4 or even more drinks at once, than the average European. 9 QB12 On a day when you drink beer, wine or spirits, how much do you usually drink?
Special EUROBAROMETER 272 Alcohol
11
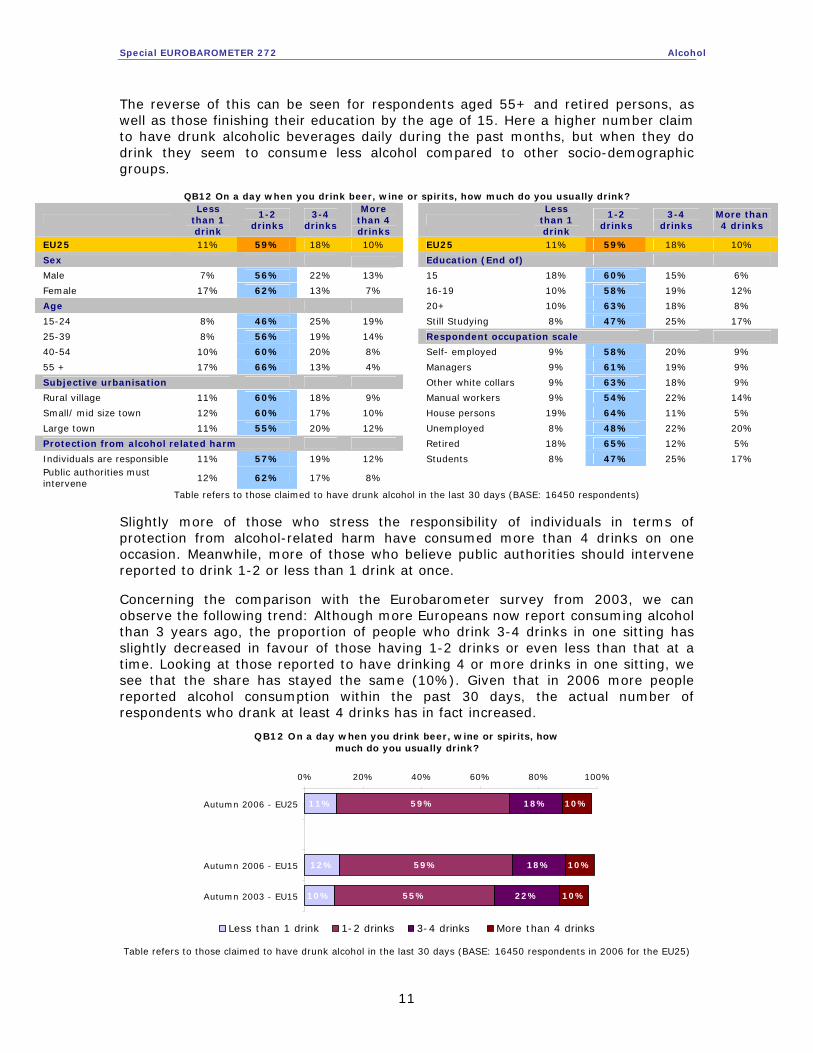
The reverse of this can be seen for respondents aged 55+ and retired persons, as well as those finishing their education by the age of 15. Here a higher number claim to have drunk alcoholic beverages daily during the past months, but when they do drink they seem to consume less alcohol compared to other socio-demographic groups.
QB12 On a day when you drink beer, wine or spirits, how much do you usually drink?
Less
than 1 drink
1-2 drinks
3-4 drinks
More than 4 drinks
Less
than 1 drink
1-2 drinks
3-4 drinks
More than 4 drinks
EU25 11% 59% 18% 10% EU25 11% 59% 18% 10%
Sex Education (End of)
Male 7% 56% 22% 13% 15 18% 60% 15% 6%
Female 17% 62% 13% 7% 16-19 10% 58% 19% 12%
Age 20+ 10% 63% 18% 8%
15-24 8% 46% 25% 19% Still Studying 8% 47% 25% 17%
25-39 8% 56% 19% 14% Respondent occupation scale
40-54 10% 60% 20% 8% Self- employed 9% 58% 20% 9%
55 + 17% 66% 13% 4% Managers 9% 61% 19% 9%
Subjective urbanisation Other white collars 9% 63% 18% 9%
Rural village 11% 60% 18% 9% Manual workers 9% 54% 22% 14%
Small/ mid size town 12% 60% 17% 10% House persons 19% 64% 11% 5%
Large town 11% 55% 20% 12% Unemployed 8% 48% 22% 20%
Protection from alcohol related harm Retired 18% 65% 12% 5%
Individuals are responsible 11% 57% 19% 12% Students 8% 47% 25% 17% Public authorities must intervene 12% 62% 17% 8%
Table refers to those claimed to have drunk alcohol in the last 30 days (BASE: 16450 respondents) Slightly more of those who stress the responsibility of individuals in terms of protection from alcohol-related harm have consumed more than 4 drinks on one occasion. Meanwhile, more of those who believe public authorities should intervene reported to drink 1-2 or less than 1 drink at once. Concerning the comparison with the Eurobarometer survey from 2003, we can observe the following trend: Although more Europeans now report consuming alcohol than 3 years ago, the proportion of people who drink 3-4 drinks in one sitting has slightly decreased in favour of those having 1-2 drinks or even less than that at a time. Looking at those reported to have drinking 4 or more drinks in one sitting, we see that the share has stayed the same (10%). Given that in 2006 more people reported alcohol consumption within the past 30 days, the actual number of respondents who drank at least 4 drinks has in fact increased.
QB12 On a day when you drink beer, wine or spirits, how much do you usually drink?
11%
12%
10%
59%
59%
55%
18%
18%
22%
10%
10%
10%
0% 20% 40% 60% 80% 100%
Autumn 2006 - EU25
Autumn 2006 - EU15
Autumn 2003 - EU15
Less than 1 drink 1-2 drinks 3-4 drinks More than 4 drinks
Table refers to those claimed to have drunk alcohol in the last 30 days (BASE: 16450 respondents in 2006 for the EU25)
Special EUROBAROMETER 272 Alcohol
12
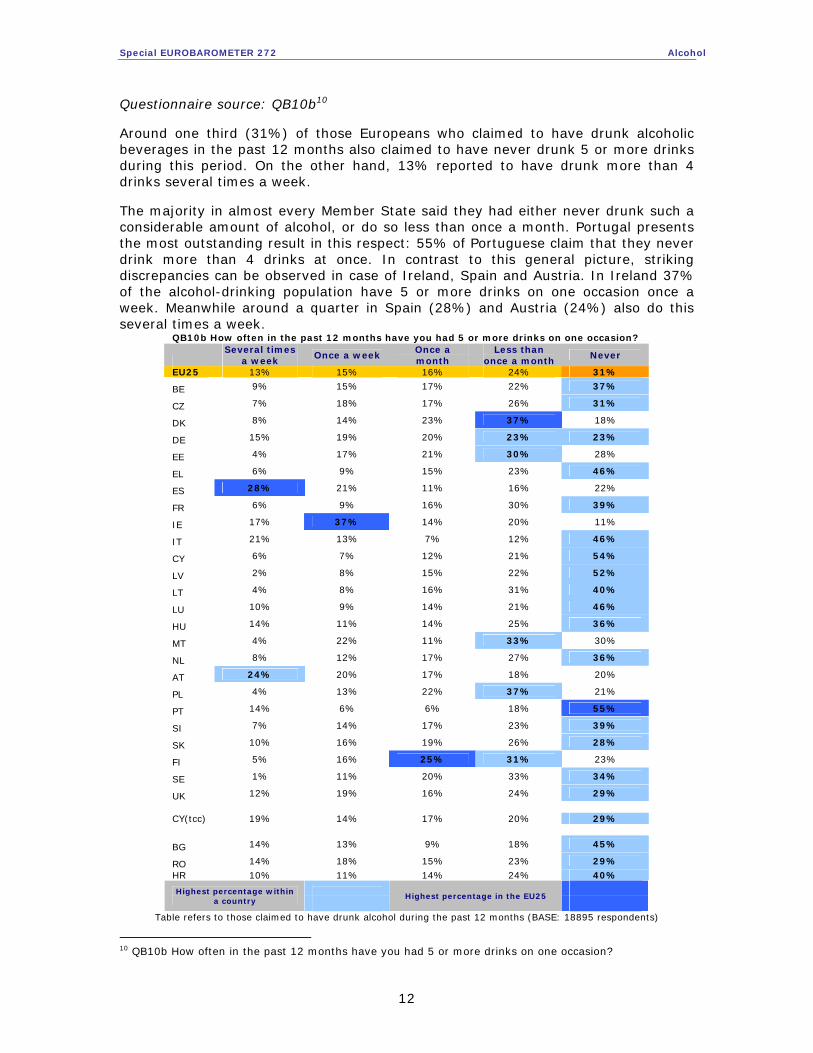
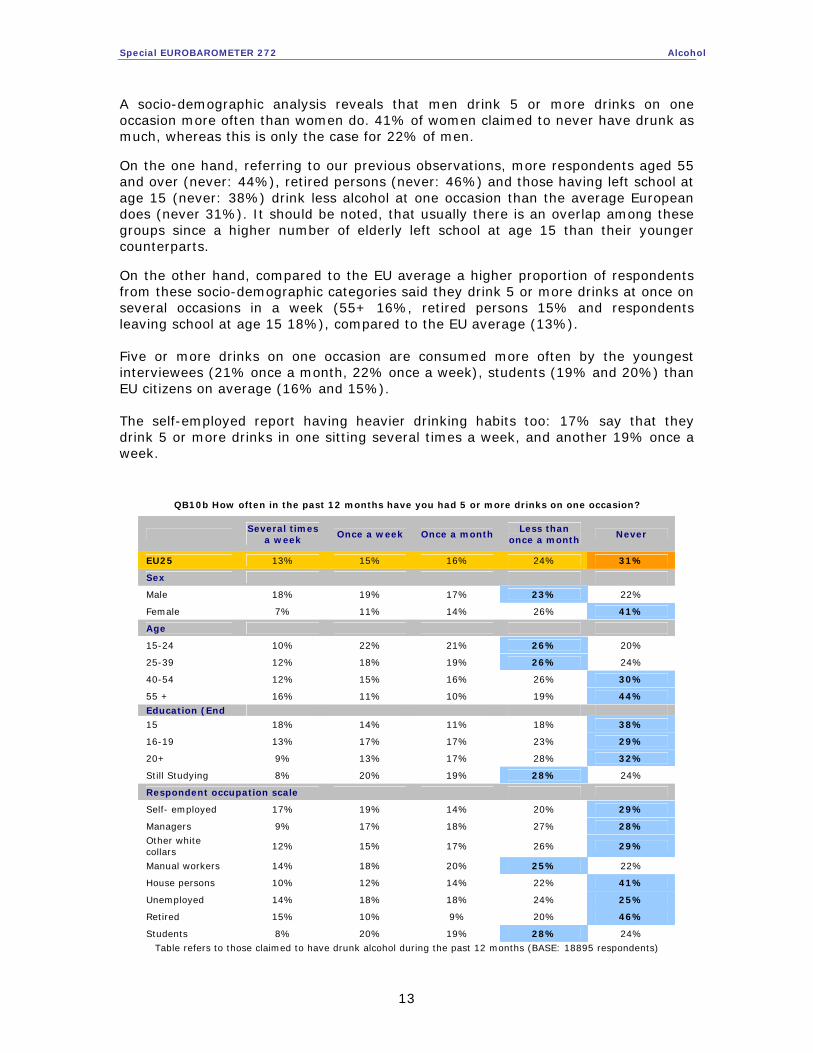
Questionnaire source: QB10b10 Around one third (31%) of those Europeans who claimed to have drunk alcoholic beverages in the past 12 months also claimed to have never drunk 5 or more drinks during this period. On the other hand, 13% reported to have drunk more than 4 drinks several times a week. The majority in almost every Member State said they had either never drunk such a considerable amount of alcohol, or do so less than once a month. Portugal presents the most outstanding result in this respect: 55% of Portuguese claim that they never drink more than 4 drinks at once. In contrast to this general picture, striking discrepancies can be observed in case of Ireland, Spain and Austria. In Ireland 37% of the alcohol-drinking population have 5 or more drinks on one occasion once a week. Meanwhile around a quarter in Spain (28%) and Austria (24%) also do this several times a week.
QB10b How often in the past 12 months have you had 5 or more drinks on one occasion?
Several times
a week Once a week
Once a month
Less than once a month
Never
EU25 13% 15% 16% 24% 31%
BE 9% 15% 17% 22% 37%
CZ 7% 18% 17% 26% 31%
DK 8% 14% 23% 37% 18%
DE 15% 19% 20% 23% 23%
EE 4% 17% 21% 30% 28%
EL 6% 9% 15% 23% 46%
ES 28% 21% 11% 16% 22%
FR 6% 9% 16% 30% 39%
IE 17% 37% 14% 20% 11%
IT 21% 13% 7% 12% 46%
CY 6% 7% 12% 21% 54%
LV 2% 8% 15% 22% 52%
LT 4% 8% 16% 31% 40%
LU 10% 9% 14% 21% 46%
HU 14% 11% 14% 25% 36%
MT 4% 22% 11% 33% 30%
NL 8% 12% 17% 27% 36%
AT 24% 20% 17% 18% 20%
PL 4% 13% 22% 37% 21%
PT 14% 6% 6% 18% 55%
SI 7% 14% 17% 23% 39%
SK 10% 16% 19% 26% 28%
FI 5% 16% 25% 31% 23%
SE 1% 11% 20% 33% 34%
UK 12% 19% 16% 24% 29%
CY(tcc) 19% 14% 17% 20% 29%
BG 14% 13% 9% 18% 45%
RO 14% 18% 15% 23% 29%
HR 10% 11% 14% 24% 40%
Highest percentage within a country
Highest percentage in the EU25
Table refers to those claimed to have drunk alcohol during the past 12 months (BASE: 18895 respondents)
10 QB10b How often in the past 12 months have you had 5 or more drinks on one occasion?
Special EUROBAROMETER 272 Alcohol
13
A socio-demographic analysis reveals that men drink 5 or more drinks on one occasion more often than women do. 41% of women claimed to never have drunk as much, whereas this is only the case for 22% of men. On the one hand, referring to our previous observations, more respondents aged 55 and over (never: 44%), retired persons (never: 46%) and those having left school at age 15 (never: 38%) drink less alcohol at one occasion than the average European does (never 31%). It should be noted, that usually there is an overlap among these groups since a higher number of elderly left school at age 15 than their younger counterparts. On the other hand, compared to the EU average a higher proportion of respondents from these socio-demographic categories said they drink 5 or more drinks at once on several occasions in a week (55+ 16%, retired persons 15% and respondents leaving school at age 15 18%), compared to the EU average (13%). Five or more drinks on one occasion are consumed more often by the youngest interviewees (21% once a month, 22% once a week), students (19% and 20%) than EU citizens on average (16% and 15%). The self-employed report having heavier drinking habits too: 17% say that they drink 5 or more drinks in one sitting several times a week, and another 19% once a week.
QB10b How often in the past 12 months have you had 5 or more drinks on one occasion?
Several times
a week Once a week Once a month
Less than once a month
Never
EU25 13% 15% 16% 24% 31%
Sex
Male 18% 19% 17% 23% 22%
Female 7% 11% 14% 26% 41%
Age
15-24 10% 22% 21% 26% 20%
25-39 12% 18% 19% 26% 24%
40-54 12% 15% 16% 26% 30%
55 + 16% 11% 10% 19% 44%
Education (End
15 18% 14% 11% 18% 38%
16-19 13% 17% 17% 23% 29%
20+ 9% 13% 17% 28% 32%
Still Studying 8% 20% 19% 28% 24%
Respondent occupation scale
Self- employed 17% 19% 14% 20% 29%
Managers 9% 17% 18% 27% 28%
Other white collars
12% 15% 17% 26% 29%
Manual workers 14% 18% 20% 25% 22%
House persons 10% 12% 14% 22% 41%
Unemployed 14% 18% 18% 24% 25%
Retired 15% 10% 9% 20% 46%
Students 8% 20% 19% 28% 24%
Table refers to those claimed to have drunk alcohol during the past 12 months (BASE: 18895 respondents)
Special EUROBAROMETER 272 Alcohol
14
1.3. Gender differences in alcohol consumption pattern QB10a As we have seen previously, generally more men than women reported to have drunken alcohol during the past 12 months (84% vs. 68%). In some countries remarkable gender differences have been measured that could also affect the overall country consumption pattern. For example in Portugal (52% vs. 20% of men) or Italy (51% vs. 28% of men) the majority of women claimed not to have drunk alcohol during the past 12 months, in Denmark this figure was only 10% (compared to 5% of men). In comparison the overall results for alcohol abstainers were 37% in Portugal, 40% in Italy and 7% in Denmark. QB10c Looking at alcohol consumption in the last 30 days in the EU25, we could observe that most respondents who reported to have drunk alcohol during the past year have also done so in the past 30 days (87%). Since abstainers logically were not asked this question the difference between results of men and women dropped to ten percentage points (92% vs. 82% of women). QB11 As to the frequency of drinking alcoholic beverages, men reported to drink alcohol more often during the past 30 days than women did. As we have seen previously Portugal has an outstanding proportion of respondents declaring to drink alcohol every day in the last 30 days (47% compared to 13% at the EU level). This reflects also in national results for both Portuguese men (55% vs. 18% in the EU25) and women (34% vs. 9% in the EU25). QB12 Generally speaking men drink more alcohol at once than women do: More women reported to drink less than one drink or 1-2 drinks on one occasion than men; meanwhile more men claimed to drink 3-4 or more than 4 drinks than women. National socio-demographic results in terms of gender follow the overall country trends: In countries where the general amount of alcohol consumption is lower such as in Italy (17% drank less than one drink; 71% 1-2 drinks) or in Portugal (14% drank less than one drink; 69% 1-2 drinks), a higher share of both male and female respondents claimed to drink maximum 2 drinks.11 On the other hand, in Ireland where the amount of alcohol usually consumed on one occasion is high (36% claimed to drink 3-4 drinks and further 34% more than 4 drinks), figures for both gender are high as well.12 QB10b Corresponding to the previous question the survey has shown that men drink 5 or more drinks on one occasion more often than women do. 41% of women claimed to never have drunk as much, whereas this is only the case for 22% of men. National gender related figures follow again the overall country results: Taking the two extreme examples, in Portugal 55% (46% of men and 68% of women) reported to never have drunk 5 or more drinks, meanwhile in Ireland only 11% (7% of men and 16% of women) did so.
11 In Italy 9% of men and 29% of women drank less than one drink; as well as 75% of men and 66% of women drank 1-2 drinks. In Portugal 7% of men and 26% of women drank less than one drink; as well as 69% of men and 68% of women drank 1-2 drinks. 12 In Ireland 36% of both gender drank 3-4 drinks and 44% of men and 23% of women consumed more than 4 drinks.
Special EUROBAROMETER 272 Alcohol
15
2. Responsibility for and prevention from alcohol related harm
Combating harmful and hazardous alcohol consumption in Europe is a public health priority for many Member States and at the EU level. Harmful alcohol consumption is estimated to cause the deaths of 195,000 people a year in the EU. It is a net cause of 7.4% of all ill-health and early deaths in the EU and is responsible for 1 in 4 deaths among young men aged 15-29.13 Social consequences such as violence, crime or problems in human relations need to be mentioned as well. 2.1. Who is responsible for protection from the harmful effects of alcohol
consumption?
- EU citizens are divided as to whether rather individuals are responsible enough or public authorities should intervene to protect the population from
alcohol related harm - Questionnaire source: QB1814 At the European Union level the slight majority of citizens (52%) consider individuals to be mainly responsible for protecting themselves from alcohol-related harm. A quite significant proportion of respondents (44%), however, think that public authorities have to intervene in order to protect individuals. In Slovakia (75%), the Czech Republic (70%) and Croatia (70%), the considerable majority of the population believes in the primacy of individual responsibility on this issue. At the other end of the country scale stand Hungary (57%), Italy (56%) and Spain (55%), where people have a more ‘interventionist’ view on how the state should take care of its citizens’ health.
13http://ec.europa.eu/health/ph_determinants/life_style/alcohol/alcohol_com_en.htm 14 QB18 From which of the following statements do you feel the closest? - Individuals are responsible enough to protect themselves from alcohol related harm - Public authorities have to intervene in order to protect individuals from alcohol related harm

Special EUROBAROMETER 272 Alcohol
16
Men (54% vs. 42%), the youngest respondents (59% vs. 37%) and students (55% vs. 41%) are slightly more in favour of individual responsibility than other socio-demographic groups. This is also true of manual workers (56% vs. 41%) and unemployed persons (55% vs. 41%). Managers (48% vs. 48%), respondents educated to the highest level (48% vs. 49%), house persons (47% vs. 49%) and respondents aged 55 and above (49% vs. 47%) are divided equally on this matter. Cross-tabulated results suggest that those who consumed alcohol in the past 12 months tend more to emphasise the responsibility of individuals in protecting themselves from alcohol related harm (55% vs. 42%). We can also observe here, that the more drinks respondents drink on one occasion, the more they believe it is the responsibility of individuals to protect themselves from alcohol related harm. Conversely, those who have not drunk alcoholic beverages in the past year are more inclined to empower public authorities to protect citizens from the detrimental consequences of alcohol consumption (52% vs. 42%). Furthermore, the fewer drinks respondents drink on one occasion the more they are convinced that public authorities should intervene.
QB12 On a day when you drink beer, wine or spirits, how much do you usually drink? AND QB18 Which of the following statements do you feel the closest?
EU25 Less than
1 drink 1-2
drinks 3-4
drinks 5-6
drinks 7-9
drinks
10 or more drinks
Protection from alcohol related harm
Individuals are responsible 52% 50% 53% 57% 65% 64% 65%
Public authorities must intervene 44% 46% 44% 40% 32% 34% 31%

Special EUROBAROMETER 272 Alcohol
17
2.2. Does price influence alcohol-drinking habits?
- Respondents in general report that they would not be sensitive to price changes - although younger respondents are more likely to say they would
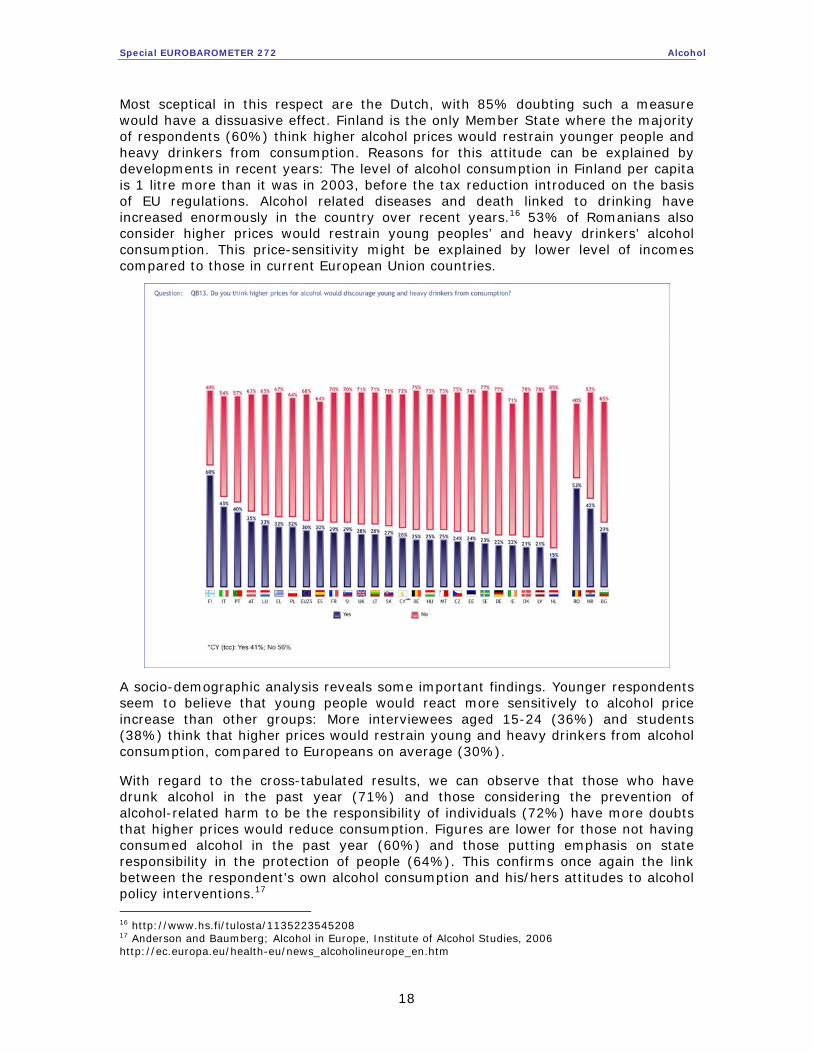
buy less alcohol if prices increase - Questionnaire source: QB1315 Two thirds of the European Union population (68%) believe that higher prices for alcohol would not discourage young people and heavy drinkers from consumption.
15 QB13 Do you think higher prices for alcohol would discourage young and heavy drinkers from consumption?
Special EUROBAROMETER 272 Alcohol
18
Most sceptical in this respect are the Dutch, with 85% doubting such a measure would have a dissuasive effect. Finland is the only Member State where the majority of respondents (60%) think higher alcohol prices would restrain younger people and heavy drinkers from consumption. Reasons for this attitude can be explained by developments in recent years: The level of alcohol consumption in Finland per capita is 1 litre more than it was in 2003, before the tax reduction introduced on the basis of EU regulations. Alcohol related diseases and death linked to drinking have increased enormously in the country over recent years.16 53% of Romanians also consider higher prices would restrain young peoples’ and heavy drinkers’ alcohol consumption. This price-sensitivity might be explained by lower level of incomes compared to those in current European Union countries.
A socio-demographic analysis reveals some important findings. Younger respondents seem to believe that young people would react more sensitively to alcohol price increase than other groups: More interviewees aged 15-24 (36%) and students (38%) think that higher prices would restrain young and heavy drinkers from alcohol consumption, compared to Europeans on average (30%). With regard to the cross-tabulated results, we can observe that those who have drunk alcohol in the past year (71%) and those considering the prevention of alcohol-related harm to be the responsibility of individuals (72%) have more doubts that higher prices would reduce consumption. Figures are lower for those not having consumed alcohol in the past year (60%) and those putting emphasis on state responsibility in the protection of people (64%). This confirms once again the link between the respondent’s own alcohol consumption and his/hers attitudes to alcohol policy interventions.17 16 http://www.hs.fi/tulosta/1135223545208 17 Anderson and Baumberg; Alcohol in Europe, Institute of Alcohol Studies, 2006 http://ec.europa.eu/health-eu/news_alcoholineurope_en.htm

Special EUROBAROMETER 272 Alcohol
19
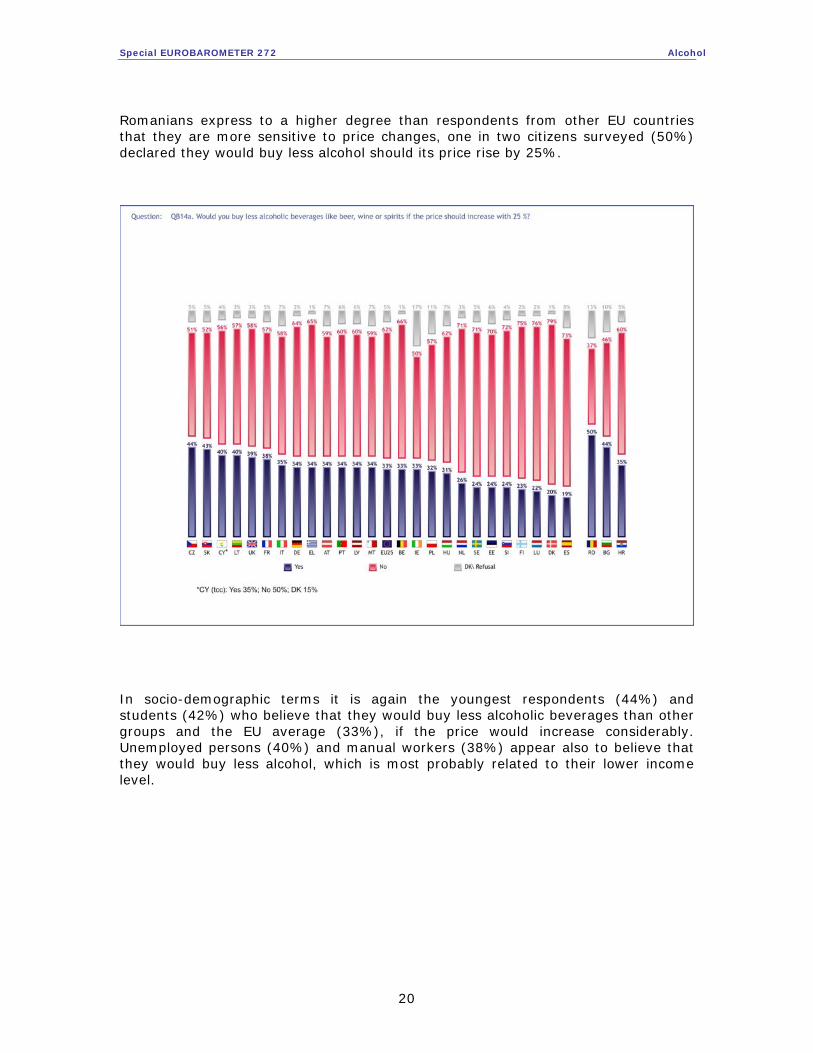
Questionnaire source: QB14a18 Similar to the results we have seen for the previous question, around two thirds of EU citizens (62%), believed that they would not to buy less alcoholic beverages should the price increase by 25%. Although, one third of respondents (33%) claimed they would purchase less alcohol in case of such a price increase.19
18 QB14a Would you buy less alcoholic beverages like beer, wine or spirits if the price should increase with 25 %? 19 For further information on this topic and on real behavioural changes related to price increases see: Anderson and Baumberg; Alcohol in Europe, Institute of Alcohol Studies, 2006 http://ec.europa.eu/health-eu/news_alcoholineurope_en.htm
Special EUROBAROMETER 272 Alcohol
20
Romanians express to a higher degree than respondents from other EU countries that they are more sensitive to price changes, one in two citizens surveyed (50%) declared they would buy less alcohol should its price rise by 25%.
In socio-demographic terms it is again the youngest respondents (44%) and students (42%) who believe that they would buy less alcoholic beverages than other groups and the EU average (33%), if the price would increase considerably. Unemployed persons (40%) and manual workers (38%) appear also to believe that they would buy less alcohol, which is most probably related to their lower income level.

Special EUROBAROMETER 272 Alcohol
21
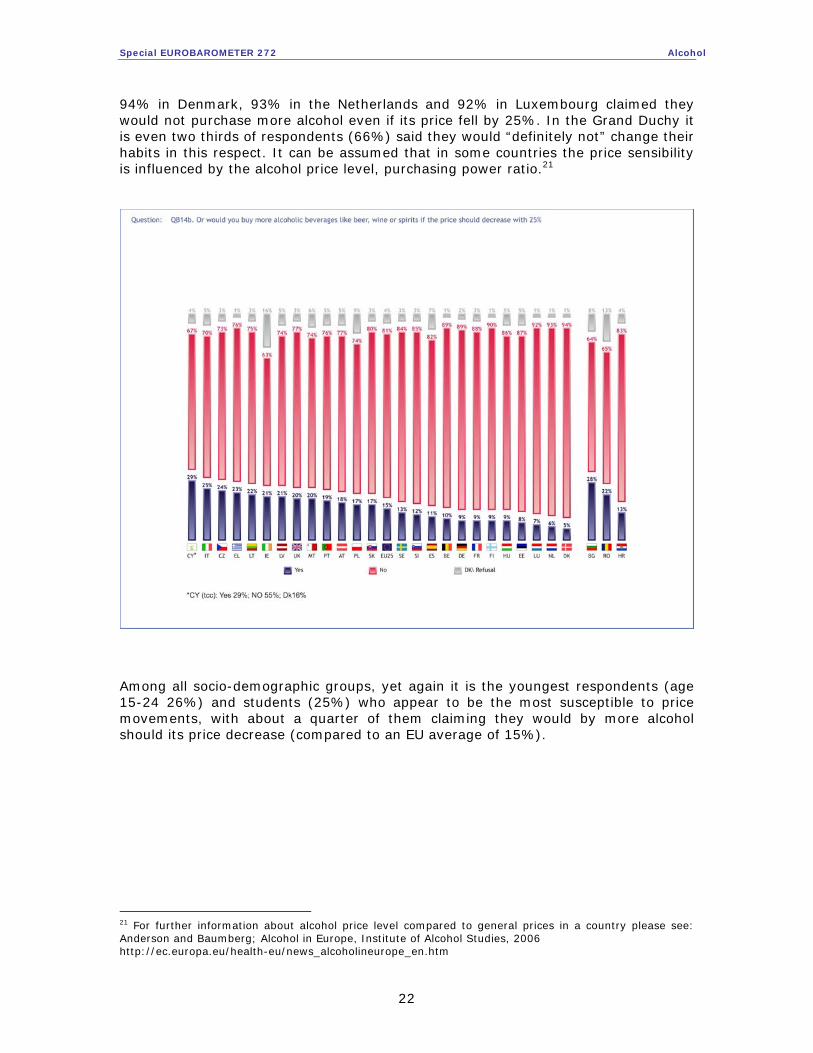
Questionnaire source: QB14b20 It is not surprising that over eight in ten respondents (81%) would not buy more alcoholic beverages should the price decrease by 25%. This figure represents a difference of 19 percentage points of interviewees who would not change their alcohol drinking habits compared to the previously seen figure for an increase in price.
20 QB14b Or would you buy more alcoholic beverages like beer, wine or spirits if the price should decrease with 25%?
Special EUROBAROMETER 272 Alcohol
22
94% in Denmark, 93% in the Netherlands and 92% in Luxembourg claimed they would not purchase more alcohol even if its price fell by 25%. In the Grand Duchy it is even two thirds of respondents (66%) said they would “definitely not” change their habits in this respect. It can be assumed that in some countries the price sensibility is influenced by the alcohol price level, purchasing power ratio.21
Among all socio-demographic groups, yet again it is the youngest respondents (age 15-24 26%) and students (25%) who appear to be the most susceptible to price movements, with about a quarter of them claiming they would by more alcohol should its price decrease (compared to an EU average of 15%).
21 For further information about alcohol price level compared to general prices in a country please see: Anderson and Baumberg; Alcohol in Europe, Institute of Alcohol Studies, 2006 http://ec.europa.eu/health-eu/news_alcoholineurope_en.htm
Special EUROBAROMETER 272 Alcohol
23
2.3. EU citizens’ view on warnings on alcohol bottles and adverts - Across the Union, broad support for warning pregnant women and drivers
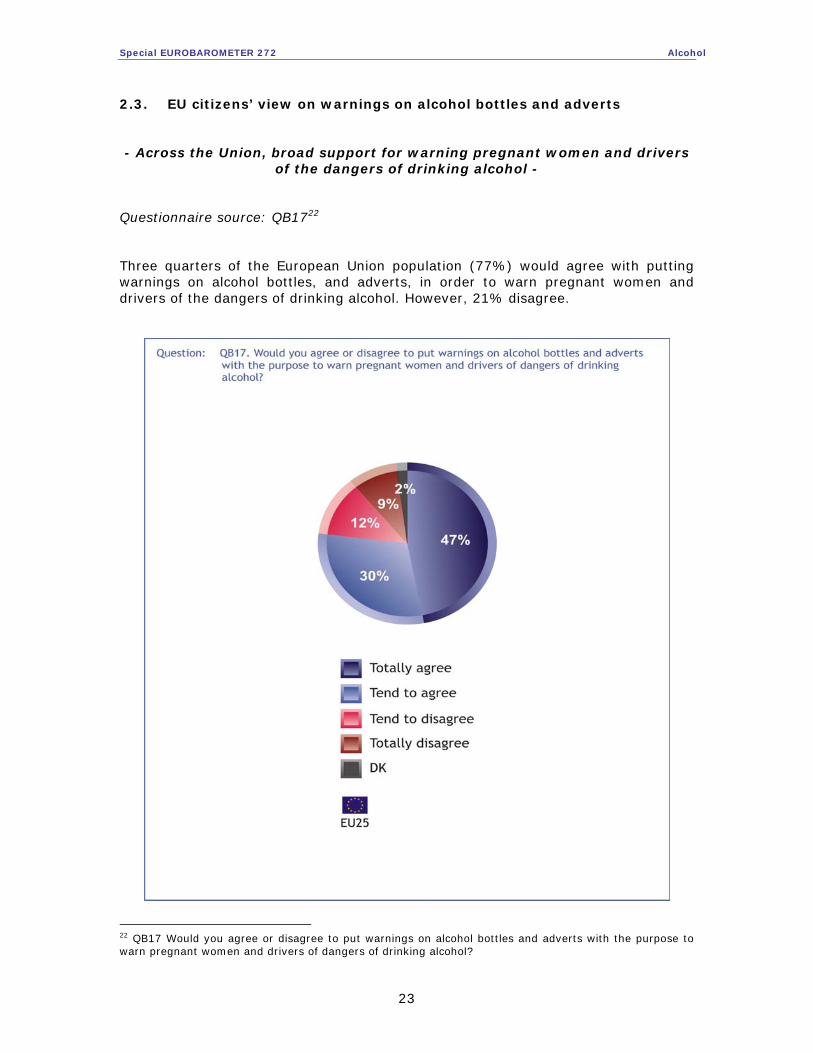
of the dangers of drinking alcohol - Questionnaire source: QB1722 Three quarters of the European Union population (77%) would agree with putting warnings on alcohol bottles, and adverts, in order to warn pregnant women and drivers of the dangers of drinking alcohol. However, 21% disagree.
22 QB17 Would you agree or disagree to put warnings on alcohol bottles and adverts with the purpose to warn pregnant women and drivers of dangers of drinking alcohol?

Special EUROBAROMETER 272 Alcohol
24
In all countries surveyed, the majority of respondents would support such a concept. However, sizable opposition to warnings has been measured in Finland (45%), Denmark (41%) and the Netherlands (38%).
Socio-demographic analysis also suggests that public opinion is quite homogenous on this question. Cross-tabulations reveal that alcohol consumers (75%) and those considering the protection from alcohol related harm to be the responsibility of individuals (72%) are less supportive of putting warnings on bottles and adverts. On the contrary, those not having drunk alcohol in the past 12 months (83%) and those who think public authorities have to intervene to protect individuals from alcohol-related harm (84%) show, logically, more support for this initiative.

Special EUROBAROMETER 272 Alcohol
25
3. Alcohol consumption and special groups Driving whilst under the influence of alcohol continues to be an important cause of road traffic crashes, contributing annually to at least 10000 fatalities on EU roads.23 BAC is the allowed level of alcohol in blood of drivers. It is usually measured in g/l or mg/ml. At BAC levels between 0.5 to 0.8 pro mille, the risk of drivers being involved in an accident is, on average, more than twice that of a sober driver. For some drivers the risk is more than ten times higher at 0.8 than at 0.5. There is wide agreement amongst medical and professional experts that a BAC of 0.5 pro mille is the highest level that should be permitted. 24 In the framework of a proposed action programme relating to public health (2001-2006), alcohol is pinpointed as an area needing specific action on road safety. The European Commission recommends two different BAC within the Community. They will be applied in accordance with the criteria for drivers and vehicles: The standard BAC for all motor vehicle drivers which should be adopted by all of the Member States is one not exceeding 0.5 g/l. At the moment most of the Member States have already adopted that BAC limit. In addition a second BAC of 0.2 g/l is recommended for certain types of driver and vehicle, namely: inexperienced drivers, motorcyclists, drivers of large vehicles and drivers of vehicles carrying dangerous goods.25 In the newly adopted (24 October 2006) Commission Communication on an EU alcohol strategy the Commission invites the Member States to even consider a zero BAC limit for young and novice drivers and drivers of public transports and dangerous goods.26 3.1. Alcohol consumption and drivers - Many respondents are not well-informed about the permitted blood alcohol limit (BAC) in their country, however EU citizens would favour lower BAC for
young and novice drivers and random police alcohol checks on EU roads - Questionnaire source: QB15a27 At the European Union level particular attention should be given to two findings: Firstly, 51% of the EU population appear to know that the maximum legal blood alcohol level for drivers is between 0.01 and 0.59 g/l, which is indeed the case in 19 Member States. Secondly, 36% of respondents admitted they “don’t know” what is the current BAC in their country. As indicated above, in most countries the legal blood alcohol level is a maximum of 0.5g/l. In three countries it is forbidden to drive even after one single drink (0.0 g/l):
23 http://eur-lex.europa.eu/LexUriServ/site/en/com/2006/com2006_0625en01.pdf 24 http://www.etsc.be/documents/blood%20alcohol%20limit.pdf 25 http://europa.eu/scadplus/leg/en/cha/c11566.htm 26 Communication from the Commission to the Council, the European Parliament, the European Economic and Social Committee and the Committee of the Regions, An EU strategy to support Member States in reducing alcohol related harm COM(2006)625 http://eur-lex.europa.eu/LexUriServ/site/en/com/2006/com2006_0625en01.pdf 27 QB15a What is the legal blood alcohol level (BAC) allowed for car drivers in (OUR COUNTRY)?

Special EUROBAROMETER 272 Alcohol
26
In the Czech Republic (75%), Slovakia (57%) the population is more aware of this limit, in Hungary (39%), however, a bit less. In Malta (0.9 g/l), the UK (0.8 g/l) and Ireland (0.8 g/l) the BAC is above the recommended level. Respondents in these countries are extremely uniformed about the allowed alcohol level in blood while driving; 96% in Malta, 70% in the UK and 66% in Ireland replied “don’t know” to this question. The “don’t know” rate is also fairly high in Cyprus (77%), Romania (76%), Italy (74%), Bulgaria (68%), the Turkish Cypriot Community (68%), Spain (59%) and Greece (49%). Several explanations are conceivable for this lack of knowledge: Firstly, respondents might have difficulties in understanding the exact measurement; secondly, information is generally not easily available about BAC; thirdly in the recent years limits have been changed in many countries, and people seem to have missed these alterations.
QB15a What is the legal blood alcohol level (BAC) allowed for car drivers in (OUR COUNTRY)?
00.00 g/l
0.01 – 0.59 g/l
0.60 - 1 g/l
More than 1 g/l
DK BAC allowed in the country g/l
EU25 6% 51% 4% 3% 36%
BE - 73% 3% 4% 20% 0.5
CZ 75% 11% - - 14% 0
DK - 77% 10% 2% 11% 0.5
DE 4% 86% 2% 2% 6% 0.5
EE 53% 19% 2% 10% 16% 0.2
EL - 44% 7% - 49% 0.5
ES - 36% 3% 2% 59% 0.5
FR 2% 77% 10% 3% 8% 0.5
IE 1% 33% - - 66% 0.8
IT 2% 18% 2% 4% 74% 0.5
CY - 23% - - 77% 0.22
LV - 60% 2% 3% 35% 0.5
LT 3% 60% 1% 3% 33% 0.4
LU 2% 18% 60% 1% 19% 0.5
HU 39% 28% 1% - 32% 0
MT - 2% - 2% 96% 0.9
NL 1% 58% 2% 11% 28% 0.5
AT 3% 88% 1% 1% 7% 0.5
PL 9% 61% 1% 2% 27% 0.2
PT - 54% 4% 5% 37% 0.5
SI 5% 82% 1% - 12% 0.5
SK 57% 18% - - 25% 0
FI 2% 74% 3% 7% 14% 0.5
SE 10% 72% 2% 1% 15% 0.2
UK - 19% 9% 2% 70% 0.8 CY (tcc) - 21% 10% 1% 68%
BG 1% 28% 1% 2% 68%
RO 3% 14% 7% - 76%
HR 89% 5% - - 6%
Highest percentage within a country

Special EUROBAROMETER 272 Alcohol
27
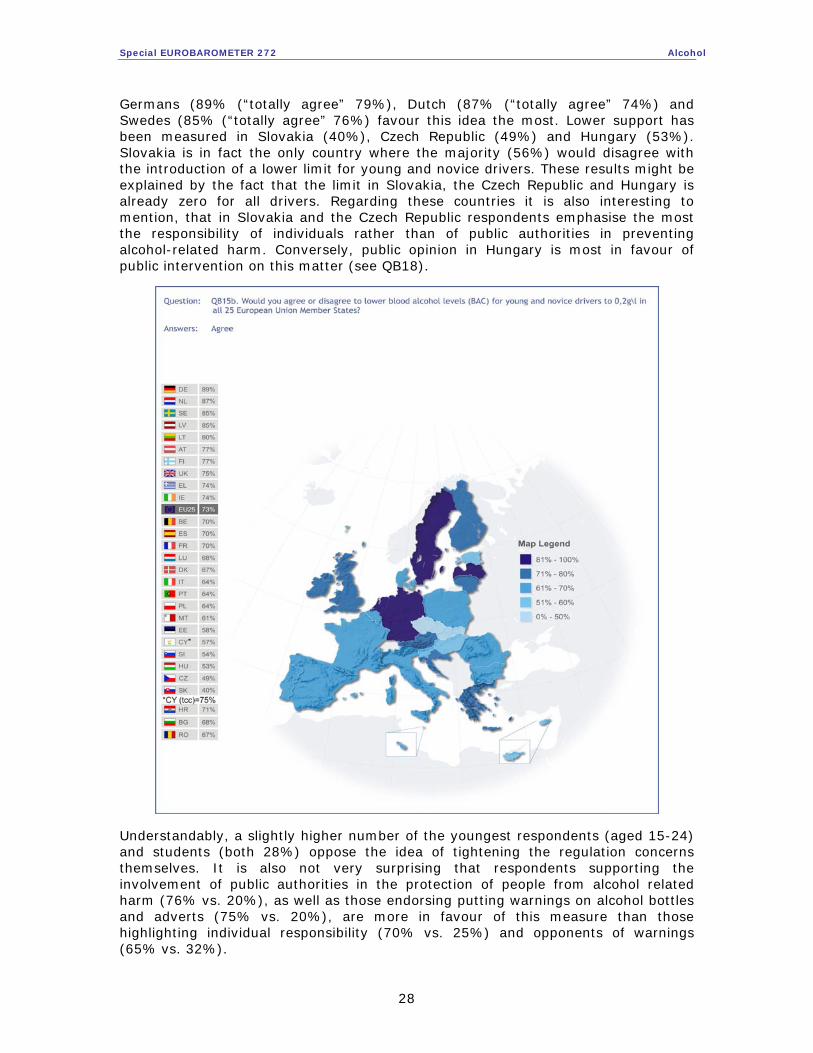
A higher proportion of “don’t know” replies has been measured in the following socio-demographic groups: women (43%), respondents aged 55 and over (44%), respondents finishing their full time education by age 15 (51%), house persons (53%), retired persons (42%), inhabitants of large towns (41%) and those who do not drink alcohol(52%). Questionnaire source: QB15b28 Almost three quarters of Europeans surveyed (73%) would agree to a lower blood alcohol level for young and novice drivers of 0.2 g/l. Moreover 51% responded even “totally agree” to this inquiry.
28 QB15b Would you agree or disagree to lower blood alcohol levels (BAC) for young and novice drivers to 0.2g\l in all 25 European Union Member States?
Special EUROBAROMETER 272 Alcohol
28
Germans (89% (“totally agree” 79%), Dutch (87% (“totally agree” 74%) and Swedes (85% (“totally agree” 76%) favour this idea the most. Lower support has been measured in Slovakia (40%), Czech Republic (49%) and Hungary (53%). Slovakia is in fact the only country where the majority (56%) would disagree with the introduction of a lower limit for young and novice drivers. These results might be explained by the fact that the limit in Slovakia, the Czech Republic and Hungary is already zero for all drivers. Regarding these countries it is also interesting to mention, that in Slovakia and the Czech Republic respondents emphasise the most the responsibility of individuals rather than of public authorities in preventing alcohol-related harm. Conversely, public opinion in Hungary is most in favour of public intervention on this matter (see QB18).
Understandably, a slightly higher number of the youngest respondents (aged 15-24) and students (both 28%) oppose the idea of tightening the regulation concerns themselves. It is also not very surprising that respondents supporting the involvement of public authorities in the protection of people from alcohol related harm (76% vs. 20%), as well as those endorsing putting warnings on alcohol bottles and adverts (75% vs. 20%), are more in favour of this measure than those highlighting individual responsibility (70% vs. 25%) and opponents of warnings (65% vs. 32%).
Special EUROBAROMETER 272 Alcohol
29
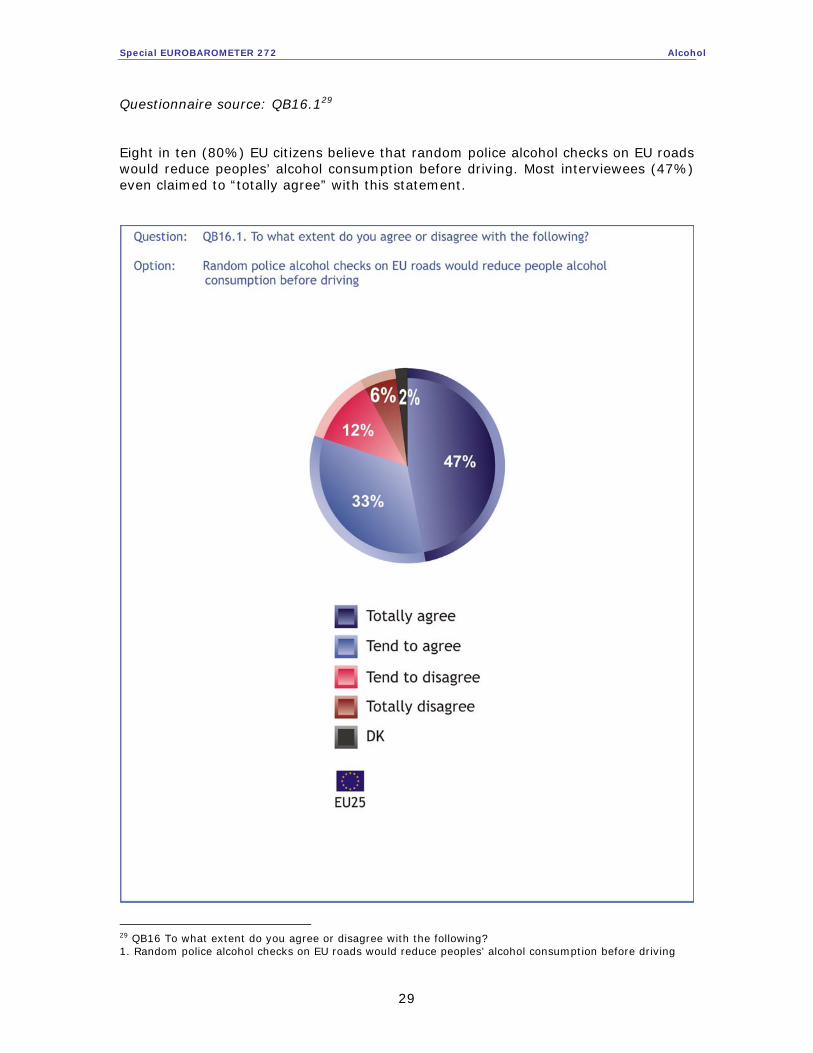
Questionnaire source: QB16.129 Eight in ten (80%) EU citizens believe that random police alcohol checks on EU roads would reduce peoples’ alcohol consumption before driving. Most interviewees (47%) even claimed to “totally agree” with this statement.
29 QB16 To what extent do you agree or disagree with the following? 1. Random police alcohol checks on EU roads would reduce peoples’ alcohol consumption before driving
Special EUROBAROMETER 272 Alcohol
30
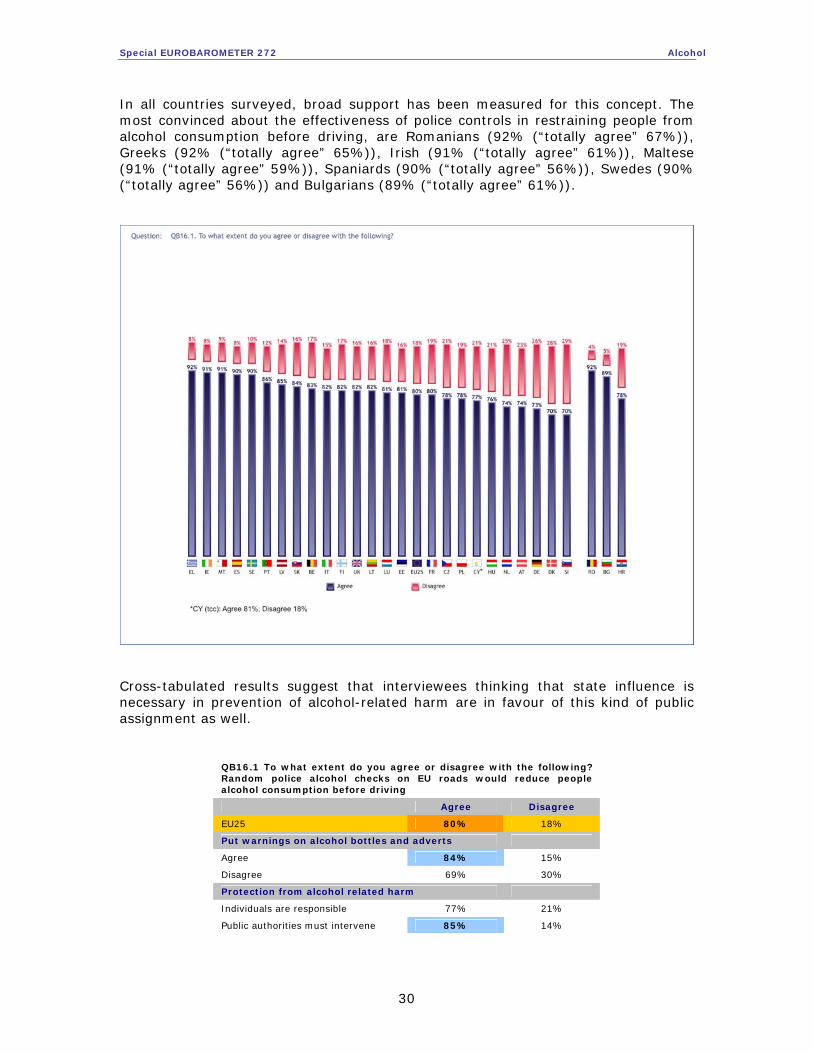
In all countries surveyed, broad support has been measured for this concept. The most convinced about the effectiveness of police controls in restraining people from alcohol consumption before driving, are Romanians (92% (“totally agree” 67%)), Greeks (92% (“totally agree” 65%)), Irish (91% (“totally agree” 61%)), Maltese (91% (“totally agree” 59%)), Spaniards (90% (“totally agree” 56%)), Swedes (90% (“totally agree” 56%)) and Bulgarians (89% (“totally agree” 61%)).
Cross-tabulated results suggest that interviewees thinking that state influence is necessary in prevention of alcohol-related harm are in favour of this kind of public assignment as well.
QB16.1 To what extent do you agree or disagree with the following? Random police alcohol checks on EU roads would reduce people alcohol consumption before driving
Agree Disagree
EU25 80% 18%
Put warnings on alcohol bottles and adverts
Agree 84% 15%
Disagree 69% 30%
Protection from alcohol related harm
Individuals are responsible 77% 21%
Public authorities must intervene 85% 14%

Special EUROBAROMETER 272 Alcohol
31
3.2. Alcohol consumption and young people - European public opinion strongly supports measures keeping young people
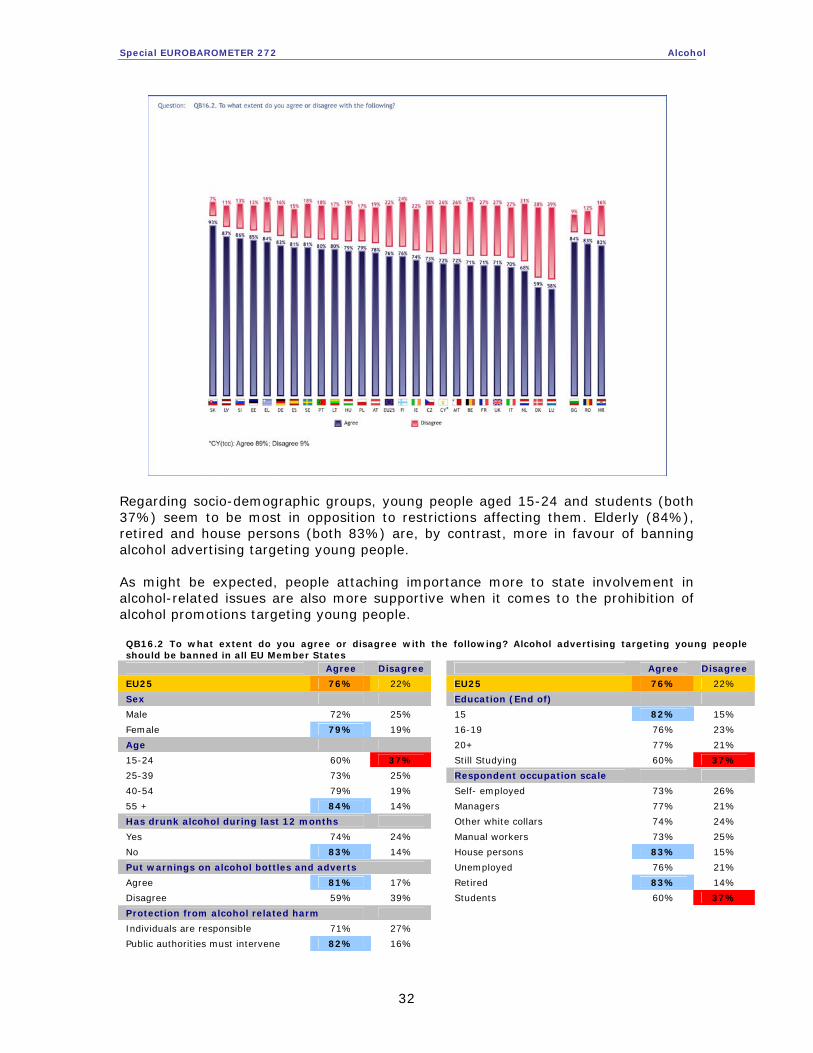
back from alcohol consumption - Questionnaire source: QB16.230 76% of the European Union population would approve the banning of alcohol advertising targeting young people in all Member States. Every second respondent (50%) said that they “agree totally” with this idea.
A country-by–country analysis shows that in all polled countries the majority of respondents would favour such a ban. Slovakians stand out as being among the most ardent supporters (93% (“totally agree” 68%)), meanwhile Luxembourgers (58% (“totally agree” 41%)) and Danes (59% (“totally agree” 37%)) seem to be the least committed in this respect.
30 QB16 To what extent do you agree or disagree with the following? 2. Alcohol advertising targeting young people should be banned in all EU Member States
Special EUROBAROMETER 272 Alcohol
32
Regarding socio-demographic groups, young people aged 15-24 and students (both 37%) seem to be most in opposition to restrictions affecting them. Elderly (84%), retired and house persons (both 83%) are, by contrast, more in favour of banning alcohol advertising targeting young people. As might be expected, people attaching importance more to state involvement in alcohol-related issues are also more supportive when it comes to the prohibition of alcohol promotions targeting young people. QB16.2 To what extent do you agree or disagree with the following? Alcohol advertising targeting young people should be banned in all EU Member States Agree Disagree Agree Disagree
EU25 76% 22% EU25 76% 22%
Sex Education (End of)
Male 72% 25% 15 82% 15%
Female 79% 19% 16-19 76% 23%
Age 20+ 77% 21%
15-24 60% 37% Still Studying 60% 37%
25-39 73% 25% Respondent occupation scale
40-54 79% 19% Self- employed 73% 26%
55 + 84% 14% Managers 77% 21%
Has drunk alcohol during last 12 months Other white collars 74% 24%
Yes 74% 24% Manual workers 73% 25%
No 83% 14% House persons 83% 15%
Put warnings on alcohol bottles and adverts Unemployed 76% 21%
Agree 81% 17% Retired 83% 14%
Disagree 59% 39% Students 60% 37%
Protection from alcohol related harm Individuals are responsible 71% 27% Public authorities must intervene 82% 16%
Special EUROBAROMETER 272 Alcohol
33
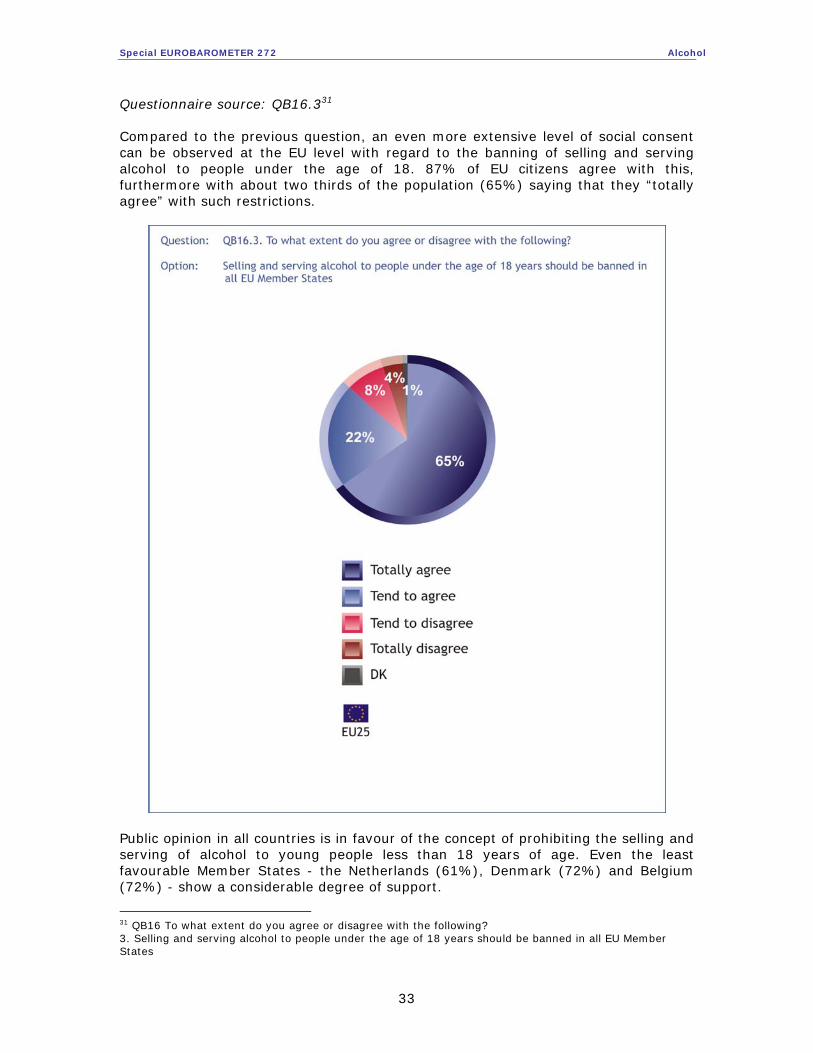
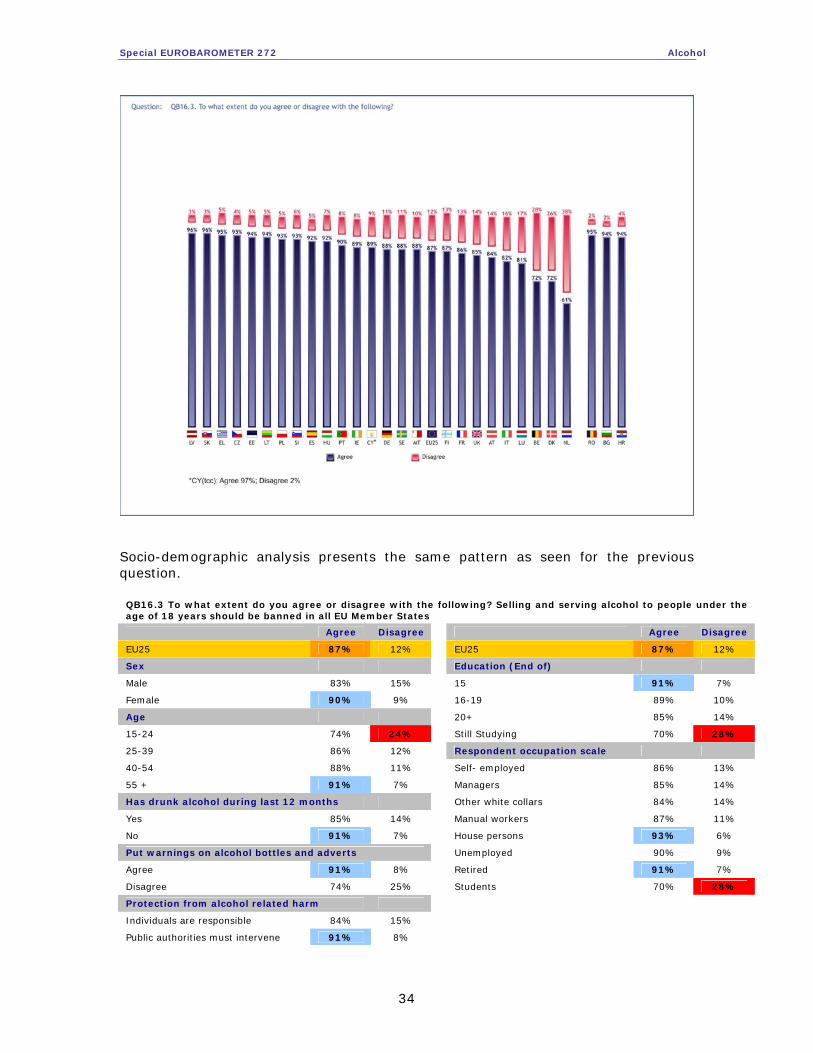
Questionnaire source: QB16.331 Compared to the previous question, an even more extensive level of social consent can be observed at the EU level with regard to the banning of selling and serving alcohol to people under the age of 18. 87% of EU citizens agree with this, furthermore with about two thirds of the population (65%) saying that they “totally agree” with such restrictions.
Public opinion in all countries is in favour of the concept of prohibiting the selling and serving of alcohol to young people less than 18 years of age. Even the least favourable Member States - the Netherlands (61%), Denmark (72%) and Belgium (72%) - show a considerable degree of support.
31 QB16 To what extent do you agree or disagree with the following? 3. Selling and serving alcohol to people under the age of 18 years should be banned in all EU Member States
Special EUROBAROMETER 272 Alcohol
34
Socio-demographic analysis presents the same pattern as seen for the previous question. QB16.3 To what extent do you agree or disagree with the following? Selling and serving alcohol to people under the age of 18 years should be banned in all EU Member States
Agree Disagree Agree Disagree
EU25 87% 12% EU25 87% 12%
Sex Education (End of)
Male 83% 15% 15 91% 7%
Female 90% 9% 16-19 89% 10%
Age 20+ 85% 14%
15-24 74% 24% Still Studying 70% 28%
25-39 86% 12% Respondent occupation scale
40-54 88% 11% Self- employed 86% 13%
55 + 91% 7% Managers 85% 14%
Has drunk alcohol during last 12 months Other white collars 84% 14%
Yes 85% 14% Manual workers 87% 11%
No 91% 7% House persons 93% 6%
Put warnings on alcohol bottles and adverts Unemployed 90% 9%
Agree 91% 8% Retired 91% 7%
Disagree 74% 25% Students 70% 28%
Protection from alcohol related harm Individuals are responsible 84% 15% Public authorities must intervene 91% 8%
Special EUROBAROMETER 272 Alcohol
35
CONCLUSION Three quarters of EU citizens claimed to have drunk alcoholic beverages during the past 12 months, and most of them appear to have also drunk in the past 30 days. Looking at trend results, a slight increase of alcohol consumption (six percentage points) can be observed in the Union since 2003, although due to the different wording of the question and sample size results are not entirely comparable. A socio-demographic analysis suggests that gender and socio-economic status are the most relevant factors in alcohol consumption: Significantly more men than women seem to have drunk alcohol in the past year. Respondents who have studied to an advanced level and managers claimed to have consumed alcohol more often than other groups. In contrast a higher proportion of house persons, people with low level of education and those aged over 55 appear to refrain from alcohol in general. Cross-tabulations show a relation - in both directions – between the consumption of alcohol in general and the assessment of whether individuals are responsible for themselves, or public authorities should intervene in order to prevent alcohol-related harm: Those who have consumed alcoholic beverages in the past year emphasise more the responsibility of individuals; meanwhile those have not drunk alcoholic beverages in the past year are more inclined to empower public authorities to protect citizens from the detrimental consequences of alcohol consumption and vice versa. A similar link has been found with regard to the increase of alcohol consumption per occasion, meaning the more drinks respondents drink on one occasion the more they underline individual responsibility, whereas the fewer drinks respondents drink on one occasion, the more they favour public intervention and vice versa. 48% of Europeans who said they drunk alcoholic beverages in the 30 days before their interview did so once (25%) or 2-3 times a week (23%). 13% claimed to have drunk daily and 8% 4-5 times a week. The majority of the EU population drinks 1-2 drinks on a usual occasion (59% - an increase of four points compared to 2003). At the same time the proportion of those who drink 3-4 drinks (18%) in one sitting has slightly decreased (four percentage points) during the past three years. The share of those having drunk more than 4 drinks remained the same over the same period (10%). Unfortunately, the proportion of young people reporting to drink 3-4 (25%) and more than 4 drinks (19%) at once is higher than for other age groups. European public opinion is quite divided on who bears responsibility in protecting individuals from alcohol-related harm: 52% stated this was the responsibility of individuals themselves, 44% said public authorities. Opinion on this question has a significant impact on attitudes towards measures aiming to prevent negative consequences of alcohol consumption. Citizens believe that price has only a marginal influence on alcohol drinking habits, especially among adults. Two thirds of the European Union population also believe that higher prices for alcohol would not discourage young people and heavy drinkers from consumption. On the other hand, socio-demographic analysis reveals some important findings: The youngest respondents (aged 15-24) appear to be the most responsive to price movements.

Special EUROBAROMETER 272 Alcohol
36
Many respondents are not well-informed about the permitted blood alcohol limit (BAC) in their country. This could be explained by possible difficulties in understanding the exact measurement, a lack of availability of such information or recently introduced changes in regulation. Broad support can be observed regarding suggested measures aiming for the protection of vulnerable groups of society and the prevention of alcohol related road accidents: • EU citizens would clearly favour lower BAC for young and novice drivers
and random police alcohol checks on EU roads for all drivers.
• Three quarters of the European Union population would agree with putting warnings on alcohol bottles and adverts in order to warn pregnant women and drivers of dangers of drinking alcohol.
• European public opinion also strongly supports measures keeping young
people back from alcohol consumption, approving both of banning alcohol advertising targeting young people in all Member States and the banning of selling and serving alcohol to people under the age of 18. A striking finding of the survey is that 84% agree with not selling alcohol to people under the age of 18, with this opinion even expressed strongly among those who think individuals are responsible for preventing themselves from harmful consequences. Understandably, a slightly higher number of the youngest respondents (aged 15-24) and students oppose concepts tightening regulations concern themselves.
Respondents seem to be coherent in their views on preventative measures: Cross-tabulated results for all the above state measures/commitments show that those thinking public authorities should intervene are more in favour of restrictions; meanwhile those highlighting individual responsibility are slightly less devoted. In a nutshell it can be concluded that the undoubted majority of the EU population drinks alcoholic beverages. In fact a slight increase can be observed in the number of drinkers compared to 2003. However, the frequency and the amount of consumption has somewhat decreased. Furthermore the survey has shown that European public opinion is quite supportive concerning measures aimed at the protection of vulnerable groups of society and the reduction of alcohol-related road accidents.

ANNEXES
Technical specifications
SPECIAL EUROBAROMETER N°272b “Attitudes towards Alcohol”
TECHNICAL SPECIFICATIONS
Between the 6th of October and the 8th of November 2006, TNS Opinion & Social, a consortium created between Taylor Nelson Sofres and EOS Gallup Europe, carried out wave 66.2 of the EUROBAROMETER, on request of the EUROPEAN COMMISSION, Directorate General Communication, “Public Opinion and Media Monitoring”. The Special Eurobarometer N°272b is part of EUROBAROMETER 66.2 and covers the population of the respective nationalities of the European Union Member States, resident in each of the Member States and aged 15 years and over. The Special Eurobarometer N°272b has also been conducted in the two acceding countries (Bulgaria and Romania) and in one of the two candidate countries (Croatia) and in the Turkish Cypriot Community. In these countries, the survey covers the national population of citizens of the respective nationalities and the population of citizens of all the European Union Member States that are residents in those countries and have a sufficient command of one of the respective national language(s) to answer the questionnaire. The basic sample design applied in all states is a multi-stage, random (probability) one. In each country, a number of sampling points was drawn with probability proportional to population size (for a total coverage of the country) and to population density. In order to do so, the sampling points were drawn systematically from each of the "administrative regional units", after stratification by individual unit and type of area. They thus represent the whole territory of the countries surveyed according to the EUROSTAT NUTS II (or equivalent) and according to the distribution of the resident population of the respective nationalities in terms of metropolitan, urban and rural areas. In each of the selected sampling points, a starting address was drawn, at random. Further addresses (every Nth address) were selected by standard "random route" procedures, from the initial address. In each household, the respondent was drawn, at random (following the "closest birthday rule"). All interviews were conducted face-to-face in people's homes and in the appropriate national language. As far as the data capture is concerned, CAPI (Computer Assisted Personal Interview) was used in those countries where this technique was available.

ABBREVIATIONS COUNTRIES INSTITUTES N°
INTERVIEWS FIELDWORK DATES
POPULATION15+
BE Belgium TNS Dimarso 1.012 07/10/2006 30/10/2006 8.650.994 CZ Czech Rep. TNS Aisa 1.072 07/10/2006 26/10/2006 8.571.710 DK Denmark TNS Gallup DK 1.060 11/10/2006 08/11/2006 4.411.580 DE Germany TNS Infratest 1.551 07/10/2006 31/10/2006 64.361.608 EE Estonia Emor 1.011 10/10/2006 06/11/2006 887.094 EL Greece TNS ICAP 1.000 10/10/2006 04/11/2006 8.693.566 ES Spain TNS Demoscopia 1.026 07/10/2006 04/11/2006 37.024.972 FR France TNS Sofres 1.022 06/10/2006 02/11/2006 44.010.619 IE Ireland TNS MRBI 1.000 09/10/2006 08/11/2006 3.089.775 IT Italy TNS Abacus 1.005 06/10/2006 04/11/2006 48.892.559 CY Rep. of Cyprus Synovate 506 06/10/2006 31/10/2006 596.752
CY(tcc) Turkish Cypriot Comm. KADEM 500 07/10/2006 27/10/2006 157.101 LV Latvia TNS Latvia 1.031 11/10/2006 05/11/2006 1.418.596 LT Lithuania TNS Gallup Lithuania 1.016 07/10/2006 30/10/2006 2.803.661 LU Luxembourg TNS ILReS 500 06/10/2006 29/10/2006 374.097 HU Hungary TNS Hungary 1.001 06/10/2006 29/10/2006 8.503.379 MT Malta MISCO 500 06/10/2006 31/10/2006 321.114 NL Netherlands TNS NIPO 1.069 06/10/2006 31/10/2006 13.030.000 AT Austria Österreichisches Gallup-Institut 1.013 06/10/2006 29/10/2006 6.848.736 PL Poland TNS OBOP 1.000 08/10/2006 05/11/2006 31.967.880 PT Portugal TNS EUROTESTE 1.006 10/10/2006 05/11/2006 8.080.915 SI Slovenia RM PLUS 1.039 06/10/2006 31/10/2006 1.720.137 SK Slovakia TNS AISA SK 1.180 06/10/2006 23/10/2006 4.316.438 FI Finland TNS Gallup Oy 1.030 06/10/2006 31/10/2006 4.348.676 SE Sweden TNS GALLUP 1.006 09/10/2006 04/11/2006 7.486.976 UK United Kingdom TNS UK 1.375 06/10/2006 05/11/2006 47.685.578 BG Bulgaria TNS BBSS 1.027 06/10/2006 19/10/2006 6.671.699 RO Romania TNS CSOP 1.026 06/10/2006 03/11/2006 18.173.179 HR Croatia Puls 1000 09/10/2006 29/10/2006 3.722.800
TOTAL 28.584 06/10/2006 08/11/2006 396.822.191

For each country a comparison between the sample and the universe was carried out. The Universe description was derived from Eurostat population data or from national statistics offices. For all countries surveyed, a national weighting procedure, using marginal and intercellular weighting, was carried out based on this Universe description. In all countries, gender, age, region and size of locality were introduced in the iteration procedure. For international weighting (i.e. EU averages), TNS Opinion & Social applies the official population figures as provided by EUROSTAT or national statistic offices. The total population figures for input in this post-weighting procedure are listed above. Readers are reminded that survey results are estimations, the accuracy of which, everything being equal, rests upon the sample size and upon the observed percentage. With samples of about 1,000 interviews, the real percentages vary within the following confidence limits:
Observed percentages 10% or 90% 20% or 80% 30% or 70% 40% or 60% 50%
Confidence limits ± 1.9 points ± 2.5 points ± 2.7 points ± 3.0 points ± 3.1 points

Questionnaire

A A(101-105) (101-105)
B B(106-107) (106-107)
C C(108-110) (108-110)
D D(111-116) (111-116)
EB65.4 D
votre numéro d'étude
EB65.4 A
code pays
EB65.4 B
notre numéro d'étude
EB65.4 C
numéro de l'interview
our survey number
EB65.4 C
Interview number
EB65.4 D
your survey number
EB65.4 A
country code
EB65.4 B
EB662MasterIN_v7 1/52 09/11/2006

Q1 Q1
(117-147) (117-147)1, 1,2, 2,3, 3,4, 4,5, 5,6, 6,7, 7,8, 8,9, 9,
10, 10,11, 11,12, 12,13, 13,14, 14,15, 15,16, 16,17, 17,18, 18,19, 19,20, 20,21, 21,22, 22,23, 23,24, 24,25, 25,26, 26,27, 27,28, 28,29, 29,30, 30,31, 31,
Autre paysNSP
EB66.1 Q1 TREND MODIFIED
BulgarieRoumanieCroatieChypre (Communauté Turque Chypriote)
MaltePologneSlovaquieSlovénie
EstonieHongrieLettonieLituanie
SuèdeFinlandeRépublique de ChypreRépublique tchèque
Pays-Bas PortugalRoyaume-Uni (Grande Bretagne, Irlande du Nord)Autriche
FranceIrlandeItalieLuxembourg
DanemarkAllemagneGrèceEspagne
POSER ITEM 29 UNIQUEMENT EN COMMUNAUTE TURQUE CHYPRIOTE
Quelle est votre nationalité ? Veuillez indiquer le(s) pays qui s'applique(nt).
(PLUSIEURS REPONSES POSSIBLES)
Belgique
POSER ITEM 26 UNIQUEMENT EN BULGARIE
POSER ITEM 27 UNIQUEMENT EN ROUMANIE
POSER ITEM 28 UNIQUEMENT EN CROATIE
DK
EB66.1 Q1 TREND MODIFIED
RomaniaCroatiaCyprus (Turkish Cypriot Community)Other countries
PolandSlovakiaSloveniaBulgaria
HungaryLatviaLithuaniaMalta
FinlandRepublic of CyprusCzech RepublicEstonia
PortugalUnited Kingdom (Great Britain, Northern Ireland)AustriaSweden
IrelandItalyLuxembourgNetherlands
GermanyGreeceSpainFrance
What is your nationality? Please tell me the country(ies) that applies(y).
(MULTIPLE ANSWERS POSSIBLE)
BelgiumDenmark
ASK ITEM 26 ONLY IN BULGARIA
ASK ITEM 27 ONLY IN ROMANIA
ASK ITEM 28 ONLY IN CROATIA
ASK ITEM 29 ONLY IN TURKISH CYPRIOT COMMUNITY
EB662MasterIN_v7 2/52 09/11/2006
D10 D10(200) (200)
1 12 2
D11 D11(201-202) (201-202)
Femme
EB66.1 D10
Quel est votre âge ?
EB66.1 D11
Parlons maintenant d'un autre sujet.
Sexe du répondant.
HommeFemale
EB66.1 D10
How old are you?
EB66.1 D11
Let's move on to another topic.
Gender.
Male
EB662MasterIN_v7 13/52 09/11/2006
D15a D15a
D15b D15b
(203-204) (205-206) (203-204) (205-206)
N'A JAMAIS EXERCE D'ACTIVITE PROFESSIONNELLE REMUNEREE
19 19
Autre ouvrier (non qualifié), personnel de maison 18 18
Contremaître, agent de maîtrise 16 16Ouvrier qualifié 17 17
Employé ne travaillant pas dans un bureau mais voyageant (vendeur, chauffeur, représentant, etc.)
14 14
Employé ne travaillant pas dans un bureau mais ayant une fonction de service (hôpital, restaurant, police, pompiers, etc.)
15 15
Cadre moyen 12 12
Employé travaillant la plupart du temps dans un bureau 13 13
Profession libérale salariée (docteur, avocat, comptable, architecte, etc.)
10 10
Cadre supérieur \ dirigeant (PDG\DG, Directeur, etc.) 11 11
Industriel, propriétaire (en tout ou en partie) d'une entreprise
9 9
SALARIES
Profession libérale (avocat, médecin, expert comptable, architecte, etc.)
7 7
Commerçant ou propriétaire d'un magasin, artisan ou autre travailleur indépendant
8 8
Agriculteur exploitant 5 5Pêcheur 6 6
A la retraite ou en congé de maladie prolongé 4 4INDEPENDANTS
Etudiants 2 2Au chômage \ temporairement sans emploi 3 3
PROFESSION ACTUELLE
PROFESSION PRECEDENTE
INACTIFSEn charge des achats courants et des tâches ménagères ou sans aucune activité professionnelle
1 1
POSER D15b SI "PAS D'ACTIVITE ACTUELLE", CODES 1 à 4 en D15a
Quelle est votre profession actuelle ?
Exerciez-vous une activité professionnelle rémunérée auparavant ? Laquelle en dernier lieu ?
D15a D15b
NEVER DID ANY PAID WORK 19 19
Other (unskilled) manual worker, servant 18 18
Supervisor 16 16Skilled manual worker 17 17
Employed position, not at a desk but travelling (salesmen, driver, etc.)
14 14
Employed position, not at a desk, but in a service job (hospital, restaurant, police, fireman, etc.)
15 15
Middle management, other management (department head, junior manager, teacher, technician)
12 12
Employed position, working mainly at a desk 13 13
Employed professional (employed doctor, lawyer, accountant, architect)
10 10
General management, director or top management (managing directors, director general, other director)
11 11
Business proprietors, owner (full or partner) of a company 9 9
EMPLOYED
Professional (lawyer, medical practitioner, accountant, architect, etc.)
7 7
Owner of a shop, craftsmen, other self-employed person 8 8
Farmer 5 5Fisherman 6 6
Retired or unable to work through illness 4 4SELF EMPLOYED
Student 2 2Unemployed or temporarily not working 3 3
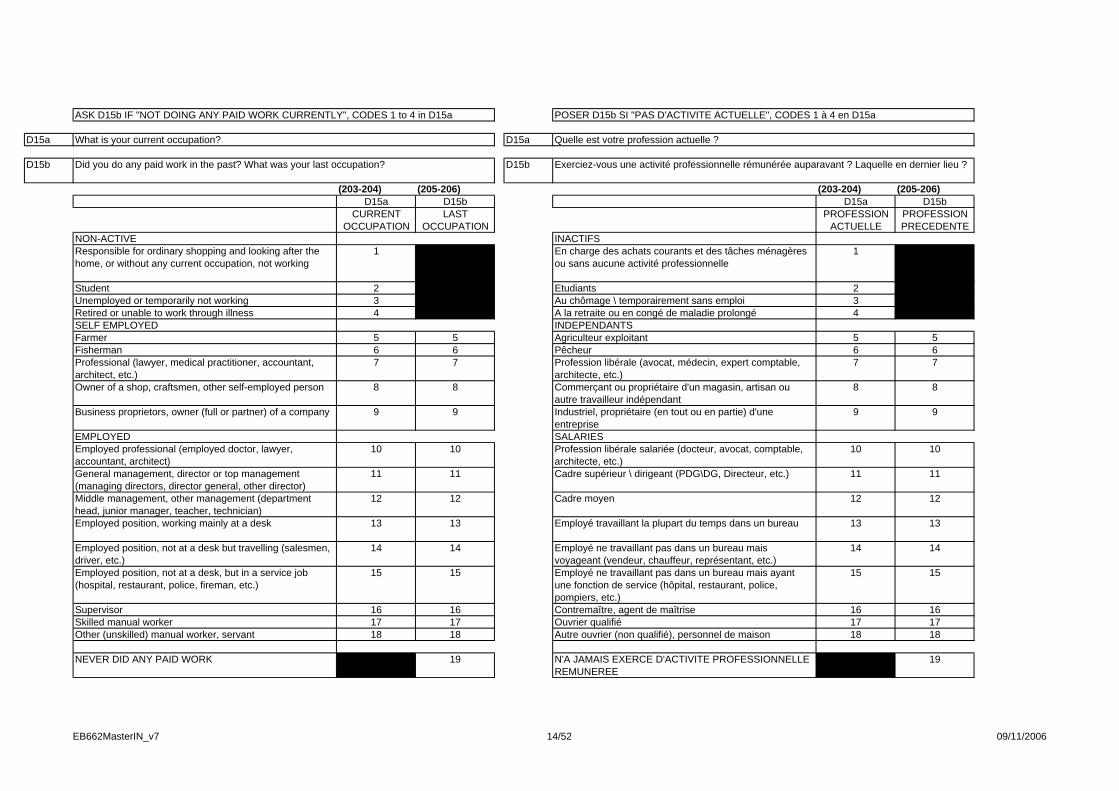
CURRENT OCCUPATION
LAST OCCUPATION
NON-ACTIVEResponsible for ordinary shopping and looking after the home, or without any current occupation, not working
1 1
ASK D15b IF "NOT DOING ANY PAID WORK CURRENTLY", CODES 1 to 4 in D15a
What is your current occupation?
Did you do any paid work in the past? What was your last occupation?
D15a D15b
EB662MasterIN_v7 14/52 09/11/2006

QB10a QB10a
(255) (255)1 12 2
QB10b QB10b
(256) (256)1 12 23 34 45 56 6
QB10c QB10c
(257) (257)1 12 2Non
EB59.0 Q36 TREND SLIGHTLY MODIFIED
Avez-vous bu de l’alcool (bière, vin, spiritueux, cidre ou d’autres alcools locaux) au cours des 30 derniers jours ? (M)
Oui
Moins d'une fois par moisJamaisNSP\ Refus
NEW
(MONTRER CARTE – LIRE – UNE SEULE REPONSE)
Plusieurs fois par semaineUne fois par semaineUne fois par mois
NEW
POSER QB10b A QB12 SI "OUI", CODE 1 en QB10a – LES AUTRES ALLER EN QB13
Au cours des 12 derniers mois, avez-vous consommé 5 verres ou plus en une seule occasion ?
Au cours des 12 derniers mois, avez-vous consommé de l’alcool (bière, vin, spiritueux, cidre ou d’autres alcools locaux) ?
OuiNon
No
EB59.0 Q36 TREND SLIGHTLY MODIFIED
Did you drink any alcoholic beverages (beer, wine, spirits, cider or other local beverages) in the last 30 days? (M)
Yes
Less than once a month NeverDK\ Refusal
NEW
(SHOW CARD – READ OUT – ONE ANSWER ONLY)
Several times a weekOnce a week Once a month
NEW
ASK QB10b TO QB12 IF "YES", CODE 1 in QB10a – OTHERS GO TO QB13
How often in the past 12 months have you had 5 or more drinks on one occasion?
During the past 12 months, did you drink any alcoholic beverage (beer, wine, sprits, cider or other local beverages)?
YesNo
EB662MasterIN_v7 20/52 09/11/2006
QB11 QB11
(258) (258)1 12 23 34 45 56 67 7
QB12 QB12
(259) (259)1 12 23 34 45 56 67 78 8NSP\ Refus
EB59.0 Q39 TREND SLIGHTLY MODIFIED
5-6 verres7-9 verres10 verres ou plusCa dépend (SPONTANE)
(MONTRER CARTE – LIRE – UNE SEULE REPONSE)
Moins d’un verre1-2 verres3-4 verres
Ne se souvient plus\ Refus (SPONTANE)
EB59.0 Q37 TREND MODIFIED
[INT.: UN VERRE\ UNE DOSE\ UNE UNITE = 1 un verre de vin (15cl) OU 1 cannette\ bouteille de bière ou de cidre (33cl) OU 4cl de spiritueux]
Les jours où vous buvez de la bière, du vin ou des spiritueux, combien de verres buvez-vous d’habitude ? (M)
2 – 3 fois par semaineUne fois par semaine2 – 3 fois par moisUne fois
Au cours des 30 derniers jours, combien de fois avez-vous bu de l’alcool ? (M)
(MONTRER CARTE – LIRE – UNE SEULE REPONSE)
Tous les jours4 – 5 fois par semaine
POSER QB11 ET QB12 SI "OUI", CODE 1 en QB10c - LES AUTRES ALLER EN QB13
DK\ Refusal
EB59.0 Q39 TREND SLIGHTLY MODIFIED
5-6 drinks 7-9 drinks 10 or more drinksIt depends (SPONTANEOUS)
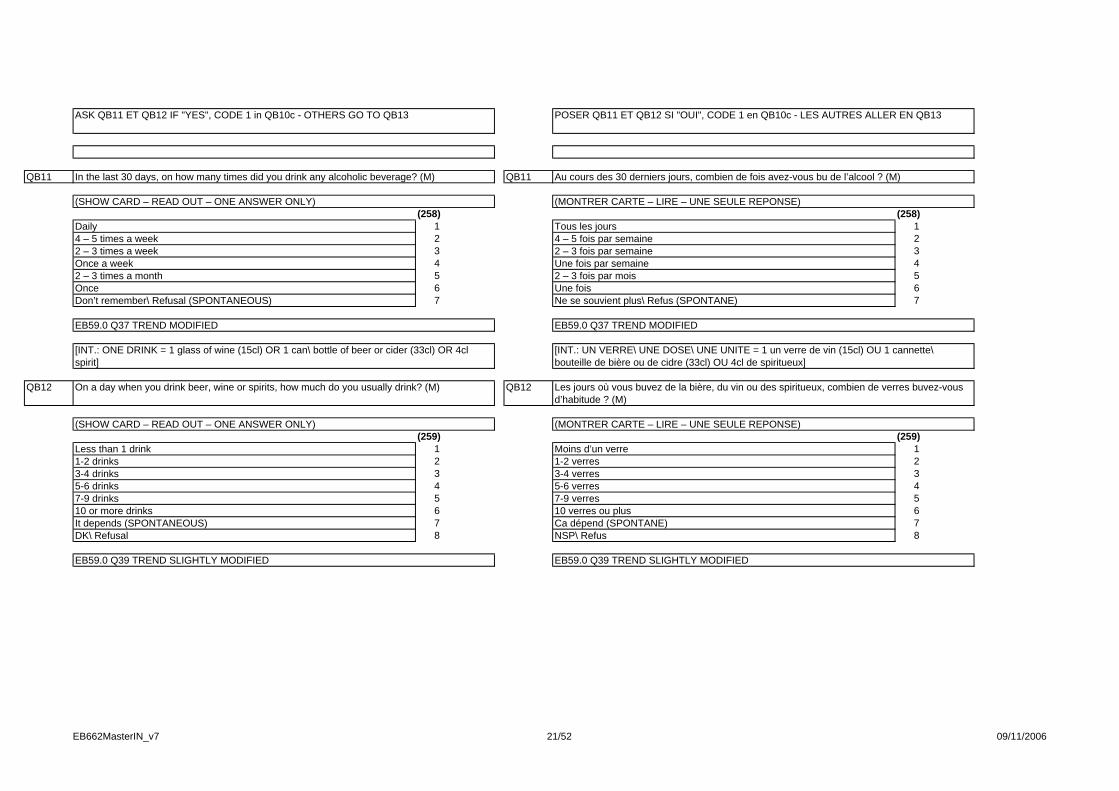
(SHOW CARD – READ OUT – ONE ANSWER ONLY)
Less than 1 drink1-2 drinks3-4 drinks
Don’t remember\ Refusal (SPONTANEOUS)
EB59.0 Q37 TREND MODIFIED
[INT.: ONE DRINK = 1 glass of wine (15cl) OR 1 can\ bottle of beer or cider (33cl) OR 4cl spirit]
On a day when you drink beer, wine or spirits, how much do you usually drink? (M)
2 – 3 times a week Once a week2 – 3 times a monthOnce
In the last 30 days, on how many times did you drink any alcoholic beverage? (M)
(SHOW CARD – READ OUT – ONE ANSWER ONLY)
Daily4 – 5 times a week
ASK QB11 ET QB12 IF "YES", CODE 1 in QB10c - OTHERS GO TO QB13
EB662MasterIN_v7 21/52 09/11/2006
QB13 QB13
(260) (260)1 12 23 34 45 5
QB14a QB14a
(261) (261)1 12 23 34 45 5
NEW
Oui, probablementNon, probablement pasNon, certainement pasNSP\ Refus
Achèteriez-vous moins d’alcool tel que de la bière, du vin ou des spiritueux si les prix augmentaient de 25% ?
(MONTRER CARTE – LIRE – UNE SEULE REPONSE)
Oui, certainement
Non, probablement pasNon, certainement pasNSP
NEW
Pensez-vous que des prix plus élevés décourageraient les jeunes et les gros buveurs à consommer de l’alcool ?
(MONTRER CARTE – LIRE – UNE SEULE REPONSE)
Oui, certainementOui, probablement
A TOUS
NEW
Yes, probablyNo, probably notNo, definitely notDK\ Refusal
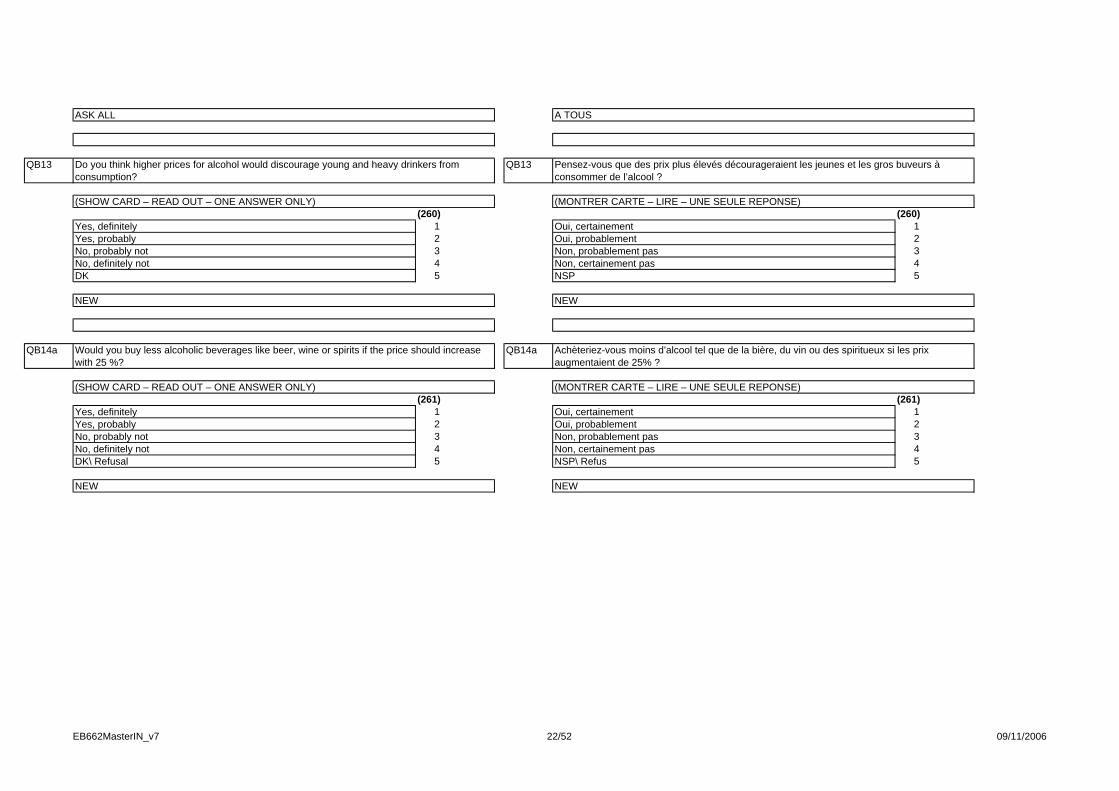
Would you buy less alcoholic beverages like beer, wine or spirits if the price should increase with 25 %?
(SHOW CARD – READ OUT – ONE ANSWER ONLY)
Yes, definitely
No, probably notNo, definitely notDK
NEW
Do you think higher prices for alcohol would discourage young and heavy drinkers from consumption?
(SHOW CARD – READ OUT – ONE ANSWER ONLY)
Yes, definitelyYes, probably
ASK ALL
EB662MasterIN_v7 22/52 09/11/2006
QB14b QB14b
(262) (262)1 12 23 34 45 5
QB15a QB15a
(263-267) (263-267)
QB15b QB15b
(268) (268)1 12 23 34 45 5
Plutôt pas d’accordPas du tout d’accordNSP
NEW
Seriez-vous d’accord pour baisser la limite du taux d’alcoolémie dans le sang autorisé pour les jeunes et les jeunes conducteurs à 0.2 g\l dans les 25 Etats membres de l’Union européenne ?
(MONTRER CARTE – LIRE – UNE SEULE REPONSE)
Tout à fait d’accordPlutôt d’accord
(NOTER EN CLAIR – SI "NSP", CODER '99.99')
g \ L
NEW
NSP\ Refus
NEW
Quel est la limite du taux d’alcoolémie dans le sang autorisé pour les conducteurs en (NOTRE PAYS) ?
Oui, certainementOui, probablementNon, probablement pasNon, certainement pas
Ou achèteriez-vous plus d’alcool tel que de la bière, du vin ou des spiritueux si les prix baissaient de 25% ?
(MONTRER CARTE – LIRE – UNE SEULE REPONSE)
Tend to disagreeTotally disagreeDK
NEW
Would you agree or disagree to lower blood alcohol levels (BAC) for young and novice drivers to 0,2g\l in all 25 European Union Member States?
(SHOW CARD – READ OUT – ONE ANSWER ONLY)
Totally agreeTend to agree
(WRITE DOWN – IF "DON’T KNOW", CODE ’99.99’)
g \ L
NEW
DK\ Refusal
NEW
What is the legal blood alcohol level (BAC) allowed for car drivers in (OUR COUNTRY)?
Yes, definitelyYes, probablyNo, probably notNo, definitely not
Or would you buy more alcoholic beverages like beer, wine or spirits if the price should decrease with 25%
(SHOW CARD – READ OUT – ONE ANSWER ONLY)
EB662MasterIN_v7 23/52 09/11/2006
QB16 QB16
(269)
1
(269)
1
(270)
2
(270)
2
(271)
3
(271)
3 4 5
NEW
Vendre ou servir de l’alcool aux personnes de moins de 18 ans devrait être interdit dans tous les Etats membres de l’UE
1 2 3
4 5
La publicité pour l’alcool ciblant les jeunes devrait être interdite dans tous les Etats membres de l’UE
1 2 3 4 5
Des contrôles policiers aléatoires du taux d’alcoolémie sur les routes de l’UE réduiraient la consommation d’alcool des gens qui s’apprêtent à prendre le volant
1 2 3
Dans quelle mesure êtes-vous d’accord ou pas d'accord avec les propositions suivantes ?
(MONTRER CARTE AVEC ECHELLE – UNE REPONSE PAR LIGNE)
(LIRE) Tout à fait d’accord
Plutôt d’accord
Plutôt pas d’accord
Pas du tout
d’accord
NSP
4 5
NEW
Selling and serving alcohol to people under the age of 18 years should be banned in all EU Member States
1 2 3
4 5
Alcohol advertising targeting young people should be banned in all EU Member States
1 2 3 4 5
Random police alcohol checks on EU roads would reduce people's alcohol consumption before driving
1 2 3
To what extent do you agree or disagree with the following?
(SHOW CARD WITH SCALE – ONE ANSWER PER LINE)
(READ OUT) Totally agree
Tend to agree
Tend to disagree
Totally disagree
DK
EB662MasterIN_v7 24/52 09/11/2006
QB17 QB17
(272) (272)1 12 23 34 45 5
QB18 QB18
(273) (273)
1 1
2 23 3
Les autorités publiques doivent intervenir pour protéger les individus des dangers liés à l’alcoolNSP
NEW
Laquelle des propositions suivantes de rapproche le plus de votre opinion ?
(MONTRER CARTE – LIRE – UNE SEULE REPONSE)
Les gens sont suffisamment responsables pour se protéger eux-mêmes des dangers liés à l’alcool
Plutôt pas d’accordPas du tout d’accordNSP
NEW
Seriez-vous d’accord ou pas d’accord d’apposer des messages sur les bouteilles d’alcool et les publicités sur l’alcool, pour avertir les femmes enceintes et les conducteurs des dangers de la consommation d’alcool ?
(MONTRER CARTE – LIRE – UNE SEULE REPONSE)
Tout à fait d’accordPlutôt d’accord
Public authorities have to intervene in order to protect individuals from alcohol related harmDK
NEW
From which of the following statements do you feel the closest?
(SHOW CARD – READ OUT – ONE ANSWER ONLY)
Individuals are responsible enough to protect themselves from alcohol related harm
Tend to disagreeTotally disagreeDK
NEW
Would you agree or disagree to put warnings on alcohol bottles and adverts with the purpose to warn pregnant women and drivers of dangers of drinking alcohol?
(SHOW CARD – READ OUT – ONE ANSWER ONLY)
Totally agreeTend to agree
EB662MasterIN_v7 25/52 09/11/2006

D1 D1
(470-471) (470-471)
1 2 3 4 5 6 7 8 9 10 1 2 3 4 5 6 7 8 9 10
11 11
12 12
D7 D7
(472-473) (472-473)1 12 23 34 4
5 56 67 78 89 9
10 10
D8 D8
(474-475) (474-475)(ENQ. : SI "ETUDIE ENCORE", CODER ‘00’)
EB66.1 D8
Autre (SPONTANE)Refus (SPONTANE)
EB66.1 D7
A quel âge avez-vous arrêté vos études à temps complet ?
Célibataire ayant déjà vécu en couple dans le passé mais actuellement seul(e)Divorcé(e)Séparé(e)Veuf\Veuve
Marié(e)Remarié(e)Célibataire vivant actuellement en couple Célibataire n'ayant jamais vécu en couple
EB66.1 D1
PAS DE QUESTIONS D2 A D6
Pouvez-vous m'indiquer la lettre qui correspond le mieux à votre situation actuelle ?
(MONTRER CARTE - LIRE - UNE SEULE REPONSE)
Gauche Droite
Refus
NSP
DEMOGRAPHIQUES
A propos de politique, les gens parlent de "droite" et de "gauche". Vous-même, voudriez-vous situer votre position sur cette échelle ?
(MONTRER CARTE) - (ENQ. : NE RIEN SUGGERER. SI LA PERSONNE HESITE, INSISTER)
(INT.: IF "STILL STUDYING", CODE ‘00’)
EB66.1 D8
Other (SPONTANEOUS)Refusal (SPONTANEOUS)
EB66.1 D7
How old were you when you stopped full-time education?
Unmarried, having previously lived with a partner, but now on my own
DivorcedSeparatedWidowed
MarriedRemarriedUnmarried, currently living with partnerUnmarried, having never lived with a partner
EB66.1 D1
NO QUESTIONS D2 TO D6
Could you give me the letter which corresponds best to your own current situation?
(SHOW CARD - READ OUT - ONE ANSWER ONLY)
Left Right
Refusal
DK
DEMOGRAPHICS
In political matters people talk of "the left" and "the right".How would you place your views on this scale?
(SHOW CARD) - (INT.: DO NOT PROMPT - IF CONTACT HESITATES, TRY AGAIN)
EB662MasterIN_v7 46/52 09/11/2006
D25 D25
(476) (476)1 12 23 34 4
D40a D40a
(477-478) (477-478)
D40b D40b
(479-480) (479-480)
EB66.1 D40b
(ENQ. : LIRE - NOTER EN CLAIR)
EB66.1 D40a
Pouvez-vous me dire combien d’enfants de moins de 10 ans vivent dans votre foyer ?
ENQ. : LIRE - NOTER EN CLAIR)
NSP
EB66.1 D25
PAS DE QUESTIONS D26 A D39
Pouvez-vous me dire combien de personnes âgées de 15 ans et plus vivent dans votre foyer, y compris vous-même ?
(LIRE)
Dans une commune ruraleDans une ville petite ou moyenneDans une grande ville
PAS DE QUESTIONS D12 A D14
D15a&b POSEES AVANT QB
PAS DE QUESTIONS D16 A D24
Diriez-vous que vous vivez … ?
PAS DE QUESTION D9
D10 ET D11 POSEE AVANT QB
EB66.1 D40b
INT.: READ OUT - WRITE DOWN)
EB66.1 D40a
Could you tell me how many children less than 10 years old live in your household?
INT.: READ OUT - WRITE DOWN)
DK
EB66.1 D25
NO QUESTIONS D26 TO D39
Could you tell me how many people aged 15 years or more live in your household, yourself included?
(READ OUT)
Rural area or villageSmall or middle sized townLarge town
NO QUESTION D12 TO D14
D15a&b ASKED BEFOR QB
NO QUESTIONS D16 TO D24
Would you say you live in a...?
NO QUESTION D9
D10 AND D11 ASKED BEFORE QB
EB662MasterIN_v7 47/52 09/11/2006

D40c D40c
(481-482) (481-482)
D41 D41
(483) (483)1 12 23 34 45 56 6
D42 D42
(484) (484)1 1
2 2
3 3
4 45 56 6
Votre père et votre mère sont nés en dehors de l’Union européenneNSP \ Refus (SPONTANE)
EB65.4 D42
Votre mère et votre père sont nés en (NOTRE PAYS)L’un de vos parents est né en (NOTRE PAYS) et l’autre est né dans un autre Etat membre de l’Union européenneVotre mère et votre père sont nés dans un autre Etat membre de l’Union européenneUn de vos parents est né en (NOTRE PAYS) et l’autre est né en dehors de l’Union européenne
EB66.1 D41
NE PAS POSER D42 item 5 en BG et RO
Laquelle de ces propositions correspond à votre situation ?
(MONTRER CATRE - LIRE - UNE SEULE REPONSE)
En Europe, mais pas dans un Etat membre de l’Union européenneEn Asie, en Afrique ou en Amérique latineEn Amérique du Nord, au Japon ou en OcéanieRefus (SPONTANE)
Vous-même, êtes-vous né(e) ?
(MONTRER CATRE - LIRE - UNE SEULE REPONSE)
En (NOTRE PAYS)Dans un autre Etat membre de l’Union européenne
Pouvez-vous me dire combien d’enfants de 10 à 14 ans vivent dans votre foyer ?
ENQ. : LIRE - NOTER EN CLAIR)
EB66.1 D40c
Your mother and your father were born outside the European UnionDK\Refusal (SPONTANEOUS)
EB65.4 D42
Your mother and your father were born in (OUR COUNTRY)One of your parents was born in (OUR COUNTRY) and the other was born in another Member State of the European UnionYour mother and your father were born in another Member State of the European UnionOne of your parents was born in (OUR COUNTRY) and the other was born outside of the European Union
EB66.1 D41
DO NOT ASK D42 item 5 in BG and RO
Which of these proposals corresponds to your situation?
(SHOW CARD - READ OUT - ONE ANSWER ONLY)
In Europe, but not in a Member Country of the European UnionIn Asia, in Africa or in Latin AmericaIn Northern America, in Japan or in OceaniaRefusal (SPONTANEOUS)
You personally, were you born…?
(SHOW CARD - READ OUT - ONE ANSWER ONLY)
In (OUR COUNTRY)In another Member Country of the European Union
Could you tell me how many children aged 10 to 14 years old live in your household?
INT.: READ OUT - WRITE DOWN)
EB66.1 D40c
EB662MasterIN_v7 48/52 09/11/2006
D43a D43a
D43b D43b(485) (486) (485) (486)
D46 D46
(487-496) (487-496)1, 1,2, 2,3, 3,4, 4,5, 5,6, 6,7, 7,8, 8,9, 9,
10, 10,NSP
EB66.1 D46
Une voitureUn appartement \ Une maison que vous avez fini de payerUn appartement \ Une maison que vous êtes en train de payerAucun (SPONTANE)
Un lecteur DVDUn lecteur CD audioUn ordinateurUne connexion Internet à la maison
Parmi les biens suivants, lesquels possédez-vous ?
(MONTRER CARTE - LIRE - PLUSIEURS REPONSES POSSIBLES)
Une télévision
Non 2 2
EB66.1 D43a D43b
Fixe MobileOui 1 1
Possédez-vous un téléphone mobile\ GSM\ portable personnel ?
D43a D43b
Possédez-vous un téléphone fixe dans votre foyer ?
DK
EB66.1 D46
A carAn apartment \ a house which you have finished paying forAn apartment \ a house which you are paying forNone (SPONTANEOUS)
DVD playerMusic CD playerComputerAn Internet connection at home
Which of the following goods do you have?
(SHOW CARD - READ OUT - SEVERAL ANSWERS POSSIBLE)
Television
No 2 2
EB66.1 D43a D43b
Fixed MobileYes 1 1
Do you own a personal mobile telephone?
D43a D43b
Do you own a fixed telephone in your household?
EB662MasterIN_v7 49/52 09/11/2006
P1 P1(497-498) (499-500) (497-498) (499-500)
P2 P2
(501-502) (503-504) (501-502) (503-504)
P3 P3(505-507) (505-507)
P4 P4(508) (508)
1 12 23 34 4
P5 P5(509) (509)
1 12 23 34 4
MoyenneMédiocre
EB66.1 P5
EB66.1 P4
Coopération du répondant
ExcellenteBonne
Deux (l'enquêteur et le répondant)TroisQuatreCinq et plus
DUREE DE L'INTERVIEW EN MINUTES
MINUTES
EB66.1 P3
Nombre de personnes présentes pendant l'interview, l'enquêteur inclus.
(ENQ. : DE 0 A 23 HEURE)
HEURE MINUTES
EB66.1 P2
JOUR MOIS
EB66.1 P1
HEURE DU DEBUT DE L'INTERVIEW
PROTOCOLE D'INTERVIEW
DATE DE L'INTERVIEW
AverageBad
EB66.1 P5
EB66.1 P4
Respondent cooperation
ExcellentFair
Two (interviewer and respondent)ThreeFourFive or more
NUMBER OF MINUTES THE INTERVIEW LASTED
MINUTES
EB66.1 P3
Number of persons present during the interview, including interviewer
(INT.:USE 24 HOUR CLOCK)
HOUR MINUTES
EB66.1 P2
DAY MONTH
EB66.1 P1
TIME OF THE BEGINNING OF THE INTERVIEW
INTERVIEW PROTOCOLE
DATE OF INTERVIEW
EB662MasterIN_v7 50/52 09/11/2006
P6 P6
(510-511) (510-511)
P7 P7
(512-513) (512-513)
P8 P8(514-521) (514-521)
P9 P9(522-529) (522-529)
P10 P10(530-537) (530-537)
P11 P11(538-545) (538-545)
EB66.1 P11
EB66.1 P9
N° enquêteur
EB66.1 P10
Facteur de pondération
EB66.1 P7
Code postal
EB66.1 P8
N° point de chute
(CODES LOCAUX)
EB66.1 P6
Région
(CODES LOCAUX)
Catégorie d'habitat
EB66.1 P11
EB66.1 P9
Interviewer number
EB66.1 P10
Weighting factor
EB66.1 P7
Postal code
EB66.1 P8
Sample point number
(LOCAL CODES)
EB66.1 P6
Region
(LOCAL CODES)
Size of locality
EB662MasterIN_v7 51/52 09/11/2006

P13 P13(546) (546)
1 12 23 3
Langue 2Langue 3
EB66.1 P13
POSER UNIQUEMENT en LU, BE, ES, FI, EE, LV et MT
Langue de l'interview
Langue 1Language 2Language 3
EB66.1 P13
ASK ONLY in LU, BE, ES, FI, EE, LV and MT
Language of interview
Language 1
EB662MasterIN_v7 52/52 09/11/2006

Tables
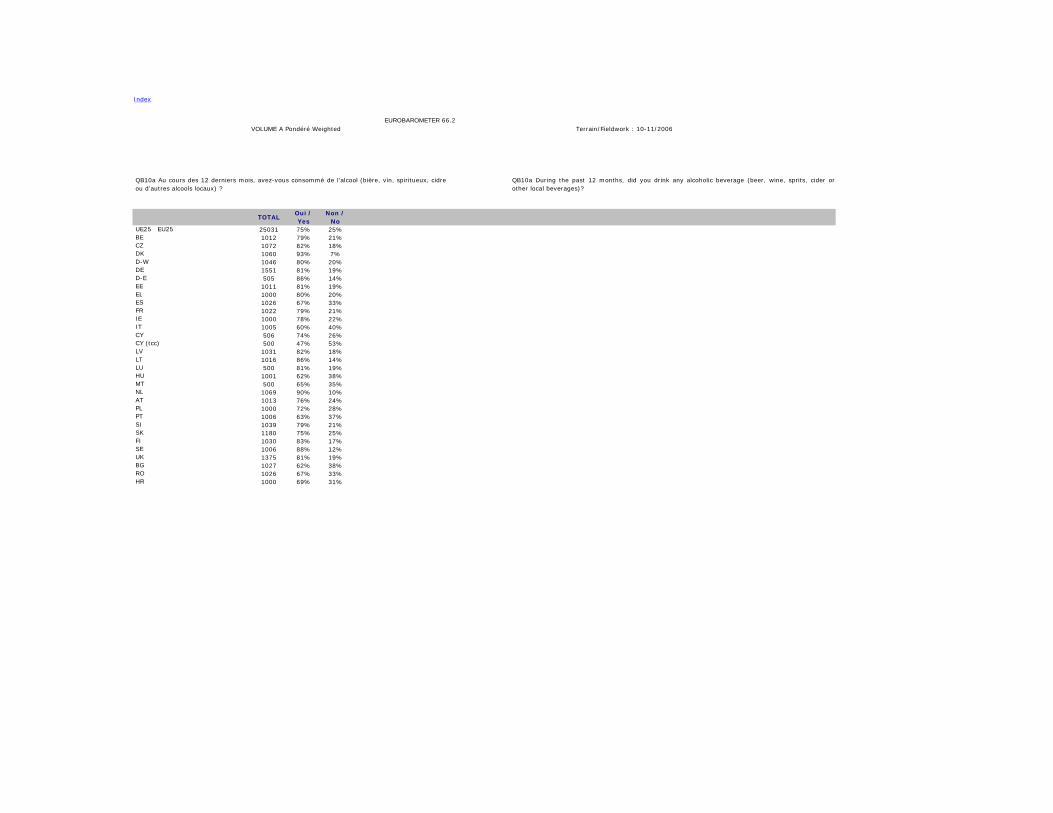
Index
EUROBAROMETER 66.2VOLUME A Pondéré Weighted Terrain/Fieldwork : 10-11/2006
TOTALOui / Yes
Non / No
UE25�EU25 25031 75% 25%BE 1012 79% 21%CZ 1072 82% 18%DK 1060 93% 7%D-W 1046 80% 20%DE 1551 81% 19%D-E 505 86% 14%EE 1011 81% 19%EL 1000 80% 20%ES 1026 67% 33%FR 1022 79% 21%IE 1000 78% 22%IT 1005 60% 40%CY 506 74% 26%CY (tcc) 500 47% 53%LV 1031 82% 18%LT 1016 86% 14%LU 500 81% 19%HU 1001 62% 38%MT 500 65% 35%NL 1069 90% 10%AT 1013 76% 24%PL 1000 72% 28%PT 1006 63% 37%SI 1039 79% 21%SK 1180 75% 25%FI 1030 83% 17%SE 1006 88% 12%UK 1375 81% 19%BG 1027 62% 38%RO 1026 67% 33%HR 1000 69% 31%
QB10a Au cours des 12 derniers mois, avez-vous consommé de l’alcool (bière, vin, spiritueux, cidreou d’autres alcools locaux) ?
QB10a During the past 12 months, did you drink any alcoholic beverage (beer, wine, sprits, cider orother local beverages)?
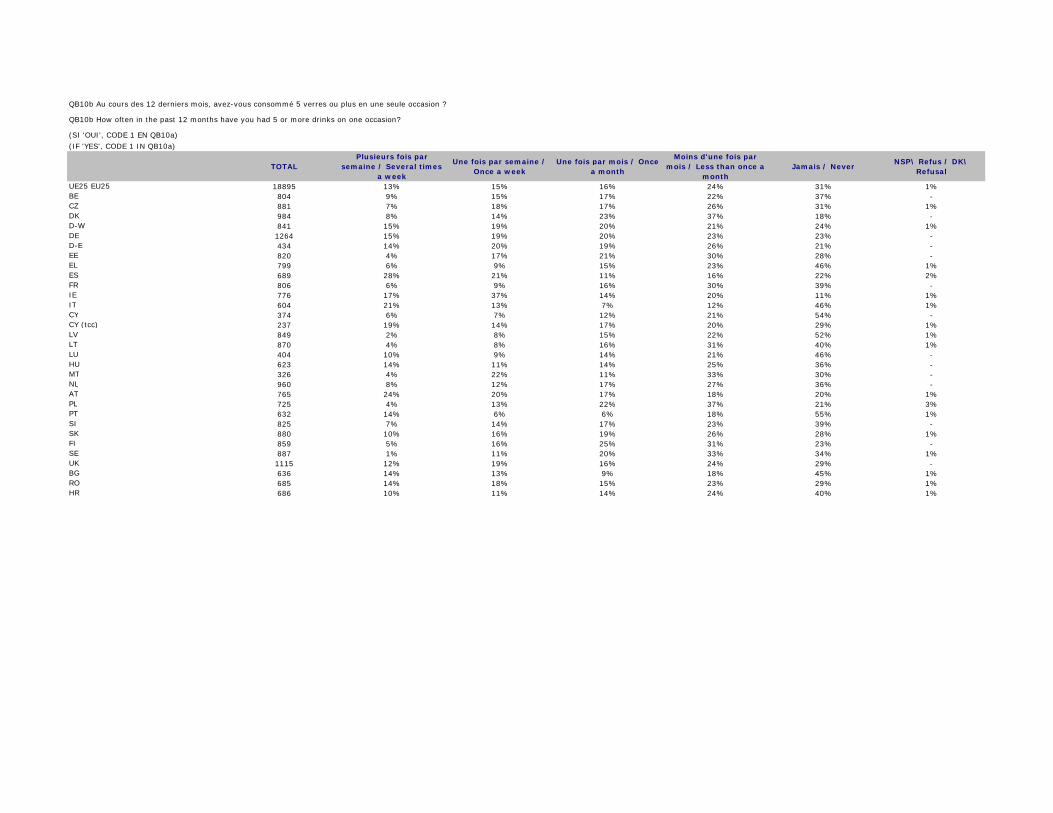
TOTALPlusieurs fois par
semaine / Several times a week
Une fois par semaine / Once a week
Une fois par mois / Once a month
Moins d'une fois par mois / Less than once a
month Jamais / Never
NSP\ Refus / DK\ Refusal
UE25 EU25 18895 13% 15% 16% 24% 31% 1%BE 804 9% 15% 17% 22% 37% - CZ 881 7% 18% 17% 26% 31% 1%DK 984 8% 14% 23% 37% 18% - D-W 841 15% 19% 20% 21% 24% 1%DE 1264 15% 19% 20% 23% 23% - D-E 434 14% 20% 19% 26% 21% - EE 820 4% 17% 21% 30% 28% - EL 799 6% 9% 15% 23% 46% 1%ES 689 28% 21% 11% 16% 22% 2%FR 806 6% 9% 16% 30% 39% - IE 776 17% 37% 14% 20% 11% 1%IT 604 21% 13% 7% 12% 46% 1%CY 374 6% 7% 12% 21% 54% - CY (tcc) 237 19% 14% 17% 20% 29% 1%LV 849 2% 8% 15% 22% 52% 1%LT 870 4% 8% 16% 31% 40% 1%LU 404 10% 9% 14% 21% 46% - HU 623 14% 11% 14% 25% 36% - MT 326 4% 22% 11% 33% 30% - NL 960 8% 12% 17% 27% 36% - AT 765 24% 20% 17% 18% 20% 1%PL 725 4% 13% 22% 37% 21% 3%PT 632 14% 6% 6% 18% 55% 1%SI 825 7% 14% 17% 23% 39% - SK 880 10% 16% 19% 26% 28% 1%FI 859 5% 16% 25% 31% 23% - SE 887 1% 11% 20% 33% 34% 1%UK 1115 12% 19% 16% 24% 29% - BG 636 14% 13% 9% 18% 45% 1%RO 685 14% 18% 15% 23% 29% 1%HR 686 10% 11% 14% 24% 40% 1%
(SI 'OUI', CODE 1 EN QB10a)
(IF 'YES', CODE 1 IN QB10a)
QB10b Au cours des 12 derniers mois, avez-vous consommé 5 verres ou plus en une seule occasion ?
QB10b How often in the past 12 months have you had 5 or more drinks on one occasion?
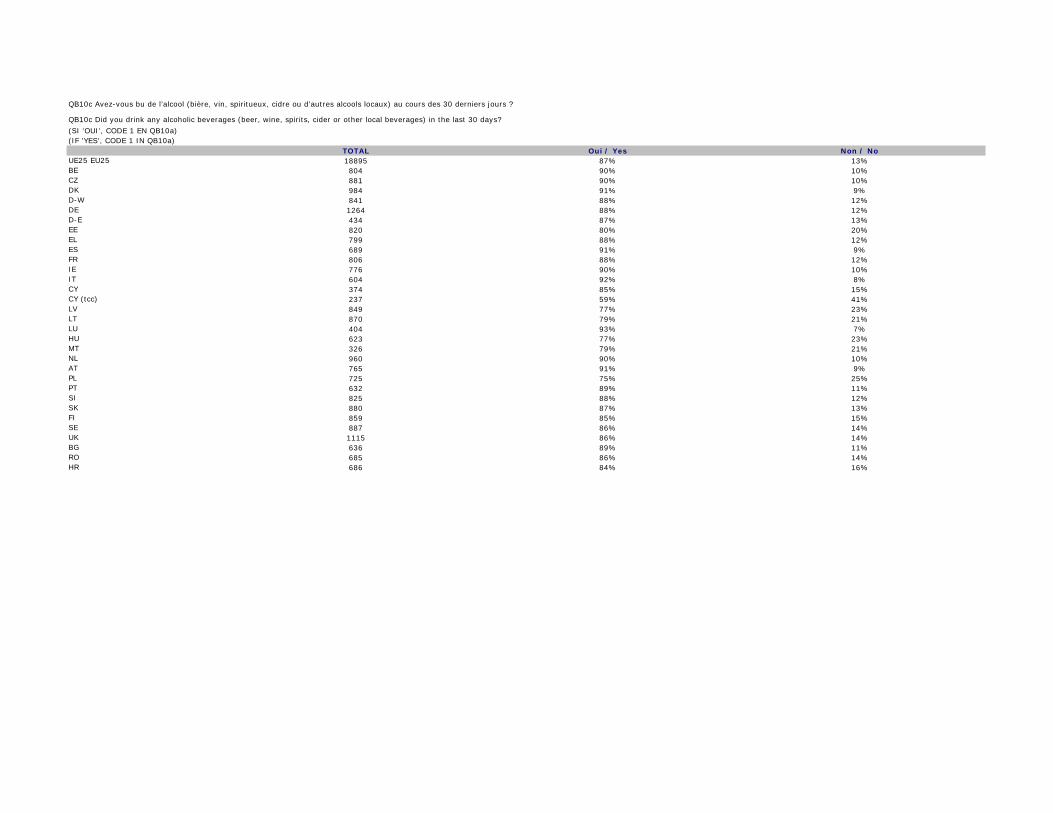
TOTAL Oui / Yes Non / NoUE25 EU25 18895 87% 13%BE 804 90% 10%CZ 881 90% 10%DK 984 91% 9%D-W 841 88% 12%DE 1264 88% 12%D-E 434 87% 13%EE 820 80% 20%EL 799 88% 12%ES 689 91% 9%FR 806 88% 12%IE 776 90% 10%IT 604 92% 8%CY 374 85% 15%CY (tcc) 237 59% 41%LV 849 77% 23%LT 870 79% 21%LU 404 93% 7%HU 623 77% 23%MT 326 79% 21%NL 960 90% 10%AT 765 91% 9%PL 725 75% 25%PT 632 89% 11%SI 825 88% 12%SK 880 87% 13%FI 859 85% 15%SE 887 86% 14%UK 1115 86% 14%BG 636 89% 11%RO 685 86% 14%HR 686 84% 16%
(SI 'OUI', CODE 1 EN QB10a)(IF 'YES', CODE 1 IN QB10a)
QB10c Avez-vous bu de l’alcool (bière, vin, spiritueux, cidre ou d’autres alcools locaux) au cours des 30 derniers jours ?
QB10c Did you drink any alcoholic beverages (beer, wine, spirits, cider or other local beverages) in the last 30 days?
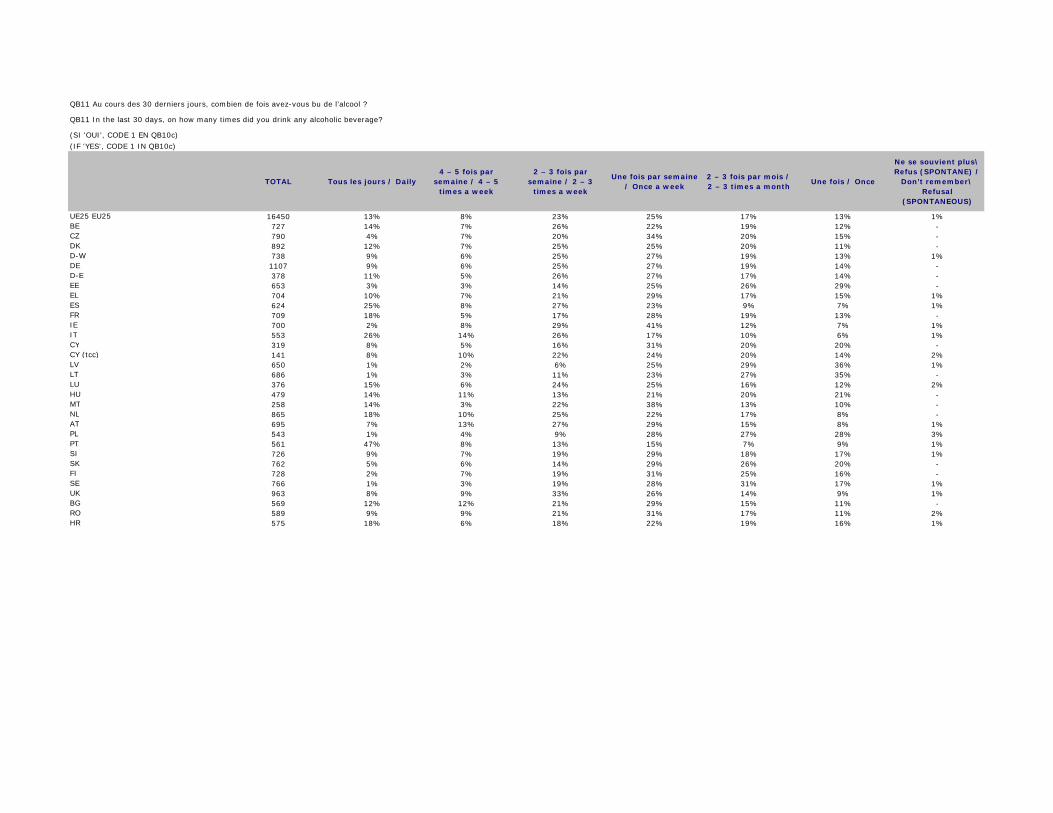
TOTAL Tous les jours / Daily4 – 5 fois par
semaine / 4 – 5 times a week
2 – 3 fois par semaine / 2 – 3
times a week
Une fois par semaine / Once a week
2 – 3 fois par mois / 2 – 3 times a month
Une fois / Once
Ne se souvient plus\ Refus (SPONTANE) /
Don’t remember\ Refusal
(SPONTANEOUS)
UE25 EU25 16450 13% 8% 23% 25% 17% 13% 1%BE 727 14% 7% 26% 22% 19% 12% - CZ 790 4% 7% 20% 34% 20% 15% - DK 892 12% 7% 25% 25% 20% 11% - D-W 738 9% 6% 25% 27% 19% 13% 1%DE 1107 9% 6% 25% 27% 19% 14% - D-E 378 11% 5% 26% 27% 17% 14% - EE 653 3% 3% 14% 25% 26% 29% - EL 704 10% 7% 21% 29% 17% 15% 1%ES 624 25% 8% 27% 23% 9% 7% 1%FR 709 18% 5% 17% 28% 19% 13% - IE 700 2% 8% 29% 41% 12% 7% 1%IT 553 26% 14% 26% 17% 10% 6% 1%CY 319 8% 5% 16% 31% 20% 20% - CY (tcc) 141 8% 10% 22% 24% 20% 14% 2%LV 650 1% 2% 6% 25% 29% 36% 1%LT 686 1% 3% 11% 23% 27% 35% - LU 376 15% 6% 24% 25% 16% 12% 2%HU 479 14% 11% 13% 21% 20% 21% - MT 258 14% 3% 22% 38% 13% 10% - NL 865 18% 10% 25% 22% 17% 8% - AT 695 7% 13% 27% 29% 15% 8% 1%PL 543 1% 4% 9% 28% 27% 28% 3%PT 561 47% 8% 13% 15% 7% 9% 1%SI 726 9% 7% 19% 29% 18% 17% 1%SK 762 5% 6% 14% 29% 26% 20% - FI 728 2% 7% 19% 31% 25% 16% - SE 766 1% 3% 19% 28% 31% 17% 1%UK 963 8% 9% 33% 26% 14% 9% 1%BG 569 12% 12% 21% 29% 15% 11% - RO 589 9% 9% 21% 31% 17% 11% 2%HR 575 18% 6% 18% 22% 19% 16% 1%
(SI 'OUI', CODE 1 EN QB10c)
(IF 'YES', CODE 1 IN QB10c)
QB11 Au cours des 30 derniers jours, combien de fois avez-vous bu de l’alcool ?
QB11 In the last 30 days, on how many times did you drink any alcoholic beverage?
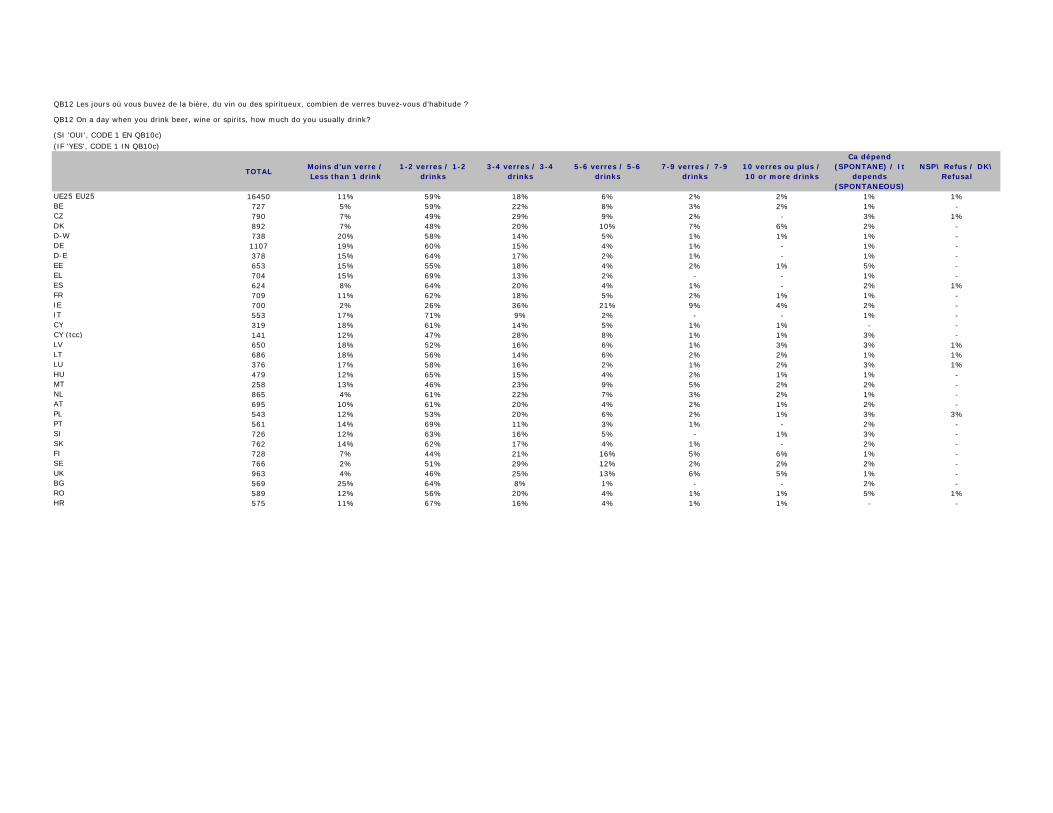
TOTALMoins d’un verre / Less than 1 drink
1-2 verres / 1-2 drinks
3-4 verres / 3-4 drinks
5-6 verres / 5-6 drinks
7-9 verres / 7-9 drinks
10 verres ou plus / 10 or more drinks
Ca dépend (SPONTANE) / It
depends (SPONTANEOUS)
NSP\ Refus / DK\ Refusal
UE25 EU25 16450 11% 59% 18% 6% 2% 2% 1% 1%BE 727 5% 59% 22% 8% 3% 2% 1% - CZ 790 7% 49% 29% 9% 2% - 3% 1%DK 892 7% 48% 20% 10% 7% 6% 2% - D-W 738 20% 58% 14% 5% 1% 1% 1% - DE 1107 19% 60% 15% 4% 1% - 1% - D-E 378 15% 64% 17% 2% 1% - 1% - EE 653 15% 55% 18% 4% 2% 1% 5% - EL 704 15% 69% 13% 2% - - 1% - ES 624 8% 64% 20% 4% 1% - 2% 1%FR 709 11% 62% 18% 5% 2% 1% 1% - IE 700 2% 26% 36% 21% 9% 4% 2% - IT 553 17% 71% 9% 2% - - 1% - CY 319 18% 61% 14% 5% 1% 1% - - CY (tcc) 141 12% 47% 28% 8% 1% 1% 3% - LV 650 18% 52% 16% 6% 1% 3% 3% 1%LT 686 18% 56% 14% 6% 2% 2% 1% 1%LU 376 17% 58% 16% 2% 1% 2% 3% 1%HU 479 12% 65% 15% 4% 2% 1% 1% - MT 258 13% 46% 23% 9% 5% 2% 2% - NL 865 4% 61% 22% 7% 3% 2% 1% - AT 695 10% 61% 20% 4% 2% 1% 2% - PL 543 12% 53% 20% 6% 2% 1% 3% 3%PT 561 14% 69% 11% 3% 1% - 2% - SI 726 12% 63% 16% 5% - 1% 3% - SK 762 14% 62% 17% 4% 1% - 2% - FI 728 7% 44% 21% 16% 5% 6% 1% - SE 766 2% 51% 29% 12% 2% 2% 2% - UK 963 4% 46% 25% 13% 6% 5% 1% - BG 569 25% 64% 8% 1% - - 2% - RO 589 12% 56% 20% 4% 1% 1% 5% 1%HR 575 11% 67% 16% 4% 1% 1% - -
(SI 'OUI', CODE 1 EN QB10c)
(IF 'YES', CODE 1 IN QB10c)
QB12 Les jours où vous buvez de la bière, du vin ou des spiritueux, combien de verres buvez-vous d’habitude ?
QB12 On a day when you drink beer, wine or spirits, how much do you usually drink?
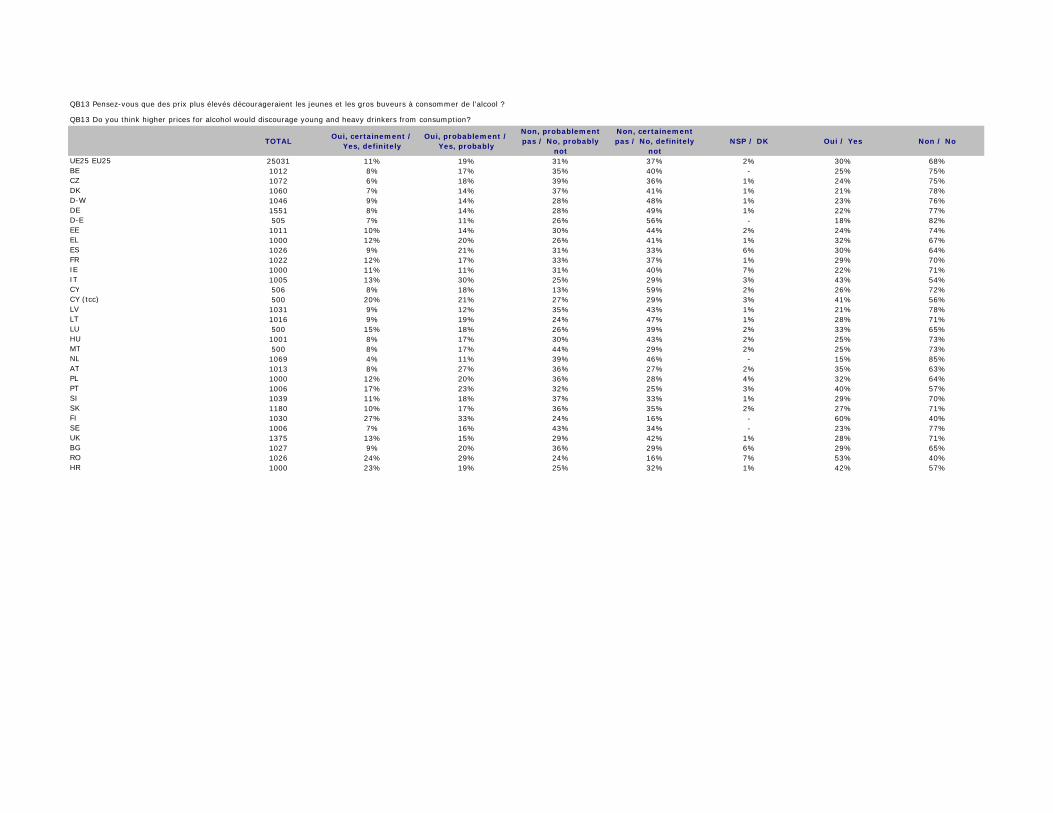
TOTALOui, certainement /
Yes, definitelyOui, probablement /
Yes, probably
Non, probablement pas / No, probably
not
Non, certainement pas / No, definitely
notNSP / DK Oui / Yes Non / No
UE25 EU25 25031 11% 19% 31% 37% 2% 30% 68%BE 1012 8% 17% 35% 40% - 25% 75%CZ 1072 6% 18% 39% 36% 1% 24% 75%DK 1060 7% 14% 37% 41% 1% 21% 78%D-W 1046 9% 14% 28% 48% 1% 23% 76%DE 1551 8% 14% 28% 49% 1% 22% 77%D-E 505 7% 11% 26% 56% - 18% 82%EE 1011 10% 14% 30% 44% 2% 24% 74%EL 1000 12% 20% 26% 41% 1% 32% 67%ES 1026 9% 21% 31% 33% 6% 30% 64%FR 1022 12% 17% 33% 37% 1% 29% 70%IE 1000 11% 11% 31% 40% 7% 22% 71%IT 1005 13% 30% 25% 29% 3% 43% 54%CY 506 8% 18% 13% 59% 2% 26% 72%CY (tcc) 500 20% 21% 27% 29% 3% 41% 56%LV 1031 9% 12% 35% 43% 1% 21% 78%LT 1016 9% 19% 24% 47% 1% 28% 71%LU 500 15% 18% 26% 39% 2% 33% 65%HU 1001 8% 17% 30% 43% 2% 25% 73%MT 500 8% 17% 44% 29% 2% 25% 73%NL 1069 4% 11% 39% 46% - 15% 85%AT 1013 8% 27% 36% 27% 2% 35% 63%PL 1000 12% 20% 36% 28% 4% 32% 64%PT 1006 17% 23% 32% 25% 3% 40% 57%SI 1039 11% 18% 37% 33% 1% 29% 70%SK 1180 10% 17% 36% 35% 2% 27% 71%FI 1030 27% 33% 24% 16% - 60% 40%SE 1006 7% 16% 43% 34% - 23% 77%UK 1375 13% 15% 29% 42% 1% 28% 71%BG 1027 9% 20% 36% 29% 6% 29% 65%RO 1026 24% 29% 24% 16% 7% 53% 40%HR 1000 23% 19% 25% 32% 1% 42% 57%
QB13 Pensez-vous que des prix plus élevés décourageraient les jeunes et les gros buveurs à consommer de l’alcool ?
QB13 Do you think higher prices for alcohol would discourage young and heavy drinkers from consumption?
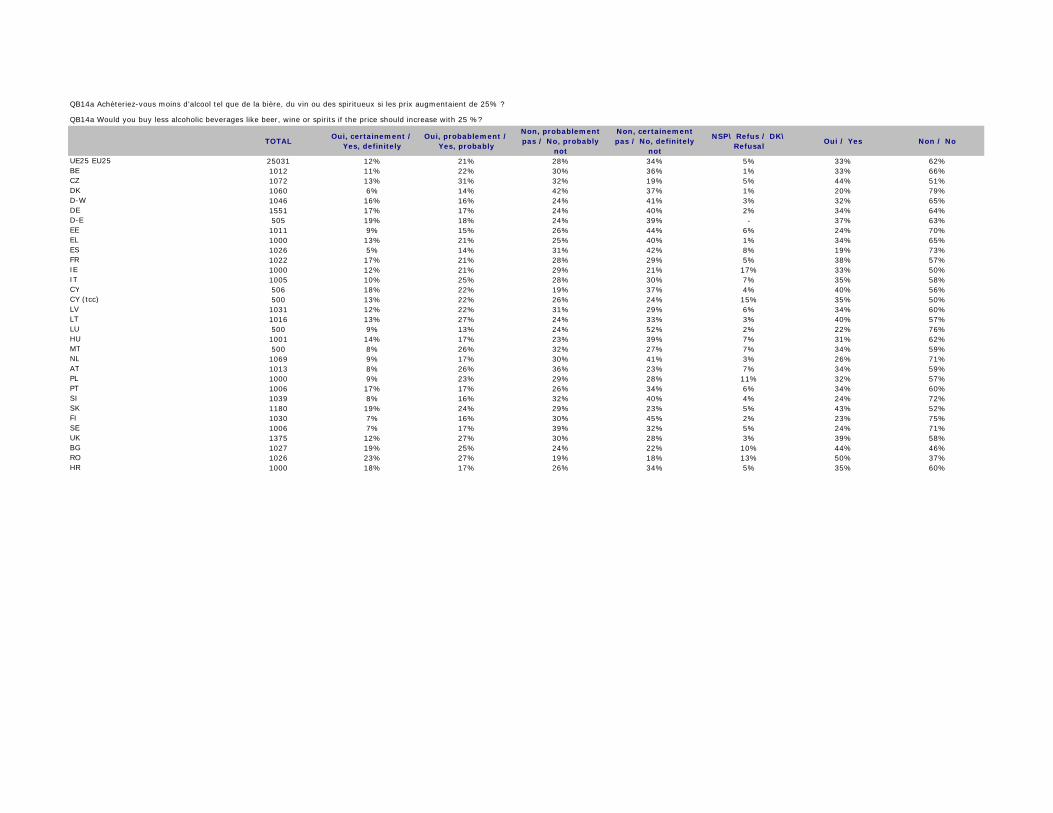
TOTALOui, certainement /
Yes, definitelyOui, probablement /
Yes, probably
Non, probablement pas / No, probably
not
Non, certainement pas / No, definitely
not
NSP\ Refus / DK\ Refusal
Oui / Yes Non / No
UE25 EU25 25031 12% 21% 28% 34% 5% 33% 62%BE 1012 11% 22% 30% 36% 1% 33% 66%CZ 1072 13% 31% 32% 19% 5% 44% 51%DK 1060 6% 14% 42% 37% 1% 20% 79%D-W 1046 16% 16% 24% 41% 3% 32% 65%DE 1551 17% 17% 24% 40% 2% 34% 64%D-E 505 19% 18% 24% 39% - 37% 63%EE 1011 9% 15% 26% 44% 6% 24% 70%EL 1000 13% 21% 25% 40% 1% 34% 65%ES 1026 5% 14% 31% 42% 8% 19% 73%FR 1022 17% 21% 28% 29% 5% 38% 57%IE 1000 12% 21% 29% 21% 17% 33% 50%IT 1005 10% 25% 28% 30% 7% 35% 58%CY 506 18% 22% 19% 37% 4% 40% 56%CY (tcc) 500 13% 22% 26% 24% 15% 35% 50%LV 1031 12% 22% 31% 29% 6% 34% 60%LT 1016 13% 27% 24% 33% 3% 40% 57%LU 500 9% 13% 24% 52% 2% 22% 76%HU 1001 14% 17% 23% 39% 7% 31% 62%MT 500 8% 26% 32% 27% 7% 34% 59%NL 1069 9% 17% 30% 41% 3% 26% 71%AT 1013 8% 26% 36% 23% 7% 34% 59%PL 1000 9% 23% 29% 28% 11% 32% 57%PT 1006 17% 17% 26% 34% 6% 34% 60%SI 1039 8% 16% 32% 40% 4% 24% 72%SK 1180 19% 24% 29% 23% 5% 43% 52%FI 1030 7% 16% 30% 45% 2% 23% 75%SE 1006 7% 17% 39% 32% 5% 24% 71%UK 1375 12% 27% 30% 28% 3% 39% 58%BG 1027 19% 25% 24% 22% 10% 44% 46%RO 1026 23% 27% 19% 18% 13% 50% 37%HR 1000 18% 17% 26% 34% 5% 35% 60%
QB14a Achèteriez-vous moins d’alcool tel que de la bière, du vin ou des spiritueux si les prix augmentaient de 25% ?
QB14a Would you buy less alcoholic beverages like beer, wine or spirits if the price should increase with 25 %?
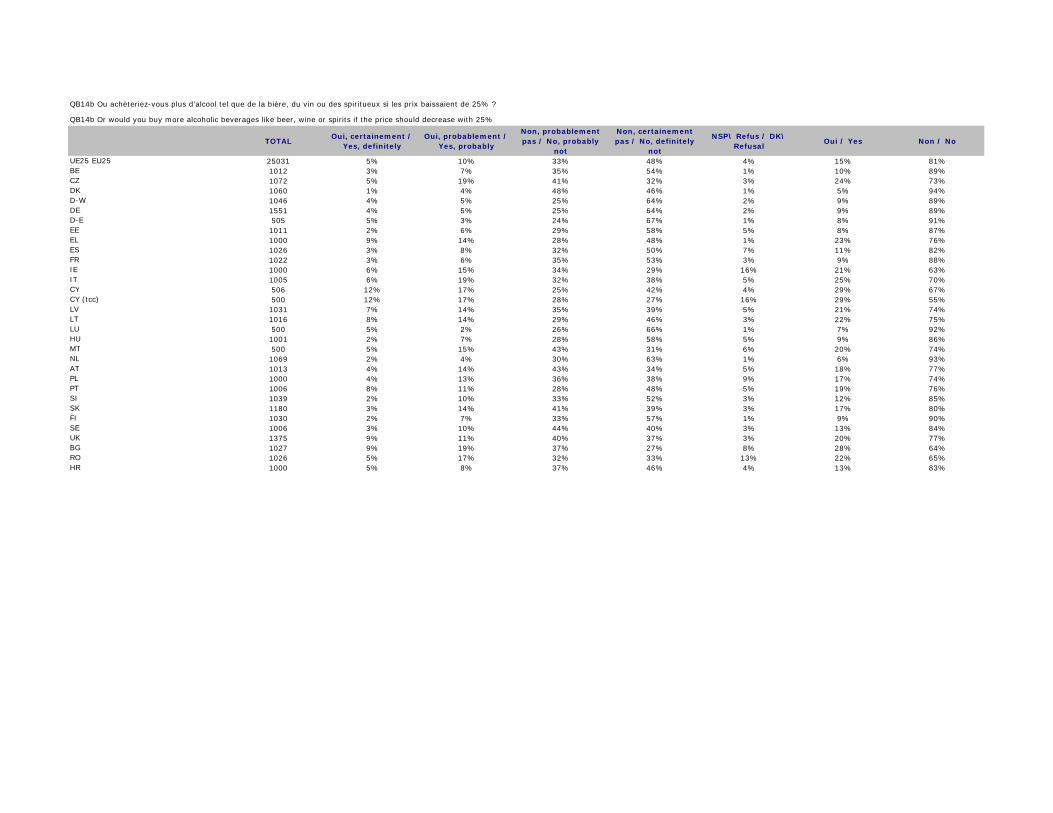
TOTALOui, certainement /
Yes, definitelyOui, probablement /
Yes, probably
Non, probablement pas / No, probably
not
Non, certainement pas / No, definitely
not
NSP\ Refus / DK\ Refusal
Oui / Yes Non / No
UE25 EU25 25031 5% 10% 33% 48% 4% 15% 81%BE 1012 3% 7% 35% 54% 1% 10% 89%CZ 1072 5% 19% 41% 32% 3% 24% 73%DK 1060 1% 4% 48% 46% 1% 5% 94%D-W 1046 4% 5% 25% 64% 2% 9% 89%DE 1551 4% 5% 25% 64% 2% 9% 89%D-E 505 5% 3% 24% 67% 1% 8% 91%EE 1011 2% 6% 29% 58% 5% 8% 87%EL 1000 9% 14% 28% 48% 1% 23% 76%ES 1026 3% 8% 32% 50% 7% 11% 82%FR 1022 3% 6% 35% 53% 3% 9% 88%IE 1000 6% 15% 34% 29% 16% 21% 63%IT 1005 6% 19% 32% 38% 5% 25% 70%CY 506 12% 17% 25% 42% 4% 29% 67%CY (tcc) 500 12% 17% 28% 27% 16% 29% 55%LV 1031 7% 14% 35% 39% 5% 21% 74%LT 1016 8% 14% 29% 46% 3% 22% 75%LU 500 5% 2% 26% 66% 1% 7% 92%HU 1001 2% 7% 28% 58% 5% 9% 86%MT 500 5% 15% 43% 31% 6% 20% 74%NL 1069 2% 4% 30% 63% 1% 6% 93%AT 1013 4% 14% 43% 34% 5% 18% 77%PL 1000 4% 13% 36% 38% 9% 17% 74%PT 1006 8% 11% 28% 48% 5% 19% 76%SI 1039 2% 10% 33% 52% 3% 12% 85%SK 1180 3% 14% 41% 39% 3% 17% 80%FI 1030 2% 7% 33% 57% 1% 9% 90%SE 1006 3% 10% 44% 40% 3% 13% 84%UK 1375 9% 11% 40% 37% 3% 20% 77%BG 1027 9% 19% 37% 27% 8% 28% 64%RO 1026 5% 17% 32% 33% 13% 22% 65%HR 1000 5% 8% 37% 46% 4% 13% 83%
QB14b Ou achèteriez-vous plus d’alcool tel que de la bière, du vin ou des spiritueux si les prix baissaient de 25% ?
QB14b Or would you buy more alcoholic beverages like beer, wine or spirits if the price should decrease with 25%

TOTAL 00,00 gl 0,01 - 0,59 gl 0,60 - 1 glPlus d'1 g/l / More than
1 g/lNSP / DK Moyenne / Average
UE25 EU25 25031 6% 51% 4% 3% 36% 0,1BE 1012 - 73% 3% 4% 20% 0,2CZ 1072 75% 11% - - 14% 0,0DK 1060 - 77% 10% 2% 11% 0,0D-W 1046 2% 86% 2% 3% 7% 0,1DE 1551 4% 86% 2% 2% 6% 0,1D-E 505 7% 84% 1% 2% 6% 0,0EE 1011 53% 19% 2% 10% 16% 0,9EL 1000 - 44% 7% - 49% 0,0ES 1026 - 36% 3% 2% 59% 0,1FR 1022 2% 77% 10% 3% 8% 0,1IE 1000 1% 33% - - 66% 0,0IT 1005 2% 18% 2% 4% 74% 0,6CY 506 - 23% - - 77% 0,0CY (tcc) 500 - 21% 10% 1% 68% 0,1LV 1031 - 60% 2% 3% 35% 0,1LT 1016 3% 60% 1% 3% 33% 0,1LU 500 2% 18% 60% 1% 19% 0,0HU 1001 39% 28% 1% - 32% 0,0MT 500 - 2% - 2% 96% 1,1NL 1069 1% 58% 2% 11% 28% 0,3AT 1013 3% 88% 1% 1% 7% 0,0PL 1000 9% 61% 1% 2% 27% 0,1PT 1006 - 54% 4% 5% 37% 0,1SI 1039 5% 82% 1% - 12% 0,0SK 1180 57% 17% 1% - 25% 0,0FI 1030 2% 74% 3% 7% 14% 0,4SE 1006 10% 72% 2% 1% 15% 0,0UK 1375 - 19% 9% 2% 70% 0,2BG 1027 1% 28% 1% 2% 68% 0,1RO 1026 3% 14% 7% - 76% 0,1HR 1000 89% 5% - - 6% 0,0
QB15a Quelle est la limite du taux d’alcoolémie dans le sang autorisé pour les conducteurs en (NOTRE PAYS) ?
QB15a What is the legal blood alcohol level (BAC) allowed for car drivers in (OUR COUNTRY)?
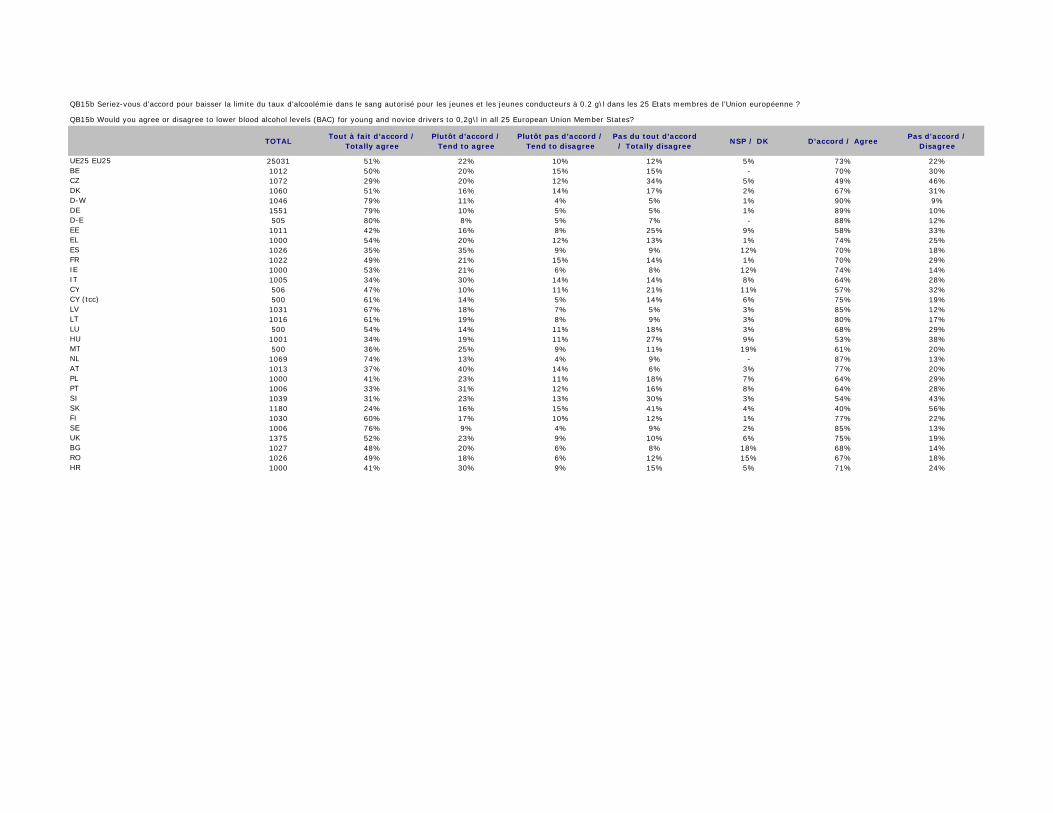
TOTALTout à fait d’accord /
Totally agreePlutôt d’accord /
Tend to agreePlutôt pas d’accord /
Tend to disagreePas du tout d’accord
/ Totally disagreeNSP / DK D'accord / Agree
Pas d'accord / Disagree
UE25 EU25 25031 51% 22% 10% 12% 5% 73% 22%BE 1012 50% 20% 15% 15% - 70% 30%CZ 1072 29% 20% 12% 34% 5% 49% 46%DK 1060 51% 16% 14% 17% 2% 67% 31%D-W 1046 79% 11% 4% 5% 1% 90% 9%DE 1551 79% 10% 5% 5% 1% 89% 10%D-E 505 80% 8% 5% 7% - 88% 12%EE 1011 42% 16% 8% 25% 9% 58% 33%EL 1000 54% 20% 12% 13% 1% 74% 25%ES 1026 35% 35% 9% 9% 12% 70% 18%FR 1022 49% 21% 15% 14% 1% 70% 29%IE 1000 53% 21% 6% 8% 12% 74% 14%IT 1005 34% 30% 14% 14% 8% 64% 28%CY 506 47% 10% 11% 21% 11% 57% 32%CY (tcc) 500 61% 14% 5% 14% 6% 75% 19%LV 1031 67% 18% 7% 5% 3% 85% 12%LT 1016 61% 19% 8% 9% 3% 80% 17%LU 500 54% 14% 11% 18% 3% 68% 29%HU 1001 34% 19% 11% 27% 9% 53% 38%MT 500 36% 25% 9% 11% 19% 61% 20%NL 1069 74% 13% 4% 9% - 87% 13%AT 1013 37% 40% 14% 6% 3% 77% 20%PL 1000 41% 23% 11% 18% 7% 64% 29%PT 1006 33% 31% 12% 16% 8% 64% 28%SI 1039 31% 23% 13% 30% 3% 54% 43%SK 1180 24% 16% 15% 41% 4% 40% 56%FI 1030 60% 17% 10% 12% 1% 77% 22%SE 1006 76% 9% 4% 9% 2% 85% 13%UK 1375 52% 23% 9% 10% 6% 75% 19%BG 1027 48% 20% 6% 8% 18% 68% 14%RO 1026 49% 18% 6% 12% 15% 67% 18%HR 1000 41% 30% 9% 15% 5% 71% 24%
QB15b Seriez-vous d’accord pour baisser la limite du taux d’alcoolémie dans le sang autorisé pour les jeunes et les jeunes conducteurs à 0.2 g\l dans les 25 Etats membres de l’Union européenne ?
QB15b Would you agree or disagree to lower blood alcohol levels (BAC) for young and novice drivers to 0,2g\l in all 25 European Union Member States?

TOTALTout à fait d’accord /
Totally agreePlutôt d’accord /
Tend to agreePlutôt pas d’accord /
Tend to disagreePas du tout d’accord
/ Totally disagreeNSP / DK D'accord / Agree
Pas d'accord / Disagree
UE25 EU25 25031 47% 33% 12% 6% 2% 80% 18%BE 1012 48% 35% 12% 5% - 83% 17%CZ 1072 45% 33% 16% 5% 1% 78% 21%DK 1060 30% 40% 19% 9% 2% 70% 28%D-W 1046 50% 24% 18% 7% 1% 74% 25%DE 1551 49% 24% 17% 9% 1% 73% 26%D-E 505 46% 21% 16% 16% 1% 67% 32%EE 1011 51% 30% 10% 6% 3% 81% 16%EL 1000 65% 27% 6% 2% - 92% 8%ES 1026 56% 34% 6% 2% 2% 90% 8%FR 1022 40% 40% 11% 8% 1% 80% 19%IE 1000 61% 30% 6% 2% 1% 91% 8%IT 1005 47% 35% 10% 5% 3% 82% 15%CY 506 58% 19% 13% 8% 2% 77% 21%CY (tcc) 500 66% 15% 8% 10% 1% 81% 18%LV 1031 56% 29% 10% 4% 1% 85% 14%LT 1016 53% 29% 11% 5% 2% 82% 16%LU 500 52% 29% 13% 5% 1% 81% 18%HU 1001 42% 34% 11% 10% 3% 76% 21%MT 500 59% 32% 8% 1% - 91% 9%NL 1069 37% 37% 16% 9% 1% 74% 25%AT 1013 35% 39% 20% 3% 3% 74% 23%PL 1000 44% 34% 13% 6% 3% 78% 19%PT 1006 50% 36% 10% 2% 2% 86% 12%SI 1039 34% 36% 22% 7% 1% 70% 29%SK 1180 51% 33% 12% 4% - 84% 16%FI 1030 46% 36% 13% 4% 1% 82% 17%SE 1006 56% 34% 7% 3% - 90% 10%UK 1375 46% 36% 10% 6% 2% 82% 16%BG 1027 61% 28% 4% 1% 6% 89% 5%RO 1026 67% 25% 2% 2% 4% 92% 4%HR 1000 43% 35% 12% 7% 3% 78% 19%
Random police alcohol checks on EU roads would reduce people alcohol consumption before driving
QB16.1 Dans quelle mesure êtes-vous d’accord ou pas d'accord avec les propositions suivantes ?
QB16.1 To what extent do you agree or disagree with the following?
Des contrôles policiers aléatoires du taux d’alcoolémie sur les routes de l’UE réduiraient la consommation d’alcool des gens qui s’apprêtent à prendre le volant
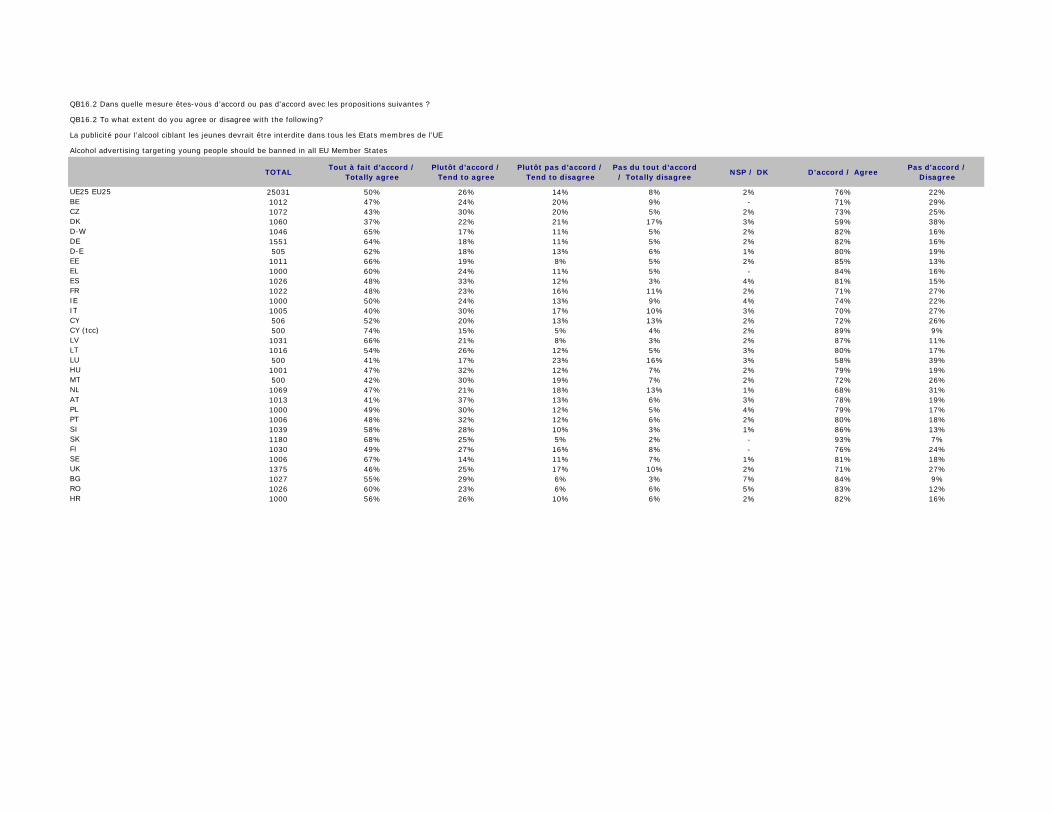
TOTALTout à fait d’accord /
Totally agreePlutôt d’accord /
Tend to agreePlutôt pas d’accord /
Tend to disagreePas du tout d’accord
/ Totally disagreeNSP / DK D'accord / Agree
Pas d'accord / Disagree
UE25 EU25 25031 50% 26% 14% 8% 2% 76% 22%BE 1012 47% 24% 20% 9% - 71% 29%CZ 1072 43% 30% 20% 5% 2% 73% 25%DK 1060 37% 22% 21% 17% 3% 59% 38%D-W 1046 65% 17% 11% 5% 2% 82% 16%DE 1551 64% 18% 11% 5% 2% 82% 16%D-E 505 62% 18% 13% 6% 1% 80% 19%EE 1011 66% 19% 8% 5% 2% 85% 13%EL 1000 60% 24% 11% 5% - 84% 16%ES 1026 48% 33% 12% 3% 4% 81% 15%FR 1022 48% 23% 16% 11% 2% 71% 27%IE 1000 50% 24% 13% 9% 4% 74% 22%IT 1005 40% 30% 17% 10% 3% 70% 27%CY 506 52% 20% 13% 13% 2% 72% 26%CY (tcc) 500 74% 15% 5% 4% 2% 89% 9%LV 1031 66% 21% 8% 3% 2% 87% 11%LT 1016 54% 26% 12% 5% 3% 80% 17%LU 500 41% 17% 23% 16% 3% 58% 39%HU 1001 47% 32% 12% 7% 2% 79% 19%MT 500 42% 30% 19% 7% 2% 72% 26%NL 1069 47% 21% 18% 13% 1% 68% 31%AT 1013 41% 37% 13% 6% 3% 78% 19%PL 1000 49% 30% 12% 5% 4% 79% 17%PT 1006 48% 32% 12% 6% 2% 80% 18%SI 1039 58% 28% 10% 3% 1% 86% 13%SK 1180 68% 25% 5% 2% - 93% 7%FI 1030 49% 27% 16% 8% - 76% 24%SE 1006 67% 14% 11% 7% 1% 81% 18%UK 1375 46% 25% 17% 10% 2% 71% 27%BG 1027 55% 29% 6% 3% 7% 84% 9%RO 1026 60% 23% 6% 6% 5% 83% 12%HR 1000 56% 26% 10% 6% 2% 82% 16%
Alcohol advertising targeting young people should be banned in all EU Member States
QB16.2 Dans quelle mesure êtes-vous d’accord ou pas d'accord avec les propositions suivantes ?
QB16.2 To what extent do you agree or disagree with the following?
La publicité pour l’alcool ciblant les jeunes devrait être interdite dans tous les Etats membres de l’UE
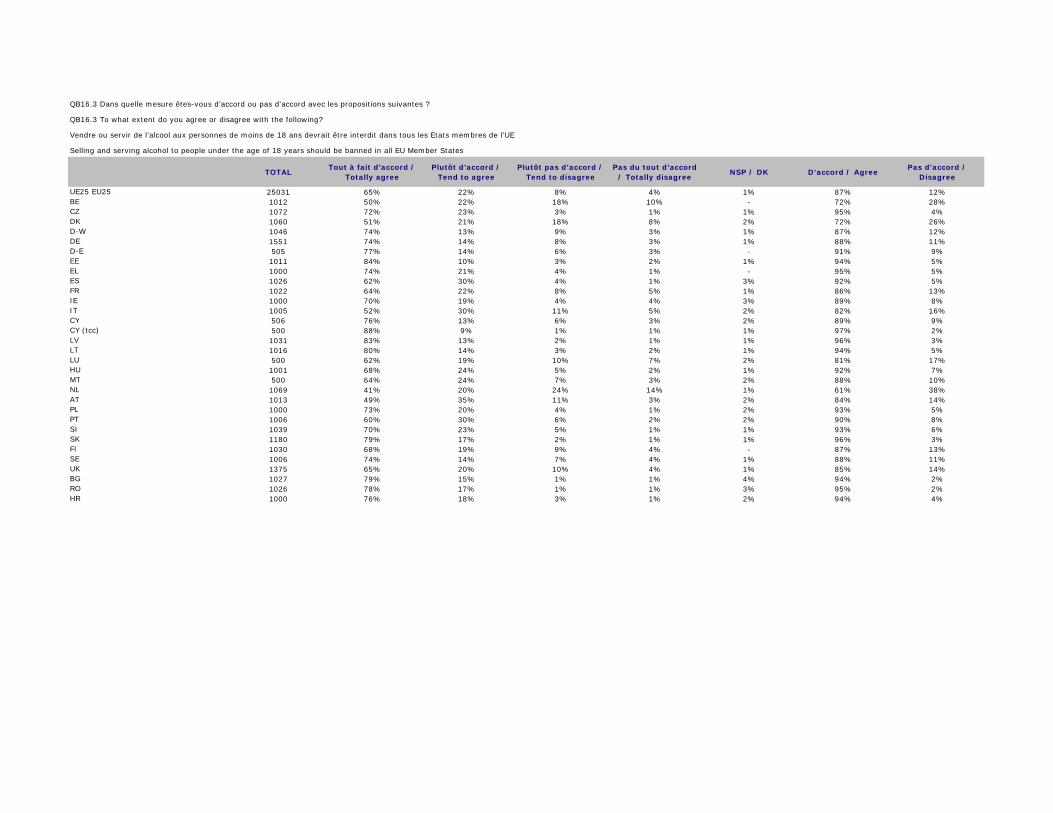
TOTALTout à fait d’accord /
Totally agreePlutôt d’accord /
Tend to agreePlutôt pas d’accord /
Tend to disagreePas du tout d’accord
/ Totally disagreeNSP / DK D'accord / Agree
Pas d'accord / Disagree
UE25 EU25 25031 65% 22% 8% 4% 1% 87% 12%BE 1012 50% 22% 18% 10% - 72% 28%CZ 1072 72% 23% 3% 1% 1% 95% 4%DK 1060 51% 21% 18% 8% 2% 72% 26%D-W 1046 74% 13% 9% 3% 1% 87% 12%DE 1551 74% 14% 8% 3% 1% 88% 11%D-E 505 77% 14% 6% 3% - 91% 9%EE 1011 84% 10% 3% 2% 1% 94% 5%EL 1000 74% 21% 4% 1% - 95% 5%ES 1026 62% 30% 4% 1% 3% 92% 5%FR 1022 64% 22% 8% 5% 1% 86% 13%IE 1000 70% 19% 4% 4% 3% 89% 8%IT 1005 52% 30% 11% 5% 2% 82% 16%CY 506 76% 13% 6% 3% 2% 89% 9%CY (tcc) 500 88% 9% 1% 1% 1% 97% 2%LV 1031 83% 13% 2% 1% 1% 96% 3%LT 1016 80% 14% 3% 2% 1% 94% 5%LU 500 62% 19% 10% 7% 2% 81% 17%HU 1001 68% 24% 5% 2% 1% 92% 7%MT 500 64% 24% 7% 3% 2% 88% 10%NL 1069 41% 20% 24% 14% 1% 61% 38%AT 1013 49% 35% 11% 3% 2% 84% 14%PL 1000 73% 20% 4% 1% 2% 93% 5%PT 1006 60% 30% 6% 2% 2% 90% 8%SI 1039 70% 23% 5% 1% 1% 93% 6%SK 1180 79% 17% 2% 1% 1% 96% 3%FI 1030 68% 19% 9% 4% - 87% 13%SE 1006 74% 14% 7% 4% 1% 88% 11%UK 1375 65% 20% 10% 4% 1% 85% 14%BG 1027 79% 15% 1% 1% 4% 94% 2%RO 1026 78% 17% 1% 1% 3% 95% 2%HR 1000 76% 18% 3% 1% 2% 94% 4%
Selling and serving alcohol to people under the age of 18 years should be banned in all EU Member States
QB16.3 Dans quelle mesure êtes-vous d’accord ou pas d'accord avec les propositions suivantes ?
QB16.3 To what extent do you agree or disagree with the following?
Vendre ou servir de l’alcool aux personnes de moins de 18 ans devrait être interdit dans tous les Etats membres de l’UE

TOTALTout à fait d’accord /
Totally agreePlutôt d’accord /
Tend to agreePlutôt pas d’accord /
Tend to disagreePas du tout d’accord
/ Totally disagreeNSP / DK D'accord / Agree
Pas d'accord / Disagree
UE25 EU25 25031 47% 30% 12% 9% 2% 77% 21%BE 1012 54% 25% 13% 8% - 79% 21%CZ 1072 38% 32% 18% 10% 2% 70% 28%DK 1060 34% 23% 22% 19% 2% 57% 41%D-W 1046 49% 20% 17% 13% 1% 69% 30%DE 1551 48% 21% 17% 13% 1% 69% 30%D-E 505 43% 24% 18% 14% 1% 67% 32%EE 1011 38% 25% 17% 13% 7% 63% 30%EL 1000 60% 29% 8% 3% - 89% 11%ES 1026 41% 43% 8% 3% 5% 84% 11%FR 1022 54% 26% 10% 9% 1% 80% 19%IE 1000 58% 24% 7% 4% 7% 82% 11%IT 1005 41% 38% 11% 7% 3% 79% 18%CY 506 76% 16% 4% 3% 1% 92% 7%CY (tcc) 500 82% 9% 2% 6% 1% 91% 8%LV 1031 52% 23% 14% 9% 2% 75% 23%LT 1016 53% 26% 10% 9% 2% 79% 19%LU 500 48% 21% 13% 17% 1% 69% 30%HU 1001 43% 32% 13% 10% 2% 75% 23%MT 500 71% 22% 4% 2% 1% 93% 6%NL 1069 38% 23% 19% 19% 1% 61% 38%AT 1013 33% 38% 16% 9% 4% 71% 25%PL 1000 61% 28% 5% 3% 3% 89% 8%PT 1006 44% 40% 7% 6% 3% 84% 13%SI 1039 36% 27% 21% 15% 1% 63% 36%SK 1180 56% 31% 8% 3% 2% 87% 11%FI 1030 28% 26% 22% 23% 1% 54% 45%SE 1006 57% 23% 9% 10% 1% 80% 19%UK 1375 47% 28% 14% 8% 3% 75% 22%BG 1027 52% 29% 9% 6% 4% 81% 15%RO 1026 72% 21% 3% 1% 3% 93% 4%HR 1000 69% 22% 4% 3% 2% 91% 7%
QB17 Seriez-vous d’accord ou pas d’accord d’apposer des messages sur les bouteilles d’alcool et les publicités sur l’alcool, pour avertir les femmes enceintes et les conducteurs des dangers de la consommation d’alcool ?
QB17 Would you agree or disagree to put warnings on alcohol bottles and adverts with the purpose to warn pregnant women and drivers of dangers of drinking alcohol?
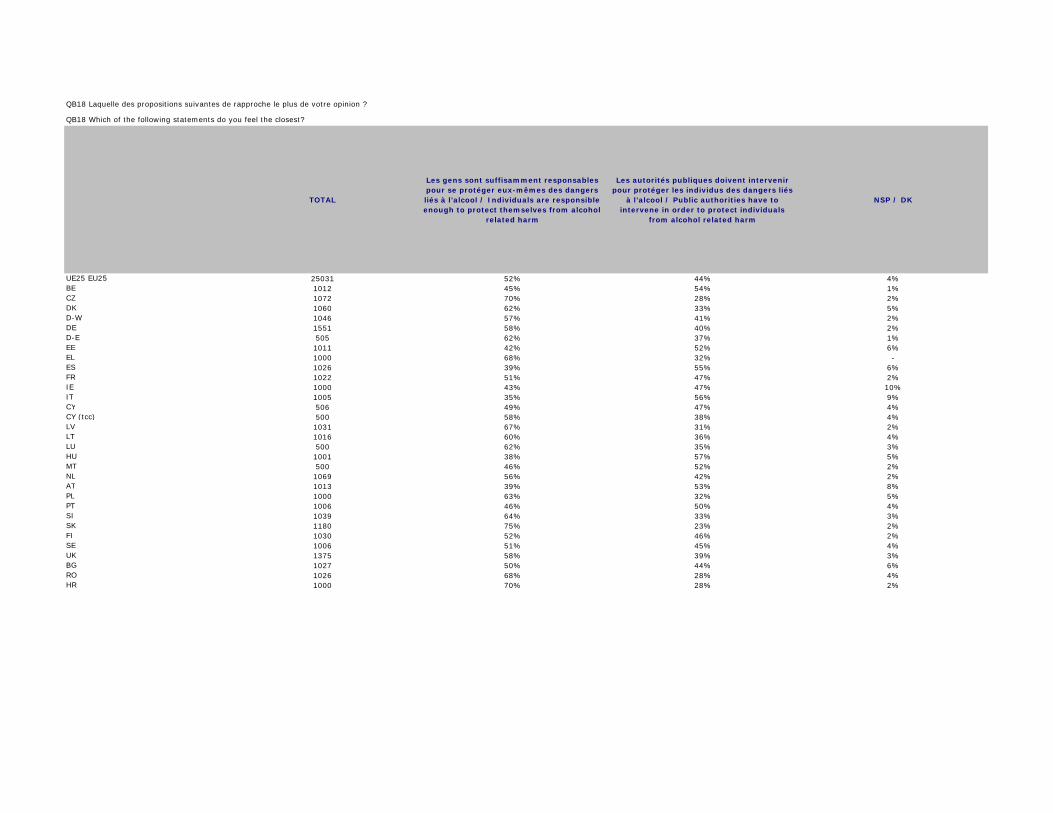
TOTAL
Les gens sont suffisamment responsables pour se protéger eux-mêmes des dangers liés à l’alcool / Individuals are responsible enough to protect themselves from alcohol
related harm
Les autorités publiques doivent intervenir pour protéger les individus des dangers liés
à l’alcool / Public authorities have to intervene in order to protect individuals
from alcohol related harm
NSP / DK
UE25 EU25 25031 52% 44% 4%BE 1012 45% 54% 1%CZ 1072 70% 28% 2%DK 1060 62% 33% 5%D-W 1046 57% 41% 2%DE 1551 58% 40% 2%D-E 505 62% 37% 1%EE 1011 42% 52% 6%EL 1000 68% 32% - ES 1026 39% 55% 6%FR 1022 51% 47% 2%IE 1000 43% 47% 10%IT 1005 35% 56% 9%CY 506 49% 47% 4%CY (tcc) 500 58% 38% 4%LV 1031 67% 31% 2%LT 1016 60% 36% 4%LU 500 62% 35% 3%HU 1001 38% 57% 5%MT 500 46% 52% 2%NL 1069 56% 42% 2%AT 1013 39% 53% 8%PL 1000 63% 32% 5%PT 1006 46% 50% 4%SI 1039 64% 33% 3%SK 1180 75% 23% 2%FI 1030 52% 46% 2%SE 1006 51% 45% 4%UK 1375 58% 39% 3%BG 1027 50% 44% 6%RO 1026 68% 28% 4%HR 1000 70% 28% 2%
QB18 Laquelle des propositions suivantes de rapproche le plus de votre opinion ?
QB18 Which of the following statements do you feel the closest?
Related Documents