Getting Started with Reports and Dashboards Johan Yu - @simplysfdc Salesforce MVP Singapore User Group - April 2015

Reports and Dashboards - Johan Yu v2
Jul 30, 2015
Welcome message from author
This document is posted to help you gain knowledge. Please leave a comment to let me know what you think about it! Share it to your friends and learn new things together.
Transcript

Getting Started with Reports and DashboardsJohan Yu - @simplysfdc
Salesforce MVP
Singapore User Group - April 2015
Agenda
• Why Reports and Dashboards Matter to You?
• Reports & Dashboards Overview
• Exercise 1: Build Pipeline Reports
• Exercise 2: Use Filters and Filter Logic in a Report
• Use Summary Formulas to Get More from Your Reports
• Exercise 3: Build a Sales Dashboard to Display Data from Sales Reports

Why Reports and Dashboards Matter to You?
• Easy, Fast and Powerful
• Free (included in the platform)
Sales
• What is our closed sales to date?
• What’s in our pipeline this FY?
Support
• How productive are my support agents?
• How are we performing for escalated and high priority cases?

Conceptual Overview
A report type defines the set of records and fields available to a report based on the relationships between a primary
object and its related objects
A report returns a set of records that meets
certain criteria
A dashboard shows data from source reports as visual
components
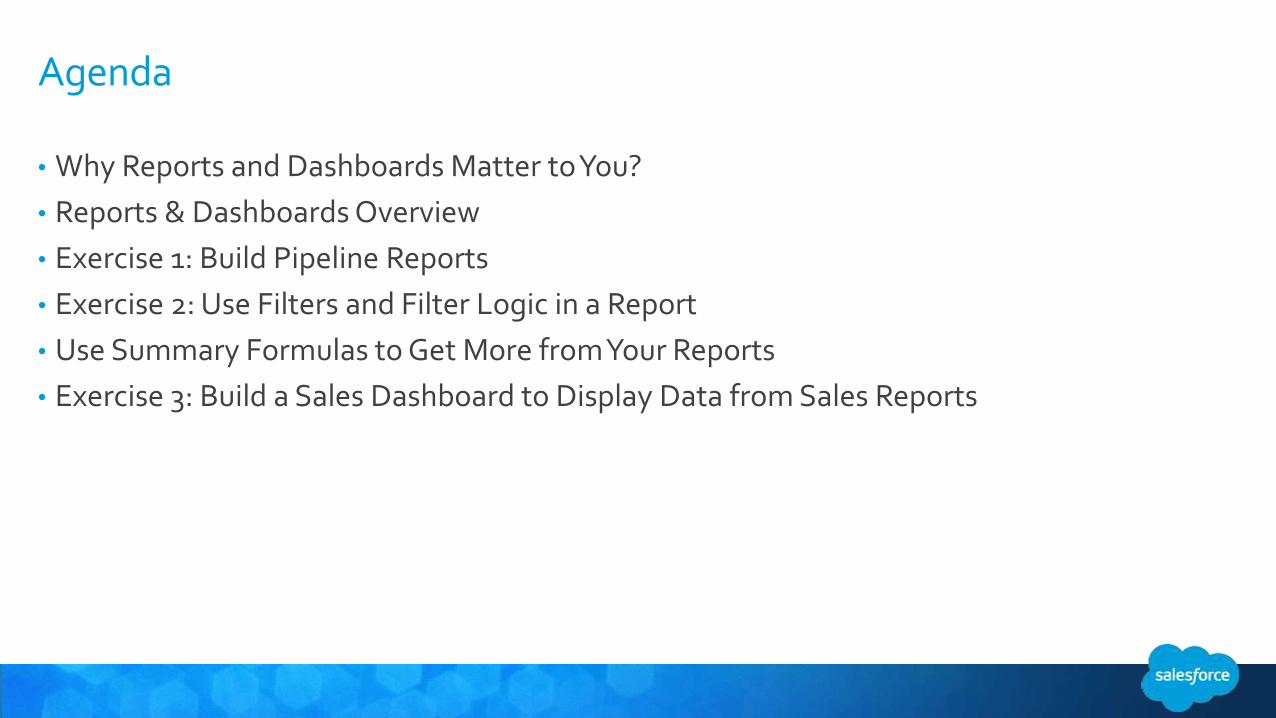
Tabular Report
• Is a basic data report with columns and rows – imagine Excel spreadsheet.
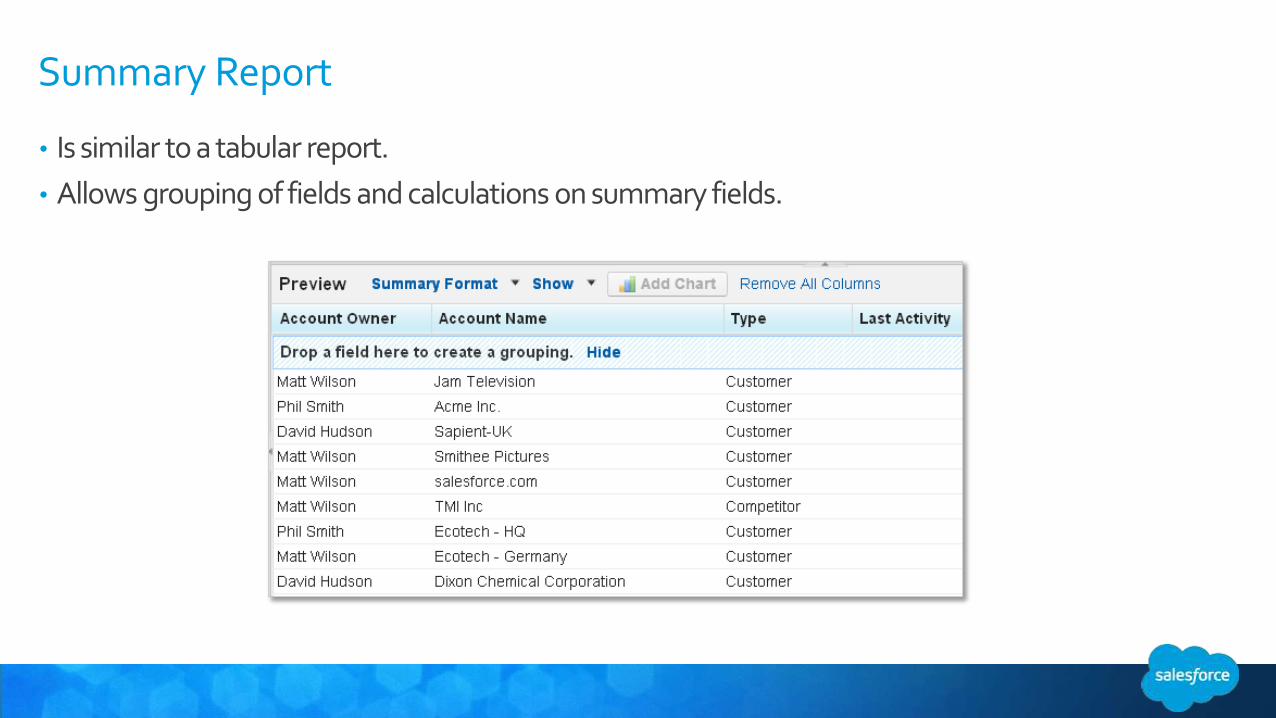
Summary Report
• Is similar to a tabular report.
• Allows grouping of fields and calculations on summary fields.

Matrix Report
• Summarizes data by both rows and columns.
• Great for comparing related totals.
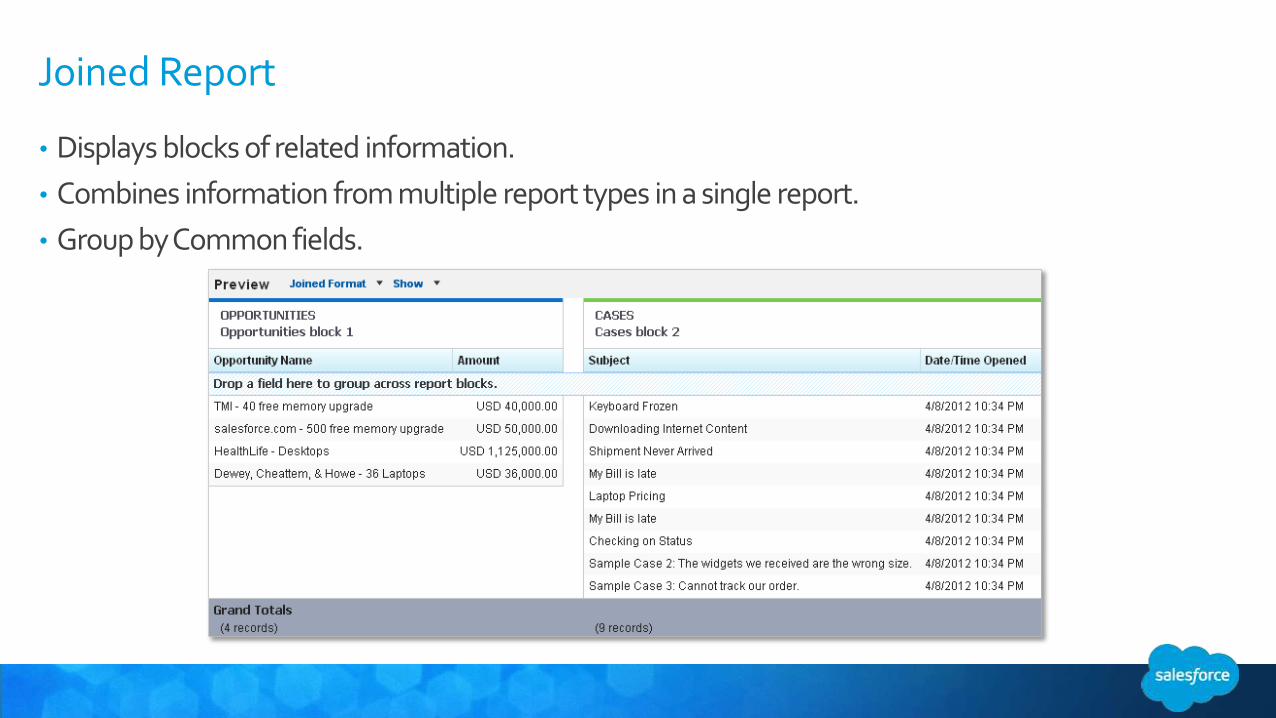
Joined Report
• Displays blocks of related information.
• Combines information from multiple report types in a single report.
• Group by Common fields.

Types of Reports• Standard Reports
– Cannot be deleted.
• Custom Reports – Can be created from standard reports.
– Can be built from scratch.
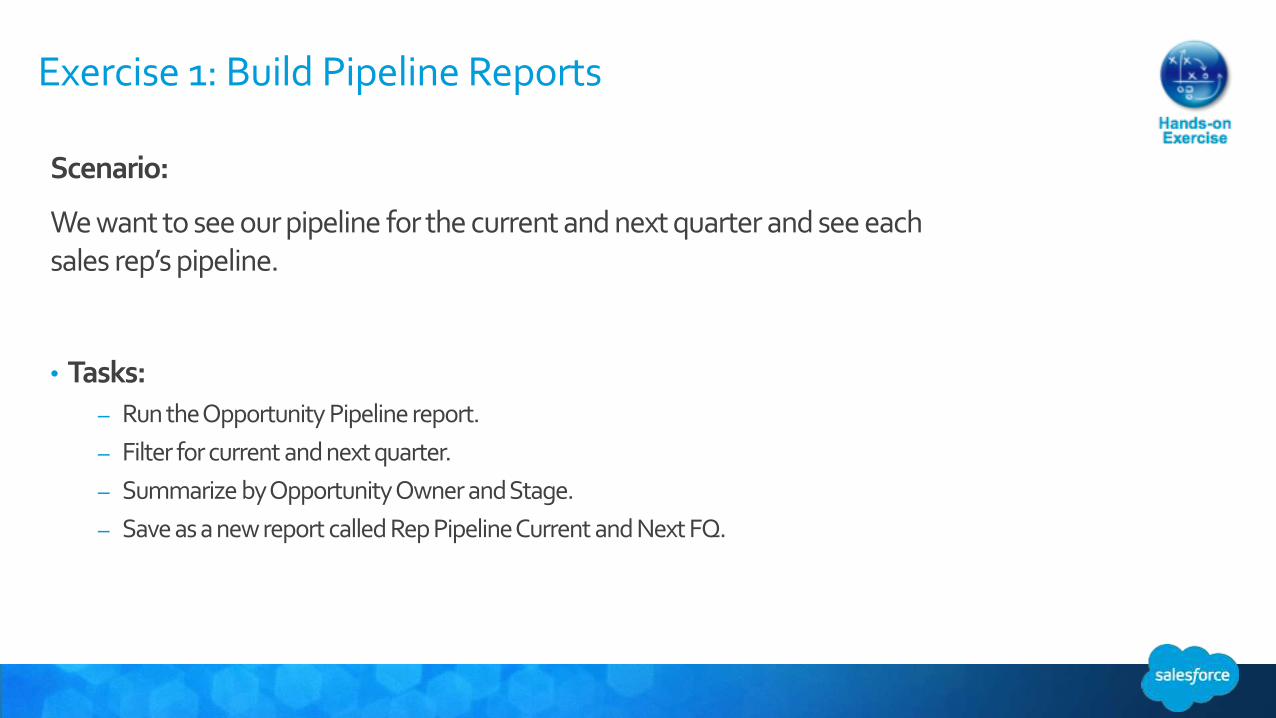
Exercise 1: Build Pipeline Reports
• Tasks:– Run the Opportunity Pipeline report.
– Filter for current and next quarter.
– Summarize by Opportunity Owner and Stage.
– Save as a new report called Rep Pipeline Current and Next FQ.
Scenario:
We want to see our pipeline for the current and next quarter and see each sales rep’s pipeline.
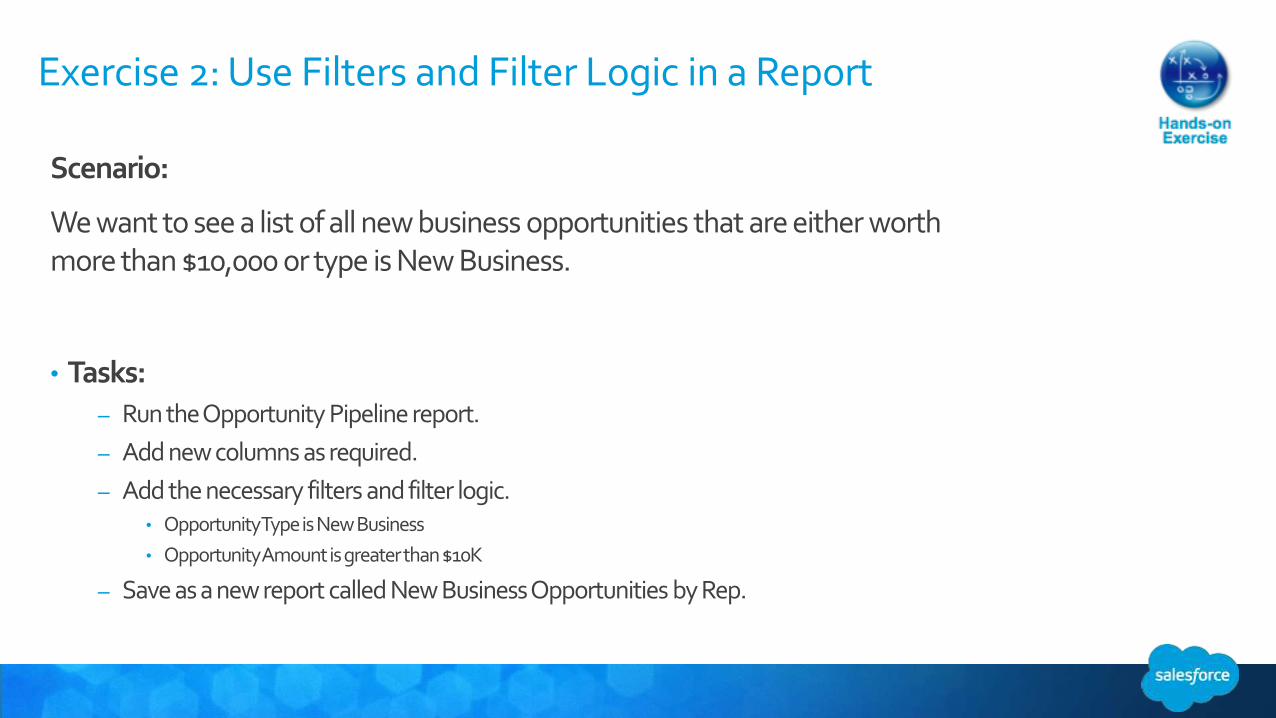
Exercise 2: Use Filters and Filter Logic in a Report
• Tasks:– Run the Opportunity Pipeline report.
– Add new columns as required.
– Add the necessary filters and filter logic.• Opportunity Type is New Business
• Opportunity Amount is greater than $10K
– Save as a new report called New Business Opportunities by Rep.
Scenario:
We want to see a list of all new business opportunities that are either worth more than $10,000 or type is New Business.
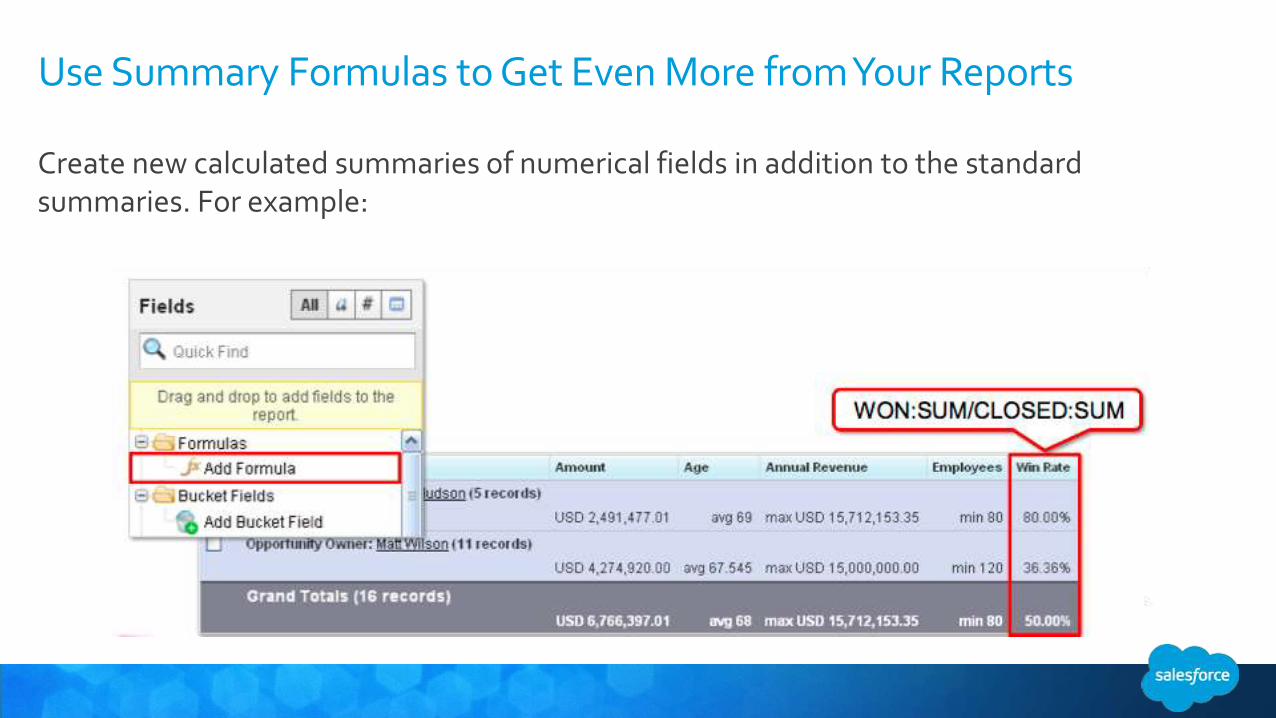
Use Summary Formulas to Get Even More from Your Reports
Create new calculated summaries of numerical fields in addition to the standard summaries. For example:
Exercise 3: Build a Sales Dashboard to Display Data
• Tasks:– Create a new sales dashboard.
– Add the required Components and Data Sources.
– Save the Sales Team Dashboard.
Scenario:
We want to see the summary information from our sales reports displayed in a single dashboard.

Sample Dashboard

Want to View Your Dashboards on Your Mobile Device?
Use the new mobile app Salesforce1!
Salesforce1 lets you:
• View and refresh your dashboards.
• Comment on a dashboard Chatter feed.
• Zoom-in on a individual component.
No configuration required.Just download the app!
Report Best Practices
1. Share report folder visibility only for users need it.
2. Name report folder with the right name – 40 chars.
3. Add fields as needed for that report – performance.
4. Add filter efficiently – performance.
5. Save report with the right name – 40 chars.
6. Add charts to reports to enhance readability.
7. Use bucket field to produce greater report.

Key Resources
1. Salesforce Reports & Dashboards Quick Start
2. Getting Started with Salesforce Reports & Dashboards
3. Salesforce Reporting & Dashboard Book by Singapore MVP!
• Available in Amazon.com, special 40% Discount for Singapore User Group Members
• Ask us during the networking session to learn more
Author: Johan Yu

Salesforce Quiz

Which of the following are valid types of Salesforce reports?
A. Summary Reports
B. Matrix Reports
C. Joined Reports
D. All of the Above
What are types of report format work best as dashboard components?
A. Matrix Reports
B. Summary Reports
C. Tabular Reports
D. A & B

It is possible to view dashboards and reports on Salesforce1 mobile app?
A. True
B. False

Thank You!
Related Documents