Victorian Government Reporting and Analytics Framework The Victorian Government has initiated a reporting and analytics uplift within each department. This framework provides a model for step-changes within each department. February 2014

Reporting and Analytics Framework v1.5
Apr 08, 2016
reporting framwork
Welcome message from author
This document is posted to help you gain knowledge. Please leave a comment to let me know what you think about it! Share it to your friends and learn new things together.
Transcript
Victorian GovernmentReporting and Analytics
Framework
The Victorian Government has initiated a reporting and analytics uplift within each department. This framework provides a model for step-changes within each department.
February 2014
Victorian Government Reporting and Analytics Framework
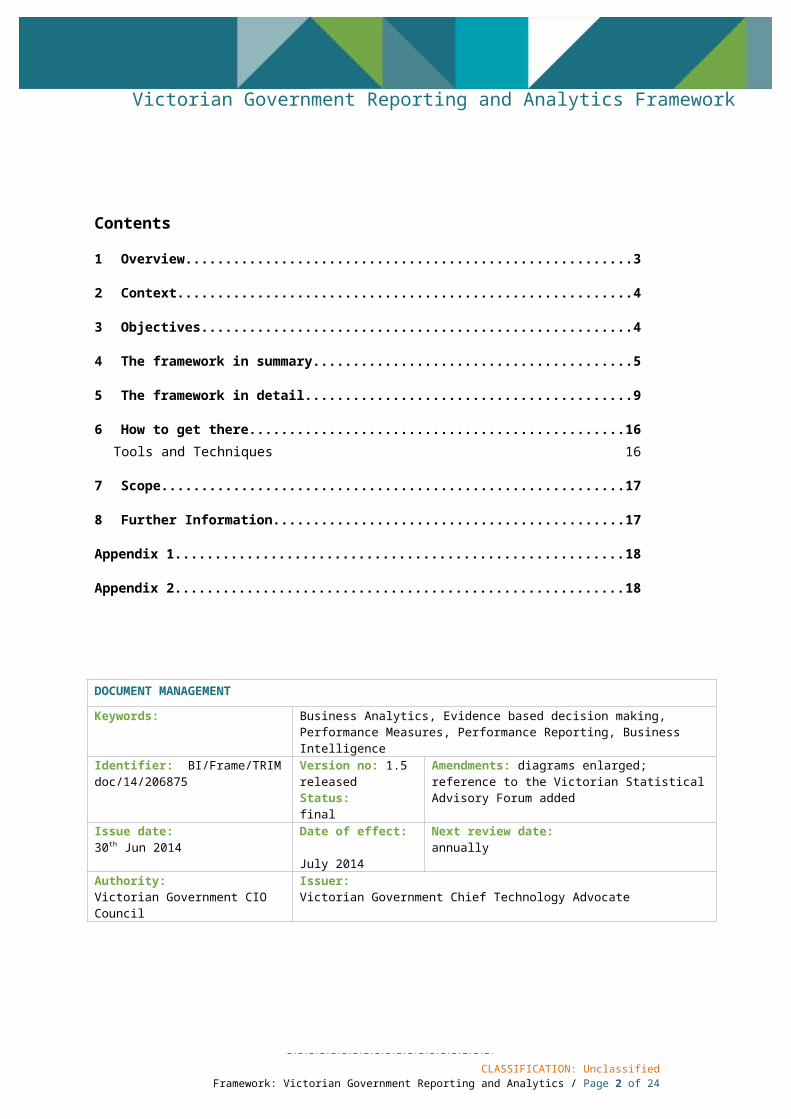
Contents
1 Overview................................................................................................................................ 3
2 Context.................................................................................................................................. 4
3 Objectives.............................................................................................................................. 4
4 The framework in summary....................................................................................................5
5 The framework in detail.......................................................................................................... 9
6 How to get there................................................................................................................... 16Tools and Techniques 16
7 Scope.................................................................................................................................... 17
8 Further Information.............................................................................................................. 17
Appendix 1................................................................................................................................... 18
Appendix 2................................................................................................................................... 18
DOCUMENT MANAGEMENT
Keywords: Business Analytics, Evidence based decision making, Performance Measures, Performance Reporting, Business Intelligence
Identifier: BI/Frame/TRIM doc/14/206875 Version no: 1.5 releasedStatus: final
Amendments: diagrams enlarged; reference to the Victorian Statistical Advisory Forum added
Issue date: 30th Jun 2014
Date of effect: July 2014
Next review date: annually
Authority: Victorian Government CIO Council
Issuer: Victorian Government Chief Technology Advocate
CLASSIFICATION: UnclassifiedFramework: Victorian Government Reporting and Analytics / Page 2 of 18
Victorian Government Reporting and Analytics Framework
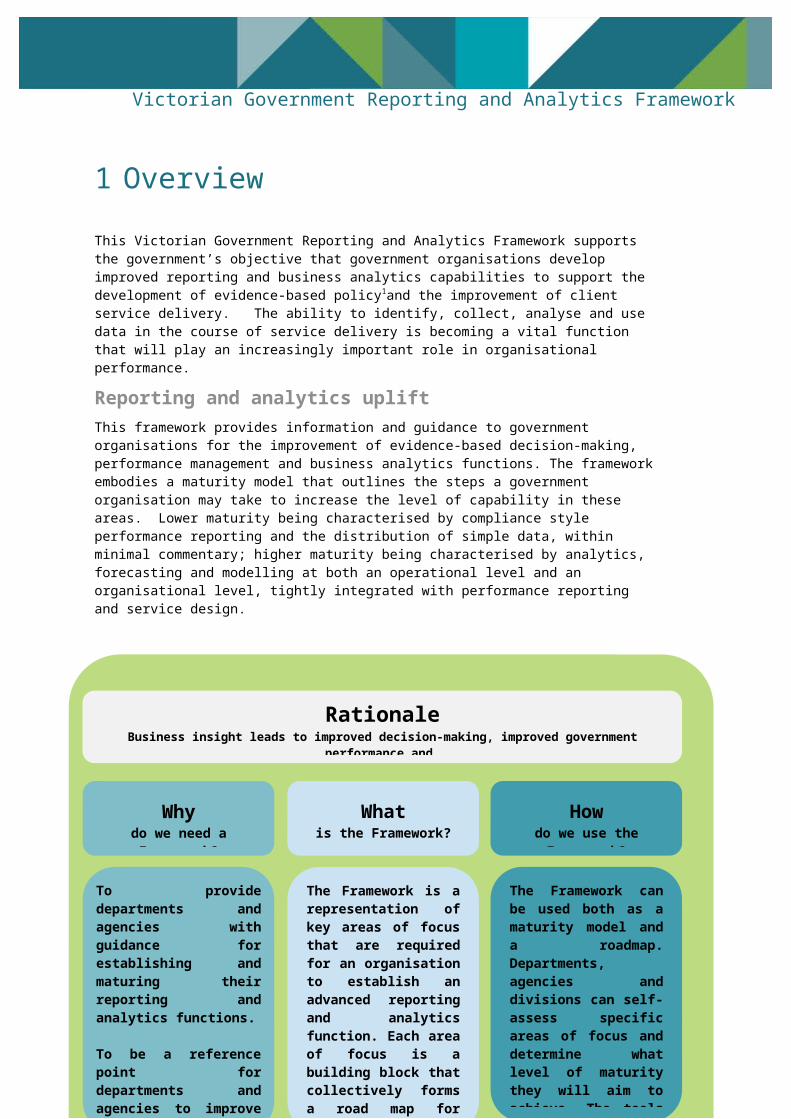
1 Overview
This Victorian Government Reporting and Analytics Framework supports the government’s objective that government organisations develop improved reporting and business analytics capabilities to support the development of evidence-based policy1and the improvement of client service delivery. The ability to identify, collect, analyse and use data in the course of service delivery is becoming a vital function that will play an increasingly important role in organisational performance.
Reporting and analytics upliftThis framework provides information and guidance to government organisations for the improvement of evidence-based decision-making, performance management and business analytics functions. The framework embodies a maturity model that outlines the steps a government organisation may take to increase the level of capability in these areas. Lower maturity being characterised by compliance style performance reporting and the distribution of simple data, within minimal commentary; higher maturity being characterised by analytics, forecasting and modelling at both an operational level and an organisational level, tightly integrated with performance reporting and service design.
1data evidence and statistical analysis that can support policy development and practical program decisions
CLASSIFICATION: UnclassifiedFramework: Victorian Government Reporting and Analytics / Page 3 of 18
The Framework is a representation of key areas of focus that are required for an organisation to establish an advanced reporting and analytics function. Each area of focus is a building block that collectively forms a road map for improvements in an organisation’s reporting and analytics capability.
To provide departments and agencies with guidance for establishing and maturing their reporting and analytics functions. To be a reference point for departments and agencies to improve and increase the use of business analytics as an essential element in decision-making, performance management and reporting.
The Framework can be used both as a maturity model and a roadmap. Departments, agencies and divisions can self-assess specific areas of focus and determine what level of maturity they will aim to achieve. The tools and techniques which support the framework assist the departments and agencies to make small, step-change improvements.
Whydo we need a Framework?
Whatis the Framework?
Howdo we use the Framework?
RationaleBusiness insight leads to improved decision-making, improved government performance and
improved client results
Victorian Government Reporting and Analytics Framework
2 ContextThe Victorian Government’s Information and Communication Technology (ICT) Strategy 2013 to 2014 states the following:
“The Victorian Government will enhance real time reporting and business intelligence capabilities. Government is largely an information-based enterprise and the value of data and analytics in developing evidence-based policy and improving service delivery cannot be underestimated. Government agencies are responsible for delivering outcomes to Victorians, and are judged on their ability to meet measures of success. We can get a clearer picture of the status of government programs by analysing these measures more consistently. Some agencies have already put in place data and analytics programs, but skills and practice can be further enhanced. The introduction of business intelligence software is only one part of the process. Agencies need to be sure of the quality and availability of the underlying data. Key reports and metrics need to be agreed and staff skills are needed to draw insights from analytics reports.”
3 ObjectivesThis framework has been developed in the context of the Victorian Government ICT Strategy. The Reporting and Analytics Framework combined with the future Community of Practice will provide focus for best practice approaches, collaboration and rationalisation of processes and tools across the government to develop evidence-based policy2and improve client service delivery.
Within this context key stakeholders throughout the whole Victorian government have been engaged in order to ensure the framework identifies and builds on existing capability and provides value to government organisations. The framework is based on the following findings.
Maturity ModelAll departments have some level of existing performance reporting and data analytics capability. There is a broad spectrum of methods, capabilities, tools and organisation maturity. There is no single step-change that can be uniformly applied across government. Given this broad spectrum of capabilities and functions, the framework includes a maturity model that can be used to assist organisations self-assess and develop a plan for improving their analytics capability. There is no single or right implementation of the framework; the framework can be applied to different organisational structures and within different organisational constraints. For example, a single division can use the maturity model to self-assess and develop a plan for improvement.
Data Analytics and Performance ReportingThere is, in many cases, a gap between an organisation’s usage of operational data and its ability to harness that data for performance reporting and evidence-based policy formation. The lower the maturity of the data analytics function, the bigger the gap. This framework aims to enable organisations to more closely align and integrate operational data with performance analysis and performance reporting.
Key Performance Indicators (KPIs) and consistent KPI reportingThis framework does not prescribe specific KPIs, measurements or methods. Measures of success at a whole-of-government level are complex due to the diversity of government services that are provided and the diversity of clients. The framework will be supported by other documents including tools and techniques which will provide an outline of the design characteristics of KPIs. This framework also references the Australian Government Architectural Reference Model which provides best practice KPIs.
2data evidence and statistical analysis that can support policy development and practical program decisions
CLASSIFICATION: UnclassifiedFramework: Victorian Government Reporting and Analytics / Page 4 of 18
Victorian Government Reporting and Analytics Framework
Data Analytics and Technology PlatformsThis framework recognises that government organisations typically have existing investments in technology platforms and associated skills, so this framework is independent of technology platforms.
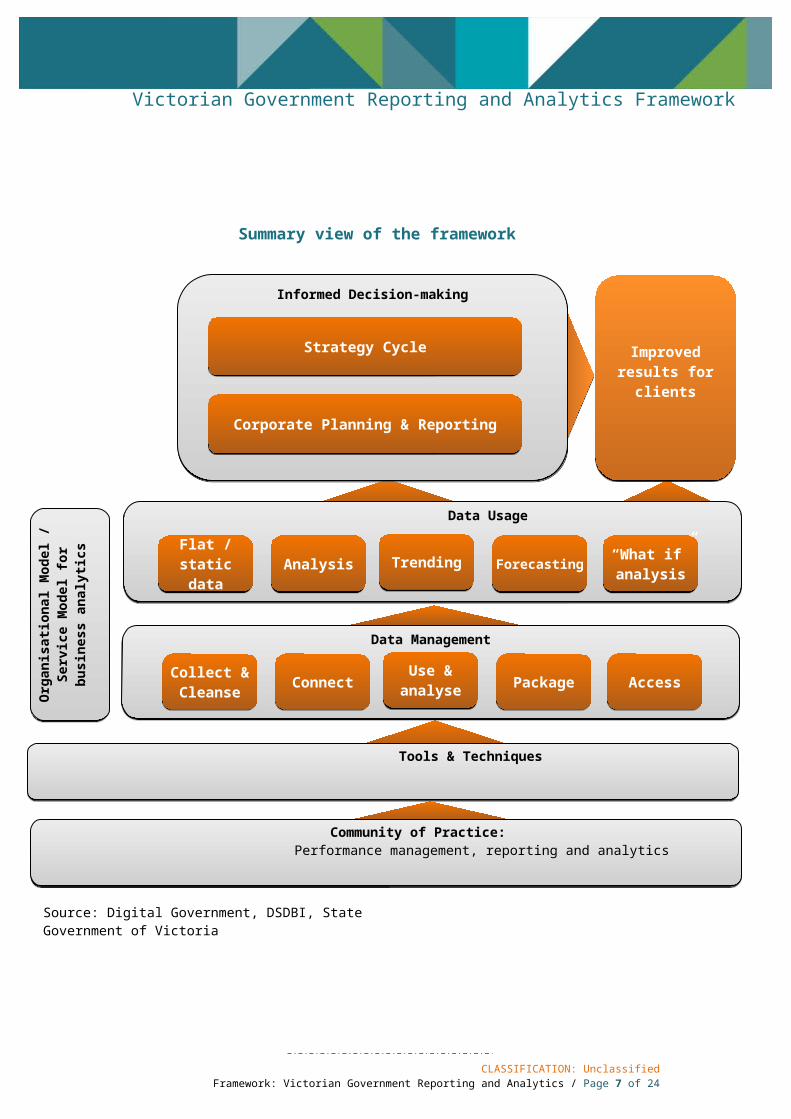
4 The framework in summaryThe Reporting and Analytics Framework is structured in five layers to exhibit how a mature strategic planning lifecycle draws on integrated, reporting and data analytics. The main areas of focus are client, informed decision-making, data usage and data management. The framework is supported by Tools & Techniques (which will be provided as separate documents) and the concept of a Community of Practice. These elements are further explained and elaborated in this document.
The layers explainedThe Informed Decision-making layer represents the strategic planning and corporate level reporting functions that should include evidence-based policy and ongoing service design and improvement. The strategic planning and corporate reporting layers are enriched by a mature and advanced data usage layer.
The Data Usage layer represents the interrogation and usage of data for the purposes of improving the business. It represented as a maturity model. It is the intent of the framework to provide a step-change road map for organisations to move from assembling flat static data through to dynamic what-if analysis of client outcomes.
The Data Management layer represents the data management functions performed by an organisation. The ability of an organisation to mature the data usage layer is underpinned by good Data Management practices.
The Tools and Techniques layer and the Community of Practice layer represent materials and resources that can be used by departments to implement the framework and move up the maturity scale. The tools and techniques will be written and collated during the first two quarters of 2014 and during this time the Community of Practice will be formerly established.
CLASSIFICATION: UnclassifiedFramework: Victorian Government Reporting and Analytics / Page 5 of 18
Victorian Government Reporting and Analytics Framework
Summary view of the framework
CLASSIFICATION: UnclassifiedFramework: Victorian Government Reporting and Analytics / Page 6 of 18
Source: Digital Government, DSDBI, State Government of Victoria
AccessPackageUse & analyseConnectCollect & Cleanse
Organisational Model
/ Service Model
for business analytics Data Management
Community of Practice: Performance management, reporting and analytics
Improved results for clients
Strategy Cycle
“What if” analysis
Tools & Techniques
ForecastingTrendingAnalysisFlat / static data
Data Usage
Corporate Planning & Reporting
Informed Decision-making
Victorian Government Reporting and Analytics Framework
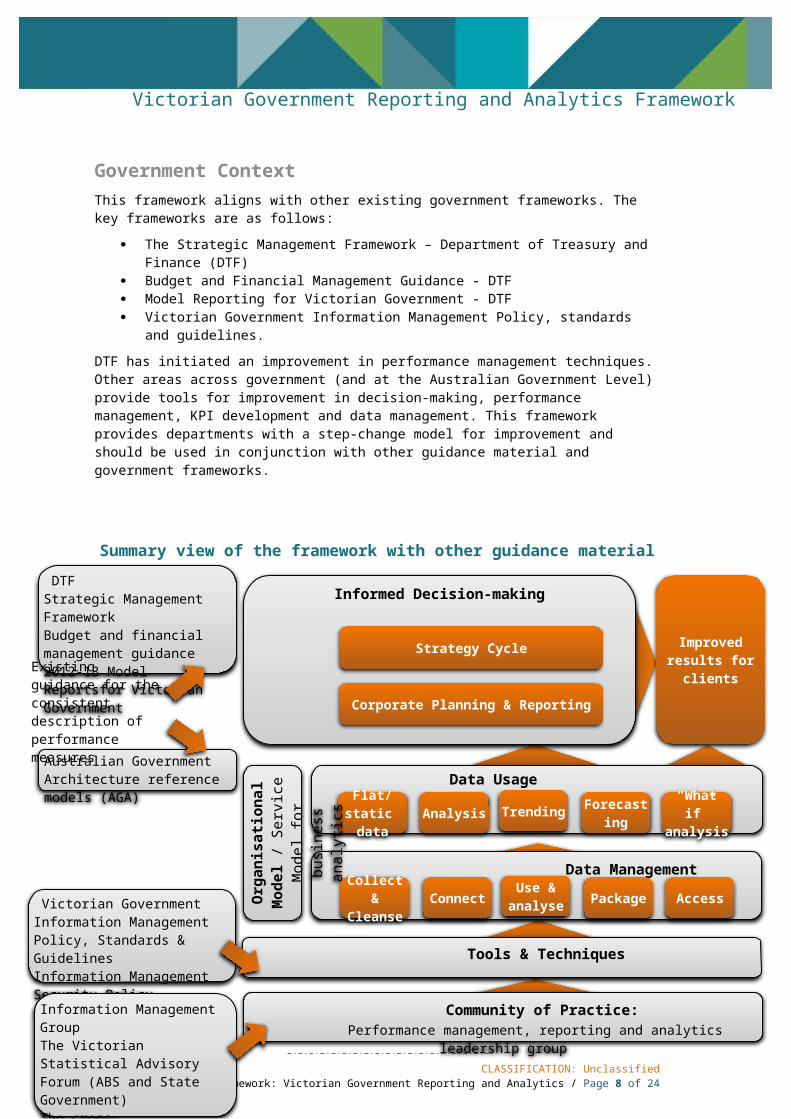
Government ContextThis framework aligns with other existing government frameworks. The key frameworks are as follows:
The Strategic Management Framework – Department of Treasury and Finance (DTF) Budget and Financial Management Guidance - DTF Model Reporting for Victorian Government - DTF Victorian Government Information Management Policy, standards and guidelines.
DTF has initiated an improvement in performance management techniques. Other areas across government (and at the Australian Government Level) provide tools for improvement in decision-making, performance management, KPI development and data management. This framework provides departments with a step-change model for improvement and should be used in conjunction with other guidance material and government frameworks.
Summary view of the framework with other guidance material
CLASSIFICATION: UnclassifiedFramework: Victorian Government Reporting and Analytics / Page 7 of 18
Source: Digital Government, DSDBI, State Government of Victoria
AccessPackageUse &
analyseConnectCollect & Cleanse
Organisational Model
/ Service Model
for business analytics
Data Management
Community of Practice: Performance management, reporting and analytics leadership group
Improved results for clients
Strategy Cycle
“What if” analysis
Tools & Techniques
ForecastingTrendingAnalysisFlat/static data
Data Usage
Corporate Planning & Reporting
Informed Decision-making
Existing guidance for the consistent description of performance measures
DTF• Strategic Management Framework• Budget and financial management
guidance• 2012-13 Model Reports
for Victorian Government
Australian Government Architecture reference models (AGA)
• Information Management Group• The Victorian Statistical Advisory
Forum (ABS and State Government)• The cross-jurisdictional performance
reference group: CSTACI - Commonwealth, State, and Territory advisory Council on Innovation
Victorian Government • Information Management Policy,
Standards & Guidelines• Information Management Security
Policy, Standards and Guidelines
Victorian Government Reporting and Analytics Framework
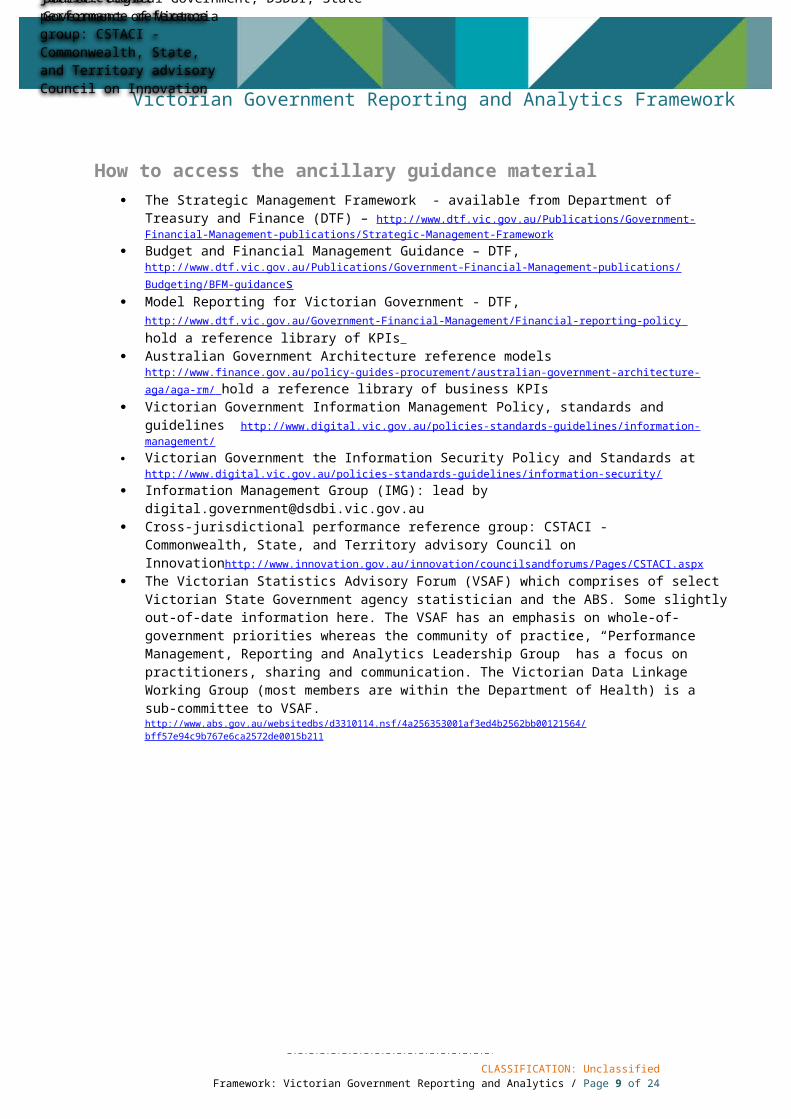
How to access the ancillary guidance material The Strategic Management Framework - available from Department of Treasury and Finance (DTF) –
http://www.dtf.vic.gov.au/Publications/Government-Financial-Management-publications/Strategic-Management-Framework Budget and Financial Management Guidance – DTF, http://www.dtf.vic.gov.au/Publications/Government-Financial-
Management-publications/Budgeting/BFM-guidance s Model Reporting for Victorian Government - DTF,
http://www.dtf.vic.gov.au/Government-Financial-Management/Financial-reporting-policy hold a reference library of KPIs
Australian Government Architecture reference models http://www.finance.gov.au/policy-guides-procurement/australian-government-architecture-aga/aga-rm/ hold a reference library of business KPIs
Victorian Government Information Management Policy, standards and guidelines http://www.digital.vic.gov.au/policies-standards-guidelines/information-management/
Victorian Government the Information Security Policy and Standards at http://www.digital.vic.gov.au/policies-standards-guidelines/information-security/
Information Management Group (IMG): lead by [email protected] Cross-jurisdictional performance reference group: CSTACI - Commonwealth, State, and Territory
advisory Council on Innovationhttp://www.innovation.gov.au/innovation/councilsandforums/Pages/CSTACI.aspx The Victorian Statistics Advisory Forum (VSAF) which comprises of select Victorian State Government agency
statistician and the ABS. Some slightly out-of-date information here. The VSAF has an emphasis on whole-of-government priorities whereas the community of practice, “Performance Management, Reporting and Analytics Leadership Group” has a focus on practitioners, sharing and communication. The Victorian Data Linkage Working Group (most members are within the Department of Health) is a sub-committee to VSAF. http://www.abs.gov.au/websitedbs/d3310114.nsf/4a256353001af3ed4b2562bb00121564/bff57e94c9b767e6ca2572de0015b211
CLASSIFICATION: UnclassifiedFramework: Victorian Government Reporting and Analytics / Page 8 of 18
Victorian Government Reporting and Analytics Framework
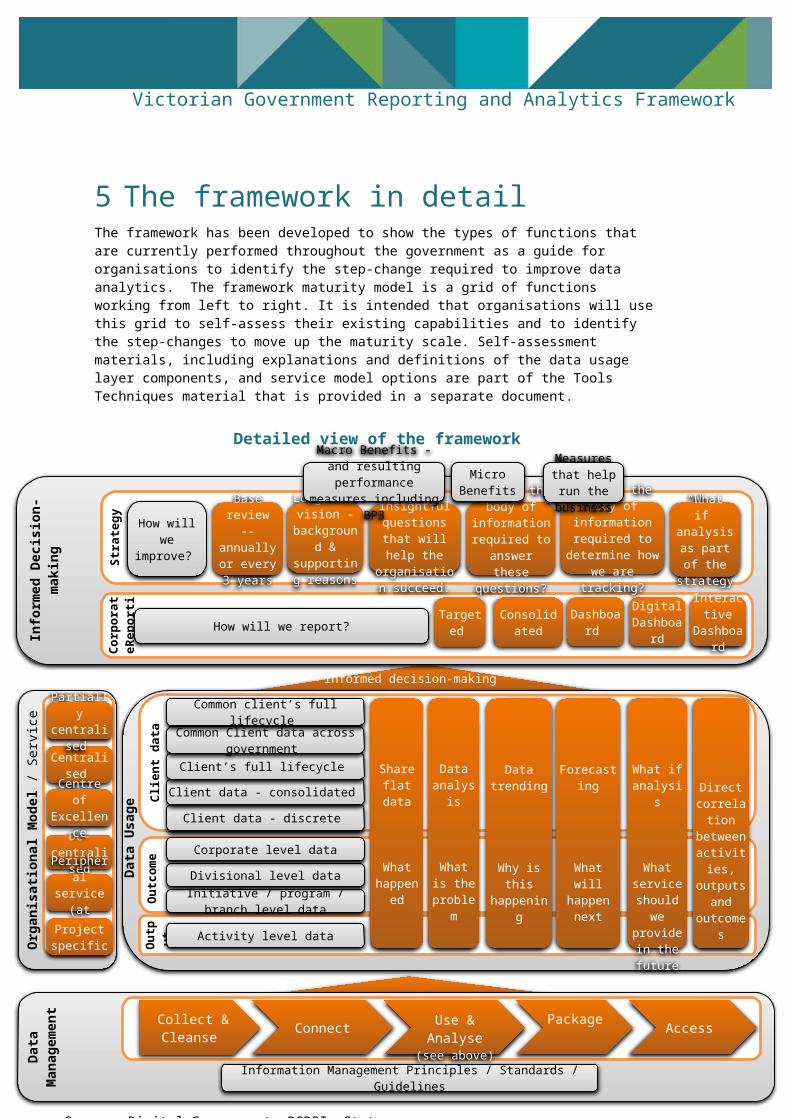
5 The framework in detailThe framework has been developed to show the types of functions that are currently performed throughout the government as a guide for organisations to identify the step-change required to improve data analytics. The framework maturity model is a grid of functions working from left to right. It is intended that organisations will use this grid to self-assess their existing capabilities and to identify the step-changes to move up the maturity scale. Self-assessment materials, including explanations and definitions of the data usage layer components, and service model options are part of the Tools Techniques material that is provided in a separate document.
Detailed view of the framework
CLASSIFICATION: UnclassifiedFramework: Victorian Government Reporting and Analytics / Page 9 of 18
Share flat data
What happened
Data trending
Why is this happening
Data analysis
What is the
problemCorporate level data
Divisional level data
Common client’s full lifecycle
Common Client data across government
Client’s full lifecycle
Client data - consolidated Centre of
Excellence
Project specific
Peripheral service (at cost)
Partially centralised
De-centralised
Centralised
Use & Analyse (see above)
Access Package ConnectCollect & Cleanse
Organisational Model
/ Service Model for business
analytics
Client data - discrete
Measures that help run the
businessMicro
BenefitsMacro Benefits - and
resulting performance measures including BP3
What is the body of information required to determine how we
are tracking?
Develop insightful questions that will
help the organisation
succeed.
Base review -- annually or every 3 years
Long term vision -
background & supporting reasons
What is the body of information
required to answer these questions?
How will we improve?
“What if” analysis as part of the
strategy
Strategy
Interactive Dashboard
What if analysis
What service
should we provide in the future
Forecasting
What will happen next
Digital Dashboard
Dashboard ConsolidatedTargeted How will we report?
CorporateReporting
Information Management Principles / Standards / Guidelines
Activity level data
Initiative / program / branch level data
Data
Usage
Direct correlation between activities, outputs
and outcomes
Outcome
Output
Data Management
Informed Decision-making
Client data
Informed decision-making
Source: Digital Government, DSDBI, State Government of Victoria
Victorian Government Reporting and Analytics Framework
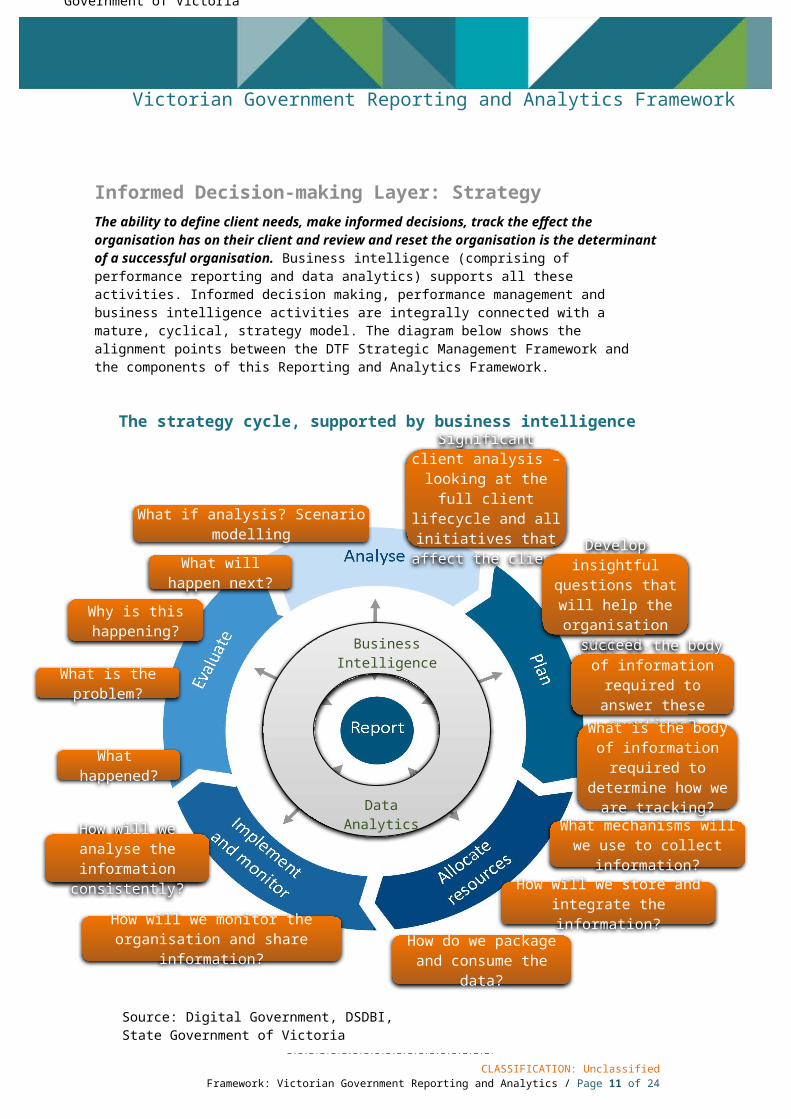
Informed Decision-making Layer: Strategy The ability to define client needs, make informed decisions, track the effect the organisation has on their client and review and reset the organisation is the determinant of a successful organisation. Business intelligence (comprising of performance reporting and data analytics) supports all these activities. Informed decision making, performance management and business intelligence activities are integrally connected with a mature, cyclical, strategy model. The diagram below shows the alignment points between the DTF Strategic Management Framework and the components of this Reporting and Analytics Framework.
The strategy cycle, supported by business intelligence
CLASSIFICATION: UnclassifiedFramework: Victorian Government Reporting and Analytics / Page 10 of 18
What is the problem?
How do we package and consume the data?
What will happen next?
What if analysis? Scenario modelling
Why is this happening?
What happened?
How will we analyse the information consistently?
How will we store and integrate the information?
How will we monitor the organisation and share information?
What mechanisms will we use to collect information?
What is the body of information required to determine how we are
tracking?
Develop insightful questions that will help
the organisation succeed.
What is the body of information required to
answer these questions?
Significant client analysis – looking at the full client lifecycle and all initiatives
that affect the client
Data Analytics
Business Intelligence
Source: Digital Government, DSDBI, State Government of Victoria
Victorian Government Reporting and Analytics Framework
Have insightful questions been developed that will help the organisation succeed?
The rationale for this item is that the data collected is only as good as the questions asked. Questions need to be asked that relate to the key aims of an organisation (and their planned benefits, “macro benefits”). Answers to these questions reflect the overarching organisational performance measures (which typically include a few BP3 measures).
Questions need to be asked that relate to the activities of the organisation (and their planned benefits, “micro benefits”). Answers to these questions reflect the performance measures. A performance contribution diagram would show how each of these measures contribute to the over-arching organisational performance measures. An example diagram will be provided within the tools and techniques.
What is the body of information required to determine how we are tracking?
Have measures been developed that would help run the business? These are measures that would help managers, regional groups and delivery groups know whether they are on-track and/or how their results compare. It is valuable, here for each manager, regional group or delivery group to understand how their results impact on the wider organisation.
Base review - is a significant client analysis performed annually (or every 3 years)?
Is a base review of the group/ organisation and its service offering conducted regularly (for example annually or every 3 years)? To do this, the review would involve an analysis of the full client lifecycle and all the initiatives that affect the client. The review would result in a reset of the service offering.
Informed Decision-making Layer: Reporting Effective distribution and presentation of information leads to improved decision-making. The capability model within this area ranges from basic reporting, where facts are disseminated but not summarised (nor assembled in an easy-to-consume manner) to state-of-the art information communication. Elements to consider are:-
Are the reporting products designed for their audience, ie. targeted? Is a consolidated report (for the organisation / group) produced?
AND are performance measures consolidated for each similar client-cohort? AND is there an attribution chart which depicts how the performance measures are consolidated?
Is the consolidated report presented in an easy-to-consume manner? ie. As a dashboard? Is the dashboard digital? ie. Can it be seen as the dashboard on a computer screen? Is the dashboard interactive? ie. Is it possible to drill-down to see detailed information?
CLASSIFICATION: UnclassifiedFramework: Victorian Government Reporting and Analytics / Page 11 of 18
Victorian Government Reporting and Analytics Framework
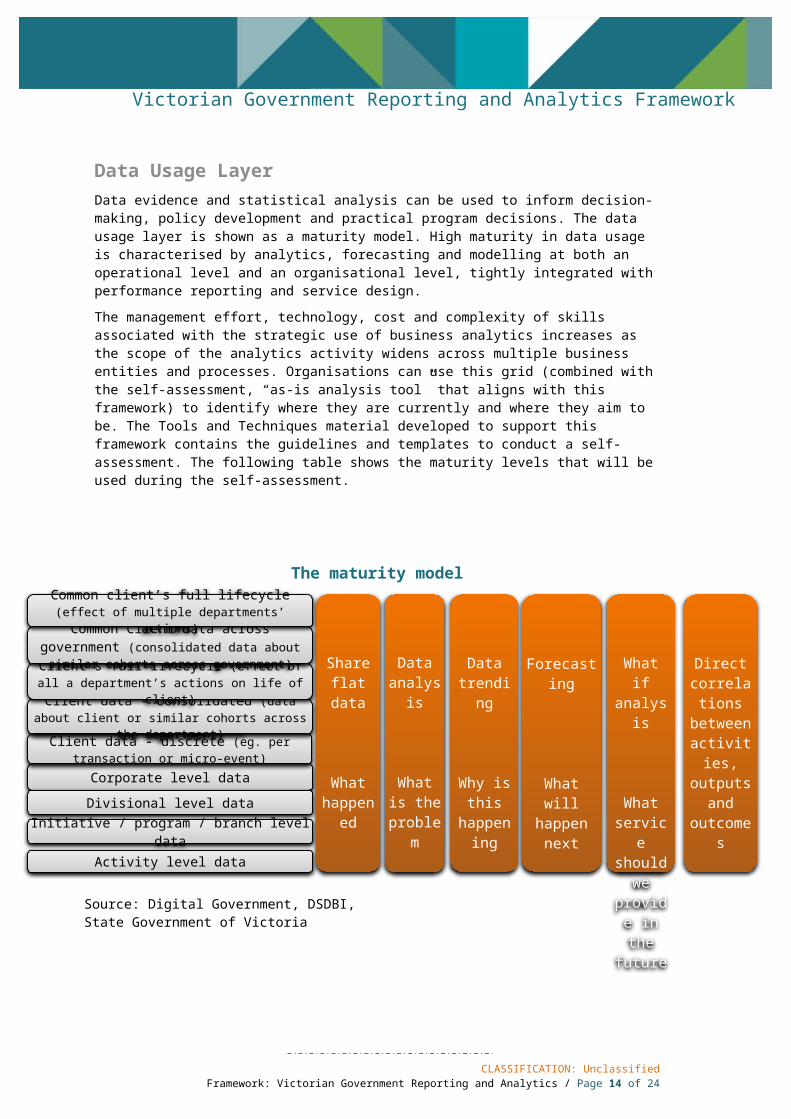
Data Usage LayerData evidence and statistical analysis can be used to inform decision-making, policy development and practical program decisions. The data usage layer is shown as a maturity model. High maturity in data usage is characterised by analytics, forecasting and modelling at both an operational level and an organisational level, tightly integrated with performance reporting and service design.
The management effort, technology, cost and complexity of skills associated with the strategic use of business analytics increases as the scope of the analytics activity widens across multiple business entities and processes. Organisations can use this grid (combined with the self-assessment, “as-is analysis tool” that aligns with this framework) to identify where they are currently and where they aim to be. The Tools and Techniques material developed to support this framework contains the guidelines and templates to conduct a self-assessment. The following table shows the maturity levels that will be used during the self-assessment.
The maturity model
CLASSIFICATION: UnclassifiedFramework: Victorian Government Reporting and Analytics / Page 12 of 18
Source: Digital Government, DSDBI, State Government of Victoria
Common client’s full lifecycle (effect of multiple departments’ actions)
Common Client data across government (consolidated data about similar cohorts across government)
Client’s full lifecycle (effect of all a department’s actions on life of client)
Client data - consolidated (data about client or similar cohorts across the department)
Client data - discrete (eg. per transaction or micro-event)
What if analysis
What service
should we provide in the future
Forecasting
What will happen next
Data trending
Why is this happening
Data analysis
What is the
problem
Share flat data
What happened
Activity level data
Initiative / program / branch level data
Divisional level data
Corporate level data
Direct correlations
between activities,
outputs and outcomes
Victorian Government Reporting and Analytics Framework
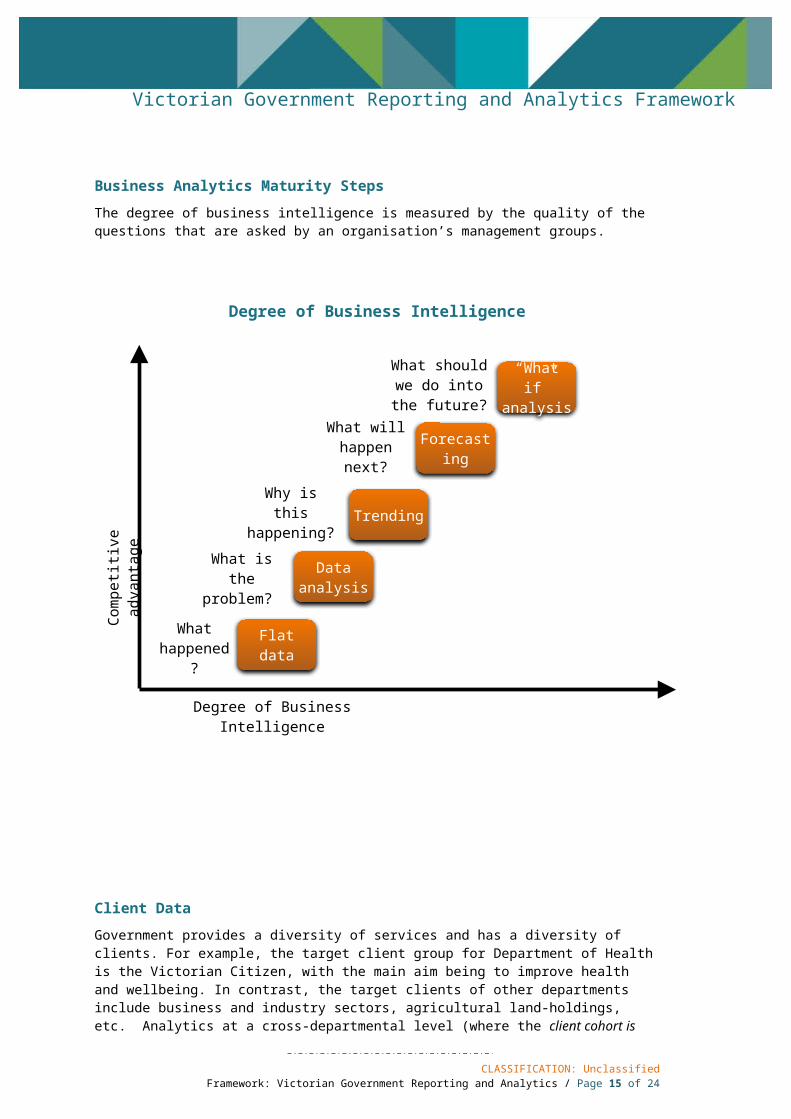
Business Analytics Maturity Steps
The degree of business intelligence is measured by the quality of the questions that are asked by an organisation’s management groups.
Degree of Business Intelligence
Client Data
Government provides a diversity of services and has a diversity of clients. For example, the target client group for Department of Health is the Victorian Citizen, with the main aim being to improve health and wellbeing. In contrast, the target clients of other departments include business and industry sectors, agricultural land-holdings, etc. Analytics at a cross-departmental level (where the client cohort is same) is effective as it is possible to make informed decisions and map the causal relationships between multiple potential government programs and potential client results.
CLASSIFICATION: UnclassifiedFramework: Victorian Government Reporting and Analytics / Page 13 of 18
What should we do into the future?
What will happen next?
Why is this happening?
“What if” analysis
Forecasting
Trending
What is the problem?
Data analysis
What happened?
Flat data
Competitive advantage
Degree of Business Intelligence
Victorian Government Reporting and Analytics Framework
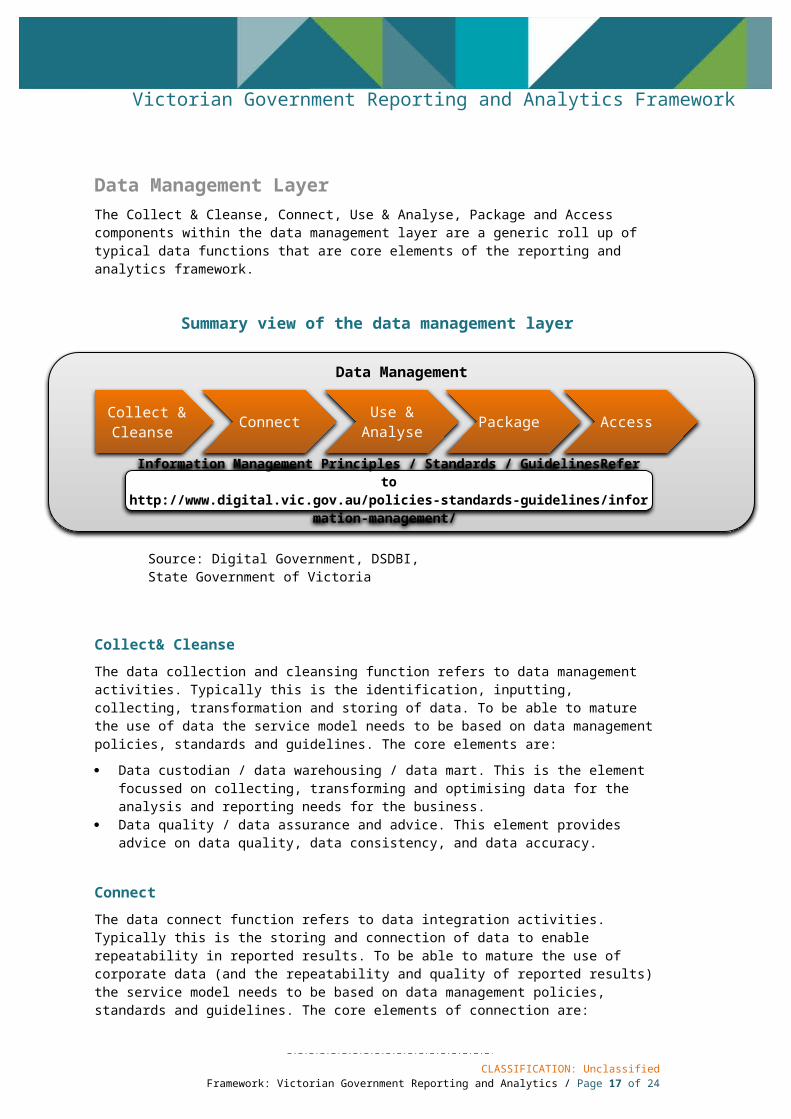
Data Management LayerThe Collect & Cleanse, Connect, Use & Analyse, Package and Access components within the data management layer are a generic roll up of typical data functions that are core elements of the reporting and analytics framework.
Summary view of the data management layer
Collect& Cleanse
The data collection and cleansing function refers to data management activities. Typically this is the identification, inputting, collecting, transformation and storing of data. To be able to mature the use of data the service model needs to be based on data management policies, standards and guidelines. The core elements are:
Data custodian / data warehousing / data mart. This is the element focussed on collecting, transforming and optimising data for the analysis and reporting needs for the business.
Data quality / data assurance and advice. This element provides advice on data quality, data consistency, and data accuracy.
Connect
The data connect function refers to data integration activities. Typically this is the storing and connection of data to enable repeatability in reported results. To be able to mature the use of corporate data (and the repeatability and quality of reported results) the service model needs to be based on data management policies, standards and guidelines. The core elements of connection are:
Data warehousing / data mart. This is the element focussed on locating common data elements to enable connection of discrete data sets for the analysis and reporting needs for the business.
Master data management / data integration. This element focuses on the synchronisation of data between operational and analytical systems. It also sets enterprise wide guidance and architecture on data movement and storage.
Metadata management / data standards advice. This element focuses on metadata services for the purpose of data governance, impact analysis and data lineage.
CLASSIFICATION: UnclassifiedFramework: Victorian Government Reporting and Analytics / Page 14 of 18
Use & Analyse
Information Management Principles / Standards / GuidelinesRefer to http://www.digital.vic.gov.au/policies-standards-guidelines/information-management/
Access Package ConnectCollect & Cleanse
Data Management
Source: Digital Government, DSDBI, State Government of Victoria
Victorian Government Reporting and Analytics Framework
Use & Analyse
The Data Use & Analyse function refers to the analytical tools and processes available to an organisation that lead to new and innovative uses of data. This function supports the Data Usage layer of the framework which includes activities such as “data analysis”, “data trending”, “forecasting” and “what if analysis”. The core elements of this function support are:
Business rules for data sets and reports (enabling the provision of consistent and repeatable data for reports)
Business rules engine and business rules custodian / Query and report services / simulation tools / modelling tools
Predictive and advance analytical tools. Trending and what it scenario design and development.
Package
The package function refers to how information is produced or assembled to address a business need. It relates to when the data is distributed, to whom it is distributed, and the quality of the presentation of the information. This function supports the Information Decision-Making layer of the framework which includes considerations such as:
Are the information products designed for their audience - targeted?;
do they show a consolidated view?; and
is the consolidated report presented in an easy-to-consume manner - as a Dashboard?
Typical examples range in complexity and coverage depending on the level of maturity. This is the activity-set that produces enterprise performance reports, client centric analysis reports and targeted analysis reports/ information sets to support business processes.
Access
The access function represents the way information is accessed, and consumed by the user. The key elements are as follows:
Digital dashboards / interactive dashboards / personal and enterprise dashboards / data drill in and discovery / search / self-help reports / alerts.
Information Management
The data management layer is supported by good data management practices, described within the existing Information Management policies, standards and guidelineshttp://www.digital.vic.gov.au/policies-standards-guidelines/information-management/ and the Information Security Policy and Standards at http://www.digital.vic.gov.au/policies-standards-guidelines/information-security/and supported by the Information Management Group (IMG) of the Victorian government.
CLASSIFICATION: UnclassifiedFramework: Victorian Government Reporting and Analytics / Page 15 of 18
Victorian Government Reporting and Analytics Framework
6 How to get thereTools and TechniquesThis section describes the tools for assisting departments to begin, or continue, their journey towards a mature performance management and integrated reporting & analytics practice.
The Victorian Government Reporting and Analytics Framework outline the key characteristics of the various levels of maturity and provides broader government context for the Framework.
The Tools & Techniques will progressively be developed in separate documents. These are supporting materials to assist with the efficient implementation of a step-change in Decision Making, Performance Management, Reporting and Analytics. The material will include a suggested layout for the consistent display of performance measures.
The Other Guidelines such as the Department of Treasury and Finance, ‘Budget and Financial Management Guidance’s’ provide detail guidance for related areas of activities.
Guidelines in ‘how to progress’ Self-assessment tool: “As-is analysis tool” Plan from improvement as a plan-on-a-
page Best-in-class within the Victorian
government for certain areas of the framework (Mar 2014)
The case for investment including business case materials
Business Intelligence Use Cases (2 off) Research papers Practitioners guide for maturing Business
Intelligence within an organisation
Performance Management KPI dictionaries
Reporting and Visualisation Visualisation techniques List of tools being used for Business
Intelligence within the Victorian government and benefits of each
Service Model / Operating Model Example Service / Operating Models Resource model, skills set requirements /
competencies
Information Management Data management resources (link to
Victorian government Information management resources)
CLASSIFICATION: UnclassifiedFramework: Victorian Government Reporting and Analytics / Page 16 of 18
How to use the frameworkA step-by-step approach to understanding and acting on this framework:Step 1: Discuss the capability model internally and carry-out a self-assessment; Identify which activities are currently being carried-outStep 2: Plan a step-change of three steps with the intent that the first step will be complete by December 2014.Step 3: Use the Tools and Techniques (which will be provided to complement this framework) and participate in the future Community of Practice to implement the step-change. Step 4: Maintain connection with the future Community of Practice to implement further step-changes. The Community of Practice contact point is Gavin Haberfield e: [email protected]
Victorian Government Reporting and Analytics Framework
7 ScopeAbout this frameworkThis framework applies to all government departments and Victoria Police, VicRoads, Public Transport Victoria (PTV), Environment Protection Agency (EPA), State Revenue Office, The Office of Emergency Services and Emergency Services Victoria.
8 Further Information
For further information regarding this standard, please contact Digital Government Branch in the Department of State Development, Business and Innovation, at [email protected]
Appendix 1About this frameworkThe authors of this framework for Reporting and Analytics Uplift, Aski Management Solutions and Digital Government Branch of the Innovation, Services, Small Business and Technology Division, met with each of the Victorian government departments (listed below) and four inner-agencies to understand and discuss current reporting and analytics methods, identify where challenges were and where departments/agencies saw the opportunities to improve performance management and data analytics. A workshop was held in December 2013 to develop the initial blue-print of the framework Reporting and Analytics Uplift.
The authors were able to discern common themes, concerns, issues, strengths and challenges with respect to performance management, reporting and analytics across the Victorian government. Four departments presented best-of-class micro-activities during the workshop session and this stimulated group discussion and understanding of the benefits of mature and integrated reporting and analytics.
The authors would like to thank all participants that contributed to the framework, particularly the workshop participants from the following departments and agencies:
Environmental Protection Agency Department of Education and Early
Childhood Development Department of Environment & Primary
Industries Department of Health Department of Human Services Department of Justice Department of Premier and Cabinet Department of State Development,
Business and Innovation Department of Transport, Planning and
Local Infrastructure Public Transport Victoria State Revenue Office VicRoads Victoria Police
CLASSIFICATION: UnclassifiedFramework: Victorian Government Reporting and Analytics / Page 17 of 18
Victorian Government Reporting and Analytics Framework
Appendix 2About other reporting and analytics frameworksThere is a range of such proprietary frameworks available (e.g. Gartner, TDWI), but no standard framework has yet emerged.
Most of the existing frameworks focus on the data usage activity and do not show the linkages with corporate performance management and service design (refer to the TDWI example below).
The Data Warehousing Institute (TDWI) maintains a maturity model and an online self-assessment tool:
TDWI Business Intelligence Maturity Model3
Gartner has developed a business analytics framework that depicts the data usage activities, platform capabilities and a relationship with corporate performance management and organisation design.
Gartner Business Analytics Framework4
The Victorian Government Reporting and Analytics Framework (VGRAF) builds on the Gartner model by expanding the definitions against “Processes” into multiple layers then overlaying a maturity model across each layer. Such an approach is relevant to government.
3 Source: The Data Warehousing Institute (TDWI) maturity model; http://tdwi.org/pages/maturity-model/maturity-model-home.aspx4 Source: Gartner’s Business Analytics Framework (September 2011); page3
CLASSIFICATION: UnclassifiedFramework: Victorian Government Reporting and Analytics / Page 18 of 18
Related Documents


![Facebook Certification - Reporting & analytics [curriculum]](https://static.cupdf.com/doc/110x72/55c2a1a3bb61eb9b358b47a4/facebook-certification-reporting-analytics-curriculum.jpg)