BC Hydro Report on U.S. Renewable Energy Credit (REC) Markets FINAL REPORT B&V Project Number: 172047.0300 May 2011 BUILDING A WORLD OF DIFFERENCE® Black & Veatch Corporation 11401 Lamar Avenue Overland Park, Kansas 66211 Tel: (913) 458‐2000 www.bv.com

Welcome message from author
This document is posted to help you gain knowledge. Please leave a comment to let me know what you think about it! Share it to your friends and learn new things together.
Transcript
BC Hydro
Report on U.S. Renewable Energy Credit (REC) Markets
FINAL REPORT B&V Project Number: 172047.0300
May 2011
BUILDING A WORLD OF DIFFERENCE®
Black & Veatch Corporation 11401 Lamar Avenue Overland Park, Kansas 66211 Tel: (913) 458‐2000 www.bv.com
BC Hydro Report on U.S. Renewable Energy Credit (REC) Markets Table of Contents
May 2011 Black & Veatch TC1
Table of Contents
1.0 Introduction ............................................................................................................ 1‐1
2.0 United States Federal RPS ...................................................................................... 2‐1
2.1 Proposed Federal RPS Structures ................................................................. 2‐1
2.2 Policy Drivers ................................................................................................ 2‐4
2.3 Prospects for a National RPS ........................................................................ 2‐6
3.0 Overview of State RPS Programs ............................................................................ 3‐1
3.1 Targets and Compliance Years ...................................................................... 3‐1
3.2 Carve‐outs and Set‐asides ............................................................................ 3‐2
3.3 Resource Eligibility and Delivery Requirements ........................................... 3‐5
3.4 Use of RECs in State RPS Programs ............................................................... 3‐8
4.0 Detailed WECC State RPS Requirements ................................................................ 4‐1
4.1 Arizona .......................................................................................................... 4‐2
4.2 California ....................................................................................................... 4‐3
4.3 Montana ....................................................................................................... 4‐6
4.4 Nevada .......................................................................................................... 4‐7
4.5 New Mexico .................................................................................................. 4‐8
4.6 Oregon .......................................................................................................... 4‐9
4.7 Utah ............................................................................................................ 4‐10
4.8 Washington ................................................................................................. 4‐10
5.0 Overview of Key Factors that influence REC price ................................................. 5‐1
6.0 REM Model Principles ............................................................................................ 6‐1
7.0 REC Price Scenarios and Assumptions ................................................................... 7‐1
7.1 REC Price Scenario Assumptions .................................................................. 7‐2
7.2 WECC RPS Demand Forecast ........................................................................ 7‐5
8.0 REC Price Results .................................................................................................. 8‐14
9.0 Summary Findings .................................................................................................. 9‐1
9.1 REC Prices and GHG Policy ............................................................................ 9‐1
9.2 Renewable Energy and GHG Policy .............................................................. 9‐3
BC Hydro Report on U.S. Renewable Energy Credit (REC) Markets Table of Contents
May 2011 Black & Veatch TC2
List of Tables
Table 2‐1 United States Federal RPS Policy Examples. ................................................... 2‐2 Table 3‐1. RPS Resource Carve‐Outs By State. ............................................................... 3‐3 Table 3‐2. Renewable Energy Credit Multipliers. ........................................................... 3‐4 Table 3‐3. New Hydroelectric Eligibility and Delivery Requirements By State. .............. 3‐5 Table 3‐4. Restrictions on Unbundled RECs by State. ..................................................... 3‐9 Table 4‐1. WECC States RPS Summary. ........................................................................... 4‐2 Table 7‐1 Market Scenario Assumptions. ........................................................................ 7‐1 Table 7‐2 Renewable Energy Assumptions. .................................................................... 7‐2 Table 7‐3. RPS Target. ..................................................................................................... 7‐6 Table 7‐4. Existing and Planned Capacity for RPS Compliance (MW) ............................ 7‐9 Table 7‐5. Existing and Planned Generation for RPS Compliance (GWh) ..................... 7‐10 Table 9‐1 Market Scenarios and Corresponding REC Prices. ........................................... 9‐1
List of Figures
Figure 2‐1. 2009 Net Generation by Energy Source (EIA) ............................................... 2‐5 Figure 3‐1. US State Renewable Portfolio Standard Goals. ............................................ 3‐2 Figure 7‐1. WECC Retail Sales for RPS States. ................................................................. 7‐7 Figure 7‐2. Existing and Planned Generation. ............................................................... 7‐10 Figure 7‐3. Cumulative Net RPS Demand (2011‐2025). ................................................ 7‐11 Figure 7‐4. Scenario 1 and 9 Net RPS Generation Demand (2011‐2025). .................... 7‐12 Figure 7‐5. Scenario 3 Net RPS Generation Demand (2011‐2025). .............................. 7‐12 Figure 7‐6. Scenario 4 and 8 RPS Net Generation Demand (2011‐2025). .................... 7‐13 Figure 8‐1. Scenario 1 REC Prices by State (2011‐2025) ............................................... 8‐15 Figure 8‐2. Scenario 1 Cumulative Capacity Build for RPS Demand (2011‐2025) ........ 8‐15 Figure 8‐3. Scenario 1 Total Capacity Build for State (2011‐2025) ............................... 8‐16 Figure 8‐4. Scenario 3 REC Prices by State (2011‐2025) ............................................... 8‐17 Figure 8‐5. Scenario 3 Cumulative Capacity Build for RPS Demand (2011‐2025) ........ 8‐17 Figure 8‐6. Scenario 3 Total Capacity Build by State(2011‐2025) ................................. 8‐18 Figure 8‐7. Scenario 4 REC Prices by State (2011‐2025) ............................................... 8‐19 Figure 8‐8. Scenario 4 Cumulative Capacity Build for RPS Demand (2011‐2025) ......... 8‐19 Figure 8‐9. Scenario 4 Total Capacity Build by State (2011‐2025)................................. 8‐20 Figure 8‐10. Scenario 8 REC Prices by State (2011‐2025) ............................................. 8‐21 Figure 8‐11. Scenario 8 Cumulative Capacity Build for RPS Demand (2011‐2025) ....... 8‐21 Figure 8‐12. Scenario 8 Total Capacity Build by State (2011‐2025) .............................. 8‐22 Figure 8‐13. Scenario 9 REC Prices by State (2011‐2025) ............................................. 8‐23 Figure 8‐14. Scenario 9 Cumulative Capacity Build for RPS Demand (2011‐2025) ....... 8‐23 Figure 8‐15. Scenario 9 Total Capacity Build by State (2011‐2025) .............................. 8‐24
BC Hydro Report on U.S. Renewable Energy Credit (REC) Markets 1.0 Introduction
May 2011 Black & Veatch 11
1.0 Introduction
The objective of this report is to provide information on the U.S. Renewable
Energy Credit (REC) Markets with a focus on the western United States. The report
includes an overview of the United States renewable energy market by analyzing some
of the key policy drivers for renewable energy development nationally and regionally.
One of the main drivers is the establishment of Renewable Energy Portfolio Standards
(RPS) in a majority of states. These RPS programs often mandate that electricity
providers procure a certain amount of renewable energy
to serve their load. National RPS programs have also
been contemplated by Congress, though as of March
2011, no legislation has been passed into law yet. An
understanding of these existing and future renewable
energy regulations will provide the foundation of the
outlook for renewable energy markets going forward.
For this report, Black & Veatch focused on the
renewable energy market resulting from existing state
RPS requirements in the Western Electricity Coordinating
Council (WECC) footprint. Black & Veatch, using its
Renewable Energy Market (REM) model and resource data from the Western
Renewable Energy Zones (WREZ) project, developed outlooks for Renewable Energy
(RE) premiums or implied Renewable Energy Credit (REC) value under five Market
Scenarios. This report will discuss the approach taken and ultimate findings.
Following this introduction, the chapters in the report are as follows:
United States Federal RPS
Overview of State RPS Programs
Detailed WECC States RPS Programs
Overview of Key Factors that influence REC Price
REM Model
Scenarios and Assumptions
REC Prices and Market Markets
Summary of Findings
A Renewable Energy Credit (REC) refers to the renewable energy attributes associated with the output of a renewable generator, separate from the underlying commodity energy. RECs are also called Green Tags, Renewable Energy Certificates, Portfolio Credits, or Renewable Energy Attributes, amongst other names.
BC Hydro Report on U.S. Renewable Energy Credit (REC) Markets 2.0 United States Federal RPS
May 2011 Black & Veatch 21
2.0 United States Federal RPS
Currently, there is no federal legislation that mandates renewable electricity
usage at the national level. Over the past decade, several pieces of legislation have
been proposed in the United States (U.S.) House of Representatives and Senate for the
establishment of a Federal RPS. Aspects of each piece of proposed legislation have
varied considerably, including the targets, timing, eligible resources, efficiency
allowances, and alternative compliance payments (ACPs). This section provides insight
on recent legislation that has been proposed and the potential for future legislation.
2.1 Proposed Federal RPS Structures In 2009, H.R. 2454, the American Clean Energy and Security Act of 2009,
introduced by Representatives Henry Waxman (D‐CA) and Edward Markey (D‐MA),
received the greatest support of all proposals in the past decade. This piece of
legislation was passed by the House in June 2009, although no corresponding legislation
was ever passed in the Senate. More recently, Senators Jeff Bingaman (D‐NM) and Sam
Brownback (R‐KS) introduced the Renewable Energy Promotion Act of 2010 (S.3813),
which sets less aggressive targets. These two bills are discussed in this section to
illustrate some of the common themes in proposed national RPS legislation.
Each bill targets 15 to 20 percent renewable energy–as a point of comparison,
the current level of non‐hydro renewable energy output in the U.S. totaled about 4
percent of the national supply. The actual amount of renewable energy likely to be
implemented by each bill is somewhat lower than the stated target due to energy
efficiency program allowances and various exclusions. Key aspects of each bill are
highlighted below. The first year that compliance with legislative goals would be
required in each is 2012.
BC Hydro Report on U.S. Renewable Energy Credit (REC) Markets 2.0 United States Federal RPS
May 2011 Black & Veatch 22
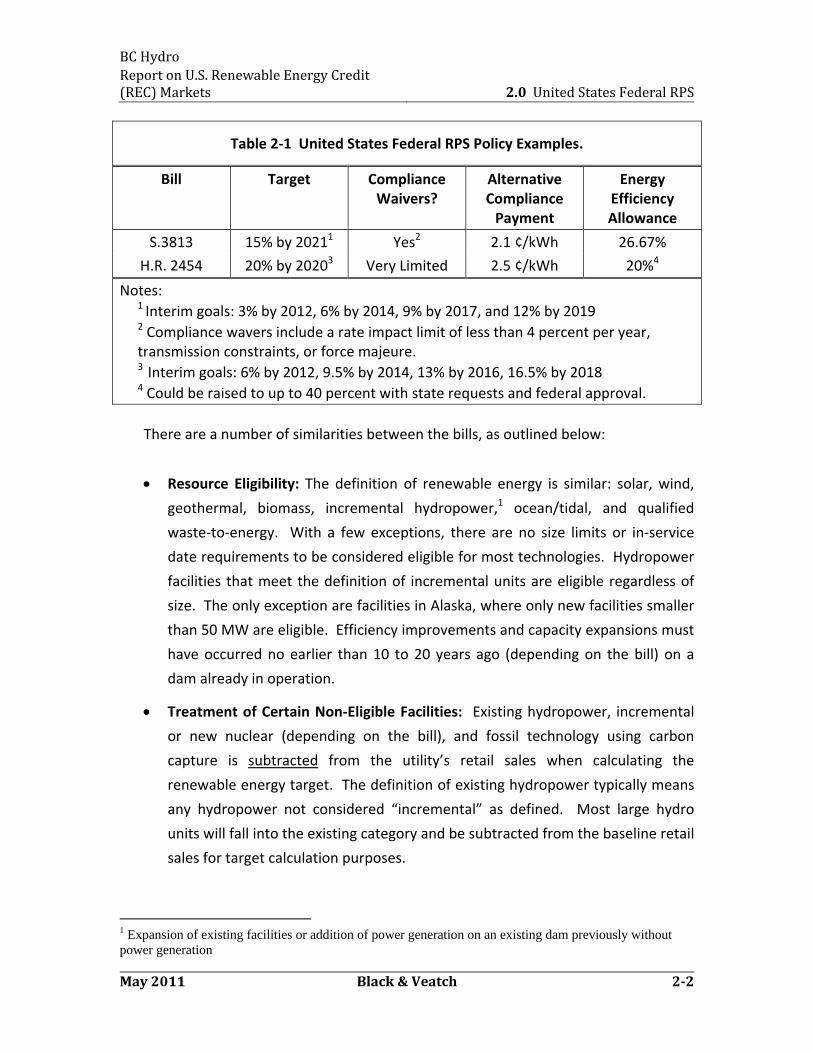
Table 2‐1 United States Federal RPS Policy Examples.
Bill Target Compliance Waivers?
Alternative Compliance Payment
Energy Efficiency Allowance
S.3813 15% by 20211 Yes2 2.1 ¢/kWh 26.67%
H.R. 2454 20% by 20203 Very Limited 2.5 ¢/kWh 20%4
Notes: 1 Interim goals: 3% by 2012, 6% by 2014, 9% by 2017, and 12% by 2019 2 Compliance wavers include a rate impact limit of less than 4 percent per year, transmission constraints, or force majeure. 3 Interim goals: 6% by 2012, 9.5% by 2014, 13% by 2016, 16.5% by 2018
4 Could be raised to up to 40 percent with state requests and federal approval.
There are a number of similarities between the bills, as outlined below:
Resource Eligibility: The definition of renewable energy is similar: solar, wind,
geothermal, biomass, incremental hydropower,1 ocean/tidal, and qualified
waste‐to‐energy. With a few exceptions, there are no size limits or in‐service
date requirements to be considered eligible for most technologies. Hydropower
facilities that meet the definition of incremental units are eligible regardless of
size. The only exception are facilities in Alaska, where only new facilities smaller
than 50 MW are eligible. Efficiency improvements and capacity expansions must
have occurred no earlier than 10 to 20 years ago (depending on the bill) on a
dam already in operation.
Treatment of Certain Non‐Eligible Facilities: Existing hydropower, incremental
or new nuclear (depending on the bill), and fossil technology using carbon
capture is subtracted from the utility’s retail sales when calculating the
renewable energy target. The definition of existing hydropower typically means
any hydropower not considered “incremental” as defined. Most large hydro
units will fall into the existing category and be subtracted from the baseline retail
sales for target calculation purposes.
1 Expansion of existing facilities or addition of power generation on an existing dam previously without power generation
BC Hydro Report on U.S. Renewable Energy Credit (REC) Markets 2.0 United States Federal RPS
May 2011 Black & Veatch 23
Applicable Entities: Utilities with sales greater than 4 million MWh/year must
comply with the RPS requirements.
Alternative Compliance Payment (ACP): An alternative payment option is
available for compliance instead of having to procure renewable energy. Money
paid under this option typically goes to the state where the utility is located to
support local renewable energy programs.
Penalties: The penalty for non‐compliance is the same in both bills—200
percent of the value of the alternative payment for every kilowatt‐hour short of
the goal. That is, if a utility is negligent in meeting their targets or making
alternative payments when a shortfall can be foreseen, the penalty is twice the
alternative payment for every kilowatt‐hour short of compliance.
Delivery Requirements and Non‐US Imports: Each bill requires that retail
electricity providers obtain electricity or RECs from eligible generation sources.
Any qualified renewable energy that is delivered to any entity regulated under
these bills could generate RECs. There is no explicit geographic restriction on the
location of the generation facilities.
Compliance Flexibility: Under each bill, electricity providers can bank RECs for
up to three years but are not allowed to borrow against future generation.
Flexibility is also created through a REC trading program and the ability to use
alternative compliance payments.
Most proposed federal RPS legislation set up a federal trading system that allows
utilities short of their goals to acquire federal RECs from elsewhere in the country.
Unbundling of credits from delivered power would be permissible in a federal system.
While the rules are not entirely clear, it appears that separate state and federal REC
compliance mechanisms have been proposed. That is, a kilowatt‐hour of renewable
electricity, supplying to states with existing RPS programs, will have both a state and a
federal credit associated with it. For states that have a target more stringent than the
federal policy, the federal credits generated by meeting state targets could likely be sold
to other utilities outside of the state. This mechanism could effectively offset the cost of
state RECs for those states that are ahead of the federal targets. Also, Black & Veatch
estimates that existing state RPS programs could make up to 8 or 9 percent of national
BC Hydro Report on U.S. Renewable Energy Credit (REC) Markets 2.0 United States Federal RPS
May 2011 Black & Veatch 24
retail sales by 2025, which means that RECs from existing state initiatives could meet
around half of the national target if enacted.
There are other variations on the previously discussed structures for RPS
legislation that also have been introduced. One is a “Clean Energy Standard” (Senate
Bill 20) introduced in September 2010 by Senator Lindsay Graham (R‐SC), which allows
new nuclear and fossil fuel generation with carbon capture and sequestration (CCS) to
count toward defined targets. This approach uses environmental performance, not
technology type, as the main qualifier for eligibility, though many of the other aspects of
the Clean Energy Standard are similar to the other RPS bills. This bill has a target of 20
percent clean energy by 2020, increasing by 5 percent every 5 years, until 45 percent is
reached in 2045. A provision to limit rate impacts, similar to S.3813, is included in this
bill.
2.2 Policy Drivers There are many reasons for the development of a U.S. Federal RPS. One
important note is RPS policies serve to bridge the gap between renewable energy
options today that may be higher cost relative to conventional generation‐‐which often
would not meet utilities’ “least‐cost” procurement requirements‐‐and future renewable
energy options that may be lower cost and are competitive with conventional
generation without relying on mandatory RPS programs. Thus, RPS programs will likely
not be permanent in the nation’s long‐term energy policy if renewable energy costs
become competitive. In addition, other justifications typically cited for RPS policies are:
security, economic, and environmental reasons.
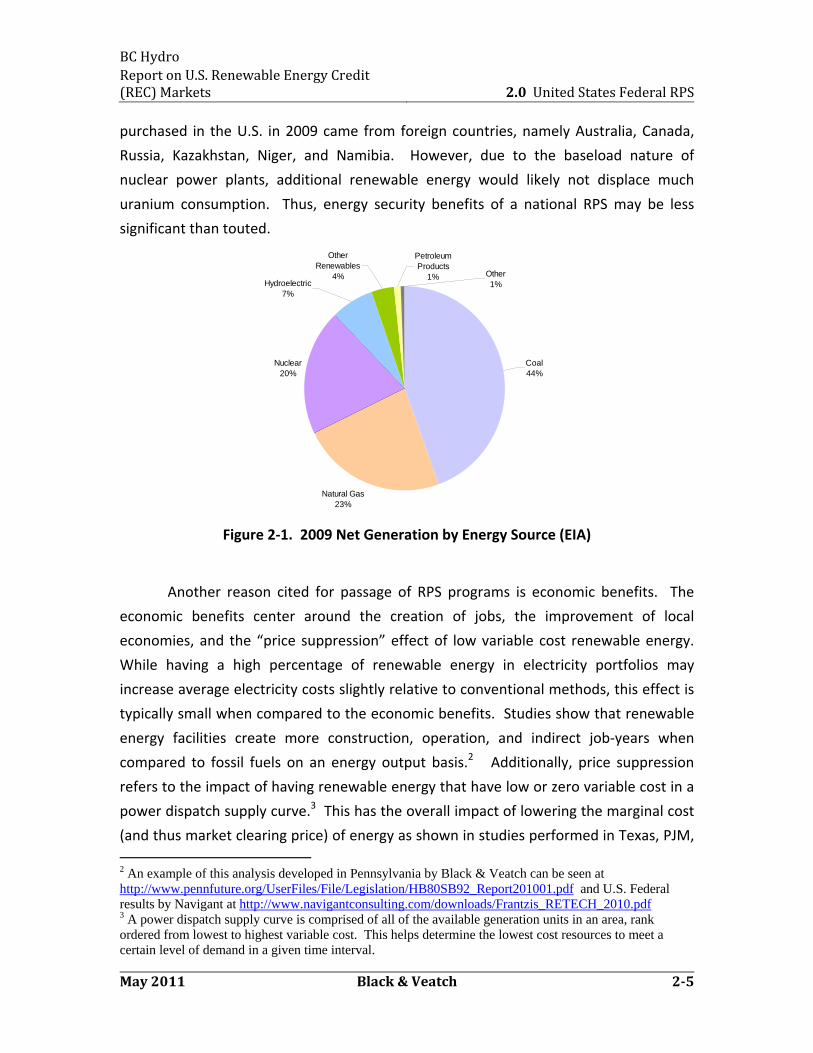
Energy security benefits typically center on “energy independence” by reducing
reliance on imported fuels. The major commodities used for power generation in the
U.S. that are currently imported in part are natural gas, uranium, and fuel oil from
foreign sources of crude oil (see Figure 2‐1). Oil boilers represent only 1 percent of total
U.S. net electricity generation, making the impact on energy security through reducing
oil in the power sector relatively low. This leaves natural gas (23 percent of U.S.
electricity production) and nuclear generation (20 percent) as contributors to energy
security concern in the power sector. According to the U.S. Department of Energy
Information Administration (EIA), the U.S. currently imports roughly 18 percent of its
total natural gas demand, with much of that supply being provided from Canadian
pipelines–a generally stable source of supply. Roughly 85 percent of the uranium
BC Hydro Report on U.S. Renewable Energy Credit (REC) Markets 2.0 United States Federal RPS
May 2011 Black & Veatch 25
purchased in the U.S. in 2009 came from foreign countries, namely Australia, Canada,
Russia, Kazakhstan, Niger, and Namibia. However, due to the baseload nature of
nuclear power plants, additional renewable energy would likely not displace much
uranium consumption. Thus, energy security benefits of a national RPS may be less
significant than touted.
Natural Gas23%
Nuclear20%
Other1%
Petroleum Products
1%
Other Renewables
4%Hydroelectric
7%
Coal44%
Figure 2‐1. 2009 Net Generation by Energy Source (EIA)
Another reason cited for passage of RPS programs is economic benefits. The
economic benefits center around the creation of jobs, the improvement of local
economies, and the “price suppression” effect of low variable cost renewable energy.
While having a high percentage of renewable energy in electricity portfolios may
increase average electricity costs slightly relative to conventional methods, this effect is
typically small when compared to the economic benefits. Studies show that renewable
energy facilities create more construction, operation, and indirect job‐years when
compared to fossil fuels on an energy output basis.2 Additionally, price suppression
refers to the impact of having renewable energy that have low or zero variable cost in a
power dispatch supply curve.3 This has the overall impact of lowering the marginal cost
(and thus market clearing price) of energy as shown in studies performed in Texas, PJM,
2 An example of this analysis developed in Pennsylvania by Black & Veatch can be seen at http://www.pennfuture.org/UserFiles/File/Legislation/HB80SB92_Report201001.pdf and U.S. Federal results by Navigant at http://www.navigantconsulting.com/downloads/Frantzis_RETECH_2010.pdf 3 A power dispatch supply curve is comprised of all of the available generation units in an area, rank ordered from lowest to highest variable cost. This helps determine the lowest cost resources to meet a certain level of demand in a given time interval.
BC Hydro Report on U.S. Renewable Energy Credit (REC) Markets 2.0 United States Federal RPS
May 2011 Black & Veatch 26
and New York. In addition, the decrease in demand for fossil fuels can lower prices for
the fuels themselves, leading to overall lower electricity prices.
Lastly, RPS policies are attempting to reduce environmental damage associated
with air, water, waste material and natural resources, which can provide health, safety,
and economic benefits. Many types of renewable energy have lower or zero criteria
pollutants and greenhouse gas (GHG) emissions when compared to fossil fuel based
generation. Though specific GHG reduction levels have not been explicitly defined in
proposed legislation, the U.S. Department of Energy’s analysis of a 25 percent RPS
performed in 20094 showed a 12 percent reduction in GHG emissions from the electric
sector by 2030, when compared to a non‐RPS base case. It is expected that renewable
energy will play an important role in any GHG reduction strategy for the nation.
2.3 Prospects for a National RPS
Given the new Republican leadership in the U.S. House of Representatives in
2011, Federal renewable energy policy will not be a priority for the House. Legislative
priorities other than energy make the chances of success for a federal RPS law in the
next two years low. RPS legislation that would be of interest to the House in 2011 and
2012 would likely need to have additional provisions related to nuclear and fossil energy
to attract the necessary votes. This implies that there likely will not be any new major
federal drivers for renewable energy from an RPS‐like bill until 2015 at the earliest.
Furthermore, though there is an apparent link between RPS policy and GHG
reduction, combining the two in a single legislation may be problematic. For example,
H.R. 2454 failed to garner support in the Senate, not due to the RPS provisions, but
rather due to the more contentious GHG cap‐and‐trade program that was part of the
bill. S.3813 has taken a more narrow approach by focusing solely on a federal RPS
program without enacting a specific federal GHG management program. A bill focused
only on RPS provisions may have a better chance of federal enactment than a broader
energy bill given the current legislative environment. RPS laws can be more easily linked
to issues that resonate more with voters and lawmakers such as jobs and economic
growth. Lawmakers in many regions have realized the benefits of a federal RPS, as
4 U.S. Department of Energy, “Impact of a 25-Percent Renewable Electricity Standard as Proposed in the American Clean Energy and Security Act Discussion Draft”, SR/OIAF/2009-04.
BC Hydro Report on U.S. Renewable Energy Credit (REC) Markets 2.0 United States Federal RPS
May 2011 Black & Veatch 27
shown by the support of Republican co‐authors to the Senate renewable energy bill
from Kansas, Nevada, and Iowa.
Without federal legislation, the two main groups that will stimulate U.S.
renewable energy through policy development are states and government agencies.
State RPS development is already well underway as will be shown in the next section.
The U.S. Environmental Protection Agency (EPA) is expected to promulgate regulations
for both GHG emissions and coal boiler criteria pollutants that may indirectly impact the
development of renewable energy in the U.S. It is unclear at this time what limits the
U.S. EPA may put into place and what regulatory restrictions will be placed on the
agency by the U.S. Congress.
BC Hydro Report on U.S. Renewable Energy Credit (REC) Markets 3.0 Overview of State RPS Programs
May 2011 Black & Veatch 31
3.0 Overview of State RPS Programs
State RPS requirements have become a major driver in the development of
renewable projects. The first programs were enacted in the late 1990s and have rapidly
expanded both in the number of states implementing RPS programs and the goals set by
those states. Roughly 50 percent of the total U.S. load is now subject to some sort of
renewable mandate. By 2020, these state RPS programs combined, if achieved, can
bring the national non‐hydro renewable energy usage to about 8 percent, according to
Black & Veatch estimates.
Conceptually, RPS programs define the target amount of renewable energy
(either as a percentage of total retail sales, an amount of installed capacity, or a total
generation amount) to be achieved within a certain period of time. In practice, state
RPS programs have developed divergent rules in a number of areas, such as:
Targets and Compliance Year(s): How much and when intermediate and
final targets are to be achieved.
Carve‐outs and Tiers: Special requirements or treatment reserved for
specific renewable types. Can also be different “Classes” or “Tiers”.
Resource Eligibility: What types of resources are considered eligible and if
existing projects count toward targets, as well as the delivery requirements
for the energy.
Tradable Renewable Energy Certificates (TRECs): The flexibility to buy and
sell unbundled RECs without buying the underlying energy to meet an RPS.
The individual state rules must be reviewed carefully to determine how each
unique set of regulations may impact future development of the market.
3.1 Targets and Compliance Years
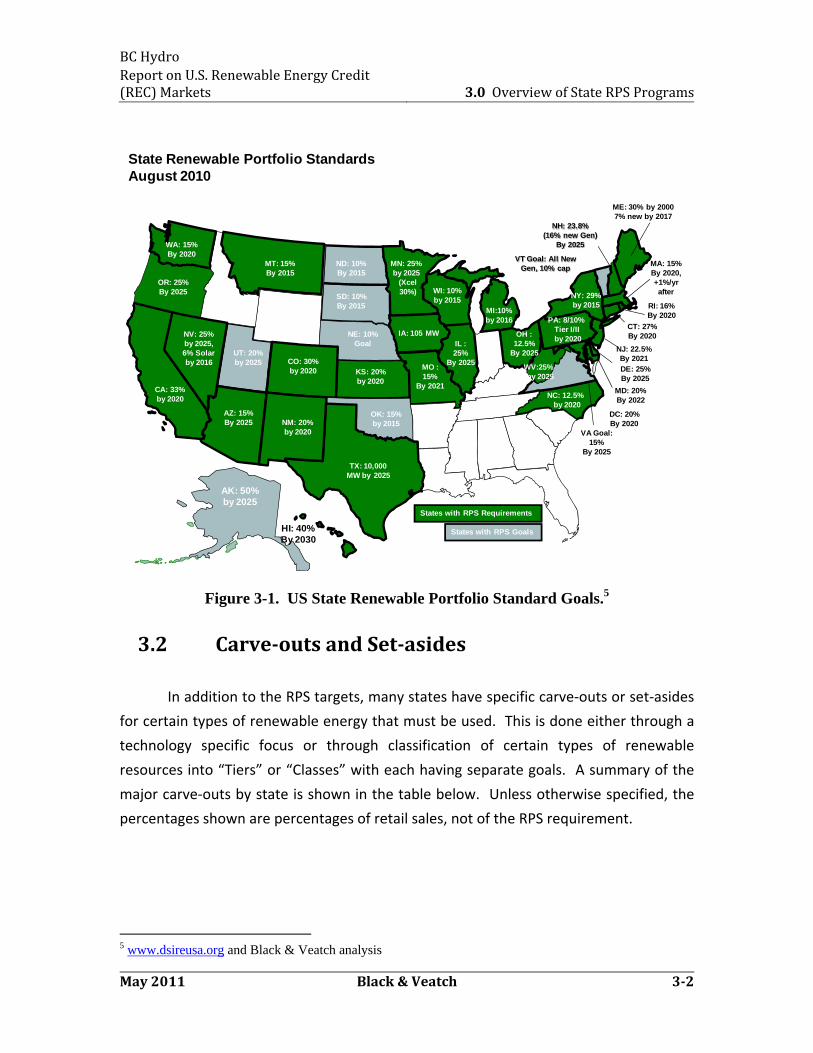
Thirty states and the District of Columbia currently have mandatory RPS
requirements. Another eight states have non‐binding renewable generation goals.
The map below shows the overall targets and target years by state.
BC Hydro Report on U.S. Renewable Energy Credit (REC) Markets 3.0 Overview of State RPS Programs
May 2011 Black & Veatch 32
State Renewable Portfolio Standards August 2010
MA: 15%By 2020,+1%/yrafter
States with RPS Requirements
States with RPS Goals
CA: 33%by 2020
NV: 25%by 2025,6% Solar by 2016
AZ: 15%By 2025 NM: 20%
by 2020
TX: 10,000 MW by 2025
MN: 25% by 2025
(Xcel30%) WI: 10%
by 2015
IA: 105 MWIL :25%
By 2025
HI: 40%By 2030
NJ: 22.5%By 2021
CT: 27%By 2020
ME: 30% by 20007% new by 2017
MD: 20%By 2022
RI: 16%By 2020
CO: 30%by 2020
NY: 29%by 2015
PA: 8/10% Tier I/II by 2020
DC: 20%By 2020
VT Goal: All NewGen, 10% cap
MT: 15%By 2015
DE: 25%By 2025
WA: 15%By 2020
NH: 23.8%(16% new Gen)
By 2025
VA Goal:15%
By 2025
OR: 25%By 2025
NC: 12.5% by 2020
ND: 10%By 2015
SD: 10%By 2015
UT: 20%by 2025
MO :15%
By 2021
OH :12.5%
By 2025
MI:10% by 2016
KS: 20%by 2020
WV:25% by 2025
OK: 15% by 2015
AK: 50% by 2025
NE: 10% Goal
Figure 3-1. US State Renewable Portfolio Standard Goals.5
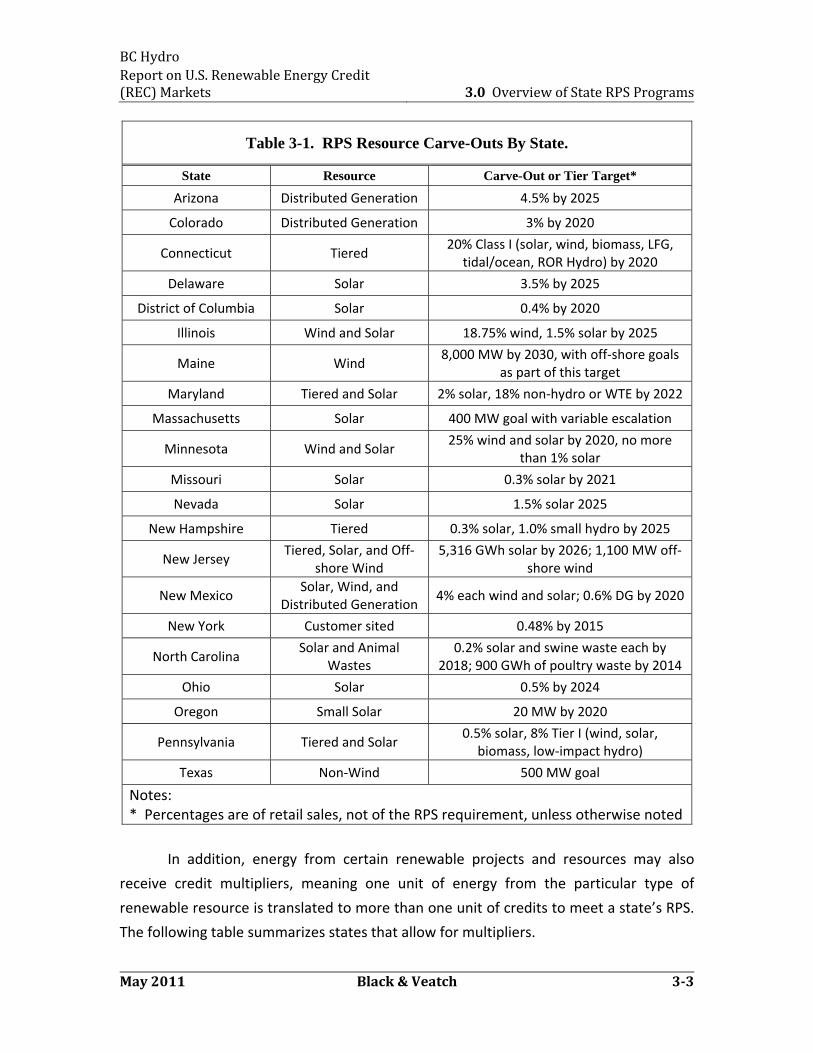
3.2 Carveouts and Setasides
In addition to the RPS targets, many states have specific carve‐outs or set‐asides
for certain types of renewable energy that must be used. This is done either through a
technology specific focus or through classification of certain types of renewable
resources into “Tiers” or “Classes” with each having separate goals. A summary of the
major carve‐outs by state is shown in the table below. Unless otherwise specified, the
percentages shown are percentages of retail sales, not of the RPS requirement.
5 www.dsireusa.org and Black & Veatch analysis
BC Hydro Report on U.S. Renewable Energy Credit (REC) Markets 3.0 Overview of State RPS Programs
May 2011 Black & Veatch 33
Table 3-1. RPS Resource Carve-Outs By State.
State Resource Carve-Out or Tier Target*
Arizona Distributed Generation 4.5% by 2025
Colorado Distributed Generation 3% by 2020
Connecticut Tiered 20% Class I (solar, wind, biomass, LFG,
tidal/ocean, ROR Hydro) by 2020
Delaware Solar 3.5% by 2025
District of Columbia Solar 0.4% by 2020
Illinois Wind and Solar 18.75% wind, 1.5% solar by 2025
Maine Wind 8,000 MW by 2030, with off‐shore goals
as part of this target
Maryland Tiered and Solar 2% solar, 18% non‐hydro or WTE by 2022
Massachusetts Solar 400 MW goal with variable escalation
Minnesota Wind and Solar 25% wind and solar by 2020, no more
than 1% solar
Missouri Solar 0.3% solar by 2021
Nevada Solar 1.5% solar 2025
New Hampshire Tiered 0.3% solar, 1.0% small hydro by 2025
New Jersey Tiered, Solar, and Off‐
shore Wind5,316 GWh solar by 2026; 1,100 MW off‐
shore wind
New Mexico Solar, Wind, and
Distributed Generation4% each wind and solar; 0.6% DG by 2020
New York Customer sited 0.48% by 2015
North Carolina Solar and Animal
Wastes0.2% solar and swine waste each by
2018; 900 GWh of poultry waste by 2014
Ohio Solar 0.5% by 2024
Oregon Small Solar 20 MW by 2020
Pennsylvania Tiered and Solar 0.5% solar, 8% Tier I (wind, solar,
biomass, low‐impact hydro)
Texas Non‐Wind 500 MW goal
Notes: * Percentages are of retail sales, not of the RPS requirement, unless otherwise noted
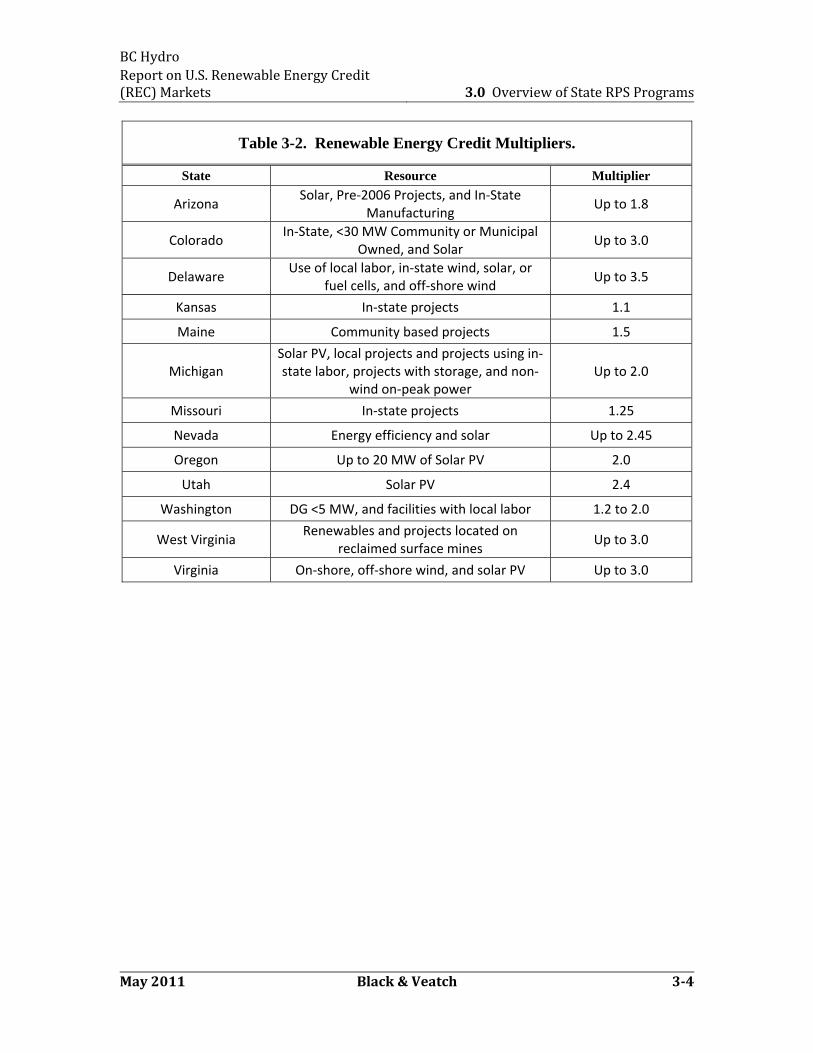
In addition, energy from certain renewable projects and resources may also
receive credit multipliers, meaning one unit of energy from the particular type of
renewable resource is translated to more than one unit of credits to meet a state’s RPS.
The following table summarizes states that allow for multipliers.
BC Hydro Report on U.S. Renewable Energy Credit (REC) Markets 3.0 Overview of State RPS Programs
May 2011 Black & Veatch 34
Table 3-2. Renewable Energy Credit Multipliers.
State Resource Multiplier
Arizona Solar, Pre‐2006 Projects, and In‐State
ManufacturingUp to 1.8
Colorado In‐State, <30 MW Community or Municipal
Owned, and Solar Up to 3.0
Delaware Use of local labor, in‐state wind, solar, or
fuel cells, and off‐shore windUp to 3.5
Kansas In‐state projects 1.1
Maine Community based projects 1.5
Michigan Solar PV, local projects and projects using in‐state labor, projects with storage, and non‐
wind on‐peak powerUp to 2.0
Missouri In‐state projects 1.25
Nevada Energy efficiency and solar Up to 2.45
Oregon Up to 20 MW of Solar PV 2.0
Utah Solar PV 2.4
Washington DG <5 MW, and facilities with local labor 1.2 to 2.0
West Virginia Renewables and projects located on
reclaimed surface minesUp to 3.0
Virginia On‐shore, off‐shore wind, and solar PV Up to 3.0
BC Hydro Report on U.S. Renewable Energy Credit (REC) Markets 3.0 Overview of State RPS Programs
May 2011 Black & Veatch 35
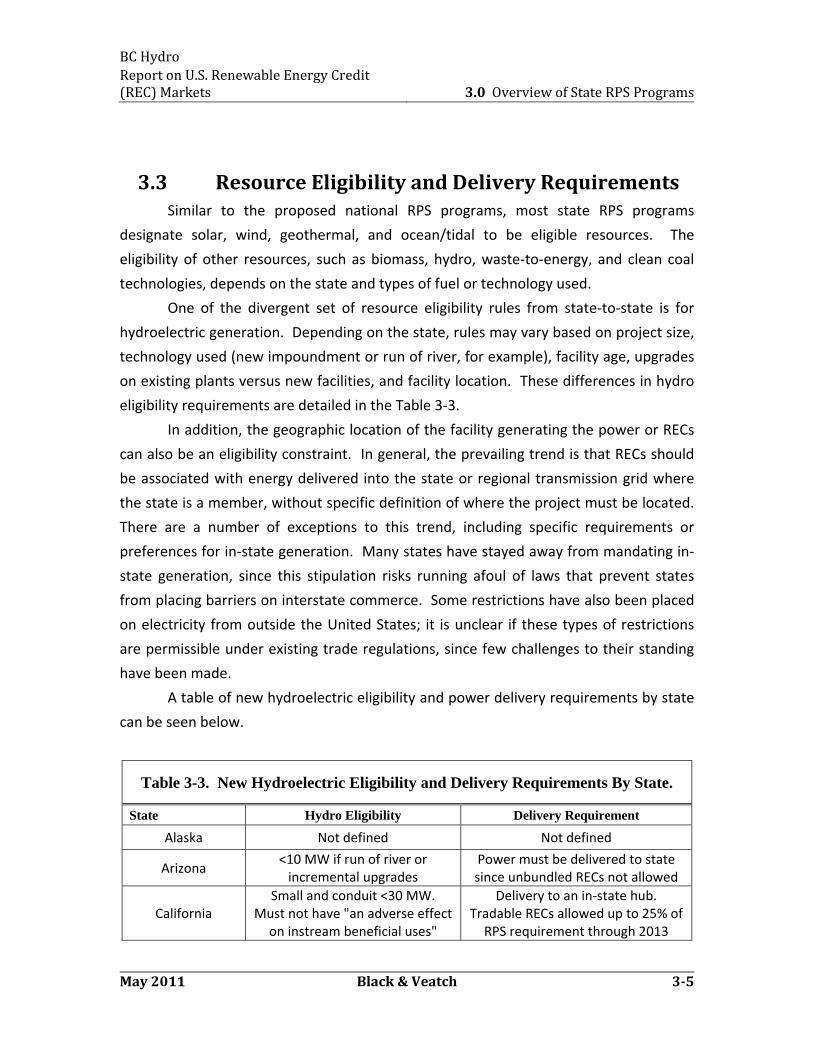
3.3 Resource Eligibility and Delivery Requirements Similar to the proposed national RPS programs, most state RPS programs
designate solar, wind, geothermal, and ocean/tidal to be eligible resources. The
eligibility of other resources, such as biomass, hydro, waste‐to‐energy, and clean coal
technologies, depends on the state and types of fuel or technology used.
One of the divergent set of resource eligibility rules from state‐to‐state is for
hydroelectric generation. Depending on the state, rules may vary based on project size,
technology used (new impoundment or run of river, for example), facility age, upgrades
on existing plants versus new facilities, and facility location. These differences in hydro
eligibility requirements are detailed in the Table 3‐3.
In addition, the geographic location of the facility generating the power or RECs
can also be an eligibility constraint. In general, the prevailing trend is that RECs should
be associated with energy delivered into the state or regional transmission grid where
the state is a member, without specific definition of where the project must be located.
There are a number of exceptions to this trend, including specific requirements or
preferences for in‐state generation. Many states have stayed away from mandating in‐
state generation, since this stipulation risks running afoul of laws that prevent states
from placing barriers on interstate commerce. Some restrictions have also been placed
on electricity from outside the United States; it is unclear if these types of restrictions
are permissible under existing trade regulations, since few challenges to their standing
have been made.
A table of new hydroelectric eligibility and power delivery requirements by state
can be seen below.
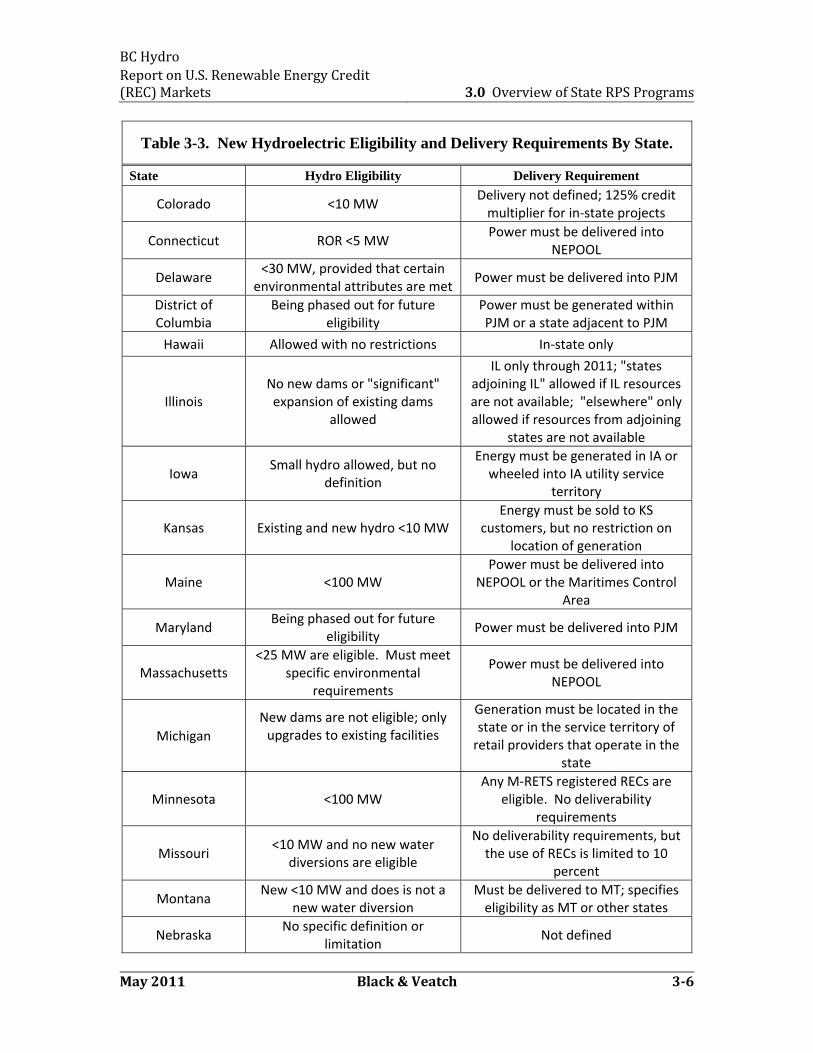
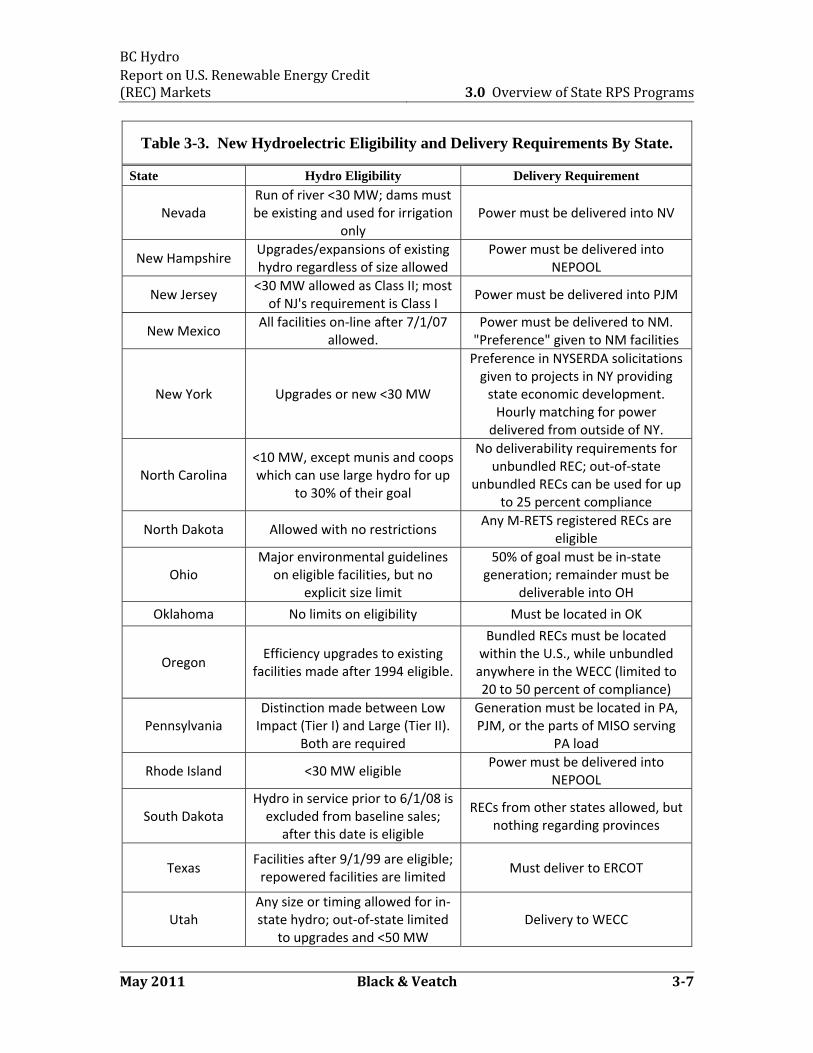
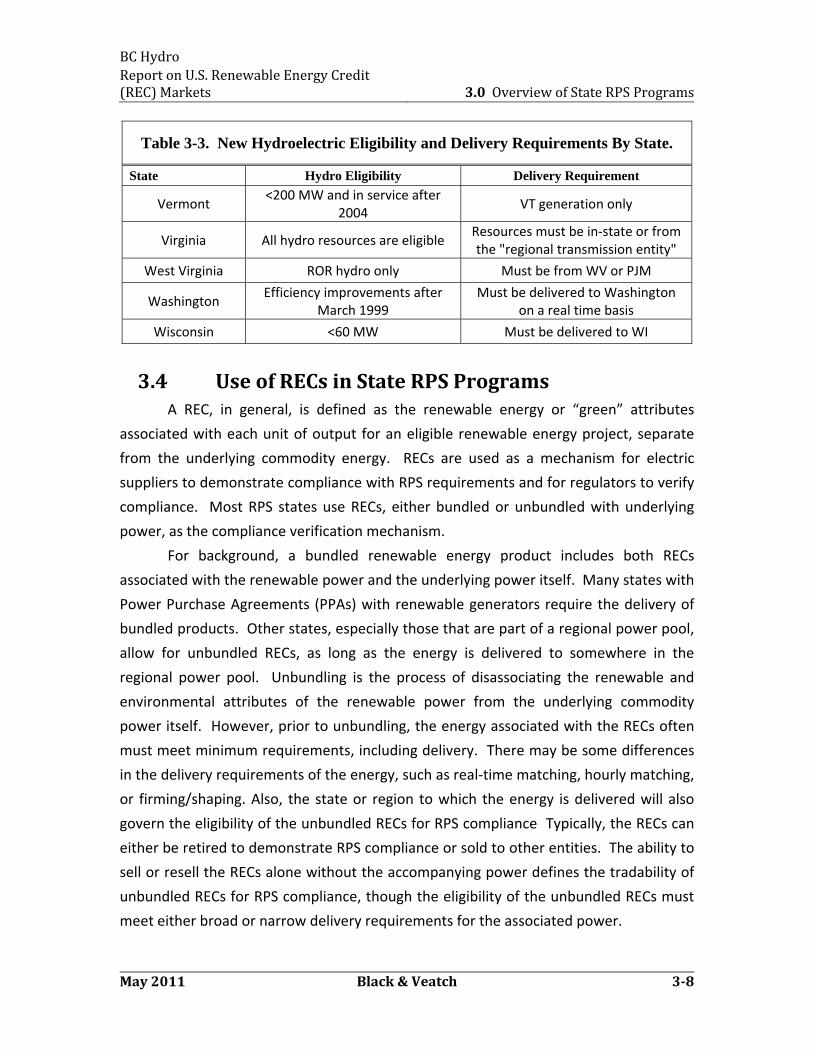
Table 3-3. New Hydroelectric Eligibility and Delivery Requirements By State.
State Hydro Eligibility Delivery Requirement
Alaska Not defined Not defined
Arizona <10 MW if run of river or incremental upgrades
Power must be delivered to state since unbundled RECs not allowed
California Small and conduit <30 MW.
Must not have "an adverse effect on instream beneficial uses"
Delivery to an in‐state hub. Tradable RECs allowed up to 25% of RPS requirement through 2013
BC Hydro Report on U.S. Renewable Energy Credit (REC) Markets 3.0 Overview of State RPS Programs
May 2011 Black & Veatch 36
Table 3-3. New Hydroelectric Eligibility and Delivery Requirements By State.
State Hydro Eligibility Delivery Requirement
Colorado <10 MW Delivery not defined; 125% credit multiplier for in‐state projects
Connecticut ROR <5 MW Power must be delivered into
NEPOOL
Delaware <30 MW, provided that certain
environmental attributes are metPower must be delivered into PJM
District of Columbia
Being phased out for future eligibility
Power must be generated within PJM or a state adjacent to PJM
Hawaii Allowed with no restrictions In‐state only
Illinois No new dams or "significant" expansion of existing dams
allowed
IL only through 2011; "states adjoining IL" allowed if IL resources are not available; "elsewhere" only allowed if resources from adjoining
states are not available
Iowa Small hydro allowed, but no
definition
Energy must be generated in IA or wheeled into IA utility service
territory
Kansas Existing and new hydro <10 MW Energy must be sold to KS
customers, but no restriction on location of generation
Maine <100 MW Power must be delivered into
NEPOOL or the Maritimes Control Area
Maryland Being phased out for future
eligibilityPower must be delivered into PJM
Massachusetts <25 MW are eligible. Must meet
specific environmental requirements
Power must be delivered into NEPOOL
Michigan New dams are not eligible; only upgrades to existing facilities
Generation must be located in the state or in the service territory of retail providers that operate in the
state
Minnesota <100 MW Any M‐RETS registered RECs are
eligible. No deliverability requirements
Missouri <10 MW and no new water
diversions are eligible
No deliverability requirements, but the use of RECs is limited to 10
percent
Montana New <10 MW and does is not a
new water diversion Must be delivered to MT; specifies eligibility as MT or other states
Nebraska No specific definition or
limitationNot defined
BC Hydro Report on U.S. Renewable Energy Credit (REC) Markets 3.0 Overview of State RPS Programs
May 2011 Black & Veatch 37
Table 3-3. New Hydroelectric Eligibility and Delivery Requirements By State.
State Hydro Eligibility Delivery Requirement
Nevada Run of river <30 MW; dams must be existing and used for irrigation
onlyPower must be delivered into NV
New Hampshire Upgrades/expansions of existing hydro regardless of size allowed
Power must be delivered into NEPOOL
New Jersey <30 MW allowed as Class II; most of NJ's requirement is Class I
Power must be delivered into PJM
New Mexico All facilities on‐line after 7/1/07
allowed.Power must be delivered to NM. "Preference" given to NM facilities
New York Upgrades or new <30 MW
Preference in NYSERDA solicitations given to projects in NY providing state economic development. Hourly matching for power delivered from outside of NY.
North Carolina <10 MW, except munis and coops which can use large hydro for up
to 30% of their goal
No deliverability requirements for unbundled REC; out‐of‐state
unbundled RECs can be used for up to 25 percent compliance
North Dakota Allowed with no restrictions Any M‐RETS registered RECs are
eligible
Ohio Major environmental guidelines
on eligible facilities, but no explicit size limit
50% of goal must be in‐state generation; remainder must be
deliverable into OH
Oklahoma No limits on eligibility Must be located in OK
Oregon Efficiency upgrades to existing
facilities made after 1994 eligible.
Bundled RECs must be located within the U.S., while unbundled anywhere in the WECC (limited to 20 to 50 percent of compliance)
Pennsylvania Distinction made between Low Impact (Tier I) and Large (Tier II).
Both are required
Generation must be located in PA, PJM, or the parts of MISO serving
PA load
Rhode Island <30 MW eligible Power must be delivered into
NEPOOL
South Dakota Hydro in service prior to 6/1/08 is excluded from baseline sales;
after this date is eligible
RECs from other states allowed, but nothing regarding provinces
Texas Facilities after 9/1/99 are eligible; repowered facilities are limited
Must deliver to ERCOT
Utah Any size or timing allowed for in‐state hydro; out‐of‐state limited
to upgrades and <50 MWDelivery to WECC
BC Hydro Report on U.S. Renewable Energy Credit (REC) Markets 3.0 Overview of State RPS Programs
May 2011 Black & Veatch 38
Table 3-3. New Hydroelectric Eligibility and Delivery Requirements By State.
State Hydro Eligibility Delivery Requirement
Vermont <200 MW and in service after
2004 VT generation only
Virginia All hydro resources are eligible Resources must be in‐state or from the "regional transmission entity"
West Virginia ROR hydro only Must be from WV or PJM
Washington Efficiency improvements after
March 1999 Must be delivered to Washington
on a real time basis
Wisconsin <60 MW Must be delivered to WI
3.4 Use of RECs in State RPS Programs A REC, in general, is defined as the renewable energy or “green” attributes
associated with each unit of output for an eligible renewable energy project, separate
from the underlying commodity energy. RECs are used as a mechanism for electric
suppliers to demonstrate compliance with RPS requirements and for regulators to verify
compliance. Most RPS states use RECs, either bundled or unbundled with underlying
power, as the compliance verification mechanism.
For background, a bundled renewable energy product includes both RECs
associated with the renewable power and the underlying power itself. Many states with
Power Purchase Agreements (PPAs) with renewable generators require the delivery of
bundled products. Other states, especially those that are part of a regional power pool,
allow for unbundled RECs, as long as the energy is delivered to somewhere in the
regional power pool. Unbundling is the process of disassociating the renewable and
environmental attributes of the renewable power from the underlying commodity
power itself. However, prior to unbundling, the energy associated with the RECs often
must meet minimum requirements, including delivery. There may be some differences
in the delivery requirements of the energy, such as real‐time matching, hourly matching,
or firming/shaping. Also, the state or region to which the energy is delivered will also
govern the eligibility of the unbundled RECs for RPS compliance Typically, the RECs can
either be retired to demonstrate RPS compliance or sold to other entities. The ability to
sell or resell the RECs alone without the accompanying power defines the tradability of
unbundled RECs for RPS compliance, though the eligibility of the unbundled RECs must
meet either broad or narrow delivery requirements for the associated power.
BC Hydro Report on U.S. Renewable Energy Credit (REC) Markets 3.0 Overview of State RPS Programs
May 2011 Black & Veatch 39
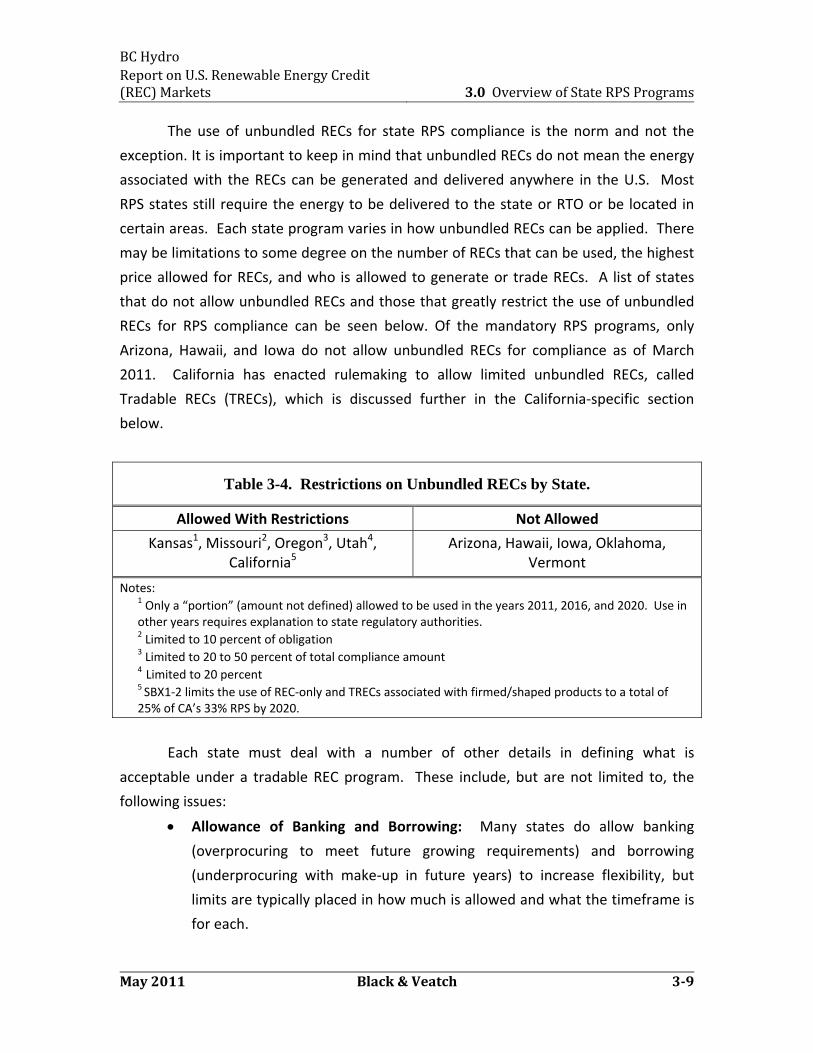
The use of unbundled RECs for state RPS compliance is the norm and not the
exception. It is important to keep in mind that unbundled RECs do not mean the energy
associated with the RECs can be generated and delivered anywhere in the U.S. Most
RPS states still require the energy to be delivered to the state or RTO or be located in
certain areas. Each state program varies in how unbundled RECs can be applied. There
may be limitations to some degree on the number of RECs that can be used, the highest
price allowed for RECs, and who is allowed to generate or trade RECs. A list of states
that do not allow unbundled RECs and those that greatly restrict the use of unbundled
RECs for RPS compliance can be seen below. Of the mandatory RPS programs, only
Arizona, Hawaii, and Iowa do not allow unbundled RECs for compliance as of March
2011. California has enacted rulemaking to allow limited unbundled RECs, called
Tradable RECs (TRECs), which is discussed further in the California‐specific section
below.
Table 3-4. Restrictions on Unbundled RECs by State.
Allowed With Restrictions Not Allowed
Kansas1, Missouri2, Oregon3, Utah4, California5
Arizona, Hawaii, Iowa, Oklahoma, Vermont
Notes: 1 Only a “portion” (amount not defined) allowed to be used in the years 2011, 2016, and 2020. Use in other years requires explanation to state regulatory authorities. 2 Limited to 10 percent of obligation 3 Limited to 20 to 50 percent of total compliance amount 4 Limited to 20 percent
5 SBX1‐2 limits the use of REC‐only and TRECs associated with firmed/shaped products to a total of 25% of CA’s 33% RPS by 2020.
Each state must deal with a number of other details in defining what is
acceptable under a tradable REC program. These include, but are not limited to, the
following issues:
Allowance of Banking and Borrowing: Many states do allow banking
(overprocuring to meet future growing requirements) and borrowing
(underprocuring with make‐up in future years) to increase flexibility, but
limits are typically placed in how much is allowed and what the timeframe is
for each.
BC Hydro Report on U.S. Renewable Energy Credit (REC) Markets 3.0 Overview of State RPS Programs
May 2011 Black & Veatch 310
REC Tracking System: A common requirement is to assure that any RECs
generated are certified and retired through a third‐party tracking system.
Systems have been set up in the West (WREGIS), Midwest (MRETS), East
(NEPOOL GIS), Mid‐Atlantic (PJM GATS), and Texas (through ERCOT).
Individual states may also have specific tracking systems (such as Nevada)
which must be followed.
Trading and Utilization Limits: States typically address who is permitted to
trade RECs, the amount of unbundled RECs allowed to be used to meet RPS
goals, the delivery requirements for the associated power, and what (if any)
price caps exist.
Trading Between States: Trading of RECs between states is common for
those that are part of a wholesale power pool, which is predominant in the
Midwest, Northeast, and Mid‐Atlantic regions. These states still require
delivery of the energy to their respective power pools. The use of unbundled
RECs without any delivery requirements to meet RPS requirements is rare.
BC Hydro Report on U.S. Renewable Energy Credit (REC) Markets 4.0 Detailed WECC State RPS Requirements
May 2011 Black & Veatch 41
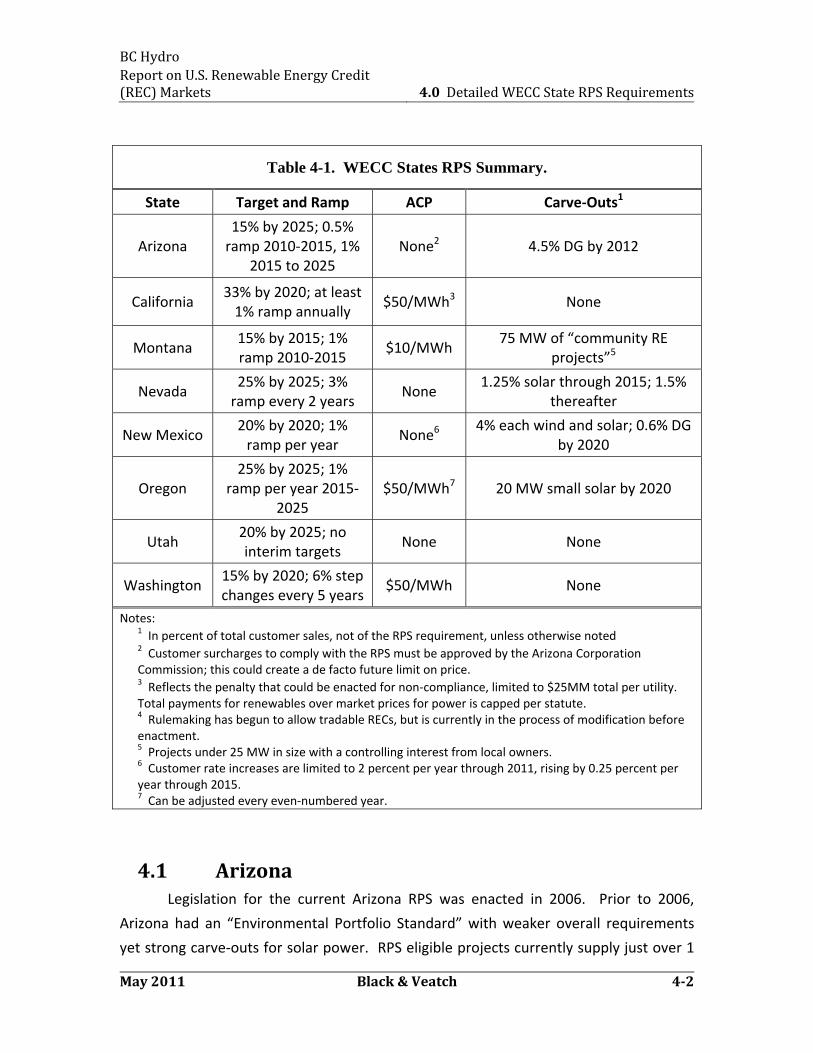
4.0 Detailed WECC State RPS Requirements
The states in the Western U.S. represent potential markets for exporting
renewable power due to their proximity, demand, and strong policies supporting
renewable energy. A summary of the key components of the RPS policies enacted in
WECC states is outlined in Table 4‐1. Additional details on each state for deliverability
requirements, the allowances for the eligibility and use of hydro, unique resource
eligibility requirements and restrictions, applicable load, and potential future
modifications to existing RPS policy are discussed below.
BC Hydro Report on U.S. Renewable Energy Credit (REC) Markets 4.0 Detailed WECC State RPS Requirements
May 2011 Black & Veatch 42
Table 4-1. WECC States RPS Summary.
State Target and Ramp ACP Carve‐Outs1
Arizona 15% by 2025; 0.5% ramp 2010‐2015, 1%
2015 to 2025 None2 4.5% DG by 2012
California 33% by 2020; at least 1% ramp annually
$50/MWh3 None
Montana 15% by 2015; 1% ramp 2010‐2015
$10/MWh 75 MW of “community RE
projects”5
Nevada 25% by 2025; 3% ramp every 2 years
None 1.25% solar through 2015; 1.5%
thereafter
New Mexico 20% by 2020; 1% ramp per year
None6 4% each wind and solar; 0.6% DG
by 2020
Oregon 25% by 2025; 1%
ramp per year 2015‐2025
$50/MWh7 20 MW small solar by 2020
Utah 20% by 2025; no interim targets
None None
Washington 15% by 2020; 6% step changes every 5 years
$50/MWh None
Notes: 1 In percent of total customer sales, not of the RPS requirement, unless otherwise noted 2 Customer surcharges to comply with the RPS must be approved by the Arizona Corporation Commission; this could create a de facto future limit on price. 3 Reflects the penalty that could be enacted for non‐compliance, limited to $25MM total per utility. Total payments for renewables over market prices for power is capped per statute. 4 Rulemaking has begun to allow tradable RECs, but is currently in the process of modification before enactment. 5 Projects under 25 MW in size with a controlling interest from local owners. 6 Customer rate increases are limited to 2 percent per year through 2011, rising by 0.25 percent per year through 2015. 7 Can be adjusted every even‐numbered year.
4.1 Arizona Legislation for the current Arizona RPS was enacted in 2006. Prior to 2006,
Arizona had an “Environmental Portfolio Standard” with weaker overall requirements
yet strong carve‐outs for solar power. RPS eligible projects currently supply just over 1
BC Hydro Report on U.S. Renewable Energy Credit (REC) Markets 4.0 Detailed WECC State RPS Requirements
May 2011 Black & Veatch 43
percent of the state’s load, putting the state roughly on‐target based on the compliance
requirements.
Deliverability: RPS eligible power must be delivered to Arizona entities that
must comply with the RPS or be utilized by ratepayers in the state. RECs from
distributed power can be purchased by utilities without having to take delivery.
Tradable RECs from non‐distributed power are not allowed.
Use of Hydro: Projects that are less than 10 MW in size and are run‐of‐river or
incremental upgrades to existing facilities are eligible. No known hydro facilities
are currently being utilized for compliance.
Unique Resource Eligibility or Restrictions: The special carve‐out for distributed
generation has made eligible a wide range of small‐scale renewable technologies
not typically used in state RPS policies such as solar water heating and solar
space cooling. Municipal solid waste (MSW) is only eligible if approved
conversion technologies are applied.
Applicable Load: All utilities with retail load in Arizona, with the exception of
public utilities and those with more than half their load outside Arizona, must
comply with the RPS. Roughly 63 percent of the state’s load must comply, since
one of the largest utilities in the state (Salt River Project) is a public entity.
Future Changes Being Considered: No major changes are currently expected or
proposed for the Arizona RPS. Legislation was proposed in 2010 by a state
legislator that would likely weaken the state’s RPS. While this bill did not receive
broad support, it is possible that there could be future attempts to weaken the
existing policy.
4.2 California California has the largest projected renewable energy demand in the country
owing to the state’s size and renewable energy target. First enacted in 2002, the state
has since increased the renewable energy goal twice, now at 33 percent by 2020
through Executive Order. Utilities that must comply with the state RPS are currently
supplying 15 percent of their load with renewable power, below the goal of 20 percent
established for 2010. Meeting future goals will require aggressive procurement of new
BC Hydro Report on U.S. Renewable Energy Credit (REC) Markets 4.0 Detailed WECC State RPS Requirements
May 2011 Black & Veatch 44
renewable resources. Failure to meet compliance levels will results in a penalty charge
of $50/MWh for each MWh shortfall unless the utility can show good cause for missing
the target (e.g. PPA sellers fail to perform, needed transmission is not built, etc,).
Deliverability: To count as a bundled renewable product for RPS eligibility, an
eligible renewable facility must be either directly interconnected to a California
balancing authority area or the facility must use a dynamic transfer arrangement
(either electronically moved into the receiving balancing authority AGC system
or allowing automatic changes to the intertie schedule to the receiving balancing
authority). A dynamic transfer arrangement typically would require the
reservation of firm transmission. The California Public Utility Commission (CPUC)
continues to consider possibly allowing eligible renewable resources that are not
directly connected to a California balancing authority to be considered a bundled
renewable product if they have firm transmission to California but do not have a
dynamic transfer arrangement. Power that is firmed and shaped (not
dynamically scheduled) is eligible for RPS compliance, but whether it is classified
as bundled or REC‐only (TREC) is part of CPUC’s consideration.“Firming and
shaping refers to the process by which resources with variable delivery schedules
may be backed up or supplemented with delivery from another source to meet
customer load.”6 The issue of TREC designation is important because the
California PUC ruled in January of 2011 that, for California investor owned
utilities, TRECs will be limited to 25 percent of annual renewable targets through
2013. Allowable amounts of TRECs purchased during this period have a price cap
of $50/MWh. Black & Veatch estimates that, if the currently approved contracts
for out‐of‐state generation from variable output projects are considered REC‐
only transactions due to inability to dynamically transfer energy to the state,
these existing project could comprise about 20 to 25 percent of the near term
target in 2013. Furthermore, there are about 4000 GWh of additional contracts
of a similar nature pending approval at the CPUC. Thus, before 2013, there
appears to be limited opportunities for additional TREC transactions to meet IOU
RPS demands in California. The CPUC will revisit, at a later date, the use of TRECs
for RPS compliance for investor owned utilities in California for periods beyond
6 “Renewable Portfolio Standard (RPS) Eligibility Guidebook: Fourth Edition,” California Energy Commission (CEC), January 2011, [CEC-300-2010-007-CMF].
BC Hydro Report on U.S. Renewable Energy Credit (REC) Markets 4.0 Detailed WECC State RPS Requirements
May 2011 Black & Veatch 45
2013, so there is additional uncertainty regarding whether future limits on the
use of TRECs would be lifted or continue indefinitely.
Use of Hydro: Small (<30 MW), conduit (also <30 MW), and upgrades to
facilities in existence prior to 2007 are allowed. To be eligible for the RPS,
facilities must not have "an adverse effect on instream beneficial uses". Over
1,000 MW of hydro currently counts toward RPS compliance.
Unique Resource Eligibility or Restrictions: Out‐of‐state facilities must meet
California environmental requirements to be considered eligible resources. No
unique resources are eligible in California’s RPS. MSW is largely ineligible, and
some restrictions are placed on the type of biomass conversion technologies that
can be employed.
Applicable Load: All of the state’s investor owned utilities (Pacific Gas & Electric,
Southern California Edison, and San Diego Gas & Electric) must comply with the
RPS. While publicly owned utilities are not required to comply per current
regulations, most have set targets that match the RPS requirements. In addition,
the Executive Order raising the RPS target to 33 percent included publicly owned
utilities for future compliance requirements. Roughly 98 percent of the overall
state’s load is covered by the RPS.
Future Changes Being Considered: On September 15, 2009, Executive Order
(EO), S‐21‐09, directed the California Air Resources Board (CARB) to adopt
regulations requiring 33 percent of electricity sold in the state to come from
renewable energy by 2020. The EO used the authority provided by the state’s
GHG reduction goals (AB 32) as the legal framework. On March 30, 2011, the
California legislature passed a bill (SBX1‐2) to codify the Executive Order; past
efforts had failed due to restrictions placed on the use of out‐of‐state renewable
energy in the new law. The RPS targets laid out by SBX1‐2 are: 20% by end of
2013, 25% by end of 2016, and 33% by end of 2020. The loading order in the bill
specifies how much must or is allowed to come from each of three categories of
projects.
a. CA resources or dynamically scheduled to CA: Minimum of 50% in 2013,
65% in 2016, and 75% by 2020.
BC Hydro Report on U.S. Renewable Energy Credit (REC) Markets 4.0 Detailed WECC State RPS Requirements
May 2011 Black & Veatch 46
b. Unbundled RECs (must be in the WECC, but electricity does not have be
delivered to CA): Maximum of 25% 2013, 15% in 2016, and 10% by 2020.
c. CA delivered product that is shaped and firmed: Remainder
4.3 Montana Montana enacted its RPS in 2006, with few changes made to the basic regulatory
structure since that time. Roughly 7 percent of the state’s RPS eligible load was served
by renewables in 2009; the 2010 target is 10 percent.
Deliverability: RPS eligible resources must be delivered to Montana from either
facilities located in Montana or other U.S. states. From the wording of the
statute, non‐U.S. resources are not eligible.
Use of Hydro: Existing projects smaller than 15 MW or new projects under 10
MW in operation after 2004 are eligible. New water diversions are not
permitted. Two small hydro projects, comprising 2 MW of capacity, are currently
counted toward RPS requirements.
Unique Resource Eligibility or Restrictions: No unique resources are included or
excluded from Montana’s RPS. MSW is not permitted for conversion to power.
Applicable Load: All utilities regulated by the Public Service Commission must
meet RPS requirements. While municipal and cooperative utilities are not
explicitly required to meet the requirements, they must develop a renewable
plan that follows the “intent of the legislature”. Roughly 72 percent of
Montana’s state load must meet the RPS requirements.
Future Changes Being Considered: Legislation introduced during the 2009
legislative session attempted to increase the RPS requirement to 25 percent by
2025, since the current RPS ends in 2015, and to allow incremental hydro power
to be an eligible generation resource. While neither passed in 2009, the 2011
legislature could reintroduce similar legislation. Support for a stronger RPS exists
in both the executive and legislative branches of Montana’s government.
BC Hydro Report on U.S. Renewable Energy Credit (REC) Markets 4.0 Detailed WECC State RPS Requirements
May 2011 Black & Veatch 47
4.4 Nevada The first RPS requirements were passed by the Nevada legislature in 1997 and
have been subsequently increased to the current level of 25 percent. The regulated
utility in the state is currently meeting the existing target of 12 percent
renewables/energy efficiency, but will need to continue to be aggressive in
procurement to meet future targets.
Deliverability: RPS compliant power must be delivered and used in Nevada.
Use of Hydro: The eligibility statutes for the Nevada RPS make it challenging for
hydro resources to qualify. Only run‐of‐river facilities less than 30 MW, or
existing dams which are less than 30 MW in size, with water used exclusively for
irrigation, are eligible. Roughly 12 MW of total hydro capacity is currently
utilized for RPS compliance.
Unique Resource Eligibility or Restrictions: Nevada considers a wide range of
technologies and feedstocks as eligible for RPS compliance including customer
sited solar technologies, MSW, and energy recovery technologies. Energy
recovery technologies include power derived from the reduction in pressure in
water or gas pipelines, and the use of waste heat to power except in facilities
with power generation as their main function. Additionally, energy efficiency
measures can be used to meet up to 25 percent of Nevada’s requirement.
Applicable Load: Only utilities regulated by the Public Utilities Commission of
Nevada must comply with the RPS. Co‐ops and municipal utilities are not
required to meet RPS obligations. In practice, this means that only one utility,
NV Energy, must meet the state mandates. NV Energy has separate obligations
in both the northern (former Sierra Pacific service territory) and southern
(former Nevada Power service territory) segments of the state.
Future Changes Being Considered: The most recent legislative session (2009)
saw an increase in both the overall RPS target and solar energy carve‐out, as well
as greater compliance flexibility by allowing the use of out‐of‐state energy. The
legislature meets again in 2011, with a new governor at the head of the
executive branch; no firm initiatives for major modification of the RPS are
currently foreseen.
BC Hydro Report on U.S. Renewable Energy Credit (REC) Markets 4.0 Detailed WECC State RPS Requirements
May 2011 Black & Veatch 48
A recent ruling by the Public Utility Commission of Nevada requiring that the
price for new renewable contracts must be publicly released has placed greater
scrutiny on the cost of the RPS. Given the condition of Nevada’s economy at this
time, efforts may be made to slow or limit future increases in RPS targets.
4.5 New Mexico The RPS in its current form was passed by the New Mexico legislature in 2007.
New Mexico has some of the most extensive carve‐outs in the country, with specific
requirements for wind, solar, and distributed generation. Current renewable generation
is roughly 6 percent of applicable load; the state target increases to 10 percent in 2011.
Deliverability: The RPS requires that power used for RPS compliance be
delivered to New Mexico. “Preference” is given to facilities located in New
Mexico, although it is unclear what this specifically means.
Use of Hydro: Few restrictions are placed on the use of hydro in New Mexico.
Any new facilities placed on‐line after 1 July 2007 are eligible.
Unique Resource Eligibility or Restrictions: Few unique resources are included
or excluded per RPS definitions. MSW is not included in the definition of
renewable resources.
Applicable Load: Retail suppliers regulated by the Public Regulation Commission
and rural cooperatives must comply, although the RPS requirement for rural
cooperatives is lower (10 percent by 2020). Municipal electric providers are
exempt. Regulations cover roughly 88 percent of the state’s load.
Future Changes Being Considered: No major changes are currently envisioned
to impact New Mexico’s RPS. Expanding the use of abundant of renewable
energy resources in the state has been mentioned as a priority for many within
the current government. New Mexico has some of the most aggressive
environmental laws in the U.S., with state specific GHG regulations passed in
2010.
BC Hydro Report on U.S. Renewable Energy Credit (REC) Markets 4.0 Detailed WECC State RPS Requirements
May 2011 Black & Veatch 49
4.6 Oregon Oregon passed RPS legislation in 2007 with an initial target of 5 percent
renewables by 2011, rising to 25 percent by 2025. Minor modifications have been made
since that time to promote the development of a diverse renewable portfolio. Roughly
8 percent of the RPS eligible load comes from renewable energy today, exceeding the
2011 target.
Deliverability: Relative to other U.S. states in the WECC, Oregon has less strict
requirements for the delivery of RPS eligible energy to the state. Unbundled
RECs do not need to be associated with power delivered to the state, while
bundled RECs can be firmed and shaped before eventual delivery to the load
serving entity. Unbundled RECs can make up 20 to 50 percent of the yearly RPS
requirement, depending on the size of the utility. Unbundled RECs can originate
from any facilities within the WECC, while bundled RECs must come from
facilities in the U.S. portion of the WECC.
Use of Hydro: Only limited types of hydro are RPS compliant. Efficiency
upgrades to existing facilities made after 1994 are eligible, as well as up to 90
MW of pre‐1995 hydro that is "low impact".
Unique Resource Eligibility or Restrictions: MSW is eligible for the RPS. The
amount of power from new MSW facilities to meet RPS requirements is limited
to a total of 9 MW. Very specific definitions are provided for the biomass
resources that are and are not RPS eligible.
Applicable Load: All utilities must comply with RPS requirements, although the
target for each utility differs depending on their size. Utilities that have at least 3
percent of the state’s load must meet the 25 percent requirement, while smaller
utilities only have to meet a 10 or 5 percent target.
Future Changes Being Considered: Renewable energy has strong support in
Oregon among the population and the incoming government. Utilities will be
aggressively procuring new energy sources to meet 2015 targets; it is unlikely
any changes will be made in the target amounts. Recent statements regarding
enhanced support for energy efficiency may lead to its eventual inclusion as a
carve‐out or as eligible for RPS compliance.
BC Hydro Report on U.S. Renewable Energy Credit (REC) Markets 4.0 Detailed WECC State RPS Requirements
May 2011 Black & Veatch 410
4.7 Utah Utah passed its RPS in 2008. Unlike the other states reviewed in this section,
Utah’s RPS is only a goal, not a mandate, with regulated utilities only encouraged to
procure renewables only “to the extent that it is cost effective to do so”. There are no
interim goals for the amount of renewables to be procured, and limited restrictions on
the eligible resources. Roughly 8 percent of the RPS eligible load is from qualifying
renewables, giving the state a good start at meeting future goals.
Deliverability: Power does not need to be delivered to Utah to be RPS eligible;
unbundled RECs that are utilized must be generated within the WECC.
Unbundled RECs are limited to 20 percent of a utility’s RPS obligation.
Use of Hydro: Any size or timing is allowed for in‐state hydro; out‐of‐state hydro
is limited to upgrades after 1 January 1995 and limited to 50 MW.
Unique Resource Eligibility or Restrictions: A wide range of resources are RPS
eligible per Utah statute including solar hot water and heating, coal mine
methane, MSW, cogeneration, ocean, tidal, energy efficiency and compressed air
energy storage (if the power used to compress the air is renewable).
Applicable Load: All utilities in the state have the RPS statute as their renewable
energy goal.
Future Changes Being Considered: Utah has strong potential for the
development of both fossil and renewable energy. The current setting of a
renewable goal rather than a mandate is a balance between the interests of
these industries. The current administration has made development of both low
cost and clean energy a priority; there does not appear to be any major efforts
underway to change the existing voluntary goal to a mandated goal.
4.8 Washington Washington’s RPS was passed through a voter initiative in 2006, with only minor
modifications to the policy since the original legislation was placed into law. Roughly 6
percent of eligible load is served by renewable energy today, surpassing the current
requirement of 3 percent. Currently, some renewable energy produced in Washington
BC Hydro Report on U.S. Renewable Energy Credit (REC) Markets 4.0 Detailed WECC State RPS Requirements
May 2011 Black & Veatch 411
is being sold to California to help meets its RPS. The target will increase to 9 percent in
2016.
Deliverability: RPS eligible power must come from a specific geographic location
(in the Pacific Northwest only) and/or must be delivered to Washington on a
real‐time basis.
Use of Hydro: Very few hydro resources are RPS eligible in Washington. Only
efficiency improvements after March 1999 are eligible for RPS credit. Currently,
small hydro makes up roughly 60 MW of RPS eligible capacity.
Unique Resource Eligibility or Restrictions: Tidal and wave energy is RPS
eligible, while MSW is not. The combustion of black liquor from pulp and paper
manufacturing is also excluded from RPS compliance. All “cost‐effective” energy
conservation must be employed in the state, although energy savings are not
counted toward RPS goals.
Applicable Load: All utilities with more than 25,000 customers must abide by
the RPS goals. This represents roughly 85 percent of the state’s electricity load.
Future Changes Being Considered: Although Washington gets roughly 70
percent of its power from hydroelectric sources, very little counts toward the
state’s RPS requirements and the load of the regulated utilities is not adjusted to
account for this supply. State utilities have been working to increase flexibility in
the RPS, while other groups have been attempting to raise the RPS goals. This
could have an impact in future eligible resources and procurement efforts.
BC Hydro Report on U.S. Renewable Energy Credit (REC) Markets
5.0 Overview of Key Factors that influence REC price
May 2011 Black & Veatch 51
5.0 Overview of Key Factors that influence REC price
Since there is not an actively traded, liquid REC market in existence in the WECC, REC
prices, as discussed in this report, refer to the annual Renewable Energy Premium
required to stimulate incremental new renewable energy (RE) projects. This reflects the
implied long‐term REC value, rather than a spot market price.
RE premiums are calculated for energy delivered from each RE project to each delivery
load zone. The premium reflects the amount required, above or below the energy and
capacity value at the delivery load zone, to make a project whole. In other words, the
RE premium is the difference between a project cost and the delivered value. The cost
of a project includes its levelized cost of energy (LCOE or busbar cost), as well as
transmission costs and losses associated with delivery of the energy. The energy and
capacity value incorporates the weighted average (based on time‐of‐day) value of the
particular Project’s production pattern. The simplified formula is as follows:
RE Premium = (LCOE + Transmission + Losses) – (Energy Value + Capacity Value)
Given the calculation method of the RE Premium, the main factors that impact
REC prices are:
RPS demand
Capital cost and change in technology over time
Availability of tax incentives
Forecasted energy and capacity value
Incremental transmission cost and transmission utilization
Financing
Delivery requirement
Though all of these components can impact the RE Premium significantly, Black
& Veatch chose to focus on the RPS demand, capital cost, grants and tax incentives, and
forecasted energy/capacity value in this discussion.
RPS demand is determined by both RPS targets and the anticipated load growth,
since RPS targets are usually a percentage of retail sales. Different load growth
trajectories for retail sales will impact the amount of renewable energy needed to meet
RPS targets over time. The amount of incremental demand determines the marginal
BC Hydro Report on U.S. Renewable Energy Credit (REC) Markets
5.0 Overview of Key Factors that influence REC price
May 2011 Black & Veatch 52
REC premium required to meet each year’s RPS demand, based on supply/demand
curve principles.
Furthermore, a decline in capital costs over time would mean future projects
would require lower levels of REC premiums to be made whole. The rate of decline will
also impact how quickly REC premiums fall over time. On the other hand, if grants or
tax incentives are reduced or discontinued, then the level of REC premium needed could
be significantly higher.
Looking at the value side, the underlying energy and capacity values have a
significant impact on the REC premium required. In forecasts where energy prices are
relatively high due to factors such as high natural gas prices and GHG policies, REC
premiums are low to zero, implying renewable energy projects can be competitive with
conventional options. On the other hand, if energy and capacity values are relatively
low, due to low natural gas prices and little environmental restrictions, then REC
premiums required would be high, which means it would be challenging for renewable
energy projects to compete with conventional generation.
Furthermore, there is a timing element in REC prices. If energy and capacity
values are expected to increase over time, at a rate faster than inflation, then the REC
premium required should shrink for future projects, assuming project costs do not
increase faster than inflation. However, as RPS requirements continue to increase,
higher cost resources will need to be accessed, since the lower cost (better capacity
factor) resources are selected usually in the earlier years. Thus, the impact of
energy/capacity value may not be easily discernable without considering all of these
factors together.
BC Hydro Report on U.S. Renewable Energy Credit (REC) Markets 6.0 REM Model Principles
May 2011 Black & Veatch 61
6.0 REM Model Principles
In support of BC Hydro’s Market Scenarios, Black & Veatch developed REC price
forecasts to correspond to the Market Scenarios. Black & Veatch used an in‐house
model, called the Renewable Energy Market (REM) model, to capture the potential
range of REC price outcomes under various scenarios. The REM model contains the
following underlying principles in the modeling approach:
The RE premium reflects the difference between the “Cost” of delivered
renewable energy and the underlying energy and capacity “Value”. The Cost
includes the levelized cost of busbar energy (LCOE), the cost of incremental
transmission, and transmission losses. The Value is based on forecasted
energy and capacity prices for the respective scenario being modeled.
Descriptions and costs of “Projects” are based on different resource classes
identified in each Qualified Resource Area (QRA) developed through the
Western Renewable Energy Zones (WREZ) Phase I project.7
Since definitions of “Projects” may consist of an entire class of resources in a
QRA, an availability constraint is placed on all projects in any given year. This
means only a portion of a defined “Project” is available to be built each year,
mimicking the reality of project development.
All RE premiums, costs, and energy/capacity values are based on 20‐year
levelized calculations. The LCOE also assumes Independent Power Producer
financing, even though some projects may be built by regulated utilities.
The incremental cost of new transmission acts as the economic constraint on
transmission between project hub and delivery load zone and is included in
the levelized cost of a Project. Transmission losses are also incorporated.
REC Prices are based on the RE Premiums of marginal units that satisfy each
state’s RPS requirement. To determine which projects are the marginal
units, supply curves are developed by rank ordering the REC premiums for all
available projects from lowest to highest. Then, the projects are allocated to
7 Black & Veatch used updated QRAs and resource classifications from the WREZ Phase I process that has not been published yet, as well as updated QRAs for British Columbia data provided by BC Hydro. The base cost for all wind projects in the WREZ model was also updated, but have not been published yet. Background methodology and analysis on WREZ resources can be found at: http://www.westgov.org/index.php?option=com_content&view=article&id=311&Itemid=81
BC Hydro Report on U.S. Renewable Energy Credit (REC) Markets 6.0 REM Model Principles
May 2011 Black & Veatch 62
states, starting with the lowest REC premium projects and then moving
higher up the supply curves. If a whole or portion of a project is allocated to
a state, then that portion cannot be allocated to another state nor can it be
used to satisfy incremental demand in future years. The marginal unit used
to meet a state’s RPS demand sets the marginal REC premium or “price” for
that year.
The model goes to 2025 when most state RPS programs end. Beyond that
time horizon, Black & Veatch has not assumed any additional increases in
RPS targets.
Transmission costs and financing assumptions are assumed to be the same
across all scenarios. Since transmission costs can vary dramatically depending on the
utilization factor and requires extensive iterative analysis, a 50 percent utilization factor
was assumed in calculating the incremental transmission cost for all scenarios. For
financing, Black & Veatch used the same default Independent Power Producer (IPP)
assumptions contained in the WREZ model for all renewable resources and
transmission.8 These assumptions were developed through a public stakeholder
process.
As run, the REM model also assumes that any renewable power that is physically
delivered using firm transmission to a state will count toward the RPS requirement of
that state. The model assumes that states generally do not allow the use of REC‐only
transaction that do not have accompanying delivered energy. Since it is assumed that
all of the states in this analysis require delivery of renewable energy to the state,9
models were set to look at each state’s RPS demand individually and calculate the RE
premium based on delivery to the state.
8 WREZ Transmission Model Version 2.0 http://www.westgov.org/wga/initiatives/wrez/gtm/documents/GTMWG%20Version%202_0%20June%202009.xls 9 This is a simplifying assumption for modeling purposes. It is noted that Oregon does allow some unbundled RECs without delivery to the state, as well as California’s new SBX1-2 legislation.
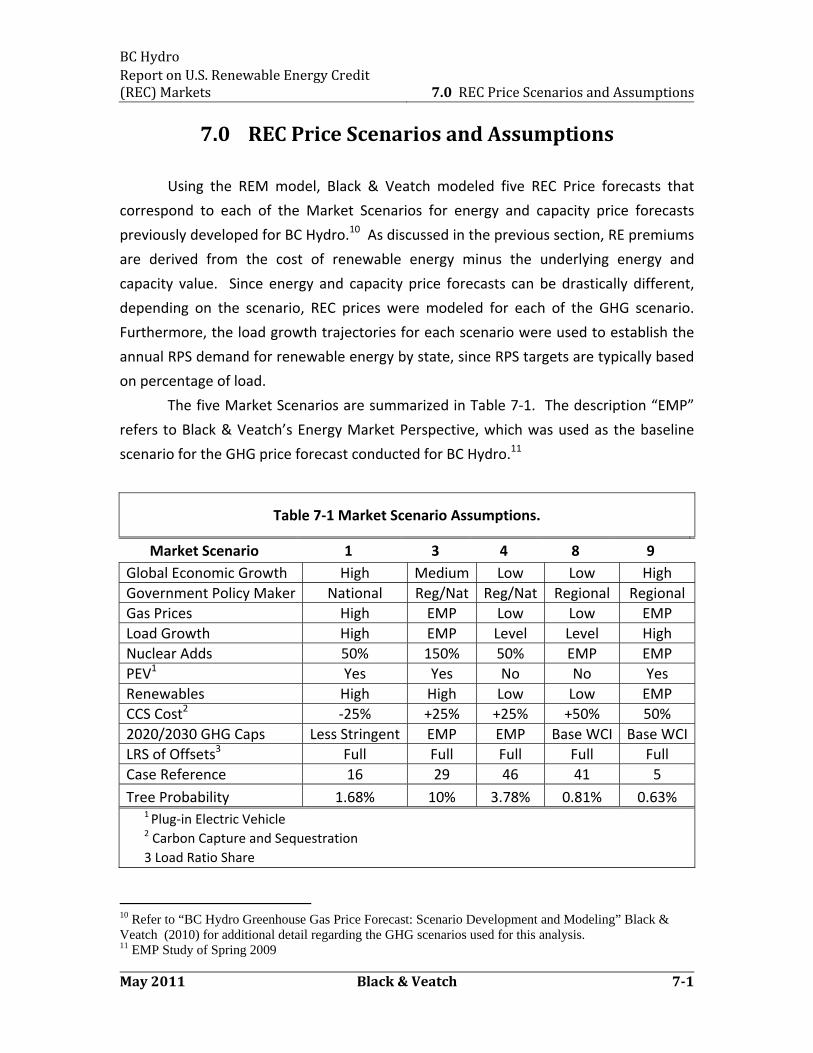
BC Hydro Report on U.S. Renewable Energy Credit (REC) Markets 7.0 REC Price Scenarios and Assumptions
May 2011 Black & Veatch 71
7.0 REC Price Scenarios and Assumptions
Using the REM model, Black & Veatch modeled five REC Price forecasts that
correspond to each of the Market Scenarios for energy and capacity price forecasts
previously developed for BC Hydro.10 As discussed in the previous section, RE premiums
are derived from the cost of renewable energy minus the underlying energy and
capacity value. Since energy and capacity price forecasts can be drastically different,
depending on the scenario, REC prices were modeled for each of the GHG scenario.
Furthermore, the load growth trajectories for each scenario were used to establish the
annual RPS demand for renewable energy by state, since RPS targets are typically based
on percentage of load.
The five Market Scenarios are summarized in Table 7‐1. The description “EMP”
refers to Black & Veatch’s Energy Market Perspective, which was used as the baseline
scenario for the GHG price forecast conducted for BC Hydro.11
Table 7‐1 Market Scenario Assumptions.
Market Scenario 1 3 4 8 9
Global Economic Growth High Medium Low Low High
Government Policy Maker National Reg/Nat Reg/Nat Regional Regional
Gas Prices High EMP Low Low EMP
Load Growth High EMP Level Level High
Nuclear Adds 50% 150% 50% EMP EMP
PEV1 Yes Yes No No Yes
Renewables High High Low Low EMP
CCS Cost2 ‐25% +25% +25% +50% 50%
2020/2030 GHG Caps Less Stringent EMP EMP Base WCI Base WCI
LRS of Offsets3 Full Full Full Full Full
Case Reference 16 29 46 41 5
Tree Probability 1.68% 10% 3.78% 0.81% 0.63% 1 Plug‐in Electric Vehicle 2 Carbon Capture and Sequestration
3 Load Ratio Share
10 Refer to “BC Hydro Greenhouse Gas Price Forecast: Scenario Development and Modeling” Black & Veatch (2010) for additional detail regarding the GHG scenarios used for this analysis. 11 EMP Study of Spring 2009
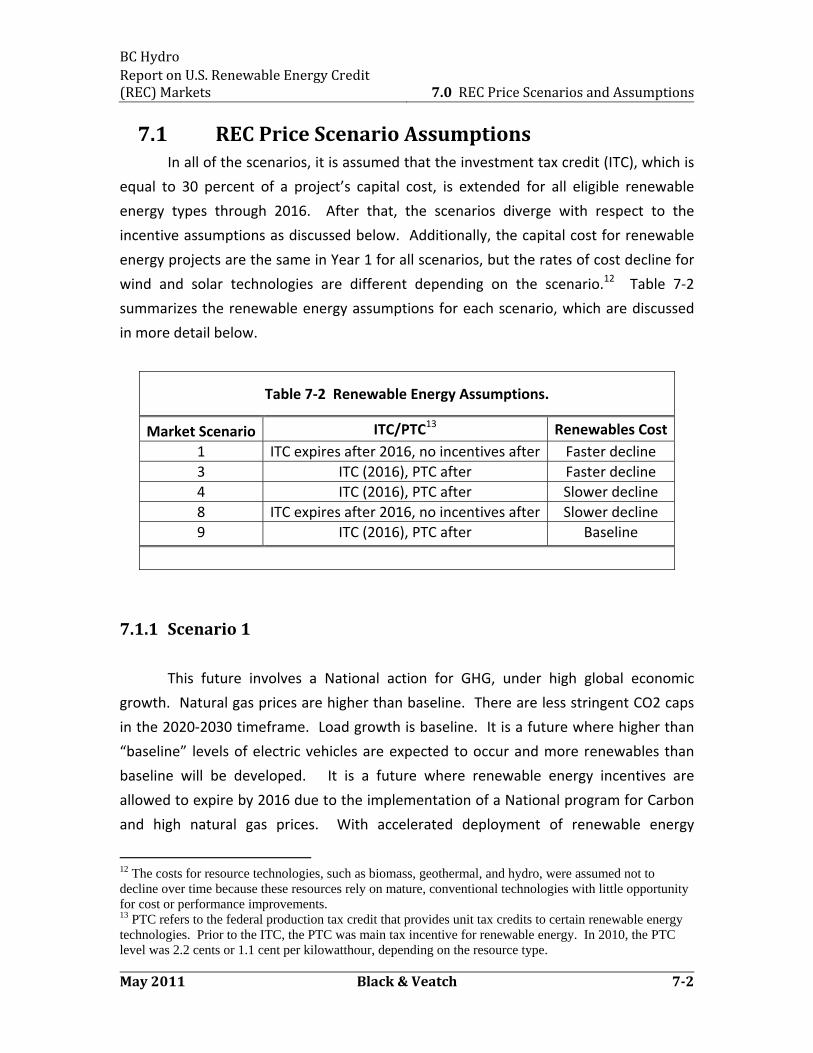
BC Hydro Report on U.S. Renewable Energy Credit (REC) Markets 7.0 REC Price Scenarios and Assumptions
May 2011 Black & Veatch 72
7.1 REC Price Scenario Assumptions In all of the scenarios, it is assumed that the investment tax credit (ITC), which is
equal to 30 percent of a project’s capital cost, is extended for all eligible renewable
energy types through 2016. After that, the scenarios diverge with respect to the
incentive assumptions as discussed below. Additionally, the capital cost for renewable
energy projects are the same in Year 1 for all scenarios, but the rates of cost decline for
wind and solar technologies are different depending on the scenario.12 Table 7‐2
summarizes the renewable energy assumptions for each scenario, which are discussed
in more detail below.
Table 7‐2 Renewable Energy Assumptions.
Market Scenario ITC/PTC13 Renewables Cost
1 ITC expires after 2016, no incentives after Faster decline
3 ITC (2016), PTC after Faster decline
4 ITC (2016), PTC after Slower decline
8 ITC expires after 2016, no incentives after Slower decline
9 ITC (2016), PTC after Baseline
7.1.1 Scenario 1
This future involves a National action for GHG, under high global economic
growth. Natural gas prices are higher than baseline. There are less stringent CO2 caps
in the 2020‐2030 timeframe. Load growth is baseline. It is a future where higher than
“baseline” levels of electric vehicles are expected to occur and more renewables than
baseline will be developed. It is a future where renewable energy incentives are
allowed to expire by 2016 due to the implementation of a National program for Carbon
and high natural gas prices. With accelerated deployment of renewable energy
12 The costs for resource technologies, such as biomass, geothermal, and hydro, were assumed not to decline over time because these resources rely on mature, conventional technologies with little opportunity for cost or performance improvements. 13 PTC refers to the federal production tax credit that provides unit tax credits to certain renewable energy technologies. Prior to the ITC, the PTC was main tax incentive for renewable energy. In 2010, the PTC level was 2.2 cents or 1.1 cent per kilowatthour, depending on the resource type.
BC Hydro Report on U.S. Renewable Energy Credit (REC) Markets 7.0 REC Price Scenarios and Assumptions
May 2011 Black & Veatch 73
projects, renewable costs decline more quickly than baseline due to greater federal and
private investment in renewable R&D to meet national CO2 caps.
Assumptions: ITC is allowed to expire by 2016 with no additional incentives
available thereafter due to expectations that renewable energy projects can be self‐
sustaining with a national carbon program and high natural gas prices. Faster rate of
decline and lower than baseline cost of renewables as a result of assumed federal R&D
to bring on the higher levels of renewables.
7.1.2 Scenario 3
This future involves Regional action on GHG until the year 2020, then National
action, under medium global economic growth. Natural gas prices are baseline. Mid‐
level/Baseline CO2 caps in the 2020‐2030 timeframe. Load growth is baseline. It is a
future where higher than “baseline” levels of electric vehicles are expected to occur and
more renewables than baseline will be developed. As such, it is expected that PTC
continues and research on renewables causes the cost of renewables to drop somewhat
faster than baseline expectations.
Assumptions: After ITC ends in 2016, federal policy switches back to production
tax credits (PTC) to continue supporting renewables, since the National Carbon program
is delayed and gas prices are baseline. Faster rate of decline and lower than baseline
cost of renewables as a result of assumed federal R&D to bring on the higher levels of
renewables.
7.1.3 Scenario 4
This future involves Regional action on Carbon until the year 2020, then National
action, under low global economic growth. Natural gas price levels stay lower than
baseline. Mid‐level/Baseline CO2 caps in the 2020‐2030 timeframe. It is a future where
loads are expected to be lower than baseline and lower than baseline levels of electric
vehicles are adopted. As a result of the lower loads, there is not as much need for
renewables. However, due to lower energy prices and continuance of state RPS
programs, the federal government will be pressured to continue supporting renewable
BC Hydro Report on U.S. Renewable Energy Credit (REC) Markets 7.0 REC Price Scenarios and Assumptions
May 2011 Black & Veatch 74
energy development with tax credits, but will not put as much R&D into lowering
renewable costs.
Assumptions: PTC continues and renewable costs decline at a slower rate and
level off higher than baseline.
7.1.4 Scenario 8
This future, which also experiences low global economic growth, does not
include a National program for carbon. Instead the carbon programs are regional only.
It is a future where national interests move away from concerns of climate change,
leaving those concerns to be dealt with at the regional levels. It has lower than baseline
natural gas prices. Load growth is relatively flat which takes away from the desire for
national focus on electric vehicles and renewable R&D. In this future, there is less
electric vehicle penetration (in part caused by the lower cost of natural gas/oil) and
results in less renewables. It is a future where renewable energy incentives are allowed
to expire by 2016, due to lack of interest at the national level, and renewable costs do
not decline as quickly as baseline due in part to the low cost of natural gas and less
federal and private investment in renewable R&D.
Assumptions: Renewable energy incentives are allowed to expire after 2016 and
renewable costs are higher than baseline.
7.1.5 Scenario 9
This future, under high economic global growth, does not include a National
program for carbon. Instead the carbon programs are regional only. It is a future where
national interests move away from concerns of climate change, leaving those concerns
to be dealt with at the regional levels. This future has higher than baseline load growth.
As opposed to the lower than baseline natural gas prices in Scenario 8, this future has
baseline natural gas prices. This scenario involves baseline levels of electric vehicles and
baseline levels of renewables. With continuance of state‐level RPS programs and
regional carbon caps, the federal government will be pressured to continue supporting
BC Hydro Report on U.S. Renewable Energy Credit (REC) Markets 7.0 REC Price Scenarios and Assumptions
May 2011 Black & Veatch 75
renewable energy development with tax credits. With the existence of the PTC,
continuance of state RPS programs and baseline gas prices, private industry does invest
in enough R&D to achieve baseline renewable cost reductions.
Assumptions: PTC continues after 2016 and renewable costs are baseline. State
RPS targets continue.
7.2 WECC RPS Demand Forecast The amount of renewable generation projected to be developed was determined
by considering existing state RPS targets, WECC Energy Demand (varies with Scenario)
and existing resources eligible for RPS. A description of each is covered below.
7.2.1 State RPS Targets Current RPS targets and goals for WECC states were used to determine the RPS
Demand Forecast. The WECC states included in the REM analysis and discussed
collectively as “WECC states” are listed in Table 7‐3. While California’s SBX1‐2 mandates
an RPS target of 33 percent by 2020, Black & Veatch has assumed that this target is not
achieved until 2025 for modeling purposes. Black & Veatch has assumed the delay in
achieving the RPS target in California due to the many challenges (permitting,
contractual, transmission, changing regulations) California has faced and will face with
deploying so many renewable energy projects. In 2010, California fell short of its target
of 20% and, in fact, the new SBX1‐2 has allowed the 20% target to be pushed back to
the end of 2013, though still holding to the 33% target at 2020.
Additionally, many states do not have interim targets for their RPS, so annual
targets were developed to reflect projected incremental procurements each year. Only
main tier RPS requirements (excluding carve‐outs) and goals were used to establish each
state’s RPS demand. Main tier RPS resources are defined by the individual states and
typically include large wind, solar, geothermal, biomass and small hydro. The main tier
RPS targets were reduced for states with solar carve‐outs, distributed generation
requirements, and energy efficiency allowances. A summary of the RPS targets used in
the REM model is provided in Table 7‐3.
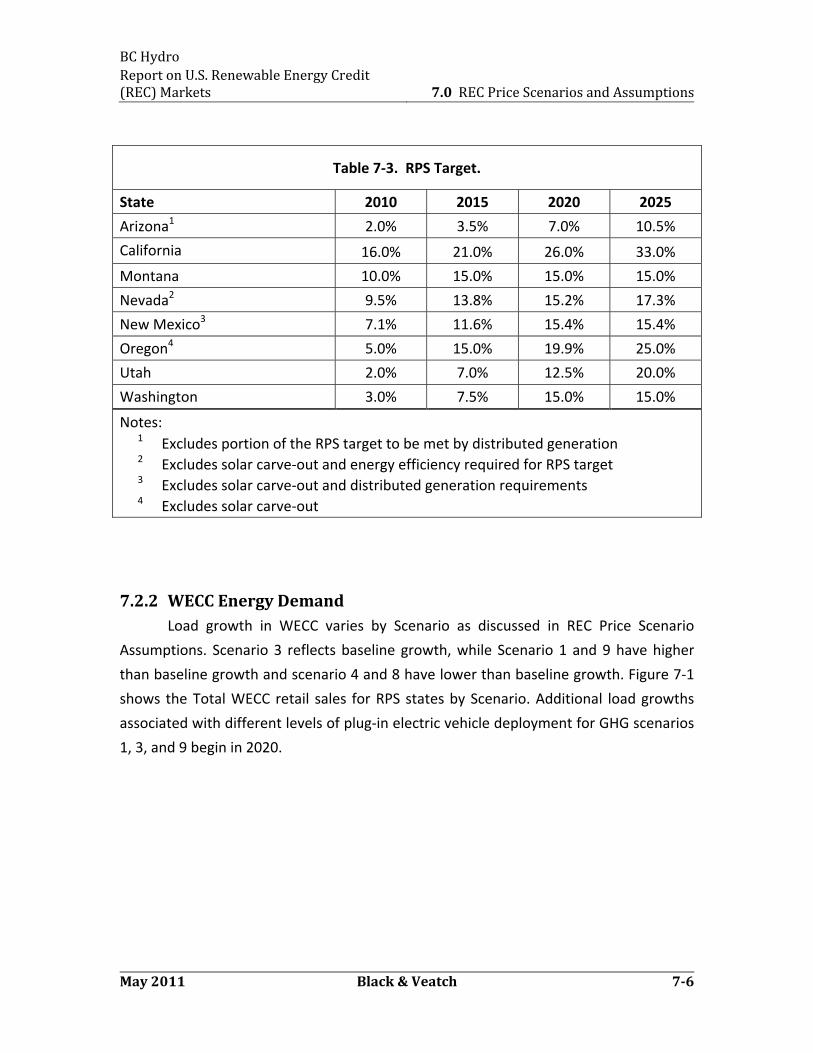
BC Hydro Report on U.S. Renewable Energy Credit (REC) Markets 7.0 REC Price Scenarios and Assumptions
May 2011 Black & Veatch 76
Table 7‐3. RPS Target.
State 2010 2015 2020 2025
Arizona1 2.0% 3.5% 7.0% 10.5%
California 16.0% 21.0% 26.0% 33.0%
Montana 10.0% 15.0% 15.0% 15.0%
Nevada2 9.5% 13.8% 15.2% 17.3%
New Mexico3 7.1% 11.6% 15.4% 15.4%
Oregon4 5.0% 15.0% 19.9% 25.0%
Utah 2.0% 7.0% 12.5% 20.0%
Washington 3.0% 7.5% 15.0% 15.0%
Notes: 1 Excludes portion of the RPS target to be met by distributed generation 2 Excludes solar carve‐out and energy efficiency required for RPS target 3 Excludes solar carve‐out and distributed generation requirements 4 Excludes solar carve‐out
7.2.2 WECC Energy Demand Load growth in WECC varies by Scenario as discussed in REC Price Scenario
Assumptions. Scenario 3 reflects baseline growth, while Scenario 1 and 9 have higher
than baseline growth and scenario 4 and 8 have lower than baseline growth. Figure 7‐1
shows the Total WECC retail sales for RPS states by Scenario. Additional load growths
associated with different levels of plug‐in electric vehicle deployment for GHG scenarios
1, 3, and 9 begin in 2020.
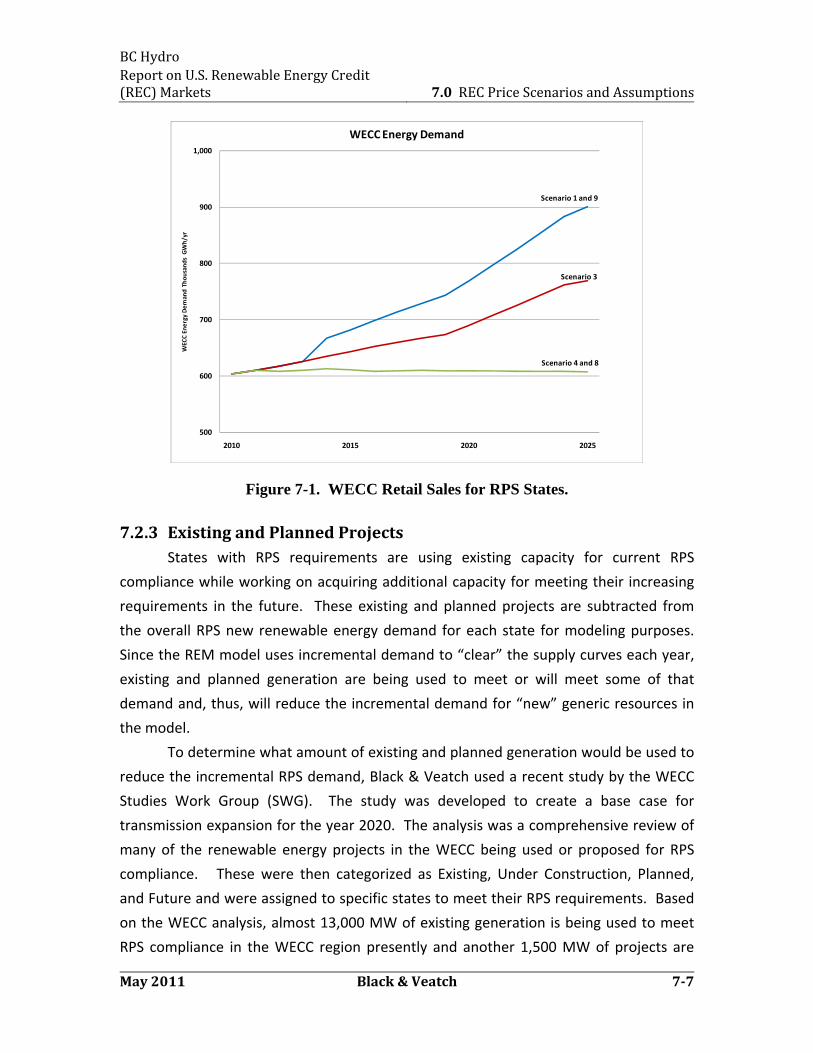
BC Hydro Report on U.S. Renewable Energy Credit (REC) Markets 7.0 REC Price Scenarios and Assumptions
May 2011 Black & Veatch 77
Scenario 1 and 9
Scenario 3
Scenario 4 and 8
500
600
700
800
900
1,000
2010 2015 2020 2025
WECC Energy Demand Thousands GWh/yr
WECC Energy Demand
Figure 7-1. WECC Retail Sales for RPS States.
7.2.3 Existing and Planned Projects States with RPS requirements are using existing capacity for current RPS
compliance while working on acquiring additional capacity for meeting their increasing
requirements in the future. These existing and planned projects are subtracted from
the overall RPS new renewable energy demand for each state for modeling purposes.
Since the REM model uses incremental demand to “clear” the supply curves each year,
existing and planned generation are being used to meet or will meet some of that
demand and, thus, will reduce the incremental demand for “new” generic resources in
the model.
To determine what amount of existing and planned generation would be used to
reduce the incremental RPS demand, Black & Veatch used a recent study by the WECC
Studies Work Group (SWG). The study was developed to create a base case for
transmission expansion for the year 2020. The analysis was a comprehensive review of
many of the renewable energy projects in the WECC being used or proposed for RPS
compliance. These were then categorized as Existing, Under Construction, Planned,
and Future and were assigned to specific states to meet their RPS requirements. Based
on the WECC analysis, almost 13,000 MW of existing generation is being used to meet
RPS compliance in the WECC region presently and another 1,500 MW of projects are
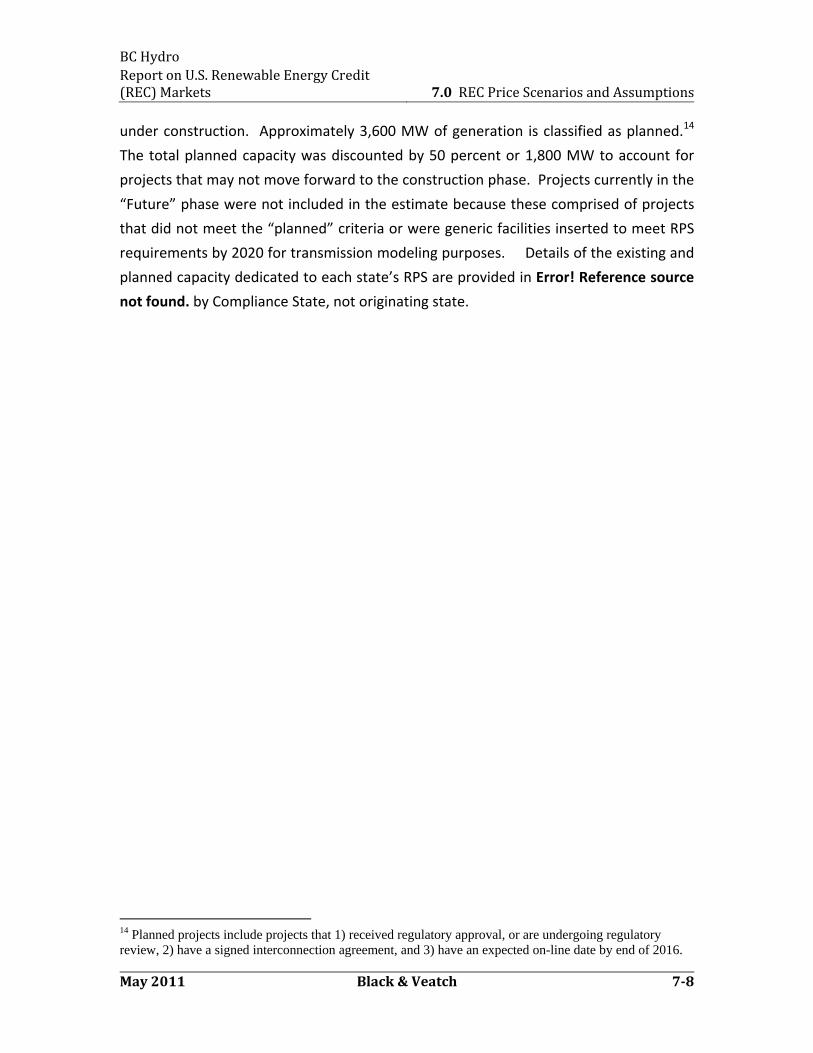
BC Hydro Report on U.S. Renewable Energy Credit (REC) Markets 7.0 REC Price Scenarios and Assumptions
May 2011 Black & Veatch 78
under construction. Approximately 3,600 MW of generation is classified as planned.14
The total planned capacity was discounted by 50 percent or 1,800 MW to account for
projects that may not move forward to the construction phase. Projects currently in the
“Future” phase were not included in the estimate because these comprised of projects
that did not meet the “planned” criteria or were generic facilities inserted to meet RPS
requirements by 2020 for transmission modeling purposes. Details of the existing and
planned capacity dedicated to each state’s RPS are provided in Error! Reference source
not found. by Compliance State, not originating state.
14 Planned projects include projects that 1) received regulatory approval, or are undergoing regulatory review, 2) have a signed interconnection agreement, and 3) have an expected on-line date by end of 2016.
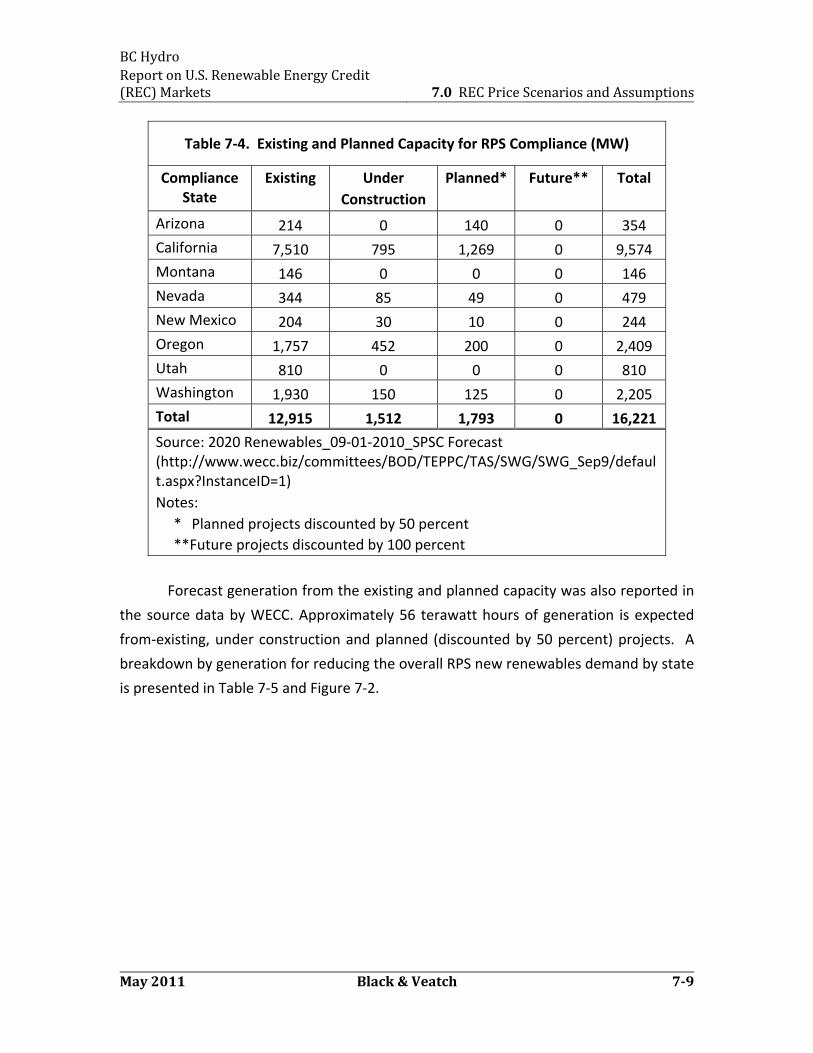
BC Hydro Report on U.S. Renewable Energy Credit (REC) Markets 7.0 REC Price Scenarios and Assumptions
May 2011 Black & Veatch 79
Forecast generation from the existing and planned capacity was also reported in
the source data by WECC. Approximately 56 terawatt hours of generation is expected
from‐existing, under construction and planned (discounted by 50 percent) projects. A
breakdown by generation for reducing the overall RPS new renewables demand by state
is presented in Table 7‐5 and Figure 7‐2.
Table 7‐4. Existing and Planned Capacity for RPS Compliance (MW)
Compliance State
Existing Under
Construction
Planned* Future** Total
Arizona 214 0 140 0 354
California 7,510 795 1,269 0 9,574
Montana 146 0 0 0 146
Nevada 344 85 49 0 479
New Mexico 204 30 10 0 244
Oregon 1,757 452 200 0 2,409
Utah 810 0 0 0 810
Washington 1,930 150 125 0 2,205
Total 12,915 1,512 1,793 0 16,221
Source: 2020 Renewables_09‐01‐2010_SPSC Forecast (http://www.wecc.biz/committees/BOD/TEPPC/TAS/SWG/SWG_Sep9/default.aspx?InstanceID=1)
Notes:
* Planned projects discounted by 50 percent
**Future projects discounted by 100 percent
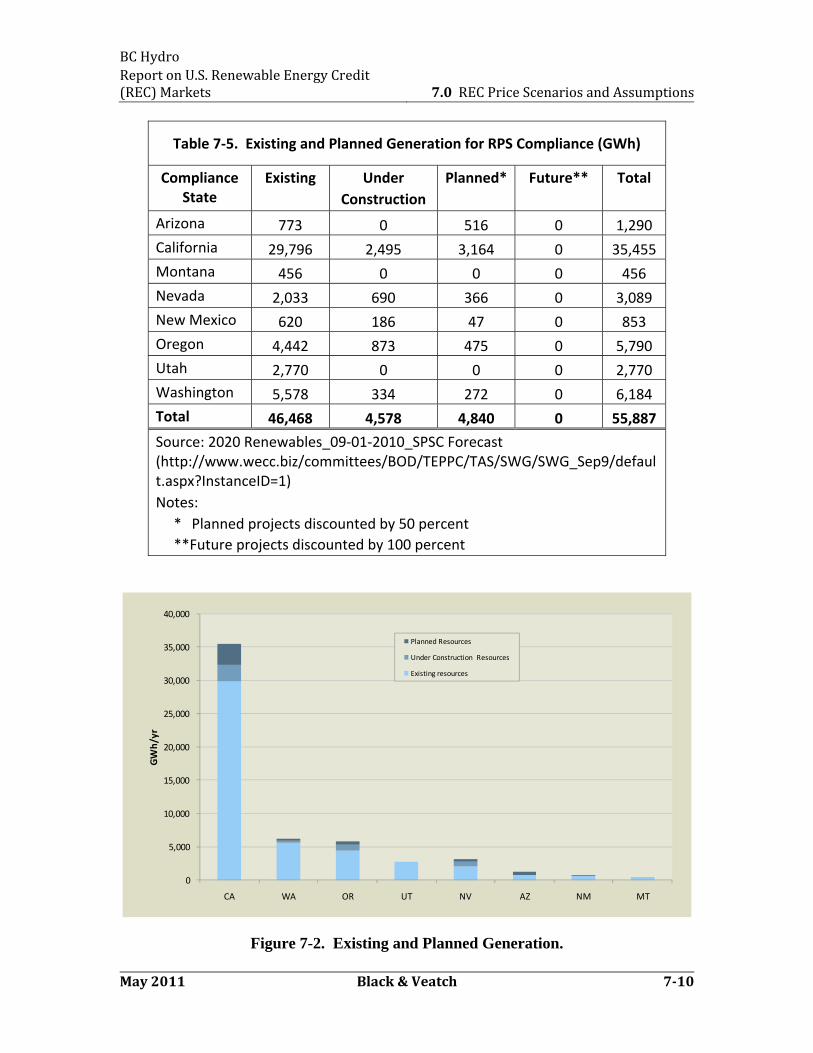
BC Hydro Report on U.S. Renewable Energy Credit (REC) Markets 7.0 REC Price Scenarios and Assumptions
May 2011 Black & Veatch 710
Table 7‐5. Existing and Planned Generation for RPS Compliance (GWh)
Compliance State
Existing Under
Construction
Planned* Future** Total
Arizona 773 0 516 0 1,290
California 29,796 2,495 3,164 0 35,455
Montana 456 0 0 0 456
Nevada 2,033 690 366 0 3,089
New Mexico 620 186 47 0 853
Oregon 4,442 873 475 0 5,790
Utah 2,770 0 0 0 2,770
Washington 5,578 334 272 0 6,184
Total 46,468 4,578 4,840 0 55,887
Source: 2020 Renewables_09‐01‐2010_SPSC Forecast (http://www.wecc.biz/committees/BOD/TEPPC/TAS/SWG/SWG_Sep9/default.aspx?InstanceID=1)
Notes:
* Planned projects discounted by 50 percent
**Future projects discounted by 100 percent
0
5,000
10,000
15,000
20,000
25,000
30,000
35,000
40,000
CA WA OR UT NV AZ NM MT
GWh/yr
Planned Resources
Under Construction Resources
Existing resources
Figure 7-2. Existing and Planned Generation.
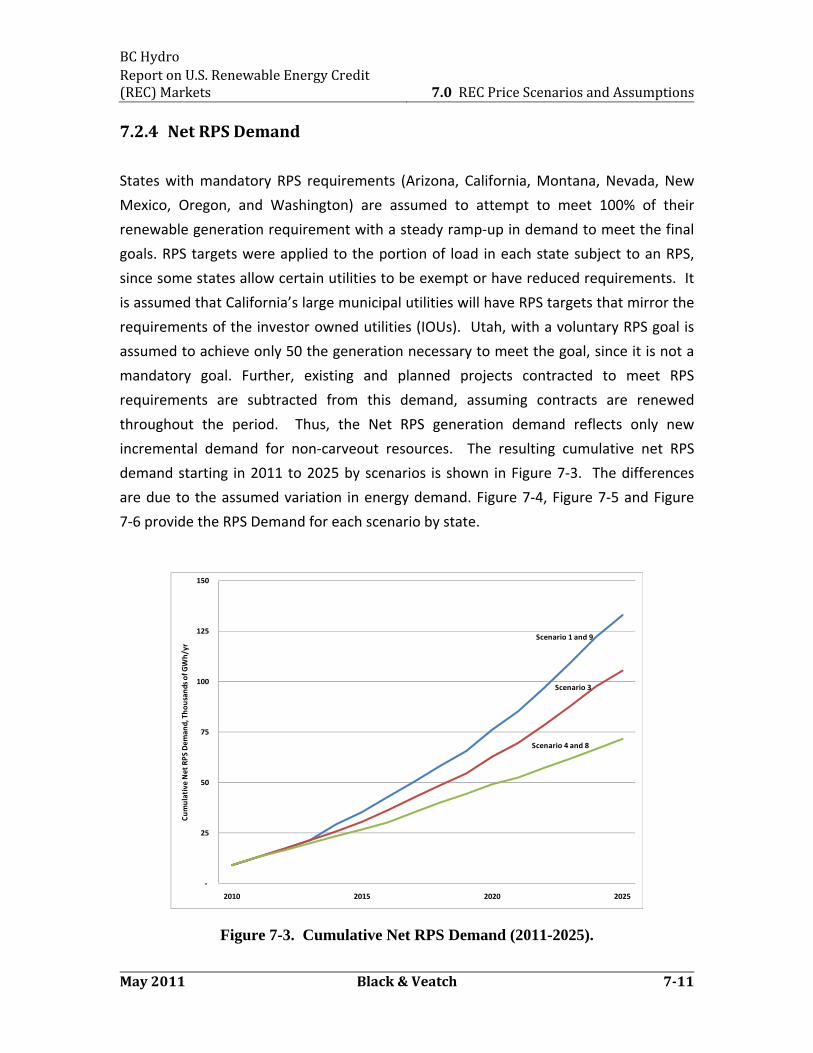
BC Hydro Report on U.S. Renewable Energy Credit (REC) Markets 7.0 REC Price Scenarios and Assumptions
May 2011 Black & Veatch 711
7.2.4 Net RPS Demand
States with mandatory RPS requirements (Arizona, California, Montana, Nevada, New
Mexico, Oregon, and Washington) are assumed to attempt to meet 100% of their
renewable generation requirement with a steady ramp‐up in demand to meet the final
goals. RPS targets were applied to the portion of load in each state subject to an RPS,
since some states allow certain utilities to be exempt or have reduced requirements. It
is assumed that California’s large municipal utilities will have RPS targets that mirror the
requirements of the investor owned utilities (IOUs). Utah, with a voluntary RPS goal is
assumed to achieve only 50 the generation necessary to meet the goal, since it is not a
mandatory goal. Further, existing and planned projects contracted to meet RPS
requirements are subtracted from this demand, assuming contracts are renewed
throughout the period. Thus, the Net RPS generation demand reflects only new
incremental demand for non‐carveout resources. The resulting cumulative net RPS
demand starting in 2011 to 2025 by scenarios is shown in Figure 7‐3. The differences
are due to the assumed variation in energy demand. Figure 7‐4, Figure 7‐5 and Figure
7‐6 provide the RPS Demand for each scenario by state.
Scenario 1 and 9
Scenario 3
Scenario 4 and 8
‐
25
50
75
100
125
150
2010 2015 2020 2025
Cumulative
Net RPS Dem
and, Thousands of G
Wh/yr
Figure 7-3. Cumulative Net RPS Demand (2011-2025).
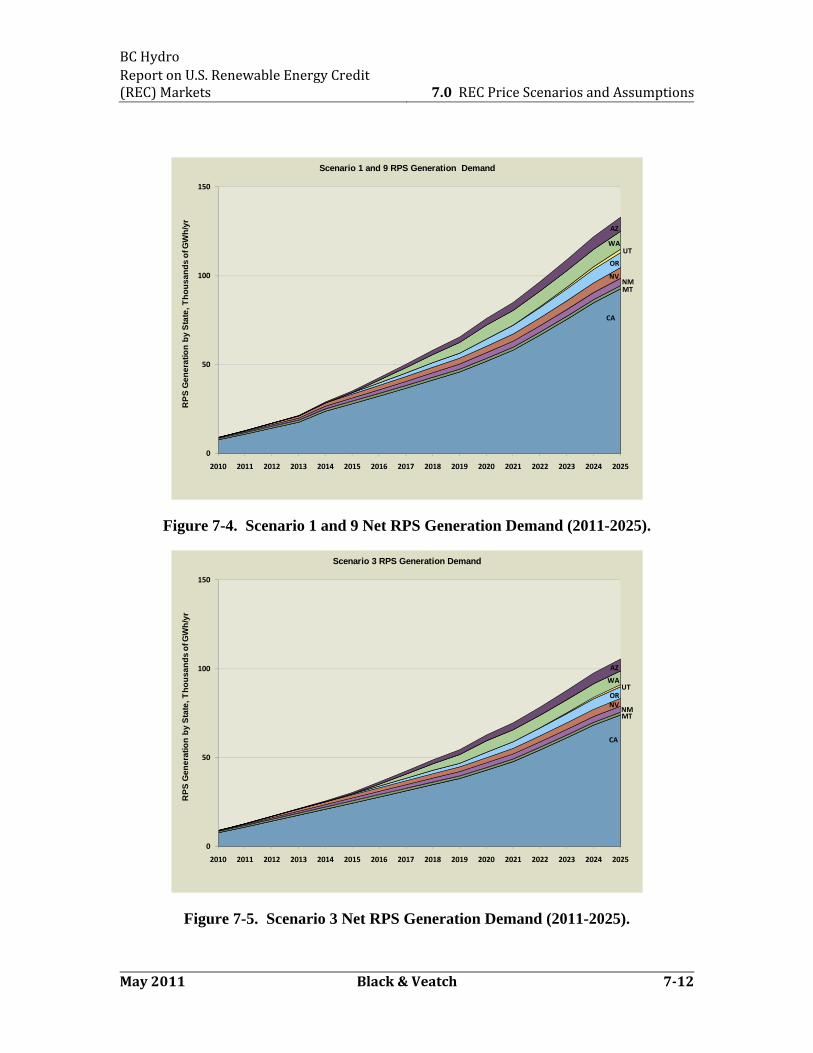
BC Hydro Report on U.S. Renewable Energy Credit (REC) Markets 7.0 REC Price Scenarios and Assumptions
May 2011 Black & Veatch 712
CA
MTNM
NV
OR
UTWA
AZ
0
50
100
150
2010 2011 2012 2013 2014 2015 2016 2017 2018 2019 2020 2021 2022 2023 2024 2025
RP
S G
en
era
tio
n b
y S
tate
, T
ho
us
and
s o
f GW
h/y
r
Scenario 1 and 9 RPS Generation Demand
Figure 7-4. Scenario 1 and 9 Net RPS Generation Demand (2011-2025).
CA
MTNM
NVOR
UTWA
AZ
0
50
100
150
2010 2011 2012 2013 2014 2015 2016 2017 2018 2019 2020 2021 2022 2023 2024 2025
RP
S G
ene
rati
on
by
Sta
te,
Th
ou
san
ds
of G
Wh
/yr
Scenario 3 RPS Generation Demand
Figure 7-5. Scenario 3 Net RPS Generation Demand (2011-2025).
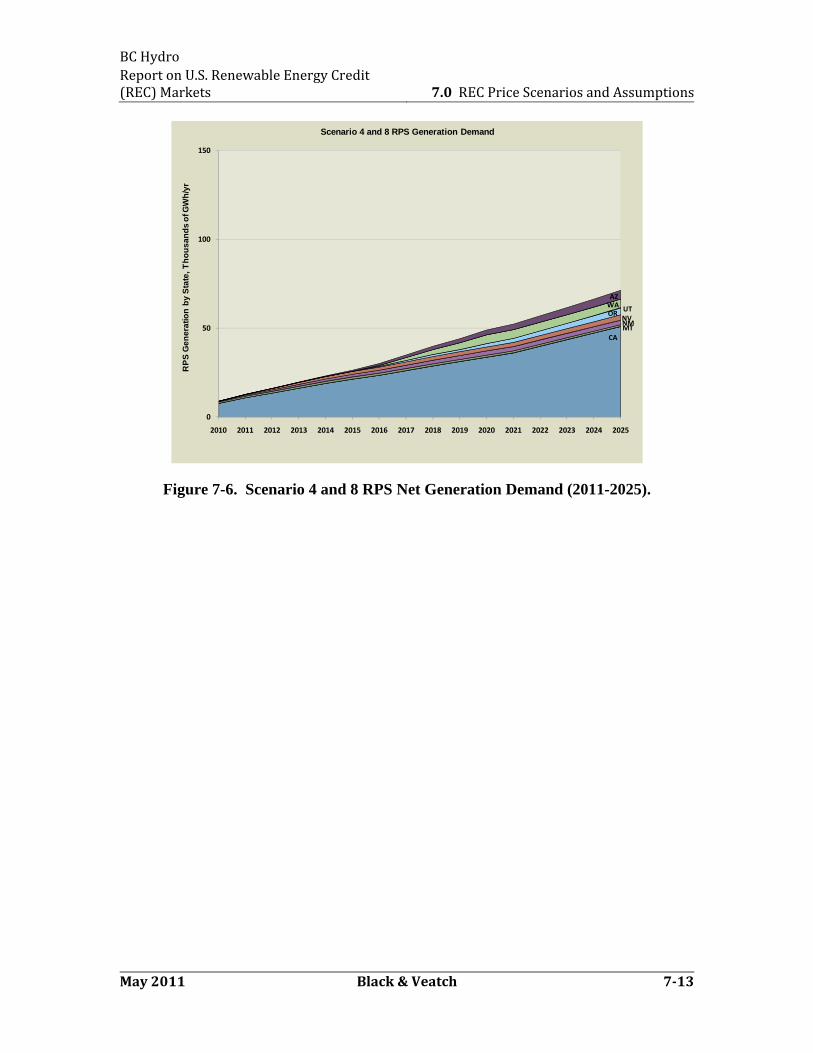
BC Hydro Report on U.S. Renewable Energy Credit (REC) Markets 7.0 REC Price Scenarios and Assumptions
May 2011 Black & Veatch 713
CAMTNMNV
ORUT
WAAZ
0
50
100
150
2010 2011 2012 2013 2014 2015 2016 2017 2018 2019 2020 2021 2022 2023 2024 2025
RP
S G
en
era
tio
n b
y S
tate
, T
ho
us
and
s o
f GW
h/y
r
Scenario 4 and 8 RPS Generation Demand
Figure 7-6. Scenario 4 and 8 RPS Net Generation Demand (2011-2025).
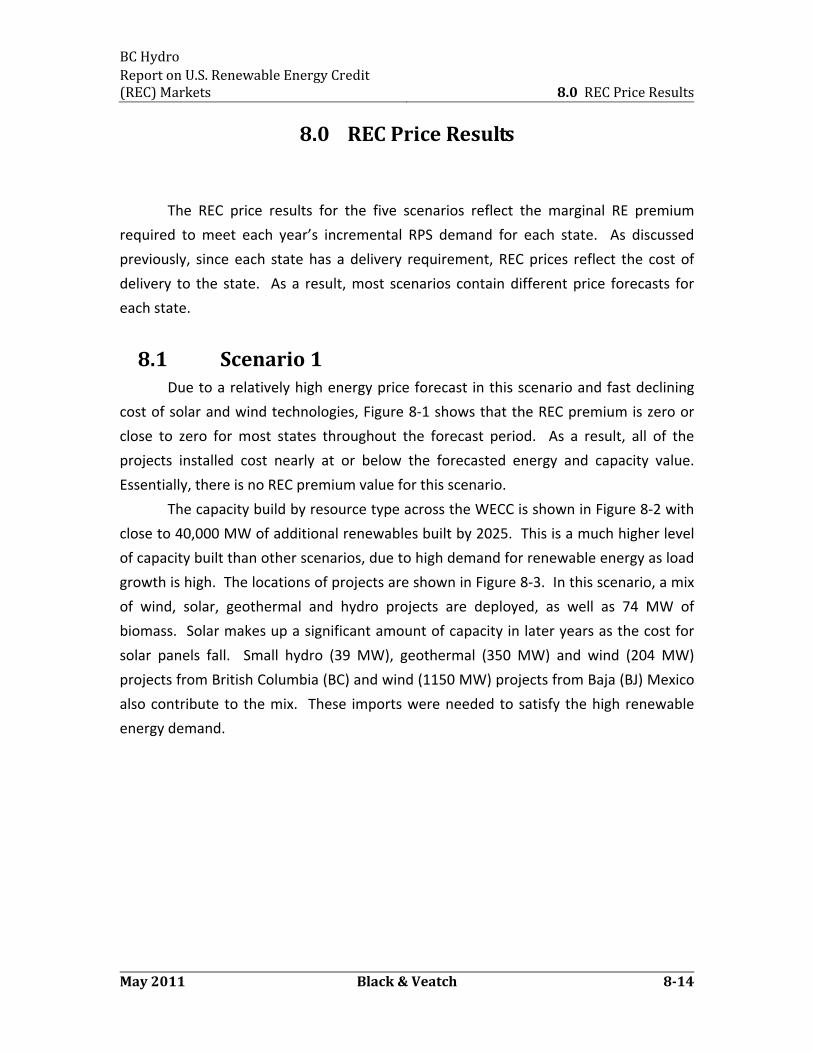
BC Hydro Report on U.S. Renewable Energy Credit (REC) Markets 8.0 REC Price Results
May 2011 Black & Veatch 814
8.0 REC Price Results
The REC price results for the five scenarios reflect the marginal RE premium
required to meet each year’s incremental RPS demand for each state. As discussed
previously, since each state has a delivery requirement, REC prices reflect the cost of
delivery to the state. As a result, most scenarios contain different price forecasts for
each state.
8.1 Scenario 1 Due to a relatively high energy price forecast in this scenario and fast declining
cost of solar and wind technologies, Figure 8‐1 shows that the REC premium is zero or
close to zero for most states throughout the forecast period. As a result, all of the
projects installed cost nearly at or below the forecasted energy and capacity value.
Essentially, there is no REC premium value for this scenario.
The capacity build by resource type across the WECC is shown in Figure 8‐2 with
close to 40,000 MW of additional renewables built by 2025. This is a much higher level
of capacity built than other scenarios, due to high demand for renewable energy as load
growth is high. The locations of projects are shown in Figure 8‐3. In this scenario, a mix
of wind, solar, geothermal and hydro projects are deployed, as well as 74 MW of
biomass. Solar makes up a significant amount of capacity in later years as the cost for
solar panels fall. Small hydro (39 MW), geothermal (350 MW) and wind (204 MW)
projects from British Columbia (BC) and wind (1150 MW) projects from Baja (BJ) Mexico
also contribute to the mix. These imports were needed to satisfy the high renewable
energy demand.
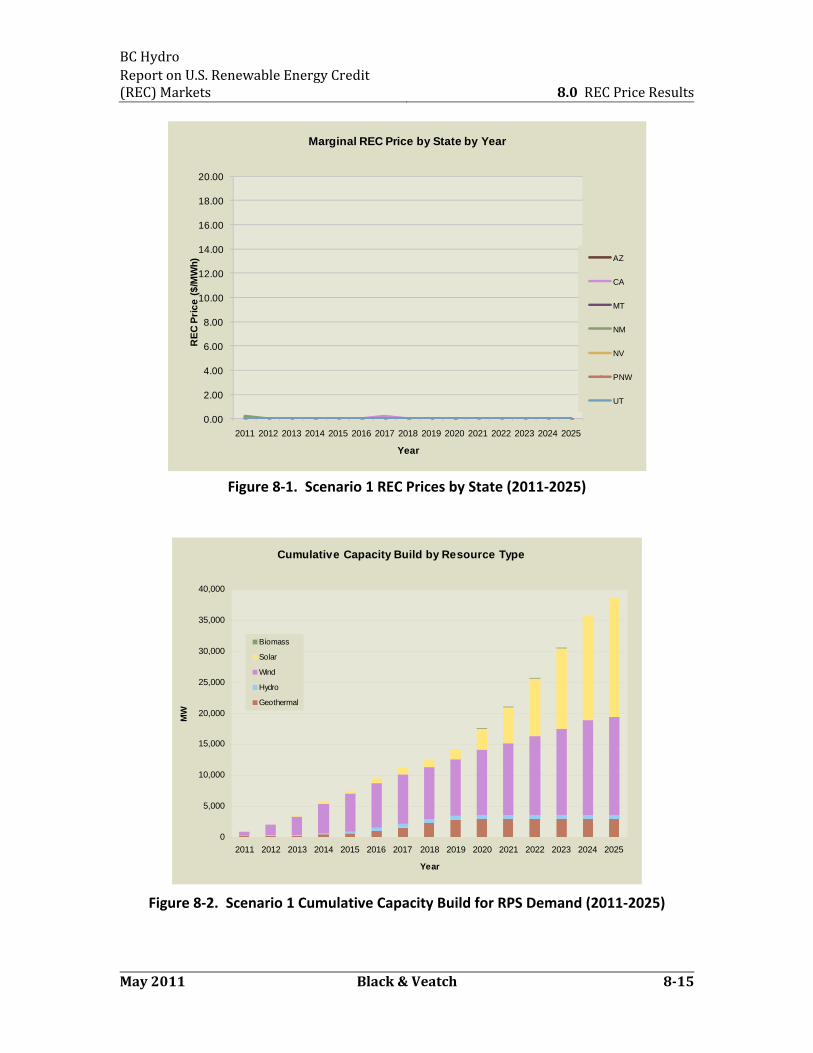
BC Hydro Report on U.S. Renewable Energy Credit (REC) Markets 8.0 REC Price Results
May 2011 Black & Veatch 815
0.00
2.00
4.00
6.00
8.00
10.00
12.00
14.00
16.00
18.00
20.00
2011 2012 2013 2014 2015 2016 2017 2018 2019 2020 2021 2022 2023 2024 2025
RE
C P
ric
e (
$/M
Wh
)
Year
Marginal REC Price by State by Year
AZ
CA
MT
NM
NV
PNW
UT
Figure 8‐1. Scenario 1 REC Prices by State (2011‐2025)
Cumulative Capacity Build by Resource Type
0
5,000
10,000
15,000
20,000
25,000
30,000
35,000
40,000
2011 2012 2013 2014 2015 2016 2017 2018 2019 2020 2021 2022 2023 2024 2025
Year
MW
Biomass
Solar
Wind
Hydro
Geothermal
Figure 8‐2. Scenario 1 Cumulative Capacity Build for RPS Demand (2011‐2025)
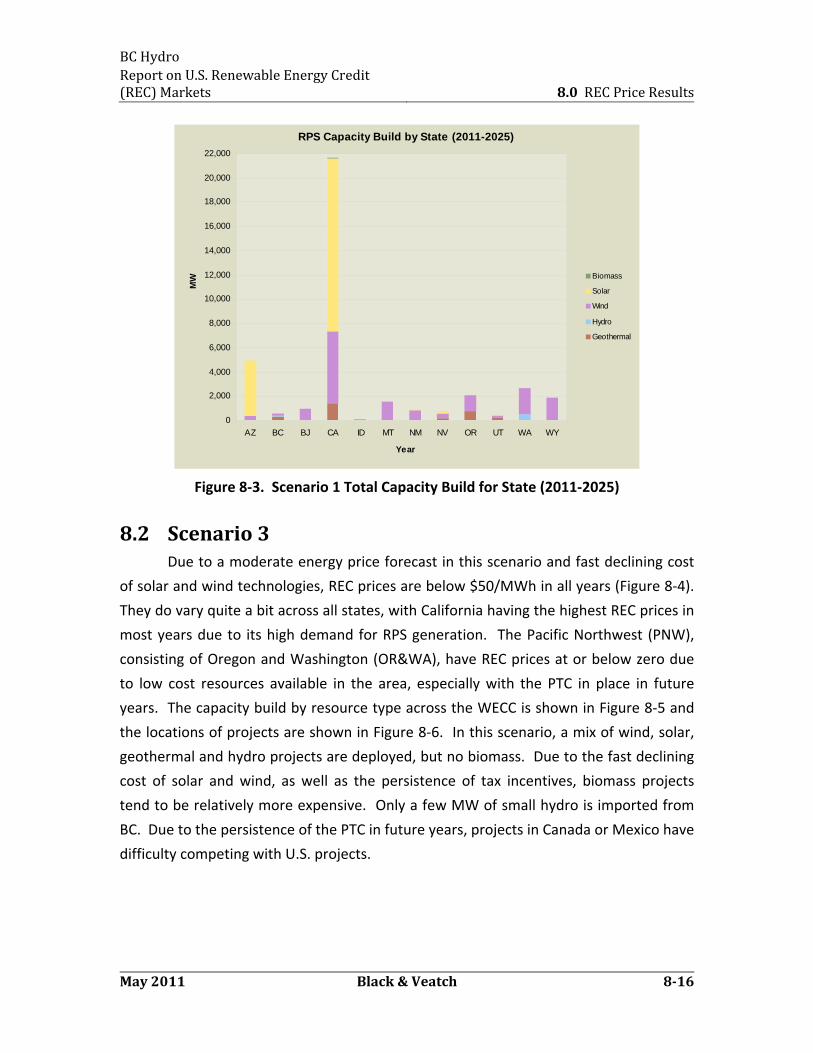
BC Hydro Report on U.S. Renewable Energy Credit (REC) Markets 8.0 REC Price Results
May 2011 Black & Veatch 816
RPS Capacity Build by State (2011-2025)
0
2,000
4,000
6,000
8,000
10,000
12,000
14,000
16,000
18,000
20,000
22,000
AZ BC BJ CA ID MT NM NV OR UT WA WY
Year
MW Biomass
Solar
Wind
Hydro
Geothermal
Figure 8‐3. Scenario 1 Total Capacity Build for State (2011‐2025)
8.2 Scenario 3 Due to a moderate energy price forecast in this scenario and fast declining cost
of solar and wind technologies, REC prices are below $50/MWh in all years (Figure 8‐4).
They do vary quite a bit across all states, with California having the highest REC prices in
most years due to its high demand for RPS generation. The Pacific Northwest (PNW),
consisting of Oregon and Washington (OR&WA), have REC prices at or below zero due
to low cost resources available in the area, especially with the PTC in place in future
years. The capacity build by resource type across the WECC is shown in Figure 8‐5 and
the locations of projects are shown in Figure 8‐6. In this scenario, a mix of wind, solar,
geothermal and hydro projects are deployed, but no biomass. Due to the fast declining
cost of solar and wind, as well as the persistence of tax incentives, biomass projects
tend to be relatively more expensive. Only a few MW of small hydro is imported from
BC. Due to the persistence of the PTC in future years, projects in Canada or Mexico have
difficulty competing with U.S. projects.
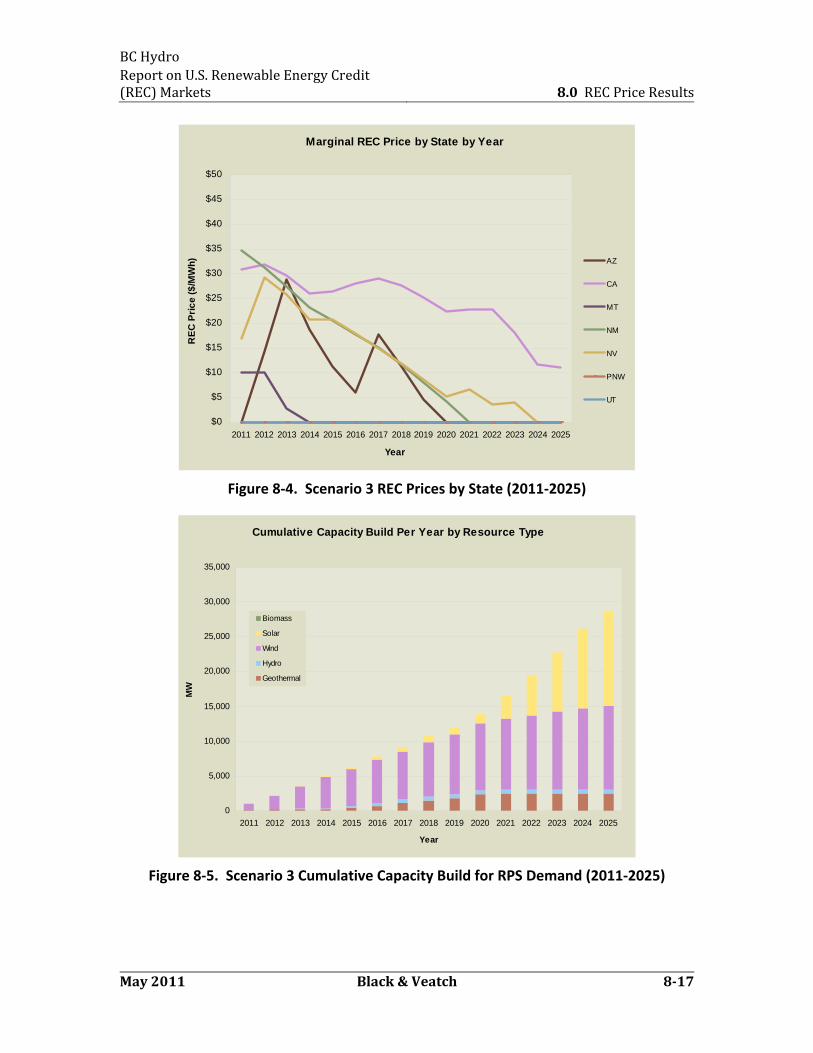
BC Hydro Report on U.S. Renewable Energy Credit (REC) Markets 8.0 REC Price Results
May 2011 Black & Veatch 817
Marginal REC Price by State by Year
$0
$5
$10
$15
$20
$25
$30
$35
$40
$45
$50
2011 2012 2013 2014 2015 2016 2017 2018 2019 2020 2021 2022 2023 2024 2025
Year
RE
C P
ric
e (
$/M
Wh
) AZ
CA
MT
NM
NV
PNW
UT
Figure 8‐4. Scenario 3 REC Prices by State (2011‐2025)
Cumulative Capacity Build Per Year by Resource Type
0
5,000
10,000
15,000
20,000
25,000
30,000
35,000
2011 2012 2013 2014 2015 2016 2017 2018 2019 2020 2021 2022 2023 2024 2025
Year
MW
Biomass
Solar
Wind
Hydro
Geothermal
Figure 8‐5. Scenario 3 Cumulative Capacity Build for RPS Demand (2011‐2025)
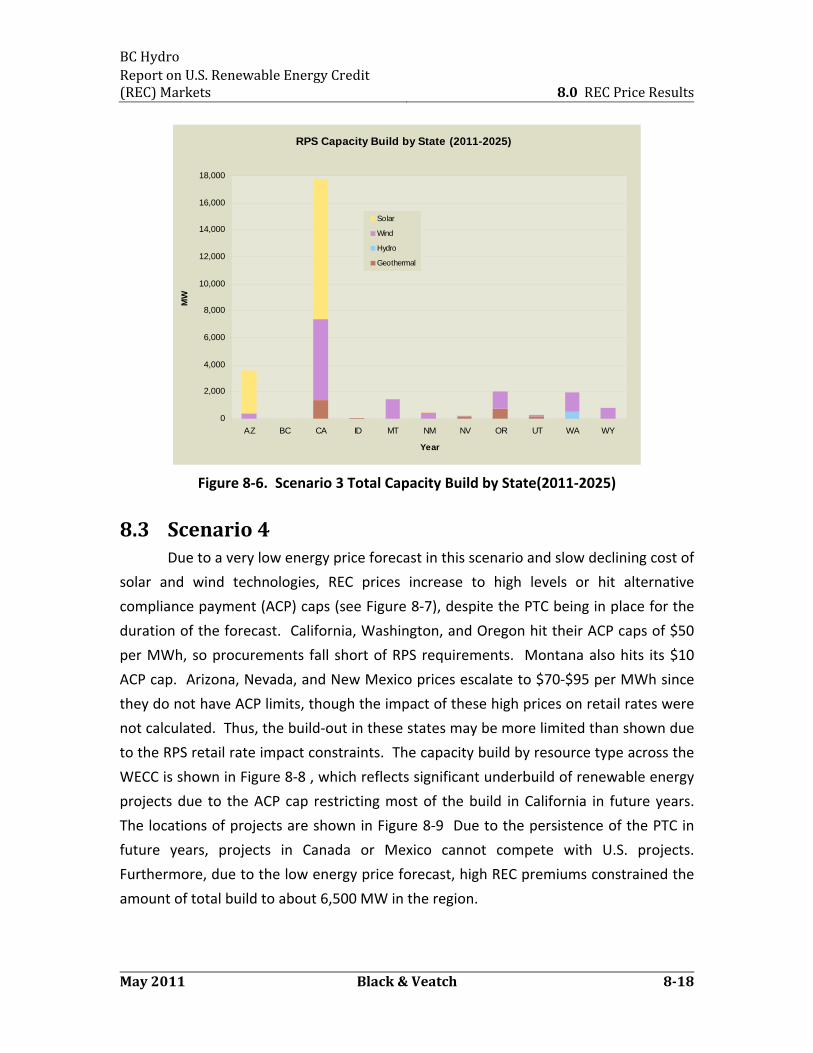
BC Hydro Report on U.S. Renewable Energy Credit (REC) Markets 8.0 REC Price Results
May 2011 Black & Veatch 818
RPS Capacity Build by State (2011-2025)
0
2,000
4,000
6,000
8,000
10,000
12,000
14,000
16,000
18,000
AZ BC CA ID MT NM NV OR UT WA WY
Year
MW
Solar
Wind
Hydro
Geothermal
Figure 8‐6. Scenario 3 Total Capacity Build by State(2011‐2025)
8.3 Scenario 4 Due to a very low energy price forecast in this scenario and slow declining cost of
solar and wind technologies, REC prices increase to high levels or hit alternative
compliance payment (ACP) caps (see Figure 8‐7), despite the PTC being in place for the
duration of the forecast. California, Washington, and Oregon hit their ACP caps of $50
per MWh, so procurements fall short of RPS requirements. Montana also hits its $10
ACP cap. Arizona, Nevada, and New Mexico prices escalate to $70‐$95 per MWh since
they do not have ACP limits, though the impact of these high prices on retail rates were
not calculated. Thus, the build‐out in these states may be more limited than shown due
to the RPS retail rate impact constraints. The capacity build by resource type across the
WECC is shown in Figure 8‐8 , which reflects significant underbuild of renewable energy
projects due to the ACP cap restricting most of the build in California in future years.
The locations of projects are shown in Figure 8‐9 Due to the persistence of the PTC in
future years, projects in Canada or Mexico cannot compete with U.S. projects.
Furthermore, due to the low energy price forecast, high REC premiums constrained the
amount of total build to about 6,500 MW in the region.
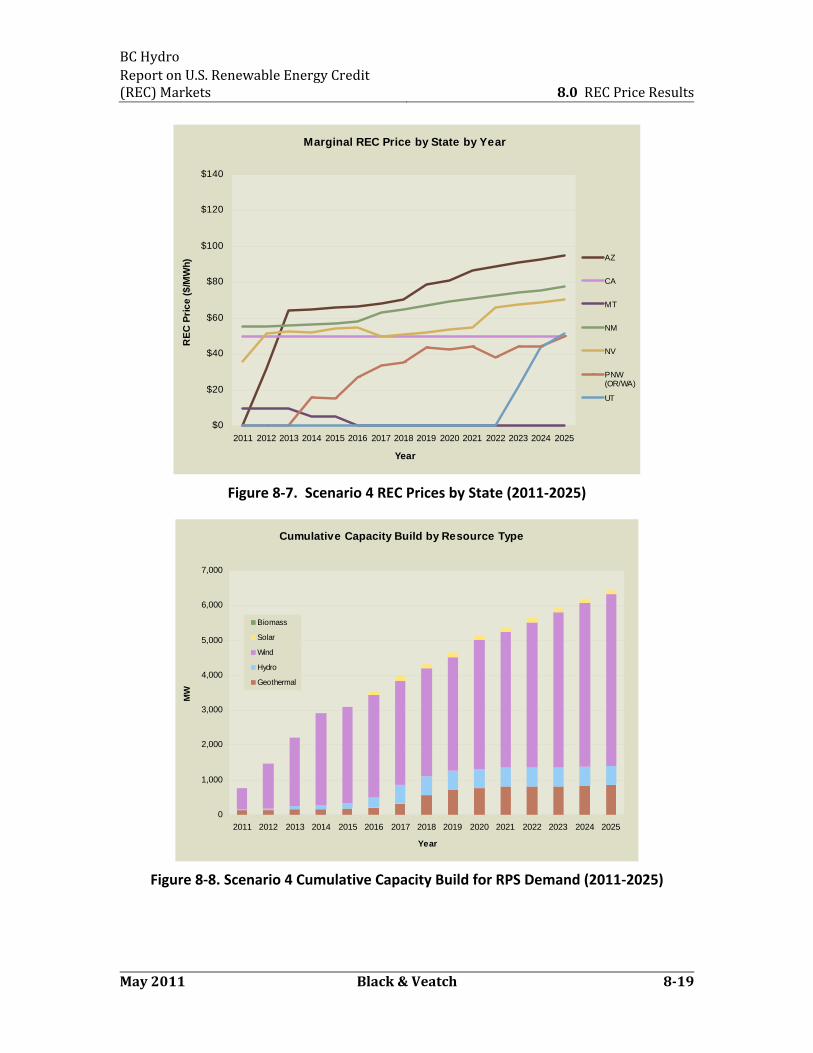
BC Hydro Report on U.S. Renewable Energy Credit (REC) Markets 8.0 REC Price Results
May 2011 Black & Veatch 819
Marginal REC Price by State by Year
$0
$20
$40
$60
$80
$100
$120
$140
2011 2012 2013 2014 2015 2016 2017 2018 2019 2020 2021 2022 2023 2024 2025
Year
RE
C P
ric
e (
$/M
Wh
) AZ
CA
MT
NM
NV
PNW(OR/WA)
UT
Figure 8‐7. Scenario 4 REC Prices by State (2011‐2025)
Cumulative Capacity Build by Resource Type
0
1,000
2,000
3,000
4,000
5,000
6,000
7,000
2011 2012 2013 2014 2015 2016 2017 2018 2019 2020 2021 2022 2023 2024 2025
Year
MW
Biomass
Solar
Wind
Hydro
Geothermal
Figure 8‐8. Scenario 4 Cumulative Capacity Build for RPS Demand (2011‐2025)
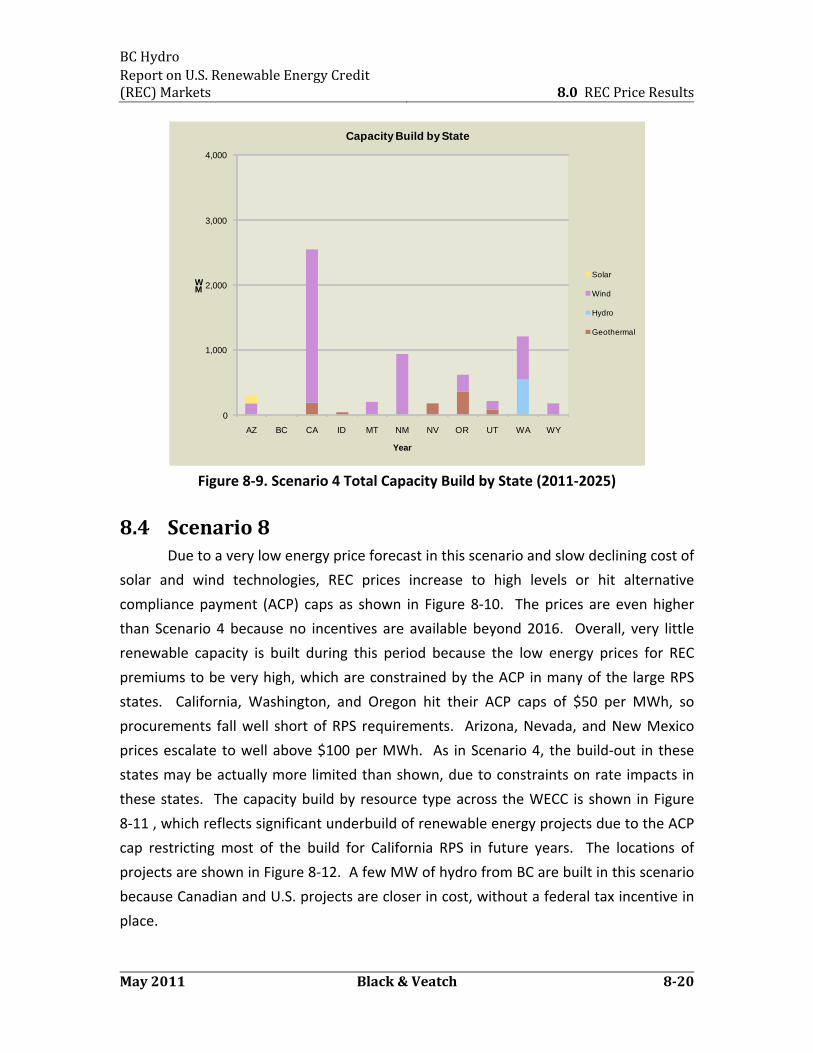
BC Hydro Report on U.S. Renewable Energy Credit (REC) Markets 8.0 REC Price Results
May 2011 Black & Veatch 820
0
1,000
2,000
3,000
4,000
AZ BC CA ID MT NM NV OR UT WA WY
MW
Year
Capacity Build by State
Solar
Wind
Hydro
Geothermal
Figure 8‐9. Scenario 4 Total Capacity Build by State (2011‐2025)
8.4 Scenario 8 Due to a very low energy price forecast in this scenario and slow declining cost of
solar and wind technologies, REC prices increase to high levels or hit alternative
compliance payment (ACP) caps as shown in Figure 8‐10. The prices are even higher
than Scenario 4 because no incentives are available beyond 2016. Overall, very little
renewable capacity is built during this period because the low energy prices for REC
premiums to be very high, which are constrained by the ACP in many of the large RPS
states. California, Washington, and Oregon hit their ACP caps of $50 per MWh, so
procurements fall well short of RPS requirements. Arizona, Nevada, and New Mexico
prices escalate to well above $100 per MWh. As in Scenario 4, the build‐out in these
states may be actually more limited than shown, due to constraints on rate impacts in
these states. The capacity build by resource type across the WECC is shown in Figure
8‐11 , which reflects significant underbuild of renewable energy projects due to the ACP
cap restricting most of the build for California RPS in future years. The locations of
projects are shown in Figure 8‐12. A few MW of hydro from BC are built in this scenario
because Canadian and U.S. projects are closer in cost, without a federal tax incentive in
place.
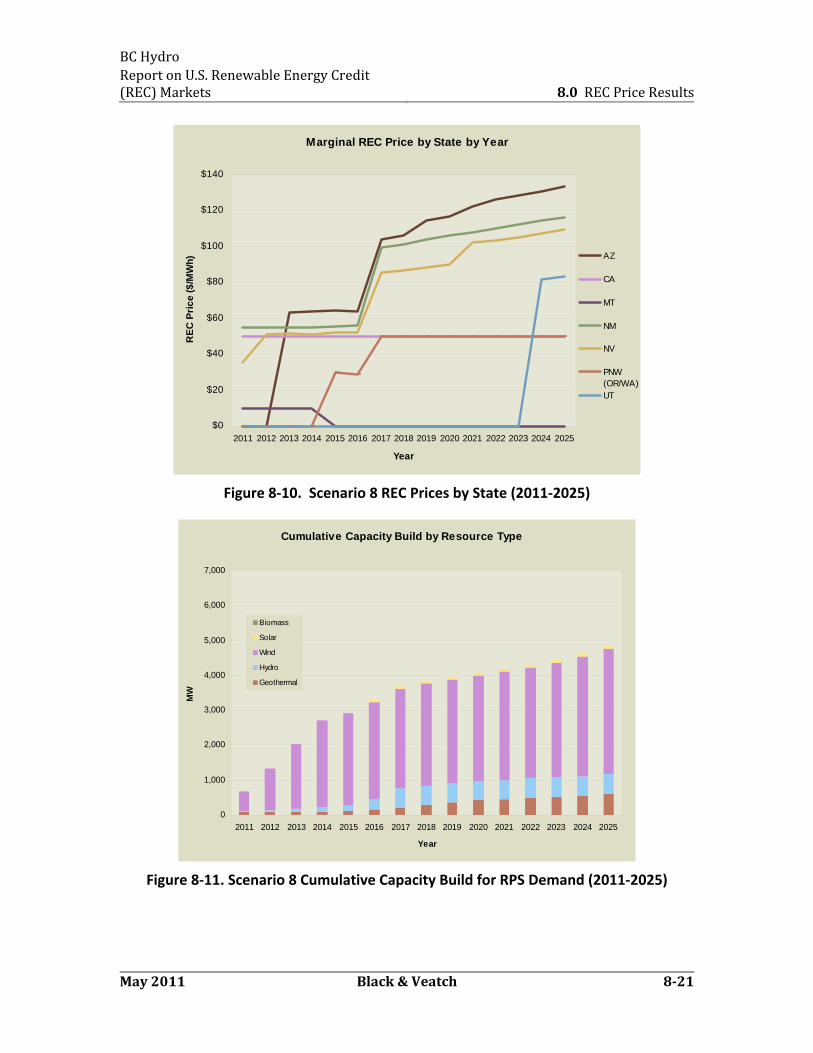
BC Hydro Report on U.S. Renewable Energy Credit (REC) Markets 8.0 REC Price Results
May 2011 Black & Veatch 821
Marginal REC Price by State by Year
$0
$20
$40
$60
$80
$100
$120
$140
2011 2012 2013 2014 2015 2016 2017 2018 2019 2020 2021 2022 2023 2024 2025
Year
RE
C P
ric
e (
$/M
Wh
) AZ
CA
MT
NM
NV
PNW(OR/WA)UT
Figure 8‐10. Scenario 8 REC Prices by State (2011‐2025)
Cumulative Capacity Build by Resource Type
0
1,000
2,000
3,000
4,000
5,000
6,000
7,000
2011 2012 2013 2014 2015 2016 2017 2018 2019 2020 2021 2022 2023 2024 2025
Year
MW
Biomass
Solar
Wind
Hydro
Geothermal
Figure 8‐11. Scenario 8 Cumulative Capacity Build for RPS Demand (2011‐2025)
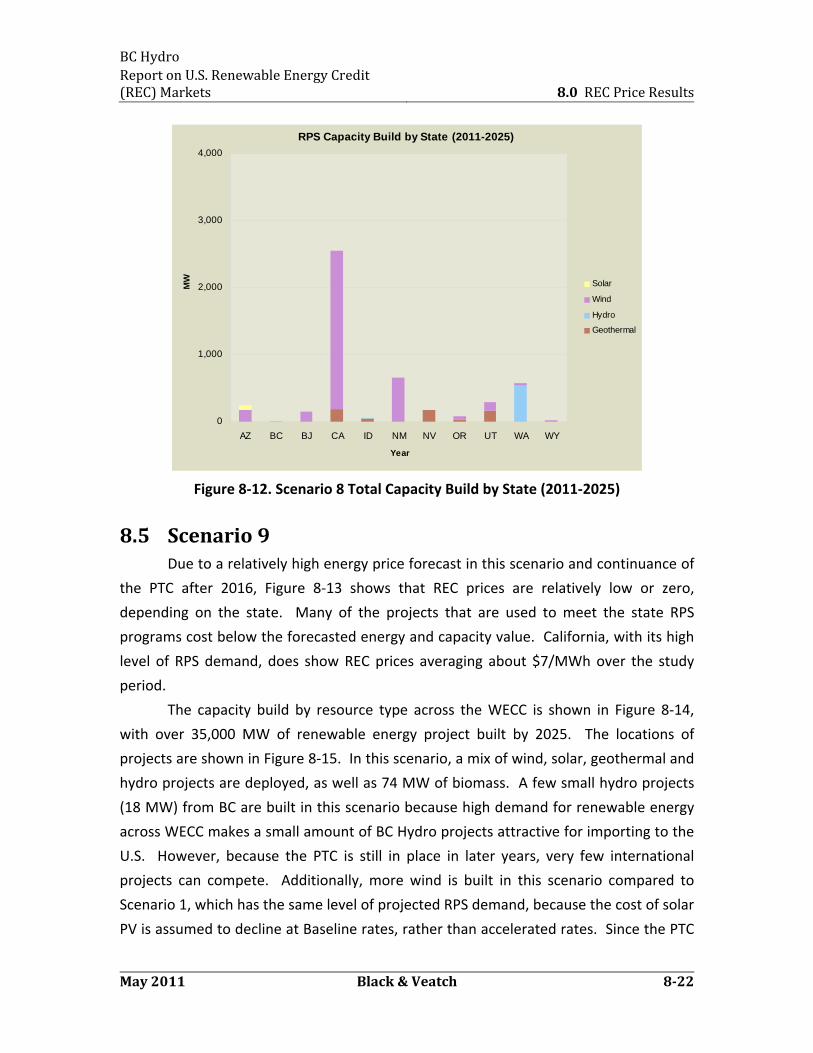
BC Hydro Report on U.S. Renewable Energy Credit (REC) Markets 8.0 REC Price Results
May 2011 Black & Veatch 822
RPS Capacity Build by State (2011-2025)
0
1,000
2,000
3,000
4,000
AZ BC BJ CA ID NM NV OR UT WA WY
Year
MW Solar
Wind
Hydro
Geothermal
Figure 8‐12. Scenario 8 Total Capacity Build by State (2011‐2025)
8.5 Scenario 9 Due to a relatively high energy price forecast in this scenario and continuance of
the PTC after 2016, Figure 8‐13 shows that REC prices are relatively low or zero,
depending on the state. Many of the projects that are used to meet the state RPS
programs cost below the forecasted energy and capacity value. California, with its high
level of RPS demand, does show REC prices averaging about $7/MWh over the study
period.
The capacity build by resource type across the WECC is shown in Figure 8‐14,
with over 35,000 MW of renewable energy project built by 2025. The locations of
projects are shown in Figure 8‐15. In this scenario, a mix of wind, solar, geothermal and
hydro projects are deployed, as well as 74 MW of biomass. A few small hydro projects
(18 MW) from BC are built in this scenario because high demand for renewable energy
across WECC makes a small amount of BC Hydro projects attractive for importing to the
U.S. However, because the PTC is still in place in later years, very few international
projects can compete. Additionally, more wind is built in this scenario compared to
Scenario 1, which has the same level of projected RPS demand, because the cost of solar
PV is assumed to decline at Baseline rates, rather than accelerated rates. Since the PTC
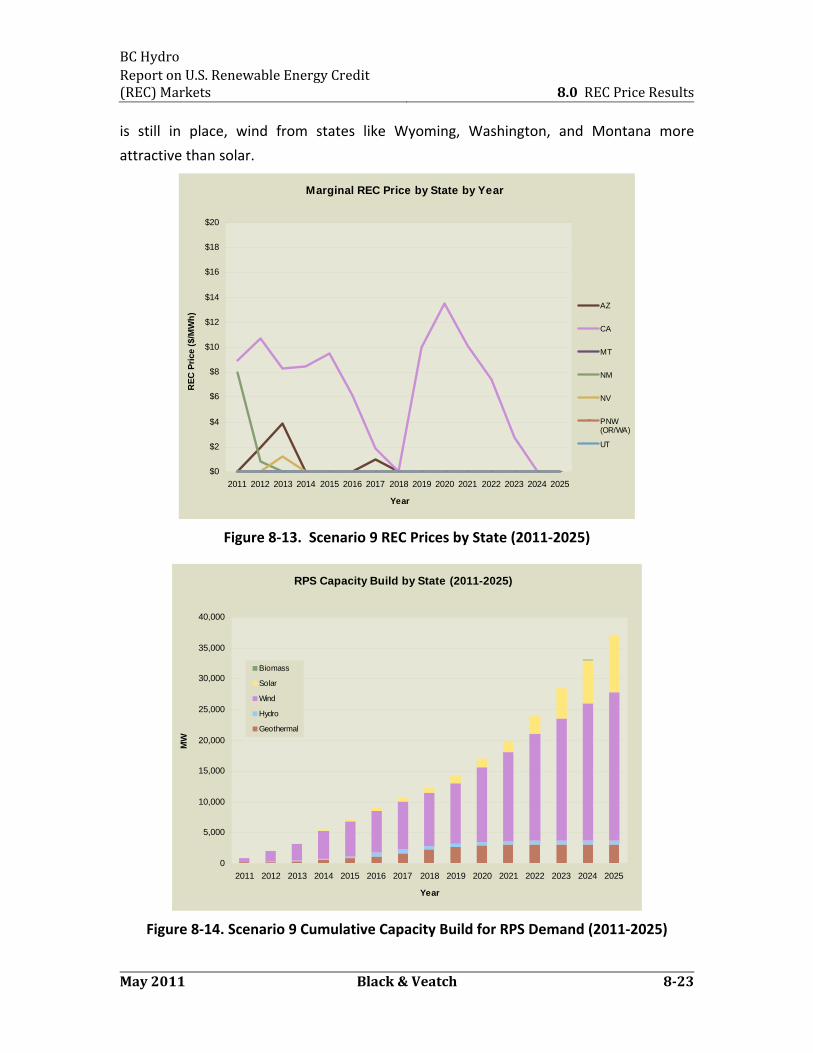
BC Hydro Report on U.S. Renewable Energy Credit (REC) Markets 8.0 REC Price Results
May 2011 Black & Veatch 823
is still in place, wind from states like Wyoming, Washington, and Montana more
attractive than solar.
Marginal REC Price by State by Year
$0
$2
$4
$6
$8
$10
$12
$14
$16
$18
$20
2011 2012 2013 2014 2015 2016 2017 2018 2019 2020 2021 2022 2023 2024 2025
Year
RE
C P
rice
($/
MW
h)
AZ
CA
MT
NM
NV
PNW(OR/WA)
UT
Figure 8‐13. Scenario 9 REC Prices by State (2011‐2025)
RPS Capacity Build by State (2011-2025)
0
5,000
10,000
15,000
20,000
25,000
30,000
35,000
40,000
2011 2012 2013 2014 2015 2016 2017 2018 2019 2020 2021 2022 2023 2024 2025
Year
MW
Biomass
Solar
Wind
Hydro
Geothermal
Figure 8‐14. Scenario 9 Cumulative Capacity Build for RPS Demand (2011‐2025)
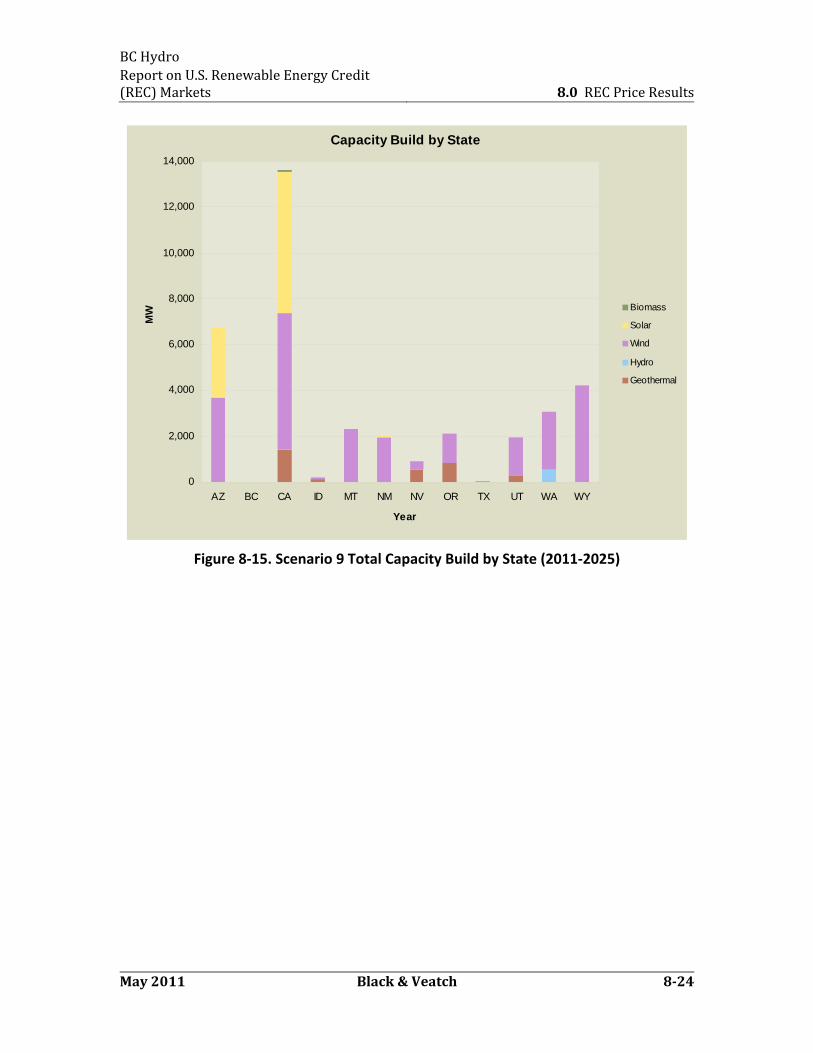
BC Hydro Report on U.S. Renewable Energy Credit (REC) Markets 8.0 REC Price Results
May 2011 Black & Veatch 824
Capacity Build by State
0
2,000
4,000
6,000
8,000
10,000
12,000
14,000
AZ BC CA ID MT NM NV OR TX UT WA WY
Year
MW Biomass
Solar
Wind
Hydro
Geothermal
Figure 8‐15. Scenario 9 Total Capacity Build by State (2011‐2025)
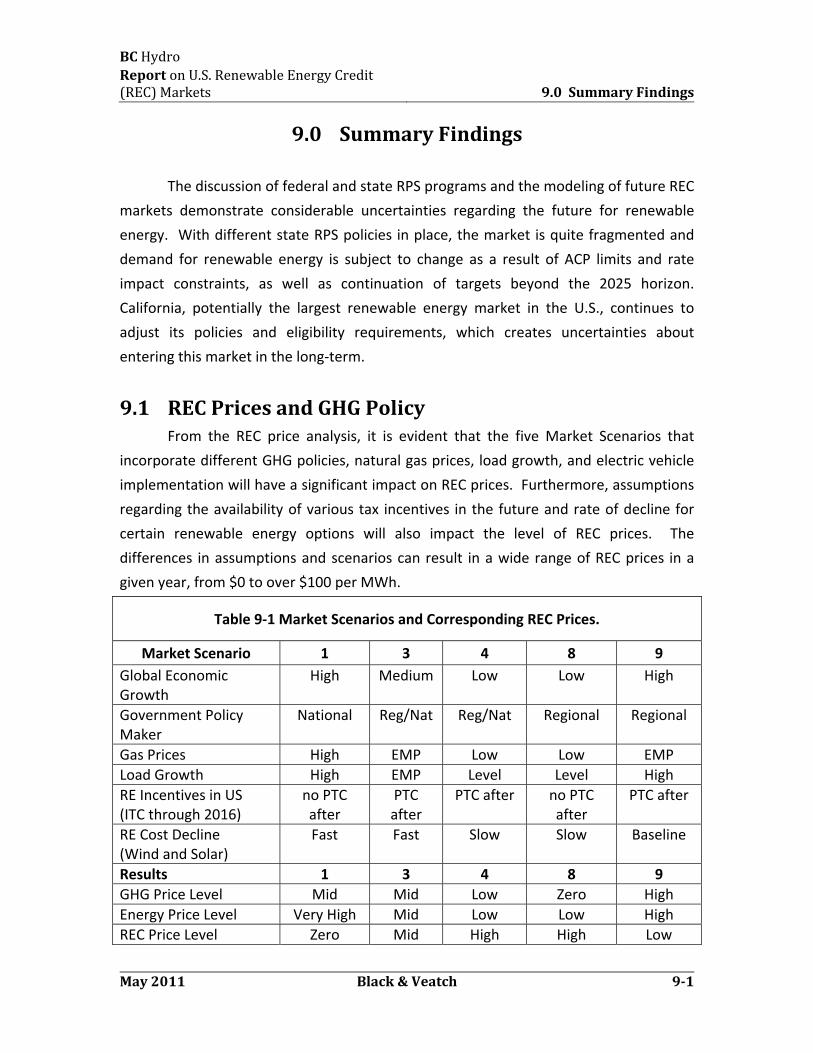
BC Hydro Report on U.S. Renewable Energy Credit (REC) Markets 9.0 Summary Findings
May 2011 Black & Veatch 91
9.0 Summary Findings
The discussion of federal and state RPS programs and the modeling of future REC
markets demonstrate considerable uncertainties regarding the future for renewable
energy. With different state RPS policies in place, the market is quite fragmented and
demand for renewable energy is subject to change as a result of ACP limits and rate
impact constraints, as well as continuation of targets beyond the 2025 horizon.
California, potentially the largest renewable energy market in the U.S., continues to
adjust its policies and eligibility requirements, which creates uncertainties about
entering this market in the long‐term.
9.1 REC Prices and GHG Policy From the REC price analysis, it is evident that the five Market Scenarios that
incorporate different GHG policies, natural gas prices, load growth, and electric vehicle
implementation will have a significant impact on REC prices. Furthermore, assumptions
regarding the availability of various tax incentives in the future and rate of decline for
certain renewable energy options will also impact the level of REC prices. The
differences in assumptions and scenarios can result in a wide range of REC prices in a
given year, from $0 to over $100 per MWh.
Table 9‐1 Market Scenarios and Corresponding REC Prices.
Market Scenario 1 3 4 8 9
Global Economic Growth
High Medium Low Low High
Government Policy Maker
National Reg/Nat Reg/Nat Regional Regional
Gas Prices High EMP Low Low EMP
Load Growth High EMP Level Level High
RE Incentives in US (ITC through 2016)
no PTC after
PTC after
PTC after no PTC after
PTC after
RE Cost Decline (Wind and Solar)
Fast Fast Slow Slow Baseline
Results 1 3 4 8 9
GHG Price Level Mid Mid Low Zero High
Energy Price Level Very High Mid Low Low High
REC Price Level Zero Mid High High Low
BC Hydro Report on U.S. Renewable Energy Credit (REC) Markets 9.0 Summary Findings
May 2011 Black & Veatch 92
Upon examination of the resulting GHG prices, energy prices, and REC prices of
each Market Scenario, it is evident that when energy prices are high, REC prices are low
or zero. The combination of natural gas prices and GHG prices contribute to the high
energy price forecast. In other words, if future energy prices are high, resulting from
either high GHG or high natural gas prices, there is no REC premium required for
developing renewable energy projects because renewable energy would be directly
competitive with conventional generation. RPS targets, as well as GHG reduction goals,
could easily be met as massive amounts of renewable energy projects are deployed. In
light of the changing focus of the U.S. Congress away from GHG policies, however, a
nationally‐driven, stringent GHG policy is not foreseen in the near‐term. Regional GHG
programs could support renewables development if GHG prices are sufficiently high.
On the other hand, if GHG policies are modest or do not exist, the GHG prices
would be low or zero. Coupled with low natural gas prices, the resulting energy prices
are also low. This means renewable energy projects cannot directly compete. In fact,
the price gap is so high for many renewable energy options (>$50 per MWh) that ACP
constraints cause many states not to meet their RPS targets. For the states that do not
have ACP constraints, REC prices may rise to $100 per MWh or more; though at these
levels, the states with rate impact constraints may also end up not meeting their RPS
targets. With the current state of the natural gas market being so low and no national
RPS or GHG policies in place, regional RPS and GHG targets may not be achievable if
caps on REC prices persist.
In a scenario where both GHG prices and natural gas prices are considered
moderate, the resulting energy prices are also moderate. At this level, there is still a gap
between the future cost of renewable generation and energy prices, so some RE
premium is still needed to make a project whole. The resulting REC prices start at
around $30 per MWh in the near term for most states and then decline over time as
energy prices rise, due to increasing GHG and natural gas prices. This means that less of
a premium will be needed in the long term, assuming the PTC continues to be in place.
It is debatable whether PTC or RECs would be the preferred mechanism to address
revenue shortfalls of renewable energy projects in later years. If PTC is removed in later
years, the REC prices would increase instead of decrease.
Overall, increased penetration of renewables will reduce GHG emissions. What
will be necessary to firm and shape the renewable, for the portion of RPS programs that
BC Hydro Report on U.S. Renewable Energy Credit (REC) Markets 9.0 Summary Findings
May 2011 Black & Veatch 93
can be met with these products, is still to be determined. If the renewables added are
quite variable, new firming and shaping resources may be needed. The extent of such
need will be in part driven by the diversity of such resources (more diversity reduces the
need) and the ability to forecast the variability. The technology of new firming and
shaping resources will impact the quantity of GHG emissions they introduce into the
environment. It is often assumed that new flexible gas fired generation will be used to
firm and shape new renewables. Whenever such gas fired resources need to be run,
GHG will be emitted. If firming and shaping is done with hydro facilities, then there will
be no GHG emissions associated with the firming and shaping.
9.2 Renewable Energy and GHG Policy State Renewable Goals (i.e. RPS targets) were originally established to bridge the
gap between renewable energy and “least‐cost” conventional generation, to reduce
local emissions such as NOx, SOx, Mercury, Particulates, etc and to create local jobs. As
climate change concerns grew, it became clear that the construction of renewable
resources would be a key activity in reducing GHG emissions also. As climate change
legislation is designed and planned, establishing RPS targets have been considered as
one major element of meeting GHG reduction goals. However, the interaction between
market‐based GHG reduction schemes and RPS targets has created concerns over
double‐counting and misconceptions in the market place.
The misconception is that a REC can be used to comply with an RPS target and
act as a carbon offset. To understand this issue, one must understand the different
entities that are responsible for meeting RPS and GHG targets. In an RPS program, the
responsible parties are the load serving entities who must ensure a portion of the
energy used to serve load is renewable. The RECs associated with the renewable energy
will also be used by these entities to report its portfolio mix and the GHG emissions
associated with the mix. However, load serving entities generally are not responsible
for GHG emissions reductions of their portfolio mix, except for the portion of generators
that are owned by them. The owners of power generators and other emitting sources
are responsible for GHG reduction targets and expect to incur additional costs for the
right to emit, either in the form of a carbon tax or carbon allowances. Non‐emitting or
carbon neutral renewable energy projects do not emit, but an emitter cannot use RECs
from these projects to claim reductions (offsets) to its own GHG emissions. This is
because the electricity produced by a renewable energy project may have already
BC Hydro Report on U.S. Renewable Energy Credit (REC) Markets 9.0 Summary Findings
May 2011 Black & Veatch 94
displaced an equivalent amount of electricity from an emitting generator, who has
reduced its own overall emissions by not generating. Thus, a second emitter cannot
take credit for that same reduction.15 In most jurisdictions, RECs cannot be counted
twice or be sold as two separate products.
In market‐based GHG reduction schemes, there is usually a carbon cost adder to
electricity generated by emitters, which non‐emitters do not face. GHG policy often
increases the marginal price for electricity, which, in turn, increases the electricity
revenue that non‐emitting renewable energy projects may be able to receive. In this
way, GHG policy implicitly supports renewable energy projects through elevated energy
price revenues, but does not provide an explicit revenue stream in the form of carbon
offsets. The value components of renewable energy projects, thus, are: (1) energy (with
implicit carbon adders); (2) capacity; and (3) RECs (for RPS compliance). As discussed in
previous chapters, the value of RECs may be bundled with the power or unbundled,
depending on the state RPS program.
15 One known exception to this is the GHG scheme in Alberta, where GHG emissions reduction goals are based on carbon intensity (per MWh generation), so renewable energy can help reduce emitters’ carbon intensity.
Related Documents