REPORT TO EPA VICTORIA ON COMMUNITY RESPONSE TO ENVIRONMENTAL NOISE February 2007 Strahan Research www.strahan-research.com.au Level 6, 90 William St Melbourne Vic 3000 Tel +61 3 9604 9199 Fax +61 3 9606 9191

Welcome message from author
This document is posted to help you gain knowledge. Please leave a comment to let me know what you think about it! Share it to your friends and learn new things together.
Transcript

REPORT TO EPA VICTORIA ON COMMUNITY RESPONSE TO ENVIRONMENTAL NOISE
February 2007 Strahan Research www.strahan-research.com.au
Level 6, 90 William St Melbourne Vic 3000 Tel +61 3 9604 9199 Fax +61 3 9606 9191

Community Response to Environmental Noise Environment Protection Authority of Victoria
Strahan Research www.strahan-research.com.au
2
CONTENTS Page
Section I: Introduction 2
1. Introduction 4
1.1 Role of EPA 4 1.2 Environmental Noise 4 1.3 Research Objectives 5 1.4 Research Methodology 5 1.5 Notes on Presentation of Quantitative Data 10
Section II: Summary of Key Findings 11 2. Community Noise Annoyance 14
2.1 Level of Annoyance with Noise Source 14 2.2 Level of Annoyance with Noise Source by Location 17 2.3 Verbal and Numerical Ratings of Annoyance 19
3. Disturbance Caused by Noise Source 21 3.1 Disturbance to Aspects of Home Life 21 3.2 Causes of Disturbance to Home Life 22
4. Annoyance Times for Noise Sources 24 5. Action Taken in Response to Noise 26 5.1 Complained or Reported Noise by Level Annoyance 26
5.2 Noise Complaint by Location 28 6. Demographics 29 Section III: Community Survey Data 30 7. Road Traffic Noise 31 8. Neighbours’ Noise 40 9. Noise From Trams Or Trains 48 10. Aircraft Noise 53 11. Noise From Factories Or Industry 58 12. Noise From Shops Or Other Businesses 64 13. Construction Activities’ Noise 69 14. Noise From Music Or Entertainment Venues 74 15. Sports And Recreation Noise 80 16. Noise From Farms, Forestry, Timber, Agriculture, Mining Or Quarrying 85 17. Noise From Ports, Boats And Shipping 91 18. Noise From Audible Alarms 97 19. Level of Annoyance and Proximity to Noise Source 103 20. Reporting Of Noise 105 21. Other Action Taken to Reduce Noise 108 Section IV: Demographics of the sample 115

Community Response to Environmental Noise Environment Protection Authority of Victoria
Strahan Research www.strahan-research.com.au
3
SECTION I: INTRODUCTION

Community Response to Environmental Noise Environment Protection Authority of Victoria
Strahan Research www.strahan-research.com.au
4
1. INTRODUCTION
1.1 ROLE OF EPA EPA Victoria was established under the Environmental Protection Act, and addresses a broad range of environmental issues including protection of air, water and soil quality, and the ecosystems they support. In addition, EPA Victoria is responsible for environmental noise management in Victoria. EPA Victoria’s role in environmental noise management includes coordinating activities related to preventing and controlling noise by developing policies, regulations and guidelines, issuing approvals, licences and notices, and enforcement. EPA assists other State and local government agencies by providing advice and setting noise standards for use in their statutory processes. Currently, EPA Victoria is reviewing its environmental noise program and developing a strategy for noise prevention and management for the future. 1.2 ENVIRONMENTAL NOISE Environmental noise encompasses noise emitted from a multitude of sources in the community, and the term “environmental noise” refers to noise from all sources, except noise at the industrial workplace. Noise exposure and level of impact it has on Victorian communities has not been the subject of recent studies, and previous studies are difficult to compare. In addition, while little has changed regarding environmental noise management and the programs and policies in Victoria during the last 15 years, there has been continual change to activities that generate noise. The community’s expectations regarding the noise environment may also have changed. In Australia, since the 1986 study (Community response to noise in Australia: results of the 1986 national noise survey (Australian Environment Council 1988), there have been no other noise-related studies of this type involving the Victorian community, and few studies elsewhere in Australia. The 1986 study, using a social survey, was the first Australian study to assess the extent of disturbance resulting from many different environmental noise sources throughout the nation, and provided data on the overall impact of various types of noise on the general population. Internationally, a review of over 360 studies of community response to noise, by the ICBEN Team 6 (The International Commission on the Biological Effects of Noise Community Response to Noise), highlighted the difficulties of comparing results of research on this issue. As a result, ICBEN Team 6 developed guidelines for reporting information, to be used in future studies on noise in the community. These included

Community Response to Environmental Noise Environment Protection Authority of Victoria
Strahan Research www.strahan-research.com.au
5
standardized noise reaction questions and response scaling for use in social surveys on noise in the community. These reporting guidelines and questions are the basis of the international standard ISO/TS 15666:2003 Acoustics – assessment of noise annoyance by means of social and socio-acoustic surveys.
EPA now intends to establish the impact of noise on the community to assist with prioritising and developing programs for noise prevention and management for the future. 1.3 RESEARCH OBJECTIVES The primary objectives of this research are to establish Victorian community experience of, and attitudes towards noise within living environments: Specifically the research:
• Identifies the types of noise sources most significant for the Victorian community.
• Identifies the proportion of population affected.
• Estimates the magnitude of the impact of various noise sources on the community.
• Establishes whose lives are disturbed by environmental noise in some way.
• Identifies the implications of noise in the community with regard to interference
with aspects of home life, the timing of noise, residents’ reporting of noise, actions taken to reduce noise and the effectiveness of these actions.
1.4 METHODOLOGY A random telephone survey of 1213 residents of metropolitan Melbourne and regional Victoria was conducted in October 2006.
1.4.1 Sample The random sample was stratified to reflect the distribution of the population between metropolitan Melbourne and regional Victoria (approximately two thirds Melbourne and one third regional Victoria). A random sample of this size allows 95% confidence that sample results will be within 3% of Victorian population values. At the same confidence level error margins are 3.5% for metropolitan Melbourne and 5% for regional Victoria.

Community Response to Environmental Noise Environment Protection Authority of Victoria
Strahan Research www.strahan-research.com.au
6
The sample included residents over 18 years of age. Details of response are outlined below.
Result
Number
Completed 1213 Refused 1923 No Answer 699 Engaged 18 Answering machine 167 Not appropriate 89 Disconnected 292 Other (Fax, business etc) 117
Response rate for this study is 31.4% and the cooperation rate1 is 63.1%. Response rate is calculated as follows:
Completed (Completed) + Completed X (Not contacted + Refused)
Completed + Non Qualified 1.4.2 Questionnaire 1.4.2.1 Design The questionnaire design conforms to guidelines set out in the ISO/TS 15666:2003 Acoustics – assessment of noise annoyance by means of social and socio-acoustic surveys. In this regard, the questionnaire included standardized questions on noise annoyance in accordance with the aforementioned document. A modular questionnaire format, similar to that used for the UK NAS99 (conducted by BRE for the UK Department for the Environment, Food and Regional Affairs), was also used for this research. A matrix question as described in 14.2 of the international guidelines was used for the broad categories of noise. Once a specific noise source was reported by a respondent as being moderately, very or extremely annoying, the respondent was asked a series of questions to determine the magnitude of the impact of that specific noise. Those questions are listed below.
1 Cooperation rate is calculated as a proportion of the number of completed interviews generated from the total number of contacted eligible respondents – Completed/Refused.

Community Response to Environmental Noise Environment Protection Authority of Victoria
Strahan Research www.strahan-research.com.au
7
By including standardized questions on noise annoyance in accordance with the international standard results of this study are broadly comparable with those from other studies including the 1986 Australian study, as well as recent international studies. The questionnaire was designed to have duration of 15 minutes. The questionnaire employed both verbal and numerical scaling responses being repeated for each broad category of noise. 1.4.2.2 Questions The following information was obtained during data collection:
• Type of neighbourhood in which respondent lives
• Type of dwelling respondent lives in
• Demographics of respondent such as gender and age
• Broad categorical questions on noise were prompted (eg road traffic, neighbours, aircraft,)
• Specific noise source questions under each category were unprompted (eg trucks, buses, motorbikes)
If noise sources were described as moderately, very or extremely annoying, that response was explored further by the respondent being asked a series of questions to elicit more information on the noise source, as follows:
• Does (noise source) interfere with aspects of your home life? (Such as, activity
disturbance, sleep disturbance, use of gardens and outdoor space) • Does (noise source) particularly bother, annoy or disturb you at home, at each of
the following times during the week and weekend? (Start of the day, day, evening, night)
The following were also asked of all respondents:
• Have you ever made a report or complaint about any of the noise sources? • Which noise(s) did you report or complain about? • Who did you report the noise or complain to about the (noise source)? • Have you ever taken any action to reduce (noise source) that you hear at home?
(If so, what action was taken?) • How effective was each action that was taken? • Overall, did the action(s) taken solve the problem?

Community Response to Environmental Noise Environment Protection Authority of Victoria
Strahan Research www.strahan-research.com.au
8
In summary broad categories of noise included in the questionnaire were as follows:
Road traffic } Neighbours } mandatory for more detailed questions Aircraft } Factories or industry } Shops or other businesses } Construction activities } Music/entertainment venues } detailed questions if moderately, Sports and recreation } very or extremely annoyed Farms, forestry, agriculture, mining } Ports, boats and shipping } Audible alarms } Trains or trams }
1.4.2.3 Verbal scaling Verbal scaling is a very clear method of enabling respondents to describe their feelings of annoyance (about the noise source in this case), and was presented without any numerical reference. In this questionnaire, we used the verbal scaling recommended by the International guidelines of ISO/TS15666 Acoustics – assessment of noise annoyance by means of social and socio-acoustic surveys. Respondents were asked how much a general category of environmental noise eg “road traffic”, annoyed, bothered or disturbed them, and were asked which one of the following closest describes his/her response: • Not at all • Slightly • Moderately • Very • Extremely Verbal scaling was applied to all broad categories of environmental noise. Those respondents who said that they were not at all bothered, annoyed or disturbed were lead through a series of questions to ascertain whether or not they heard the noise and were not bothered by it or whether they simply did not hear the noise. Those few respondents who said that they did not know whether they were bothered, annoyed or disturbed by a noise were lead through a series of questions that allowed them to reconsider their response.2 1.4.2.4 Numerical Scaling In accordance with the guidelines, of ISO/TS 15666 Acoustics – assessment of noise annoyance by means of social and socio-acoustic surveys, we used an11-point numerical scaling in this study (from 0 to 10, where 0= “not at all”, and 10 = “extremely”)
2 See the appended survey for exact wording that achieved these outcomes.

Community Response to Environmental Noise Environment Protection Authority of Victoria
Strahan Research www.strahan-research.com.au
9
Numerical scaling was used together with verbal scaling for each general category of noise asked about in the survey. The numerical scaling provides a check on consistency of respondents’ answers, and is also useful in multi-racial societies, where understanding of numbers may be less of an issue than verbal options. The numerical scale question was asked after the verbal scale question and consequently those respondents, who were coded by the verbal scale as not having heard the noise or as not knowing whether or not they were annoyed by the noise, were not asked the numerical scaling question. 1.4.3 Surveying Non English Speaking Respondents In order to survey a representative sample of people with no or very limited English language competence we used multilingual interviewers and employed a system of language identification. We arranged for an interviewer with appropriate language skills to re-contact the household if, at initial contact, the interview could not be conducted in the appropriate language. All our interviewers are provided with and taught key phrases in languages in which they do not have specific competence in order that they can identify the language that is spoken and have an appropriate interviewer ring the household later.
1.4.4 Pre-Test We pre-tested 30 households to fine tune the questionnaire, ensure it was of an appropriate duration and ensured that it was able to achieve our collection objectives of meaningful, high quality data.
1.4.5 Audit In order to continuously monitor quality, all our telephone interviewing is completed on our premises under strict supervision. All surveys (telephone, in depth and door to door) are thoroughly audited consistent with AMSRS practices. 10% of each interviewer’s calls are audited each at each interview session.

Community Response to Environmental Noise Environment Protection Authority of Victoria
Strahan Research www.strahan-research.com.au
10
1.5 NOTES ON THE PRESENTATION OF QUANTITATIVE DATA
Computer rounding produces tables that add up to 100% +/- 1%. Differences described in the text are statistically significant when tested with Chi-square at the 0.5 levels. Cross-tabulations where there are a number of categories have small numbers in some cells and are provided as a guide only.

Community Response to Environmental Noise Environment Protection Authority of Victoria
Strahan Research www.strahan-research.com.au
11
SECTION II: SUMMARY OF KEY FINDINGS

Community Response to Environmental Noise Environment Protection Authority of Victoria
Strahan Research www.strahan-research.com.au
12
The noise sources to which more residents are exposed are road traffic (70% of respondents heard road traffic noise), aircraft (61%) and neighbour noise (57%). Community exposure to commercial and industrial noise was much lower, around 10% of the respondents heard industrial noise and shops/other business at their homes.
• Road traffic noise, neighbour noise, audible alarms and construction noise are the four sources of noise most annoying to Victorians. Each one annoys the largest numbers of respondents at night over weekends.
− Road traffic noise is a constant noise source, which is heard by 70% of
respondents, and annoys or bothers 20% of respondents moderately to extremely. At least 35% of respondents were disturbed at all times of day, peaking at weekends during the night with 54% of respondents nominating this as the time they are particularly annoyed by road traffic noise. General traffic noise, truck noise and noise from antisocial driving (hotted up cars, vehicles accelerating rapidly, engine revving etc) are the main types of annoying traffic noise.
− Neighbour noise is heard by 57% of respondents, annoying 15% of them
moderately to extremely, with greatest effect at the start of the week-day and at night on weekends. TV, music and radio noise and noisy dogs are cited as the most annoying neighbour noise.
− Almost a half of respondents (48%) hear audible alarms, with 8% rating
the annoyance as moderate to extreme. One in five respondents (23%) say that audible alarms are annoying primarily at the start of the week-day and at night on weekends. Intruder alarms and car alarms are the main alarms that respondents cited as annoying.
− Construction noise is heard by over a third of respondents (34%) and 8%
rate annoyance as moderate to extreme. Sixty-nine respondents are annoyed primarily at the start of the day during the week. Noise associated with neighbours building or renovating their homes is identified as the main construction noise that respondents find annoying.
− While aircraft noise is widely heard (61% of respondents) it causes
moderate to extreme annoyance for 6% of the respondents. Annoyance from aircraft noise is greatest during the daytime on weekends. Helicopters are the source of aircraft noise most commonly mentioned as annoying.
• Overall, almost half of respondents (49%) have been disturbed by a noise source
over the last twelve months. A small number of respondents (4%) have not heard any of the twelve noise sources in the last twelve months.
• With a few exceptions, a similar proportion of respondents hear all noise sources
irrespective of whether they are located in metropolitan Melbourne or regional Victoria. However a significantly higher proportion of respondents in Melbourne tend to be moderately to extremely annoyed by the top four noise sources.

Community Response to Environmental Noise Environment Protection Authority of Victoria
Strahan Research www.strahan-research.com.au
13
• Sleep is the aspect of home life disturbed by noise for the largest number of
respondents (23% of respondents reported sleep disturbance from noise). “Reading, relaxing and other quiet activities” (20%) and “spending time outdoors” (14%) were other aspects of home life disturbed by noise.
• The start of the day, and night-time at weekends were the times when
respondents reported being particularly disturbed by environmental noise.
• Over one in six respondents (18%) say they have complained about noise to the authorities with complaints made primarily about neighbour noise and road traffic noise.
• The police are the authority that most respondents contacted to lodge a
complaint (60% of those that complained). One quarter of respondents (25%) that complained contacted local government, 15% contacted the person causing the noise, and 4% contacted EPA.
• Over one in ten (11%) of respondents say they have tried to solve the noise
problem. Of these, 63% made changes to their homes or their habits and (37%) tried to directly or indirectly resolve the problem through negotiation or demand.
• Over a third (36%) of respondents who have taken actions to reduce the noise
said they had been very or extremely effective, while 14% felt their actions had not been effective at all, and 25% felt their actions were only slightly effective.
• Almost half (49%) of those asked felt their actions had solved the problem.

Community Response to Environmental Noise Environment Protection Authority of Victoria
Strahan Research www.strahan-research.com.au
14
2. COMMUNITY NOISE ANNOYANCE 2.1 LEVEL OF ANNOYANCE WITH NOISE SOURCE To determine the community noise annoyance in accordance with the International Standard ISO/TS 15666 Acoustics – assessment of noise annoyance by means of social and socio-acoustic surveys the respondents were asked about how much they were bothered, disturbed or annoyed by broad categories of environmental noise. Table 1: Proportions of respondents who heard and reported being bothered, annoyed or disturbed to various extents by general categories of environmental noise
Proportion of respondents bothered, annoyed or disturbed by noise source (%)
Source of Noise (n=1213)
% Respondents who hear the
noise Slightly to extremely
Moderately to extremely
Very to extremely
Road traffic noise
69.7 (845)
40.1 (487)
19.6 (238)
7.8 (95)
Neighbour noise
56.8 (689)
29.5 (358)
14.6 (177)
7.8 (94)
Audible Alarms
48.1 (583)
22.9 (277)
8.1 (98)
3.5 (42)
Construction activities
34.4 (417)
16.8 (204)
8.0 (97)
3.4 (41)
Aircraft noise
60.9 (739)
18.3 (223)
6.2 (76)
2.6 (32)
Sports/recreation
28.4 (345)
7.5 (91)
2.9 (35)
1.4 (17)
Music/entertainment venue noise
17.2 (209)
5.6 (68)
2.7 (33)
1.2 (15)
Tram/train
33.1 (402)
8.6
(104)
2.6 (31)
1.1 (13)
Factory/industry
9.6
(117)
2.5 (30)
1.1 (13)
0.4 (5)
Farming, forestry, timber/ agriculture
13.5 (164)
2.5 (31)
0.7 (9)
0.4 (5)

Community Response to Environmental Noise Environment Protection Authority of Victoria
Strahan Research www.strahan-research.com.au
15
Shops/other businesses
10.2 (124)
2.4 (29)
0.6 (7)
0.4 (4)
Ports, boats, shipping
9.2
(112)
1.0 (13)
0.3 (4)
0
The four noise sources that are heard and cause annoyance and disruption to the largest number of respondents are:
− Road traffic (heard by 69.7% of respondents and annoys 40.1% of them) − Neighbours (56.8% and 29.5%) − Audible alarms (48.1% and 22.9%) − Construction (34.4% and 16.8%)
Aircraft noise is also widely heard (60.9%) and to a lesser extent tram and train noise (33.1%). However in both cases they cause annoyance to considerably fewer respondents (18.3% and 8.6% respectively). Noise produced by farming and forestry and mining and quarrying is heard by 13% of respondents but only 2.5% say is annoys them to any degree. A similar story can be told in relation to:
− Shop and other business noise (heard by 10.2% and annoys 2.4%) − Factory and industry noise (9.6% and 2.5%) − Ports, boats and shipping noise (9.2% and 1.0%)
Percentage of Respondents Hearing Noise
0 10 20 30 40 50 60 70 80
Road traffic noise
Neighbor noise
Audible Alarms
Construction activities
Aircraft noise
Sports/recreation
Music/entertainment venue noise
Tram/train
Factory/industry
Farming, forestry, timber/ agriculture
Shops/other businesses
Ports, boats, shipping
% Respondents who Hear Noise
Figure 1. Percentage of Respondents Hearing Noise

Community Response to Environmental Noise Environment Protection Authority of Victoria
Strahan Research www.strahan-research.com.au
16
Respondents Hearing Noise and Level of Annoyance
69.7
56.8
48.1
34.4
60.9
28.4
17.2
33.1
9.6
13.5
10.2
9.2
40.1
29.5
22.9
16.8
18.3
7.5
5.6
8.6
2.5
2.5
2.4
1
19.6
14.6
8.1
8
6.2
2.9
2.7
2.6
1.1
0.7
0.6
0.3
7.8
7.8
3.5
3.4
2.6
1.4
1.2
1.1
0.4
0.4
0.4
0
0 10 20 30 40 50 60 70 80
Road traffic noise
Neighbor noise
Audible Alarms
Construction activities
Aircraft noise
Sports/recreation
Music/entertainment venue noise
Tram/train
Factory/industry
Farming, forestry, timber/ agriculture
Shops/other businesses
Ports, boats, shipping
Percent of Respondents
Very to extremelyannoyed
Moderately toextremelyannoyedSlightly toextremelyannoyedHear Noise
Figure 2: Proportion of respondents who heard general noise categories and who report being bothered, annoyed or disturbed to various extents.

Community Response to Environmental Noise Environment Protection Authority of Victoria
Strahan Research www.strahan-research.com.au
17
2.2 LEVEL OF ANNOYANCE WITH NOISE BY LOCATION In order to establish possible differences in the extent that respondents were bothered, disturbed or annoyed by broad categories of environmental noise due to the location of their residence, an analysis of responses by location was undertaken as detailed below.
Table 2: Proportions of respondents who heard and reported being bothered, annoyed or disturbed to various extents by general categories of environmental noise located in metropolitan Melbourne and regional Victoria
Proportion of respondents bothered, annoyed or disturbed by noise source (%)
Source of Noise (n=1213)
% Respondents who hear the
noise Slightly to extremely
Moderately to extremely
Very to extremely
Metro
68.5 (549)
42.0 (337)
21.3 (171)
8.7 (70)
Road traffic noise
Regional 72.0 (295)
36.3 (149)
16.1 (66)
5.9 (24)
Metro 56.5 (453)
30.7 (246)
16.7 (134)
8.9 (71)
Neighbour noise
Regional 57.6 (236)
27.3 (112)
10.5 (43)
5.6 (23)
Metro
52.6 (422)
28.6 (229)
10.3 (83)
4.2 (34)
Audible Alarms
Regional
61.0 (250)
11.5 (47)
3.6 (15)
2.0 (8)
Metro 34.7 (278)
19.2 (154)
9.5 (76)
4.0 (32)
Construction activities
Regional 33.7 (138)
12.0 (49)
5.1 (21)
2.2 (9)
Metro 61.1 (490)
21.6 (173)
7.6 (61)
2.9 (23)
Aircraft noise
Regional 60.5 (248)
12.0 (49)
3.7 (15)
2.2 (9)
Metro 26.1 (209)
9.4 (75)
3.2 (26)
1.5 (12)
Sports/recreation
Regional 33.0 (136)
3.9 (16)
2.2 (9)
1.2 (5)
Metro 12.6 (101)
4.7 (38)
2.6 (21)
1.1 (9)
Music/entertainment venue noise
Regional 26.3 (108)
7.3 (30)
2.9 (12)
1.5 (6)
Metro 33.4 (268)
10.6 (85)
3.2 (26)
1.5 (12)
Tram/train
Regional 32.4 (133)
4.4 (18)
1.0 (4)
0.2 (1)
Metro 7.4 (59)
2.5 (20)
1.1 (9)
0.3 (3)
Factory/industry
Regional
14.1 (58)
2.4 (10)
1.0 (4)
0.5 (2)
Farming, forestry, timber/ agriculture
Metro 4.6 (37)
0.6 (5)
0.2 (2)
0.2 (2)
Community Response to Environmental Noise Environment Protection Authority of Victoria
Strahan Research www.strahan-research.com.au
18
Regional 31.0 (127)
6.3 (26)
1.7 (7)
0.7 (3)
Metro 9.6 (77)
3.4 (27)
0.9 (7)
0.5 (4)
Shops/other businesses
Regional 11.5 (47)
0.5 (2)
0 0
Metro 6.0 (48)
0.9 (7)
0.1 (1)
0 Ports, boats, shipping
Regional 15.6 (64)
1.5 (6)
0.73 (3)
0
With a few exceptions, a similar proportion of respondents hear all noise sources irrespective of whether they are located in metropolitan Melbourne or in regional Victoria. However a significantly higher proportion of respondents in metropolitan Melbourne than in regional Victoria tend to be moderately to extremely annoyed by the top four noise sources:
− Road traffic (21.3% in metropolitan Melbourne and 16.1% in regional Victoria) − Neighbour (16.7% and 10.5%) − Audible alarms (10.3% and 3.6%) − Construction activities (9.5% and 5.1%)
A higher proportion of respondents in regional Victoria than those in metropolitan Melbourne say they hear noise from:
− Farming, forestry, mining and quarrying (31.0% regional Victoria and 4.6% metropolitan Melbourne)
− Music and entertainment venues (26.3% and 12.6%) − Ports, boats and shipping (15.6% and 6.0%) − Factories and industry (14.1% and 7.4%)
Factory and industry noise is experienced by relatively small numbers of respondents in both metropolitan Melbourne and regional Victoria but the level of annoyance in both areas is similar. Noise from ports, boats and shipping although at a low level are distributed across the state and are produced by a wide range of sources including power boats, jet skis and shipping.

Community Response to Environmental Noise Environment Protection Authority of Victoria
Strahan Research www.strahan-research.com.au
19
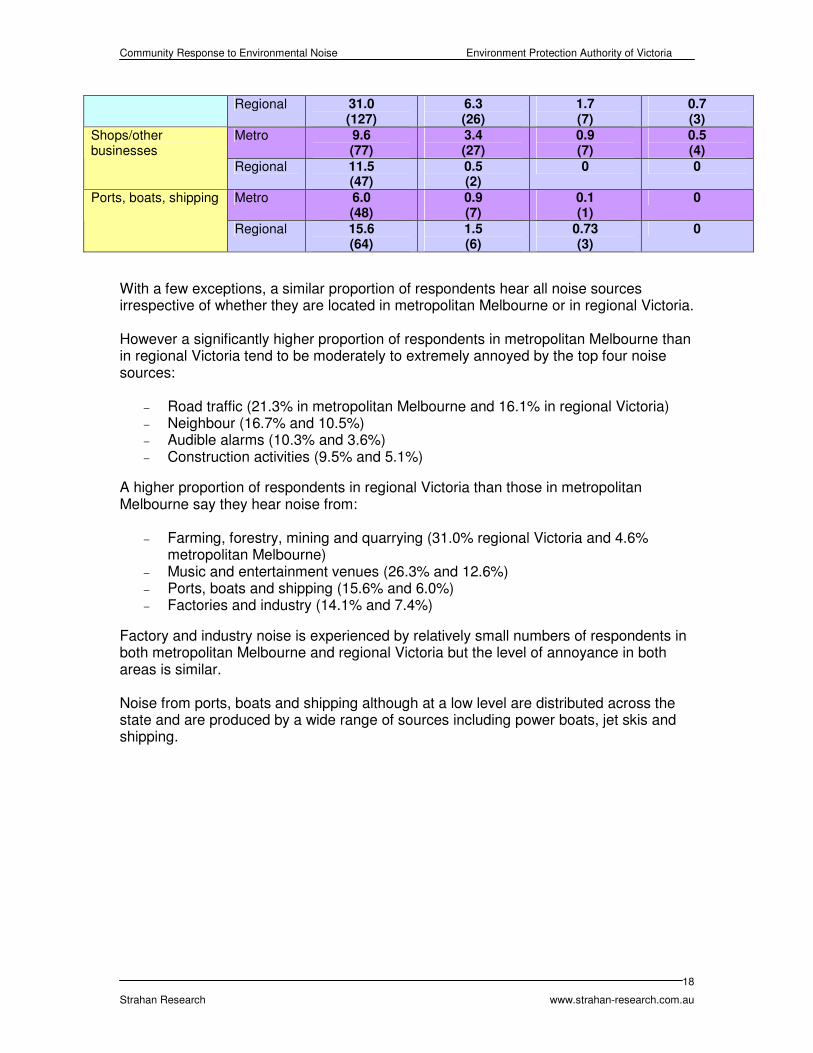
2.3 VERBAL AND NUMERICAL RATINGS OF ANNOYANCE Table 1 presented community noise annoyance as a proportion of all respondents as fewer people hear, or are exposed to some sources (eg. factories) than other more prevalent types of environmental noise (eg. road traffic noise) Table 3 shows the level of annoyance as a proportion of those respondents that hear each noise source. Table 3 also compares annoyance on both verbal and numerical scales. Table 3: Number and proportion of respondents who hear each noise source and comparison of verbal and numerical scales indicating bother, annoyance or disturbance at levels of moderately and greater or 6 and greater. Number
Respondents who hear
noise source
Hear noise source
Respondents (%)
N=1213
% Respondents’
hearing noise, who
verbally rate it as
Moderately – extremely annoying
% Respondents
who hear noise source
and numerically Rate noise annoyance
6 or >6
Road traffic noise *
845
69.7
28.2
22.7
Neighbour noise *
689
56.8
25.7
20.9
Audible Alarms
583
48.1
16.8
12.6
Construction activities
417
34.4
23.3
13.5
Aircraft noise
739
60.9
10.3
7.2
Sports/recreation
345
28.4
10.1
6.3
Music/entertainment venue noise
209
17.2
15.8
9.9
Tram/train
402
33.1
7.7
4.2
Community Response to Environmental Noise Environment Protection Authority of Victoria
Strahan Research www.strahan-research.com.au
20
Factory/industry
117
9.6
11.1
4.3
Farming, forestry, timber/ agriculture
164
13.5
5.5
3.0
Shops/other businesses
124
10.2
5.6
4.8
Ports, boats, shipping
112
9.2
3.6
0.9
Consistent with ISO/TS 15666, both verbal and numerical ratings of annoyance with noise sources were made by respondents. The use of the two questions allows checking of consistency of responses and the numerical scale reduces confusion with language. Results summarized in the table above demonstrate considerable consistency between the verbally and numerically-based measures of annoyance for all noise sources. A larger proportion of respondents consistently say that they are moderately to extremely annoyed by all noise sources than rate their annoyance with the same noise sources as 6 or above. This suggests that respondents perceive moderate annoyance to be reflected in a number below 6 out of ten. Further analysis indicates, that especially for those noise sources that are heard by a larger number of respondents, the numerical scale incorporating five to ten most closely corresponds to the verbal scale moderately to extremely bothered, annoyed or disturbed.

Community Response to Environmental Noise Environment Protection Authority of Victoria
Strahan Research www.strahan-research.com.au
21
3. DISTURBANCE CAUSED BY NOISE SOURCE 3.1 DISTURBANCE TO ASPECTS OF HOME LIFE Those respondents who heard various noise sources and who were bothered annoyed or disturbed by it (slightly to extremely in the case of traffic and neighbour noise and moderately to extremely in the case of all other noise sources) were asked whether various aspects of home life were disturbed. Analysis of responses to disturbance to aspects of home life caused by all noise sources is detailed below.
Aspects of Home Life Disturbed by All Noise Sources
23.6
20.2
14.3
13.1
9.8
10.4
8.5
0 5 10 15 20 25
Sleeping (n=646)
Reading, relaxing, quiet activities(n=553)
Spending time outdoors (n=392)
Listening to TV, radio, music (n=359)
Conversation incl telephone (n=268)
Concentrating or studying (n=284)
Entertaining (n=233)
Asp
ect o
f hom
e Li
fe D
istu
rbed
Percent of Responses
Figure 3: Proportion of respondents that reported environmental noise disturbing aspects of their home life As illustrated in Figure 3 above, sleep is the most mentioned aspect of home life that is disturbed by all noise sources (23.6% of responses). Reading, relaxing and other quiet activities, mentioned in 20.2% of responses and spending time outdoors (14.3%) are also cited by respondents as being disturbed by noise.

Community Response to Environmental Noise Environment Protection Authority of Victoria
Strahan Research www.strahan-research.com.au
22
3.2 CAUSES OF DISTURBANCE TO HOME LIFE Figure 4 below demonstrates the consistent impact of the top four noise sources on the key elements of home life. Sleep; reading, relaxing and quiet activities; and spending time outdoors are disturbed primarily by:
− Road traffic noise (36.2%, 33,2% and 33.1% respectively) − Neighbour noise (28.6%, 28.7% and 29.8% respectively) − Audible alarms (11.1%, 10.1% and 7.9% respectively) − Construction activities (6.7%, 7.9% and 8.4% respectively)
Noise Source Causing Sleep Disturbance
36.2
28.6
11.1
6.7
4.8
2.3
3.6
3.1
1.4
1.4
0.9
0
0 5 10 15 20 25 30 35 40
Road traffic noise
Neighbour noise
Audible alarms
Construction activities
Aircraft noise
Sports/recreation
Music/entertainment
Tram/train
Factory/industry
Farming/forestry
Shops/other business
Ports/boats/shipping
Noi
se S
ourc
e
Percentage of Responses
Figure 4: Noise Sources Causing Sleep Disturbance

Community Response to Environmental Noise Environment Protection Authority of Victoria
Strahan Research www.strahan-research.com.au
23
Noise Source Causing Disturbance to Reading, Relaxing And Other Quiet Activities
33.2
28.7
10.1
7.9
7.6
4
2.2
2.9
1.1
1.1
1.1
0.2
0 5 10 15 20 25 30 35
Road traffic noise
Neighbour noise
Audible alarms
Construction activities
Aircraft noise
Sports/recreation
Music/entertainment
Tram/train
Factory/industry
Farming/forestry
Shops/other business
Ports/boats/shippingN
oise
Sou
rce
Percent of Responses
Figure 5: Noise Sources Causing Disturbance to Reading, Relaxing and Other Quiet Activities
Noise Source Causing Disturbance to Outside Activities
33.1
29.8
7.9
8.4
7.9
4.3
2
2.6
1.5
1.5
0.5
0.3
0 5 10 15 20 25 30 35
Road traffic noise
Neighbour noise
Audible alarms
Construction activities
Aircraft noise
Sports/recreation
Music/entertainment
Tram/train
Factory/industry
Farming/forestry
Shops/other business
Ports/boats/shipping
Noi
se S
ourc
e
Percent of Responses
Figure 6: Noise Sources Causing Disturbance to Outside Activities

Community Response to Environmental Noise Environment Protection Authority of Victoria
Strahan Research www.strahan-research.com.au
24
4. ANNOYANCE TIMES FOR NOISE SOURCES In accordance with the EPA’s role in assessing the impact of noise on the community and assisting with prioritising and developing programs for noise prevention and management for the future, it is necessary to determine peak noise-annoyance times with respect to week days and weekends, as these may vary depending upon the noise source. In order to establish the times of day during the week and on the weekend when the most respondents were disturbed or annoyed by various noise sources further analysis of the data was undertaken to identify which noise sources were of greatest annoyance at which times.
Annoyance Times
191
309
118
216
2616
22 22
42
6 33 3
23
7
24
2 7
51
77
8 3 6
69
40
50
100
150
200
250
300
350
Start ofDay Week
Start ofDay
Weekend
Day Week DayWeekend
EveningWeek
EveningWeekend
NightWeek
NightWeekend
Times of Day
Num
ber
of R
espo
nses
Road Traffic
Neighbour
Tram/Train
Aircraft
Shops/business
Entertainment/music
Sports/recreation
Audible Alarms
Farming/Mining
Factory/industry
Construction
Figure 7: Times of Day During the Week and Weekend when Respondents Reported Being Disturbed by Noise Sources

Community Response to Environmental Noise Environment Protection Authority of Victoria
Strahan Research www.strahan-research.com.au
25
Figure 7 illustrates the times during the week and on weekends that respondents are most disturbed by various noise sources.
− Road traffic noise is the main source of annoyance both at the start of the day and during the night on weekends (191 and 309 responses respectively).
− Neighbour noise is an important source of annoyance at the start of the day
during the week (118 responses) and during the night on weekends (216 responses).
− Similar to neighbour noise but at a lower level, noise from audible alarms is a
source of annoyance at the start of the day during the week (51 responses) and during the night on weekends (77 responses).
− Construction noise annoys more people at the start of the weekday than any
other time.

Community Response to Environmental Noise Environment Protection Authority of Victoria
Strahan Research www.strahan-research.com.au
26
5. ACTION TAKEN IN RESPONSE TO NOISE 5.1 COMPLAINED OR REPORTED NOISE BY LEVEL OF
ANNOYANCE Many respondents who said that they complained about or reported a noise source of any kind displayed varying levels of annoyance with the top four noise sources. The relationship between the level of annoyance with the top noise sources and whether or not a respondent reported or complained about any noise is summarized below. Table 4: Level of annoyance with four main noise sources by whether complained about or reported any noise source Noise Source
Annoyance Slight to
Extreme and Complained about Noise
Annoyance Moderate to Extreme and Complained about Noise
Annoyance Very to Extreme
and Complained about Noise
Road traffic noise
60.8
33.0
17.9
Neighbour noise
55.2
37.7
25.5
Audible alarms
36.8
14.2
8.0
Construction noise
28.4
14.2
9.9
Table 4 above illustrates the relationship between the extent of annoyance with the four main noise sources and whether respondents complained about or reported noise of any type. Many respondents who were at all annoyed by road traffic or neighbour noise reported or complained about noise (60.8% and 55.2% respectively). However considerably fewer respondents reported or complained about audible alarm or construction noise (36.8% and 28.4% respectively). For all four noise sources outlined above there is a significant difference between respondents who experienced a lower level of disturbance or annoyance from the noise source and reported or complained about noise (any type of noise) compared to those who were more annoyed. Those who were more annoyed about the top four noise sources were more likely to have complained about noise.

Community Response to Environmental Noise Environment Protection Authority of Victoria
Strahan Research www.strahan-research.com.au
27
In addition, for respondents who complained or reported a noise there is a significant difference between those annoyed by neighbour noise than those annoyed by road traffic noise. Respondents who were annoyed about neighbour noise were more likely to complain about or report a noise than were those who were annoyed about road traffic noise.

Community Response to Environmental Noise Environment Protection Authority of Victoria
Strahan Research www.strahan-research.com.au
28
5.2 NOISE COMPLAINT BY LOCATION Table 5: Metropolitan and Regional Respondents Reporting or Complaining About Noise Reported/Complained about Noise
Metro
Respondents %
Regional
Respondents %
Total
Respondents %
Yes
19.7
12.9
17.4
No
80.2
86.8
82.4
Don’t Know
0.1
0.2
0.2
The proportion of respondents who say they have complained about or reported a noise source is significantly higher in metropolitan Melbourne than in regional Victoria. Almost one in five respondents (19.7%) living in metropolitan Melbourne compared to 12.9% of respondents resident in regional Victoria said that they complained about or reported a noise.

Community Response to Environmental Noise Environment Protection Authority of Victoria
Strahan Research www.strahan-research.com.au
29
6. DEMOGRAPHICS Table 6: Relationship between noise Category Heard and Proximity to Noise Source Related Noise category Proportion of respondents living close by Road traffic Freeway 18.4 Arterial Road 38.3 Neighbour noise Residences 88.0 Aircraft Airport/airfield 10.6 Tram/Train Tram/railway line 31.4 Ports/boats/shipping Sea/river/port/lake 12.4 Construction Building construction 14.4 Sports/recreation Sports Venue 26.4 Music/entertainment venue Hotel 11.0 Nightclub 1.9 Other entertainment venue 7.6 Factories/industry Factory/industrial premises 8.9 Shops or other businesses Shops/commercial premises 25.6 Farms/forestry/timber/agriculture Farming/forestry etc 13.9 Other 6.9 Audible alarms Residential 88.0 Factory/industrial premises 8.9 Shops/commercial premises 25.6
Table 7: Description of Area in which Respondents Live Residential Description
Respondents %
Mostly residential 80.4 Residential mixed with shops or offices 4.6
4.6 Residential mixed with factories and industry 2.3 2.3 Mostly factories or shops with some residential 0.2 0.2 House with no near neighbours or offices or factories 7.9 7.9 Other 4.6

Community Response to Environmental Noise Environment Protection Authority of Victoria
Strahan Research www.strahan-research.com.au
30
SECTION III: COMMUNITY SURVEY DATA

Community Response to Environmental Noise Environment Protection Authority of Victoria
Strahan Research www.strahan-research.com.au
31
7. ROAD TRAFFIC NOISE 7.1 ANNOYANCE FROM ROAD TRAFFIC NOISE The respondents were asked: Thinking about the last 12 months or so when you are here at home, how much does road traffic noise bother, disturb or annoy you? Table 8: Extent Road Traffic Bothers, Disturbs or Annoys Respondent (Verbal Scale)
Verbal scale for road traffic annoyance
Respondents %
n=1213
Not at all 29.3 Slightly 20.5 Moderately 11.8 Very 3.8 Extremely 4.0 Don’t know 0.1 Don’t hear 30.3 Almost one in three respondents (30.3% or 368 respondents) said they do not hear road traffic noise. Almost one in three respondents (29.3%) say that road traffic noise does not bother them at all. Almost one in five (19.6% or 238 respondents) said that road traffic noise is moderately, very or extremely annoying. This increases to 40.1% when respondents who are slightly annoyed by road traffic noise are included. Respondents who said more than other groups that they were not annoyed at all by road traffic noise are:
− Living in regional areas (35.6%) − 55 years and older (33.4%)
Respondents who have complained about or reported a noise problem are more than other groups:
− Slightly (27.8%) annoyed and, − Moderately to extremely annoyed (33.0%) about road traffic noise

Community Response to Environmental Noise Environment Protection Authority of Victoria
Strahan Research www.strahan-research.com.au
32
Respondents who heard road traffic noise were asked: Thinking about the last 12 months or so, what number from 0-10 best shows how much you are bothered, disturbed or annoyed by road traffic noise when you are here at home. If you are not at all annoyed choose 0; if you are extremely annoyed choose 10. If you are somewhere in between, choose a number between 0 and 10. Table 9: Extent Road Traffic Bothers, Disturbs or Annoys Respondent (Numerical Scale)
Numerical scale for road traffic annoyance
Respondents %
n=846
0 (not at all annoyed) 33.3 1 7.8 2 11.5 3 11.7 4 6.1 5 7.0 6 4.3 7 5.9 8 6.5 9 1.7 10 (extremely annoyed) 4.3 In rating annoyance with traffic noise numerically, a third of respondents (33.3%) said that they were not at all annoyed by traffic noise, while 22.7% (191) of respondents rated their annoyance at six out of ten or greater.

Community Response to Environmental Noise Environment Protection Authority of Victoria
Strahan Research www.strahan-research.com.au
33
7.2 PARTICULAR TYPES OF ROAD TRAFFIC NOISE Respondents who were slightly to extremely annoyed by road traffic noise were asked: Over the last 12 months or so when you are here at home are there any particular types of road traffic noise that bother, disturb or annoy you? (unprompted) Table 10: Particular Types of Road Traffic Noise Reported Unprompted report of particular road traffic noise *
Responses
(%)
General traffic 16.7 (203) Trucks 14.3 (175) Hotted up cars/modified cars 11.2 Vehicles accelerating rapidly 9.2 Squealing brakes 6.9 Engine revving 6.6 Car stereos/music from vehicles 3.3 Private cars 8.8 Motor bikes 6.7 Garbage trucks 2.8 Truck engine brakes 2.4 Air brakes 1.9 Buses 1.7 Police/ambulance/fire sirens 1.6 Any other kind of vehicle 1.5 Freeways/highways 1.5 Residential/local roads 1.2 Main roads/dual carriageway 1.0 Delivery vehicles/vans 1.0 Car horns 0.8 Car alarms 0.5 Main roads/single carriageway 0.2 Loose panels of loads on trucks 0.2 Any other kind of noise (specify) 4.5 *Multiple responses allowed General traffic noise was the source most commonly mentioned (in 16.7% of responses) as most annoying, followed by noise from trucks that was mentioned in 14.3% of responses. However the major source of noise annoyance could be described as a range of “anti-social” traffic behaviours, encompassing 482 out of a total of 1347 responses (35.8%) including:

Community Response to Environmental Noise Environment Protection Authority of Victoria
Strahan Research www.strahan-research.com.au
34
• Hotted up cars/modified cars (11.2% of responses [136 responses]) • Vehicles accelerating rapidly (9.2% [111]) • Squealing brakes (6.9% [84]) • Engine revving (6.6% [80]) • Car stereos/music from vehicles (3.3% [40]) • Hoon behaviour (31 responses under other category [60.8% of the category])
While road noise including freeways/highways (1.5%), residential/local roads (1.2%) and main roads/dual carriageway (1.0%) does not appear to be a major source of annoyance, it is possible that noise from vehicles using these types of roads were described as general traffic. Those who had complained about or reported a noise problem more than other groups tend to cite as sources of annoyance:
− Truck noise (22.4%) − Modified cars (27.9%) − Vehicles accelerating rapidly (27.9%)
Respondents living in metropolitan Melbourne (82.0%) and those aged 35-54 years (51.4%) more than others tend to cite vehicles accelerating rapidly as a source of annoyance.

Community Response to Environmental Noise Environment Protection Authority of Victoria
Strahan Research www.strahan-research.com.au
35
7.3 THE INTERFERENCE OF ROAD TRAFFIC WITH ASPECTS
OF HOME LIFE The respondents who were slightly to extremely annoyed by road traffic noise were asked: Does road traffic noise interfere with any of the following aspects of your home life? Table 11: Interference of Road Traffic Noise with Aspects of Home Life
Interference of road traffic with home life and activity at home disturbed
Responses
(%)
Very to
Extremely Annoyed
(Number of Responses)
Very to
Extremely Annoyed
(Percent of Responses)
Sleeping (n=234)
19.3
66
28.2
Reading, relaxing or other quiet activities (n=183)
15.1
57
30.9
Spending time outdoors at home (n=130)
10.7
46
35.4
Listening to TV, radio, music (n=108)
8.9
38
35.1
Having a conversation (including on the telephone) (n=81)
6.7
35
43.2
Concentrating or studying (n=79)
6.5
23
29.1
Entertaining (n=68)
5.6
28
41.2
*Multiple responses allowed Almost one in five respondent (19.3%) reported that road traffic noise interfered with their sleep. Of respondents who were very to extremely annoyed by traffic noise, a higher number reported sleep disturbance than any other aspect of home life disturbed. There were 225 respondents who’s level of annoyance was slight to extreme and reported sleep disturbance for road traffic noise (with a further 9 saying they were disturbed but rated the disturbance as “not at all” in the verbal rating question), and 66 of those said it was very to extremely annoying. Next most disturbed was reading, relaxing,

Community Response to Environmental Noise Environment Protection Authority of Victoria
Strahan Research www.strahan-research.com.au
36
or pursuing quiet activities 176 mentions, and a further 7 who had said this activity was disturbed but they were “not at all” annoyed.). The least disturbed activity at home, was entertaining 66 responses), possibly because when people entertain, they generate their own noise, so would not notice or be annoyed by road traffic. Respondents aged 18 to 34 years (23.1%) and those who had complained or reported a noise problem (30.3%) more than others said that traffic noise interfered with sleeping. Respondents living in metropolitan Melbourne (76.1%) and those who had complained or reported a noise problem (26.6%) more than others said that traffic noise interfered with reading, relaxing and quiet activities. Those who had complained or reported a noise problem (30.0%) more than others said that traffic noise interfered with spending time outdoors at home.

Community Response to Environmental Noise Environment Protection Authority of Victoria
Strahan Research www.strahan-research.com.au
37
7.4 IMPACT OF ROAD TRAFFIC NOISE AT SPECIFIC TIMES OF
THE DAY The respondents who said that they were annoyed by road traffic noise were asked: Does road traffic noise particularly bother, annoy or disturb you at home, at any of the following times during the week and the weekend? Table 12: Number of Respondents Disturbed by Road Traffic Noise at Particular Times of Day
Time of day *
During the week
(No. of respondents)
During the weekend (No. of respondents)
At the start of the day
240 191
Day
197 194
Evening
293 279
Night
298 309
*Multiple responses allowed
Road traffic noise clearly impacts on people throughout the day and night, regardless of whether it is a weekday or over the weekend, however, night time is when the greatest numbers of people are annoyed by traffic noise (during the week 298 respondents and weekend nights 309 respondents). Respondents were least annoyed by road traffic noise at the start of day over the weekend generating 191 mentions. People 55 years and over more than others tend to be annoyed by road traffic noise:
− At the start of the weekday (48.7%) − During the evening in the week (61.0%)
Those who more than others are annoyed by road traffic noise in the day during the week and on the weekend tend to be:
− Living in regional areas (45.0% and 44.2% respectively) − 55 years and over (46.5% and 42.3% respectively)
Those living in regional areas more than others tend to be annoyed by road traffic noise at the start of the day during the weekend (43.5%). Respondents who have complained or reported a traffic noise (55.4%) more than others tend to be annoyed during the evening on weekends.

Community Response to Environmental Noise Environment Protection Authority of Victoria
Strahan Research www.strahan-research.com.au
38
7.5 DISTURBANCE BY PARTICULAR TYPES OF ROAD
TRAFFIC NOISE – WEEKDAYS AND WEEKENDS Table 13: Disturbance Caused by Particular Road Traffic sources at Times of Day During the Week
Weekdays Specific road traffic noise sources *
Start of day
(% response3)
During
daytime (% response)
During evening
(% response)
During night (% response)
General traffic
51.6 (97) 44.6 (83) 59 (111) 59.9 (112)
Trucks 61.8 (102) 45.3 (73) 54.8 (91) 58.2 (96)
Private Cars 51.5 (51) 39.4 (39) 64.7 (66) 56.9 (58)
Motorbikes 47.9 (35) 43.8 (32) 58.7 (44) 54.1 (40)
Modified cars 32.4 (36) 29.1 (32) 55.3 (68) 62.4 (78)
Engine revving 36.8 (28) 32.9 (24) 66.7 (52) 70.1 (54)
Vehicles accelerating rapidly
26.4 (28) 27.9 (29) 56.1 (60) 63.6 (68)
Squealing brakes 35.8 (29) 39.7 (31) 65.9 (54) 69.9 (58)
*Multiple responses possible. Number in brackets denotes number of responses. Shaded cell shows the time of day when greatest number of respondents affected by each specific noise source.
Respondents are most annoyed by specific road traffic noise sources at different times during the week and on weekends. The most respondents are annoyed at night during the week by:
• Engine revving (70.1%) • Squealing brakes (69.9%) • Vehicles accelerating rapidly (63.6%) • Modified cars (62.4%) • General traffic (59.9%)
At the start of weekdays truck noise (61.8%) is mentioned most as annoying or disturbing 3 Percent response is calculated from the number of respondents who said they were annoyed by a specific road traffic noise source at a particular time of the week day as a proportion of the total number of respondents who were annoyed by the specific road traffic noise source.

Community Response to Environmental Noise Environment Protection Authority of Victoria
Strahan Research www.strahan-research.com.au
39
Table 14: Disturbance Caused by Particular Road Traffic sources at Times of Day During the Weekend
Weekends Specific road traffic noise sources *
Start of day (% response4)
During daytime (% response)
During evening
(% response)
During night (% response)
General traffic
41.5 (76) 44 (80) 51.9 (95) 57.3 (106)
Trucks 43.1 (69) 38 (60) 44.1 (71) 47.5 (77)
Private Cars 36.7 (36) 35.4 (35) 50 (51) 53.4 (55)
Motorbikes 48.6 (35) 49.3 (36) 61 (47) 57.3 (43)
Modified cars 30.6 (34) 31.5 (35) 55.5 (71) 74 (94)
Engine revving 42.7 (32) 35.1 (26) 64.1 (50) 75.6 (59)
Vehicles accelerating rapidly
31.1 (33) 29.5 (31) 61.1 (66) 73.1 (79)
Squealing brakes 35.8 (29) 36.3 (29) 61.4 (51) 75.9 (63)
*Multiple responses possible. Number in brackets denotes number of responses. Shaded cell shows the time of day when greatest number of respondents affected by noise source. Weekend nights is the time when the largest number of respondents say that all noise sources, except motorbikes are annoying or disturbing. It appears that there may a relationship between the time of day and the type of road traffic noise that is cited as annoying. However the relationship is unclear and further research is required to clarify it.
4 Percent response is calculated from the number of respondents who said they were annoyed by a specific road traffic noise source at a particular time of the weekend as a proportion of the total number of respondents who were annoyed by the specific road traffic noise source.

Community Response to Environmental Noise Environment Protection Authority of Victoria
Strahan Research www.strahan-research.com.au
40
8. NEIGHBOURS’ NOISE 8.1 ANNOYANCE CAUSED BY NOISE FROM NEIGHBOURS The respondents were asked: Thinking about the last 12 months or so when you are here at home, how much does noise from neighbours bother, disturb or annoy you? Table 15: Extent Neighbour Noise Bothers, Disturbs or Annoys Respondent (Verbal Scale) Verbal scale for neighbours’ noise annoyance
Respondents %
n=1213
Not at all 27.2 Slightly 14.9 Moderately 6.8 Very 3.9 Extremely 3.9 Don’t know .1 Don’t hear 43.2 Over a quarter of respondents (27.2%) say they are not at all disturbed by neighbour noise. One in seven respondents (14.6%) say that neighbour noise is moderately to extremely annoying. Over four in ten respondents (43.2%) say that they do not hear neighbour noise. Respondents who have complained about or reported noise (37.7%) more than other groups say that they are moderately to extremely annoyed by neighbour noise

Community Response to Environmental Noise Environment Protection Authority of Victoria
Strahan Research www.strahan-research.com.au
41
Respondents who heard neighbour noise were asked: Thinking about the last 12 months or so, what number from 0-10 best shows how much you are bothered, disturbed or annoyed by noise from neighbours when you are here at home. If you are not at all annoyed choose 0; if you are extremely annoyed choose 10. If you are somewhere in between, choose a number between 0 and 10. Table 16: Extent Neighbour Noise Bothers, Disturbs or Annoys Respondent (Numerical Scale) Numerical scale for neighbours’ noise annoyance
Respondents %
n=690
0 (not at all annoyed) 40.0 1 9.4 2 11.2 3 9.3 4 4.1 5 5.2 6 3.6 7 5.1 8 4.8 9 2.5 10 (extremely annoyed) 4.9 Four out of ten respondents (40.0% or 276 respondents) rated were not at all annoyed by neighbour noise while 20.9% of the respondents scored annoyance generated by neighbour’s noise at six out of ten or more.

Community Response to Environmental Noise Environment Protection Authority of Victoria
Strahan Research www.strahan-research.com.au
42
8.2 PARTICULAR TYPES OF NEIGHBOURS’ NOISE Respondents who were slightly to extremely annoyed by neighbour noise were asked: Over the last 12 months or so when you are here at home are there any particular types noise from neighbours that bother, disturb or annoy you? (unprompted) Table 17: Particular Types of Neighbour Noise Reported Unprompted report of particular noise from neighbours *
Responses%
TV, music or radio
10.7
Dogs
8.7
Parties
6.8
Noisy neighbours – inside their homes
5.2
Noisy neighbours – nearby outdoors
5.2
Cars, motorcycles starting up/leaving
4.7
Children’s voices/playing
3.4
Power tools, hammering, drilling
3.3
Lawnmowers or other garden equipment
3.1
Domestic equipment 0.8
Other animals/pets
0.7
Residential air conditioners
0.6
Repairs to cars/motorbikes
0.4
Other people nearby
0.2
Footsteps
0.2
Burglar alarms
0.1
Any other kind of noise from neighbours
3.9
*Multiple responses allowed

Community Response to Environmental Noise Environment Protection Authority of Victoria
Strahan Research www.strahan-research.com.au
43
The most commonly reported annoying neighbour noise (10.7%) is TV, music or radio noise with 130 respondents mentioning it, followed by noisy dogs (8.7%) mentioned by 106 respondents. The third most commonly mentioned source of noise is from parties (6.8%). Noisy neighbours both inside and outside their homes (5.2%) are also an important source of annoying neighbour noise. While 57 (4.7%) respondents mentioned cars or motorcycles starting up or leaving as a problem, if other vehicle noises which fell into the category “other”, were added in, it increased to 5.3% of the respondents. Other vehicle noise included trucks, tractors, boat engines, or people doing wheelies. The 3.9% (46) of respondents constituting “other” neighbour noise was predominantly noise related to anti-social behaviour, with 24 of the 46 people (52.2% of the “other”) saying that behaviour like drunkenness, swearing, domestic violence, and yelling were disturbing them. The “other” category also included building, renovation or construction noise, with 7 respondents of the 46 saying this was an annoying source of noise for them. Those who more than others cited TV, music and radios as a source of annoying neighbour noise tend to be:
− Respondents who had reported or complained about a noise (37.7%) − Those living in the Melbourne metropolitan area (76.2%) − Respondents aged 18-34 years (27.7%)
Those who more than others cited parties as a source of annoying neighbour noise tend to be:
− Respondents who had reported or complained about a noise (36.6%) − People living in the Melbourne metropolitan area (78.0%)
Those who more than others cited dogs as a source of annoying neighbour noise tend to be:
− Respondents who had reported or complained about a noise (28.3%) − Those living in regional areas of Victoria (38.7%)

Community Response to Environmental Noise Environment Protection Authority of Victoria
Strahan Research www.strahan-research.com.au
44
8.3 THE INTERFERENCE OF NEIGHBOURS’ NOISE WITH
ASPECTS OF HOME LIFE The respondents who were slightly to extremely annoyed by neighbour noise were asked: Does noise from neighbours interfere with any of the following aspects of your home life? Table 18: Interference of Neighbour Noise with Aspects of Home Life
Interference of neighbours’ noise with home life and activity at home disturbed
Responses
(%)
Very to
Extremely Annoyed
(Number of Responses)
Very to
Extremely Annoying
(Percent of Responses)
Sleeping (n=184)
15.1
69
37.3
Reading, relaxing or other quiet activities (n=158)
13.0
68
42.8
Spending time outdoors at home (n=117)
9.6
52
44.4
Listening to TV, radio, music (n=98)
8.1
58
69.2
Concentrating or studying (n=80)
6.6
48
60.1
Entertaining (n=71)
5.9
43
60.5
Having a conversation (including on the telephone) (n=68)
5.6
42
61.8
*Multiple responses allowed Of respondents who were very to extremely annoyed by neighbour noise, a higher number reported noise interfered with sleeping than any other aspect of home life. The next most disturbed activity at home was reading, relaxing or quiet activities with 151 respondents who rated annoyance as slight to extreme, and 68 of those said very to extremely annoying.

Community Response to Environmental Noise Environment Protection Authority of Victoria
Strahan Research www.strahan-research.com.au
45
The least disturbed activity was having a conversation, however there were still 67 respondents who were annoyed by neighbour noise and said this noise source inferred with conversation. Respondents who were more likely than others to say that their sleep and their reading, relaxing and quiet activities were disturbed by neighbour noise tend to be:
− Those who have reported or complained about a noise (43.8% and 44.0% respectively)
− Residents of the Melbourne metropolitan area (74.1% and 78.6% respectively) − Those aged 35 to 54 years (22.7% and 59.1%) and 35 to 54 years (53.5% in
relation to sleep only) Those who were more likely than others to say that spending time outdoors was disturbed by neighbour noise tend to:
− Have reported or complained about a noise (43.6%) − Aged 35 to 54 years (58.1%)

Community Response to Environmental Noise Environment Protection Authority of Victoria
Strahan Research www.strahan-research.com.au
46
8.4 IMPACT OF NEIGHBOURS’ NOISE AT SPECIFIC TIMES OF
THE DAY The respondents who said that they were annoyed by neighbour noise were asked: Does noise from neighbours particularly bother, annoy or disturb you at home, at any of the following times during the week and the weekend?
Table 19: Number of Respondents Disturbed by Neighbour Noise at Particular Times of Day Time of day * During the week
(No. of respondents)
During the weekend (No. of respondents)
At the start of the day
118 134
Day
130 175
Evening
157 194
Night
165 216
*Multiple responses allowed
Directly comparing corresponding times of day, neighbour noise is overall more disturbing at the weekends than during the week. The peak time respondents say they are disturbed by this type of noise is at night over the weekends, when 216 respondents say they are disturbed. Respondents who more than others are annoyed by neighbour noise at the start of the week day or the weekend tend to be those who:
− Have complained about or reported noise (37.3% and 45.8% respectively) − Live in regional areas of Victoria (35.5% and 44.2% respectively)
Respondents who more than others are annoyed by neighbour noise during the week day and weekend tend to be those who:
− Live in regional areas of Victoria (44.1% and 51.6% respectively) − Are aged 55 years and over (39.7% and 50.4% respectively)
Respondents who more than others are annoyed by neighbour noise during the evening in the week and on the weekend tend to be those who:
− Have complained or reported a noise (44.5% and 55.1% respectively) − Are aged 55 years and over (46.2% and 53.0% respectively)

Community Response to Environmental Noise Environment Protection Authority of Victoria
Strahan Research www.strahan-research.com.au
47
Respondents who have complained or reported a noise more than others tend to be disturbed by neighbour noise at night during the week (55.5%) and on the weekend (63.6%).

Community Response to Environmental Noise Environment Protection Authority of Victoria
Strahan Research www.strahan-research.com.au
48
9. TRAMS OR TRAIN NOISE 9.1 ANNOYANCE CAUSED BY NOISE FROM TRAMS OR
TRAINS The respondents were asked: Thinking about the last 12 months or so when you are here at home, how much does tram or train noise bother, disturb or annoy you? Table 20: Extent Tram or Train Noise Bothers, Disturbs or Annoys Respondent (Verbal Scale)
Verbal scale for tram or train noise annoyance
Respondents %
n=1213
Not at all 24.3 Slightly 6.0 Moderately 1.5 Very 0.6 Extremely 0.5 Don’t know 0.1 Don’t hear 66.9 Almost a quarter of respondents (24.3%) say that tram or train noise does not bother them at all, and a further 66.9% (811) of respondents say they don’t hear this type of noise. A very small number of respondents, 31 (2.6%) describe the annoyance from tram and train noise as moderate to extreme.

Community Response to Environmental Noise Environment Protection Authority of Victoria
Strahan Research www.strahan-research.com.au
49
The respondents who heard tram or train noise were asked: Thinking about the last 12 months or so, what number from 0-10 best shows how much you are bothered, disturbed or annoyed by tram or train noise when you are here at home. If you are not at all annoyed choose 0; if you are extremely annoyed choose 10. If you are somewhere in between, choose a number between 0 and 10. Table 21: Extent Tram or Train Noise Bothers, Disturbs or Annoys Respondent (Numerical Scale)
Numerical scale for tram or train noise annoyance
Respondents %
n=400
0 (not at all annoyed) 66.0 1 9.8 2 7.5 3 5.5 4 4.0 5 3.3 6 0.5 7 1.3 8 0.8 9 0.3 10 (extremely annoyed) 1.3 Excluding those who do not hear tram or train noise, two thirds (66%) of respondents are not at all annoyed by it and only 4.2% (16 respondents) rated their annoyance at six out of ten or greater.

Community Response to Environmental Noise Environment Protection Authority of Victoria
Strahan Research www.strahan-research.com.au
50
9.2 PARTICULAR TYPES OF TRAM OR TRAIN NOISE Respondents who were moderately to extremely annoyed by tram or train noise were asked: Over the last 12 months or so when you are here at home are there any particular types of tram or train noise that bother, disturb or annoy you? (unprompted) Table 22: Particular Types of Tram or Train Noise Reported
Unprompted report of particular noise from trams or trains *
Responses %
Passenger trains
4.9
Goods/freight trains
2.5
Trams
2.1
Trams rattling along
1.2
Train horns
1.2
Crossing bells
0.7
Tram wheels squealing
0.6
Rail yards/goods yards (shunting, freight handling)
0.4
Tram bell
0.3
Idling locomotives
0.2
Railway track maintenance
0.2
Other types of tram/train noise
0
*Multiple responses allowed The tram or train noise most commonly mentioned by respondents was passenger trains, which annoys 4.9% (or 60) of the respondents. Goods or freight trains disturbs 30 respondents (2.5%), and trams bother 2.1% (26) of respondents.

Community Response to Environmental Noise Environment Protection Authority of Victoria
Strahan Research www.strahan-research.com.au
51
9.3 THE INTERFERENCE OF TRAM OR TRAIN NOISE WITH
ASPECTS OF HOME LIFE The respondents who were moderately to extremely annoyed by tram or train noise were asked: Does noise from trams or trains interfere with any of the following aspects of your home life? Table 23: Interference of Tram or Train Noise with Aspects of Home Life
Interference of tram or train noise with home life *
Respondents %
Sleeping
1.6
Reading, relaxing or other quiet activities
1.3
Concentrating or studying
0.7
Listening to TV, radio, music
0.9
Spending time outdoors at home
0.8
Entertaining
0.6
Having a conversation (including on the telephone)
0.6
*Multiple responses allowed As with traffic and neighbour noise, the aspect of home life most disturbed by trams and trains, is sleep, however, the magnitude of respondents affected by trams or trains is very small (1.6%, or 20 respondents). The aspect of home life least disturbed by this noise source is the ability to have a conversation (0.6% or 7 respondents).

Community Response to Environmental Noise Environment Protection Authority of Victoria
Strahan Research www.strahan-research.com.au
52
9.4 IMPACT OF TRAM OR TRAIN NOISE AT SPECIFIC TIMES
OF THE DAY The respondents who were moderately to extremely annoyed by tram or train noise were asked: Does noise from trams or train particularly bother, annoy or disturb you at home, at any of the following times during the week and the weekend?
Table 24: Number of Respondents Disturbed by Tram or Train Noise at Particular Times of Day Time of day * During the week
(No. of Respondents)
During the weekend (No. of Respondents)
At the start of the day
26 25
Day
16 18
Evening
19 19
Night
24 20
*Multiple responses allowed
The predominant time when tram and train noise disturbs respondents is at the start of the day, both during the week, and at weekends with over three quarters of respondents (26 and 25 respondents respectively) mentioning this in each instance. The time of day that was least mentioned where annoyance resulting from the noise was experienced was during the week in the day (16 respondents say this).

Community Response to Environmental Noise Environment Protection Authority of Victoria
Strahan Research www.strahan-research.com.au
53
10. AIRCRAFT NOISE 10.1 ANNOYANCE CAUSED BY NOISE FROM AIRCRAFT The respondents were asked: Thinking about the last 12 months or so when you are here at home, how much does aircraft noise bother, disturb or annoy you? Table 25: Extent Aircraft Noise Bothers, Disturbs or Annoys Respondent (Verbal Scale) Verbal scale for aircraft noise annoyance
Respondents %
n=1213
Not at all 42.2 Slightly 12.1 Moderately 3.6 Very 1.4 Extremely 1.2 Don’t hear 39.1 Over four in ten respondents (42.2% or 512) said they were not at all annoyed by aircraft noise, while 6.2% say that this source of noise is moderately to extremely annoying. Almost four in ten (39.1%) of respondents say they never hear aircraft noise.

Community Response to Environmental Noise Environment Protection Authority of Victoria
Strahan Research www.strahan-research.com.au
54
The respondents who heard aircraft noise were asked: Thinking about the last 12 months or so, what number from 0-10 best shows how much you are bothered, disturbed or annoyed by aircraft noise when you are here at home. If you are not at all annoyed choose 0; if you are extremely annoyed choose 10. If you are somewhere in between, choose a number between 0 and 10. Table 26: Extent Aircraft Noise Bothers, Disturbs or Annoys Respondent (Numerical Scale)
Numerical scale for aircraft noise annoyance
Respondents %
n=739
0 (not at all annoyed) 60.4 1 13.9 2 7.6 3 5.0 4 3.0 5 2.8 6 2.2 7 0.5 8 2.8 9 0.9 10 (extremely annoyed) 0.8 Six out of ten (60.4%, or 446 respondents) said that they were not at all annoyed by aircraft noise, while 7.2% (54 people) rated the level of annoyance as six out of ten or more.

Community Response to Environmental Noise Environment Protection Authority of Victoria
Strahan Research www.strahan-research.com.au
55
10.2 PARTICULAR TYPES OF AIRCRAFT NOISE Respondents who were moderately to extremely annoyed by aircraft noise were asked: Over the last 12 months or so when you are here at home are there any particular types of aircraft noise that bother, disturb or annoy you? (unprompted) Table 27: Particular Types of Aircraft Noise Reported Unprompted report of particular noise from aircraft *
Responses
(%)
Helicopters
10.6
Commercial airlines
9.8
Light aircraft
6.7
Military aircraft
0.8
Glider towing
0.1
Ground running
0
Pilot training
0
Other types of aircraft noise
1.3
*Multiple responses allowed Over one in ten respondents mentioned helicopters as an annoying source of aircraft noise (10.6% of respondents), followed by commercial airlines with 9.8% mentioning that specific noise source (119 respondents). Light aircraft were the third commonest aircraft mentioned as annoying, affecting 81 respondents. In the group mentioning “other” sources, there were 16 responses of which 50% cited recreational craft as being annoying. Specific aircraft such as model aeroplanes, stunt planes, paragliders and the MCG blimp were mentioned amongst this group. Three respondents mentioned jets under the category of other, as being annoying.

Community Response to Environmental Noise Environment Protection Authority of Victoria
Strahan Research www.strahan-research.com.au
56
10.3 THE INTERFERENCE OF AIRCRAFT NOISE WITH
ASPECTS OF HOME LIFE The respondents who were moderately to extremely annoyed by aircraft noise were asked: Does noise from aircraft interfere with any of the following aspects of your home life? Table 28: Interference of Aircraft Noise with Aspects of Home Life Interference of aircraft noise with home life *
Responses
(%)
Reading, relaxing or other quiet activities
3.5
Listening to TV, radio, music
3.1
Sleeping
2.6
Spending time outdoors at home
2.6
Having a conversation (including on the telephone)
2.3
Concentrating or studying
1.9
Entertaining
1.9
*Multiple responses allowed Reading, relaxing, or quiet activities, (3.5%) and listening to TV, radio and music (3.1%) are the two main activities cited by a small number of respondents as affected by aircraft noise.

Community Response to Environmental Noise Environment Protection Authority of Victoria
Strahan Research www.strahan-research.com.au
57
10.4 IMPACT OF AIRCRAFT NOISE AT SPECIFIC TIMES OF THE
DAY The respondents who were moderately to extremely annoyed by aircraft noise were asked: Does noise from aircraft particularly bother, annoy or disturb you at home, at any of the following times during the week and the weekend? Table 29: Number of Respondents Disturbed by Aircraft Noise at Particular Times of Day Time of day *
During the week (No. of Respondents)
During the weekend
(No. of Respondents)
At the start of the day
22 22
Day
28 42
Evening
28 32
Night
33 31
*Multiple responses allowed
Daytime over weekends is when the greatest number of respondents say aircraft noise annoys them (42 respondents), with the smallest proportion of respondents saying aircraft noise annoys them at the start of the day, both during the week (22) and over weekends (22).

Community Response to Environmental Noise Environment Protection Authority of Victoria
Strahan Research www.strahan-research.com.au
58
11. NOISE FROM FACTORIES OR INDUSTRY 11.1 ANNOYANCE CAUSED BY NOISE FROM FACTORIES OR
INDUSTRY The respondents were asked: Thinking about the last 12 months or so when you are here at home, how much does factory or industry noise bother, disturb or annoy you? Table 30: Extent Factory or Industry Noise Bothers, Disturbs or Annoys Respondent (Verbal Scale) Verbal scale for factory or industry noise annoyance
Respondents %
n=1213
Not at all 7.0 Slightly 1.4 Moderately 0.7 Very 0.2 Extremely 0.2 Don’t know 0.1 Don’t hear 90.4 The vast majority of those interviewed (90.4% or 1096 respondents) say they don’t hear factory or industrial noise, and a further 7% (85) say they are not at all annoyed by it. Only about one in one hundred (1.1% or 13 respondents) reported moderate to extreme annoyance from this noise source.

Community Response to Environmental Noise Environment Protection Authority of Victoria
Strahan Research www.strahan-research.com.au
59
The respondents who heard factory or industry noise were asked: Thinking about the last 12 months or so, what number from 0-10 best shows how much you are bothered, disturbed or annoyed by factory or industry noise when you are here at home. If you are not at all annoyed choose 0; if you are extremely annoyed choose 10. If you are somewhere in between, choose a number between 0 and 10. Table 31: Extent Factory or Industry Noise Bothers, Disturbs or Annoys Respondent (Numerical Scale) Numerical scale for factory or industry noise annoyance
Respondents %
n=115
0 (not at all annoyed) 69.6 1 5.2 2 5.2 3 4.3 4 5.2 5 6.1 6 0 7 0 8 1.7 9 1.7 10 (extremely annoyed) 0.9 Of those respondents who heard factory noise, 69.6% or 80 respondents rated it as not at all annoying while 4.3 % or 5 respondents rated their annoyance at six out of ten or more.

Community Response to Environmental Noise Environment Protection Authority of Victoria
Strahan Research www.strahan-research.com.au
60
11.2 PARTICULAR TYPES OF FACTORY OR INDUSTRY NOISE Respondents who were moderately to extremely annoyed by factory or industry noise were asked: Over the last 12 months or so when you are here at home are there any particular types of factory or industry noise that bother, disturb or annoy you? (unprompted) Table 32: Particular Types of Factory or Industry Noise Reported
Unprompted report of particular noise from factories or industry *
Responses %
Trucks loading/unloading deliveries
0.8
Machinery noise
0.7
Humming roaring noise
0.6
Continuous noise
0.5
Reversing beepers
0.3
Moving, collecting or dropping waste bins
0.2
Workers’ voices
0
Other types of factory or industry noise
1.0
*Multiple responses allowed
Factory or industry noise does not annoy very many respondents at all, the greatest number mentioning trucks loading or unloading deliveries (0.8% or 8 respondents) as being annoying. The “other” types of noise comprised just 12 respondents.

Community Response to Environmental Noise Environment Protection Authority of Victoria
Strahan Research www.strahan-research.com.au
61
11.3 INTERFERENCE OF FACTORY OR INDUSTRY NOISE WITH
ASPECTS OF HOME LIFE The respondents who were moderately to extremely annoyed by factory or industry noise were asked: Does noise from factories or industry interfere with any of the following aspects of your home life? Table 33: Interference of Factory or Industry Noise with Aspects of Home Life
Interference of factory or industry noise with home life *
Responses
(%)
Sleeping
0.7
Reading, relaxing or other quiet activities
0.5
Spending time outdoors at home
0.5
Entertaining
0.3
Listening to TV, radio, music
0.3
Concentrating or studying
0.3
Having a conversation (including on the telephone)
0.2
*Multiple responses allowed A very small number of respondents said that any aspects of home life were disturbed by factory or industry noise. Sleep was cited by the most respondents (0.7% or 8 mentions) as being disturbed by this category of noise.

Community Response to Environmental Noise Environment Protection Authority of Victoria
Strahan Research www.strahan-research.com.au
62
11.4 IMPACT OF FACTORY OR INDUSTRY NOISE AT SPECIFIC
TIMES OF THE DAY The respondents who were moderately to extremely annoyed by factory or industry were asked: Does noise from factories or industry particularly bother, annoy or disturb you at home, at any of the following times during the week and the weekend?
Table 34: Number of Respondents Disturbed by Factory or Industry Noise at Particular Times of Day Time of day *
During the week (No. of Respondents)
During the weekend
(No. of Respondents)
At the start of the day
4 4
Day
5 4
Evening
3 2
Night
6 5
* Multiple responses allowed
Night time during the week is when most respondents are annoyed by factory or industry noise (6 respondents).

Community Response to Environmental Noise Environment Protection Authority of Victoria
Strahan Research www.strahan-research.com.au
63
11.5 LOCATION OF RESPONDENTS ANNOYED BY FACTORY NOISE
Table 35: Location of Respondents Disturbed Annoyed or Bothered by Factory or Industry Noise
Pcode No. in
Sample Suburb No.
Disrupted
3012 8 BROOKLYN, KINGSVILLE, KINGSVILLE WEST, MAIDSTONE, TOTTENHAM, WEST FOOTSCRAY 3
3015 7 NEWPORT, SOUTH KINGSVILLE, SPOTSWOOD 1
3020 6 ALBION, GLENGALA, SUNSHINE, SUNSHINE NORTH, SUNSHINE WEST 1
3031 5 FLEMINGTON, KENSINGTON 2
3058 6 BATMAN, COBURG, COBURG NORTH, MERLYNSTON, MORELAND 1
3068 5 CLIFTON HILL, FITZROY NORTH 1
3079 6 IVANHOE, IVANHOE EAST, IVANHOE NORTH 2
3084 10 BANYULE, EAGLEMONT, HEIDELBERG, ROSANNA, VIEWBANK 1
3115 2 WONGA PARK 1
3130 10 BLACKBURN, BLACKBURN NORTH, BLACKBURN SOUTH, LABURNUM 1
3135 6 BEDFORD ROAD, HEATHMONT, RINGWOOD EAST 1
3150 15 GLEN WAVERLEY, WHEELERS HILL 1
3168 2 CLAYTON, NOTTING HILL 1
3175 7 BANGHOLME, DANDENONG, DANDENONG EAST, DANDENONG NORTH, DANDENONG SOUTH, DUNEARN 1
3178 7 ROWVILLE 1
3190 3 HIGHETT 1
3214 4 CORIO, NORLANE, NORTH SHORE 1
3219 4 BREAKWATER, EAST GEELONG, NEWCOMB, ST ALBANS PARK, THOMSON, WHITTINGTON 1
3380 1 BELLELLEN, BRIDGE INN, MOKEPILLY, STAWELL, STAWELL WEST, WINJALLOK 1
3672 4 BENALLA, BENALLA WEST 1
3825 3
ABERFELDY, AMOR, CARINGAL, COALVILLE, COOPERS CREEK, ERICA, FUMINA, FUMINA SOUTH, HERNES OAK, HILL END, JACOB CREEK, MOE, MOE SOUTH, MOONDARRA, NEWBOROUGH, NEWBOROUGH EAST, RAWSON, TANJIL, TANJIL SOUTH, THALOO, THOMSON, WALHALLA, WESTBURY, WILLOW GROVE, YALLOURN, YALLOURN NORTH 1
3844 6
BLACKWARRY, CALLIGNEE, CALLIGNEE NORTH, CARRAJUNG, FLYNN, FLYNNS CREEK, KOORNALLA, LOY YANG, TRARALGON, TRARALGON EAST, TRARALGON SOUTH, TYERS, WILLUNG SOUTH 1
3937 1 RED HILL, RED HILL SOUTH 1
3953 1
BERRYS CREEK, BOOROOL, HALLSTON, KOOROOMAN, LEONGATHA, LEONGATHA NORTH, LEONGATHA SOUTH, MARDAN, MOUNT ECCLES, MOUNT ECCLES SOUTH, NERRENA, RUBY, TRIDA, WILD DOG VALLEY 1
3996 1 INVERLOCH, POUND CREEK 1
A small number of respondents in a wide variety of metropolitan and regional locations say that they are annoyed by factory noise.

Community Response to Environmental Noise Environment Protection Authority of Victoria
Strahan Research www.strahan-research.com.au
64
12. NOISE FROM SHOPS OR OTHER BUSINESSES 12.1 ANNOYANCE CAUSED BY NOISE FROM SHOPS OR
OTHER BUSINESSES The respondents were asked: Thinking about the last 12 months or so when you are here at home, how much does shop or other business noise bother, disturb or annoy you? Table 36: Extent shop or Other Business Noise Bothers, Disturbs or Annoys Respondent (Verbal Scale)
Verbal scale for shop or business noise annoyance
Respondents %
n=1213
Not at all 7.7 Slightly 1.8 Moderately 0.2 Very 0.2 Extremely 0.2 Don’t know 0.1 Don’t hear 89.8 Almost nine out of ten respondents do not hear noise from shops or other businesses (89.8% or 1089 respondents). There were 93 respondents (7.7%) who say they are not at all bothered by noise from shops or other businesses. Less than one in one hundred respondents (0.6%) or 7 respondents) say they are moderately to extremely annoyed by noise from shops or businesses.

Community Response to Environmental Noise Environment Protection Authority of Victoria
Strahan Research www.strahan-research.com.au
65
The respondents who heard shop or other business noise were asked: Thinking about the last 12 months or so, what number from 0-10 best shows how much you are bothered, disturbed or annoyed by shop or business noise when you are here at home. If you are not at all annoyed choose 0; if you are extremely annoyed choose 10. If you are somewhere in between, choose a number between 0 and 10. Table 37: Extent shop or Other Business Noise Bothers, Disturbs or Annoys Respondent (Numerical Scale) Numerical scale for shop or business noise annoyance
Respondents %
n=123
0 (not at all annoyed) 76.4 1 4.9 2 4.1 3 4.1 4 1.6 5 4.1 6 1.6 7 0 8 1.6 9 0.8 10 (extremely annoyed) 0.8 Over three quarters of respondents who hear shop or other business noise, say it is not at all annoying (rating it at 0 on numerical scale), while 4.8% (6 respondents) rate annoyance from shop or business noise at six out of ten or greater.

Community Response to Environmental Noise Environment Protection Authority of Victoria
Strahan Research www.strahan-research.com.au
66
12.2 PARTICULAR TYPES OF SHOP OR OTHER BUSINESS NOISE
Respondents who were moderately to extremely annoyed by shop or other business noise were asked: Over the last 12 months or so when you are here at home are there any particular types of shop or business noise that bother, disturb or annoy you? (unprompted) Table 38: Particular Types of Shop or Other Business Noise Reported
Unprompted report of particular noise from shops or other businesses *
Responses
(%)
Trucks/deliveries/unloading/loading
0.5
Waste collection
0.2
Cars in car parks
0.2
Public address systems
0.2
Air conditioning or refrigeration or exhaust fans – continual machinery noise
0
Other types of shop or other business noise
1.2
* Multiple responses allowed
Of the small number of respondents who are moderately to extremely annoyed by shop or other business noise, most of them (0.5% or 6 respondents) cited trucks loading or unloading. In specifying “Other types of shop or other business noise”, “ people” noise was mentioned by 4 respondents, which included kids at shops, girls’ voices, and yahoos hanging around.

Community Response to Environmental Noise Environment Protection Authority of Victoria
Strahan Research www.strahan-research.com.au
67
12.3 INTERFERENCE OF SHOP OR OTHER BUSINESS NOISE
WITH ASPECTS OF HOME LIFE The respondents who were moderately to extremely annoyed by shop or other business noise were asked: Does noise from shops or other businesses interfere with any of the following aspects of your home life? Table 39: Interference of shop or Other Business Noise with Aspects of Home Life
Interference of shop or business noise with home life *
Responses
(%)
Sleeping
0.5
Reading, relaxing or other quiet activities
0.5
Concentrating or studying
0.3
Entertaining
0.2
Listening to TV, radio, music
0.2
Spending time outdoors at home
0.2
Having a conversation (including on the telephone)
0.1
*Multiple responses allowed Although an extremely small number of respondents were affected (6 in each case), sleeping; and reading, relaxing, and quiet activities, were the two activities that the largest number cited as being interfered with by this noise source.

Community Response to Environmental Noise Environment Protection Authority of Victoria
Strahan Research www.strahan-research.com.au
68
12.4 IMPACT OF SHOP OR BUSINESS NOISE AT SPECIFIC
TIMES OF THE DAY The respondents who were moderately to extremely annoyed by shop or other business noise were asked: Does noise from shops or other businesses particularly bother, annoy or disturb you at home, at any of the following times during the week and the weekend? Table 40: Number of Respondents Disturbed by Shop or Other Business Noise at Particular Times of Day Time of day *
During the week (No. of Respondents)
During the weekend
(No. of Respondents)
At the start of the day
6 3
Day
5 4
Evening
5 5
Night
5 5
*Multiple responses allowed More respondents complained of this noise at the start of the day during the week (6 respondents) than other times, however there were also 5 mentions of annoyance during the evening and night time over weekends as well as night time during the week.

Community Response to Environmental Noise Environment Protection Authority of Victoria
Strahan Research www.strahan-research.com.au
69
13. CONSTRUCTION ACTIVITY NOISE 13.1 ANNOYANCE CAUSED BY NOISE FROM CONSTRUCTION
ACTIVITIES The respondents were asked: Thinking about the last 12 months or so when you are here at home, how much does construction noise bother, disturb or annoy you? Table 41: Extent Construction Noise Bothers, Disturbs or Annoys Respondent (Verbal Scale) Verbal scale for construction noise annoyance
Respondents %
n=1213
Not at all 17.5 Slightly 8.8 Moderately 4.6 Very 1.9 Extremely 1.5 Don’t hear 65.6 Nearly two thirds of respondents (65.6%) do not ever hear construction noise (796 respondents) and over one in six respondents (17.5% or 212) say they are not at all annoyed by it. Less than one in ten respondents (8% or 97 respondents) say they are moderately to extremely annoyed by construction noise. Respondents who more than others say that they are not annoyed at all by construction noise tend to:
− Live in regional areas of Victoria (21.5%) − Be aged 55 years and over (21.0%)
Those who have complained about or reported a noise problem more than other groups say that they are slightly (14.2%) and moderately to extremely annoyed (14.2%) by construction noise

Community Response to Environmental Noise Environment Protection Authority of Victoria
Strahan Research www.strahan-research.com.au
70
The respondents who hear construction noise were asked: Thinking about the last 12 months or so, what number from 0-10 best shows how much you are bothered, disturbed or annoyed by construction noise when you are here at home. If you are not at all annoyed choose 0; if you are extremely annoyed choose 10. If you are somewhere in between, choose a number between 0 and 10. Table 42: Extent Construction Noise Bothers, Disturbs or Annoys Respondent (Numerical Scale) Numerical scale for construction noise annoyance
Respondents %
n=414
0 (not at all annoyed) 46.6 1 10.9 2 8.0 3 8.7 4 6.3 5 6.0 6 2.9 7 2.7 8 4.6 9 1.4 10 (extremely annoyed) 1.9 Excluding respondents who do not hear construction noise, almost half (46.6%) say they are not at all annoyed by construction noise. Just over one in eight respondents (13.5% or 56 respondents) who hear construction noise rate their annoyance with it at six or greater.

Community Response to Environmental Noise Environment Protection Authority of Victoria
Strahan Research www.strahan-research.com.au
71
13.2 PARTICULAR TYPES OF CONSTRUCTION NOISE Respondents who were moderately to extremely annoyed by construction noise were asked: Over the last 12 months or so when you are here at home are there any particular types of construction noise that bother, disturb or annoy you? (unprompted) Table 43: Particular Types of Construction Noise Reported
Unprompted report of particular noise from construction activities *
Responses
(%)
Building or renovating neighbours/other people’s homes
11.1
Building or renovating commercial or industrial buildings
3.1
Road works – construction, repair, maintenance
2.1
Rail track construction or maintenance
0.1
Tram track maintenance
0
Other types of construction noise
2.6
*Multiple responses allowed
The predominant specific construction noise reported by respondents was building or renovating noise at neighbours or other homes (11.1% or 135 responses). In addition 3.1% (38) responses cited building or renovation of commercial buildings as annoying. Thirty two responses (2.6%) mentioned specific other construction noises, and half of these (16 responses) were described as machinery noise, such as jack hammering, saws, concrete pumps, pneumatic drills and hammering. There were also 8 mentions of vehicle noise related to construction activities. Respondents who more than other groups say that neighbours building and renovating annoyed them tend to be:
− Those who complained about or reported a noise problem (33.3%) − Living in metropolitan Melbourne (73.3%)

Community Response to Environmental Noise Environment Protection Authority of Victoria
Strahan Research www.strahan-research.com.au
72
13.3 INTERFERENCE OF CONSTRUCTION ACTIVITY NOISE
WITH ASPECTS OF HOME LIFE The respondents who were moderately to extremely annoyed by construction noise were asked: Does noise from construction activities interfere with any of the following aspects of your home life? Table 44: Interference of Construction Noise with Aspects of Home Life
Interference of construction activity noise with home life and activity at home disturbed
Responses
(%)
Very to
Extremely Annoyed
(Number of Responses)
Very to
Extremely Annoyed
(Percent of Responses)
Reading, relaxing or other quiet activities (n=44)
3.6
26
59.1
Sleeping (n=43)
3.5
25
50
Spending time outdoors at home (n=33)
2.7
19
57.6
Listening to TV, radio, music (n=25)
2.1
20
36
Concentrating or studying (n=26)
2.1
13
50
Having a conversation (including on the telephone) (n=23)
1.9
16
69.6
Entertaining (n=12)
1.0
9
75
*Multiple responses allowed Of the respondents who were very to extremely annoyed by construction activity, a higher number reported reading relaxing and quiet activities and sleep disturbance, than the other home activities. Spending time outdoors was mentioned as disturbed and annoyance rated as very to extremely by 19 respondents, and 20 respondents were very or extremely annoyed by construction activity and reported disturbance to their listening to TV, radio, or music.

Community Response to Environmental Noise Environment Protection Authority of Victoria
Strahan Research www.strahan-research.com.au
73
13.4 IMPACT OF CONSTRUCTION ACTIVITY NOISE AT
SPECIFIC TIMES OF THE DAY The respondents who were moderately to extremely annoyed by construction noise were asked: Does noise from construction activities particularly bother, annoy or disturb you at home, at any of the following times during the week and the weekend?
Table 45: Number of Respondents Disturbed by Construction Noise at Particular Times of Day Time of day *
During the week (No. of Respondents)
During the weekend
(No. of Respondents)
At the start of the day
69 37
Day
62 23
Evening
9 7
Night
4 5
*Multiple responses allowed
Construction activity annoys more respondents during the week than over weekends, and the peak time of annoyance as reported by 69 respondents, is at the start of the weekday. Respondents are also annoyed by construction noise during weekdays (62 respondents). The lowest number of complaints is at night both during the week and over weekends 4 and 5 respondents respectively. Those who more than others are annoyed by construction noise during the weekday tend to be:
− Aged 55 years and older (75.9%) − Those who have not complained or reported a noise problem (75.4%)

Community Response to Environmental Noise Environment Protection Authority of Victoria
Strahan Research www.strahan-research.com.au
74
14. NOISE FROM MUSIC/ENTERTAINMENT VENUES 14.1 ANNOYANCE CAUSED BY NOISE FROM MUSIC/
ENTERTAINMENT VENUES The respondents were asked: Thinking about the last 12 months or so when you are here at home, how much does noise from music or entertainment venues bother, disturb or annoy you? Table 46: Extent Music or Entertainment Venue Noise Bothers, Disturbs or Annoys Respondent (Verbal Scale) Verbal scale for Music/entertainment venue Noise annoyance
Respondents %
n=1213
Not at all 11.6 Slightly 2.9 Moderately 1.5 Very 0.8 Extremely 0.4 Don’t hear 82.8 Most respondents do not hear music or entertainment venue noise at all, (82.8% or 1004 respondents), and of those that do hear the noise, a further 11.6% (141) say it does not bother them at all. Only 2.7% (33) of respondents find music or entertainment venue noise moderately to extremely annoying.

Community Response to Environmental Noise Environment Protection Authority of Victoria
Strahan Research www.strahan-research.com.au
75
The respondents who hear music or entertainment venue noise were asked: Thinking about the last 12 months or so, what number from 0-10 best shows how much you are bothered, disturbed or annoyed by noise from music or entertainment venues when you are here at home. If you are not at all annoyed choose 0; if you are extremely annoyed choose 10. If you are somewhere in between, choose a number between 0 and 10. Table 47: Extent Music or Entertainment Venue Noise Bothers, Disturbs or Annoys Respondent (Numerical Scale) Numerical scale for noise annoyance from music or entertainment venues
Respondents %
n=211
0 (not at all annoyed) 59.2 1 10.0 2 9.5 3 4.3 4 1.9 5 5.2 6 1.9 7 1.9 8 2.8 9 1.4 10 (extremely annoyed) 1.9 Almost six in ten respondents (59.2%) who hear music or entertainment venue noise, say that it is not at all annoying while 9.9% (21 respondents) rate their level of annoyance with it as six or over.

Community Response to Environmental Noise Environment Protection Authority of Victoria
Strahan Research www.strahan-research.com.au
76
14.2 PARTICULAR TYPES OF MUSIC/ENTERTAINMENT VENUE NOISE
Respondents who said music or entertainment noise was annoying were asked: Over the last 12 months or so when you are here at home are there any particular types of noise from music/entertainment venues that bother, disturb or annoy you? (unprompted) Table 48: Particular Types of Music or Entertainment Venue Noise Reported Unprompted report of particular noise from music/entertainment venues *
Responses
(%)
Hotel, pub
1.4
Outdoor concert
0.6
Live bands
0.5
Community Hall
0.5
Nightclub
0.3
Disco
0.2
Club
0.2
Music Festival
0.2
Church services
0.1
Aerobics/fitness centre
0.1
Recording studio
0
Church bells
0
Other types of music or entertainment noise
3.0
*Multiple responses allowed
The largest number of respondents cited noise from hotels or pubs (1.4% or 17 respondents) as annoying. Other specific noises got more mentions overall (3% or 31 responses). Two specific noise sources were identified in this group, namely noise when people leave pubs and

Community Response to Environmental Noise Environment Protection Authority of Victoria
Strahan Research www.strahan-research.com.au
77
turn on their car stereos (13 mentions). One respondent described it as “doof-doof” music. There were also 11 mentions of people throwing parties, either their neighbours or nearby residential homes.

Community Response to Environmental Noise Environment Protection Authority of Victoria
Strahan Research www.strahan-research.com.au
78
14.3 INTERFERENCE OF MUSIC/ENTERTAINMENT VENUE
NOISE WITH ASPECTS OF HOME LIFE The respondents who rated music or entertainment noise as moderately to extremely annoying were asked: Does noise from music/entertainment venues interfere with any of the following aspects of your home life? Table 49: Interference of Music or Entertainment Venue Noise with Aspects of Home Life Interference of music/entertainment venues’ noise with home life *
Responses
(%)
Sleeping
1.9
Reading, relaxing or other quiet activities
1.0
Listening to TV, radio, music
0.9
Concentrating or studying
0.7
Spending time outdoors at home
0.7
Having a conversation (including on the telephone)
0.5
Entertaining
0.5
*Multiple responses allowed Again, the two activities that the noise from music and entertainment venues interferes with most, are sleeping, and reading, relaxing and quiet activities (1.9% and 1.0% of responses respectively).

Community Response to Environmental Noise Environment Protection Authority of Victoria
Strahan Research www.strahan-research.com.au
79
14.4 IMPACT OF MUSIC/ENTERTAINMENT VENUE NOISE AT
SPECIFIC TIMES OF THE DAY The respondents who rated music or entertainment noise as moderately to extremely annoying were asked: Does noise from music/entertainment venues particularly bother, annoy or disturb you at home, at any of the following times during the week and the weekend?
Table 50: Number of Respondents Disturbed by Music or Entertainment Venue Noise at Particular Times of Day Time of day *
During the week (No. of Respondents)
During the weekend
(No. of Respondents)
At the start of the day
3 3
Day
5 5
Evening
11 16
Night
15 23
*Multiple responses allowed
As would be expected this type of noise source disturbs the largest number of respondents at night, particularly over weekends, with more 23 respondents saying this. This is followed by weekend evenings (16 respondents) and weeknights (15 respondents). Conversely the times when least respondents complained of music and entertainment venue noise is at the start of the weekday (3 respondents). The fact that there are any mentions of this time of day linked to music or entertainment venues may be due to all night venues or working people rising really early for work.

Community Response to Environmental Noise Environment Protection Authority of Victoria
Strahan Research www.strahan-research.com.au
80
15. SPORTS AND RECREATION NOISE 15.1 ANNOYANCE CAUSED BY NOISE FROM SPORTS AND
RECREATION The respondents were asked: Thinking about the last 12 months or so when you are here at home, how much does sport or recreation noise bother, disturb or annoy you? Table 51: Extent Sport and recreation Noise Bothers, Disturbs or Annoys Respondent (Verbal Scale) Verbal scale for sports or recreation noise annoyance
Respondents %
n=1213
Not at all 20.9 Slightly 4.6 Moderately 1.5 Very 0.7 Extremely 0.7 Don’t hear 71.6 Over one in five respondents are not at all annoyed by sports and recreation noise (20.9%) and over seven in ten respondents don’t hear this type of noise (71.6% or 868 respondents). A small number of respondents (2.9% or 35) say they are moderately to extremely annoyed by sport or recreation noise.

Community Response to Environmental Noise Environment Protection Authority of Victoria
Strahan Research www.strahan-research.com.au
81
The respondents who do hear sport and recreation noise were asked: Thinking about the last 12 months or so, what number from 0-10 best shows how much you are bothered, disturbed or annoyed by noise from sports or recreation when you are here at home. If you are not at all annoyed choose 0; if you are extremely annoyed choose 10. If you are somewhere in between, choose a number between 0 and 10. Table 52: Extent Sport and recreation Noise Bothers, Disturbs or Annoys Respondent (Numerical Scale) Numerical scale for noise annoyance from sports or recreation
Respondents %
n=341
0 (not at all annoyed) 63.9 1 11.7 2 6.7 3 5.3 4 4.4 5 1.8 6 0.9 7 0.9 8 2.1 9 0.6 10 (extremely annoyed) 1.8 More than six out of ten respondents who hear sport and recreation noise say that it does not annoy them at all. Just over one in twenty respondents (6.3% or 21 respondents) rated their annoyance at 6 or greater.

Community Response to Environmental Noise Environment Protection Authority of Victoria
Strahan Research www.strahan-research.com.au
82
15.2 PARTICULAR TYPES OF SPORTS OR RECREATION NOISE Respondents who were annoyed by sports or recreation noise were asked: Over the last 12 months or so when you are here at home are there any particular types of noise from sports or recreation that bother, disturb or annoy you? (unprompted) Table 53: Particular Types of Sport or Recreation Noise Reported
Unprompted report of particular noise from sports or recreation *
Responses %
Football
2.9
Playing fields
2.7
Public address systems/announcements
1.0
Motor sport racetracks
0.7
Trail bikes
1.2
Water sports
0.2
Indoor sporting venues (basketball, netball, indoor cricket)
0.2
Speedways
0.1
Shooting ranges
0
Skate parks
0
Other types of sport or recreation noise
3.3
*Multiple responses allowed While the numbers were extremely small, football noise was cited as annoying more than any sport or recreation noise (2.9% or 35 responses) Playing field noise was also cited as annoying in a small number of cases (2.7% or 33 mentions). Under other types of sports or recreation noise, 36 respondents mentioned a range of noises, which included other sports like tennis, and athletics (11 mentions). There were also 8 mentions of crowd noise and loudspeaker noise at the MCG, and fun-runs. In addition 9 respondents cited school noise such as playground noise, PA system noise and school bells as being annoying.

Community Response to Environmental Noise Environment Protection Authority of Victoria
Strahan Research www.strahan-research.com.au
83
15.3 INTERFERENCE OF SPORTS OR RECREATION NOISE
WITH ASPECTS OF HOME LIFE The respondents who were annoyed by sports or recreation noise were asked: Does noise from sports or recreation interfere with any of the following aspects of your home life? Table 54: Interference of Sport or Recreation Noise with Aspects of Home Life *Interference of sports or recreation noise with home life
Responses
(%)
Reading, relaxing or other quiet activities
1.8
Spending time outdoors at home
1.4
Sleeping
1.2
Entertaining
1.1
Concentrating or studying
1.0
Having a conversation (including on the telephone)
1.0
Listening to TV, radio, music
0.9
*Multiple responses allowed Reading, relaxing or other quiet activities were disturbed more than other activities (1.8% or 22 responses), followed by spending time out doors (1.4% or 17 responses). This is one noise source that did not have sleep as one of the two most disrupted activities at home.

Community Response to Environmental Noise Environment Protection Authority of Victoria
Strahan Research www.strahan-research.com.au
84
15.4 IMPACT OF SPORTS OR RECREATION NOISE AT
SPECIFIC TIMES OF THE DAY The respondents who were annoyed by sports or recreation noise were asked: Does noise from sports or recreation particularly bother, annoy or disturb you at home, at any of the following times during the week and the weekend?
Table 55: Number of Respondents Disturbed by Sport or Recreation Noise at Particular Times of Day Time of day *
During the week (No. of Respondents)
During the weekend
(No. of Respondents)
At the start of the day
7 14
Day
9 24
Evening
10 16
Night
7 23
*Multiple responses allowed
Sports and recreation noise tends to annoy respondents more over weekends.
The largest number of respondents says they are annoyed over weekends during the day by sports and recreation noise (24 respondents). This was followed by 16 respondents saying they were disturbed in the evenings on weekends.

Community Response to Environmental Noise Environment Protection Authority of Victoria
Strahan Research www.strahan-research.com.au
85
16. NOISE FROM FARMS, FORESTRY, TIMBER, AGRICULTURE, MINING OR QUARRYING 16.1 ANNOYANCE CAUSED BY NOISE FROM FARMS,
FORESTRY, TIMBER, AGRICULTURE, MINING OR QUARRYING
The respondents were asked: Thinking about the last 12 months or so when you are here at home, how much does noise from farms, forestry, timber, agriculture, mining or quarrying bother, disturb or annoy you? Table 56: Extent Farming and Mining Noise Bothers, Disturbs or Annoys Respondent (Verbal Scale) Verbal scale for noise annoyance caused by farms, forestry, timber, agriculture, mining or quarrying
Respondents %
n=1213
Not at all 10.9 Slightly 1.8 Moderately 0.3 Very 0.4 Extremely 0.0 Don’t know 0.1 Don’t hear 86.5 Almost nine in ten respondents (86.5%) don’t hear noise from farming, forestry, agriculture, mining or quarrying. A further 10.9% (132 respondents) say this type of noise does not bother them at all. A very small number 0.8% (9 respondents) say this noise is moderately to extremely annoying.

Community Response to Environmental Noise Environment Protection Authority of Victoria
Strahan Research www.strahan-research.com.au
86
The respondents who hear farming, forestry, agriculture, mining or quarrying noise were asked: Thinking about the last 12 months or so, what number from 0-10 best shows how much you are bothered, disturbed or annoyed by noise from farms, forestry, timber, agriculture, mining or quarrying when you are here at home? If you are not at all annoyed choose 0; if you are extremely annoyed choose 10. If you are somewhere in between, choose a number between 0 and 10. Table 57: Extent Farming and Mining Noise Bothers, Disturbs or Annoys Respondent (Numerical Scale) Numerical scale for noise annoyance from farms, forestry, timber, agriculture, mining or quarrying
Respondents %
n=161
0 (not at all annoyed) 75.2 1 8.1 2 4.3 3 3.1 4 1.2 5 5.0 6 0.6 7 0.6 8 0.6 9 0.0 10 (extremely annoyed) 1.2 Over three quarters of respondents who hear the noise say that it is not annoying at all. Only 3% of respondents (5) rate annoyance with this noise source at six or greater.

Community Response to Environmental Noise Environment Protection Authority of Victoria
Strahan Research www.strahan-research.com.au
87
16.2 PARTICULAR TYPES OF NOISE FROM FARMS, FORESTRY, TIMBER, AGRICULTURE, MINING OR QUARRYING
Respondents who find farming, forestry, agriculture, mining or quarrying noise annoying were asked: Over the last 12 months or so when you are here at home are there any particular types of noise from farms, forestry, timber, agriculture, mining or quarrying that bother, disturb or annoy you? (unprompted) Table 58: Particular Types of Farming and Mining Noise Reported Unprompted report of particular noise from farms, forestry, timber, agriculture, mining or quarrying *
Responses
(%)
Tractors
1.6
Agriculture machinery
1.1
Trucks
0.3
Scare guns
0.2
Bird scarers
0.2
Mining
0.2
Quarries
0.2
Blasting
0.2
Irrigation pumps
0.2
Log trucks
0.2
Chicken or broiler farm
0
Sawmill
0
Frost fans
0
Other types of agriculture or mining noise
1.2
*Multiple responses allowed

Community Response to Environmental Noise Environment Protection Authority of Victoria
Strahan Research www.strahan-research.com.au
88
Tractors were mentioned as annoying by the greatest number of respondents (1.6% or 19 responses), followed by agricultural machinery (1.1% or 13 responses). There were 21 other specific noises that were mentioned by respondents, the overwhelming majority being animal noises, which 15 (71.4% of the 21 responses) respondents say are annoying.

Community Response to Environmental Noise Environment Protection Authority of Victoria
Strahan Research www.strahan-research.com.au
89
16.3 INTERFERENCE OF NOISE FROM FARMS, FORESTRY,
TIMBER, AGRICULTURE, MINING OR QUARRYING WITH ASPECTS OF HOME LIFE
The respondents who find farming, forestry, agriculture, mining or quarrying noise moderately to extremely annoying were asked: Does noise from farms, forestry, timber, agriculture, mining or quarrying interfere with any of the following aspects of your home life? Table 59: Interference of Farming or Business Noise with Aspects of Home Life
Interference with home life by noise from farms, forestry, timber, agriculture, mining or quarrying *
Responses
(%)
Sleeping
0.7
Reading, relaxing or other quiet activities
0.5
Spending time outdoors at home
0.5
Having a conversation (including on the telephone)
0.3
Listening to TV, radio, music
0.2
Concentrating or studying
0.2
Entertaining
0.2
*Multiple responses allowed An extremely small number of respondents reported that noise from farming, agricultural and mining activities interfered with their home life. However sleeping is the activity most interfered with by this source of noise (0.7% or 9 respondents), followed by reading, relaxing, and quiet activities, and spending time outdoors, which got an equal number of mentions by respondents (0.5% or 6 respondents).

Community Response to Environmental Noise Environment Protection Authority of Victoria
Strahan Research www.strahan-research.com.au
90
16.4 IMPACT OF NOISE FROM FARMS, FORESTRY, TIMBER,
AGRICULTURE, MINING OR QUARRYING AT SPECIFIC TIMES OF THE DAY
The respondents who find farming, forestry, agriculture, mining or quarrying noise annoying were asked: Does noise from farms, forestry, timber, agriculture, mining or quarrying particularly bother, annoy or disturb you at home, at any of the following times during the week and the weekend?
Table 60: Number of Respondents Disturbed by Farming or Mining Noise at Particular Times of Day Time of day *
During the week
(No. of Respondents)
During the weekend
(No. of Respondents)
At the start of the day
7 5
Day
8 7
Evening
4 3
Night
4 4
*Multiple responses allowed
Daytime during the week is when more respondents say they are annoyed by farming noise, than other times (8 mentions), followed by the start of the day during the week (7 respondents) and during the day on the weekend (respondents).

Community Response to Environmental Noise Environment Protection Authority of Victoria
Strahan Research www.strahan-research.com.au
91
17. NOISE FROM PORTS, BOATS AND SHIPPING 17.1 ANNOYANCE CAUSED BY NOISE FROM PORTS, BOATS
AND SHIPPING The respondents were asked: Thinking about the last 12 months or so when you are here at home, how much does noise from ports, boats and shipping bother, disturb or annoy you? Table 61: Extent Port, Boat or Shipping Noise Bothers, Disturbs or Annoys Respondent (Verbal Scale) Verbal scale for noise annoyance caused by ports, boats and shipping
Respondents %
n=1213
Not at all 8.0 Slightly 0.7 Moderately 0.3 Very 0 Extremely 0 Don’t know 0.1 Don’t hear 90.8 Over nine in ten respondents (90.8%) do not hear port, boat and shipping noise, and a further 8.0% are not at all annoyed by this noise source. Only 0.3% (4) of respondents are moderately annoyed by this noise source, while none said they are very or extremely annoyed by it.

Community Response to Environmental Noise Environment Protection Authority of Victoria
Strahan Research www.strahan-research.com.au
92
The respondents who hear boat and shipping noise were asked: Thinking about the last 12 months or so, what number from 0-10 best shows how much you are bothered, disturbed or annoyed by noise from ports, boats and shipping when you are here at home? If you are not at all annoyed choose 0; if you are extremely annoyed choose 10. If you are somewhere in between, choose a number between 0 and 10. Table 62: Extent Port, Boat or Shipping Noise Bothers, Disturbs or Annoys Respondent (Numerical Scale) Numerical scale for noise annoyance from ports, boats and shipping
Respondents %
n=109
0 (not at all annoyed) 80.7 1 8.3 2 5.5 3 1.8 4 0.9 5 1.8 6 0.9 7 0 8 0 9 0 10 (extremely annoyed) 0 The vast majority (80.7%) of those who hear ports, boating or shipping noise are not at all annoyed by it. There is only one respondent in this group (0.9%) who rated their annoyance as 6 or greater

Community Response to Environmental Noise Environment Protection Authority of Victoria
Strahan Research www.strahan-research.com.au
93
17.2 PARTICULAR TYPES OF NOISE FROM PORTS, BOATS
AND SHIPPING Respondents who were annoyed by ports, boating or shipping noise were asked: Over the last 12 months or so when you are here at home are there any particular types of noise from ports, boats and shipping that bother, disturb or annoy you? (unprompted) Table 63: Particular Types of Port, Boat or Shipping Noise Reported
Unprompted report of particular noise from ports, boats and shipping *
Responses
(%)
Ship horns
1.0
Recreational Power boats
0.5
Jet-skis
0.4
Shipping ports
0
Cranes
0
Inland ports(road/rail interchange)
0
Other types of port, shipping or boat noise
0.7
*Multiple responses allowed
There were 12 responses (1.0%) citing ship’s horns which was the most commonly mentioned annoying noise, followed by 6 mentions of power boats (0.5%) and 5 mentions of jet-skis (0.4%). Other types of annoying port, boating or shipping noise were mentioned eight times; the only specific noise source of note in that category was two mentions of fog horns.

Community Response to Environmental Noise Environment Protection Authority of Victoria
Strahan Research www.strahan-research.com.au
94
17.3 THE INTERFERENCE OF NOISE FROM PORTS, BOATS
AND SHIPPING WITH ASPECTS OF HOME LIFE The respondents who were moderately to extremely annoyed by ports, boating or shipping noise were asked: Does noise from ports, boats and shipping interfere with any of the following aspects of your home life? Table 64: Interference of Port, Boat or Shipping Noise with Aspects of Home Life
Interference with home life by noise from ports, boats and shipping *
Responses
(%)
Reading, relaxing or other quiet activities
0.1
Spending time outdoors at home
0.1
Listening to TV, radio, music
0
Having a conversation (including on the telephone)
0
Concentrating or studying
0
Entertaining
0
Sleeping
0
*Multiple responses allowed Clearly the noise of ports, boating and shipping noise is not affecting aspects of home life for many respondents, as there were only two responses. This is the only noise source where sleeping was not mentioned as being interfered with.

Community Response to Environmental Noise Environment Protection Authority of Victoria
Strahan Research www.strahan-research.com.au
95
17.4 IMPACT OF NOISE FROM PORTS, BOATS AND SHIPPING
AT SPECIFIC TIMES OF THE DAY
The respondents who were annoyed by ports, boating and shipping noise were asked: Does noise from ports, boats and shipping particularly bother, annoy or disturb you at home, at any of the following times during the week and the weekend?
Table 65: Number of Respondents Disturbed by Port, Boat or Shipping Noise at Particular Times of Day Time of day *
During the week
(No. of Respondents)
During the weekend
(No. of Respondents)
At the start of the day
2 2
Day
2 2
Evening
3 2
Night
3 3
*Multiple responses allowed Night time during the week and weekends and evenings during the week is when the respondents find ports, boat and shipping noise most disturbing compared to other times. The numbers in this category of noise are very small with only three responses.

Community Response to Environmental Noise Environment Protection Authority of Victoria
Strahan Research www.strahan-research.com.au
96
17.5 LOCATION OR RESPONDENTS ANNOYED BY PORT, BOAT OR SHIPPING NOISE
Table 66: Location of Respondents Annoyed by Port, Boat or Shipping Noise
Post code
No. in Sample Suburb
No. Annoyed
3011 5 FOOTSCRAY, SEDDON, SEDDON WEST 1
3012 8 BROOKLYN, KINGSVILLE, KINGSVILLE WEST, MAIDSTONE, TOTTENHAM, WEST FOOTSCRAY 1
3031 5 FLEMINGTON, KENSINGTON 1
3106 3 TEMPLESTOWE 1
3188 5 HAMPTON, HAMPTON EAST, HAMPTON NORTH 1
3196 8 BONBEACH, CHELSEA, CHELSEA HEIGHTS, EDITHVALE 1
3207 1 GARDEN CITY, PORT MELBOURNE 1
3218 3 GEELONG WEST, HERNE HILL, MANIFOLD HEIGHTS 1
3227 1 BARWON HEADS, BREAMLEA, CONNEWARRE 1
3228 3 BELLBRAE, BELLS BEACH, JAN JUC, TORQUAY 1
3892 1 MALLACOOTA 1
3936 4 ARTHURS SEAT, DROMANA, SAFETY BEACH 1
3941 2 RYE, ST ANDREWS BEACH, TOOTGAROOK 1
A very small number of respondents in a wide variety of locations say that they are annoyed by port, boat or shipping noise. These respondents are resident in locations around the Port of Melbourne, on Port Phillip Bay, Geelong and on the ocean.

Community Response to Environmental Noise Environment Protection Authority of Victoria
Strahan Research www.strahan-research.com.au
97
18. NOISE FROM AUDIBLE ALARMS 18.1 ANNOYANCE CAUSED BY NOISE FROM AUDIBLE
ALARMS The respondents were asked: Thinking about the last 12 months or so when you are here at home, how much does noise from audible alarms bother, disturb or annoy you? Table 67: Extent Audible Alarm Noise Bothers, Disturbs or Annoys Respondent (Verbal Scale) Verbal scale for noise annoyance caused by audible alarms
Respondents %
n=1213
Not at all 25.1 Slightly 14.8 Moderately 4.6 Very 2.3 Extremely 1.2 Don’t hear 51.9 Just over half of respondents (51.9% or 630) do not hear audible alarm noise and a further quarter (25.1%) are not at all disturbed by audible alarms. Just fewer than one in ten (8.1% or 98 respondents) say they are moderately to extremely annoyed by noise from audible alarms. It is worth noting that there is a significant minority of respondents (179 or 14.8%) who say they are slightly annoyed by audible alarms suggesting a potentially emerging trend with the increase in use of alarms with safety and security concerns in the community. Respondents living in regional Victoria (61.1%) more than others say they do not hear audible alarms. Those aged 55 years and over (30.4%) more than others say they are not annoyed at all by audible alarms. Those who more than other groups are annoyed by audible alarms tend to be respondents who:
− Have reported or complained about a noise problem [slightly annoyed (22.6%) and moderately to extremely annoyed (14.2%)]
− Live in metropolitan Melbourne [18.2% slightly annoyed]

Community Response to Environmental Noise Environment Protection Authority of Victoria
Strahan Research www.strahan-research.com.au
98
− Are aged 18-24 years [11.0% moderately to extremely] The respondents who were annoyed by audible alarms were asked: Thinking about the last 12 months or so, what number from 0-10 best shows how much you are bothered, disturbed or annoyed by noise from audible alarms when you are here at home? If you are not at all annoyed choose 0; if you are extremely annoyed choose 10. If you are somewhere in between, choose a number between 0 and 10. Table 68: Extent Audible Alarm Noise Bothers, Disturbs or Annoys Respondent (Numerical Scale) Numerical scale for noise annoyance from audible alarms
Respondents %
n=584
0 (not at all annoyed) 45.0 1 14.7 2 11.8 3 8.4 4 3.1 5 4.5 6 3.3 7 2.2 8 3.6 9 2.1 10 (extremely annoyed) 1.4 Just under half of respondents (45%) who hear them say they are not at all annoyed by audible alarm noise. One in eight respondents (12.6% or 73 respondents) rated the annoyance caused by audible alarms as six out of ten or greater.

Community Response to Environmental Noise Environment Protection Authority of Victoria
Strahan Research www.strahan-research.com.au
99
18.2 PARTICULAR TYPES OF NOISE FROM AUDIBLE ALARMS Respondents who were annoyed by audible alarms were asked: Over the last 12 months or so when you are here at home are there any particular types of noise from audible alarms that bother, disturb or annoy you? (Unprompted) Table 69: Particular Types of Audible Alarm Noise Reported Unprompted report of particular noise from audible alarms *
Responses
(%)
Intruder alarms
16.7
Car alarms
12.1
Motion alarms
1.5
Reversing beepers
0.4
Other types of alarm noises
3.1
*Multiple responses allowed
Intruder alarms accounted for the largest source of annoyance with 16.7% (202 responses) citing this type of alarm. This was followed by 12.1% (147 responses) citing car alarms as annoying. There were 37 (3.1%) mentions of other types of alarm noise, and almost two thirds of these (64.9%) comprised fire and smoke alarms, ambulance, police or army sirens. Respondents who more than others cited intruder and car alarms as annoying tend to be those who:
− Have reported or complained about a noise problem (26.7% and 34.0% respectively)
− Live in metropolitan Melbourne (84.6% and 84.4% respectively) − Are aged 35 to 54 years (52.5% and 54.4% respectively)

Community Response to Environmental Noise Environment Protection Authority of Victoria
Strahan Research www.strahan-research.com.au
100
18.3 INTERFERENCE OF NOISE FROM AUDIBLE ALARMS WITH
ASPECTS OF HOME LIFE The respondents who were moderately to extremely annoyed by audible alarms were asked: Does noise from audible alarms interfere with any of the following aspects of your home life? Table 70: Interference of Audible Alarm Noise with Aspects of Home Life Interference with home life by noise from audible alarms and activity at home disturbed
Responses
(%)
Very to
Extremely Annoyed
(Number of Responses)
Very to
Extremely Annoyed
(Percent of Responses)
Sleeping (n=72)
5.9
31
43.1
Reading, relaxing or other quiet activities (n=56)
4.6
18
32.1
Listening to TV, radio, music (n=49)
4.0
20
40.8
Having a conversation, including on the telephone (n=36)
3.0
14
38.9
Concentrating or studying (n=37)
3.1
14
37.8
Spending time outdoors at home (n=31)
2.6
14
45.2
Entertaining (n=24)
2.0
9
37.5
*Multiple responses allowed Of respondents who were very to extremely annoyed by alarms, a higher number reported sleep disturbance than any other aspect of home life disturbed. (There were 70 respondents who said it was slightly to extremely annoying, with 2 saying it did not annoy them although their sleep was being disturbed by alarms) thirty one respondents rated the annoyance as very to extremely annoying. This was followed by reading, relaxing and quiet activities (4.6% or 55 responses) being disturbed by alarms.

Community Response to Environmental Noise Environment Protection Authority of Victoria
Strahan Research www.strahan-research.com.au
101
There were 48 respondents who said listening to TV radio or music was at all disturbed by alarms, and 20 of them rated the annoyance as very to extremely annoying. Those who more than others say that their sleep and reading, relaxing and quiet activities are disturbed by audible alarms tend to be respondents who:
− Have complained about or reported a noise problem (40.3% and 42.9% respectively)
− Live in metropolitan Melbourne (86.1% and 92.9% respectively)

Community Response to Environmental Noise Environment Protection Authority of Victoria
Strahan Research www.strahan-research.com.au
102
18.4 IMPACT OF NOISE FROM AUDIBLE ALARMS AT SPECIFIC
TIMES OF THE DAY
The respondents who were moderately to extremely annoyed by audible alarms were asked: Does noise from audible alarms particularly bother, annoy or disturb you at home, at any of the following times during the week and the weekend?
Table 71: Number of Respondents Disturbed by Audible Alarm Noise at Particular Times of Day Time of day *
During the week
(No. of Respondents)
During the weekend
(No. of Respondents)
At the start of the day
51 52
Day
63 55
Evening
58 57
Night
76 77
*Multiple responses allowed
The largest numbers of respondents say that they are annoyed by audible alarm noise at night over the weekend (77 responses) and weeknights (76 responses). It is worth noting that there are a sizable number of respondents who are disturbed by audible alarm noise at any time of day or night with the start of the day being the “low” time of annoyance but still a problem for 51 of these respondents. Respondents aged 35-54 years (59.2%) more than other groups are annoyed by audible alarms at the start of the day on the weekend.

Community Response to Environmental Noise Environment Protection Authority of Victoria
Strahan Research www.strahan-research.com.au
103
19. LEVEL OF ANNOYANCE AND PROXIMITY TO NOISE SOURCES
It is considered that the extent of annoyance with a noise may be related to the proximity of a respondent to a source of that noise. Table 72 below summarizes data illustrating the level of annoyance with a noise by proximity to a source of that noise.
Table 72: Proximity to Source of the Noise and Level of Annoyance with Noise
% of Respondents who
Location to possible noise sources
Don’t Hear Slightly Annoyed
Moderately Annoyed
Very and Extremely Annoyed
Arterial road
23.2 (108) 23.2 (108)
13.5 (63) 12.5 (58)
Tram or railway line
35.7(136) 14.1 (55) 4.2 (16) 3.2 (12)
Sports venue
45.0 (144) 10.3 (33) 2.5 (8) 3.1 (10)
Shops/commercial premises
85.9 (267) 3.5 (11) 0.3 (1) 0.6 (2)
Freeway
22.4 (50) 25.1 (56) 14.3 (32) 11.7 (26)
Building construction
18.3 (32) 18.3 (32) 15.4 (27) 16.0 (28)
Forestry, farming, mining, quarrying, or agricultural activity
37.9 (64) 13.0 (22) 2.4 (4) 1.8 (3)
Sea, river, port or lake
68.7 (103) 4.0 (6) 2.0 (3) 0.0 (0)
Hotel
64.2 (86) 6.0 (8) 6.7 (9) 5.2 (7)
Airport/airfield
13.3 (17) 20.3 (26) 9.4 (12) 10.1 (11)
Factory or industrial premises
68.5 (74) 7.4 (8) 3.7 (4) 4.7 (5)
Other entertainment/leisure venue
64.1 (69) 7.6 (7) 5.4 (5) 4.4 (4)
Nightclub
52.2 (12) 4.3 (1) 21.7 (5) 4.4 (1)
Respondents who live in proximity to the following noise sources say that they do not hear noise from them:
− Shops and commercial premises (85.9%) − Sea, river, port or lake (68.7%) − Factory or industrial premises (68.5%) − Hotel (64.2%)

Community Response to Environmental Noise Environment Protection Authority of Victoria
Strahan Research www.strahan-research.com.au
104
− Other entertainment or leisure venue (64.1%) Respondents who live in proximity to the following noise sources are very or extremely annoyed by noise:
− Building construction (16.0%) − Arterial road (12.5%) − Freeway (11.7%) − Airport or airfield (10.1%)

Community Response to Environmental Noise Environment Protection Authority of Victoria
Strahan Research www.strahan-research.com.au
105
20. REPORTING OF NOISE 20.1 MADE A COMPLAINT OR REPORT The respondents were asked: Have you ever made a report or complaint about any of the noise sources? Table 73 Proportion of: Respondents Making a Report or Complaint About Any Noise source
Respondents N=1213
Yes No Don’t Know
Complaints about noise sources
17.5
82.4
0.2
Just over one in six respondents (17.5% or 212) say that they have reported or complained about a noise problem.

Community Response to Environmental Noise Environment Protection Authority of Victoria
Strahan Research www.strahan-research.com.au
106
20.2 SPECIFIC NOISE COMPLAINTS AND AUTHORITIES WHO
WERE NOTIFIED OF NOISE The respondents who said that they had complained or made a report about a noise problem were asked: Which noise did you report or complain about and who did you complain or report it to? Table 74: Authority to which Noise was Reported or Complained About N=212 *
Those
causing problem
Police
EPA
Local
Council
Landlord.
Dept of Housing
Govt Dept
MP or Local
Councillor
Ombuds
man
Other
Road traffic (n=33)
< 3 8.5 < 3 5.2 0 0 < 3 0 0
Neighbours (n=146)
10.4 40.6 < 3 14.2 < 3 < 3 0 0 < 3
Trams or trains (n=3)
< 3 0 < 3 < 3 0 0 0 0 0
Aircraft (n=2)
0 < 3 < 3 0 0 0 0 0 0
Factories or industry (n=8)
< 3 0 < 3 < 3 0 0 < 3 0 0
Shops or other businesses (n=2)
< 3 < 3 0 0 0 0 0 0 0
Construction activities (n=6)
0 < 3 < 3 < 3 0 0 0 0 0
Music or entertainment venues (n=14)
< 3 3.8 0 < 3 0 0 0 0 < 3
Sports and recreation (n=3)
< 3 < 3 0 0 0 0 0 0 0
Farming, forestry, etc (n=3)
0 < 3 < 3 < 3 0 0 0 0 0
Ports, boats and shipping (n=0)
0 0 0 0 0 0 0 0 0
Audible alarms (n=15)
< 3 3.8 0 0 0 0 0 0 < 3
14.7 60.0 4.4 24.6 0.5 0.9 1.0 0.0 5.2 *Percent of response. Multi responses possible.

Community Response to Environmental Noise Environment Protection Authority of Victoria
Strahan Research www.strahan-research.com.au
107
The vast majority of complaints about noise are made to the police specifically in relation to noise generated by:
− Neighbours (40.6%) − Road traffic (8.5%)
Respondents also complain about or report neighbour and road traffic noise to local Council (14.2% and 5.2% respectively) and to those causing the problem (10.4% to neighbours). A small number of respondents complained about or reported the following noise to the EPA:
− Factory and industry (1.4%) − Road traffic (1 response) − Neighbours (1 response) − Trams and trains (1 response) − Aircraft (1 response) − Construction (1 response) − Farming, forestry and mining (1 response)

Community Response to Environmental Noise Environment Protection Authority of Victoria
Strahan Research www.strahan-research.com.au
108
21.OTHER ACTION TAKEN TO REDUCE NOISE 21.1 TAKEN ACTION The respondents were asked: Have you ever taken any other action to reduce the noise that you hear at home? Table 75: Proportion of Respondents that Have Taken Action to Reduce Noise Heard in their Home
% Respondents
N=1213
Yes No Don’t Know
Other action taken to reduce noise at home
11.0
88.9
0.2
Just over one in ten respondents (11.0%) said that they had taken some other action to reduce the noise that they hear in their home.

Community Response to Environmental Noise Environment Protection Authority of Victoria
Strahan Research www.strahan-research.com.au
109
21.2 TYPE OF ACTION TAKEN TO REDUCE NOISE The respondents who had taken some other action to reduce noise in their homes were asked: What action was taken? (to reduce noise that you hear at home) Table 76: Actions Taken to Reduce Noise Heard in the Home Actions Taken
Respondents
% N=133
Changed Home or Habits Made changes to home (inside or outside)
31.6
Did something to keep the noise out
11.3
Changed habits to avoid noise
15.0
Used earplugs
5.3
Total Changed Habits or Home 63.2 Direct or Indirect Resolution with Noise Source Approached/negotiated with those responsible for noise
22.6
Reported to authorities (Police, Shire, VCAT)
7.5
Banged on doors/yelled at those responsible
6.0
Organized a petition
0.8
Total Direct or Indirect Resolution with Noise Source 36.9

Community Response to Environmental Noise Environment Protection Authority of Victoria
Strahan Research www.strahan-research.com.au
110
The two main actions taken by respondents were to:
o Change habits or use of the home primarily by making physical changes to the property (31.6%)
o Try to directly or indirectly resolve the noise problem primarily by
approaching and negotiating with those responsible for the noise (22.6%)

Community Response to Environmental Noise Environment Protection Authority of Victoria
Strahan Research www.strahan-research.com.au
111
21.3 EFFECTIVENESS OF ACTION TAKEN The respondents who had taken action were asked: How effective was the action that was taken?
Table 77: Overall Effectiveness of Action Taken to Reduce Noise Heard in the Home
Effectiveness of Action
Respondents
% n =133
Not effective at all
13.5
Slightly effective
24.8
Somewhat effective
26.3
Very effective
21.8
Extremely effective
13.5
Over a third or respondents (35.3%) felt that the actions that they had taken to reduce the noise affecting their household had been very or extremely effective. A further quarter of respondents (26.3%) said that their actions had been somewhat effective. However over one in eight respondents (13.5%) felt that their actions had not been effective at all and almost a quarter (24.8%) said they had only been slightly effective.

Community Response to Environmental Noise Environment Protection Authority of Victoria
Strahan Research www.strahan-research.com.au
112
Table 78: Effectiveness of Specific Actions Taken to Reduce Noise Heard in the Home
Actions Taken
Not Effective
at All
Slightly Effective
Somewhat
Effect-ive
Very Effective
Extreme-ly
Effective
Changed Home or Habits Made changes to home (inside or outside)
2.4
28.6
28.6
28.6
11.9
Did something to keep the noise out
6.7
33.3
33.3
20.0
6.7
Changed habits to avoid noise
10.0
20.0
45.0
10.0
15.0
Used earplugs
0.0
42.9
42.9
14.3
0.0
Direct or Indirect Resolution with Noise Source Approached/negotiated with those responsible for noise
23.3
23.3
10.0
26.7
16.7
Reported to authorities (Police, Shire, VCAT)
40.0
0.0
20.0
20.0
20.0
Banged on doors/yelled at those responsible
25.0
25.0
12.5
12.5
25.0
Organized a petition
100.0
0.0
0.0
0.0
0.0
Respondents reported that the actions that they took to address noise problems were of varied effectiveness. Changes to the home appeared to be most effective action taken to address noise with almost seven in ten respondents (69.1%) saying that this was somewhat (28.6%), very (28.6%) or extremely (11.9%) effective. Approaching and negotiating with those responsible for the noise was of mixed effectiveness with an approximately equal number of respondents saying that this approach was very or extremely effective (43.4%) and not effective at all or only slightly effective (46.6%). Changing habits was generally seen as somewhat effective (45.0%) or of little effectiveness (not at all – 10% and slightly effective 20.0%).

Community Response to Environmental Noise Environment Protection Authority of Victoria
Strahan Research www.strahan-research.com.au
113
21.4 ACTION TAKEN SOLVE PROBLEM The respondents were asked: Did the action(s) taken solve the problem? Table 79: Overall Perception of Whether Action Taken Solved the Noise Problem Actions Solve Problem
Respondents
% n =133
Yes
48.9
No
45.1
Don’t know
5.3
Almost a half of respondents (48.9%) who took action to reduce noise said that their actions solved the problem.

Community Response to Environmental Noise Environment Protection Authority of Victoria
Strahan Research www.strahan-research.com.au
114
Table 80: Perception of Whether Specific Actions Solved the Noise Problem
Actions Taken
Solved the
Problem
Did Not Solve the Problem
Don’t Know
Changed Home or Habits
Made changes to home (inside or outside)
45.2
50.0
4.8
Did something to keep the noise out
53.3
33.3
13.3
Changed habits to avoid noise
55.0
45.0
0.0
Used earplugs
28.6
71.4
0.0
Direct or Indirect Resolution with Noise Source
Approached/negotiated with those responsible for noise
53.3
36.7
10.0
Reported to authorities (Police, Shire, VCAT)
30.0
60.0
10.0
Banged on doors/yelled at those responsible
75.0
25.0
0.0
Organized a petition
0.0
100.0
0.0
Consistent with the previous discussion on the effectiveness of actions to address noise, a majority of respondents who used the approach felt that the following actions solved the noise problem:
− Changed habits to avoid noise (55.0%) − Approached and negotiated with source of noise problem (53.3%)
As could probably be expected from those who were willing to take aggressive action to confront the source of their noise problem, 75.0% of those who said they yelled and banged on doors felt that this solved the problem.

Community Response to Environmental Noise Environment Protection Authority of Victoria
Strahan Research www.strahan-research.com.au
115
SECTION V: DEMOGRAPHICS

Community Response to Environmental Noise Environment Protection Authority of Victoria
Strahan Research www.strahan-research.com.au
116
Table 81: Demographics of the sample Demographics of Sample
Total %
Gender Male 39.1 Female 60.9
Age 18-24 5.6 25-34 11.6 35-44 21.6 45-54 24.6 55-64 17.3 65 plus 19.2
Region Metro 66.1 Regional 33.8 Residential Description Mostly residential 80.4 Residential mixed with shops or offices 4.6
4.6 Residential mixed with factories and industry 2.3 2.3 Mostly factories or shops with some residential 0.2 0.2 House with no near neighbours or offices or factories 7.9 7.9 Other 4.6
Type of dwelling Respondent lives in Free-standing /detached house 85.2 Unit 6.1 Semi-detached townhouse/villa 4.4 Flat/apartment 3.2 Other 0.8 Refused 0.3 Location to possible noise sources Arterial road 38.3 Train or railway line 31.4 Sports venue 26.4 Shops/commercial premises 25.6 Freeway 18.4 Building construction 14.4 Forestry, farming, mining, quarrying, or agricultural activity 13.9 Sea, river, port or lake 12.4 Hotel 11.0 Airport/airfield 10.6 Factory or industrial premises 8.9 Other entertainment/leisure venue 7.6 Nightclub 1.9 Other 6.9

Community Response to Environmental Noise Environment Protection Authority of Victoria
Strahan Research www.strahan-research.com.au
117
Related Documents