Report PTS-ER-2017:10 Date July 3, 2017 Report: The Swedish Telecommunications Market 2016

Welcome message from author
This document is posted to help you gain knowledge. Please leave a comment to let me know what you think about it! Share it to your friends and learn new things together.
Transcript
Report
PTS-ER-2017:10 Date
July 3, 2017
Report:
The Swedish Telecommunications Market
2016
Swedish Post and Telecom Authority 2
The Swedish Telecommunications Market 2016
Report Number
PTS-ER-2017:10
Reference Number
16-11655
ISSN
1650-9862
Author
Karin Fransén and Andreas Wigren
Swedish Post and Telecom Authority
Box 5398 SE-102 49 Stockholm Sweden +46 8 678 55 00 [email protected] www.pts.se
Swedish Post and Telecom Authority 3
Table of contents
Summary of the Swedish Telecommunications Market 2016 7
Sammanfattning av Svensk telekommarknad 2016 11
1 Introduction 17
2 Income in the market 19
3 Mobile telephone and data services 20 3.1 Subscriptions - Mobile telephone and data services 20 3.2 Subscription - M2M-services 23 3.3 Call traffic – Mobile telephone services 24 3.4 Number of SMS and MMS 25 3.5 Data traffic in mobile networks 26 3.6 Income for mobile telephone and data services 30 3.7 Income for M2M 30 3.8 Income for interconnection in mobile networks 31 3.9 Market share - mobile telephone and data services 31 3.10 Market share - Mobile broadband 32 3.11 Number porting – Mobile numbers 33
4 Internet services 34 4.1 Subscriptions - Internet services 34 4.2 Transfer speed - Fixed broadband 38 4.3 Income from internet services 40 4.4 Market share - Broadband in total 41 4.5 Market share - Fixed broadband 43
5 Fixed line telephone services 44 5.1 Subscriptions - Fixed line telephone services 44 5.2 Telephone traffic – Fixed line telephone services 48 5.3 Income from fixed line telephone services 49 5.4 Income from interconnection in fixed networks 50 5.5 Market share - Fixed line telephone services 50 5.6 Number porting - Fixed line telephone services 51
6 TV services 52 6.1 Traditional pay TV services 52
6.1.1 Traditional pay TV subscriptions - 52 6.1.2 Income from TV services 56 6.1.3 Market share - pay TV services 58
6.2 Digital terrestrial TV free to air (DTT FTA) 59 6.3 TV viewer figures and other ways of looking at moving images 60
7 Bundled services 61
8 Data communication services and dark fibre to end customers 63 8.1 Data communication to end customers 63 8.2 Income from data communication services and dark fibre to end
customers 63
9 Ducting 65 1.1 Data Collection and Implementation 66 1.2 Discrepancies and updates of data 66 1.3 Historical information and market shares 67 1.4 Definitions 67

Swedish Post and Telecom Authority 4
Appendix 66 1. Method and definitions 66 2 List of participants 70 3 Changes in statistics 77 4 Report tables 78 5 Quality declaration 79
Swedish Post and Telecom Authority 5
Table
Table 1 Average volume of data used per month ................................................... 28
Figure
Figure 1 End user market income for electronic communication ................................ 19
Figure 2 Number of subscriptions for mobile telephone and data services, private and corporate ............................................................................................... 20
Figure 3 Number of subscriptions for mobile telephone and data services - private ...... 22
Figure 4 Number of subscriptions for mobile telephone and data services - corporate .. 22
Figure 5 Number of subscriptions that used 4G (LTE) .............................................. 23
Figure 6 Number of subscriptions for M2M services ................................................. 24
Figure 7 Development of the number of outgoing call minutes from mobile telephones 25
Figure 8 Development in the number of sent SMS in total and per subscription and month ................................................................................................... 26
Figure 9 Volume of transferred mobile data – private and corporate .......................... 27
Figure 10 Volume of mobile data transferred - private ............................................... 29
Figure 11 Volume of mobile data transferred - corporate ........................................... 29
Figure 12 Mobile income by fixed and variable charges .............................................. 30
Figure 13 Market share - subscriptions for mobile telephone and data services ............. 31
Figure 14 Market share - subscriptions for mobile broadband ..................................... 32
Figure 15 Number of portings of mobile and fixed line telephone numbers ................... 33
Figure 16 Number of internet subscriptions .............................................................. 34
Figure 17 Development of subscriptions for broadband - private and corporate ............ 36
Figure 18 Development of subscriptions for broadband - private ................................. 37
Swedish Post and Telecom Authority 6
Figure 19 Development of subscriptions for broadband - corporate ............................. 37
Figure 20 Distribution of speeds for download of data - fixed broadband ...................... 39
Figure 21 Distribution of speeds for upload of data - fixed broadband .......................... 40
Figure 22 Income from the end customer market for fixed internet services ................. 41
Figure 23 Market share - subscriptions for broadband in total ..................................... 42
Figure 24 Market share - fixed broadband subscriptions............................................. 43
Figure 25 Number of subscriptions for fixed line telephony - private and corporate ....... 44
Figure 26 Number of subscriptions for fixed line telephony - private ............................ 47
Figure 27 Number of subscriptions for fixed line telephony - corporate ........................ 47
Figure 28 Outgoing call minutes from fixed line telephone services ............................. 48
Figure 29 Income from end customers for fixed line telephone services ....................... 49
Figure 30 Market share - fixed line telephone service subscriptions ............................. 50
Figure 31 Number of pay TV subscriptions by distribution platform ............................. 53
Figure 32 Proportion of TV subscriptions by distribution platform ................................ 54
Figure 33 Income from TV services in basic subscriptions .......................................... 57
Figure 34 Market share - subscriptions to digital TV services ...................................... 59
Figure 35 Number of bundled subscriptions .............................................................. 61
Figure 36 Income from data communication services and dark fibre to end customers .. 63
Swedish Post and Telecom Authority 7
Summary of the Swedish Telecommunications Market 2016
The Swedish Post and Telecom Authority (PTS), has been tasked with tracking developments in the electronic communications market, promoting competition in that same market and inform consumers. As a part of these tasks, PTS collects and publishes market data in this report, the “Swedish Telecommunications Market” annually. The data is also used in various analysis within PTS.
The Swedish Telecom Market report is one of Sweden’s most important survey of telecom operators’ subscriptions, revenues, data traffic, etc., within the areas mobile call and data services, fixed broadband, fixed telephony, traditional TV services, data communications, dark fibre and ducts. The report is based on PTS’s own survey of over 550 operators, with a response rate of 95 per cent. All comparisons refer to 31 December 2016 compared to the same date in 2015.
Highlights from the 2016 report:
Compared with the results from 2015 (in brackets).
Mobile subscriptions
• Total mobile subscriptions: 14.56 million (-1%)
• Mobile subscriptions incl.1GB: 7.8million (+15%)
• Mobile data traffic: 639 000 Tbyte (+35%)
Broaband subscriptions
• Fixed (fibre, cable, xDSL): 3.7 million (+6%)
• of which fibre: 2.0 million (+19%)
• Mobile (router, dongle): 2.1 million (-4%)
Fixed Telephony subscriptions
• Fixed telephony: 3.1 million (-11%)
• of which IP telephony: 1.7 million (-7%)
Traditional pay-TV subscriptions
• Subscriptions: 5.2 million (+1%)
• of which IPTV: 1.1 million (+12%)
• of which DTT: 0.5 million (-12%)
Swedish Post and Telecom Authority 8
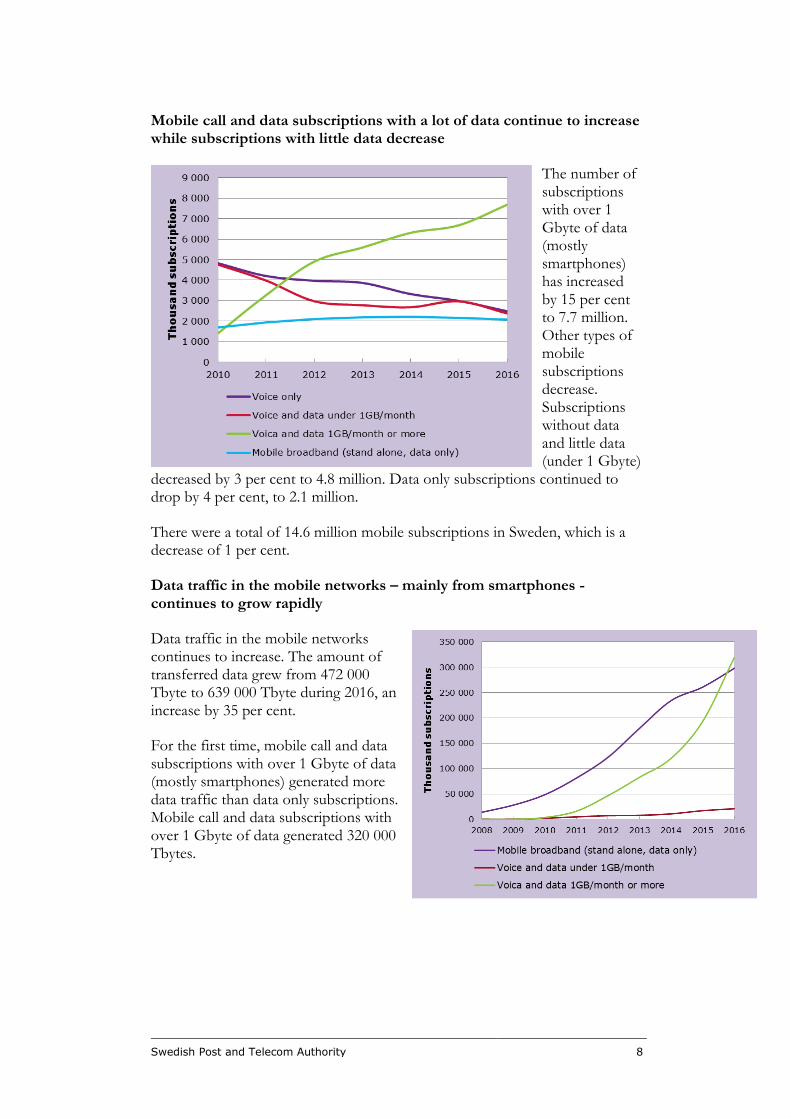
Mobile call and data subscriptions with a lot of data continue to increase while subscriptions with little data decrease
The number of subscriptions with over 1 Gbyte of data (mostly smartphones) has increased by 15 per cent to 7.7 million. Other types of mobile subscriptions decrease. Subscriptions without data and little data (under 1 Gbyte)
decreased by 3 per cent to 4.8 million. Data only subscriptions continued to drop by 4 per cent, to 2.1 million.
There were a total of 14.6 million mobile subscriptions in Sweden, which is a decrease of 1 per cent.
Data traffic in the mobile networks – mainly from smartphones - continues to grow rapidly
Data traffic in the mobile networks continues to increase. The amount of transferred data grew from 472 000 Tbyte to 639 000 Tbyte during 2016, an increase by 35 per cent.
For the first time, mobile call and data subscriptions with over 1 Gbyte of data (mostly smartphones) generated more data traffic than data only subscriptions. Mobile call and data subscriptions with over 1 Gbyte of data generated 320 000 Tbytes.
Swedish Post and Telecom Authority 9
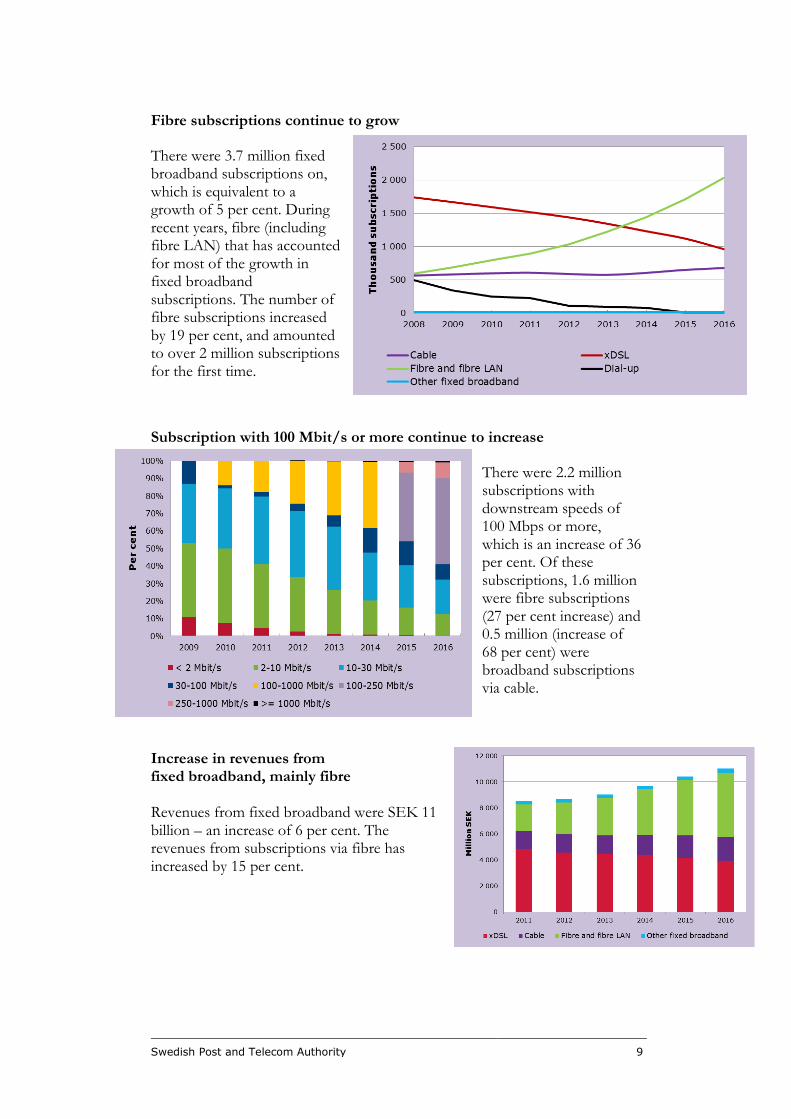
Fibre subscriptions continue to grow
There were 3.7 million fixed broadband subscriptions on, which is equivalent to a growth of 5 per cent. During recent years, fibre (including fibre LAN) that has accounted for most of the growth in fixed broadband subscriptions. The number of fibre subscriptions increased by 19 per cent, and amounted to over 2 million subscriptions for the first time.
Subscription with 100 Mbit/s or more continue to increase
There were 2.2 million subscriptions with downstream speeds of 100 Mbps or more, which is an increase of 36 per cent. Of these subscriptions, 1.6 million were fibre subscriptions (27 per cent increase) and 0.5 million (increase of 68 per cent) were broadband subscriptions via cable.
Increase in revenues from fixed broadband, mainly fibre Revenues from fixed broadband were SEK 11 billion – an increase of 6 per cent. The revenues from subscriptions via fibre has increased by 15 per cent.
Swedish Post and Telecom Authority 10
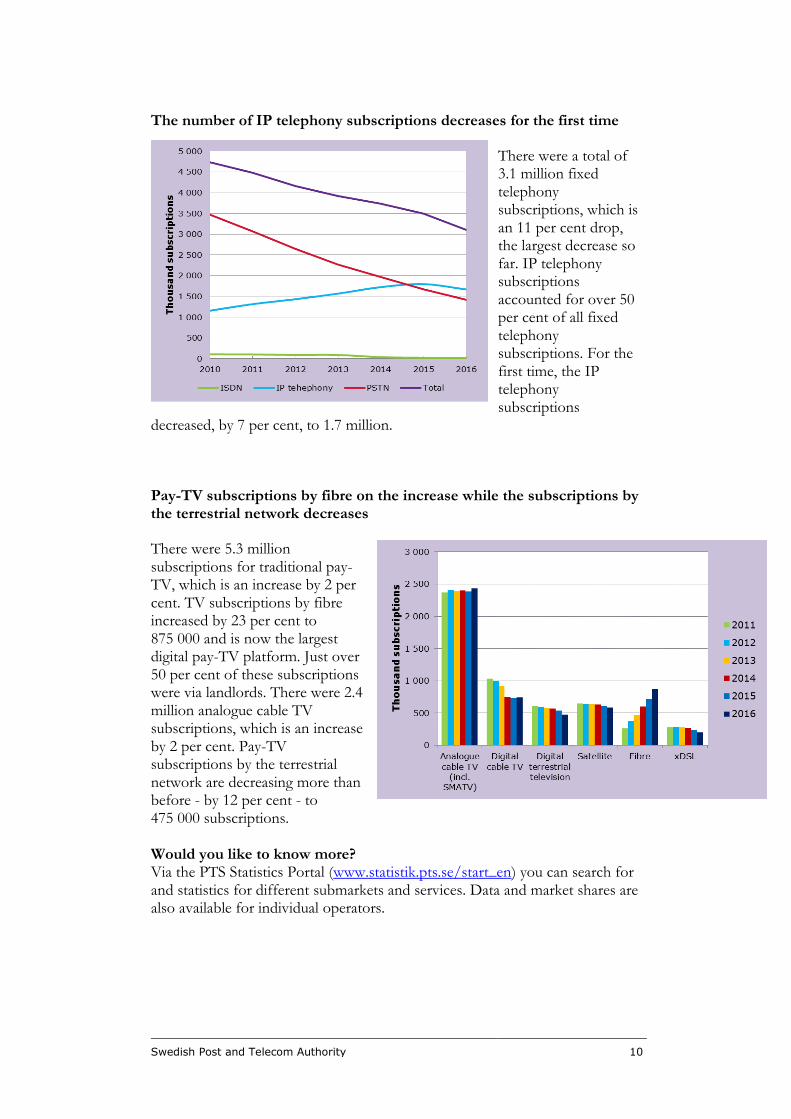
The number of IP telephony subscriptions decreases for the first time
There were a total of 3.1 million fixed telephony subscriptions, which is an 11 per cent drop, the largest decrease so far. IP telephony subscriptions accounted for over 50 per cent of all fixed telephony subscriptions. For the first time, the IP telephony subscriptions
decreased, by 7 per cent, to 1.7 million.
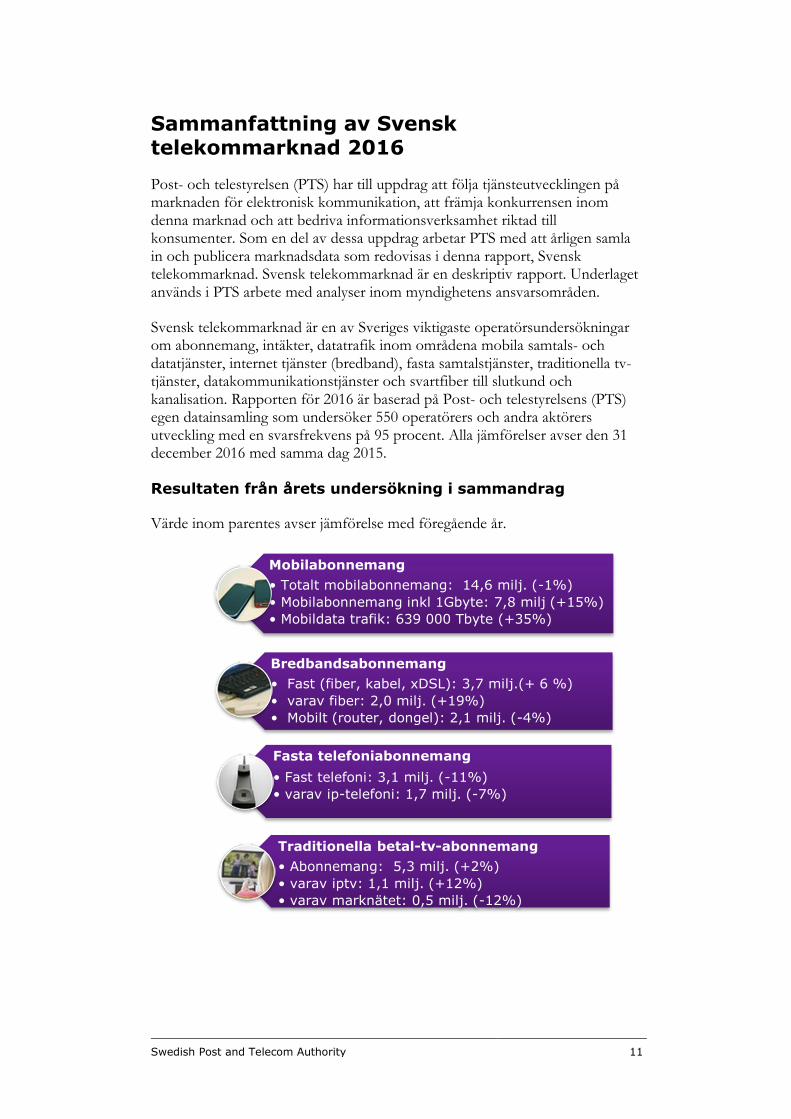
Pay-TV subscriptions by fibre on the increase while the subscriptions by the terrestrial network decreases
There were 5.3 million subscriptions for traditional pay-TV, which is an increase by 2 per cent. TV subscriptions by fibre increased by 23 per cent to 875 000 and is now the largest digital pay-TV platform. Just over 50 per cent of these subscriptions were via landlords. There were 2.4 million analogue cable TV subscriptions, which is an increase by 2 per cent. Pay-TV subscriptions by the terrestrial network are decreasing more than before - by 12 per cent - to 475 000 subscriptions. Would you like to know more? Via the PTS Statistics Portal (www.statistik.pts.se/start_en) you can search for and statistics for different submarkets and services. Data and market shares are also available for individual operators.
Swedish Post and Telecom Authority 11
Sammanfattning av Svensk telekommarknad 2016
Post- och telestyrelsen (PTS) har till uppdrag att följa tjänsteutvecklingen på marknaden för elektronisk kommunikation, att främja konkurrensen inom denna marknad och att bedriva informationsverksamhet riktad till konsumenter. Som en del av dessa uppdrag arbetar PTS med att årligen samla in och publicera marknadsdata som redovisas i denna rapport, Svensk telekommarknad. Svensk telekommarknad är en deskriptiv rapport. Underlaget används i PTS arbete med analyser inom myndighetens ansvarsområden.
Svensk telekommarknad är en av Sveriges viktigaste operatörsundersökningar om abonnemang, intäkter, datatrafik inom områdena mobila samtals- och datatjänster, internet tjänster (bredband), fasta samtalstjänster, traditionella tv-tjänster, datakommunikationstjänster och svartfiber till slutkund och kanalisation. Rapporten för 2016 är baserad på Post- och telestyrelsens (PTS) egen datainsamling som undersöker 550 operatörers och andra aktörers utveckling med en svarsfrekvens på 95 procent. Alla jämförelser avser den 31 december 2016 med samma dag 2015.
Resultaten från årets undersökning i sammandrag
Värde inom parentes avser jämförelse med föregående år.
Mobilabonnemang
• Totalt mobilabonnemang: 14,6 milj. (-1%)
• Mobilabonnemang inkl 1Gbyte: 7,8 milj (+15%)
• Mobildata trafik: 639 000 Tbyte (+35%)
Bredbandsabonnemang
• Fast (fiber, kabel, xDSL): 3,7 milj.(+ 6 %)
• varav fiber: 2,0 milj. (+19%)
• Mobilt (router, dongel): 2,1 milj. (-4%)
Fasta telefoniabonnemang
• Fast telefoni: 3,1 milj. (-11%)
• varav ip-telefoni: 1,7 milj. (-7%)
Traditionella betal-tv-abonnemang
• Abonnemang: 5,3 milj. (+2%)
• varav iptv: 1,1 milj. (+12%)
• varav marknätet: 0,5 milj. (-12%)
Swedish Post and Telecom Authority 12
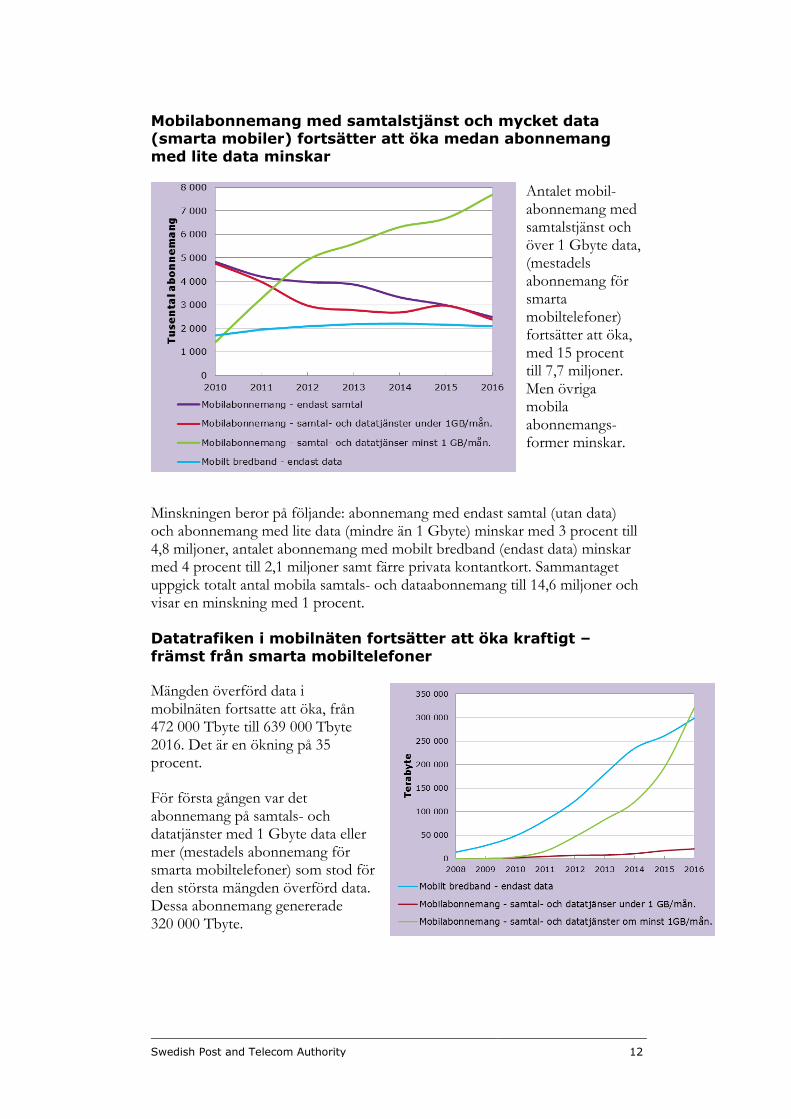
Mobilabonnemang med samtalstjänst och mycket data (smarta mobiler) fortsätter att öka medan abonnemang
med lite data minskar
Antalet mobil-abonnemang med samtalstjänst och över 1 Gbyte data, (mestadels abonnemang för smarta mobiltelefoner) fortsätter att öka, med 15 procent till 7,7 miljoner. Men övriga mobila abonnemangs-former minskar.
Minskningen beror på följande: abonnemang med endast samtal (utan data) och abonnemang med lite data (mindre än 1 Gbyte) minskar med 3 procent till 4,8 miljoner, antalet abonnemang med mobilt bredband (endast data) minskar med 4 procent till 2,1 miljoner samt färre privata kontantkort. Sammantaget uppgick totalt antal mobila samtals- och dataabonnemang till 14,6 miljoner och visar en minskning med 1 procent.
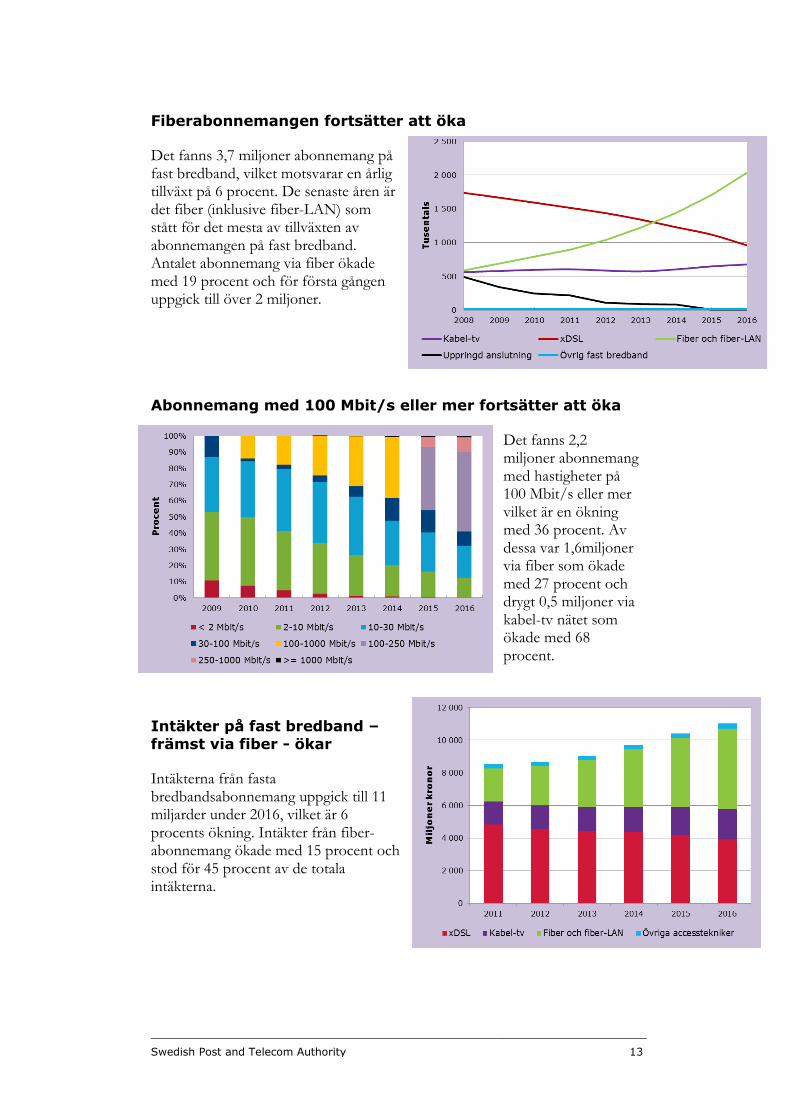
Datatrafiken i mobilnäten fortsätter att öka kraftigt –
främst från smarta mobiltelefoner
Mängden överförd data i mobilnäten fortsatte att öka, från 472 000 Tbyte till 639 000 Tbyte 2016. Det är en ökning på 35 procent.
För första gången var det abonnemang på samtals- och datatjänster med 1 Gbyte data eller mer (mestadels abonnemang för smarta mobiltelefoner) som stod för den största mängden överförd data. Dessa abonnemang genererade 320 000 Tbyte.
Swedish Post and Telecom Authority 13
Fiberabonnemangen fortsätter att öka
Det fanns 3,7 miljoner abonnemang på fast bredband, vilket motsvarar en årlig tillväxt på 6 procent. De senaste åren är det fiber (inklusive fiber-LAN) som stått för det mesta av tillväxten av abonnemangen på fast bredband. Antalet abonnemang via fiber ökade med 19 procent och för första gången uppgick till över 2 miljoner.
Abonnemang med 100 Mbit/s eller mer fortsätter att öka
Det fanns 2,2 miljoner abonnemang med hastigheter på 100 Mbit/s eller mer vilket är en ökning med 36 procent. Av dessa var 1,6miljoner via fiber som ökade med 27 procent och drygt 0,5 miljoner via kabel-tv nätet som ökade med 68 procent.
Intäkter på fast bredband –
främst via fiber - ökar
Intäkterna från fasta bredbandsabonnemang uppgick till 11 miljarder under 2016, vilket är 6 procents ökning. Intäkter från fiber-abonnemang ökade med 15 procent och stod för 45 procent av de totala intäkterna.
Swedish Post and Telecom Authority 14
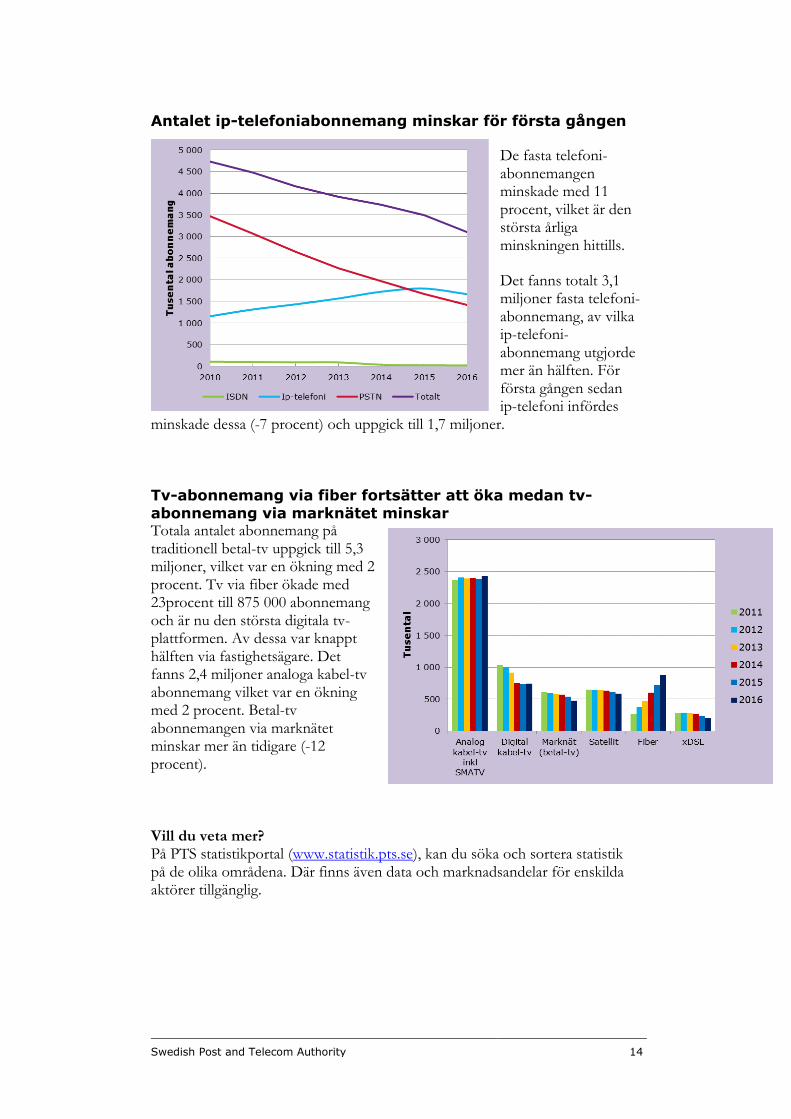
Antalet ip-telefoniabonnemang minskar för första gången
De fasta telefoni-abonnemangen minskade med 11 procent, vilket är den största årliga minskningen hittills.
Det fanns totalt 3,1 miljoner fasta telefoni-abonnemang, av vilka ip-telefoni-abonnemang utgjorde mer än hälften. För första gången sedan ip-telefoni infördes
minskade dessa (-7 procent) och uppgick till 1,7 miljoner.
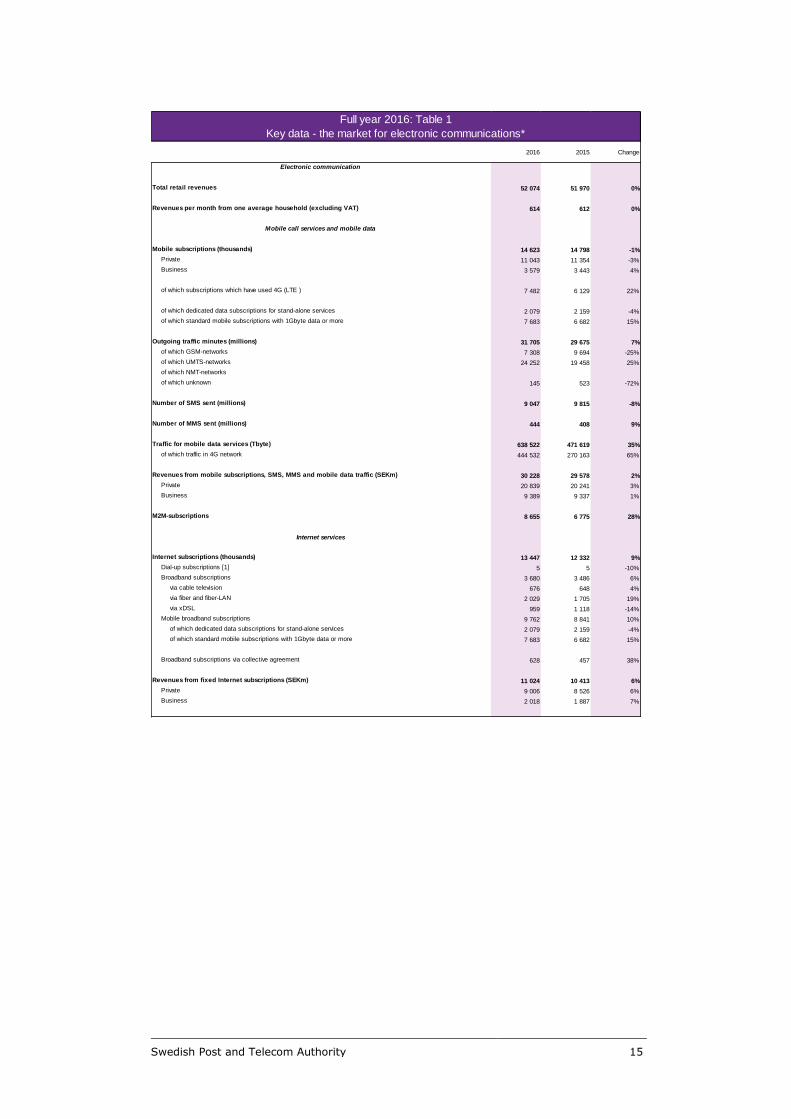
Tv-abonnemang via fiber fortsätter att öka medan tv-
abonnemang via marknätet minskar Totala antalet abonnemang på traditionell betal-tv uppgick till 5,3 miljoner, vilket var en ökning med 2 procent. Tv via fiber ökade med 23procent till 875 000 abonnemang och är nu den största digitala tv-plattformen. Av dessa var knappt hälften via fastighetsägare. Det fanns 2,4 miljoner analoga kabel-tv abonnemang vilket var en ökning med 2 procent. Betal-tv abonnemangen via marknätet minskar mer än tidigare (-12 procent). Vill du veta mer? På PTS statistikportal (www.statistik.pts.se), kan du söka och sortera statistik på de olika områdena. Där finns även data och marknadsandelar för enskilda aktörer tillgänglig.
Swedish Post and Telecom Authority 15
2016 2015 Change
Electronic communication
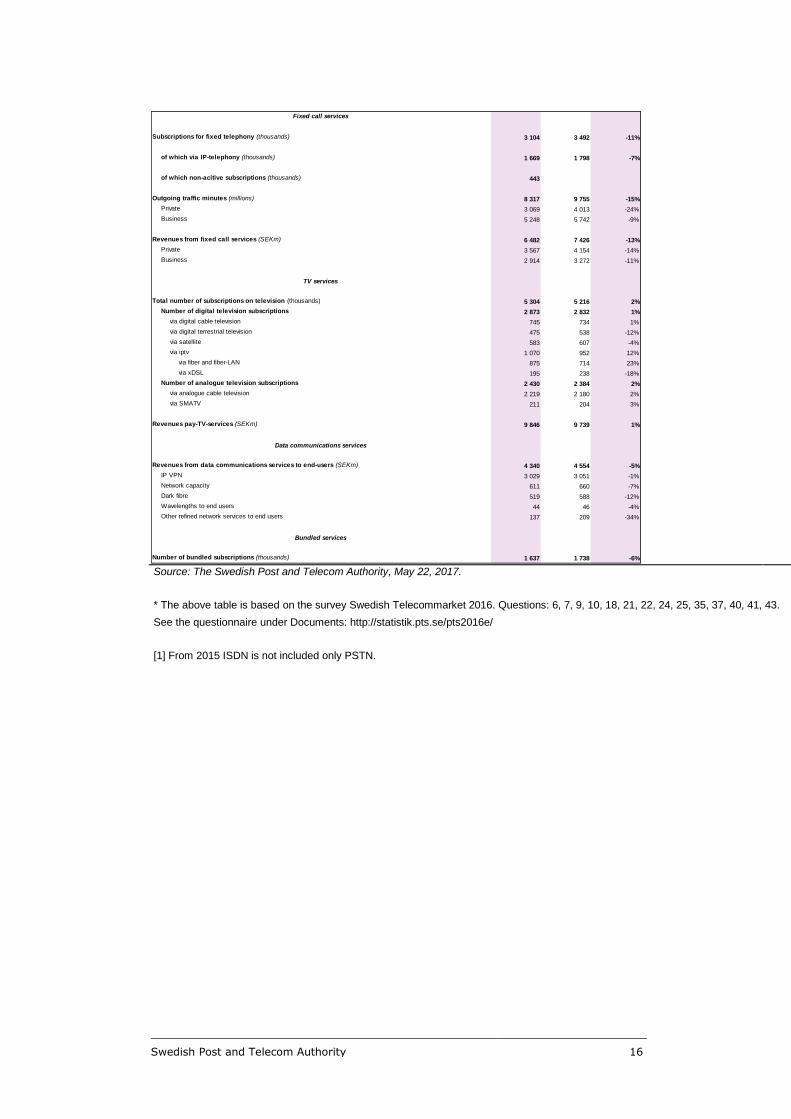
Total retail revenues 52 074 51 970 0%
Revenues per month from one average household (excluding VAT) 614 612 0%
Mobile call services and mobile data
Mobile subscriptions (thousands) 14 623 14 798 -1%
Private 11 043 11 354 -3%
Business 3 579 3 443 4%
of which subscriptions which have used 4G (LTE ) 7 482 6 129 22%
of which dedicated data subscriptions for stand-alone services 2 079 2 159 -4%
of which standard mobile subscriptions with 1Gbyte data or more 7 683 6 682 15%
Outgoing traffic minutes (millions) 31 705 29 675 7%
of which GSM-networks 7 308 9 694 -25%
of which UMTS-networks 24 252 19 458 25%
of which NMT-networks 0 0
of which unknown 145 523 -72%
Number of SMS sent (millions) 9 047 9 815 -8%
Number of MMS sent (millions) 444 408 9%
Traffic for mobile data services (Tbyte) 638 522 471 619 35%
of which traffic in 4G network 444 532 270 163 65%
Revenues from mobile subscriptions, SMS, MMS and mobile data traffic (SEKm) 30 228 29 578 2%
Private 20 839 20 241 3%
Business 9 389 9 337 1%
M2M-subscriptions 8 655 6 775 28%
Internet services
Internet subscriptions (thousands) 13 447 12 332 9%
Dial-up subscriptions [1] 5 5 -10%
Broadband subscriptions 3 680 3 486 6%
via cable television 676 648 4%
via fiber and fiber-LAN 2 029 1 705 19%
via xDSL 959 1 118 -14%
Mobile broadband subscriptions 9 762 8 841 10%
of which dedicated data subscriptions for stand-alone services 2 079 2 159 -4%
of which standard mobile subscriptions with 1Gbyte data or more 7 683 6 682 15%
Broadband subscriptions via collective agreement 628 457 38%
Revenues from fixed Internet subscriptions (SEKm) 11 024 10 413 6%
Private 9 006 8 526 6%
Business 2 018 1 887 7%
Full year 2016: Table 1
Key data - the market for electronic communications*
Swedish Post and Telecom Authority 16
Source: The Swedish Post and Telecom Authority, May 22, 2017. * The above table is based on the survey Swedish Telecommarket 2016. Questions: 6, 7, 9, 10, 18, 21, 22, 24, 25, 35, 37, 40, 41, 43.
See the questionnaire under Documents: http://statistik.pts.se/pts2016e/ [1] From 2015 ISDN is not included only PSTN.
Fixed call services
Subscriptions for fixed telephony (thousands) 3 104 3 492 -11%
of which via IP-telephony (thousands) 1 669 1 798 -7%
of which non-acitive subscriptions (thousands) 443 0
Outgoing traffic minutes (millions) 8 317 9 755 -15%
Private 3 069 4 013 -24%
Business 5 248 5 742 -9%
Revenues from fixed call services (SEKm) 6 482 7 426 -13%
Private 3 567 4 154 -14%
Business 2 914 3 272 -11%
TV services
Total number of subscriptions on television (thousands) 5 304 5 216 2%
Number of digital television subscriptions 2 873 2 832 1%
via digital cable television 745 734 1%
via digital terrestrial television 475 538 -12%
via satellite 583 607 -4%
via iptv 1 070 952 12%
via fiber and fiber-LAN 875 714 23%
via xDSL 195 238 -18%
Number of analogue television subscriptions 2 430 2 384 2%
via analogue cable television 2 219 2 180 2%
via SMATV 211 204 3%
Revenues pay-TV-services (SEKm) 9 846 9 739 1%
Data communications services
Revenues from data communications services to end-users (SEKm) 4 340 4 554 -5%
IP VPN 3 029 3 051 -1%
Network capacity 611 660 -7%
Dark fibre 519 588 -12%
Wavelengths to end users 44 46 -4%
Other refined network services to end users 137 209 -34%
Bundled services
Number of bundled subscriptions (thousands) 1 637 1 738 -6%
Swedish Post and Telecom Authority 17
1 Introduction
Purpose and assignment
The Swedish Post and Telecom Authority (PTS) has been tasked with monitoring service developments in the market for electronic communication, promoting competition within this market and providing information aimed at consumers. As a part of this assignment, PTS annually collects and publishes market data in this report, The Swedish Telecommunications Market. The Swedish Telecommunications Market is a descriptive report. The data is used in PTS’ analysis work within the authority’s area of responsibility.
About the survey
As in previous years, the report for 2016 is based on PTS’ own data collection, which covers developments at some 550 operators and other stakeholders.
The statistics for 2016 have been collected with the aid of an online questionnaire. The selection was based partly on the selection of organisations in previous years and partly on organisations of which PTS has been notified according to the Act (2003:389) regarding electronic communication (LEK). Data collection occurred during the period January to April 2017, and the initial contact was followed up with reminders by e-mail. Some companies that did not respond also had a telephone reminder. The questionnaire was sent to 550 organisations, 518 of which answered all questions in the survey. A further four organisations began to answer the questionnaire but did not finish it. The response rate was 95 per cent.
However collection and adjustment of operator data continues after the report the Swedish Telecommunications Market has been published, so that the PTS database for operator statistics is always updated. All figures refer to the situation on 31 December 2016, and comparisons are made with the same date in 2015 unless otherwise stated.
This year's report also shows the division into private and corporate subscriptions. The private subscriptions also include subscriptions of sole trader companies (that are registered with a personal ID number).
Unless otherwise stated, the information comes from PTS operator statistics. Another source, that is used for data on number porting, is the Swedish Number Portability Administrative Centre (SNPAC).
Swedish Post and Telecom Authority 18
About the report
The report describes the results in the sections:
2 Income in the market 3 Mobile services 4 Internet services (broadband) 5 Fixed line telephone services 6 TV services 7 Packaging 8 Data communication services and dark fibre to end customers 9 Ducting
A number of appendices also cover: 1 methods and definitions, 2 list of participants, 3 changes, 4 report tables and 5 quality declaration.
On the PTS statistics portal (www.statistik.pts.se), under the tab ”Swedish Telecommunications Market” the market shares of all those who received questionnaires is shown. There are market shares by income, traffic and subscriptions for the full years 2006-2016.
Swedish Post and Telecom Authority 19
2 Income in the market
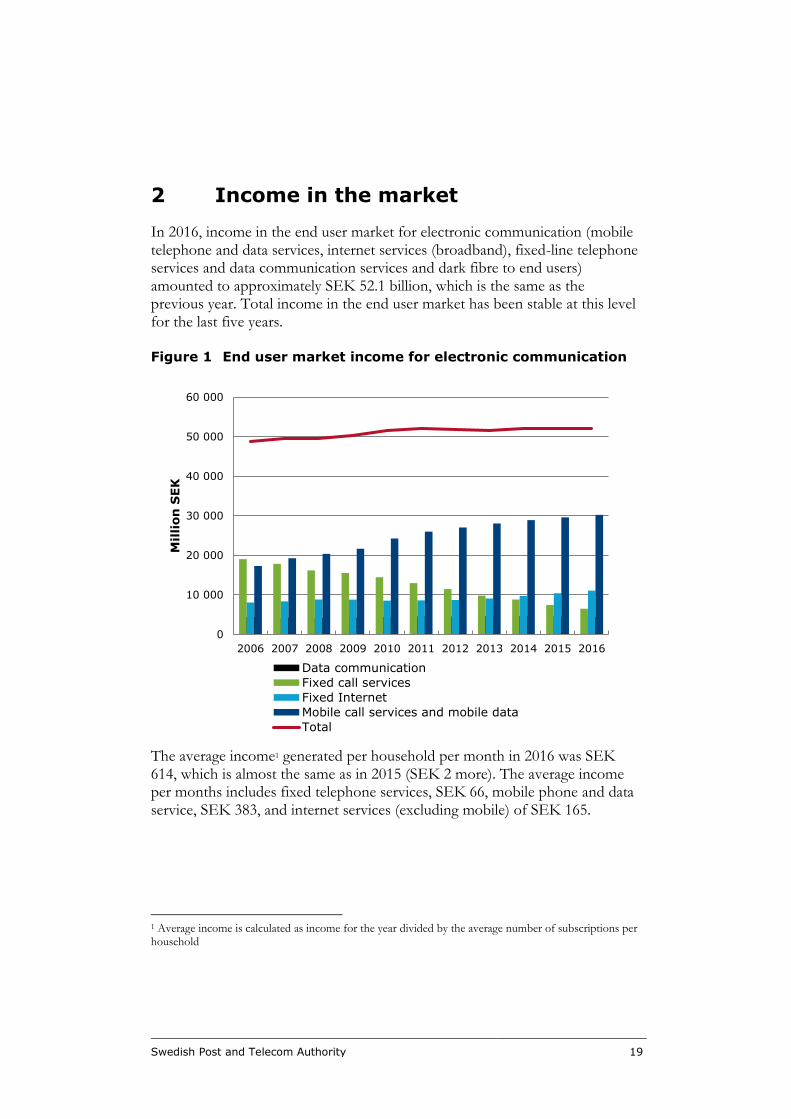
In 2016, income in the end user market for electronic communication (mobile telephone and data services, internet services (broadband), fixed-line telephone services and data communication services and dark fibre to end users) amounted to approximately SEK 52.1 billion, which is the same as the previous year. Total income in the end user market has been stable at this level for the last five years.
Figure 1 End user market income for electronic communication
The average income1 generated per household per month in 2016 was SEK 614, which is almost the same as in 2015 (SEK 2 more). The average income per months includes fixed telephone services, SEK 66, mobile phone and data service, SEK 383, and internet services (excluding mobile) of SEK 165.
1 Average income is calculated as income for the year divided by the average number of subscriptions per household
0
10 000
20 000
30 000
40 000
50 000
60 000
2006 2007 2008 2009 2010 2011 2012 2013 2014 2015 2016
Mil
lion
SEK
Data communication
Fixed call services
Fixed Internet
Mobile call services and mobile data
Total
Swedish Post and Telecom Authority 20
3 Mobile telephone and data services
All figures below refer to the situation on 31 December 2016, and comparisons are made with the same date in 2015.
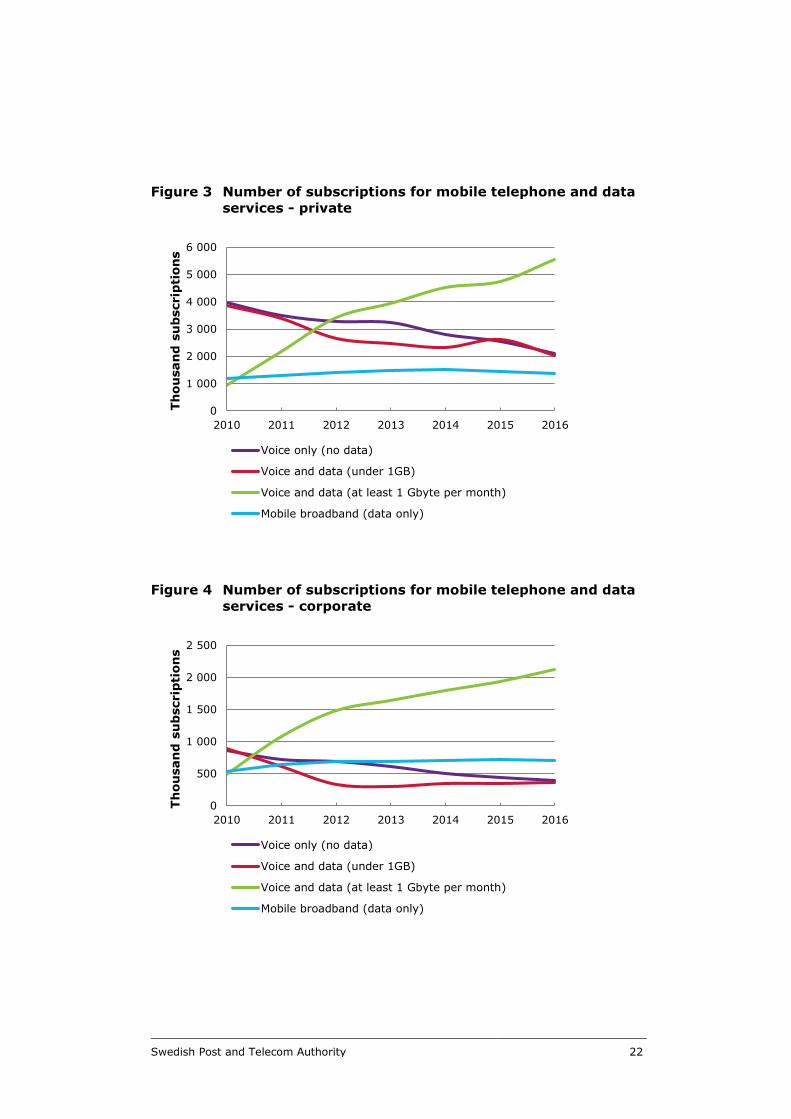
3.1 Subscriptions - Mobile telephone and data services
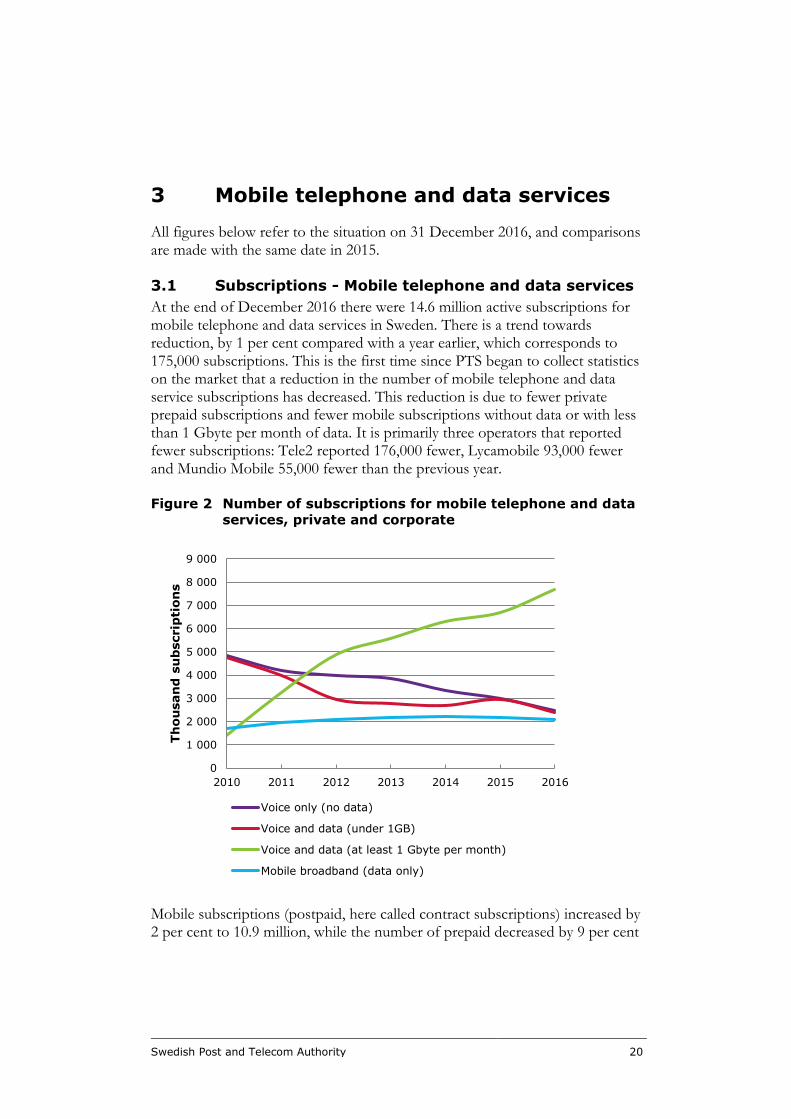
At the end of December 2016 there were 14.6 million active subscriptions for mobile telephone and data services in Sweden. There is a trend towards reduction, by 1 per cent compared with a year earlier, which corresponds to 175,000 subscriptions. This is the first time since PTS began to collect statistics on the market that a reduction in the number of mobile telephone and data service subscriptions has decreased. This reduction is due to fewer private prepaid subscriptions and fewer mobile subscriptions without data or with less than 1 Gbyte per month of data. It is primarily three operators that reported fewer subscriptions: Tele2 reported 176,000 fewer, Lycamobile 93,000 fewer and Mundio Mobile 55,000 fewer than the previous year.
Figure 2 Number of subscriptions for mobile telephone and data
services, private and corporate
Mobile subscriptions (postpaid, here called contract subscriptions) increased by 2 per cent to 10.9 million, while the number of prepaid decreased by 9 per cent
0
1 000
2 000
3 000
4 000
5 000
6 000
7 000
8 000
9 000
2010 2011 2012 2013 2014 2015 2016
Th
ou
san
d s
ub
scrip
tion
s
Voice only (no data)
Voice and data (under 1GB)
Voice and data (at least 1 Gbyte per month)
Mobile broadband (data only)
Swedish Post and Telecom Authority 21
to 3.7 million. The proportion of prepaid has fallen over the last decade and represented 26 per cent of all subscriptions in 2016. The corresponding figure was 57 per cent ten years ago.
Fewer mobile subscriptions for voice only, without data
The number of mobile subscriptions for voice services only was 2.5 million, which represents a reduction of 17 per cent.
The number of mobile subscriptions with little data (less than 1Gbyte
(GB) per month) is falling
The number of mobile subscriptions with both voice and data services that included less than 1Gbyte was 2.4 million. This is a reduction of 20 per cent.
Mobile subscriptions with 1 Gbyte (GB) or more per month continue to
increase
The number of mobile subscriptions with both voice and 1 Gbyte a month or more of data services (mainly smartphones) continued to increase and amounted to 7.7 million, which is an increase of 15 per cent.
Mobile broadband subscriptions with only data continue to fall
There were 2.1 subscriptions for mobile broadband with telephone services2 which is a reduction of 4 per cent. These subscriptions are used for dongles or mobile routers.
Number of subscriptions for voice and data services, by private and corporate
The figures below show the number of subscriptions by private and corporate subscribers. Subscriptions with only voice services and subscriptions with voice and data services of less than 1 Gbyte used to be common among private user, but have fallen considerably in recent years.
2 Subscriptions that have only been used for data and not generated any telephone traffic at all in the last quarter of the period.
Swedish Post and Telecom Authority 22
Figure 3 Number of subscriptions for mobile telephone and data
services - private
Figure 4 Number of subscriptions for mobile telephone and data
services - corporate
0
1 000
2 000
3 000
4 000
5 000
6 000
2010 2011 2012 2013 2014 2015 2016
Th
ou
san
d s
ub
scrip
tion
s
Voice only (no data)
Voice and data (under 1GB)
Voice and data (at least 1 Gbyte per month)
Mobile broadband (data only)
0
500
1 000
1 500
2 000
2 500
2010 2011 2012 2013 2014 2015 2016
Th
ou
san
d s
ub
scrip
tion
s
Voice only (no data)
Voice and data (under 1GB)
Voice and data (at least 1 Gbyte per month)
Mobile broadband (data only)
Swedish Post and Telecom Authority 23
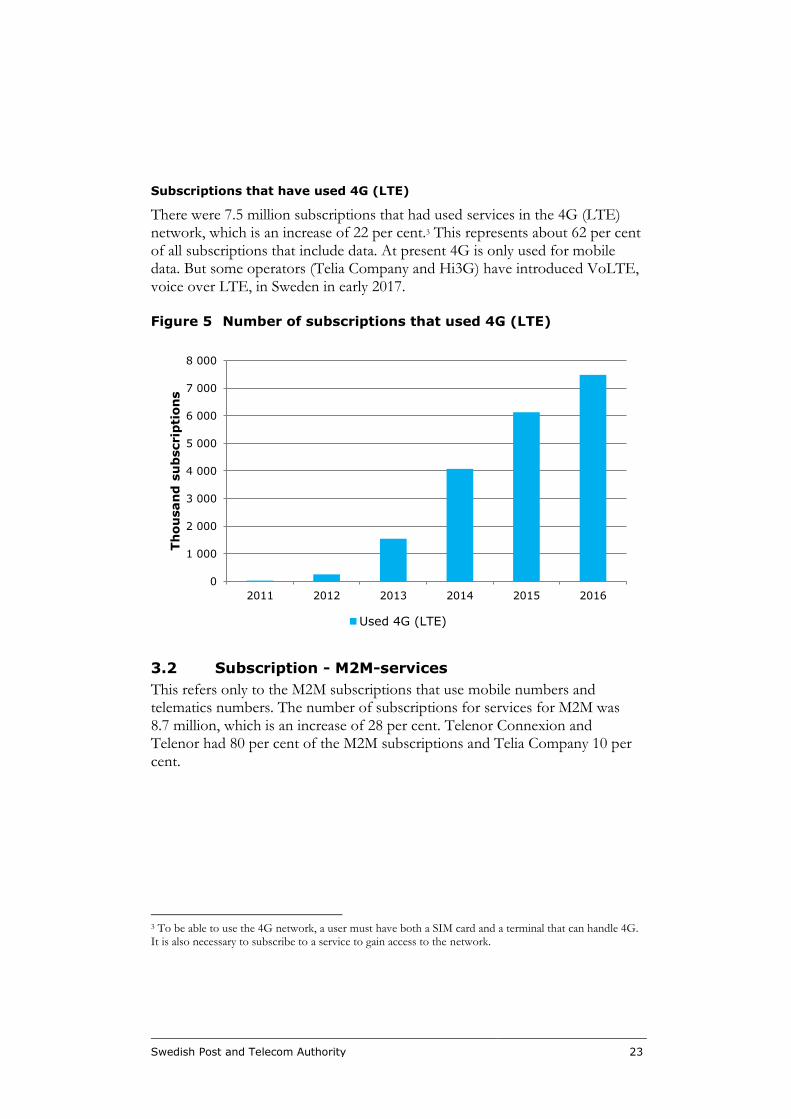
Subscriptions that have used 4G (LTE)
There were 7.5 million subscriptions that had used services in the 4G (LTE) network, which is an increase of 22 per cent.3 This represents about 62 per cent of all subscriptions that include data. At present 4G is only used for mobile data. But some operators (Telia Company and Hi3G) have introduced VoLTE, voice over LTE, in Sweden in early 2017.
Figure 5 Number of subscriptions that used 4G (LTE)
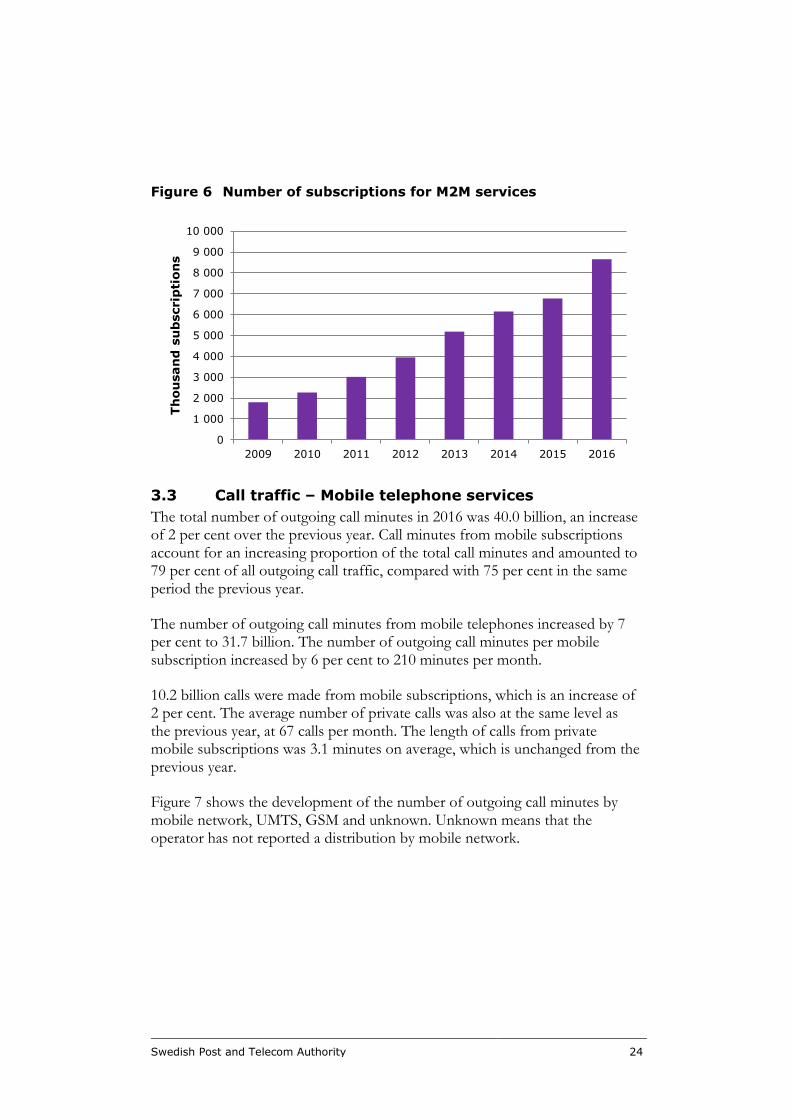
3.2 Subscription - M2M-services
This refers only to the M2M subscriptions that use mobile numbers and telematics numbers. The number of subscriptions for services for M2M was 8.7 million, which is an increase of 28 per cent. Telenor Connexion and Telenor had 80 per cent of the M2M subscriptions and Telia Company 10 per cent.
3 To be able to use the 4G network, a user must have both a SIM card and a terminal that can handle 4G. It is also necessary to subscribe to a service to gain access to the network.
0
1 000
2 000
3 000
4 000
5 000
6 000
7 000
8 000
2011 2012 2013 2014 2015 2016
Th
ou
san
d s
ub
scrip
tion
s
Used 4G (LTE)
Swedish Post and Telecom Authority 24
Figure 6 Number of subscriptions for M2M services
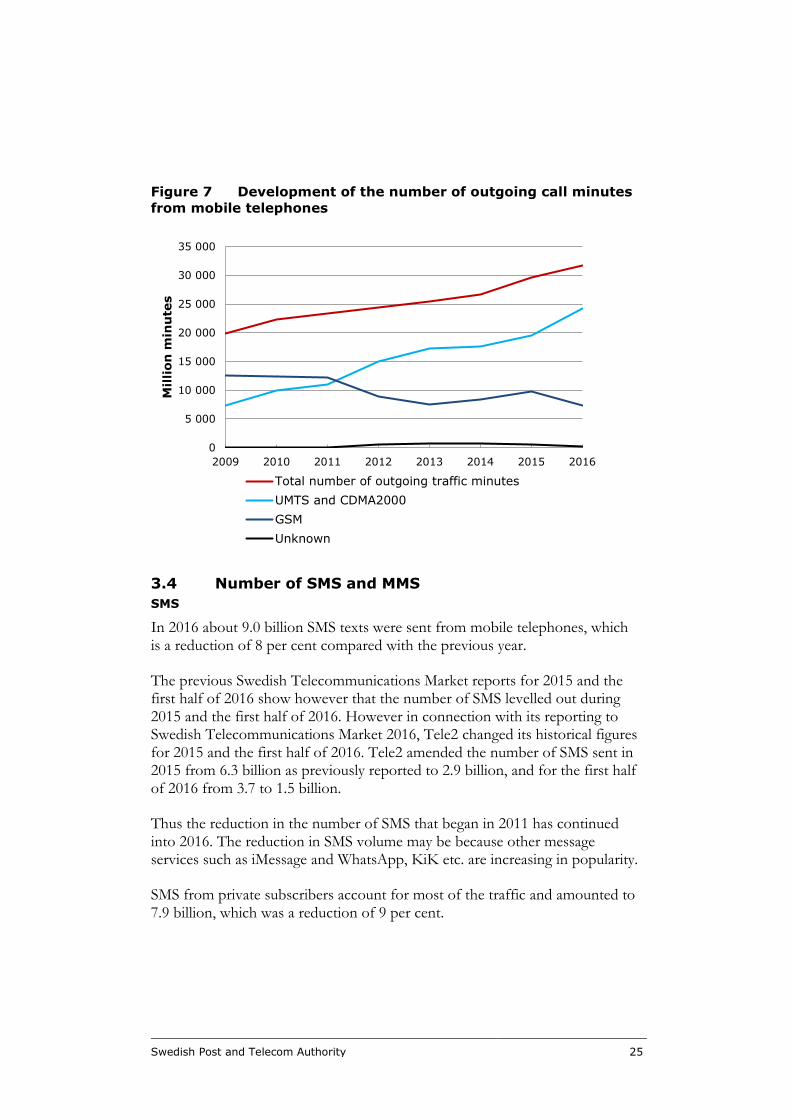
3.3 Call traffic – Mobile telephone services
The total number of outgoing call minutes in 2016 was 40.0 billion, an increase of 2 per cent over the previous year. Call minutes from mobile subscriptions account for an increasing proportion of the total call minutes and amounted to 79 per cent of all outgoing call traffic, compared with 75 per cent in the same period the previous year.
The number of outgoing call minutes from mobile telephones increased by 7 per cent to 31.7 billion. The number of outgoing call minutes per mobile subscription increased by 6 per cent to 210 minutes per month.
10.2 billion calls were made from mobile subscriptions, which is an increase of 2 per cent. The average number of private calls was also at the same level as the previous year, at 67 calls per month. The length of calls from private mobile subscriptions was 3.1 minutes on average, which is unchanged from the previous year.
Figure 7 shows the development of the number of outgoing call minutes by mobile network, UMTS, GSM and unknown. Unknown means that the operator has not reported a distribution by mobile network.
0
1 000
2 000
3 000
4 000
5 000
6 000
7 000
8 000
9 000
10 000
2009 2010 2011 2012 2013 2014 2015 2016
Th
ou
san
d s
ub
scrip
tion
s
Swedish Post and Telecom Authority 25
Figure 7 Development of the number of outgoing call minutes
from mobile telephones
3.4 Number of SMS and MMS
SMS
In 2016 about 9.0 billion SMS texts were sent from mobile telephones, which is a reduction of 8 per cent compared with the previous year.
The previous Swedish Telecommunications Market reports for 2015 and the first half of 2016 show however that the number of SMS levelled out during 2015 and the first half of 2016. However in connection with its reporting to Swedish Telecommunications Market 2016, Tele2 changed its historical figures for 2015 and the first half of 2016. Tele2 amended the number of SMS sent in 2015 from 6.3 billion as previously reported to 2.9 billion, and for the first half of 2016 from 3.7 to 1.5 billion.
Thus the reduction in the number of SMS that began in 2011 has continued into 2016. The reduction in SMS volume may be because other message services such as iMessage and WhatsApp, KiK etc. are increasing in popularity.
SMS from private subscribers account for most of the traffic and amounted to 7.9 billion, which was a reduction of 9 per cent.
0
5 000
10 000
15 000
20 000
25 000
30 000
35 000
2009 2010 2011 2012 2013 2014 2015 2016
Mil
lion
min
ute
s
Total number of outgoing traffic minutes
UMTS and CDMA2000
GSM
Unknown
Swedish Post and Telecom Authority 26
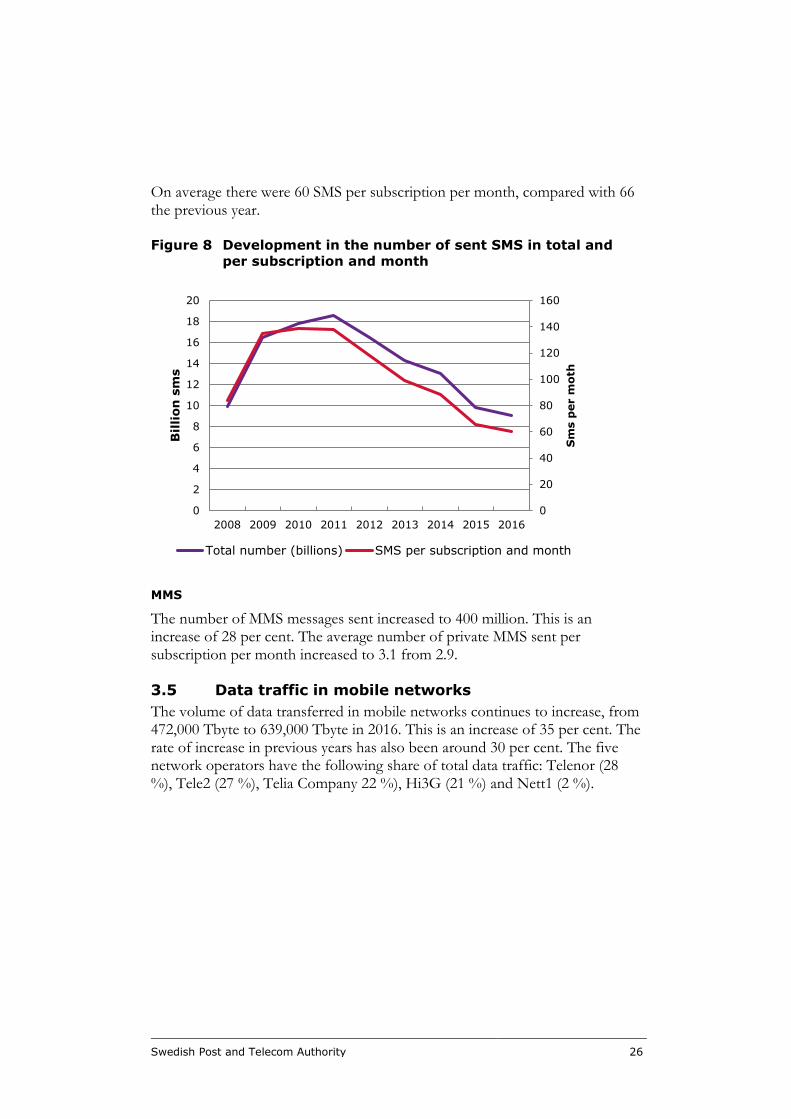
On average there were 60 SMS per subscription per month, compared with 66 the previous year.
Figure 8 Development in the number of sent SMS in total and
per subscription and month
MMS
The number of MMS messages sent increased to 400 million. This is an increase of 28 per cent. The average number of private MMS sent per subscription per month increased to 3.1 from 2.9.
3.5 Data traffic in mobile networks
The volume of data transferred in mobile networks continues to increase, from 472,000 Tbyte to 639,000 Tbyte in 2016. This is an increase of 35 per cent. The rate of increase in previous years has also been around 30 per cent. The five network operators have the following share of total data traffic: Telenor (28 %), Tele2 (27 %), Telia Company 22 %), Hi3G (21 %) and Nett1 (2 %).
0
20
40
60
80
100
120
140
160
0
2
4
6
8
10
12
14
16
18
20
2008 2009 2010 2011 2012 2013 2014 2015 2016
Sm
s p
er m
oth
Bil
lion
sm
s
Total number (billions) SMS per subscription and month
Swedish Post and Telecom Authority 27
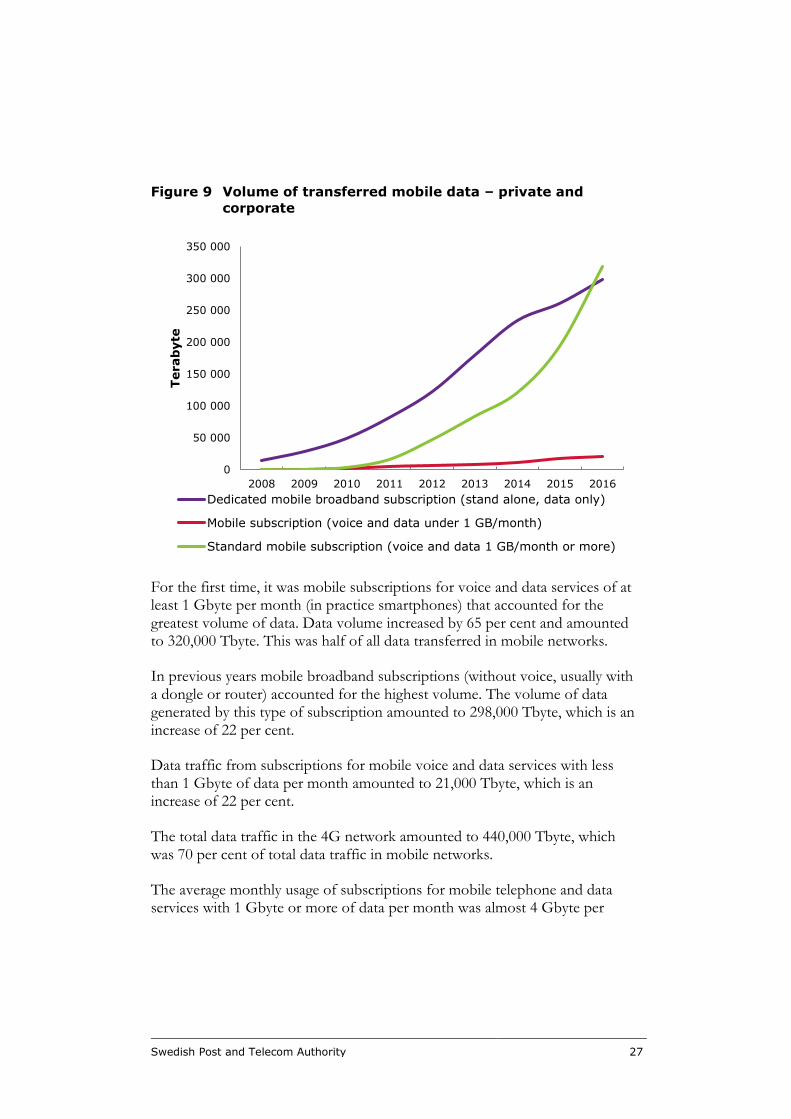
Figure 9 Volume of transferred mobile data – private and
corporate
For the first time, it was mobile subscriptions for voice and data services of at least 1 Gbyte per month (in practice smartphones) that accounted for the greatest volume of data. Data volume increased by 65 per cent and amounted to 320,000 Tbyte. This was half of all data transferred in mobile networks.
In previous years mobile broadband subscriptions (without voice, usually with a dongle or router) accounted for the highest volume. The volume of data generated by this type of subscription amounted to 298,000 Tbyte, which is an increase of 22 per cent.
Data traffic from subscriptions for mobile voice and data services with less than 1 Gbyte of data per month amounted to 21,000 Tbyte, which is an increase of 22 per cent.
The total data traffic in the 4G network amounted to 440,000 Tbyte, which was 70 per cent of total data traffic in mobile networks.
The average monthly usage of subscriptions for mobile telephone and data services with 1 Gbyte or more of data per month was almost 4 Gbyte per
0
50 000
100 000
150 000
200 000
250 000
300 000
350 000
2008 2009 2010 2011 2012 2013 2014 2015 2016
Terab
yte
Dedicated mobile broadband subscription (stand alone, data only)
Mobile subscription (voice and data under 1 GB/month)
Standard mobile subscription (voice and data 1 GB/month or more)
Swedish Post and Telecom Authority 28
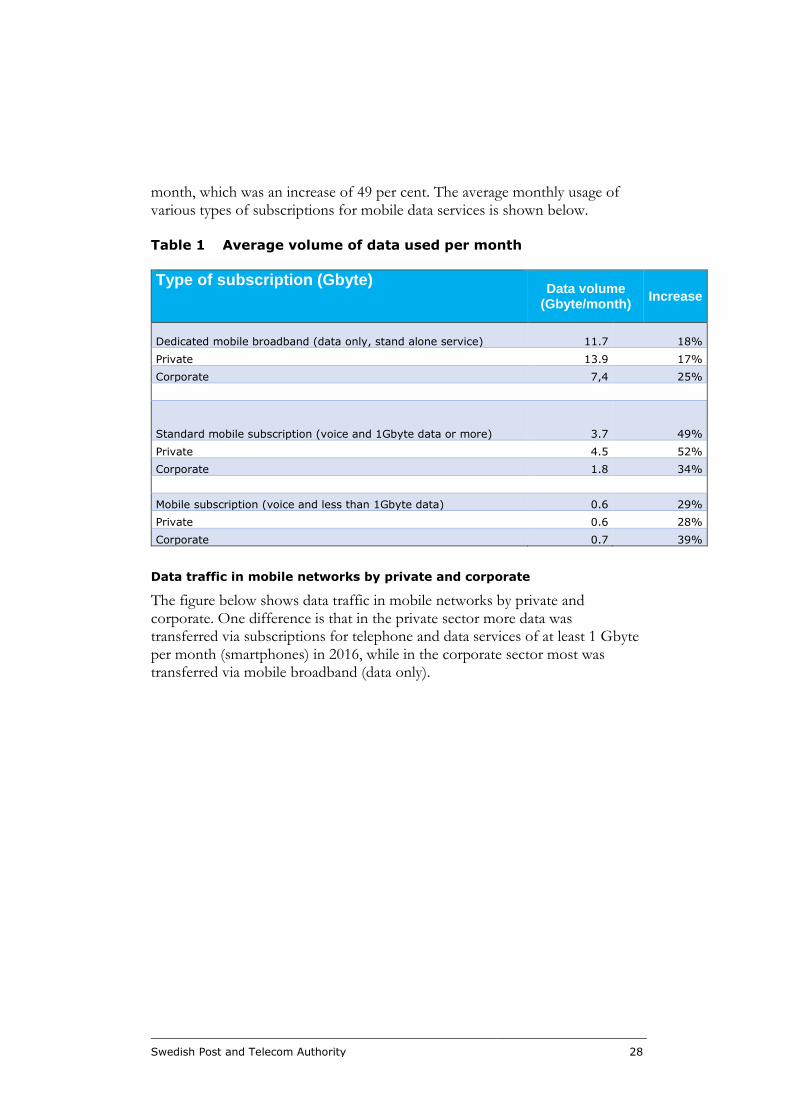
month, which was an increase of 49 per cent. The average monthly usage of various types of subscriptions for mobile data services is shown below.
Table 1 Average volume of data used per month
Type of subscription (Gbyte) Data volume
(Gbyte/month) Increase
Dedicated mobile broadband (data only, stand alone service) 11.7 18%
Private 13.9 17%
Corporate 7,4 25%
Standard mobile subscription (voice and 1Gbyte data or more) 3.7 49%
Private 4.5 52%
Corporate 1.8 34%
Mobile subscription (voice and less than 1Gbyte data) 0.6 29%
Private 0.6 28%
Corporate 0.7 39%
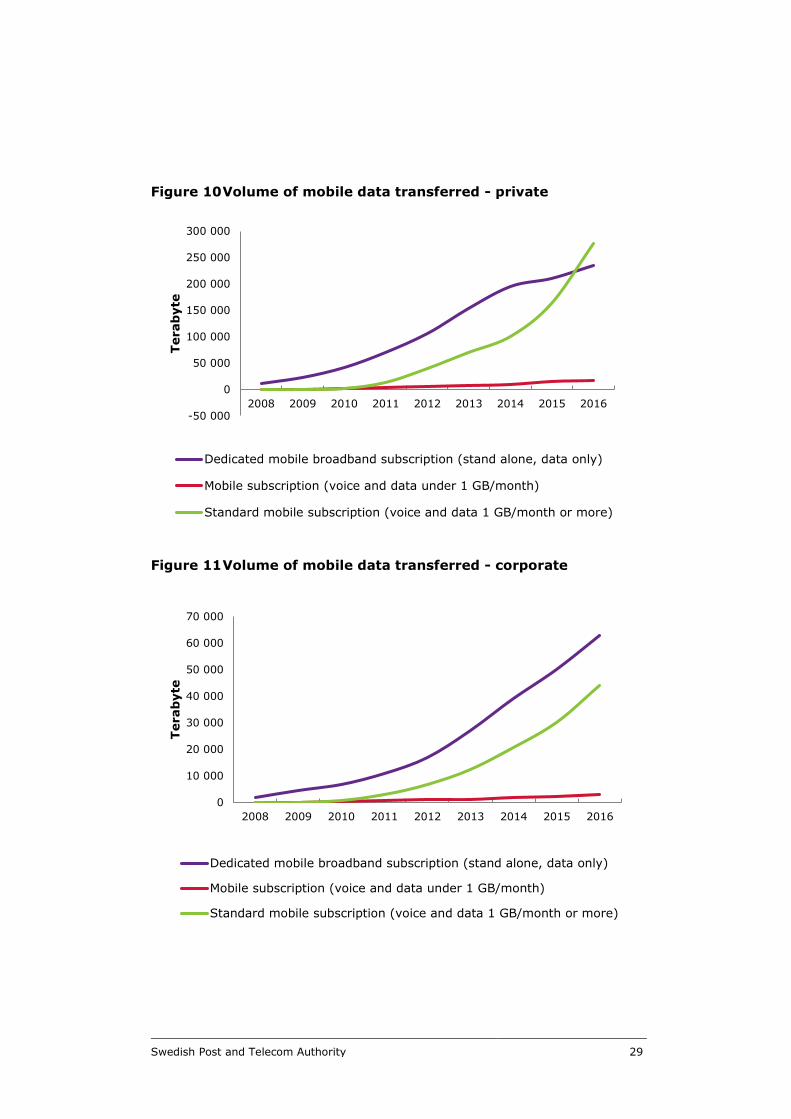
Data traffic in mobile networks by private and corporate
The figure below shows data traffic in mobile networks by private and corporate. One difference is that in the private sector more data was transferred via subscriptions for telephone and data services of at least 1 Gbyte per month (smartphones) in 2016, while in the corporate sector most was transferred via mobile broadband (data only).
Swedish Post and Telecom Authority 29
Figure 10 Volume of mobile data transferred - private
Figure 11 Volume of mobile data transferred - corporate
-50 000
0
50 000
100 000
150 000
200 000
250 000
300 000
2008 2009 2010 2011 2012 2013 2014 2015 2016
Terab
yte
Dedicated mobile broadband subscription (stand alone, data only)
Mobile subscription (voice and data under 1 GB/month)
Standard mobile subscription (voice and data 1 GB/month or more)
0
10 000
20 000
30 000
40 000
50 000
60 000
70 000
2008 2009 2010 2011 2012 2013 2014 2015 2016
Terab
yte
Dedicated mobile broadband subscription (stand alone, data only)
Mobile subscription (voice and data under 1 GB/month)
Standard mobile subscription (voice and data 1 GB/month or more)
Swedish Post and Telecom Authority 30
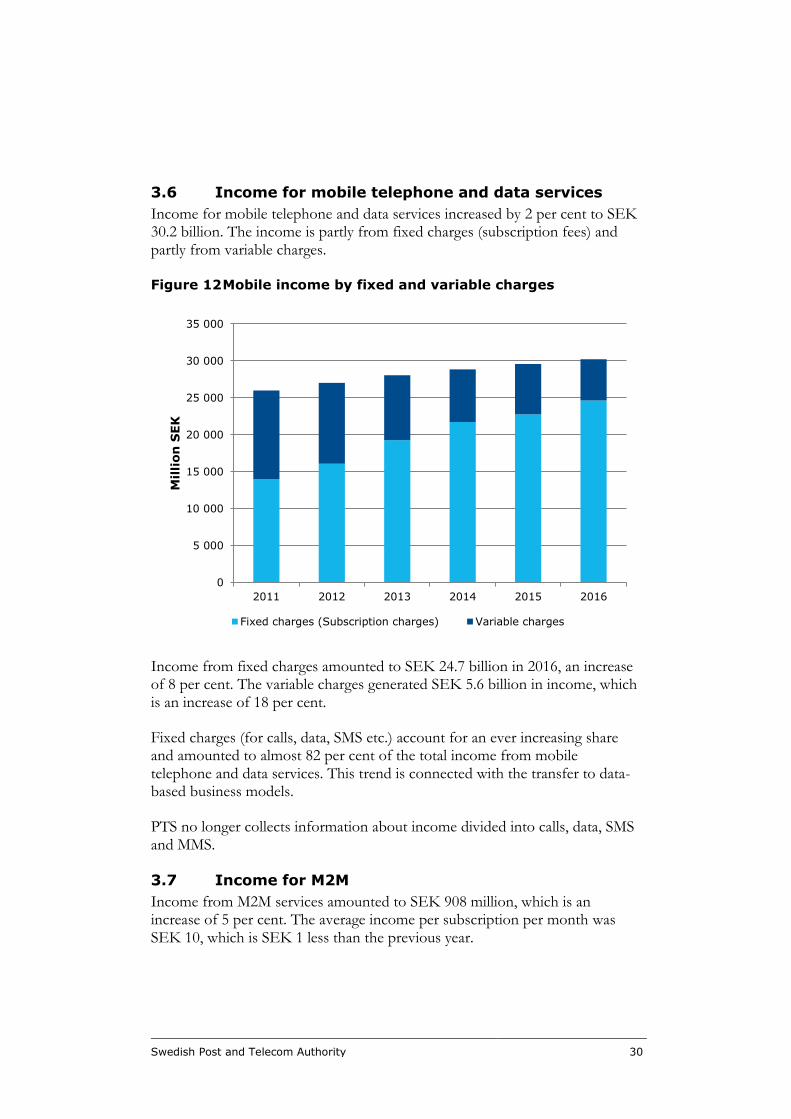
3.6 Income for mobile telephone and data services
Income for mobile telephone and data services increased by 2 per cent to SEK 30.2 billion. The income is partly from fixed charges (subscription fees) and partly from variable charges.
Figure 12 Mobile income by fixed and variable charges
Income from fixed charges amounted to SEK 24.7 billion in 2016, an increase of 8 per cent. The variable charges generated SEK 5.6 billion in income, which is an increase of 18 per cent.
Fixed charges (for calls, data, SMS etc.) account for an ever increasing share and amounted to almost 82 per cent of the total income from mobile telephone and data services. This trend is connected with the transfer to data-based business models.
PTS no longer collects information about income divided into calls, data, SMS and MMS.
3.7 Income for M2M
Income from M2M services amounted to SEK 908 million, which is an increase of 5 per cent. The average income per subscription per month was SEK 10, which is SEK 1 less than the previous year.
0
5 000
10 000
15 000
20 000
25 000
30 000
35 000
2011 2012 2013 2014 2015 2016
Mil
lion
SEK
Fixed charges (Subscription charges) Variable charges
Swedish Post and Telecom Authority 31
3.8 Income for interconnection in mobile networks
Interconnection means that a call is made from a fixed line or mobile network and then terminated in another fixed line or mobile network. Calls that are made within the same network are not counted as interconnection. For this reason, the total volume of interconnection minutes is less than the total volume of outgoing traffic minutes.In 2016, 14.1 billion minutes were terminated in the mobile networks, an increase of 9 per cent over 2015, when 13 billion minutes were terminated. Interconnection income from mobile telephony amounted to almost SEK 1 billion in 2016, which is the same level as in 2015. The average income per minute for termination of incoming mobile traffic from national operators was SEK 0.074, a decrease of SEK 0.008 compared with the year before.
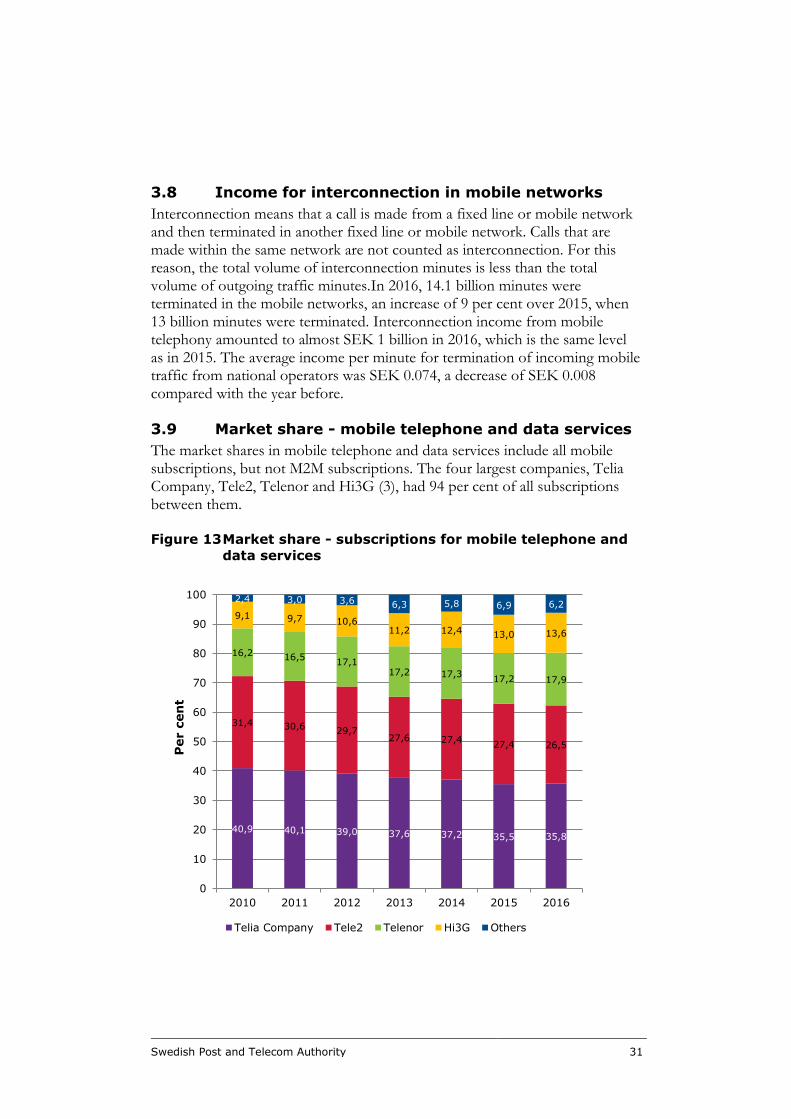
3.9 Market share - mobile telephone and data services
The market shares in mobile telephone and data services include all mobile subscriptions, but not M2M subscriptions. The four largest companies, Telia Company, Tele2, Telenor and Hi3G (3), had 94 per cent of all subscriptions between them.
Figure 13 Market share - subscriptions for mobile telephone and
data services
40,9 40,1 39,0 37,6 37,2 35,5 35,8
31,4 30,6 29,727,6 27,4
27,4 26,5
16,2 16,517,1
17,2 17,317,2 17,9
9,1 9,7 10,611,2 12,4 13,0 13,6
2,4 3,0 3,6 6,3 5,8 6,9 6,2
0
10
20
30
40
50
60
70
80
90
100
2010 2011 2012 2013 2014 2015 2016
Per c
en
t
Telia Company Tele2 Telenor Hi3G Others
Swedish Post and Telecom Authority 32
Tele 2 (excluding TDC) lost market share from 27.4 to 26.5 per cent. Hi3G continued to increase its market share, from 13.0 per cent to 13.6. With 2 per cent of the subscription market, Lycamobile was the biggest in the “others” category, although its market share was reduced from 3.0 per cent. In the “others” category, TDC (acquired by Tele2 in 2016) increased to 1.3 per cent.
In The Swedish Telecommunications Market, brands are not compared, so Hallon for example is included in Hi3G and Halebop is included in Telia Company.
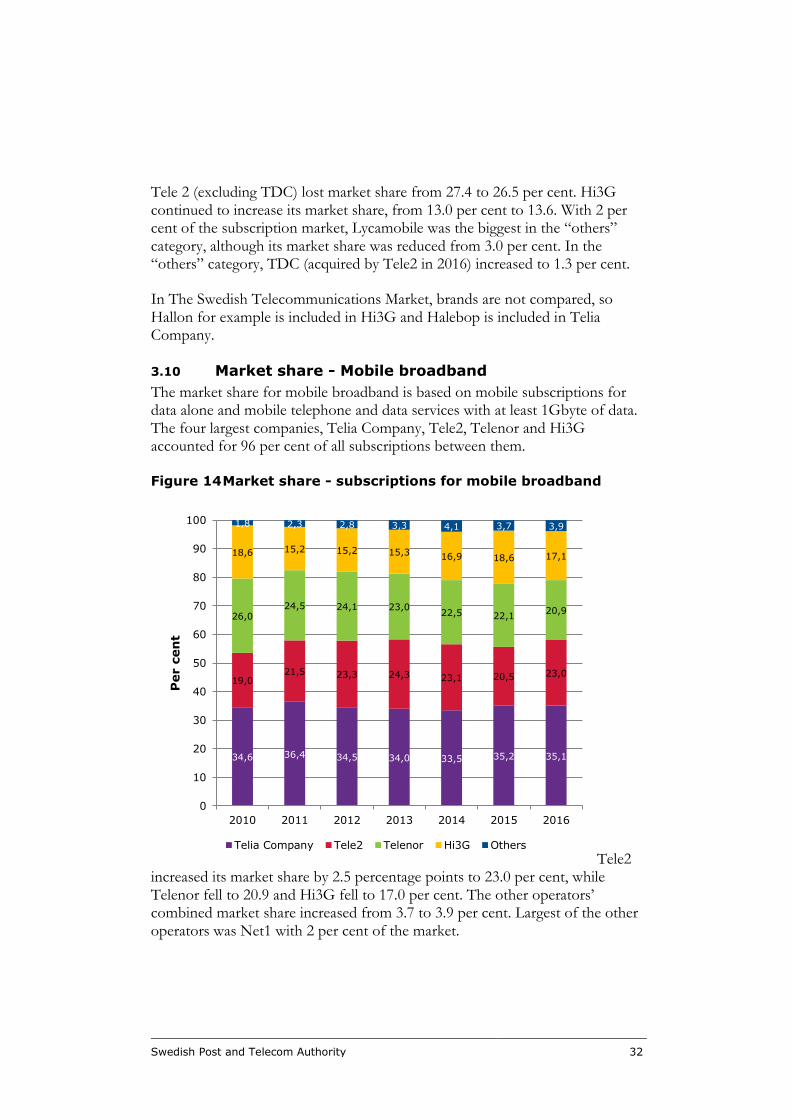
3.10 Market share - Mobile broadband
The market share for mobile broadband is based on mobile subscriptions for data alone and mobile telephone and data services with at least 1Gbyte of data. The four largest companies, Telia Company, Tele2, Telenor and Hi3G accounted for 96 per cent of all subscriptions between them.
Figure 14 Market share - subscriptions for mobile broadband
Tele2 increased its market share by 2.5 percentage points to 23.0 per cent, while Telenor fell to 20.9 and Hi3G fell to 17.0 per cent. The other operators’ combined market share increased from 3.7 to 3.9 per cent. Largest of the other operators was Net1 with 2 per cent of the market.
34,6 36,4 34,5 34,0 33,5 35,2 35,1
19,021,5 23,3 24,3 23,1 20,5 23,0
26,024,5 24,1 23,0
22,5 22,120,9
18,6 15,2 15,2 15,3 16,9 18,6 17,1
1,8 2,3 2,8 3,3 4,1 3,7 3,9
0
10
20
30
40
50
60
70
80
90
100
2010 2011 2012 2013 2014 2015 2016
Per c
en
t
Telia Company Tele2 Telenor Hi3G Others
Swedish Post and Telecom Authority 33
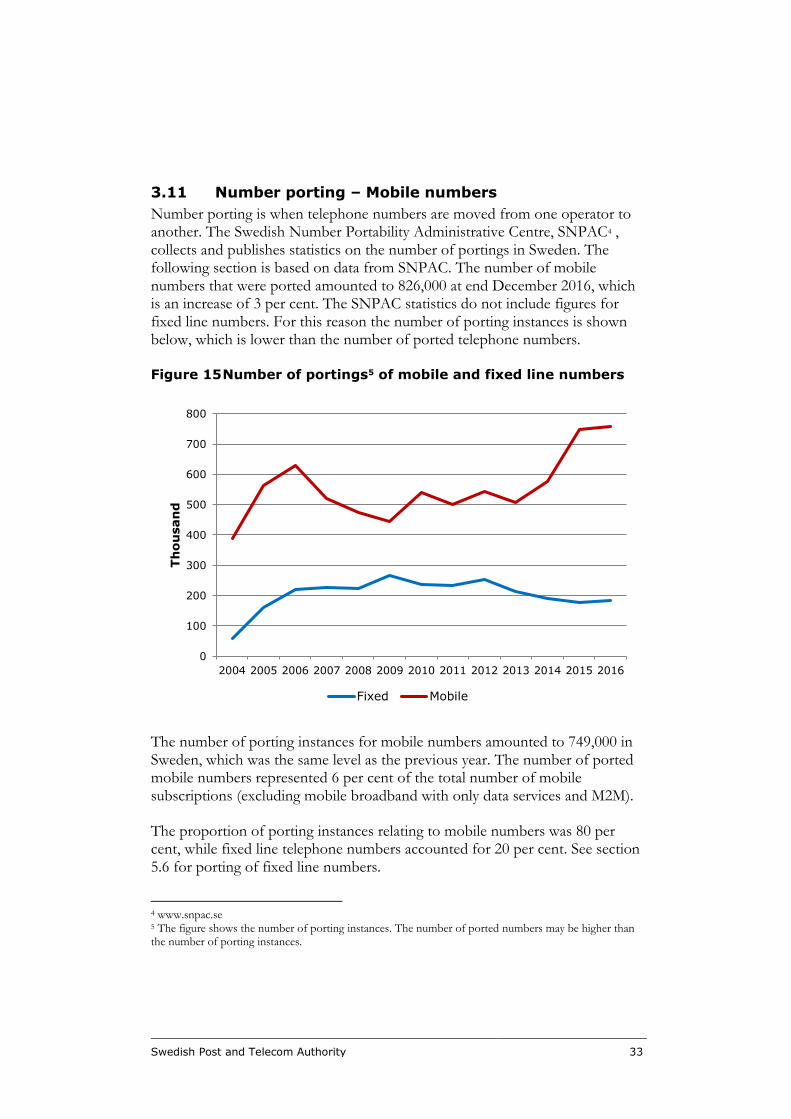
3.11 Number porting – Mobile numbers
Number porting is when telephone numbers are moved from one operator to another. The Swedish Number Portability Administrative Centre, SNPAC4 , collects and publishes statistics on the number of portings in Sweden. The following section is based on data from SNPAC. The number of mobile numbers that were ported amounted to 826,000 at end December 2016, which is an increase of 3 per cent. The SNPAC statistics do not include figures for fixed line numbers. For this reason the number of porting instances is shown below, which is lower than the number of ported telephone numbers.
Figure 15 Number of portings5 of mobile and fixed line numbers
The number of porting instances for mobile numbers amounted to 749,000 in Sweden, which was the same level as the previous year. The number of ported mobile numbers represented 6 per cent of the total number of mobile subscriptions (excluding mobile broadband with only data services and M2M).
The proportion of porting instances relating to mobile numbers was 80 per cent, while fixed line telephone numbers accounted for 20 per cent. See section 5.6 for porting of fixed line numbers.
4 www.snpac.se 5 The figure shows the number of porting instances. The number of ported numbers may be higher than the number of porting instances.
0
100
200
300
400
500
600
700
800
2004 2005 2006 2007 2008 2009 2010 2011 2012 2013 2014 2015 2016
Th
ou
san
d
Fixed Mobile
Swedish Post and Telecom Authority 34
4 Internet services
All information below refers to 31 December 2016, and comparisons are made with the same date in 2015.
4.1 Subscriptions - Internet services
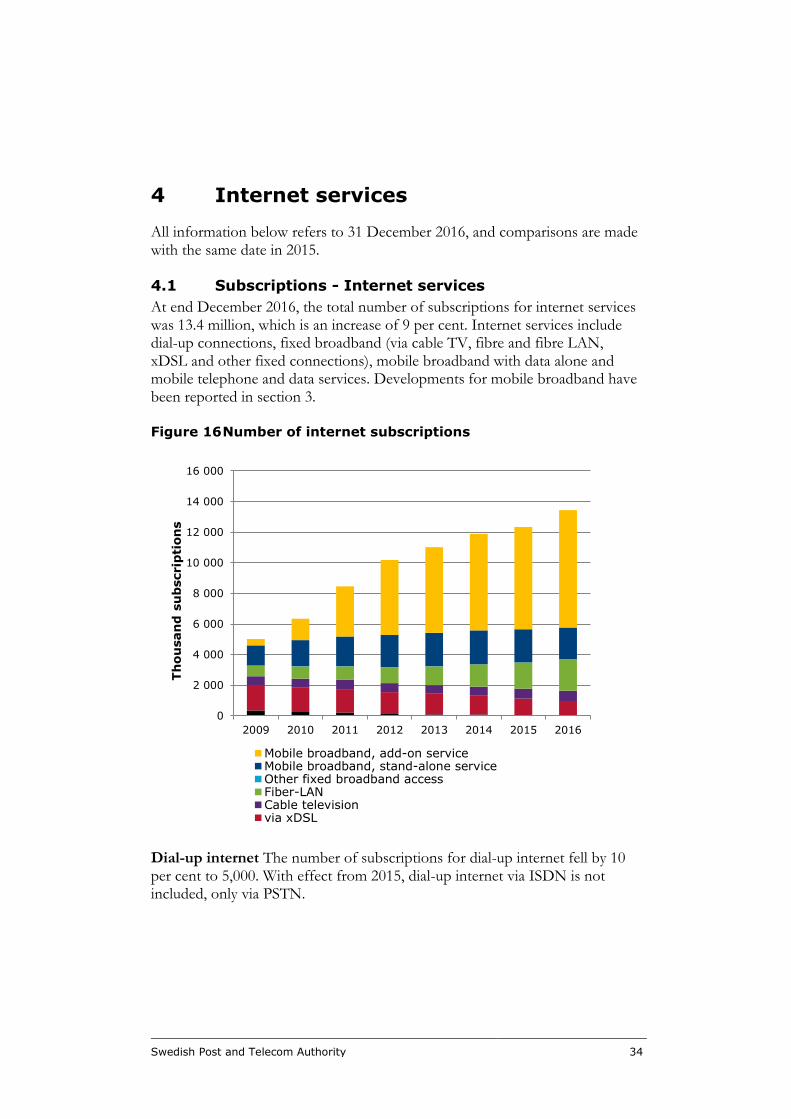
At end December 2016, the total number of subscriptions for internet services was 13.4 million, which is an increase of 9 per cent. Internet services include dial-up connections, fixed broadband (via cable TV, fibre and fibre LAN, xDSL and other fixed connections), mobile broadband with data alone and mobile telephone and data services. Developments for mobile broadband have been reported in section 3.
Figure 16 Number of internet subscriptions
Dial-up internet The number of subscriptions for dial-up internet fell by 10 per cent to 5,000. With effect from 2015, dial-up internet via ISDN is not included, only via PSTN.
0
2 000
4 000
6 000
8 000
10 000
12 000
14 000
16 000
2009 2010 2011 2012 2013 2014 2015 2016
Th
ou
san
d s
ub
scrip
tion
s
Mobile broadband, add-on serviceMobile broadband, stand-alone serviceOther fixed broadband accessFiber-LANCable televisionvia xDSL
Swedish Post and Telecom Authority 35
Subscriptions for fixed broadband
There were 3.68 million subscriptions for fixed broadband, which corresponds to an annual growth of 6 per cent.
Since 2010, fibre (including fibre LAN) has accounted for most of the growth of fixed broadband subscriptions. The number of subscriptions via fibre increased by 19 per cent and amounted to 2.02 million. Subscriptions for fibre and fibre LAN now represent more than half (55%) of all fixed broadband subscriptions. The four largest providers by number of fibre and fibre LAN subscriptions are Telia Company, Telenor, Bredband2 and Bahnhof which together accounted for 75 per cent of all subscriptions.
The number of subscriptions for xDSL continued to fall. They amounted to 960,000, which was a fall of 14 per cent. The number of subscriptions for broadband via cable TV networks amounted to 670,000, which was an increase of 4 per cent. Com Hem accounted for 93 per cent of all cable TV subscriptions. “Other fixed broadband subscriptions” remained at 15,000. “Other fixed broadband subscriptions” includes fixed radio, satellite and other fixed broadband connections. The number of subscriptions for fixed radio amounted to 8,000, which was an increase of 34 per cent. There were 600 broadband subscriptions via satellite, which was an increase of 200.
Swedish Post and Telecom Authority 36
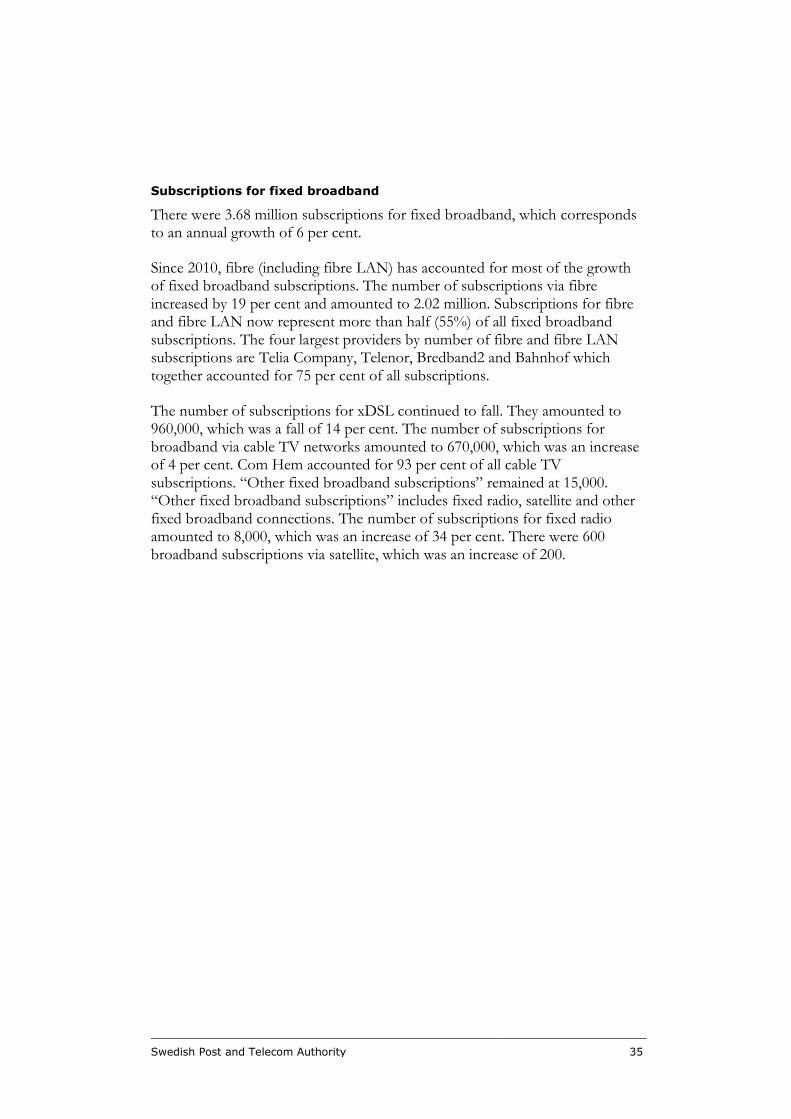
Figure 17 Development of subscriptions for broadband - private
and corporate
Development of subscriptions for broadband by private and corporate
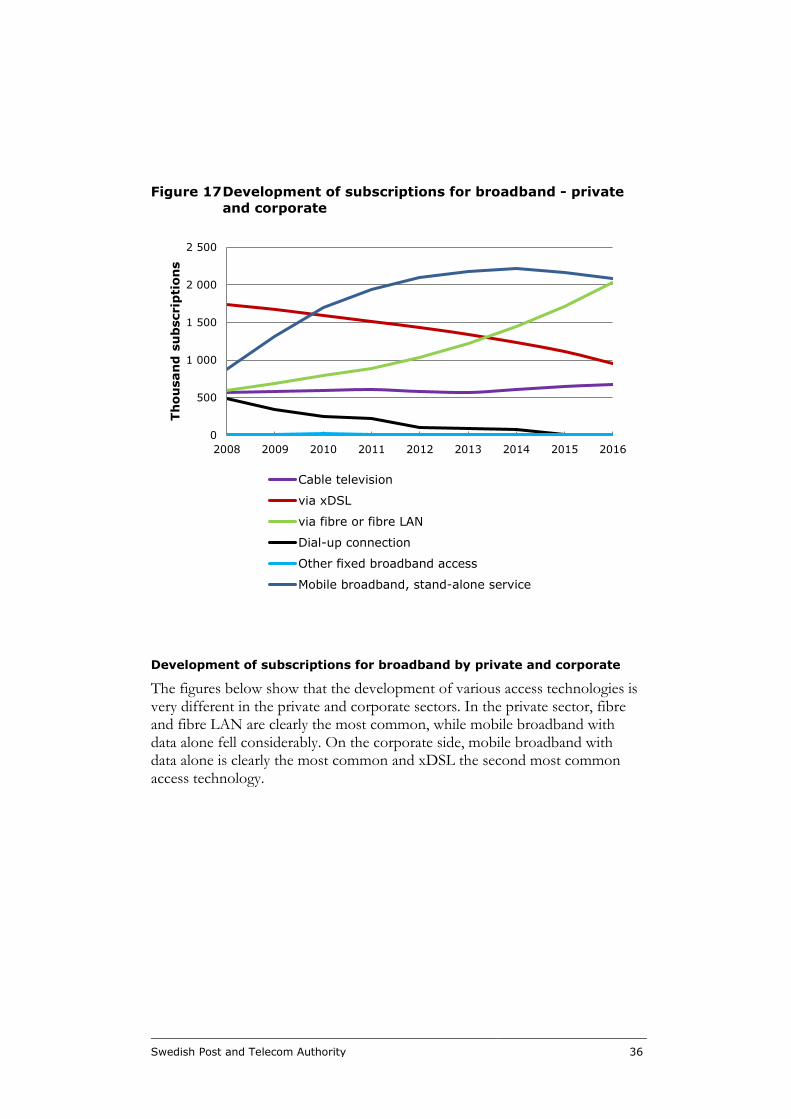
The figures below show that the development of various access technologies is very different in the private and corporate sectors. In the private sector, fibre and fibre LAN are clearly the most common, while mobile broadband with data alone fell considerably. On the corporate side, mobile broadband with data alone is clearly the most common and xDSL the second most common access technology.
0
500
1 000
1 500
2 000
2 500
2008 2009 2010 2011 2012 2013 2014 2015 2016
Th
ou
san
d s
ub
scrip
tion
s
Cable television
via xDSL
via fibre or fibre LAN
Dial-up connection
Other fixed broadband access
Mobile broadband, stand-alone service
Swedish Post and Telecom Authority 37
Figure 18 Development of subscriptions for broadband - private
Figure 19 Development of subscriptions for broadband -
corporate
0
500
1 000
1 500
2 000
2 500
2008 2009 2010 2011 2012 2013 2014 2015 2016Th
ou
san
d s
ub
scrip
tion
s
Cable television
via xDSL
via fibre or fibre LAN
Dial-up connection
Other fixed broadband access
Mobile broadband, stand-alone service
0
100
200
300
400
500
600
700
800
2008 2009 2010 2011 2012 2013 2014 2015 2016Th
ou
san
d s
ub
scrip
tion
s
Cable television
via xDSL
via fibre or fibre LAN
Dial-up connection
Other fixed broadband access
Mobile broadband, stand-alone service
Swedish Post and Telecom Authority 38
The number of group connections on fixed broadband subscriptions
Group connections refers to active, private internet subscriptions with, for example, landlords, housing cooperatives, housing associations or village communities rather than directly with the end customer. Almost 628,000 broadband subscriptions were stated to be group connections, which is an increase of 38 per cent.
There were 530,000 group connection subscriptions via fibre and fibre LAN, of which almost 240,000 were bundled with other electronic communication services. There were 86,000 group connections via cable TV, of which 5,000 were bundled. Group connections with xDSL subscriptions amounted to 10,000 and these were all bundled.
Group connection subscriptions account for 27 per cent of the total number of private broadband subscriptions via fibre and fibre LAN, 13 per cent of private cable TV subscriptions and 2 per cent of xDSL subscriptions.
The three largest providers of group connections were Telenor (40 % of all group connections), Telia Company (25 %) and ComHem (16 %).
43 per cent of group connections were part of a package. Group connections often offer lower prices to end customers. Often with group connections everyone in the group must join and agreements normally have relatively long binding periods.
4.2 Transfer speed - Fixed broadband
In this report, this refers to the speed that the customer subscribes for. The actual speed experienced by the consumer may be lower, especially in the case of broadband services in mobile networks. Download speed means the speed according to the subscription at which the user’s web browser can receive data and upload speed means the speed according to the subscription at which the user can send data.
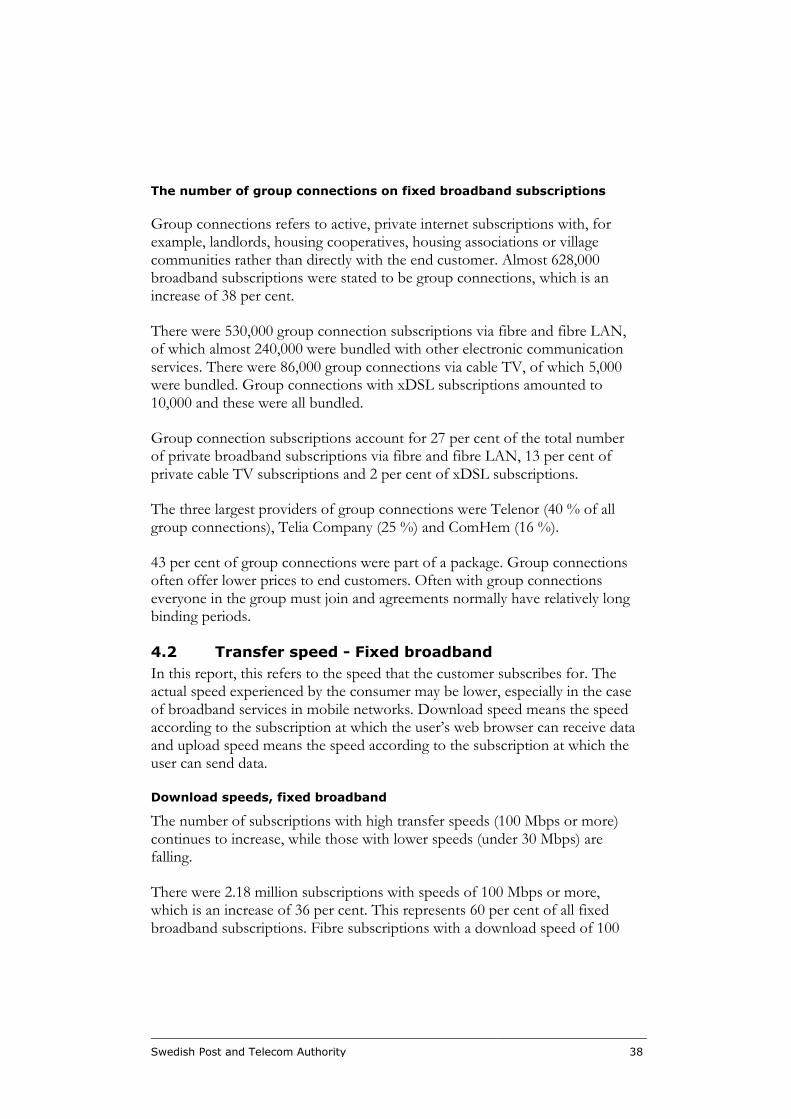
Download speeds, fixed broadband
The number of subscriptions with high transfer speeds (100 Mbps or more) continues to increase, while those with lower speeds (under 30 Mbps) are falling.
There were 2.18 million subscriptions with speeds of 100 Mbps or more, which is an increase of 36 per cent. This represents 60 per cent of all fixed broadband subscriptions. Fibre subscriptions with a download speed of 100
Swedish Post and Telecom Authority 39
Mbps or more amounted to 1.6 million (increase of 27 per cent), while subscriptions via cable TV networks with this speed amounted to 570,000 (increase of 68 per cent). The number of subscriptions with 1 Gbps amounted to 36 000, which was an increase of 65 per cent. There were 320,000 fixed broadband subscriptions with speeds between 30 and 100 Mbps, a reduction of 33 per cent.
79 per cent of fibre subscriptions had a speed of 100 Mbps or more, while 68 per centre of broadband subscriptions via cable TV ha speeds of 100 Mbps or more.
Figure 20 Distribution of speeds for download of data - fixed
broadband
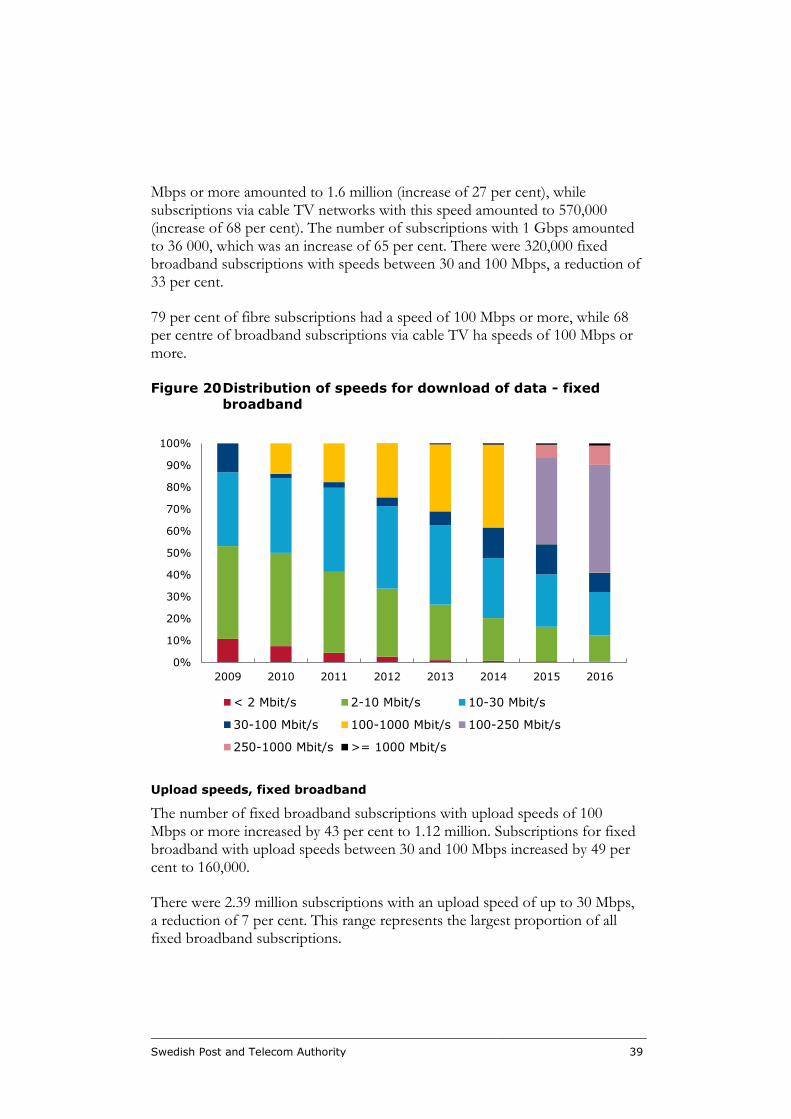
Upload speeds, fixed broadband
The number of fixed broadband subscriptions with upload speeds of 100 Mbps or more increased by 43 per cent to 1.12 million. Subscriptions for fixed broadband with upload speeds between 30 and 100 Mbps increased by 49 per cent to 160,000.
There were 2.39 million subscriptions with an upload speed of up to 30 Mbps, a reduction of 7 per cent. This range represents the largest proportion of all fixed broadband subscriptions.
0%
10%
20%
30%
40%
50%
60%
70%
80%
90%
100%
2009 2010 2011 2012 2013 2014 2015 2016
< 2 Mbit/s 2-10 Mbit/s 10-30 Mbit/s
30-100 Mbit/s 100-1000 Mbit/s 100-250 Mbit/s
250-1000 Mbit/s >= 1000 Mbit/s
Swedish Post and Telecom Authority 40
More and more subscriptions are being marketed with symmetrical transfer speeds, up and down. This is partly a consequence of the proportion of fibre subscriptions increasing.
Figure 21 Distribution of speeds6 for upload of data - fixed
broadband
4.3 Income from internet services
The following section mainly reports income from fixed internet services. Income from mobile data networks is reported in section 3.6.
6 The speed refers to what is being subscribed for and not the actual speed reading.
0%
10%
20%
30%
40%
50%
60%
70%
80%
90%
100%
2010 2011 2012 2013 2014 2015 2016
> 144 kbit/s - 30 Mbit/s 30 - 100 Mbit/s
>= 100 Mbit/s and over 100 - 250 Mbit/s
>= 250 Mbit/s och över
Swedish Post and Telecom Authority 41
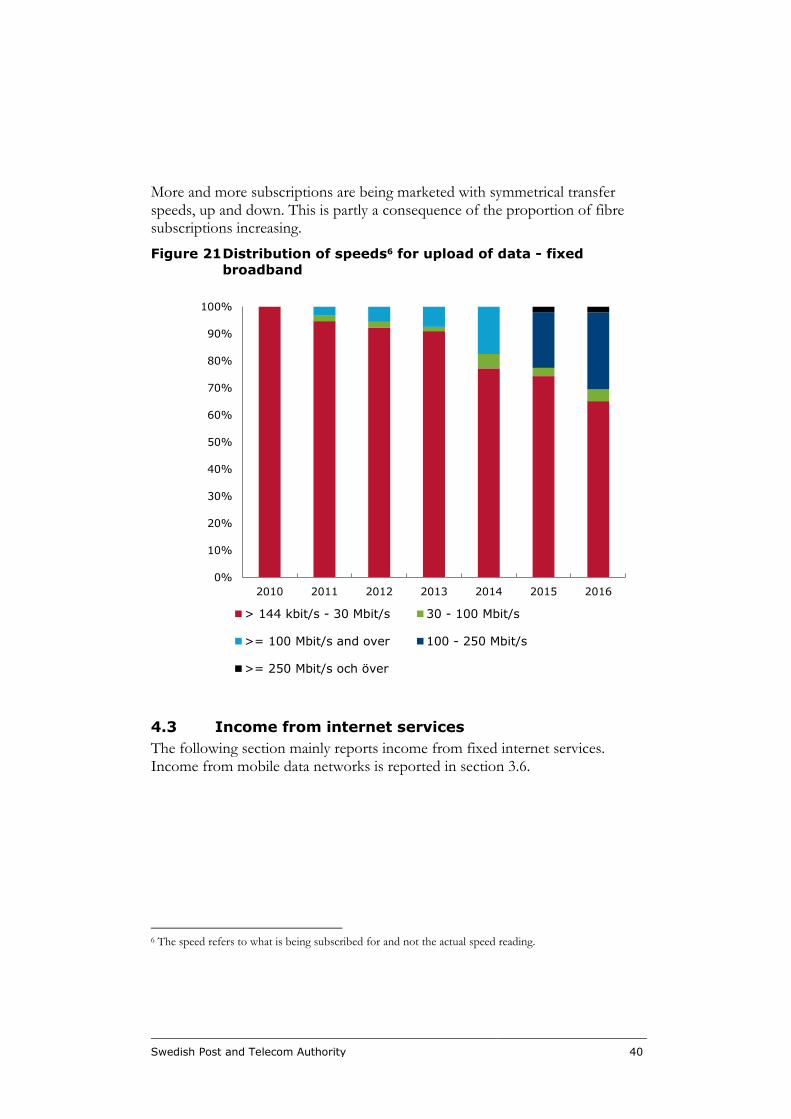
Figure 22 Income from the end customer market for fixed
internet services
Income from fixed internet subscriptions amounted to SEK 11 billion in 2016, which is 6 per cent more than in 2015, when it was SEK 10.4 billion. Income from dial-up connections was negligible.
Of the income from fixed broadband in 2016, fibre subscriptions accounted for 45 per cent, xDSL subscriptions for 36 per cent and broadband subscriptions via cable TV for 17 per cent. Income from fibre subscriptions has increased by 15 per cent and income from cable TV subscriptions by 7 per cent compared with 2015. Over the same period, income from xDSL subscriptions fell by 6 per cent.
During 2016, the average income per month from a fixed broadband subscription was SEK 256, which is the same as in 2015.
4.4 Market share - Broadband in total
Market share for broadband is presented in total and also by fixed and mobile broadband subscriptions (see section 3).
0
2 000
4 000
6 000
8 000
10 000
12 000
2011 2012 2013 2014 2015 2016
Mil
lion
SEK
via xDSL Cable television Fibre or fibre LAN Other
Swedish Post and Telecom Authority 42
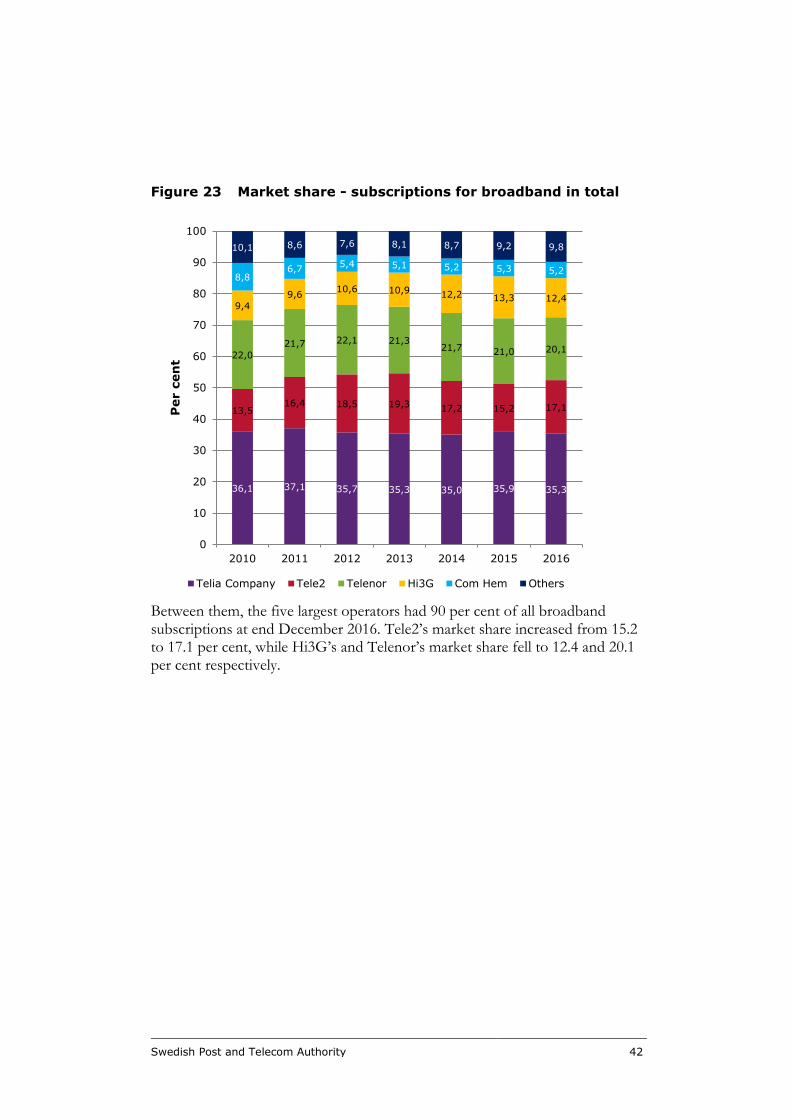
Figure 23 Market share - subscriptions for broadband in total
Between them, the five largest operators had 90 per cent of all broadband subscriptions at end December 2016. Tele2’s market share increased from 15.2 to 17.1 per cent, while Hi3G’s and Telenor’s market share fell to 12.4 and 20.1 per cent respectively.
36,1 37,1 35,7 35,3 35,0 35,9 35,3
13,516,4 18,5 19,3 17,2 15,2 17,1
22,0
21,7 22,1 21,321,7 21,0 20,1
9,4
9,610,6 10,9 12,2 13,3 12,4
8,86,7
5,4 5,1 5,2 5,3 5,2
10,1 8,6 7,6 8,1 8,7 9,2 9,8
0
10
20
30
40
50
60
70
80
90
100
2010 2011 2012 2013 2014 2015 2016
Per c
en
t
Telia Company Tele2 Telenor Hi3G Com Hem Others
Swedish Post and Telecom Authority 43
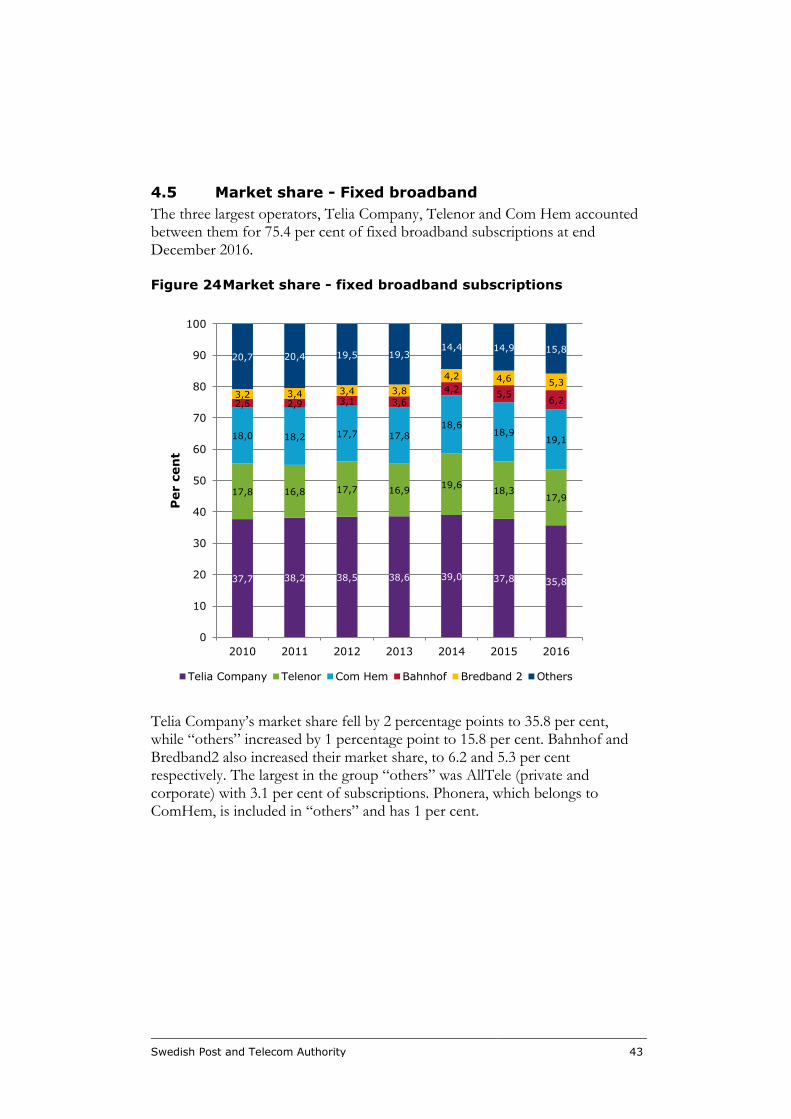
4.5 Market share - Fixed broadband
The three largest operators, Telia Company, Telenor and Com Hem accounted between them for 75.4 per cent of fixed broadband subscriptions at end December 2016.
Figure 24 Market share - fixed broadband subscriptions
Telia Company’s market share fell by 2 percentage points to 35.8 per cent, while “others” increased by 1 percentage point to 15.8 per cent. Bahnhof and Bredband2 also increased their market share, to 6.2 and 5.3 per cent respectively. The largest in the group “others” was AllTele (private and corporate) with 3.1 per cent of subscriptions. Phonera, which belongs to ComHem, is included in “others” and has 1 per cent.
37,7 38,2 38,5 38,6 39,0 37,8 35,8
17,8 16,8 17,7 16,919,6
18,317,9
18,0 18,2 17,7 17,818,6
18,919,1
2,6 2,9 3,1 3,6
4,25,5
6,23,2 3,4 3,4 3,8
4,2 4,6 5,3
20,7 20,4 19,5 19,314,4 14,9 15,8
0
10
20
30
40
50
60
70
80
90
100
2010 2011 2012 2013 2014 2015 2016
Per c
en
t
Telia Company Telenor Com Hem Bahnhof Bredband 2 Others
Swedish Post and Telecom Authority 44
5 Fixed line telephone services
All figures below refer to the situation on 31 December 2016 and comparisons are made with the same date in 2015.
5.1 Subscriptions - Fixed line telephone services
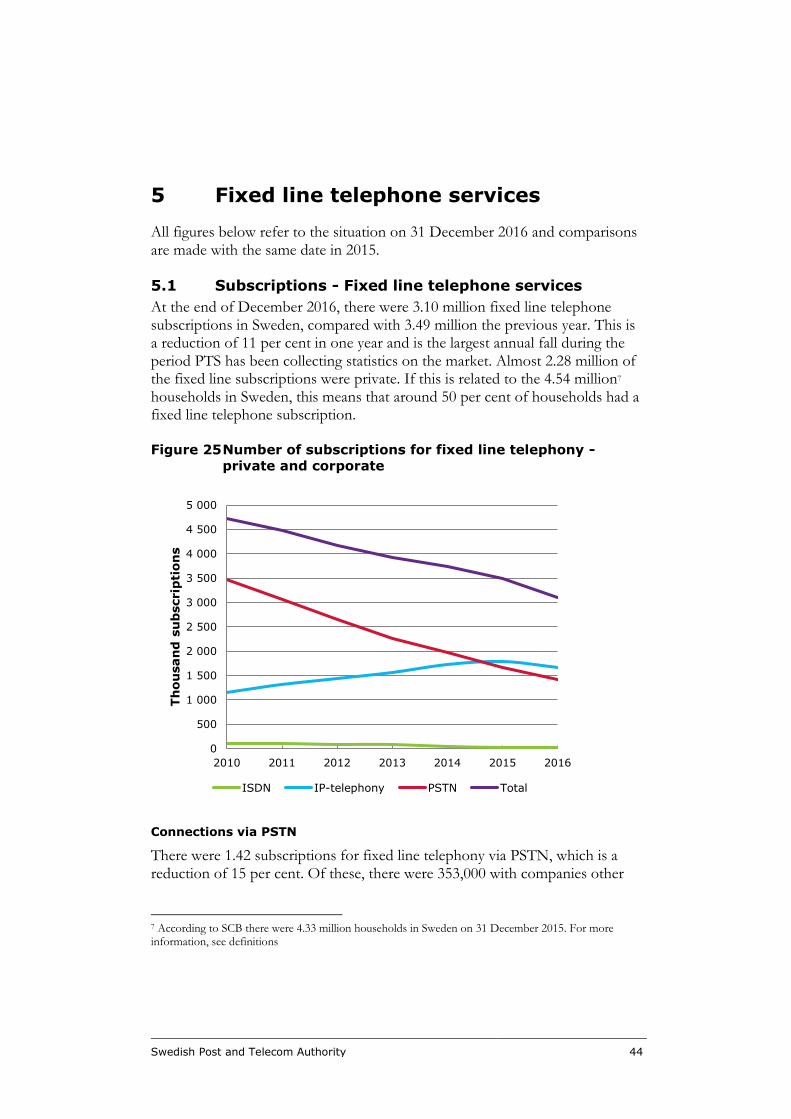
At the end of December 2016, there were 3.10 million fixed line telephone subscriptions in Sweden, compared with 3.49 million the previous year. This is a reduction of 11 per cent in one year and is the largest annual fall during the period PTS has been collecting statistics on the market. Almost 2.28 million of the fixed line subscriptions were private. If this is related to the 4.54 million7 households in Sweden, this means that around 50 per cent of households had a fixed line telephone subscription.
Figure 25 Number of subscriptions for fixed line telephony -
private and corporate
Connections via PSTN
There were 1.42 subscriptions for fixed line telephony via PSTN, which is a reduction of 15 per cent. Of these, there were 353,000 with companies other
7 According to SCB there were 4.33 million households in Sweden on 31 December 2015. For more information, see definitions
0
500
1 000
1 500
2 000
2 500
3 000
3 500
4 000
4 500
5 000
2010 2011 2012 2013 2014 2015 2016
Th
ou
san
d s
ub
scrip
tion
s
ISDN IP-telephony PSTN Total
Swedish Post and Telecom Authority 45
than Telia Company via the wholesale product GTA8. The number of subscriptions via GTA fell by 21 per cent. The greatest proportion of GTA subscriptions were with Phonera (36 per cent) and Tele2 (35 per cent).
The number of Carrier PreSelect subscriptions9 fell by 19 per cent to 58,000.
Connections via ISDN
At the end of December 2016 there were 18,000 connections via ISDN, which is a reduction of 20 per cent. ISDN is now exclusively a corporate service and there may be up to 30 simultaneous users on the same connection. Telia Company had 42 per cent of all ISDN connections.
Active subscriptions with IP telephony
In addition to traditional telephony (PSTN, ISDN) operators also offer so-called IP telephony (also known as VoIP - Voice over IP) as a service. This is done by connection over the IP network that the operator itself has control over, unlike connection over the internet. IP telephony is accessed via fibre LAN, Cable TV network, xDSL and “other IP-based access” or “other access”.
The number of IP telephony subscriptions10 is now greater than the number of subscriptions via traditional telephony (PTSN and ISDN). IP telephony subscriptions amounted to 54 per cent of all fixed line telephony subscriptions. For the first time since IP telephony was introduced, the number of subscriptions fell - to 1.67 million.
The number of IP telephony subscriptions via fibre or fibre LAN was 670,000, which is an increase of 7 per cent. The number of subscriptions via “other IP-based access”11 fell by 1 per cent to 195,000. The number of IP telephony subscriptions via xDSL was 509,000, which is a reduction of 21 per cent. The
8 GTA is an abbreviation of grossistprodukt för telefoniabonnemang, which means wholesale product for telephony subscriptions. GTA means that a subscriber can pay both subscription fee and call charges to an operator other than Telia. Before GTA was introduced in 2004, many subscribers paid a subscription fee to Telia and a traffic invoice to another company (so-called Carrier PreSelect telephony) 9 Refers to active Carrier PreSelect customers where the customer is indirectly connected. Active means that the customer has made at least one call in the last quarter of the review period. Note that if a customer has different Carrier PreSelects for national and international calls, this corresponds to only one customer. Carrier PreSelect can be abbreviated to CPS. Refers to Carrier PreSelect for both PSTN and ISDN. 10 Some operators have not been able to give an exact figure for this question but have estimated the answer, so that the number is therefore an estimate to a certain extent. 11 The operators state in comments what is referred to. Here are the descriptions of the three that correspond to about 60 per cent of these subscriptions: ”VoI Over The Top and we cannot determine access form”, ” fixed connections Managed Voice” and ” Internet, Internet Pro and IP-VPN”
Swedish Post and Telecom Authority 46
number of IP telephony subscriptions via cable TV was 296,000, which is a reduction of 9 per cent.
Com Hem, Telia Company and Telenor (including Glocalnet and Bredbandsbolaget) are the three largest companies in IP telephony with 69 per cent of all subscriptions between them.
Inactive IP telephony subscriptions
The number of active subscriptions with IP telephony amounted to 1.67 million. Here active subscriptions refers to those that have generated traffic (incoming or outgoing calls) during the last 3 month period. The number of inactive IP telephone subscriptions amounted to 443,000. 95 percent of these subscriptions were with Telia Company and Telenor. Thus in total there were 2.12 million IP telephony subscriptions.12
Bundled IP telephony subscriptions
The number of IP telephony subscriptions that were part of a package amounted to 853,000, or about 40 per cent of all IP telephony subscriptions.
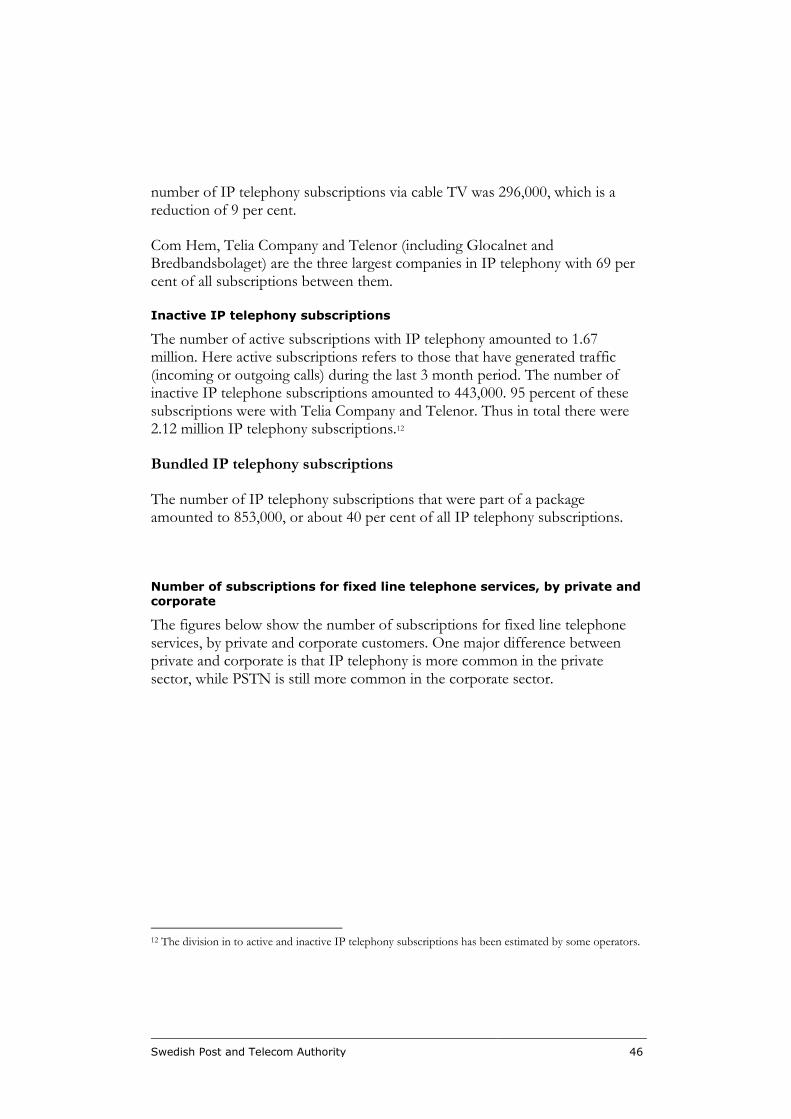
Number of subscriptions for fixed line telephone services, by private and
corporate
The figures below show the number of subscriptions for fixed line telephone services, by private and corporate customers. One major difference between private and corporate is that IP telephony is more common in the private sector, while PSTN is still more common in the corporate sector.
12 The division in to active and inactive IP telephony subscriptions has been estimated by some operators.
Swedish Post and Telecom Authority 47
Figure 26 Number of subscriptions for fixed line telephony -
private
Figure 27 Number of subscriptions for fixed line telephony -
corporate
0
500
1 000
1 500
2 000
2 500
3 000
3 500
4 000
2010 2011 2012 2013 2014 2015 2016
Th
ou
san
d s
ub
scrip
tion
s
ISDN IP-telephony PSTN Total
0
500
1 000
1 500
2010 2011 2012 2013 2014 2015 2016
Th
ou
san
d s
ub
scrip
tion
s
ISDN IP-telephony PSTN Total
Swedish Post and Telecom Authority 48
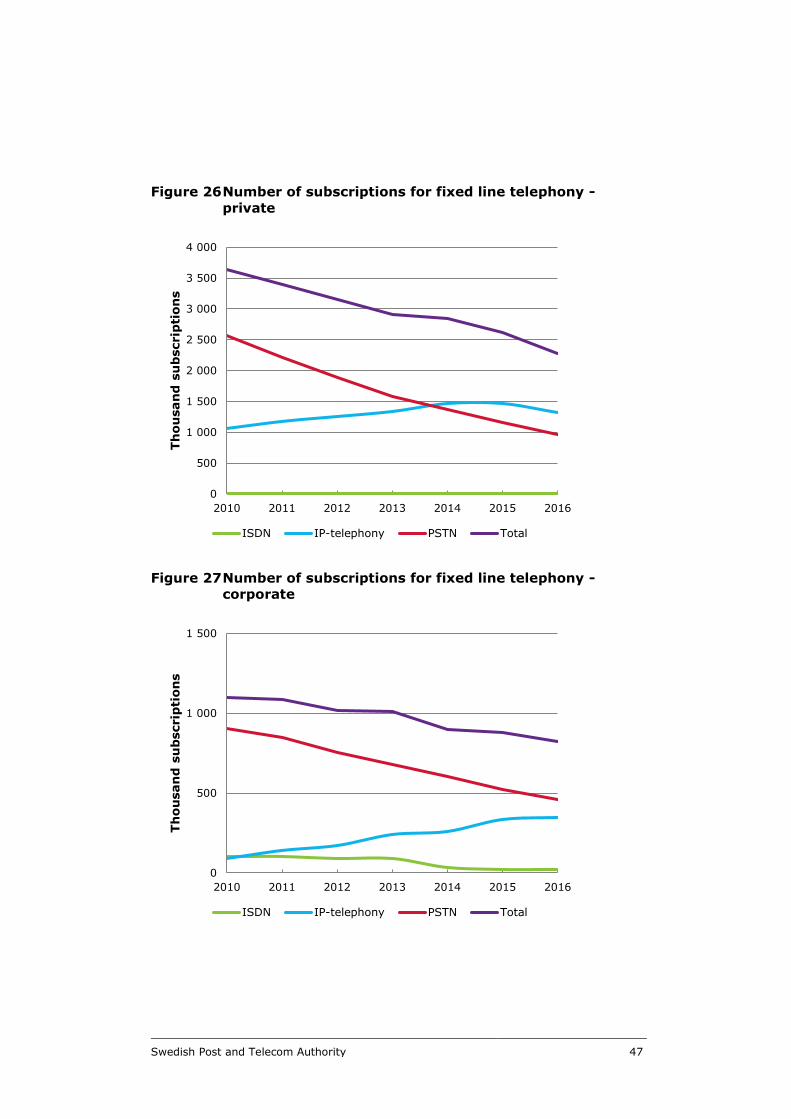
5.2 Telephone traffic – Fixed line telephone services
The number of outgoing call minutes from fixed line subscriptions fell 14 per cent to 8.3 billion. Of these, the number of minutes from private subscriptions fell by 24 per cent to 3.1 billion.
Figure 28 Outgoing call minutes from fixed line telephone
services
The number of outgoing call minutes from IP telephony subscriptions (private and corporate) fell 19 per cent to 1.9 billion. Some operators have estimated the number of call minutes from IP telephony and the total is therefore to some extent an estimate.
The numbers of calls from fixed network subscribers fell by 20 per cent to 4.8 billion.
The average length of call from private subscriptions was 3.4 minutes, a reduction from 3.5 minutes. The average number of calls per private fixed network subscription per month was 62, which is a reduction from 65.
Call traffic differs between private and corporate. So-called SIP trunking is often used in the corporate sector. Companies usually use the physical internet connection that they are subscribing to for SIP trunking, which is the logical connection between the company’s LAN and the operator’s SIP server (also
0
5 000
10 000
15 000
20 000
25 000
2009 2010 2011 2012 2013 2014 2015 2016
Mil
lion
min
ute
s
Total number of outgoing traffic minutes for fixed call
servicesIP-based telephony
PSTN and ISDN
Swedish Post and Telecom Authority 49
called SIP proxy). Thus they do not have their own physical connection for SIP trunking.
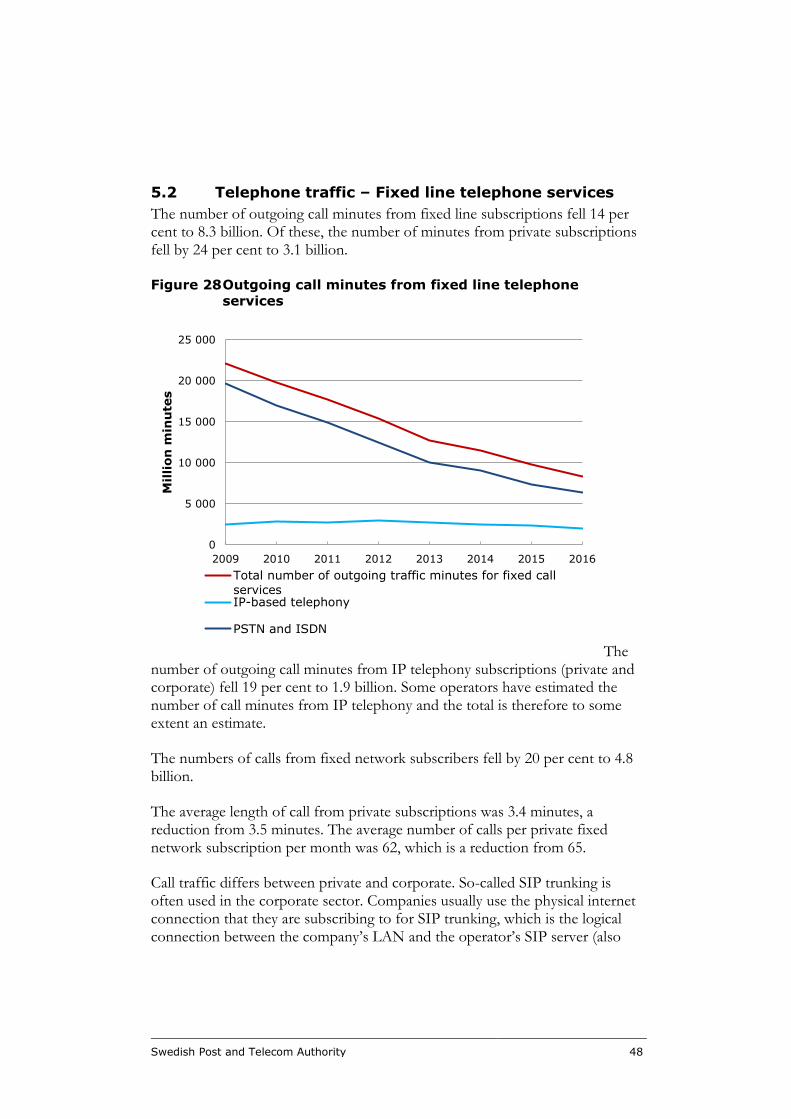
5.3 Income from fixed line telephone services
Income from fixed line telephone services (excluding income from dial-up internet) fell from SEK 7.4 billion in 2015 to SEK 6.5 billion in 2016. This is a reduction of 13 per cent.
Figure 29 Income from end customers for fixed line telephone
services
In 2016 fixed charges represented 57 per cent of income from fixed line telephony, which is 3 percentage points more than the previous year. Income from IP telephony amounted to SEK 1.3 billion in 2016, which is a reduction of 9 per cent from the previous year. IP telephony’s share of the income increased from 19 per cent in 2015 to 21 per cent in 2016.
The average income per month from a fixed line telephone subscription was SEK 164 in 2016, a reduction of SEK 8 compared with 2015.
0
5 000
10 000
15 000
20 000
25 000
2005 2006 2007 2008 2009 2010 2011 2012 2013 2014 2015 2016
Mil
lion
SEK
Other
International calls
Calls from fixed networks to mobile networks
Calls from fixed networks to fixed networks
Fixed charges
Swedish Post and Telecom Authority 50
5.4 Income from interconnection in fixed networks
In 2016, 8.8 billion minutes were terminated in the fixed networks, a reduction of 5 per cent from 2015, when 9.4 billion minutes were terminated.
In 2015 interconnection income from fixed line telephony amounted to SEK 87 million, which is a reduction of SEK 12 million, or almost 12 per cent, compared with 2015.
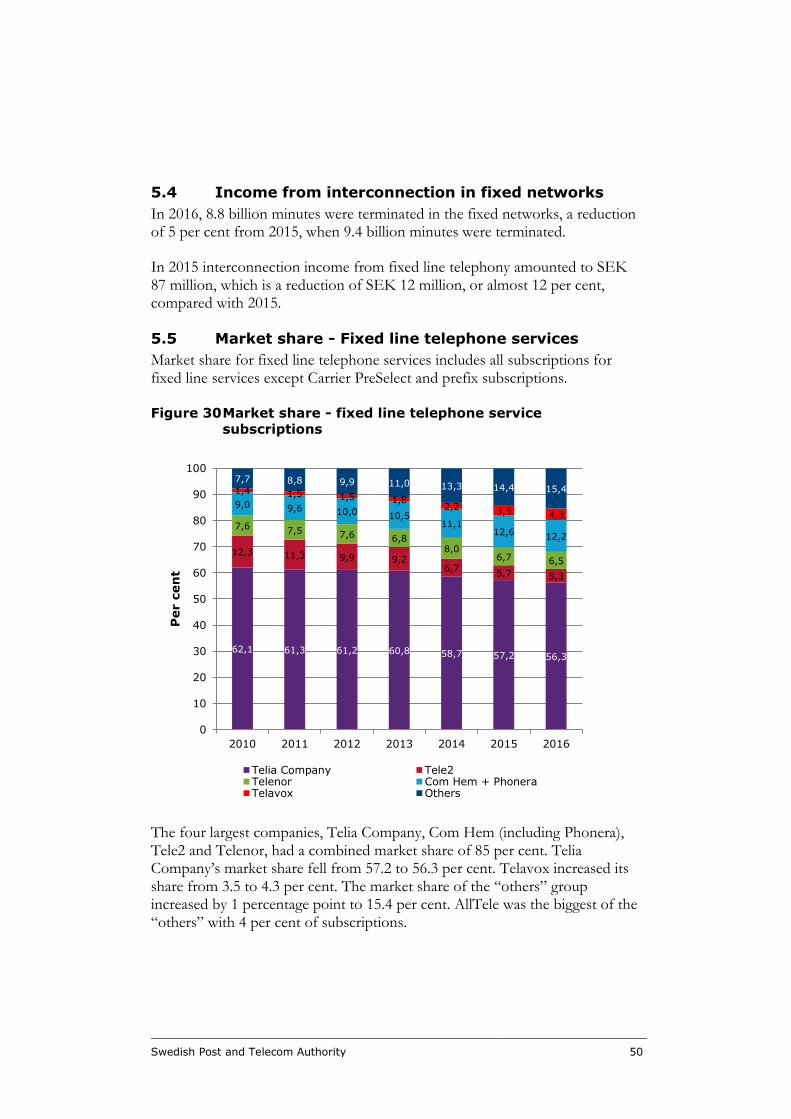
5.5 Market share - Fixed line telephone services
Market share for fixed line telephone services includes all subscriptions for fixed line services except Carrier PreSelect and prefix subscriptions.
Figure 30 Market share - fixed line telephone service
subscriptions
The four largest companies, Telia Company, Com Hem (including Phonera), Tele2 and Telenor, had a combined market share of 85 per cent. Telia Company’s market share fell from 57.2 to 56.3 per cent. Telavox increased its share from 3.5 to 4.3 per cent. The market share of the “others” group increased by 1 percentage point to 15.4 per cent. AllTele was the biggest of the “others” with 4 per cent of subscriptions.
62,1 61,3 61,2 60,8 58,7 57,2 56,3
12,3 11,3 9,9 9,26,7
5,7 5,3
7,67,5 7,6 6,8
8,06,7 6,5
9,0 9,6 10,0 10,511,1
12,612,2
1,4 1,5 1,5 1,82,2
3,5 4,3
7,7 8,8 9,9 11,0 13,3 14,4 15,4
0
10
20
30
40
50
60
70
80
90
100
2010 2011 2012 2013 2014 2015 2016
Per c
en
t
Telia Company Tele2Telenor Com Hem + PhoneraTelavox Others
Swedish Post and Telecom Authority 51
5.6 Number porting - Fixed line telephone services
This section is about porting instances for fixed (geographical) telephone numbers. See section 3.11 for more information about number porting and figures for the number of porting instances for fixed line telephone numbers and mobile numbers. The number of ported fixed line telephone numbers is not included in SNPAC’s statistics. For this reason the number of porting instances is shown below, which is lower than the number of ported telephone numbers.
The number of porting instances for fixed (geographical) numbers amounted to 185,000 in Sweden, which was an increase of 4 per cent. This represents 6 per cent of the total number of fixed line telephone subscriptions.
Swedish Post and Telecom Authority 52
6 TV services
This section is about developments in the number of subscriptions for traditional cable TV which follows a fixed platform. Section 6.1 gives statistics for pay TV subscriptions, section 6.2 reports surveys about free TV via the digital terrestrial network and section 6.3 briefly reports on other ways of seeing moving images and viewing times for traditional TV.
6.1 Traditional pay TV services
6.1.1 Traditional pay TV subscriptions -
Traditional TV is distributed to consumers via various distribution platforms such as cable, satellite, terrestrial transmission or broadband. TV via broadband is delivered via fibre, fibre LAN or xDSL.
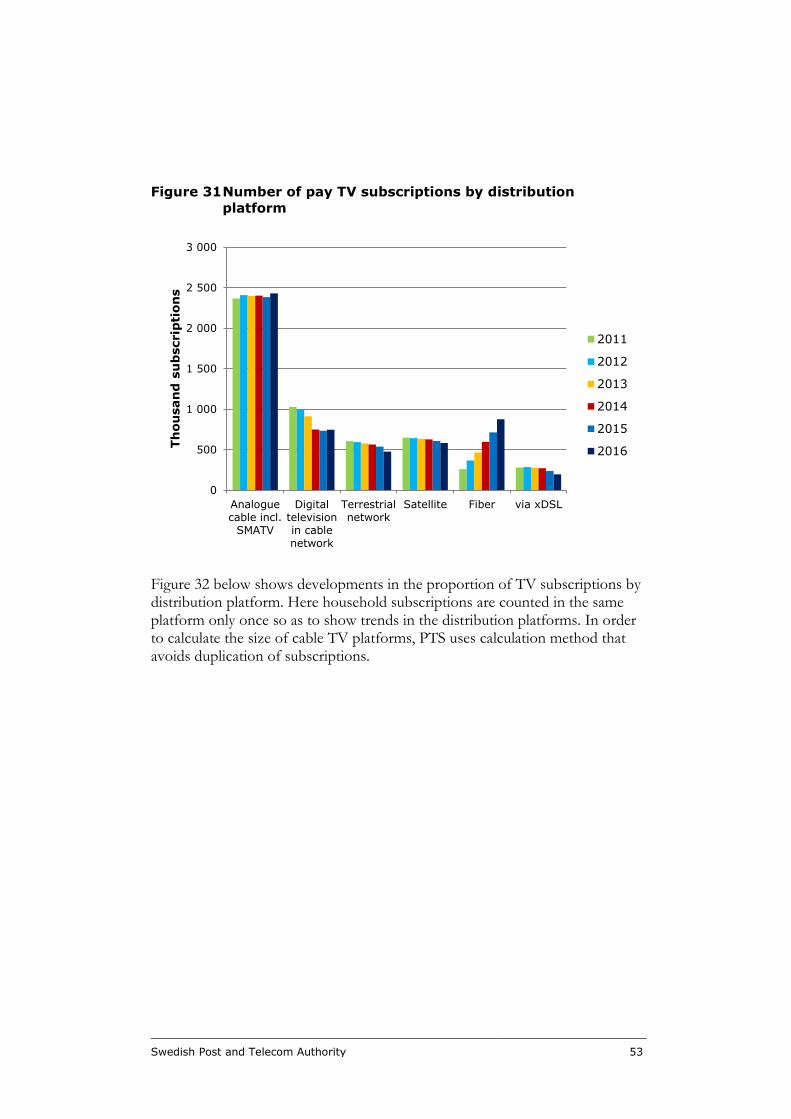
In December 2016, there were 5.3 million pay TV subscriptions in Sweden, which was in increase of 2 per cent. The number of pay TV subscriptions is more than the number of households in Sweden since households may have one or more subscriptions, often an analogue subscription (cable TV) via the property owner and a digital subscription taken out by the consumer. There are now only analogue TV subscriptions via cable TV networks. These amounted to 2.4 million, which corresponds to an increase of 2 per cent. Digital pay TV subscriptions via cable TV networks, satellite, terrestrial transmissions or broadband amounted to 2.9 million, which corresponds to an increase of 1 per cent. Figure 31 below shows developments in the number of pay TV subscriptions.
Swedish Post and Telecom Authority 53
Figure 31 Number of pay TV subscriptions by distribution
platform
Figure 32 below shows developments in the proportion of TV subscriptions by distribution platform. Here household subscriptions are counted in the same platform only once so as to show trends in the distribution platforms. In order to calculate the size of cable TV platforms, PTS uses calculation method that avoids duplication of subscriptions.
0
500
1 000
1 500
2 000
2 500
3 000
Analoguecable incl.
SMATV
Digitaltelevisionin cablenetwork
Terrestrialnetwork
Satellite Fiber via xDSL
Th
ou
san
d s
ub
scrip
tion
s
2011
2012
2013
2014
2015
2016
Swedish Post and Telecom Authority 54
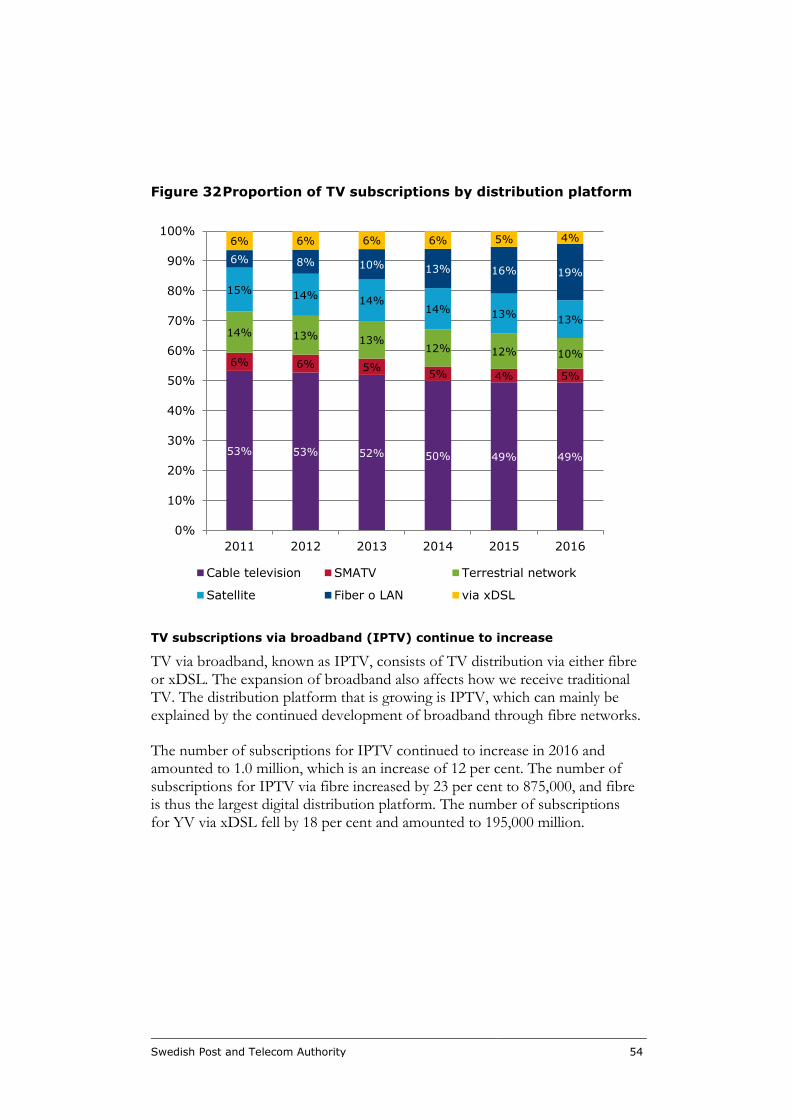
Figure 32 Proportion of TV subscriptions by distribution platform
TV subscriptions via broadband (IPTV) continue to increase
TV via broadband, known as IPTV, consists of TV distribution via either fibre or xDSL. The expansion of broadband also affects how we receive traditional TV. The distribution platform that is growing is IPTV, which can mainly be explained by the continued development of broadband through fibre networks.
The number of subscriptions for IPTV continued to increase in 2016 and amounted to 1.0 million, which is an increase of 12 per cent. The number of subscriptions for IPTV via fibre increased by 23 per cent to 875,000, and fibre is thus the largest digital distribution platform. The number of subscriptions for YV via xDSL fell by 18 per cent and amounted to 195,000 million.
53% 53% 52% 50% 49% 49%
6% 6% 5%5% 4% 5%
14% 13% 13%12% 12% 10%
15% 14%14%
14% 13%13%
6% 8% 10% 13% 16% 19%
6% 6% 6% 6% 5% 4%
0%
10%
20%
30%
40%
50%
60%
70%
80%
90%
100%
2011 2012 2013 2014 2015 2016
Cable television SMATV Terrestrial network
Satellite Fiber o LAN via xDSL
Swedish Post and Telecom Authority 55
Subscriptions for digital cable TV on a par with last year
Digital cable TV: The number of digital cable TV subscriptions amounted to 745,000. Over the last three years, digital cable TV subscriptions have been at the same level, but before this cable TV subscriptions decreased from 2012. There was a movement between 2013 and 2015 when subscriptions fell sharply, which derives from Telenor’s acquisition of Tele2’s customer base for cable TV subscriptions. 13
Analogue cable TV including SMATV: The total number of analogue cable TV subscriptions including SMATV14 has been relatively unchanged at 2.4 million since 2006. The reason is that many households have an analogue TV subscription included as part of the rent. The analogue TV subscriptions were all taken out indirectly via agreements with property owners, a distribution that has been unchanged since measurements began in 2009.
Some of the total of analogue cable TV subscriptions are via big TV operators such as Com Hem, Canal Digital Kabel, Sappa, Telia Company and Telenor. Subscriptions of this type amounted to 2.2 million, which is the same as the previous year. The remaining 211,000 subscriptions have been estimated on the basis of the number of households that have subscriptions via SMATV networks. Subscription via SMATV networks increased by 2 per cent compared with the previous year. The volume of SMATV and the increase must be viewed with caution however, since these are estimates.
Most households that have a digital cable TV subscription also have an analogue cable TV subscription via the property owner. Of the above mentioned 2.2 million subscribers who had analogue cable TV subscriptions, 674,000 had a digital cable TV subscription in addition to the analogue one via the property owner. Other households with analogue cable TV subscriptions can often watch free TV channels digitally at no extra cost.15
PTS calculates that the number of households with cable TV services (one or more subscriptions) was approximately 3.2 million, which is 2 per cent more than the previous year.
13 Telenor: Telenor bought Tele2’s Swedish fibre and cable TV operation on the private customer market on 23/10/2013 14 Satellite Master Antenna Television (SMATV) is an independent cable TV network where many households share an antenna. 15 According to Com Hem:”Since January 2010, all Com Hem-connected households can receive a number of free digital channels at no extra subscription cost. All that is needed to see the free digital channels is an approved digital box or a TV with built in digital box that is approved by Com Hem. No programme card is needed.”
Swedish Post and Telecom Authority 56
Subscriptions for TV via satellite continue to fall
The number of subscriptions for TV via satellite continues to fall and amounted to just under 583,000 on 31 December 2016. This is a reduction of 4 per cent in one year.
Biggest annual reduction in subscriptions in terrestrial TV (pay TV)
In terrestrial broadcasting there is the possibility of having a pay TV subscription and it is also possible to watch free TV16 without a subscription, digital terrestrial tv free to air (DTT FTA). DTT FTA is covered in section 6.2.
There is only one company that offers pay TV subscriptions on the terrestrial network and that is Boxer TV. The reduction in the number of subscriptions in the terrestrial digital network continues. There were 475,000 subscriptions for pay TV in the terrestrial digital network on 31 December 2016. This is a reduction of 12 per cent, which is the greatest annual reduction of subscriptions in the terrestrial digital network. The number of subscriptions in the terrestrial digital network has fallen every year since 2008.
6.1.2 Income from TV services
The following section reports income from pay TV services for basic and supplementary subscriptions.17 All income that relates to the end customers’ purchases of basic or supplementary packages is18 included.
The total income from TV services for basic and supplementary subscriptions amounted to SEK 9.8 billion at the end of December 2016, which is an increase of 1 per cent from 2015.19
16 Here free TV refers to TV that can be received unencrypted and free of charge by the end customer, with no requirement for a subscription or equivalent. Free TV is only available on the terrestrial platform, where the programme company buys the transmission service directly from Teracom, which transmits the channels unencrypted. Since free TV viewers do not have a subscription to watch the programmes, it is not clear exactly how many households only receive free TV and have no pay TV subscription. 17 In previous years, income from “smaller cable TV networks and property owners” who reported was included in income for analogue and digital cable TV subscriptions.. This income has not been included with effect from the 2012 report. 18 Supplementary subscriptions refers to subscriptions where a household has a separate agreement for additional services such as digital TV with channel package. This includes all income that relates to the end customer’s purchase of supplementary subscriptions (channels or packages in addition to the basic subscription): ongoing charges, start-up charges, hire or sale of digital TV boxes and programme cards. Supplementary packages also included income for transaction-based VOD (video on demand) and pay-per-view up to and including 2015. From 2016 income for transaction-based VOD (video on demand) and pay-per-view is not included.
Swedish Post and Telecom Authority 57
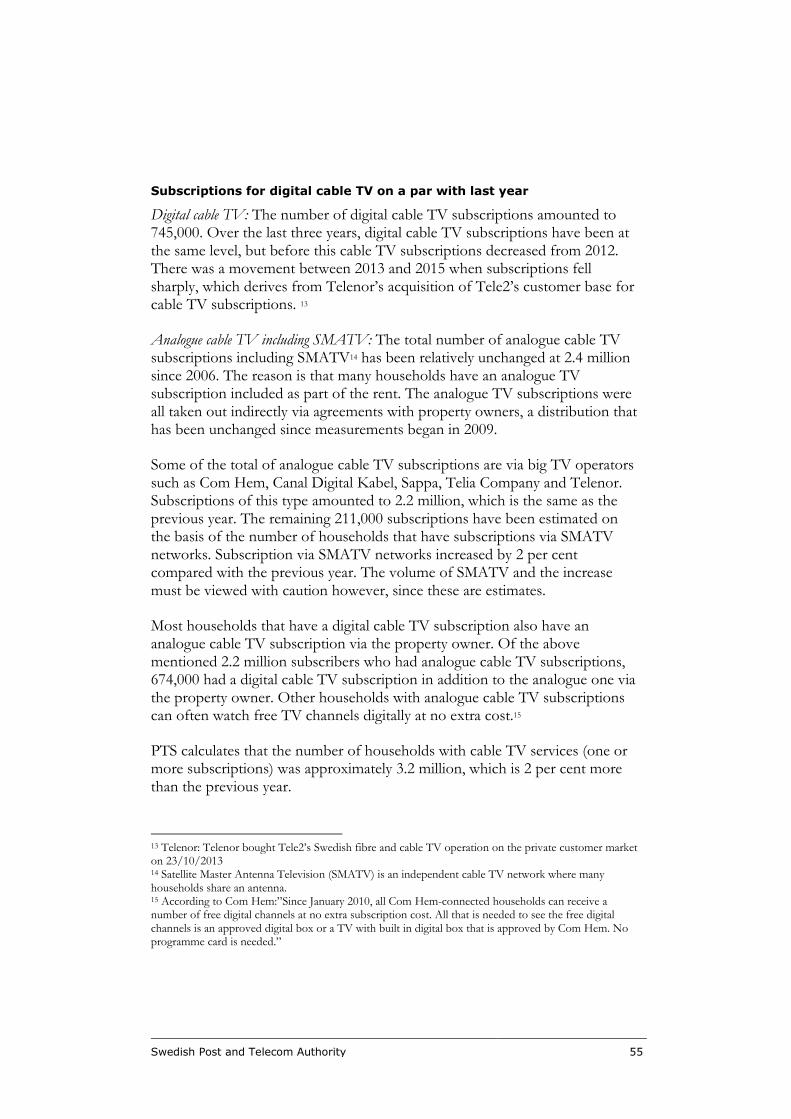
Figure 33 Income from TV services in basic subscriptions
Income from the basic package
Income from basic subscriptions20 amounted to SEK 8.6 billion, an increase of 1 per cent. Income from basic subscriptions has been at the same level since 2012.
The greatest increase was income from basic packages for TV via fibre, which increased by 32 per cent to SEK 1.2 billion. Income from basic packages for TV via xDSL fell by 9 per cent to SEK 400 million. Income from basic packages for digital cable TV amounted to SEK 1.9 billion, which is an increase of 1 per cent compared with the previous year. Income of SEK 1.0 billion came from analogue cable TV subscriptions, which is a fall of 3 per cent. Income from basic packages for terrestrial TV fell by 3 per cent to SEK 1.4 billion. Income from basic packages for TV services via satellite fell by 3 per cent compared with the previous year, to SEK 2.8 billion.
20 For the period 2009 to 2014, income from terrestrial TV services for both basic and supplementary packages was reported as a basic package, since they could not be separated. This means that for these years income from basic packages was somewhat too high, while income from supplementary packages was somewhat too low.
0
500
1 000
1 500
2 000
2 500
3 000
Analoguetelevisionin cablenetwork
Digitaltelevisionin cablenetwork
Televisionvia
terrestrialnetwork
Televisionvia
satellite
Iptv viafiber and
LAN
Iptv viaxDSL
Mil
lion
SEK
2012
2013
2014
2015
2016
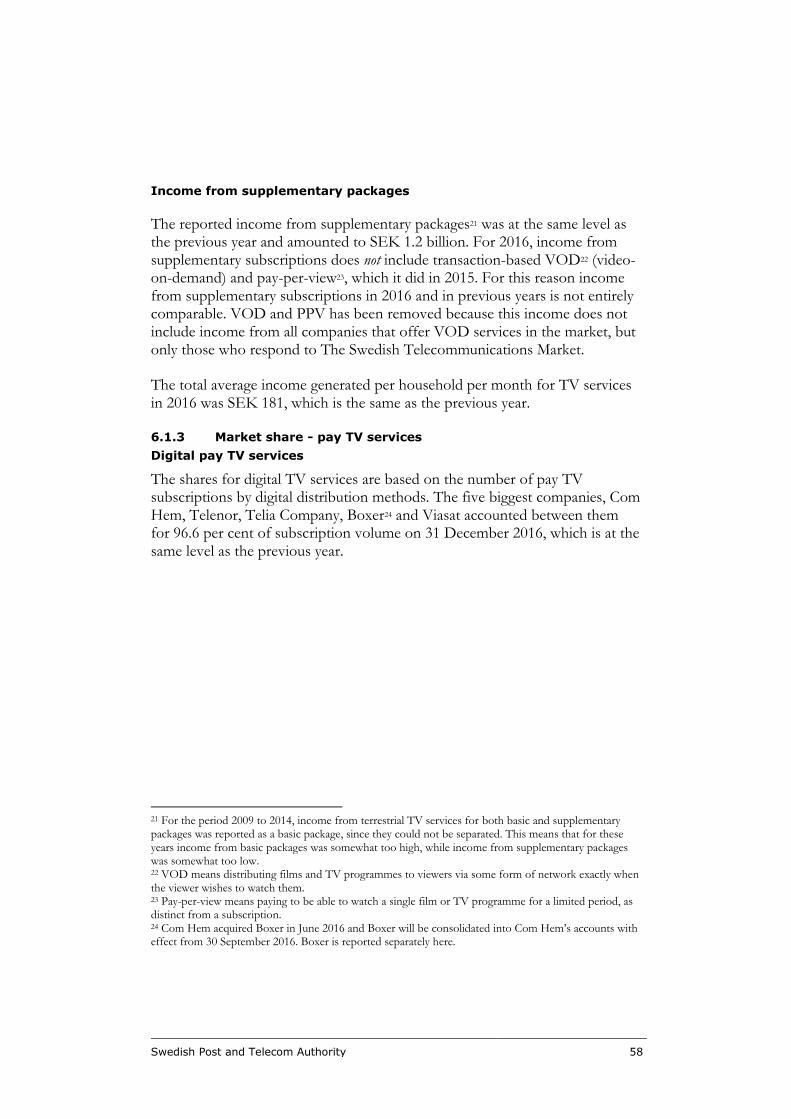
Swedish Post and Telecom Authority 58
Income from supplementary packages
The reported income from supplementary packages21 was at the same level as the previous year and amounted to SEK 1.2 billion. For 2016, income from supplementary subscriptions does not include transaction-based VOD22 (video-on-demand) and pay-per-view23, which it did in 2015. For this reason income from supplementary subscriptions in 2016 and in previous years is not entirely comparable. VOD and PPV has been removed because this income does not include income from all companies that offer VOD services in the market, but only those who respond to The Swedish Telecommunications Market.
The total average income generated per household per month for TV services in 2016 was SEK 181, which is the same as the previous year.
6.1.3 Market share - pay TV services
Digital pay TV services
The shares for digital TV services are based on the number of pay TV subscriptions by digital distribution methods. The five biggest companies, Com Hem, Telenor, Telia Company, Boxer24 and Viasat accounted between them for 96.6 per cent of subscription volume on 31 December 2016, which is at the same level as the previous year.
21 For the period 2009 to 2014, income from terrestrial TV services for both basic and supplementary packages was reported as a basic package, since they could not be separated. This means that for these years income from basic packages was somewhat too high, while income from supplementary packages was somewhat too low. 22 VOD means distributing films and TV programmes to viewers via some form of network exactly when the viewer wishes to watch them. 23 Pay-per-view means paying to be able to watch a single film or TV programme for a limited period, as distinct from a subscription. 24 Com Hem acquired Boxer in June 2016 and Boxer will be consolidated into Com Hem’s accounts with effect from 30 September 2016. Boxer is reported separately here.
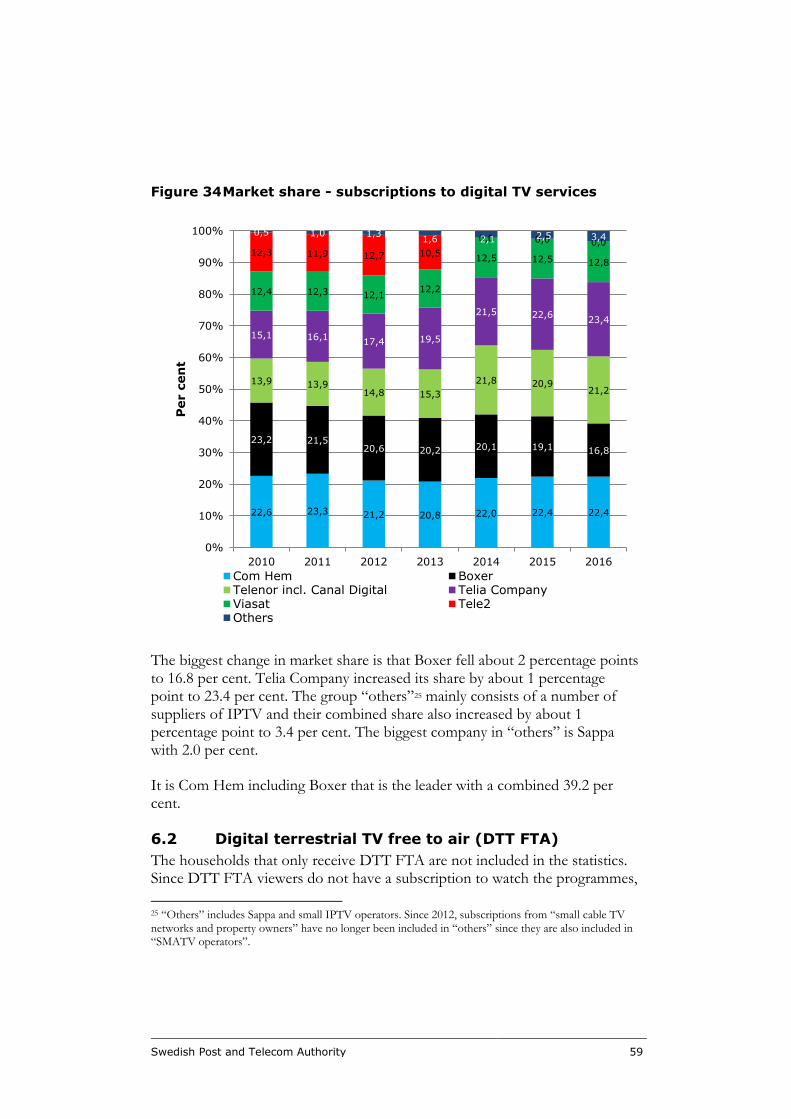
Swedish Post and Telecom Authority 59
Figure 34 Market share - subscriptions to digital TV services
The biggest change in market share is that Boxer fell about 2 percentage points to 16.8 per cent. Telia Company increased its share by about 1 percentage point to 23.4 per cent. The group “others”25 mainly consists of a number of suppliers of IPTV and their combined share also increased by about 1 percentage point to 3.4 per cent. The biggest company in “others” is Sappa with 2.0 per cent.
It is Com Hem including Boxer that is the leader with a combined 39.2 per cent.
6.2 Digital terrestrial TV free to air (DTT FTA)
The households that only receive DTT FTA are not included in the statistics. Since DTT FTA viewers do not have a subscription to watch the programmes,
25 “Others” includes Sappa and small IPTV operators. Since 2012, subscriptions from “small cable TV networks and property owners” have no longer been included in “others” since they are also included in “SMATV operators”.
22,6 23,3 21,2 20,8 22,0 22,4 22,4
23,2 21,520,6 20,2 20,1 19,1 16,8
13,9 13,914,8 15,3
21,8 20,921,2
15,1 16,117,4 19,5
21,5 22,623,4
12,4 12,3 12,112,2
12,5 12,5 12,812,3 11,9 12,7 10,5
0,0 0,0 0,00,5 1,0 1,3
1,6 2,1 2,5 3,4
0%
10%
20%
30%
40%
50%
60%
70%
80%
90%
100%
2010 2011 2012 2013 2014 2015 2016
Per c
en
t
Com Hem BoxerTelenor incl. Canal Digital Telia CompanyViasat Tele2Others
Swedish Post and Telecom Authority 60
it is not clear exactly how many households receive DTT FTA. According to a survey by Sweco for PTS26 8 per cent of households have DTT FTA as the only means of reception in their permanent residence, which corresponds to about 354,000 households (based on number of households according to SCB). This is a reduction compared with 2015.27
DTT FTA is most common among those who live in detached houses. Among these households, 13 per cent only have DTT FTA, followed by those who rent, about 6 per cent of whom say they only have DTT FTA. DTT FTA is least common in housing cooperatives.
Nine out of ten households that have DTT FTA think that they will still receive TV the same way in 12 months time, which is a slight increase over 2015. The proportion planning to change is 5 per cent.
Of those who responded, about one in four has access to a holiday home. Of these, one household in three has only DTT FTA in the holiday home, which is a reduction compared with 2015.
About one household in three chooses to pay for other TV services, such as Netflix, HBO, Viaplay, which is a slight increase over 2015. For those with only free DTT FTA the figure is lower, 22 per cent.
6.3 TV viewer figures and other ways of looking at
moving images
Viewer figures for traditional TV in December 2016 were at the same level as a year previously, according to the monitoring company MMS. The figure for December 2016 for those who have watched TV for 5 continuous minutes or more on an average day was 61 per cent, which was unchanged from the previous year. The number of minutes of TV viewing on an average day was also as good as unchanged at 133 minutes (compared with 136 the year before). Seen over a longer period, time spent watching traditional TV has fallen greatly as more and more people are using streaming services. A survey by MMS showed that almost half, 47 per cent, of 9 to 99 year olds have access to a subscription service for streamed TV or film in their homes, which is an increase of 380,000 people compared with the previous year. A third have Netflix, which is still the largest supplier in Sweden.
26 Sweco was commissioned by PTS to perform a survey of households’ use of free TV in 2016, which has been published by PTS http://www.pts.se/sv/Dokument/Rapporter/Radio/2017/Hushallens-anvandning-av-fri-tv-2016/ . Previous surveys for 2013, 2014, 2015 were performed by SWECO and even earlier surveys for 2011 and 2012 were performed by TNS SIFO. 27 Based on number of households according to SCB
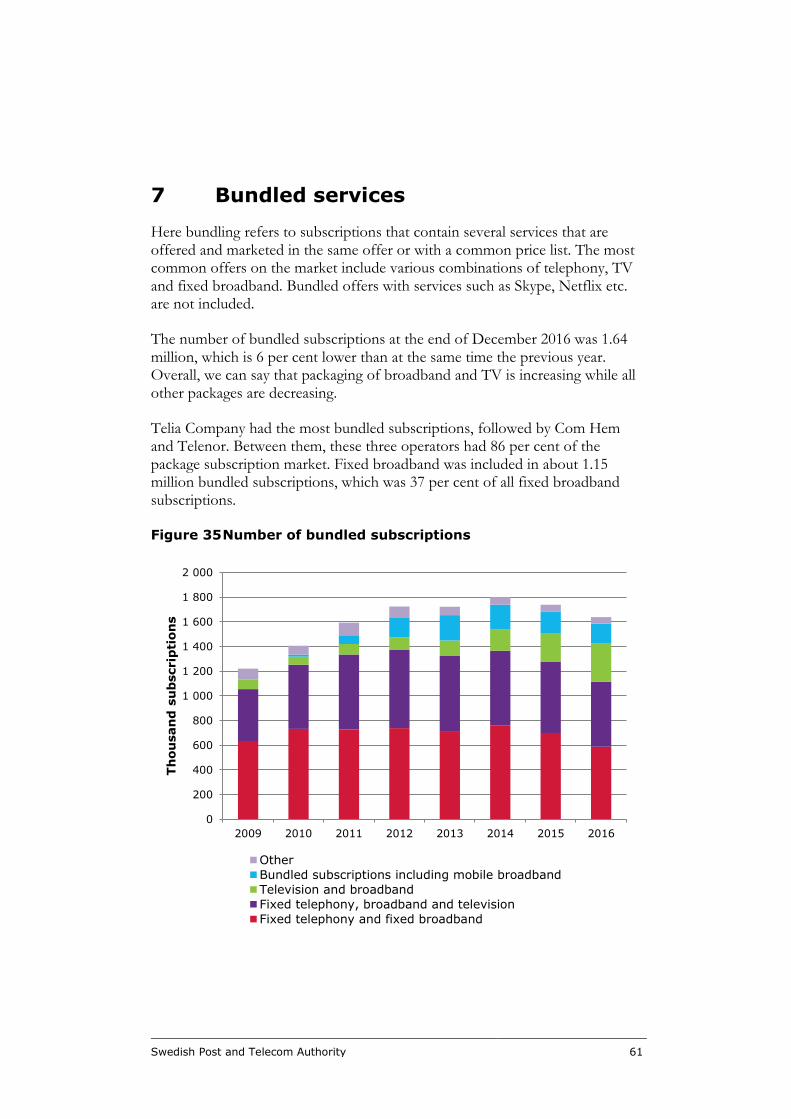
Swedish Post and Telecom Authority 61
7 Bundled services
Here bundling refers to subscriptions that contain several services that are offered and marketed in the same offer or with a common price list. The most common offers on the market include various combinations of telephony, TV and fixed broadband. Bundled offers with services such as Skype, Netflix etc. are not included.
The number of bundled subscriptions at the end of December 2016 was 1.64 million, which is 6 per cent lower than at the same time the previous year. Overall, we can say that packaging of broadband and TV is increasing while all other packages are decreasing.
Telia Company had the most bundled subscriptions, followed by Com Hem and Telenor. Between them, these three operators had 86 per cent of the package subscription market. Fixed broadband was included in about 1.15 million bundled subscriptions, which was 37 per cent of all fixed broadband subscriptions.
Figure 35 Number of bundled subscriptions
0
200
400
600
800
1 000
1 200
1 400
1 600
1 800
2 000
2009 2010 2011 2012 2013 2014 2015 2016
Th
ou
san
d s
ub
scrip
tion
s
Other
Bundled subscriptions including mobile broadband
Television and broadband
Fixed telephony, broadband and television
Fixed telephony and fixed broadband
Swedish Post and Telecom Authority 62
Double play, bundled subscriptions with two services, decreased by 4 per cent to 1.08 million. The commonest bundled subscription consist of fixed telephony and broadband, and these fell by 16 per cent to 587,000 subscriptions. This combination accounted for 36 per cent of the total number of bundled subscriptions. Bundled subscriptions consisting of TV and fixed broadband are the third commonest and these increased by 33 per cent to 307,000 subscriptions.
Triple play, i.e. bundles of three services, declined by 9 per cent. The second most common bundle was subscriptions for fixed telephony, fixed broadband and TV. These bundled subscriptions amounted to 528,000 subscriptions, which was a reduction of 9 per cent.
Bundling with four services, so-called quadruple play, are relatively uncommon and were at the same level as the previous year at 14,000.
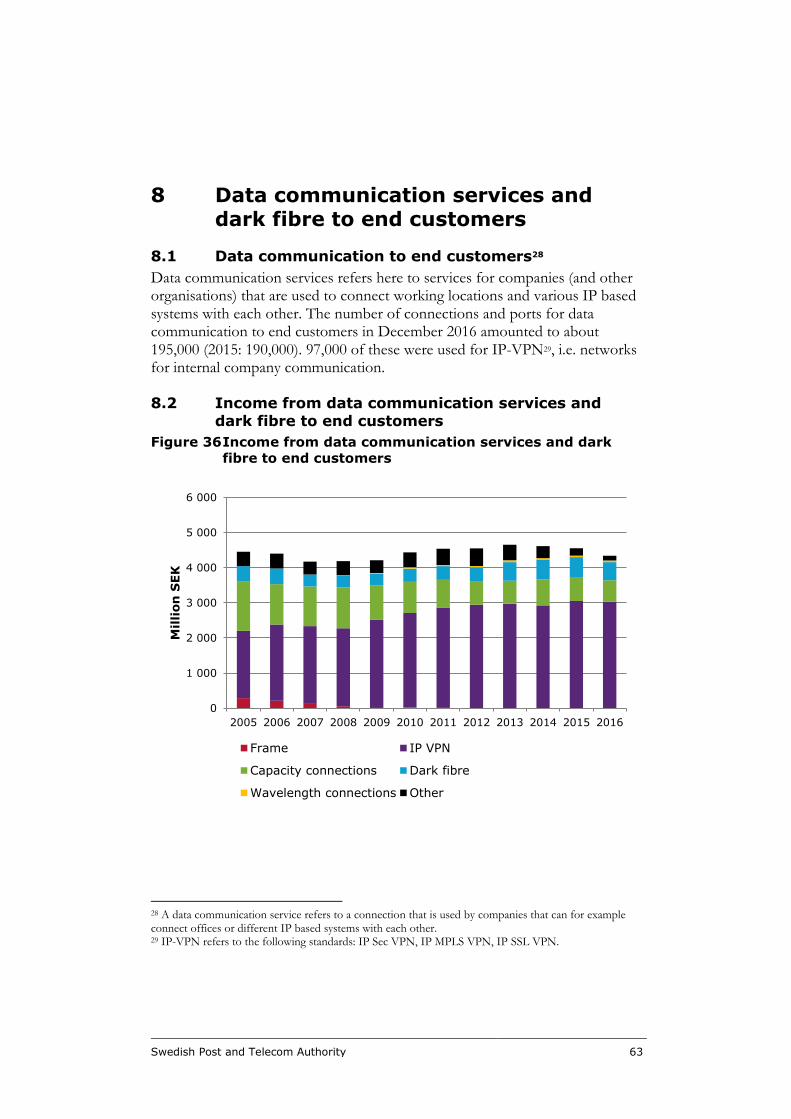
Swedish Post and Telecom Authority 63
8 Data communication services and dark fibre to end customers
8.1 Data communication to end customers28
Data communication services refers here to services for companies (and other organisations) that are used to connect working locations and various IP based systems with each other. The number of connections and ports for data communication to end customers in December 2016 amounted to about 195,000 (2015: 190,000). 97,000 of these were used for IP-VPN29, i.e. networks for internal company communication.
8.2 Income from data communication services and
dark fibre to end customers
Figure 36 Income from data communication services and dark
fibre to end customers
28 A data communication service refers to a connection that is used by companies that can for example connect offices or different IP based systems with each other. 29 IP-VPN refers to the following standards: IP Sec VPN, IP MPLS VPN, IP SSL VPN.
0
1 000
2 000
3 000
4 000
5 000
6 000
2005 2006 2007 2008 2009 2010 2011 2012 2013 2014 2015 2016
Mil
lion
SEK
Frame IP VPN
Capacity connections Dark fibre
Wavelength connections Other
Swedish Post and Telecom Authority 64
The total income from data communication services and dark fibre to end customers in 2016 was SEK 4.3 billion, a reduction of 5 per cent compared with 2015. There are considerable sales of dark fibre30 as capacity services and wavelength connections to operators (wholesalers) but this income is not included in this report.
Between 2015 and 2016 income from IP VPN services31 was largely unchanged at about SEK 3 billion, while income from capacity services32 fell by 6 per cent to SEK 611 million. Sales of capacity services to end customers have shown a downward trend, while the trend for sales of IP VPN services has been upward. This is mainly because companies are increasingly outsourcing the operation of their IP networks to an operator instead of handling this themselves.
Income from wavelength connections to end customers was SEK 44 million, a reduction from SEK 46 million the previous year. End customer income from dark fibre fell by 12 per cent, from SEK 588 million in 2015 to Sek 519 million in 2016.
30 Dark fibre connections refers to leased optical fibre connections where the fibre is not lit. That is to say, physical fibre cable without electronic equipment. 31 IP-VPN refers to the following standards: IP Sec VPN, IP MPLS VPN, IP SSL VPN. 32 The definition of digital capacity services changed in 2014 which means that statistics for the preceding years are not entirely comparable with those after 2014.
Swedish Post and Telecom Authority 65
9 Ducting
This year’s information gathering for The Swedish Telecommunications Market included for the second year questions about the ownership and use of ducting. PTS collects responses because of the ducting obligation in SMP decisions for market 3a (the market for local access to network infrastructure). The information is also being collected because of the new act (2016:534) on measures for the development of broadband networks, which was implemented into Swedish law on 1 July 2016.
Of the 231 organisations that received questions about ducting, 165 stated that they owned their own ducting as at 31 December 2016. Of the 165 respondents, 24 stated that they hired out ducting during 2016 and a further 90 stated that they have the possibility of hiring out ducting but had not been asked for this. Of the 165 respondents, 27 stated that they hired some form of ducting from others.
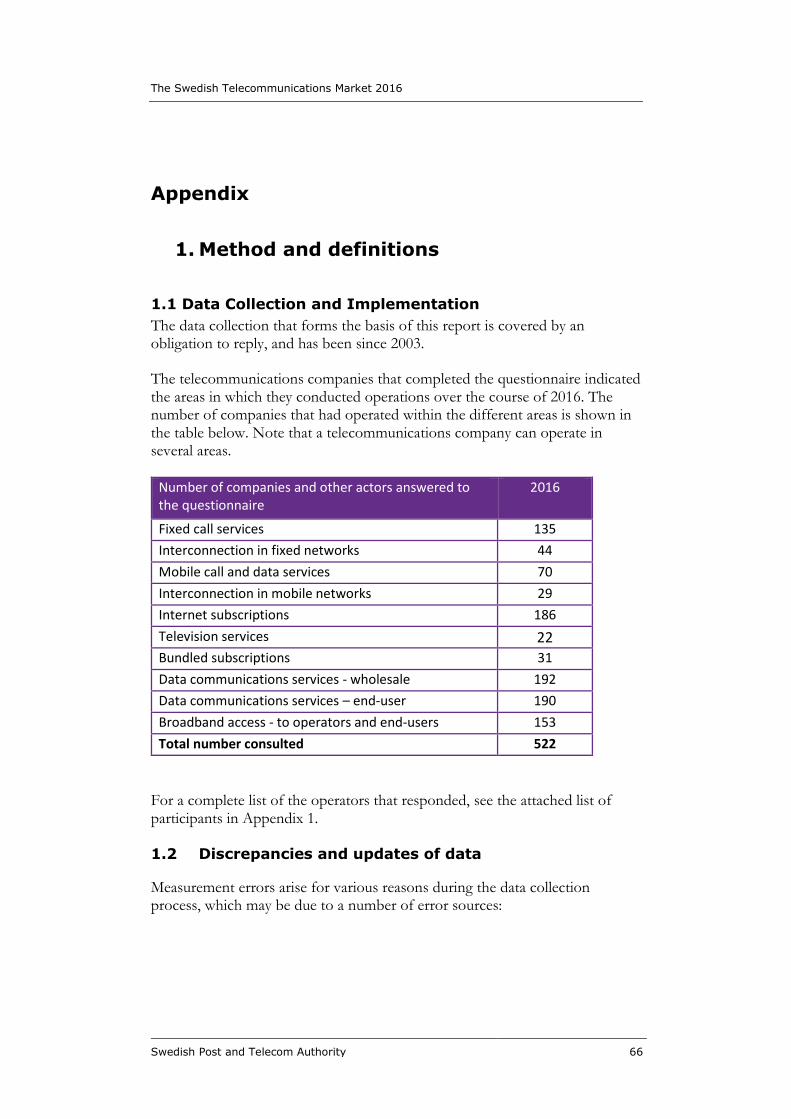
The Swedish Telecommunications Market 2016
Swedish Post and Telecom Authority 66
Appendix
1. Method and definitions
1.1 Data Collection and Implementation
The data collection that forms the basis of this report is covered by an obligation to reply, and has been since 2003.
The telecommunications companies that completed the questionnaire indicated the areas in which they conducted operations over the course of 2016. The number of companies that had operated within the different areas is shown in the table below. Note that a telecommunications company can operate in several areas.
Number of companies and other actors answered to the questionnaire
2016
Fixed call services 135
Interconnection in fixed networks 44
Mobile call and data services 70
Interconnection in mobile networks 29
Internet subscriptions 186
Television services 22 Bundled subscriptions 31
Data communications services - wholesale 192
Data communications services – end-user 190
Broadband access - to operators and end-users 153
Total number consulted 522
For a complete list of the operators that responded, see the attached list of participants in Appendix 1.
1.2 Discrepancies and updates of data
Measurement errors arise for various reasons during the data collection process, which may be due to a number of error sources:
The Swedish Telecommunications Market 2016
Swedish Post and Telecom Authority 67
Those consulted did not answer all of the questions in the survey
Not all operators in the market responded to the survey
The responses were misleading due to the fact that it was not possible to produce an exact value based on the company’s accounts, the instructions were misunderstood or inadequate, or incorrect information was submitted
The measurement errors are judged not to be large and can often be compensated for by starting from previously collected data or by estimating based on related questions in the survey.
As the information reported in percentages has been rounded off, the sum of the parts is not always 100 per cent.
The historical statistics are revised as PTS obtains corrections and further information. For that reason, the statistics for one and the same year can differ between editions of the report. The latest updated database is available on the PTS online statistics portal (www.statistik.pts.se)
For a more detailed description of measurement errors and non-response, see the attached quality declaration, Appendix 3.
1.3 Historical information and market shares
The development of the market is reported using statistics that, in some cases, go as far back as 1992. Since 2006, PTS has also published data on market shares for variables at the end-user level for every collection period. Market shares for a number of different variables are included in the report, but significantly more information is published on the online statistics portal. The variables judged to be inadequate, or which are misleading in another way, are not published on the statistics portal.
1.4 Definitions
Definitions that form the basis for this report are also used in the questionnaire, and these definitions are continually revised so that they are in sync with market developments. The segmentation of the individual sub-markets can change from year to year. Since 2003, PTS has also considered the information requirements for conducting market analyses and for deciding whether any operator has significant market power. Despite these changes, it is, for the most part, still possible to compare the information with that of previous reports.
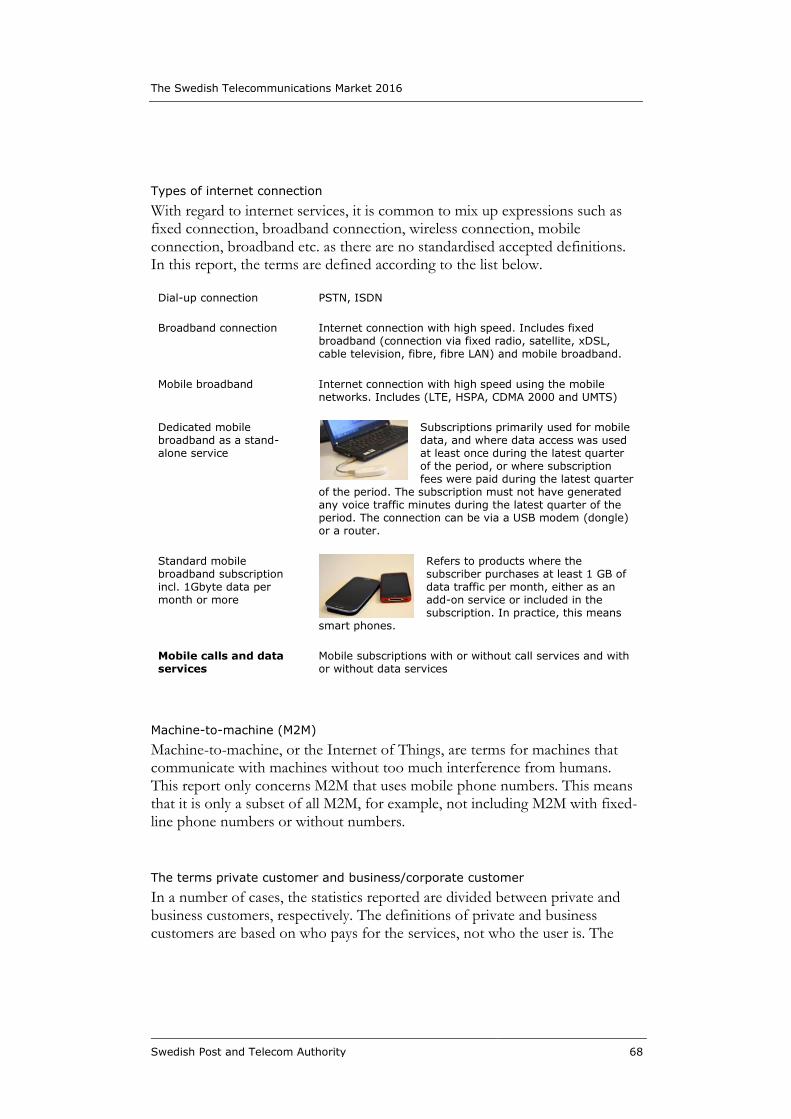
The Swedish Telecommunications Market 2016
Swedish Post and Telecom Authority 68
Types of internet connection
With regard to internet services, it is common to mix up expressions such as fixed connection, broadband connection, wireless connection, mobile connection, broadband etc. as there are no standardised accepted definitions. In this report, the terms are defined according to the list below.
Dial-up connection PSTN, ISDN
Broadband connection Internet connection with high speed. Includes fixed broadband (connection via fixed radio, satellite, xDSL, cable television, fibre, fibre LAN) and mobile broadband.
Mobile broadband Internet connection with high speed using the mobile networks. Includes (LTE, HSPA, CDMA 2000 and UMTS)
Dedicated mobile broadband as a stand-alone service
Subscriptions primarily used for mobile data, and where data access was used at least once during the latest quarter of the period, or where subscription fees were paid during the latest quarter
of the period. The subscription must not have generated any voice traffic minutes during the latest quarter of the period. The connection can be via a USB modem (dongle) or a router.
Standard mobile broadband subscription incl. 1Gbyte data per month or more
Refers to products where the subscriber purchases at least 1 GB of data traffic per month, either as an add-on service or included in the subscription. In practice, this means
smart phones.
Mobile calls and data services
Mobile subscriptions with or without call services and with or without data services
Machine-to-machine (M2M)
Machine-to-machine, or the Internet of Things, are terms for machines that communicate with machines without too much interference from humans. This report only concerns M2M that uses mobile phone numbers. This means that it is only a subset of all M2M, for example, not including M2M with fixed-line phone numbers or without numbers.
The terms private customer and business/corporate customer
In a number of cases, the statistics reported are divided between private and business customers, respectively. The definitions of private and business customers are based on who pays for the services, not who the user is. The
The Swedish Telecommunications Market 2016
Swedish Post and Telecom Authority 69
criterion for the party paying being designated a business customer (including organisations that are not businesses) is that it has an organisation registration number. The remainder are designated as private customers. This means, however, that businesses and organisations registered under a personal identity number are included in the private customer category.
Households
From 2016 onwards, Statistics Sweden (Statistiska Centralbyrån; SCB) has changed the method it uses to gather statistics on households. SCB has also revised statistics for household for the years 2011 – 2015 with the same method. This means that statistics related to the number of households in this report are not completely comparable to the corresponding statistics from editions before 2011. The number of households is published once a year and the latest published number is used in this report.
The Swedish Telecommunications Market 2016
Swedish Post and Telecom Authority 70
2 List of participants
0700 Sverige AB 21st Century Mobile AB (publ) 31173 Services AB 4 Sweden AB 42 Telecom AB AB Borlänge Energi AB Hallstahem AB iP.1 internet till företag AB PiteEnergi AB Sappa AB STOKAB AB strömstaNET Accesit Norden AB ACN Communications Sweden AB AC-net Externservice AB Add Logo Telecom AB Advoco Communication AB AEB Kommunikation AB Affärsverken Karlskrona AB AID Solutions Väst AB Alingsås Energi Nät AB AllTele Företag Sverige AB AllTele Privat AB Alvondo AB Ansluten Hosting i Sverige AB Arboga kommun /Fibra Arjeplogs kommun Arkaden Konsult AB ARKAIDN AB Arvidsjaurstadsnät Arvika Kommunnät AB AT&T Global Network Services Sweden Aurora Innovation AB Avesta Kommun Aviolinx Communication and Services AB Avoice AB AxByte AB
Bahnhof AB Balder Tech AB Bearcom Beepsend AB Benemen Oy Bengtsfors Energi Nät AB Best 4 you AB BICS Sweden AG Bild AT se AB Bjurholms kommun Bjäre Kraft Bredband AB Bjärke Energi AB Björnekulla IT AB BKE TeleCom BKO, Kommunikationsoperatör i Boden AB BM Sverige AB Bodens Energi Nät AB BogalNet AB Bollnäs Energi AB Borderlight AB BoreNet AB Borås Elnät AB Botkyrka Stadsnät AB Boxer TV-Access AB Bredband i Kristianstad AB Bredband Östra Skaraborg AB Bredband2 Bredbandsson AB Bredbandsteknik 2000 i Karlshamn AB Bredbandstjänster i Dalarna AB Breiband.no AS BroNet i Lysekil ekonomisk förening BT Nordics Sweden AB Bygdanet Ekonomisk Förening Bålsta Kabel-TV AB C4 Elnät AB
The Swedish Telecommunications Market 2016
Swedish Post and Telecom Authority 71
Canal Digital Sverige AB Canal Vision AB Carlslids Bredband ek. för. CCD Communications Deutschland GMBH Cellip AB CenturyLink Europe BV filial Sweden Challenger Mobile AB Citynätet i Nässjö AB Cloud 9 Mobile Communications Ltd Clue AB CLX Networks AB Colt Technology Services AB Com Hem AB Com4 Sweden AB Comgate Connect AB Compatel Limited Conect Connectel AB CRM Portalen AB CRW Data AB C-Sam AB Cubic Telecom LT Dackebygdens Kabel-TV AB Daimler AG Dala Energi Fibernät AB Daladatorer i Mora AB Data Communication & Software i Gröndal Degerfors Energi AB DGC Access AB Dialoga Servicios Interactivos. S.A. DIDWW Ireland Limited DNA Oyj Dorotea kommun easy pbx AB EasyTelecom i Stockholm AB e-BO Enterprises NV Eddima Teknik AB Efftel AB
Egonet AB Eidsiva bredbånd AS Eksjö Energi ELIT AB Ellevio AB ElmNet AB Ember AB Emmaboda Energi & Miljö AB engboms network solution ab Eniro 118 118 AB Enterprise Services Sverige AB EPM Data AB Erate AB Eskilstuna Energi & Miljö euNetworks Fiber UK Limited European Ip Cloud AB EVRY One Nät Uppsala AB Excanto AB Excedo Networks AB Excellent Hosting Sweden AB Falbygdens Bredband AB Falbygdens Energi AB Falu elnät AB Fast Communications AB Fastbit AB Fello Fiber Direkt i Sverige AB Fiberaccessbolaget i Sverige AB Fiberstaden AB Finspångs Stadsnät Finet AB First New Media Scandinavia AB Flens Kommun Fogwise AB Fonia AB Forshaga Fibernät AB Fouredge AB Framtidens Bredband Freespee Frilansjobb i Skandinavien AB Fröskogs Fiber Ekonomisk Förening ftech AB GCM AB
The Swedish Telecommunications Market 2016
Swedish Post and Telecom Authority 72
Generic Mobile Systems Sweden AB GleSYS Internet Services AB Globetouch AB Gothia Telecom Ab Gotlands Energi AB Griffel AB Griffnet AB Grästorp Energi ek för GT3C Sweden AB GTelecom Limited (B.V.I.) filial GTT Comunication S.r.l. Gällivare kommun Gästabudstaden AB Gävle Energi AB Götalandsnätet AB Göteborg Energi GothNet AB Götene kommun Habo Energi AB Hagfors kommun Halmstads stadsnät AB Hammarö kommun / Stadsnät Haparanda kommun HebyNet AB Hedemora Energi AB Helsinge Net Ovanåker AB Herrljunga Elektriska AB Hewlett Packard Enterprise Hi3G Access AB Hjo Energi AB Hofors kommun HORISEN AG hotsplots GmbH HVE Balt-Com Fiber AB HåboNet AB Härjeåns Nät AB Hässleholms kommun Höganäs Energi AB Höglandets Optoservice Högsbynät AB iCentrex Sweden AB Icuri AB
Idé & Resurscentrum AB IDT Retail Europe Limited imega system ab inContact Ltd. Indicate IT AB Infogram System AB InformationsTeknik i Norrbotten AB Inmarsat Solutions (Canada) Inc. Inmarsat Ventures Ltd InnoTel AB Insat Net AB Intelecom Sweden AB Interactive digital media gmbh Interoute Managed Services Sweden AB IntJoors Holding AB IntraPhone IT AB IP Maxi AB IP Sweden AB IPC Network Services Limited Ipify ltd IP-ONLY AB IT System i Dalarna AB IT Åre IT4U Sweden AB IT-BO i Stockholm AB IT-mästaren Mitt AB ITTRE Sverige AB iTUX Communication AB JL Phone Systems AB Jokkmokks kommun Jordberga Gård AB JT Technologies & Telecommunications AB Junet AB Junyverse AB Jönköping Energi AB Kalix Stadsnät KalixNet AB Kalix Tele24 AB Karlsborgs Energi AB Karlshamn Energi
The Swedish Telecommunications Market 2016
Swedish Post and Telecom Authority 73
Karlskoga Stadsnät AB Karlstads El- och Stadsnät AB Kinda kommun Kiruna kommun KnivstaNet AB Kommunicera i Umeå AB KPN Eurorings Kraftringen Enerig AB (publ) KumBro Stadsnät AB Kungsbacka kommun Kungälv Energi Kustbandet AB Kävlinge Kommun Köpings Kabel-TV AB LA Cable AB Laholms Bredbandsbolag AB Landskrona Energi AB Lappland Network Services AB Lebara Media Services Ltd Lerdals Fiber Ekonomisk Förening Level 3 Communications AB Lidén Data Internetwork AB Lidero Network AB limitless mobile LINK Mobility A/S LINK Mobility AB Linking Communication B2B AB Ljungby Energi AB Ljusnet AB Lulebo AB Lunet AB Lycamoibile Sweden Limited Lycksele kommun Lyssna-Njut Euronics AB Malmö stad för malmö stadsnät Malungs Elnät AB Malå kommun Mark Kraftvärme AB Media Nework i Halmstad AB Mediateknik i Varberg AB Megaport (Sweden) AB Mi Carrier Service AB
Microtec i Laholm Ab MIMS Invest AB miniTel AB Mitto AG MKB Nét AB Mobile Arts AB MOBIWEB LIMITED Monty UK Global Mora Kommun Motala kommun Multicom Security AB Mundio Mobile Sweden Ltd Munkfors kommun My Beat AB Mälardalens Datorförening Mälarenergi AB Mönsterås kommun N4 Qavat AB Natterbox Ltd Net at Once Sweden AB Netcomp System i Blekinge AB Netett Sverige AB NetIT Internet Solutions in Sweden AB Netnod Internet Exchange i Sverige AB Netsize Internet Payment Exchange AB Netwest Sweden AB NextGen Mobile Ltd Njudung Energi Vetlanda AB Nordic Digit AB Nordiska Servercentralen AB Nordmalings kommun Norrköping Vatten och Avfall AB Norrsken AB Norrtälje Energi AB Nortech Telecom Nossebro Energi Försäljnings AB Nossebroortens Energi Ek För NTT Europe Limited Nybro energi AB
The Swedish Telecommunications Market 2016
Swedish Post and Telecom Authority 74
Nytel i Sverige AB Nätbolaget Holding Sverige AB Obduro Network AB Obenetwork AB Office i Kiruna AB OITP Dalarna AB Olofströms Kabel-TV AB Olofströms Kraft AB On 1 Call Support AB Orange Business Sweden AB OrbiGo AB Orsa Kommun Oversite AB Oxelö Energi AB Pajala kommun PCCW Global (Sweden) A.B. PCCW Global B.V. Peter Lindström Elektronik AB Phonera Företag AB Pico Global Ltd. Profitbyte AB Pure IP Limited Pushtalk Group Communication AB Qall Telecom AB QuickNet AB RB Communication AB Rebtel Networks AB Region Gävleborg Retn Baltic AS Rg19 i Norden AB Ringson AB Robertsfors kommun Rockan Data Center AB Romelebygdens Kabel-TV AB Ronneby Miljö&Teknik AB Rydalink ekonomisk förening SalaNet AB Sandviken Energi AB Sanet Telecom AB SAP Svenska AB SavMAN AB
Seniortelefoni Sverige AB ServaNet AB Serverado AB ServIT AB SEVAB Shyam Telecom UK Ltd Sierra Wireless Sweden AB Sigma IT Consulting Sweden AB SIHI Scandinavia AB SIT24AB Skara Energi AB Skellefteå Kraft Fibernät AB Skurups Elverk Skype Communications, S.A.R.L. Skövde Kommun Smedjebacken Energi & Vatten AB SMS Provider Corp. Smålands Bredband AB Sollefteå kommun Sollentuna Energi & Miljö AB Sorsele kommun South Brains AB SPIRIUS AB Spkr Direct Communication STADSNÄT I ÅMÅL AB Staffanstorps Fibernät AB Statnett SF Stockholm Colocation AB Stockholms Stadsnät AB Storumans kommun Straznet AB Sundbybergs Stadsnätsbolag AB Suravision AB Svea Billing Services AB Swedavia Airport Telecom AB Svensk Konsumentmobil AB Svensk Säkerhetstjänst Net i Sverige AB Svenska IP-Telefonibolaget AB Svenska Kraftnät Svenska UMTS-nät AB Sveriges Telefoni Företag AB
The Swedish Telecommunications Market 2016
Swedish Post and Telecom Authority 75
Swisstok Telnet Finland Oy Switch Nordic Green AB Swoscom AB Systemintegration i Växjö Systempartner i Ljungby AB Säffle Kommunikation AB Sävast Kabeltv föreninng Söderhamn NÄRA Söderköpings kommun Sölvesborgs Energi och Vatten AB Taisto Keskitalo DATA AB Tata Communications (Sweden) AB TCN Sverige Ab TeamViewer GmbH TechTrade International AB Teknik i Media Datacenter Stockholm AB Telavox AB Tele2 Business AB (förut TDC Sverige AB Tele2 Sverige AB Tele4u i Sverige AB Telecom3 Sverige AB Teledigit Scandinavia AB Teleinfo 118800 Tele-Man AB Telemar Scandinavia AB Telenor Connexion AB Telenor Maritime AS Telenor Sverige AB Telephonia Telecom AB TeleProffs Sverige AB Teleservice Bredband Skåne AB Teletek 5060 AB Telge Nät AB Telia Company AB Teloteket AB Telstra Limited Tenorama Data AB Teracom AB Teru HB
The Cloud Networks Nordic AB Tibro Energi AB Tictic AB Tidaholms Energi AB Tierp FiberNetwork AB Tingo Mobil AB TIWS Sweden AB T-MOBILE HOTSPOT GMBH Tomelilla kommun Trafikverket Tranemo Kommun Tranquillity Transaction networl services AB TRANSATEL SA TransTK (UK) Ltd Tranås Energi AB Trelleborgs Byakontakt Triangelbolaget D4 AB Trollhättan Energi AB Tropo (Europe) Limited Trosa Fibernät AB Tuna Kabel-TV AB Uddevalla Energi AB Ulricehamns Energi AB Umeå Energi Umenet Ab Unicornn Telecom AB Uno Telefoni AB UppCom AB Utsikt Bredband AB Vaggeryds Energi AB Vallebygdens Energi ekf Valvea AB Vanco Sweden AB Vansbro kommun Wantech AB VaraNet AB Varasättens Bredband Ekonomisk Förening Varberg Energi Vattenfall Eldistribution AB WCOM AB Weblink IP Phone AB
The Swedish Telecommunications Market 2016
Swedish Post and Telecom Authority 76
Vellinge stadsnät AB Vellinge Wireless AB Verizon Sweden AB West UC Limited Wexnet AB ViaEuropa i Sverige AB Viasat AB Viatel Sweden AB Wifog AB Viking Tech AB Vilhelmina kommun Vimmerby kommun Vindelbostäder AB Winther Wireless AB Vixor Wireless Broadband Infrastructure Vodafone Enterprise Sweden AB Voice Integrate Nordic AB Voice Provider Voicenet Solutions Ltd (TA 8x8 Solutions Voicetech Sweden AB Voxbone S.A Wx3 Telecom AB Väddö Media Information IS AB VänerEnergi AB Vännäs Kommun Värnamo Energi AB Västerbergslagens Elnät AB Västervik Miljö & Energi AB VÖKBY Bredband AB Ydre kommun Ystad Energi AB Zedcom ISP AB Åre Network AB Årjängs Nät AB Åsele kommun
Älvdalens kommun Älvsbyns Kommun Öckerö Fastighets AB/Öckerö Nät Örecom AB Öresundsbro Konsortiet Öresundskraft AB Österlens Kraft AB Österåkers Stadsnät AB Östhammars Stadsnät (Östhammars kommun) Överkalix kommun Övertorneå kommun Övik Energi AB
The Swedish Telecommunications Market 2016
Swedish Post and Telecom Authority 77
3 Changes in statistics
The following changes were noted in the reported data for 2016. Acquisitions See separate document about participants. Change of name: See separate document about participants. Historical corrections Some operators has corrected their historical data since the last publication. These corrections are now included in the statistics portal and Excel-tables. See also separate document about corrections. Changes after publication The collection of operator data continues even after the Swedish Telecommunications Market report is published, which makes it so that the PTS database for operator statistics is continually improved, and the frequency of response increases. See statistik.pts.se and www.pts.se). For the absolute latest statistics, refer to the statistics portal online.

The Swedish Telecommunications Market 2016
Swedish Post and Telecom Authority 78
4 Report tables
Available in a separate document.
The Swedish Telecommunications Market 2016
Swedish Post and Telecom Authority 79
5 Quality declaration
B.0 Introduction
‘The Swedish Telecommunications Market’ represents a data compilation conducted twice annually. The results are presented on a statistics portal (www.statistk.pts.se) and also in summary form in a report.
B.1 Contents
1.1 Statistical target characteristics
The compilation gathers information about the number of subscriptions broken down by subscription type, traffic broken down according to kind of traffic and revenues from the retail market in respect of the market for mobile call services. This information is reported in certain cases split between private and business, respectively.
1.2 Objects and population
The target population comprises a sample selection of undertakings that have conducted operations within the market for electronic communications. The framework population comprises those undertakings that have given notice to PTS that they intend to conduct telecom operations according to Chapter 2, Section 1 of the Electronic Communications Act (LEK). Undertakings subject to a notification obligation are provided by PTS in a register. In addition to this, there are also a number of undertakings within the market for broadcasting and a number of public stakeholders.
1.3 Variables
Data collection is conducted by means of a web questionnaire. The compilation includes variables as regards:
Subscriptions (number and type)
Traffic volumes (number of minutes, calls, bytes, sms, mms)
Revenues (SEK)
Market shares (based on number of subscriptions)
The Swedish Telecommunications Market 2016
Swedish Post and Telecom Authority 80
1.4 Statistical measures
Data collected is reported as number, in SEK, bytes, bit per second, as an average per household, number per minute and as number per 1,000 inhabitants.
1.5 Study domains
Data is presented in five areas: fixed call services, mobile voice and data services, Internet services, television services, and bundled subscriptions. There are reports broken down into private and business.
1.6 Reference times
This data compilation relates to the calendar year 2016.
1.7 Comprehensiveness
The data compilation ‘The Swedish Telecommunications Market’ is an independent survey, but PTS also gathers in data annually concerning broadband access lines.
B.2 Accuracy
2.2 Overall accuracy
The Swedish Telecommunications Market is a comprehensive survey that does not have any measurement of uncertainty, though there is uncertainty. The data compilation has a high response frequency, 95% for the 2016 compilation. However, the framework population may be smaller than the target population, an uncertainty that is considered to be low as PTS’s register quality is considered overall to be good.
Partial attrition is reduced in part by the inclusion of responses from previous years in the web questionnaires to assist the respondents when completing the questionnaire, and also by the incorporation of certain blocks that require the respondents to provide an explanation in the event of an excessive deviation from responses provided in previous years. Systematic errors occur, and are reduced partly by data for various sizes being checked against each other to identify deviating information.
The Swedish Telecommunications Market 2016
Swedish Post and Telecom Authority 81
2.3 Sources of inaccuracy
Besides inaccuracy resulting from the survey being a sample survey, the result is affected by a further number of sources of error, for instance partial attrition, under and over coverage and various kinds of measurement error.
1. Estimating
Estimates are made of the half-year data through the responses from the full-year survey being added to the total for those operators that are not included in the sampling selection. This means that regard is not taken to any changes in the form of increases or reductions within that group and that those increases or reductions seen for the sample are underestimated. In addition to this there are also estimates for individual operators. These estimates are made on the basis of the previous responses submitted by company and subsequently sent back to the operator for approval.
2. Measurement errors
Measurement errors arise when an operator answers the questionnaire but does not provide the true value. This may be the result of neglect, inadequate or misunderstood instructions or that it was not possible for any exact value to be established from the businesses’ accounts. Several operators have, for instance, not had access to reliable documentation for reporting volume data.
3. Processing
The information gathered undergoes processing and if necessary correction, sometimes following supplementary information from undertakings.
B.3 Timelines
3.1 Frequency
The data collection is collected twice annually, on half-year and full-year basis. For the half-year report, the data collection comprises fewer variables and is based on a sample of the target population.
3.2 Production time
Four months; publication occurs approximately one month after data collection is concluded.
The Swedish Telecommunications Market 2016
Swedish Post and Telecom Authority 82
3.3 Punctuality
Six months after the end of the survey period, according to the plan.
B.4 Comparability and coherence
4.1 Comparability over time
For detailed information about breaks in time series, reformulated intervals, etc., see the tables published on the PTS statistics portal (www.statistik.pts.se).
4.2 Comparability between groups
Certain variables in the data presentation are also included in other statistics:
Households. Statistics Sweden (SCB) annually publishes statistics on the number of households in Sweden.
Population of Sweden. SCB also annually publishes statistics concerning the population of Sweden.
4.3 Coherence with other statistics
Since 2003, PTS collects statistics for the full-year report in cooperation with SCB and Trafikanalys, which means that the statistics published from 2003 an onwards by PTS and Trafikanalys can be used jointly. For the years before 2003, there may be certain differences as a consequence of separate statistical processing. There is no corresponding information for the data collected on half-year basis.
4.4 Availability and clarity
The results of the data collection are presented on a statistics portal in the form of tables. The results are also compiled in this report, ‘The Swedish Telecommunications Market’.
4.5 Forms of dissemination
Both the statistics portal and the report are publicly available on the web. All information is also published in English.
The Swedish Telecommunications Market 2016
Swedish Post and Telecom Authority 83
4.6 Documentation
This document represents the quality documentation.
4.7 Access to primary material
All material is presented in the form of tables on the PTS statistics portal. Primary data can usually be provided to the general public upon request.
4.8 Further information can be provided by
Karin Fransén, PTS, telephone +46(0)8-678 55 00, e-mail: [email protected]
Andreas Wigren, PTS, telephone +46(0)8-678 55 00, e-mail: [email protected]
Related Documents