The Italian Insurance Market 2016 figures + 3M17 overview

Welcome message from author
This document is posted to help you gain knowledge. Please leave a comment to let me know what you think about it! Share it to your friends and learn new things together.
Transcript

The Italian Insurance Market
2016 figures + 3M17 overview

PwC
Italian insurance market snapshots
The Italian Insurance Market • 2016 figures + 3M17 overview
1
PwC | The Italian Insurance Market • 2016 figures + 3M17 overview
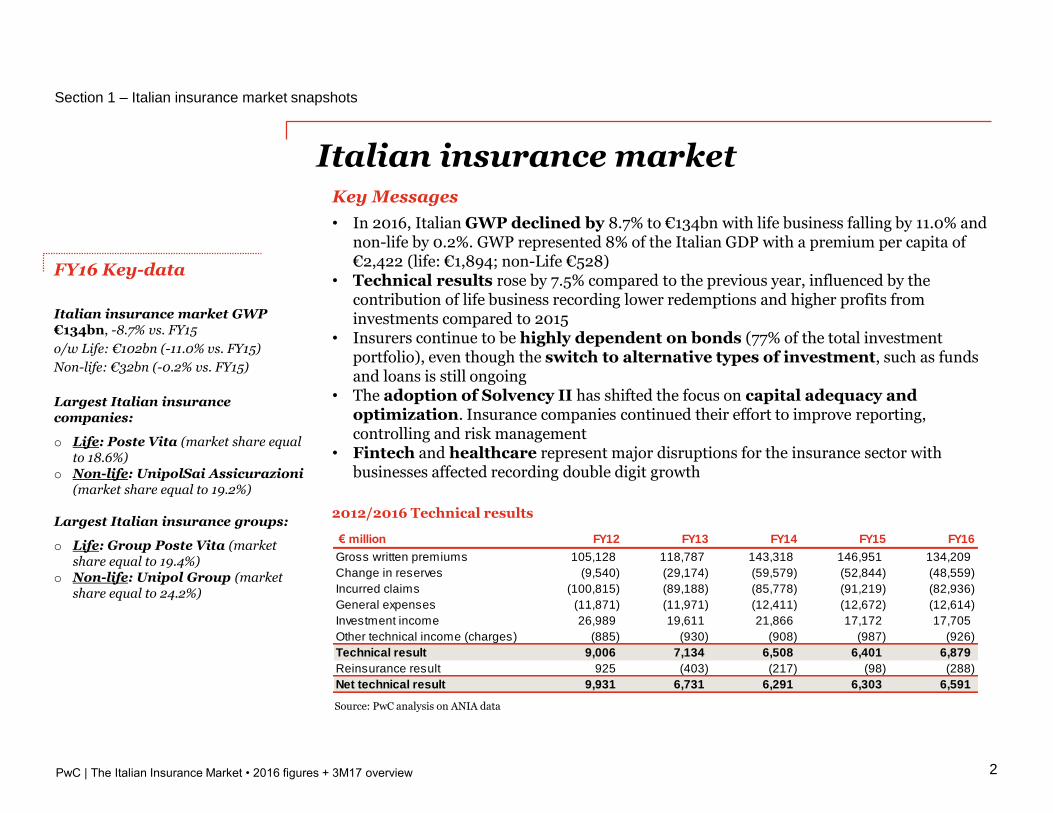
€ million FY12 FY13 FY14 FY15 FY16
Gross written premiums 105,128 118,787 143,318 146,951 134,209
Change in reserves (9,540) (29,174) (59,579) (52,844) (48,559)
Incurred claims (100,815) (89,188) (85,778) (91,219) (82,936)
General expenses (11,871) (11,971) (12,411) (12,672) (12,614)
Investment income 26,989 19,611 21,866 17,172 17,705
Other technical income (charges) (885) (930) (908) (987) (926)
Technical result 9,006 7,134 6,508 6,401 6,879
Reinsurance result 925 (403) (217) (98) (288)
Net technical result 9,931 6,731 6,291 6,303 6,591
Section 1 – Italian insurance market snapshots
2
Italian insurance market
FY16 Key-data
Italian insurance market GWP €134bn, -8.7% vs. FY15
o/w Life: €102bn (-11.0% vs. FY15)
Non-life: €32bn (-0.2% vs. FY15)
Largest Italian insurance companies:
o Life: Poste Vita (market share equal to 18.6%)
o Non-life: UnipolSai Assicurazioni (market share equal to 19.2%)
Largest Italian insurance groups:
o Life: Group Poste Vita (market share equal to 19.4%)
o Non-life: Unipol Group (market share equal to 24.2%)
Source: PwC analysis on ANIA data
Key Messages
• In 2016, Italian GWP declined by 8.7% to €134bn with life business falling by 11.0% and non-life by 0.2%. GWP represented 8% of the Italian GDP with a premium per capita of €2,422 (life: €1,894; non-Life €528)
• Technical results rose by 7.5% compared to the previous year, influenced by the contribution of life business recording lower redemptions and higher profits from investments compared to 2015
• Insurers continue to be highly dependent on bonds (77% of the total investment portfolio), even though the switch to alternative types of investment, such as funds and loans is still ongoing
• The adoption of Solvency II has shifted the focus on capital adequacy and optimization. Insurance companies continued their effort to improve reporting, controlling and risk management
• Fintech and healthcare represent major disruptions for the insurance sector with businesses affected recording double digit growth
2012/2016 Technical results
PwC | The Italian Insurance Market • 2016 figures + 3M17 overview
69,715 85,110
110,515 114,950 102,257
35,413
33,690
32,800 32,002
31,953 105,129 118,800
143,315 146,952 134,205
FY12 FY13 FY14 FY15 FY16
€m
illi
on
Life Non-Life
6%
80%
0%
14%
62%
22%
14% 1%
Italian insurance market trend
Section 1 – Italian insurance market snapshots
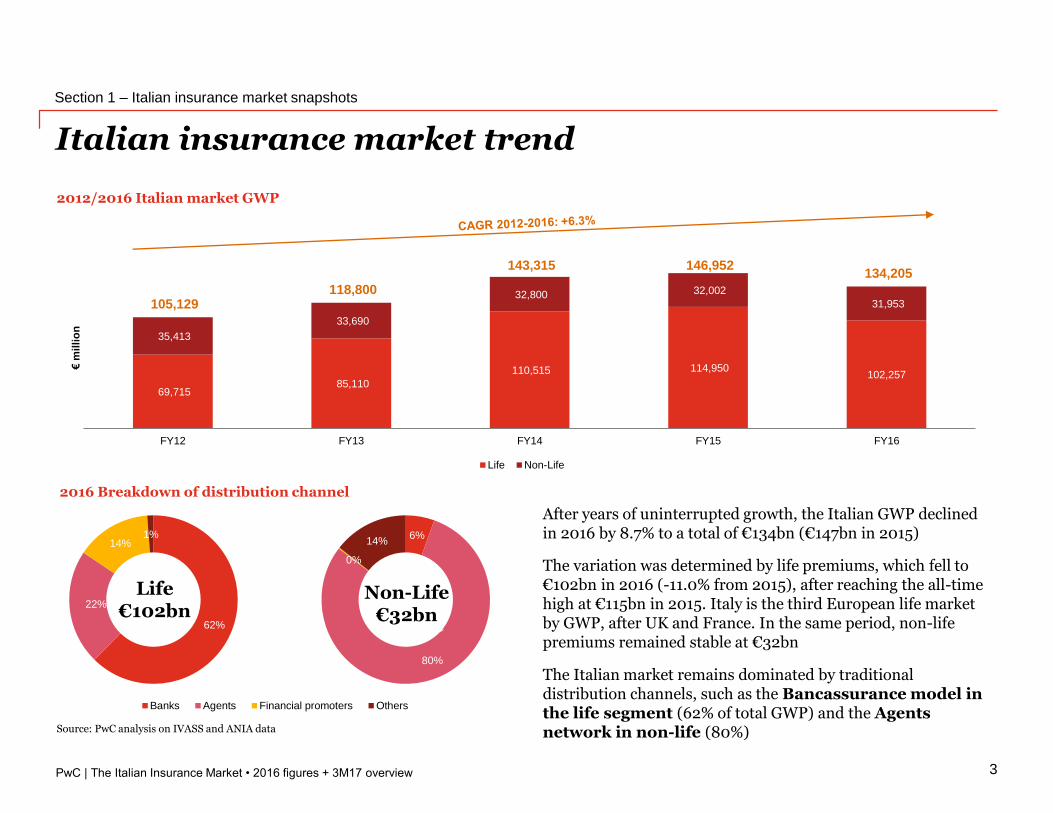
2012/2016 Italian market GWP
2016 Breakdown of distribution channel
Non-life
Source: PwC analysis on IVASS and ANIA data
After years of uninterrupted growth, the Italian GWP declined in 2016 by 8.7% to a total of €134bn (€147bn in 2015)
The variation was determined by life premiums, which fell to €102bn in 2016 (-11.0% from 2015), after reaching the all-time high at €115bn in 2015. Italy is the third European life market by GWP, after UK and France. In the same period, non-life premiums remained stable at €32bn
The Italian market remains dominated by traditional distribution channels, such as the Bancassurance model in the life segment (62% of total GWP) and the Agents network in non-life (80%)
Life€102bn
Non-Life€32bn
5%
81%
0%
14%
Non-Life market - Breakdown per distribution channel FY14
Banks Agents Financial promoters Others
3
PwC | The Italian Insurance Market • 2016 figures + 3M17 overview
19,820
10,437
7,844
5,480 4,587
19,820
18,016
14,947
6,550 6,323
18.6%
9.8%
7.4%
5.1%4.3%
19.4%
17.6%
14.6%
6.4% 6.2%
0%
2%
4%
6%
8%
10%
12%
14%
16%
18%
20%
-
5,000
10,000
15,000
20,000
Mark
et
sh
are
GW
P (€
mil
lio
n)
6,960
5,070
3,731
1,658 1,426
7,737
5,889
4,570
1,974 1,929
19.2%
14.0%
10.3%
4.6% 3.9%
24.2%
18.4%
14.3%
6.2% 6.0%
0%
5%
10%
15%
20%
25%
30%
-
3,000
6,000
9,000
12,000
15,000
Mark
et
sh
are
GW
P (€
mil
lio
n)
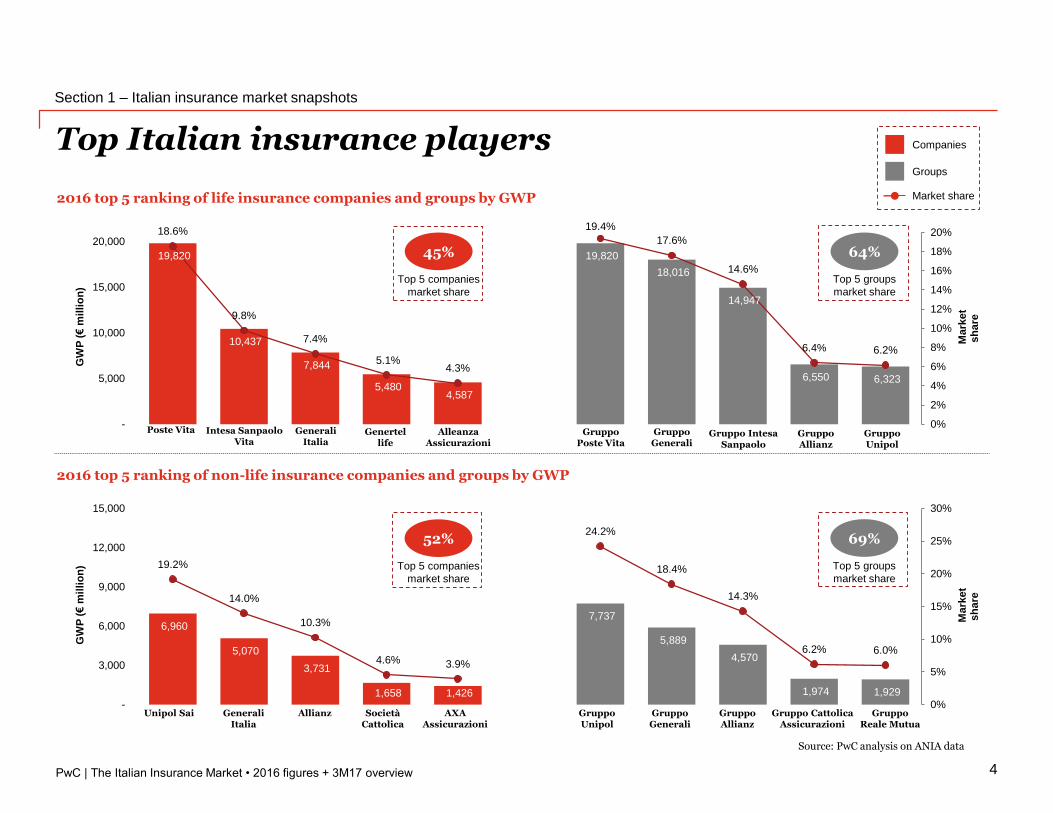
2016 top 5 ranking of life insurance companies and groups by GWP
Top Italian insurance players
Section 1 – Italian insurance market snapshots
4
2016 top 5 ranking of non-life insurance companies and groups by GWP
45%
Top 5 companies
market share
Source: PwC analysis on ANIA data
Poste Vita Genertellife
Intesa Sanpaolo Vita
Generali Italia
AlleanzaAssicurazioni
GruppoPoste Vita
GruppoGenerali
Gruppo Intesa Sanpaolo
GruppoAllianz
GruppoUnipol
Unipol Sai Generali Italia
Allianz AXAAssicurazioni
GruppoUnipol
GruppoGenerali
GruppoAllianz
Gruppo CattolicaAssicurazioni
GruppoReale Mutua
SocietàCattolica
64%
Top 5 groups
market share
52%
Top 5 companies
market share
69%
Top 5 groups
market share
Companies
Groups
Market share
PwC | The Italian Insurance Market • 2016 figures + 3M17 overview
Investments
Section 1 – Italian insurance market snapshots
5
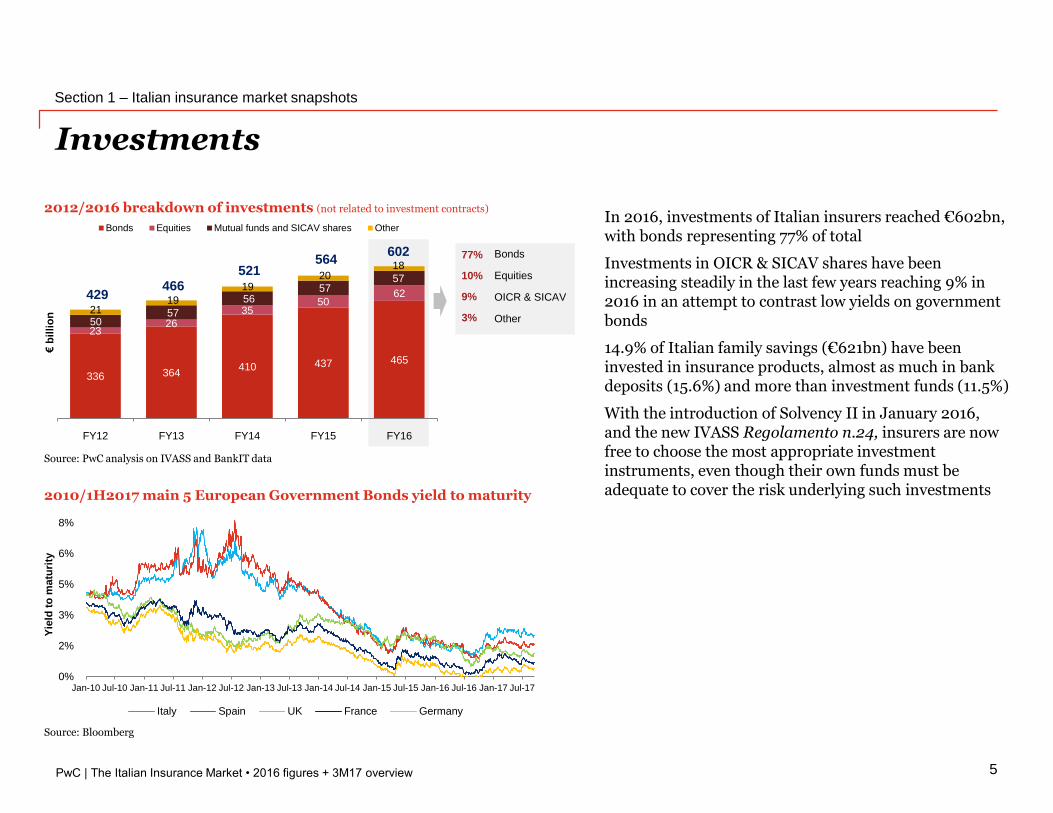
2010/1H2017 main 5 European Government Bonds yield to maturity
Source: Bloomberg
In 2016, investments of Italian insurers reached €602bn, with bonds representing 77% of total
Investments in OICR & SICAV shares have been increasing steadily in the last few years reaching 9% in 2016 in an attempt to contrast low yields on government bonds
14.9% of Italian family savings (€621bn) have been invested in insurance products, almost as much in bank deposits (15.6%) and more than investment funds (11.5%)
With the introduction of Solvency II in January 2016, and the new IVASS Regolamento n.24, insurers are now free to choose the most appropriate investment instruments, even though their own funds must be adequate to cover the risk underlying such investments
0%
2%
3%
5%
6%
8%
Jan-10 Jul-10 Jan-11 Jul-11 Jan-12 Jul-12 Jan-13 Jul-13 Jan-14 Jul-14 Jan-15 Jul-15 Jan-16 Jul-16 Jan-17 Jul-17
Yie
ld t
o m
atu
rity
Italy Spain UK France Germany
Source: PwC analysis on IVASS and BankIT data
3%
9%
10%
77%
Other
OICR & SICAV
Equities
Bonds
316 343 389 414 441
166
7574
7676
22 25
35 49
60
26 23
23 25
23
430 466
521 564
601
FY12 FY13 FY14 FY15 FY16
€b
illi
on
Bonds Equities Mutual funds and SICAV shares Other
2012/2016 breakdown of investments (not related to investment contracts)
336 364410 437 465
2326
3550
62
50 57
56 57
57
21 19
19 20
18
429 466
521 564
602
FY12 FY13 FY14 FY15 FY16
€b
illi
on
PwC | The Italian Insurance Market • 2016 figures + 3M17 overview
Section 1 – Italian insurance market snapshots
6
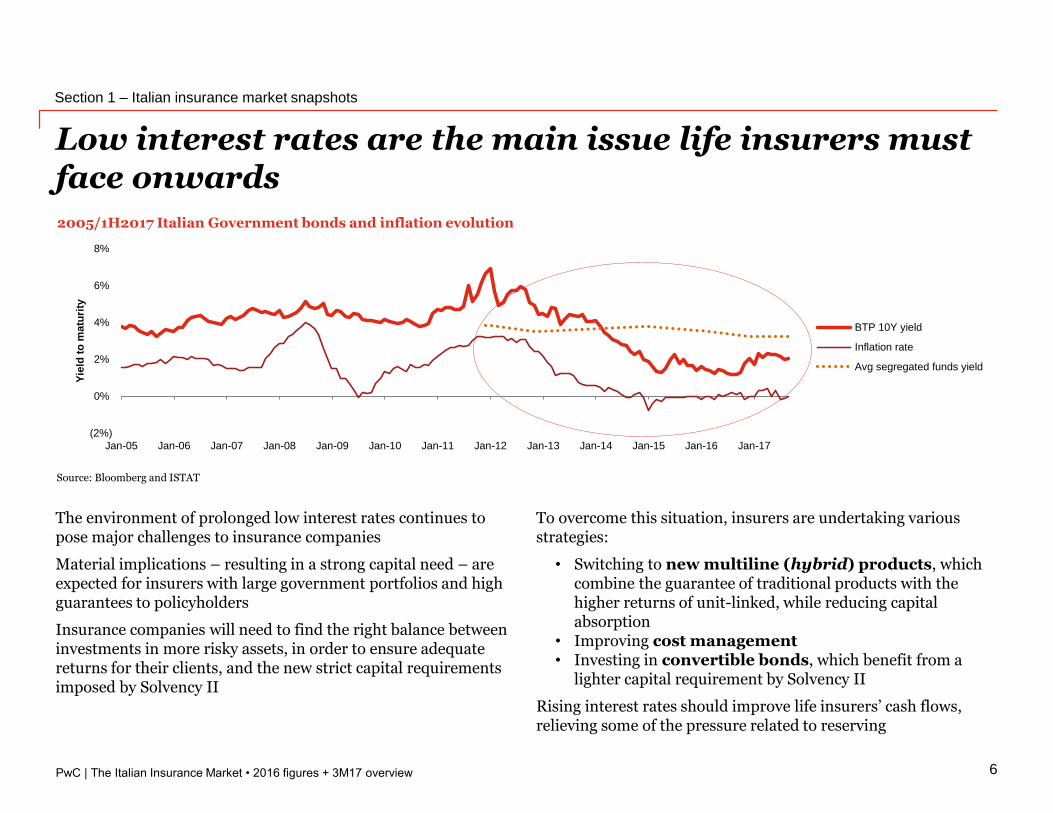
Low interest rates are the main issue life insurers must face onwards
2005/1H2017 Italian Government bonds and inflation evolution
Source: Bloomberg and ISTAT
To overcome this situation, insurers are undertaking various strategies:
• Switching to new multiline (hybrid) products, which combine the guarantee of traditional products with the higher returns of unit-linked, while reducing capital absorption
• Improving cost management• Investing in convertible bonds, which benefit from a
lighter capital requirement by Solvency II
Rising interest rates should improve life insurers’ cash flows, relieving some of the pressure related to reserving
The environment of prolonged low interest rates continues to pose major challenges to insurance companies
Material implications – resulting in a strong capital need – are expected for insurers with large government portfolios and high guarantees to policyholders
Insurance companies will need to find the right balance between investments in more risky assets, in order to ensure adequate returns for their clients, and the new strict capital requirements imposed by Solvency II
(2%)
0%
2%
4%
6%
8%
Jan-05 Jan-06 Jan-07 Jan-08 Jan-09 Jan-10 Jan-11 Jan-12 Jan-13 Jan-14 Jan-15 Jan-16 Jan-17
Yie
ld t
o m
atu
rity
BTP 10Y yield
Inflation rate
Avg segregated funds yield
PwC | The Italian Insurance Market • 2016 figures + 3M17 overview
35,413 33,690 32,800 32,002 31,953
20,190 18,644 17,567 16,642 16,128
FY12 FY13 FY14 FY15 FY16
€m
illi
on
Total Motor
Section 1 – Italian insurance market snapshots
7
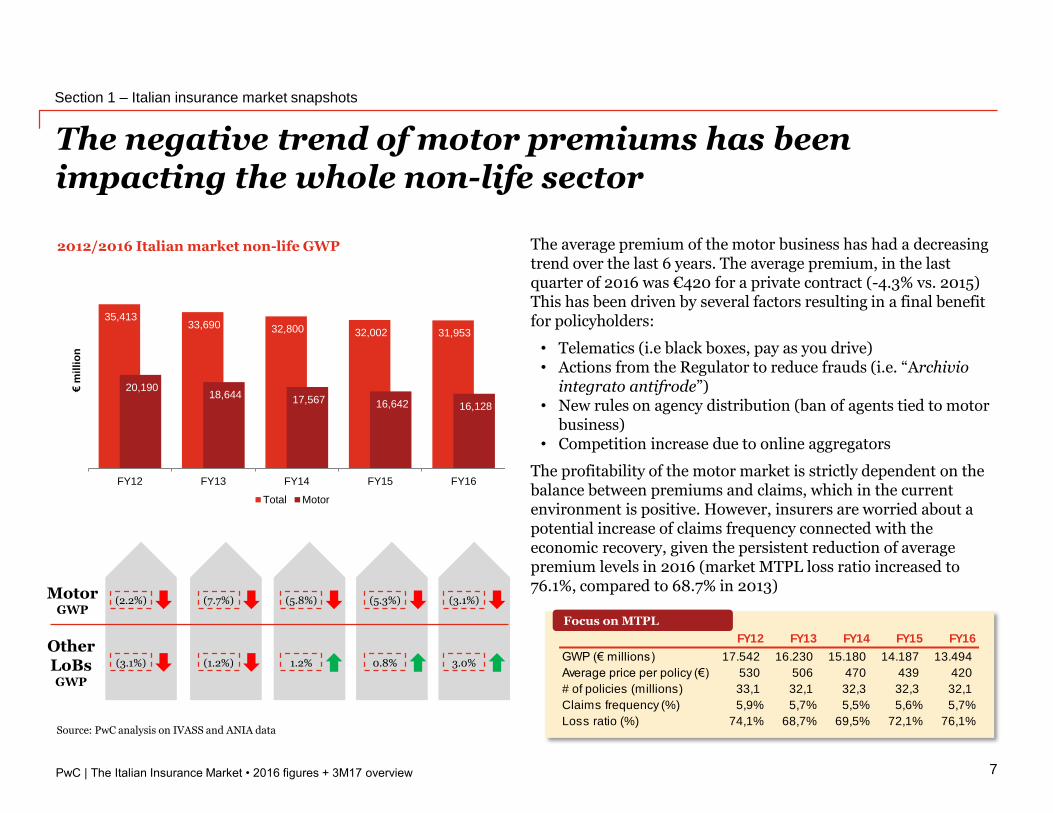
The negative trend of motor premiums has been impacting the whole non-life sector
2012/2016 Italian market non-life GWP
Source: PwC analysis on IVASS and ANIA data
MotorGWP
OtherLoBsGWP
(2.2%) (7.7%) (5.8%) (5.3%)
(3.1%) (1.2%) 1.2% 0.8%
The average premium of the motor business has had a decreasing trend over the last 6 years. The average premium, in the last quarter of 2016 was €420 for a private contract (-4.3% vs. 2015) This has been driven by several factors resulting in a final benefit for policyholders:
• Telematics (i.e black boxes, pay as you drive)• Actions from the Regulator to reduce frauds (i.e. “Archivio
integrato antifrode”)• New rules on agency distribution (ban of agents tied to motor
business)• Competition increase due to online aggregators
The profitability of the motor market is strictly dependent on the balance between premiums and claims, which in the current environment is positive. However, insurers are worried about a potential increase of claims frequency connected with the economic recovery, given the persistent reduction of average premium levels in 2016 (market MTPL loss ratio increased to 76.1%, compared to 68.7% in 2013)
(3.1%)
3.0%
FY12 FY13 FY14 FY15 FY16
GWP (€ millions) 17.542 16.230 15.180 14.187 13.494
Average price per policy (€) 530 506 470 439 420
# of policies (millions) 33,1 32,1 32,3 32,3 32,1
Claims frequency (%) 5,9% 5,7% 5,5% 5,6% 5,7%
Loss ratio (%) 74,1% 68,7% 69,5% 72,1% 76,1%
Focus on MTPL
PwC | The Italian Insurance Market • 2016 figures + 3M17 overview
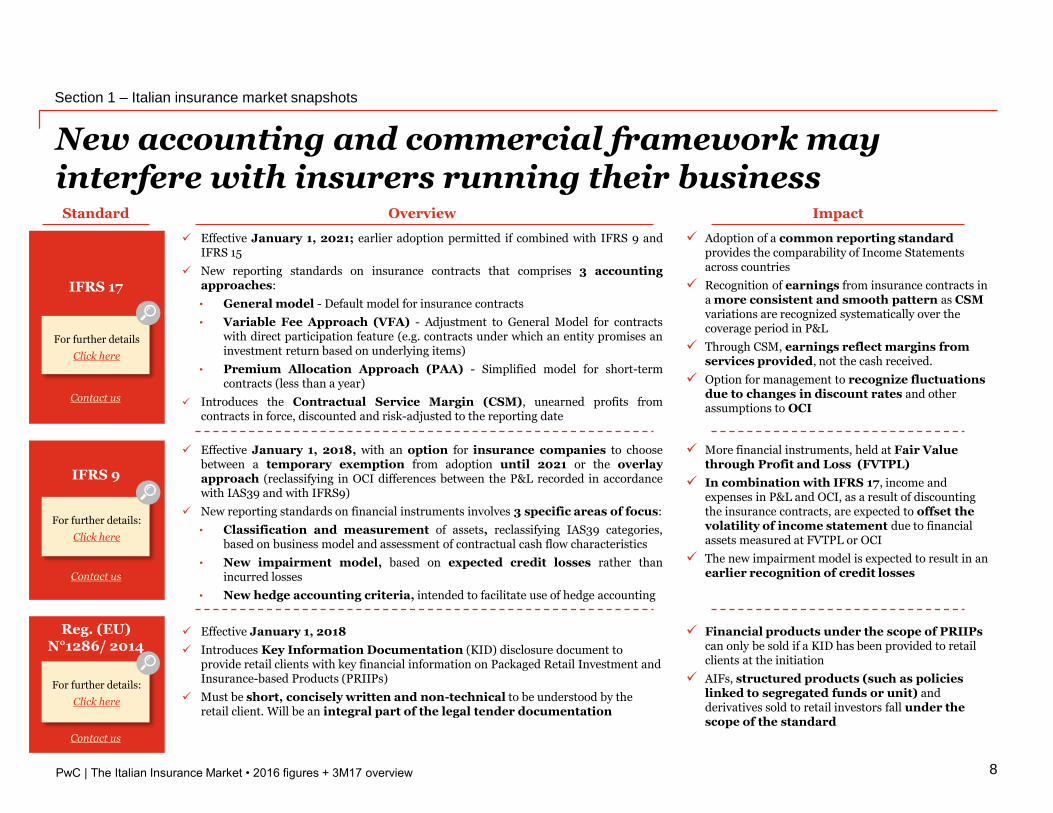
New accounting and commercial framework may interfere with insurers running their business
8
Section 1 – Italian insurance market snapshots
Effective January 1, 2021; earlier adoption permitted if combined with IFRS 9 andIFRS 15
New reporting standards on insurance contracts that comprises 3 accountingapproaches:
• General model - Default model for insurance contracts
• Variable Fee Approach (VFA) - Adjustment to General Model for contractswith direct participation feature (e.g. contracts under which an entity promises aninvestment return based on underlying items)
• Premium Allocation Approach (PAA) - Simplified model for short-termcontracts (less than a year)
Introduces the Contractual Service Margin (CSM), unearned profits fromcontracts in force, discounted and risk-adjusted to the reporting date
Overview Impact
Effective January 1, 2018, with an option for insurance companies to choosebetween a temporary exemption from adoption until 2021 or the overlayapproach (reclassifying in OCI differences between the P&L recorded in accordancewith IAS39 and with IFRS9)
New reporting standards on financial instruments involves 3 specific areas of focus:
• Classification and measurement of assets, reclassifying IAS39 categories,based on business model and assessment of contractual cash flow characteristics
• New impairment model, based on expected credit losses rather thanincurred losses
• New hedge accounting criteria, intended to facilitate use of hedge accounting
Effective January 1, 2018
Introduces Key Information Documentation (KID) disclosure document to provide retail clients with key financial information on Packaged Retail Investment and Insurance-based Products (PRIIPs)
Must be short, concisely written and non-technical to be understood by the retail client. Will be an integral part of the legal tender documentation
Adoption of a common reporting standard provides the comparability of Income Statementsacross countries
Recognition of earnings from insurance contracts in a more consistent and smooth pattern as CSM variations are recognized systematically over the coverage period in P&L
Through CSM, earnings reflect margins from services provided, not the cash received.
Option for management to recognize fluctuations due to changes in discount rates and other assumptions to OCI
Financial products under the scope of PRIIPscan only be sold if a KID has been provided to retail clients at the initiation
AIFs, structured products (such as policies linked to segregated funds or unit) and derivatives sold to retail investors fall under the scope of the standard
IFRS 17
Reg. (EU) N°1286/ 2014
Standard
For further details
Click here
IFRS 9
For further details:
Click here
For further details:
Click here
Contact us
Contact us
Contact us
More financial instruments, held at Fair Value through Profit and Loss (FVTPL)
In combination with IFRS 17, income and expenses in P&L and OCI, as a result of discounting the insurance contracts, are expected to offset the volatility of income statement due to financial assets measured at FVTPL or OCI
The new impairment model is expected to result in an earlier recognition of credit losses
PwC
Italian life insurance market
The Italian Insurance Market • 2016 figures + 3M17 overview
9
PwC | The Italian Insurance Market • 2016 figures + 3M17 overview
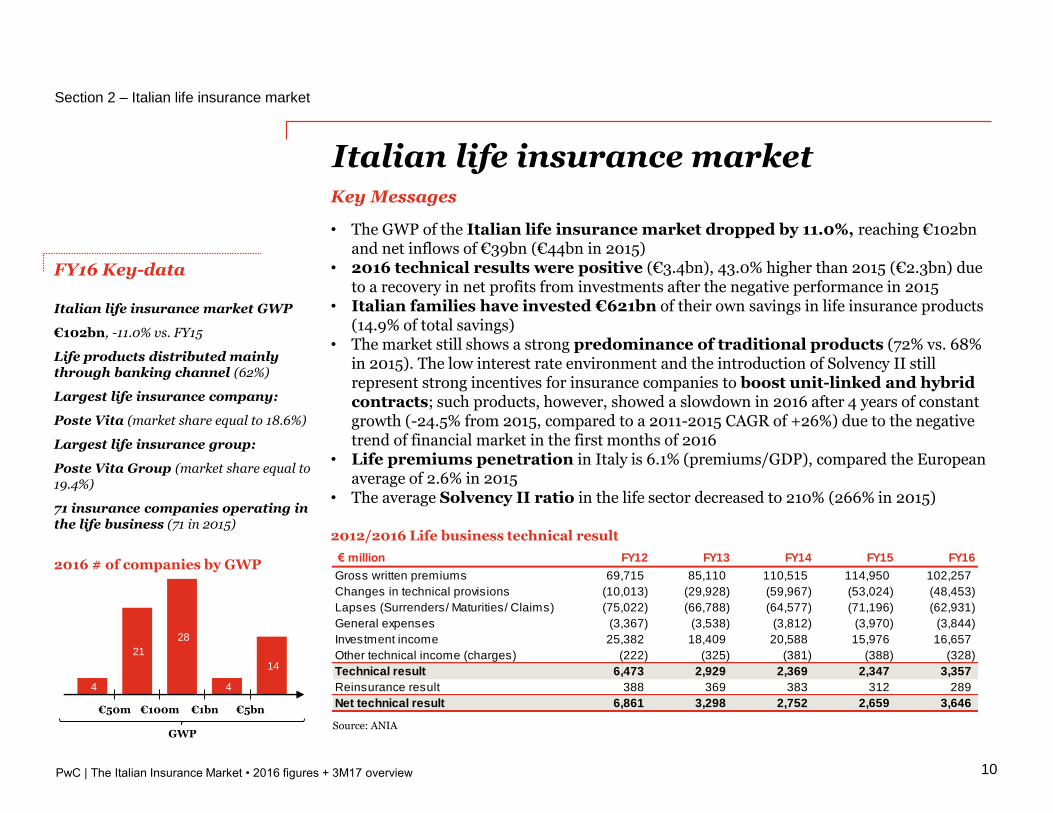
€ million FY12 FY13 FY14 FY15 FY16
Gross written premiums 69,715 85,110 110,515 114,950 102,257
Changes in technical provisions (10,013) (29,928) (59,967) (53,024) (48,453)
Lapses (Surrenders/ Maturities/ Claims) (75,022) (66,788) (64,577) (71,196) (62,931)
General expenses (3,367) (3,538) (3,812) (3,970) (3,844)
Investment income 25,382 18,409 20,588 15,976 16,657
Other technical income (charges) (222) (325) (381) (388) (328)
Technical result 6,473 2,929 2,369 2,347 3,357
Reinsurance result 388 369 383 312 289
Net technical result 6,861 3,298 2,752 2,659 3,646
4
21
28
4
14
Section 2 – Italian life insurance market
10
Italian life insurance market
2016 # of companies by GWP
GWP
FY16 Key-data
Italian life insurance market GWP
€102bn, -11.0% vs. FY15
Life products distributed mainly through banking channel (62%)
Largest life insurance company:
Poste Vita (market share equal to 18.6%)
Largest life insurance group:
Poste Vita Group (market share equal to 19.4%)
71 insurance companies operating in the life business (71 in 2015)
2012/2016 Life business technical result
Source: ANIA
Key Messages
• The GWP of the Italian life insurance market dropped by 11.0%, reaching €102bn and net inflows of €39bn (€44bn in 2015)
• 2016 technical results were positive (€3.4bn), 43.0% higher than 2015 (€2.3bn) due to a recovery in net profits from investments after the negative performance in 2015
• Italian families have invested €621bn of their own savings in life insurance products (14.9% of total savings)
• The market still shows a strong predominance of traditional products (72% vs. 68% in 2015). The low interest rate environment and the introduction of Solvency II still represent strong incentives for insurance companies to boost unit-linked and hybrid contracts; such products, however, showed a slowdown in 2016 after 4 years of constant growth (-24.5% from 2015, compared to a 2011-2015 CAGR of +26%) due to the negative trend of financial market in the first months of 2016
• Life premiums penetration in Italy is 6.1% (premiums/GDP), compared the European average of 2.6% in 2015
• The average Solvency II ratio in the life sector decreased to 210% (266% in 2015)
€5bn€1bn€100m€50m
PwC | The Italian Insurance Market • 2016 figures + 3M17 overview
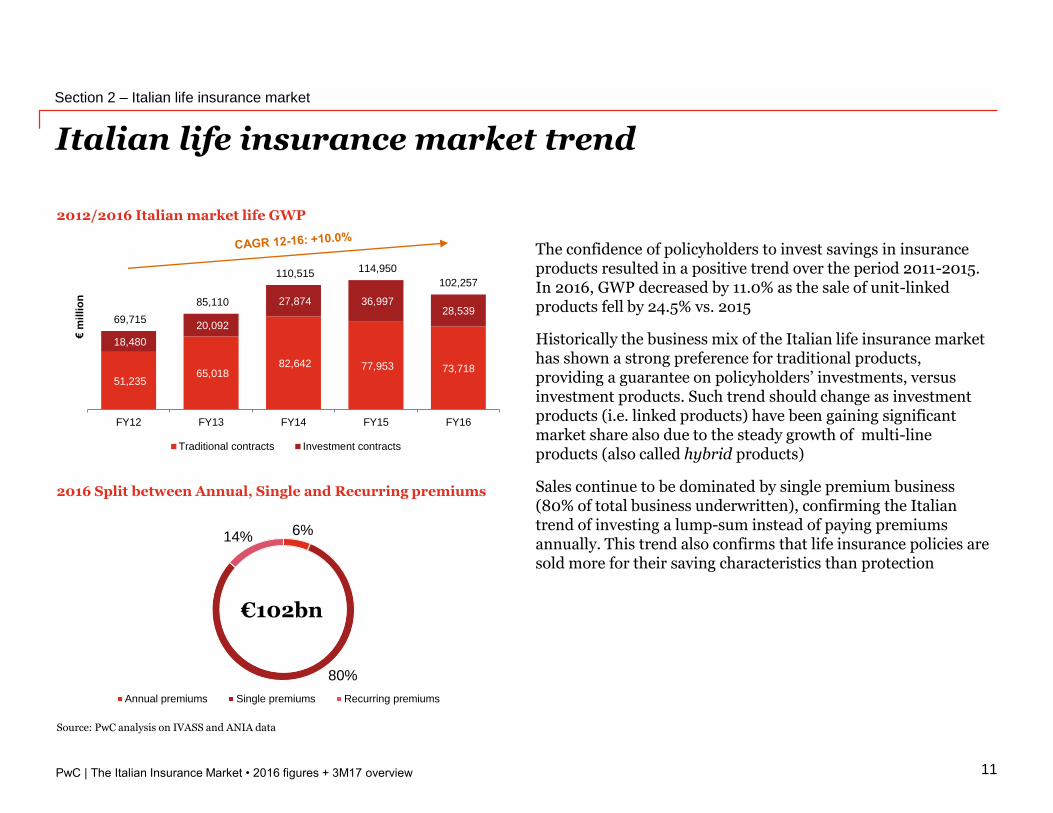
51,235 65,018
82,642 77,953 73,718
18,480
20,092
27,874 36,997 28,539
69,715
85,110
110,515 114,950
102,257
FY12 FY13 FY14 FY15 FY16
€m
illi
on
Traditional contracts Investment contracts
2012/2016 Italian market life GWP
Italian life insurance market trend
Section 2 – Italian life insurance market
11
2016 Split between Annual, Single and Recurring premiums
Source: PwC analysis on IVASS and ANIA data
The confidence of policyholders to invest savings in insurance products resulted in a positive trend over the period 2011-2015. In 2016, GWP decreased by 11.0% as the sale of unit-linked products fell by 24.5% vs. 2o15
Historically the business mix of the Italian life insurance market has shown a strong preference for traditional products, providing a guarantee on policyholders’ investments, versus investment products. Such trend should change as investment products (i.e. linked products) have been gaining significant market share also due to the steady growth of multi-line products (also called hybrid products)
Sales continue to be dominated by single premium business (80% of total business underwritten), confirming the Italian trend of investing a lump-sum instead of paying premiums annually. This trend also confirms that life insurance policies are sold more for their saving characteristics than protection
6%
80%
14%
Annual premiums Single premiums Recurring premiums
€102bn
PwC | The Italian Insurance Market • 2016 figures + 3M17 overview
Breakdown of net inflows
41%
46%
9%4%
Traditional products Unit & Index linked Capitalisations Other LoBs
Section 2 – Italian life insurance market
12
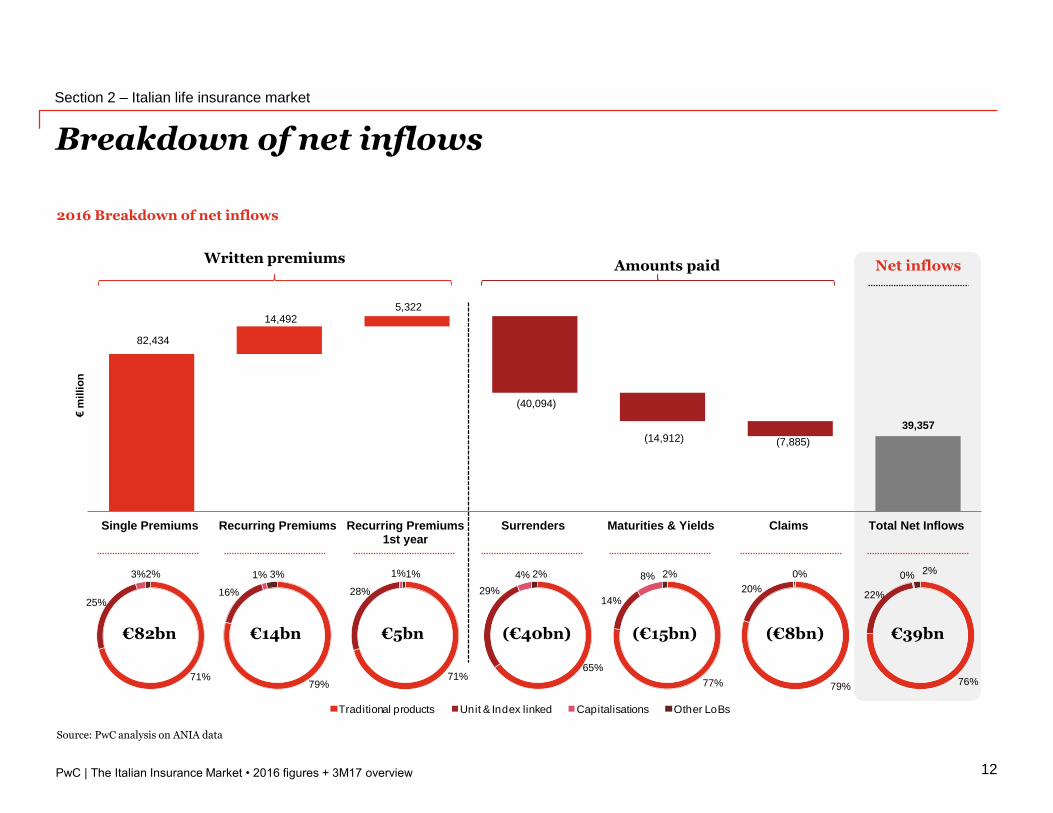
2016 Breakdown of net inflows
Written premiumsAmounts paid
Source: PwC analysis on ANIA data
€82bn €14bn €5bn (€40bn) (€15bn) (€8bn)
Net inflows
€39bn
71%
25%
3% 2%
79%
16%
1% 3%
71%
28%
1% 1%
65%
29%
4% 2%
77%
14%
8% 2%
79%
20%
0%
76%
22%
0% 2%
82,434
39,357
(7,885)
(40,094)
(14,912)
14,492 5,322
Single Premiums Recurring Premiums Recurring Premiums1st year
Surrenders Maturities & Yields Claims Total Net Inflows
€m
illi
on
PwC | The Italian Insurance Market • 2016 figures + 3M17 overview
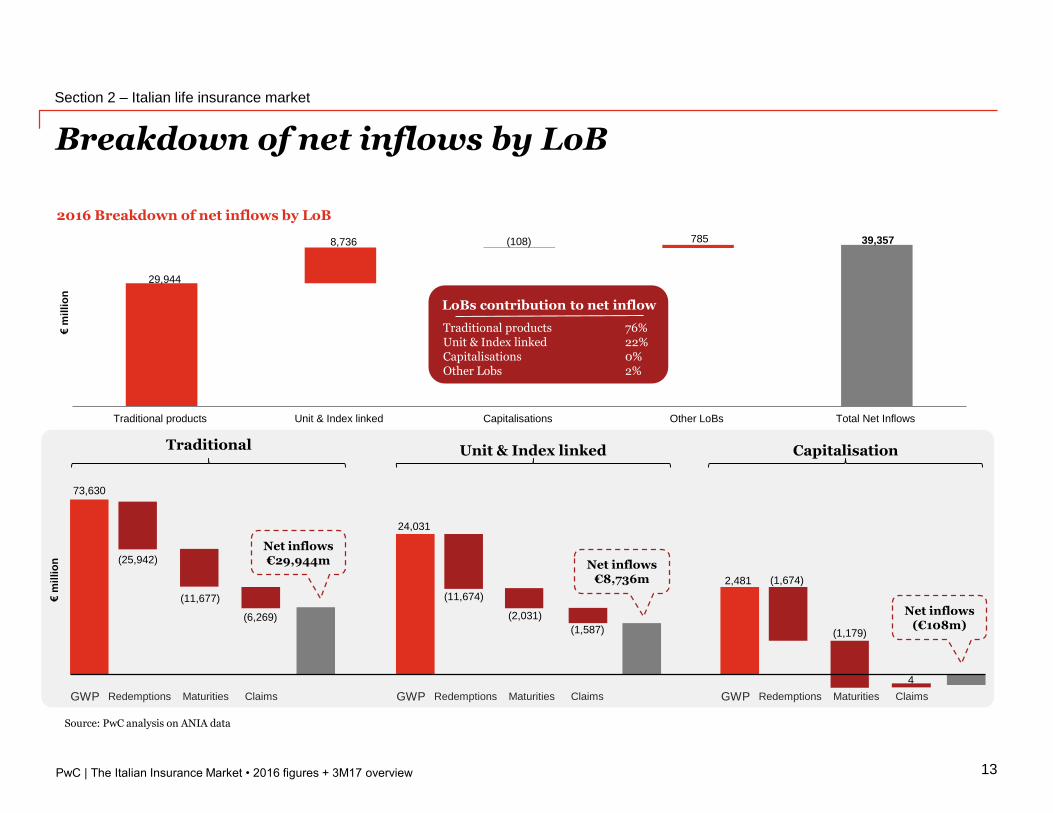
29,944
8,736 (108) 785 39,357
Traditional products Unit & Index linked Capitalisations Other LoBs Total Net Inflows
€m
illi
on
2016 Breakdown of net inflows by LoB
Breakdown of net inflows by LoB
13
Source: PwC analysis on ANIA data
GWP Redemptions Maturities Claims
Net inflows €29,944m
Traditional
73,630
(25,942)
(11,677)
(6,269)
€m
illi
on
Traditional productsUnit & Index linkedCapitalisationsOther Lobs
76%22%0%2%
LoBs contribution to net inflow
GWP Redemptions Maturities Claims
Unit & Index linked
24,031
(11,674)
(2,031)
(1,587)
GWP Redemptions Maturities Claims
Capitalisation
2,481 (1,674)
(1,179)
4
Net inflows €8,736m
Net inflows (€108m)
Section 2 – Italian life insurance market
PwC | The Italian Insurance Market • 2016 figures + 3M17 overview
6.05 5.20
4.41 4.76 5.84
17.7%
15.0%
13.2% 13.0%
10.5%
0%
5%
10%
15%
20%
-
1
2
3
4
5
6
7
8
FY12 FY13 FY14 FY15 FY16
Average duration (years) Lapse index (%)
11.1% 9.0% 7.7% 7.8% 6.7%
1.2%
1.3% 1.3% 1.3%
1.3%
5.3%
4.8% 4.2% 3.9%
2.5%
17.7%
15.0%
13.2% 13.0%
10.5%
FY12 FY13 FY14 FY15 FY16
Surrender index (%) Claim index (%) Maturity index (%)
Portfolio lapse index and average duration
Section 2 – Italian life insurance market
14
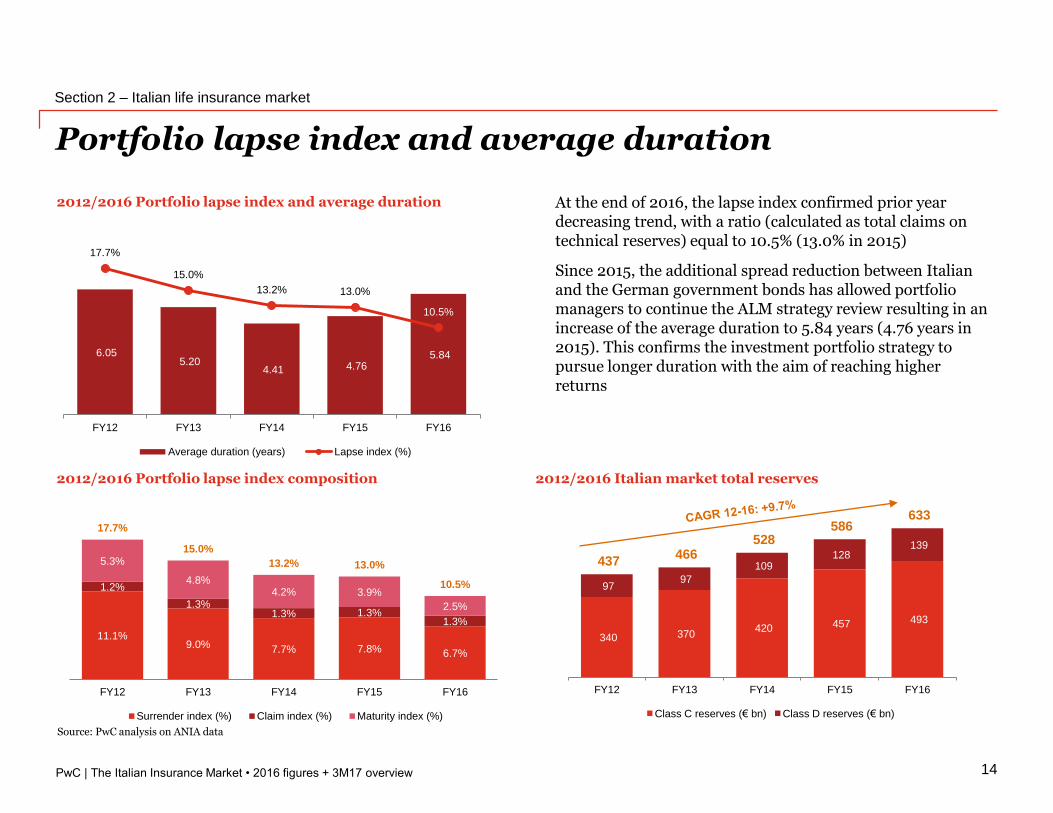
At the end of 2016, the lapse index confirmed prior year decreasing trend, with a ratio (calculated as total claims on technical reserves) equal to 10.5% (13.0% in 2015)
Since 2015, the additional spread reduction between Italian and the German government bonds has allowed portfolio managers to continue the ALM strategy review resulting in an increase of the average duration to 5.84 years (4.76 years in 2015). This confirms the investment portfolio strategy to pursue longer duration with the aim of reaching higher returns
2012/2016 Italian market total reserves
2012/2016 Portfolio lapse index and average duration
2012/2016 Portfolio lapse index composition
Source: PwC analysis on ANIA data
340 370 420 457 493
97 97
109 128
139
437 466
528 586
633
FY12 FY13 FY14 FY15 FY16
Class C reserves (€ bn) Class D reserves (€ bn)
PwC | The Italian Insurance Market • 2016 figures + 3M17 overview
62%
34%
4%
Life marketinvestments
Banks
Agents
Financial promoters
Others
2016 Asset allocation of life products
Distribution channel and investments overview
Section 2 – Italian life insurance market
15
Source: PwC analysis on IVASS data
Source: PwC analysis on ANIA data
2016 GWP by distribution channel
€102bn22.1%
+0.9% vs. FY15 62.3%
-7.6% vs. FY15
14.4%
+5.9% vs. FY15
1.2%
+0.7% vs. FY15
€657bnClass D
investments
€140bn
Class Cinvestments
€517bn
61.5%34.2%
4.3%
Bonds
Equities and mutual funds shares
Liquidity, Fixed assets and others
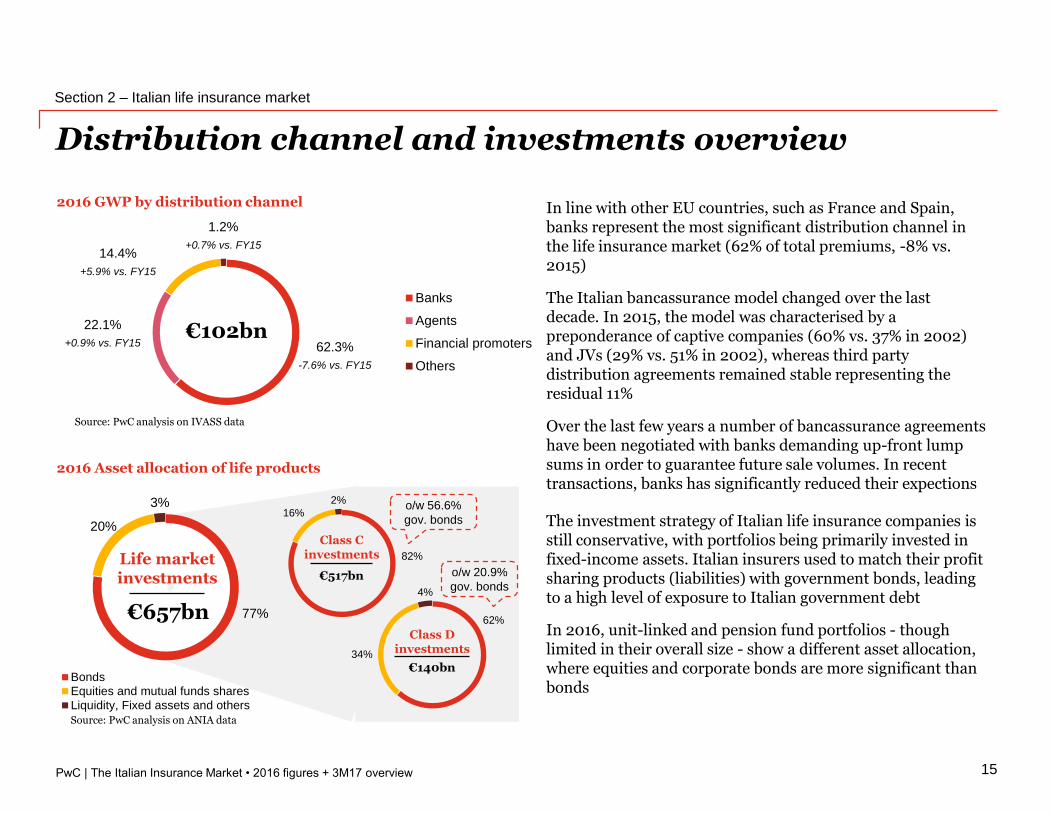
In line with other EU countries, such as France and Spain, banks represent the most significant distribution channel in the life insurance market (62% of total premiums, -8% vs. 2015)
The Italian bancassurance model changed over the last decade. In 2015, the model was characterised by a preponderance of captive companies (60% vs. 37% in 2002) and JVs (29% vs. 51% in 2002), whereas third party distribution agreements remained stable representing the residual 11%
Over the last few years a number of bancassurance agreements have been negotiated with banks demanding up-front lump sums in order to guarantee future sale volumes. In recent transactions, banks has significantly reduced their expections
The investment strategy of Italian life insurance companies is still conservative, with portfolios being primarily invested in fixed-income assets. Italian insurers used to match their profit sharing products (liabilities) with government bonds, leading to a high level of exposure to Italian government debt
In 2016, unit-linked and pension fund portfolios - though limited in their overall size - show a different asset allocation, where equities and corporate bonds are more significant than bonds
82%
16%
2%o/w 56.6%
gov. bonds
o/w 20.9%
gov. bonds
77%
20%
3%
PwC | The Italian Insurance Market • 2016 figures + 3M17 overview
14.0%
10.9%
17.6%
66.0%
72.4%
69.2%
20.0%
16.8%
13.3%
FY14
FY15
FY16
Others Banks Financial promoters
59.6% 55.7% 56.7%
40.4% 44.3% 43.3%
FY14 FY15 FY16
Traditional Unit & Index Linked
Multiline products
Section 2 – Italian life insurance market
Source: ANIA
16
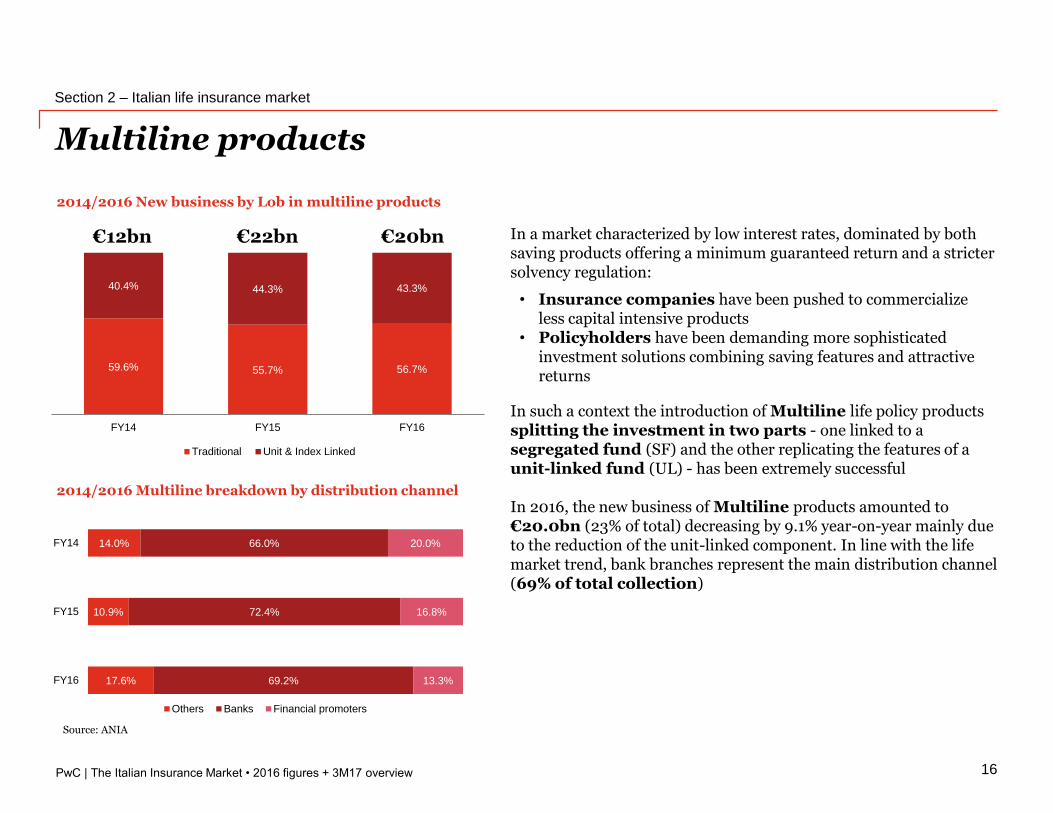
€22bn In a market characterized by low interest rates, dominated by both saving products offering a minimum guaranteed return and a stricter solvency regulation:
• Insurance companies have been pushed to commercialize less capital intensive products
• Policyholders have been demanding more sophisticated investment solutions combining saving features and attractive returns
In such a context the introduction of Multiline life policy products splitting the investment in two parts - one linked to asegregated fund (SF) and the other replicating the features of a unit-linked fund (UL) - has been extremely successful
In 2016, the new business of Multiline products amounted to €20.0bn (23% of total) decreasing by 9.1% year-on-year mainly due to the reduction of the unit-linked component. In line with the life market trend, bank branches represent the main distribution channel (69% of total collection)
€20bn€12bn
2014/2016 Multiline breakdown by distribution channel
2014/2016 New business by Lob in multiline products
PwC | The Italian Insurance Market • 2016 figures + 3M17 overview
4.19% 4.15%
3.61%
3.03% 4.02% 3.37%
3.41%
2.50%
4.02% 3.86%3.81%
3.68%
4.11%
1.99%
1.58%
1.89%
2013 2014 2015 2016
Posta - Valore più ISP Vita - Base sicura
Generali - Gesav Italy - BTP 10y
207253 263 289
8488
108112
29
3352
62
13
148
8
3.91%
3.77% 3.56% 3.24%4.11%
1.99%1.58%
1.89%
2013 2014 2015 2016
Equity
Funds & oth.
Other bonds
Gvmt. bonds
Avg. Segreg. fundsyield
Italy - BTP 10y
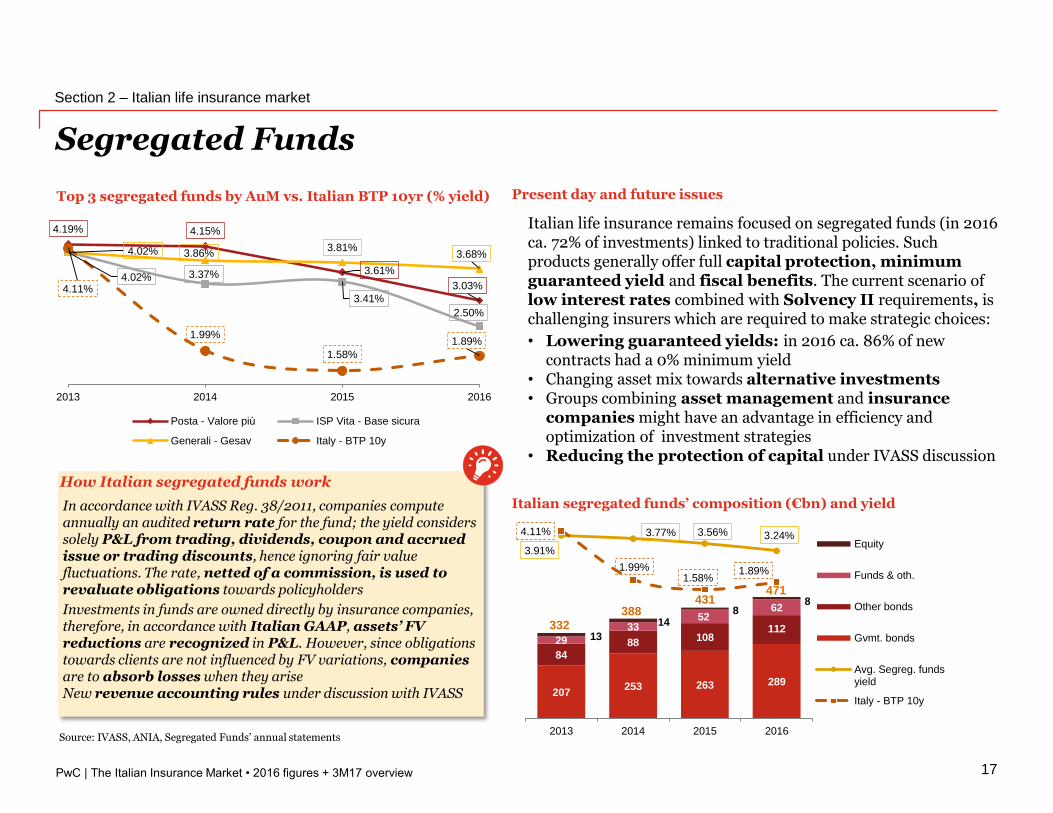
In accordance with IVASS Reg. 38/2011, companies compute annually an audited return rate for the fund; the yield considers solely P&L from trading, dividends, coupon and accrued issue or trading discounts, hence ignoring fair value fluctuations. The rate, netted of a commission, is used to revaluate obligations towards policyholders
Investments in funds are owned directly by insurance companies, therefore, in accordance with Italian GAAP, assets’ FV reductions are recognized in P&L. However, since obligations towards clients are not influenced by FV variations, companiesare to absorb losses when they ariseNew revenue accounting rules under discussion with IVASS
How Italian segregated funds work
Segregated Funds
Section 2 – Italian life insurance market
17
Source: IVASS, ANIA, Segregated Funds’ annual statements
Top 3 segregated funds by AuM vs. Italian BTP 10yr (% yield) Present day and future issues
Italian life insurance remains focused on segregated funds (in 2016 ca. 72% of investments) linked to traditional policies. Such products generally offer full capital protection, minimumguaranteed yield and fiscal benefits. The current scenario of low interest rates combined with Solvency II requirements, ischallenging insurers which are required to make strategic choices:
• Lowering guaranteed yields: in 2016 ca. 86% of new contracts had a 0% minimum yield
• Changing asset mix towards alternative investments • Groups combining asset management and insurance
companies might have an advantage in efficiency and optimization of investment strategies
• Reducing the protection of capital under IVASS discussion
Italian segregated funds’ composition (€bn) and yield
332388
431471
PwC | The Italian Insurance Market • 2016 figures + 3M17 overview
Medium bancassurance players
Top underwriters
110%
160%
210%
260%
310%
€- €1,000 €2,000 €3,000 €4,000 €5,000 €6,000 €7,000 €8,000
120%
140%
160%
180%
200%
220%
240%
260%
280%
300%
320%
€- €5,000 €10,000 €15,000 €20,000
Italy – Composite insurers 229%
EU – Life insurers 217%
Italy – Life insurers 210%EU – Composite insurers 210%
Solvency II ratio
Section 2 – Italian life insurance market
18
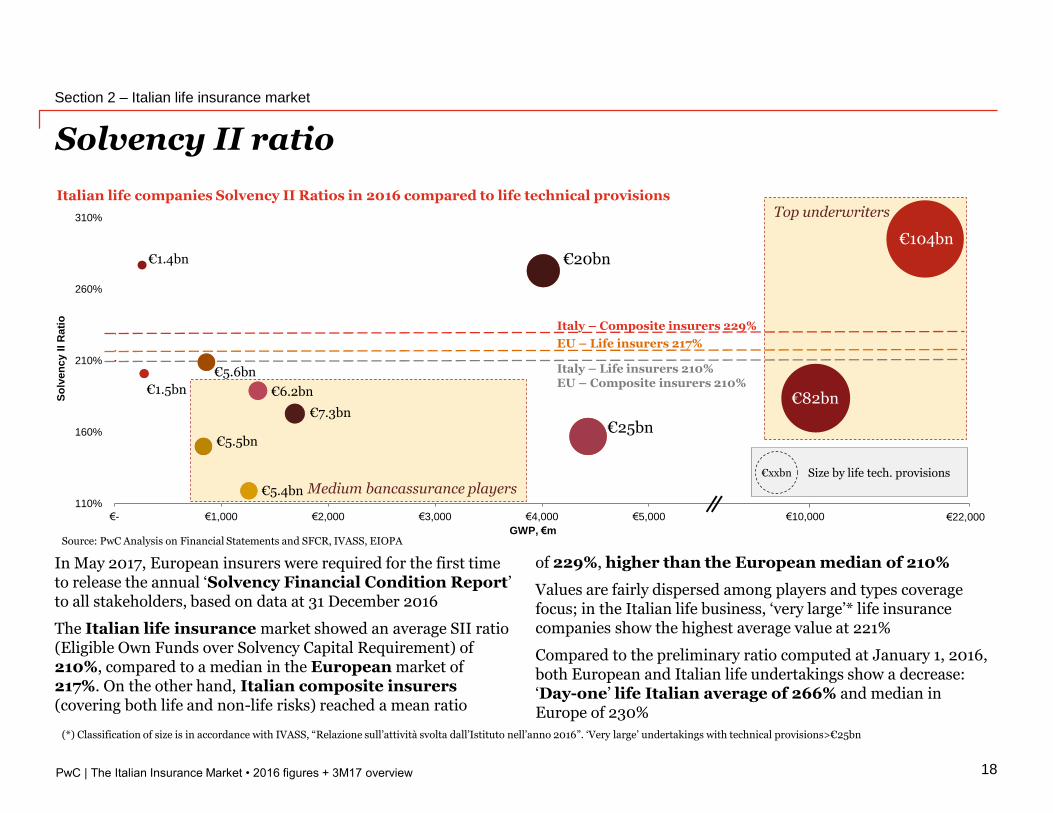
In May 2017, European insurers were required for the first time to release the annual ‘Solvency Financial Condition Report’ to all stakeholders, based on data at 31 December 2016
The Italian life insurance market showed an average SII ratio (Eligible Own Funds over Solvency Capital Requirement) of 210%, compared to a median in the European market of217%. On the other hand, Italian composite insurers (covering both life and non-life risks) reached a mean ratio
of 229%, higher than the European median of 210%
Values are fairly dispersed among players and types coverage focus; in the Italian life business, ‘very large’* life insurance companies show the highest average value at 221%
Compared to the preliminary ratio computed at January 1, 2016, both European and Italian life undertakings show a decrease: ‘Day-one’ life Italian average of 266% and median in Europe of 230%
Source: PwC Analysis on Financial Statements and SFCR, IVASS, EIOPA
(*) Classification of size is in accordance with IVASS, “Relazione sull’attività svolta dall’Istituto nell’anno 2016”. ‘Very large’ undertakings with technical provisions>€25bn
GWP, €m
Italian life companies Solvency II Ratios in 2016 compared to life technical provisions
So
lven
cy I
I R
ati
o
€22,000120%
140%
160%
180%
200%
220%
240%
260%
280%
300%
320%
€- €5,000 €10,000 €15,000 €20,000
€104bn
€82bn
€25bn
€20bn
€7.3bn
€6.2bn
€5.4bn
€5.5bn
€5.6bn
€1.4bn
€1.5bn
€xxbn Size by life tech. provisions
€10,000
PwC
Italian non-life insurance market
The Italian Insurance Market • 2016 figures + 3M17 overview
19
PwC | The Italian Insurance Market • 2016 figures + 3M17 overview
€ million FY12 FY13 FY14 FY15 FY16
Gross written premiums 35,413 33,690 32,800 32,002 31,953
Earned Premium 35,886 34,441 33,188 32,182 31,847
Incurred claims (25,793) (22,400) (21,201) (20,023) (20,005)
General expenses (8,504) (8,433) (8,599) (8,702) (8,770)
Investment income 1,607 1,202 1,278 1,196 1,049
Other technical income (charges) (663) (605) (527) (599) (598)
Technical result 2,533 4,205 4,139 4,054 3,522
Reinsurance result 537 (772) (600) (410) (578)
Net technical result 3,070 3,433 3,539 3,644 2,945
Section 3 – Italian non-life insurance market
20
Italian non-life insurance market
FY16 Key-data
Italian insurance market GWP
€32bn, -0.2% vs FY15
Non-life products distributed mainly through agents (79.9%)
Largest non-life insurance company: Unipol Sai Assicurazioni (market share equal to 19.2%)
Largest non-life insurance group: Unipol Group (market share equal to 24.2%)
126 insurance companies operating in the non-life business (127 in FY15)
2016 # of companies by GWP
2012/2016 Non-life business technical result
Source: ANIA
Key Messages
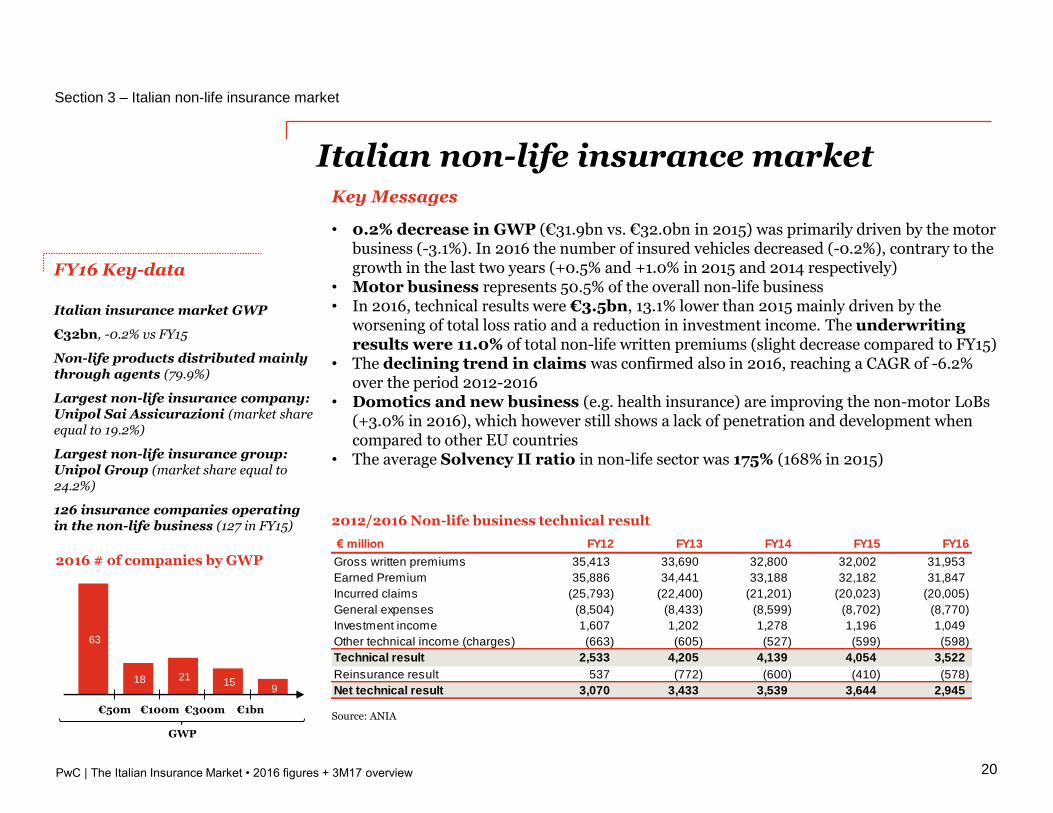
• 0.2% decrease in GWP (€31.9bn vs. €32.0bn in 2015) was primarily driven by the motor business (-3.1%). In 2016 the number of insured vehicles decreased (-0.2%), contrary to the growth in the last two years (+0.5% and +1.0% in 2015 and 2014 respectively)
• Motor business represents 50.5% of the overall non-life business• In 2016, technical results were €3.5bn, 13.1% lower than 2015 mainly driven by the
worsening of total loss ratio and a reduction in investment income. The underwriting results were 11.0% of total non-life written premiums (slight decrease compared to FY15)
• The declining trend in claims was confirmed also in 2016, reaching a CAGR of -6.2% over the period 2012-2016
• Domotics and new business (e.g. health insurance) are improving the non-motor LoBs(+3.0% in 2016), which however still shows a lack of penetration and development when compared to other EU countries
• The average Solvency II ratio in non-life sector was 175% (168% in 2015)
63
18 21 15
9
GWP
€1bn€300m€100m€50m
PwC | The Italian Insurance Market • 2016 figures + 3M17 overview
Banks Agents Financial promoters Others
35,413
33,690
32,800 32,002 31,953
FY12 FY13 FY14 FY15 FY16
€m
illi
on
2012/2016 Italian market non-life GWP
Italian non-life insurance at a glance
Section 3 – Italian non-life insurance market
21
2012/2016 Breakdown of GWP by LoBs
2016 Split between motor and non-motor LoB
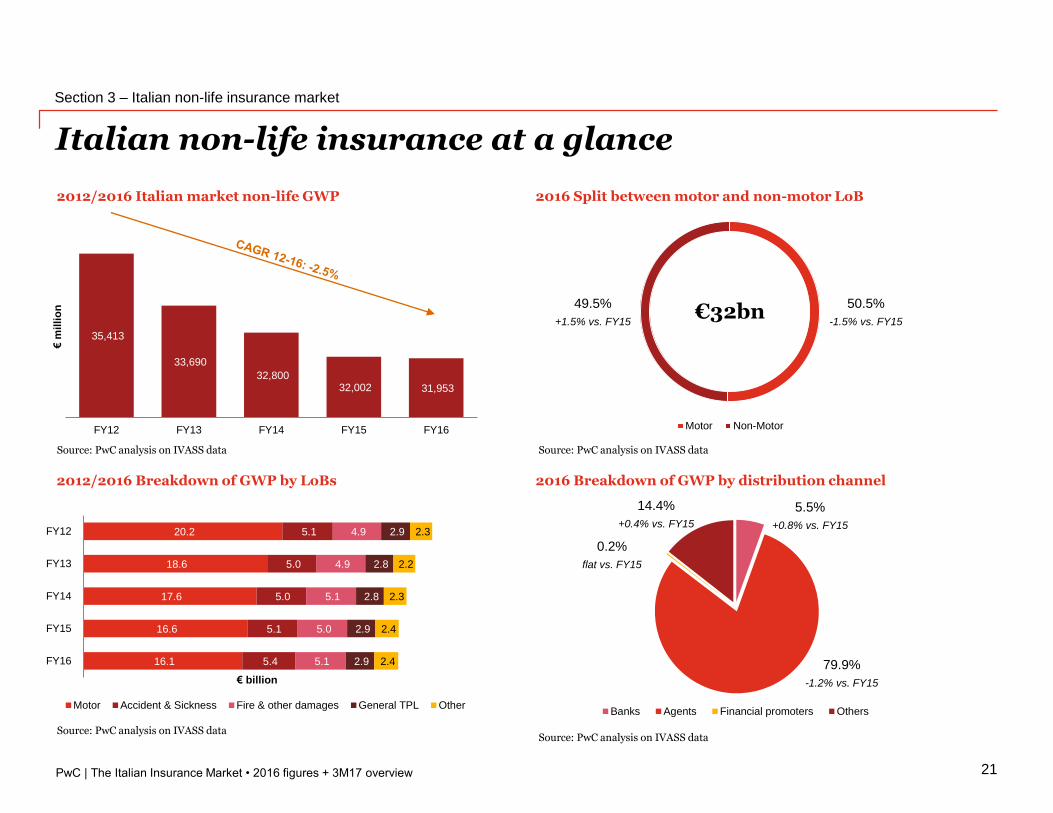
Source: PwC analysis on IVASS data
Source: PwC analysis on IVASS data
Source: PwC analysis on IVASS data
20.2
18.6
17.6
16.6
16.1
5.1
5.0
5.0
5.1
5.4
4.9
4.9
5.1
5.0
5.1
2.9
2.8
2.8
2.9
2.9
2.3
2.2
2.3
2.4
2.4
FY12
FY13
FY14
FY15
FY16
€ billion
Motor Accident & Sickness Fire & other damages General TPL Other
2016 Breakdown of GWP by distribution channel
Source: PwC analysis on IVASS data
0.2%
flat vs. FY15
79.9%
-1.2% vs. FY15
14.4%
+0.4% vs. FY15
5.5%
+0.8% vs. FY15
Motor Non-Motor
49.5%
+1.5% vs. FY15
50.5%
-1.5% vs. FY15€32bn
PwC | The Italian Insurance Market • 2016 figures + 3M17 overview
7.5% 7.7% 7.9% 7.9%7.5%
4.7% 4.8% 4.8% 4.7% 4.4%
FY12 FY13 FY14 FY15 FY16
Motor LoBs Total Non-life market
Direct sales premiums are stable
Section 3 – Italian non-life insurance market
22
€ million
MTPL
Other Motor
Accident & Sickness
Fire & other damages
GTPL
Other
Totalby LoB
1,345
367
97
15
7
96
1,927Total by
company
Ranking non-life insurance market
Genialloyd
488.8
82.4
22.3
4.4
2.3
37.7
637.9
# 11
Direct Line
231.1
189.0
37.6
0.6
0.2
10.2
468.9
# 14
Genertel
310.1
50.9
22.6
9.4
3.9
34.2
431.2
# 16
Linear
122.5
12.3
8.7
0.3
0.1
6.0
150.0
# 37
Zurich Connect
77.9
25.5
3.2
0.3
0.1
4.0
111.3
# 42
Quixa
114.9
6.6
2.8
0
0
3.9
128.2
# 39
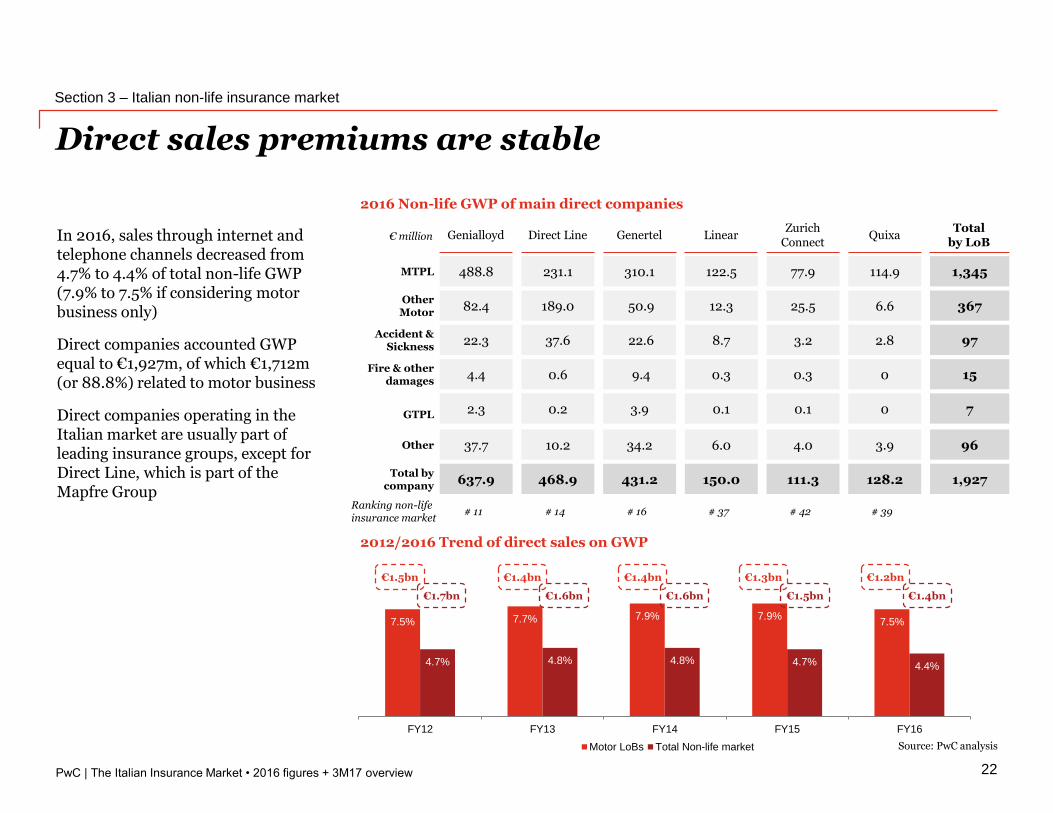
2016 Non-life GWP of main direct companies
2012/2016 Trend of direct sales on GWP
Source: PwC analysis
In 2016, sales through internet and telephone channels decreased from 4.7% to 4.4% of total non-life GWP (7.9% to 7.5% if considering motor business only)
Direct companies accounted GWP equal to €1,927m, of which €1,712m (or 88.8%) related to motor business
Direct companies operating in the Italian market are usually part of leading insurance groups, except for Direct Line, which is part of the Mapfre Group
€1.5bn
€1.7bn
€1.4bn
€1.6bn
€1.4bn
€1.6bn
€1.3bn
€1.5bn
€1.2bn
€1.4bn
PwC | The Italian Insurance Market • 2016 figures + 3M17 overview
24.0% 25.0% 26.2% 27.2% 27.4%
71.9% 65.0% 63.9% 62.2% 62.8%
95.9% 90.1% 90.1% 89.4% 90.3%
FY12 FY13 FY14 FY15 FY16
Expense ratio Loss ratio
35.9% 23.9% 30.5% 11.4% 17.5% 18.6% 30.4% 33.4% 32.4% 21.5% 14.9%
32.8% 25.0% 33.6% 37.7% 37.5% 32.7%
39.9% 66.9% 57.4%
159.4%
11.0%
69.3% 42.2% 60.1% 62.9% 76.1%
15.7%
48.1% 66.0% 41.3% 29.1% 24.8% 32.9%
75.8%90.9% 87.9%
170.9%
28.5%
87.9%72.5%
93.5% 95.2% 97.6%
30.6%
80.9%91.0%
74.9% 66.8% 62.3% 65.5%
Accident Sickness Landvehicles
Railwayrollingstocks
Aircraft Ships Goods intransit
Fire andnaturalforces
Otherdamage toproperty
Motorvehicle +
Shipsliability
Aircraftliability
General TPL Credit Suretyship Financialloss
Legalexpenses
Assistance
Expense ratio Loss ratio
Expense, loss and combined ratios
Section 3 – Italian non-life insurance market
23
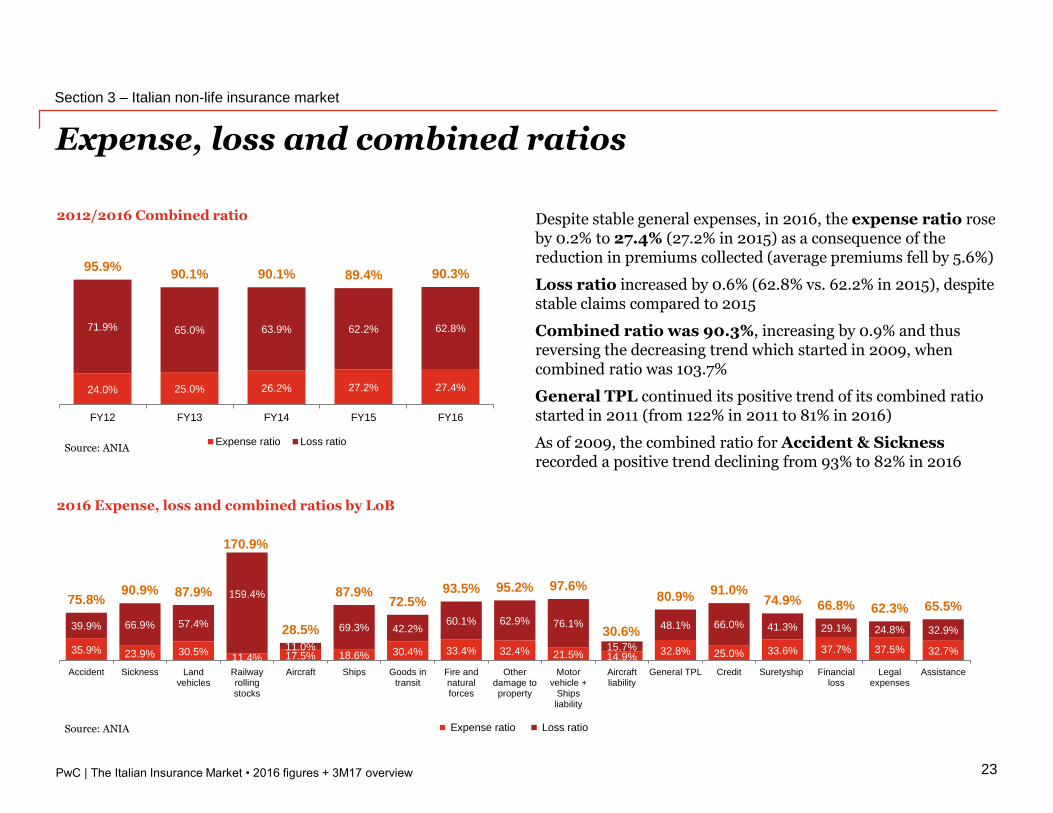
2012/2016 Combined ratio
2016 Expense, loss and combined ratios by LoB
Source: ANIA
Source: ANIA
Despite stable general expenses, in 2016, the expense ratio rose by 0.2% to 27.4% (27.2% in 2015) as a consequence of the reduction in premiums collected (average premiums fell by 5.6%)
Loss ratio increased by 0.6% (62.8% vs. 62.2% in 2015), despite stable claims compared to 2015
Combined ratio was 90.3%, increasing by 0.9% and thus reversing the decreasing trend which started in 2009, when combined ratio was 103.7%
General TPL continued its positive trend of its combined ratio started in 2011 (from 122% in 2011 to 81% in 2016)
As of 2009, the combined ratio for Accident & Sicknessrecorded a positive trend declining from 93% to 82% in 2016
PwC | The Italian Insurance Market • 2016 figures + 3M17 overview
17,605 17,007 16,964
17,760 17,542
16,230
15,180
14,187 13,494
FY08 FY09 FY10 FY11 FY12 FY13 FY14 FY15 FY16
100 96
101 106 107
102
95
90 84
2008 2009 2010 2011 2012 2013 2014 2015 2016
2008=
100
Index average price (2008=100)
Section 3 – Italian non-life insurance market
24
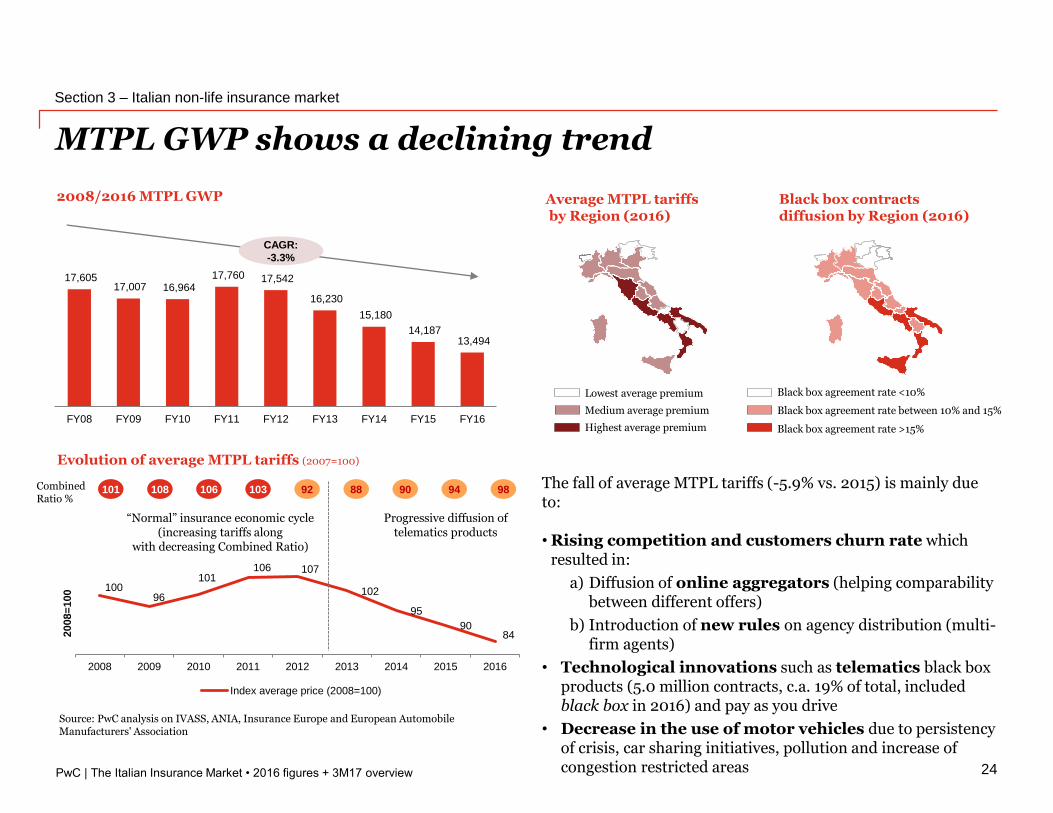
MTPL GWP shows a declining trend
Evolution of average MTPL tariffs (2007=100)
The fall of average MTPL tariffs (-5.9% vs. 2015) is mainly due to:
• Rising competition and customers churn rate which resulted in:
a) Diffusion of online aggregators (helping comparability between different offers)
b) Introduction of new rules on agency distribution (multi-firm agents)
• Technological innovations such as telematics black box products (5.0 million contracts, c.a. 19% of total, included black box in 2016) and pay as you drive
• Decrease in the use of motor vehicles due to persistency of crisis, car sharing initiatives, pollution and increase of congestion restricted areas
Source: PwC analysis on IVASS, ANIA, Insurance Europe and European Automobile Manufacturers' Association
101 108 106 103 92 88 90
CAGR:
-3.3%
Combined Ratio %
Progressive diffusion of telematics products
“Normal” insurance economic cycle (increasing tariffs along
with decreasing Combined Ratio)
94
2008/2016 MTPL GWP Average MTPL tariffs by Region (2016)
Black box contracts diffusion by Region (2016)
Black box agreement rate between 10% and 15%
Black box agreement rate <10%
Black box agreement rate >15%
Medium average premium
Lowest average premium
Highest average premium
98
PwC | The Italian Insurance Market • 2016 figures + 3M17 overview
73.1% 71.1%
67.8% 65.5%
66.9% 72.2%
68.4%
68.4% 70.1%
73.2%
71.5%
60.7% 58.6%
53.9% 52.0%
2012 2013 2014 2015 2016
Health Motor Non-life business -excl. Motor
2,136
2,073 2,056
2,143
2,349
-2.6% -4.9% -2.6% -2.4%
-0.2%
2012 2013 2014 2015 2016
Health insurance business (€k) % Growth rate Non-life GWP (y/y)
Focus: Is health insurance the next rising star? (1 of 2)
Section 3 – Italian non-life insurance market
25
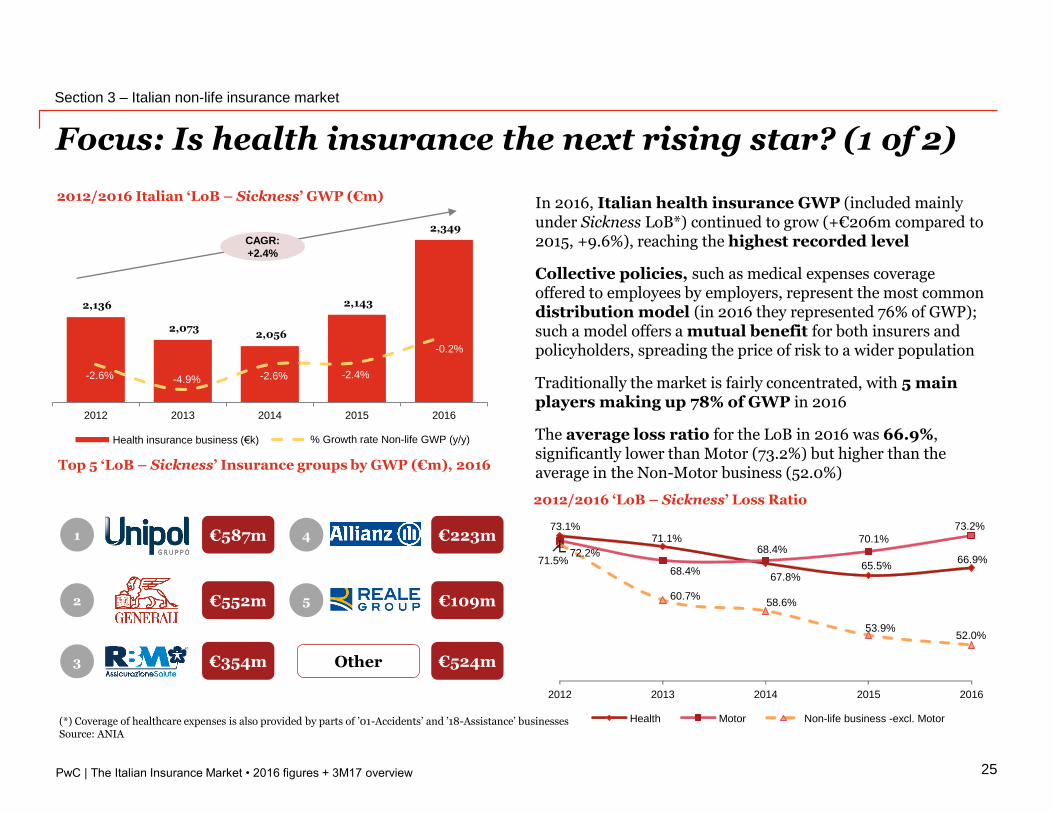
2012/2016 Italian ‘LoB – Sickness’ GWP (€m)
Top 5 ‘LoB – Sickness’ Insurance groups by GWP (€m), 2016
2012/2016 ‘LoB – Sickness’ Loss Ratio
Source: ANIA
In 2016, Italian health insurance GWP (included mainly under Sickness LoB*) continued to grow (+€206m compared to 2015, +9.6%), reaching the highest recorded level
Collective policies, such as medical expenses coverage offered to employees by employers, represent the most common distribution model (in 2016 they represented 76% of GWP); such a model offers a mutual benefit for both insurers and policyholders, spreading the price of risk to a wider population
Traditionally the market is fairly concentrated, with 5 main players making up 78% of GWP in 2016
The average loss ratio for the LoB in 2016 was 66.9%, significantly lower than Motor (73.2%) but higher than the average in the Non-Motor business (52.0%)
CAGR:
+2.4%
(*) Coverage of healthcare expenses is also provided by parts of ’01-Accidents’ and ’18-Assistance’ businesses
€587m
€552m
€354m
1
2
3 Other
€223m
€109m
€524m
4
5
PwC | The Italian Insurance Market • 2016 figures + 3M17 overview
Focus: Is health insurance the next rising star? (2 of 2)
Section 3 – Italian non-life insurance market
26
Source: “L’innovazione nell’assicurazione salute” - Egea 2016, ISTAT
97 100 104 107 110 111 113 114 113 114 115
28 29 30 31 31 31 33 33 33 33 34
2005 2006 2007 2008 2009 2010 2011 2012 2013 2014 2015
Public medical expenditure Private medical expenditure
CAGR:
+2,0%
125 129 133 138 141 142 146 147 146 147 149
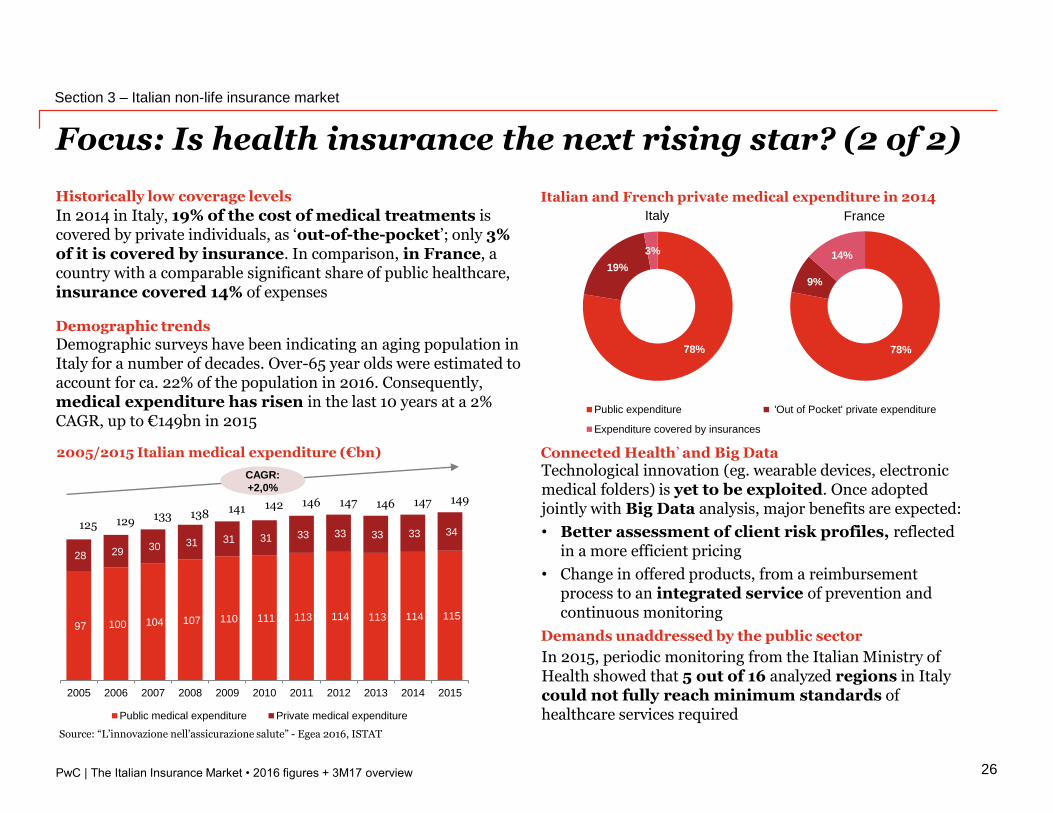
2005/2015 Italian medical expenditure (€bn)
Italian and French private medical expenditure in 2014
Connected Health’ and Big Data
Demands unaddressed by the public sector
Historically low coverage levels
In 2014 in Italy, 19% of the cost of medical treatments is covered by private individuals, as ‘out-of-the-pocket’; only 3%of it is covered by insurance. In comparison, in France, a country with a comparable significant share of public healthcare, insurance covered 14% of expenses
Demographic trends
Demographic surveys have been indicating an aging population in Italy for a number of decades. Over-65 year olds were estimated to account for ca. 22% of the population in 2016. Consequently, medical expenditure has risen in the last 10 years at a 2% CAGR, up to €149bn in 2015
Technological innovation (eg. wearable devices, electronic medical folders) is yet to be exploited. Once adopted jointly with Big Data analysis, major benefits are expected:
• Better assessment of client risk profiles, reflected in a more efficient pricing
• Change in offered products, from a reimbursement process to an integrated service of prevention and continuous monitoring
In 2015, periodic monitoring from the Italian Ministry of Health showed that 5 out of 16 analyzed regions in Italy could not fully reach minimum standards of healthcare services required
78%
19%
3%
Public expenditure 'Out of Pocket' private expenditure
Expenditure covered by insurances
78%
19%
3%
Public expenditure 'Out of Pocket' private expenditure
Expenditure covered by insurances
78%
9%
14%
Public expenditure 'Out of Pocket' private expenditure
Expenditure covered by insurances
Italy France
PwC | The Italian Insurance Market • 2016 figures + 3M17 overview
Top underwriters
Solvency II ratio
Section 3 – Italian non-life insurance market
27
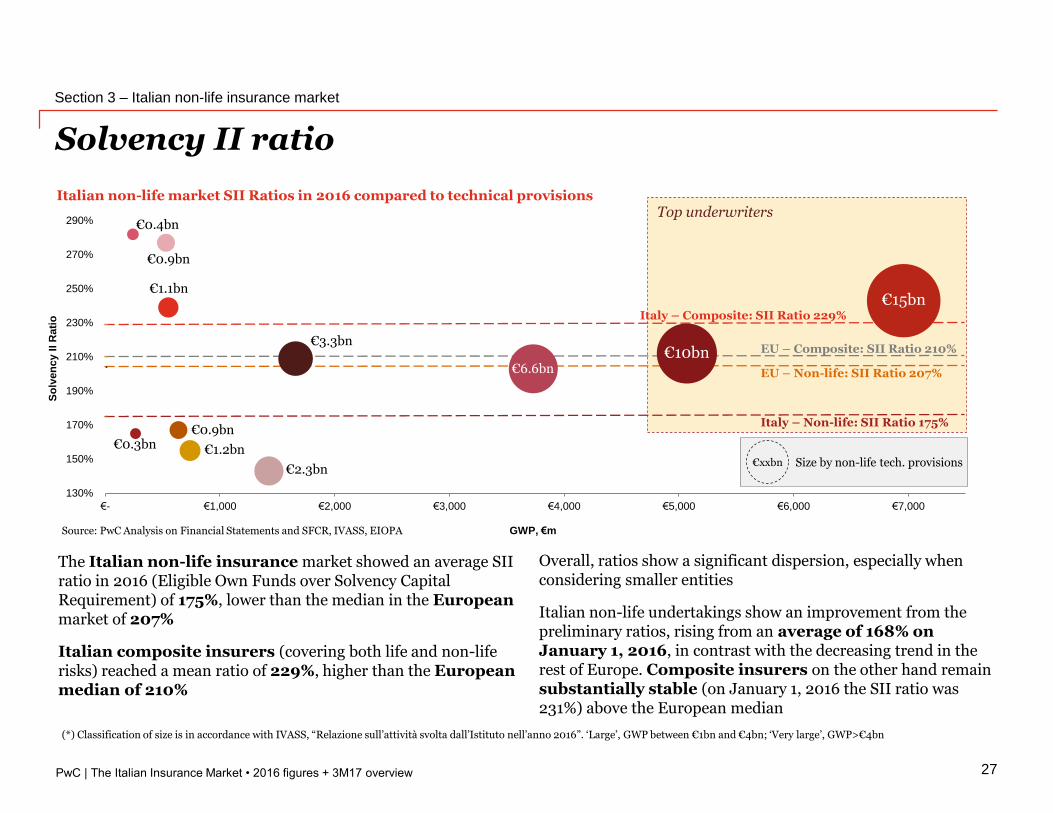
The Italian non-life insurance market showed an average SII ratio in 2016 (Eligible Own Funds over Solvency Capital Requirement) of 175%, lower than the median in the Europeanmarket of 207%
Italian composite insurers (covering both life and non-life risks) reached a mean ratio of 229%, higher than the European median of 210%
Overall, ratios show a significant dispersion, especially when considering smaller entities
Italian non-life undertakings show an improvement from the preliminary ratios, rising from an average of 168% on January 1, 2016, in contrast with the decreasing trend in the rest of Europe. Composite insurers on the other hand remain substantially stable (on January 1, 2016 the SII ratio was 231%) above the European median
Source: PwC Analysis on Financial Statements and SFCR, IVASS, EIOPA
(*) Classification of size is in accordance with IVASS, “Relazione sull’attività svolta dall’Istituto nell’anno 2016”. ‘Large’, GWP between €1bn and €4bn; ‘Very large’, GWP>€4bn
€0.9bn
Italy – Composite: SII Ratio 229%
EU – Composite: SII Ratio 210%
EU – Non-life: SII Ratio 207%
Italy – Non-life: SII Ratio 175%
€0.4bn
€1.1bn
€0.3bn€0.9bn
€1.2bn
€2.3bn
€3.3bn
130%
150%
170%
190%
210%
230%
250%
270%
290%
€- €1,000 €2,000 €3,000 €4,000 €5,000 €6,000 €7,000
€6.6bn
€15bn
€10bn
GWP, €m
So
lven
cy I
I R
ati
o
Italian non-life market SII Ratios in 2016 compared to technical provisions
€xxbn Size by non-life tech. provisions

PwC
3M17 overview & industry outlook
The Italian Insurance Market • 2016 figures + 3M17 overview
28
PwC | The Italian Insurance Market • 2016 figures + 3M17 overview
66%
29%
3% 2%
51%
49%
20,297 27,493
31,972 30,331 26,251
8,198
7,967
7,804 7,704 7,746
28,495
35,460 39,776 38,035
33,997
3M13 3M14 3M15 3M16 3M17
€m
illi
on
Life Non-Life
3M17: Insurance market trend update
Section 4 – 3M17 overview & industry outlook
29
3M17 Italian Life & non-Life GWP breakdown per LoB
3M13/3M17 Italian market GWP
Life€26.3bn
Non-life€7.7bn
74%
21%
4% 2%
Traditional productsUnit & Index linkedCapitalizationsOthers (Mutual funds & Sickness)
58%
42%
Non-life market - Breakdown per motor and non-motor 3M13
Motor
Non-Motor
Source: PwC analysis on IVASS data
Source: PwC analysis on IVASS data
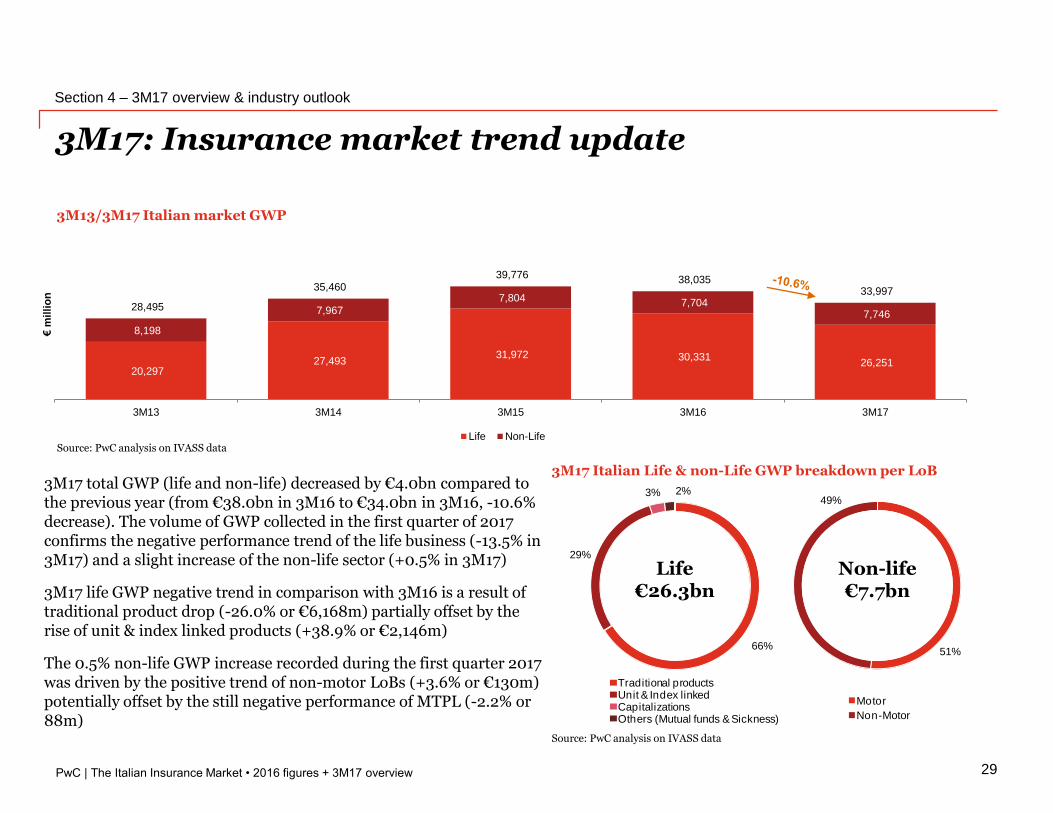
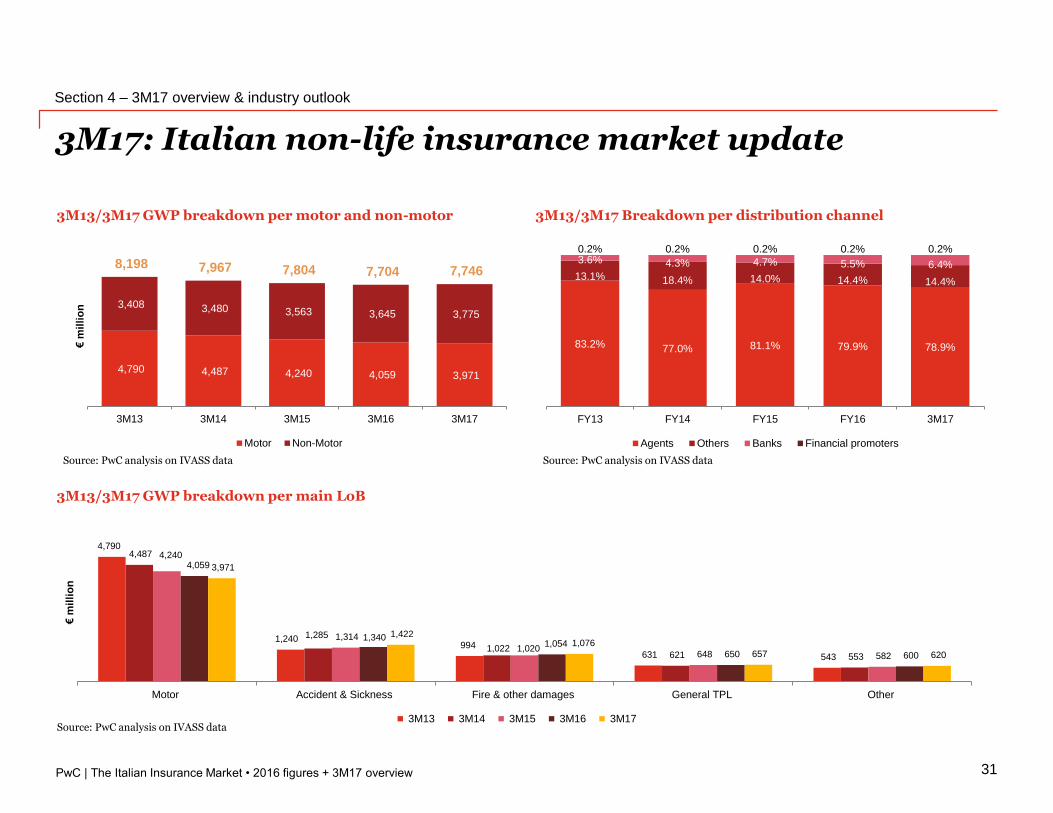
3M17 total GWP (life and non-life) decreased by €4.0bn compared to the previous year (from €38.0bn in 3M16 to €34.0bn in 3M16, -10.6% decrease). The volume of GWP collected in the first quarter of 2017 confirms the negative performance trend of the life business (-13.5% in 3M17) and a slight increase of the non-life sector (+0.5% in 3M17)
3M17 life GWP negative trend in comparison with 3M16 is a result of traditional product drop (-26.0% or €6,168m) partially offset by the rise of unit & index linked products (+38.9% or €2,146m)
The 0.5% non-life GWP increase recorded during the first quarter 2017 was driven by the positive trend of non-motor LoBs (+3.6% or €130m) potentially offset by the still negative performance of MTPL (-2.2% or 88m)
PwC | The Italian Insurance Market • 2016 figures + 3M17 overview
76%
75%
68%
72%
66%
24%
25%
32%
28%
34%
0% 20% 40% 60% 80% 100%
FY13
FY14
FY15
FY16
3M17
Traditional contracts Investment contracts
14,981
4,183
769 364
22,345
3,856
940 354
21,945
8,208
1,403418
23,494
5,519
856 461
17,326
7,665
769 491
Traditional products Unit & Index linked Capitalisations Others (Mutual funds & Sickness)
€m
illi
on
3M13 3M14 3M15 3M16 3M17
3M17: Italian life insurance market update
30
3M13/3M17 Breakdown per channelFY13/3M17 Breakdown per type of policies
Source: PwC analysis on IVASS data
3M13/3M17 Life GWP quarter breakdown per LoB
Section 4 – 3M17 overview & industry outlook
Source: PwC analysis on IVASS data
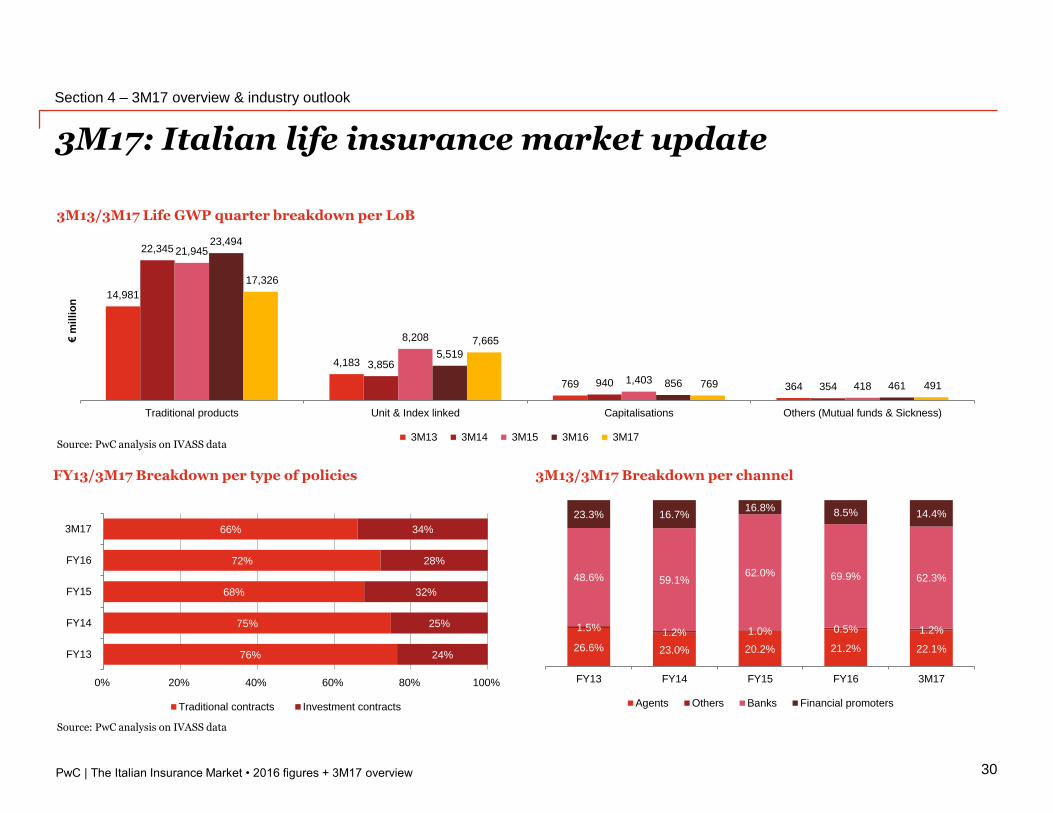
26.6% 23.0% 20.2% 21.2% 22.1%
1.5% 1.2% 1.0% 0.5% 1.2%
48.6% 59.1% 62.0% 69.9% 62.3%
23.3% 16.7% 16.8% 8.5% 14.4%
FY13 FY14 FY15 FY16 3M17
Agents Others Banks Financial promoters
PwC | The Italian Insurance Market • 2016 figures + 3M17 overview
4,790
1,240 994
631 543
4,487
1,285
1,022 621 553
4,240
1,314
1,020 648 582
4,059
1,340 1,054
650 600
3,971
1,422 1,076
657 620
Motor Accident & Sickness Fire & other damages General TPL Other
€m
illi
on
3M13 3M14 3M15 3M16 3M17
3M17: Italian non-life insurance market update
31
3M13/3M17 Breakdown per distribution channel
3M13/3M17 GWP breakdown per main LoB
3M13/3M17 GWP breakdown per motor and non-motor
Source: PwC analysis on IVASS data
Source: PwC analysis on IVASS data
Source: PwC analysis on IVASS data
Section 4 – 3M17 overview & industry outlook
4,790 4,487 4,240 4,059 3,971
3,408 3,480 3,563 3,645 3,775
8,198 7,967 7,804 7,704 7,746
3M13 3M14 3M15 3M16 3M17
€m
illi
on
Motor Non-Motor
83.2% 77.0% 81.1% 79.9% 78.9%
13.1% 18.4% 14.0% 14.4% 14.4%
3.6% 4.3% 4.7% 5.5% 6.4%
0.2% 0.2% 0.2% 0.2% 0.2%
FY13 FY14 FY15 FY16 3M17
Agents Others Banks Financial promoters
PwC | The Italian Insurance Market • 2016 figures + 3M17 overview
Industry outlook
32
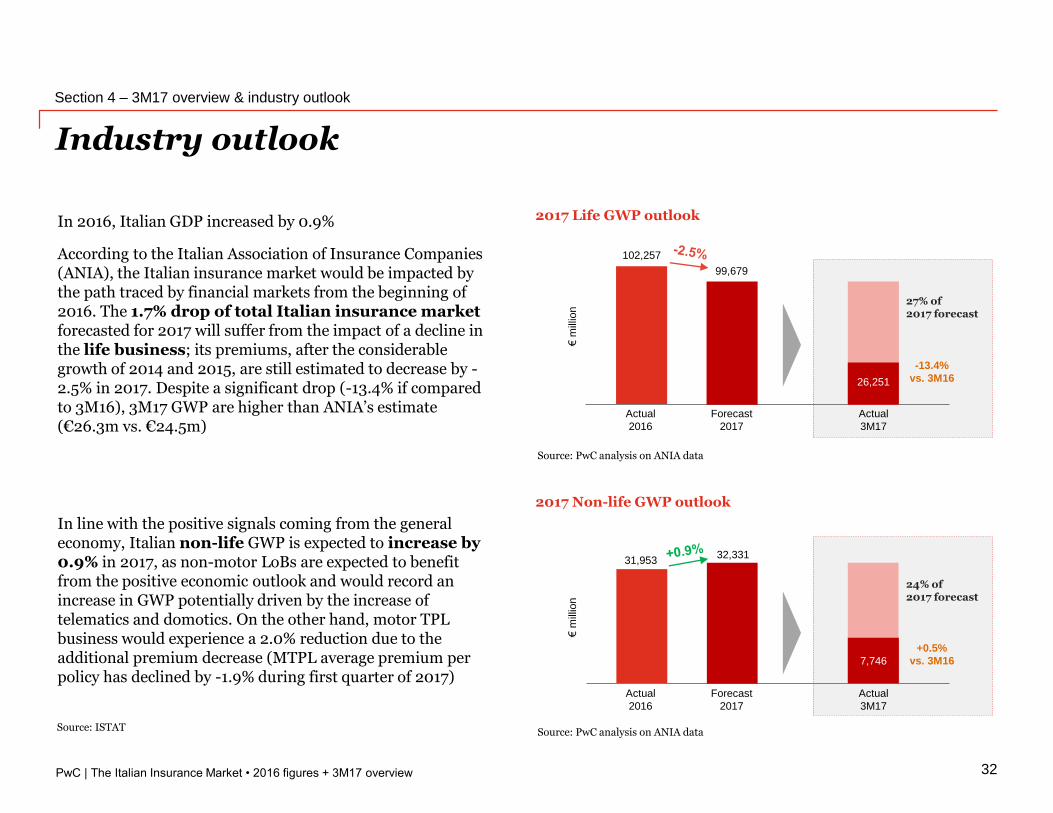
2017 Non-life GWP outlook
2017 Life GWP outlook
Source: PwC analysis on ANIA data
Source: PwC analysis on ANIA data
102,257
99,679
Actual
2016
26,251
Forecast
2017
Actual
3M17
-13.4%
vs. 3M16
€m
illio
n
Actual
2016
Forecast
2017
Actual
3M17
31,95332,331
7,746
+0.5%
vs. 3M16
27% of 2017 forecast
24% of 2017 forecast
€m
illio
n
In 2016, Italian GDP increased by 0.9%
According to the Italian Association of Insurance Companies (ANIA), the Italian insurance market would be impacted by the path traced by financial markets from the beginning of 2016. The 1.7% drop of total Italian insurance marketforecasted for 2017 will suffer from the impact of a decline in the life business; its premiums, after the considerable growth of 2014 and 2015, are still estimated to decrease by -2.5% in 2017. Despite a significant drop (-13.4% if compared to 3M16), 3M17 GWP are higher than ANIA’s estimate (€26.3m vs. €24.5m)
In line with the positive signals coming from the general economy, Italian non-life GWP is expected to increase by 0.9% in 2017, as non-motor LoBs are expected to benefit from the positive economic outlook and would record an increase in GWP potentially driven by the increase of telematics and domotics. On the other hand, motor TPL business would experience a 2.0% reduction due to the additional premium decrease (MTPL average premium per policy has declined by -1.9% during first quarter of 2017)
Section 4 – 3M17 overview & industry outlook
Source: ISTAT

PwC
M&A activity
The Italian Insurance Market • 2016 figures + 3M17 overview
33
PwC | The Italian Insurance Market • 2016 figures + 3M17 overview
# Year Target Bidder
Stake
%
Deal Size
(€m)
1 2 01 7 Eu r ov ita A ssicu r a zion i S.p.A Cin v en Pa r tn er s LLP n d n d
2 2 01 6 UNIQA Pr otezion e Societa Rea le Mu tu a di A ssicu r a zion i S.p.A .1 00% 2 9 5
3 2 01 6 Old Mu tu a l Wea lth Ita ly SpA Cin v en Pa r tn er s LLP 1 00% 2 7 8
4 2 01 5 C.B.A . V ita SpA HDI A ssicu r a zion i SpA 1 00% n d
5 2 01 5 ERGO Pr ev iden za SpA Cin v en Pa r tn er s LLP n d n d
6 2 01 4 Ca r ig e V ita Nu ov a A pollo Globa l Ma n a g em en t 1 00% 1 7 0
7 2 01 3 Eu r ov ita A ssicu r a zion i JC Flow er s 8 0% 4 7
8 2 01 2 Ch ia r a V ita Helv et ia Holdin g A G 3 0% 2 3
9 2 01 1 Bipiem m e V ita SpA Cov ea 8 1 % 2 4 3
1 0 2 01 1 BNL V ita SpA Ca r dif A ssicu r a zion i SpA 5 1 % 3 2 5
M&A Transactions
Section 5 – M&A activity
34
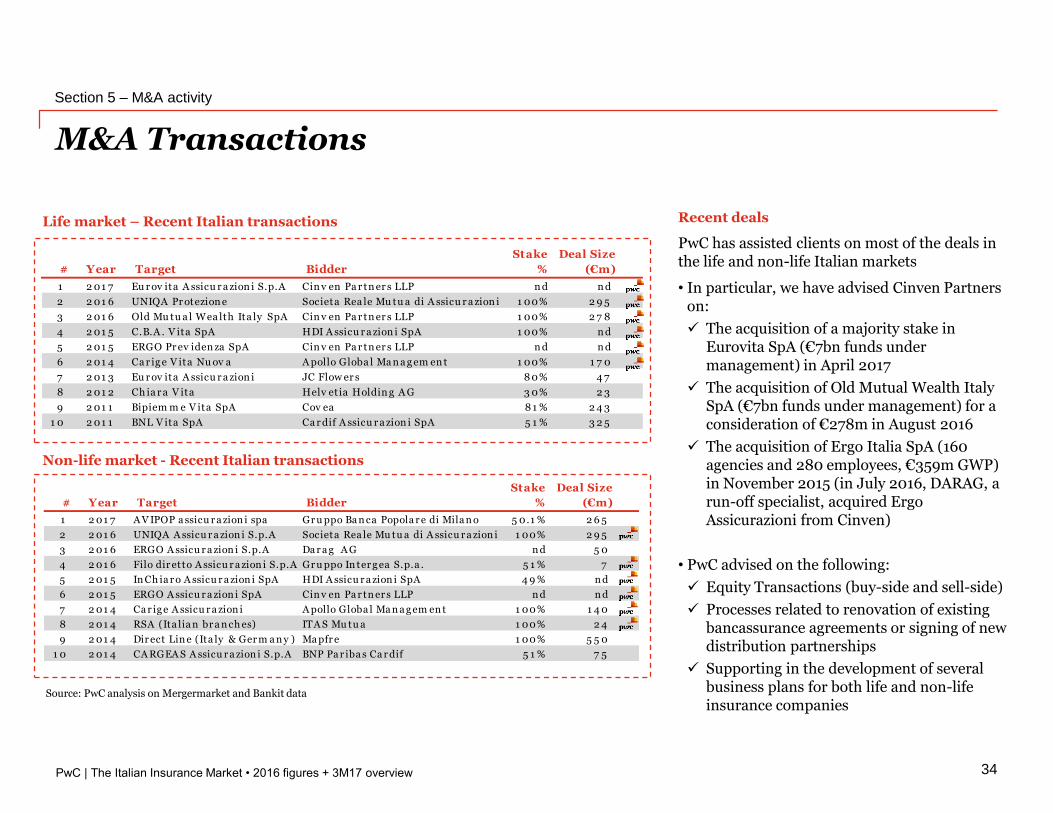
Life market – Recent Italian transactions
Non-life market - Recent Italian transactions
Source: PwC analysis on Mergermarket and Bankit data
Recent deals
PwC has assisted clients on most of the deals in the life and non-life Italian markets
• In particular, we have advised Cinven Partners on:
The acquisition of a majority stake in Eurovita SpA (€7bn funds under management) in April 2017
The acquisition of Old Mutual Wealth Italy SpA (€7bn funds under management) for a consideration of €278m in August 2016
The acquisition of Ergo Italia SpA (160 agencies and 280 employees, €359m GWP) in November 2015 (in July 2016, DARAG, a run-off specialist, acquired Ergo Assicurazioni from Cinven)
• PwC advised on the following:
Equity Transactions (buy-side and sell-side)
Processes related to renovation of existing bancassurance agreements or signing of new distribution partnerships
Supporting in the development of several business plans for both life and non-life insurance companies
# Year Target Bidder
Stake
%
Deal Size
(€m)
1 2 01 7 A V IPOP a ssicu r a zion i spa Gr u ppo Ba n ca Popola r e di Mila n o 5 0.1 % 2 6 5
2 2 01 6 UNIQA A ssicu r a zion i S.p.A Societa Rea le Mu tu a di A ssicu r a zion i S.p.A .1 00% 2 9 5
3 2 01 6 ERGO A ssicu r a zion i S.p.A Da r a g A G n d 5 0
4 2 01 6 Filo dir etto A ssicu r a zion i S.p.A . Gr u ppo In ter g ea S.p.a . 5 1 % 7
5 2 01 5 In Ch ia r o A ssicu r a zion i SpA HDI A ssicu r a zion i SpA 4 9 % n d
6 2 01 5 ERGO A ssicu r a zion i SpA Cin v en Pa r tn er s LLP n d n d
7 2 01 4 Ca r ig e A ssicu r a zion i A pollo Globa l Ma n a g em en t 1 00% 1 4 0
8 2 01 4 RSA (Ita lia n br a n ch es) ITA S Mu tu a 1 00% 2 4
9 2 01 4 Dir ect Lin e (Ita ly & Ger m a n y ) Ma pfr e 1 00% 5 5 0
1 0 2 01 4 CA RGEA S A ssicu r a zion i S.p.A BNP Pa r iba s Ca r dif 5 1 % 7 5
PwC | The Italian Insurance Market • 2016 figures + 3M17 overview
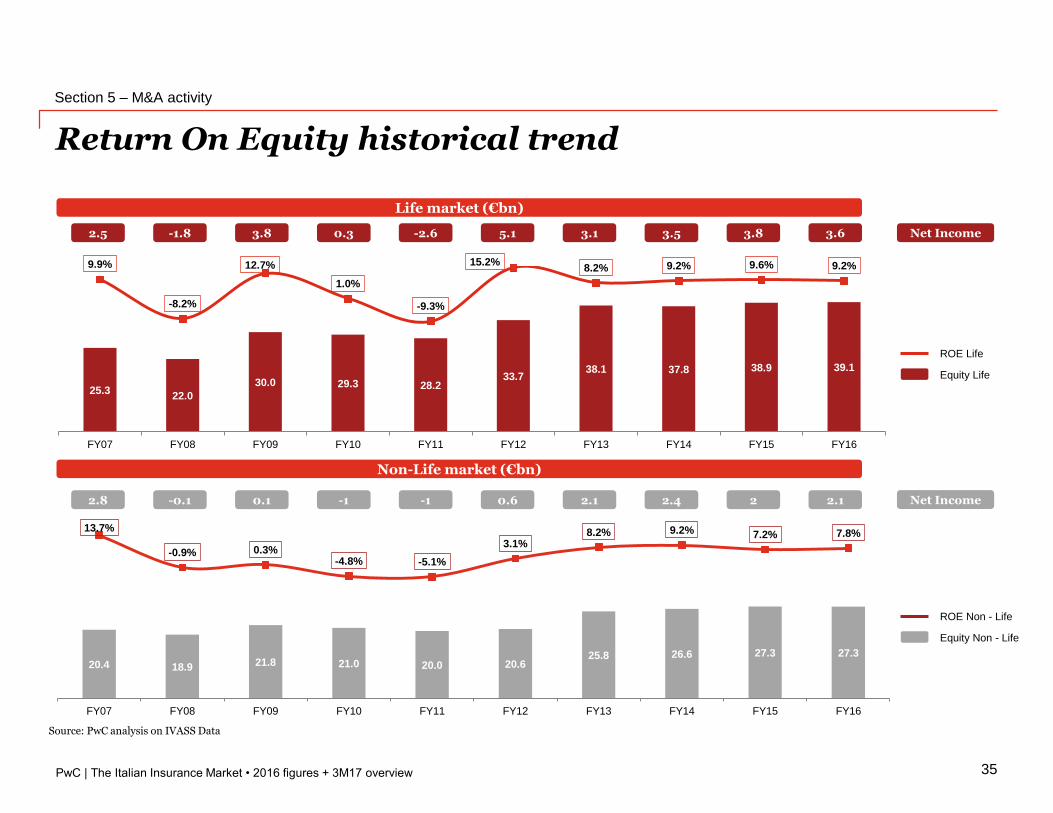
Return On Equity historical trend
Section 5 – M&A activity
35
Source: PwC analysis on IVASS Data
25.322.0
30.0 29.3 28.233.7
38.1 37.8 38.9 39.1
9.9%
-8.2%
12.7%
1.0%
-9.3%
15.2%8.2% 9.2% 9.6% 9.2%
FY07 FY08 FY09 FY10 FY11 FY12 FY13 FY14 FY15 FY16
20.4 18.9 21.8 21.0 20.0 20.625.8 26.6 27.3 27.3
13.7%
-0.9% 0.3%-4.8% -5.1%
3.1%8.2% 9.2% 7.2% 7.8%
FY07 FY08 FY09 FY10 FY11 FY12 FY13 FY14 FY15 FY16
Non-Life market (€bn)
2.8 -0.1 0.1 -1 -1 0.6 2.1 2.4 2 2.1
2.5 -1.8 3.8 0.3 -2.6 5.1 3.1 3.5 3.8 3.6 Net Income
ROE Life
Equity Life
Net Income
ROE Non - Life
Equity Non - Life
Life market (€bn)
PwC
The Italian insurance market in the European context
The Italian Insurance Market • 2016 figures + 3M17 overview
36
PwC | The Italian Insurance Market • 2016 figures + 3M17 overview
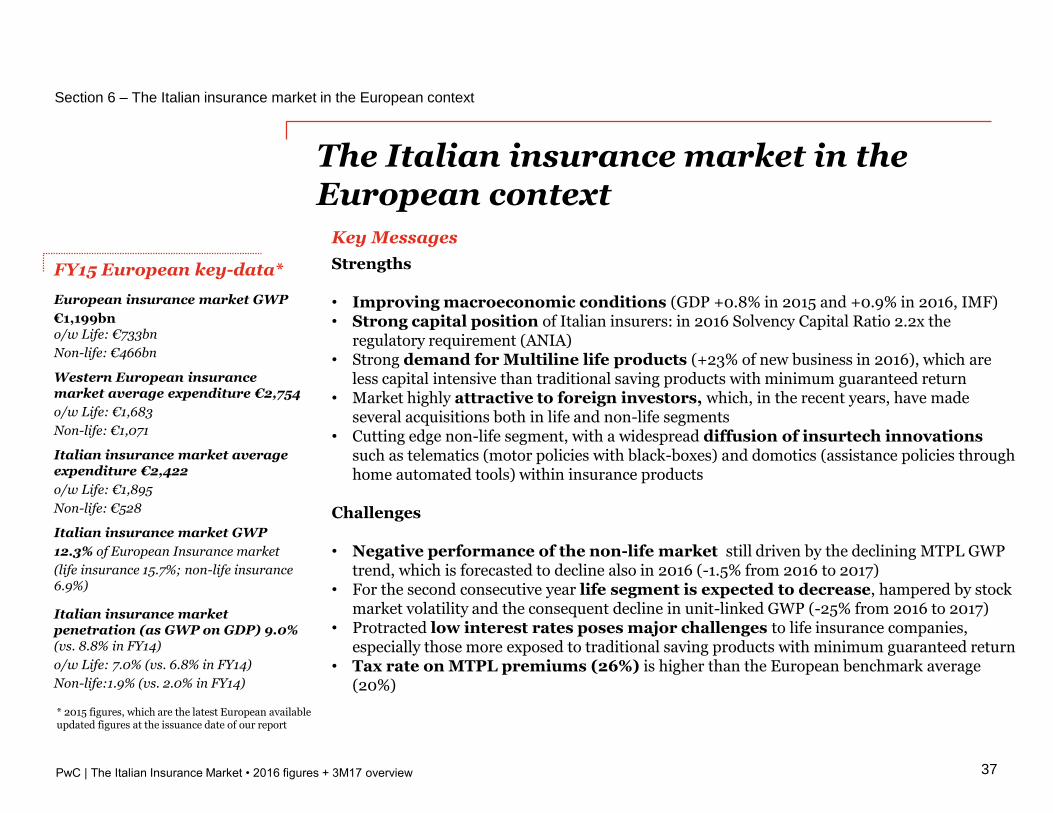
FY15 European key-data*
European insurance market GWP
€1,199bno/w Life: €733bn
Non-life: €466bn
Western European insurance market average expenditure €2,754
o/w Life: €1,683
Non-life: €1,071
Italian insurance market average expenditure €2,422
o/w Life: €1,895
Non-life: €528
Italian insurance market GWP
12.3% of European Insurance market
(life insurance 15.7%; non-life insurance 6.9%)
Italian insurance market penetration (as GWP on GDP) 9.0% (vs. 8.8% in FY14)
o/w Life: 7.0% (vs. 6.8% in FY14)
Non-life:1.9% (vs. 2.0% in FY14)
Section 6 – The Italian insurance market in the European context
37
The Italian insurance market in the European context
Key Messages
Strengths
• Improving macroeconomic conditions (GDP +0.8% in 2015 and +0.9% in 2016, IMF)• Strong capital position of Italian insurers: in 2016 Solvency Capital Ratio 2.2x the
regulatory requirement (ANIA)• Strong demand for Multiline life products (+23% of new business in 2016), which are
less capital intensive than traditional saving products with minimum guaranteed return• Market highly attractive to foreign investors, which, in the recent years, have made
several acquisitions both in life and non-life segments• Cutting edge non-life segment, with a widespread diffusion of insurtech innovations
such as telematics (motor policies with black-boxes) and domotics (assistance policies through home automated tools) within insurance products
Challenges
• Negative performance of the non-life market still driven by the declining MTPL GWP trend, which is forecasted to decline also in 2016 (-1.5% from 2016 to 2017)
• For the second consecutive year life segment is expected to decrease, hampered by stock market volatility and the consequent decline in unit-linked GWP (-25% from 2016 to 2017)
• Protracted low interest rates poses major challenges to life insurance companies, especially those more exposed to traditional saving products with minimum guaranteed return
• Tax rate on MTPL premiums (26%) is higher than the European benchmark average (20%)
* 2015 figures, which are the latest European available updated figures at the issuance date of our report
PwC | The Italian Insurance Market • 2016 figures + 3M17 overview
33.7 32.8 32.0
-
67.1 68.3 70.0
-
96.6 98.9 101.1
- 57.2 56.3 57.7 -29.4 29.3 29.5
-
68.8 65.6 70.6 85.1 110.5 114.9
-
118.8 128.9 135.7
-
90.8 93.7 92.7
-
18.3 17.5 14.7
-
25.9 25.2 25.6
-
184.4 175.8 183.4
118.8 143.3 147.0
185.9 197.2 205.7 187.4 192.6 193.8
75.5 73.8 72.4 55.2 54.4 55.1
253.2 241.4 254.0
FY13 FY14 FY15 FY13 FY14 FY15 FY13 FY14 FY15 FY13 FY14 FY15 FY13 FY14 FY15 FY13 FY14 FY15
€m
illi
on
Life market Non-life market
ItalyFrance
Germany
NetherlandsSpain
United Kingdom
-
500
1,000
1,500
2,000
2,500
3,000
3,500
(500) - 500 1,000 1,500 2,000 2,500 3,000 3,500 4,000
GW
P -
Lif
e (
€)
GWP - Non-Life (€)
European insurance market
Section 6 – The Italian insurance market in the European context
38
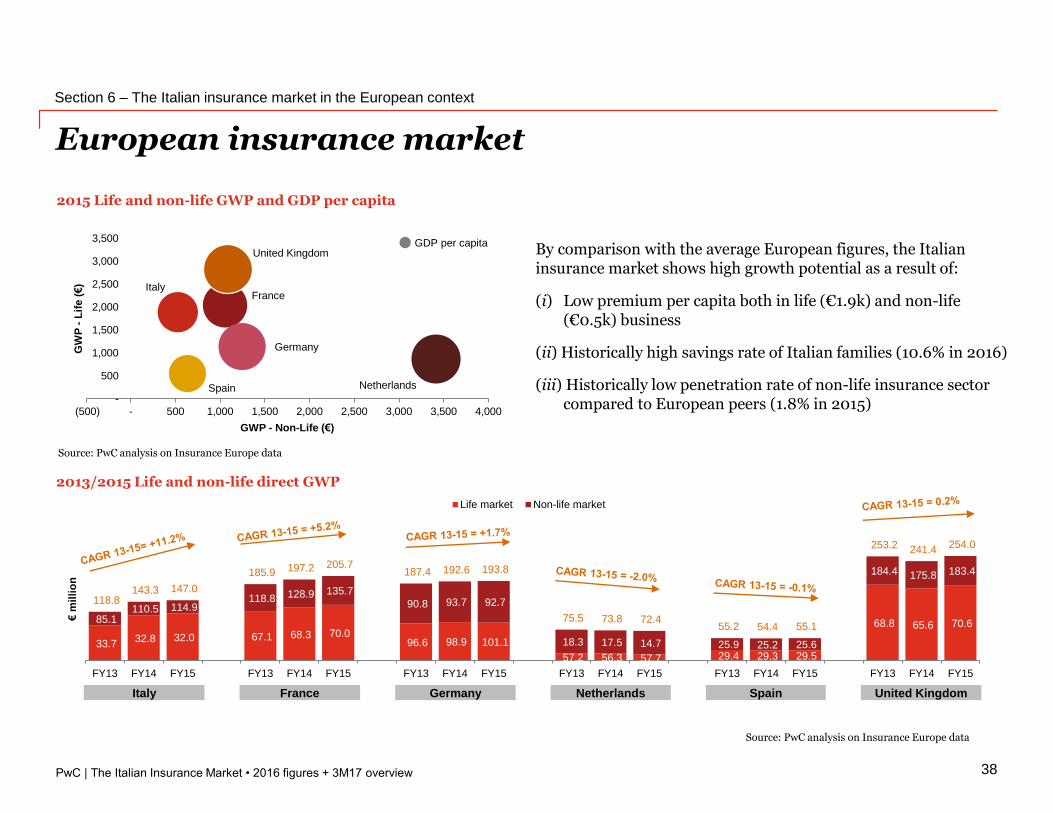
By comparison with the average European figures, the Italian insurance market shows high growth potential as a result of:
(i) Low premium per capita both in life (€1.9k) and non-life (€0.5k) business
(ii) Historically high savings rate of Italian families (10.6% in 2016)
(iii) Historically low penetration rate of non-life insurance sector compared to European peers (1.8% in 2015)
2013/2015 Life and non-life direct GWP
2015 Life and non-life GWP and GDP per capita
Source: PwC analysis on Insurance Europe data
Source: PwC analysis on Insurance Europe data
GDP per capita
France Germany Netherlands Spain United KingdomItaly
PwC | The Italian Insurance Market • 2016 figures + 3M17 overview
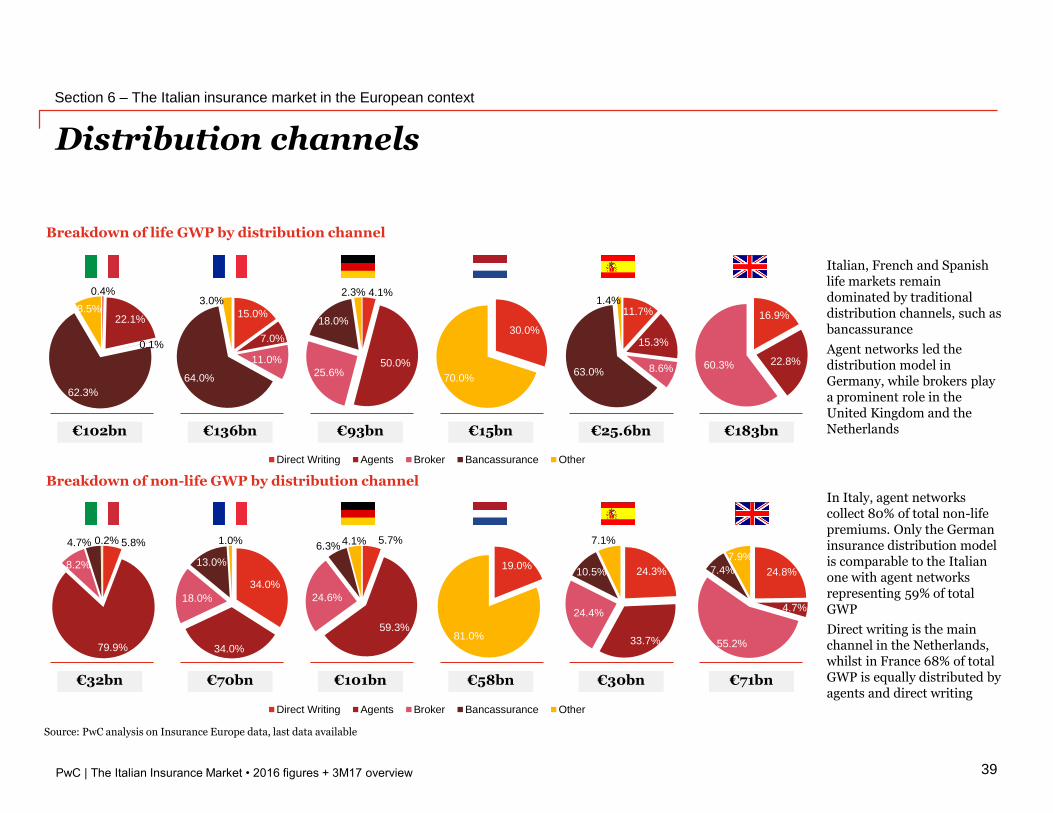
Breakdown of life GWP by distribution channel
Distribution channels
Section 6 – The Italian insurance market in the European context
39
Breakdown of non-life GWP by distribution channel
Source: PwC analysis on Insurance Europe data, last data available
0.4%
22.1%
0.1%
62.3%
8.5% 15.0%
7.0%
11.0%
64.0%
3.0%4.1%
50.0%25.6%
18.0%
2.3%
30.0%
70.0%
11.7%
15.3%
8.6%63.0%
1.4%
16.9%
22.8%60.3%
5.8%
79.9%
8.2%
4.7% 0.2%
34.0%
34.0%
18.0%
13.0%
1.0% 5.7%
59.3%
24.6%
6.3%4.1%
19.0%
81.0%
24.3%
33.7%
24.4%
10.5%
7.1%
24.8%
4.7%
55.2%
7.4%
7.9%
€102bn €136bn €93bn €15bn €25.6bn €183bn
€32bn €70bn €101bn €58bn €30bn €71bn
Italian, French and Spanish life markets remain dominated by traditional distribution channels, such as bancassurance
Agent networks led the distribution model in Germany, while brokers play a prominent role in the United Kingdom and the Netherlands
In Italy, agent networks collect 80% of total non-life premiums. Only the German insurance distribution model is comparable to the Italian one with agent networks representing 59% of total GWP
Direct writing is the main channel in the Netherlands, whilst in France 68% of total GWP is equally distributed by agents and direct writing
15.0%7.0%11.0%64.0%3.0% Direct Writing Agents Broker Bancassurance Other
15.0%7.0%11.0%64.0%3.0% Direct Writing Agents Broker Bancassurance Other
Our contacts
Emanuele GrassoPartner | Financial Services
T: +39 02 7785 372M: +39 348 [email protected]
Gabriele PicutiSenior Associate | Financial Services
M: +39 344 [email protected]
Marco FalcheroAssociate Partner | Financial Services
T: +39 02 7785 951M: +39 335 [email protected]
Davide BigattiSenior Associate | Financial Services
M: +39 340 [email protected]
© 2017 PricewaterhouseCoopers Advisory SpA. All rights reserved. PwC refers to PricewaterhouseCoopers Advisory SpA and may sometimes refer to the PwC
network. Each member firm is a separate legal entity. Please see www.pwc.com/structure for further details. This content is for general information purposes
only, and should not be used as a substitute for consultation with professional advisors.
Related Documents