Market opportunities in environmental goods and services, renewable energy, carbon finance and CATs Country report: South Africa October 2008

Welcome message from author
This document is posted to help you gain knowledge. Please leave a comment to let me know what you think about it! Share it to your friends and learn new things together.
Transcript

Market opportunities in environmental goods andservices, renewable energy, carbon finance and CATsCountry report: South Africa
October 2008

Country report: South Africa
Contents
Summary of market opportunities in environmental goods and services,renewable energy, carbon finance and CATs in South Africa 1
1: Introducing the South African market 3
2: The market for environmental goods and services in South Africa 6
3: The market for carbon abatement technologies, renewable energy and carbon finance in South Africa 9
4: Policy and regulatory frameworks 14
Annex A: Definitions of environmental goods and services, renewable energy, carbon finance and CATs 19
Annex B: Power stations in South Africa 22
Annex C: Bibliography 23
This report is one of seven on the opportunities for exports to, and direct investment and joint ventures in, themarkets for environmental goods and services (EGS), carbon abatement technologies (CATs), renewable energy andcarbon finance in selected countries (see Annex A for definitions of these sectors). It should be noted that thenuclear sector was excluded from the review. The other countries are Australia, Brazil, China, India, Turkey and theUSA – representing a mix of emerging/high growth and developed overseas markets in these sectors.
The findings from the reports have been fed into an overview report which:
• provides an assessment of the UK’s competitive advantage in EGS, CATs, renewable energy and carbon finance,
• maps this onto the market opportunities as revealed from the case studies, and
• suggests the opportunities for UK exporters and direct investors by market and sector.
The report considers the general market opportunities presented in the selected countries. It is based on deskresearch that drew on the most readily available and accessible information sourced from within the countryconcerned and from international agencies.
It provides background designed to be helpful in focusing the more detailed investigations that will need to becarried out by anyone interested in selling to or investing in the relevant markets and countries.
The report does not assess specific opportunities for UK exporters and/or investors – or their appropriate route tomarket. However, it shows where there are significant market opportunities in environmental goods and services,renewable energy, carbon finance and CATs.

Country report: South Africa 1
Summary of market opportunities inenvironmental goods and services, renewableenergy, carbon finance and CATs
Opportunities1 There are significant opportunities in South Africa for exports and/or direct investment in hazardous waste
management, solid waste management, water and wastewater treatment, as well as in advancedconventional energy generation and renewable energy. There are future opportunities in air pollutioncontrol, cleaner technologies, generation technologies and asset management. A map of current and futureopportunities in the environmental and low carbon markets in South Africa is set out below.
Sector Current opportunities* Future opportunities Policy framework (current)
Environmental Goods and Services
Air pollution & control � � Fair/Good
Cleaner technologies
Energy management � ☺ Good
Environmental consultancy � ☺ Good
Environmental monitoring
Marine pollution � � Fair
Noise & vibration
Land remediation
Waste management � ☺ Good
Water supply � ☺ Fair/Good
EGS overall � � Fair/Good
Carbon Abatement Technologies (CAT)
CCS � � Poor
Generation technologies � �
Low carbon fuels � � Fair
Asset management
CAT overall � � Fair
Other opportunities
Renewable energy � ☺ Fair
Carbon finance � ☺
Key ☺Relatively large market size and activity, relatively demanding regulation, relatively high publicexpenditure in this sector and relatively liberal trade and investment regime
�Mix of modest market size and activity, modestly demanding regulation, modest publicexpenditure and liberalising but still restrictive trade and investment
�No or minimal market size and activity, no regulation, and restrictive trade and investmentregime
No or inadequate information
* The assessment of current opportunities is based on the most recent official data and information on market size and sector activity. In many casesthis can refer to 2005 figures and as such certain conclusions in this report may not capture very recent developments in some sectors orannouncements concerning the near future. A variety of sources, methods and time-frames was drawn on to assess future opportunities – coveringthe next five-ten years based on government policies and/or budget allocations and/or independent forecasts and projections.

Country report: South Africa 2
Market entry options2 Most of the provisions of the EU/South Africa Trade, Co-operation and Development Agreement came into
force on 1 January 2000. The Agreement has boosted South Africa's trading prospects with Europe.Liberalisation towards a free trade area over the 12-year transition period will strengthen the UK’scommercial position in South Africa. The UK is the second largest European trader with South Africa (afterGermany). The availability of possible market entry strategies is summarised below:
Route to market Availability Comment
Export • Trade liberalisation followed
Foreign direct investment (FDI) • The rate of FDI is the highest across Africa, and reaches a variety of sectors notablyenergy, machinery and mining
Joint venture (JV) • Joint venture is a possibility with South African firms, although firms must be awareof bbBBE1 regulations
Source: SQW Consulting
Gaps in the evidence base3 A thorough trawl of readily available reports, studies and policy statements with regard to the markets
under review and consultations with stakeholders found little evidence on the opportunities in South Africain the following markets:
• Cleaner technologies (EGS)
• Environmental monitoring (EGS)
• Noise and vibration (EGS)
• Land remediation (EGS)
• Asset management (CATs)
4 This is not to say that this evidence is unavailable. More information could undoubtedly be found onspecific market opportunities and constraints from specialised and technical policy statements/guidance,journals and trade press. However, it was beyond the terms of reference for this review to investigate theopportunities in this degree of detail.
5 The report should be read as an introduction to the most significant opportunities in the Turkish markets.It has been designed to provide a focus for the more detailed investigations that will need to be carried outby anyone interested in selling to or investing in the markets.
1 Broad based Black Economic Empowerment strategy introduced by Government in March 2003

Country report: South Africa 3
Key facts1.1 South Africa is Africa’s largest economy (GDP in 2006 was US$255 billion) but has one of the most
unequal distributions of income in the world. The dominant sources of economic activity are centredaround minerals, energy and services (advanced financial services, tourism and retail). Whilst prospects forthe economy continue to improve as a result of the gains in macroeconomic stability, growth efforts areconstrained by massive unemployment, low savings levels and an inflexible labour market. To address someof these issues, in March 2003, the African National Congress (ANC) Government introduced a broad basedBlack Economic Empowerment strategy (bbBEE), which aims to accelerate growth and stimulate jobcreation.
SOUTH AFRICA – KEY FACTS (2000-2006)
2000 2001 2002 2003 2004 2005 2006
GDP growth (annual % at constant 2000 prices) 4.2 2.7 3.7 3.1 4.9 5.0 5.4
Gross capital formation (% GDP) 16 15 16 17 18 18 20
CO2 emissions (metric tonnes per capita) 9 9 9 9 9 — —
Total debt service(% of exports of goods, services and income) 10 11 12 6 4 5 7
GDP per unit of energy use(constant 2005 PPP US$ per kg of oil equivalent) 3 3 3 3 3 3 —
Trade (% of GDP) 53 56 62 54 54 56 63
Source: World Bank Group Millennium Development Goals statistics, Statistics South Africa
1.2 South Africa is expected to continue to benefit from strong foreign direct investment (FDI) inflows, whichremain the highest of any state in Sub-Saharan Africa (reaching US$6.4 billion in 2005). According toUnctad’s World Investment Report 2006, investment inflows to South Africa were the most diversified inAfrica in 2005, being channelled into banking, energy, machinery and mining, with banking receiving thelargest share.
1.3 UK investment flows to South Africa have grown over recent years, with UK net outward FDI figures toSouth Africa of £2,265 million (2002), £2,222 million (2003), £3,840 million (2004), £5,716 million (2005);net book value of UK direct investment at the end of 2006 was £8,630 million.
1.4 The current regime inherited an economic system based on import substitution, high tariffs and subsidies,and extensive government intervention in the economy. Trade liberalisation has progressed substantiallyover the last decade; the country has reduced its import-weighted average tariff rate from more than 20 percent in 1994 to 7 per cent in 2002, and has removed the requirement for permits on most imports, excepton used products and those regulated by international treaties.
1.5 Trade and investment with the UK is important, and is viewed positively within South Africa, with a numberof ANC leaders having received a UK education whilst in exile during apartheid. English is only one of 11official languages but is the medium of communication in most government departments and publications.The UK is South Africa’s largest trade and investment partner with over £7 billion in two-way trade ingoods and services and £24 billion of UK investment in South Africa. Exports from the UK to South Africain 2007 included £129 million of specialised industrial machinery, and £120 million of power generatingmachinery.
1: Introducing the South African marketThis section provides background information on the South African economy and the driversand international legal dispositions affecting the growth of the market for environmental andlow carbon technologies, goods and services.

Country report: South Africa 4
Drivers of environmental goods and services, renewable energy, carbon finance and CATs1.6 South Africa has a population of just over 47 million (2006), with a recent average annual growth rate of
1.7 per cent (1990-2006). Typical of an industrialising (or ‘advanced developing’) economy, South Africa ischaracterised by rapid levels of population growth and urbanisation (currently around 60 per cent live inurban areas), coupled with deforestation and increasing natural resource exploitation. Like China and India,it is poor but growing, and faces a rapidly rising demand for energy, in particular, electricity.
1.7 It is a resource-rich country. It has an abundance of minerals and is the top global exporter of platinum,manganese, vanadium and chromium, and holds 40 per cent of the world’s gold reserves in theWitwatersrand area. Other main mineral raw materials include diamonds, uranium, iron ore and coal. It isalso rich in biodiversity and natural resources, with three internationally recognised biodiversity hotspotsand home to nearly 10 per cent of the world’s plants, 7 per cent of the world’s vertebrate species and 5 percent of the world’s known insect species, as well as 15 per cent of global marine species.
1.8 Attitudes towards the environment – particularly climate change – are shifting, and there is now growingawareness of environmental issues. The country has witnessed an increased level of lobbying for stricterenvironmental protection laws, from both domestic and international environmental groups, since thecountry’s first democratic election in 1994. However, whilst the country faces mounting pressure to provideaccess to clean drinking water and improved air quality, rapid industrialisation and manufacturing forexport will continue to be encouraged as a strong economic driver for growth. The growing share of energyintensive industries in South Africa’s economy, and the country’s reliance on coal, have led to high andrising carbon emissions.
1.9 The vast majority of South Africa’s electricity (80-90 per cent) is generated in coal-fired power stations byEskom (Energy Supply Commission, a public utility founded in 1923). Coal-fired power generation is basedon the ready availability of cheap coal mining. However, despite large year-on-year jumps in peak demand,there has been little investment in expanding capacity, and this has now led to a situation of peakshortages and – consequently – a rolling schedule of planned electricity cuts across the country. Thecountry has been warned to expect ‘tight energy supply’ for at least another four years.
1.10 Without any large-scale planned additions to generation capacity, this will place restrictions on large-scaleenergy-consuming projects (such as Rio Tinto Alcan’s planned Coeca aluminium smelter). The case forexpansion of renewable energy is therefore compelling, and the government’s commitment to thediversification of South Africa’s energy supply – as well as the provision of energy to (off-grid) remote ruralareas – will create an ‘enabling’ environment for the introduction of independent power producers usingrenewable energies.
Country report: South Africa 5
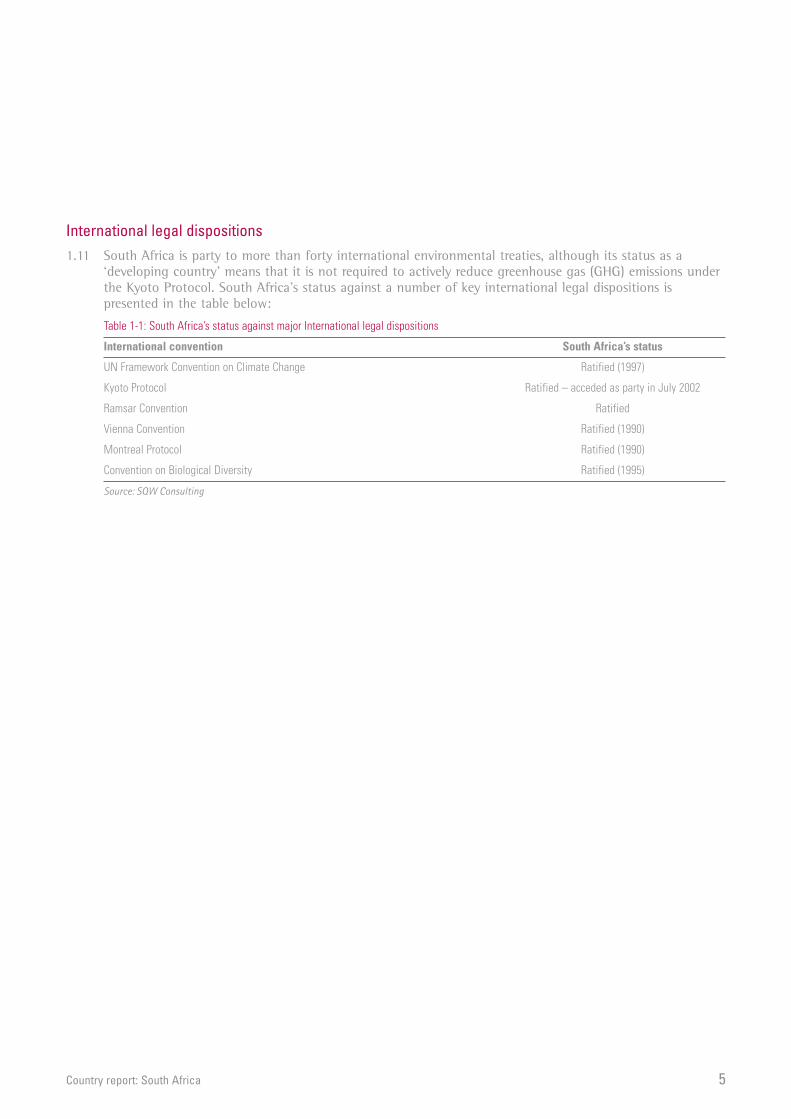
International legal dispositions1.11 South Africa is party to more than forty international environmental treaties, although its status as a
‘developing country’ means that it is not required to actively reduce greenhouse gas (GHG) emissions underthe Kyoto Protocol. South Africa’s status against a number of key international legal dispositions ispresented in the table below:
Table 1-1: South Africa’s status against major International legal dispositions
International convention South Africa’s status
UN Framework Convention on Climate Change Ratified (1997)
Kyoto Protocol Ratified – acceded as party in July 2002
Ramsar Convention Ratified
Vienna Convention Ratified (1990)
Montreal Protocol Ratified (1990)
Convention on Biological Diversity Ratified (1995)
Source: SQW Consulting

Country report: South Africa 6
2: The market for environmental goods andservices in South AfricaThis section describes the growth market for environmental goods and services (EGS) inSouth Africa and outlines the drivers of this growth. It then provides more information onthose segments presenting significant market opportunities.
2.1 The South African Department of Trade and Industry (DTI) and industry stakeholders completed a study in2006 to investigate the domestic environmental goods and services (EGS) sector. The study estimated thesize of the South African EGS market to be between ZAR 14.6 billion (US$1.8 billion)2 and ZAR 23.2 billion(US$2.9 billion) in 2004 (1-1.6 per cent of GDP). One problem, however, is a lack of reliable statistics onthe sector. Another is the lack of cohesion and organisation within the sector. However, this does not seemto be getting in the way of its growth prospects with the South African DTI estimating that the industry iscurrently experiencing an annual growth rate of between 10 and 15 per cent.
2.2 EGS News (December 2007) summarised the findings of the DTI study as follows:
The major SA EGS sub-sectors were focused on water and waste management and resource management. Demand-driven growth isexperienced in the climate change, air and noise pollution goods and services. South Africa is a world leader in specific niche areas such asthe management of mine waste and mine rehabilitation and conservation and biodiversity management.
The structure of the South African EGS industry includes a strong presence of foreign subsidiaries, established small local companies and newand emerging players. The current focus of these companies is the local market, which is therefore extremely competitive.
Key growth areas
2.3 South Africa’s rapidly growing demand for energy, and the growing share of energy intensive industries inits economy has led to an increasing need for sustainable energy management, both in policy and practice.
2.4 The two major types of pollution in South Africa are marine and air pollution. South African cities do nothave levels of pollution being experienced by many in India or China (Mastercard’s Insights Reports onUrbanisation and Environmental Challenges, 2008). But pollutant levels are still high – NO2 levels in CapeTown were measured at significantly higher than Calcutta, for example. In addition to industrial pollution,low-level atmospheric pollution results from coal-heated boilers (eg in hospitals) or coal combustion instoves.
2.5 Historically, air and water pollution has not been well regulated. There is still considered to be a significantapartheid legacy in terms of the distribution of impacts of pollution within the country, which wasconcentrated disproportionately on black communities. Apartheid spatial planning sited crowded townshipsin close proximity to toxic waste sites, sewerage treatment plants, or downwind/downstream from industrialcomplexes. However, political leverage is now shifting and ‘environmental justice’ is a key phrase behindmuch of the current policy work and legislation.
2.6 Industrial activity is prominent and growing throughout the country, although concentrated in specific sites.South Durban has the largest petrochemical industries in the country, and it refines approximately 60 percent of South Africa’s petroleum. The South Durban industrial basin also contains a wastewater treatmentplant, several toxic waste landfill sites, a paper manufacturing plant and a multitude of chemical processindustries.
2.7 New pollution control technologies will require further training (for design, commissioning, optimisationand operational control). Wits University offers a final-year course in air pollution control, but there is littletraining or education available in the industry, as well as a shortage of skilled personnel in the filtrationindustry (Engineering News, 2007).
2.8 Mining activities also present negative environmental impacts; pollution from mining activities is probablythe most direct cause of groundwater pollution in the country, whilst small waste coal dumps cause bothpollution and safety (spontaneous ignition) problems. Gold mining, for example, is a particularly resource-intensive activity, with mining occurring at depths up to about 4,000 metres; the production of one fineounce of gold requires on average about three tonnes of ore, 5,000 litres of water and 600 kilowatt hoursof electricity.
2 Exchange rates are valid as of 08/09/2008. This approximates to 1 US Dollar = 7.92 South African Rand.

Country report: South Africa 7
2.9 With regard to waste, by far the largest waste stream is generated from the mining sector. However, there isa lack of available or current waste information from all sectors. Combined with illegal dumping and a lackof regulation/enforcement, there is considerable scope for better waste management systems to bedeveloped in the future.
2.10 ‘Municipalities in South Africa are a major source of demand for EGS and indirectly also one of the largestsuppliers of EGS to industry, government and households. Johannesburg, Cape Town, Durban, Pretoria, andPort Elizabeth Metropolitan Councils are the biggest suppliers of environmental services through theiractive role in waste collection and management.’ UK Trade & Investment (UKTI), April 2008).
Market segments2.11 The main market segments within EGS, where there is most current and prospective activity, are related to
solid waste management – including hazardous waste, water and wastewater treatment, and airpollution prevention and measurement.
OPPORTUNITIES IN ENVIRONMENTAL GOODS AND SERVICES IN SOUTH AFRICA
Solid waste management
Over the last decade waste management has been prioritised within environmental management as well as within the various governmentaldepartments regulating these functions. Local municipalities have also become more accountable to their communities, ensuring that theyhave an integrated waste management plan in place to adequately provide an equitable service to all. Currently 90 per cent of waste is sentto landfill.
Energy from waste applications present a serious opportunity, particularly with the current state of the electricity market. There is a significantamount of landfill gas used for electricity projects, and this is growing.
Furthermore, landfill will begin to reach capacity in three to five years; this presents a significant driver to increase the rate of recycling. Inparticular, there may be serious opportunities in mining waste diversion and diversion of rubble to construction projects.
There is a national target to reduce the amount of ‘Big Five’ waste (plastics, cans, paper, glass and tyres) going to landfills by 70 per cent by2022, and plans are in place to minimise and treat the remaining 30 per cent (UKTI, April 2008). Whilst there are no government initiatives inplace to support this, some provincial authorities are looking to increase the number of recycling facilities and introduce environmentallyfriendly waste management technologies.
There may also be significant opportunities developing in health care waste, which is currently 100 per cent incinerated, as forthcoming wastelegislation is due to target this area.
A study of opportunities, constraints and challenges in the recycling industry – as well as government interventions required to support thesector – has been commissioned by the Enterprise Industry Development Division (EIDD) of South Africa’s DTI.
Environmental Management Systems (EMS)
According to UKTI (April 2008), ‘there are opportunities in the environmental management systems (EMS) sub sector, as most South Africancompanies are seeking to establish themselves in international markets. Some are already exporting outside Africa to Europe and the USA.They are pushing to acquire the appropriate ISO accreditation for their businesses to ensure that they meet the international standardsrequired. Therefore the demand for international companies that are able to provide EMS expertise to achieve accreditation is high and on theincrease. Furthermore, although there are some local companies who can provide this service, the larger SA companies seeking to achieveISO standard(s) tend to look for international expertise, which they feel carries more credibility with their international customers’.
Hazardous waste
The Norwegian Pollution Control Authority SFT plans to support the South African environmental authorities in preparing a strategy forhazardous waste.
Water and wastewater treatment
South Africa is experiencing significant – and growing – pressure on its water resources; the lack of major arterial rivers or lakes means thatextensive water conservation and control measures are required. The agricultural sector accounts for a high proportion of water withdrawals(available data on water withdrawals from 1990 indicates that 72 per cent of water withdrawal was for agricultural usage, 11 per cent forindustry and 17 per cent for domestic usage, although this will have changed significantly as the country has continued to industrialise overthis period). Agricultural run-off and urban discharge result in pollution of the country’s rivers.

Country report: South Africa 8
Many rural and suburban communities do not have access to residential waterborne sanitation systems. The municipal systems that do existhave suffered from continued under-investment and lack of maintenance. South Africa will continue to face mounting pressure to provideaccess to clean drinking water. Contamination of drinking water by wastewater outfall leads to regular outbreaks of waterborne diseases suchas cholera and typhoid fever.
Investment through programmes such as ASGISA (see Chapter 4) will see many municipalities put under pressure to both upgrade oldwastewater treatment plants, and build new ones to cope with increased capacity needs. This will provide significant opportunities forequipment and service providers, and will continue to require additional equipment and expertise in the area of water and wastewatertreatment, for example in purification, monitoring, filtering and pumping.
The US Commercial Service (May 2006) believes that the best prospects would be in: the implementation of biological sewage treatmentprocesses, the treatment and recovery of organics from agro-industrial processes, the treatment and recovery of inorganics in industrial andmining effluents, bio-technological co-treatment of industrial effluent with sewage waste, the upgrading of sewage reticulation plants,upgrading and expansion of existing storm water infrastructure.
In October 2007, the Norwegian Pollution Control Authority SFT signed an agreement concerning co-operation on the administration of smallerwastewater treatment plants, as part of the Environmental Protection Co-operation between Norway and South Africa. This programme,valued at NOK 10 million annually, will include the education of inspectors who have already been through the training programme run by theDepartment of Environmental Affairs, addressing the more practical aspects of their work. There is also a co-operative project testing out theuse of smaller, prefabricated wastewater treatment plants in Durban.
Marine pollution
South Africa is vulnerable to oil spills, due to the high volume of oil shipped around the coastline (on its way from the Middle East toUS/Europe). South Africa’s response systems to marine pollution caused by a shipping casualty however are considered to be inadequate. Thecountry is located on one of the busiest tanker routes in the world, and yet it has not signed up to the 1999 international protocol on marinepollution with its associated compensation fund. The 1981 Marine Pollution Act employs the ‘polluter pays’ principle up to a maximum of ZAR120 million (US$15 million) to be paid by the insurers of the vessel. This was nearly put to the test by several groundings – the tanker SealandExpress, carrying hazardous cargo and with several thousand tonnes of fuel on board, ran aground off Sunset Beach (Cape Town) during astorm in 2003, and the Treasure sank in Table Bay in 2000 carrying 13,000 tonnes of bunker fuel.
South Africa’s regulation of pollutants and discharges into the marine environment is shared between the Departments of Water Affairs andForestry and Environmental Affairs and Tourism. Whilst there is a comprehensive policy on the regulation of land-derived discharges into themarine environment, there is very little information on discharges or the monitoring of these discharges.
Air pollution
Air pollution is a growing concern in South Africa, largely caused by the reliance of the country’s industrial sector on coal for energy. SouthAfrica’s coal has a relatively high ash content (up to 45 per cent) and contains approximately 1.2 per cent sulphur. In 2000, it was reported thatSouth African refineries produce approximately 82 tonnes of sulphur dioxide gas daily. Air pollution is particularly concentrated in severalindustrial ‘hotspots’, such as South Durban, the Vaal Triangle, and Milnerton in Cape Town, and there are concerns about resulting acid rain.
Historically, air pollution has not been well monitored or regulated. However, the South African Air Quality Act, enacted in 2004, signals theintentions of the regulator to control emissions within licensed limits. The first step is generally to reduce the emission of particulates;industrial plant owners use bag filters, various scrubber designs or electrostatic precipitators (Engineering News, March 2007). Industrybelieves that compliance on controlling particulate emissions is achievable and affordable with present technologies, but the removal ofsubmicron particulates from flue gas streams will require new technologies.
Anecdotally, however, ‘ineffective implementation and enforcement has led to uncertainty by industry, as they are unsure whichstandards/technology to apply in tackling air pollution, particularly when dealing with emissions from stacks’ (UKTI, April 2008).
In transport, regulations apply to diesel vehicles, largely geared to ensuring proper maintenance (although enforcement is weak). On 1 January2006, South Africa switched from leaded to unleaded petrol in motorised vehicles. Prior to the fuel switch, an estimated 60 per cent of SouthAfrican vehicles were using leaded petrol. In addition, diesel fuel used in South Africa after January 1, 2006 has ultra-low sulphur content of0.005 - 0.05 per cent, increasing its cost by $0.11 per gallon.
The Central Energy Fund (CEF) is also involved in developing the market for low-smoke fuels. Baniettor Mining (owned by BHP Billiton and CEF)owns the mineral rights to torbanite, which could be used to manufacture low-smoke fuels.
Environmental consultancy
The sector is projected to be growing rapidly and, whilst there are a large number of South African consultants in the sector, those SouthAfrican companies wishing to expand overseas will look to use internationally accredited companies. There is also a shortage of staff withrelevant skills in government, and this presents significant capacity-raising opportunities (such as consultancy).
Source: SQW from various sources
Country report: South Africa 9
3: The market for carbon abatement technologies,renewable energy and carbon financing in South AfricaThis section summarises the readily available evidence on the market for carbon abatement technologies (CATs),renewable energy and carbon financing in South Africa. It describes the general growth in the sectors and itsdrivers and presents information on those segments within the three sectors where there are significantopportunities.
Market growth and its drivers3.1 South Africa’s economy is highly energy-intensive; energy intensity in 1999 was 34,462 British Thermal
Units (BTU/US$1990,) compared with 12,638 BTU/US$1990 in the USA (US Energy InformationAdministration). South Africa has seen a rapid rise in energy usage over recent decades. This has beenmatched by a rapid growth in energy production; in the twenty years from 1980 to 2000, total energyproduction rose by 97 per cent, compared with world growth of 37 per cent over the same period.
3.2 The large majority of South Africa’s energy consumption is from the use of coal, much of which is used toproduce synthetic fuels. Synthetic fuels account for around 76 per cent of South Africa’s oil production.Sasol is the world’s largest manufacturer of oil from coal, using coal-to-liquids (CTL) technology, and thestate-owned PetroSA runs the largest gas-to-liquids (GTL) plant in the world at Mossel Bay.
3.3 The country has proven (offshore) oil reserves of 15 million barrels (as of January 2007), although morethan half of its oil consumption is imported (mostly from Saudi Arabia and Iran). Nonetheless, South Africahas the second largest oil refinery system in Africa, with major refineries in Durban, Cape Town andSasolburg. A further 300,000 bbl/d refinery has also been announced in the KwaZulu-Natal province.
3.4 The vast majority of South Africa’s electricity (90 per cent) is generated in coal-fired power stations byEskom (Energy Supply Commission, a public utility founded in 1923). Eskom, the continent’s biggest powerproducer, employs almost 33,000 employees (Eskom Annual Report, 2007), and in 2006 had a revenue ofZAR 36 billion (US$5 billion), putting it among the top nine utilities in the world in terms of sales (topseven in terms of generating capacity).
3.5 Eskom’s 24 power stations can be found in almost every province of South Africa, and include:
• ten (base-load) coal-fired power stations (each 2,000-4,000 MW),
• a nuclear site at Koeberg (1,930 MW) (the only nuclear plant in Africa),
• six peak load power stations (two HEP stations, two gas turbine, two pumped storage), and
• In addition, three coal-fired stations were mothballed in 1990, but are in the process of beingre-commissioned to meet the growing demand for electricity.
3.6 Kendal Power Station is currently the largest coal-fired power station in the world. It has a turbine ‘designefficiency’ of 35 per cent. It has an indirect dry-cooling system, meaning that it uses significantly less waterin its cooling processes than the conventional wet-cooled power stations.
3.7 Eskom uses over 90 million tonnes of coal per annum. Coal mining in South Africa is relatively cheapcompared to the rest of the world; in Europe, for example, costs are almost four times higher. The countryhas the world’s sixth largest recoverable coal reserves (53.7 billion short tonnes), accounting for around5 per cent of the world total, with 70 per cent of this lying in just three coal fields. Coal-firing in SouthAfrica is particularly inefficient, as most of the country’s coal is low quality with a low heat value and ahigh ash content (up to 45 per cent).
3.8 Recent years have seen large year-on-year jumps in peak demand. However, Eskom’s requests for funding tobuild new power stations to meet this demand were denied, in part because of the government’s intentionto privatise the company in the late 1990s (Former President Mbeki admitted in December 2007 that thisstrategic error is now adversely affecting the country’s economy).
3.9 Despite the fact that this situation had been predicted several years in advance, Eskom has had to takedrastic measures to cope with this mismatch in demand and supply. The current reserve margin is around8 per cent, while the National Energy Regulator wants 16 per cent. In January 2008 the companyintroduced a schedule of planned electricity cuts, or ‘load shedding’ during peak periods and, on thedemand-side, consumers have also been encouraged to conserve power during peak periods. In February2008, Public Enterprises Minister Alec Erwin announced that South Africans could expect ‘tight energysupply’ for another four years (other reports are higher, ranging from seven to 15 years).

Country report: South Africa 10
3.10 Eskom is currently negotiating the import of electricity from neighbouring countries (eg Cahora Bassa inMozambique provides around 1,200 MW to South Africa out of its total capacity of 1,600 MW).
3.11 In January 2008, Eskom announced that it would not take on any new ‘mega’-projects (1,000 MW-plus)until around 2012, when it hoped to commission the first generating units at its new Medupi powerstation, which could – for example – affect the timing of Rio Tinto Alcan’s Coeca aluminium smelter.Nonetheless, Eskom has now indicated it will spend around US$39 billion on building new coal and gasturbine plants by 2012.
Market segments3.12 The main market segments within low carbon technologies where there is most current and prospective
activity are related to renewable energies in particular wind and solar with interesting developments inbiomass.
Carbon abatement technologies
3.13 Looking to the future, the government’s intention is to expand generation from nuclear reactors, and abouthalf of the expected increase of Eskom’s generating capacity (doubling in size to 80 GW) to 2025 isexpected to be nuclear. A Koeberg-type pressure water reactor will not be on stream before 2015, and apebble-bed modular reactor will not be on line before 2013. A nuclear strategy is expected to be finalisedthis year by the Ministry of Minerals and Energy.
3.14 There is little Carbon Capture and Storage (CCS) activity ongoing in South Africa at the present time, but itcould represent an opportunity in future. There may be particular potential for Carbon AbatementTechnology (CAT) installations in plants involved in converting coal to gas for the production of liquid fuelsand synthetic chemicals. However, CCS on a much larger scale does not seem to support the centralsustainable development aims of the government in a way that switching to gas and renewable energiesmight.
OPPORTUNITIES IN CARBON ABATEMENT TECHNOLOGIES IN SOUTH AFRICA
Carbon Capture and Storage (CCS)
South Africa’s reliance on coal, alongside a growing environmental awareness country-wide, means that CCS is a serious potential technologyoption. CCS would allow the country to make significant cuts in emissions without fundamental changes to their energy systems. South Africahas a large potential for carbon storage (20 gigatonnes).
However, CCS represents an expensive option and one that would increase the cost of power significantly. CCS may even work againstsustainable development goals, and could (through the increase in cost) slow the increase of electrification (and provision of some free powerto households), that is a central government policy aim.
There are, nonetheless, some options for relatively low cost CCS from specific installations, including mainly plants for gasifying coal for theproduction of liquid fuels and synthetic chemicals. These installations represent a potential carbon saving of 30 Mt of CO2 per year that couldbe sequestered for around US$20 per tonne. The Department of Minerals and Energy undertook a study to ascertain the potential for carbonstorage, which found that the most appropriate source for the first detailed investigation would be the 30 Mt/year of 95 per cent CO2 emittedby Sasol.
Although the country has no CCS projects underway, it has significant relevant technical expertise already, including geology and drilling, gastransportation by pipeline, and gasification of coal (Sasol and PetroSA).

Country report: South Africa 11
Generation technologies
New opportunities will become evident as Eskom has indicated it will spend around US$39 billion on building new coal and gas turbine plantsby 2012.
Gas – The building of gas-fired power stations and co-generation projects is being sped up to ensure that by 2010 the reserve margin is closerto 15 per cent.
As stated in the previous section, a growing number of landfill gas to electricity projects are occurring (eg under the CDM), and this is likely toexpand yet further.
Low carbon transport fuels
The White Paper on Renewable Energy policy outlines the potential for biomass in transport (biodiesel as fuels – or blended fuels – forvehicles), as well as in cooking, space heating, water heating and refrigeration (fuel wood and other biomass). It also discusses biomasscogeneration as an alternative fuel for industrial activities.
Biodiesel oil crops can be grown in six out of nine provinces. At present no fuel crops are grown for biodiesel, although soya and sunflower (inparticular) are grown for human and animal consumption (RET, 2005). The production of biodiesel would therefore require significantinvestment in new capacity. As the infrastructure for production and distribution is not yet established, nor the legal or regulatory framework,this may be difficult to bring forward in the short-term on a large scale, particularly because of the need to bring together a large number ofdifferent government departments. Further, as South Africa is a net diesel exporter, new markets would have to be found for current dieselproduction. Nonetheless, CEF has recently entered into a joint venture with Sasol to produce 100 million litres of bio-diesel from soya, whichmay help to remove some of these barriers.
Renewable energy
3.15 In general, renewable energy fulfils two of the government’s energy objectives: managing energy-relatedenvironmental impacts, and diversifying energy supplies. The current energy crisis means that the country isparticularly keen to diversify its energy supply.
3.16 Currently, there is a very low baseline of renewable energy provision. In 2004, less than 1 per cent of the200,000 GWh of electricity generated annually in South Africa came from renewables. However, the scopefor encouraging its use – both on-grid (for environmental and diversity reasons) and off-grid (as anaffordable, reliable and socially acceptable alternative) – is substantial. In the short-term, there is a very realcapacity issue, and there will be a significant time-lag before new coal-fired power stations can bedelivered.
3.17 The University of Cape Town (2005) estimated that South Africa has a potential annual output of86,843 GWh from renewable energy sources. In 1999, renewable energy accounted for approximately 9 percent of total energy consumption (Energy Futures, 2000), although most was from fuelwood and dungrather than from modern renewable technologies.
3.18 The Eskom/WWF Renewable Energy Fund was announced in 2006. This fund is designed to support gridand off-grid applications for small scale (<1 MW) projects, concept development and/or feasibility studies.It will not cover commercial start-up capital, proven technologies, or pure market research/academicresearch. Submissions are due to be short-listed by end May 2008, with funding commencing 31 July 2008.
OPPORTUNITIES IN RENEWABLE ENERGY IN SOUTH AFRICA
Wind
TIn comparison with other renewable energy sources, research by the University of Cape Town showed that wind had the highest potentialGWh output, but that the cost of wind generation tended to be higher than most of the other renewable resource categories. It is estimatedthat wind power could supply at least 1 per cent of the country’s projected total annual electricity requirements of 198,000 GWh. (Departmentof Minerals and Energy, 2002), with good potential along most coastal and escarpment areas with mean wind speeds above 6m/s.
The Klipheuwel Wind Farm, run by Eskom about 40km north of Cape Town, has a generation capacity of 3.16 MW.
A national pilot project at Darling, north west of Cape Town, has been established at a cost of ZAR 70 million (US$9 million) to generate anestimated 13.2 GWh per year using four wind turbines. This project, run by the Oelsner Group, represents the first independent commercialwind farm venture in South Africa, and there are plans to add another six turbines, followed by a further ten in the long term. The project willbe connected to the national grid, and sold to customers who choose to pay a 25c/kWh surcharge for a ‘green’ energy supply – initially this isexpected to be largely business customers. The project is the result of a partnership between national government, the Danish government,

Country report: South Africa 12
the Central Energy Fund and the Darling Independent Power Producing Company, drawing on a loan from the Development Bank of SouthernAfrica.
The support for the project by the City of Cape Town, which has signed a 20-year power purchase agreement (for onward sale), indicates thatmore such schemes could be given the go-ahead.
Biomass
Biomass accounts for almost 10 per cent of net energy use in South Africa. The main sources are fuelwood used in the rural domestic sector,bagasse in the sugar industry and pulp and paper waste in commercial forestry for in-house heat and electricity generation (RET, 2005).
Fuelwood is a valuable national resource, although resources are not evenly distributed and many woodlands are not sustainably managed.Fuelwood is not currently on the government’s agenda, and does not currently present a proposition for private investment. Sugar bagasse isconsidered the most economically viable renewable resource with the highest GWh output (RET, 2005).
The Renewable Resource Database (RRDB) modelling of the wood and pulp industries energy potential (based on availability and energycontent) found that sawmills could provide a potential tonnage of 1.57 Mt/year, with an energy potential of 7,639 GWh/year and that pulpmills could provide a potential tonnage of 1 Mt/year, with an energy potential of 4,528 GWh/year (DME, Eskom, CSIR, 2001).
The biomass sector is also witnessing considerable investment activity. The Eastern Cape Biomass company is building a ZAR 70 million(US$9 million) alternative fuels project, which will produce biomass pellets, intended solely for export through the deep-sea Port of Ngqura,scheduled for completion in late 2008. The Industrial Development Corporation (IDC) has taken a 10 per cent stake in the business. A previousbiomass project, Star Biomass, was set up as a joint venture with shipping company Grindrod. However, its plant at Richards Bay, establishedin 2001 at a cost of ZAR 50 million (US$6 million), never reached critical mass and the company faltered. The IDC commented in February 2007that clean fuels were seen as ‘risky investments, and that is why the banks don’t go there’ (SESSA news item, 15 Feb 2007).
Solar
South Africa has always had substantial potential for harnessing solar power. However, there are now new drivers for installing solar capacitybecause of a lack of investment in existing and new power stations
Photovoltaics (PV): Installed PV capacity – predominantly used in telecommunications networks, small-scale domestic use, game farms,community pumping schemes – is estimated at 12 MW (RET, 2005). PV is starting to be used to power advanced robotic schemes, such as atraffic light system in Cape Town.
Interesting advances are being made in solar PV technologies by South African academics. A Professor at the University of Johannesburg hasdevised a solar panel that is thinner and up to 50 per cent cheaper than anywhere else in the world. Conventional solar panels only harness15 per cent of incipient solar energy by the cell; the new panels allow more energy to be generated at less cost (using thinner photovoltaiccells and using different components to the conventional phosphorus and boron doped layers). The technology is already being produced in apilot project based in Germany, and it is hoped that South Africa's first solar fabrication plant, based in Paarl in the Western Cape, will be upand running in late 2009.
After structuring a beneficial licensing deal, Johanna Solar Technology, based in Germany and owned by a consortium of investors, includingthe Central Energy Fund (CEF (Pty) Ltd), Venfin, Richemont and Anglo American, has committed to bringing the technological know-how andproject management expertise gained through the pilot project back to South Africa (CEF website).
Solar water heating (SWH) accounts for approximately 1 per cent of the solar energy market in terms of GWh, although making affordableprovision and the reduction of initial installation costs (possibly by scaling up manufacture and installation) is considered to be a priority inorder to scale up further (RET, 2005). Standards have not yet been introduced, and so there is a need to develop these to allow accreditationfor manufacturers and installers.
The Department for Minerals and Energy (DME) and CEF are running a six-month solar water heating pilot project for domestic use in middle-to upper-income homes. The current cost of the solar heater is prohibitive, estimated at between ZAR 7,000 (US$900) and ZAR 20,000(US$2,500), and the country’s manufacturing capacity is only 10,000 units per annum, so the programme will be linked with subsidies for theunits (see section 4). Rolling out SWH more widely to poor off-grid areas may not be viable, until areas are provided with piped water.
Wave energy
The potential for wave energy, particularly along the Cape coastline, is considered to be significant. Average harvestable potential along theentire coast is estimated at 56,800 MW (DME, 2004).
Hydro-electricity
As of 2003, there were eight licensed small hydro facilities with a combined total of 68 MW, and a power generation potential of 9,900 GWhper year (RET, 2005).
Source: SQW from various sources

Country report: South Africa 13
Carbon finance
3.19 Carbon finance is small but growing in South Africa. The Clean Development Mechanism (CDM) allowsindustrialised countries with a greenhouse gas reduction commitment (Annex 1 countries in the KyotoProtocol) to invest in projects that reduce emissions in developing countries as an alternative to emissionreductions in their own countries, which is often more expensive. CDM projects must prove ‘additionality’ –ie that the planned reductions would not occur without the additional incentive provided by emissionreductions credits.
3.20 According to a report by UKTI (March 2008), South Africa has been slow to take up CDM projects, withSouth African projects accounting for just 13 of the 952 registered verifiable emissions reduction projectsregistered on the UNFCCC website as of March 2008 (there are a further ten CDM projects at the validationphase). These are set out in Table 3-1, and full details can be found on the UNFCCC website(http://cdm.unfccc.int/Projects/index.html).
Table 3-1: CDM projects in South Africa
Kuyasa low-cost urban housing energy upgrade project
Lawley fuel switch project
PetroSA biogas to energy project
Rosslyn brewery fuel switching project
Durban landfill-gas-to-electricity project – Mariannhill and La Mercy landfills
Tugela Mill fuel switching project
EnviroServ Chloorkop landfill gas recovery project
Omnia fertiliser limited nitrous oxide reduction project
Mondi Richards Bay biomass project
Sasol Nitrous Oxide Abatement Project
Transalloys Manganese Alloy Smelter energy efficiency project
Catalyst inside the ammonia reactor of the No. 9 nitric acid plant at African Explosives Ltd
N2O abatement project at nitric acid plant No. 11 at African Explosives Ltd
Source: UNFCCC website
3.21 Whilst South Africa has been relatively slow to take up CDM projects, it is nonetheless amongst the top tencountries in terms of volume of certified emission reductions (CERs) generated by registered projects,although this list is dominated by China and India. As of April 2008, South Africa had a 1 per cent share ofthe expected global annual CER output (or 2.5 million CERs out of 210 million globally).
3.22 The UKTI paper (March 2008) states that: ‘Project developers in South Africa believe the reason for the slowuptake of CDM projects in South Africa is due to the lack of capacity/project development knowledge on theground and a nervousness of the potential risk with the uncertainty of post Kyoto in 2012.’
3.23 The Designated National Authority (DNA) to oversee CDM projects in South Africa is the Department ofMinerals and Energy (DME). Although the CDM process can be complex, the DNA in South Africa isconsidered to be well organised and is being used as a model to be implemented in other African countries.

Country report: South Africa 14
4: Policy and regulatory frameworksThis section describes the governance and trade policy context, the extent to which environmentalpolicies and regulation have become more demanding and the institutions responsible for trade,investment and environmental policy and regulation.
Widening democratic participation, sharing growth4.1 South Africa benefits from a democratic constitution. Freedom of Information (FOI) laws are in effect,
legally guaranteeing public access to government records. Nonetheless, South Africa scores five in theCorruption Perception Index (CPI) where ten is highly clean and zero is highly corrupt3.
4.2 The broad-based Black Economic Empowerment (bbBEE) programme was introduced after the end ofapartheid rule in 1994, and culminated in the Black Economic Empowerment Act (2003), with a target of25 per cent BEE ownership of energy companies by 2014. This sets an important context for understandingall government policies and inward investment.
4.3 An inter-departmental committee on Indigenous Knowledge Systems has been established, including:Department of Environment Affairs and Tourism, Department of Science and Technology, Department ofAgriculture, Department of Health, and Department of Trade and Industry. An Indigenous KnowledgeSystems Bill is under consideration.
4.4 The Accelerated and Shared Growth Initiative of South Africa (ASGISA) has spent ZAR 372 billion(US$47 billion) on major infrastructure projects, including sanitation and wastewater provision and energydistribution, for example, through the improvement of municipal service delivery.
Trade and investment4.5 The Government viewed economic restructuring through trade liberalisation, deregulation and privatisation
as important for growth and employment generation in the long run, despite short-term transitional costs.There have been political difficulties in pushing privatisation forward and the Government has recentlyshifted its focus from pursuing wholesale privatisation to developing profit oriented public sectorenterprises.
4.6 Since the early 1990s, South Africa has been involved in a trade liberalisation process. As a result, thedecline in tariffs was uninterrupted throughout the 1990s and the weighted average tariff decreased by onethird between 1993 and 2000. Moreover, the highly complex tariff regime was simplified. South Africantrade policy relies on unilateral, bilateral and multilateral trade liberalisation in the context of the WorldTrade Organization (WTO). The free trade area agreement with the European Union, by far the mostimportant trading partner of South Africa, was signed in 1999 and progressively implemented from 2000onwards. Unilateral trade liberalisation is also at the top of the South African political agenda, mainlybecause of its commitments to the WTO and the Growth, Employment and Redistribution Programme.
4.7 bbBEE is a key element to doing business in South Africa. It is the cornerstone of the South AfricanGovernment’s efforts to educate and train the huge sector of the population that was disadvantaged underapartheid. It aims to accelerate the participation of black people (which includes African, Indian andColoured people) in the economy.
4.8 bbBEE intends to achieve this by encouraging change in seven key areas of business: ownership;management control; employment equity; skills development; preferential procurement; enterprisedevelopment; and residual aspects such as corporate social investment. The bbBEE process is primarilydriven by legislation, regulation and contractual undertaking. The key acts which provide the legislativeframework for the transformation of the economy are the Skills Development Act; the Employment EquityAct, the Preferential Procurement Act, and the broad based Black Economic Empowerment Act.
3 The CPI is based solely on perceptions derived from 14 different polls and surveys of business people and country analysts

Country report: South Africa 15
Environmental policy4.9 Section 24 of the South African constitution ensures the right of citizens to live in a clean and healthy
environment, and also makes provisions for the benefit of present and future generations, ‘throughreasonable legislative and other measures that: prevent pollution and economical degradation, promoteconservation, and secure ecologically sustainable development and use of natural resources while promotingjustifiable economic and social development’.
4.10 The White Paper on Environmental Management, developed by the Department of Environmental Affairsand Tourism (DEAT) in 1997, provided the framework for modern environmental policy in South Africa.
4.11 The National Environmental Management Act (1998) brought in national standards to consolidate thecountry’s once-fragmented environmental legislation. It covers: air, water and marine pollution, wastemanagement, deforestation, energy efficiency and biodiversity conservation. Whilst it is generally acceptedby industry as providing comprehensive coverage of the key sub-sectors, there ‘appears to be a vacuumbetween setting generic policies and focusing regulations on specific sub-sectors’ (UKTI, April 2008), andenvironmental enforcement has been limited to date.
4.12 The third IPCC assessment report (2007) stated that climate change is featuring higher on the South Africangovernment’s agenda, but that it needs to be mainstreamed in all government departments. Whilst thecountry is not obligated to reduce carbon emissions, it is accepted that the more developed of thedeveloping countries would need to accept ‘some kind’ of emissions reductions.
4.13 There is now a government commitment to create ‘an enabling structure, strategy and action plan’ tostimulate trade in EGS. A 2006 report baselining the sector for the South African Department of Trade andIndustry (DTI) stated that, unlike most other industries, the growth of the EGS industry is largely driven bygovernment activities and policies. The SA EGS Forum was established in August 2007, ostensibly to unitethe sector. However, anecdotal evidence suggests that there is some confusion across DEAT and the SouthAfrican DTI as to the definition of the EGS sector.
4.14 The EGS Forum has produced a draft South African EGS Sector Growth Strategy and Action Plan (2007),which recognises EGS as a growth sector, ‘with the potential to make a significant contribution to nationaleconomic objectives’. It is explicitly recognised that the Action Plan needs to demonstrate its contribution tothe poverty alleviation agenda.
Energy policy4.15 Post-apartheid policy has tended to have a strong focus on energy for development. The country is
committed to providing universal access to electricity by 2012. In practice, this means a combination of gridexpansion and the deployment of Remote Area Power Supply (RAPS) systems. The South African off-gridelectrification programme grants private companies the right to develop off-grid energy utilities, withexclusive rights to government subsidies to cover capital costs over five years.
4.16 In 2001, the government introduced a subsidy for free basic electricity for households on the grid,equivalent to 50kWh per month.
4.17 The National Energy Regulator of South Africa (NERSA) regulates policy across the South African energyindustry, and is responsible for the country’s energy plan.
4.18 Public Enterprises Minister Alec Erwin has stated that the government’s aim is for independent producers tocontribute around 30 per cent of the country’s electricity. Subsidies for synthetic fuel production are beingphased out for Sasol, although Mossgas continues to receive substantial financial support.

Country report: South Africa 16
4.19 In general, renewable energy fulfils two of the government’s energy objectives: managing energy-relatedenvironmental impacts, and diversifying energy supplies. The national government has set a target of anadditional 10,000 GWh a year in renewable energy for the national grid by 2013.
4.20 In light of the current energy crisis, a statement on Cabinet's Renewable Energy Development, released bythe Government of South Africa on 25 January 2008, named a number of projects the Department ofMinerals and Energy have embarked on, including: a hydropower project, a project to convert biogas toelectricity, wind power projects, and a green power pilot project, which includes biomass electricitycogeneration.
Future regulations and legislation4.21 There are various bills and regulation in the pipeline, relating to issues that include pollution and waste
minimisation (eg the National Environmental Management: Waste Management Bill; and thePollution/Waste Minimisation Act); whilst these are currently with Parliament, it is uncertain how long theywill take to come forward.
4.22 An important point is that key environmental policies have in the past been delayed in terms of embeddinginto legislation. At least a part of this is as a result of the strong industry lobby. Currently DEAT and theCouncil for Scientific Industry Research (CSIR) are looking to implement Defra’s (UK) policy model toencourage bills to be supported by robust research and to enable industry buy-in. Passing environmentalbills into legislation should be quicker in the future.
4.23 There is currently a shortage of staff with relevant skills in government, and this presents significantcapacity-raising opportunities (such as consultancy).
4.24 Environmental enforcement is also increasing, particularly with the formation of the EnvironmentalManagement Inspectors – dubbed the ‘Green Scorpions’ - in 2005, which is beginning to change thecommon perception in South Africa that government lacks the will to enforce its environmental legislation.There are now 866 Inspectors in 15 institutions across the country. Furthermore, DEAT is set to sign aformal agreement with the South African Police Service to allow the Green Scorpions to carry their owncriminal dockets or case files, and to hand those over for prosecution to the National Prosecuting Authority,which could allow for ‘more effective and efficient’ prosecution of environmental crime.
NATIONAL ENVIRONMENTAL INITIATIVES AND REGULATIONS
Central Energy Fund, NEEA and SANERI
The Central Energy Fund, CEF (Pty) Ltd. manages the operation and development of the oil and gas assets and operations of the South Africangovernment, and is increasingly involved in the search for ‘appropriate energy solutions’ to meet the future energy needs of the country.These include solar, biomass, wind and renewable energy sources. In 2006, the CEF group of companies announced that they would beinvesting more than ZAR 30 billion (US$4 billion) over the next four years as it ‘intensifies its quest for new energy sources’. Capitalexpenditure would be split into: Feedstock projects (ZAR 7.4 billion) (US$0.9 billion), Exploration (ZAR 2.5 billion) (US$0.31 billion), Security ofsupply opportunities (ZAR 15 billion) (US$1.9 billion), Infrastructure (ZAR 1.4 billion) (US$0.2 billion), Low smoke fuels (ZAR 2billion)(US$0.3 billion), Renewable Energy (ZAR 2.6 billion) (US$0.3 billion), Other (ZAR 0.3 billion) (US$0.04 billion).
CEF established two new energy bodies in 2006 – the National Energy Efficiency Agency (NEEA) and the South African National EnergyResearch Institute (SANERI) – to deal with the country’s energy challenges.
NEEA will oversee the implementation of Eskom’s Demand Side Management (DSM) and other energy efficiency projects, after it was agreed(following consultation) that the existing governance arrangements relating to the DSM Fund need to be reformed. In the interim, however,DSM funds will remain with Eskom, which, as the main implementing agency will continue to manage these funds under the oversight of theNEEA governance body. As well as prioritising and recommending projects, NEEA will develop strategies to tackle the growing demand forenergy in the country, and will support, co-ordinate and invest in energy efficiency training country-wide.

Country report: South Africa 17
SANERI is responsible for R&D in the energy industry. Its remit is ‘to generate new ideas and to develop practical guidelines for how SouthAfrica can best take advantage of what nature offers us in the form of clean and renewable energy’, and to support the development oftechnologies to fully exploit the country’s resources. It will focus on energy policy, planning and modelling, as well as cleaner fossil fuel use(including clean coal), renewable energy, and alternative energy sources (including fuel cells and hydrogen). It provides bursaries for post-graduate research into cleaner energies, and has funded Stellenbosch University to act as the hub of a postgraduate programme in renewableand sustainable energy studies.
Renewable Energy Subsidy Office (REFSO)
REFSO has began disbursing subsidies for renewable energy projects worth ZAR 4 million (US$0.5 million), for example through providing asubsidy of 20-30 per cent on domestic solar water heating units (see below).
Energy White Paper (DME, 1998)
The Energy White Paper outlines the following major objectives for government:
Increasing access to affordable energy services
Stimulating economic development – encouragement of competition within energy markets
Managing energy-related environmental and health effects
Securing supply through diversity – increased opportunities for energy trade and diversity in both supply sources and primary energy carriers.
It is debatable whether the first of these encourages diversity or greater production of cheap electricity from coal, but the other threeobjectives are in line with a diversification of energy supply, particularly into low-carbon and renewable energies.
White Paper on Renewable Energy Policy (DME, 2004)
This policy targets the provision of 10,000 GWh per annum over 10 years from renewable sources (mainly biomass, wind, solar and small-scale hydro projects) by 2013. This is equivalent to approximately 4 per cent of the country’s estimated electricity demand.
An assessment of the macroeconomic impacts of pursuing this policy suggests that it would create more than 35,000 jobs, that it wouldcontribute more than ZAR 5 billion (US$0.63 billion) to GDP, and that ZAR 687 million (US$87 million) would be added to the incomes of low-income households (RET, 2005; DME, 2004).
Solar water heating initiative (DME, CEF)
The DME has established a concessioning process for off-grid rural electrification, and has installed over 20,000 solar home systems in fourconcession areas.
The DME and CEF are running a solar water heating pilot project for domestic use in middle- to upper-income homes that will see a millionsolar water heaters installed over the next three years. According to a departmental statement, the DME is confident that the project will seea marked reduction in electricity use; potential savings have been estimated at 650 MW. As well as homes, the programme is targeting grouphouses (such as army bases and mine residences), commercial and industrial applications.
Given the prohibitive cost of the solar heater (see section 3.18), REFSO will provide a subsidy of 20-30 per cent depending on the cost of theunit.
National Waste Management Strategy Implementation (NWMSI)
The National Environmental Management: Waste Management Bill is due to be passed imminently.
The NWMSI project comprises four components: Recycling; Waste information system; Health Care waste; Project management and cross-cutting issues, including legal, financial, capacity building, etc.
Air Quality Act, 2004
The Act is seen as an important move to control industrial emissions, and includes provision to reward public representatives for informing thechief air pollution control officer about contraventions.

Country report: South Africa 18
National Biodiversity Strategy and Action Plan
The NBSAP was developed, with wide stakeholder consultation, between 2003 and 2005. However, much of the existing policy andlegislation is fairly new, and many aspects remain to be implemented.
The strategy sets out quantitative biodiversity targets for the 5-year action plan, based on a scientific assessment by the NBSA in 2004. Itcovers terrestrial, river, estuarine and marine ecosystems.
The NBSAP identified nine priority geographic areas, as well as priorities for freshwater, estuarine and marine ecosystems. Within theseareas, biodiversity considerations have to be incorporated into municipal spatial plans. A dialogue between conservation organisations andthe Chamber of Mines aims to improve biodiversity practices within the industry and prevent loss of natural habitat in critical sites.
The Biodiversity Act (2004), also allows for the establishment of a Bioprospecting Fund, for the collection and distribution of financial benefitsarising from bioprospecting.
Source: SQW from various sources

Country report: South Africa 19
Annex A: Definitions of environmental goods andservices, renewable energy, carbon finance and CATs
A.1 The Defra/BERR Environmental Industries Unit has defined the individual EGS sectors as follows:
Sub-sector Description Examples of types of activity
Air Pollution Control Defined as products, systems and services forthe prevention, reduction and removal ofgaseous and particulate pollutants from air
External and internal emissions and odourcontrol, filters and catalytic converters
Cleaner Technologies and Processes Defined as products, systems or services forcleaner more resource efficient technologies,processes or products which are not coveredelsewhere
Decommissioning/Decontamination ofNuclear sites
Defined as products, systems and servicesrequired for the decommissioning of existingnuclear liability sites and structures
Consultancy, decontamination, recycling andcompaction technologies, waste collectionand containment
Environmental Consultancy Defined as services to provide assessmentand advice relating to environmental issues
Environmental audits, environmental impactassessment, corporate environmentalresponsibility
Environmental Monitoring, Instrumentationand Analysis
Defined as products, systems and services formeasuring and monitoring environmentalparameters
Water, air and soil quality, meteorologicalconditions and flow rates
Energy Management/Efficiency Defined as products, systems and services forenergy management and energy efficiency
Energy consultancy/audits, building energymanagement systems, energy efficientproducts and efficiency advice
Marine Pollution Control Defined as products, systems and services forcontrolling, clean up and minimising marinepollution
Products such as oil absorbents and boomsand services such as marine pollutionpreventing techniques
Noise & Vibration Control Defined as products, systems and services formonitoring and reducing noise and vibration.
Noise meters, monitoring systems, acousticbuffers, enclosures and barriers and silencers
Recovery and Recycling Defined as products, systems and services forwaste segregation, recovery and recycling
Paper, organics, metals, plastics, glass,demolition and construction wastes, vehiclesand white goods
Remediation and Reclamation of Land Defined as products, systems and services forthe identification, assessment andremediation/reclamation of land andbuildings, including prevention of contaminantdispersal
Absorbents and injection equipment,monitoring systems and proprietary treatmentprocesses and sampling/analysis and siteinvestigation/engineering
Waste Management Defined as products, systems and services forthe minimisation, collection, treatment (notrecycling) and disposal of waste
Advice on waste minimisation, landfill,mechanical and biological treatment,regulatory advice and technologies such asspecialised containment, shredders,compactors and waste management vehicles
Water Supply and Wastewater Treatment Defined as products, systems and services forthe management of the fresh waterenvironment, provision, treatment, distributionand storage of clean water and wastewaterfor industrial and domestic users
Resource development, demand management,manufacture of wastewater treatmentequipment, design, construction, installationand operation of water and wastewatertreatment facilities
Table A-1: Constituent sub-sectors of the Environmental Goods and Services sector
Source: DEFRA, Sustainable Consumption and Production – Development of an Evidence Base: Annex 1,UK Government Definitions of the Environmental Goods and Services Sector (Draft Review September 2006)
Country report: South Africa 20
Sub-sector Description Examples of types of activity
Carbon Capture & Storage (CCS) Defined as a multi-stage process wherecarbon from power generation is capturedeither before or after combustion andtransported to a long-term storage ingeological formations. This approach canreduce emissions by up to 85 per centdepending on the type of non-capture plantdisplaced
The entire supply chain for CCS technologiesfrom R&D to demonstration and deployment.This includes manufacturing, as well asengineering and financial/business consultingservices across the three main stages:
• Carbon capture at plant
• Transportation to a storage
• Storage in a geological formation
Generation technologies that provide higherconversion efficiency
Defined as higher efficiency conversionprocesses, where the amount of fuel consumeand the associated emission of CO2 arereduced and the conversion processes aremade more efficient (eg emission reductionsof 10-30 per cent are possible depending onthe performance of the old and replacementplant. Even higher levels can be attained byadding co-firing with biomass (typically a5-10 per cent mix)
The entire supply chain for renewabletechnologies from R&D to demonstration anddeployment. This includes manufacturing, aswell as engineering and financial/businessconsulting services. Main technologies are:
• Supercritical boilers
• Integrated Gasification Combined Cycle(coal)
• Combined Cycle Gas Turbine (gas)
Substitution to low carbon transport fuels Defined as fuels used for transport based onthe fermentation and distillation ofreplenishable organic matter, such asagricultural crops (eg sugar cane or beet,rapeseed) or woody material. Commonlyknown as biofuels, the main commercialvarieties are bioethanol and biodiesel, wherethe former can be used as the main fuel andthe latter is typically mixed with standarddiesel in different proportions. Currently, thereare second and third generation biofuels
Production of crops and other organic matterto be converted into fuel. The design oftechnology and equipment for producingbiofuels. The production of different types oflow-carbon fuels including bioethanol andbiodiesel
Asset Management Defined as planning, procurement andmaintenance of energy generation facilities
Business planning, condition assessment,data gathering, technical maintenance
A.2 For the purposes of the study, we have taken Renewable Energy and Carbon Finance out of the definitionof EGS and CATs and treated them as separate sectors.
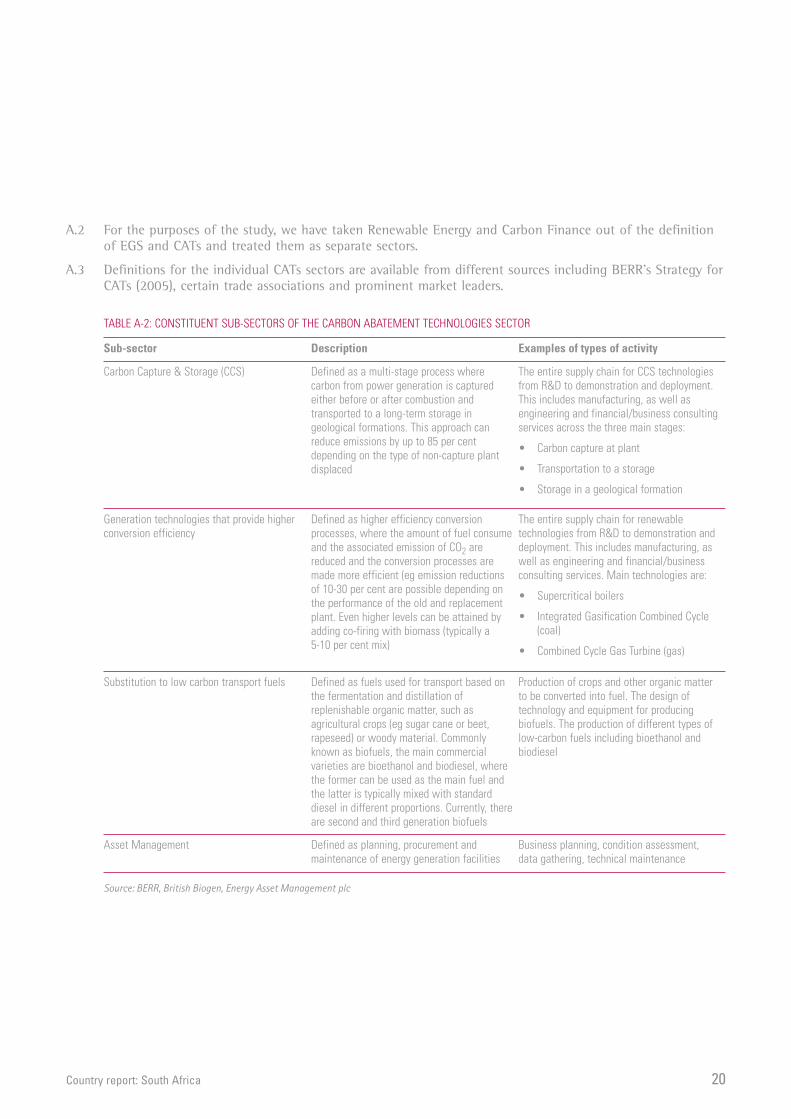
A.3 Definitions for the individual CATs sectors are available from different sources including BERR’s Strategy forCATs (2005), certain trade associations and prominent market leaders.
TABLE A-2: CONSTITUENT SUB-SECTORS OF THE CARBON ABATEMENT TECHNOLOGIES SECTOR
Source: BERR, British Biogen, Energy Asset Management plc

Country report: South Africa 21
Sub-sector Description Examples of types of activity
Renewable energy Defined as energy technologies that usenatural resources such as sunlight, wind,flowing water, tides and waves, biomass andgeothermal heat. The availability of theseresources is either unaffected by energycapacity installed (eg solar and wind energy)or can be replenished in the short-term(eg hydro and biomass)
The entire supply chain for renewabletechnologies from R&D to demonstration anddeployment. This includes manufacturing, aswell as engineering and financial/businessconsulting services. Main technologies are:
• Wind (onshore and offshore)
• Solar (thermal and electric)
• Hydro (smaller scale)
• Biomass (heat and power)
• Geothermal
• Marine (wave and tidal)
A.4 Renewable energy is defined broadly in all sources consulted and a generic definition is as follows:
TABLE A-3: RENEWABLE ENERGY
Source: various sources
Sub-sector Description Examples of types of activity
Carbon finance Defines as the investments in greenhouse gasemission reduction projects, the creation(origination) of tradable commodities on the‘carbon market’, and the provision of financialand business services associated with all ofthe above
Trade in carbon commodities and derivativeson different markets and exchanges, such asCERs, EAUs, VERs and others
CDM and JI project assessment, registration,finance and development
A.5 Carbon Finance is also a term which is not standardised across the literature and a definitionreflecting the content attributed to it by several sources is as follows.
TABLE A-4: CARBON FINANCE
Source: various sources

Country report: South Africa 22
Annex B: Power stations in South Africa
Source: Eskom website - www.eskom.co.za

Country report: South Africa 23
Annex C: Bibliography
Carbon Sequestration Leadership Forum (September 2005) South African activities related to Carbon Captureand Storage
Department of Minerals and Energy (May 2004) White Paper on Renewable Energy Policy
Department of Minerals and Energy (2002) Energy Outlook for South Africa
Department of Minerals and Energy, Eskom, CSIR (2001) South African Renewable Energy Resource Database
Engineering News (16 March 2007), Legislation to boost air pollution control in South Africa,www.engineeringnews.co.za/article.php?a_id=102933
Environmental Goods and Services News (2007) South African Environmental Goods and Services Sector –Sector Growth Strategy and Action Planwww.enviropaedia.com/news/article/default.php?pk_news_type_id=3&pk_news_id=104
Eskom (2007) Annual Report, www.eskom.co.za/annreport07/annreport07/disclaimer.htm
Eskom website – www.eskom.co.za
Intergovernmental Panel on Climate Change (2007) Fourth Assessment Report: Working Group III report –Mitigation of Climate Change.
Mastercard Worldwide Insights (2008) Urbanisation and Environmental Challenges in Asia/Pacific, Middle Eastand Africa – Ranking of Worldwide Centres of Commerce
Nedlac (2006) Strategy to Stimulate Growth in the South African Environmental Goods and Services Industry
Peek, S. Conflict and cooperation in Durban’s petrochemical basin,www.umich.edu/~snre492/brian.html
Renewable Energy Technology (RET) Working Group/Global Network on Energy for Sustainable Development,Energy Research Centre, University of Cape Town (June 2005) Renewable Energy Technologies for poverty alleviation,Initial assessment report: South Africa
South Africa Government (2008) A National Electricity Emergency Programme, issued 25th January 2008.www.info.gov.za/speeches/2008/08012511151001.htm
Statistics South Africa – www.statssa.gov.za/
Transparency International (2007) Corruption Perceptions Indexwww.transparency.org/policy_research/surveys_indices/cpi/2007
UKTI (March 2008) South Africa Country & Market Profile: Low Carbon Markets
UKTI (April 2008) Sector Report: Environmental Sector, South Africa
University of Cape Town (Gisela Prasad, Eugene Visagie), Energy Research Centre (June 2005) Renewable EnergyTechnologies for poverty alleviation. Initial assessment report: South Africa
US Commercial Service (May 2006) South Africa: Opportunities for Wastewater Equipment and Services
US Energy Information Administration (EIA) (April 2007) Country Analysis Briefs: South Africa
UNFCCC website (2008) http://cdm.unfccc.int/Projects/index.html
World Bank Group Millennium Development Goals Statistics South Africa (stats available to 2006),http://go.worldbank.org/79Z3TW8V90

Country report: South Africa 24


Whereas every effort has been made to ensure thatthe information given in this document is accurate,neither UK Trade & Investment nor its parentDepartments (the Department for Business, Enterprise& Regulatory Reform, and the Foreign &Commonwealth Office), accept liability for any errors,omissions or misleading statements, and no warrantyis given or responsibility accepted as to the standingof any individual, firm, company or otherorganisation mentioned.
Published October 2008 by UK Trade & Investment© Crown CopyrightURN 08/1341
UK Trade & Investment is the Governmentorganisation that helps UK-based companies succeedin an increasingly global economy. Its range of expertservices are tailored to the needs of individualbusinesses to maximise their international success.We provide companies with knowledge, advice andpractical support.
UK Trade & Investment also helps overseas companiesbring high quality investment to the UK’s vibranteconomy – acknowledged as Europe’s best place fromwhich to succeed in global business. We providesupport and advice to investors at all stages of theirbusiness decision making.
UK Trade & Investment offers expertise and contactsthrough a network of international specialiststhroughout the UK, and in British Embassies andother diplomatic offices around the world.
For further information please visitwww.uktradeinvest.gov.uk or telephone+44 (0)20 7215 8000.
Related Documents