COMMERCIAL IN CONFIDENCE FINAL REPORT Revenue sharing arrangements between MRFs and councils from the NSW Container Deposit Scheme Prepared for NSW Office of Local Government 29 March 2018 THE CENTRE FOR INTERNATIONAL ECONOMICS www.TheCIE.com.au

Welcome message from author
This document is posted to help you gain knowledge. Please leave a comment to let me know what you think about it! Share it to your friends and learn new things together.
Transcript

COMMERCIAL IN CONFIDENCE
F I N A L R E P O R T
Revenue sharing arrangements between MRFs and councils from the NSW Container
Deposit Scheme
Prepared for
NSW Office of Local Government
29 March 2018
THE CENTRE FOR INTERNATIONAL ECONOMICS
www.TheCIE.com.au

The Centre for International Economics is a private economic research agency that
provides professional, independent and timely analysis of international and domestic
events and policies.
The CIE’s professional staff arrange, undertake and publish commissioned economic
research and analysis for industry, corporations, governments, international agencies
and individuals.
© Centre for International Economics 2018
This work is copyright. Individuals, agencies and corporations wishing to reproduce
this material should contact the Centre for International Economics at one of the
following addresses.
C A N B E R R A
Centre for International Economics
Ground Floor, 11 Lancaster Place
Majura Park
Canberra ACT 2609
GPO Box 2203
Canberra ACT Australia 2601
Telephone +61 2 6245 7800
Facsimile +61 2 6245 7888
Email [email protected]
Website www.TheCIE.com.au
S Y D N E Y
Centre for International Economics
Suite 1, Level 16, 1 York Street
Sydney NSW 2000
Telephone +61 2 9250 0800
Email [email protected]
Website www.TheCIE.com.au
B R I S B A N E
Centre for International Economics
Nous House
Level 12, 259 Queen Street
Brisbane QLD 4000
Phone +61 419 040 735
Email [email protected]
Website www.TheCIE.com.au
DISCLAIMER
While the CIE endeavours to provide reliable analysis and believes the material
it presents is accurate, it will not be liable for any party acting on such information.

www.TheCIE.com.au
Revenue sharing arrangements between MRFs and councils from the NSW Container Deposit Scheme iii
Contents
Executive summary 1
1 Introduction 7
The NSW Container Deposit Scheme 7
The role of a MRF in recycling 8
Refunds available to MRFs 9
This project 11
2 Framework for evaluating impacts 13
Objectives for sharing of refunds 13
Types of impacts of the CDS on a MRF 15
MRF financial model 16
Process for gathering information 17
3 Impacts of the CDS on a MRF 18
Administration and compliance costs (Impact 1) 18
Changes in material volumes (Impact 2) 19
Impact on market prices received by MRFs (Impact 3) 23
CDS revenues (Impact 4) 24
Commercial collections 26
4 MRF viability and commodity markets 27
Markets for recycled materials 27
Export markets for paper and plastic 28
Commodity prices 30
Glass markets 33
Defining viability 33
5 Scenarios for refund sharing arrangements 35
Refund shares to cover CDS-related costs 35
Refund shares for MRF viability 41
6 Other issues 45
Transparency of agreements 45
Structure of a refund sharing agreement 46
Bargaining power of MRFs and councils 47
Contracts with collectors 47
Incentives for councils and MRFs 48
Risk sharing for contracts 48
A Technical appendix — impacts of the CDS on a MRF 49

www.TheCIE.com.au
iv Revenue sharing arrangements between MRFs and councils from the NSW Container Deposit Scheme
BOXES, CHARTS AND TABLES
1 Components of the CDS refund share for a MRF 2
2 CDS revenue and underlying commodity price 3
3 Costs of CDS relative to the revenues for a hypothetical MRF 3
4 Refund shares across different MRFs to cover CDS impacts 4
5 Refund shares for MRF viability 5
1.1 Overview of NSW Container Deposit Scheme 7
1.2 What a MRF does 8
1.3 Containers collected by MRFs and refunds available 10
1.4 Share of contained from each source and revenue for MRFs 11
2.1 Components of the CDS refund share for a MR 14
2.2 Revenues and costs of a MRF 16
3.1 Activities required of MRFs because of the CDS 18
3.2 Material shares from kerbside recycling 20
3.3 Estimates of diversion from kerbside recycling 21
3.4 Commodity prices used for scenarios 23
3.5 CDS revenue and underlying commodity price 24
3.6 Estimating CDS refunds, before diversion away from kerbside systems 25
4.1 MRF outputs and NSW exports of plastic and paper waste 28
4.2 NSW waste exports to China and Hong Kong 29
4.3 NSW waste exports, total value 29
4.3 NSW waste exports in tonnes, total 30
4.4 Export destinations for waste from NSW for last quarter of 2017 30
4.4 Price indicators for paper 31
4.5 Price indicators for mixed plastic 31
4.6 Price indicators for separated plastic 32
4.7 Commodity price changes all sources 2016/17 to February 2018 32
4.8 Shares of glass recycling in NSW 2017 33
5.1 Impacts of the CDS on hypothetical MRF 36
5.2 Costs of CDS relative to the revenues for a hypothetical MRF 36
5.3 Financial metrics for a MRF under different scenarios 37
5.4 Refund shares across different MRFs to cover CDS impacts 38
5.5 Refund share for different material diversion rates 38
5.6 Refund share for different diversion rates for aluminium and plastic 39
5.7 Refund share for different operating cost structures 40
5.8 Refund shares for MRF viability 42
5.9 Commodity price movements as a gate fee equivalent 42
5.10 Commodity price changes and CDS refunds 43
6.1 Information known to a MRF and a council 45
6.2 Risks of alternative approaches to structing refund sharing agreements 46
www.TheCIE.com.au
Revenue sharing arrangements between MRFs and councils from the NSW Container Deposit Scheme 1
Executive summary
The CIE and A. Prince Consulting (APC) have been asked to provide advice to NSW
Office of Local Government (OLG) on the refund sharing agreements between material
recovery facilities (MRFs) and local councils. These refund sharing agreements are a
temporary provision to ensure that refunds for containers deposited in kerbside bins are
returned to the community, prior to new contracts for processing of kerbside recyclable
materials being entered into.
The key task of this project has been to advise on the refund share that a MRF should
receive to ensure that they can cover the direct and indirect costs of the NSW Container
Deposit Scheme (CDS). As a secondary task, the project also seeks to advise on what
CDS refund shares would enable MRFs to continue to be viable given recent difficulties
in the markets for recycled materials.
Framework for evaluating refund shares
The impacts of the CDS on a MRF include:
1 direct administration and compliance costs
2 a change in the volume of materials processed, and particularly higher value
materials, as some containers are diverted from kerbside recycling to collection points.
This:
– reduces the gate fees that a MRF collects
– reduces the variable costs for MRFs to process material
– reduces the materials available for MRFs to sell (in some cases materials are sold
at a negative price)
3 a potential change in the markets available for MRFs to sell into. For example, higher
quality glass collected through the CDS collection points may substitute for lower
quality glass collected by MRFs
4 an increase in revenue because of revenue available from container refunds.
It is our expectation that negotiations will not proceed smoothly unless issues of MRF
viability are also part of the CDS refund sharing discussions or dealt with at the same
time. The markets for commodities that MRFs produce have been influenced by changes
in China’s acceptance of material, as well as longer term issues in recycling of glass
domestically. Addressing issues of feasibility could be done through the CDS refund
share, or through a variation to gate fees, but should be addressed only once. Note that
the largest part of viability issues for MRF reflects changes in paper markets, as this is the
largest share of MRF materials, although mixed plastics markets have also been impacted
by China’s policies. Even though not all these impacts are related to commodities eligible
for the CDS, the viability of a MRF needs to be considered in total.

www.TheCIE.com.au
2 Revenue sharing arrangements between MRFs and councils from the NSW Container Deposit Scheme
Reflecting the above, our approach to how a refund share could work is set out in chart 1.
That is a MRF would receive a refund share to enable it to remain viable and to cover its
CDS-related costs. The council would receive the remainder.
1 Components of the CDS refund share for a MRF
Data source: The CIE.
Before turning to estimated refund shares, it is clear that the revenues from the CDS will
dwarf the CDS-related costs for a MRF.
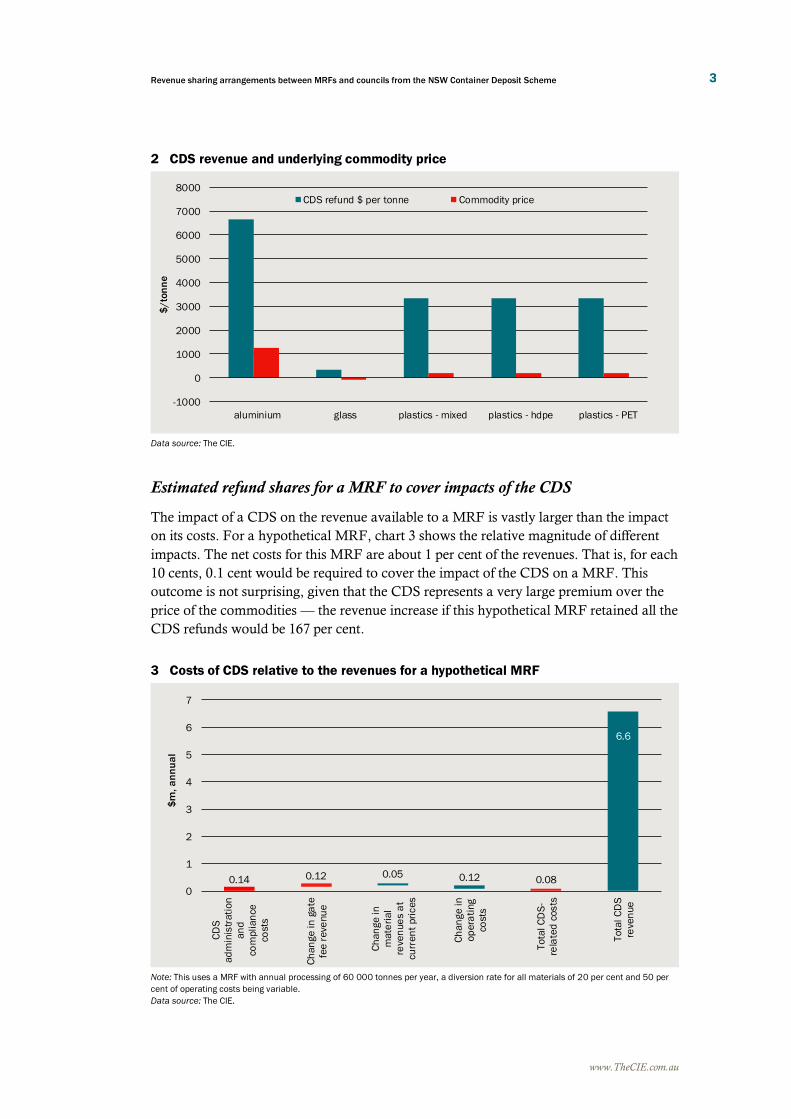
■ A comparison of CDS revenues from containers versus their value as commodities is
shown in chart 2. The CDS refund represents an enormous increase in the value of
containers. For example, aluminium has a value of over $6000 per tonne from the
CDS, compared to a value of $1250 per tonne as a commodity. The variation for
other CDS eligible commodities is similarly large.
■ A typical MRF’s material will generate CDS refunds of $150 to $200 per input tonne.
This compares to operating costs (excluding waste disposal and transport) of ~$100
per tonne. That is, the CDS revenues are very large relative to MRF costs (and their
existing revenue streams).
■ The largest part of CDS-related administration costs is paid for by Exchange for
Change, and already taken out of the refund returned to a MRF. The administration
and compliance activities left for a MRF are fairly limited.
These factors indicate that the dominant part of negotiations around CDS refunds will be
issues of viability of recycling, rather than the CDS costs box shown in chart 1 above.
MRF break-
even revenue
MRF
losses
Current
revenue
CDS
revenue MRF CDS
costs
Existing
MRF
contract
Council
CDS share
MRF CDS
share
www.TheCIE.com.au
Revenue sharing arrangements between MRFs and councils from the NSW Container Deposit Scheme 3
2 CDS revenue and underlying commodity price
Data source: The CIE.
Estimated refund shares for a MRF to cover impacts of the CDS
The impact of a CDS on the revenue available to a MRF is vastly larger than the impact
on its costs. For a hypothetical MRF, chart 3 shows the relative magnitude of different
impacts. The net costs for this MRF are about 1 per cent of the revenues. That is, for each
10 cents, 0.1 cent would be required to cover the impact of the CDS on a MRF. This
outcome is not surprising, given that the CDS represents a very large premium over the
price of the commodities — the revenue increase if this hypothetical MRF retained all the
CDS refunds would be 167 per cent.
3 Costs of CDS relative to the revenues for a hypothetical MRF
Note: This uses a MRF with annual processing of 60 000 tonnes per year, a diversion rate for all materials of 20 per cent and 50 per
cent of operating costs being variable.
Data source: The CIE.
-1000
0
1000
2000
3000
4000
5000
6000
7000
8000
aluminium glass plastics - mixed plastics - hdpe plastics - PET
$/to
nn
e
CDS refund $ per tonne Commodity price
0.14 0.12 0.05 0.12 0.08
6.6
0
1
2
3
4
5
6
7
CD
S
ad
min
istr
ati
on
an
d
com
pli
an
ce
cost
s
Ch
an
ge
in
ga
te
fee
re
ven
ue
Ch
an
ge
in
mate
ria
l
reve
nu
es
at
curr
en
t p
ric
es
Ch
an
ge
in
op
era
ting
cost
s
To
tal C
DS
-
rela
ted
co
sts
To
tal
CD
S
reve
nu
e
$m
, a
nn
ua
l

www.TheCIE.com.au
4 Revenue sharing arrangements between MRFs and councils from the NSW Container Deposit Scheme
Turning to actual MRFs, we see somewhat higher refund shares to offset the impacts of
the CDS on each MRF for which we have estimates (chart 4). This reflects the smaller
MRFs in the sample, and the fixed nature of compliance and administration costs. It also
reflects one MRF directly counting containers, which requires additional software and
capital equipment. For the median MRF, the refund share remains low at 2-3 per cent, to
offset the CDS impacts.
4 Refund shares across different MRFs to cover CDS impacts
Data source: The CIE.
■ The share of the CDS refund to compensate a MRF for the impacts of the CDS will
be less than 5 per cent for any medium to large MRFs (processing more than
50 000 tonnes per year)
■ For smaller MRFs, refund shares to cover CDS-related costs may be higher (5-10
per cent typically) and higher again where a direct method of counting containers
is used (15 per cent)
Estimated refund shares for a MRF to be viable
The viability of MRFs is a much more substantive issue than the direct CDS-related costs
that are the focus of this project. Many MRFs are not able to recover their costs at current
commodity prices. A viable industry will require additional revenue streams, either from
the CDS or from changes to gate fees. Viability is a difficult issue to measure, and will
change as commodity prices move. The extent to which recent commodity price issues
are temporary or longer lasting is not clear.
To consider MRF viability, we measure the refund share that would leave each MRF for
which we have data able to cover its operating costs should current commodity market
conditions continue.
■ If 10 per cent of CDS eligible materials are diverted from kerbside recycling, the
median MRF would be able to cover its operating costs with a refund share of 40 per
cent.
-2%
0%
2%
4%
6%
8%
10%
12%
14%
16%
18%
10% diversion rate 20% diversion rate
Sh
are
of
CD
S r
efu
nd
Revenue share to cover CDS impacts

www.TheCIE.com.au
Revenue sharing arrangements between MRFs and councils from the NSW Container Deposit Scheme 5
■ This increases to almost 50 per cent if the diversion rate of CDS is 20 per cent
■ The range amongst MRFs is large, with some MRFs viable in the sense of covering
their operating costs with shares of 10-20 per cent and others only viable with shares
of 60-70 per cent.
In the longer term, a viable MRF will need to cover more than just their operating costs,
as it will also have to cover depreciation and a return on their capital invested.
These measures of viability reflect current commodity market conditions and MRF
operating practices. MRFs will adapt to undertake further processing of materials to
increase their revenues from commodity sales, but this will also cost more. The extent to
which poor commodity market conditions will persist is not known.
The different outcomes for different MRFs reflects the choices MRFs have made about
how they process materials, the gate fees or rebates they have offered, as well as the types
of materials that they have as inputs and commodity market conditions (including
regulatory arrangements in key markets such as China).
5 Refund shares for MRF viability
Data source: The CIE.
Our recommendations regarding viability are as follows.
■ Issues around viability do not necessarily need to be addressed through the CDS,
but in our view do need to be addressed in some way by councils to ensure that
CDS (and other) material continues to be processed.
– If councils instead choose to vary the gate fee from that in the contract to
ensure viability, then the CDS share for a MRF should reflect only its CDS-
related costs. That is viability should not be addressed through both a gate fee
change and a higher share of CDS refunds than required to offset CDS-related
impacts
■ The impacts of commodity price changes on MRFs have been very different, and
viability issues are also very different.
0%
10%
20%
30%
40%
50%
60%
70%
80%
10% diversion rate 20% diversion rate
Sh
are
of
CD
S r
efu
nd
Revenue share for viability

www.TheCIE.com.au
6 Revenue sharing arrangements between MRFs and councils from the NSW Container Deposit Scheme
– A 50 per cent refund share would lead to most but not all MRFs being viable, as
well as covering their CDS-related impacts, based on current commodity prices
and information provided by MRFs
– This would be equivalent to an additional gate fee of ~$60 per tonne, which is
about the same as the decline in commodity value as measured by VISY’s
trading data, and within the estimates of price changes provided by MRFs
– The extent to which commodity price changes are temporary or permanent is
very difficult to know. A council may wish to retain the option to re-examine the
CDS refund share as market conditions change, which would bring upside and
downside risk for a council
■ Where a council bears costs related to commodity risk already, such as a risk
sharing contract, then that council should not reflect any risks it has already borne
in the CDS refund share paid to a MRF
Other issues for refund sharing
At a high level, the two paths for a refund sharing agreement are:
1 Decide on a particular refund share now, with risks that the refunds available and
costs to a MRF will be different to those expected.
2 Develop a process or protocol for determining the refund share at the end of each
quarter or year.
Reflecting the uncertainty about CDS impacts, and that these will change over time, we
recommend using a protocol rather than an upfront agreement, as long as the council has
the skills and resources to be able to verify the operation of the protocol over time. The
protocol could follow a similar approach to estimating impacts as set out in this report,
but replacing estimates with actual data wherever possible.
We also recommend that information is provided to ensure transparency of refunds.
■ Councils should have access to data on the material output shares of the MRF that
their material goes to, in order to be able to approximately verify the refund the
council should receive
■ If councils agree to a model or process for estimating refunds on an ongoing basis,
rather than a share, then the model would need to be transparent to councils and
MRFs to ensure that refunds could be verified and ideally third-party auditing
would be required for data used in the model
Other issues for ensuring viability of the sector
Recent issues for MRFs highlight the vulnerability of the existing contracting models to
commodity market conditions and overseas regulatory changes. We would expect that
MRFs will respond by repricing these risks higher in new contracts. Considering
alternatives to better manage risks, such as risk sharing, may lead to better pricing for
councils and a more sustainable sector.

www.TheCIE.com.au
Revenue sharing arrangements between MRFs and councils from the NSW Container Deposit Scheme 7
1 Introduction
The NSW Container Deposit Scheme
The NSW Container Deposit Scheme (CDS), Return and Earn, commenced on 1
December 2017. The scheme allows for containers returned to collection points to earn a
10 cent refund and for containers recycled by materials recovery facilities (MRFs) to also
receive a refund that will be shared between MRFs and local councils. The cost of the
scheme, including the refund, will be paid for at the point of first beverage supply into
NSW. This obligation could fall on a manufacturer of beverages in NSW, on any entity
within NSW that supplies into NSW or any entity outside NSW that exports to NSW
(e.g. interstate manufacturer, wholesaler or retailer).
Our understanding of how the scheme works is set out in chart 1.1. Materials Recovery
Facilities (MRFs) are referred to in Division 3 of the Waste Avoidance and Resource
Recovery Container Deposit Scheme Regulation 2016. Under the scheme there is an obligation
for the Scheme Coordinator to pay a refund to Material Recovery Facilities (MRFs). This
refund value will be based on the number of eligible beverage containers collected and
processed for recycling by the MRF operator, estimated by using a method specified in a
Processing Refund Protocol.
1.1 Overview of NSW Container Deposit Scheme
Data source: The CIE and APC.
First supply point into
NSW
Material Recovery
Facility
Wholesaler Retailer
Customer
Scheme administrator
FEE KERBSIDE
RECYCLING
REFUND
Council
Flow of money Flow of materials Container
recycled
RVM or depot

www.TheCIE.com.au
8 Revenue sharing arrangements between MRFs and councils from the NSW Container Deposit Scheme
The role of a MRF in recycling
A MRF is essentially a facility for sorting co-mingled recyclables into different types of
commodities. The commodities used are then transported for further processing or to
manufacturers for use. A schematic is shown in chart 1.2.
1.2 What a MRF does
Data source: The CIE and APC.
The financial arrangements for a MRF could include:
■ a processing agreement with a council — in this case, the council separately contracts
with a collector and a MRF. The collector does not own the material at any point
■ a contract only with a collector — in this case, the council pays a collector to pick-up
kerbside recyclables. The material is then owned by the collector and they make their
own arrangements with a MRF. In practice a collector would normally align the
contract with a MRF to the contract they have with the council, to reduce their risk.
In NSW, MRFs come in a variety of sizes, process in different ways and operate under
different business models.
■ Size — the largest MRF operating in NSW is the VISY facility at Smithfield, which
services over 30 councils (and is capable of processing more than 200 000 tonnes per
year), while small regional facilities may process less than 10 000 tonnes per year.
■ The extent to which processes are automated or manual — larger MRFs tend to use
automated processes for sorting, while smaller MRFs particularly in regional areas
tend to use hand sorting.
■ The range of materials produced — a MRF can sort to different levels of product
categories. For example, one MRF may produce a mixed plastic, while another may
MRF
PROCESSOR/
MANUFACTURER STORAGE
EXPORTED LANDFILLED
GLASS
PAPER &
CARDBOARD
PLASTICS
METALS
WASTE

www.TheCIE.com.au
Revenue sharing arrangements between MRFs and councils from the NSW Container Deposit Scheme 9
sort plastic into HDPE, PET and other plastic. Similarly, one MRF may produce a
single output of glass, while another may produce glass of different colours and
different sizes.
Refunds available to MRFs
MRFs will be able to claim a refund for containers deposited through household
collections and through other collections. There are interim arrangements in place to
ensure that councils receive some part of the refunds, prior to new contracts being
negotiated. The arrangements for different types of collections and at different time
period are as follows:
■ Containers collected from household recycling:
– for the first 12 months all refunds are collected by MRFs. MRFs may choose to
provide some of this revenue back to councils as part of a refund sharing
agreement. If no agreement is reached then this revenue is retained by a MRF
– after 12 month but before a new agreement between a MRF and council, refunds
will only be paid to a MRF if there is either a refund sharing agreement with the
council or council has notified the EPA in writing that it considers that in the
circumstances it is fair and reasonable that there is no such agreement in force
– after a new agreement between a MRF and council made after the commencement
of the CDS, any refunds will be part of the agreement.
■ Containers collected from other (commercial) recycling:
– all refunds will go to the MRFs
– whether these lead to reductions in commercial prices for material entering MRFs
(or payment for such material) will depend on the extent to which the refunds are
passed back. This in turn will reflect the amount of competition between MRFs for
commercial waste streams.
A schematic of these arrangements is shown in chart 1.3.

www.TheCIE.com.au
10 Revenue sharing arrangements between MRFs and councils from the NSW Container Deposit Scheme
1.3 Containers collected by MRFs and refunds available
Data source: The CIE and APC.
The refund for a MRF is estimated using the MRF protocol. The refund is equal to:
𝑅 = ∑ 𝑄𝑖 . 𝐶𝐹𝑖 . 𝐷
𝑖
− 𝐴
Where:
■ R is the refund to the MRF
■ 𝑄𝑖 is the tonnes of outputs of commodity i
■ 𝐶𝐹𝑖 is the container factor for commodity i. That is, the estimated number of container
per tonne of output
■ 𝐷 is the refund amount (10 cents per container), and
■ 𝐴 is the MRFs share of administrative costs.
Note that a MRF will be paid one amount by the scheme administrator for their
containers each quarter. The MRF will then have to split this amongst different councils
and non-council collections in order to apply a refund share. For example:
■ suppose a MRF had a refund sharing arrangement where the MRF kept 10 per cent
with council A and 20 per cent with council B
■ the MRF receives $100 from the scheme administrator in refunds
Household collections
council 1
Councils
$0 (FIRST YEAR) Household collections
council 2
Commercial collections
MRF REFUND OBLIGATIONS
AGREED REFUND SHARE
(AFTER 1 YEAR AND BEFORE
NEW AGREEMENT)
NEGOTIATED ARRANGEMENT
(AFTER NEW AGREEMENT)
Commercial
NEGOTIATED ARRANGEMENT
FLOW OF MONEY FLOW OF MATERIALS
Scheme Administrator
MRF

www.TheCIE.com.au
Revenue sharing arrangements between MRFs and councils from the NSW Container Deposit Scheme 11
■ the MRF has to divide up how much of this $100 is from each of its input waste
streams. However, the amount of containers in each input waste stream will not be
known
■ the share attributed to each of the input streams will influence the amount left for the
MRF — for example in table 1.4, the MRF receives $32 under one allocation of
containers across inputs and $42 under a different allocation
1.4 Share of contained from each source and revenue for MRFs
Refund share
to MRF
Scenario 1 Scenario 2
Share of
materials
Refund to be
paid by MRF
Share of
materials
Refund to be
paid by MRF
Per cent Per cent $ Per cent $
Council A 10 40 4 20 2
Council B 20 40 8 50 10
Commercial 100 20 20 30 30
Revenue to MRF from
$100 refund
32 42
Source: The CIE and APC.
The MRF can only claim a refund where material has been recycled and not landfilled.
In particular the regulations state:
A processing refund is not payable in respect of any container that has not been:
(a) recycled by the claimant, or
(b) delivered to a recycling facility in Australia or consigned for transport to a recycling facility
in a foreign country.1
And
A material recovery facility operator must not permit any container in respect of which the
operator has made a claim for the payment of a processing refund to be disposed of to landfill.2
Note that the regulations appear to allow for refunds of material that is stored, as long as it is
stored at a recycling facility. The definition of recycled by a claimant may need clarification — for
example, if a claimant turned glass into glass sand, but had no purchasers of this glass sand then it
is not clear if this would count as being recycled.
This project
The purpose of this project is to understand how refunds from containers collected at a
MRF should be divided between MRFs and councils. This will inform the refund sharing
agreements negotiated by councils and MRFs. To inform this, the project measures the
1 Waste Avoidance and Resource Recovery (Container Deposit Scheme) Regulation 2017,
section 19.
2 Waste Avoidance and Resource Recovery (Container Deposit Scheme) Regulation 2017,
section 20.

www.TheCIE.com.au
12 Revenue sharing arrangements between MRFs and councils from the NSW Container Deposit Scheme
share of refunds that would leave a MRF indifferent between its current position and its
position with the CDS. This is called the ‘profit-neutral refund share’. It also sets out
broader issues around viability of processing of kerbside recycling.
The method for measuring the profit neutral refund share is set out in later sections of
this report.
The CIE and APC would like to thank NSW MRFs and the Waste Contractors and
Recycling Association (WCRA) for their invaluable assistance during the project.

www.TheCIE.com.au
Revenue sharing arrangements between MRFs and councils from the NSW Container Deposit Scheme 13
2 Framework for evaluating impacts
Objectives for sharing of refunds
The NSW Container Deposit Scheme aims to provide a financial incentive for resource
recovery and litter reduction , by placing a 10 cent refund on each eligible container
returned to a collection point. Purchasers of eligible beverages will end up paying the
amount required to fund this refund and administration costs when they purchase a
beverage. They, or whoever else returns the container then earns the refund.
To encourage higher levels of recovery and litter reduction requires that those making
decisions to recover containers receive the refund. This is straightforward for containers
deposited directly at container collection depots or reverse vending machines. However,
for kerbside collection this is a more complex issue. The person depositing their container
in a kerbside recycling bin will not directly receive revenue from the refund. They may
indirectly receive a financial benefit if revenue is received by councils and flows back in
the form of lower waste charges or better community services. Additional revenue from
kerbside recyclables may also encourage councils to change their waste management
strategies to increase the recycling of containers. This is muted to some extent because
the number of containers per tonne of outputs is based on a state-wide average figure,
rather than specific to a MRF or council area.
A MRF is responsible for sorting mixed recyclables into different components for sale.
This can be done in different ways, such as manual or using machines or a combination,
and with different levels of sorting, such as sorting into mixed plastics, or further sorting
into specific types of plastics. Revenue from the CDS refunds may marginally change the
incentives for MRFs if different output streams have different amounts of containers
however, what governs the separation is the end markets for the material. To attract the
refund the material must be able to be recycled.
The incentive impacts of different mechanisms for sharing of refunds are likely to be
minimal, and do not provide any clear direction on the rationale for refund sharing.
A more useful viewpoint is to consider how a competitive market would allocate the
CDS refunds. Suppose that a number of potential MRFs bid for a council contract
without the CDS. Their bids reflect the revenues that they consider sufficient to pay the
costs of operating a MRF and the risks associated with this. Now consider how these bids
would change as a result of the CDS:
■ the MRF would account for any of the costs and revenues associated with the CDS
■ this would be reflected in a bid that continued to leave the MRF with revenue that
that they consider sufficient to pay the costs of operating the MRF and the risks
associated with this.

www.TheCIE.com.au
14 Revenue sharing arrangements between MRFs and councils from the NSW Container Deposit Scheme
That is, other conditions equal, at the point when contracts are renegotiated, MRFs
would be expected to bid to a point where they could cover the costs and risks associated
with the CDS, and no more.
■ The starting point is to estimate the share of the CDS refund that would lead to the
same profit for a MRF as if the CDS had not occurred
One alternative viewpoint that has been put forward in discussions with MRFs is that
MRFs have borne the commodity risks on the downside and that the CDS is equivalent
to a commodity risk on the upside. While the CDS is an upside risk, it is not a
commodity price issue, but a regulatory issue. However, this view can be used to extend
the consideration of how a re-contracting arrangement if undertaken now would work.
3 As above, a MRF would account for the CDS refunds and the CDS-related costs in
their bids for a contract
4 They would also revise their expectations of commodity prices, given issues related to
the China National Sword and difficulties in finding markets for glass. These issues
are discussed in detail in chapter 4.
This would broaden the refund share to MRFs to cover MRF losses from commodity
market conditions and MRF CDS-related costs, as shown in chart 2.1. As part of the
report we provide advice on the MRF losses and MRF CDS costs — it is up to individual
council negotiations as to how much a council wishes to include MRF losses. Note that
including a refund share for a MRF related to MRF losses is only relevant if this has not
been addressed elsewhere, such as through a gate fee variation.
2.1 Components of the CDS refund share for a MR
Data source: The CIE.
MRF break-
even revenue
MRF
losses
Current
revenue
CDS
revenue MRF CDS
costs
Existing
MRF
contract
Council
CDS share
MRF CDS
share

www.TheCIE.com.au
Revenue sharing arrangements between MRFs and councils from the NSW Container Deposit Scheme 15
Note that it could be anticipated that a MRF would consider a refund share that left them
with no gain as ‘unfair’.3 In this case, they may not take part in the refund sharing
agreement, meaning that no refunds would be available for material collected at the
kerbside. Where the MRF is likely to have a long term interest in goodwill from the
council then issues of fairness will be less important, and it is unlikely a MRF would not
make a refund sharing agreement. However, it should also be recognized that the
negotiating position in which MRFs and councils are placed is highly artificial and will
tend to push towards outcomes where fairness is important for resolution.
Commercial waste
Some MRFs receive commercial waste that will include containers eligible for the CDS.
Examples are collections from the hospitality sector including hotels, restaurants and
cafes.
If there is a competitive MRF sector, then over time the refunds available from these
collections will be passed through as lower waste charges for businesses. This process
may take some time, and while it occurs, MRFs are likely to gain a revenue increase
from container refund revenue.
Types of impacts of the CDS on a MRF
The impacts on MRFs of the CDS include:
■ direct administration and compliance costs
■ a change in the volume of materials processed, and particularly higher value
materials, as some containers are diverted from kerbside recycling to collection points.
This:
– reduces the gate fees that a MRF collects
– reduces the variable costs for MRFs to process material
– reduces the materials available for MRFs to sell (in some cases materials are sold
at a negative price)
■ a potential change in the markets available for MRFs to sell into. For example, higher
quality glass collected through the CDS collection points may substitute for lower
quality glass collected by MRFs
■ an increase in revenue because of revenue available from container refunds.
3 For example, see the Ultimatum Game experiment in economics. In this game, the first player
(the proposer) conditionally receives a sum of money and proposes how to divide the sum
between the proposer and the other player. The second player (the responder) chooses to either
accept or reject this proposal. If the responder accepts then both receive the designated shares.
If the responder does not accept then no-one receives anything. Even with substantial shares
offered, a responder will often object to shares less than 50 per cent on the basis of fairness.

www.TheCIE.com.au
16 Revenue sharing arrangements between MRFs and councils from the NSW Container Deposit Scheme
MRF financial model
To estimate the impacts on MRFs and the revenue share between councils and MRFs,
we have developed a MRF financial model. This traces the costs and revenues available
to MRFs over the economic life of a MRF and on an annual basis. A MRFs costs and
revenues comprise three main components:
■ revenue from a gate fee paid by waste on being delivered to the facility — not that
depending on commodity prices, this fee could be zero or waste could also be paid to
be dropped at the facility
■ costs associated with the facility, including capital and operating costs
■ revenues and costs from the disposal of material — this will be positive for most
commodities and negative for residual waste that has to go to landfill. In some cases,
there may also be a cost to dispose of other commodities such as glass.
A schematic of the costs and revenues is shown in chart 2.2, with red items being costs
for a MRF and black being revenues for a MRF.
2.2 Revenues and costs of a MRF
Data source: The CIE and APC.
The impacts of the CDS can be traced through these channels. This is done
mathematically in Appendix A. In terms of the revenue and cost types above:
■ if the CDS reduces the volume of materials going to kerbside recycling then this
would:
– reduce revenue from gate fees
– reduce revenues and costs from the sale/disposal of commodities
MRF
GLASS PAPER &
CARDBOARD PLASTICS METALS
WASTE
$X/ TONNE
COST OF
OPERATING
$X/INPUT TONNE
COST OF LAND AND
CAPITAL
$X/TONNE OF
ANNUAL CAPACITY GATE FEE
$X/TONNE
$X/TONNE
$X/
TONNE
$X/
TONNE
$X/
TONNE

www.TheCIE.com.au
Revenue sharing arrangements between MRFs and councils from the NSW Container Deposit Scheme 17
– reduce operating costs to the extent that these vary with the amount of tonnes
processed
■ in addition, the CDS adds a new revenue stream from CDS refunds.
Process for gathering information
To develop the data for the MRF financial model we have:
■ reviewed public reports on commodity prices and operating costs
■ used data on Australian exports to provide commodity export prices
■ used data provided by NSW EPA on material volumes through MRFs
■ undertaken a consultation process with MRFs, including:
– a workshop run by the Waste Contractors and Recyclers Association (WCRA)
– one-on-one consultations with five MRFs, and subsequent liaison about costs and
revenues.
Note that we have not reviewed audited financial information from the MRFs.
To report results we use ranges from consultations and do not report any information
provided by MRFs as commercial-in-confidence.
www.TheCIE.com.au
18 Revenue sharing arrangements between MRFs and councils from the NSW Container Deposit Scheme
3 Impacts of the CDS on a MRF
The CDS has four types of impacts on a MRF.
1 The CDS leads to compliance and administration costs
2 The CDS may change the material volume and composition that a MRF receives.
This changes both costs and revenues
3 The CDS may change the markets available to MRFs, such as the glass market
4 The CDS generates revenues through eligible containers that remain in kerbside
recycling.
This chapter discusses these impacts and the types of magnitudes.
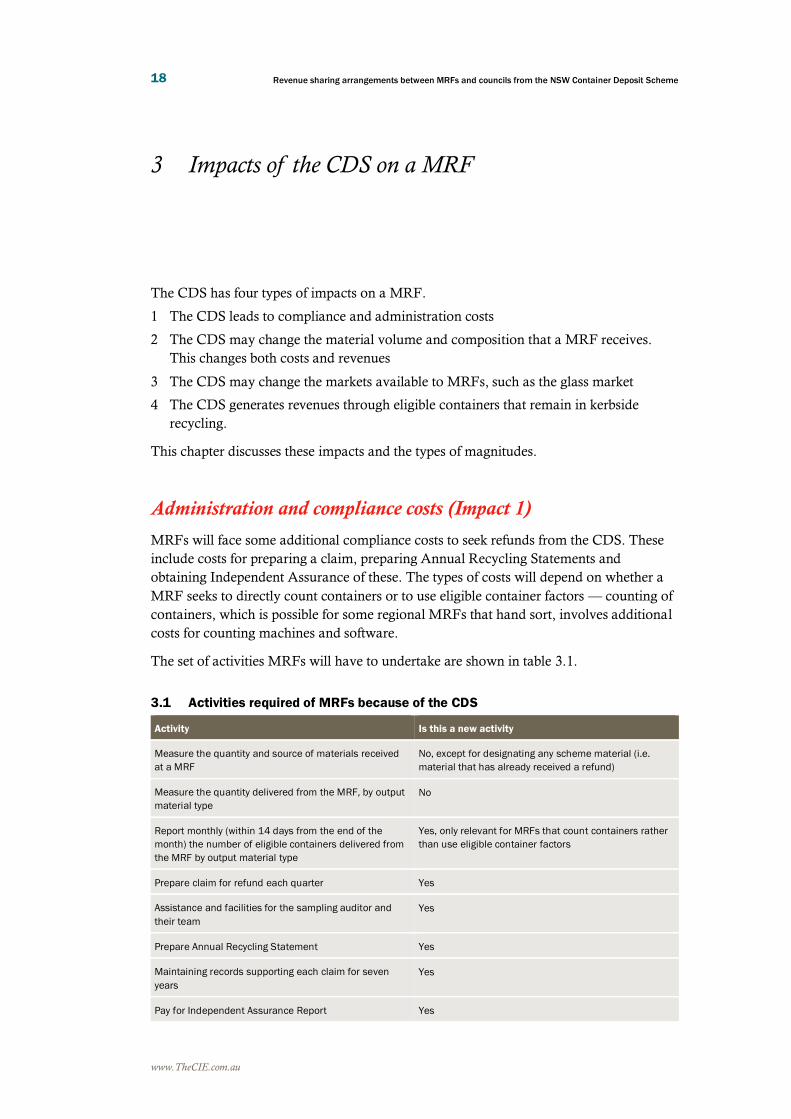
Administration and compliance costs (Impact 1)
MRFs will face some additional compliance costs to seek refunds from the CDS. These
include costs for preparing a claim, preparing Annual Recycling Statements and
obtaining Independent Assurance of these. The types of costs will depend on whether a
MRF seeks to directly count containers or to use eligible container factors — counting of
containers, which is possible for some regional MRFs that hand sort, involves additional
costs for counting machines and software.
The set of activities MRFs will have to undertake are shown in table 3.1.
3.1 Activities required of MRFs because of the CDS
Activity Is this a new activity
Measure the quantity and source of materials received
at a MRF
No, except for designating any scheme material (i.e.
material that has already received a refund)
Measure the quantity delivered from the MRF, by output
material type
No
Report monthly (within 14 days from the end of the
month) the number of eligible containers delivered from
the MRF by output material type
Yes, only relevant for MRFs that count containers rather
than use eligible container factors
Prepare claim for refund each quarter Yes
Assistance and facilities for the sampling auditor and
their team
Yes
Prepare Annual Recycling Statement Yes
Maintaining records supporting each claim for seven
years
Yes
Pay for Independent Assurance Report Yes
www.TheCIE.com.au
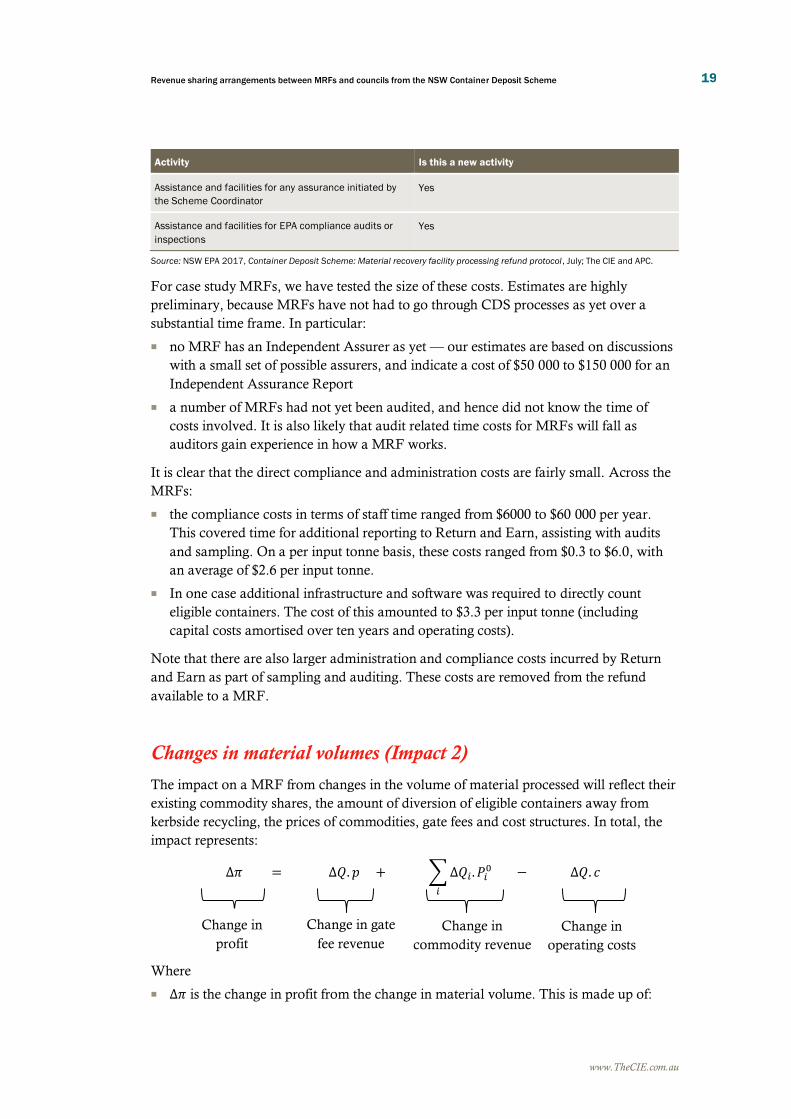
Revenue sharing arrangements between MRFs and councils from the NSW Container Deposit Scheme 19
Activity Is this a new activity
Assistance and facilities for any assurance initiated by
the Scheme Coordinator
Yes
Assistance and facilities for EPA compliance audits or
inspections
Yes
Source: NSW EPA 2017, Container Deposit Scheme: Material recovery facility processing refund protocol , July; The CIE and APC.
For case study MRFs, we have tested the size of these costs. Estimates are highly
preliminary, because MRFs have not had to go through CDS processes as yet over a
substantial time frame. In particular:
■ no MRF has an Independent Assurer as yet — our estimates are based on discussions
with a small set of possible assurers, and indicate a cost of $50 000 to $150 000 for an
Independent Assurance Report
■ a number of MRFs had not yet been audited, and hence did not know the time of
costs involved. It is also likely that audit related time costs for MRFs will fall as
auditors gain experience in how a MRF works.
It is clear that the direct compliance and administration costs are fairly small. Across the
MRFs:
■ the compliance costs in terms of staff time ranged from $6000 to $60 000 per year.
This covered time for additional reporting to Return and Earn, assisting with audits
and sampling. On a per input tonne basis, these costs ranged from $0.3 to $6.0, with
an average of $2.6 per input tonne.
■ In one case additional infrastructure and software was required to directly count
eligible containers. The cost of this amounted to $3.3 per input tonne (including
capital costs amortised over ten years and operating costs).
Note that there are also larger administration and compliance costs incurred by Return
and Earn as part of sampling and auditing. These costs are removed from the refund
available to a MRF.
Changes in material volumes (Impact 2)
The impact on a MRF from changes in the volume of material processed will reflect their
existing commodity shares, the amount of diversion of eligible containers away from
kerbside recycling, the prices of commodities, gate fees and cost structures. In total, the
impact represents:
∆𝜋 = ∆𝑄. 𝑝 + ∑ ∆𝑄𝑖 . 𝑃𝑖0
𝑖
− ∆𝑄. 𝑐
Where
■ ∆𝜋 is the change in profit from the change in material volume. This is made up of:
Change in
commodity revenue
Change in gate
fee revenue
Change in
profit
Change in
operating costs

www.TheCIE.com.au
20 Revenue sharing arrangements between MRFs and councils from the NSW Container Deposit Scheme
– A change in gate fee (∆𝑄. 𝑝), which equals the change in total input tonnes into the
MRF multipled by the gate fee (𝑝) , which could be positive or negative — a
positive gate fee means the council pays a MRF for taking material and a negative
gate fee means a council receives a rebate
– A change in revenue from the sale of commodities (∑ ∆𝑄𝑖 . 𝑃𝑖0
𝑖 ), which is the sum
over each commodity i, of the change in the tonnes of output of the commodity
(∆𝑄𝑖) mutleiplied by the price of the commodity in the absence of the CDS (𝑃𝑖0)
– A change in costs (−∆𝑄. 𝑐), which equals the change in the tonnes of product input
multiplied by the variable cost of processing each input tonne (c).
The components required to estimate these changes are set out below.
Material in kerbside recycling
There are a range of estimates about the material shares in kerbside recycling bins. These
include audits of bins, which are based on looking at inputs, and MRF reporting to EPA
and for consultations for this project. Paper and cardboard and glass are the two largest
material components for a MRF from all sources, although the ranges for importance
vary. The most critical commodities from a CDS perspective are plastic, aluminium and
glass. Aluminium is less than 1 per cent for all data sources (generally about 0.7 per cent),
plastic ranges from 6-8 per cent and glass from 26-40 per cent.
For scenarios, we use data from consultations with MRFs.
3.2 Material shares from kerbside recycling
Material 2011 kerbside
audits a
Average of
APC estimates
from various
audits
MRA 2012 b MRF data
collected by
EPA
MRF
consultations
Per cent Per cent Per cent Per cent Per cent
Paper and cardboard 55 41 59 43 47
Glass 30 35 26 40 34
Plastics 8 6 7 7 6
Other metals 2 2 2 3 2
Aluminium 1 1 1 1 1
Other 4 13 5 6 10
Total 100 100 100 100 100
a NSW EPA 2014, Domestic kerbside waste and recycling in NSW: Results of the 2011 waste audits, June. b Mike Ritchie and
Associates 2012, The impacts (costs/benefits) of the introduction of a container deposit/refund system (CDS) on kerbside recycling
and councils, prepared for the Local Government and Shires Associations of NSW.
Source: As noted above.
Diversion rates from households
The refund revenue available from the CDS to MRFS will depend on how many
containers continue to go through MRFs rather than being deposited directly at container
collection points. There is no clear idea of the extent to which this diversion might occur.

www.TheCIE.com.au
Revenue sharing arrangements between MRFs and councils from the NSW Container Deposit Scheme 21
A range of estimates are shown in table 3.3, which range from close to zero to almost all
material.
Our expectation is that the diversion from kerbside will be substantially less than the
numbers reported in South Australia, because of the maturity of the SA scheme, large
number of collection points in SA, higher share of households with space to store
material and less time consuming transport task. The diversion rate will be likely to
change in NSW over time, as expected in the consultation RIS. They will also be
different for different MRFs, although this will not be taken into account in refund
calculations because there will be one container factor for each output material across the
whole of NSW.
The first data on the amount of containers that are continuing to go through the MRFs
should be available after the first quarter of claims by MRFs and sampling by the NSW
EPA (i.e. sometime in March). However, given that the diversion rate will change over
time, to the extent that it changes the share of revenue a MRF should receive, this should
be calculated after data is available each quarter.
■ The refund share should reflect actual data on the diversion of CDS material away
from MRFs in NSW, as measured by the eligible container factors and composition
of MRF outputs
3.3 Estimates of diversion from kerbside recycling
Study Diversion of containers from kerbside
Per cent
CDS Consultation RIS 2017 a 5-40
MRA 2012 b 82
Harrison 2012 c 82
Container deposits to date in NSW (December 2018) d ~10
a NSW EPA 2017, NSW Container Deposit Scheme: Consultation Regulation Impact Statement, May, p. 45. b Mike Ritchie and
Associates 2012, The impacts (costs/benefits) of the introduction of a container deposit/refund system (CDS) on kerbside recycling
and councils, prepared for the Local Government and Shires Associations of NSW. Note that this appears to be based on SA scheme.
c Harrison Research 2012, CDL awareness and support research project, prepared for SA EPA and Zero Waste SA, September. (Note
CIE calculations based on Q6. d This is the share of the overall container market that is going through the CDS to date. This could
differ from the diversion rate depending on whether containers are more or less likely to be coming from kerbside than other channels
(litter, commercial/non-home consumption). This is also increasing rapidly.
Source: As noted above.
We have also considered the international evidence. While this indicates that kerbside
recycling and container deposit schemes are likely to cannibalise each other to some
extent, it does not indicate diversion rates.4
For scenarios, we show the sensitivity of results to a wide range of diversion scenarios.
4 See Viscusi, K. J. Huber and J. Bell 2012, “Alternative policies to increase recycling of plastic
water bottles in the United States”, Review of Environmental Economics and Policy, volume 6,
issue 2, summer 2012, pp. 190–211; Beatty, T., P. Berck, and J. Shimshack. 2007, “Curbside
recycling in the presence of alternatives”, Economic Inquiry, Volume 45 No. 4, pp. 739–55.

www.TheCIE.com.au
22 Revenue sharing arrangements between MRFs and councils from the NSW Container Deposit Scheme
MRF costs and cost structures
MRFs will have different costs and cost structures reflecting:
■ their size — there are likely to be economies of scale in operating a MRF
■ the sorting technologies that are employed — MRFs that use more manual sorting
will have higher operating costs but lower capital costs, while MRFS that use more
automated sorting will have lower operating costs but higher capital costs
■ their labour force — wages will differ for regional and Sydney MRFs. Some regional
MRFs operate as disability work providers, which impacts on wage costs.
If a MRF has costs that are largely fixed, then having less material to be processed would
not reduce its costs. However, if a MRFs costs are variable (that is, change with the
volume of material processed), then diversion of kerbside recycling would reduce a
MRFs costs.
We do not have good information about the extent to which a MRF’s operating costs are
likely to vary if material is removed from kerbside recycling.
■ Across MRFs, MRFs that are larger have larger costs — this indicates that in general,
the costs of operating a MRF vary according to its size
■ MRF contracts are structured in a way that indicates that costs are mainly variable —
that is, gate fees are per input tonne, so when input tonnes go up the amount paid by a
council will increase. Such a structure is consistent with costs largely being variable.
■ A number of MRFs indicated that the amount of paper is what drives their costs, as
the processes are operated to the point at which a paper stream of sufficiently high
quality is extracted. In this case, there would be no reduction in costs from having less
glass, aluminium or plastic in the system.
■ Even MRFs that mainly used manual sorting indicated their costs are fixed — this is
highly unlikely.
For running scenarios, we allow for operating costs of $100 per tonne (excluding costs of
disposal of residual waste and transport) and assume that 50 per cent of these operating
costs are fixed and 50 per cent are variable. Note that this assumption does not make
substantial differences to the estimated CDS share for a MRF.
Changes in gate fees
The gate fee paid by NSW councils varies, with some councils receiving a rebate (a
negative gate fee) and others paying a gate fee. For the purposes of scenarios we use a
gate fee of $50 per tonne for kerbside and $70 per tonne for commercial. This will be at
the high end for metropolitan areas but at the low end for regional areas.
Changes in commodity revenues
The change in commodity revenue will reflect the amount of diversion of different
commodities and the price attached to a commodity.

www.TheCIE.com.au
Revenue sharing arrangements between MRFs and councils from the NSW Container Deposit Scheme 23
■ For aluminium and plastic, prices are positive, so material removed by the CDS leads
to lost revenue for a MRF
■ For glass, the price is negative. The more material removed from kerbside recycling
the better from the perspective of a MRF.
The commodity prices used for scenarios are shown in table 3.4. These represent a typical
price received currently. Note that the prices received for materials are very different
across MRFs depending on the quality of material that they are providing and their
location.
3.4 Commodity prices used for scenarios
Used
$/tonne
Paper and cardboard 50
Aluminium 1250
Other metals 100
Glass -75
Plastics - average 200
Source: The CIE and APC.
A detailed discussion about commodity price is set out in chapter 4.
Impact on market prices received by MRFs (Impact 3)
Potentially, the average price received for commodities from MRFs could change as a
result of the CDS. This could be because:
■ within a commodity type, the containers may be cleaner than non-container material.
This could mean the output material with the CDS has a lower quality and a lower
value
■ the CDS provides a cleaner stream of materials to manufacturers than comes from a
MRF, which then leads to manufacturers not requiring material from MRFs.
– the extent to which this occurs will depend on the depth of the market
– for most commodities, notably aluminium and plastic, the market for material is
sufficiently global that a change in NSW flows can be safely presumed to have no
impact on market prices
– the exception is glass, where CDS glass could conceivable reduce the demand for
non-CDS glass and lead to lower glass outputs for those MRFs that continue to
send glass to Glass Recovery Service (GRS) and then onto Owens-Illinois, a bottle
manufacturer.
For most MRFs in NSW, glass is turned into products such as glass sand. For a small
number of MRFs, material goes to GRS and then onto Owens-Illinois to be used in bottle
manufacturing. CDS glass would be preferable for bottle manufacturers as it is cleaner.
However, relevant MRFs have contracts in place.

www.TheCIE.com.au
24 Revenue sharing arrangements between MRFs and councils from the NSW Container Deposit Scheme
The average cost of disposing of glass to GRS versus recovering into glass sand is $60 and
$80 respectively.5 The costs for GRS are the transport costs to deliver glass to GRS ($40
per tonne (and the gate fee paid ($20/tonne). For glass sand, the costs represent
additional processing costs to crush glass, with a negligible price received for the product.
A change in the ability to access a glass recovery market could therefore lead to a cost of
$20 per tonne of glass produced or less than $10 per input tonne into a MRF.
If the market for glass sand cannot accommodate more product, then issues will arise as
have already occurred for other MRFs, with glass being stored interstate in lieu of finding
a local market for its use. This is a more costly option.
Note that these issues may well have occurred without a CDS, at the point at which
contracts for glass recovery reached their end point. Discussions with industry suggest
that higher quality standards would be likely at this stage regardless of whether or not the
CDS is in place. Given this, we show the impact of a change in the glass market because
of the CDS as a sensitivity.
CDS revenues (Impact 4)
The revenue available from CDS refunds dwarfs the underlying price of the commodities
(chart 3.5).
For example, an empty aluminium can weighs around 15 grams. This means that there
are 67 000 aluminium cans in a tonne of eligible CDS material. This would provide
revenue of $6700 through the CDS. In comparison, the price of aluminium received by
MRFs is ~$1250 per tonne.
For other materials the differences are even starker.
3.5 CDS revenue and underlying commodity price
Data source: The CIE.
5 The CIE 2017, NSW glass recycling: Issues and options, prepared for NSW EPA.
-1000
0
1000
2000
3000
4000
5000
6000
7000
8000
aluminium glass plastics - mixed plastics - hdpe plastics - PET
$/to
nn
e
CDS refund $ per tonne Commodity price

www.TheCIE.com.au
Revenue sharing arrangements between MRFs and councils from the NSW Container Deposit Scheme 25
Because the revenue impacts from the CDS are so large, this dwarfs any other cost
implications arising from the CDS.
Using estimates of the material tonnes from MRFS from NSW EPA and estimates of the
eligible containers per tonne, we expect that total revenue for MRFs to be in the order of
$100 million in the first year. Note that this is considerably lower than expected in Return
and Earn assumptions, which assume $47 million from kerbside recycling in the first
three months of the scheme.6 These estimates are before estimating the amount of
material that could divert away from kerbside recycling and go directly into the CDS.
In terms of the revenue per input tonne, we anticipate that the number of eligible
containers per tonne of inputs into the MRF will be at least 1500 to 2000, implying an
available refund of $150 to $200 per input tonne. That is, for a council that has 20 000
tonnes of kerbside recycling in a year, the amount of CDS refund available would be $3-4
million per year.
The basis of revenue estimates for the CDS are shown in table 3.6. This builds up
revenue from the weight of containers and the amount of material that is eligible. Note
that we have also checked this against preliminary information on auditing (shown in
column E). The estimates below are before diversion of material away from kerbside.
This reduces the number of tonnes per tonne of material from the figures shown below.
3.6 Estimating CDS refunds, before diversion away from kerbside systems
Commodity Average
weight of a
container
(A)
Number of
containers
in a tonne
of eligible
material (B)
Amount of
material
that is
eligible
(before
diversion)
(C)
Number of
containers
per tonne of
material (D)
Check against
approximate
eligible
container
factors (E)
Share of
input
tonnes (F)
Number of
containers
per tonne of
inputs (G)
Grams No./tonne of
eligible
materials
Per cent No./tonne of
material
outputs
No./tonne of
material
outputs
Per cent No./tonne of
inputs
Paper and
cardboard
na na 0 0 0 47.4 0
Aluminium 15 66 667 90 60 000 60 000 0.7 392
Other metals na na 0 0 0 2.3 0
Glass 300 3 333 60 2 000 2 000 33.8 676
Plastics
Mixed 30 33 333 25 8 333 8 000 6.1 508
HDPE 30 33 333 2 667 600 0.0 0
PET 30 33 333 65 21 667 20 000 0.0 0
Residual 200 5 000 0 0 0 9.7 0
Total
1 576
Note: Mixed is for plastic where HDPE and PET have not been removed as yet. Column B = 1000000/Column A. Column D = Column
B* Column C. Colum G = Column D * Column F.
Source: The CIE and APC.
6 Return and Earn 2017, Return and Earn publishes estimated costs for beverage suppliers in NSW, 18
August.

www.TheCIE.com.au
26 Revenue sharing arrangements between MRFs and councils from the NSW Container Deposit Scheme
The two main risks to CDS revenue going through a MRF are:
1 the diversion of material away from kerbside systems. This is likely to be radically
different for different council areas, reflecting socio-economic conditions. As noted in
table 3.3, estimates vary widely
2 that material cannot be recycled within 12 months and hence a CDS refund cannot be
claimed. This is not relevant for aluminium, for which there is a market. We do not
think it will be relevant for plastic containers, although there may be some short term
issues in plastic markets. This could be relevant for glass. The extent to which this risk
eventuates will depend on how the custody of material is enforced. Material will be
sold or moved to another location from a MRF, but whether it is recycled within 12
months will be difficult to verify.
Commercial collections
Commercial collections will be subject to their own competitive pressures, and it would
be expected that the value of containers will, over time, be passed back through lower
gate fees. However, this is unlikely to occur in the immediate future because of
commodity market conditions.
The model developed allows for the inclusion of refunds from commercial collections.
However, we do not focus on this, as it is not of direct relevance to the council refund
sharing.

www.TheCIE.com.au
Revenue sharing arrangements between MRFs and councils from the NSW Container Deposit Scheme 27
4 MRF viability and commodity markets
A profit neutral sharing of refunds from the CDS would leave any MRF that is in a poor
financial position in the same poor financial position. We do not think that negotiations
around the CDS will proceed smoothly without directly addressing the issue of viability
of recycling. This is because:
1 The recycling of containers is required in order to be able to collect a refund, and a
MRF that is not viable will stop accepting kerbside recycling for processing at some
point
2 MRFs perceive the CDS as an upside to offset against the current downsides
impacting on the industry.
Specific issues that have impacted on viability include:
■ declining prices for glass and a lack of options for recycling of glass
■ limitation of waste imports by China, covering all types of waste plastics and unsorted
waste paper7, which was initially scheduled to be put in place on 1 September 2017
but appears to have been put in place as at the start of 2018.
This chapter examines the issues in the recycling markets and provides a guide as to the
magnitude of these impacts.
Markets for recycled materials
MRFs operate in world markets for some commodities, in local markets for others and in
some cases in a combination of both.
Glass markets are local, as glass has a low value and is heavy, it is not typically exported
although it can be exported interstate for manufacturing.
Paper and cardboard have both domestic and overseas markets. VISY is a major user of
MRF paper, with its Smithfield MRF directly feeding into its paper facility at the same
location. Orora also purchases a small amount of material such as cardboard from MRFs
and direct from source separated paper only kerbside collections.
Plastics is more likely to be exported, although VISY also operates a NSW PET
manufacturing facility that uses material from MRFs.
The market for metals is similar to plastic. Our understanding is that aluminium is
generally exported.
7 World Trade Organisation 2017, Notification 17-3880: Committee on Technical Barriers to Trade, 18
July 2017.

www.TheCIE.com.au
28 Revenue sharing arrangements between MRFs and councils from the NSW Container Deposit Scheme
To give a sense of the amount of commodities, chart 4.1 shows the paper and plastic
production of NSW MRFs versus the exports of mixed paper and plastic and other paper
and plastic waste. Note that NSW waste does not all go through MRFs.
■ Some councils operate a separate paper collection system. For these councils, paper
collected will go directly to paper manufacturers rather than to a MRF.
■ Paper and cardboard commercial collections will not go through a MRF.
Nevertheless, the extent of exports from NSW indicates that Australia is connected to
other international markets for paper and plastics.
4.1 MRF outputs and NSW exports of plastic and paper waste
Note: For year to October 2017.
Data source: NSW EPA, Global Trade Intelligence Service.
Export markets for paper and plastic
There have been substantial changes to waste exports from NSW over the last year as
China’s National Sword has been announced (chart 4.2). Exports to China and Hong
Kong have fallen from as much as 70 per cent of NSW exports to ~20 per cent by
December 2017. The falling share of exports to China and Hong Kong have not been
reflected as much in falling overall export values. Waste paper exports have remained at
$3-4 million per month, but have fallen substantially in January 2018. Plastic exports
have gradually fallen in value over the past two years from ~$2 million per month to ~$1
million per month (chart 4.3).
0
50 000
100 000
150 000
200 000
250 000
300 000
MRF output Exports MRF output Exports
PAPER - Paper or cardboard PL - Plastic
To
nn
es
(ye
ar
to O
cto
be
r 2
01
7)
MRF output Exports - other Exports - mixed

www.TheCIE.com.au
Revenue sharing arrangements between MRFs and councils from the NSW Container Deposit Scheme 29
4.2 NSW waste exports to China and Hong Kong
Data source: ABS Stat, downloaded 9 February 2018.
4.3 NSW waste exports, total value
Data source: ABS Stat, downloaded 9 February 2018.
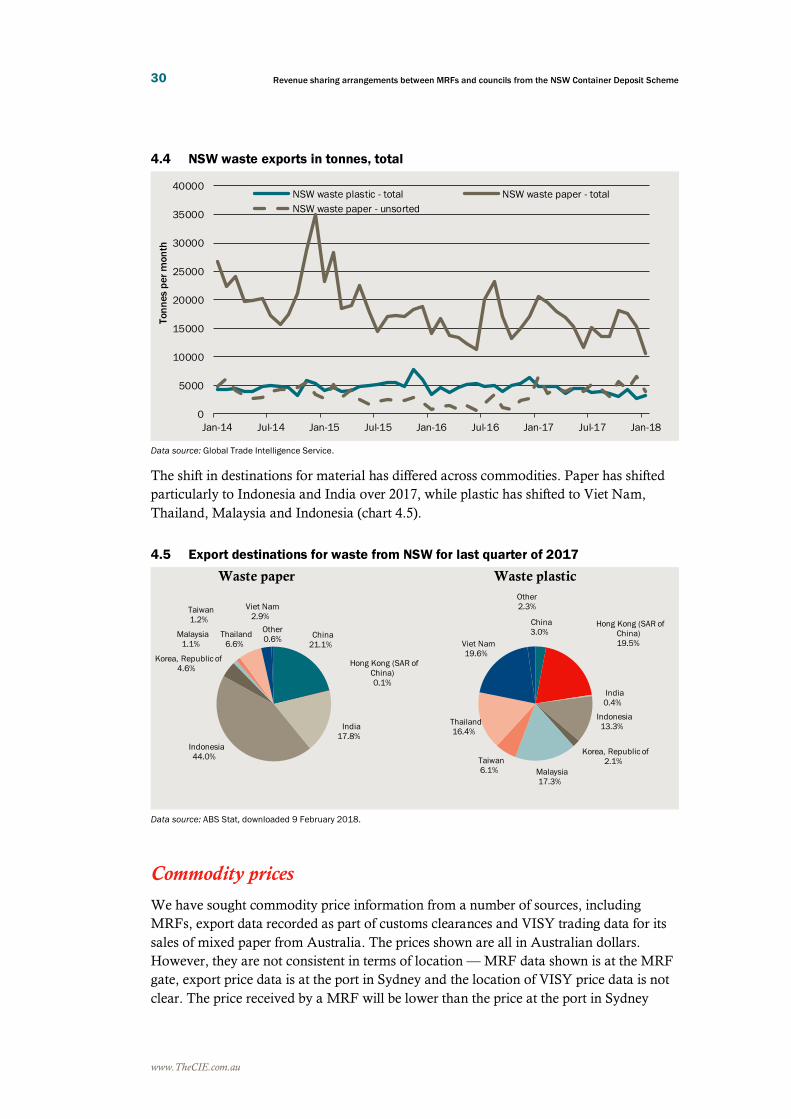
In terms of quantities, total NSW waste paper exports have fallen from the start of 2014,
although mixed paper exports have not. Plastic exports have fallen materially in terms of
tonnes (chart 4.4).
0%
10%
20%
30%
40%
50%
60%
70%
80%
90%
100%
Jan
-20
13
Jul-2
01
3
Jan
-20
14
Jul-2
01
4
Jan
-20
15
Jul-2
01
5
Jan
-20
16
Jul-2
01
6
Jan
-20
17
Jul-2
01
7
Sh
are
of
exp
ort
s
Pulp and waste paper Waste, parings and scrap of plastics
0
1
2
3
4
5
6
7
Jan-14 Jul-14 Jan-15 Jul-15 Jan-16 Jul-16 Jan-17 Jul-17 Jan-18
Va
lue
of
exp
ort
s ($
m/
mo
nth
)
NSW waste paper NSW waste plastic
www.TheCIE.com.au
30 Revenue sharing arrangements between MRFs and councils from the NSW Container Deposit Scheme
4.4 NSW waste exports in tonnes, total
Data source: Global Trade Intelligence Service.
The shift in destinations for material has differed across commodities. Paper has shifted
particularly to Indonesia and India over 2017, while plastic has shifted to Viet Nam,
Thailand, Malaysia and Indonesia (chart 4.5).
4.5 Export destinations for waste from NSW for last quarter of 2017
Waste paper Waste plastic
Data source: ABS Stat, downloaded 9 February 2018.
Commodity prices
We have sought commodity price information from a number of sources, including
MRFs, export data recorded as part of customs clearances and VISY trading data for its
sales of mixed paper from Australia. The prices shown are all in Australian dollars.
However, they are not consistent in terms of location — MRF data shown is at the MRF
gate, export price data is at the port in Sydney and the location of VISY price data is not
clear. The price received by a MRF will be lower than the price at the port in Sydney
0
5000
10000
15000
20000
25000
30000
35000
40000
Jan-14 Jul-14 Jan-15 Jul-15 Jan-16 Jul-16 Jan-17 Jul-17 Jan-18
Ton
nes
per
mon
th
NSW waste plastic - total NSW waste paper - total
NSW waste paper - unsorted
China
3.0%Hong Kong (SAR of
China)
19.5%
India
0.4%
Indonesia
13.3%
Korea, Republic of
2.1%
Malaysia
17.3%
Taiwan
6.1%
Thailand
16.4%
Viet Nam
19.6%
Other
2.3%
China
21.1%
Hong Kong (SAR of
China)
0.1%
India
17.8%
Indonesia
44.0%
Korea, Republic of
4.6%
Malaysia
1.1%
Taiwan
1.2%
Thailand
6.6%
Viet Nam
2.9%
Other
0.6%

www.TheCIE.com.au
Revenue sharing arrangements between MRFs and councils from the NSW Container Deposit Scheme 31
(because of transport costs to the port), and this is again lower than the price received at
an overseas port (because of shipping costs and customs duties).
Summaries of price indicators for paper, mixed plastic and separated plastic are shown in
charts 4.6 to 4.8.
■ VISY trading prices show a sharp decline in prices for all commodities from 2016/17,
and particularly for paper in 2018.
■ Export price data, for NSW exports, shows falls in plastic prices over the past two
years, but no change in paper prices. Data is up to December 2017.
4.6 Price indicators for paper
Data source: VISY; Global Trade Intelligence Service.
4.7 Price indicators for mixed plastic
Data source: VISY; Global Trade Intelligence Service.
0
100
200
300
400
500
600
700
Jul-2014 Jan-2015 Jul-2015 Jan-2016 Jul-2016 Jan-2017 Jul-2017 Jan-2018
Un
it p
rice
(A
$/to
nn
e)
VISY price Mixed paper
Export price NSW All waste paper and cardboard
Export price NSW Unsorted waste paper
0
100
200
300
400
500
600
700
800
900
Jul-2014 Jan-2015 Jul-2015 Jan-2016 Jul-2016 Jan-2017 Jul-2017 Jan-2018
Un
it p
rice
(A
$/to
nn
e)
Export price NSW Mixed plastic VISY price Mixed plastic

www.TheCIE.com.au
32 Revenue sharing arrangements between MRFs and councils from the NSW Container Deposit Scheme
4.8 Price indicators for separated plastic
Data source: VISY; Global Trade Intelligence Service.
Looking across a broader set of prices, most indicators suggest prices have fallen
substantially (chart 4.9). The export data does not show falls in prices to the same degree
as other measures. It is also clear that different MRFs are experiencing very different
changes in the prices that they receive, depending on which markets they have been
focused on, the presence of any long-term contracts and the quality of the products that
they are producing.
4.9 Commodity price changes all sources 2016/17 to February 2018
Note: NSW export data is to January 2018.
Data source: VISY; Global Trade Intelligence Service; MRFs; MRA 2018, 2018 looks like a lot of pain for MRFs and councils, Inside
Waste 15 February.
0
200
400
600
800
1000
1200
Jul-2014 Jan-2015 Jul-2015 Jan-2016 Jul-2016 Jan-2017 Jul-2017 Jan-2018
Un
it p
rice
(A
$/to
nn
e)
Export price NSW Waste Ethylene VISY price PET VISY price HDPE
-300
-250
-200
-150
-100
-50
0
50
NSW export data VISY traded prices MRF NSW MRF NSW MRA
Co
mm
od
ity
pri
ce m
ove
me
nts
($
/to
nn
e) paper plastic

www.TheCIE.com.au
Revenue sharing arrangements between MRFs and councils from the NSW Container Deposit Scheme 33
Glass markets
The CIE has previously estimated that the changes to glass markets in NSW were
making an impact of $14-$32 per input tonne on MRFs.8 This is a substantial impact
given MRF operating costs of around or over $100 per input tonne (excluding disposal
and transport). These costs have been evident for several years. Recent contracts should
have reflected these changes to glass markets. Older contracts will not have.
The estimated shares of glass being recycled in different ways is shown in chart 4.10.
4.10 Shares of glass recycling in NSW 2017
Data source: Industry Consultations and CIE calculations.
Defining viability
Viability could be defined in different ways for this project, depending on different
information sources.
■ The change in commodity prices — one measure of viability would be to measure the
change in commodity prices since a contract was entered into. On the basis that the
MRF must have considered itself to be viable when it entered a contract, the change
in prices would represent a viability loss.
■ Short-term viability, where revenues cover operating costs — where financial
information for a MRF is available, a MRF could be considered to be viable in the
short term if it can cover its operating costs.
■ Long-term viability, where revenues covers operating and capital costs — over the
longer term a viable MRF will have to cover the return on its capital and depreciation
of its assets. This could be measured by information on capital investments or through
adding a margin to the operating costs.
8 The CIE 2017, NSW glass recycling: issues and options, prepared for the NSW EPA, November.
0 5 10 15 20 25 30 35 40 45 50
Recycled into new glass products
Crush to glass sand
Landfill interstate
Landfill locally
Stockpile interstate
Process interstate
Export
Per cent of total glass recycled

www.TheCIE.com.au
34 Revenue sharing arrangements between MRFs and councils from the NSW Container Deposit Scheme
The scenarios examined in the next chapter identify the refund shares that appear to get
to the first two definitions of viability. However, it should be stressed that information on
financial performance has been not been audited or verified.

www.TheCIE.com.au
Revenue sharing arrangements between MRFs and councils from the NSW Container Deposit Scheme 35
5 Scenarios for refund sharing arrangements
Refund shares to cover CDS-related costs
To illustrate the magnitude of refund shares related to CDS-costs we use a hypothetical
MRF based on the assumptions set out in previous chapters. We use a throughput of
60 000 tonnes, representing a medium size MRF. We then also show a range of impacts
using actual MRFs. We show results using a diversion rate of kersbide containers of 20
per cent — that is, 20 per cent of eligible containers are diverted from kerbside recycling
bins. Note that in terms of total volumes this represents about a 4 per cent reduction, as
about20 per cent of kerbside bins are eligible containers.
To illustrate the impacts, we break these up into the different components discussed in
chapter 3.
Our hypothetical MRF would face two negative impacts from the CDS — direct
compliance and administration costs of $0.14 million, and a loss of gate fee revenue of
$0.12 million. Offsetting against this are:
■ the loss of materials is, at current commodity prices, a net gain — that is, because of
the high quantity of glass, reducing this saves a MRF money and more than offsets
the revenue loss from less plastic and aluminium. This effect is a benefit to the MRF
of $0.05 million. Note that if commodity prices were higher, or diversion occurred
more for aluminium and plastic than for glass, then this effect would be a cost to a
MRF
■ reduced operating costs of $0.12 million. This is based on a variable operating cost of
$50 per input tonne
In total, the MRF has a net cost of $0.8 million from the introduction of the CDS
(chart 5.1).
The costs of the CS to a MRF are compared to revenues from the CDS in chart 5.2. The
revenue from the CDS dwarfs the costs. For this hypothetical MRF, the costs are about 1
per cent of the revenues. That is, for each 10 cents, 0.1 cent would be required to cover
the impact of the CDS on a MRF. This outcome is not surprising, given that the CDS
represents a very large premium over the price of the commodities, and the largest part of
compliance and administration costs are borne by Exchange for Change, rather than a
MRF.

www.TheCIE.com.au
36 Revenue sharing arrangements between MRFs and councils from the NSW Container Deposit Scheme
5.1 Impacts of the CDS on hypothetical MRF
Note: This uses a MRF with annual processing of 60 000 tonnes per year, a diversion rate for all materials of 20 per cent and 50 per
cent of operating costs being variable.
Data source: The CIE.
5.2 Costs of CDS relative to the revenues for a hypothetical MRF
Note: This uses a MRF with annual processing of 60 000 tonnes per year, a diversion rate for all materials of 20 per cent and 50 per
cent of operating costs being variable.
Data source: The CIE.
0.14
0.12
0.05
0.12
0.08
0.00
0.05
0.10
0.15
0.20
0.25
0.30
CD
S
ad
min
istr
ati
on
an
d c
om
plia
nce
cost
s
Ch
an
ge
in
ga
te
fee r
eve
nu
e
Ch
an
ge in
ma
teri
al
reve
nu
es
at
curr
en
t pri
ces
Ch
an
ge
in
op
era
ting c
ost
s
Tota
l C
DS
-
rela
ted
costs
$m
, a
nn
ua
l
6.6
0
1
2
3
4
5
6
7
CD
S
ad
min
istr
ati
on
an
d c
om
plia
nce
cost
s
Ch
an
ge
in
ga
te
fee r
eve
nu
e
Ch
an
ge in
ma
teri
al
reve
nue
s a
t
curr
en
t pri
ces
Ch
an
ge
in
op
era
ting c
ost
s
Tota
l C
DS
-
rela
ted
costs
Tota
l C
DS
reve
nue
$m
, a
nn
ua
l

www.TheCIE.com.au
Revenue sharing arrangements between MRFs and councils from the NSW Container Deposit Scheme 37
Table 5.3 shows financial metrics for the MRF, under assumptions that:
■ there is no CDS (the base case)
■ a MRF keeps all CDS refunds
■ a MRF receives a refund to cover the impacts of the CDS and
■ a MRF receives 50 per cent of the CDS refund.
Without the CDS, the hypothetical MRF has revenues of $4.4 million per year and costs
of $7.2 million. That is, it makes a net operating loss. This is because we have used
commodity prices reflecting current prices.
If a MRF retained all CDS refunds (commercial and residential), the revenue of the MRF
increases from $4.4 million to $11.6 million — an increase of 167 per cent. Costs stay
about the same, comprising higher administration and compliance costs, but lower
operating costs because less material is processed.
The refund share to cover a MRF’s CDS-related costs is 1.3 per cent. This is the third
scenario.
Finally, under a 50 per cent refund share, and assuming a MRF retains none of the
commercial refunds, the MRF would have revenues of $7.6 million, compared to costs of
$7.2 million. That is, it could cover its operating costs even with existing commodity
price lows persisting. This outcome would not lead to longer term viability for the
hypothetical MRF, because a margin of 5 per cent would not be sufficient to cover capital
costs (depreciation and a return on capital).
5.3 Financial metrics for a MRF under different scenarios
Base case
(no CDS)
With CDS and
no revenue
sharing
With CDS and
revenue sharing @
1.3%
With CDS and
revenue sharing
@ 50%
$m $m $m $m
Revenue 4.4 11.6 4.4 7.6
Operating costs -7.2 -7.2 -7.2 -7.2
Operating profit -2.8 4.4 -2.8 0.4
Other information
Profit margin (%) -64% 38% -64% 5%
Tonnes processed per year (000) 60.0 57.5 57.5 57.5
MRF CDS revenue as a gate fee
equivalent ($/input tonne)
125 2 63
Note: This uses a MRF with annual processing of 60 000 tonnes per year, a diversion rate for all materials of 20 per cent and 50 per
cent of operating costs being variable.
Source: The CIE.
Turning to actual MRFs, we see somewhat higher refund shares to offset the impacts of
the CDS on each MRF. This reflects the smaller MRFs in the sample, and the fixed
nature of compliance and administration costs. It also reflects one MRF directly counting
containers, which requires additional software and capital equipment. For the median
MRF, the refund shares remain low at 2-3 per cent, to offset the CDS impacts.

www.TheCIE.com.au
38 Revenue sharing arrangements between MRFs and councils from the NSW Container Deposit Scheme
5.4 Refund shares across different MRFs to cover CDS impacts
Data source: The CIE.
Sensitivity analysis
Changes in the diversion rate
Typically, as the diversion rate of material increases out of kerbside recycling, it would be
expected that a MRF would require a higher share of refunds to cover its costs. This is
true for many of the MRFs that we have considered. However, for the hypothetical
MRF, the more diversion the better for the MRF. This is because the MRF benefits from
having less material that it has to dispose of at a loss, such as glass. Hence the MRF
needs no share of the refund at all to offset the CDS impacts, as the CDS has overall
positive impacts on the MRF at higher levels of diversion (chart 5.5).
5.5 Refund share for different material diversion rates
Note: This uses a MRF with annual processing of 60 000 tonnes per year and a diversion rate for all materials of 20 per cent.
Data source: The CIE.
-2%
0%
2%
4%
6%
8%
10%
12%
14%
16%
18%
10% diversion rate 20% diversion rate
Sh
are
of
CD
S r
efu
nd
Revenue share to cover CDS impacts
0.0%
0.2%
0.4%
0.6%
0.8%
1.0%
1.2%
1.4%
1.6%
1.8%
0% 20% 40% 60% 80% 100%
Reve
nu
e s
ha
re f
or
reve
nu
e n
eu
tra
lity
for
MR
F (
per
cen
t)
Diversion rate of household CDS eligible material away from MRF (per cent)
Revenue share to MRF for neutral CDS impact

www.TheCIE.com.au
Revenue sharing arrangements between MRFs and councils from the NSW Container Deposit Scheme 39
It is likely that aluminium and plastic will be diverted more readily from kerbside
recycling than glass, because they will be easier for people to deposit directly. In chart 5.6
we show the refund share that leaves a MRF with the same profit with or without the
CDS, assuming a diversion rate of glass of 10 per cent, and diversion rates of plastic and
aluminium varying along the x-axis. In this case, the refund share for a MRF to cover the
CDS impacts gradually increases as the diversion rate increases. At 40 per cent, the level
anticipated by the CDS Regulation Impact Statement, the share for the hypothetical
MRF would be ~5 per cent.
5.6 Refund share for different material diversion rates for aluminium and plastic
Note: This uses a MRF with annual processing of 60 000 tonnes per year and a diversion rate for all materials of 20 per cent.
Data source: The CIE.
If a MRF’s compliance costs are high, and the materials it obtains from containers are
worth more, then the profit neutral CDS refund share for a MRF can be very high at high
diversion rates (80 per cent and above). However, we do not anticipate this level of
diversion to be relevant for NSW in the short to medium term.
Changes in share of costs that are variable
If costs do not decline with the lower amount of material processed, then this increases
the amount of the refund a MRF would be required to retain to cover its CDS-related
impacts. Varying the share of costs that are variable from 0 per cent to 100 per cents gives
the refund shares in chart 5.7. If all costs are fixed, the refund share for our hypothetical
MRF would be ~3 per cent, with a diversion rate of 20 per cent from kerbside recycling.
If costs are all variable, then the hypothetical MRF would not be negatively impacted by
the CDS.
0%
2%
4%
6%
8%
10%
12%
14%
16%
18%
20%
0% 20% 40% 60% 80% 100%
Re
ven
ue
sh
are
fo
r re
ven
ue
ne
utr
ality
fo
r
MR
F (
pe
r ce
nt)
Diversion rate of household CDS eligible material away from MRF (per cent)
Revenue share to MRF for neutral CDS impact

www.TheCIE.com.au
40 Revenue sharing arrangements between MRFs and councils from the NSW Container Deposit Scheme
5.7 Refund share for different operating cost structures
Note: This uses a MRF with annual processing of 60 000 tonnes per year and a diversion rate for all materials of 20 per cent.
Data source: The CIE.
Inclusion of commercial collections
Commercial collections will also have eligible containers. Refunds from these are not
subject to refund sharing agreements. However, over time it would be expected that gate
fees for commercial collections would fall from what they otherwise would have been, to
reflect the extra revenue available from CDS refunds. Note that this does not appear to be
happening at the moment, and commercial gate fees are increasing rather than
decreasing, as MRFs seek to reduce the amount of material they process because of
difficulties in finding markets for it.
If the refunds available to a MRF from commercial collections are included, and it is
assumed that commercial gate fees do not fall as a result, then the refund share for our
hypothetical MRF would become negative. To remain at the same profit level, a MRF
would be able to give a council 110 per cent of the CDS refund, rather than 99 per cent
without commercial collections. This is with commercial collections at ~10 per cent of
the MRFs inputs.
Note that the issue of commercial collections is relevant in our view primarily because
the refunds from commercial collections can improve the viability of a MRF. It does not
make sense for a council to receive any refunds arising from commercial collections.
Inclusion of a loss of the market for glass
If the CDS replaces a MRFs current market for glass, because material is cleaner, then
we estimate that this would increase the profit neutral refund share for a MRF from 1.3
per cent to 6.2 per cent. This is based on the alternative market costing a MRF $20 per
tonne more, for all glass that a MRF produces.
-1.0%
-0.5%
0.0%
0.5%
1.0%
1.5%
2.0%
2.5%
3.0%
3.5%
0% 20% 40% 60% 80% 100%
Re
ven
ue
sh
are
fo
r re
ven
ue
ne
utr
ality
fo
r
MR
F (
pe
r ce
nt)
Share of operating costs (excl. disposal) that are variable (per cent)
Revenue share to MRF for neutral CDS impact

www.TheCIE.com.au
Revenue sharing arrangements between MRFs and councils from the NSW Container Deposit Scheme 41
Conclusions
■ The share of the CDS refund to compensate a MRF for the impacts of the CDS will
be less than 5 per cent for any medium to large MRFs (processing more than
50 000 tonnes per year)
■ For smaller MRFs, refund shares to cover CDS-related costs may be higher (5-10
per cent typically) and higher again where a direct method of counting containers
is used (15 per cent)
Refund shares for MRF viability
To consider MRF viability, we measure the refund share that would leave each MRF for
which we have data able to cover its operating costs should current commodity market
conditions continue.
■ With a 10 per cent diversion rate, the median MRF would be able to cover its
operating costs with a refund share of 40 per cent.
■ This increases to almost 50 per cent if the diversion rate is 20 per cent
■ The range amongst MRFs is large, with some MRFs viable in the sense of covering
their operating costs with shares of 10-20 per cent and others only viable with shares
of 60-70 per cent.
These measures of viability reflect current commodity market conditions and MRF
operating practices. MRFs will adapt to undertake further processing of materials to
increase their revenues from commodity sales. The extent to which poor commodity
market conditions will persist is not known.
In order to be viable in the longer term, and if commodity market conditions remain at
current lows, a MRF would need a higher share of the CDS refund (or a variation in gate
fees).
The different outcomes for different MRFs reflects the choices MRFs have made about
how they process materials, the gate fees or rebates they have offered, as well as the types
of materials that they have as inputs and commodity market conditions (including
regulatory arrangements in key markets such as China).

www.TheCIE.com.au
42 Revenue sharing arrangements between MRFs and councils from the NSW Container Deposit Scheme
5.8 Refund shares for MRF viability
Data source: The CIE.
An alternative way of considering viability is to look at different estimates of recent
negative commodity market changes. On a dollar per input tonne basis, measures range
from a very small reduction (as measured by export prices) to $60 from VISY trading
prices, $30-$90 from information provided by NSW MRFs and an estimate of over $100
from MRA consulting.
5.9 Commodity price movements as a gate fee equivalent, 2016/17 to February
2018
Note: NSW export data is to January 2018.
Data source: As noted in chart; CIE calculations..
Chart 5.10 shows different commodity price changes and their equivalent in terms of
share of CDS refunds (with a 20 per cent assumed diversion rate of materials). For
example, VISY trading price information indicates a $60 per input tonne reduction in
commodity prices from 2016/17 to today. This is equivalent to ~50 per cent of the CDS
refund available to a MRF.
0%
10%
20%
30%
40%
50%
60%
70%
80%
10% diversion rate 20% diversion rate
Sh
are
of
CD
S r
efu
nd
Revenue share for viability
-120
-100
-80
-60
-40
-20
0
20
NSW export data VISY traded prices MRF NSW MRF NSW MRA
Co
mm
od
ity
pri
ce m
ove
me
nts
as
a g
ate
fe
e
eq
uiv
ale
nt
($/in
pu
t to
nn
e)
plastic paper

www.TheCIE.com.au
Revenue sharing arrangements between MRFs and councils from the NSW Container Deposit Scheme 43
5.10 Commodity price changes and CDS refunds
Note: This uses a 20 per cent diversion rate of household material from kerbside recycling.
Data source: The CIE.
Other issues
Viability is a key issue to ensure that material continues to be recycled, which is
necessary to obtain a CDS refund. Measuring viability is not straight forward.
■ MRFs have different products and product quality
■ Some MRFs have contracts for material or buyers who trust their material and offer
different prices
■ Some are vertically integrated and use their MRF material in their own manufacturing
activities
The arrangements with councils are also not all the same. S small number of councils
have already taken a share of the impacts from changes in commodity markets through
risk sharing contracts. Councils may have agreed to variations in gate fees to ensure
viability, or may wish to use this as a way to ensure viability, rather than using the CDS.
Conclusions
■ Issues around viability do not need to be addressed through the CDS, but in our
view do need to be addressed in some way by councils to ensure that CDS (and
other) material continues to be processed.
– If councils instead choose to vary the gate fee from that in the contract to
ensure viability, then the CDS share for a MRF should reflect only its CDS-
related costs
■ The impacts of commodity price changes on MRFs have been very different, and
viability issues are also very different.
0%
10%
20%
30%
40%
50%
60%
70%
80%
90%
$10 $20 $30 $40 $50 $60 $70 $80 $90 $100
Re
fun
d s
ha
re
Commodity price change measured as $/input tonne
Without CDS costs CDS-related impacts

www.TheCIE.com.au
44 Revenue sharing arrangements between MRFs and councils from the NSW Container Deposit Scheme
– A 50 per cent refund share would lead to most but not all MRFs being viable, as
well as covering their CDS-related impacts, based on current commodity prices
and information provided by MRFs
– This would be equivalent to an additional gate fee of ~$60 per tonne, which is
about the same as the decline in commodity value as measured by VISY’s
trading data, and within the estimates of price changes provided by MRFs
– The extent to which commodity price changes are temporary or permanent is
very difficult to know. A council may wish to retain the option to re-examine the
CDS refund share as market conditions change, which would bring upside and
downside risk for a council
■ Where a council bears costs related to commodity risk already, such as a risk
sharing contract, then that council should not reflect any risks it has already borne
in the CDS refund share paid to a MRF

www.TheCIE.com.au
Revenue sharing arrangements between MRFs and councils from the NSW Container Deposit Scheme 45
6 Other issues
Transparency of agreements
A MRF will receive a single quarterly refund from the Scheme Coordinator, but will
source material from multiple sources. Further, a council will not necessarily even know
the total refund received by a MRF. This means that a council may know their refund
share (e.g. 50 per cent) but will not know what dollar number to apply that to.
A break-down of the information that will be known to a MRF and that will be known to
a council is shown in table 6.1. For a council to be able to approximately estimate the
refund share attributable to its own inputs would require:
■ that the council knows the output composition of its MRF, to which it can apply
eligible container factors to estimate a number of containers per tonne of MRF inputs
■ its input tonnes, which it will know as it pays for this through gate fees.
However, this rough approximation will not work as well where a MRF receives material
that it quite heterogeneous — for example, inputs from councils with a four bin system
(separate paper and cardboard) and councils with three bin systems. In this case, a more
complex reconciliation will be required.
6.1 Information known to a MRF and a council
Information Known by MRF Known by council
Total refund received by a MRF ✓ X
Total input tonnes received by a MRF ✓ X
Input tonnes received from specific council ✓ ✓
Composition of material from a council X X
Composition of MRF outputs ✓ X
Eligible container factors (containers per tonne of outputs) ✓ ✓
Information on how CDS has impacted MRF material
volumes
? X
Compliance costs related to the CDS ✓ X
Source: The CIE.
Our recommendations to improve transparency are set out below.
■ Councils should have access to data on the material output shares of the MRF that
their material goes to, in order to be able to approximately verify the refund the
council should receive

www.TheCIE.com.au
46 Revenue sharing arrangements between MRFs and councils from the NSW Container Deposit Scheme
■ If councils agree to a model or process for estimating refunds on an ongoing basis,
rather than a share, then the model would need to be available to councils and
MRFs to ensure that refunds could be verified and ideally third party auditing
would be required for data used in the model
Structure of a refund sharing agreement
The Waste Avoidance and Resource Recovery (Container Deposit Scheme) Regulation 2017
(section 18) defined as refund sharing agreement as follows.
refund sharing agreement means an arrangement between a local council and a material
recovery facility operator under which the operator agrees to pay to the council a proportion of
all refund amounts paid to the operator by the Scheme Coordinator on or after the Scheme
commencement day in respect of containers collected in the council’s area during the course of
domestic waste management services.
We take this to mean that an agreement could have different proportions over time, or
could specify a process or model for sharing of refunds, rather than simply a fixed
proportion.
At a high level, the two paths for a refund sharing agreement are:
3 Decide on a particular refund share now, with risks that the refunds available and
costs to a MRF will be different to those expected. This could be structured as:
– a percentage of refunds provided to a MRF and allocated to each council that the
MRF accepts material from
– a fixed amount to be retained by a MRF, such as $100 000 for compliance costs,
and then sharing of the remainder
4 A process or protocol for determining the refund share at the end of each quarter or
year. This could include:
– the requirements for claiming CDS-related costs, such as invoices for Independent
Assurance reporting
– the process for estimating the change in material volumes and the unit costs or
prices attached to these changes
These different approaches lead to different risks for councils and MRFs (table 6.2). A
protocol leads to risks around measuring changes and validating data on an ongoing
basis. An upfront refund share leads to risks because the impacts of the CDS could be
very different from those expected, and because commodity market conditions will
change.
6.2 Risks of alternative approaches to structing refund sharing agreements
Risk Refund share decided up front Refund share determined through
protocol
Diversion rates from households are
lower than expected
MRF may receive too much of CDS
refunds
May be difficult to measure diversion
rate to use in protocol
Diversion rates from households are
lower than expected
MRF may receive too little of CDS
refund
May be difficult to measure diversion
rate to use in protocol

www.TheCIE.com.au
Revenue sharing arrangements between MRFs and councils from the NSW Container Deposit Scheme 47
Risk Refund share decided up front Refund share determined through
protocol
Compliance more costly than
expected
MRF may receive too little of CDS
refund
Verification of compliance costs will
be difficult for a MRFs own costs
Compliance less costly than expected MRF may receive too much of CDS
refund
Verification of compliance costs will
be difficult for a MRFs own costs
Commodity markets rebound MRF may receive too much of CDS
refunds
Require good measures of
commodity prices
Source: The CIE.
We would recommend using a protocol rather than an upfront agreement, as long as the
council has the skills and resources to be able to verify the operation of the protocol over
time.
Bargaining power of MRFs and councils
The bargaining power between MRFs and councils over the CDS may be quite different.
■ MRFs often serve many councils, giving them a far larger financial incentive than an
individual council around CDS (and other) contract negotiations
■ The CDS negotiation is a highly artificial negotiating construct. A council and MRF
are already contracted, and there is not necessarily the ability to test the market in
such a situation.
■ The current viability concerns for MRFs may mean that, where contract disruption is
possible, a council has few options available.
Collective negotiation would be one way to reduce some of these issues.
Contracts with collectors
Some councils do not directly contract with a MRF for processing, but contract with a
collector only. The collector then bears the responsibility of contracting with a MRF to
accept material. Under this type of arrangement, a council could:
■ have a refund sharing agreement with a material recovery facility, even though they
are not directly contracted to that facility
■ make an agreement (not a refund sharing agreement) about refunds with the collector,
and then notify EPA that it considers that in the circumstances it is fair and
reasonable that there is no refund sharing agreement in force.
The principles of how much of the revenue should be obtained by a council and for what
reasons remain the same under this arrangement. However, councils may not have much
transparency about the relationships between the collector and the MRF. For example, it
may not be clear if refund shares intended to cover a MRFs costs or to ensure viability
actually go to a MRF. A collector may seek to retain a share of the refund for themselves,
even though there is no basis for their collecting any CDS refunds.

www.TheCIE.com.au
48 Revenue sharing arrangements between MRFs and councils from the NSW Container Deposit Scheme
Incentives for councils and MRFs
Different financial arrangements for processing involve different incentives for councils
and MRFs, and this is also the case with the CDS.
■ Fixed gate fees that are lower than landfill gate fees do not provide an incentive for
councils to educate residents about material that cannot be recycled. Contamination is
a major cost for MRFs.
– Across the waste audits conducted by APC over 20 years a number of common
causes of contamination are seen including bagged recyclables, contaminated
paper (magazines or brochures wrapped in plastic), non-recyclable plastics,
containerised food/ liquid, textiles (clothing) and carpet. Underlying factors
include insufficient general waste bin space, socio-economics and type of housing.
Contamination rates typically range from 10 – 17 per cent and in some cases are as
high as 56 per cent.
– Some contracts have councils paying the waste costs of a MRF. This removes the
above incentive issue, but will also encourage a MRF to landfill product that has a
price of less than zero, such as glass, as council would bear this cost.
■ A high CDS share to MRFs will provide a strong financial incentive for material to be
proven to be eligible for the CDS refund. This will be the case regardless of whether
the true destination is for recycling. While this outcome may be one that has a
financial advantage to councils and MRFs, the credibility of the CDS scheme would
be damaged if refunds are paid on material that is later revealed to have gone to
landfills.
Risk sharing for contracts
CDS refunds provide another form of risk to MRFs and councils, in that they are likely
to change over time, and the ability to forecast or hedge against these changes is limited.
This risk adds to the already substantial risks relating to commodity markets, particularly
for exporters.
The recent commodity market issues for MRFs highlight the vulnerability of the existing
contracting models to commodity market conditions, and overseas regulatory changes.
We would expect that MRFs will respond by repricing these risks higher in new
contracts. Considering alternatives to better manage risks, such as risk sharing, may lead
to better pricing for councils and a more sustainable sector.

www.TheCIE.com.au
Revenue sharing arrangements between MRFs and councils from the NSW Container Deposit Scheme 49
A Technical appendix — impacts of the CDS on a
MRF
The impacts of the CDS on a MRF’s profits are:
∆𝜋 = ∆𝑄. 𝑝 − ∆𝑄. 𝑐 + ∑ ∆𝑄𝑖 . 𝑃𝑖0
𝑖
+ ∑ 𝑄𝑖1. ∆𝑃𝑖 +
𝑖
𝑟. [∑ 𝑄𝑖1. 𝐶𝐹𝑖 . 𝐷 − 𝐴
𝑖
] − 𝐶𝐶
Where
■ ∆𝜋 is the change in profit
■ ∆𝑄 is the change in total input tonnes into the MRF
■ 𝑝 is the gate fee (which could be positive or negative)
■ 𝑐 is the variable cost of processing each input tonne
■ ∆𝑄𝑖 is the change in the tonnes of each output commodity, i
■ 𝑃𝑖0 is the without CDS price of each output commodity (in dollars per tonne)
■ 𝑄𝑖1is the quantity of outputs for each commodity with the CDS
■ ∆𝑃𝑖 is any changes to commodity prices because of the CDS
■ 𝑟 is the revenue share of refunds retained by a MRF
■ 𝐶𝐹𝑖 is the container factor for commodity i
■ 𝐷 is the refund amount
■ A is the administration costs paid by the scheme administrator
■ CC is compliance costs for the MRF associated with the CDS.
The profit neutral revenue share is the r* where ∆𝜋 is set equal to zero. That is:
𝑟∗ =−[∆𝑄. 𝑝 − ∆𝑄. 𝑐 + ∑ ∆𝑄𝑖 . 𝑃𝑖
0𝑖 + ∑ 𝑄𝑖
1. ∆𝑃𝑖𝑖 − 𝐶𝐶]
[∑ 𝑄𝑖1. 𝐶𝐹𝑖 . 𝐷 − 𝐴𝑖 ]
Note that where there was no diversion of materials from households away from
kerbside, and no impacts on prices of commodities in the market, then this becomes:
𝑟∗ =𝐶𝐶
[∑ 𝑄𝑖1. 𝐶𝐹𝑖 . 𝐷 − 𝐴𝑖 ]
That is, MRFs recover their revenue share based on their compliance costs only.

www.TheCIE.com.au
2 Revenue sharing arrangements between MRFs and councils from the NSW Container Deposit Scheme
THE CENTRE FOR INTERNATIONAL ECONOMICS
www.TheCIE.com.au
Related Documents