Report on the Situation of Malaria in the Americas, 2000-2015 12 1 Document prepared by the Regional Malaria Program, Pan American Health Organization with data from Annual Country Reports- 2016

Welcome message from author
This document is posted to help you gain knowledge. Please leave a comment to let me know what you think about it! Share it to your friends and learn new things together.
Transcript

Report on the Situation of Malaria in the
Americas, 2000-201512
1 Document prepared by the Regional Malaria Program, Pan American Health Organization with data from Annual
Country Reports- 2016

General situation in endemic countries
The number of malaria cases in the Region of the Americas declined by62% (1,181,095 to 451,242 cases) between 2000 and 2015 (figure 1). Inthe same period malaria-related deaths has declined by 61.2% (410 in2000 to 159 deaths in 2015). An estimated 7.2 million cases and 3,200deaths were averted between 2000 and 2015, assuming that the ratesfrom 2000 remained constant. Despite many achievements, there arestill an estimated 102 million people living in areas at risk of malaria inthe Americas of which, at least 28 million were living in areasconsidered to be at high risk (>10 cases/1,000 inhabitants).
With the exception of Haiti and Venezuela, most of the 21 endemiccountries in the Americas have had a reduction of malaria cases till2015 compared to 2000 (figure 2). Notable changes in cases during the2010-2015 period include a decrease in Haiti and increases in Panama,Peru, Nicaragua, and Venezuela. Panama has had a 34% increase incases during 2010-2015 with the majority of cases in the indigenouspopulations living in conditions of vulnerability. In Peru and Venezuela,cases have doubled and tripled, respectively during 2010-2015. Theareas of concern in both these countries are within the Amazon forestthat spans across many countries in South America.
In 2015, cases of malaria increased in Colombia, Dominican Republic,Ecuador, Guatemala, Honduras, Nicaragua, Peru, and Venezuela ascompared to 2014. In Colombia, malaria transmission continues to behigh in the department of Choco. Cases increased during 2014 and2015 and accounted for 53% of all cases in the country. The GlobalFund grant came to an end in 2014 and thereafter there has been adecline in interventions in the state, including decreased diagnosticposts and vector control interventions. The Dominican Republic had a33% increase in cases between 2014 and 2015, mostly due to a localoutbreak in the Santo Domingo. The increase in cases in Ecuador maybe related to the reorganization of the national malaria program leadingto decline in attention to case management and preventive interventionswhile functions were being transferred. Furthermore, case increases inlocalities of the Ecuadorian Pacific coast may also be affected by the ElNino Southern Oscillation phenomenon associated with malariaepidemics occurring every few years (figure 4). In Guatemala, 67% ofcases in 2015 were reported in the department of Escuintla where manypeople work in farms. People migrate to this area for work seasonallywhich causes reintroduction of cases in other areas within the country orneighbouring countries as workers return home following the harvestseason. The Escuintla department reported the highest amount of casesin the entire Mesoamerican sub-region. Honduras also had a smallincrease of cases in 2015 due to a focal outbreak related to economicactivity (harvesting of jellyfish) on the Atlantic coast in the Moskitia area.In 2015, the number of cases doubled in Nicaragua compared to 2014(from 1,163 to 2,307 cases). Cases continue to be high in the Moskitiaarea due to changes in economic activity increasing occupational risk,especially in those working on recently developed palm and cocoaplantations in the area. Social disturbance due to land ownership hasbeen another reason for the increase. In Peru, 96% of cases in thecountry were reported from the state (region) of Loreto. Located in theAmazon basin, Loreto is the largest and the least populated state of
Paraguay
Argentina
Costa Rica
Ecuador
Belize
El Salvador
Suriname
Mexico
Nicaragua
Honduras
Guatemala
Fr. Guiana
Bolivia
Brazil
Colombia
Guyana
Dom. Rep.
Panama
Peru
Haiti
Venezuela
-100%
-75%
-50%
-25%
0%
25%
50%
75%
100%
Precentage change
359%
Figure 2. Decrease in malaria morbidity by countries ofthe Americas, 2000 - 2015
* Fr. Guiana - French Guiana, ** Dom. Rep. - Dominican Republic
>75% Decrease
50-75% Decrease
<50% Decrease
Increase
2000
2001
2002
2003
2004
2005
2006
2007
2008
2009
2010
2011
2012
2013
2014
2015
0.0M
0.3M
0.6M
0.9M
1.2M
Confirmed cases [in millions]
0
100
200
300
400
Deaths
Figure 1. Malaria morbidity and mortality inthe Americas, 2000 - 2015
Confirmed Cases
Deaths
P. falciparum & mixed
Peru that has had high rates of malaria in the past few years largely dueto decline in access to diagnosis and treatment, and diminished vectorcontrol interventions. In Venezuela, cases have increased annuallysince 2008. Between 2014 and 2015, cases increased by 50% from90,708 to 136,402. If this trend continues, Venezuela could report themost cases in the Americas by 2016. The country has reported morecases in 2015 than in any of the previous 50 years. The situation isworsening mainly due to social and economic conditions, increasedmining activities, and decreased vector control interventions, especiallyin Sifontes municipality of the Bolivar state.
On the other hand, zero cases were reported in Argentina, Paraguay,and Costa Rica in 2015 (table 2). Argentina has officially requestedWHO to initiate the process of certification of elimination. Seven othercountries in the Americas (Belize, Costa Rica, Ecuador, El Salvador,Mexico, Paraguay and Suriname) have the potential to eliminate malariaby 2020 according to a WHO analysis presented in the report“Eliminating malaria" released in 2016 (E2020). Belize reported 13confirmed cases, of which 4 were imported from Guatemala, Mexicoand Nicaragua and had 10 active foci. Six of the nine cases in ElSalvador were reported imported from Guatemala in 2015. Malariatransmission continues to be limited a few foci in the north of the countrybordering Guatemala. Transmission in Mexico is limited to a few foci intwo areas of the country - southern states bordering Belize andGuatemala and in the north in Sinaloa and adjoining states. More thanhalf of the cases in Suriname have been reported imported since 2013.Although French Guiana, France reportedly has declined malaria cases,the number of cases reported imported in neighbouring countries ofSuriname (273) and Brazil (29) from that territory are higher than thenumber of indigenous cases reported in French Guiana itself.
Plasmodium vivax is the main malaria-causing species in the Americas(72% of cases in 2015). Belize, El Salvador, Mexico, and Panamareport cases almost exclusively caused by P. vivax while cases in Haitiand the Dominican Republic are almost exclusively caused by P.falciparum. Plasmodium malariae is also prevalent in the Americas,though accounts for less than 0.1% of all cases. Under-diagnosis of thisspecies is common and the prevalence could be higher.
<5 5-9
10-14
15-19
20-24
25-29
30-34
35-39
40-44
45-49
50+
0
10,000
20,000
30,000
40,000
50,000
Confirmed Cases
Figure 3. Malaria by age group and sex, 2015
* Data not available for Haiti and Venezuela. Information for Guatemala andNicaragua available according to age groups different from those used here.
Female Male

Country Year ConfirmedCases
CasesInvestigated Imported Indigenous P.
falciparumImported
P. falciparumImportedP. vivax Active Foci
Argentina 201320142015
Belize 201320142015
Costa Rica 201320142015
Ecuador 201320142015
El Salvador 201320142015
Mexico 201320142015
Paraguay 201320142015
Suriname 201320142015
000
144
000
000
144
144
144
1184
404
000
000
404
131926
131926
000
423
431
000
854
866
866
20
3
23
9
43
1
184
160
68
10
686
100
686241378
422
621
000
000
621
987
987
505661
2720
684
000
34104
551666499
551666499
000
213
677
000
8811
8811
8811
61
203
91
224
17
98
295247491
376401729
Table 2. Malaria in countries of E2020 in the Region of the Americas, 2013 - 2015
... No data available
Country Year Total population atrisk
Blood samplesexamined Confirmed Cases P. falciparum &
mixed infectionsSlide positivity rate
(x100)Annual ParasiteIndex (x1000)
Bolivia 201320142015
Brazil 201320142015
Colombia 201320142015
DominicanRepublic
201320142015
FrenchGuiana
201320142015
Guatemala 201320142015
Guyana 201320142015
Haiti 201320142015
Honduras 201320142015
Nicaragua 201320142015
Panama 201320142015
Peru 201320142015
Venezuela 201320142015
1.521.631.61
4.345.935.51
96341996
6,9077,4017,342
159,167124,900133,260
4,549,2154,549,2154,549,215
5.523.994.25
9.538.599.43
16,79123,40931,482
143,162143,415178,546
1,488,0721,658,9761,873,518
25,933,92135,965,91241,992,553
5.493.855.34
17.6510.1015.81
30,87020,50418,174
55,86640,76851,722
316,451325,713284,332
10,176,93610,596,9979,691,401
0.100.100.09
0.210.140.12
651491576
661496579
316,947362,304431,683
6,319,6764,761,8046,577,495
3.173.584.40
3.753.063.93
205148307
434448877
11,55814,65122,327
136,831125,004199,199
0.440.400.95
1.881.874.04
5192152
5,5404,9316,214
295,246264,269153,731
12,600,00012,270,0006,541,912
13.0216.5242.97
7.518.6515.29
3,9505,13917,425
9,98412,35331,479
132,941142,843205,903
767,000747,884732,557
1.721.692.02
5.816.7712.14
17,58317,69620,378
17,58317,69620,957
69,659134,766172,624
10,243,69310,466,50010,388,424
0.630.601.03
2.372.233.75
9335671,159
3,5753,3805,428
150,854151,420144,436
5,717,1745,598,2445,270,455
0.650.340.38
0.380.190.23
345163220
2,3071,1631,194
604,418605,357519,993
3,523,0633,373,4993,134,267
0.784.760.19
0.871.080.75
686
562874705
64,51180,70193,624
717,489183,4283,724,171
14.965.4966.76
7.697.484.99
13,6826,9886,843
66,60964,67643,139
865,980864,413863,790
4,453,08211,778,357646,192
22.1215.3313.47
21.8217.3616.50
35,50927,84327,659
136,40290,70878,643
625,174522,617476,764
6,165,2915,916,1535,837,393
Table 1. Malaria in countries in the Region of the Americas, 2013 - 2015

Figure 4. Malaria by Annual Parasite Index (API) at the second administrative level (ADM-2) in the Americas - 2015
Municipality State Country
0 50,000
20130 100,000
20140 100,000
2015
Sifontes Bolivar Venezuela
Cruzeiro do Sul Acre Brazil
Atures Amazonas Venezuela
Manaus Amazonas BrazilGran Sabana Bolivar Venezuela
San Juan BautistaLoreto Peru
Andoas Loreto Peru
Raul Leoni Bolivar Venezuela
Quibdo Choco Colombia
Cedeno Bolivar VenezuelaIpixuna Amazonas Brazil
Eirunepe Amazonas Brazil
Tado Choco Colombia
Mancio Lima Acre Brazil
Labrea Amazonas Brazil
Sao Gabriel** Amazonas BrazilTigre Loreto Peru
El Callao Bolivar Venezuela
Rodrigues Alves Acre Brazil
Napo Loreto Peru
Ramon Castilla Loreto Peru
Barcelos Amazonas BrazilAtalaia do Norte Amazonas Brazil
Sucre Bolivar Venezuela
Trompeteros Loreto Peru
46,610
20,043
4,377
7,295
5,195
7,414
1,029
2,844
4,232
5,057
5,455
8,483
1,814
7,281
4,651
5,524
2,511
340
3,524
859
3,911
2,423
4,291
2,691
1,226
52,509
17,210
5,897
7,443
5,224
10,616
6,842
5,130
5,008
5,289
2,983
5,288
3,472
6,207
7,412
4,533
5,194
574
4,774
3,207
1,851
3,863
3,619
3,490
2,744
71,934
14,979
9,812
9,748
8,354
8,006
7,898
7,777
7,120
6,898
6,731
6,240
5,716
5,552
5,161
5,071
4,764
4,462
4,380
4,344
4,341
4,207
3,991
3,820
3,761
Figure 5. Municipalities (ADM-2) with high malaria burden incountries of the Amazonas sub-region, 2013 - 2015
* São Gabriel da CachoeiraDistrict-level data (ADM-3) used for Peru, which were partially available during 2013-2015.
Throughout the Americas, approximately 58% of all cases occurredin men in 2015 (figure 3). This trend has been consistent throughoutthe years and malaria mostly affects males between the ages of15-24 years. Yet, around 9% of all cases in 2015 occurred inchildren under 5 years of age; Brazil, Colombia, Haiti, Panama, andPeru had particularly high number of malaria cases (>10% of totalcases) in children less than 5 years old suggesting that a significantproportion of malaria transmission occurs within households in thesecountries.
AmazonasThe top 25 municipalities by burden of disease in the Americasreported almost 50% of the total cases in the Region in 2015 (figure5). The majority (19) of these top 25 municipalities had an increasein malaria compared to the previous year with 13 of them reportingan increase of over 30% in 2015. The municipality of Sifontes inBolivar State of Venezuela alone reported approximately 16% of thetotal cases of the Region. Malaria in this municipality continues toincrease due to mining and social disturbances and has spread toother neighbouring municipalities like El Callo. Shortage ofmedicines and declining coverage by vector control interventionshas led to increase in other municipalities of the country, especiallyin the state of Amazonas.
The same situation abounds in Loreto state of Peru which has led toincreases or very high transmission of malaria in municipalities ofthat state, especially in Andoas and Tigre. Disperse populationsliving on the edges of rivers traversing the state are particularly hardto reach. There is an urgent need to sort logistical problems,increase access to diagnosis and treatment through communityhealth workers in each locality and distribution of bednets to thesevulnerable populations. On the other hand, malaria has beendeclining in many municipalities of Brazil due to the improvement inaccess to diagnosis and treatment. Noteworthy are Cruzeiro do Sulin Acre and Manaus in Amazonas. Municipalities of Choco have alsoreported an increase in malaria.
In Mesoamerican sub-region the 25 municipalities with the highestmalaria burden reported more than 63% of the total malaria cases inthe sub-region (figure 6). Sixteen of these reported an increase inmalaria cases. Malaria in La Gomera municipality of Escuintla statein Guatemala continues to increase; access to diagnosis andtreatment is particularly deficient here. Puerto Lempira in the Gracias
Change from previous yearDecrease Increase No Data
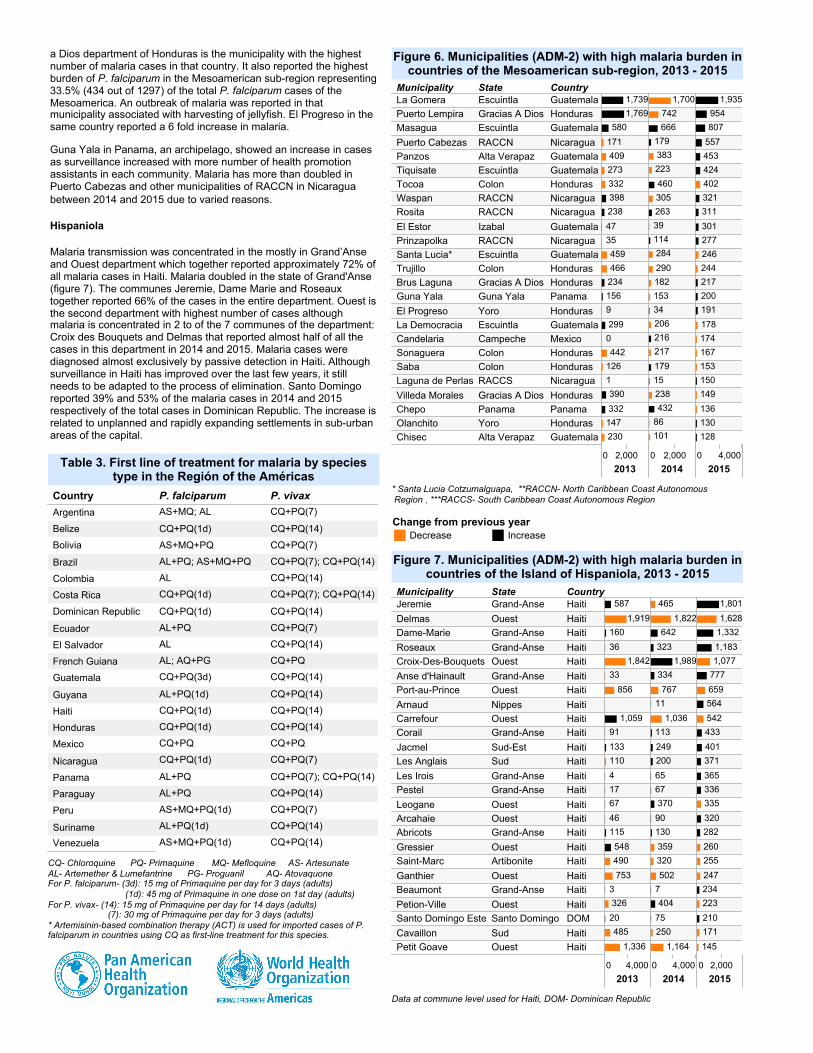
a Dios department of Honduras is the municipality with the highestnumber of malaria cases in that country. It also reported the highestburden of P. falciparum in the Mesoamerican sub-region representing33.5% (434 out of 1297) of the total P. falciparum cases of theMesoamerica. An outbreak of malaria was reported in thatmunicipality associated with harvesting of jellyfish. El Progreso in thesame country reported a 6 fold increase in malaria.
Guna Yala in Panama, an archipelago, showed an increase in casesas surveillance increased with more number of health promotionassistants in each community. Malaria has more than doubled inPuerto Cabezas and other municipalities of RACCN in Nicaraguabetween 2014 and 2015 due to varied reasons.
Hispaniola
Malaria transmission was concentrated in the mostly in Grand’Anseand Ouest department which together reported approximately 72% ofall malaria cases in Haiti. Malaria doubled in the state of Grand'Anse(figure 7). The communes Jeremie, Dame Marie and Roseauxtogether reported 66% of the cases in the entire department. Ouest isthe second department with highest number of cases althoughmalaria is concentrated in 2 to of the 7 communes of the department:Croix des Bouquets and Delmas that reported almost half of all thecases in this department in 2014 and 2015. Malaria cases werediagnosed almost exclusively by passive detection in Haiti. Althoughsurveillance in Haiti has improved over the last few years, it stillneeds to be adapted to the process of elimination. Santo Domingoreported 39% and 53% of the malaria cases in 2014 and 2015respectively of the total cases in Dominican Republic. The increase isrelated to unplanned and rapidly expanding settlements in sub-urbanareas of the capital.
Municipality State Country
0 2,000
20130 2,000
20140 4,000
2015
La Gomera Escuintla GuatemalaPuerto Lempira Gracias A DiosHondurasMasagua Escuintla GuatemalaPuerto Cabezas RACCN NicaraguaPanzos Alta Verapaz GuatemalaTiquisate Escuintla GuatemalaTocoa Colon HondurasWaspan RACCN NicaraguaRosita RACCN NicaraguaEl Estor Izabal GuatemalaPrinzapolka RACCN NicaraguaSanta Lucia* Escuintla GuatemalaTrujillo Colon HondurasBrus Laguna Gracias A DiosHondurasGuna Yala Guna Yala PanamaEl Progreso Yoro HondurasLa Democracia Escuintla GuatemalaCandelaria Campeche MexicoSonaguera Colon HondurasSaba Colon HondurasLaguna de PerlasRACCS NicaraguaVilleda Morales Gracias A DiosHondurasChepo Panama PanamaOlanchito Yoro HondurasChisec Alta Verapaz Guatemala
1,739
1,769
580
171
409
273
332
398
238
47
35
459
466
234
156
9
299
0
442
126
1
390
332
147
230
1,700
742
666
179
383
223
460
305
263
39
114
284
290
182
153
34
206
216
217
179
15
238
432
86
101
1,935
954
807
557
453
424
402
321
311
301
277
246
244
217
200
191
178
174
167
153
150
149
136
130
128
Figure 6. Municipalities (ADM-2) with high malaria burden incountries of the Mesoamerican sub-region, 2013 - 2015
* Santa Lucia Cotzumalguapa, **RACCN- North Caribbean Coast Autonomous Region , ***RACCS- South Caribbean Coast Autonomous Region
Municipality State Country
0 4,000
20130 4,000
20140 2,000
2015
Jeremie Grand-Anse HaitiDelmas Ouest HaitiDame-Marie Grand-Anse HaitiRoseaux Grand-Anse HaitiCroix-Des-BouquetsOuest HaitiAnse d'Hainault Grand-Anse HaitiPort-au-Prince Ouest HaitiArnaud Nippes HaitiCarrefour Ouest HaitiCorail Grand-Anse HaitiJacmel Sud-Est HaitiLes Anglais Sud HaitiLes Irois Grand-Anse HaitiPestel Grand-Anse HaitiLeogane Ouest HaitiArcahaie Ouest HaitiAbricots Grand-Anse HaitiGressier Ouest HaitiSaint-Marc Artibonite HaitiGanthier Ouest HaitiBeaumont Grand-Anse HaitiPetion-Ville Ouest HaitiSanto Domingo EsteSanto Domingo DOMCavaillon Sud HaitiPetit Goave Ouest Haiti
587
1,919
160
36
1,842
33
856
1,059
91
133
110
4
17
67
46
115
548
490
753
3
326
20
485
1,336
465
1,822
642
323
1,989
334
767
11
1,036
113
249
200
65
67
370
90
130
359
320
502
7
404
75
250
1,164
1,801
1,628
1,332
1,183
1,077
777
659
564
542
433
401
371
365
336
335
320
282
260
255
247
234
223
210
171
145
Figure 7. Municipalities (ADM-2) with high malaria burden incountries of the Island of Hispaniola, 2013 - 2015
Data at commune level used for Haiti, DOM- Dominican Republic
Change from previous yearDecrease Increase
Country P. falciparum P. vivaxArgentina
Belize
Bolivia
Brazil
Colombia
Costa Rica
Dominican Republic
Ecuador
El Salvador
French Guiana
Guatemala
Guyana
Haiti
Honduras
Mexico
Nicaragua
Panama
Paraguay
Peru
Suriname
Venezuela CQ+PQ(14)
CQ+PQ(14)
CQ+PQ(14)
CQ+PQ(14)
CQ+PQ(14)
CQ+PQ(14)
CQ+PQ(14)
CQ+PQ(14)
CQ+PQ(14)
CQ+PQ(14)
CQ+PQ(14)
CQ+PQ(7); CQ+PQ(14)
CQ+PQ(7); CQ+PQ(14)
CQ+PQ(7); CQ+PQ(14)
CQ+PQ(7)
CQ+PQ(7)
CQ+PQ(7)
CQ+PQ(7)
CQ+PQ(7)
CQ+PQ(3d)
CQ+PQ(1d)
CQ+PQ(1d)
CQ+PQ(1d)
CQ+PQ(1d)
CQ+PQ(1d)
CQ+PQ(1d)
CQ+PQ
CQ+PQ
CQ+PQ
AS+MQ+PQ(1d)
AS+MQ+PQ(1d)
AS+MQ+PQ
AS+MQ; AL
AL+PQ(1d)
AL+PQ(1d)
AL+PQ; AS+MQ+PQ
AL+PQ
AL+PQ
AL+PQ
AL; AQ+PG
AL
AL
Table 3. First line of treatment for malaria by speciestype in the Región of the Américas
CQ- Chloroquine PQ- Primaquine MQ- Mefloquine AS- ArtesunateAL- Artemether & Lumefantrine PG- Proguanil AQ- AtovaquoneFor P. falciparum- (3d): 15 mg of Primaquine per day for 3 days (adults)
(1d): 45 mg of Primaquine in one dose on 1st day (adults)For P. vivax- (14): 15 mg of Primaquine per day for 14 days (adults)
(7): 30 mg of Primaquine per day for 3 days (adults)* Artemisinin-based combination therapy (ACT) is used for imported cases of P.falciparum in countries using CQ as first-line treatment for this species.
Country 2013 2014 2015
0% 25% 50% 75% 100%
Percentage of all cases0% 25% 50% 75% 100%
Percentage of all cases0% 25% 50% 75% 100%
Percentage of all cases
Argentina
Belize
Bolivia
Brazil
Colombia
Costa Rica
Dominican Republic
Ecuador
El Salvador
French Guiana
Guatemala
Guyana
Haiti
Honduras
Mexico
Nicaragua
Panama
Paraguay
Peru
Suriname
Venezuela
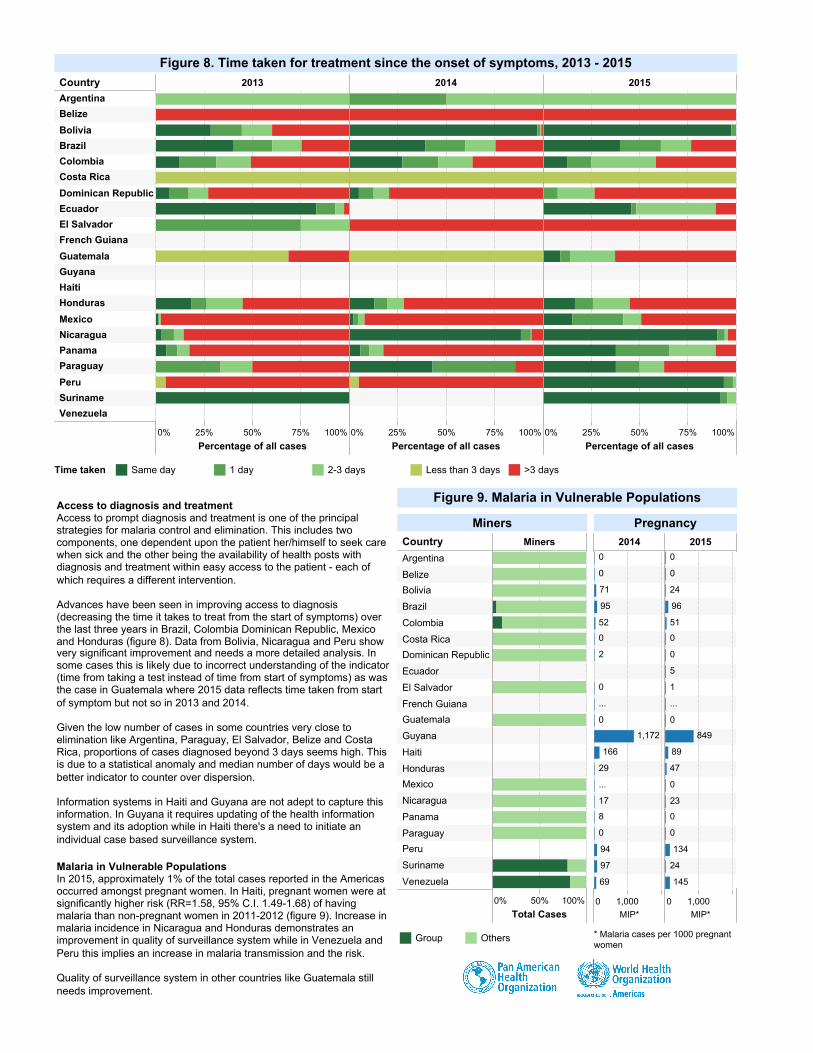
Figure 8. Time taken for treatment since the onset of symptoms, 2013 - 2015
Time taken Same day 1 day 2-3 days Less than 3 days >3 days
Access to diagnosis and treatmentAccess to prompt diagnosis and treatment is one of the principalstrategies for malaria control and elimination. This includes twocomponents, one dependent upon the patient her/himself to seek carewhen sick and the other being the availability of health posts withdiagnosis and treatment within easy access to the patient - each ofwhich requires a different intervention.
Advances have been seen in improving access to diagnosis(decreasing the time it takes to treat from the start of symptoms) overthe last three years in Brazil, Colombia Dominican Republic, Mexicoand Honduras (figure 8). Data from Bolivia, Nicaragua and Peru showvery significant improvement and needs a more detailed analysis. Insome cases this is likely due to incorrect understanding of the indicator(time from taking a test instead of time from start of symptoms) as wasthe case in Guatemala where 2015 data reflects time taken from startof symptom but not so in 2013 and 2014.
Given the low number of cases in some countries very close toelimination like Argentina, Paraguay, El Salvador, Belize and CostaRica, proportions of cases diagnosed beyond 3 days seems high. Thisis due to a statistical anomaly and median number of days would be abetter indicator to counter over dispersion.
Information systems in Haiti and Guyana are not adept to capture thisinformation. In Guyana it requires updating of the health informationsystem and its adoption while in Haiti there's a need to initiate anindividual case based surveillance system.
Malaria in Vulnerable PopulationsIn 2015, approximately 1% of the total cases reported in the Americasoccurred amongst pregnant women. In Haiti, pregnant women were atsignificantly higher risk (RR=1.58, 95% C.I. 1.49-1.68) of havingmalaria than non-pregnant women in 2011-2012 (figure 9). Increase inmalaria incidence in Nicaragua and Honduras demonstrates animprovement in quality of surveillance system while in Venezuela andPeru this implies an increase in malaria transmission and the risk.
Quality of surveillance system in other countries like Guatemala stillneeds improvement.
Country Miners
0% 50% 100%
Total Cases
Argentina
Belize
Bolivia
Brazil
Colombia
Costa Rica
Dominican Republic
Ecuador
El Salvador
French Guiana
Guatemala
Guyana
Haiti
Honduras
Mexico
Nicaragua
Panama
Paraguay
Peru
Suriname
Venezuela
Miners
Group Others
2014 2015
0 1,000MIP*
0 1,000MIP*
1,172
166
71
95
52
29
17
94
97
69
...
...
0
0
0
2
0
0
8
0
849
134
145
24
96
51
89
47
23
24
...
0
0
0
0
5
1
0
0
0
0
Pregnancy
* Malaria cases per 1000 pregnantwomen
Figure 9. Malaria in Vulnerable Populations
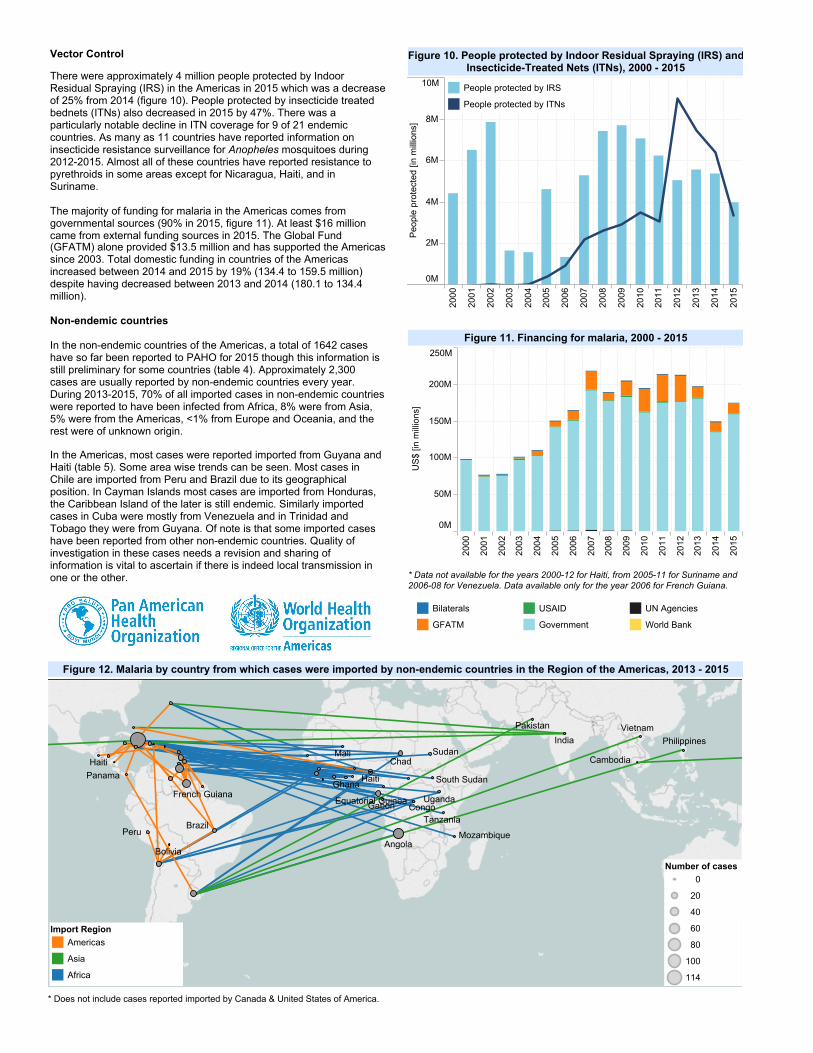
Vector Control
There were approximately 4 million people protected by IndoorResidual Spraying (IRS) in the Americas in 2015 which was a decreaseof 25% from 2014 (figure 10). People protected by insecticide treatedbednets (ITNs) also decreased in 2015 by 47%. There was aparticularly notable decline in ITN coverage for 9 of 21 endemiccountries. As many as 11 countries have reported information oninsecticide resistance surveillance for Anopheles mosquitoes during2012-2015. Almost all of these countries have reported resistance topyrethroids in some areas except for Nicaragua, Haiti, and inSuriname.
The majority of funding for malaria in the Americas comes fromgovernmental sources (90% in 2015, figure 11). At least $16 millioncame from external funding sources in 2015. The Global Fund(GFATM) alone provided $13.5 million and has supported the Americassince 2003. Total domestic funding in countries of the Americasincreased between 2014 and 2015 by 19% (134.4 to 159.5 million)despite having decreased between 2013 and 2014 (180.1 to 134.4million).
Non-endemic countries
In the non-endemic countries of the Americas, a total of 1642 caseshave so far been reported to PAHO for 2015 though this information isstill preliminary for some countries (table 4). Approximately 2,300cases are usually reported by non-endemic countries every year.During 2013-2015, 70% of all imported cases in non-endemic countrieswere reported to have been infected from Africa, 8% were from Asia,5% were from the Americas, <1% from Europe and Oceania, and therest were of unknown origin.
In the Americas, most cases were reported imported from Guyana andHaiti (table 5). Some area wise trends can be seen. Most cases inChile are imported from Peru and Brazil due to its geographicalposition. In Cayman Islands most cases are imported from Honduras,the Caribbean Island of the later is still endemic. Similarly importedcases in Cuba were mostly from Venezuela and in Trinidad andTobago they were from Guyana. Of note is that some imported caseshave been reported from other non-endemic countries. Quality ofinvestigation in these cases needs a revision and sharing ofinformation is vital to ascertain if there is indeed local transmission inone or the other.
2000
2001
2002
2003
2004
2005
2006
2007
2008
2009
2010
2011
2012
2013
2014
2015
0M
50M
100M
150M
200M
250M
US$ [in millions]
Figure 11. Financing for malaria, 2000 - 2015
* Data not available for the years 2000-12 for Haiti, from 2005-11 for Suriname and2006-08 for Venezuela. Data available only for the year 2006 for French Guiana.
Bilaterals
GFATM
USAID
Government
UN Agencies
World Bank
2000
2001
2002
2003
2004
2005
2006
2007
2008
2009
2010
2011
2012
2013
2014
2015
0M
2M
4M
6M
8M
10M
People protected [in millions]
Figure 10. People protected by Indoor Residual Spraying (IRS) andInsecticide-Treated Nets (ITNs), 2000 - 2015
People protected by IRS
People protected by ITNs
Vietnam
Sudan
South Sudan
Philippines
Peru
Panama
Mozambique
Equatorial GuineaCongo
Cambodia
Brazil
French Guiana
Tanzania
Pakistan
Uganda
Angola
Gabon
Ghana
Bolivia
Chad
India
Haiti
Haiti
Mali
Figure 12. Malaria by country from which cases were imported by non-endemic countries in the Region of the Americas, 2013 - 2015
* Does not include cases reported imported by Canada & United States of America.
Import RegionAmericas
Asia
Africa
Number of cases0
20
40
60
80
100
114

CountryYear
2000 2001 2002 2003 2004 2005 2006 2007 2008 2009 2010 2011 2012 2013 2014 2015AnguillaAntigua & BarbudaArubaBahamasBarbadosBermudaBritish Virgin IslandsCanadaCayman IslandsChileCubaDominicaGrenadaGuadeloupeJamaicaMartiniqueMonteserratPuerto RicoSabaSaint BarthelemySaint Kitts & NevisSaint LuciaSaint MartinSaint Vincent & the G*Trinidad & TobagoTurks & Caicos IslandsUnited States of AmericaUruguayUS Virgin IslandsGrand Total 1,642
71,484
8
1
0
4
11
298590022
2,237
21,724
12
1
0
5
10
3740
447022
2,338013
1,742
13
10
0109622
486
4880
52
00
2,26107
1,687
1901201
102521032103
477
92
00
2,54002
1,925
100711
201391012851
517
106
10
2,2730
1,691
2321
1
50712801
31
5140
21
1
1,92405
1,484
24
2110
301122010
4
364
2
00
1,789012
1,298
221
0
201422120
19
3720
14
10
2,1530
1,505
160
0
3
199
00355
384
6
2,218
151,564
80
2
1019460
3331
3330
49
2,044027
1,528180
11
10
88
10952
3650131
20
1,967
541,3241150
01
00101417002671
3750032000
1,814090
1,2783100
10
10169
003071
3650003
00
1,795
241,337180
20
1012712002953
3470061000
1,85020
1,383000
00
00116700000
4300054
20
1,95312
1,4020170
30
10777005373
4380032000
Table 4. Number of malaria cases in non-endemic countries of the the Region of the Americas, 2000 - 2015
*Saint Vincent & the Grenadines **Blank spaces imply no data available ***Preliminary data from Canada for 2015
AfricaAsiaOceaniaUnknown
1222
814328927,5762222
6
184442
203
4
102
752226280
24
2
4
2
2
1 7,576Other Regions
Country/Region fromwhich malaria wasimported
Country / Territory
Bahamas
Barbados
Bermuda
Canada
Cayman
Islands
Chile
Cuba
Grenada
Guadeloupe
Jamaica
Martinique
Puerto Rico
Saint Lucia
Trinidad &
Tobago
U.S.A.
Uruguay
ArgentinaBelize
Bolivia
BrazilColombia
Costa RicaDominican Republic
Ecuador
El SalvadorFrench Guiana
Guatemala
GuyanaHaiti
HondurasJamaica
Mexico
NicaraguaPanama
Peru
VenezuelaCaribbean, unspecified
Central America, unspecifiedFrench Guiana + Guyana
South America, unspecified
2
2
12
24
72
24
6
34
76108
46
6
272
2
618
2
22
8
4020
2
4
4
2
26
2
2
2
12
2
2
4
2
8
2
10
2
2
6
4
6
2
2
2
120
Table 5. Imported cases in non-endemic countries of the Americas by country / Region oforigin, 2013 - 2015
1 108Countries of the Americas
* U.S.A. - United States ofAmerica
Related Documents