Report on the October 2014 Mineral Soil Sampling Test Program North Abitibi Property Larder Lake Mining Division Hoblitzell Township, Ontario 49° 29’ 26” N, 79° 55’ 33” W NTS 32E05 and 32E12 Tri Origin Exploration Ltd. #18-125 Don Hillock Drive Aurora, ON L4G 0H8 Meghan Hewton, MSc. January 19, 2015

Welcome message from author
This document is posted to help you gain knowledge. Please leave a comment to let me know what you think about it! Share it to your friends and learn new things together.
Transcript

Report on the October 2014 Mineral Soil
Sampling Test Program
North Abitibi Property
Larder Lake Mining Division
Hoblitzell Township, Ontario
49° 29’ 26” N, 79° 55’ 33” W
NTS 32E05 and 32E12
Tri Origin Exploration Ltd.
#18-125 Don Hillock Drive
Aurora, ON
L4G 0H8
Meghan Hewton, MSc.
January 19, 2015

i
TABLE OF CONTENTS
Page Table of Contents ………………………….………………………………………………………... i Introduction and Property Description ……………………………...……………………..…..... 1 Property Geology ……......................……………………...……………...……………….……..... 5 Archean Geology ………………………………………………………………………….... 5 Quaternary Geology ……………………………………………………………………...… 6 October 2014 Mineral Soil Sampling Program …....…………………………………..……....... 8 Sampling Method …………………………………………………………………………... 8 Results ...………………………………………………………………………………….… 9 Discussion and Conclusions …...……………………………………...…………………..……... 14 References ………………………………………………………………………........................... 16 Statement of Qualifications ……………………..……………………………………..……...… 17 FIGURES Figure 1 – Location of the North Abitibi gold property, Larder Lake Mining Division. …….…….. 2 Figure 2 – Claim boundaries at the North Abitibi property for claims held by Tri Origin
Exploration. …….………………………………………………………………………. 4 Figure 3 – Amalgamation of overburden work completed between 1986 and 2014 over the Spade
Lake and Road gold zones, along with Quaternary geology map (Gao 2013). .….…..... 7 Figure 4 – Clay content of samples collected from the Road and Spade Lake zones. …….............. 9 Figure 5 – Results of mineral soil geochemical analyses for gold performed by AR-MS. …..…… 11 Figure 6 – Results of mineral soil geochemical analyses for silver performed by AR-MS. ....…… 12 TABLES Table 1 - List of Claims. …………………………………………………………..……………...… 3 Table 2 - Summary statistics of geochemical analytical results from mineral soil samples for
selected elements. …………………………………………………………………....... 13 APPENDICES Appendix A – Certificate of analysis and analytical results for mineral soil samples. ………….... 18 Appendix B – Geochemical Survey Maps. …………..………………………………………........ 29 Appendix B1 – Mineral soil geochemical analyses for copper performed by AR-MS. ....….......... 29 Appendix B2 – Mineral soil geochemical analyses for zinc performed by AR-MS. ……............... 31 Appendix B3 – Mineral soil geochemical analyses for arsenic performed by AR-MS. …….......... 33 Appendix B4 – Mineral soil geochemical analyses for iron performed by AR-MS. ……............... 35

1
Introduction and Property Description
The North Abitibi property is located in Hoblitzell Township, Larder Lake Mining Division,
approximately 20 km west of the Ontario/Québec border and 120 km northeast of Cochrane, ON
(Figure 1). The property is accessible by the all-weather gravel “Tomlinson Road”, which departs
north from the “Trans-Limit Road” at kilometer 89 as measured from Cochrane. The property
consists of 16 unpatented, contiguous claims totaling 179 units and covering an area of 2,864 ha.
All of the claims are held as 100% interest by Tri Origin Exploration Ltd. through an agreement
with Vista Gold Corporation and are in good standing until at least January 27, 2016. Table 1 lists
the claims and current ownership, and Figure 2 shows the geographic boundaries of each claim.

2
Figure 1. Location of the North Abitibi gold property, Larder Lake Mining Division.

3
Table 1. List of claims.
Claim Number Recorded Holder Due Date 4202440 Tri Origin Exploration (100%) April 27, 2016 4202444 Tri Origin Exploration (100%) April 27, 2016 4202445 Tri Origin Exploration (100%) April 27, 2016 4202446 Tri Origin Exploration (100%) April 27, 2016 4202448 Tri Origin Exploration (100%) April 27, 2016 4202449 Tri Origin Exploration (100%) April 27, 2016 4203555 Tri Origin Exploration (100%) January 27, 2016 4203556 Tri Origin Exploration (100%) January 27, 2016 4203557 Tri Origin Exploration (100%) January 27, 2016 4203558 Tri Origin Exploration (100%) January 27, 2016 4203559 Tri Origin Exploration (100%) January 27, 2016 4203560 Tri Origin Exploration (100%) January 27, 2016 4203561 Tri Origin Exploration (100%) January 27, 2016 4209464 Tri Origin Exploration (100%) April 27, 2016 4209468 Tri Origin Exploration (100%) April 27, 2016 4209469 Tri Origin Exploration (100%) April 27, 2016

4
Figure 2. Claim boundaries at the North Abitibi property for claims held by Tri Origin Exploration.
In the summer of 2008, Tri Origin Exploration conducted a peat and mineral soil sampling
survey over the North Abitibi gold property which produced little in the way of meaningful or
interpretable results (Canam and Bartram 2008). It is likely that the water-logged nature of the peat
horizon and surficial processes influence the geochemical signature of the peat to a much greater
degree than does the underlying bedrock geology, and therefore bedrock geochemistry was not
reflected in the peat geochemical survey results. The mineral soil underlying the peat may better
reflect geochemical dispersion haloes from the bedrock than does the peat. A test mineral soil
sampling survey over known gold-mineralized zones was therefore proposed in order to test
efficacy, sampling protocol, and whether this is the appropriate sample material to help identify
other mineralized zones through thick peat and deep overburden. Mineral soil samples were
collected by Ore Galore Exploration Services contracted by Tri Origin Exploration between

5
October 3 and 5, 2014 over two mineralized zones (Road and Spade Lake zones) across two lines
each. The sampling lines were entirely enclosed within claims 4203558 and 4203559. Final
analytical results were received by Tri Origin Exploration on November 3, 2014.
Property Geology
Archean Geology
The North Abitibi region is underlain by volcanic, volcaniclastic, sedimentary, and intrusive
rocks of the east-west trending Burntbush greenstone belt, a northwestern extension of the Archean
Abitibi Subprovince. The Burntbush greenstone belt is 60 to 90 km wide north to south and extends
for over 150 km eastward into Quebec as the Harricana-Turgeon greenstone belt, which hosts the
Mattagami, Selbaie, Joutel, and Casa Berardi mining camps. See Jackson and Fyon (1991) for an
overview of the geology of the western Abitibi Subprovince.
The geology of the property has been compiled from drill core logs, trench mapping, and
geophysical interpretation, since bedrock outcrops are rare. The property is underlain by a mixed
assemblage of east-west trending felsic, intermediate, and mafic volcanic, pyroclastic, and
volcaniclastic rocks, with minor sedimentary rocks (greywacke, argillite, and banded magnetite-
silica iron formation). Drill core logs and trench mapping indicate a moderate to steep northerly dip
of the units. Evidence from drill core at the north end of the property near Spade Lake indicates
bedding tops to the north, but no such evidence has been reported elsewhere on the property. These
units are intruded by a coarse-grained to porphyritic granite to granodiorite known as the Spade
Lake porphyry. The intrusions are likely comprised of discontinuous dykes, sills, or small plugs.
Gold mineralization is associated with pyritic quartz ± iron carbonate ± feldspar veins cutting
dacitic to rhyodacitic and occasionally andesitic to basaltic volcanic rocks and pyritic schists.
Mineralization occurs in at least two discrete east-west trending zones. The “Road zone”, located on
the west side of Tomlinson Road was originally discovered and exposed by Newmont Exploration
during their 1986 and 1987 diamond drilling and 1986 trench mapping programs. Diamond drilling
in 2007 and 2008, as well as trenching in 2011, by Tri Origin Exploration expanded the surface and
underground extents of mineralization at the Road zone. Gold mineralization at the Road zone has
been exposed at the surface in trenches between 5,482,020 and 5,482,080 m N, and delineated as a
steeply north-dipping, east-west trending zone. Assay results from drill core have returned values

6
up to 17.8 g/t Au, while grab samples from trenches have returned up to 43 g/t Au and 140 g/t Ag
(Kendle 2012). On the northeast side of Spade Lake, the “Spade Lake zone” has been intersected by
numerous diamond drillholes between 1988 and 2008, which have delineated a steeply north-
dipping, east-west trending mineralized zone. Gold mineralization at the Spade Lake zone is
predicted to project to the surface from drillhole data to the north of Spade Lake between 5,483,150
and 5,483,250 m N. Assays from diamond drill core have returned up to 12.6 g/t Au.
Quaternary Geology
Across the North Abitibi property, RC overburden drilling and stratigraphic logging by
Newmont Exploration (Richard 1986) and Cogema Canada Ltd. (Learn 1988a, 1988b) recorded the
overburden stratigraphy as generally quite thick (3 to over 25 m). Stratigraphically, the area
comprises a basal unit of locally-derived melt-out or lodgement till identified as the Illinoian glacial
stage Lower till, which is only locally developed and generally up to a couple of meters thick. Both
the Lower till and bedrock are unconformably overlain by light grey, silty to locally sandy, locally-
to distally-derived glacial and glaciolacustrine till known as the Matheson Formation. The
Matheson Formation is overlain by medium grey, soft, fine, clayey Barlow-Ojibway Formation
glaciolacustrine sediments deposited at the bottom of proglacial Lake Ojibway by long-distance
transport, which is in turn overlain by light beige to brownish grey, clayey to sandy-clayey
diamicton till with local sandy interbeds of the Wisconsinan-stage Cochrane Formation which is
generally 2.3 to >10 m thick and consists of reworked sediments derived from the Barlow-Ojibway
Formation. The overburden succession is generally capped by a peat layer which can be up to 4 m
thick. For more information on the Quaternary stratigraphy of the North Abitibi area, see reverse
circulation drilling reports by J. Learn for Cogema (Learn 1988a, 1988b) and J.A. Richard for
Newmont Exploration (Richard 1986), as well as mapping by C. Gao (Gao 2013). Figure 3 presents
a summary of reverse circulation overburden holes drilled by Newmont Exploration (1986) and
Cogema Canada (1988a, 1988b), from which most of the information regarding Quaternary
stratigraphy has been drawn, accompanied by government surficial mapping (Gao 2013) and the
locations of trenches and diamond drill holes.

7
Figure 3. Amalgamation of overburden work completed between 1986 and 2014 over the Spade Lake and Road gold zones, along with Quaternary geology map by Gao (2013).
Spad
e
Lake
zo
ne
Road
zo
ne

8
Mineral Soil Sampling Test Program
Sampling Method
Gold mineralization at the Road zone has been exposed at the surface in trenches between
5,482,020 and 5,482,080 m N. Meanwhile, gold mineralization at the Spade Lake zone is predicted
to project to the surface just to the north of Spade Lake between 5,483,150 and 5,483,250 m N. The
sampling lines over the Road and Spade Lake gold zones (Figure 3) were planned to cross over the
surface projections of gold mineralization at each zone. The sampling lines therefore consist of two
parallel lines oriented north-south and separated by 200 m (lines at 576,300 m E and 576,500 m E
at the Road zone, and 577,460 m E and 577,660 m E at the Spade Lake zone). Samples were
collected by Ore Galore Exploration Services contracted by Tri Origin Exploration between
October 3 and 5, 2014. Sampling lines were 425 m long at the Road Zone and 400 m long at the
Spade Lake zone. Samples were taken every 25 m; where human disturbance had occurred (ie. trail
building, drilling, etc.) or the overlying peat was too thick for the auger to pass through (>2 m),
samples were taken up to 15 m away in any direction from the target site where a sample could be
collected. If a sample could not be collected at a particular site, the site was skipped.
Samples were collected using a hand-held steel auger. The auger was manually driven through
the peat (if present) until the underlying inorganic/mineral soil was encountered. The sample was
then collected from 25 to 35 cm below the top of the mineral soil horizon. Where there was no peat
developed, the sample was taken 25 cm below the base of the soil’s A horizon (if developed) or
below the top of the mineral soil horizon. The sample was photographed, described, and placed in a
brown soil sample bag. Large clasts, pebbles, and roots were removed from the sample by hand.
Field duplicate samples were taken at every 25th site from a second hole beside the original hole.
Samples were air dried at room temperature and submitted to Activation Laboratories Ltd in
Thunder Bay, ON. Samples were prepared by Activation Laboratories according to preparation
code S1-DIS, so that samples were dried at 60°C and sieved to -80 mesh. Samples were then
analysed by FA-AA (according to Activation Laboratories’ analytical package code 1A2-Tbay Au –
fire assay AA) and ICP-MS (analytical package code UT-1-Tbay aqua regia ICP-MS). Standards,
lab duplicates, and blanks were inserted by Activation Laboratories. Final analytical results were
received by Tri Origin Exploration on November 3, 2014.

9
Results
Sixty-six mineral soil samples (including two field duplicates) were collected. Forty of these
samples were collected from two sampling lines over the Road zone, and 26 samples were collected
from two lines over the Spade Lake zone. The original sampling plan had planned for 34 samples to
be collected from the Spade Lake zone however, 8 samples could not be collected from the southern
end of the eastern-most line (line 577,660 m E) due to a very thick peat horizon exceeding 2 m.
Samples from both zones were generally very clay-rich (28 samples from the Road zone and
25 samples from the Spade Lake zone were described as being comprised of 70% or more clay
content; Figure 4), pebble-poor, and ranged in colour from various shades of grey, brownish-grey,
and brown. Samples from the Road zone had greater variability in silt and sand content; several
samples were quite sandy and well-drained, comprising 70 to 90% sand and silt. These samples
tended to be from the western-most sample line (line 576,300 m E) closer to the trench area. Many
of the samples from both zones were very moist to wet and contained little organic matter.
Figure 4. Clay content of samples collected from the Road and Spade Lake zones.
All samples were analysed by FA-AA and returned gold values below the detection limit (<5
ppb). As a result, aqua regia digest mass spectrometry (AR-MS) was used to analyse samples for
gold concentration. AR-MS is a semi-quantitative analysis for gold, and caution must be taken
when interpreting results. The aqua regia leach will dissolve free gold, gold-bearing tellurides, and
02468
101214161820
100% 90% 80% 70% 60% 50% 40% 30% 20% 10% 0%
Num
ber o
f Sam
ples
Clay content
Road ZoneSpade Lake Zone

10
gold-bearing sulphide (provided the sample is low in sulphide), but only partially dissolves silicates
and oxides (de Caritat et al. 2010), and so the technique does not provide a total gold concentration.
Of the 66 soil samples that were analysed by AR-MS (Figure 5), only two samples returned gold
concentration below detection (<0.5 ppb). Both of these samples were collected from the Road
zone. The majority of the samples from the Road zone returned Au values less than 10 ppb, with the
exception of three values from the northern half of the zone (10.2, 10.8, and 33.6 ppb). The
majority of samples from the Spade Lake zone exceeded 10 ppb Au, with half (13 of 26) returning
values of 25.0 to 27.3 ppb. These values are considered very low, but anomalous (“anomalous”
values being greater than 2 standard deviations from the mean analytical result for the element of
interest).
All other elements were analysed by AR-MS only. All samples from both zones were
analysed for sulphur and returned values below detection limit (<1%). All samples from both zones
returned very low silver concentrations (Figure 6), with no samples exceeding 183 ppb, and no
samples were considered anomalous. Analytical results for copper and zinc did not exceed 49.1
ppm and 73.3 ppm, respectively. Results for iron were low and did not exceed 3.30%. Minor values
for arsenic were returned from both zones (2.4 to 8.4 ppm). Results for the alkali elements
potassium and sodium were also low, returning values below 0.54 % and 0.05%, respectively.
Results for calcium and magnesium were quite variable, ranging from 0.24 to 9.73% Ca and 0.34 to
2.83% Mg.
Table 2 presents summary statistics of geochemical analyses from soil samples for selected
elements. A certificate of analysis and analytical results from Activation Laboratories can be found
in Appendix A. Geochemical survey maps of each element of interest can be found in Appendix B.

11
Figure 5. Results of mineral soil geochemical analyses for gold performed by AR-MS.

12
Figure 6. Results of mineral soil geochemical analyses for silver performed by AR-MS.

13
Table 2. Summary statistics of geochemical analytical results from mineral soil samples for selected elements.
Sample Area
Au (ppb)
Au (ppb)
Ag (ppm)
As (ppm)
Cu (ppm)
Mo (ppm)
Zn (ppm)
Fe (%)
K (%)
Na (%)
Ca (%)
Mg (%)
S (%)
Analysis FA-AA
AR-MS
AR-MS
AR-MS
AR-MS
AR-MS
AR-MS
AR-MS
AR-MS
AR-MS
AR-MS
AR-MS
AR-MS
Detection
Limit 5 0.5 0.002 0.1 0.01 0.01 0.1 0.01 0.01 0.001 0.01 0.01 1 Road Zone n = 40
Average -5 3.4 0.053 2.5 15.74 0.20 38.3 2.09 0.26 0.030 1.47 0.97 -1
Standard Deviation 0 5.4 0.026 1.3 8.14 0.26 8.3 0.41 0.07 0.007 1.63 0.54 0
Median -5 2.2 0.047 2.2 13.90 0.15 38.6 2.05 0.26 0.032 0.71 0.81 -1
Maximum -5 33.6 0.183 8.4 49.10 1.69 55.0 2.96 0.37 0.041 6.97 2.47 -1
Minimum -5 -0.5 0.018 1.2 4.66 0.04 20.5 1.24 0.11 0.015 0.24 0.34 -1 Spade Lake Zone
n = 26
Average -5 22.2 0.070 2.3 17.56 0.17 49.5 2.45 0.34 0.037 3.60 1.60 -1
Standard Deviation 0 7.3 0.035 0.9 4.51 0.15 10.9 0.46 0.08 0.007 2.63 0.65 0
Median -5 24.8 0.064 2.1 16.60 0.12 51.5 2.47 0.32 0.038 3.41 1.62 -1
Maximum -5 27.3 0.171 4.6 27.10 0.54 73.3 3.30 0.54 0.048 9.73 2.83 -1
Minimum -5 1.2 0.028 0.8 10.70 -0.01 24.5 1.21 0.19 0.024 0.50 0.65 -1 All
Samples n = 66
Average -5 10.8 0.059 2.4 16.46 0.19 42.8 2.23 0.29 0.033 2.31 1.22 -1
Standard Deviation 0 11.1 0.031 1.2 6.96 0.22 10.8 0.47 0.09 0.008 2.32 0.66 0
Median -5 3.2 0.049 2.2 15.65 0.14 42.8 2.19 0.30 0.034 1.04 0.90 -1
Maximum -5 33.6 0.183 8.4 49.10 1.69 73.3 3.30 0.54 0.048 9.73 2.83 -1
Minimum -5 -0.5 0.018 0.8 4.66 -0.01 20.5 1.21 0.11 0.015 0.24 0.34 -1

14
Discussion and Conclusions
Despite gold mineralization at the Spade Lake zone being predicted to subcrop on the north
side of Spade Lake between 5,483,150 and 5,483,250 m N, no samples from the Spade Lake zone
showed distinct gold (or any other metal) enrichment. Results for gold analyses from mineral soil
samples were instead consistent between all samples across the length of both sampling lines.
Anomalous, though low, gold values determined by AR-MS (up to 27.3 ppb) demonstrated a weak
association with other anomalous (though also low) values for other metals and alkali elements. In
the sampling area around the Spade Lake zone, RC overburden drilling and stratigraphic logging by
Cogema (Learn 1988a, 1988b) described the overburden stratigraphy as generally quite thick (9 to
over 25 m). Stratigraphically, the area is comprised of several units of clay-dominant and locally
silty to sandy till of glacial and glaciolacustrine origin which is generally distally-derived, but may
be locally sourced in places. The uppermost unit is the light beige, clayey to sandy clayey,
reworked Cochrane Formation till which is generally 2.3 to >10 m thick. This till was also mapped
at surface by Gao (2013) as the Cochrane Formation. The overburden succession is capped by peat
which exceeds 1 m in thickness. Most samples from the Spade Lake zone were described as very
clay-rich, grey to beige or light brown, and were likely collected from the Cochrane till. Since the
till is so clay-rich and soil geochemical analyses for metals and alkalis returned such low values, it
is likely that the clay-rich beds of the Cochrane Formation and other underlying tills act as
impermeable or semi-permeable layers to groundwater and metal mobility, and therefore prevent
most (if not all) of the geochemical signature from the underlying bedrock and associated gold and
sulphide mineralization from being transported to the surface by geochemical dispersion or
groundwater mobility.
The overburden around the Road zone is generally not as thick as at the Spade Lake zone, but
is variable in thickness (Richard 1986). Proximal meltout or lodgement till (likely the Lower till) is
a couple of meters thick and only locally present, and is overlain by 1 to several meters of
glaciofluvial sand and gravel, which is overlain by several meters of clayey diamicton with local
sandy interbeds (the Cochrane till), and capped by 0 to 2 m of peat. Very few samples with
anomalous gold, silver, or other metals were returned, indicating that the geochemical signature
from the underlying bedrock and associated gold/sulphide mineralization is not being transported to
the surface by geochemical dispersion or groundwater and metal mobility. Despite knowing the
location of gold mineralization at the surface, and that it is comparatively close to the surface in the

15
trenching area, there was no obvious relationship between gold mineralization and mineral soil
sample analytical results. Gold values determined by FA-AA were all below the detection limit, and
gold values determined by AR-MS were consistently low; only one sample returned an anomalous
value (33.6 ppb), but this sample was collected 120 m north of the known surface mineralization
and is therefore not associated with Road zone gold mineralization. Similar to the Spade Lake zone,
the clay-rich glacial and glaciolacustrine deposits may be acting as impermeable layers to
groundwater and metal mobility, and therefore, metals are not reaching the uppermost layers of the
overburden and soil profile.
A weak association between anomalous gold values (by AR-MS) and other metals and alkali
elements in the soil may exist at the Spade Lake zone, determined from geochemical mapping
(Appendix B), but no such association was readily visible at the Road zone, possibly because so
few samples at the Road zone returned anomalous metal values. The results of this test survey
demonstrate that this technique of mineral soil sampling from below the peat horizon is not
effective for gold exploration at this particular property. It is therefore not recommended that this
geochemical sampling technique be used for gold exploration in the region around the North Abitibi
property.

16
References
Canam, P., and Bartram, R. 2008. Report on the Summer 2008 Geochemical Sampling
Program, North Abitibi Property, Hoblitzell Township, Ontario. For Tri Origin Exploration Ltd.
de Caritat, P., Cooper, M., Pappas, W., Thun, C., and Webber, E. 2010. National
Geochemical Survey of Australia: Analytical Methods Manual. Geoscience Australia, Record
2010/15, 22 pp.
Gao, C. 2013. Quaternary Geology, Burntbush Area, northeastern Ontario; Ontario
Geological Survey, Preliminary Map P. 3770, scale 1:100 000.
Jackson, S.L., and Fyon, J.A. 1991. The western Abitibi Subprovince in Ontario; in Thurston,
P. C., et al. eds., Geology of Ontario, Ontario Geological Survey, Special Volume 4, Part 1, p.404-
482.
Kendle, F. 2012. Report on the 2011 Trenching Program, North Abitibi (NA) Property,
Larder Lake Mining Division, Hoblitzell Township, Ontario. For Tri Origin Exploration Ltd.
Learn, J., 1988a, Final Report 1987 Reverse Circulation Drilling, Burntbush River Project,
Cogema Canada Limited. AFRI # 32E12SW0014.
Learn, J., 1988b, Final Report 1988 Reverse Circulation Drilling, Burntbush River Project,
Cogema Canada Limited. AFRI # 32E12SW0017.
Richard, J.A. 1986. For Newmont Exploration of Canada Ltd. 1986 Overburden Drilling
Program: Golden Shield Property, Project 261, Hoblitzell and Noseworthy townships, Ontario.
AFRI #32E12SE0032.

17
Statement of Qualifications
I, Meghan Hewton, of 17 Tindall Lane, Goodwood, Ontario, L0C 1A0, do hereby certify
that:
1. I am employed as a geologist by Tri Origin Exploration Ltd.
2. I graduated with a Master’s of Science (Geology) from Simon Fraser University in 2012,
and a Bachelor of Science (Honours Environmental Geosciences) from the University of
Western Ontario in 2010.
3. I have worked as a geologist for a total of three years.
4. I am responsible for the technical report titled “Report on the October 2014 Mineral Soil
Sampling Test Program, North Abitibi Property”.
5. My knowledge of the property as described herein was obtained by fieldwork and
literature review.
6. I have no direct interest, nor do I expect to receive any interest in the mining claims that
comprise the North Abitibi Property within the Hoblitzell Township in the Larder Lake
Mining division.
7. I am not aware of any material fact or material change with respect to the subject matter
of the Technical Report that is not reflected in the Technical Report, the omission to
disclose which makes the Technical Report misleading.
8. I consent to the filing of the Technical Report with any stock exchange and other
regulatory authority and any publication by them for regulatory purposes, including
electronic publication in the public company files on their websites accessible by the
public, of the Technical Report.
Dated this 9th day of January, 2015.
MEGHAN HEWTON

18
Appendix A
Certificate of analysis and analytical results for mineral soil samples.

Quality Analysis ... Innovative Technologies
Date Submitted: 07-Oct-14
Invoice No.: A14-07393
Invoice Date: 03-Nov-14
Your Reference: north abitibi
TRI Origin Exploration
125 Don Hillock Drive
Unit 18
Aurora Ont L4G 0H8
Canada
ATTN: Robert Valliant
CERTIFICATE OF ANALYSIS
66 Soil samples were submitted for analysis.
The following analytical package was requested: Code 1A2-Tbay Au - Fire Assay AA (QOP Fire Assay Tbay)Code UT-1-TBAY Aqua Regia ICP/MS
REPORT A14-07393
This report may be reproduced without our consent. If only selected portions of the report are reproduced, permissionmust be obtained. If no instructions were given at time of sample submittal regarding excess material, it will bediscarded within 90 days of this report. Our liability is limited solely to the analytical cost of these analyses. Test resultsare representative only of material submitted for analysis.
Notes:Assays are recommended for values >10,000 for Cu and Au. The Au from AR-MS is only semi-quantitative.For accurate Au data,fire assay is recommended.If value exceeds upper limit we recommend reassay by fire assay gravimetric-Code 1A3
CERTIFIED BY:
Emmanuel Eseme , Ph.D.Quality Control
ACTIVATION LABORATORIES LTD.
1201 Walsh Street West, Thunder Bay, Ontario, Canada, P7E 4X6 TELEPHONE +807 622-6707 or +1.888.228.5227 FAX +1.905.648.9613
E-MAIL [email protected] ACTLABS GROUP WEBSITE www.actlabs.com
Page 1/10
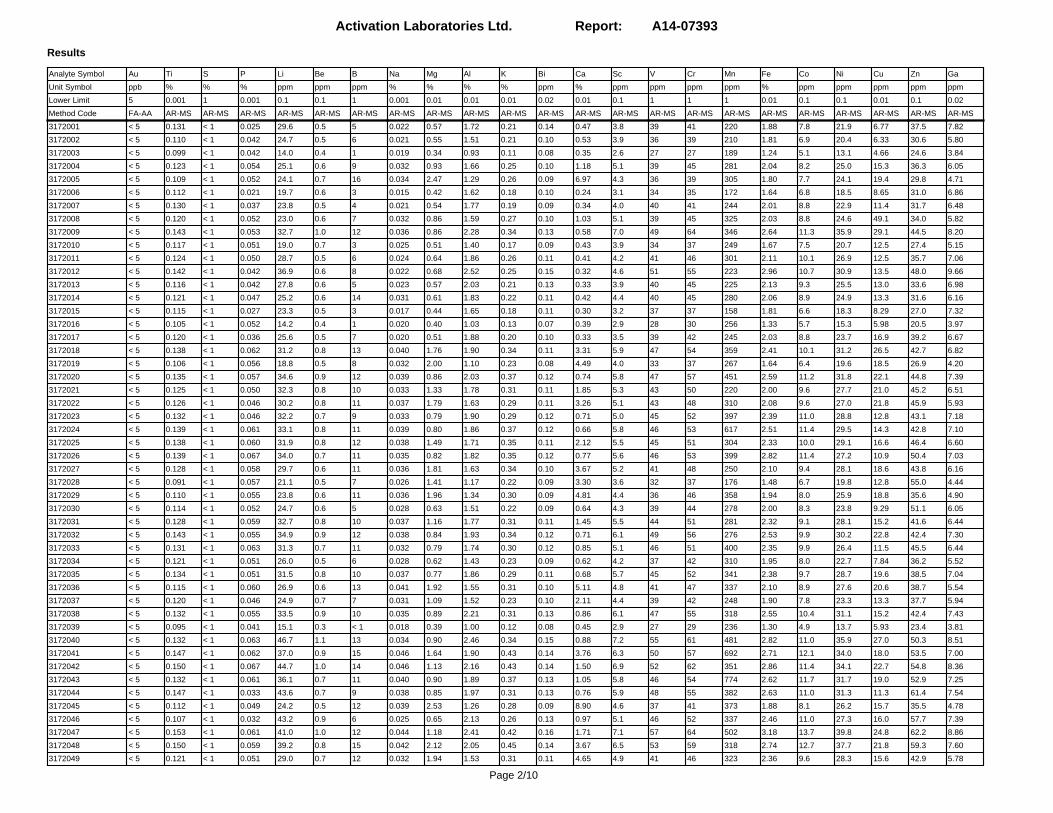
Activation Laboratories Ltd. Report: A14-07393
Results
Analyte Symbol Au Ti S P Li Be B Na Mg Al K Bi Ca Sc V Cr Mn Fe Co Ni Cu Zn Ga
Unit Symbol ppb % % % ppm ppm ppm % % % % ppm % ppm ppm ppm ppm % ppm ppm ppm ppm ppm
Lower Limit 5 0.001 1 0.001 0.1 0.1 1 0.001 0.01 0.01 0.01 0.02 0.01 0.1 1 1 1 0.01 0.1 0.1 0.01 0.1 0.02
Method Code FA-AA AR-MS AR-MS AR-MS AR-MS AR-MS AR-MS AR-MS AR-MS AR-MS AR-MS AR-MS AR-MS AR-MS AR-MS AR-MS AR-MS AR-MS AR-MS AR-MS AR-MS AR-MS AR-MS
3172001 < 5 0.131 < 1 0.025 29.6 0.5 5 0.022 0.57 1.72 0.21 0.14 0.47 3.8 39 41 220 1.88 7.8 21.9 6.77 37.5 7.82
3172002 < 5 0.110 < 1 0.042 24.7 0.5 6 0.021 0.55 1.51 0.21 0.10 0.53 3.9 36 39 210 1.81 6.9 20.4 6.33 30.6 5.80
3172003 < 5 0.099 < 1 0.042 14.0 0.4 1 0.019 0.34 0.93 0.11 0.08 0.35 2.6 27 27 189 1.24 5.1 13.1 4.66 24.6 3.84
3172004 < 5 0.123 < 1 0.054 25.1 0.6 9 0.032 0.93 1.66 0.25 0.10 1.18 5.1 39 45 281 2.04 8.2 25.0 15.3 36.3 6.05
3172005 < 5 0.109 < 1 0.052 24.1 0.7 16 0.034 2.47 1.29 0.26 0.09 6.97 4.3 36 39 305 1.80 7.7 24.1 19.4 29.8 4.71
3172006 < 5 0.112 < 1 0.021 19.7 0.6 3 0.015 0.42 1.62 0.18 0.10 0.24 3.1 34 35 172 1.64 6.8 18.5 8.65 31.0 6.86
3172007 < 5 0.130 < 1 0.037 23.8 0.5 4 0.021 0.54 1.77 0.19 0.09 0.34 4.0 40 41 244 2.01 8.8 22.9 11.4 31.7 6.48
3172008 < 5 0.120 < 1 0.052 23.0 0.6 7 0.032 0.86 1.59 0.27 0.10 1.03 5.1 39 45 325 2.03 8.8 24.6 49.1 34.0 5.82
3172009 < 5 0.143 < 1 0.053 32.7 1.0 12 0.036 0.86 2.28 0.34 0.13 0.58 7.0 49 64 346 2.64 11.3 35.9 29.1 44.5 8.20
3172010 < 5 0.117 < 1 0.051 19.0 0.7 3 0.025 0.51 1.40 0.17 0.09 0.43 3.9 34 37 249 1.67 7.5 20.7 12.5 27.4 5.15
3172011 < 5 0.124 < 1 0.050 28.7 0.5 6 0.024 0.64 1.86 0.26 0.11 0.41 4.2 41 46 301 2.11 10.1 26.9 12.5 35.7 7.06
3172012 < 5 0.142 < 1 0.042 36.9 0.6 8 0.022 0.68 2.52 0.25 0.15 0.32 4.6 51 55 223 2.96 10.7 30.9 13.5 48.0 9.66
3172013 < 5 0.116 < 1 0.042 27.8 0.6 5 0.023 0.57 2.03 0.21 0.13 0.33 3.9 40 45 225 2.13 9.3 25.5 13.0 33.6 6.98
3172014 < 5 0.121 < 1 0.047 25.2 0.6 14 0.031 0.61 1.83 0.22 0.11 0.42 4.4 40 45 280 2.06 8.9 24.9 13.3 31.6 6.16
3172015 < 5 0.115 < 1 0.027 23.3 0.5 3 0.017 0.44 1.65 0.18 0.11 0.30 3.2 37 37 158 1.81 6.6 18.3 8.29 27.0 7.32
3172016 < 5 0.105 < 1 0.052 14.2 0.4 1 0.020 0.40 1.03 0.13 0.07 0.39 2.9 28 30 256 1.33 5.7 15.3 5.98 20.5 3.97
3172017 < 5 0.120 < 1 0.036 25.6 0.5 7 0.020 0.51 1.88 0.20 0.10 0.33 3.5 39 42 245 2.03 8.8 23.7 16.9 39.2 6.67
3172018 < 5 0.138 < 1 0.062 31.2 0.8 13 0.040 1.76 1.90 0.34 0.11 3.31 5.9 47 54 359 2.41 10.1 31.2 26.5 42.7 6.82
3172019 < 5 0.106 < 1 0.056 18.8 0.5 8 0.032 2.00 1.10 0.23 0.08 4.49 4.0 33 37 267 1.64 6.4 19.6 18.5 26.9 4.20
3172020 < 5 0.135 < 1 0.057 34.6 0.9 12 0.039 0.86 2.03 0.37 0.12 0.74 5.8 47 57 451 2.59 11.2 31.8 22.1 44.8 7.39
3172021 < 5 0.125 < 1 0.050 32.3 0.8 10 0.033 1.33 1.78 0.31 0.11 1.85 5.3 43 50 220 2.00 9.6 27.7 21.0 45.2 6.51
3172022 < 5 0.126 < 1 0.046 30.2 0.8 11 0.037 1.79 1.63 0.29 0.11 3.26 5.1 43 48 310 2.08 9.6 27.0 21.8 45.9 5.93
3172023 < 5 0.132 < 1 0.046 32.2 0.7 9 0.033 0.79 1.90 0.29 0.12 0.71 5.0 45 52 397 2.39 11.0 28.8 12.8 43.1 7.18
3172024 < 5 0.139 < 1 0.061 33.1 0.8 11 0.039 0.80 1.86 0.37 0.12 0.66 5.8 46 53 617 2.51 11.4 29.5 14.3 42.8 7.10
3172025 < 5 0.138 < 1 0.060 31.9 0.8 12 0.038 1.49 1.71 0.35 0.11 2.12 5.5 45 51 304 2.33 10.0 29.1 16.6 46.4 6.60
3172026 < 5 0.139 < 1 0.067 34.0 0.7 11 0.035 0.82 1.82 0.35 0.12 0.77 5.6 46 53 399 2.82 11.4 27.2 10.9 50.4 7.03
3172027 < 5 0.128 < 1 0.058 29.7 0.6 11 0.036 1.81 1.63 0.34 0.10 3.67 5.2 41 48 250 2.10 9.4 28.1 18.6 43.8 6.16
3172028 < 5 0.091 < 1 0.057 21.1 0.5 7 0.026 1.41 1.17 0.22 0.09 3.30 3.6 32 37 176 1.48 6.7 19.8 12.8 55.0 4.44
3172029 < 5 0.110 < 1 0.055 23.8 0.6 11 0.036 1.96 1.34 0.30 0.09 4.81 4.4 36 46 358 1.94 8.0 25.9 18.8 35.6 4.90
3172030 < 5 0.114 < 1 0.052 24.7 0.6 5 0.028 0.63 1.51 0.22 0.09 0.64 4.3 39 44 278 2.00 8.3 23.8 9.29 51.1 6.05
3172031 < 5 0.128 < 1 0.059 32.7 0.8 10 0.037 1.16 1.77 0.31 0.11 1.45 5.5 44 51 281 2.32 9.1 28.1 15.2 41.6 6.44
3172032 < 5 0.143 < 1 0.055 34.9 0.9 12 0.038 0.84 1.93 0.34 0.12 0.71 6.1 49 56 276 2.53 9.9 30.2 22.8 42.4 7.30
3172033 < 5 0.131 < 1 0.063 31.3 0.7 11 0.032 0.79 1.74 0.30 0.12 0.85 5.1 46 51 400 2.35 9.9 26.4 11.5 45.5 6.44
3172034 < 5 0.121 < 1 0.051 26.0 0.5 6 0.028 0.62 1.43 0.23 0.09 0.62 4.2 37 42 310 1.95 8.0 22.7 7.84 36.2 5.52
3172035 < 5 0.134 < 1 0.051 31.5 0.8 10 0.037 0.77 1.86 0.29 0.11 0.68 5.7 45 52 341 2.38 9.7 28.7 19.6 38.5 7.04
3172036 < 5 0.115 < 1 0.060 26.9 0.6 13 0.041 1.92 1.55 0.31 0.10 5.11 4.8 41 47 337 2.10 8.9 27.6 20.6 38.7 5.54
3172037 < 5 0.120 < 1 0.046 24.9 0.7 7 0.031 1.09 1.52 0.23 0.10 2.11 4.4 39 42 248 1.90 7.8 23.3 13.3 37.7 5.94
3172038 < 5 0.132 < 1 0.055 33.5 0.9 10 0.035 0.89 2.21 0.31 0.13 0.86 6.1 47 55 318 2.55 10.4 31.1 15.2 42.4 7.43
3172039 < 5 0.095 < 1 0.041 15.1 0.3 < 1 0.018 0.39 1.00 0.12 0.08 0.45 2.9 27 29 236 1.30 4.9 13.7 5.93 23.4 3.81
3172040 < 5 0.132 < 1 0.063 46.7 1.1 13 0.034 0.90 2.46 0.34 0.15 0.88 7.2 55 61 481 2.82 11.0 35.9 27.0 50.3 8.51
3172041 < 5 0.147 < 1 0.062 37.0 0.9 15 0.046 1.64 1.90 0.43 0.14 3.76 6.3 50 57 692 2.71 12.1 34.0 18.0 53.5 7.00
3172042 < 5 0.150 < 1 0.067 44.7 1.0 14 0.046 1.13 2.16 0.43 0.14 1.50 6.9 52 62 351 2.86 11.4 34.1 22.7 54.8 8.36
3172043 < 5 0.132 < 1 0.061 36.1 0.7 11 0.040 0.90 1.89 0.37 0.13 1.05 5.8 46 54 774 2.62 11.7 31.7 19.0 52.9 7.25
3172044 < 5 0.147 < 1 0.033 43.6 0.7 9 0.038 0.85 1.97 0.31 0.13 0.76 5.9 48 55 382 2.63 11.0 31.3 11.3 61.4 7.54
3172045 < 5 0.112 < 1 0.049 24.2 0.5 12 0.039 2.53 1.26 0.28 0.09 8.90 4.6 37 41 373 1.88 8.1 26.2 15.7 35.5 4.78
3172046 < 5 0.107 < 1 0.032 43.2 0.9 6 0.025 0.65 2.13 0.26 0.13 0.97 5.1 46 52 337 2.46 11.0 27.3 16.0 57.7 7.39
3172047 < 5 0.153 < 1 0.061 41.0 1.0 12 0.044 1.18 2.41 0.42 0.16 1.71 7.1 57 64 502 3.18 13.7 39.8 24.8 62.2 8.86
3172048 < 5 0.150 < 1 0.059 39.2 0.8 15 0.042 2.12 2.05 0.45 0.14 3.67 6.5 53 59 318 2.74 12.7 37.7 21.8 59.3 7.60
3172049 < 5 0.121 < 1 0.051 29.0 0.7 12 0.032 1.94 1.53 0.31 0.11 4.65 4.9 41 46 323 2.36 9.6 28.3 15.6 42.9 5.78
Page 2/10

Activation Laboratories Ltd. Report: A14-07393
Analyte Symbol Au Ti S P Li Be B Na Mg Al K Bi Ca Sc V Cr Mn Fe Co Ni Cu Zn Ga
Unit Symbol ppb % % % ppm ppm ppm % % % % ppm % ppm ppm ppm ppm % ppm ppm ppm ppm ppm
Lower Limit 5 0.001 1 0.001 0.1 0.1 1 0.001 0.01 0.01 0.01 0.02 0.01 0.1 1 1 1 0.01 0.1 0.1 0.01 0.1 0.02
Method Code FA-AA AR-MS AR-MS AR-MS AR-MS AR-MS AR-MS AR-MS AR-MS AR-MS AR-MS AR-MS AR-MS AR-MS AR-MS AR-MS AR-MS AR-MS AR-MS AR-MS AR-MS AR-MS AR-MS
3172050 < 5 0.126 < 1 0.042 33.6 0.7 11 0.029 1.60 1.69 0.30 0.12 3.66 5.1 44 47 296 2.53 9.9 28.7 14.8 53.4 6.31
3172051 < 5 0.133 < 1 0.054 32.0 0.7 14 0.040 2.33 1.71 0.37 0.13 6.00 5.7 46 50 301 2.36 10.7 32.1 22.6 47.1 6.32
3172052 < 5 0.156 < 1 0.058 41.7 0.9 16 0.047 1.97 2.26 0.50 0.16 4.06 6.9 57 64 347 3.06 14.0 40.2 27.1 59.0 8.48
3172053 < 5 0.121 < 1 0.051 27.9 0.6 12 0.039 2.35 1.48 0.30 0.10 7.54 5.0 41 45 328 2.09 8.8 28.2 16.7 38.4 5.53
3172054 < 5 0.134 < 1 0.049 31.8 0.8 10 0.032 1.38 1.88 0.30 0.13 2.98 5.5 46 51 311 2.44 9.8 29.4 16.1 45.7 7.31
3172055 < 5 0.155 < 1 0.052 38.5 1.0 12 0.031 0.88 2.43 0.35 0.15 0.72 6.4 55 63 376 2.93 11.9 34.7 16.5 54.6 9.55
3172056 < 5 0.159 < 1 0.051 35.1 0.8 8 0.034 0.86 2.12 0.33 0.13 0.72 5.8 51 57 384 2.68 11.8 32.6 14.4 60.1 8.60
3172057 < 5 0.149 < 1 0.040 30.8 0.6 7 0.030 0.75 1.93 0.26 0.12 0.50 5.0 48 53 309 2.47 10.8 30.7 13.1 49.7 7.86
3172058 < 5 0.141 < 1 0.046 24.4 0.5 4 0.030 0.65 1.51 0.22 0.10 0.56 4.9 42 45 328 2.11 8.9 24.9 10.7 37.4 6.27
3172059 < 5 0.158 < 1 0.039 38.6 0.8 12 0.037 1.25 2.18 0.37 0.16 2.47 6.2 54 61 362 2.74 12.3 34.8 17.8 55.4 9.10
3172060 < 5 0.129 < 1 0.054 29.1 0.6 12 0.039 2.27 1.55 0.32 0.11 6.83 5.3 43 47 369 2.25 9.9 29.8 17.4 42.6 5.89
3172061 < 5 0.126 < 1 0.051 29.4 0.5 9 0.030 1.78 1.51 0.27 0.11 5.00 5.1 39 45 311 2.03 8.9 27.0 14.3 43.2 5.81
3172062 < 5 0.128 < 1 0.054 28.6 0.7 13 0.035 2.48 1.42 0.29 0.11 5.41 5.0 41 45 270 1.97 9.0 27.9 17.1 39.4 5.40
3172063 < 5 0.158 < 1 0.058 49.1 1.0 19 0.045 1.88 2.50 0.54 0.17 2.53 7.5 60 69 360 3.30 15.4 43.7 26.8 73.3 9.47
3172064 < 5 0.098 < 1 0.052 16.1 0.4 5 0.024 1.51 0.87 0.19 0.09 3.15 3.1 27 27 179 1.21 5.7 16.6 11.2 24.5 3.46
3172065 < 5 0.135 < 1 0.054 32.4 0.6 13 0.048 1.88 1.70 0.40 0.13 4.88 5.3 46 51 331 2.38 10.4 32.6 20.6 50.1 6.23
3172069 < 5 0.115 < 1 0.049 24.0 0.6 10 0.036 2.83 1.20 0.27 0.09 9.73 4.5 36 39 330 1.80 7.9 25.0 14.5 34.1 4.53
Page 3/10

Activation Laboratories Ltd. Report: A14-07393
Results
Analyte Symbol Ge As Rb Sr Y Zr Nb Mo Ag In Sn Sb Te Cs Ba La Ce Cd Pr Nd Sm Se Eu
Unit Symbol ppm ppm ppm ppm ppm ppm ppm ppm ppm ppm ppm ppm ppm ppm ppm ppm ppm ppm ppm ppm ppm ppm ppm
Lower Limit 0.1 0.1 0.1 0.5 0.01 0.1 0.1 0.01 0.002 0.02 0.05 0.02 0.02 0.02 0.5 0.5 0.01 0.01 0.1 0.02 0.1 0.1 0.1
Method Code AR-MS AR-MS AR-MS AR-MS AR-MS AR-MS AR-MS AR-MS AR-MS AR-MS AR-MS AR-MS AR-MS AR-MS AR-MS AR-MS AR-MS AR-MS AR-MS AR-MS AR-MS AR-MS AR-MS
3172001 < 0.1 8.4 34.1 29.1 4.86 5.8 2.3 1.69 0.060 < 0.02 0.75 0.11 < 0.02 1.88 65.6 13.2 27.6 0.01 3.2 10.6 1.9 0.3 0.4
3172002 < 0.1 3.0 22.0 24.2 7.04 6.4 1.7 0.52 0.054 < 0.02 0.61 0.08 < 0.02 1.38 75.0 18.6 38.9 0.02 4.6 15.3 2.6 0.3 0.5
3172003 < 0.1 2.0 15.9 19.9 5.94 4.0 1.7 0.30 0.046 < 0.02 0.43 0.05 < 0.02 0.84 34.8 16.7 35.8 0.03 4.1 13.7 2.4 0.5 0.4
3172004 < 0.1 2.5 27.1 30.8 10.8 10.8 0.7 0.20 0.042 < 0.02 0.61 0.08 < 0.02 1.60 76.6 25.8 46.7 0.01 6.2 21.0 3.6 0.6 0.7
3172005 < 0.1 2.8 24.8 60.6 9.38 13.3 0.3 0.25 0.018 < 0.02 0.54 0.09 < 0.02 1.43 69.8 23.0 43.5 0.04 5.4 18.4 3.1 0.4 0.6
3172006 < 0.1 1.8 25.1 19.4 4.01 7.7 1.7 0.29 0.038 < 0.02 0.69 0.06 < 0.02 1.41 61.6 13.8 34.5 0.06 3.2 10.4 1.8 0.5 0.3
3172007 < 0.1 2.3 21.8 22.4 5.97 8.0 1.8 0.23 0.043 < 0.02 0.65 0.10 < 0.02 1.32 61.2 16.9 41.0 0.05 4.0 13.8 2.5 0.5 0.4
3172008 < 0.1 1.9 26.4 27.7 11.2 15.8 0.5 0.14 0.034 < 0.02 0.60 0.12 < 0.02 1.49 76.3 27.3 49.4 0.03 6.3 21.7 3.6 0.4 0.7
3172009 0.1 2.7 34.8 32.8 16.6 14.9 0.6 0.13 0.044 0.03 0.75 0.10 < 0.02 2.21 110 40.5 62.0 0.04 9.3 30.9 5.1 0.6 1.0
3172010 < 0.1 1.8 20.6 24.1 6.99 5.4 1.1 0.14 0.033 < 0.02 0.54 0.04 < 0.02 1.13 56.9 18.9 40.0 0.01 4.7 15.7 2.7 0.4 0.5
3172011 < 0.1 1.7 31.5 22.8 6.50 4.2 1.7 0.20 0.037 < 0.02 0.61 0.07 < 0.02 1.65 83.5 17.4 37.8 0.07 4.1 14.1 2.5 0.4 0.5
3172012 < 0.1 2.7 28.1 20.2 4.89 5.7 2.9 0.40 0.073 0.02 0.83 0.09 < 0.02 1.79 93.8 13.8 36.0 0.08 3.1 10.7 1.8 0.5 0.3
3172013 < 0.1 2.0 23.2 19.9 5.07 4.6 2.0 0.24 0.049 < 0.02 0.66 0.06 < 0.02 1.46 80.3 14.7 39.1 0.07 3.5 11.5 2.0 0.3 0.4
3172014 < 0.1 2.2 22.1 25.3 7.08 6.3 1.3 0.15 0.030 < 0.02 0.60 0.05 < 0.02 1.39 69.6 19.4 45.5 0.04 4.8 16.4 2.8 0.3 0.5
3172015 < 0.1 1.6 27.9 22.7 3.96 5.9 2.1 0.27 0.044 < 0.02 0.71 0.05 < 0.02 1.52 61.1 13.4 31.3 0.05 3.1 10.2 1.7 0.5 0.3
3172016 < 0.1 1.2 15.5 22.1 6.19 5.1 1.2 0.06 0.023 < 0.02 0.42 0.02 < 0.02 0.79 38.4 16.0 35.1 0.02 3.9 13.4 2.4 0.7 0.4
3172017 < 0.1 2.3 23.5 21.6 4.46 4.3 2.2 0.22 0.073 < 0.02 0.63 0.07 < 0.02 1.35 71.4 13.8 37.2 0.11 3.1 10.4 1.8 0.3 0.3
3172018 < 0.1 2.3 32.2 42.3 11.6 13.5 0.7 0.10 0.040 0.02 0.73 0.09 < 0.02 2.00 98.3 29.9 53.8 0.02 7.0 23.4 3.9 0.5 0.8
3172019 < 0.1 3.8 22.1 42.7 9.45 8.9 0.7 0.06 0.035 < 0.02 0.49 0.06 < 0.02 1.12 55.8 21.8 43.3 0.04 5.2 17.7 3.1 6.7 0.6
3172020 < 0.1 2.5 37.9 30.6 10.1 9.1 1.3 0.21 0.042 0.02 0.76 0.08 < 0.02 1.93 107 28.0 61.3 0.04 6.6 21.6 3.7 0.3 0.7
3172021 < 0.1 1.3 33.2 31.6 10.8 7.4 2.1 0.04 0.085 0.02 0.67 0.07 < 0.02 1.73 87.1 27.9 52.9 0.09 6.5 21.9 3.7 0.5 0.7
3172022 < 0.1 1.6 28.7 38.7 10.0 12.4 1.1 0.11 0.043 0.02 0.67 0.07 < 0.02 1.58 80.5 24.9 48.6 0.05 5.9 19.6 3.3 0.5 0.7
3172023 < 0.1 2.2 34.1 28.9 7.82 5.2 1.8 0.09 0.049 0.02 0.75 0.06 < 0.02 1.75 84.0 20.1 48.1 0.04 4.9 16.1 2.8 0.2 0.5
3172024 < 0.1 2.6 33.9 30.0 10.1 16.2 0.8 0.18 0.040 0.02 0.75 0.06 < 0.02 1.79 98.8 27.4 55.6 0.06 6.6 22.0 3.7 0.3 0.7
3172025 < 0.1 3.0 32.1 35.7 10.2 17.7 1.9 0.08 0.058 0.02 0.77 0.07 < 0.02 1.78 89.4 27.5 52.6 0.05 6.4 21.3 3.6 0.4 0.7
3172026 < 0.1 3.5 34.0 31.2 9.16 10.5 1.9 0.20 0.045 0.02 0.77 0.06 < 0.02 1.88 94.5 24.6 54.5 0.09 5.9 19.6 3.3 0.5 0.7
3172027 < 0.1 6.2 31.2 43.0 9.56 17.5 1.2 0.15 0.042 < 0.02 0.71 0.06 < 0.02 1.64 89.8 24.6 48.5 0.05 6.0 20.5 3.4 14.0 0.6
3172028 < 0.1 1.4 22.7 39.3 8.00 7.4 2.4 0.15 0.082 < 0.02 0.64 0.04 < 0.02 1.19 59.5 20.1 41.4 0.17 4.9 16.5 2.8 0.8 0.5
3172029 < 0.1 1.9 29.3 47.2 9.82 9.1 1.7 0.15 0.058 < 0.02 0.60 0.08 < 0.02 1.45 79.3 22.8 44.3 0.07 5.4 18.3 3.2 0.5 0.6
3172030 < 0.1 1.7 28.3 27.4 7.91 3.9 1.7 0.13 0.040 < 0.02 0.63 0.03 < 0.02 1.42 63.7 19.2 40.4 0.06 4.9 16.2 2.8 0.3 0.5
3172031 < 0.1 2.7 31.1 31.6 11.6 6.4 1.6 0.09 0.065 0.02 0.67 0.06 < 0.02 1.70 95.2 28.6 50.8 0.05 6.7 22.6 3.8 1.9 0.8
3172032 < 0.1 2.3 31.8 29.9 11.4 16.4 0.9 0.20 0.049 0.02 0.75 0.08 < 0.02 1.83 105 28.2 52.9 0.04 6.8 22.6 3.8 0.3 0.7
3172033 < 0.1 2.0 37.5 31.1 8.91 3.8 2.2 0.14 0.067 0.02 0.72 0.06 < 0.02 1.75 95.3 22.6 50.0 0.07 5.4 18.5 3.1 0.2 0.6
3172034 < 0.1 1.9 28.3 26.9 8.03 4.3 1.9 0.11 0.049 < 0.02 0.76 0.04 < 0.02 1.38 72.9 20.1 42.6 0.02 4.9 16.9 2.9 0.1 0.5
3172035 < 0.1 2.1 28.5 29.2 11.6 9.4 1.7 0.07 0.053 0.02 0.74 0.05 < 0.02 1.69 89.6 29.8 54.8 0.04 7.0 23.5 4.0 0.3 0.8
3172036 < 0.1 1.9 32.0 52.9 10.7 5.5 1.9 0.10 0.088 < 0.02 0.64 0.08 < 0.02 1.65 101 26.0 46.2 0.05 6.1 20.6 3.5 0.4 0.7
3172037 < 0.1 1.9 27.4 35.9 8.82 8.3 1.5 0.06 0.047 < 0.02 0.67 0.05 < 0.02 1.53 73.5 22.2 41.6 0.07 5.2 17.5 3.0 0.5 0.6
3172038 < 0.1 2.9 33.0 31.9 12.1 8.8 1.4 0.09 0.048 0.02 0.78 0.05 < 0.02 1.92 92.3 30.5 55.1 0.05 7.2 24.5 4.1 1.2 0.8
3172039 < 0.1 1.2 16.3 21.2 7.23 3.8 1.7 0.05 0.059 < 0.02 0.46 < 0.02 < 0.02 0.88 39.9 17.6 33.0 0.04 4.3 14.7 2.5 0.4 0.5
3172040 0.1 3.0 42.7 32.1 18.8 4.0 2.3 0.13 0.183 0.03 0.92 0.07 < 0.02 2.37 128 44.4 56.1 0.08 10.4 35.1 5.9 0.6 1.2
3172041 < 0.1 4.3 38.3 108 12.0 15.9 2.3 0.46 0.089 0.02 0.81 0.08 < 0.02 2.12 124 29.7 56.8 0.08 6.9 23.0 3.9 0.3 0.8
3172042 0.1 2.6 40.2 81.1 15.1 7.9 2.3 0.54 0.152 0.02 0.85 0.08 < 0.02 2.20 107 35.9 58.8 0.07 8.5 29.1 5.0 0.6 1.0
3172043 < 0.1 2.9 37.0 55.9 11.0 11.9 1.8 0.53 0.063 0.02 0.76 0.04 < 0.02 1.94 106 27.9 55.0 0.13 6.6 22.1 3.7 0.4 0.7
3172044 < 0.1 2.3 35.4 52.7 9.69 7.6 2.0 0.22 0.059 0.02 0.81 0.08 < 0.02 1.91 88.2 25.3 52.2 0.07 6.0 20.1 3.4 0.5 0.7
3172045 < 0.1 2.1 25.9 81.0 8.95 14.2 0.7 0.20 0.043 < 0.02 0.54 0.06 < 0.02 1.44 69.6 22.8 43.5 0.05 5.3 17.8 2.9 0.2 0.6
3172046 < 0.1 2.3 36.2 33.6 13.4 4.2 2.3 0.20 0.088 0.03 0.78 0.05 < 0.02 1.91 119 37.4 58.8 0.14 8.6 28.9 4.9 0.6 0.9
3172047 < 0.1 2.8 43.3 50.1 14.0 11.9 3.0 0.34 0.113 0.03 0.88 0.10 < 0.02 2.28 143 33.8 64.8 0.14 8.1 27.0 4.5 0.9 0.9
3172048 < 0.1 1.9 41.3 51.4 11.8 24.5 1.7 0.12 0.080 0.03 0.84 0.10 < 0.02 2.30 117 30.6 58.0 0.05 7.1 24.1 4.0 < 0.1 0.8
3172049 < 0.1 4.6 29.9 51.0 10.1 15.9 1.1 0.11 0.070 < 0.02 0.65 0.05 < 0.02 1.62 81.2 25.6 49.4 0.05 6.1 20.7 3.4 2.4 0.7
Page 4/10

Activation Laboratories Ltd. Report: A14-07393
Analyte Symbol Ge As Rb Sr Y Zr Nb Mo Ag In Sn Sb Te Cs Ba La Ce Cd Pr Nd Sm Se Eu
Unit Symbol ppm ppm ppm ppm ppm ppm ppm ppm ppm ppm ppm ppm ppm ppm ppm ppm ppm ppm ppm ppm ppm ppm ppm
Lower Limit 0.1 0.1 0.1 0.5 0.01 0.1 0.1 0.01 0.002 0.02 0.05 0.02 0.02 0.02 0.5 0.5 0.01 0.01 0.1 0.02 0.1 0.1 0.1
Method Code AR-MS AR-MS AR-MS AR-MS AR-MS AR-MS AR-MS AR-MS AR-MS AR-MS AR-MS AR-MS AR-MS AR-MS AR-MS AR-MS AR-MS AR-MS AR-MS AR-MS AR-MS AR-MS AR-MS
3172050 < 0.1 3.9 30.6 48.2 9.97 10.6 2.0 0.22 0.171 < 0.02 0.70 0.05 < 0.02 1.73 84.9 25.2 49.3 0.07 5.9 19.8 3.3 0.2 0.7
3172051 < 0.1 1.6 35.0 65.1 10.9 20.5 1.7 0.02 0.070 0.02 0.70 0.09 < 0.02 1.89 99.4 28.4 53.0 0.10 6.5 22.3 3.8 0.3 0.7
3172052 < 0.1 2.2 46.8 55.7 12.4 23.8 1.0 0.06 0.049 0.03 0.88 0.12 < 0.02 2.53 132 32.3 61.3 0.11 7.7 25.9 4.3 0.3 0.8
3172053 < 0.1 1.9 27.2 72.3 9.72 16.2 0.9 0.04 0.046 < 0.02 0.62 0.06 < 0.02 1.60 84.3 24.5 46.5 0.04 5.7 19.6 3.3 < 0.1 0.7
3172054 < 0.1 2.0 36.4 43.6 10.1 9.3 1.5 0.05 0.050 0.02 0.75 0.05 < 0.02 1.98 91.1 25.9 49.5 0.04 6.2 21.0 3.5 < 0.1 0.7
3172055 < 0.1 1.6 46.4 32.2 10.2 9.3 2.2 0.09 0.066 0.02 0.99 0.04 < 0.02 2.54 112 27.6 53.5 0.04 6.5 21.8 3.6 < 0.1 0.7
3172056 < 0.1 3.1 43.2 33.0 8.56 8.3 2.3 0.04 0.064 0.02 0.83 0.06 < 0.02 2.15 95.8 23.2 46.2 0.03 5.4 18.1 3.0 3.2 0.6
3172057 < 0.1 2.3 31.7 28.8 6.44 9.1 1.8 0.12 0.035 0.02 0.78 0.05 < 0.02 1.74 71.5 17.3 38.3 0.05 4.1 13.7 2.4 < 0.1 0.5
3172058 < 0.1 1.7 26.8 31.1 8.50 8.4 1.3 0.05 0.028 < 0.02 0.66 0.03 < 0.02 1.42 57.5 20.8 43.0 0.04 5.2 17.5 3.0 < 0.1 0.6
3172059 < 0.1 1.9 42.9 43.5 8.73 13.5 1.8 0.10 0.041 0.03 0.88 0.07 < 0.02 2.36 98.4 23.4 51.7 0.08 5.6 18.8 3.1 < 0.1 0.6
3172060 < 0.1 1.9 30.8 68.4 10.3 9.6 0.8 0.08 0.036 0.02 0.63 0.06 < 0.02 1.70 89.3 26.5 50.1 0.03 6.1 20.5 3.5 < 0.1 0.7
3172061 < 0.1 2.5 27.6 64.5 9.91 19.1 2.5 0.10 0.073 0.02 0.66 0.05 < 0.02 1.77 84.4 25.3 48.0 0.05 6.0 20.1 3.4 < 0.1 0.7
3172062 < 0.1 1.2 28.0 62.7 10.3 20.7 1.9 0.14 0.106 < 0.02 0.63 0.06 < 0.02 1.55 80.9 26.1 50.3 0.08 6.3 21.2 3.6 < 0.1 0.7
3172063 < 0.1 1.9 50.1 52.4 12.7 28.4 1.5 0.18 0.081 0.03 0.93 0.11 < 0.02 2.75 139 32.8 62.1 0.09 7.9 26.6 4.3 < 0.1 0.8
3172064 < 0.1 1.1 17.7 41.5 7.81 16.3 1.4 0.10 0.045 < 0.02 0.45 0.05 < 0.02 0.94 46.7 19.8 39.3 0.03 4.8 16.1 2.7 0.2 0.5
3172065 < 0.1 2.0 38.1 59.8 9.23 26.4 1.5 0.31 0.063 0.02 0.68 0.08 < 0.02 2.07 109 24.4 46.7 0.07 5.8 19.4 3.2 < 0.1 0.6
3172069 < 0.1 0.8 23.7 79.7 9.19 5.3 0.7 < 0.01 0.030 < 0.02 0.50 0.05 < 0.02 1.32 65.1 23.4 44.9 0.04 5.4 18.2 3.0 < 0.1 0.6
Page 5/10

Activation Laboratories Ltd. Report: A14-07393
Results
Analyte Symbol Gd Tb Dy Ho Er Tm Yb Lu Hf Ta W Re Au Tl Pb Th U Hg
Unit Symbol ppm ppm ppm ppm ppm ppm ppm ppm ppm ppm ppm ppm ppb ppm ppm ppm ppm ppb
Lower Limit 0.1 0.1 0.1 0.1 0.1 0.1 0.1 0.1 0.1 0.05 0.1 0.001 0.5 0.02 0.01 0.1 0.1 10
Method Code AR-MS AR-MS AR-MS AR-MS AR-MS AR-MS AR-MS AR-MS AR-MS AR-MS AR-MS AR-MS AR-MS AR-MS AR-MS AR-MS AR-MS AR-MS
3172001 1.5 0.2 1.0 0.2 0.5 < 0.1 0.4 < 0.1 < 0.1 < 0.05 < 0.1 < 0.001 4.7 0.17 8.26 3.1 0.5 < 10
3172002 2.1 0.3 1.5 0.3 0.7 < 0.1 0.6 < 0.1 < 0.1 < 0.05 < 0.1 < 0.001 2.7 0.14 7.10 5.1 0.6 < 10
3172003 1.9 0.2 1.3 0.2 0.6 < 0.1 0.5 < 0.1 < 0.1 < 0.05 < 0.1 < 0.001 1.1 0.09 5.74 4.5 0.5 < 10
3172004 2.8 0.4 2.1 0.4 1.0 0.1 0.8 0.1 < 0.1 < 0.05 < 0.1 < 0.001 1.3 0.19 6.89 6.9 0.6 30
3172005 2.7 0.3 1.9 0.4 0.9 0.1 0.8 0.1 0.1 < 0.05 < 0.1 < 0.001 0.6 0.19 6.83 6.4 0.7 20
3172006 1.4 0.2 0.9 0.2 0.4 < 0.1 0.3 < 0.1 < 0.1 < 0.05 < 0.1 < 0.001 < 0.5 0.15 7.81 4.7 0.5 20
3172007 2.0 0.2 1.3 0.2 0.6 < 0.1 0.5 < 0.1 < 0.1 < 0.05 < 0.1 < 0.001 2.1 0.14 8.08 5.9 0.6 20
3172008 3.0 0.4 2.1 0.4 1.0 0.1 0.8 0.1 0.1 < 0.05 < 0.1 < 0.001 1.9 0.19 6.71 7.2 0.6 10
3172009 4.2 0.5 2.9 0.6 1.5 0.2 1.2 0.2 < 0.1 < 0.05 < 0.1 < 0.001 4.0 0.26 8.53 9.2 0.7 20
3172010 2.2 0.3 1.5 0.3 0.7 < 0.1 0.6 < 0.1 < 0.1 < 0.05 < 0.1 < 0.001 3.5 0.13 6.75 6.0 0.6 30
3172011 2.1 0.3 1.4 0.3 0.6 < 0.1 0.5 < 0.1 < 0.1 < 0.05 < 0.1 < 0.001 1.8 0.16 7.76 4.9 0.6 < 10
3172012 1.5 0.2 1.0 0.2 0.5 < 0.1 0.4 < 0.1 < 0.1 < 0.05 < 0.1 < 0.001 2.0 0.17 10.9 4.7 0.6 30
3172013 1.6 0.2 1.1 0.2 0.5 < 0.1 0.4 < 0.1 < 0.1 < 0.05 < 0.1 < 0.001 3.3 0.15 8.85 4.8 0.6 30
3172014 2.3 0.3 1.6 0.3 0.8 < 0.1 0.6 < 0.1 < 0.1 < 0.05 < 0.1 < 0.001 2.5 0.16 8.17 6.6 0.6 20
3172015 1.3 0.2 0.8 0.2 0.4 < 0.1 0.3 < 0.1 < 0.1 < 0.05 < 0.1 < 0.001 2.8 0.15 8.08 4.2 0.5 20
3172016 1.8 0.2 1.3 0.2 0.6 < 0.1 0.5 < 0.1 < 0.1 < 0.05 < 0.1 < 0.001 2.8 0.10 5.49 4.8 0.5 30
3172017 1.5 0.2 0.9 0.2 0.4 < 0.1 0.4 < 0.1 < 0.1 < 0.05 < 0.1 < 0.001 2.8 0.13 8.15 4.5 0.5 40
3172018 3.2 0.4 2.3 0.4 1.1 0.2 0.9 0.1 < 0.1 < 0.05 < 0.1 0.001 10.2 0.24 8.58 8.5 0.7 30
3172019 2.6 0.3 1.8 0.3 0.9 0.1 0.7 0.1 < 0.1 < 0.05 < 0.1 < 0.001 5.1 0.15 5.94 5.9 0.6 20
3172020 3.2 0.4 2.1 0.4 1.0 0.1 0.8 0.1 < 0.1 < 0.05 < 0.1 < 0.001 1.0 0.21 9.62 8.8 0.8 20
3172021 3.0 0.4 2.1 0.4 1.0 0.1 0.8 0.1 < 0.1 < 0.05 < 0.1 < 0.001 2.4 0.19 8.70 6.9 0.7 40
3172022 2.8 0.4 2.0 0.4 0.9 0.1 0.8 0.1 < 0.1 < 0.05 < 0.1 < 0.001 10.8 0.19 8.10 6.5 0.6 30
3172023 2.3 0.3 1.6 0.3 0.8 0.1 0.6 < 0.1 < 0.1 < 0.05 < 0.1 < 0.001 2.0 0.17 9.48 6.3 0.6 < 10
3172024 3.0 0.4 2.1 0.4 1.0 0.1 0.8 0.1 0.1 < 0.05 < 0.1 < 0.001 2.2 0.20 8.56 8.3 0.7 10
3172025 3.1 0.4 2.0 0.4 1.0 0.1 0.8 0.1 0.2 < 0.05 < 0.1 < 0.001 2.2 0.20 8.49 7.4 0.8 30
3172026 2.8 0.4 1.9 0.4 0.9 0.1 0.7 0.1 < 0.1 < 0.05 < 0.1 < 0.001 2.8 0.20 9.13 7.6 0.8 10
3172027 2.7 0.3 1.9 0.4 0.9 0.1 0.7 0.1 0.2 < 0.05 < 0.1 < 0.001 1.8 0.20 7.84 7.6 0.9 20
3172028 2.2 0.3 1.6 0.3 0.8 0.1 0.6 < 0.1 < 0.1 < 0.05 < 0.1 < 0.001 2.5 0.14 8.64 4.8 1.2 20
3172029 2.6 0.4 1.9 0.4 1.0 0.1 0.8 0.1 < 0.1 < 0.05 < 0.1 < 0.001 33.6 0.20 7.03 6.0 0.7 20
3172030 2.2 0.3 1.6 0.3 0.8 0.1 0.6 < 0.1 < 0.1 < 0.05 < 0.1 < 0.001 2.4 0.14 7.73 4.9 0.6 20
3172031 3.1 0.4 2.2 0.4 1.1 0.1 0.9 0.1 < 0.1 < 0.05 < 0.1 < 0.001 3.0 0.19 9.28 6.9 0.7 30
3172032 3.1 0.4 2.2 0.4 1.1 0.1 0.9 0.1 0.1 < 0.05 < 0.1 < 0.001 1.8 0.22 8.53 8.1 0.6 30
3172033 2.6 0.3 1.8 0.3 0.9 0.1 0.7 0.1 < 0.1 < 0.05 < 0.1 < 0.001 1.9 0.17 9.32 6.2 0.9 20
3172034 2.3 0.3 1.6 0.3 0.8 0.1 0.6 < 0.1 < 0.1 < 0.05 0.1 < 0.001 < 0.5 0.13 7.13 5.2 0.8 10
3172035 3.3 0.4 2.3 0.4 1.1 0.2 0.9 0.1 < 0.1 < 0.05 < 0.1 < 0.001 1.4 0.21 8.25 7.5 0.7 10
3172036 2.8 0.4 2.0 0.4 1.0 0.1 0.8 0.1 < 0.1 < 0.05 < 0.1 < 0.001 3.5 0.21 7.15 6.1 0.9 40
3172037 2.6 0.3 1.7 0.3 0.8 0.1 0.7 0.1 < 0.1 < 0.05 < 0.1 < 0.001 1.1 0.17 7.85 5.9 0.6 20
3172038 3.3 0.4 2.3 0.4 1.1 0.2 0.9 0.1 < 0.1 < 0.05 < 0.1 < 0.001 1.2 0.21 9.15 8.0 0.7 30
3172039 2.0 0.3 1.4 0.3 0.7 < 0.1 0.5 < 0.1 < 0.1 < 0.05 < 0.1 < 0.001 2.0 0.09 5.17 4.4 0.6 10
3172040 5.1 0.7 3.6 0.7 1.7 0.2 1.3 0.2 < 0.1 < 0.05 < 0.1 < 0.001 1.8 0.32 11.9 7.6 0.9 90
3172041 3.4 0.4 2.3 0.4 1.1 0.2 0.9 0.1 0.1 < 0.05 < 0.1 < 0.001 1.2 0.23 10.8 8.1 1.1 20
3172042 4.2 0.5 2.8 0.5 1.5 0.2 1.1 0.2 < 0.1 < 0.05 < 0.1 < 0.001 1.4 0.23 10.9 8.4 1.3 50
3172043 3.2 0.4 2.2 0.4 1.0 0.1 0.8 0.1 < 0.1 < 0.05 < 0.1 < 0.001 25.2 0.23 9.33 7.5 1.2 30
3172044 2.8 0.4 1.9 0.4 0.9 0.1 0.8 0.1 < 0.1 < 0.05 < 0.1 < 0.001 25.4 0.19 9.73 6.8 0.9 30
3172045 2.6 0.3 1.8 0.3 0.9 0.1 0.7 0.1 0.1 < 0.05 < 0.1 < 0.001 27.3 0.17 7.04 6.2 0.7 30
3172046 3.8 0.5 2.6 0.5 1.3 0.2 0.9 0.1 < 0.1 < 0.05 < 0.1 < 0.001 25.3 0.20 11.5 5.4 1.1 40
3172047 3.8 0.5 2.6 0.5 1.3 0.2 1.1 0.2 < 0.1 < 0.05 < 0.1 < 0.001 25.4 0.26 11.6 8.5 2.5 50
3172048 3.4 0.4 2.4 0.4 1.2 0.2 1.0 0.1 0.4 < 0.05 < 0.1 < 0.001 26.9 0.25 11.8 9.4 1.1 30
3172049 2.8 0.4 2.0 0.4 1.0 0.1 0.8 0.1 0.2 < 0.05 < 0.1 < 0.001 24.1 0.20 9.14 7.1 0.6 30
Page 6/10

Activation Laboratories Ltd. Report: A14-07393
Analyte Symbol Gd Tb Dy Ho Er Tm Yb Lu Hf Ta W Re Au Tl Pb Th U Hg
Unit Symbol ppm ppm ppm ppm ppm ppm ppm ppm ppm ppm ppm ppm ppb ppm ppm ppm ppm ppb
Lower Limit 0.1 0.1 0.1 0.1 0.1 0.1 0.1 0.1 0.1 0.05 0.1 0.001 0.5 0.02 0.01 0.1 0.1 10
Method Code AR-MS AR-MS AR-MS AR-MS AR-MS AR-MS AR-MS AR-MS AR-MS AR-MS AR-MS AR-MS AR-MS AR-MS AR-MS AR-MS AR-MS AR-MS
3172050 2.8 0.4 2.0 0.4 1.0 0.1 0.8 0.1 < 0.1 < 0.05 < 0.1 < 0.001 25.2 0.20 8.86 7.0 0.9 20
3172051 3.1 0.4 2.1 0.4 1.1 0.1 0.9 0.1 0.3 < 0.05 < 0.1 < 0.001 25.0 0.22 9.28 8.0 1.1 30
3172052 3.6 0.5 2.5 0.5 1.2 0.2 1.0 0.2 0.3 < 0.05 < 0.1 < 0.001 25.4 0.28 11.2 10.6 0.9 20
3172053 2.8 0.4 1.9 0.4 1.0 0.1 0.7 0.1 0.2 < 0.05 < 0.1 < 0.001 23.0 0.19 7.67 7.0 0.7 30
3172054 2.9 0.4 2.1 0.4 1.0 0.1 0.8 0.1 < 0.1 < 0.05 < 0.1 < 0.001 23.8 0.22 9.48 7.2 0.7 20
3172055 2.9 0.4 2.1 0.4 1.0 0.1 0.8 0.1 < 0.1 < 0.05 < 0.1 < 0.001 22.4 0.25 10.9 7.6 0.7 30
3172056 2.5 0.3 1.7 0.3 0.8 0.1 0.7 < 0.1 < 0.1 < 0.05 < 0.1 < 0.001 26.7 0.22 10.7 6.5 0.6 30
3172057 2.0 0.2 1.4 0.2 0.6 < 0.1 0.5 < 0.1 < 0.1 < 0.05 < 0.1 < 0.001 24.6 0.21 9.99 5.7 0.5 20
3172058 2.4 0.3 1.8 0.3 0.9 0.1 0.7 0.1 < 0.1 < 0.05 < 0.1 < 0.001 23.0 0.17 8.80 6.0 0.6 20
3172059 2.6 0.3 1.8 0.3 0.9 0.1 0.7 0.1 0.1 < 0.05 < 0.1 < 0.001 23.5 0.24 10.9 7.4 0.7 30
3172060 3.0 0.4 2.1 0.4 1.0 0.1 0.8 0.1 < 0.1 < 0.05 < 0.1 < 0.001 24.3 0.20 8.00 7.3 0.7 20
3172061 2.8 0.4 2.0 0.4 1.0 0.1 0.8 0.1 0.3 < 0.05 < 0.1 < 0.001 22.3 0.19 7.94 7.5 0.8 20
3172062 3.0 0.4 2.1 0.4 1.0 0.1 0.8 0.1 0.3 < 0.05 < 0.1 < 0.001 25.8 0.19 8.29 7.5 1.1 20
3172063 3.5 0.5 2.5 0.5 1.3 0.2 1.0 0.2 0.4 < 0.05 < 0.1 < 0.001 23.3 0.30 12.4 10.7 1.3 20
3172064 2.3 0.3 1.6 0.3 0.8 0.1 0.6 < 0.1 0.3 0.29 < 0.1 < 0.001 6.1 0.13 5.43 5.6 0.7 20
3172065 2.6 0.3 1.9 0.4 1.0 0.1 0.7 0.1 0.5 < 0.05 < 0.1 < 0.001 25.2 0.25 8.13 8.1 1.0 10
3172069 2.5 0.3 1.8 0.3 0.9 0.1 0.7 0.1 < 0.1 < 0.05 < 0.1 < 0.001 26.1 0.15 6.88 6.4 0.7 30
Page 7/10

Activation Laboratories Ltd. Report: A14-07393
QC
Analyte Symbol Au Ti S P Li Be B Na Mg Al K Bi Ca Sc V Cr Mn Fe Co Ni Cu Zn Ga
Unit Symbol ppb % % % ppm ppm ppm % % % % ppm % ppm ppm ppm ppm % ppm ppm ppm ppm ppm
Lower Limit 5 0.001 1 0.001 0.1 0.1 1 0.001 0.01 0.01 0.01 0.02 0.01 0.1 1 1 1 0.01 0.1 0.1 0.01 0.1 0.02
Method Code FA-AA AR-MS AR-MS AR-MS AR-MS AR-MS AR-MS AR-MS AR-MS AR-MS AR-MS AR-MS AR-MS AR-MS AR-MS AR-MS AR-MS AR-MS AR-MS AR-MS AR-MS AR-MS AR-MS
GXR-1 Meas 0.009 < 1 0.056 8.3 0.8 9 0.061 0.17 0.63 0.04 1400 0.96 1.0 76 9 852 25.2 8.5 43.7 1110 754 4.95
GXR-1 Cert 0.036 0.257 0.0650 8.20 1.22 15.0 0.0520 0.217 3.52 0.050 1380 0.960 1.58 80.0 12.0 852 23.6 8.20 41.0 1110 760 13.8
GXR-4 Meas 0.142 2 0.137 11.3 1.7 < 1 0.141 1.60 2.84 1.81 20.6 0.94 6.8 79 57 137 3.18 15.7 44.0 6490 76.2 12.3
GXR-4 Cert 0.29 1.77 0.120 11.1 1.90 4.50 0.564 1.66 7.20 4.01 19.0 1.01 7.70 87.0 64.0 155 3.09 14.6 42.0 6520 73.0 20.0
GXR-6 Meas < 1 0.040 30.4 1.1 < 1 0.073 0.41 7.19 1.21 0.17 0.19 23.0 159 77 1010 5.64 14.2 25.5 72.1 128 15.1
GXR-6 Cert 0.0160 0.0350 32.0 1.40 9.80 0.104 0.609 17.7 1.87 0.290 0.180 27.6 186 96.0 1010 5.58 13.8 27.0 66.0 118 35.0
SAR-M (U.S.G.S.)Meas
0.060 0.075 15.8 1.2 0.025 0.36 1.18 0.32 1.78 0.31 3.2 35 90 4840 3.04 12.1 50.6 366 999 5.04
SAR-M (U.S.G.S.)Cert
0.38 0.07 27.4 2.20 1.140 0.50 6.30 2.94 1.94 0.61 7.83 67.2 79.7 5220 2.99 10.70 41.5 331.0000
930.0 17
OxD108 Meas 458
OxD108 Cert 414.000
OxD108 Meas 449
OxD108 Cert 414.000
SF67 Meas 913
SF67 Cert 835.000
SF67 Meas 912
SF67 Cert 835.000
3172002 Orig 0.113 < 1 0.042 24.8 0.5 6 0.022 0.55 1.52 0.21 0.10 0.54 4.0 36 40 212 1.83 6.9 20.5 6.41 31.4 5.89
3172002 Dup 0.107 < 1 0.041 24.6 0.5 5 0.021 0.54 1.50 0.21 0.09 0.52 3.9 35 39 207 1.78 6.9 20.3 6.26 29.9 5.70
3172010 Orig < 5
3172010 Dup < 5
3172020 Orig < 5
3172020 Dup < 5
3172030 Orig < 5
3172030 Dup < 5
3172031 Orig 0.131 < 1 0.061 32.8 0.8 10 0.038 1.18 1.81 0.32 0.11 1.48 5.6 45 52 286 2.37 9.2 28.7 15.5 42.4 6.60
3172031 Dup 0.126 < 1 0.057 32.6 0.8 10 0.036 1.14 1.74 0.31 0.11 1.43 5.4 43 51 276 2.27 8.9 27.5 14.9 40.8 6.28
3172032 Orig 0.145 < 1 0.055 34.6 0.9 14 0.039 0.84 1.93 0.34 0.11 0.71 6.1 50 56 274 2.52 9.9 30.1 23.3 42.1 7.22
3172032 Dup 0.141 < 1 0.055 35.2 0.9 11 0.038 0.83 1.92 0.34 0.12 0.71 6.1 49 55 277 2.54 9.9 30.3 22.2 42.7 7.37
3172045 Orig < 5
3172045 Dup < 5
3172054 Orig 0.133 < 1 0.049 31.9 0.7 10 0.032 1.39 1.89 0.30 0.13 3.01 5.5 46 51 312 2.45 9.9 29.5 16.2 46.1 7.39
3172054 Dup 0.135 < 1 0.048 31.8 0.8 10 0.033 1.37 1.87 0.30 0.13 2.95 5.5 46 51 310 2.42 9.7 29.3 16.0 45.2 7.23
3172057 Orig < 5
3172057 Dup < 5
3172065 Orig < 5
3172065 Dup < 5
3172069 Orig 0.112 < 1 0.049 23.5 0.5 10 0.035 2.79 1.18 0.26 0.09 9.62 4.4 35 39 328 1.80 7.8 24.5 14.2 33.6 4.45
3172069 Dup 0.117 < 1 0.050 24.5 0.6 11 0.038 2.88 1.22 0.27 0.09 9.85 4.5 36 39 332 1.81 8.0 25.6 14.8 34.6 4.61
Method Blank < 5
Method Blank < 5
Method Blank < 5
Method Blank < 5
Method Blank < 0.001 < 1 < 0.001 < 0.1 < 0.1 < 1 < 0.001 < 0.01 < 0.01 < 0.01 < 0.02 < 0.01 < 0.1 < 1 < 1 < 1 < 0.01 < 0.1 < 0.1 < 0.01 < 0.1 < 0.02
Method Blank < 0.001 < 1 < 0.001 < 0.1 < 0.1 < 1 < 0.001 < 0.01 < 0.01 < 0.01 < 0.02 < 0.01 < 0.1 < 1 < 1 < 1 < 0.01 < 0.1 < 0.1 < 0.01 < 0.1 < 0.02
Page 8/10

Activation Laboratories Ltd. Report: A14-07393
QC
Analyte Symbol Ge As Rb Sr Y Zr Nb Mo Ag In Sn Sb Te Cs Ba La Ce Cd Pr Nd Sm Se Eu
Unit Symbol ppm ppm ppm ppm ppm ppm ppm ppm ppm ppm ppm ppm ppm ppm ppm ppm ppm ppm ppm ppm ppm ppm ppm
Lower Limit 0.1 0.1 0.1 0.5 0.01 0.1 0.1 0.01 0.002 0.02 0.05 0.02 0.02 0.02 0.5 0.5 0.01 0.01 0.1 0.02 0.1 0.1 0.1
Method Code AR-MS AR-MS AR-MS AR-MS AR-MS AR-MS AR-MS AR-MS AR-MS AR-MS AR-MS AR-MS AR-MS AR-MS AR-MS AR-MS AR-MS AR-MS AR-MS AR-MS AR-MS AR-MS AR-MS
GXR-1 Meas 400 2.7 191 27.4 15.6 < 0.1 19.5 29.5 0.75 25.7 93.9 13.6 2.78 291 6.5 12.6 2.37 6.70 2.3 13.2 0.5
GXR-1 Cert 427 14.0 275 32.0 38.0 0.800 18.0 31.0 0.770 54.0 122 13.0 3.00 750 7.50 17.0 3.30 18.0 2.70 16.6 0.690
GXR-4 Meas 105 105 81.1 13.3 12.4 0.2 334 3.43 0.21 5.82 4.08 0.79 2.54 37.8 53.5 101 0.03 38.6 6.0 5.3 1.4
GXR-4 Cert 98.0 160 221 14.0 186 10.0 310 4.00 0.270 5.60 4.80 0.970 2.80 1640 64.5 102 0.860 45.0 6.60 5.60 1.63
GXR-6 Meas 228 71.9 37.3 7.46 15.4 < 0.1 1.81 0.222 0.06 1.03 2.38 < 0.02 3.78 1100 12.7 34.1 0.07 11.8 2.3 < 0.1 0.6
GXR-6 Cert 330 90.0 35.0 14.0 110 7.50 2.40 1.30 0.260 1.70 3.60 0.0180 4.20 1300 13.9 36.0 1.00 13.0 2.67 0.940 0.760
SAR-M (U.S.G.S.)Meas
39.3 29.0 32.3 21.5 3.2 14.1 5.23 1.08 1.64 4.67 0.67 195 48.9 100 5.40 0.3
SAR-M (U.S.G.S.)Cert
38.8 146 151 28.00 29.9 13.1 3.64 1.08 2.76 6.0 0.96 801 57.4 122.0 5.27 0.39
OxD108 Meas
OxD108 Cert
OxD108 Meas
OxD108 Cert
SF67 Meas
SF67 Cert
SF67 Meas
SF67 Cert
3172002 Orig < 0.1 3.6 22.6 25.0 7.16 6.7 1.8 0.64 0.057 < 0.02 0.61 0.10 < 0.02 1.40 76.0 19.3 40.4 0.02 4.7 15.9 2.7 0.3 0.5
3172002 Dup < 0.1 2.4 21.4 23.3 6.92 6.1 1.5 0.41 0.052 < 0.02 0.60 0.07 < 0.02 1.36 74.0 17.9 37.4 0.03 4.4 14.7 2.5 0.3 0.5
3172010 Orig
3172010 Dup
3172020 Orig
3172020 Dup
3172030 Orig
3172030 Dup
3172031 Orig < 0.1 2.3 31.7 32.4 11.9 6.7 1.6 0.10 0.065 0.02 0.68 0.06 < 0.02 1.73 96.3 28.6 50.9 0.05 6.7 22.8 3.9 0.7 0.8
3172031 Dup < 0.1 3.2 30.5 30.8 11.3 6.2 1.5 0.08 0.064 0.02 0.67 0.05 < 0.02 1.66 94.0 28.5 50.6 0.05 6.6 22.3 3.7 3.1 0.7
3172032 Orig < 0.1 2.1 31.9 29.8 11.4 17.4 1.0 0.18 0.051 0.02 0.72 0.08 < 0.02 1.81 105 28.5 54.0 0.04 6.9 22.9 3.9 0.2 0.8
3172032 Dup < 0.1 2.4 31.8 30.0 11.5 15.5 0.8 0.23 0.048 0.02 0.77 0.08 < 0.02 1.84 106 27.8 51.8 0.04 6.7 22.2 3.7 0.4 0.7
3172045 Orig
3172045 Dup
3172054 Orig < 0.1 2.1 36.5 44.0 10.2 9.2 1.5 0.05 0.047 0.02 0.76 0.05 < 0.02 1.98 90.7 26.0 49.8 0.04 6.2 21.0 3.5 0.1 0.7
3172054 Dup < 0.1 2.0 36.3 43.2 10.0 9.5 1.6 0.05 0.053 0.02 0.75 0.05 < 0.02 1.98 91.4 25.8 49.3 0.03 6.3 21.0 3.5 < 0.1 0.7
3172057 Orig
3172057 Dup
3172065 Orig
3172065 Dup
3172069 Orig < 0.1 0.9 23.6 78.8 9.12 4.2 0.7 < 0.01 0.030 < 0.02 0.51 0.05 < 0.02 1.29 63.5 23.2 45.0 0.05 5.5 18.2 3.0 0.2 0.6
3172069 Dup < 0.1 0.8 23.9 80.6 9.26 6.5 0.7 < 0.01 0.030 < 0.02 0.49 0.06 < 0.02 1.35 66.7 23.6 44.7 0.04 5.4 18.1 3.1 < 0.1 0.6
Method Blank
Method Blank
Method Blank
Method Blank
Method Blank < 0.1 < 0.1 < 0.1 < 0.5 < 0.01 < 0.1 < 0.1 < 0.01 < 0.002 < 0.02 < 0.05 < 0.02 < 0.02 < 0.02 < 0.5 < 0.5 < 0.01 < 0.01 < 0.1 < 0.02 < 0.1 < 0.1 < 0.1
Method Blank < 0.1 < 0.1 < 0.1 < 0.5 < 0.01 < 0.1 < 0.1 < 0.01 < 0.002 < 0.02 < 0.05 < 0.02 < 0.02 < 0.02 < 0.5 < 0.5 < 0.01 < 0.01 < 0.1 < 0.02 < 0.1 < 0.1 < 0.1
Page 9/10

Activation Laboratories Ltd. Report: A14-07393
QC
Analyte Symbol Gd Tb Dy Ho Er Tm Yb Lu Hf Ta W Re Au Tl Pb Th U Hg
Unit Symbol ppm ppm ppm ppm ppm ppm ppm ppm ppm ppm ppm ppm ppb ppm ppm ppm ppm ppb
Lower Limit 0.1 0.1 0.1 0.1 0.1 0.1 0.1 0.1 0.1 0.05 0.1 0.001 0.5 0.02 0.01 0.1 0.1 10
Method Code AR-MS AR-MS AR-MS AR-MS AR-MS AR-MS AR-MS AR-MS AR-MS AR-MS AR-MS AR-MS AR-MS AR-MS AR-MS AR-MS AR-MS AR-MS
GXR-1 Meas 3.7 0.7 4.6 0.4 2.0 0.3 0.2 < 0.05 149 3100 0.42 730 2.3 30.4 3940
GXR-1 Cert 4.20 0.830 4.30 0.430 1.90 0.280 0.960 0.175 164 3300 0.390 730 2.44 34.9 3900
GXR-4 Meas 4.7 0.6 2.9 0.2 0.9 0.1 0.2 < 0.05 14.8 505 3.38 49.6 17.9 4.7
GXR-4 Cert 5.25 0.360 2.60 0.210 1.60 0.170 6.30 0.790 30.8 470 3.20 52.0 22.5 6.20
GXR-6 Meas 2.1 0.3 1.7 0.1 0.8 0.1 0.1 < 0.05 < 0.1 2.26 103 4.3 0.8
GXR-6 Cert 2.97 0.415 2.80 0.0320 2.40 0.330 4.30 0.485 1.90 2.20 101 5.30 1.54
SAR-M (U.S.G.S.)Meas
3.1 1.03 1020 11.8 2.0
SAR-M (U.S.G.S.)Cert
9.78 2.7 982 17.2 3.57
OxD108 Meas
OxD108 Cert
OxD108 Meas
OxD108 Cert
SF67 Meas
SF67 Cert
SF67 Meas
SF67 Cert
3172002 Orig 2.1 0.3 1.5 0.3 0.7 < 0.1 0.6 < 0.1 < 0.1 < 0.05 < 0.1 < 0.001 2.4 0.14 7.26 5.2 0.6 < 10
3172002 Dup 2.0 0.3 1.5 0.3 0.7 < 0.1 0.5 < 0.1 < 0.1 < 0.05 < 0.1 < 0.001 3.0 0.14 6.94 5.0 0.6 < 10
3172010 Orig
3172010 Dup
3172020 Orig
3172020 Dup
3172030 Orig
3172030 Dup
3172031 Orig 3.1 0.4 2.2 0.4 1.1 0.2 0.9 0.1 < 0.1 < 0.05 < 0.1 < 0.001 2.7 0.19 9.21 7.0 0.7 20
3172031 Dup 3.1 0.4 2.1 0.4 1.1 0.1 0.8 0.1 < 0.1 < 0.05 < 0.1 < 0.001 3.3 0.19 9.34 6.9 0.6 40
3172032 Orig 3.2 0.4 2.3 0.4 1.1 0.1 0.9 0.1 0.2 < 0.05 < 0.1 < 0.001 2.7 0.22 8.59 8.2 0.6 40
3172032 Dup 3.1 0.4 2.2 0.4 1.1 0.2 0.9 0.1 0.1 < 0.05 < 0.1 < 0.001 1.0 0.22 8.48 8.0 0.6 10
3172045 Orig
3172045 Dup
3172054 Orig 2.9 0.4 2.1 0.4 1.0 0.1 0.8 0.1 < 0.1 < 0.05 < 0.1 < 0.001 22.9 0.21 9.43 7.2 0.7 30
3172054 Dup 2.9 0.4 2.0 0.4 1.0 0.1 0.8 0.1 < 0.1 < 0.05 < 0.1 < 0.001 24.7 0.22 9.52 7.2 0.7 10
3172057 Orig
3172057 Dup
3172065 Orig
3172065 Dup
3172069 Orig 2.5 0.3 1.8 0.3 0.9 0.1 0.7 0.1 < 0.1 < 0.05 < 0.1 < 0.001 27.5 0.15 6.85 6.3 0.7 40
3172069 Dup 2.6 0.3 1.8 0.3 0.9 0.1 0.7 0.1 < 0.1 < 0.05 < 0.1 < 0.001 24.7 0.16 6.91 6.4 0.7 30
Method Blank
Method Blank
Method Blank
Method Blank
Method Blank < 0.1 < 0.1 < 0.1 < 0.1 < 0.1 < 0.1 < 0.1 < 0.1 < 0.1 < 0.05 < 0.1 < 0.001 < 0.5 < 0.02 < 0.01 < 0.1 < 0.1 < 10
Method Blank < 0.1 < 0.1 < 0.1 < 0.1 < 0.1 < 0.1 < 0.1 < 0.1 < 0.1 < 0.05 < 0.1 < 0.001 < 0.5 < 0.02 < 0.01 < 0.1 < 0.1 < 10
Powered by TCPDF (www.tcpdf.org)
Page 10/10

29
Appendix B
Geochemical survey maps.
Appendix B1.
Mineral soil geochemical analyses for copper performed by AR-MS.

30

31
Appendix B2.
Mineral soil geochemical analyses for zinc performed by AR-MS.

32

33
Appendix B3.
Mineral soil geochemical analyses for arsenic performed by AR-MS.

34

35
Appendix B4.
Mineral soil geochemical analyses for iron performed by AR-MS.

36

37

Appendix D. Sample Locations and Descriptions
Station Number
Sample Number
UTM Easting (NAD 83)
UTM Northing (NAD 83)
Altitude (m)
Description
3172001 3172001 576301 5481879 323 70% clay, 30% sand; brown-grey 3172002 3172002 576303 5481900 320 90% clay, 10% sand, grey-brown 3172003 3172003 576304 5481931 322 0-20 cm below peat; muddy, wet, light-grey, sand 3172004 3172004 576304 5481931 322 20-40 cm below peat; 90% clay, 10% sand, wet, light brown 3172005 3172005 576304 5481931 322 40-60 cm below peat; 90% clay, 10% sand, wet, light brown 3172006 3172006 576302 5481953 321 50/50, dry, sandy clay, light brown-grey 3172007 3172007 576303 5481977 319 60% grey clay, with 40% brown sand, grey brown 3172008 3172008 576303 5482003 320 light grey, muddy wet sand 3172009 3172009 576302 5482022 321 90% brown clay with 10% sand 3172010 3172010 576303 5482049 321 90% brown clay with 10% sand 3172011 3172011 576305 5482076 322 70% brown sand, with 30% brown clay 3172012 3172012 576302 5482102 321 0-20 cm below peat; 80% brown sand with 20% grey clay 3172013 3172013 576302 5482102 321 20-40 cm below peat; 80% brown sand with 20% grey clay 3172014 3172014 576302 5482102 321 40-60 cm below peat; 80% brown sand with 20% grey clay 3172015 3172015 576305 5482123 322 50/50 brown, clayish sand 3172016 3172016 576303 5482150 322 90% brown sand with 10% brown clay 3172017 3172017 576304 5482174 323 90% brown sand with 10% brown clay 3172018 3172018 576304 5482199 320 light brown wet clay 3172019 3172019 576306 5482226 320 light brown wet clay 3172020 3172020 576304 5482250 320 light brown wet clay, but more solid than last two samples 3172021 3172021 576305 5482277 319 light grey clay 3172022 3172022 576305 5482303 317 light grey clay 3172023 3172023 576504 5482301 311 light brownish grey, 90% clay, 10% sand 3172024 3172024 576503 5482278 311 grey clay, 90% clay, 10% brown sand 3172025 3172025 576505 5482278 312 duplicate of 3172024 3172026 3172026 576505 5482257 312 grey clay with small brown 3172027 3172027 576504 5482226 311 grey clay with small brown

Station Number
Sample Number
UTM Easting (NAD 83)
UTM Northing (NAD 83)
Altitude (m)
Description
3172028 3172028 576504 5482201 310 grey clay with small brown 3172029 3172029 576504 5482174 311 light brown with little grey clay 3172030 3172030 576502 5482155 311 light brown with little grey clay 3172031 3172031 576503 5482126 311 light brown with little grey clay 3172032 3172032 576502 5482106 313 light brown with little grey clay 3172033 3172033 576501 5482074 313 light brown with little grey clay 3172034 3172034 576502 5482049 314 light brown with little grey clay 3172035 3172035 576502 5482030 320 brown clay 3172036 3172036 576503 5481997 317 brownish-grey clay 3172037 3172037 576505 5481972 318 brownish-grey clay 3172038 3172038 576504 5481941 318 brownish-grey clay 3172039 3172039 576501 5481915 315 sandy brown clay 3172040 3172040 576506 5481905 314 brown clay 3172041 3172041 577464 5483501 348 brownish grey clay; no picket 3172042 3172042 577465 5483479 333 brownish grey clay; no picket 3172043 3172043 577468 5483455 307 Sandy-clay, brownish grey; tag with picket 3172044 3172044 577466 5483428 303 Brown clay; has picket, no writing 3172045 3172045 577464 5483401 302 90% grey clay with 10% sand; picket, no writing 3172046 3172046 577467 5483375 299 dark grey-brown clay; picket says 375 N 3172047 3172047 577467 5483350 298 dark grey-brown clay; no picket 3172048 3172048 577467 5483330 297 thick grey silty clay; picket 25N, 47W 3172049 3172049 577471 5483302 297 brownish-grey clay; picket, no writing 3172050 3172050 577471 5483302 297 duplicate of 3172049 3172051 3172051 577470 5483281 295 grey clay; picket, no writing 3172052 3172052 577471 5483251 296 grey clay; no picket 3172053 3172053 577471 5483229 296 light brown clay; no picket 3172054 3172054 577473 5483206 296 light brown clay; picket, no writing 3172055 3172055 577473 5483175 295 light grey clay; no picket 3172056 3172056 577473 5483152 296 light brown clay; no picket

Station Number
Sample Number
UTM Easting (NAD 83)
UTM Northing (NAD 83)
Altitude (m)
Description
3172057 3172057 577477 5483120 295 light brown, sandy clay; 90% clay, 10% sand 3172058 3172058 577474 5483101 294 light brown, sandy clay; 90% clay, 10% sand 3172059 3172059 577666 5483506 292 greyish brown clay; picket 45W 200N 3172060 3172060 577664 5483477 293 grey clay; picket, no writing 3172061 3172061 577666 5483452 292 grey clay; picket, no writing 3172062 3172062 577668 5483423 291 grey clay; picket, no writing 3172063 3172063 577668 5483399 292 grey clay; picket, no writing 3172064 3172064 577668 5483368 291 90% grey clay with 10% sand; is off about 10 m 3172065 3172065 577668 5483350 292 90% grey clay with 10% sand 3172066 -- 577670 5483325 291 Peat too deep; No sample taken 3172067 -- 577668 5483300 291 Peat too deep; no picket; organic; No sample taken 3172068 -- 577670 5483275 291 Peat too deep; no picket; organic; No sample taken 3172069 3172069 577672 5483250 290 grey clay; no picket; bottom of auger 3172070 -- 577672 5483223 291 Peat too deep; little grey clay at bottom; No sample taken 3172071 -- 577674 5483200 292 Peat too deep; organic; No sample taken 3172072 -- 577673 5483171 291 Peat too deep; organic; No sample taken 3172073 -- 577674 5483150 291 Peat too deep; organic; No sample taken 3172074 -- 577671 5483125 293 Peat too deep; organic; No sample taken
Note: “--“ indicates no sample could be collected at this station.

400200
metres
Projection: UTM Zone 17 (NAD 83)
North Abitibi2014 Mineral SoilSampling Program
Station and Sample Locations
Scale: 1:10,000
0 100
Sample Stations
Claim Boundaries
Sample (sample number)
No Sample Takenat Station
ClaimNumber
4203559
4203558
4203557
4203556
4202446
4203558
4202440
Appendix C. Sample locations (including stations where samples could not be collected).
Related Documents