1 REPORT ON FIVE WILD HORSE HERDS AND HERD MANAGEMENT AREAS (HMA) IN OREGON, WITH RESULTS OF DETAILED ECOLOGICAL EVALUATIONS ON TWO HMAs CONDUCTED IN 2017 BY CRAIG C. DOWNER, WILDLIFE ECOLOGIST PRESIDENT: ANDEAN TAPIR FUND and WILD HORSE AND BURRO FUND APRIL 6, 2018 P.O. Box 456 Minden, NV 89423 Email: [email protected] contact for information on photographs herein Natural image of Wild Horse sculpted in Tuff stone in Three Fingers Wild Horse HMA, Oregon, June 4, 2017 ca. 9:40 AM. Photo © Craig C. Downer 2017.

Welcome message from author
This document is posted to help you gain knowledge. Please leave a comment to let me know what you think about it! Share it to your friends and learn new things together.
Transcript

1
REPORT ON FIVE WILD HORSE HERDS AND HERD MANAGEMENT AREAS (HMA) IN OREGON,
WITH RESULTS OF DETAILED ECOLOGICAL EVALUATIONS ON TWO HMAs CONDUCTED IN 2017
BY CRAIG C. DOWNER, WILDLIFE ECOLOGIST
PRESIDENT: ANDEAN TAPIR FUND and
WILD HORSE AND BURRO FUND
APRIL 6, 2018
P.O. Box 456
Minden, NV 89423
Email: [email protected]
contact for information on photographs herein
Natural image of Wild Horse sculpted in Tuff stone in Three Fingers Wild Horse HMA, Oregon, June 4,
2017 ca. 9:40 AM. Photo © Craig C. Downer 2017.

2
Healthy Wild Horse Band in Three Fingers Wild Horse HMA, OR, June 2017 at High Noon.
Photo © Craig C. Downer 2017.
TABLE OF CONTENTS
Title page with photo ………………………………………………………………………………………………………………….. 1
Introduction with photo ………………………………………………………………………………………………………………. 3
Overview and Illustrations of Wild Horse Areas with maps …..…………………………………………………….. 4
Oregon HMAs Correlated with Grazing Allotments …………………………..…………………………………………. 6
South Steens Wild horse HMA w/ photos & map ………………………………………………………………………… 7
Discussion of Findings for South Steens HMA ……………………………………………………………………………… 9
Kiger Mustang HMA w/ photos & map ……………………………………………………………………………………….. 10
Discussion of Findings for Kiger Mustang HMA …………………………………………………………………………… 13
Paisley Desert Wild Horse HMA w/ photo & map ……………………………………………………………………….. 15
Discussion of Findings for Paisley HMA ……………………………………………………………………………………… 18
Three Fingers Wild Horse HMA w/ photos & map ……………………………………………………………………….. 18
Discussion of Findings for Three Fingers HMA ……………………………………………………………………………… 22
Big Summit Wild Horse HMA (aka Territory) on Ochoco Nat. Forest w/ photo & map ………………… 23
Discussion of Findings & Plea for Action ……………………………………………………………………………………. 25

3
Ecological Evaluations Analysis and Recommendations ………………………………………………………………. 27
South Steens Wild Horse HMA w/ color graph …………………………………………………………………………… 27
South Steens HMA Top Three Management Priorities & Recommended Actions ……………………….28
Kiger Mustang Wild Horse HMA w/ color graph ………………………………………………………………………… 29
Kiger Mustang HMA Top Three Management Priorities & Recommended Actions w/ photo ……. 29
Environmental Disturbance Factors (EDF) Analysis S. Steens & Kiger Mustang HMAs color graph 31
Discussion of Environmental Disturbance Factors ……………………………………………………………………… 32
The Bigger Picture: Oregon and Beyond ……………………………………………………………………………………… 32
Recommendations w/ map …………………………………………………………………………………………………………. 34
Reserve Design Proposal ……………………………………………………………………………………………………………… 37
South Steens, Kiger Mustang, and Riddle Mountain HMAs ………………………………………………………… 38
Paisley Desert and Big Summit Wild Horse HMAs ………………………………………………………………………. 38
Three Fingers HMA …………………………………………………………………………………………………………………….. 38
Legal Facilitators of Reserve Design ……………………………………………………………………………………………. 39
Conclusion ……………………………………………………………………………………………………………………………………. 40
A Parting Prayer …………………………………………………………………………………………………………………………… 40
Bibliography …………………………………………………………………………………………………………………………………. 41
Appendix A: Partial List of Plant Species ……………………………………………………………………………………….. 44
Appendix B: Analysis of South Steens HMA History of Management & Manag. Plan by BLM ……….. 45
Appendix C: Analysis of Kiger Mustang HMA BLM Plan & History of Management ………………………. 54
Appendix D: Investigation of Paisley Desert Wild Horse Program …………………………………………………. 61
Appendix E: Analysis of Three Fingers HMA Wild Horse Management History & Plan by BLM ……… 68
Appendix F: Analysis of Big Summit Wild Horse Territory ……………………………………………………………… 80
Introduction
During 2017, I visited five legal federal wild horse areas in the beautiful state of Oregon. Four of these
were on Bureau of Land Management-United States Department of Interior (BLM-USDI) lands. The BLM
Burns District has jurisdiction over the two Herd Management Areas (HMAs) where I conducted a series
of 33 non-invasive ecological evaluations, namely: South Steens HMA and Kiger Mustang HMA, both in
southeastern Oregon. BLM Lakeview District has jurisdiction over the Paisley Desert HMA in south-
central Oregon, where I made observations in the late spring. Also during the late spring, I visited
another wild horse area in the Ochoco National Forest: the Big Summit HMA (the Forest Service (USFS)
usually references its wild equid areas as “Territories”). In both the Paisley Desert and Big Summit
HMAs, I made a series of observations while camping on site. Further, I conducted extensive ecological
evaluations, 39 in number, and produced a report including Reserve Design recommendations for the
Three Fingers Wild Horse HMA in southeastern Oregon, under the Vale BLM Field Office’s jurisdiction.
The latter was for the non-profit organization Friends of Animals. Though my ecological evaluations
were confined to the South Steens, Kiger Mustang and Three Fingers HMAs, I took detailed notes and
many digital photos in all five referenced legal wild horse areas. In this report I share the detailed
ecological evaluations I made in the South Steens and Kiger Mustang HMAs as well as observations I
made in the other three HMAs, and present some alarming critiques and solid recommendations. I
highly commend and recommend that the reader carefully peruse Appendices B, C, D, E and F, which
constitute a brilliant and factual, clear and logically presented expose of the “fairness issue” for all of the
five wild horse herd and their legal Herd Areas and Herd Management Areas/Territories which are the

4
subject of this report. On behalf of my non-profit organization, I take this opportunity to unreservedly
thank researcher Marybeth Devlin for this great addition to my report.
Overview and Illustrations of Wild Horse Areas
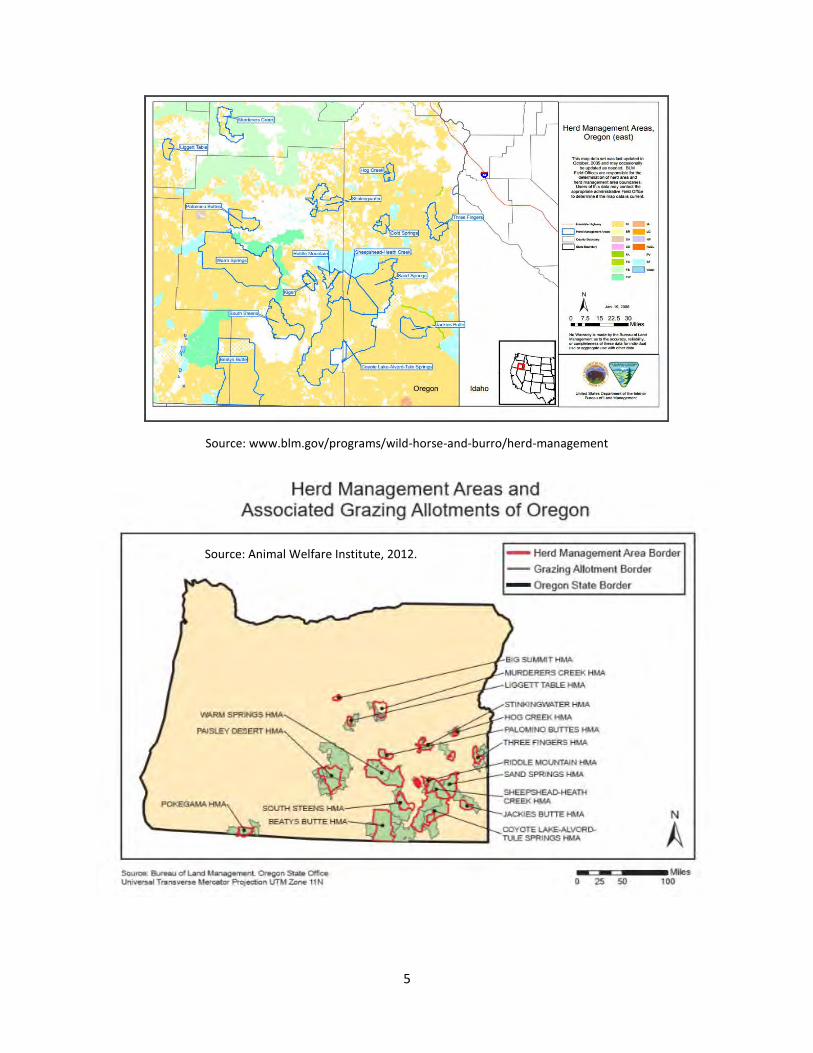
HMAs of Oregon
Oregon BLM has 18 wild horse HMAs on ca. 1.3 million acres but assigns an AML of just 2,715.
It has zeroed out ca. one-half of the original Herd Areas (HA), ca. 1.3 million acres.
5
Source: www.blm.gov/programs/wild-horse-and-burro/herd-management
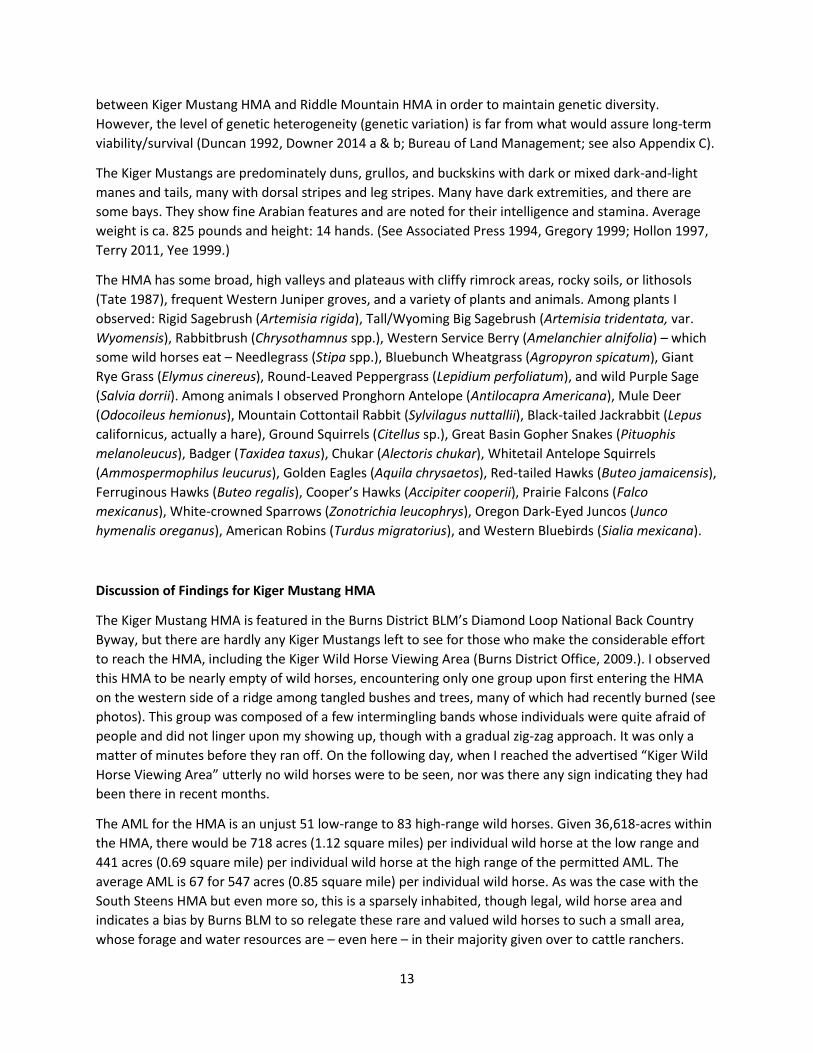
Source: Animal Welfare Institute, 2012.

6
Oregon HMAs Correlated with Grazing Allotments
On Oregon federal lands Active AUMs (Animal Unit Months) sum to 963,679 dwarfing the tiny number
of AUMs assigned to the wild horses. This indicates similar inequities in acres occupied and grazing
resources assigned to livestock vis-à-vis wild horses. According to my calculations, there were over 3
square miles of original legal Herd Area acreage per remaining wild horse and over two square miles of
reduced Herd Management Area acreage per remaining wild horse. However livestock permittee
occupation covers almost all federal lands including especially the HMAs (see BLM Public Lands Statistics
for 2016, published in 2017 and available online at www.blm.gov; see also Downer 2014 a, pp. 52-53,
etc., see Index for Oregon).

7
SOUTH STEENS WILD HORSE HMA
Beautiful young sorrel wild stallion on the run
Handsome Paint Mustang resting by side of Western Juniper
Photos © Craig C. Downer, 2017.

8
According to this BLM map, all but about one-sixth of
the South Steens HMA is grazed by ranchers’
livestock. Only in the far southeastern portion are
livestock prohibited, yet in my field observations I did
not notice any area in the HMA that was devoid of
livestock spoor, at least of the areas that were
physically accessible by cattle. Considerable evidence
for trespass livestock in the southeastern area exists.
In this 130,000+ acre HMA, I performed fifteen 100-
foot ecological transects following methods outlined
in a manual of the United States Geological Survey
(2005, see results below). The HMA is located 10
miles south of French Glen and 70 miles to the
southwest of Burns. South Steens horses show a
prevalence of flashy pinto and paint coloration, but
buckskins, chestnuts, bays, and even a few grullos and
dark, blackish horses were also observed. A
considerable number were Kiger mustang type,
indicating a possible mixing with the Kiger herd just to
the north. The average height was on the tall side, ca.
15 hands and on the heavier side averaging an
estimated 1,100 pounds, compared with wild horses throughout the West.
Elevations ranged from 5,000’ to 7,500’ a.s.l. The magnificent Steens Mountain range rises to a
maximum of 9,733’ elev. on its eastern edge and generally in the past has experienced very cold winters
alternating with hot dry summers. The terrain is generally rocky with high-sloping plateaus edged with
sharp rimrocks divided by deep canyons with both permanent and seasonal streams. The Wyoming Big
Sagebrush (Artemisia tridentata, var. Wyomensis) as well as the Rigid Sagebrush (Artemisia rigida) are
profuse here, as well as many conical-shaped Western Juniper trees (Juniperus occidentalis), some of
which grow to over 40-feet. I observed a variety of wildlife, including swiftly running herds of up to 40 or
more Pronghorn Antelope (Antilocapra americana) and elegant Mule Deer (Odocoileus hemionus), who
stole out from the trees close to my campsite. Long-legged Black-tailed Jackrabbits (Lepus californicus),
capable of prodigious leaps, Mountain Cottontail rabbits (Sylvilagus nuttallii), brilliant Downy
Woodpeckers (Picoides pubescens), high soaring Golden Eagles (Aquila chrysaetos)as well as wily
Coyotes (Canis latrans), spunky Great Basin Western Fence Lizards (Sceloporus occidentalis), energetic
Townsend Ground Squirrels (Citellus townsendi), furry Bobcats (Lynx rufus), and even a few stealthy
Mountain Lions (Felix concolor) were also in evidence. Foraged vegetation included much Needle Grass
(Stipa spp.), Bluebunch Wheatgrass (Agropyron spicatum), Steppe Bluegrass (Poa secunda), Indian Rice
Grass (Oryzopsis hymenoides), Giant Wild Rye (Elymus cinereus), along with invading Medusa-head Rye
Grass (Taeniatherum caput-medusae), and Cheat Grass (Bromus tectorum), the former often planted by
ranchers or BLM while the latter is an opportunist that takes hold in disturbed soils. Deer Brush (Purshia
tridentata), Gray Rabbit Brush (Chrysothamnus nauseosus) and Green Rabbit Brush (Chrysothamnus
viscidiflorus) were prevalent, while less prevalent were Squaw Currant bushes (Ribes cereum) and even
less so were Golden Currants (Ribes aureum), occurring in moister, more sheltered habitats. Thyme
Source: Animal Welfare Institute, 2012

9
Desert Buckwheat (Eriogonum thymoides), with its rosy inflorescence, was also observed, particularly in
rocky soils. Both species of currant displayed a symbiosis of some sort with the Western Junipers, at
whose base they were often observed to grow. For a further partial list of the species of plants
observed, see Appendix A at the end of this report.
Elegant Mule Deer in last rays of sun seeks shelter for the night along with his companions
Photo © Craig C. Downer 2017.
Discussion of Findings for South Steens HMA
Most of the South Steens HMA was overgrazed by cattle – a situation that makes life difficult for the
wild horses, especially considering the harsh weather, seasonal extremes, and generally rocky,
unproductive soils. Though in its Section 2 c, the Wild Free-Roaming Horses and Burros Act (WFHBA)
clearly states that the legal Herd Areas are to be “devoted principally” to the welfare and benefit of the
wild horses, such was far from being the case.
The so-called “Appropriate Management Level” (AML) decided upon by BLM for South Steens HMA is a
mere 159 low-range to 304 high-range wild horses. Given ca. 130,000 HMA acres, this works out to 818
acres (1.28 square miles) per individual horse at low end and 428 acres (0.67 square mile) per individual
horse at high end, for an average of 623 acres – nearly one square mile – per individual horse at the
mean AML of 232 horses. This is an almost wild-horse-empty ecosystem.

10
Cattle ranchers are typically allowed to stock their permitted ranges at densities of at least one large
cow and her calf per 100 acres. A cow and her calf BLM equates to one “Animal Unit Month” (AUM)
worth of grazing, which BLM also assigns to a single wild horse, though these often weigh less than the
average cow. Thus, the unequitable treatment of the wild horses again rears its head. See Appendix B
for detailed evidence on this all important “fairness issue”. ( See also Ganskopp 1984, Berger 1986,
National Research Council 2013, Steen Mountain Advisory Council Meeting 2012, Devlin 2018, Hansen
et al. 1977, Downer 2014 a, Downer 2014 b, Wild Horse Freedom Federation 2017).
The heavy presence of cattle grazing within the HMA and its year-long effects proves BLM has failed the
wild horses of South Steens as well as their supportive public. Furthermore, this federal agency is tightly
managing the herd to favor pinto coloration rather than allowing natural selection to occur. And color
can be a big factor when it comes to survival, as this relates to camouflage and predation as well as heat
absorption and dissipation. BLM herd management constitutes a form of semi-domestication and
violates the core intent of the WFHBA. And the artificial selection of traits, including sexual, can be
detrimental to the overall fitness of a population (see Knell et al. 2017). Stallion genetic diversity is of
particular concern, as it has waned to very low levels among the world’s horses due to artificial breeding
favoring a small selection of stallions (see Lippold et al. 2011, Horsetalk 2011, Planet Earth Online 2011).
For this reason, it is through restoring wild, naturally living horses of viable population size and
untampered reproduction in adequate habitats that this serious situation can and must be corrected.
Included in Appendix B is an exacting analysis by wild horse researcher Marybeth Devlin of the past and
present management by BLM of the South Steens wild horse herd and HMA. The unfairness being
displayed toward these wild horses is flagrant. Both the elimination of the Alvord Peak portion of the
original Herd Area citing conflict with Bighorn Sheep and the questionable manipulation of reported
population numbers and growth rates are unjust and must be corrected in order to restore these wild
horses at viable population levels and as fit and ecologically adapted individuals and bands.
KIGER MUSTANG HMA

11
https://www.blm.gov/site-page/programs-wild-horse ... Select Kiger Mustang HMA.
One can read or see pictures or videos about the Kiger Mustangs, but one must experience them directly
and in person to gain a vivid and true appreciation of their special uniqueness and inspiring aliveness. I
have done this upon several occasions and what a thrill it has always been. I truly look forward to visiting
them again and frequently, but am very worried that this wonderful and unique lineage of wild horses is
being literally squeezed into a serious decline and very possible demise by the ruthless “management”
program it is suffering. In this, the emphasis is definitely on the “man” and not on the “horse” in its own
right. We must change this unacceptable situation, but it will take real gumption to do so and a vision of
just where and how to proceed. We people can learn how to share the land and freedom with such
wonders of the animal world as these horses. We can all learn to be conscientious citizens of Planet
Earth and realize greater possibilities for All of Life – Not Man Apart – to live in harmonious mutualistic
symbiosis. This dream must come true, become a “practice what you preach” phenomenon. And I see
no greater place to begin than in the Kiger-mustang-containing ecosystem. Here where the awesome
Steens Mountains water the Malheur marshes is a home, a place of evolutionary unfolding, of such
great wonder, and this unique wonder can only unfold in natural freedom!
Spry Young Kiger Mustang in Kiger Mustang Wild Horse HMA Wildfire Recovery Area.
Kiger Mustang HMA, Oregon 10/2017. Photos © Craig C. Downer 2017

12
As the above map indicates, the entire Kiger Mustang HMA is grazed by rancher’s livestock, as are
several other wild horse HMAs in this region. Three different permittees occupy the Kiger HMA.
I performed eighteen 100-foot ecological evaluation transects in this small 36,618-acre HMA, which is
located 45 miles southeast of Burns and two miles east of Diamond (for transect results, see below).
Though BLM publicizes the special “Spanish Colonial Mustang” character (related to the rare Sorraia, see
Oekle 1997) of these horses, it has hypocritically assigned a small and inadequate area for them to try to
survive in as well as a non-viable population level, or AML. And even in this greatly reduced HMA, my 18
transects indicate that cattle are consuming the vast majority of the vegetation. So not even in this tiny
legal area designated for a very special, remnant Spanish mustang breed are these outstanding,
intrinsically valuable animals being given preference over public lands livestock ranchers. This is contrary
to the core provision of the WFHBA1. Indeed, BLM admits that it has to periodically transfer horses
1 The Wild and Free Roaming Horses and Burros Act of 1971, PL-92-195.
Source: Animal Welfare Institute, 2012.
13
between Kiger Mustang HMA and Riddle Mountain HMA in order to maintain genetic diversity.
However, the level of genetic heterogeneity (genetic variation) is far from what would assure long-term
viability/survival (Duncan 1992, Downer 2014 a & b; Bureau of Land Management; see also Appendix C).
The Kiger Mustangs are predominately duns, grullos, and buckskins with dark or mixed dark-and-light
manes and tails, many with dorsal stripes and leg stripes. Many have dark extremities, and there are
some bays. They show fine Arabian features and are noted for their intelligence and stamina. Average
weight is ca. 825 pounds and height: 14 hands. (See Associated Press 1994, Gregory 1999; Hollon 1997,
Terry 2011, Yee 1999.)
The HMA has some broad, high valleys and plateaus with cliffy rimrock areas, rocky soils, or lithosols
(Tate 1987), frequent Western Juniper groves, and a variety of plants and animals. Among plants I
observed: Rigid Sagebrush (Artemisia rigida), Tall/Wyoming Big Sagebrush (Artemisia tridentata, var.
Wyomensis), Rabbitbrush (Chrysothamnus spp.), Western Service Berry (Amelanchier alnifolia) – which
some wild horses eat – Needlegrass (Stipa spp.), Bluebunch Wheatgrass (Agropyron spicatum), Giant
Rye Grass (Elymus cinereus), Round-Leaved Peppergrass (Lepidium perfoliatum), and wild Purple Sage
(Salvia dorrii). Among animals I observed Pronghorn Antelope (Antilocapra Americana), Mule Deer
(Odocoileus hemionus), Mountain Cottontail Rabbit (Sylvilagus nuttallii), Black-tailed Jackrabbit (Lepus
californicus, actually a hare), Ground Squirrels (Citellus sp.), Great Basin Gopher Snakes (Pituophis
melanoleucus), Badger (Taxidea taxus), Chukar (Alectoris chukar), Whitetail Antelope Squirrels
(Ammospermophilus leucurus), Golden Eagles (Aquila chrysaetos), Red-tailed Hawks (Buteo jamaicensis),
Ferruginous Hawks (Buteo regalis), Cooper’s Hawks (Accipiter cooperii), Prairie Falcons (Falco
mexicanus), White-crowned Sparrows (Zonotrichia leucophrys), Oregon Dark-Eyed Juncos (Junco
hymenalis oreganus), American Robins (Turdus migratorius), and Western Bluebirds (Sialia mexicana).
Discussion of Findings for Kiger Mustang HMA
The Kiger Mustang HMA is featured in the Burns District BLM’s Diamond Loop National Back Country
Byway, but there are hardly any Kiger Mustangs left to see for those who make the considerable effort
to reach the HMA, including the Kiger Wild Horse Viewing Area (Burns District Office, 2009.). I observed
this HMA to be nearly empty of wild horses, encountering only one group upon first entering the HMA
on the western side of a ridge among tangled bushes and trees, many of which had recently burned (see
photos). This group was composed of a few intermingling bands whose individuals were quite afraid of
people and did not linger upon my showing up, though with a gradual zig-zag approach. It was only a
matter of minutes before they ran off. On the following day, when I reached the advertised “Kiger Wild
Horse Viewing Area” utterly no wild horses were to be seen, nor was there any sign indicating they had
been there in recent months.
The AML for the HMA is an unjust 51 low-range to 83 high-range wild horses. Given 36,618-acres within
the HMA, there would be 718 acres (1.12 square miles) per individual wild horse at the low range and
441 acres (0.69 square mile) per individual wild horse at the high range of the permitted AML. The
average AML is 67 for 547 acres (0.85 square mile) per individual wild horse. As was the case with the
South Steens HMA but even more so, this is a sparsely inhabited, though legal, wild horse area and
indicates a bias by Burns BLM to so relegate these rare and valued wild horses to such a small area,
whose forage and water resources are – even here – in their majority given over to cattle ranchers.

14
As with the South Steens herd, the Kiger mustangs are being overly subject to artificial selection. This is
contrary to the core intent of the WFHBA. Natural selection is being thwarted, and the herd is becoming
a tiny, semi-domesticated herd. Though BLM advertises their preserving of the Spanish Mustang
heritage with the “Kigers” their management program is seriously undermining this precious remnant
herd. Urgently needed is a reduction in livestock and an increase in the Kiger Mustang population
through natural reproduction and restoring of Kiger mustangs that had been earlier removed along with
increased forage and water allocations and the provision for and safeguarding of other long-term
habitat requirements. This will enable a sound and uniquely tailored Reserve Design to meet all of the
long-term needs for a viable Kiger-Mustang-containing-and-enhanced ecosystem.
Though several caterpillar-excavated reservoirs were observed, nearly all were dry and all had been
recently trampled by cattle. The HMA was lacking in water; and few natural springs were present. My
overall conclusion was that this famous wild horse herd and its legal habitat were being given
insufficient resources for their long-term survival, and that even the tiny portions of forage, water, and
shelter that were being utilized by the relatively few wild horses here were begrudged by the cattle
ranchers, deer hunters, and even supposed conservationists – many of whom have bought into the false
disinformation campaign that has for many years been waged against wild horses (Wild Horse Freedom
Federation 2017, Animal Welfare Institute 2012). If ever there were a herd that deserved better
treatment, more forage, water, space, habitat and a greater population number, it would be these Kiger
mustangs, yet I see no concrete proposals to this effect. Another unfairly treated herd of Spanish
Colonial Mustangs occurs in the Pryor Mountain Wild Horse Refuge in southern Montana, about which I
did a field inspection and report (Downer 2016 a, Downer 2014 a).
Located just to the east of the Kiger Mustang HMA, the Riddle Mountain HMA also contains the Kiger-
type mustangs (See map above). Though exchange of horses between Riddle and Kiger Mustang HMAs is
facilitated by BLM, Riddle Mountain HMA is only 28,000 acres in size and its AML is only 33 to 56 horses.
So, even in combination with the Kiger Mustang HMA’s AML of 51 to 83, there is still an inadequate,
genetically non-viable population level. The total AML for the two HMAs is 84 to 139 wild horses – well
below the very minimal standard of 150 wild horses that the BLM often uses for minimum viable
population – on the combined Kiger Mustang and Riddle Mountain HMA acreage of 64,618 acres (101
square miles).
The BLM’s website values the Kiger-type wild horses from these two HMAs principally as potentially
domesticated horses, for no mention whatsoever is made of their valuable place and role in the natural
ecosystem, e.g. significant contributions to the humus content of soils (Tate 1987), to the successful
dispersal and germination of the seeds of many native plant species, and to the prevention of
catastrophic wildfires on both public and private lands (Simpson 2017). Such catastrophic “megafires”
are alarmingly increasing in our times, mainly due to the pollution of the Earth’s atmosphere and the
destruction of natural ecosystems that mainly unquestioned human traditions continue to cause and at
accelerating rates (see Kapoor 2017).
Appendix C gives detailed proof by wild horse researcher Marybeth Devlin concerning the unfair
treatment of the world-famous Kiger mustangs. And it is hoped that with this report meaningful reforms
will take place for the restoration of this great American heritage, a heritage that is both historical and
evolutionary – deeply rooted in the American ethos and psyche.

15
PAISLEY DESERT WILD HORSE HMA
The Paisley Desert HMA is 100% occupied by livestock with a heavy emphasis and favoritism being given
to the ranchers over the wild horse interest. It is located in Oregon BLM’s Lakeview District.
Though I spent two days in this HMA, entering both from the north, from Christmas Valley (where I
camped) and from the south, proceeding north from the town of Paisley, I never laid eyes on a single
wild horse. When I finally did find some unshod horse tracks in the southern portion, these represented
only a few horses. What I did witness were several hundred cattle in this sizeable HMA of 271,667 acres
(424.5 square miles). Paisley Desert’s AML is only 60 to 150 wild horses – figures that are woefully
disproportionate to this HMA’s large acreage. To wit: at the low end of the AML of 60, there would be
4,528 acres (7.075 square miles) per individual wild horse, while at the high end of 150, there would be
1,811 acres (2.83 square miles) per individual wild horse. The average mid-level population of 95 wild
horses would be 2,860 acres (4.47 square miles) per individual wild horse. Appendix D also confirms this
extremely unfair situation for the wild horses. Devlin (2018) also reports that Oregon BLM maintains the
Paisley Desert wild horse population increased 179% between 2015 and 2016, i.e. from 154 to 430
horses, which I agree would be “biologically impossible”.
Many witnesses I have spoken to report that wild horses are being driven into various HMAs deliberately
by ranchers and others in order to give the appearances of such extravagant population increases. Also
involved here could be poor, tendentious, or even dishonest census taking involving double counting
and the use of “fudge factors” such as automatically assuming 20% annual population growth while
ignoring normal 50% foal mortality or more and ca. 5% to 10% adult mortality (Gregg et al. 2014). –
Remember that so long as the tendentious livestock industry remains in cahoots with BLM, USFS, and
other government officials, they will continue to “grind their axe” against the wild horses and burros.
Given this unwholesome situation, how can we expect any true objectivity and fair treatment
concerning these our “national heritage species”?
Although I saw none of the Paisley Desert wild horses, according to BLM’s website, genetic analysis has
revealed affinities with the Colonial Spanish Mustangs, as well as Morgan, Saddlebred and Kentucky
Mountain Saddle horses. According to BLM, a great diversity of colors is present, including bays, browns,
blacks, pintos, palominos, duns and buckskins. The average size is ca. 15 hands high and 1,100 pounds in
weight.

16
Paisley Desert Wild Horse HMA
Photo from www.blm.gov Herd Management Areas Oregon, Paisley Desert HMA. https://www.blm.gov/site-page/programs-wild-horse (select
Paisley Desert HMA). Accessed 2/25/2018.
Band of Fleeing Wild Horses from Paisley Desert HMA

17
My observations of livestock grazing in the HMA indicated considerable overuse of forage plants and
trampling, particularly near moisture habitats such as meadows and springs. This was contributing to
more erosion, chiefly by wind, but also by precipitation runoff, especially in steeper areas.
The Southern boundary of the HMA is 10 miles northeast of Paisley, Oregon, and very near a huge cattle
feedlot belonging to the Simplot Land and Cattle Company. This had thousands of cattle in it when I
visited, and Simplot does in fact graze many of the Paisley Desert HMA sectors (see Appendix D). The
northern end of the HMA lies 15 miles to the southeast of Christmas Valley
HMA terrain is rocky with several long rimrock ridges running southeast to northwest. Intervening areas
have closed lakebeds and grassy areas, whose forage mostly goes to ranchers’ cattle, and there are
grazing allotment fences partitioning the HMA. Much of the HMA is shrub-land, with Wyoming Big
Sagebrush, Basin Big Sagebrush, Black Sagebrush and associates (all Artemisia spp.) prevailing in many
areas. There are also large areas where significant stands of Rabbitbrush (Chrysothamnus spp.), Spiny
Source: Animal Welfare Institute, 2012.

18
Hopsage (Atriplex/Grayia spinosa), and Greasewood (Sarcobatus vermiculatus) grow. Frequent grasses
are Blue-bunch Wheatgrass (Agropyron spicatum), Bottlebush Squirreltail (Sitanion hystrix), Indian Rice
Grass (Oryzopsis hymenoides), and Sandberg’s Bluegrass (Poa secunda). Among vertebrates, Bighorn
Sheep (Ovis canadensis), Pronghorn Antelope (Antilocapra americana), Mule Deer (Odocoileus
hemionus), and Sage Grouse (Centrocercus urophasianus), along with many other bird, rodent and
reptile species, are to be found, though not in the abundance they would be if there were not so many
cattle.
Discussion of Findings for Paisley HMA
From Christmas Valley residents I received reports of ongoing illegal killings of the wild horses by locals.
Apparently these crimes are being ignored by authorities. More investigation of the facts are needed
here. And there is a probable tie with livestock permittees.
In addition to the cattle trampling and overgrazing, a serious problem exists with borrow pits (one of
which I visited), wind erosion of soils, vehicle damage to soils, and poaching. The large borrow pit at the
southern end of the HMA evinces considerable evidence of wind scouring and should be remedied by
compacting exposed soils surfaces and planting of suitable native vegetation.
Appendix D contains a report by wild horse researcher Marybeth Devlin concerning the Paisley Desert
wild horse herd and HMA. As suspected, BLM’s planning documents and management actions constitute
a particularly egregious injustice toward the wild horses and their supportive public here.
THREE FINGERS WILD HORSE HMA
Band of Wild Horses in southern Three Fingers HMA, Oregon, June 4, 2017. Photo © Craig C. Downer 2017
www.blm.gov/site-page/programs-wild-horse ... Select Three Fingers HMA

19
From the map, it is obvious that 100% of the HMA is allocated for livestock and that the HMA is also
surrounded by extensive grazing allocations, except for the west side: the Owyhee Reservoir.
My 39 ecological transect analyses and resultant report (including flight census and Reserve Design
recommendations) for this HMA have been extensive and were conducted for the Friends of Animals
(Downer 2016 c, Downer 2017). While these reports are in the organization’s hands, I will say that the
degree of unfairness displayed by the Vale BLM Field Office is extreme (see Appendix E). Only a tiny,
genetically non-viable remnant herd is left in this HMA; and nearly all of the remaining wild horses were
amassed around a single remote spring bounded by steep terrain and cliffs. Rancher’s livestock now
occupy nearly the entire HMA and in numbers summing in the thousands.
During my LightHawk-sponsored overflight of the HMA on June 3, 2017, I became most aware of how
nearly wild-horse-empty but cattle-full the Three Fingers HMA actually was. Aside from a wild horse
Source: Animal Welfare Institute, 2012.

20
congregation around a spring, I saw only one small band of three horses and one lone horse while flying
back and forth in a zig-zag pattern in order to cover the entire HMA. The congregation of ca. 60 wild
horses I saw were located around a highland spring. They seemed to be relegated here by various
devious means, including patterns of fencing, roads, water availability, and livestock allotments. Upon
investigation, it became apparent that BLM officials had used a major wildfire -- the Cherry Road Fire –
as a pretense for “gutting” this herd (see Appendix E). This wildfire burned during the late summer of
2016, and was all the excuse needed to almost entirely eliminate the wild horses from this spectacular
62,509-acre (97.7 square mile) HMA. My on-ground as well as in-flight inspections of the HMA indicated
a possible deliberate allowance of this wildfire to burn within the HMA, in order to disfavor the wild
horses – now practically all gone – and to favor the rancher’s livestock – now occupying nearly the entire
HMA and in numbers summing in the thousands.
Achieving justice for our wild horses and burros depends on federal officials exercising their authority to
legally reduce private, usually corporate, domestic livestock grazing in the wild horses’ and wild burros’
legal areas, whether on BLM or USFS lands. Such exercise would be legally covered under 43 Code of
Federal Regulations (C.F.R.) 4710.3-2 and 43 C.F.R. 4710.5(a). In particular 43 C.F.R. 4710.5 clearly states
that the Bureau of Land Management can legally reduce or even close livestock grazing in order “to
provide habitat for wild horses and burros.”
This HMA lies 25 miles northwest of Jordan Valley, Oregon, and has its western border along the
extensive Owyhee Reservoir, hence there is an abundant water source for naturally wide-ranging wild
horses to which they should have every right. The southern boundary is the Leslie Gulch Road. Leslie
Gulch itself is an Area of Critical Environmental Concern (ACEC) where a rugged and steep terrain
prevents wild horses from entering. “California Bighorn Sheep” (see Appendix E) were introduced here
but, according to reports I received, died out in recent years due to a form of pneumonia contracted
from livestock. Though I hiked throughout the area, I saw no current sign of these wild Bighorn.
Domestic sheep are known to transmit very devastating strains of pneumonia to these their close,
though wild, kin, and cattle may also infect Bighorn sheep.
Three Fingers wild horses average around 950 pounds and 15 hands tall. Genetically they are similar to
American Light Racing and Riding breeds, with some North American Gaited Breed intermixture. They
are reported to have stemmed from horses released by locals and display sorrel, bay, brown, black, and
gray colorations. But Native American, including Bannock, herds probably also contributed significantly
to their makeup (D’Azevedo 1986).
Elevations within the HMA vary from ca. 2,600 to 5,000 feet a.s.l. Common plant species are Wyoming
Big Sagebrush (Artemisia tridentata var. wyomensis), Gray Rabbitbrush (Chrysothamnus nauseosus),
Bluebunch Wheatgrass (Agropyron spicatum), and Sandberg’s Bluegrass (Poa secunda). Over much of
the HMA and adjacent areas, frequent wildfires have resulted in a replacement of native vegetation with
certain exotic invaders prevalent in the West, especially the shallow-rooted winter annual Cheat Grass
(Bromus tectorum) as well as the Medusa-head Rye Grass (Taeniatherum caput-medusae). Both of the
latter are taking over large portions of the HMA and surrounding lands, especially the former. I believe
that wild horses could help eliminate these by grazing them before they set seed in the spring or early
summer and also by preventing the very wildfires that promote the proliferation of Cheat Grass. The
Medusa-head rye grass was especially introduced to favor cattle -- contrary to the principal purpose of
the HMA -- the preservation of the wild horses, as Section 2 (c) of the WFHBA insists.

21
Annual precipitation in the HMA arrives mainly in winter and spring as snow, though summer thunder-
storms also contribute significantly. This averages 8-to-10 inches per year. There are several perennial
springs within the HMA, but too often these were observed being despoiled by cattle trampling and
defecation. In general it seems that many of the original water sources of the Three Fingers Herd Area
have been deliberately made inaccessible, particularly Succor Creek, access to which was part of the
original Three Fingers Herd Area, meaning the horses were using this in 1971 (see photo).
Succor Creek with year-round water on eastern side of Three Fingers Herd Area, but excluded by BLM from becoming part of Herd Management Area. June 2017. Photo © Craig C. Downer 2017
Threatened Greater Sage Grouse (Centrocercus urophasianus) occur in the HMA, along with Spotted
Bats (Euderma maculata) and Kit Foxes (Vulpes macrotis). I observed a large herd of over 100 Pronghorn
Antelope (Antilocapra americana) in the southeastern section of the HMA near some ranches. These
“fastest-running” land animals all took off in unison and quickly crested a ridge. I estimated their speed
at over 40 m.p.h. I also observed several Mule Deer (Odocoileus hemionus) and spoor of Rocky
Mountain Elk (Cervus canadensis), a.k.a. Wapiti. I encountered many birds, a large part of which were
associated with Lake Owyhee. These included a pair of elegant and acrobatic Common Terns (Sterna
hirundo). A true exotic species from Central Asia and Eastern Europe which displaces similar native
North American upland species, Chukar partridges (Alectoris chukar) were common, as were Raven
(Corvus corax), Coyotes (Canis latrans), Red-tailed Hawks (Buteo jamaicensis) and Golden Eagles (Aquila

22
chrysaetos). Mountain Lion (Felis concolor) and Bobcat (Felix/Lynx rufus) tracks were observed. Among
the world’s fastest flying birds, both Prairie Falcons (Falco mexicanus) and Peregrine Falcons (Falco
peregrinus) were seen in cliffy areas, especially near the reservoir. The Peregrine Falcon has recently
been removed from the Endangered Species list, though it still warrants careful protection.
Discussion of Findings for Three Fingers HMA
The HMA’s terrain contains many isolated plateaus and rolling, grassy hills that are ideally suited for
inhabitation by wild horses. However, there was no sign of wild horses over the vast majority of the
HMA (estimated at 95% of the horses’ legal area). Three Fingers has an AML of only 75 to 150 horses. At
the low of 75, there would be 833 acres (1.3 square mile) per individual wild horse. At the high end of
150, there would be 417 acres (0.65 square mile) per horse. Additionally, many livestock allotment
fences exist within the HMA and these interfere with the wild horses’ natural movements. As such,
these fences are contrary to the “free-roaming” mandate of the WFHBA, though this is true of nearly all
HMAs today. It bears noting that these fences probably interfere with the interbreeding exchange
among bands, putting in further jeopardy of inbreeding an already dangerously low wild horse
population. Also, the extreme wariness of those wild horses I observed indicated possible persecution
by ranchers and others.
Three Fingers wild horses lend many positive contributions, not the least of which is the mitigation or, in
many cases, the prevention of catastrophic wildfires. They also contribute greatly to soil building
through humus derived from their droppings, successful seed dispersal and germination for a great
variety of plants, and the opening up of food and water sources for a great many species. The chief
problem in the HMA is that it is not being protected and managed for the wild horses, as the law
requires, but rather principally for livestock. Those wild horses who remain risk inbreeding due to their
low population level; and steps should be taken to remedy this situation as soon as possible. This can be
accomplished by opening up overly fenced areas, reducing livestock allocation within the HMA, and
restoring wild horses. These would preferably come from Three Fingers wild horses currently held in
holding facilities by the BLM, such as at the Burns BLM holding facility, or wild horses from nearby herds
whose members would be similarly adapted to the Three Fingers’ climate, vegetation (important both as
forage and for shelter), terrain, level of natural predation, nature of soils, and other conditions. Indeed,
it was the promise of the Vale office of BLM to return the wild horses it has gathered from Three Fingers
HMA as the grazing resource recovered, but so far not a single wild horse has been restored to its
natural native home here.
The HMA and adjacent areas present very scenic and spectacular views, as well as some amazing
petroglyphs, probably of Bannock origin. There were some well-maintained, non-electric camping sites,
both on the northern and southern as well as on the eastern sides of the HMA. And hot springs for
soaking were near the northern and southern HMA boundaries. A significant portion of the visitors I
witnessed who came here were photographers and sightseers and would have greatly appreciated
viewing the beautiful and spirited wild horses had more been present to make this possible.
APPENDIX E gives a thorough-going analysis of the “fairness issue” at hand with this dangerously
reduced and resource-deprived herd, and I recommend a careful study of its factually-derived points.

23
BIG SUMMIT WILD HORSE HMA (aka Territory) on Ochoco National Forest
This is the only wild horse territory that is exclusively managed by the US Forest Service in its
northwestern region. Located in the Lookout Mountain Ranger District of the Ochoco National Forest, it
was not described on the official USFS website (https://www.fs.fed.us/), though the District office in
Prineville had a detailed handout describing it as an HMA. It was listed on the National USFS website
(composed on February, 2014), which indicated its assigned AML as 60 wild horses (no minimum or
maximum given) and a current 2014 population of 138. Of singular interest is that out of a total 53
territories for wild horses/burros, 19 were listed as “Inactive” and, so, presumably devoid, i.e. “zeroed-
out”, of wild equids. No acreages were given but an estimated total wild horse population of 5,776 and
an estimated burro population of 707 were given for all US Forest Service lands in the United States.
Though the Big Summit Wild Horse Territory figured on a large-scale map of wild horse and wild burro
territories on the current 2018 USFS website, it did not figure in the alphabetical listing of all the
territories. From handouts and public article information as well as from my personal visit to this
territory, I was able to better assess what was transpiring with this legal herd and its habitat. Though
legally established by the 1971 WFHBA, it was not until 1975 that the Ochoco National Forest practically
established this small 27,300-acre (42.7 square mile) “Herd Management Area” for the wild horses living
here. Much later, and because the management plan for this herd had not been updated since 1975, a
special meeting took place from noon to 7 PM on November 17, 2015, at the Ochoco National Forest
office in Prineville. Yet, to date (early 2018) no final decision has been made as to the exact content of
the Herd Management Plan.

24
In late April 2017, on entering the HMA, I immediately observed a band of twelve rather nervous, lean
and muscular wild horses along an overflowing stream a few hundred yards above a campground. Upon
detecting my presence, they quickly and energetically dashed up a steep, rocky hillside to the south of
the stream. A shrill series of whinnies was then heard several hundred yards to the north from the pine-
covered hillside. This stirring alarm issued from a wiry, dark stallion obviously urging his band to retreat.
Profusely sweating and with matted coat, his concern and anxiety were palpable. Although at first I
thought I was the cause of the wild horses’ panic, I later thought that something or someone was
stalking this band from the north, for the stallion seemed to have been agitated for some time to
produce such a sweat, and he had just crashed down a mountain slope, a sign of evading pursuer(s). But
could he have feared for his band’s security due to my close proximity to his charges, who themselves
were very afraid and shot off like rockets when I approached them? After carefully reading the
trenchant and truth-seeking Appendix F, I am more inclined to believe that these horses were deathly
afraid of me just because I was a tall man with a cowboy-like hat. Indeed, the behavior of the band and
the stallion closely resembled that of Big Summit bands due to ongoing persecution (see Appendix F).
The HMA itself is mountainous and covered with medium-to-tall conifer forests, chiefly yellow pines
(Pinus ponderosa). It is well watered, and had a number of gushing springs and streams as well as some
sizeable lakes brimming full of water when I entered here. There was still so much snow that I could not
complete the loop road due to high drifts. I particularly recall the lovely Walden Lake, which I hiked
around but encountered no recent sign of wild horses – which struck me as very odd given this was right
in the midst of their legal territory and would present a major source of drinking water.
Overall, I observed that sheep were taking most of the forage in the HMA and a relative small portion
seemed to be going to the few wild horses here. This is confirmed by the exacting research presented in
Appendix F. Indeed, the sheep ranchers are being allowed to consume the great majority of the
nutritious forage during the prime growing season of spring and summer. Some areas of meadow and
livestock holding areas were overly trampled by livestock. Of greatest concern was the fact that I saw so
few horses or sign of their presence, although I nearly completed the road loop and made frequent
Sympathetic Big Summit Wild Horse Band
Photo: www.blm.gov/or/resources/whb/BigSummitHMA.pdf

25
stops and hikes into the HMA’s interior. There were also tight, four-strand, barbed-wire fences along the
eastern boundary of the HMA. These and other interior fences constituted hazards to the wild horses,
interfering with their healthy daily and seasonal foraging, watering, and socially related movement
patterns – and the reduction of the herd gene pool due to their reduced ability to intermingle.
During my days at Big Summit, I observed and photographed many details. It was plain that the chief
allocation of HMA resources was going mainly to bordering ranchers. Also loggers and wood gatherers
were being given a liberal license to remove logs or firewood; and their incursions by heavy trucks were
producing significant erosion of top soils that were causing much damage to the health of the
ecosystem. Hunters were also being very much catered to, as attested frequent ATV trails, signs of deer
and elk butchery including hanging poles along with campfire rings with parking places.
Discussion of Findings and Plea for Action
During June of each year, volunteer and USFS workers count the Big Summit wild horses. They go either
by horse or on foot throughout the accentuated topography of the entire HMA. Ca. 150 wild horses
were counted in June, 2015. A non-profit called the Central Oregon Wild Horse Coalition (COWHC) exists
and has a very dedicated president, Gayle Hunt, with whom I spoke. As well as participating in the
count, COWHC monitors and advocates for the wild horses of Big Summit and several other legal areas.
Since the revised plan for this herd is to be finalized later this year (2018), substantive inputs on behalf
of this herd and its habitat could help restore the herd to a viable level and assure a benign future for
these unique and inspiring mustangs and the many people who value them, many of whom view them.
At a mere 60 horses, the Big Summit AML would be genetically non-viable (Duncan 1992). This unfair
AML represents 27,300 divided by 60 = 455 acres (0.71 square mile) per allowed individual wild horse.
This arbitrary figure is unnatural and ignores the existing niche space for horses in this ecosystem, and
how the horses’ filling their niche actually restores balance to an ecosystem that is overly burdened by
all the many ruminant-digesting herbivores such as cattle, sheep, and deer that modern society overly
promotes but which in a more balanced situation the horses themselves would complement but at
levels more appropriate for each species in question (Hansen et al. 1977, Downer 2014 a & b). Indeed,
as sources presented in Appendix F indicate, even the anti-wild-horse officials had to admit that the
horses grazing down of coarser drier vegetation gave a boost to greener and more nutritious vegetation
for the very large flocks of sheep that graze the HMA.
This inadequate AML should be considered illegal, for it is contrary to Section 2 (c) of the unanimously
passed Wild Free-Roaming Horses and Burros Act and conflicts with other mutually supportive acts,
including the Multiple Use and Sustainability Act and the National Historical Heritage Act. Forest Service
officials, Congressmen and Senators alike should recognize the “principal” status of these unique
“national heritage” and “returned North American native” wild horses (MacPhee 2013). Both the AML
designation and its associated resource allocation for the Big Summit HMA should be revised. This
urgently needed reform to upgrade the herd and its habitat could be accomplished this year, 2018,
provided concerned and enlightened people take the necessary steps at upcoming meetings, etc.
Although the Big Summit HMA is a charming area, an inescapable and ominous feeling arose in me that
those who possessed the most right to naturally live here – the wild horses – were precisely those who
were being most persecuted – even blamed for contrived grievances – by vested interests and

26
authorities alike. (Proofs that my feeling was correct are given in Appendix F.) These unique “mountain
forest” horses deserve their fair share of this land and its resources as well as precious freedom. They
are highly evolved, spirited, peace-loving, and positively contributing presences – and they are definitely
a deeply rooted, returned native species here in North America (MacPhee 2013). Additionally, a large
part of the local, national and international public greatly appreciate them and want to see their fair and
just treatment. They must not be singled out for blame, or “scapegoated”. Eventually such blind
persecution would cause their disappearance even from legal areas such as the Big Summit HMA where
they possess the most right to live. Ironically, though they are being disreputably persecuted and
squeezed out here, it is precisely their restoration to greater, truly viable population levels that could
revive the local economy (see Appendix F).
My sincere hope for the new year is that the new plan that emerges for this herd and its legal habitat
will not be all about how to further restrict and hamper these worthy denizens of Big Summit, as for
example through the harmful and vigor-compromising darting of PZP to prevent mares from conceiving
and in a population that is already genetically subpar. Rather, my prayer is that more enlightened
concepts including principally Reserve Design (Downer 2010, 2014 a & b; Peck 1998) will be adopted and
that this herd will be allowed a larger, truly viable population and, concomitantly, a much fairer portion
of the forage, water, and other habitat requirements derived from this unique mountain ecosystem
where they play such a benign and life-enhancing role, paying pack their natural home multifold.
Disastrous herd “management” plans that are contrary to Section 2 (c) of the unanimously passed Wild
Free Roaming Horses and Burros Act and also conflict with mutually supportive acts such as the Multiple
Use and Sustainability Act and the National Historical Heritage Act should be abandoned as Forest
Service officials, Congressmen and Senators alike come to recognize the legally ”principal” status of
these unique “national heritage” and “returned North American native” wild horses.
I highly recommend your perusing Appendix F – a brilliantly researched and substantiated expose of the
unfairness that has gone on for far too long concerning Big Summit HMA. And it goes further to provide
a rationale and plan for the restoration of this great and unique heritage: the Big Summit wild horses.

27
Ecological Evaluations Analysis and Recommendations
Data from 100’ Transects (Total N = 33)
SOUTH STEENS WILD HORSE HMA
Overall this evaluation evidences some significant disturbances to the ecosystem that should be
prioritized and addressed.
The Departure from Expected (D fr E) graph findings indicate a few sites both in the None to Slight (N-S)
and the Extreme to Total (E-T) categories, with most falling in the more moderate categories: Slight to
Moderate (S-M), Moderate (M), or Moderate to Extreme (M-E). Considerable departures in the
Moderate to Extreme category occurred for Soil and Site Stability, Hydrological Function, and Biotic
Integrity, all of which had 20 percent or more of the transect evaluations in each of these categories.
The highest percentage noted was 53% from Biotic Integrity with Slight to Moderate departure
category; this indicates the adaptation of living organisms in disturbed habitats. Soil and Site Stability
and Hydrological Function were similar – though the former had the highest percentage in the Moderate
to Extreme category at 27%.
By examining the comparative %EDF graph (see below, p. 30) for the South Steens HMA at the left
column for each factor, we see that Livestock-associated disturbance is by far the greatest factor, being
present in 14 of the 15 transects (93%). Invasive Species was the next most significant disturbance
factor, occurring in 10 of the 15 transects (67%), followed by both Roads-Vehicles and Hunters in 8 of
15 transects (53%), then by Wind Erosion in 7 of 15 (47%), Water Erosion: 6 of 15 (40%), Tree Cuttings: 5
0
10
20
30
40
50
60
N-S S-M M M-E E-T
OR South Steens HMA Departure from Expected (% D fr E) N=15 100’ transects by Craig Downer, 10/2017
Soil/Site S Hydrol F Biotic Int

28
of 15 (33%), and Fire: 2 of 15 (13%). Disturbance from Mining and Energy Extraction, common
throughout the West, was not observed in South Steens, at least in the areas I visited.
The low incidence of Fire Disturbances here could correlate to the wild horses as well as other
herbivores in their capacity to reduce large quantities of dry flammable vegetation. As contrasted to the
ruminant, pre-gastric digesting herbivores, the horses possess a post-gastric, caecal digestion, which
better equips them to tolerate ingesting drier, coarser grasses, forbs, and even certain bush or tree
leaves without spending so much metabolic energy as ruminants do. Consequently, their droppings, or
feces, are less degraded and contribute more humus to soils, adding greatly to their nutritive and
moisture-retaining qualities and capacities. The latter acts to further prevent wildfires by dampening out
lightning strikes, sparks from campfires and the like. Cheat Grass, for example, is very flammable and
thrives in disturbed soils. Water runoff from roads and ORV trails can also be a significant cause of
topsoil removal and gully erosion.
South Steens HMA Top Three Management Priorities and Recommended Actions
1. Livestock Impacts: reduce domestic livestock AUMs, shorten rotation periods, incorporate rest
years, increase monitoring, incorporate more rapid adaptive management, and give more
emphasis to enforcing grazing regulations, especially as concerns trespass grazing in unauthorized
areas and out-of-grazing-season presence of livestock. This should involve permit cancellation.
2. Invasive Species: monitor cattle/sheep grazing in HMA as vectors for invasive species spread as
seeds or propagules in their feces or even as attached on their coats, hooves, etc. Institute strict
controls over permitted livestock grazing in this area. These practices are common for waterways
but are equally needed in dryland range situations. Monitor visitors, hunters, horseback riders,
and campers and their vehicles, gear, etc., entering the area to reduce the introduction of exotic
species, some of which may be introduced by their pets, riding horses, etc. In regard to riding
horses, considerable monitoring of exotic seeds introduced through their feces and restrictions
resulting therefrom would be required (e.g., requiring use of certified weed-free hay. Policies
encouraging natural succession germane to the native ecosystem here should be adopted as a
more long-lasting way of reducing or possibly eliminating exotic, or invasive species. Such
upgrades in land management priorities should be implemented as soon as possible.
3. Roads-Vehicles-Hunters: a program to reduce vehicle disturbances should include closing and
scarifying unnecessary and excessive roads, including jeep or ORV roads and stricter monitoring
and enforcement program concerning these. Stricter standards and controls need to be
established together with a greater emphasis on public education and regulation enforcement.
Much the same type of upgraded vigilance, education, and enforcement needs to occur with
hunters (and others) whose activities are linked to roads and vehicles. This upgrade in land
management priorities needs to occur as soon as possible.

29
KIGER MUSTANG WILD HORSE HMA
As indicated above, this HMA’s results showed more significant departures when compared with those
found in the South Steens HMA. For example, Biotic Integrity had considerably more D fr E. Both Soil
and Site Stability and Hydrologic Function were also more deviated in relation to what would be
considered the normative and well-functioning state. As in the South Steens, however, the
comparative EDF chart (see below p. 30) again showed Livestock to be the most ecosystem-damaging
factor, present here in 16 of 18 transects (89%). This is closely followed by Roads and Vehicles present
in 15 of 18 transects (83%), in turn closely followed by significant Fire damage documented in 14 of 18
transects (78%). Invasive Species were noted in 11 of 18 transects (61%), followed by Campers (9 of
18, or 50%), Wind (8 of 18, or 44%), and Water and Tree Cutting (each 6 of 18, or 33%).
Kiger Mustang HMA Top Three Management Priorities and Recommended Actions
1. Livestock impacts: reduce domestic livestock AUMs, shorten rotation periods, incorporate rest
years, increase monitoring, incorporate more rapid adaptive management. Grazing compliance
enforcement, including cancellation of grazing permits.
2. Roads and Vehicles: a program to reduce vehicle disturbances should include closing and
scarifying unnecessary and excessive roads, including jeep or ORV roads and a stricter monitoring
and enforcement program concerning these. Establish stricter standards and controls with greater
emphasis on public education and regulation enforcement. Much the same type of upgraded
vigilance, education, and enforcement needs to occur with hunters (and other visitors) whose
0
10
20
30
40
50
60
N-S S-M M M-E E-T
OR Kiger Mustang HMA Departure from Expected (% D fr E) N=18 100' transects by Craig Downer, 10/2017
Soil/Site S Hydrol F Biotic Int

30
activities are linked to Road and Vehicles. This upgrade in land management priorities needs to
occur as soon as possible.
3. Fire: an increase in the legitimate wild horse population would greatly reduce catastrophic
wildfires. I recommend at least 500 as a preliminary population goal later to reach a level in the
low thousands, and to be phased in as livestock and other conflicting interests are pared down.
Reducing wood cutting would allow healthier Western Juniper groves to establish themselves as
well as certain bushes such as Wyoming Big Sagebrush (Artemisia tridentata var. Wyomensis) and
Mountain Mahogany (Cercocarpus ledifolius). This would increase the depth and exuberance of
soils and consequently increase the volume of the aquifer, or water table. It would dampen out
incipient fires. A stricter control on Roads and Vehicles would also greatly aid in the latter. Greater
campfire control is also needed. There should also be stricter controls on prescribed burns, which
can frequently become unmanageable, resulting in large and destructive fires, especially in the
more arid West.
Southern Steens Mountain from just south of Blitzen Creek & north of South Steens campground. Note
Quaking Aspen with golden leaves & conical Western Junipers. Strong barbed-wire fences keep the
South Steens wild horses from occupying this portion of their original BLM Herd Area, including the
highland meadows to which they used to migrate in the warmer seasons. Photo © Craig C. Downer 2017.

31
ENVIRONMENTAL DISTURBANCE FACTORS (EDF) ANALYSIS
SOUTH STEENS & KIGER MUSTANG HMAS
0
5
10
15
20
25
30
35
Fire Wind Water Roads,Vehicles
Livestock Hunters Campers TreeCutting
Mining InvasiveSpecies
Two BLM Oregon HMAs' Environmental Disturbance Factors (% EDF)
100' transects conducted October, 2,017, by Craig DownerSouth Steens HMA N = 15, Kiger Mustang HMA N = 18,
Total N = 33
S Steens HMA Kiger Mustang HMA Totals

32
The above Environmental Disturbance Factor graph indicates that for the combined 33 transects in the
two HMAs, Livestock disturbance was documented as by far the greatest factor, significant in 30 of the
33, or 91% of transects. Impacts from Roads and Vehicles is the second most significant factor, present
in 23 of 33 (70%) of transects, and the third most significant results from Hunters, with disturbance
present in 22 of 33 (67%) of transects. Invasive Species were present in 21 of 33 (64%) of transects.
Disturbance related to Fire was present in 16 of 33 (48%) of transects. At 11 out of 33 (33%), Tree
Cutting was the lowest disturbance ranked. Mining and Energy Extraction was not noted in either HMA.
Discussion of Environmental Disturbance Factors
Though some more obviously and others more subtly, all of the factors are interrelated and interactive.
Both are in Oregon and face similar climate and disturbances, yet each of the HMAs are unique and
respond distinctively to the identified impacts. There can be no “one size fits all” management regimen
even in such similar locations. It can be said, however, that the most damaging impacts are related to
human activities and can therefore be addressed through management improvements. It is plainly
evident that a rapid and significant reduction in livestock and vehicle pressure is needed on these two
HMAs to forestall further degradation.
In both HMAs the declared “Appropriate Management Level” (AML) dictates the low and high range wild
horse population for which the BLM has decided to manage. But these numbers are arbitrarily low and
genetically unfeasible. In these few areas, forage allocations are by law to be assigned in their majority
to the wild horses. There is no honest justification for the paltry forage allocations the wild horses are
receiving, nor for the significant numbers and impacts upon their legal habitat being caused by
overabundant livestock. The wild horses are cherished by the majority of Americans and by public law
must receive their fair share of the resources, including appropriate habitat space. They are allowed no
other places to exist but this fraction of all public lands open to numberless other users.
The Bigger Picture: Oregon and Beyond
By some professional accounts, Oregon has 2,978,751 legal acres (4,654 square miles) in its Wild Horse
HMAs, and aims to manage therein only a total of 1,353 horses (overall low AML), despite fear-
mongering of vested interests insisting an overpopulation must exist. Statewide, the HMAs comprise
2,202 acres, or 3.4 square miles per individual wild horse – a nearly empty natural wild horse habitat
niche. Other extreme examples of the gross inequity handed Oregon’s wild horses in their legal HMAs
are: Beaty’s Butte with 437,120 acres, where the assigned low AML of 100 equates to only ONE horse
for every 4,371 acres (6.83 square miles), and the assigned high AML of 250 represents 1,748.5 acres (or
2.73 square miles) per single horse. The vast Warm Springs HMA has 475,460 acres, but an AML of only
111 to 202 horses. At low end, this represents 4.283 acres (or 6.7 square miles) per individual wild
horse. At high end, it represents 2,353.8 acres (or 3.7 square miles) per wild horse.
It should be noted that biologically impossible growth rates are commonly announced by BLM for
Oregon’s wild herds (as well as others), e.g. Paisley Desert, 2015 to 2016, 154 to 430 horses for an
unbelievable 179% annual growth. Other examples are Beaty’s Butte, 2010 to 2011, 117 to 416 horses
for a 256% annual growth rate; Jackie’s Butte, 2014 to 2015, 18 to 75 horses, for a 317% annual growth
rate. Most of these outlandish rates of population growth being reported by BLM officials would be like

33
asking us to believe that every wild horse, young or old, mare or stallion, produced twins or even
triplets, etc., in a single year! This discrepancy – or falsity – must be addressed through independent
population censuses that are regularly and consistently carried out if wild horse populations are to
survive in any sustainable manner.
While numerous studies (including from the National Academy of Sciences [NAS-National Research
Council 2013]) indicate optimal annual growth rates of around 20%, these typically fail to account for
high first-year foal mortality (often around or exceeding 50%), annual adult mortality (around 5% or
more) and the fact that at least half of any herd does not reproduce at all. This has much to do with the
fact that a given herd usually has only a dominant harem sire. All the other males form bachelor bands
and cannot reproduce unless and until one overcomes, or tricks, the harem sire. Thus, even under
optimal conditions, a realistic successful recruitment rate falls more in the range of 5% to 10%. And the
latter does not factor in other losses from illegal harassment, roundups, captures, removals, poisonings,
and other types of killing that are increasingly occurring on our public lands today, per NAS. Also, we
should bear in mind that the horse species has an eleven-month gestation period, which is considerably
longer than many mammals and yields a relatively slow population growth rate. This compromises a
herd’s ability to recover from draconian reduction in population numbers.
Some management is necessary in confined areas, naturally, and many various means of limiting the
increase and expansion of a wild horse herd exist. A chief one is to allow mature social units, a.k.a.
bands, to establish themselves over the generations. The older dominant stallions and mares can and do
inhibit reproduction in younger males and females. Another concerns supporting healthy populations of
natural predators, such as Mountain Lions, Coyotes, and Bears. The basic biological rules between
predator and prey remain influential in wild horse habitats, acting as significant checks and balances –
but today these natural predators are themselves subjected to endless pressure, mostly to protect
domestic livestock.
Another common oversight by BLM, US Forest Service, state agriculture and wildlife and other entities
concerns how habitat itself acts to limit population numbers over time. This applies particularly to the
promising prospect of developing a long-term Reserve Design wild horse protection, preservation, and
management strategy by which any given wild horse herd would come to naturally self-stabilize as its
ecological niche is harmoniously filled. This relates to how all of the various habitat requirements (food,
water, shelter, minerals, migratory and reproductive necessities, etc.) act to limit wild horses according
to their intrinsic Carrying Capacity (a.k.a. K) for any particular ecosystem. Compensatory reproduction by
remaining wild horses following mass removals is well documented, but strategies, other than invasive
(roundups, drug darting or surgery), that lead to self-stabilizing herds are given much less attention,
though it would be superbly wise to do so. It has been widely observed that populations from many
diverse species reproduce more when having been dealt a severe blow to their numbers (Jenkins and
Ashley 2003).
For these and many related reasons, we have witnessed the wholesale elimination of wild horses from
their many millions of legal acres throughout the West, principally from BLM-USDI and US Forest
Service-USDA lands. Spurious arguments for either eliminating or reducing them to merely token, non-
viable populations have often included the “lumping” of wild horses (and wild burros) with livestock and
other disturbance factors such as mining and energy extraction, off-road-vehicles, and even the
pumping down of aquifers by ranches and human communities – which is enormous! So when it comes

34
time to attributing blame, it is all-too-often the large, attractive, and therefore visible wild horses who
are “conveniently” singled out; and this: in spite of the fact that it is usually they who are actually
restoring balance to the ecosystem by more greatly contributing to healthy soils, successful seeding of
more native plants, prevention of catastrophic wildfires that devastate ecosystems, etc. These very
benign contributions must not continue to be callously ignored or if brought up quickly denied or
ridiculed. It is apparent that government officials in cahoots with traditional resource exploiters have
been combining wild horse impacts with wider Environmental Disturbance Factors, then labeling these
as “wild horse related”. This is deliberately done to obfuscate and misrepresent the issue of ecosystem
declines and remedies as to their true causes and with malicious intent directed at the wild horses.
Much of this negative attitude has to do with an obstinate overemphasis upon ruminant herbivores
when what the world needs now is a more balanced ecosystem, including more post-gastric digesting
herbivores such as the wild horses. Correcting this imbalance is very much related to staving off the dire
threat to life on Earth posed by Global Warming, as ruminants are contributing in major fashion to this
through emission of greenhouse gases such as methane (Ripley et al. 2014).
I truly believe that upon the reform of this unwholesome situation – upon our nation’s “coming clean” in
this regard – depends the very future well-being of our nation – perhaps even our entire world – as all
aspects and facets of this as any situation are inextricably interrelated.
Recommendations
Achieving justice for our wild horses and burros depends on federal officials exercising the authority to
legally reduce private, usually corporate, domestic livestock grazing in the wild horses’ and wild burros’
legal areas, whether on BLM or USFS lands. Such exercise would be legally covered under 43 Code of
Federal Regulations (C.F.R.) 4710.3-2 and 43 C.F.R. 4710.5(a). In particular 43 C.F.R. 4710.5 clearly states
that the Bureau of Land Management can legally reduce or even close livestock grazing in order “to
provide habitat for wild horses and burros.”
Oregon’s present Herd Management Areas for wild horses (see map below) represent only about one-
half of the original Herd Areas as far as their size, or acreage. Indeed, Oregon BLM has eliminated wild
horses from right around one-and-a-third million acres and has then added further injustice by
allocating only small fractions of the grazing resource to the wild horses within their remaining occupied
areas. Generally it is getting harder to find any maps of the original Herd Areas probably because both
officials and benefactors in wild horse elimination or marginalization do not want the greater truth to be
known by the public. (See first map in this report of both HAs and HMAs on page 3, also see Downer
2014 a, pp. 52 & 53, Figures 4, 5, & 6.)

35
In Oregon, the unique and legally defined areas in which wild horses are allowed to live relatively
unmolested are decreasing both in number and in size. And the horses’ access to resources needed for
survival are likewise being reduced. Both national laws, and laws of basic decency, mandate that the
present wild horse populations be restored to higher, more genetically viable levels. Today, the
upgrading of Oregon’s wild horse herds is imperative to insure their long-term viability.
Higher, more genetically viable population levels are required; and the proven principles of Reserve
Design (Downer, 2010, 2014 a and 2014 b) should be employed to allow for the natural adaptation of
wild horses, both individually and collectively, within their inhabited ecosystems.
My recommendations include an enlightened phasing in of progressive changes whereby the major
environmental disturbance factors are reduced so that a more truly natural balance among all
appropriate species can be achieved within a positively regarded wild-horse-containing ecosystem. Too
often wild horses are maligned by established interests accustomed to monopolizing (or nearly so) the
natural resources of any given area. These profit-seeking interests will filter and even twist what
Source: http://themindfulhorsewoman.weebly.com/kiger_mustangs_oregon.html

36
purports to be objective field observations so as to discredit their target: the wild horses. Their
underlying motivation is not to realize the Greater Truth and Justice concerning these animals and the
life community, but rather to perpetuate or even expand their unquestioned exploitation of the public
lands for their own private benefit.
Various means exist for limiting the increase and expansion of a herd. One of the chief is to allow the
mature social units, or wild horse bands, to establish themselves over the generations. The older
dominant stallions and mares can and do inhibit reproduction in younger males and females. Another
means concerns natural predators. These act as significant checks and balances – but are by no means
the sole limiting factors for wild horses, wild burros, or other prey species. It is possible to design a
reserve with natural boundaries or barriers to constrain herd activities or to opt for artificial barriers,
bearing in mind that the reserve itself must contain sufficient appropriate habitat to provide all the
needs of a viably sized, vigorous and dynamic wild horse population. The International Union for
Conservation of Nature (IUCN) indicates this should be around 2,500 individuals (Duncan 1992), though
BLM policies are grounded on the supposition numbers should not fall below 50 actively breeding adults
in a given population, which would entail a total population of 200 or more. A well-planned reserve
would ensure appropriate niche space and forage abundance and availability to govern a balanced herd
size, but management must allow natural processes to operate over significant periods of time for
ecological harmonization to take place.
It has been proven that the mass removals of wild horses, e.g. BLM helicopter roundups removing half
or even 90% or more of the horses, result in the above mentioned “compensatory reproduction” among
those horses who remain (Jenkins & Ashley 2003). These traumatized horses then go into a desperate
survival mode and reproduce at a higher rate because they feel threatened. This sort of behavior is
observed among many species after sustaining severe reduction in numbers and disorganization of their
societies. Drastic herd reduction results in a tragic loss of both social and resource interaction memories.
And this, in turn, results in larger, more chaotic, and less harmonious populations. Perhaps, the latter is
the devious design of the wild horses’ human enemies.
Although the following suggestion seems like pandering to some of the wild horses’ traditional enemies,
I present the following as food for thought. Another reasoned recommendation would create financial
incentives for livestock grazing permit holders to voluntarily include wild horses upon the lands they
graze and to decrease equivalent numbers of livestock. This idea has been proposed by rancher and wild
horse advocate Lynn McCormick of Colorado. As noted earlier in this report, conflicts between public
and private interests are increasing as resources dwindle and human populations (and demand for
recreation) increase. Certain solid studies indicate that ranching in much of the arid to semi-arid West
(and elsewhere) is generally unprofitable and that net profit is typically only between $50 and $100
dollars per animal per year (Torell et al. 2012, Torell & Kincaid 1996, Taylor et al. 2004). This situation
adds pressure to increase livestock numbers and/or weight/size, demonize perceived competitors (wild
horses/burros, wildlife), and overlook trespass grazing (see revealing report: United States Government
Accountability Office, 2016).
Ms. McCormick suggests paying willing grazing permit holders some agreed rate, say one U.S. dollar per
day per wild horse on a year-round basis in order to manage some reasonable number of wild horses
within their grazing permit area. This would represent a substantial savings to taxpayers over current
off-range holding costs. In exchange, permit holders would decrease an equivalent number of domestic

37
livestock from the same grazing permit area. This system could be based on standard Animal Unit
Months (AUMs) used in calculating sustainable grazing pressure, and each agreement would be
independently tailored to suit each rancher’s situation and one option would be to have this program
entirely voluntary. This would entail no or only minimal extra work for the rancher, and allow permit
holders to realize higher profits than they otherwise would from their public lands grazing permits. It
would also save U.S. taxpayers significant amounts of money while resulting in the better monitoring
and managing of shared habitat. It would keep wild horses where they belong on the range as wild
animals. Though this alternative would rankle with those with a keener sense of justice, it is one that
might just work in the immediate future and help many wild horses as well as wild burros regain their
rightful place in the wild.
Today, an inordinate percentage of the forage and water that is so important to entire ecosystems is
diverted instead to support a relative few ecologically incongruous livestock operations, whose owners
often describe people on welfare as “unjustly enjoying entitlements,” while overlooking the immense
entitlements and subsidies needed to continue propping up their ranching way of life at public expense.
Much time and taxpayer expense is also diverted to accommodate and then mitigate the ill-effects of
these shared and often competing uses of our public lands.
More hopefully, most of the wild horse and wild burro herds today, including those in Oregon, have
some type of citizen fan club composed of passionately protective people. Many are very proactive in
collaborating with BLM and USFS officials to perform volunteer work and provide people trained for
citizen science-related monitoring, record keeping and documentation, etc. Such collaborations can ease
tension while taking pressure off decreasing federal budgets and encouraging better public relations on
our public lands, and should be encouraged and expanded.
Reserve Design Proposal
I have personally visited five of Oregon’s wild horse herds and their HMAs and have more intensively
investigated three of these, visiting each on several occasions and in different seasons and conducting
ecological evaluations therein. I have also perused the professional literature concerning the
requirements for a successful Reserve Design and its on-the-ground implementation. I propose initially
developing and implementing a specially tailored Reserve Design for each of the following wild horse
herds and their respective habitats:
South Steens, Kiger Mustang, and Riddle Mountain HMAs
Three Fingers HMA
Natural barriers that limit all four of these herds are present to varying extents. Such natural barriers
would be effective means for achieving the stabilization of each herd’s population numbers. This work is
in progress and will require more detailed gathering of in-field and ecologically oriented equid-related
conservation information, but at this writing I have the following suggestions to get these Reserve
Designs going. This benign and caring approach is urgently needed today for the sake of these wonderful
wild horses and their future, which may be justifiably equated with the very future of the horse species
on Earth since it is ‘in the Wild, that the true Vigor of the Species is Preserved’ (Downer 2014a).

38
South Steens, Kiger Mustang, and Riddle Mountain HMAs
For both the South Steens and Kiger Mustang herds, the high altitude Steens Mountain range (with its
abrupt escarpment along its eastern edge) greatly limits these herds on the eastern side of their domain.
On the other northwestern and southern sides, ranches with their fences and roads further contain the
herds, except for the southern side of the Kiger Mustang HMA and the northern side of the South Steens
HMA. Concerning the latter situation, I recommend that the Kiger Mustang and the South Steens HMAs
be joined by means of Cooperative Agreements for wide corridors (at least) that could be established
under Sections 4 and 6 of the Wild Free-Roaming Horses and Burros Act.
In a similar vein, at the north end of the long Steens Mountain range, the Kiger Mustang HMA could be
joined with the Riddle Mountain HMA. BLM already exchanges wild horses between these two HMAs in
order to bolster genetic diversity. Carefully designed highway overpasses could be constructed in order
to link these HMAs and the deconstruction of barbed wire fences would serve to unite these HMAs. And
these same two means, particularly the deconstruction of fences, could join the Kiger Mustang and
South Steens HMAs.
The resultant joining up of these three HMAs would produce an interbreeding mustang population and
assure their long-term genetic viability as well as their more resilient and successful adaptation to this
region’s special life community, or ecosystem (Mansfield 1999, Jackman and Long 1964, Jackson et al.
1975). This unification would counter the damaging effects of “population fragmentation,” which has
and continues to cause the extinction of many uniquely adapted populations, races, subspecies, and
entire species of plants and animals throughout the world today (Noss et al. 1997, Duncan 1992,
Downer 2014 a & b, Kapoor 2017). It would also allow more options for natural migration and dispersal
through various seasons and resources, minimizing impacts in any single smaller location.
I believe this herd and HMA consolidation and expansion would ensure the long-term survival for these
unique wild horses. It would allow them to specifically adapt to this unique and species-rich part of our
world that is in many ways centered around the majestic Steens Mountains. Healthier wild horse herds
would contribute positively to this regional ecosystem, helping greatly to restore its soils, disperse a
greater variety of its native plant seeds, and bolster its food chains/webs. Also, it would enhance the
existing “Steens Mountain Cooperative Management and Protection Area” working agreement
operating here (Steens Mountain Advisory Committee Meeting 2012; also BLM Oregon webpage).
Paisley Desert and Big Summit Wild Horse HMAs
Reserve Design proposals for these two HMAs will require additional in-field and office investigation, but
these should be formulated in order to restore these unique herds as soon as possible.
Three Fingers HMA
The Owyhee Lake/Reservoir already serves to limit this herd on its western side. On the southwestern

39
side of this HMA the steep and rugged Leslie Gulch area forms a barrier to wild horses’ movement to the
south, and rancher allotment fences along the rest of the southern boundary could be fortified.
However, the many grazing allotment fences within this HMA are overly restricting the movements of
these wild horses, contrary to the WFHBA’s “free-roaming” mandate. Many of these fences could be
deconstructed through cooperative agreements with the ranchers. However, since these grazing
allotment separation fences allow the control of livestock grazing and so prevent overgrazing, it would
be better to simply negotiate for certain areas to be freed up entirely of livestock grazing so that the
wild horses could have greater areas in which to move, forage, interact, and live freely and naturally and
at viable levels, as the WFHBA intends. Solutions in favor of restoring the wild horses to fairer numbers
and habitats could involve either paying ranchers to manage some number of wild horses, reducing or
buying out livestock grazing permits, or other combinations of options designed to achieve equity for
wild horses in their shrinking legal areas.It is highly recommended that the previous reduction of the
original Herd Area be restored, including areas along the Succor Creek on the eastern side to restore to
wild horses their proper access to the significant forage and essential drinking water that was and
remains the original intention of the WFHBA (see www.blm.gov/site-page/programs-wild-horse, select
Three Fingers HMA).
Only a tiny remnant of wild horses remain in the HMA. I counted 61 in my overflight in June 2017 which
was professionally estimated to represent 66 wild horses in my report to Friends of Animals. This
remnant should be supplemented by means of restoring wild horses that are presently being held in
captivity in short- and long-term holding facilities, particularly in Burns, Oregon. From the records
describing each horse and its herd and their history, genetic composition and habitat type, an educated
judgement could be made as to which of the many captured wild horses would be most suitable for
restoring the Three Fingers herd. Also, as concerns the many wild horses that have already been
gathered and who languish in holding areas, the geldings in particular could be returned without fear of
affecting population growth, and could live out their natural lives in much healthier circumstances and
at far less public expense.
Legal Facilitators of Reserve Design
The following legal statutes should be employed to implement Reserve Design:
Codes of Federal Regulations 4710.5 and 4710.6 specifically provide for the curtailment or cancellation
of livestock grazing privileges on public lands in order to ensure thriving, healthy herds of wild horses
and wild burros in their legal areas established by the WFHBA (Herd Areas on BLM lands and Territories
on US Forest Service lands).
Section 6 of the WFHBA authorizes cooperative agreements with landowners and state and local
governments to better accomplish the goals of the Act. This allows for providing complete and
unimpeded habitats for long-term viable wild horse and wild burro populations.
Section 4 of the WFHBA allows public officials to remove wild horses and wild burros that stray onto
private property, but also allows private landowners to maintain wild, free-roaming horses or burros on
their private land or on lands leased from the government, provided that they do so in a manner that
protects them from harassment and [provided] that the animals were not willfully removed or enticed
from the public lands. The latter must keep the federal government informed of the number of wild
horses or burros so maintained. This is a longstanding and still outstanding opportunity for the public to

40
help in preserving and protecting the wild horse and wild burro herds at healthy population levels and in
adequately sized and suitable, complete habitats. It is a means of complementing the federal Herd Areas
(BLM) and Territories (U.S. Forest Service) (see Downer2014 a, pp. xi-xiv).
Conclusion Results of my investigations are quite disturbing, especially as they involve our government’s lack of land
and resource allocations for wild horses. Lacking too is a genuine defense of each herd’s habitat against
traditional enemies, especially cattle and sheep ranchers. Both BLM’s and USFS’s habitat designations
and reductions have failed to defend the wild horses’ basic and Congressionally mandated legal rights,
as witness the many incongruous and inadequate Appropriate Management Levels (AMLs) that have
been assigned. These paid wild horse “managers” are putting those valued “national heritage” animals
that remain at serious risk for future survival.
A Parting Prayer
Without an inspired vision for the future, a nation, a people, a species – an interrelated life community
would surely perish! But I see this vision arising in many today, who yearn for a new and better way of
life that respects all the diverse forms of conscious being that interrelate and make life possible. One
very encouraging example comes from the eminent biologist Edward O. Wilson, who urges humans to
save a full half of the Earth by letting it resume its natural and balanced state (Wilson 2016).
Through their genuine appreciation of and caring for the wild horses in the wild, through their hard
perseverance and diligence, those who came before left us the unanimously passed Wild Free-Roaming
Horses and Burros Act of 1971 and its vision for a shared Earth and for the shared right to live freely and
naturally of our ancient allies, the noble horses and burros. Much has changed and much still will, but
the inspiration and fortitude of our forefathers and foremothers also remains with us. We can choose to
live together upon a restored and adapting Earth, which all naturally living species must together
resuscitate, or we can merely fall back upon the blind repression of the Rest of Life that we have for far
too long ignobly perpetrated! This repression, born of ignorance, can and must be replaced with an
acceptance of our stewardship charge and awareness of how all this Great Living Community on Earth
truly works and our – and the horses’ – rightful place in it … and it is my most sincere belief that the
Living Earth shall still come to realize a greater blessing and rise to a greater height than ever before in
this regard. Amen.

41
Bibliography
Animal Welfare Institute. 2012. Overview of the Management of Wild Horses and Burros: A report
presented to the National Academy of Science Committee to Review the Management of Wild Horses
and Burros. Link: https://awionline.org/sites/default/files/uploads/documents/AWI-WL-
FinalWildHorseandBurroReportWithStateMaps10-26-12.pdf Accessed 2-21-2018.
Associated Press (AP). 1994 (March 10). Kiger Mustangs Rare Among Horses. The Oregonian. Portland.
Bekoff, Marc. 2013. Ignoring Nature No More: The Case for Compassionate Conservation. University of
Chicago Press. 450 pages.
Benchmark Maps. 2006. Oregon Road & Recreation Atlas. Third Edition. Santa Barbara, California.
Berger, Joel. 1986. Wild Horses of the Great Basin: Social Competition and Population Size. University of
Chicago Press.
Bureau of Land Management-USDI. 2018. Wild Horse and Burro Program. www.blm.gov/programs/wild-
horse-and-burro/herd-management or www.blm.gov/site-page/programs-wild-horse ... (Select Oregon
& each HMA treated in this report.)
Bureau of Land Management-USDI. 2004 (August 6). Andrews Management Unit / Steens Mountain
Cooperative Management and Protection Area, Harney County, Oregon. IN: Proposed Resource
Management Plan and Final Environmental Impact Statement. Appendix A: Steens Mountain Wilderness
& Wild & Scenic Management Plan.
Burns District Office, BLM-USDI. 1990. The Kiger Mustang. Folding handout describing Kiger mustangs’
history, natural characteristics and lifestyle, Spanish colonial heritage, rarity, and value to humans. Fine
drawings depicting them.
Burns District Office, BLM-USDI. 2009. National Back Country Byway Diamond Loop. Kiger Mustang
HMA.
https://www.blm.gov/or/resources/recreation/files/brochures/DiamondLoopByway_October09.pdf
Carter, W.H. 1923 (Nov.) The Story of the Horse. National Geographic. Vol XLIV, No. 5. Washington, D.C.
Clutton-Brock, Julie. 1992. Horse Power: A History of the Horse and the Donkey in Human Societies.
Harvard University Press, Cambridge, Massachusetts. 192 pages.
Cornell Law School. 43 Code of Federal Regulations CFR 4710.5: Closure to livestock grazing.
https://www.law.cornell.edu/cfr/text/43/4710.5
D’Azevedo, Warren L. 1986. Great Basin. Vol. 11. In: W. C. Sturtevant, Ed., Handbook of North American
Indians. Smithsonian Institution, Washington, D.C.
Denhardt, Robert M. 1975. The Horse of the Americas. New Edition. Univ. of Oklahoma Press, Norman.
Devlin, Marybeth. 2018. Oregon – Interim Report #1. Based on her public comments on Oct. 12, 2017 at
Modoc-Washoe Experimental Stewardship Program meeting, Cedarville, California.
Downer, Craig C. 1977. Wild Horses: Living Symbols of Freedom. Western Printers & Publ., Sparks, NV.

42
Downer, Craig C. 2010. Proposal for Wild Horse/Burro Reserve Design as a Solution to Present Crisis.
Natural Horse 2010. Vol. 12, Issue 5, pages 26 ff. (presented at BLM Workshop on Wild Horses and
Burros in Denver, Colorado, in June, 2010.)
Downer, Craig C. 2014 a. The Wild Horse Conspiracy. www.amazon.com/dp/1461068983. 313 pages.
Downer, Craig C. 2014 b. The horse and Burro as Positively Contributing Returned Natives in North
America. American Journal of Life Sciences, 2014; 2(1): 5-23.
Downer, Craig C. 2016 a. Report on Pryor Mountain Wild Horse Refuge. Contact author for copy.
Submitted to Billings District Office of BLM, Montana.
Downer, Craig C. 2016 b (April 19). Proposed Removal of Pinyons, Junipers Damaging Ecosystem. Reno
Gazette Journal, Nevada.
Downer, Craig C. 2016 c. Ecological Evaluation: Three Fingers Wild Horse HMA. For Friends of Animals.
Downer, Craig C. 2017. Report on Three Fingers Wild Horse Herd Management Area Based on On-
Ground and Aerial Inspection, May 31 to June 5, 2017. For Friends of Animals.
Duncan, P. 1992. Zebras, Asses, and Horses: An Action Plan for the Conservation of Wild Equids. IUCN
Species Survival Commission, Equid Specialist Group. Gland Switzerland.
Ganskopp, David Conrad. 1984. Habitat Use and Spatial Interactions of Cattle, Wild Horses, Mule Deer,
and California Bighorn Sheep in the Owyhee Breaks of Southeast Oregon. (Listed in Univ. Nevada-Reno
Library list of publications.)
Gregg, K, LeBlanc, L., & Johnston, J. 2014. Wild Horse Population Growth.
http://rtfitchauthor.com/2014/04/28/report-wild-horse-population-growth
Gregory, Gordon. 1999 (June 20). A Horse of a Very Special Color: A Once-Forgotten Herd of Wild
Mustangs is Spurring Attention from Experts and Filmmakers. The Oregonian (Sunrise edition). Page C
04. www.springwaterstation.com/news/news.html
Hansen, R.M., Clark, R.C., & Lawhorn, W. 1977 (March). Foods of Wild Horses, Deer, and Cattle in the
Douglas Mountain Area, Colorado. Journal of Range Management 30(2): 116 ff.
Hollon, Jim. 1997 (August 20). Contest Features Kiger Mustangs. The Oregonian (Sunrise ed.). Pg. C 02.
Howe, H.F. & Westley, L.C. 1988. Ecological Relationships of Plants and Animals. Oxford University Press.
Hyde, Dayton O. 1973. The Last Free Man: The True Story Behind the Massacre of Shoshone Mike and
His Band of Indians in 1911. The Dial Press, New York, N.Y. 264 pages.
Jackman, E.R. & Long, R.A. 1964. The Oregon Desert. The Caxton Printers, Ltd. 407 pages.
Jackson, Donald Dale & Editors of Time-Life Books. 1975. Sagebrush Country. IN: The American
Wilderness series. 184 pages.
Jackson, Jaime. 1992. The Natural Horse: Lessons from the Wild for Domestic Horse Care. Northland
Publications. First Edition. 171 pages.

43
Jenkins, S.H. and M.C. Ashley, 2003. Wild Horse, Equus caballus and Allies. Ch. 53 In: Wild Mammals of
North America: Biology, Management and Conservation. 2nd Edition. Eds. G.A. Feldhamer, D.C.
Thompson, & J.A. Chapman. The John Hopkins University Press, Baltimore and London.
Kapoor, Maya L. 2017 (Nov. 8). What a new report on climate portends for the West. High Country
News. http://www.hcn.org/articles/climate-change-why ... Discussing “Focusing on the science of
climate change, the report” linked at https://science2017.globalchange.gov/ and involving the third
National Climate Assessment linked at http://nca2014.globalchange.gov/
Knell, Robert J & Martinez-Ruiz, Carlos. 2017. Selective harvest focused on sexual signal traits can lead to
extinction under directional environmental change. Proc. of the Royal Society Britain. Vol 284, N. 1868.
MacPhee, Ross, Ph.D. 2013. The Wild Horse is Native to North America.
http://www.thecloudfoundation.org/reading-room-faq-s-article/wh-ret.
Mansfield, Donald H. 1999. Flora of Steens Mountain. Oregon State University Press, Corvallis. 410 pp.
National Research Council. 2013 (Sept.) Using Science to Improve the BLM Wild Horse and Burro
Program: A Way Forward. National Academy of Sciences, US Government Printing Office. Wash., D.C.
Noss, R.F., O’Connell, M.A., Murphy, D.D. 1997. The Science of Conservation Planning: Habitat
Conservation under the Endangered Species Act. Island Press, Washington, D.C. Copyright WWF.
Notzke, Claudia. 2013. An Exploration into Political Ecology and Nonhuman Agency: The Case of the Wild
Horse in Western Canada. The Canadian Geographer / Le Geographe Canadien. Vol. 57, Issue 4.
Oelke, Hardy. 1997. Born Survivors on the Eve of Extinction: Can Iberia’s Wild Horse Survive among
America’s Mustangs. Wipperfurth, Germany.
Peck, Sheila. 1998. Chapter 5: Reserve Design. IN: Planning for Biodiversity: Issues and Examples. Island
Press, Washington, D.C. Pages 89-114.
Ripple, W.J.; Smith, P.; Haberl, H.; Montzka, S.A.; McAlpine, C.; Boucher, D.H. 2014 Ruminants, climate
change and climate policy. Nature Climate Change. Vol. 4. Pages 2 – 5.
Simpson, William E. 2017 (July 31). Can the Wild Horse Fire Brigade really work?
https://www.horsetalk.co.nz/2017/07/31/wild-horse-fire-brigade-work/ Accessed 3/3/18.
Steens Mountain Advisory Council Meeting. 2012 (November). Wild Horse and Wild Horse Management;
land exchange and acquisition, the Steens Mountain Comprehensive Recreation Plan.
Tate, Robert L., III. 1987. Soil Organic Matter, Biological and Ecological Effects. John Wiley & Sons, N.Y.
Terry, Lynne. 2011 (April 1). Rescued Kiger mustangs for TLC. The Oregonian. Portland.
Taylor, D.T; R.H. Coupal; T. Foulke & J.G. Thompson. 2004 (Oct.). The Economic Importance of Livestock
Grazing on BLM Land in Fremont County Wyoming. Univ. of Wyoming, Dept. of Agri. & Appl. Economics.
Torell, L.A. & M.E. Kincaid. 1996. Public Land policy and the market value of New Mexico ranches, 1979-
94. Rangeland Ecology & Management/Journal of Range Management Archives. Univ. of Arizona.
https://journals.uair.arizona.edu/index.php/jrm/articles/view/9121

44
Torell, L.A., B. Dixon & D. McCullom. 2012 (Oct.). The Market-Value of Ranches and Grazing Permits in
New Mexico, 1996 to 2010. New Mexico State Univ., Agric. Exp. Sta., Coll. Of Agric.
http://aces.nmsu.edu/pubs/research/ecnomics/RR779.pdf
United States Forest Service-USDA
https://www.fs.fed.us/ … (Select Washington-Oregon region and wild horse & burro program, also
Ochoco National Forest.)
United States Geological Survey, et al. 2005. Interpreting Indicators of Rangeland Health. Technical
Reference # 1734-6, Version 4.
United States Government Accountability Office (GAO). 2016 (July). Unauthorized Grazing: Actions
Needed to Improve Tracking and Deterrence Efforts. Report to the Committee on Natural Resources,
House of Representatives. GAO-16-559. 64 pages.
https://www.peer.org/assets/docs/blm/7_18_17_GAO_grazing%20Trespass-Report.pdf
Ward, David. 2009. The Biology of Deserts. Oxford University Press, Oxford, England.
Waring, George H. 1983. Horse Behavior: The Behavioral Traits and Adaptations of Domestic and Wild
Horses, Including Ponies. Noyes Publications, Park Ridge, New Jersey. 292 pages.
Wild Horse Freedom Federation. 2017. White Paper. http://wildhorsefreedomfederation.org/up-
content/uploads/2017/07/White-Paper.pdf
Wilson, Edward O. 2016. Half-Earth: Our Planet’s Fight for Life. Liveright / Norton, New York.
Yee, Daniel. 1999 (Nov. 1). Rancher Raises Kiger Mustangs. The Columbian. Oregon.
APPENDIX A:
PARTIAL LIST OF PLANT SPECIES
Observed in South Steens and Kiger Mustang HMAs by Craig C. Downer during site visits in June & September, 2009, and in
October, 2017.
Osmorhiza occidentalis; Lomatium canbyi, Apocynum cannabinum, Balsamorhiza serrata, Mertensia cillata; Antennaria rosea;
Cirsium canovirens; Crepis occidentalis; Dimeresia Howellii; Eatonella nivea; Layra glandulosa; Dowingia bicornuta; Malacothrix
glabrata; Senecio streptomthifolius; Atriplex confertifolia; Dugaldia hoopesii, Heliotropium curassavicum; Draba Cusickii;
Cerastium arvense; Silene oregana; Agoseris aurantiaca; Astragalus filipes; Sambucus mexicana; Astragalus Whitneyi; Swertia
perennis; Phacelia sericea; Ribes aureum; Sisyrinchium Douglasii; Salvia dorii; Leucocrinum montanum; Phacelia gymnoclada;
Paeonia brownii; Calochortus bruneauis; Camissonia Boothii; Triteleia hyacinthina; Aquilegia formosa; Iliamna rivularis;
Oenothera deltoides; Piperia unalascensis; Potamogeton diversifolius; Clarkia pulchella; Orobanche fasciculata; Collomia
grandiflora; Parnassia cirrata; Claytonia lanceolata; Allium lemmonii; Navarretia intertexta; Claytonia megarhiza; Ranunculus
eschschultzii; Lewisia rediviva; Lewisia pygmaea; Catiilleja applegatei; Sibbaldia procumbers; Lithophragma tenellum; Castilleja
pilosa var. steenensis; Mimulus Lewisii; Pedicularis attolens; Sparganium emersum; Penstemon Davidsonii var. praeteritus;
Oxyria digyna; Monardella ordoratissima.
Publications Used for Identifications
Mansfield, Donald H. 1999. Flora of Steens Mountain. Oregon State University Press, Corvallis. Primary Identification source.
Taylor, Ronald J. 1992. Sagebrush Country: A Wildflower Sanctuary. Mountain Press Publishing Company. Missoula, Montana.
The Audubon Society. 1979. The Audubon Society Field Guide to North American Wildflowers, Western Region. Alfred A. Knopf
Inc. New York, NY.
Yocom, Charles; Brown, Vinson; and Starbuck, Aldine. 1958. Wildlife of the Intermountain West. Naturegraph Books, Happy
Camp, California.

45
APPENDIX B: ANALYSIS OF SOUTH STEENS HMA HISTORY OF MANAGEMENT AND MANAGEMENT PLAN BY BLM Date: February 26, 2018 To: Craig Downer Fr: Marybeth Devlin Re: Oregon — South Steens in Oregon BLM’s Burns District Here is the analysis of how BLM manages the South Steens Wild-Horse (WH) herd versus how the agency administers livestock-grazing within the mustangs' dedicated habitat. Population-growth impossibilities are also addressed. 1. Size of the South Steens HMA Per the latest "Herd Area and Herd Management Area Statistics" report, dated March 1, 2017, the size of the South Steens horse-herd management area is: 134,459 total acres ≃ 210 square miles
https://www.blm.gov/programs/wild-horse-and-burro/about-the-program/program-data 2. Arbitrary — and Austere — Management Level (AML) Here is the AML's high-bound — the number of wild horses above which BLM declares the South Steens herd to be "overpopulated."
High-AML: 304 Acres / WH: 442 ≃ 2/3 of a square mile ( 69% of a mile2 ) / WH
Here is the AML's low-bound, down-to-which BLM manages the herd. Low-AML: 159 Acres / WH: 846 ≃ 11/3 square miles ( 132% of a mile2 ) / WH 3. 2017 Alleged Population-Estimate for the South Steens Herd Here is the herd-size as of March 1, 2017, along with the stocking-density.
Wild Horses 599

46
Acres / WH: 225 ≃ 1/3 of a square mile ( 35% of a mile2 ) / WH 4. Animal Unit Months (AUMs) — for Wild Horses The numbers of monthly grazing slots — AUMs — that correspond to the respective low-and-high bounds of the South Steens herd's AML are:
At low-AML 159 = 1,908 AUMs At high-AML 304 = 3,648 AUMs
5. Animal Unit Months (AUMs) — for Livestock There are three (3) livestock-grazing allotments that overlap the South Steens horses' habitat. BLM provided information regarding these allotments and the respective numbers of "active preference" AUMs for livestock on screen-page 59 of the 2015 Update to the 2013 Population Management Plan Environmental Assessment. Allotment Name Active 10-year Season of Use % inside HMA Preference Average Number of months AUMs AUMs Frazier Field 24% 1,906 1,540 04/01 to 09/30 (6) Lavoy Tables 16% 1,653 1,514 04/01 to 10/31 (7) South Steens 100% 9,577 4,724 04/01 to 10/31 (7) ---------------------------------------------------------------------------------------------------- Roll-up 140% 13,136 7,778 https://eplanning.blm.gov/epl-front-office/eplanning/legacyProjectSite.do?methodName=renderLegacyProjectSite&projectId=67816 It is curious that BLM chose to provide 10-year average AUM-use by livestock. Then-current usage was thus obscured, whereas BLM goes to great lengths to report bloated increases in the wild-horse population — current, historical, and projected. BLM's seeming intent was, and is, to protect permittee-interests by downplaying the enormous damage inflicted on the rangeland by livestock. Further, BLM allows permittees to self-certify (on Form 4130-005 Actual Grazing Use Report) how many livestock they ran and for how long. BLM takes their word for it and then bills them accordingly. The ranchers pay their fees after-the-fact ... eventually ... maybe ... or maybe not. See Bundy, Cliven. So, the report of actual use is under the control of and thus, vulnerable to manipulation by those who stand to gain by under-reporting their use of AUMs. Form 4130-005 can be accessed at the link below under the tab titled, strangely enough, "Rangeland Resources, Wild Horse and Burros." Of the eight forms provided there, the only one relating to mustangs is the adoption application. The other seven have to do with livestock grazing.
https://www.blm.gov/services/electronic-forms

47
6. Percentage of AUMs Awarded to Livestock v. to Wild Horses Within their dedicated habitat, we would expect wild horses to receive the majority of the grazing slots — the AUMs — in accordance with the Act's stipulation that they benefit from principal use of their dedicated habitat's resources. Instead, we discover that ... Of the combined maximum-total of 16,784 AUMs available to livestock and wild horses in the South Steens horse-habitat ...
13,136 — AUMs — 78% — have been allotted to livestock 3,648 — AUMs — 22% — have been allotted to wild horses
---------------------------------------------------------------------------------------- 16,784 — AUMs — 100% — Roll-up However, BLM's scheme is to manage the South Steens wild horses down to low-AML. So, the actual apportionment disadvantages the wild horses even more. Of the targeted management-total of 15,044 AUMs ...
13,136 — AUMs — 87% — have been allotted to livestock 1,908 — AUMs — 13% — have been allotted to wild horses
---------------------------------------------------------------------------------------- 15,044 — AUMs — 100% — Roll-up 7. To BLM, Management Means Cull, Control, and Contracept Screen-page 7 quotes an excerpt from the Resource Management Plan and other documents wherein it reportedly also appears:
“Wild horse numbers are managed through gathering, removal, and other approved methods of population control...." (Quotation marks in original.)
The definition contained in that one sentence reveals why the program fails: Management = cull, control, contracept. There is no mention of Reserve Design or any program for conserving the herd, just for culling or otherwise controlling it such as by contracepting it. This is not an enlightened approach but a self-interested one, as BLM inflates herd-numbers in order to justify costly culls, conducted by contractors. The more expensive the better, because the higher the costs, the higher the administrative fee BLM will reap. Thus, BLM is incentivized to find an overpopulation to prompt a cull to increase revenue, thereby protecting positions and paychecks. Culls are the means whereby BLM gets more money to "manage" the program. 8. Management by Running a Breeding Program Ironically, while BLM practices a benighted management-model via culls, it also becomes inappropriately hands-on where it should be hands-off — deciding which horses to remove and which horses will remain free. From screen-page 8:
“A diverse age structure and sex ratios ranging from 40 to 50 percent female and 50 to 60 percent male will be maintained. Wild horses

48
returned to the HMA after a gather will possess representative characteristics of herd conformation, size, color, and unique markings ....” (Quotation marks in original.)
On BLM's specific Webpage for the South Steens herd, those "representative characteristics" are identified:
The HMA is managed for pinto colored horses with above average conformation.
https://www.blm.gov/programs/wild-horse-and-burro/herd-management/herd-management-areas/oregon-washington/southsteens
Such anthropocentric "management" is antithetical to the spirit and letter of the Act, which stipulates "minimal feasible management" of wild horses. BLM interprets the Act perversely to interfere with and frustrate Natural Selection. Decreeing which horses shall remain free based on color-patterns reflects poor management practices. Injecting them with a sterilant-pesticide further works against what is supposed to be a self-sustaining herd by inadvertently selecting for low immune-function, among many other adverse effects. Gelding some of the stallions (one of the alternatives considered in the EA and, evidently, practiced before) has been shown not to reduce the birth rate; however, it does reduce male-line genetic diversity, which is in steep decline already. 9. BLM Cites NAS Herd-Growth Rate, Despite Data Withheld from NAS Screen-page 13 of the EA advises:
An exact annual population growth rate is not available for this herd so a 20 percent population growth rate is used based on the National Academy of Sciences (NAS) (2013) explanation that growth rates approaching 20 percent or even higher are realized in many horse populations (p. 55). This annual population growth rate includes both survival and fecundity rates (NAS 2013, p. 55).
However, taken in context of other passages in the NAS report, it's a wonder that the Committee even took a stab at estimating the population-growth rate. On pages 46-47 of the NAS report, we learn that BLM ...
Failed to meet data-requests from the Committee, Provided incomplete records in many instances, and Lacked data supporting the national population statistics.
Indeed, BLM had allegedly disposed of crucial portions of the records, whose absence prevented the researchers from tracing the data-discrepancies to their source. Evidencing that the problem was of long-standing, the NAS noted that the National Research Council Committee (NRC) had disclosed many of the same issues in its review of the program 30 years earlier. To understand the magnitude of the problem, it is advantageous to read just what the NAS report said about it on pages 46-47:

49
https://www.nap.edu/read/13511/chapter/4#46
10. Why 20% Cannot Be the Correct Herd-Growth Rate According to BLM, there were 25,300 wild horses and burros on the range in 1971. However, the real number is widely believed to have been higher. Nevertheless, here is how BLM's figure — 25,300 — would have increased over the 47 years since 1971 per a herd-growth rate of 20%, compounded, with the number rounded.
133,000,000 at 20% BLM reports that it removed nearly 258,000 mustangs over that 47-year period — 240,974 during the years from 1971 to 2012, and 17,016 from 2013 to date. If so, then at 20%, there would still be well over 132,000,000. Because the mustangs number in the thousands and not in the millions, BLM's constant refrain — that wild-horse herds multiply by 20% annually, per its own falsified data provided to the NAS — is, therefore, a greatly-exaggerated, non-supportable false statement. 11. The Herd-Growth Rate Is No More Than 5% Gregg, LeBlanc, and Johnston (2014) conducted a definitive study on wild horse demographics, using BLM's own data. They reviewed the records of 4 representative herds with a combined population of 5,859 wild horses. Their analysis revealed the average birth rate to be just under 20%. However, their analysis also disclosed that 50% of foals perish before their first birthday. Hence, the birth rate is just a temporary blip in the data, and the normative population-gain from surviving foals is 10%. However, wild horses other-than-foals also die. Because the subject study did not look at that aspect, we have to turn elsewhere. BLM reports a 5% annual mortality rate for horses taken off the range and maintained in short-term holding. We will use that rate as a conservative proxy for the annual mortality rate for adult horses on the range. Starting with the 10% net increase from surviving foals, we then subtract the 5% loss of horses other-than-foals, and that yields an average herd-growth rate of 5%. 12. Herd-growth Claims Questioned BLM appears to be conflating the average birth rate (20%) with the herd-growth rate. BLM also appears to be inflating the population growth. Both types of errors have infected the data for the subject herd.
SOUTH STEENS Year Reported Percent Compared to Max-Norm Comment Population Change as of Mar 1

50
2009 329 November 20. 584 pre-gather 482 captured 369 removed 59 contracepted 135 post-gather 1 2010 159 Down to low-AML, but 24 horses more 2011 191 20% 4 times the norm 2012 191 0% 0 growth per PZP? June census: 383 See analysis below. 2013 229 20% 4 times the norm 2014 460 101% 20 times the norm 2015 662 44% 9 times the norm 2016 632 − 5% Slight decline. 794 pre-gather September 1. 39 removed 2 2017 599 755 projected 1 Discrepancies found before and after the 2009 cull BLM estimated a pre-gather population of 584, reflecting a birth rate of 78%, nearly 4 times the norm or, alternatively, if a herd-growth rate, 153/5 times the norm. Further, there would have to have been zero mortality across all foals and all adult horses or, alternatively, an even higher birth rate to offset the expected normative death rates. BLM reported it had removed 369 horses. If so, then 584 − 369 = 215. However, BLM reported a post-gather population of only 135. What happened to the other 80 horses? Because the cull took place in late November 2009, we would have expected the March 2010 population to be identical to the post-gather figure of 135. Yet, BLM reported 159 horses, which was 24 horses more. 2 Discrepancies found before and after the 2016 cull

51
BLM reported the identical population for the South Steens herd for both 2011 and 2012: 191. If BLM's 20% growth rate were applied to the expected increase in population from 2011 to 2012, then 191 x 120% = 229. That would normally have been BLM's estimated population as of March 2012, but BLM reported it as the March 2013 population. We could assume this was the first mistake — that 229 should have been the March 2012 estimate. But maybe not. Remember: BLM had injected 59 mares with PZP in 2009. The full effects would have manifested in 2011, reflected by reduced growth — maybe even no net growth — by 2012. But then, on page 13 of the EA, it said ...
Based on the June 2012 census which counted 383 horses and assuming a 20 percent population growth rate, the estimated wild horse population by fall 2015 would be approximately 662 adult wild horses (plus 132 foals).
That gives us 2 scenarios from which to choose: Scenario #1: 229 was correct. If so, then the population had increased by 154. But 154 ÷ 229 = 67%, which is 31/3 times the average birth rate and 132/5 times the average growth rate. Scenario #2: 191 was correct. If so, then the population had increased by 192. But 191 ÷ 192 ≃ 100%, which is 5 times the normative birth rate and 20 times the normative growth rate. BLM then projected the population to Fall 2015 — following that year's foaling season — to estimate an adult wild horse population of 662 "(plus 132 foals)." If so, that would mean 662 + 132 = 794. The EA then laid out its plan on screen-page 13:
The first portion of the Proposed Action would be to gather 90 percent of the total wild horse population and remove excess horses down to the low end of AML. Ninety percent of the herd is gathered in order to (1) select horses to return to the HMA to re-establish the low end of AML and (2) remove excess wild horses that would be prepared for the adoption program. This would mean if horses were gathered in 2015, approximately 715 horses, roughly 90 percent of the estimated herd size based on current estimates, would be gathered using the helicopter-drive method. Approximately 503 excess adult wild horses would be removed from the South Steens HMA, included those that have strayed outside the HMA boundary, to re-establish the herd size at the low end of AML (159 animals).
As an exercise, let's try to replicate BLM's process that took them to the above conclusions. Percent Year Population As of ... Change Compared to Normative Figure 2012 229 March 20% 4 times average growth rate 2012 383 Summer 67% 31/3 times average birth rate 132/5 times average growth rate

52
OR 2012 191 March 0% 0 growth per PZP? 2012 383 Summer 100% 5 times average birth rate 20 times average growth rate 2013 460 March 20% 4 times average growth rate 2014 552 March 20% 4 times average growth rate 2015 662 March 20% 4 times average growth rate 2015 794 Fall 20% 4 times average growth rate Total to have included 132 foals 90% of 794 = 715. However, ... 794 − 503 = 291, not 159. Whatever the plan had been, it did not turn out that way. The only known removals per the official record were 39 horses that were bait-trapped, an action that concluded on September 1, 2016. Per BLM's numbers, we would have expected the March 2016 population to be 794 − 39 = 755. However, BLM reported the March 2016 population at 632, which was 123 fewer horses. The March 2017 population was reported as 599, which was another 33 horses fewer. 13. Supposed Potential Competition with Bighorn Sheep On screen-page 28 of the EA, BLM noted:
The 1984 Andrews RPS reduced the size of the South Steens HMA by eliminating the Alvord Peak area where there was existing forage conflict between horses and bighorn sheep (no specific acreage was given).
BLM loves to see conflict where there is none, and to take away habitat from the wild horses to accommodate, in this case, so-called California Bighorn sheep, which descend from Canadian imports brought in because native bighorn had been "eliminated," as discussed in the link below. https://defenders.org/bighorn-sheep/basic-facts Contradicting BLM's unsupported claim of competition between bighorn and wild horses, Wockner, Singer, and Schoenecker (2004) reported:
Two studies have been conducted that have shown no obvious, convincing competition between the two species. A study of diets and habitats of both species revealed substantial diet overlap only during some seasons, but there were considerable spatial and habitat separations between wild horses and bighorns during all seasons

53
(Kissell and others, 1996). (Emphasis added.) Schoenecker, compiler (2004) also reported:
Although competition in the past is difficult to decipher, our data suggested no obvious negative effect of horse grazing or the presence of wild horses on bighorn sheep. Bighorn sheep demographic patterns did not differ between the wild horse-bighorn sheep and bighorn-only areas. We found no differences in pregnancy rates, lambing rates, or lamb survivorship in bighorn sheep inhabiting areas on versus off the wild horse range (pregnancy rate of ewes (± s.e.) was 77 ± 4%, and lambing rate was 68 ± 5%, overall), although our sample sizes were small. This finding is in general agreement with those of Kissell and others (1996) and Coughenour (2000), who found little overlap in use of resources. Kissell and others (1996) and Coughenour (2000) found considerable spatial and habitat separation. Even where habitats were shared, diets tended to be largely different between the two species. (Emphasis added.)
14. Genetic Status Report Was Not Included; Only BLM's Summary of It Dr. Cothran's reports for 2004 and 2009 were not attached to the EA. We have only BLM's interpretation of his analysis based on excerpts from his reports, found on screen-page 30 of the 2015 Update to the EA. However, an Internet search retrieved some data that was part of the NAS report of 2013. At the link below, you will find this information, which I have endeavored to extract and reassemble here from a chart found on screen-page 157.
HMA ST N Yr Sampled AML South Steens OR 31 2010 304 Cothran Ha Ho Fis MNA Report Date
0.758 0.741 − 0.023 6.92 10/19/10
https://www.nap.edu/read/13511/chapter/7#157
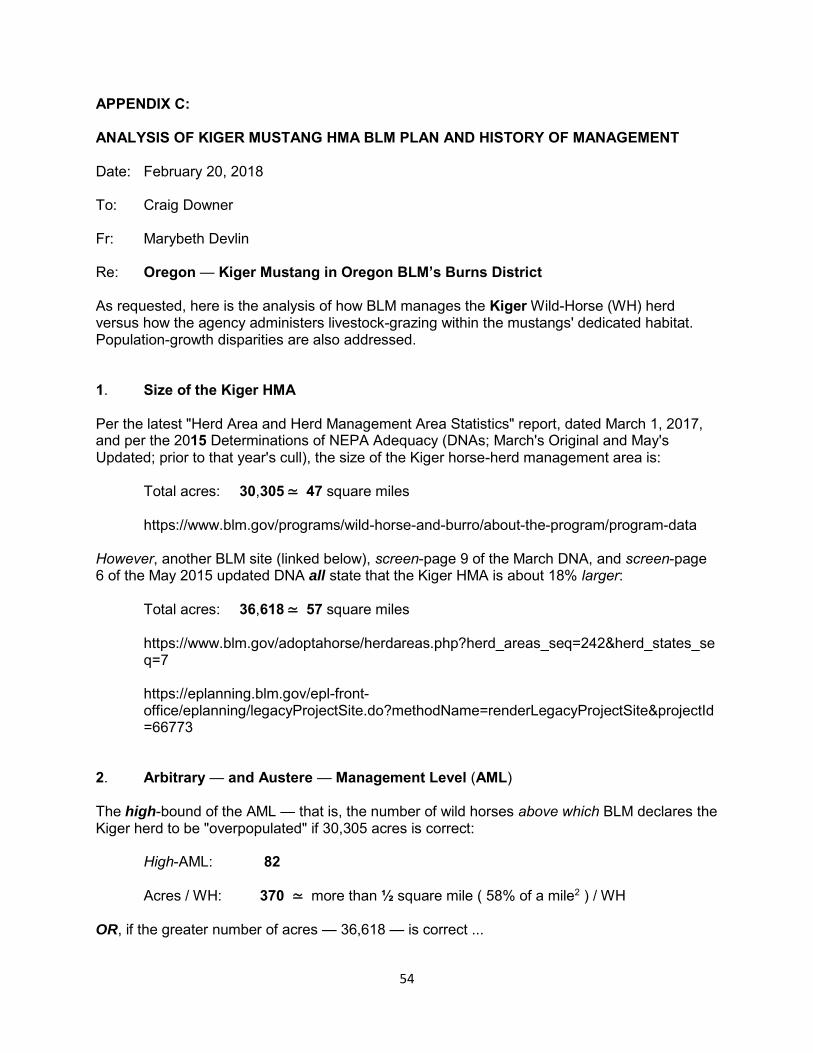
54
APPENDIX C: ANALYSIS OF KIGER MUSTANG HMA BLM PLAN AND HISTORY OF MANAGEMENT Date: February 20, 2018 To: Craig Downer Fr: Marybeth Devlin Re: Oregon — Kiger Mustang in Oregon BLM’s Burns District As requested, here is the analysis of how BLM manages the Kiger Wild-Horse (WH) herd versus how the agency administers livestock-grazing within the mustangs' dedicated habitat. Population-growth disparities are also addressed. 1. Size of the Kiger HMA Per the latest "Herd Area and Herd Management Area Statistics" report, dated March 1, 2017, and per the 2015 Determinations of NEPA Adequacy (DNAs; March's Original and May's Updated; prior to that year's cull), the size of the Kiger horse-herd management area is: Total acres: 30,305 ≃ 47 square miles
https://www.blm.gov/programs/wild-horse-and-burro/about-the-program/program-data However, another BLM site (linked below), screen-page 9 of the March DNA, and screen-page 6 of the May 2015 updated DNA all state that the Kiger HMA is about 18% larger: Total acres: 36,618 ≃ 57 square miles
https://www.blm.gov/adoptahorse/herdareas.php?herd_areas_seq=242&herd_states_seq=7
https://eplanning.blm.gov/epl-front-office/eplanning/legacyProjectSite.do?methodName=renderLegacyProjectSite&projectId=66773
2. Arbitrary — and Austere — Management Level (AML) The high-bound of the AML — that is, the number of wild horses above which BLM declares the Kiger herd to be "overpopulated" if 30,305 acres is correct:
High-AML: 82 Acres / WH: 370 ≃ more than ½ square mile ( 58% of a mile2 ) / WH
OR, if the greater number of acres — 36,618 — is correct ...
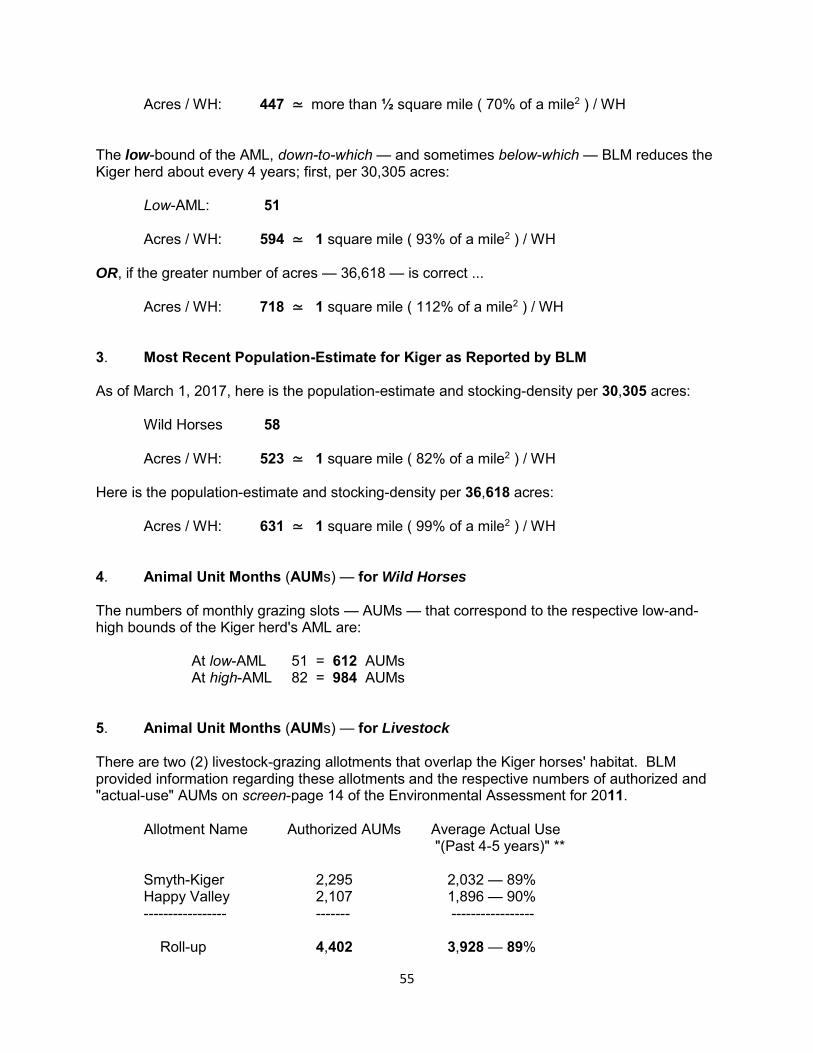
55
Acres / WH: 447 ≃ more than ½ square mile ( 70% of a mile2 ) / WH The low-bound of the AML, down-to-which — and sometimes below-which — BLM reduces the Kiger herd about every 4 years; first, per 30,305 acres: Low-AML: 51 Acres / WH: 594 ≃ 1 square mile ( 93% of a mile2 ) / WH OR, if the greater number of acres — 36,618 — is correct ...
Acres / WH: 718 ≃ 1 square mile ( 112% of a mile2 ) / WH 3. Most Recent Population-Estimate for Kiger as Reported by BLM As of March 1, 2017, here is the population-estimate and stocking-density per 30,305 acres:
Wild Horses 58
Acres / WH: 523 ≃ 1 square mile ( 82% of a mile2 ) / WH Here is the population-estimate and stocking-density per 36,618 acres:
Acres / WH: 631 ≃ 1 square mile ( 99% of a mile2 ) / WH 4. Animal Unit Months (AUMs) — for Wild Horses The numbers of monthly grazing slots — AUMs — that correspond to the respective low-and-high bounds of the Kiger herd's AML are:
At low-AML 51 = 612 AUMs At high-AML 82 = 984 AUMs
5. Animal Unit Months (AUMs) — for Livestock There are two (2) livestock-grazing allotments that overlap the Kiger horses' habitat. BLM provided information regarding these allotments and the respective numbers of authorized and "actual-use" AUMs on screen-page 14 of the Environmental Assessment for 2011. Allotment Name Authorized AUMs Average Actual Use "(Past 4-5 years)" ** Smyth-Kiger 2,295 2,032 — 89% Happy Valley 2,107 1,896 — 90% ----------------- ------- ----------------- Roll-up 4,402 3,928 — 89%

56
** The average actual use by cattle in the "(past 4-5 years)" would, presumably, have covered the 4 or 5 years preceding the 2011 EA — namely, 2006 to 2010, inclusive. However, neither the Determinations of NEPA Adequacy nor the Decision Record issued prior to the 2015 cull provided an update on AUMs actually then-currently being used for livestock-grazing. 6. Percentage of AUMs Awarded to Livestock v. to Wild Horses Within their dedicated habitat, we would expect wild horses to receive the majority of the grazing slots — the AUMs — in accordance with the Act's stipulation that they benefit from principal use of their dedicated habitat's resources. Instead, we discover that ... Of the combined maximum number of AUMs available to livestock and to wild horses in the Kiger horse-habitat — 5,386 —
4,402 — AUMs — 82% — have been allotted to livestock 984 — AUMs — 18% — have been allotted to wild horses
However, BLM's scheme is to manage the Kiger wild horses down to or below the low-AML. So, the actual apportionment disadvantages the wild horses even more. Of the targeted management-total of 5,014 AUMs ...
4,402 — AUMs — 88% — have been allotted to livestock 612 — AUMs — 12% — have been allotted to wild horses
7. Overlap of Allotments Is Greater than 100% In the 2011 EA's chart referenced above, BLM has a column to indicate that the overlap of the allotments and the horses' habitat is 77% for Smyth-Kiger and 32% for Happy Valley. The ploy seems to be to downplay the extent of the encroachment, suggesting that neither allotment encompasses the entire HMA. However, together, they have it more-than covered.
77% + 32% = 109%. Further, during some part of the grazing season, all of the cattle are likely be placed within the HMA where, in their overwhelming numbers, they outcompete the horses for the available forage, leaving behind only stubble as Winter approaches. Note that the livestock-grazing season covers the prime forage-growing season. Start / End Dates Allotment Name Grazing Season Season-Length Smyth-Kiger April 1 - October 31 7 months Happy Valley April 1 - October 15 6½ months

57
8. Commoditization, monetization of the Kiger Herd In a cull, BLM-Oregon selects horses to remove versus horses to remain based on characteristics that "would perpetuate the desirable features of the Kiger Mustang." What BLM refers to as "high quality" traits include specific colors, markings, conformation, size, and weight. However, managing this tiny herd per such strict, anthropocentric criteria points to a captive-breeding program. With the herd-size below minimum-viable population, the gene-pool diversity is surely being depleted. In fact, declining genetic diversity was cited by Consultant Dr. Gus Cothran in his most recent report. But not to worry, says BLM, outside horses can be introduced to increase diversity as needed. In the 2011 EA, BLM boasted that it achieves an "absolute" 100% adoption-rate for Kiger mustangs. Adoption ... or auction? Not too long ago, at an Advisory Board meeting, two BLM-Oregon staffers bragged about how much revenue is brought in by sale of captured Kiger horses. The news-article linked below noted: "At one auction in 1999, a claybank filly sold for $19,000." http://denver.cbslocal.com/2015/07/09/colorado-group-claims-blm-trying-to-breed-special-mustangs-in-oregon/ The emphasis on how much revenue the Kiger horses generate for BLM points to the Agency's commercial exploitation of the herd. 9. Herd-growth Claims Questioned Below is a chart that pulls, from BLM's National Program Data Webpage, the Kiger herd's annual herd-growth numbers and gather statistics. An average annual herd-growth of, at most, 5% would be the expected maximum-normative rate of increase. If BLM were to be believed, the Kiger herd's population-growth exceeds the norm many times over, and does so consistently — literally, year after year.
KIGER Year Reported Percent Compared to Max-Norm Comment Population Change as of Mar 1 2009 61 2010 86 41% 8 times the norm 2011 100 16% 3 times the norm Per gather report, 100 removed plus 2 deaths. 1 2012 51 Down to low-AML

58
2013 61 20% 4 times the norm 2014 73 20% 4 times the norm 2015 130 78% 15½ times the norm Per gather report, 119 culled. 2 2016 49 Below low-AML 2017 58 18% 3½ times the norm 1 Discrepancies found in regard to the 2011 cull
The 2011 EA said BLM planned to cull 120 "excess" wild horses. However, the March 1, 2011 population was reported as 100. Even if ...
1. A 20% birth rate were achieved in Spring 2011, and even if 2. All new foals survived until the cull took place, and even if 3. All adults had survived year-to-date, ...
BLM would ostensibly have been planning to remove 100% of the herd. Per the National Gather-Data Webpage, BLM reported the following:
123 Pre-gather number. A 23% birth rate, 15% above average. A growth rate of 23% would be 4½ times the norm. 116 Captured. Cull completed on July 12, after peak-foaling 100 Removed by government roundup 2 Removed by Grim Reaper (deaths) 21 Post-gather population = 123 − 102
Consequently, we would have expected the March 1, 2012 population to equal the post-cull number: 21. However, BLM reported 51. What are the possible explanations for this huge discrepancy? Scenario #1: The herd increased 143% in the 8 months since the gather. Conclusion: Impossible. Scenario #2: The post-gather report was correct. There were only 21 wild horses left on the range following the cull. If so, then the 2012 population-estimate of 51 was a falsehood. Conclusions: Fraud. Misrepresentation of data. Violation of the WFRHBA by reducing the herd so far below low-AML that the herd could not be self-sustaining.

59
Scenario #3: BLM quietly put back 30 of the 116 horses that the helicopter-contractor had been paid to remove. Conclusion: Fraud. Falsification of records. Improper expenditure of government funds. Scenario #4: BLM paid the helicopter-contractor for removing 116 horses so he could "make his numbers" — and so BLM could perpetuate the overpopulation Lie — but stopped the cull at 86 horses. Conclusion: Fraud. Falsification of records. Improper expenditure of funds. Scenario #5: The pre-gather population figure of 123 was a mistake. It was intended to be the number that BLM planned to capture. If so, using algebra, we can determine what population BLM would have estimated for the Kiger herd, pre-gather, in order for there to be 30 more horses than expected, achieving low-AML — 51 — in 2012. Again, we will initially pretend that all newborns survived up until the cull and that no adult horses had died either, over the year. The equation: 2011 population + 2011 population-gain (foals) − number removed = 51
100 + x − (100 + 2) = 51 100 + x − 102 = 51 x − 2 = 51 x = 53
So, the pre-gather herd-population would have to have been 153. But that would have meant either a 53% birth rate, which is 2½ times the norm, or a 53% growth rate, which would be 10½ times the norm. Conclusion: Unlikely birth and growth rates; probably impossible. Fraud. Falsification of records. Improper expenditure of funds.
2 Discrepancies found in regard to the 2015 cull
Following the 2011 cull, BLM reported 20% annual increases in the Kiger herd's population — 4 times the norm each year, compounded. However, by 2014, the population was only 73, still within AML. Another inflated 20% increase would have put the population at 87 or 88 horses — just a handful over AML and certainly not enough to justify a costly helicopter-drive roundup. So, BLM ginned up the numbers, claiming in its March 2015 population report that the herd had increased to 130 horses — a 78% herd-growth rate — 15½ times the norm.
BLM then issued Determinations of NEPA Adequacy (DNAs; March and May, 2015) that were tiered to the 2011 EA. The DNAs stated that a gather would be conducted in 2015 to cull 156 "excess" wild horses. Removals were subsequently conducted via a helicoper-drive that lasted from August 31 to September 2. Although significantly fewer horses were culled than planned, more troubling was finding that BLM had reduced the herd to just 49 wild horses, a number that was below low-AML. The post-gather statistics, posted on the National Webpage, did not report either pre-gather or post-gather population-estimates. The data were limited to ...

60
130 — captured 119 — removed 0 — contracepted
What must have been the pre-gather population? We turn to algebra once again. The equation: 2015 population + 2015 population-gain (foals) − number removed = 49
130 + x − (119) = 49 x + 11 = 49 x = 38
So, the pre-gather herd-population would have to have been 168. But that would have meant a 29% birth rate, which would be 45% above average. A growth rate of 29% would be 6 times the norm. And that growth would have been on top of and compounded upon the alleged 78% growth from the preceding year. Conclusion: Unlikely birth and growth rates; probably impossible. Fraud. Falsification of records. Improper expenditure of funds. However, please recall that BLM had originally projected that the number to be culled would be 156. Therefore, the anticipated herd-growth to offset such a large cull would have to have been a lot higher. Yet again, we employ the equation: 2015 population + 2015 population-gain − number to be removed = 49
130 + x − 156 = 49 x − 26 = 49 x = 75
So, the pre-gather herd-population would have to have been 205. But that would have meant either a 58% birth rate, 3 times the norm, or a 58% growth rate, 11½ times the norm. And that growth would have been on top of and compounded upon the alleged 78% growth from the preceding year. Conclusion: Impossible birth and growth rates. Fraud. Falsification of records. Improper expenditure of government funds.

61
APPENDIX D: INVESTIGATION OF PAISLEY DESERT WILD HORSE PROGRAM BY MARYBETH DEVLIN
Date: February 24, 2018
To: Craig Downer
Fr: Marybeth Devlin, Wild Horse Researcher
Re: Oregon — Paisley Desert wild horse herd and HMA in Oregon BLM’s Lakeview District
Here is the analysis of how BLM manages the Paisley Desert Wild-Horse (WH) herd versus how the
agency administers livestock-grazing within the mustangs' dedicated habitat. Population-growth
impossibilities are also addressed.
1. Size of the Paisley Desert HMA
Per the latest "Herd Area and Herd Management Area Statistics" report, dated March 1, 2017, the size
of the Paisley Desert horse-herd management area is:
303,718 total acres ≃ 475 square miles
https://www.blm.gov/programs/wild-horse-and-burro/about-the-program/program-data
2. Arbitrary — and Austere — Management Level (AML)
Here is the AML's high-bound — the number of wild horses above which BLM declares the Paisley
Desert herd to be "overpopulated."
High-AML: 150
Acres / WH: 2,025 ≃ 3 square miles / WH
Here is the AML's low-bound, down-to-which BLM manages the herd.
Low-AML: 60
Acres / WH: 5,062 ≃ 8 square miles / WH
3. 2017 Population-Estimate Alleged for the Paisley Desert Herd
Here is the herd-size as of March 1, 2017, along with the stocking-density.
Wild Horses 516
Acres / WH: 589 ≃ 1 square mile ( 92% of a mile2 ) / WH
4. Animal Unit Months (AUMs) — for Wild Horses per year

62
The numbers of monthly grazing slots — AUMs — that correspond to the respective low-and-high
bounds of the Paisley Desert herd's AML are:
At low-AML 60 = 720 AUMs
At high-AML 150 = 1,800 AUMs
5. Animal Unit Months (AUMs) — for Livestock, Wild Horses, Wildlife
There are four (4) livestock-grazing allotments that overlap the Paisley Desert horses' habitat. BLM
provided information regarding these allotments and the respective numbers of "active preference"
AUMs for livestock (LS) on screen-page 16 of the Environmental Assessment for 2009. BLM's chart also
included the AUMs for wild horses (WH) and other wildlife (WL). The AUMs for wild horses are per the
high-bound AML.
Permittee Allotment Season LS AUMs WH AUMs WL AUMs
ZX Ranch* ZX-Christmas Lake 2/01 - 11/15 4598 778 122
ZX Ranch* Sheeprock 2/25 - 07/15 3969 929 284
ZX Ranch* Saint Patricks 3/01 - 05/15 750 35 53
Martin Pernoll Squaw Lake 9/15 - 12/31 834 58 165
---------------------------------------------------------------------------------------------------------------------------
10,151 1,800 624
* JR Simplot Trust
https://eplanning.blm.gov/epl-front-
office/eplanning/legacyProjectSite.do?methodName=renderLegacyProjectSite&projectId=66558
6. Percentage of AUMs Awarded
Within their dedicated habitat, we would expect wild horses to receive the majority of the grazing slots
— the AUMs — in accordance with the Act's stipulation that they benefit from principal use of their
dedicated habitat's resources. Instead, we discover that ...
Of the combined maximum-total of 12,575 AUMs available to livestock, to wild horses, and to other
wildlife in the Paisley Desert horse-habitat ...
10,151 — AUMs — 81% — have been allotted to livestock
1,800 — AUMs — 14% — have been allotted to wild horses
624 — AUMs — 5% — have been allotted to other wildlife
----------------------------------------------------------------------------------------
12,575 — AUMs — 100% — Roll-up

63
However, BLM's scheme is to manage the Paisley Desert wild horses down to low-AML. So, the actual
apportionment disadvantages the wild horses even more. Of the targeted management-total of 11,495
AUMs ...
10,151 — AUMs — 88.3% — have been allotted to livestock
720 — AUMs — 6.3% — have been allotted to wild horses
624 — AUMs — 5.4% — have been allotted to other wildlife
----------------------------------------------------------------------------------------
11,495 — AUMs — 100.0% — Roll-up
7. Rest and Rotation Scheme
Also on screen-page 16, the 2009 EA advises that livestock grazing is practiced per deferred rest, rest
rotation, or spring use, as follows.
“Pastures in the ZX Christmas Lake and Sheeprock allotments are rested from livestock grazing at least
one year following livestock use and often rested two years. The Saint Patricks allotment is used, by
livestock, only in the spring. Martin Pernoll uses the Squaw Lake allotment which is currently set up as a
rest rotation grazing system.”
Even so, livestock inflict great damage to the range by their concentrated grazing and vast numbers. A
year or two of rest would not begin to repair the destruction. Meanwhile, the wild horses are left with
stubble to sustain themselves as Winter approaches.
8. Supposed Potential Competition with Bighorn Sheep
On page 16 of the EA, BLM worried that, should wild horses step outside the boundaries of the HMA,
there was "a potential conflict with big horn sheep in the Diablo Rim area." BLM loves to see conflict
where there is none. Wockner, Singer, and Schoenecker (2004) noted:
“Two studies have been conducted that have shown no obvious, convincing competition between the
two species. A study of diets and habitats of both species revealed substantial diet overlap only during
some seasons, but there were considerable spatial and habitat separations between wild horses and
bighorns during all seasons (Kissell and others, 1996).” (Emphasis added.).
Schoenecker, compiler (2004) reported:
“Although competition in the past is difficult to decipher, our data suggested no obvious negative effect
of horse grazing or the presence of wild horses on bighorn sheep. Bighorn sheep demographic patterns
did not differ between the wild horse-bighorn sheep and bighorn-only areas. We found no differences in
pregnancy rates, lambing rates, or lamb survivorship in bighorn sheep inhabiting areas on versus off the
wild horse range (pregnancy rate of ewes (± s.e.) was 77 ± 4%, and lambing rate was 68 ± 5%, overall),
although our sample sizes were small. This finding is in general agreement with those of Kissell and

64
others (1996) and Coughenour (2000), who found little overlap in use of resources. Kissell and others
(1996) and Coughenour (2000) found considerable spatial and habitat separation. Even where habitats
were shared, diets tended to be largely different between the two species.” (Emphasis added.).
9. Appendices Were Omitted; So Could Not Review Genetic Status Report
With the herd repeatedly reduced to a level below minimum-viable population, gene-pool diversity is
surely being depleted. In fact, comments received during the public-review period brought up the issue
of genetic viability. EA page 5:
“Comments suggested that the actions, selected age group for retention, and AML would put horses
below genetic viability.
Response: Please refer to the population record provided on page 3, and Management Objective 3 on
page 5 of Appendix G. These references indicate that the herd is viable and would not be in danger of
extinction. The population record indicates that horses from other Oregon herds have been
introduced into the Paisley Desert population and would be in the future if necessary. In addition the
Genetic Analysis of the Paisley Desert HMA written by E. Gus Cothran is provided in Appendix F which
indicates the herd should not be in jeopardy of extinction in the near future, i.e. 20 years. Cothran did
recommend that the herd should be closely monitored. The Lakeview BLM has monitored the herd and
occasionally introduced horses from other Oregon Herds.” (Emphasis added.).
Because all the Appendices were left out of the online EA, it is not possible to verify BLM's interpretation
of Dr. Cothran's analysis or to tell when it was done. Further, if BLM has had to introduce outside horses
to increase genetic diversity, the need to have done so evidences BLM's failure to manage the herd as a
self-sustaining population.
An Internet search retrieved some data that was part of the NAS report of 2013. At the link below, you
will find this information, which I have endeavored to extract and reassemble here from a chart found
on screen-page 157. Note that it is per an email sent/received in 2011. The data are likely much older.
HMA ST N Yr Sampled AML
Paisley Desert OR 83 No year 150
Ha Ho Fis MNA
0.743 0.780 0.047 8.00
E.G. Cothran, Texas A&M University, email communication, December 21, 2011
https://www.nap.edu/read/13511/chapter/7#174

65
10. Herd-growth Claims Questioned
BLM appears to be conflating the average birth rate (20%) with the herd-growth rate. However, those
are different measures. Foal-mortality (50%) and other-than-foal mortality (at least 5%) offset births,
resulting in a normative herd-growth rate of no more than 5%. At that rate, it takes 14 years for a herd
to double. However, Page 2 of the Decision Record states:
“Monitoring data collected over the past years shows that the Paisley Desert herd grows at an average
of 20% and doubles in numbers at least every 4 years.”
BLM's claims are questioned as are its herd-growth records.
Below is a chart that pulls, from BLM's National Program Data Webpage, the annual herd-growth
numbers and gather statistics. To reiterate, an average annual herd-growth of, at most, 5% would be the
expected maximum-normative rate of increase. If BLM were to be believed, the Paisley Desert herd's
population-growth exceeds the norm many times over, year after year.
PAISLEY DESERT
Year Reported Percent Compared to Max-Norm Comment
Population Change
as of Mar 1
2009 245 December 21
354 pre-gather
275 captured
250 removed
2 deaths
15 contracepted
102 post-gather 1
2010 60 Down to low-AML
42 horses missing
2011 117 95% 19 times the norm
2012 146 25% 5 times the norm July 30 and Aug 29
300 pre-gather
208 captured
208 removed

66
107 post-gather2
2013 107
2014 128 20% 4 times the norm
2015 154 20% 4 times the norm
2016 430 179% 36 times the norm3
2017 516 20% 4 times the norm
1 Discrepancies found before and after the 2009 cull
Page 7 of the 2009 EA reported a population of 223 horses, including foals, as of July — 22 horses (9%)
fewer than the number (245) reported earlier, in March. The Decision Record stated that BLM planned
to gather [and, evidently, to remove] 163 wild horses and leave 60 (30 males, 30 females). And, indeed,
223 − 163 = 60.
Before release, 20 to 30 of the mares would be injected with PZP.
The roundup was subsequently conducted in December 2009. However, according to the National
Gather-Data Webpage, BLM reported the following:
354 Pre-gather population — 59% higher in just 5 months
275 Captured
250 Removed by government roundup
2 Removed by Grim Reaper (deaths)
15 Contracepted
102 Post-gather population (354 − 252 = 102)
Because the gather was held so late in the year, we would have expected the March 1, 2010 population
to equal the post-cull number: 102. However, BLM reported 60.
Discussion: The herd could not have increased so drastically, let alone in less than a year. It appears that
BLM falsified the numbers. Possible motivation: So that the helicopter-contractor could "make his
numbers" while BLM could perpetuate the lie of an exploding population and spend down its budget.
What happened to the 42 horses that went missing?
2 Discrepancies found in regard to the 2012 cull
The 2011 population again ballooned — on BLM's spreadsheets — where BLM reported a 95% increase,
which is 19 times normal growth. The following year, 2012, BLM reported a 25% increase
(compounded), which is 5 times the norm. BLM apparently forgot that 15 (half) of the mares had been
injected with PZP. Thus, we would have anticipated a much-lower herd-growth rate.

67
Note: The 2009 EA was meant to cover culls "over a ten year time frame." So, BLM did not prepare a
new EA for the gather that took place 21/2 years later, in late July and August 2012. Further, the 2012
event appears to have been an emergency action:
“A devastating wildfire swept through the Paisley Desert HMA in 2012, requiring an emergency gather.”
http://www.mustangs4us.com/HMA-Section/oregon.htm
The 2012 cull was conducted in 2 separate actions: one on July 30, the other on August 29. The pre-
gather population in each case was reported as 300, which represented a 106% increase in just 4
months — 21 times the yearly norm.
BLM claimed to have captured 208 horses, to have removed all of them, and supposedly to have left 107
post-gather. However 300 − 208 = 92.
Which is the true number? That prompts the question: What would the 2012 pre-gather population
have to have been for 107 horses to remain post-gather, if indeed 208 were removed? The equation:
2012 population + 2012 population-gain (foals) − number removed = 107
146 + x − 208 = 107
x − 62 = 107
x = 169
So, the pre-gather herd-population would have to have been 146 + 169 = 315. But that would have
meant the herd had grown 116% in only 4 months — 23 times the yearly norm.
3 Another Unlikely Jump in Population
For the next 2 years (2013 and 2014), BLM reported herd-growth of "only" 20% — 4 times the norm.
BLM continued conflating the average birth rate with the growth rate.
Then, in 2016, BLM reported another huge one-year increase in population: 179%. That jump was 36
times the norm. Because such growth is biologically impossible, the reported increase was obviously
falsified. However, BLM stuck to its story, claiming that the herd grew another 20%, compounded, by
2017.
These falsified records will, no doubt, soon be proffered as evidence of the urgent need for yet another
cull, with BLM claiming wild horses are prolific breeders. However, BLM's herd-growth rates are lies. In
truth, the "crisis" of overpopulation is an entirely concocted one.
Conclusions: Inadequate AML. Sparse stocking-density. Inflated forage-needs. Impossible growth rates.
Falsification of records. Improper expenditure of government funds. In a word ... Fraud.

68
APPENDIX E: ANALYSIS OF THREE FINGERS HMA WILD HORSE MANAGEMENT HISTORY AND PLAN BY BLM Date: March 2, 2018 To: Craig Downer Fr: Marybeth Devlin Re: Oregon — Three Fingers wild horse herd and HMA in Oregon BLM’s Vale District Here is the analysis of how BLM manages the Three Fingers Wild-Horse (WH) herd versus how the agency administers livestock-grazing within the mustangs' dedicated habitat. Population-growth impossibilities are also addressed. 1. Size of the Three Fingers HMA Per the latest "Herd Area and Herd Management Area Statistics" report, dated March 1, 2017, the size of the Three Fingers horse-herd management area is: 71,486 total acres ≃ 112 square miles
https://www.blm.gov/programs/wild-horse-and-burro/about-the-program/program-data 2. Arbitrary — and Austere — Management Level (AML) Here is the AML's high-bound — the number of wild horses above which BLM declares the Three Fingers herd to be "overpopulated."
High-AML: 150 Acres / WH: 477 ≃ 3/4 of a square mile ( 75% of a mile2 ) / WH
Here is the AML's low-bound, down-to-which BLM manages the herd. Low-AML: 75 Acres / WH: 953 ≃ 11/2 square miles ( 149% of a mile2 ) / WH 3. 2017 Alleged Population-Estimate for the Three Fingers Herd Here is the herd-size as of March 1, 2017, along with the stocking-density.
Wild Horses 87

69
Acres / WH: 822 ≃ 11/4 square miles ( 128% of a mile2 ) / WH 4. Animal Unit Months (AUMs) — for Wild Horses The numbers of monthly grazing slots — AUMs — that correspond to the respective low-and-high bounds of the Three Fingers herd's AML are:
At low-AML 75 = 900 AUMs At high-AML 150 = 1,800 AUMs
5. Animal Unit Months (AUMs) — for Livestock There are seven (7) permittees using the two (2) livestock-grazing allotments that overlap the Three Fingers horses' habitat. Four permittees run cattle in the Three Fingers allotment, and three permittees run a combination of cattle (mostly) and horses (just 56 AUMs) in the Board Corral allotment. BLM provided information regarding these allotments and the respective numbers of authorized and "actual" AUMs for livestock on screen-page 11 of the 2011 Environmental Assessment. Because BLM's chart would not fit here, salient portions of it are presented below. 5-year 5-year Name of Allotment Authorized Average Maximum Season of Use % inside HMA AUMs "Actual" "Actual" Number of months Use Use Three Fingers 35% 9,030 8,468 10,157 03/01 to 10/31 (08) Board Corral 28% 2,354 3,048 4,112 03/01 to 02/28 (12) ----------------------------------------------------------------------------------------------------------- Roll-up 63% 11,384 11,516 14,269 https://eplanning.blm.gov/epl-front-office/eplanning/legacyProjectSite.do?methodName=renderLegacyProjectSite&projectId=67816 The permittees' combined average use was slightly over the number of authorized AUMs. At their maximum use, it was way-over — 25% over. At minimum use, either the exact number of AUMs authorized (Board Corral: 2,354) or fewer than (Three Fingers: 6,671) AUMs authorized were reported, yielding a combined total of 9,025 — 21% lower. Finally, please note that the seasons of use are longer than those typically seen. In particular, Board Corral runs year-round. Finally, just because the allotments encroach less than 100% of the horses' habitat does not mean that all is well. The overwhelming number of livestock grazing in the HMA poses intense competition to the wild horses. All of the cattle could be inside the HMA at any given time, devouring the forage and leaving only the stubble for the wild horses, especially as Winter approaches.

70
6. Percentage of AUMs Awarded to Livestock v. to Wild Horses Within their dedicated habitat, we would expect wild horses to receive the majority of the grazing slots — the AUMs — in accordance with the Act's stipulation that they benefit from principal use of their dedicated habitat's resources. Instead, we discover that ... Of the combined maximum-total of 13,184 AUMs available to livestock and wild horses in the Three Fingers horse-habitat ...
11,384 — AUMs — 86% — have been allotted to livestock 1,800 — AUMs — 14% — have been allotted to wild horses
---------------------------------------------------------------------------------------- 13,184 — AUMs — 100% — Roll-up However, BLM's scheme is to manage the Three Fingers wild horses down to low-AML. So, the actual apportionment disadvantages the wild horses even more. Of the targeted management-total of 12,284 AUMs ...
11,384 — AUMs — 93% — have been allotted to livestock 900 — AUMs — 07% — have been allotted to wild horses
---------------------------------------------------------------------------------------- 12,284 — AUMs — 100% — Roll-up 7. BLM Cited a 17% Growth Rate — but Reported Much Higher Rates Screen-page 10 of the EA advised that BLM's analysis of population-estimates and aerial counts of the Three Fingers herd revealed "an average annual growth rate of approximately 17% since the last gather." However, a review of the data that BLM actually reported told a different story. In 2010, the year before the 2011 cull, BLM had reported a 44% increase in population — 9 times the norm. In 2011, the year of the cull for which the EA had been prepared, BLM reported a 67% increase — 131/2 times the norm. For the next 4 years, BLM reported a consistent 20% annual increase — 4 times the norm — except, that is, until just before the "emergency" cull of 2016, when it claimed the herd had grown 79% — 154/5 times the norm. So, it was false and misleading for BLM to have claimed that the growth rate was just 17%, which itself is 32/5 times the norm. 8. Why 17% or 20% Cannot Be the Correct Herd-Growth Rate Although BLM claimed a 17% growth rate for the Three Fingers herd, BLM's National Office cites a standard growth rate of 20% per year. However, neither rate is true. Here's how we know. According to BLM, there were 25,300 wild horses and burros on the range in 1971. (The real number is widely believed to have been higher.) Here is how BLM's figure — 25,300 — would have increased over the 47 years since 1971 per a herd-growth rate of 17%, compounded, with the number rounded:
40,537,412

71
Per a herd-growth rate of 20%, compounded, with the number rounded, we get
133,000,000 BLM reports that it removed nearly 258,000 mustangs over that 47-year period — 240,974 during the years from 1971 to 2012, and 17,016 from 2013 to date. If so, then at 17%, there would still be more than 40,000,000 and, at 20%, there would be well-over 132,000,000. Because the mustangs number in the thousands and not in the millions, BLM's constant refrain — that wild-horse herds multiply by either 17% or 20% annually — is, therefore, a greatly-exaggerated, non-supportable falsehood. 9. The Normative Herd-Growth Rate Is No More Than 5% Gregg, LeBlanc, and Johnston (2014) conducted a definitive study on wild horse demographics, using BLM's own data. They reviewed the records of 4 representative herds with a combined population of 5,859 wild horses. Their analysis revealed the average birth rate to be just under 20%. However, their analysis also disclosed that 50% of foals perish before their first birthday. Hence, the birth rate is just a temporary blip in the data, and the normative population-gain from surviving foals is 10%. However, wild horses other-than-foals also die. Because the subject study did not look at that aspect, we have to turn elsewhere. BLM reports a 5% annual mortality rate for horses taken off the range and maintained in short-term holding. We will use that rate as a conservative proxy for the annual mortality rate for adult horses on the range. Starting with the 10% net increase from surviving foals, we then subtract the 5% loss of horses other-than-foals, and that yields an average herd-growth rate of 5%. 10. Herd-growth Claims Questioned BLM appears to be conflating the average birth rate with the herd-growth rate. BLM also appears to be inflating the population growth. Both types of errors have infected the data for the Three Fingers herd. https://www.blm.gov/programs/wild-horse-and-burro/about-the-program/program-data
THREE FINGERS Year Reported Percent Compared to Max-Norm Comment Population Change as of Mar 1 2009 108 2010 156 44% 9 times the norm 2011 261 67% 131/2 times the norm August 15.

72
220 pre-gather 190 captured 144 removed 1 death 75 post-gather 41 unaccounted 1 2012 75 Down to low-AML 2013 90 20% 4 times the norm 2014 108 20% 4 times the norm 2015 130 20% 4 times the norm 2016 156 20% 4 times the norm September 1. 279 pre-gather 154 removed 1 death 37 unaccounted 2 2017 87 1 Discrepancies found before and after the 2011 cull In the 2 years leading up to the removal-action of August 2011, BLM falsified the herd-growth figures. Increases of 9 times the norm (2010) and 131/2 times the norm (2011) were shamelessly reported. Then, having claimed a population of 261 in March 2011, BLM reported only 220 in August 2011, pre-gather. That still would have constituted a 41% growth rate — 8 times the norm since March of that year. There was no explanation for the 41 horses that had gone missing. The August 2011 cull removed a total of 145 horses, one of which was by death. The post-gather total became the March 2012 population. Then, over the next four years, BLM alleged the herd grew consistently at an annual rate of 20% — 4 times the normative average. 2 Discrepancies found before and after the 2016 cull In June 2016, BLM issued a Determination of NEPA Adequacy and a Decision Record to justify a proposed roundup of the Three Fingers herd for purposes of range-rehabilitation following the "Soda" fire — even though the HMA had not been affected by that fire. Instead of preparing an environmental assessment, as required, BLM merely "tiered" to the old EA from 2011. BLM announced that, of a then-current population of 156, it would round up 100 horses, remove 50 of them, and return the other 50 to the range — 25 males and 25 females — after injecting the latter with PZP-22, the long-acting formulation of the pesticide-sterilant. That would have left a herd of 106 horses, at least, that is, on BLM's dubious spreadsheets. https://eplanning.blm.gov/epl-front-

73
office/eplanning/projectSummary.do?methodName=renderDefaultProjectSummary&projectId=62950 Advocacy-organization Friends of Animals challenged the improperly-issued June DNA/DR in court. Before that matter could be resolved, on August 21, an arsonist started a wildfire — named the Cherry Road Fire — that burned into a portion of the Three Fingers HMA. The fire was 95% contained by August 25, just 4 days later. The total area affected was 35,308 acres. Please note that the Three Fingers HMA encompasses 71,486 acres, and only some of the burn-area was within the HMA. http://www.oregonlive.com/wildfires/index.ssf/2016/08/new_wildfire_threatens_state_p.html https://inciweb.nwcg.gov/incident/article/4974/32985/ BLM seized the opportunity to exploit the disaster. It was like a chapter out of Naomi Klein's book The Shock Doctrine, which describes the unethical strategy of taking advantage of a disaster to ram through actions that the public opposes before the latter can organize a defense. BLM quickly withdrew the previously-challenged DNA/DR and, on August 28, stealthily issued a "Full Force and Effect" Decision Record for an emergency roundup. The reason the adverb "stealthily" correctly characterizes the move was because BLM failed to post this DR on the ePlanning site. As far as can be determined, it still does not appear there to date. American Wild Horse Campaign got wind of BLM's sneak attack and alerted its readers to the imminent gather. AWHC provided a link to BLM's press release that announced the "emergency" action. While it is still possible to access that press release, one can do so only ever-so-briefly because it quickly disappears and reverts to "Page Not Found." Through repeated trials, I was able to capture and save the URL and the text of the press release. I was also successful in accessing the embedded link to the Emergency DR, which I also downloaded. https://www.blm.gov/or/resources/whb/fingers2016.php https://www.blm.gov/or/resources/whb/files/fingers-emer-dr.pdf Per AWHC's understanding, the then-current herd-population was 202 horses. In the emergency DR, BLM claimed that there were 202 horses ... that is, adult horses ... but also 77 foals, for a total population of 279. If that were true, then the herd would have increased by 123 members, or 79%, which is 154/5 times the normative growth rate. Foals were apparently accounting for 49% of that increase (77 ÷ 156), 21/2 times the average birth rate. Curiously, adult horses represented 30% (123 − 77 = 46 ) of new herd-members. Whence all these adult newbies? Further, it has been BLM's practice to skew the gender-ratio of the Three Fingers herd in favor of males 60:40. Thus, the March 1 herd-population of 156 would have had about 62 females. Let's willfully suspend disbelief for sake of argument and assume that all the females had given birth in 2016. That would mean 62 mares birthed 77 foals, requiring there to have been 15 sets of twins. However, the incidence of twin foals is known to be 1:10,000. Further, most foal-twins die at birth, and death would surely be a certain outcome on the range. So, it is unlikely that 15 cases of twin-births occurred in Three Fingers, let alone that all 15 of those twins survived long enough to be inventoried. Even a movie-goer would find BLM's story-line "hokey."

74
BLM claimed that the Cherry Road Fire had burned 90% of one key "pasture" where the wild horses supposedly tended to congregate. This claim was doubtful in light of wild horses' propensity to free-roam, on average, 10 miles a day. Citing its bloated estimate that 279 horses were present, BLM declared its intent to remove 150 of them. BLM reassured readers that "between 80–120 wild horses will remain ...." What? Let's do the math: 279 − 150 = 129. A search of the payments made by BLM to Helicopter Contractor Sun J revealed two transactions associated with the 2016 Three Fingers "emergency" gather.
$ 97,074 24,272 -------------- $ 121,346
https://www.usaspending.gov/Pages/AdvancedSearch.aspx?sub=y&ST=C,G,L,O&FY=2018,2017,2016,2015,2014,2013,2012,2011,2010,2009,2008&A=0&SS=USA&k=Sun%20J&pidx=4&SB=RN&SD=ASC https://www.usaspending.gov/Pages/AdvancedSearch.aspx?sub=y&ST=C,G,L,O&FY=2018,2017,2016,2015,2014,2013,2012,2011,2010,2009,2008&A=0&SS=USA&k=Sun%20J&pidx=5&SB=RN&SD=ASC The helicopter-drive began August 29 — one day after the DR was issued. Only 3 days later, on September 1, 2016, the roundup concluded. BLM announced that it had removed 155 horses: 67 stallions, 55 mares, and 33 foals; however, one of those foals was put down. We would have expected the post-gather population to be 124 (279 − 155). However, the March 2017 population was reported as only 87. What happened to the 37 missing horses? Here is the post-gather press-release, with BLM crowing about working for the "health and well-being" of the herd. https://www.blm.gov/or/districts/vale/.../VA_ThreeFingersGather_2016-Final.pdf Advocacy-group Protect Mustangs cried foul, criticizing BLM's stealth action in culling so many horses as just "an excuse to move them off public land." Executive Director Anne Novak called for an end to BLM's dishonest tactics: "This racket needs to stop now." http://protectmustangs.org/?tag=three-fingers-herd-management-area Friends of Animals amended its earlier suit to challenge the "emergency" roundup. BLM argued "mootness" — that the roundup was over and couldn't be undone — but the court didn't buy it. FOA requested to be allowed to proceed with discovery (interrogatories and depositions). Discovery would determine whether the court could provide any relief from the harm caused by BLM's violations of the WFRHBA and NEPA. Effective remedies could include returning some or all of the Three Fingers horses to the range, protective fencing, temporary watering sites, and making the removal of the wild horses temporary rather than permanent. In fact, as FOA pointed out, these very measures were already part of BLM's Vale District Normal Fire Year Emergency Stabilization and Rehabilitation Plan.

75
https://www.leagle.com/decision/infdco20170317f55 And the court agreed with FOA.
Specifically, the judge has ordered BLM to comply with requests from FoA to determine whether: (1) the removed horses can be returned to the Three Fingers HMA after post-fire restoration has been completed; (2) unburned portions of the HMA can support additional horses; (3) fencing is a viable alternative to removal to protect the fire-damaged areas from wild horses; and (4) supplemental food and water can be provided to keep wild horses from returning to the fire damaged areas.
https://friendsofanimals.org/article/victory-lap-5/ Conclusions: BLM falsified and misrepresented the data concerning the Three Fingers wild-horse herd. BLM took advantage of the Cherry Road Fire to pull off an even-bigger removal-action in August 2016 than the one originally devised back in June of that year. BLM evaded completion of a proper environmental assessment. BLM ginned up the numbers to justify removing more horses or to pay the contractor as if a certain agreed-upon number had been removed, whether that many were removed or not. The secrecy in which BLM conducted the action prevented public oversight. 11. Management by Removals to Increase Revenues Removals are BLM's stock-solution to every problem it invents with regard to the wild horses under its care. BLM's reactions to the Soda Fire (which did not affect the Three Fingers HMA) and to the Cherry Road Fire (which impacted only a part of the HMA) evidence that BLM practices management-by-removal-only. BLM ignored the several options available to it as featured its Fire Plan. BLM falsified the population-data to make it appear as if the herd had grown at a prolific rate, seeming to require a massive cull. And BLM mischaracterized what was actually limited damage to the range from the Cherry Road Fire and misrepresented that burn-area as requiring the immediate removal of most of the herd on an "emergency" basis. BLM does not follow an honest management-model but a fraudulent, self-interested one. BLM has consistently inflated the herd's numbers in order to justify costly culls, conducted by contractors. The more expensive the better, because the higher the costs, the higher the administrative fee BLM reaps. BLM is thus-incentivized to find an overpopulation to prompt a cull to increase revenue, and thereby to protect positions and paychecks. Culls are the means whereby BLM gets more money to "manage" the program. However, this is not management. Rather, it is malfeasance. 12. Yes, There Is a Conspiracy against the Wild Horses The reader may still feel a bit skeptical. Perhaps the discrepancies cited herein are confined to just this particular BLM office or to a few "bad apples" in the system. If only that were the case. Please consider the crimes below. There are many others, current and historical.

76
First, falsified figures regarding wild-horse herd populations have been found to contaminate the data across many herds in every state that has wild-horses. In fact, the discrepancies uncovered in the Three Fingers data are not among the worst. Below are just a few examples of one-year herd-growth figures that BLM has officially reported. Also included is an explanation of how many foals each filly and mare would have to have birthed to achieve the growth BLM had reported for one of the herds featured:
235% — 47 times the norm — Bible Springs — UT 237% — 47 times the norm — Great Divide Basin — WY 256% — 51 times the norm — Beatys Butte — OR 256% — 51 times the norm — Choke Cherry — UT ** 260% — 52 times the norm — Shawave Mountains — NV 293% — 59 times the norm — Diamond Hills South — NV 317% — 63 times the norm — Jackies Butte — OR 418% — 84 times the norm — Black Rock Range East — NV 522% — 104 times the norm — Salt Wells Creek — WY 525% — 105 times the norm — Carracas Mesa — NM 1,218% — 244 times the norm — Centennial — CA 1,257% — 251 times the norm — Carter — CA
** BLM claimed the Choke Cherry population grew from 43 horses to 153 horses in one year, an increase of 110. If so, to overcome foal-mortality (average: 50%) and adult mortality (at least 5%), each filly and mare would have to have given birth to 10 foals that year.
Second, a comprehensive report was recently issued following a 5-year investigation conducted by Wild Horse Freedom Federation. It revealed that BLM has been publishing fictitious figures regarding the number of wild horses removed from the range that are now allegedly boarded on private ranches. However, the numbers of captive horses independently verified at pasture do not agree with the numbers for which BLM is reimbursing the contractors. Where are those missing horses? http://wildhorsefreedomfederation.org/white-paper/ Third, during the administration of DOI Secretary Salazar — infamous for his equid cleansing campaign — BLM staff improperly sold 1,700 wild horses to a neighbor-buddy of the Secretary. The buyer-in-question admitted that he had falsified his application-form and knowingly sent the wild horses to slaughter. Not long thereafter, Salazar resigned, following an incident wherein he threatened to punch the reporter that broke the story. The Inspector General's report can be accessed at the link below. The second link is to a news-report about the Secretary's threat against the journalist. https://www.doioig.gov/sites/doioig.gov/files/WildHorseBuyer_Public.pdf https://www.politico.com/blogs/politico44/2012/11/witness-salazar-threatened-colorado-reporter-149402 Fourth, unethical behavior goes way back in the Wild Horse Program. For instance, in 1997, the Associated Press published an exposé on the sale of hundreds of wild horses to slaughter. And who were the parties selling them, contrary to law? Turned out, they were BLM personnel,

77
who had pretended to "adopt" the horses. Those dishonorable government employees — more than 200 of them, plus family-members and friends — were misusing their positions, breaking the law, and personally profiting from blood-money. http://www.igha.org/BLM3.html 13. Management by Running a Breeding Program Ironically, while BLM practices a benighted management-model via culls, it also becomes inappropriately hands-on where it should be hands-off — deciding which horses to remove and which horses will remain free. Screen-page 4 of the 2011 EA identifies BLM's objectives for managing the Three Fingers herd. The specific goals include "enhancing and perpetuating special and unique characteristics that distinguish the herd." Screen-page 6 advises that horses to remain in the herd "would be selected to maintain a diverse age structure, herd characteristics and body type (conformation)." Such anthropocentric "management" is antithetical to the spirit and letter of the Act, which stipulates "minimal feasible management" of wild horses. BLM interprets the Act perversely to interfere with and frustrate Natural Selection. Decreeing which horses shall remain free based on certain preferred traits reflects poor management practices. Injecting them with a sterilant-pesticide further works against what is supposed to be a self-sustaining herd by inadvertently selecting for low immune-function, among many other adverse effects. Gelding some of the stallions (one of the alternatives considered in the 2011 EA) has been shown not to reduce the birth rate; however, it does reduce male-line genetic diversity, which is in steep decline already. 14. Genetic Status Report Was Not Included Dr. Cothran's report was not attached to the 2011 EA. BLM provided only its own assurance, found on screen-page 10, that genetic diversity has been maintained ... by introducing stallions from other herds.
Stallions from other herds with similar characteristics have been periodically introduced into this HMA to help ensure genetic diversity. Baseline genetic diversity samples were taken in 2002. These samples indicate that genetic variability within the Three Fingers HMA is high and the herd appears to be of mixed origins. In comparison with other Oregon herds, the Three Fingers herd shows closest resemblance to the Paisley herd which reflects similar, diverse origins.
Two problems jump out: First, having to translocate horses from other HMAs reflects BLM's failure to manage the Three Fingers horses as a self-sustaining herd. The obvious reason why the herd could not — and cannot — self-sustain is the inadequate population to which BLM restricts it. Second, introducing stallions is not the recommended approach. Few stallions — maybe only 10% — ever secure bands of their own. Thus, most do not contribute to the gene-pool. Translocating mares has a better chance of yielding the intended results. On screen-page 26 of the EA, BLM does state its intent to introduce non-endemic mares henceforth, when genetic monitoring indicates the need to increase diversity. However, the true solution is a robust population-size so the herd can be self-sustaining rather than teetering on the brink of collapse, dependent on BLM to save it.

78
Although BLM omitted previous genetic-status reports from the EA, an Internet search retrieved some data that was part of the NAS report of 2013. At the link below, you will find this information, which I have endeavored to extract and reassemble here from a chart found on screen-page 157. The data appear to correlate with DNA samples drawn in the 2011 gather. Caveat: BLM often takes DNA samples from horses that are removed from the range rather than from horses that are returned to the range. Because the herd is reduced drastically by BLM's culls, the remnant horses are likely not genetically-diverse-enough. Going forward, diversity is limited by the sparse population. Please note that Dr. Cothran's report is typically completed several months after a gather — too late for remedial action.
HMA ST N Yr Sampled AML Three Fingers OR 50 2011 150 Cothran Ha Ho Fis MNA Report Date
0.710 0.753 0.058 7.25 04/30/12
https://www.nap.edu/read/13511/chapter/7#157 15. Supposed Potential Competition with Bighorn Sheep On screen-page 11 of the 2011 EA, BLM noted:
The steeper "badland" topography near the Owyhee Reservoir, including the area burned, and the main side canyons provide important habitat for a herd of California bighorn sheep. ... A major concern in the Three Fingers HMA is competition for winter forage and summer water at the few natural springs in the area between bighorn sheep and wild horses.
BLM loves to see conflict where there is none, and to penalize the wild horses to accommodate, in this case, so-called California Bighorn sheep. The latter descend from Canadian imports brought in to restock the area because native bighorn had been "eliminated," as discussed in the link below. https://defenders.org/bighorn-sheep/basic-facts Contradicting BLM's unsupported claim of competition between bighorn and wild horses, Wockner, Singer, and Schoenecker (2004) reported:
Two studies have been conducted that have shown no obvious, convincing competition between the two species. A study of diets and habitats of both species revealed substantial diet overlap only during some seasons, but there were considerable spatial and habitat separations between wild horses and bighorns during all seasons (Kissell and others, 1996). (Emphasis added.)
79
Schoenecker, compiler (2004) also reported:
Although competition in the past is difficult to decipher, our data suggested no obvious negative effect of horse grazing or the presence of wild horses on bighorn sheep. Bighorn sheep demographic patterns did not differ between the wild horse-bighorn sheep and bighorn-only areas. We found no differences in pregnancy rates, lambing rates, or lamb survivorship in bighorn sheep inhabiting areas on versus off the wild horse range (pregnancy rate of ewes (± s.e.) was 77 ± 4%, and lambing rate was 68 ± 5%, overall), although our sample sizes were small. This finding is in general agreement with those of Kissell and others (1996) and Coughenour (2000), who found little overlap in use of resources. Kissell and others (1996) and Coughenour (2000) found considerable spatial and habitat separation. Even where habitats were shared, diets tended to be largely different between the two species. (Emphasis added.)

80
APPENDIX F: ANALYSIS OF BIG SUMMIT WILD HORSE TERRITORY
Date: March 9, 2018 To: Craig Downer Fr: Marybeth Devlin Re: Oregon — Big Summit WHT in Ochoco National Forest As requested, here is the analysis of how the US Forest Service manages the Big Summit Wild-Horse (WH) Herd versus how the agency administers livestock-grazing within the mustangs' dedicated habitat — a wild-horse territory. 1. Current Size of the Big Summit Wild Horse Territory (WHT) Per the Webpage maintained for the Big Summit herd by the US Forest Service, the size of the WHT is: Total acres: 27,300 ≃ 43 square miles ( 42.7 square miles )
https://www.fs.usda.gov/detail/ochoco/specialplaces/?cid=fseprd488281 2. Slated-to-Be-Reduced Size of the Big Summit WHT Per Proposed Action #2 of the Plan Revision Project Environmental Impact Statement (EIS), the WHT would be reduced by 325 acres. (See Item #19 , below.) With that change, the size of the WHT would then be: Total acres: 26,975 ≃ 42 square miles ( 42.2 square miles ) 3. Arbitrary — and Austere — Management Level (AML) The AML's range is narrow: 55 to 65 wild horses. Only 10 slots separate the high end from the low end of the range. This suggests an unrealistic and severe management approach could be imposed, were it not for the strong local advocacy group: Central Oregon Wild Horse Coalition. The high-bound of the AML — that is, the number of wild horses above which USFS could declare the Big Summit herd to be "overpopulated" is:
High-AML: 65

81
Acres / WH: 420 ≃ 2/3 of a square mile ( 66% of a mile2 ) / WH
The low-bound of the AML, down-to-which USFS could reduce the Big Summit herd is: Low-AML: 55 Acres / WH: 496 ≃ 3/4 of a square mile ( 78% of a mile2 ) / WH 4. Animal Unit Months (AUMs) in the WHT — for Wild Horses The numbers of monthly grazing slots — AUMs — that correspond to the respective low-and-high bounds of the Big Summit herd's AML are:
At low-AML 55 = 660 AUMs At high-AML 65 = 780 AUMs
5. Most Recent Population-Figures for the Big Summit Herd The Central Oregon Wild Horse Coalition (COWHC) coordinates the volunteers that conduct the annual census. Gayle Hunt, President of the Coalition, characterizes the population as "static." It fluctuates, but not by very much. Page 2 of the Scoping Letter to the Plan Update and Revision advises that the herd-population over the years 2013 to 2016 ranged from 110 to 152 wild horses. The average was 126. Per Ms. Hunt, below are the three most recent years' census-results. The corresponding stocking-density in each case is also provided: 2015 Wild Horses 152 Acres / WH: 180 ≃ 1/4 of a square mile ( 28% of a mile2 ) / WH 2016 Wild Horses 122 − 20% Attributed to winter-kill. Acres / WH: 224 ≃ 1/3 of a square mile ( 35% of a mile2 ) / WH 2017 Wild Horses 135 up 11% from 2016, but down 11% from 2015 Acres / WH: 202 ≃ 1/3 of a square mile ( 32% of a mile2 ) / WH

82
The 2015 total is the one cited on USFS' Big Summit Webpage. It is also the highest of the last three inventories. The reader is likely to conclude, incorrectly, that a census must not have been conducted in 2016 or in 2017, and that the population could have grown. In truth, the herd was inventoried both years and its population has declined overall since 2015. https://www.fs.usda.gov/detail/ochoco/specialplaces/?cid=fseprd488281 Ms. Hunt's 2015 narrative report is also embedded on that Webpage. The link below will take you directly to her report without having to visit that page first. https://www.fs.usda.gov/Internet/FSE_DOCUMENTS/fseprd488559.pdf In June 2017, USFS announced it would double its wild-horse census-efforts, calling for volunteers to participate in the inventory that was to be conducted the following month. These counts are performed on the ground, as opposed to the usual aerial method.
http://www.ktvz.com/news/ochoco-natl-forest-doubles-wild-horse-monitoring/529495671
6. Genetic Status of the Big Summit Herd Page 3 of the Scoping Letter to the Plan Revision Project states that the Big Summit herd's genetic-status reports for 2010 (Cothran) and 2011 (Mills) showed low genetic diversity. These results are not surprising because the number of horses is below minimum-viable population (MVP). And what is the MVP? While the answer varies depending on whom you ask, the MVP is way-more than the paltry number that USFS begrudges the wild horses in their own habitat. BLM's contract-geneticist Cothran recommends an MVP of 150 to 200 horses. Further, the MVP is not an optimum number but a minimum number. A robust population, well-above MVP, is needed if only to ensure against stochastic events. Thus, proper management would not keep the herd on the brink of genetic collapse. The AML must not be set for administrative convenience or to accommodate commercial interests to the detriment of the horses' long-term survival. Further, please note that Big Summit is geographically isolated from other wild-horse herds. Then consider one of the cautionary statements issued by the BLM-convened Wild Horse and Burro Population Viability Forum:
Smaller, isolated populations (<200 total census size) are particularly vulnerable when the number of animals participating in breeding drops below a minimum needed level.

83
Coates-Markle L. (2000) Summary Recommendations, BLM Wild Horse and Burro Population. Viability Forum April 1999, Ft. Collins, CO. Resource Notes 35: 4 pp. Retrieved from http://www.blm.gov/nstc/resourcenotes/rn35.html
Big Summit's population is significantly lower than 200 and, worse yet, the herd's mares have been injected with the pesticide-sterilant PZP. [ Discussed below, in Item #12. ] While it is obvious that the Big Summit herd's population is inadequate per the above standards, the International Union for the Conservation of Nature (IUCN) recommends an MVP of 2,500 for wild-horse herds. While that many may not be feasible in the Big Summit WHT, USFS can certainly do much better by the wild horses than the current management-level. The IUCN pointed out in its report:
The animals' ability to adapt to harsh conditions is a justification for their preservation. ... [T]he selective pressures they have endured in the wild are likely to be shaping them genetically, producing hardier stock which may prove a useful genetic resource. http://data.iucn.org/dbtw-wpd/edocs/1992-043.pdf
That potential to be a genetic resource may be especially true of the Big Summit herd. Please read on. 7. Harsh Conditions and Marginal Forage, but the Wild Horses Thrive The US Forest Service provides an online brochure that describes the rugged Big Summit Wild Horse Territory and the sturdy mustangs that inhabit it. On the topic of "Survival," USFS has this to say:
The Big Summit wild horse is the product of generations of survival of the fittest in the often harsh mountain conditions. They possess stamina and endurance, can subsist on marginal forage conditions, and have developed a sound hoof that tends to leave a perfect track, even in extreme terrain. These traits contribute to the Ochoco wild horse's outstanding ability to pack an elk or travel tirelessly up a steep trail. [ Emphasis added ] https://www.fs.usda.gov/Internet/FSE_DOCUMENTS/stelprdb5299975.pdf
8. Recent Roundup-and-Removal History for the Big Summit Herd The last cull was in 2010 although, reportedly, USFS keeps threatening to hold another.

84
A 2015 news-article regarding the upcoming EIS provided a graphic that showed the then-recent capture-statistics, 2002 through 2010, for the Big Summit herd. The data were credited as having been sourced from the Ochoco National Forest. The narrative indicated that most of the rounded-up horses were put up for adoption. Were others returned to the Forest? It does not say.
http://www.bendbulletin.com/localstate/environment/3651186-151/ochoco-national-forest-revamping-wild-horse-plan
http://www.bendbulletin.com/csp/mediapool/sites/dt.media.BlobServ.cls?part=nativeFile&value=4565577&table=dt_newsmedia.HighRes1&column=fileheaderId
The above data indicate that 63 horses were removed over the 9-year period, for an average of 7 horses a year. Per Ms. Hunt, the 2009 cull resulted in the death of 2 of the 4 wild horses captured: 1 filly, and 1 colt that died following castration. That was a 50% fatality rate. The contractor was Cattoor. Ms. Hunt further reports that, in 2010, USFS had agreed to limit the cull to bachelor-studs only and to leave intact family-bands alone. You guessed it — USFS removed the families. COWHC demanded that the USFS bring the wild-horse bands back to the Forest. And USFS did just that — it returned the bands back to Big Summit.

85
9. False Assumption regarding a 20% Herd-Growth Rate Screen-page 2 of the 1975 Herd Management Plan reported an average herd-growth rate of 8%. However, page 3 of the 2017 Scoping Letter assumes a "20%" annual herd-growth rate, citing the 2013 National Academy of Sciences report. It is unlikely that the herd's growth-rate would have changed so drastically. Further, what USFS did not know is that BLM, which commissioned the NAS study, rigged the results to support its false narrative. It did so by withholding data, by providing incomplete data, by discarding source-data, and by requiring the researchers to base their conclusions on its falsified data. The NAS scientists complained — in writing, in the report itself — that BLM had apparent difficulty in meeting data-requests from the committee. Many of the records provided were incomplete. Indeed, BLM claimed to have disposed of population-statistics documents, which prevented the researchers from tracing data-discrepancies to their source. Further, these problems were not new. Many of the same issues had been identified by the National Research Council Committee on Wild and Free-Roaming Horses and Burros, which reviewed similar records near the start of the Wild Horse and Burro Program over 30 years ago (NRC, 1980, 1982). 10. Why 20% Cannot Be the Correct Herd-Growth Rate First, please keep in mind that the birth rate and the population-growth rate are different measures. To determine the growth rate, the birth rate must be reduced by the death rate. But BLM conflates the birth rate with the growth rate, improperly using the birth rate as the growth rate. So, let's see how that erroneous approach would play out. According to BLM, there were 25,300 wild horses and burros on the range in 1971. (The real number is widely believed to have been higher.) Here is how BLM's figure — 25,300 — would have increased over the 47 years since 1971 per a herd-growth rate of 20%, compounded, with the number rounded:
133,000,000 BLM reports that it removed nearly 258,000 mustangs over that 47-year period — 240,974 during the years from 1971 to 2012, and 17,016 from 2013 to date. If so, then there should still be well-over 132,000,000. Because the mustangs number in the thousands and not in the millions, BLM's constant refrain — that wild-horse herds multiply by 20% annually — is, therefore, a greatly-exaggerated, non-supportable falsehood.

86
11. The Normative Herd-Growth Rate Is No More Than 5% Gregg, LeBlanc, and Johnston (2014) conducted a definitive study on wild horse demographics using BLM's own data. They reviewed the records of 4 representative herds with a combined population of 5,859 wild horses. Their analysis revealed the average birth rate to be just under 20%. However, their analysis also disclosed that 50% of foals perish before their first birthday. Hence, the birth rate is just a temporary blip in the data, and the normative population-gain from surviving foals is 10%. However, wild horses other-than-foals also die. Because the subject study did not look at that aspect, we must turn elsewhere. BLM reports a 5% annual mortality rate for horses taken off the range and maintained in short-term holding. We will use that off-the-range death rate as a conservative proxy for the on-the-range death rate for adult wild horses. Procedure: Starting with the 10% net population-increase from surviving foals, we subtract the 5% loss of horses other-than-foals, which yields an average herd-growth rate of 5%. 12. Porcine Zona Pellucida (PZP) — Has Been Used on the Herd The Central Oregon Wild Horse Coalition, although reluctant to have the Big Summit fillies and mares injected with the pesticide-sterilant PZP, hoped it might save the wild horses from suffering the brutality and disruption of roundups. COWHC negotiated an agreement with USFS that 10 mares would be treated. What actually happened? USFS staff reported, excitedly, that 23 mares had been injected with PZP. The shamelessness with which USFS staff revealed their treachery was astounding. The records, however, did not support USFS' account. Instead, it appeared that 18 mares had been double-dosed, and some may even have been triple-dosed. COWHC cites USFS' betrayal of the agreement and the sloppy recordkeeping as reflecting the freedom from accountability that USFS enjoys and in which USFS maneuvers. 13. USFS' Approach to Managing Wild Horse Territories Below is the link to the USFS Webpage where the Agency lists six primary responsibilities for administering the WHTs. For convenience, provided herein is an abbreviated version. Item "c" is highlighted because USFS seems to "get it" that management activities are supposed to be at the minimally-feasible level — meaning, with as little intervention as possible, an approach which would also result in low management-costs.
a. Protect the horses

87
b. Maintain a TNEB c. Manage activities at the minimally feasible level d. Keep inventory e. Remove excess animals to AML f. Transfer title to adopters after 1 year
https://www.fs.fed.us/wild-horse-burro/aboutus.shtml
14. Big Summit Herd Management Plan — 1975 — Still in Effect At the link below, you can access the 8-page Ochoco Wild & Free Roaming Horse Management Plan. The Plan is worth a read to understand USFS' thinking at the time. Some excerpts-of-note:
The first horses on this range originated approximately 50 years ago according to local residents. ... The horses established their territories on and around Round Mountain, and have since that time been kept at approximately 60 head by local horse chasers, natural deaths and predators. When the ... Act was passed in December of 1971, the horse chasing ceased and since that time we have had a yearly increase of approximately 8% in the herd. [ screen-page 2; emphasis added ]
The horse range encompasses portions of two sheep allotments (Canyon Creek and Reservoir) for a total of 27,300 acres. At this time there is no conflict between the uses .... [ screen-page 3; emphasis added; 100% overlap ] We will not go into any type of sophisticated breeding program. We do not plan to favor certain genetic strains over others. Natural selection will be our goal. [ screen-page 5; emphasis added ] We do not plan to substitute studs from the horse bands with studs of different breeds, or studs from different areas. This would involve us in a breeding program which is not needed. [ screen-page 5; emphasis added ]
https://www.fs.usda.gov/Internet/FSE_DOCUMENTS/fseprd486907.pdf
15. Environmental Analysis Report (EAR) — Issued April 4, 1975 The 20-page EAR was issued at the same time as the original Horse Management Plan. The underscored purpose of the EAR, presented by the authors on screen-page

88
5, appeared to reflect their reluctance and resentment at having to make room for a relatively-few wild horses. Never mind that the Act requires the wild horses to receive the principal benefit of their designated habitat. To wit:
The objective will be to estimate a range of feral horse management intensity that we feel is compatible with other resource uses and meets the intent of multiple use — Sustained Yield Act of 1960 and the Wild Free-Roaming Horse and Burro Act of 1971.
Throughout the EAR, repeatedly and recalcitrantly, the authors referred to the wild horses as "feral," revealing a negative bias. The authors' deliberate substitution of the word "feral" in place of the correct word "wild" displayed a dismissive attitude toward the Act. Screen-pages 10-11 tell us who then-used the area that became the WHT:
The greatest use by far is by deer and elk hunters, who often come to camp and stay through hunting season.
Further-down on screen-page 11, we learn ...
There is a hunter camp and fishing area located in the southeast corner of Section 35 and southwest corner of Section 36 on Howard Creek. The horses do come down to this area, however, that is on an irregular basis since they will usually not go to an area where they are likely to be harassed. [ Emphasis added ]
USFS' statement-above in the EAR, an official document, shows that hunters were known to persecute the wild horses. Why was this illegal activity tolerated? Why were the horses — forest-resources — chased out of their habitat by hunters — forest-users? Did USFS' condoning of the harassment not constitute dereliction of duty? Does this not further-evidence lack of accountability? How amazing that USFS boldly reported that it apparently did not enforce regulations meant to protect the wild horses, although required by law to do so. Screen-pages 12-13 discussed grazing management. Please see Item #18, where this topic is specifically addressed. Screen-page 15 listed 7 mining claims that are either within the WHT or "on the fringes" of it. Further-down screen-page 15, the EAR again addressed how the wild horses reacted to being harassed, a discussion which seemed to reflect USFS' acceptance of such abuse:

89
When harassed they merely go into the dense thickets or steep canyons until the intruders leave, and then return to their regular feeding areas. They do not "scare away" to remain gone for long periods from their feeding areas, but usually return within a week ....
Screen-page 16 described the defensive behavior band-stallions exhibit when they become aware that a human is following them. Whether such actions constitute normal behavior, or whether it is the result of earlier harassment, is not addressed.
Once the stallions discover that they are actually being followed they all act nervous and excited, stamping, snorting and occasionally nickering as they try to move the band. When the band is on the move, the stallion does not always move with them, but periodically moves away from the rest in semi-circles at approximately 500 feet as though making an attempt to draw attention to himself, and away from the band. [This is exactly what I witnessed. See my earlier observations. – CCD.]
Further-down screen-page 16, USFS heaps blame on those 60 wild horses that then-inhabited the WHT's 27,300 acres for damage to soils, claiming that the horses' impact was much greater than the thousands of sheep that overran the same area. Screen-page 17, however, acknowledges that the wild horses do benefit the commercial sheep that share the WHT. By eating the roughage, the Big Summit wild horses make more green sprouts available to the sheep. Screen-page 18 makes USFS' case for why the wild-horse population should be restricted to 55-65. No, the primary reason given is not because of limited forage or water but rather, the EAR claims, because the stallions had already staked out their respective territories. USFS worried that, if the herd were larger, " ... stallions would split off from existing herds and establish new ranges outside the existing feral horse territory." [ Ms. Hunt advises that, when wild horses do wander outside the boundaries of the WHT and onto allotments, they are often shot. ] Further-down on screen-page 18, the EAR complains about soil-compaction which, it implies, is caused by wild horses. However, the text goes on to admit that the soils-in-question were previously disturbed "through logging." Interestingly, on screen-page 19, the EAR states that the then-current (1975) population — 60, per screen-page 11; but 59, per screen-page 12 — had not increased appreciably since December 1971. Fast-forward to 2018, when Coalition President Gayle Hunt describes herd-growth as "static." 16. March 2011 — 3 Big Summit Wild Horses Shot, Yearling Orphaned

90
The article linked below was reposted by Straight from the Horse's Heart from a news-segment broadcast by Bend, Oregon television station and NBC-affiliate KTVZ. It reported that three wild horses from the Big Summit herd had been found shot dead. The deceased included a mare and two stallions. The mare's yearling kept nudging her, trying to get her to her feet. Disturbingly, this was not the first time the Big Summit wild horses had come under attack, which could very well explain why these horses behave skittishly and defensively, and why they flee when they encounter humans.
As a member of the Central Oregon Wild Horse Coalition, Krista Lee hung posters around Prineville, asking for the public’s help in finding whoever shot the horses. ... What makes Lee even angrier is that this is not the first time an attack like this has happened. Since 2002, Lee said there have been similar attacks in the area. “Anywhere from one to three horses being killed per time,” said Lee. “And they’re still doing it.” [ Emphasis added ]
https://rtfitchauthor.com/2011/03/18/three-wild-horses-shot-dead-in-oregon-foal-orphaned/ Recall, too, that the 1975 EAR referenced that the wild horses were subject to harassment in certain areas of their own habitat. Further, as Ms. Hunt advised, wild horses that wander off the WHT and onto grazing allotments are subject to being shot or, at least, shot at. If they survive the attack, the horses will surely be wary of humans henceforth. 17. October 2013 — 6 Big Summit Wild Horses Discovered Shot According to the article linked below ...
In October 2013, six horses from the herd were found shot, five were dead and one was so badly wounded it was euthanized, all near Big Summit Prairie. The case remains open, according to Ochoco National Forest and Forest Service law enforcement officials.
http://www.bendbulletin.com/localstate/3651186-151/ochoco-national-forest-revamping-wild-horse-plan
The fact that such shootings keep occurring in the same area again and again over many years suggests that one or more local individuals are the perpetrators.

91
18. Forage Allocation in the WHT for Livestock, Wildlife, Wild Horses As mentioned in Item #15, screen-pages 12-13 of the 1975 EAR discussed grazing management in the WHT. There were — and apparently still are — two allotments but only one permittee. Both allotments are dedicated to sheep-grazing, and together they encompass 100% of the Big Summit WHT. In keeping with its anti-horse attitude, the EAR describes "the feral horse range" as being located on the sheep-allotments rather than the allotments being located on the WHT. Identified below are the subject allotments: Allotment Allotment Name Acres Season of Use Duration Number 5 Canyon Creek 20,000 Jun 15 - Sep 30 108 days 19 Reservoir 7,300 Jun 15 - Sep 30 108 days To view the map showing the boundaries of these grazing allotments, left-click once then left-double-click on the shortcut-link below. When the access-box appears, click on "open." At that site, you will be able to enlarge the map sufficiently to find Allotment Numbers 5 and 19, which are, of course, contiguous.
USFS estimated that the 27,300 acres produce 300 pounds of air-dry forage per acre, for a total of 8,190,000 pounds per year. However, 5,486,225 pounds of that amount were excluded, as follows: 927,000 pounds — for "aesthetics" 4,095,000 pounds — that were (and may still be) inaccessible 464,225 pounds — that were (and may still be) available, but not being used ---------------------------------------------------------------------------------------------------------- 5,486,225 pounds — Roll-up The then-available remaining forage was apportioned thusly:
Pounds of Forage Species Percentage 278,400 Deer 10.3%

92
109,500 Elk 4.0% 1,523,875 Sheep 56.4% 792,000 W. Horses 29.3%
-------------------------------------------------------- 2,703,775 Roll-up 100.0% Focusing on the percentage-allocations between sheep and wild horses ...
Pounds of Forage Species Percentage 1,523,875 Sheep 66% 792,000 W. Horses 34%
-------------------------------------------------------- 2,315,875 Roll-up 100% https://www.fs.usda.gov/Internet/FSE_DOCUMENTS/fseprd486908.pdf It is revealing to look at the average weight per animal per species, how much forage they are known to consume, and how much USFS has allocated to them. Species Range of Weight Weight Used Here for Comparison Deer — mule deer 95 to 330 lbs. 200 lbs. Elk 500 to 730 lbs. 600 lbs. Sheep 100 to 350 lbs. 200 lbs. Big Summit W. horses 800 to 1,000 lbs. 1,000 lbs. AUM = 26 pounds of dry forage per day AUM = 9,490 pounds per year
Species Comparison AUM per Pounds of Weight Animal Forage / Day / Animal Deer 200 lbs. 0.2 5.2 Elk 600 lbs. 0.6 15.6 Sheep 200 lbs. 0.2 5.2 WHs 1,000 lbs. 1.0 26.0

93
Pounds of Species Population Days of Pounds of Forage in 1975 Grazing Forage / Day / Allocated Animal 278,400 Deer 232 365 3.3 = 37% lower 109,500 Elk 20 365 15.0 = 4% lower 1,523,875 Sheep 2,200 108 6.4 = 23% higher 792,000 W. Horses 60 365 36.2 = 39% higher ! First, there is no telling why USFS allocated a lower amount of forage to deer than would be required. The deer-in-question are identified as mule deer, not a smaller species. The forage-allocation for elk is not too far off the mark. It is understandable why USFS would estimate the forage-use of sheep higher than their average weight would suggest they consume. That is because although 1 AUM covers the grazing of 5 sheep per month, what "5 sheep" actually means is "5 ewes and their lambs." Also, please note that ewes typically birth twins and, sometimes, triplets. So, each-such grazing-unit would likely need more forage. Instead of 2,200 sheep, the population is likely 4,000 or more individual sheep-animals, when lambs are factored into the equation. There is no reasonable explanation for why the wild horses would require significantly more forage than normal. Even though the midpoint weight of the WHT horses is 900 pounds — or 0.9 AUM — I assessed them-each a full AUM for comparison-purposes. However, because both BLM and USFS unfairly count foals as if they were adults, true forage-consumption is likely way-less than 26 pounds per wild horse, on average. It's certainly not 36 pounds. Moreover, as USFS admitted in the 1975 EAR, the wild horses graze down the roughage — the dry, coarse, old-growth forage — which frees up the new shoots that the sheep prefer. Wild horses thrive on what ranchers would deem poor-quality forage. They don't need more of it because they are what's known as "easy keepers." So why did USFS gin up the wild horses' alleged forage-use? Given USFS' evident bias against the horses, it would seem the intent was to falsely portray them as having a heavy impact on the forage-resource. The Truth is the opposite. Further, and most importantly, by consuming the dry roughage, the wild horses reduce the risk of wildfires — yet another tremendous benefit to the Forest and to the local community. It should further be noted that the 792,000 pounds of forage that USFS allocates per 60 horses would easily feed 83 wild horses. Moreover, the 464,225 pounds of unused forage would support another 49 wild horses. In addition, the 4,095,000 pounds of forage that USFS declared "inaccessible" could sustain 432 more wild horses. Obviously, the Big Summit WHT can support a much-higher wild-horse population. There would still be 927,000 pounds of forage left over for aesthetic purposes.

94
Meanwhile, let's examine the issue of sheep-grazing. Per market-indicators, USFS should consider reducing the amount of forage allocated to sheep in the WHT. The most-recent report issued by USDA — parent-agency to USFS — concerning the sheep-industry addressed the continuing decline in that sector. Sheep-numbers in the US have plummeted, from a high of 51 million ... in 1884 (yes, 1884) to 5 million in 2016. That's a 90% drop. https://www.ers.usda.gov/topics/animal-products/sheep-lamb-mutton/sector-at-a-glance/ While it is understandable that USFS would want to provide the sheep-grazing permittee as many AUMs as they can, that begs the question: Is propping up a dying business-sector — enabling it to limp along, when otherwise it would fail — a wise thing to do? Ironically, the sheep-ranchers' desire to cling to their lifestyle works against their own economic interests. Change is happening in all sectors of the economy. Economic trends point to a burgeoning, highly-lucrative recreational sector to which the local economy could transition. And in such a market, the Big Summit wild horses would be a huge asset, a resource, a tourist-draw. In areas where marketing has promoted wild horses, visitors come specifically to see them ... and spend their dollars at local businesses. Further, if the herd were managed according to Reserve Design principles, that would add educational and scientific components to the mix — special features that would be even more of a tourist-magnet. Congress might well be persuaded to increase funding to carry out the enlightened management-model that Reserve-Design offers, and animal-advocacy organizations would surely be willing to provide grant-money for pilot-projects. 19. USFS Gearing Up for Environmental Impact Statement (EIS) The USFS' Herd Management Plan for the Big Summit WHT has not been updated since 1975 — yes, 43 years ago. In 2015, USFS announced it would start holding monthly meetings of a "stakeholder involvement group" regarding updating the Plan.
https://www.fs.usda.gov/detail/ochoco/news-events/?cid=FSEPRD479058
https://rtfitchauthor.com/2015/11/06/ochoco-national-forest-revamping-wild-horse-plan/
In June 2017, USFS published, in the Federal Register, a Notice of Intent (NOI) to prepare an EIS.
https://www.federalregister.gov/documents/2017/06/21/2017-12951/ochoco-national-forest-lookout-mountain-ranger-district-oregon-ochoco-wild-and-free-roaming-herd
Then, in July 2017, USFS Ochoco National Forest's Lookout Mountain Ranger District initiated the plan's formal renewal / revision process by conducting a scoping period.

95
The EIS' projected completion-date is September 2018.
https://data.ecosystem-management.org/nepaweb/nepa_project_exp.php?project=46228
https://www.fs.usda.gov/nfs/11558/www/nepa/100829_FSPLT3_4035983.pdf
The NOI and the Scoping Letter identified seven key decisions to be made to the Herd Management Plan via the EIS. Briefly, those are:
1. Whether the current AML which, we learn, the Resource Management Plan (RMP) apparently set at a maximum of 60, is still valid in order to achieve a TNEB and a multiple-use relationship. USFS states that the limiting factors are winter-forage and space. If 60 were affirmed as the maximum herd-size, any horses above that number would be deemed "excess" and subject to removal. Comment: If winter forage really were the limiting factor, then it would be due to the thousands of sheep that intensely graze the WHT during the peak growing season, leaving behind only stubble for the wild horses to subsist on during the Winter. As discussed earlier in this report, the sheep-business is in decline. USFS should seize the opportunity to free up AUMs for the wild horses to reach MVP, thereby protecting genetic diversity. In fact, because the sheep-sector is dying, there may already be numerous unused sheep-AUMs that USFS can reassign to the wild horses. As for space, the WHT has enough acreage to accommodate an MVP-compliant herd-size. 2. Correct the Territory boundary map to remove private land that was mistakenly included in the original Territory map; this would revise the Territory acres to 26,975, as opposed to 27,300 acres as described in the original Environmental Assessment. [ Emphasis added ] Comment: Going forward, the WHT would be 325 acres smaller. However, it is my understanding that wild horses were present in many areas that USFS failed to include in the original Big Summit WHT. Any boundary-map change must incorporate those areas. 3. Manage for genetic diversity ... by introducing new genes ... or by adjusting the sex ratio. [ Emphasis added ] Comment: The need to translocate wild horses from other herds to restore genetic viability would mean USFS had failed to manage

96
the wild horses as a self-sustaining herd. The fact that USFS would consider putting such a "tool" in its proposed plan exhibits both profound ignorance and an unwillingness to afford the Big Summit horses a proper population. Adjusting the sex ratio would have the contrary effect on genetic diversity, again reflecting ignorance and poor management-practice. 4. Implement methods to slow population-growth, such as by using PZP. Comment: Slowing population-growth is contraindicated. The Big Summit herd needs to be increased, not suppressed. 5. Develop emergency-response methods for dealing with ill, injured, or aged wild horses, or for public-safety issues. Comment: Translated, this means find any excuse to kill wild horses for political advantage or administrative convenience; or to kowtow to graziers, hunters, loggers, and miners. 6. Develop an off-forest facility to corral captured wild horses and offer them up for adoption. Comment: There should be no more removals until the herd's size grows to a level that is well-above MVP. 7. Amend the RMP if it is determined that an AML or AML-range different from the current one is needed. USFS then proceeded to throw up roadblocks — listing the many inconvenient steps — that would be involved in amending the RMP. Comment: USFS would do well to complete an Ecological Site Inventory (ESI) of the Big Summit WHT in conjunction with the EIS. An ESI would study the Territory by species — both plant and animal. Teams would be deployed to determine actual use — including trespass use. They would then prorate actual use by each animal species present, including lagomorphs, rodents and insects. Data-collection standards would be quantitative — measuring production and composition by air-dry weight (ADW) by species. An ESI would reveal current use and by whom. USFS should use the results to inform its decision-making.
20. Maps — Links to Maps that May Prove Useful to the Purpose At the link below, USFS lists most of the WHTs that it manages. However, although Big

97
Summit is shown on the map there-provided, it does not appear on the list. Consequently, there is no description of Big Summit and, perhaps, other WHTs.
https://www.fs.fed.us/wild-horse-burro/territories/index.shtml Below is the link to a graphic that accompanied an article on the upcoming Plan Revision. It is a map of the Ochoco National Forest with the WHT outlined. However, while you can get to the map by merely clicking on the link, you are blocked from copying the image on that page. If you wish to import the map-image to a document, copy and paste the same link in a browser. From there you can copy-and-paste the map into a document, if desired. There may be another way, but that's how I found success in doing it.
http://www.bendbulletin.com/csp/mediapool/sites/dt.media.BlobServ.cls?part=nativeFile&value=4565578&table=dt_newsmedia.HighRes1&column=fileheaderId
At the link below, you can access a color-coded map of the Big Summit WHT within the Ochoco National Forest. This map thus-identifies the areas of developed recreation, general forest, general forest winter range, Lookout Mountain Recreation Area, old growth, and visual management corridors. There are a lot of subtle color-shade-distinctions, however. Also, I do not know how to copy the image from a pdf file.
https://www.fs.usda.gov/nfs/11558/www/nepa/100829_FSPLT3_4051602.pdf Finally, below is the link to a map of Oregon showing the HMAs and WHTs in the state. Just east and north of Prineville, which is itself east and north of Bend, Oregon, you will find the Big Summit wild-horse habitat on the map below, marked "20." Find it in the upper left quadrant of the map.
http://themindfulhorsewoman.weebly.com/kiger_mustangs_oregon.html
Related Documents