REPORT of the FAO-APHCA Regional Workshop on Animal Feed Resources and their Management in the Asia- Pacific Region Bangkok, 13-15 August 2013 FAO Regional Office for Asia and the Pacific, 2013

Welcome message from author
This document is posted to help you gain knowledge. Please leave a comment to let me know what you think about it! Share it to your friends and learn new things together.
Transcript

REPORT of the FAO-APHCA Regional Workshop on Animal Feed Resources and their Management in the Asia-Pacific Region
Bangkok, 13-15 August 2013
FAO Regional Office for Asia and the Pacific, 2013

Disclaimer:
The designations employed and the presentation of material in this information product do not imply the expression of any opinion whatsoever on the part of the Food and Agriculture Organization of the United Nations (FAO) nor the Animal Production and Health Commission for Asia and the Pacific (APHCA) concerning the legal or development status of any country, territory, city or area or of its authorities, or concerning the delimitation of its frontiers or boundaries. The mention of specific companies or products of manufacturers, whether or not these have been patented, does not imply that these have been endorsed or recommended by FAO in preference to others of a similar nature that are not mentioned. The views expressed in this information product are those of the author(s) and do not necessarily reflect the views of FAO.
FAO encourages the use, reproduction and dissemination of material in this information product. Except where otherwise indicated, material may be copied, downloaded and printed for private study, research and teaching purposes, or for use in non-commercial products or services, provided that appropriate acknowledgement of FAO as the source and copyright holder is given and that FAO’s endorsement of users’ views, products or services is not implied in any way.
For correspondence, please contact:
Senior Animal Production and Health Officer and Secretary of APHCA FAO Regional Office for Asia and the Pacific (RAP) 39 Maliwan Mansion, Phra Atit Road Bangkok 10200, THAILAND E-mail: [email protected] FAO Homepage: http://www.fao.org APHCA Homepage: http://www.aphca.org

REPORT of the FAO-APHCA Regional
Workshop on Animal Feed Resources and their Management
in the Asia-Pacific Region
Bangkok, 13-15 August 2013
FOOD AND AGRICULTURE ORGANIZATION OF THE UNITED NATIONS
REGIONAL OFFICE FOR ASIA AND THE PACIFIC
Bangkok, 2013

i
TABLE OF CONTENTS
Background ........................................................................................................................................ 1
Feed assessments and balances .................................................................................................... 1
Linkages with other components of livestock development .......................................................... 1
Workshop objective ...................................................................................................................... 2
Workshop approach ...................................................................................................................... 2
Opening Remarks ............................................................................................................................... 3
Asia-Pacific Livestock Sector Trends ................................................................................................... 5
Importance and Role of Feed Assessments ........................................................................................ 9
Bangladesh Country Report ............................................................................................................. 14
Bhutan Country Report .................................................................................................................... 18
India Country Report........................................................................................................................ 23
Nepal Country Report ...................................................................................................................... 29
Pakistan Country Report .................................................................................................................. 34
Sri Lanka Country Report ................................................................................................................. 40
Indian Livestock Feed Portal – Features and Utility .......................................................................... 44
Balanced Feeding at Smallholders’ Doors ........................................................................................ 49
Use of Co-products of Biofuel Industries as Livestock Feed .............................................................. 53
Indonesia Country Report ................................................................................................................ 58
Lao PDR Country Report .................................................................................................................. 64
Malaysia Country Report ................................................................................................................. 68
Mongolia Country Report ................................................................................................................ 72
Myanmar Country Report ................................................................................................................ 75
Thailand Country Report .................................................................................................................. 78
Conclusions and Recommendations ................................................................................................. 82
General Conclusions .................................................................................................................... 82
Recommendations ...................................................................................................................... 82
Timetable ......................................................................................................................................... 84
List of Participants ........................................................................................................................... 87

1
BACKGROUND Increases in population, disposable income and urbanisation in Asian countries are driving an
unprecedented rise in demand for foods of animal origin that will stretch the capacity of existing
production and distribution systems. The increasing demand for livestock products has implications
for natural resource use (land and water) and environmental, health (animal and human) and socio-
economic impacts.
Feed is the foundation of the livestock production, with feed costs generally accounting for up to
70% of the cost of animal production. Furthermore, animal feeding impacts animal reproduction,
health and welfare and safety of animal products. Ensuring access to feed in sufficient quantity and
quality is therefore among the key and strategic priorities for livestock sector development.
However, the prospects of dramatically increasing feed demands raises the serious question as to
how these feed requirements will be met, particularly in land-constrained countries and regions.
FEED ASSESSMENTS AND BALANCES
In most Asian countries feed balances are not usually available or accurate despite their strategic
role in livestock sector development. Guidance in developing national feed assessments (NFAS)
based lessons learned across a wide range of feed situations, from spatially extensive rangeland and
grasslands to highly intensive crop-livestock systems is available (FAO, 2012).
Feed balances can be calculated in terms of energy, protein or other specific nutrients. While
assessments of feed inventories and feed productive capacities provide critical information, the
sufficiency of the feed supply can only be gauged relative to the demands for feeds. Essentially, this
comparison between livestock requirements and feed supplies constitutes the feed balance.
Feed assessments are a pre-requisite for developing optimal feeding strategies at various levels and
thus environmental sustainability and support food security. The ability to cope with emergency
feed shortage situations, the ability to provide input data into country level food input-output
analyses, and the capability to assess environmental impact of livestock are challenges that all
initiatives and stakeholders involved in sustainable livestock development are confronted with.
LINKAGES WITH OTHER COMPONENTS OF LIVESTOCK DEVELOPMENT
Better feed assessments will strengthen past and on-going work done by several institutions in the
region (research, development, producers, etc). They could be basis for informed decision and
stronger advocacy on the need for pro-poor investments in livestock feeds in order to face the
increasing market demand for livestock products in the region.
If food security is to be achieved and the demand for livestock feed met, agricultural R&D must also
be involved for a better focus on integrated approaches to producing and marketing more food
(staple crops and livestock products) and feed. Drivers of the sourcing and utilization of the feed
need to be better factored in considering the agro-ecological systems but also the requirements of
the various value chains as well as their constraints, potential, level of integration and specialization.
Feed assessments are therefore a component of an overall strategy or options that will integrate
technical (genetics, health and nutrition), policy and institutional interventions for using resources
more efficiently to produce more food and feed in extensive, mixed crop-livestock, mixed extensive
and intensive systems.

2
By analysing and anticipating the evolution of the feed sector in Asia and subsequently strategically
targeting technical, institutional and policy interventions, it should be possible:
to foster policy processes and mechanisms at regional and national level that contribute to food security, poverty alleviation and sustainable livestock sector development;
to support resource-poor livestock-keepers in their efforts to alleviate input constraints to food and feed production and exploit market opportunities for livestock products;
build mechanisms to establish and maintain feed assessments in Asia.
WORKSHOP OBJECTIVE
As a first step towards the longer-term goal of generating better data to support sustainable and
equitable livestock sector development, this meeting of experts is planned to discuss and review
state-of-the art on national feed assessments and to identify critical knowledge gaps.
The envisaged workshop outcomes are:
1. An agreed approach for: a) conducting feed assessments at country and regional levels, b)
characterising feeding systems, c) generating quantitative information on compound feed and
concentrate mix, including the cereals and cereal types and agro-industrial by-products that
are used in the production of compound feed and concentrate mix, and d) updating regularly
information a), b) and c).
2. A regional initiative for a better use of feed in livestock production in Asia.
WORKSHOP APPROACH
The workshop will be attended by (i) national delegates involved in animal production with
particular expertise in the field of animal feeding, (ii) directors of animal production in ministries of
Livestock or Agriculture, (iii) experts in livestock development, animal nutrition, feed technology, (iv)
livestock development officers (regional development institutions, research, NGO, FAO) and (v)
private processors and feed producers.
To set the scene, country delegates will be requested to prepare a paper and make a presentation
on the animal feed sector in their country. The paper should cover following aspects:
a) National feed resources with quantitative information on their availability (on yearly basis and
on seasonal basis; both),
b) Methodologies used in generating the quantitative information on availability of feed
resources,
c) Information on the main feeding systems (which feedstuff, in what proportions, which period
of the year and in which part of the country they are fed; and the relative importance of each
feeding system in generating animal products) in the country; and
d) Quantitative information on compound feed (manufactured by companies, in mesh or pellet
form and sold in the market) and concentrate feed (large scale operators who manufacture
their own feed, and smallholders who mix own feed on farm).
In the following part of the workshop, international experts will provide overviews of current
approaches to feed assessments and innovations in animal nutrition for consideration by working
groups, which will be formed on day 3 of the workshop to chart the way forward towards
harmonization of approaches for feed assessments and better utilization of available feed resources.

3
OPENING REMARKS H. Konuma
Distinguished delegates, colleagues, ladies and gentlemen,
On behalf of the Assistant Director-General and Regional Representative for Asia and the Pacific, Mr.
Hiroyuki Konuma, and on my own behalf, I have great pleasure in welcoming you to Thailand and to
the FAO-APHCA Regional Workshop on “Animal Feed Resources and their Management in the Asia-
Pacific Region”.
This workshop is extremely timely - in fact, it should probably have been held some years ago.
Increases in population and disposable income in Asian countries are driving an unprecedented rise
in demand for food of animal origin, i.e. meat, milk and eggs. This rapidly growing demand will
severely stretch the capacity of existing food production and distribution systems with major
implications for natural resource use and consequential environmental, health - both animal and
human - and socio-economic impacts.
Feed is the foundation of the livestock production, with feed costs generally accounting for up to
70% of the cost of production. Feed prices have been increasingly volatile due to negative impacts of
climate change and natural disasters, as well as from increasing competition in the use of grains
between feed and bio-fuel. Animal feeding systems impact on animal reproduction, health and
welfare, and the safety and quality of animal products. Ensuring access to feed in sufficient quantity
and quality is therefore among key strategic priorities for livestock sector development.
The prospect of dramatically increasing demand for animal source food and consequential growth in
demand for animal feed raises the question as to how these feed requirements can be met,
particularly in land-constrained countries and regions, and in the face of the growing food - feed -
fuel competition.
In order to better monitor and guide national and regional livestock sector development strategies,
it is essential to develop systematic approaches to accurately assess livestock feed supplies and to
obtain better insight into how these feed resources are being utilized, and how the prices are
changing.
Accurate estimation of feed resource availability and use would improve assessments of the
environmental impacts of livestock, both through land use change and through greenhouse gas
emissions associated with livestock production. Accurate information on the proportions of cereals
being diverted to animal feed is a critical element for assessing national and regional food security
situations. Furthermore, feed assessments, including the price developments, are essential pre-
requisites for developing optimal feeding strategies at various levels and thus environmental
sustainability and food security.
Unfortunately, despite their strategic role in livestock sector development planning, feed balances
are not usually available and where available, they tend to be rather inaccurate. Sub-optimal input
data for country-level food/feed input-output analyses and the inability to accurately assess
environmental impacts of livestock are challenges that all initiatives and stakeholders involved in
sustainable livestock development are confronted with.

4
Thus, I consider this workshop is an important step towards the longer-term goal of systematically
generating more and better data to support sustainable and equitable livestock sector development
in the Asia-Pacific region. I am convinced that your expertise, experience and commitment will make
this workshop a success and that you will chart the way forward towards a better understanding and
eventually efficient utilization of feed resources in Asia.
I would like to take this opportunity to reiterate the envisaged workshop outcomes, namely:
3. An agreed and systematic approach for:
a) conducting feed assessments,
b) characterising feeding systems,
c) generating quantitative information on compound feed and concentrate mixes and their
utilization, and,
d) systems for regularly updating the above information
and
4. The foundations for a regional initiative towards better use of feed in livestock production in
Asia.
I suggest that you keep these outcomes in mind in your deliberations.
I wish to welcome once again to the land of smiles. I wish you all success in the deliberations and a
pleasant stay in Thailand.
Thank you.

5
ASIA-PACIFIC LIVESTOCK SECTOR TRENDS
J. Otte
Building Bridges, Supporting Livelihoods
FAO Regional Office for Asia and the Pacific
Building Bridges, Supporting Livelihoods
Asia-Pacific Livestock Sector Trends –Implications for Feed Resource
Management
FAO-APHCA Regional Workshop on Animal Feed Resources
Bangkok, Thailand, 13 August 2013
Joachim Otte (FAO, Bangkok)
Building Bridges, Supporting Livelihoods
FAO Regional Office for Asia and the Pacific
Outline
• The ‘critical’ 100 years: 1950 to 2050
• Demand growth for animal sourced food
• Livestock sector development
• Food / feed for thought
2
Building Bridges, Supporting Livelihoods
3FAO Regional Office for Asia and the Pacific
The Challenge
3
Over the next 50 years, the world’s framersand ranchers will be called upon to producemore food than has been produced in thepast 10,000 years combined, and to do soin environmentally sustainable ways
Jaques Diouf, FAO Director General, 2007
8/8/20144FAO Regional Office Asia and Pacific
Building Bridges, Supporting LivelihoodsBuilding Bridges, Supporting LivelihoodsBuilding Bridges, Supporting Livelihoods
Global Human Population:2000 BC – 2010 AD
Source: IUCN/WWF Living Planet Report
App. 1850
1950: 2.6 bln
2050: 9.3 bln
4
Billion
Building Bridges, Supporting Livelihoods
FAO Regional Office for Asia and the Pacific
Absolute Population Growth
6.7
1.6
0.8
0 2 4 6 8
1950-2050
1850-1950
150BC-1850AD
5
Billion people
Building Bridges, Supporting Livelihoods
8/8/20147FAO Regional Office for Asia and the Pacific
Food Expenditure Density
Source: PPLPI (2008)

6
Building Bridges, Supporting Livelihoods
FAO Regional Office for Asia and the Pacific
Asia’s BOP Markets ($PPP Trillion)
0.0
0.5
1.0
1.5
2.0
2.5
3.0
3.5
Other
Water
ICT
Health
Transport
Housing
Energy
Food
8
Source: WRI (2007)
$2,200,000,000,000
Building Bridges, Supporting Livelihoods
FAO Regional Office for Asia and the Pacific
Income & Food Choice
0
20
40
60
80
100
Dev'ping Dev'ped
Non-food
Other food
Fish
Milk
Meat
Fruit
Cereals1,000
2,000
3,000
4,000
5,000
6,000
19
90
19
92
19
94
19
96
19
98
20
00
20
02
20
04
20
06
China
India
9
Allocation of additional $ income
64 96
Income in $2005PPP
8/8/201410FAO Regional Office Asia and Pacific
Building Bridges, Supporting LivelihoodsBuilding Bridges, Supporting LivelihoodsBuilding Bridges, Supporting Livelihoods
Demand Growth 2000-2030: Meats
0
100
200
300
400
500
S Asia E.Asia SE.Asia Aus&NZ
BeefMuttonPorkPoultryEggs
0
5
10
15
20
25
S Asia E.Asia SE.Asia Aus&NZ
BeefMuttonPorkPoultryEggs
Million MTs
Source: FAO Projections
% 725
Building Bridges, Supporting Livelihoods
FAO Regional Office for Asia and the Pacific
Livestock Sector Development
• Growth in total number of livestock
• Relative growth in importance of poultry and pigs vs ruminants
• Faster turnover / increased throughput (intensification)
• Larger farming units and concentration of units
• Corporate vs family farms
• Stratification of sector and vertical integration / contract farming
• Longer, cross-border supply chains
13
Building Bridges, Supporting LivelihoodsBuilding Bridges, Supporting Livelihoods
8/8/2014 1414FAO Regional Office for Asia and the Pacific
Large ruminants
0
100
200
300
400
500
S.Asia E.Asia SE.Asia
1990
2000
2010
Small ruminants
0
100
200
300
400
500
S.Asia E.Asia SE.Asia
1990
2000
2010
Livestock Population Trends
14
million million
Sourc
e:
FA
OS
TA
T
Building Bridges, Supporting LivelihoodsBuilding Bridges, Supporting Livelihoods
8/8/2014 1515FAO Regional Office for Asia and the Pacific
Pigs
0
100
200
300
400
500
S.Asia E.Asia SE.Asia
1990
2000
2010
Poultry
0
1
2
3
4
5
6
7
S.Asia E.Asia SE.Asia
1990
2000
2010
Livestock Population Trends
15
million billion
Sourc
e:
FA
OS
TA
T

7
8/8/201416FAO Regional Office Asia and Pacific
Building Bridges, Supporting LivelihoodsBuilding Bridges, Supporting LivelihoodsBuilding Bridges, Supporting Livelihoods
100
200
300
400
500Meat
Chicken
100
200
300
400
500
100
200
300
400
500East Asia Southeast Asia South Asia
Poultry Sector Productivity Growth
Sourc
e:
FA
OS
TA
T
Building Bridges, Supporting Livelihoods
FAO Regional Office for Asia and the Pacific
China: Structure of Poultry Sectors
98.1
30.3
0
20
40
60
80
100
Farms Production
Layer Sector
<500 500 - 2,000 > 2,000
17
98.6
23.3
0
20
40
60
80
100
Farms Production
Broiler Sector
< 2,000 2,000 - 10,000 > 10,000
Source: Bingsheng & Yijun (2007)
27.5
49.2
27.9
41.8
Building Bridges, Supporting Livelihoods
FAO Regional Office for Asia and the Pacific
0
1,000
2,000
3,000
4,000
5,000
6,000
S.Asia E.Asia SE.Asia
1990 2000 2009
Asia’s Net Feed ImportsUS$ million
19
Sourc
e:
FA
OS
TA
T
Building Bridges, Supporting Livelihoods
FAO Regional Office for Asia and the Pacific
Number of Undernourished
0
50
100
150
200
250
300
3501990-92
2010-12
Source: FAO SOFI, 2012
21
million
Building Bridges, Supporting Livelihoods
FAO Regional Office for Asia and the Pacific
Allocation of Crop Calories - Global
Food Feed Other
36% 55%
9%
Sou
rce:
Ca
ssid
y et
al.,
20
13
22
Building Bridges, Supporting Livelihoods
FAO Regional Office for Asia and the Pacific
Allocation of Crop Calories
0
20
40
60
80
100
India China Brazil USA
Other
Feed
Food
23
Sou
rce:
Ca
ssid
y et
al.,
20
13

8
Building Bridges, Supporting Livelihoods
FAO Regional Office for Asia and the Pacific
Agricultural Land (ha) per Person
0
1
2
3
4
5
Arable Pastures
24
Hectare 10.2
So
urc
e: FA
OS
TA
T
Building Bridges, Supporting Livelihoods
25FAO Regional Office for Asia and the Pacific
Cropland Use
Sou
rce:
Fo
ley
et a
l., 2
01
1
Building Bridges, Supporting Livelihoods
FAO Regional Office for Asia and the Pacific
The ‘Productivity’ Gap
26
Developed countries
Developing countries
LDCs
Meat/head of cattle/year (kg) 92.9 24.2 12.2
Meat/head of shoats/year (kg) 8.0 5.7 3.8
Meat/head of pigs/year (kg) 132.5 83.2 31.6
Meat/head of chicken/year (kg) 7.5 3.2 1.4
Milk/head of cattle/year (kg) 1,047 191 89
Eggs/1,000 chicken/year (kg) 4.3 3.4 1.1
Building Bridges, Supporting Livelihoods
FAO Regional Office for Asia and the Pacific
Is ‘modern’ livestock production
• Sustainable if applied on a global scale?
• Efficient in producing food for a growing human population?
• Ethical considering the amount of ‘hunger’ still prevailing?
27

9
IMPORTANCE AND ROLE OF FEED ASSESSMENTS
H. Makkar
What and how we have to achieve during this workshop?
Harinder Makkar
Animal Production and Health Division, Food and Agriculture Organization of the
United Nations (FAO), Rome, Italy
Challenging tasks?
Make quantitative assessment of various feed resources available in your country.
Conduct a critical analysis of the methodologies and approaches used in generating
quantitative data on feed resources.
Characterise feeding systems for main livestock species
Generate quantitative data on the types of grains used and their amount in the diets of
various animal species
Factors affecting the use of various feed ingredients in the preparation of diets.
2010 (million tonnes) 2050/2010
World
Meat 268.7 173%
Dairy not butter 657.3 158%
2010 (million tonnes) 2050/2010
Developing countries
Meat 158.3 209%
Dairy not butter 296.2 216%
Assumptions about purchasing power and eating habits based on previous trends
FAO (2011)
Projected consumption of meat & dairy products
Challenges ahead....
Feed: foundation of livestock production systems
Feed
ProductionReproductive
efficiency
Environment
Land use and
land use
change
Water use &
water pollutionAnimal health
Animal
welfare
Product
quality &
safety
Economic viability
(driver of production systems)
What are National Feed Assessment and National Feed
Assessment System?
National Feed Assessment is a data- and computation-based analysis of the
supplies and demands for livestock feeds in a country
A National Feed Assessment System is a complete set of procedures,
facilities, tools, personnel, organizations, and institutions involved in the
collecting, handling, processing of data necessary to calculate and report
the supplies of livestock feeds from all sources and for all livestock types
in a country.

10
Why do we need National Feed Assessments? ....1/3
Planning of the livestock sector as well as the setting of environmentally
sustainable stocking rates
Used in conjunction with nutrient balances, they can identify potential
surpluses or deficits
Spatial and temporal assessments of current, and forecasted feed resources,
including forages, will assist in disaster management
Development and implementation of sound policies regarding the use of national
feed resources that will contribute to the sustainable growth of national livestock
sectors
Informed decisions related to the nature and quantities of commodities, the feed
resources that could be traded locally, potential areas for feed markets, and feed
resources involved in imports and exports
Why do we need National Feed Assessments? .....2/3
Assess the fractions of food grain that is used for feed
Production + (imports - exports) + (opening stocks - closing stocks) = food
available for human consumption + industrial non-food uses + used as feed
+ used as seed + waste (+ discrepancy)
Help to better characterize the impacts of feed shortages on livestock
production at national levels
Enhance the efficiency and profitability of the animal feed industry and assist
researchers to formulate sustainable feeding strategies.
Enable determination of the input-output relations for countries, e.g. the
estimation of edible protein outputs versus protein inputs
Why do we need National Feed Assessments? ....3/3
Improve the accuracy of assessments of the environmental impacts of
livestock resulting from land use transformations, soil nutrient use, as well
greenhouse gas emissions and element fluxes (e.g. nitrogen) associated
with livestock production.
Facilitate determination of animals that can be supported or produced based upon
existing feed resources, and in identifying what feed resources would and could be
developed to achieve production objectives.
Knowledge of forage biomass availabilities and distributions can assist
pastoralists in determining whether to move, buy or sell, animals, and assess
the level of risk for decision making
Importance of Livestock Sector Data? ......1/2
Questionnaire - The Livestock Data Innovation in Africa Project (n = 641)
Within Governments, use of livestock data and indicators
Policy and planning (44%),
Development projects (33%)
Research (30%)
NGOs/Donors/International Organizations use data/indicators
Design and implement development projects (31%)
Private companies
Formulate investments (76%)
Researchers
Research purpose (67%)
Formulate and implement development projects (39%)
Livestock Data Innovation in Africa
Importance of Livestock Sector Data? .....2/2
Out of 15 different livestock data types
Data on livestock feeds: Ranked fourth in importance
Behind animal health, meat production, and livestock population.
Milk production was fifth.
Respondents also ranked various data types according to needs for
improvements in data quantity and quality
Livestock feed data was ranked third in needs for improved data
Sources:
Pica-Ciamarra, U., N. Morgan & D. Baker. 2012. Core livestock data and indicators” results of a
stakeholder survey. A paper of the World Bank, FAO,ILRI Livestock Data Innovation in Africa Project,
with support from the Gates Foundation. Available at:
http://www.fao.org/ag/againfo/home/documents/2012_PAP_Core_Livestock_Indicators_120503.pdf )
Feed balance: Why?
At its simplest level, a feed balance is a comparison between
- Requirements of livestock (demand)
- Amount of utilizable feed (supply) and therefore
A “snapshot“ of the current situation
+
Demand Supply
A livestock feed balance can be undertaken: local, regional national level
- Depending on policy requirements & degree of accuracy required

11
Calculation of feed balance: General considerations
Calculated on an annual basis
(many feed crops, such as cereal grains, have an annual production
cycle with one harvest, this may be appropriate)
May be performed over a shorter period
(may be advantages in doing so in certain circumstances)
For example, for periods of the year when the amount of natural grassland
available for grazing animals is low
(to establish the maximum potential livestock carrying capacity of a
particular region when feeds are in limited supply)
Livestock feed balance enables
- Identification of limitations to current levels of production
- Estimation of the feed requirements for increasing production
- Effective handling of emergency situations
- Sound planning of livestock sector
- Potential shortages in feed to meet increasing demand for food
- Types of feed materials that might be required where shortfalls
identified
- Alternatively, where a feed balance identifies a feed surplus, can be
used to estimate the additional livestock production that the surplus
might support
A structured approach to planning – A must
Feed balance in terms of energy required
Feed balances are normally calculated in terms of the energy required by
livestock and the energy supplied by feeds
(energy is usually the first limiting component in livestock diets)
Estimate the energy requirements for each class of livestock
• maintenance;
• pregnancy;
• production (e.g. milk yield, live weight gain, number of eggs produced)
In some situations, adjustments required
- extremes of climate (heat or cold), and
- for exercise where this is significant
Demand Supply
• Numbers of animals at the beginning and end of the feed balance period
(usually the beginning and end of the year)
• Herd or flock production measured as
-- calving/lambing/kidding frequency
-- mortality rate
-- age at first calving
-- calving interval
-- live weight gain
-- output of animal products (milk, meat, eggs, wool)
Feed balance calculation: Animal number & production level
A simple approach for feed balance
Use a form of reverse-balance calculation
- energy required for a given level of production
(growth rate, milk yield, calves born is calculated)
This is then divided by the energy concentration of the forage, after any energy
provided by supplementary feeds has been discounted
Example for a lactating dairy cow
• Energy required for maintenance and production = 190 MJ ME/day
• ME provided by compound feed 1.8 kg DM at 12.5 MJ/kg DM = 22.5 MJ ME/day
• Energy from forages = 190 – 22.5 = 167.5 MJ/day
• ME content of forage = 10.5 MJ ME/kg DM
• Forage DM intake = 167.5/10.5 = 15.9 kg DM/day
In this example, forage dry matter intake is predicted as 15.9 kg/day
(allow for losses)
Further calculated for herd, a month and then a year National level
Feed deficit or surplus?
ME required for
maintenance
plus production
(Animal number
& production
level)
Forage
B
'Forage
A
Conc.
Feed demand (required ME) Feed supply (available ME)
NRC/ARC/INRA/CSIRO www.feedipedia.org

12
How feed balance information can be used?
A surplus may suggest the potential for further livestock production,
although it is important to establish when and where the surplus occurs
A surplus of forages during a brief period of the year or in an area not suitable to
livestock production may not be fully utilizable unless livestock can be
temporarily moved to the area
Alternatively, it may be possible to conserve the forage as silage or hay and
used to supplement grassland when growth is low
In the case of a deficit, this can be rectified by increasing crop production or
improving the efficiency of conservation of surplus forages, by the purchase of
feeds or a reduction in numbers of animals
Comments
Although a feed balance can be assessed at a national level, greater accuracy
achieved if it is done at local or regional levels and the results consolidated.
Because of the different feeds for ruminant and non-ruminant livestock,
it is recommended that reconciliations are done separately for each species
before producing a national feed balance
What is meant by Feeding Systems?
A Feeding System contains information on which feedstuffs and what
proportion are fed to livestock
Feeding Systems
Integrating the temporal information in Feeding Systems, for
being more meaningful :
A Feeding System contains information on which feedstuffs, in what
proportion, and which period of the year (season) are fed to livestock
Integrating also the demographic information in Feeding Systems,
for being even more meaningful:
A Feeding System contains information on which feedstuffs, in what
proportion, which period of the year (for example a season) and in which
region (for example a agro-climatic zone) and/or livestock production system
(for example: extensive, mixed extensive, mixed crop-livestock, intensive (or
zero-grazing)) are fed to an animal species
Why countries should characterize Feeding Systems?
Development of efficient feeding strategies – that increase profitability
– increase nutrient use efficiency in animal food chain – decrease
emission of green house gas emissions – production quality
Generation of accurate country-level GHG inventories for the livestock
industries – animal species/commodity wise
Assessment and development of feed-related approaches – mitigation
of GHG – adaptation of the livestock sector to on-going global warming
Characterization of Feeding Systems enables:
1/2
Why countries should characterize Feeding Systems?
Identification of appropriate methodologies and approaches including
institutional mechanism for estimating feed use and feed balance
Better understanding of the drivers influencing use of feedstuffs, enabling better
forecasting of their use and likely changes in livestock production systems
Estimation of resources that are human foods but used for animal feed, for example
cereal grains, soybean, enabling accurate assessment of food security situation in
country
Improvement of feed related statistics in national and international databases
including FAOSTAT, furthering sound scientific analyses and sound policy
formulation
Characterization of Feeding Systems enables:
2/2
Feed Assessment, Feed Balance and Feeding Systems?
“Feed Assessments, Feed Balance and Feeding Systems are an integral
component of an overall strategy for enhancing resources use
efficiency to produce more food.
Technical, policy and institutional interventions are required – generate –
sustain these efforts

13
• Make quantitative assessment of various feed resources available in
your country.
• Conduct a critical analysis of the [methodologies and approaches used]
in generating quantitative data on feed resources and in calculating
feed balance.
• [Approaches] Characterise feeding systems for main livestock species
• Generate quantitative data on the types of grains used and their amount in
the diets of various animal species [approaches for assessing the grain use
in on-farm feed production and in compound feed]
• Factors affecting the use of various feed ingredients in the preparation of diets.
Focus on …………………….1/2
Identify strengths and weakness in approaches
Identify knowledge gaps in data, approaches, methodologies
– feed assessments – characterisation of feeding systems
How to bridge the knowledge gaps
Reach at the conclusions which methodologies and approaches to use
Prepare a roadmap on how to complete the task
Discuss how to sustain this work
Prepare guidelines for feed assessments and characterization
of feeding systems from Asian perspective
Focus on …………………….2/2

14
BANGLADESH COUNTRY REPORT M. Uddin
FAO-APHCA regional workshop in Bangkok : 13-15 August 2013
Animal Feed Resources and their
Management in Bangladesh
Mohammad Mohi Uddin
Bangladesh country Report
FAO-APHCA regional workshop in Bangkok : 13-15 August 2013
1. Background
2. Approaches,
methods and data
i) Feed Inventory
ii) Feeding system
characterization
3. Knowledge gaps
4. Potentials for
improvement
Outline
FAO-APHCA regional workshop in Bangkok : 13-15 August 2013
Livestock and poultry population
Year Livestock (1000 heads) Poultry (1000 heads)
Cattle Buffalo Sheep Goat Backyard Breeder Layers Broilers
2012 24688 642 3120 25212 97800 5500 33800 286000
Source: DLS 2013
Livestock population Poultry population
25%
1%
8%
66%
Backyard Commerical breeders
Commercial layers Commercial brolers
FAO-APHCA regional workshop in Bangkok : 13-15 August 2013
Overview of livestock products in Bangladesh
Item Livestock production, demand and
balance
Production DemandBalance
(+ or -)Milk
(million ton)2.89 13.15 -10.251
Meat
(million ton)1.17 6.31 -5.139
Egg (million
number)8395 14997 -6602
Source: Poultry Business Directory (2011), Bangladesh; for milk only: IFCN sector data for Bangladesh 2013
For meat and egg: estimation for egg was done based on data from Ali, 2012 and for meat BBS 2005 but using a growth
rate of 2% to estimate for 2012.
Livestock products are highly demand driven
FAO-APHCA regional workshop in Bangkok : 13-15 August 2013
Aveneus to increase productivity
Increasing feed resources and effective management of feed
resources- way for
• improving productivity,
• mitigating demand gap and
• achieving MDG
What we see in the feed resources in BD:
Is this only in Bangladesh? Looking at globally……
Country Feeds Production
(Million Ton=
MT)
Requirement
(MT) for
livestock and
poultry
Deficiency
(%)
Overall
deficiency
(%)
Bangladesh Roughage 26.27 37.45 -29.85% -61.72.8%
Concentrate 5.83 46.4 -87.44%
Gap between feed production and requirement in Bangladesh
FAO-APHCA regional workshop in Bangkok : 13-15 August 2013
Source: Feed inventory report by Uddin et al., 2013;
personal communication with the respective country research partner via IFCN network;
-62%
-15% -14%
-34%
57%
17%
-70%
-40%
-10%
20%
50%
80%
Ba
ng
lad
es
h
Ch
ina
Ira
n
Eg
yp
t
Se
rbia
Ch
ile
% deficiency or surplus
Asia and Africa
are probably the
feed deficient
countries
Global feed supply and demand

15
FAO-APHCA regional workshop in Bangkok : 13-15 August 2013
Approaches, methods and dataApproaches and methods
Two major approaches of feed management are:• Using quantitative and qualitative information
• Use of mixed methodological approach
Data sources
Secondary data
• Bangladesh Bureau of Statistics (BBS)
• Department of Livestock Services (DLS)
• Department of Agricultural Extension (DAE)
• IFCN dairy sector model and IFCN farm database 2012 for
Bangladesh
• Several literature review
Primary data
• Field survey from three production systems from 220 dairy farms
• Panel approach which is called modified Delphi Technique
FAO-APHCA regional workshop in Bangkok : 13-15 August 2013
Overview of feed inventory model in Bangladesh
Key strength of this model:
Xls based simple modeling
to get the output which are
not available as such.
Potential for improvement
Making holistic
Incorporation all animal +
Production + breed + environment
Feed inventory approach
+ Feed to poultry
FAO-APHCA regional workshop in Bangkok : 13-15 August 2013
Feed inventory approachStep 1: Total feed requirement
Total livestock
(cattle, buffalo, sheep and goat)
Total Poultry
(Chicken and ducks)
Conversion to total ACU
(Adult cattle Unit)
+Total feed requirement for livestock:
ACU * 7.0 kg DM*365
Total feed requirement for poulty:
173g*365*total poultry number
=
Total feed requirement:
Total feed for livestock + poultry (in DM)
FAO-APHCA regional workshop in Bangkok : 13-15 August 2013
Livestock
population
Category Conversion factor Number of
animals
ACUs
Cattle Male
<12 months 0.11 1649 181
12-36 months 0.34 1697 577
>36 months 1.00 8605 8605
Female
<12 months 0.11 2359 259
12-36 months 0.34 1947 662
>36 months 1.00 7789 7789
Total Cattle ACUS 18074
Buffalo Male
<12 months 0.11 23 4
12-36 months 0.34 33 17
>36 months 1.00 382 436
Female
<12 months 0.11 29 5
12-36 months 0.34 27 13
>36 months 1.00 146 167
Total Buffalo ACUS 642
Sheep Male
0-12 months "sub adults / replacements" 0.03 10 10
> 12 months "adults / breeders" 0.10 88 88
Female
0-12 months "sub adults / replacements" 0.03 20 20
> 12 months "adults / breeders" 0.10 122 122
Total sheep ACUS 241
Goat Male
0-12 months "sub adults / replacements" 0.03 82
> 12 months "adults / breeders" 0.10 700
Female
0-12 months "sub adults / replacements" 0.03 165
> 12 months "adults / breeders" 0.10 998
Total Goat ACUS 1945
Grand total ACUS (cattle, buffalo, sheep and goat) 20901
Source: Livestock population-DLS 2012; Conversion factors from Anandan and Sampath (2012)
FAO-APHCA regional workshop in Bangkok : 13-15 August 2013
Feed inventory approachStep 2: Total feed for livestock and poultry
Total Feed production in FM (Gross)
-Harvesting, processing
and other losess
X proportion used for livestock and
Poultry (%)
Total feed production in FM
=
Total feed production in DM
X % DM
Total feed production in DM
% Extration rate for Grain
Feed availble for livestock and poulty
(Feed inventory)
FAO-APHCA regional workshop in Bangkok : 13-15 August 2013
Total Feed resources
Feed resources Data source Estimation
Crop Residues DAE, 2011, IFCN2013 Estimated using HI, IFCN WF
model using ratio of crop and
crop residues
Oil seed cakes/meals DAE, 2011
Grain by-products DLS 2013 Estimated using ER
Grain DAE, 2011, Estimated to livestock and
poultry by using the coefficient
for grain used for livestock and
poultry and to human by using
panel approach
Roots and tubers and
their by-products
- -data missing
Other by-products - -data missing
Grasses DAE, 2011, Sarker et al., 2012 -data missing
Forage trees - -data missing
Other forages
DAE = Department of Agricultural Extension, WF = Water footprint model

16
FAO-APHCA regional workshop in Bangkok : 13-15 August 2013
Harvesting and processing loss:
7-12% for crop residues and other forages; for grain 5-7%: all
depending on season and region
% DM:
From IFCN farm result database for Bangladesh (2013) and
Khandaker and Uddin, (2002)
% Extraction rate
From Anandan and Sampath (2012)
Cereal used for livestock and poultry
Estimated from panel
FAO-APHCA regional workshop in Bangkok : 13-15 August 2013
Feed inventory approach
Step 3: Feed balance
Feed availble for livestock (DM) + Poultry Total feed requirement
Livestock + poultry (DM)-
=
Total feed balance (+/-)
FAO-APHCA regional workshop in Bangkok : 13-15 August 2013
Species
No of Adult Cattle Units
(ACUs) (1000 heads)
DM
million ton
Total feed requirement by different species
Cattle 18074 46.18
Buffalo 642 1.64
Sheep 241 0.62
Goat 1945 4.97
Poultry 388 30.45
Total feed requirement 83.85
Total feed available for livestock and poultry
Total available (Roughage and concentrate) 32.08
Total Roughage 26.27
Total concentrate 5.82
Source: own analysis based on the feed inventory method
Feed available and requirement
FAO-APHCA regional workshop in Bangkok : 13-15 August 2013
Feed balance in Bangladesh
Species
Demand Supply
Total
(roughage+
concentrate
) Roughage Concentrate
Total
(roughage+
concentrate)
Rougha
ge
Conce
ntrate
Cattle 46.18 32.33 13.85 13.46 11.47 1.99
Buffalo 1.64 1.15 0.49 0.32 0.25 0.07
Sheep 0.62 0.52 0.09 1.60 1.53 0.07
Goat 4.97 4.22 0.75 12.32 12.23 0.09
Poultry 30.45 0.06 30.39 4.39 0.79 3.61
All 83.85 37.45 46.40 32.09 26.27 5.83
Source: own analysis based on feed inventory method,
Method:
Demand:
allocation for roughage and concentrate for large ruminant= 70:30; for small ruminant =85:15; for poultry = 3
: 97 (because geese eats small roughage, some roughage may be used as binder)
Supply:
Allocation to Livestock: Roughage = 97% and 3% to poultry
Concentrate: 38% to livestock and 62% poultry
Allocating concentrate to different species: Cattle, buffalo, sheep and goat = 90:3:3:4
FAO-APHCA regional workshop in Bangkok : 13-15 August 2013
Livestock
species
Mixed Extensive
Systems
Mixed Crop-Livestock
SystemsIntensive Systems
Home-
made
concentra
te
(kg/d)
Compound
feed a
(kg/d)
Total
(kg/d)
Home-
made
concen
trate
(kg/d)
Compound
feed a
(kg/d)
Total
(kg/d)
Home
made
conce
ntrate
(kg/d)
Compo
und
feed a
(kg/d)
Total
(kg/d)
Dairy cattle 0.74 0.12 0.86 1.85 0.34 2.19 1.95 0.91 2.86
Non-dairy
cattle - 0.48 - 1.58 0.7 0.2 0.9
Dairy
buffalo 0.9 - 0.9 1.5 - 1.5 - - -
Non-dairy
buffalo 0.51 - 0.51 - 1.3 - - -
Sheep 0.22 - 0.22 0.25 - 0.25 - - -
Goat 0.22 - 0.22 0.25 - 0.25 - - -Source: Estimation based on Khan et al., 2009; Uddin et al., 2013 and opinion from panel membersa Mainly as mesh form produced by feed industry
-typically not used
Estimation of the average daily amount of home-made concentrates and compound feed
(concentrate feed produced by the feed industry) for different livestock.
FAO-APHCA regional workshop in Bangkok : 13-15 August 2013
Livestock population
Estimation of total
concentrate consumption
Total consumption
All
livestock
Mixed
extensiv
e
Mixed
crop
livestock
Intensi
ve
Mixed
extensi
ve
Mixed
crop
livesto
ck
Intensive total/d in
t
total/y in
t
total/y
million
ton
Dairy
cattle 11797 2241 1614 97 1928 3534 277 5739 2094704 2.09
Dairy
buffalo 292 15 14 0 7 21 28 10387 0.01
Non-
dairy
cattle 12249 980 804 56 470 1270 51 1791 653556 0.65
Non-
dairy
buffalo 292 9 8 0 4 11 15 5620 0.01
Livestock 7573 2764268 2.76
Sheep 3120 406 2434 62 89 608 698 254636 0.25
Goat 25212 11598 9833 3782 2551 2458 5010 1828513 1.83
Sheep and goat 5707 2083149 2.08
Grand
total 13281 4847416 4.85
Method explanation: using proportion of different livestock species from different production systems (Table 6)
and their corresponding consumption (Table 21)
Human-animal competition: concentrate goes to Livestock

17
FAO-APHCA regional workshop in Bangkok : 13-15 August 2013
total
livestock
Semi-
intensive/
semi-
scavenging Intensive
Total
consumptio
n/year in
million ton
Backyard /small
holder 97800 62000 0 1.96
Commercial
breeder 5500 5500 0.39
Commercial layers 33800 5746 28054 2.51
Commercial
broilers 286000 105820 180180 20.02
Duck 46635 46635 0 0.17
Total poultry 25.05Method explanation: using proportion of different livestock species from different production
systems (Table 7) and their corresponding consumption (Table 27)
Human-animal competition: concentrate goes to poultry
FAO-APHCA regional workshop in Bangkok : 13-15 August 2013
Challenges: Knowledge gaps
Challenges
Knowlege
gaps
• No data/missing data
• Lack of updated
• Purpose
• Animal strucure
• Socio-economic
• Coordination
• Dissemination
• Data quality
• Validation
• Regional and
seasonal
• Difficult to
disntiguish
• Varies with feed
resources
• Suitability
• Extrapolation
• Holistic view
DataFarming
systemMethod
• No method
• Inconsistency
• Simple, old
• Typical faraming
system
• Rapid in and out
• Farming
knowledge
What
FAO-APHCA regional workshop in Bangkok : 13-15 August 2013
Data gaps and approaches to overcome
SL. Nr. List of things/data Reasons Approaches to achieve
1 Livestock and poultry
populationNon ruminants
-pig
-rabbit
Data is not available from
any of the national or
regional statistics
Conducting sample survey in
selected regions and estimation by
utilizing panel approach
Poultry
-Geese
Quail
Turkey
Pigeon
2 Feed resourcesData on production by
species are missing.
Conducting sample survey + panel
study + detailed land survey + expert
estimation + panel approach
RTB
OBP
Legume forage
Other forage
3 Feeding system characterization Data on characterization at
farm and regional level is
not available
Case study in different regions and
seasons
4 Detailed concentrate use in
different production systems
and livestock species
Data concentrate use at
farm and regional level is
not available
Case study in different regions and
seasons
FAO-APHCA regional workshop in Bangkok : 13-15 August 2013
Feed inventory-strong tool for understanding feeds
and feeding management
• Data collection, method development Panel study, expert round
Case study
Sample survey (too expensive but extremely good)
• Sustainability and long-term viablity Modeling on feed inventory-extended to all Asian countries
Coordinating center and/or institution at central level
country level-to validate and update and published
Proposed name of the network
Asian Animal Feed Comparison Network (AAFCN) : legal point need
to be claified with IFCN;
but AAFSN = Asian Animal Feeding System Netowork: no need
Summary/ Potential for improvements

18
BHUTAN COUNTRY REPORT
J. Gyeltshen
1
Feed and Fodder Resources of Bhutan – Current status
Jambay GyeltshenNCAN, Bhutan
Area - 38,394 Sq.kmCapital - Thimphu
About Bhutan:
Development Philosophy :
Gross National Happiness
Introduction
• 2.93 % arable land; 80 %forests & 60 % peopledepend on agriculture
• Farming system –integration of crops, animals and forest - a mutually supportive system
• Livestock’s role - draft, manure and livestock products
Livestock Units
Live. Categories Animal Units
Improved Cattle (Jersey & BS)
74,240
Local (Mithun & Nublang)
146752
Yaks 35472
Buffaloes 571
Horses 22600
Sheep & Goat 12451
Total 291086
Source: Livestock Statistics, 2012
Livestock Production Systems
• Transhumant yak system -
typical and limited to alpine
cool temperate areas
• Migratory cattle system –
(temperate & subtropical
regions)
- Seasonal movement
between winter and
summer pastures – main
strategy of feeding

19
Livestock Production Systems…
• Sedentary system –
for milking cattle
(improved breeds), draft
animals, buffaloes and
goats.
Tethering; grazing in
fallow lands or forests
during day.
Pig rearing
Population – 19,191
Native: 9788
Exotic: 9403
Breeds: Large black,
Duroc and Saddleback
Reared under intensive
system where feeds are
provided and adequate
housing provided
Poultry production
Population – 549,733
Native : 146,574
Improved : 403,159
Native birds - under
extensive system – birds
search their own food
Improved poultry (layer
and broiler) – reared
under intensive system
Fodder Resources
Tem. Sp.: Cocksfoot (Dactylis
glomereta), Italian rye (Lolium
multiforum) & white clover (Trifolium
Repens)
Subtropical Sp. : Ruzi (Brachiaria
ruziziensis), molasses (Milinis minutiflora)
and stylo (Stylosanthes guianensis)
Improved Pasture
Acreage(acres)
DM (MT)
Temperate 9057 54,342
Subtropical 7591 75,910
Total 16,648 130,252
(Wangchuk et.al., 2006)
Fodder resources…
Native Pasture (Tsamdro):Acreage: 1188708 acres - open meadows, shrubs, trees -spread across temperate and alpine regions
DM production: calculated at 1.18 MT/hac. is 283,828 MT i.e. about 35.58 % of total DM requirement
Fodder resources…
Fodder Crops
Acreage DM (MT)
Fodder Maize
39.07 96.89
Tuber crops 1737.67 2884.53
Oats 827.10 1736.91
Total 2604 4718.34
Fodder Crops
Good source of winter feed

20
Fodder resources…
Crop Residues Quantity (MT)
Paddy straw 157460
Maize stover 159652
Wheat straw 12532
Barley straw 6220
Buckwheat straw 16674
Millet Stover 14128
Total 366666
Crop Residues
DM : 293,332.80 MT 79 % utilization only & hence 231,733 MT
Fodder resources…Fodder trees & Plantations
Fodder type Quantity DM (MT)
Fodder trees (nos.)
681945 23868
Fodder plantations (acres)
2002 8809
Total 32,677
Fodder Sp: Guatemala (Tripsicum luxom), Napier (Panesitum purpureum), Paspalumatratum, broom grass (Thysanchaenamaxima)Fodder trees: Ficus Sp. and willow (Salix babylonica)
Feeds Resources
Agro-industrial by-
products :DDGS :4320 MT
WDGS : 576 MT
Oil seeds/meals
Mustard oil cake: 1524 MT
Soybean: 826 MT (90 %
exported to India)
16.33
35.58
0.61
29
3.07 1.1
Dry matter contribution by Fodder resources
Improved pasture
Native Pasture
Fodder crops
Crop residues
Fodder trees
Fodder plantations
Dry Matter Availability: 85.66 %
Constraints:
Seasonal shortage of Fodder (mid February to mid April) in temperate and Alpine regions
Approaches/Methodologies
Ministry : RNR Statistical Steering Committee (RNR-SSC)
Departments : IMS in each Department
RNR Statistical Framework
Information flow (Field)
Regional Livestock Dev. Centres (RLDC)
District Livestock Sector (DFFP)
Extension Centres
Farmers, Farmers’ groups
National Centre for Animal Nutrition (NCAN)
Data collection
Data reporting & Editing
Data analysis &compilation
Data compilation & analysis
NCAN - involved in coordinating and implementing major field activities; hence monitoring and evaluation of activities NCAN: direct access to information from farmers
A quick survey was also conducted by team of technical experts

21
Feeding Systems
Feeding livestock related to
production systems.
Vary – with season & AEZs
Yaks and migratory local
cattle - under extensive
systems; improved cattle and
goats – sedentary, mixed
crop and livestock system.
Pig and commercial poultry
under intensive systems
Yaks… Alpine (>2800 masl)
Season Feeds
Winter (Nov.- Feb.)
At 2800 masl. Open grazing; Dwarf bamboo (Yushinia microfylla) grass, sedges, salt. 98% grazing, 2% conc.
Spring (Mar. - May)
Start migration. Forest and open grazing. Dwarf bamboo, young grasses, sedges and salt. 99% grazing, 1 % concentrate
Summer (Jun – Aug)
≥ 4000 masl. Grazing open meadows. Young grasses & little con. to milchcows. Salt. 99 % grazing, 1 % concentrate
Autumn (Sep - Oct)
Migrate down at 2800 masl. Open grazing Calves given some conc. Dwarf bamboo, dry grass and sedges. 98 % grazing, 2 % conc.
Dairy Cattle .. Temperate (1800-2800 masl)Season Feeds
Winter (Nov. -Feb.)
Grazing crop lands, hay and silage, crop residues (straw). Chopped turnip/Swede mixed with 2 kg con. given to milch cows in gruel form. 30 % grazing, 30% hay, 30 % silage, 5 % root crops, 3 % crop residues and 2 % concentrates.
Spring(Mar. -May)
Most critical period. Oat, Straw & alcohol residues and concentrates fed to milchcows. 30% Oat , 20 % crop residues, 20% grazing, 5% home mixed feeds
Summer (Jun –Aug)
Pasture, full grazing/cut and carry . Conc. feeds for milch cows at 2 kg/cow. Herbaceous under growth. 90 % grazing, 10% concentrates
Autumn (Sep -Oct)
Grazing in pasture and fallow crop lands. Dry grass & crop residues. Hay Feeding by end of November. 80 % grazing, 10 % hay, 5% crop residues and 5 % concentrates
Dairy Cattle .. Mid altitude (1200-1800 masl) Season Feeds
Winter (Nov. -Feb.)
Pasture still available. Grazing. Cropresidues (straw and stover), fodder treesand planted fodder, maize, and oats30 % grazing/ tethering, 40 % cropresidues, 20 % planted fodder, fodder trees,oat, maize and 5 % concentrates.
Spring(Mar. -May)
Pasture/grasses regrow. Oat, Straw, alcohol residues and conc. to milking cows. Fodder trees and planted fodder.90 % grazing/cut and carry/tethering, 5 % Oat and 5 % concentrates.
Summer (Jun –Aug)
Pasture, full grazing/cut and carry . Conc. feeds for milch cows at 2 kg/cow. Herbaceous under growth in forests. 90 % grazing, 10% concentrates
Autumn (Sep -Oct)
Grazing in pasture/ fallow lands. Dry grass & crop residues. Hay Feeding by November. 80 % grazing, 10 % hay, 5% crop residues and 5 % concentrates
Dairy & buffaloes.. Subtropical (150-1200 masl)
Season Feeds
Winter (Nov. -Feb.)
Pasture green till December. Grazing. Cropresidues (straw and stover), fodder treesand planted fodder, maize, and oats30 % grazing/ tethering, 40 % cropresidues, 20 % planted fodder, fodder trees,oat, maize and 5 % concentrates.
Spring(Mar. -May)
Pasture/grasses grow. Oat, Straw & alcohol residues and conc. to milking cows. Fodder trees and planted fodder. 90 % grazing/cut and carry/tethering, 5 % Oat and 5 % conc.
Summer (Jun –Aug)
Pasture, full grazing/cut and carry . Conc. feeds for milch cows at 2 kg/cow. Herbaceous under growth in forests. 90 % grazing, 10% concentrates
Autumn (Sep -Oct)
Grazing in pasture/ fallow lands. Green grass & crop residues. 90 % grazing, 5% crop residues and 5 % concentrates
Compound / Concentrate Feeds
Concentrate feed is very
crucial for production
of milk, meat, eggs and
fibre. In dairy, it enhances
milk production
Bhutan – only 1 feed mill
(100 MT/day capacity)

22
Herd structure of Ruminants
Ruminant production system*
Total
(%)Livestock
type
Extensive
(%)
Mixed-
extensive
(%)
Mixed crop
livestock
(%)
Intensive
(%)
Dairy cattle 21.18 0 75.86 2.96 100
Dairy
buffalo
0 0 100 0 100
Non-dairy
cattle
99 0 1 0 100
Sheep 100 0 0 0 100
Goats 0 0 100 0 100
Yak 100 0 0 0 100
Mixed crop livestock system dominates ruminant production
Herd structure of mono-gastricsLivestock production system*
Total
(%)Livestock type Extensive
(%)
Semi-intensive
(%)
Intensive
(%)
Pigs 0 0 100 100
Chicken: Backyard /
smallholder
100 0 0 100
Chicken: Commercial
breeders
0 0 100 100
Chicken: Commercial
layers
0 0 100 100
Chicken: Commercial
broilers
0 0 100 100
Commercial poultry (layer & broiler) are reared under intensive system while backyard chicken is reared under extensive system
PigNo. of pigs Feed
(Kg/day)Total (Kg/day)
9403
@ 3
kg/day
28,209 i.e.
28.21 MT
PoultryNo. of poultry
Feed (Kg/day)
Total (Kg/day)
403159
@ 120
gm/day/bird
48379 i.e.
48.38 MT
Feed Requirements
Annual Feed requirement for pigs : 10,297 MT
Annual Feed requirement for poultry : 17658 MT
Use of feed ingredients (% DM)
Pigs Poultry
IngredientCompound Feeds
Compound
Feeds
Wheat
Maize 44 51
Soy meal/Cake 10 22
Oilseed Meal/Cake 10
DDGS b 8 5
Fishmeal 10 5
Molasses 2
Cereal Brans 20 14
Vegetable oils 2
TOTAL (%) 100 (%) 100 (%)
Proportion and type of ingredients would change according to the availability and prices
Factors for use of Ingredients
• Farm Labour /Human Resource
• Import of Ingredients
• Availability and price of Feed Ingredients
Tashi Delek

23
INDIA COUNTRY REPORT
T. Vaid and S. Anandan
FAO-APHCA Regional Workshop on
“Animal Feed Resources and their Management in the
Asia-Pacific Region”
COUNTRY PAPER
INDIA
1
> 17% of the world’s population & 11%
livestock and counting
4.2% of the world’s water
2.4% of the world’s area
142 m ha cultivated & 55 m ha net irrigated
137% cropping intensity
52% of population earns livelihood in agriculture
15.7% contribution in GDP
10.23% earning of total exports (~Rs. 86,000 crores)
India Today…
Few Facts
• ~ 500 million livestock
• ~ 650 million poultry
• proportion of unproductive cattle
• Uneven distribution of livestock and feed resources across agro-climatic zones
• Predominantly small holding systems
• < 5% area under fodder production over the years
• crop yield, crop residue quality ??
• Straw burning and diversion for other uses
• Export of oil cakes
• price of oil cakes and by products
Feed assessment methodology
• Primary survey- Time consuming, laborious
but reliable data
• Secondary survey – Quick, suitable for macro
assessments, information generated needs
refinements
• Combination of the two – combines the
advantages of both and suitable for
assessments at regional and national levels.
Approaches, data sources and methodologies
NIANP FEEDBASE – Based on secondary data
1) Crop production- Harvest index and extraction rates (DAC, Directorate of Economics)
2) Land use statistics – Area and biomass productivity (Directorate of Economics)
3) Livestock census – numbers and their productivity (DAHDF)
7
Production of cereals, pulses, oilseeds
& others
Area under cropped area,forests, pastures, fallows
etc.,
Extractio
n rate
sH
arvest in
dex
Bio
mass
Pro
du
ctivity
Potential feed resources available
Crop residues
GreensConcentrates
Nu
mb
ers age
w
ise an
d
pro
du
ctiivity
Cattle, buffalo. sheep. goat,equines, camels, yak,
mithun, pigs,commercial poultry,
Feed requirementsCrop
residuesGreensConcentrates
Feed balance
Adequate
Surplus Deficit
Protein Energy Protein Energy
Crop data Land use Livestock census
8

24
Conversion factors for various feed resources
Crop Conversion Factors Percent (of total produce)
Crop residues oilcakes Grains Bran &
chunnies
Paddy (Rice) 1.30 - 2.00 8.00
Wheat 1.00 - 2.00 8.00
Jowar
(Sorghum)
2.50 - 5.00 -
Bajra (Pearl
millet)
2.50 - 5.00 -
Barley 1.30 - 10.00 -
Maize 2.50 - 10.00 -
Ragi (Finger
Millet)
2.00 - 5.00 -
Small Millet 2.50 - 40.00 -
Other Cereals 2.00 - 10.00 -
Pulses 1.70 - - 3.00
9
Green fodder production potential of various land categories
Source Area Productivity/annum
Cultivated fodder 5% of the total cropped
area
40 tons/hectare
Forests 50% of the area
accessible for fodder
3 tons/hectare
Permanent pastures and
grazing lands
Total area 5 tons/hectare
Miscellaneous tree crops Total area 1 ton/hectare
Cultivable waste lands Total area 1 ton/hectare
Current fallows Total area 1 ton/hectare
Other fallows Total area 1 ton/hectare
Sugarcane tops Proportion of the
sugarcane yield
0.25 of the sugarcane
yield
Source- FEEDBASE, National Institute of Animal Nutrition and Physiology 11
For green fodder estimation - the area of land is multiplied by the
biomass production potential .
Factors considered for arriving at the
feed requirements
Species Factors
Cattle - Cross bred Adult body weight- 350 kg
Growth potential- 400 g/d
Milk production - state/national productivity
values provided by Department of Animal
Husbandry, Government of India
Cattle Indigenous Adult body weight- 250 kg
Growth potential- 200 g/d
Milk production state/national productivity
values provided by Department of Animal
Husbandry, Government of India
Buffalo Adult body weight-350 kg
Growth potential- 350g /d
Milk production- state/national productivity
values provided by Department of Animal
Husbandry, Government of India
13
Sheep & goat 90% of the population under extensive system with no concentrate
supplementation
10% of the population under semi intensive system with 25%
concentrate supplementation.
Dry matter requirement - 3% of the body weight.
Poultry Only commercial broilers and layers have been considered based on the
feed conversion ratio (FCR), assuming 3.5 and 40 kg of feed per broiler
and layer respectively.
Pigs Desi pigs- 35 kg slaughter weight and an FCR of 1:6
Crossbred pigs -70 kg slaughter weight and an FCR of 1:5
Equines ad mules Dry matter intake – 2% of body weight
Horses and donkeys Dry matter intake – 2% of body weight
Camels Dry matter intake – 2% of body weight
Yak Dry matter intake – 2% of body weight
Mithun Dry matter intake – 2% of body weight
Source- FEEDBASE, National Institute of Animal Nutrition and Physiology
14
Main screen of FEEDBASE – Feed distribution
Feed availability information in tabular form

25
Feed availability information in spatial (GISMap) form
Feed balance information in map form
Feed balance information in graphical form
Status of feed resources availability (%
deficit / surplus) under different
scenarios -2011
Scenario I – 100% each to productive & non productive animals
Scenario II – 90% to productive animals & 80% to non productive animals
Scenario III – 90% to productive animals & 60% to non productive animals
All India coordinated research project survey for feeding practices
Co-ordinated by NIANP21 Total centers- State agricultural Universities
ICARNGO
Surveyed the different agro-eco regions through primary survey for
Documenting feeding practicesIdentifying limiting nutrientsDeveloping appropriate feeding strategies
Agro eco regions
Broadly classified into 6 agro-eco
regions
Rainfed
Semi arid
Coastal
Irrigated
Arid
Hill and mountain

26
Rainfed agro eco region
Characteristics Occupies 63% of cropped area and contributes 45% of agriculture productionCoarse cereals, pulses, oilseeds and cotton are the major crops, Low crop productivity Livestock is a major source of livelihood
States Gujarat, Maharasthra, Madhya Pradesh, Karnataka,
Tamilnadu
Species Mainly Crossbred cattle ,local buffaloes, bullocks and
small ruminants
Feed resources Cereal grains, millets, rice bran, cereal straws, cotton
seed cake and groundnut cake
Limiting nutrients Protein, energy, Ca, P,Cu and Zn
Semi arid agro eco regionCharacteristics Erratic rainfall and water deficit
Greater reliance on livestock
States Rajasthan, Gujarat, Uttar Pradesh, and Maharasthra,
Species Mainly Crossbred cattle ,local buffaloes, small ruminants
Feed resources Legume straws, lucerne, berseem, fodder trees, green
fodder, sorghum stover, mustard cake, linseed cake,
sunflower cake, pulse chunnies
Limiting
nutrients
Dry matter, Protein, energy, Ca, P, Cu and Zn
Coastal agro eco region
Characteristics Supports livelihood of several millions rural poorAqua culture is predominant followed by agriculture, agro forestry and silvi culture Livestock rearing is an integral part and characterized by high crossbred cattle population and poultry
States Gujarat, Maharasthra, Andhra pradesh, Karnataka,
Kerala, Tamilnadu
Species Mainly Crossbred cattle , bullocks, buffaloes, pigs
Feed resources Native grasses, paddy straw, coconut cake, fodder trees,
banana leaves, tapioca waste
Limiting
nutrients
Protein, fiber, Ca, and Zn
In certain pockets excess feeding of concentrate
Irrigated agro eco region
Characteristics Impact of green revolution most evidentAccounts for 37% of arable land and provides 55% of agriculture productionLivestock is very prominent and characterized by high production potentialStagnation in the crop productivity is a major concernFurther enhancement of livestock productivity is an challenge
States Gujarat, Haryana, Punjab, Uttar Pradesh and Bihar
Species Mainly Crossbred cattle , buffaloes, and small ruminants
Feed resources Bajra grain, guar, rice bran, cotton seed cake, sugarcane
tops, berseem, lucerne
Limiting
nutrients
Protein, energy, Ca, P, Cu, Mn and Zn
Arid agro eco region
Characteristics Hot and cold region occupying 19% of geographical areaHigh water deficits and erratic rainfallDroughts marked by long spells are commonSupports 34% of livestock populationAvailability of adequate feed resources is major constraint
States Rajasthan, Gujarat, Andhra Pradesh
Species Mainly crossbred cattle , camel, buffaloes, sheep, goats
Feed resources Pastures, fodder tree leaves, local grasses, cotton seed
cake, cotton seed, wheat bran, rice bran, groundnut cake,
GN haulms, Guar,
Limiting nutrients Energy, Cu, Mn and Zn
Hilly and mountain agro eco regionCharacteristics Covers North western Himalaya and North Eastern Himalaya
Climatic variations, sloping land, small holdings, Absence of irrigation and low productivity are the major characteristicsSpecial practice of migratory system of grazing
States Himachal Pradesh, Uttaranchal, Arunachal Pradesh,
Assam nad Tamilnadu
Species Mainly crossbred & local cattle , buffaloes, sheep, goats,
yak and pigs
Feed resources Local grasses, fodder trees, kodo grain, mustard cake,,
cereal bran, water weeds, Pastures, fodder tree leaves,
local grasses, cotton seed cake,cotton seed, wheat bran,
rice bran, groundnut cake, GN haulms, Guar,
Limiting
nutrients
Dry matter, Protein, Energy, Ca, P, Mg, Cu, Mn and Co

27
Feeding systems (FS)
• Large diversity in feeding systems across agro-eco regions, species and within species
• Feeding systems governed by –resources(feed/livestock), production objective and economic returns
• Broad classification of FS– better understanding of the feed utilization and requirements
Systems Extensive (no or low
inputs)
Semi intensive systems
(moderate inputs)
Intensive /stall feeding (High inputs)
Local Cattle 80 % 10% 10%
Crossbred cattle
nil 60% 40%
Buffalo 60% 20% 20% Sheep 80% 18% 2%
Goat 85% 13% 2%
Yak & Mithun 99% 1% nil
Ruminant feeding systems
Monogastric feeding systems
Systems extensive system semi intensive systems
Intensive /stall feeding
Poultry
Commercial(layers & broilers)
nil nil 100%
Non commercial (local and backyard)
96-98% 3-4% nil
Aqua
Fishes 10% 90%
Shrimp 30% 70%
Pigs 80-85% 10-15% < 1%
Estimates of grain usage as livestock feeds (000 tons)
Feed used % Grains
Grain quantity Maize Sorghum Pearlmillet
Rice/ wheat
Broiler 11000 50-60 6051 5748 121 61 121
Layer 8100 40-45 3848 2886 462 385 115
Dairy- cooperative
3300 15 495 371 50 49 25
Dairy -Private 3700 5-10 278 209 33 28 8
Dairy - Ingredients
40000 5-10 3000 2100 300 300 300
Aqua sector 8610
345 215
130
Small ruminants
365 10-12 37 19 8 7 3
Pigs 728 20 146 73 37 29 7
Total 75803
14200 11621 1011 859 709
Knowledge gaps- crop related
• Inventory of all crops
• Potential agro byproducts and their
availability
• Harvest index/extraction ratios- regional
& varietal differences
• Non feed uses of feeds & byproducts
• Gap in the potential and actual
availability
Knowledge gaps- Green fodder
• Data on area under green fodder production, type of fodder and their productivity
• Updated land use data
• Biomass production potential of different land categories
• Regional variation in the production potential (grass cover, soil types, rain fall and biomass production potential)

28
Knowledge gaps- livestock related
• Livestock census interval – five years
• Time lag in publishing the information
• Production potential for other functions (growth, draft, reproduction etc)
• Mostly documented for milk production
• Production cycle of different species (age at first calving, lactation length, calving interval)
• Information on the feeding systems and feed resources utilization
• Distribution of livestock under different production/feeding systems
Knowledge gaps- others
• Local trading of feed resources – intra
and inter regional
• Fruits and vegetable/industrial by
products- availability and feed uses
• Import of feed resources/supplements
• Data from feed industry on the
volumes and the type of feeds and
ingredients used
Suggestions for bridging the gaps
• Develop a complete inventory of feed resources
• Co-ordinate with related departments to ensure that the required information is included and updated regularly
• Improve the precision of the data in terms of the land use data and the biomass production potential
Suggestions for bridging the gaps
• Coordinate with the feed, agro processing
industry to generate and share the data
• Animal husbandry departments –
documentation and reporting of the feeding
systems & feed resources and productivity
• Develop an exclusive agency to coordinate
and develop a mechanism for regular
updation, refinement and reporting

29
NEPAL COUNTRY REPORT
D. Yadav
Devendra Prasad Yadav
Chief Livestock Development Officer
Government of Nepal
Ministry of Agriculture Development
Department of Livestock Services
NATIONAL PASTURE AND ANIMAL FEED CENTER
Outlines of PresentationSN Title
1 Brief of Nepalese agriculture
2 Introduction to feed inventory
3 Approaches and methodology
4 Major findings
5 Government policies.. Act.. Regulations..
6 Knowledge gaps & approaches to bridge to those gaps
7 Conclusions and recommendations
Land use statistics
Category Area (000 ha)
Agricultural land cultivated 3 091 (21.0%)
Agricultural land uncultivated 1 030 (7.0%)
Forest land 4 268 (29.0%)
Shrub land 1 560 (10.6%)
Grass and pasture land 1 766 (11.9%)
Water 383 (2.6%)
Others 2 620 (17.8%)
Total 14 718
Source: - MOAC (2012)
Contribution of Livestock
Share in:National GDP~ about 12%Agricultural GDP ~ 30 %Total milk production: Cattle (30%) and buffalo (70%)Total meat production: Buffalo( 65%), Goat(20%)
poultry (7%) and swine (7%)
Above all livestock are: •Living bank-handy source of money at crisis •Insurance against crop failure •Ensures flow of money from urban to rural areas
Livestock Population, 2011/12
SN Species No. (million) %of HH keeping Sps
1 Cattle 7.2 ~60%
2 Buffalo 5.0 ~50%
3 Yak and crosses 0.06 ~1.4%
4 Sheep 0.8 ~0.3%
5 Goats 9.0 ~75%
6 Pigs 1.0 ~7%
7 Poultry 40.0 ~34%
8 Horse/mules 0.01
Source: MoAC, 2011
About 12% of cattle and 25% of buffaloes are milking
Livestock products and per capita availability (DLS, 2012)
Commodity Milk(‘000MT) Meat(‘000MT) Egg (Mill.)
Cattle 447.0 - -
Buffalo 1109.0 167.0 -
Goats - 52.9 -
Sheep - 2.7 -
Pigs - 17.9 -
Poultry - 17.1 704.0
Total 1556.0 257.6 704.0
Per capita
availability
51.0 l/yr 8.5kg/yr 24 nos./yr

30
NATIONAL FEED INVENTORY INTRODUCTION
Nepal - agrarian country - typical crop livestock mixed farming system
Livestock: an integral part of Nepalese farming system - shares about 30% to the AGDP
Livestock are kept for draught in agriculture, transport andmanure besides being a major source of income, whichcontributes nearly 36 – 47 % to the total income of farmhouseholds in different eco-zones and engages nearly 80% offarm families.
Increased urbanization, better mobility and the increased flow
of tourists have increased the demand for livestock products
which has led to increasing commercialization of livestock
Almost all Nepalese farming families keep some animals;
average livestock per family is about 4.8 head.
With increasing altitude the number of livestock per household
rises (Terai: 3.1 head per family; 12.2 in Mountains).
The Agricultural Perspective Plan (APP, 1995) has estimated
livestock growth from 2.9% to 6.1% by the end of a 2015
Accordingly its share in AGDP growth will rise from 31% to
45%
The most important limiting factor to meet this challenging
task is the feed and fodder deficit
Traditionally the major feed resources are crop residues and
by-products, forest, seasonal grazing land, and non-cultivated
areas.
Agricultural lands provide about 60% of the total annual feed
supply whilst 40% by forest and grazing lands (TLDP, 2002)
The feed balance is such that the total dry matter deficit, and
total green roughage deficit in the country is about 30.8% and
54.3%, respectively
Livestock in Nepal are in feed deficit by over three million tons
per annum (TLDP, 2002)
Great effort has to be made to provide adequate feed not only
to increase production, but also to lower the production cost:
only limited options are available to tackle this problem
APPROACH AND METHODOLOGY This report is obtained in present form through the critical review of various literatures
including journal articles, online articles, annual progress reports of various agencies,
institutions and organizations, statistical yearbook of Nepal, text books, research reports,
master and PhD theses etc.
The report has tried to provide detail information regarding to the feeds and feeding
situation in different seasons (summer and winter) in three ecological regions (Mountain,
Hills and Terai) of all five development regions (eastern, central, western, mid-western
and far-western) for each livestock species including ruminants and non ruminants
reared in Nepal
Tables and texts in this report are generated with the help of quantitative data available
in the reviewed articles and reports.
Data on feed assessment has been produced based on available information of different
types of feed manufactured for different livestock species.
Accordingly, total produced volume of feed has been presented based on reported values
for all the country representing last 12 years period that covers requirement of feed.
Indeed, feed assessment has been made considering all three major livestock rearing and two
types of feeds i.e. homemade and compound feeds.
Considering the similarity in nature of all ecological zones and belts calculations has been
made to represent the general scenario. Accordingly, the method followed includes:
Ruminant and non ruminant population has been divided proportionately to the each
production system e.g. Mixed extensive, crop-livestock and intensive systems
Those values were then multiplied by the total feed required per day per animal considering
homemade and compound feeds that gave the value of feed requirement per day to the
livestock population of each category of each species
In the meanwhile, calculation was made for major cereals and pulse ingredients used in feed
manufacturing that could compete to the human food. They were, wheat, maize, millet, barley,
rice, soybean and other pulses
Information thus collected were verified and approved by organizing a day workshop with the
key persons and professional experts from the Agriculture and Forestry University (AFU),
Nepal Agriculture Research Council (NARC) and Department of Livestock Services (DLS) in
Kathmandu Nepal on 12 July, 2013.
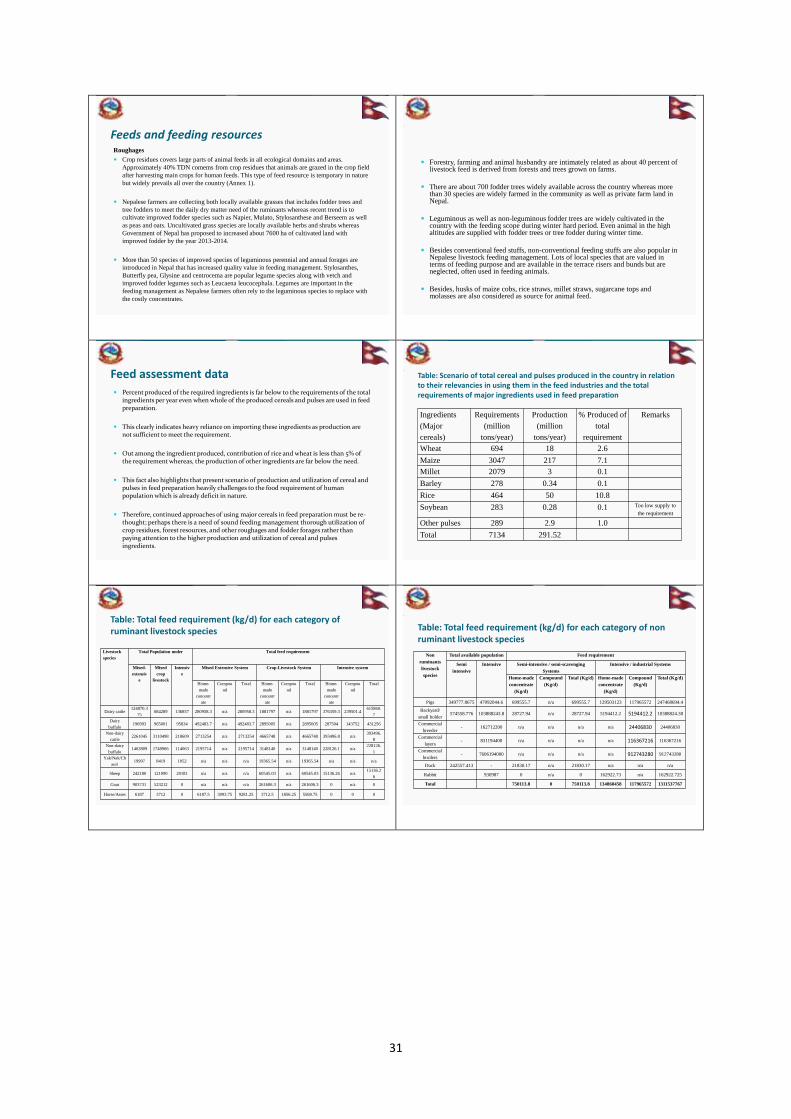
31
Feeds and feeding resourcesRoughages
Crop residues covers large parts of animal feeds in all ecological domains and areas.
Approximately 40% TDN comems from crop residues that animals are grazed in the crop field
after harvesting main crops for human feeds. This type of feed resource is temporary in nature
but widely prevails all over the country (Annex 1).
Nepalese farmers are collecting both locally available grasses that includes fodder trees and
tree fodders to meet the daily dry matter need of the ruminants whereas recent trend is to
cultivate improved fodder species such as Napier, Mulato, Stylosanthese and Berseem as well
as peas and oats. Uncultivated grass species are locally available herbs and shrubs whereas
Government of Nepal has proposed to increased about 7600 ha of cultivated land with
improved fodder by the year 2013-2014.
More than 50 species of improved species of leguminous perennial and annual forages are
introduced in Nepal that has increased quality value in feeding management. Stylosanthes,
Butterfly pea, Glysine and centrocema are popular legume species along with vetch and
improved fodder legumes such as Leucaena leucocephala. Legumes are important in the
feeding management as Nepalese farmers often rely to the leguminous species to replace with
the costly concentrates.
Forestry, farming and animal husbandry are intimately related as about 40 percent of livestock feed is derived from forests and trees grown on farms.
There are about 700 fodder trees widely available across the country whereas more than 30 species are widely farmed in the community as well as private farm land in Nepal.
Leguminous as well as non-leguminous fodder trees are widely cultivated in the country with the feeding scope during winter hard period. Even animal in the high altitudes are supplied with fodder trees or tree fodder during winter time.
Besides conventional feed stuffs, non-conventional feeding stuffs are also popular in Nepalese livestock feeding management. Lots of local species that are valued in terms of feeding purpose and are available in the terrace risers and bunds but are neglected, often used in feeding animals.
Besides, husks of maize cobs, rice straws, millet straws, sugarcane tops and molasses are also considered as source for animal feed.
Feed assessment data
Percent produced of the required ingredients is far below to the requirements of the total ingredients per year even when whole of the produced cereals and pulses are used in feed preparation.
This clearly indicates heavy reliance on importing these ingredients as production are not sufficient to meet the requirement.
Out among the ingredient produced, contribution of rice and wheat is less than 5% of the requirement whereas, the production of other ingredients are far below the need.
This fact also highlights that present scenario of production and utilization of cereal and pulses in feed preparation heavily challenges to the food requirement of human population which is already deficit in nature.
Therefore, continued approaches of using major cereals in feed preparation must be re-thought; perhaps there is a need of sound feeding management thorough utilization of crop residues, forest resources, and other roughages and fodder forages rather than paying attention to the higher production and utilization of cereal and pulses ingredients.
Table: Scenario of total cereal and pulses produced in the country in relation to their relevancies in using them in the feed industries and the total requirements of major ingredients used in feed preparation
Ingredients
(Major
cereals)
Requirements
(million
tons/year)
Production
(million
tons/year)
% Produced of
total
requirement
Remarks
Wheat 694 18 2.6
Maize 3047 217 7.1
Millet 2079 3 0.1
Barley 278 0.34 0.1
Rice 464 50 10.8
Soybean 283 0.28 0.1 Too low supply to
the requirement
Other pulses 289 2.9 1.0
Total 7134 291.52
Table: Total feed requirement (kg/d) for each category of ruminant livestock species
Livestock
species
Total Population under Total feed requirement
Mixed-
extensiv
e
Mixed
crop
livestock
Intensiv
e
Mixed Extensive System Crop-Livestock System Intensive system
Home-
made
concentr
ate
Compou
nd
Total Home-
made
concentr
ate
Compou
nd
Total Home-
made
concentr
ate
Compou
nd
Total
Dairy cattle124870.3
75684289 136857 280958.3 n/a 280958.3 1881797 n/a 1881797 376359.3 239501.4
615860.
7
Dairy
buffalo196993 965001 95834 492483.7 n/a 492483.7 2895005 n/a 2895005 287504 143752 431256
Non-dairy
cattle2261045 3110498 218609 2713254 n/a 2713254 4665748 n/a 4665748 393496.8 n/a
393496.
8
Non-dairy
buffalo1463809 1748966 114063 2195714 n/a 2195714 3148140 n/a 3148140 228126.1 n/a
228126.
1
Yak/Nak/Ch
auri19997 8419 1052 n/a n/a n/a 19365.54 n/a 19365.54 n/a n/a n/a
Sheep 242180 121090 20181 n/a n/a n/a 60545.03 n/a 60545.03 15136.26 n/a15136.2
6
Goat 903731 523212 0 n/a n/a n/a 261606.3 n/a 261606.3 0 n/a 0
Horse/Asses 6187 3712 0 6187.5 3093.75 9281.25 3712.5 1856.25 5568.75 0 0 0
Table: Total feed requirement (kg/d) for each category of non ruminant livestock species
Non
ruminants
livestock
species
Total available population Feed requirement
Semi
intensive
Intensive Semi-intensive / semi-scavenging
Systems
Intensive / industrial Systems
Home-made
concentrate
(Kg/d)
Compound
(Kg/d)
Total (Kg/d) Home-made
concentrate
(Kg/d)
Compound
(Kg/d)
Total (Kg/d)
Pigs 349777.8675 47092044.6 699555.7 n/a 699555.7 129503123 117965572 247468694.4
Backyard/
small holder574558.776 103888243.8 28727.94 n/a 28727.94 5194412.2 5194412.2 10388824.38
Commercial
breeder- 162712200 n/a n/a n/a n/a 24406830 24406830
Commercial
layers- 831194400 n/a n/a n/a n/a 116367216 116367216
Commercial
broilers- 7606194000 n/a n/a n/a n/a 912743280 912743280
Duck 242557.413 - 21830.17 n/a 21830.17 n/a n/a n/a
Rabbit 930987 0 n/a 0 162922.73 n/a 162922.725
Total 750113.8 0 750113.8 134860458 117965572 1311537767

32
Table: Calculation of total requirement of feed ingredients and their supply situation in Nepal, 2013
Feed Ingredients
Requirement
Grand Total
(t/yr)
Total
production
(t/yr)
% Produced of
the
requirement
Ruminants Non ruminants
Total (Kg/d) Total (t/yr) Total (Kg/d) Total (t/yr)
Wheat 999876.2658 364955 18937486.87 69121827 69486782 1846142.294 2.6
Maize 3470337.989 1266673 83150777.24 303500337 304767010 2179413.61 7.1
Barley 356946.9545 130286 7607284.294 27766588 27896873 34829.83384 0.1
Millet 563863.4196 205810 7607284.294 27766588 27972398 315066.6 0.1
Rice 410000.3966 149650 12693809.43 46332404 46482055 5072248.47 10.8
Soy 1567785.475 572242 7607284.294 27766588 28338829 28269.8222 0.1
Pulses 1406257.385 513284 7783734.291 28410630 28923914 291499.9437 1.0
Table: Calculation of amount of requirement of feed ingredients to each category of livestock species, 2013
Ruminant
s
Wheat Maize Barley Millet Rice Soy Pulses
%
contri
butio
n
Total
amount
(t/yr)
%
contribu
tion
Total
amount (t/yr)
%
contribu
tion
Total
amount
(t/yr)
%
contributi
on
Total
amount
(t/yr)
%
contrib
ution
Total
amount
(t/yr)
%
contrib
ution
Total
amount
(t/yr)
%
contribu
tion
Total
amount
(t/yr)
Dairy
cattle60 218973 50 633336.5 25 32571.5 25 51452.5 25 37412.5 35 200284.7 25 128321
Buffalo 30 109486.5 30 380001.9 25 32571.5 25 51452.5 35 52377.5 25 143060.5 25 128321
Goat 8 29196.4 18 228001.1 25 32571.5 25 51452.5 20 29930 20 114448.4 25 128321
Sheep 2 7299.1 2 25333.46 25 32571.5 25 51452.5 20 29930 20 114448.4 25 128321
Non-
ruminants
Wheat Maize Barley Millet Rice Soy Pulses
%
contri
butio
n
Total
amount
(t/yr)
%
contribu
tion
Total
amount (t/yr)
%
contribu
tion
Total
amount
(t/yr)
%
contributi
on
Total
amount
(t/yr)
%
contrib
ution
Total
amount
(t/yr)
%
contrib
ution
Total
amount
(t/yr)
%
contribu
tion
Total
amount
(t/yr)
Pig 70 13256240.8 30 91050101.1 50 13883294 50 13883294 60 27799442.4 40 11106635 40 11364252
Poultry 30 5681246.06 70 212450236 50 13883294 50 13883294 40 18532961.6 60 16659953 60 17046378
Tariffs/barriers to feed imports
Recently, Government of Nepal also has emphasized in its policy to support private industries in facilitating custom duties and relaxing rules and tariff regulations in purchasing important ingredients from abroad.
Agricultural reform duty is levied at a flat rate of 10% ad valorem on those agricultural products that face no customs duty. Thus, even those imports eligible for duty free import from India and Tibet are subject to a levy.
The purpose of this duty seems to provide some protection to domestic products while remaining within the broad framework of the Nepal-India bilateral treaty, which provides for trade in primary products free from customs duty and quantitative restriction.
A local development duty is also levied on importable items at the rate of 1.5% ad valorem (Chapagain, 2004).
It is evident from the tariff structure that poultry products have some protection as compared to feed. In case of feed, it is somewhat complex to determine the level of tariff protection.
In addition, Nepal has also committed to amend existing relevant laws rules and regulations to make them WTO compatible (WTO, 2003).
Of direct concern to the poultry industry are the laws concerning export and import and customs valuation listed in the legislative action plan of Nepal’s submission to the WTO.
Nepal also committed to introduce a new law on anti-dumping by July 2004.
Parallel to this development, the government is also reviewing the current Food Act 2023 (1966) with an intention to update it to meet the future feed requirements (Chapagain, 2004).
Restrictions on exports
There are no export duties on any of the poultry products
Two feed ingredients, namely rice bran and molasses, are however subject to export duty at the specific rate of Rs. 0.25 per kilogram (Chapagain, 2004)
This is subjected to change in terms of price adjustment. Nepal already lacks enough feeds and feeding materials to support its growing livestock
Therefore government’s policy is to move towards self sufficiency in feed production and supporting its livestock’s requirement thus major ingredients related to feed production are restricted to export
This seems to be continued in the future in order to safe guard the growing livestock population and livestock related industries
Drivers including the policy options
Employment generation- Government of Nepal is encouraging its people to create employment through self efforts whereas out among the natural resource sector livestock is also one of the increased interest creating sectors for employment generation.
Youth Self-employment Fund of Government of Nepal has been especially involved in creating jobs/employments to the youths that are largely based to the livestock sector.
Issues related to feeds and feeding management are already becoming a matter of great concern of the farmers/entrepreneurs.
Marketing potentials- Livestock sector has ever increasing potentials of marketing in Nepal. Most of the livestock produced are domestically consumed whereas it hasn’t met the potential meat requirement of people in the country.
Marketing potentials is thus related with industry development that is well linked to the pricing, quality as well as quantity supply of feed ingredients.

33
Knowledge gaps
Precise information on exact dry matter requirement of each species under different categories of rearing systems and stage of rearing (lactation, dry, pregnant)
Exact contribution of seasonal forages (local), crop by-products, their volume and nutritional values at different stage of harvesting that could be varied according to the niche specific context
Well prediction of dynamics of animal population covering different stages of growth
Real use and contribution of major cereal ingredients to the dominant rearing systems in terms of feeding management
Approaches that could help in bridging knowledge gaps
Continued preparation of feed inventory covering resource base, feeding systems, niche specific variation rather than broad ecological domain
Generation of required data at lower level of system hierarchy (at village and community level) by DLS in association with other line agencies and NGOs
Conduction of representative workshops at lower level of system hierarchy (at village and community level) to verify the obtained data and to update the inventory with the involvement of major stakeholders
Major assumptions
There is no or least variation existed in different eco-zone in relation to the existing livestock rearing systems
Major sources of feeds in Nepalese livestock feeding management comes from natural resource base including crops residues and seasonal fodder/forages that they are similar in nature in terms of contributing to the feeding management (quantity issue)
Fodder tree including non-conventional feeds contribute major say during winter season whereas those contributions are similar and peculiar only in the mid-hills of Nepal
Feeds ingredients are largely used as minimum quantity in rest of the systems whereas intensive system use major ingredients that can compete to the human food as well
Verification of major assumption in order to improve quality of the data/information
Available published literatures have consistently used similar statistics that reflects consistency in nature of available data
Government of Nepal and other authentic data sources also have used similar assumption while generating data bases that also resembles to the data on feed inventory
40% of the total land in Nepal has been covered by forest resource whereas only 25% arable lands barely contribute to the animal feeds thus natural resource base reflects valid assumptions
Conclusions and recommendations Nepalese farming system is typically crop-livestock integrated in nature where
role of livestock is pivotal in supporting the livelihood of Nepalese people.
All types of livestock species including ruminants, non-ruminants are reared in across the ecological domains where feeding management is often traditional in nature.
Forest, crop lands, crop residues, stovers and by-products are major feed resource in Nepal. The role of these sectors are seasonal in nature especially while contributing to the feeds needs of the existing species.
Livestock feed situation is not constant in terms of seasons as well as ecological belts. Winter is the hard hit season to supply feeds whereas lush of feeds and feed by-products are available during summer time.
The role of conservation fodder is minimal in overall to mange feed requirements and supply.
Fodder trees and tree fodder plays pivotal roles in feeds management during winter hard period as more than 100 fodder species are domesticated in the country.
Leguminous as well as non-leguminous fodder trees are common in practice.
Hundreds of improved fodder species including perennial legumes are introduced in the country that has increased access to the feeds and feeding management in the country.
Government current policy is friendly and practical that aims to manage sustainable feeds utilization and resource use through proper management.
Government of Nepal has implemented several policies to regulate production and quality aspects of feeds and feeding management that would, hopefully, support in mitigating DM requirements of increasing livestock population

34
PAKISTAN COUNTRY REPORT
G. Habib
Feed Assessment & Management in Pakistan
Ghulam Habib
5 out of 10 highest value Pakistani Commodities are Livestock -2011
0
2000
4000
6000
8000
10000
Val
ue
in In
t. $
bill
ion
FAOSTAT., 2013
Livestock share in national GDP sustained better than crops
0
2
4
6
8
10
12
GD
P %
Crops
Livestock
High Consumption of animal origin food has raised the production demand
0
1000
2000
3000
4000
1980 1990 2000 2015
1000 tonnes
Year
Meat total
Beef and buffalo
Sheep and goat
Poultry
Milk (/10)
0
2
4
6
8
10
Beef Mutton Poultry Meat
Pro
du
ctio
n m
illio
n t
on
2005-06 2011-12 Growth %/yr
David Hall,2004Economic Survey Pakistan, 2011-12
Demand Driven Livestock Population Growth in Pakistan
0
10
20
30
40
50
60
70
1955 1960 1972 1976 1986 1996 2000 2006 2012
Mill
ion
nu
mb
er
Years
Cattle
Buffaloes
Sheep
Goats
Fragmented Farm Base
0 20 40 60 80
>50
16-50
7-15
1-6
%
He
rd S
ize
Buff
Cattle
0 20 40 60 80
>350
76-350
31-75
1-30
%
Flo
ck S
ize
GoatSheep

35
Heterogeneous Distribution of Livestock in 10 Agro-Ecological Zones
Distribution of livestock species driven by Feed Resources
Cattle Buffalo
Sheep Goats
Feed Resource Inventory Approach / Methodology used
1. Crop based Feed Resources:
Crop types, acreage and yield: Official statistics
Crop residues yield : Extraction ratio local data
Grain use in ruminant feed: estimate based on local practices, survey reports, feed compounding data
Oilseed cakes/meals: used extraction ratio local data & literature values
Proportion used for cakes & meals got from local main processors
Imported oilseeds & meals: from official statistics
Grain Byproducts: extraction rate local data from milling industry
Feed Resource Inventory Approach / Methodology used
2. Fodder Crops: Official statistics on aggregated summer and
winter cultivated fodder
3. Grazing:
Grazing land: Official statistics on land utilization
Feed from grazing land: Published data , project reports
4. Nutrient Composition of Feeds: Local composition tables
5. Animal Numbers & Feed Requirement• Used Pakistan Livestock Census 2006 as a base line
• 1996-2006 inter-census growth rate for estimating 2010-11 numbers
• Feed Requirements: NRC standards for dairy cattle, sheep and goats
• Minimum dry matter intake as 2 percent of BWT
Characterization of Production Systems & Feeding Management
Approach used1. Agro-ecological zones: Distribution & agro-climatic feature
published by National Agric. Research Center (PARC)
2. Livestock distribution & feeding practices in 4 production systems: Estimated based on fragmented survey /project reports and unpublished information from provincial livestock departments
3. Pricing of feed ingredients: published data and personal communication
4. Government policies on animal feed: Ministry of National Food Safety and Research
Feed Resources
Crop Residue59%
Oil Cakes,Bran5%
Grains1%
Fodder26%
Grazing9%

36
Heterogeneous Feed Resources
Crop Residue
61%
Oil Cakes 5%
Grains1%
Fodder31%
Grazing2%
Punjab Province
Agricultural land 49%
Crop Residue
62%
Oil Cakes6%
Grains1%
Fodder16%
Grazing15%
Sindh Province
Crop Residue
57%
Oil Cakes,3%
Grains1%
Fodder16%
Grazing23%
KP province
Agricultural land 8%
Crop Residue
28%
Oil Cakes2%
Grains0%
Fodder7%
Grazing63%
Baluchistan Province
Agricultural land 2.4%
Agricultural land 31%
Crop residues constitute bulk feedCrop residue Thousand Tons %
Rice straw 7,235 10.8
Wheat straw 37,821 56.3
Barley straw 107 0.2
Maize stover 11,121 16.6
Millet stover 1,384 2.1
Sorghum stover 565 0.8
S. Cane leaves 4,839 7.2
Guar straw 809 1.2
Pulses straw 2,641 3.9
Others 608 0.9
Total 67,137 100.0
Estimated Feed Balance
0
20
40
60
80
100
120
140
160
DM CP TDN
Mill
ion
To
ns
Available
Requirement
Million Tons
DM CP TDN
Available 113.4 8.5 61.2 Requirement 139.9 12.6 80.7 Balance -26.4 -4.1 -19.4Percent -18.9 -32.8 -24.1
Grain use as animal feed 2010-11thousand tons
Grain Poultry Sheep, Goats
Dairy Cattle & Buffaloes
Total Consumption
Domestic Production
Maize 1,922 53 1,043 3,018 3,707
Broken Rice 123 - 21 144 772
Millet 205 31 6 245 346
Sorghum - 23 7 30 147
Barley - 15 21 37 71
Total 2,250 122 1,098 3,470 5,043
2020 4,050 244 1669 5,963 ?
Commercial Fish & quails faming will further add to grain need
Oilseed Byproducts –meals/cakes 210-11Thousand Tons
Soybean Cottonseed
Rapeseed & canola
Sunflower
Guar Total
Poultry 408 449 123 41 1,021
Ruminant 4,022 421 126 - 4,569
Total 408 4,022 870 249 41 5,590
Production 434 3,782 421 506 51 5194
Protein meals are imported to meet the domestic demand
0
100
200
300
400
500
SBM CSM RSM CM SFM GM
Tho
usa
nd
To
n
Domestic
Imported
Dependence on import of oil meals will continue for poultry, fish and dairy sectors in future

37
Animal Distribution in Production Systems
Livestock typeExtensive
Mixed-
Extensive
Mixed Crop
Livestock
(%)
Intensive
(%) (%) (%)
Dairy Cattle &
Buffalo44 12 35 9
Sheep & Goats 67 20 12 1
Poultry 10 0 0 90
Yak 100 0 0 0
Camels 70 30 0 0
Extensive Production System
• Country’s major production system
• Large herd size,
• Small ruminant dominant ( SR 64%, LR 36%)
• Entirely depend on grazing lands, No suplt.
• Use of grazing lands depend on timing & intensity of rain fall
• Nomadic and Transhumant systems (landless)
• Large diversity in arid, desert EPS and semi arid, subhumid hilly EPS---- migratory system as mitigating measure
Mixed Extensive System
• Grazing + stall feeding; sedentary small size flocks/herds
• Crop residues, hay, tree leaves, fodder
• Home mixed supplement to milking cows & goats only (oil cakes + cereal bran, other grain byproducts 40:60)
• Fattening kids, lams for Eid fed grain based suplt for 4 months (200g/d)
Mixed Crop-Livestock System (MCLS)
• Small holder farming- mixed spp.• Accommodate nearly half of LR &
one third of SR• Feed dependency on arable land• Complementary roles• Contribute 70% milk supply• Diversified – arid and irrigated
regions– Herd size & species composition– Input-output– Breed quality– LR/SR ratio– Land for fodder– Market access
Mixed Crop-Livestock System (MCLS)
Supplement Feeding• 95% farmers use home-mixed
conc. & 5% compound feed• Oilseed cake, cereal bran ,
grains/dried bread as 45:45:10• Fed to milking & adv. Pregnant
cow, buff (3 kg/d) & goats (300g/d)
• Occasional Special supplement oil/ghee 500 ml , raw sugar 1 kg to milking cows/buff
• Animal Fattening for eid on grain-oilseed cake, bran (20:40:40) based suplt.
• Dry & growing animals not given suplt.
• Silage making slowly adopted
Intensive Production SystemDairy Cattle & Buffalo
• Close to urban settlement
• Small scale: <100 anim, medium Scale: 100-300 anim, large scale : 300 - >1000 anim
• Small, medium farms are buff dominant
• Large scale farms have exotic cow breeds
• Rising interest in dairy intensification
0
10
20
30
40
50
60
1-6 7-20 21 - >50
Cat
tle,
bu
ff %
of
Tota
l nu
mb
ers
Herd Size
1996 2006

38
Intensive Production SystemDairy Cattle & Buffalo- Feeding Systems
• Less fodder (15-20 kg/anim) & more concentrate ( 6-12 kg/anim)
• Small, medium farms are more traditional, 80% prepare own suplt.- oilseed cake-cereal bran based (50:50)
• Large scale farms have State of art Technology, use compound feed ( grain, oilseed cake , cereal bran, molasses 20: 30:40:10)
Intensive Production SystemDairy Cattle & Buffalo- Feeding Systems
Suppl. feeding practices in small, medium farms
• No or little grains – Imbalance E/P
• No minerals added - wide Ca:P ratio 2:11-2:13
• Fixed allowance not based on milk yield
• Not cost effective – overburden low producers & deprive higher producer
• High N & P excretion – Env. Pollution
• High afflation intake from moldy dried bread & CSC --
--decreases milk , reprod and make milk unsafe for human consumption
Baled Silage is getting popular for solving fodder problem
Animals are fed large amount of cereal straw during fodder shortage in peak summer and peak winter months . Baled silage as effective alternative for landless commercial dairy farms
Issues/missing InformationFeed Resource Inventory
Crop Residues• Changes in extraction ratio with varietal shift in cereal
cultivation • Multiple use of crop residues as feed, fuel, industry &
other• Movement/trading of crop residues among different AEZ
Grains• Quantity used in ruminants, equine, rural poultry, quails
and fish feeds• Grains used in food processing and directly consumed by
human • Export/Import
Issues/missing InformationFeed Resource Inventory
Oilseed Byproducts
Data Compilation on
• Local extraction rates of oil cakes & meals
• Proportion of seeds used for meals and cakes
• Imported oilseeds & meals and export
• Proportion by type used in diets of different animals, seasonal & geographical variation
Grain byproducts
Data compilation on local extraction rates of bran, polishing, husk, milling waste

39
Issues/missing InformationFeed Resource Inventory
Fodder crops
• Land utilization & yield data on fodder crop reported by statistical bureau – questionable
• Data on fodder species/varieties & zonal distribution
• Seasonal variation - impact of climate change
• Quantity of non-cultivated forages (grasses, tree leaves, weeds, crop thinning)
• Hay and silage making
• Quantity exported?
Issues/missing InformationFeed Resource Inventory
Grazing
• Most neglected area
• 20-30 years old data
• Carrying capacity of range lands-quantification
• Degradation of range lands-changes in vegetation cover (biomass & quality)
• Reduction in grazing lands-erosion & agric. & other uses
• Grazing practices; AEZ & seasons
Issues/missing InformationFeed Resource Inventory
• National Livestock Census is conducted after every 10 years---long gap
• Validity of estimates based on old data ?• Quality of Livestock Census data is not up to the mark
– Milk production data misleading ?– Missing information on fattening – Missing information on intensive system– No data on primary feeding systems (grazing, stall feeding,
both)– No consideration for AEZ
• Data on commercial fish farming and quails farming not traceable
Way Forward
Main Cross Cutting Issue is;
Scattered information, raw data, no compilation & Updating on regular basis
• Need institutional set up to collect, update, identify gaps & generate missing data
• Use university students in each province as work force
• Funding needed to support the activity at national level with coordinating units in each province
• Regional partnership for experience sharing & exchange of knowledge

40
SRI LANKA COUNTRY REPORT
G. Premalal
Regional Workshop on
“ Animal Feed Resources and their Management”
in Asia-Pacific Region
Bangkok, 13-15 August 2013
Country Report- Sri Lanka
G.G.C.Premalal1
and W.K. de Silva2
1. Research Officer, Department of Animal Production and Health (DAPH)
2. Director General, Department of Animal Production and Health (DAPH)
Ministry of Livestock and Rural Community development (MLRCD)
Sri Lanka
Introduction – Agro ecological and livestock
Agro ecological
background
Main features
Monsoonal rains- 2 periods
South West
North East
May – Sep; “Yala”
Nov – Feb; “Maha”
Rainfall – 3 climatic zones
Wet Zone
Intermediate Zone
Dry Zone
Highlands and the southwest parts;
> 2500 mm; Both Monsoonal rains
Narrow strip of land fringing the
highlands to the North and East;
1750-2500mm
Northern and Eastern lowlands ;
North East Monsoon; < 1750mm;
Altitude- 3 regions
Low Country
Mid Country
Up Country
< 300 mm; Covers 2/3 of the
Island.
300 – 900 mm
> 900
Livestock- 2 Distinct regions
Coconut Triangle
Jaffna Peninsula
Main coconut area; Wet and
In termediate zones; < 300m;
1750 – 2750 mm
Dar zone; < 300; 1200-1750mm
Introduction – Agro ecological and livestock
Major ecological zone/Livestock zone
Elevation from
sea level (m)
Rainfall
(mm/yr)
Temp.
Range CO
Low country wet zone < 300 2500 - 2750 25 - 30Low country intermediate zone < 300 1750 - 2500 25 - 30Low country dry zone < 300 < 1750 30 - 37Mid country wet zone 300 - 900 2500 - 3000 22 - 27Mid country intermediate zone 300 - 900 2000 - 2500 22 - 27Hill country wet zone > 900 > 2500 13 - 15Hill country intermediate zone > 900 2500 - 2750 20 -25Coconut Triangle < 300 1750 - 2750 25 - 30Jaffna Peninsula < 300 1200 - 1750 30 - 37
9 ecological and livestock
zones
Introduction –Livestock Sector
Animal Species Purpose of Keeping Total of each species in 2012(million)
Cattle Milk, Draft 1.23
Buffalo Milk, Draft 0.41
Goat Milk, Meat 0.38
Sheep Meat 0.0091
Poultry-Chicken Meat, Eggs 14.03
Poultry- Ducks Meat, Eggs 0.0012
Poultry – Geese, Guinea Fowl, Quail, Turkey etc.
Meat, Eggs ?
Swine Meat 0.089
Reared under different;•Environmental/ecological• Production/farming systems•Feeding systems – extensive, supplementary extensive, mixed feeding, intensive
•Socio economic backgrounds; landholdings, level of wealth, ethnic groups etc.
Animal feed resources
Feed Type Source
Green forages (pasture/fodder/Herbage)
100% local
Crop residues (straw/stover/tops/leaves)
100% local
Grains (maize/sorghum/wheat)
55% local45% imported
Grain by-products(rice polish/rice bran/wheat bran)
98% local2% imported
Oil seed cake/meal(coconut poonac/ soya meal/rape seed meal)
10% local(90% imported
Toot/tuber/their by- products(cassava/sweet potato)
100% local
Animal by-products(fish meal/meat & bone meal)
10% local90% imported
Source: Data Bank (2011), Divisions of Pasture and Fodder Crops; and Animal Nutrition, Veterinary Research Institute
Animal feed resources
Green forage sources, their land extents and expected productions
Source Land Extent
(000' ha)
Expected dry matter production
(MT/yr)
Favorable
(Rainy season)
Unfavorable
(Drought
season)
Permanent Pasture under large farms -
well managed pasture
5.7 68,400 27,360
Permanent Pasture under large farms -
poorly managed pasture
13.27 52,800 13,200
Permanent Fodder under large farms -
well managed
1.87 93,500 70,125
Cultivated fodder under small/medium
holders
18.5 925,500 308,330
Coconut plantations (30% of total coconut
lands)
145.0 725,000 181,250
Marginal tea lands 30.23 151,150 50,380
Fellow paddy fields/bunds 150.0 400,000 160,000
Road sides/Railway embankments 5.0 40,000 12,000
All the types of natural
grasslands/scrubs/wastelands (50% total
land extent)
530 1,590,000 170,500
Total 898.57 4,046,350 993,145Source: Data Bank (2011), Division of Pasture and Fodder Crops, Veterinary Research Institute

41
Animal feed resources
Production and potential availability of residues of major crops in Sri Lanka
Source: Modified by the authors on data of Department of Census and Statistics, 2011-2012
Crop Type of residue Residue: Crop
yield ratio
Dry Matter
Content (%)
Expected Dry
Matter Quantity
(MT/yr)
Rice Straw 1:1 90 2,493,961
Maize Stover 3:1 75 39,746
Sorghum Stover 4:1 75 360
Meneri Straw 4:1 90 72
Kurakkan(Millet) Straw 4:1 90 2,545
Ground Nut Vines(Stem and leaves) 5:1 80 56,520
Green Gram Vines(Stem and leaves) 4:1 80 29,856
Soybean Vines(Stem and leaves) 4:1 80 13,888
Cowpea Vines(Stem and leaves) 4:1 80 36,992
Black gram Vines(Stem and leaves) 4:1 90 31,104
Gingerly Stem and leaves 3:1 90 23,625
Cassava Leaves 3:1 25 170,827
Sweet Potato Vines(Stem and leaves) 5:1 30 69,090
Sugar Cane Top leaves and stems 4:1 35 373,800
Animal feed resources
Raw materials used (locally available and imported)
Source : Division of Veterinary Regulatory Affairs, DAPH; 2012
Type Raw Materials Local Imported
Total
UsageCereals 1.Maize 90698.21 1.8 90700.01
2.wheat 0 49166 49166
3.Dhall Powder 82.99 82.99
3.Others(Sorghum) 1257 459 1716
Cereal by Products 1.Rice Polish 46035.7 2.2 46037.9
2.Rice Bran 1673.74 1673.74
3.Wheat Bran 14082.714 14082.714
4.Wheat Flour 164 1128 1292
5.Broken Rice 7868 7868
9.Wheat Midds 2566 2566
10.Dhal Husk 1900 1900
Oil Meals 1.Coconut Meal/Poonac 10716.963 10716.963
2.Soya Bean Meal 9424.62 86272 95696.62
3.Rape Seed Meal 0 271 271
4.Other (hypro soya & full fat Soya) 1908 297 2205
Animal by products 1.Fish Meal 1618.53 5152 6770.53
2.Meat & Bone Meal 476.23 16202 16678.23
3.Milk Powder 26.69 26.69
4.Poultry Offal Meal 938 938
5.Others 5.1 40 45.1
The approaches, data sources and methodologies used in
generating data
Groups considered.
• Current livestock populations and age groups under different animal species and commodities
• Livestock production and feeding systems
• Green forage (both natural and cultivated fodder) production potential
• Production of crop residues and agricultural by-products
• Importation of feed ingredients
• Local production of compound feeds
• Home/Farm use of concentrates and compound feeds
The approaches, data sources and methodologies used in
generating data
Main data sources
• Agriculture and Environment Statistics Division, Department of Census and Statistics
• Central Bank Reports and Statistics in Agriculture and Livestock
• Ministry of Livestock and Rural Community Development (MLRCD)
• Department of Animal Production and Health (DAPH)– Division of Livestock Economics and Planning
– Division of Veterinary Regulatory Affairs
– Division of Veterinary Research (Veterinary Research Institute)
• Animal Nutrition Research Unit
• Pasture and Fodder Research Unit
• Farming Systems Research Unit
• Research and review articles pertaining to animal feed production and utilization
• Other related data sources
Main Livestock feeding Systems
Ruminants: Dairy cattle and buffalo
Extensive Feeding System (EFS)
Supplementary Based Extensive Feeding System (SEFS)•Green forage supplementary based feeding system (Natural green forage +cut tree leaves)•Concentrate supplementary based feeding system (Natural green forage + Concentrates)
Mixed Feeding System (MFS)•Green forage crop residue based feeding system (Green forages on grazing/roaming/tethering with crop residues) •Crop residue agro by-product based feeding system (Crop residues with agro by-products)•Green forage agro by-product based feeding system (Green forages on grazing/roaming/tethering with agro by-products)
Intensive Feeding System (IFS)•Cut green forage and agro by-product based feeding system (Cut green forage with agro by-products)•Cut green forage and compound feed based feeding system (Green forage with compound feeds)•Intensive grazing with compound feed based feeding system (Green forage on grazing with compound feeds)
Main Livestock feeding Systems
Ruminants: Goat
Extensive Feeding System (EFS)•fed with forages in scrub jungles. •commonly practiced system in low country dry zone and low country intermediate zones. •Generally, indigenous and Indian crosses are reared under this system especially for meat purpose.
Supplementary Based Extensive Feeding System (SEFS)•Allowed to free graze during day time•Shelter is provided during night and fed with variety of tree leaves. •Mainly practiced in coconut triangle.
Intensive Feeding System (IFS)•Animals are kept indoors•Fed with concentrates and tree fodder. •Improved breeds, such as Sanan and their crosses are kept for meat and milk under this system.

42
Main Livestock feeding Systems
Ruminants: Sheep
Extensive Feeding System (EFS)•common to coconut triangle and Jaffna Peninsula,•Practiced mainly for meat purposes•Animals are reared in natural grassland and scrubs, and on forages under coconut plantations. •Shelter is provided during night but supplementary feeding is mostly absent.
Supplementary Based Extensive Feeding System (SEFS)•Fed extensively on forages grown under coconut or scrub jungles•Supplemented with tree leaves collected or purchased outside •with concentrate or compound feeds
Main Livestock feeding Systems
RuminantsProportions of number of animals in different feeding systems
Ruminant production system*
Total
(%)
Livestock type Extensive Feeding
system (EFS)
(%)
Supplementary
Based Extensive
Feeding System
(SEFS)
(%)
Mixed Feeding
System (MFS)
(%)
Intensive Feeding
System (IFS)
(%)
Dairy cattle 15 15 60 10 100
Dairy buffalo 60 10 20 10 100
Non-dairy cattle 40 15 40 05 100
Non-dairy buffalo 80 10 05 05 100
Sheep 50 50 - - 100
Goats 60 30 - 10 100
Source: Calculated by the authors from different sources
Main Livestock feeding Systems
Monogastric: Grower Pigs
Extensive Feeding System (EFS)•Very limited or usually extinct
Semi-intensive Scavenging Based Feeding System (SISFS)•Mainly crossbred pigs•With very little inputs. •Mostly animals are fed with kitchen refuses and swill while animals are allowed for limited scavenging.
Intensive Feeding System (IFS)•Peri-urban areas rear •improved breeds•Not allowed for scavenging •Fed with quality feeds (vegetable market refuses, swill, concentrates such as grains and grain by-products, root and tubers, toot and tuber by products etc.)
Main Livestock feeding Systems
Monogastric: Grower PigsApprox. Proportions of feedstuffs used
Agro-ecological zones: Low country wet zone, Low country Intermediate zone and Low country dry zone
Intensive Feeding System (IFS)
Fed with high quality feeds
1. Vegetable market refusals + grains + grain by-products
2. Swill + grains + grain by-products
3. Root and tubers and their by-products grains + grain by-
products
4. Swill + compound feeds
Semi –intensive Scavenging Based Feeding System (SISFS)
Scavenging under limited extent and fed with medium quality feedstuffs
1. Scavenging with kitchen refusals
2. Scavenging with swill
3. Scavenging with homemade concentrates
4. Scavenging with compound feeds
(1) Vegetable market refusals : grains : grain by-products =
50:25:25 ratio
(2) Swill : grains : grain by-products = 50:25:25 ratio
(3) Root and tubers and their by-products: grains : grain by-
products = 50:25:25 ratio
(4) Swill : compound feeds = 60:40 ratio
(1) Scavenging : kitchen refusals = 50:50 ratio
(2) Scavenging : Swill = 50:50 ratio
(3) Scavenging : Grain: Grain by-products = 50:30:20 ratio
(4) Scavenging : Compound feeds = 50:50 ratio
Source: Modified by authors on different sources
Main Livestock feeding Systems
Monogastric: Poultry
Extensive Feeding System (EFS)•Village/Backyard chicken•Benefits for family nutrition•Income due to high demand for village chicken meat and eggs•Well adapted to harsh environments•No monitoring inputs are made.
Semi-intensive Scavenging Based Feeding System(SISFS)•Locally adapted scavenging birds•Kitchen refuse (coconut residues and vegetable wastes) and agro by-products such as rice bran and broken rice•Provides nutrients to farm family (egg and meat)•Additional income to village economy•Cost of production is comparatively low •Simple shelter is provided during night•Scavenging is also allowed within a limited extent.
Intensive Feeding System (IFS)•Improved breeds for meat and egg purposes•Under small, medium and large scale•Cost of production is high•By-back (contract) system is also followed
Compound Feeds and Concentrate Feeds
General overview•Locally available raw materials and imported feed ingredients•Smallholdings,
•depend primarily on locally available materials•maize meal, rice polish, rice bran, coconut poonac etc. •Usage assumed in an approximate manner
•Compound feed production•Well organized•Registered under the provisions of Animal Feed Act, No 15 of 1986 •Obtained a license issued by the Department of Animal Production and Health (DAPH)•Used raw materials; Locally available and imported. •Manufacturers provide the information on type of materials and their percentages and production quantities•To the Division of Veterinary Regulatory Affairs of DAPH•Organized industry.

43
Compound Feeds and Concentrate FeedsCompound animal feed production by type – 2011-2012
Type of Feed Quantity (MT)2012
Poultry Feed 363736.642
Cattle Feed 14687.9
Pig Feed 3990.275
Shrimp Feed 10
Horse Feed 219.4
Goat Feed 78.25
Source: Division of Veterinary Regulatory Affairs, DAPH; 2012
Compound Feeds and Concentrate FeedsRaw Materials Usage by Animal Feed Manufacturers -2012
Source: Division of Veterinary Regulatory Affairs, DAPH; 2012
Type Raw Materials Local Imported Total Usage
Cereals 1.Maize 90698.21 1.8 90700.01
2.wheat 0 49166 49166
3.Dhall Powder 82.99 82.99
3.Others(Sorghum) 1257 459 1716
Cereal by Products 1.Rice Polish 46035.7 2.2 46037.9
2.Rice Bran 1673.74 1673.74
3.Wheat Bran 14082.714 14082.714
4.Wheat Flour 164 1128 1292
5.Broken Rice 7868 7868
9.Wheat Midds 2566 2566
10.Dhal Husk 1900 1900
Oil Meals 1.Coconut Meal/Poonac 10716.963 10716.963
2.Soya Bean Meal 9424.62 86272 95696.62
3.Rape Seed Meal 0 271 271
4.Other (hypro soya & full fat Soya) 1908 297 2205
Animal by products 1.Fish Meal 1618.53 5152 6770.53
2.Meat & Bone Meal 476.23 16202 16678.23
3.Milk Powder 26.69 26.69
4.Poultry Offal Meal 938 938
5.Others 5.1 40 45.1
Compound Feeds and Concentrate FeedsAverage daily amount of home-made concentrate and compound provided to
different categories of monogastric animals
Source: Authors calculations on various publications and personal communications
Livestock Species and Type Semi –intensive Scavenging Based
Feeding System (SISFS)
Intensive Feeding System (IFS)
Industrial Systems
Home-made
concentrate
(MT/day)
Compound
feed
(MT/day)
Home-made
concentrate
(MT/day)
Compound
feed
(MT/day)
Pigs 54.12 13.02 107.45 53.76
(MT/day) 67.14 161.21
Chicken: Backyard/Smallholder 24.11 - - -
(MT/day) 24.11
Chicken: Commercial breeders - - - 159.62
(MT/day) - 159.62
Chicken: Commercial layers - - 519.12 222.48
(MT/day) - 741.60
Chicken: Commercial broilers - - 517.68 776.52
(MT/day) - 1294.20
Compound Feeds and Concentrate FeedsPromotions of feed production and production technologies
•Maize:•Expand the maize cultivation•New improved cultivars •Good post harvest technologies to minimize wastages.•Taxes increased by the government
•Field demonstration farms on appropriate feeding systems•Utilizing locally available raw materials
•Small scale feed production units •small scale animal feed milling•Improve feed milling technology•Encourage the use of agro by-products•Establishment of oil extraction mills and urea molasses mineral block (UMMB) production units•Increase availability of quality feed raw materials at competitive prices•Encourage local production of other feed ingredients. e.g. Soya meal•Establish a system to monitor the export of local feed raw materials•Encourage the cultivation of other potential crops for feed raw materials. e.g. Soya•Establish a system to monitor the exportation potential of feed raw materials•Regulatory system to register feed dealers, sub dealers and retailers•Introducing local production of some animal origin feed materials. e.g. fish mealPromotion program for utilization of rice and rice by-products for feed formulation

44
INDIAN LIVESTOCK FEED PORTAL – FEATURES AND UTILITY
S. Anandan
Indian feed portal – features and utility
Overview
• Need for portal
• Features
• End users and utility
• Maintenance and updating
• Snap shots
Need for portal
• Feed largest input
• Large body of information
• Diverse production system
• Shortage & high cost
• Ready access
• Customization & refinement
Features
• Home
• Feed resources
• Nutrient requirements
• Feed standards
• Import/export
• Feed markets
• Feed assessment
• Production & productivity

45
Maize - (Zea mays)
Common names – makka (hindi), Mushkina jola (kannada), makkajonalu (Telugu), Makka solam (Tamil), General description Maize is ranked as third most important food crop in India. Maize is a major food, feed and fodder crop and currently India ranks 4th in area and 7th in production of maize globally. Over the last five years, it has registered a growth rate of more than 7% in area and more than 6% in productivity in India. Currently around 8.5 million hectares of land is under cultivation and the production is around 21.8 million tons with an average productivity of 2.6 tons/hectare. Current growth rate of maize production is around 9% and is higher than the consumption rate of 5% and as a result India is a net exporter of maize (2-3 million tons/annum) since 2008-09. The major states producing maize includes Karnataka, Andhra Pradesh, Maharasthra, Bihar and Rajasthan. Uses The uses of maize are mainly for food, feed and industrial purpose that includes the production of starch and distilleries for production of potable alcohol. Maize is the first choice of grains in livestock feed due to it high energy and digestibility, especially in poultry diets where energy is very important factor influencing the performance of the birds. Maize is generally used at the rate of 50-60% of diets in broiler birds, 40-50% in layer birds, 15-30% of concentrate feeds in cattle, buffalo, sheep & goats. Composition The proximate composition, fibre fractions and amino acid composition of maize grains is as follows
DM % CP% EE% CF% NFE% Total ash% NDF% ADF% ADL%
91.66 9.35 3.50 2.25 82.01 2.53 16.65 5.18 1.39
Macrominerals %
Microminerals ppm
Ca P Mg K Na Cl S Co Cu I Fe Mn Se Zn Mo silica %
0.19 0.39 0.14 2.60 6.92 0.12 312.37 21.12 33.01
References- Directorate of Maize Research. Annual Report 2011-12
Areca leaf sheath
Description
Areca is a commercial crop and is mainly grown in the states
of Karnataka, Kerala, Tamilnadu, Assam and Andaman &
Nicobar Islands. Areca leaf sheath is shed periodically from
the tree and it can be potentially used as dry fodder in
ruminants. Around four lakh hectares of land is under Areca
cultivation and it is estimated that 5400 million leaf sheaths
are shedded annually. Each areca leaf sheath weighs
around 200-300g and assuming an average weight of 250g
the total annual availability of areca sheath works out to be
0.14 million tons. Presently areca sheath is used for making plates/cups, fuel and composting
Composition
Chemical composition.
CP% EE% Ash% Silica % NDF% ADF% Lignin% TDN%
3.5 0.1 6.4 3.3 71.3 47.7 3.9 49.3
Mineral composition
Ca% P% S% Cu ppm
0.23-0.60 0.06-0.08 0.61-0.75 15-23
Usage
Areca sheath can totally replace paddy straw in total mixed rations in sheep and cattle. Areca sheath can
be used as sole roughage to an extent of 40-50% of the total mixed ration in dairy cattle rations. The
sheaths should be dried properly and chaffed before feeding. Fresh sheaths have a thin plastic like outer
layer which at times may cause impaction/indigestion in animals.
References - Gowda et al., 2011. Areca sheath : An alternate dry fodder for livestock. NIANP publication
Areca leaf sheath
Sweet sorghum bagasse
Description
Sweet sorghum is being promoted as a multipurpose crop
and can be used for food, bio-fuel and fodder purpose.
Sweet sorghums have also been widely used for the
production of forage and silage for animal feed. The sweet
sorghum stalks, after harvesting grains are crushed to
extract the juice which is further processed to produce
ethanol that is used as bio-fuel. Sweet sorghum enjoys
several advantages over sugarcane or maize as feedstock for biofuel production. It requires only one half
of the water needed to grow maize and just one-eighth of that needed for a sugarcane crop. The
bagasse consisting of crushed stem with leaves is a potential fodder that can be used in ruminants.
Currently the bagasse is used for fuel and paper industry. The average yield of sorghum stalks and
bagasse under farmers field conditions is around 25 and 13 tons/hectare respectively
Composition
Chemical composition.
CP% Ash% NDF% ADF% Lignin% ME MJ/kg
5.0 ± 1.65 6.68± 0.26 62.18± 1.7
38.68± 2.4
4.43± 0.4
8.0 ± 0.34
Usage
Sweet sorghum fodder is highly relished by animals due to its high sugar content. It can be used as green
fodder or silage and similarly the bagasse can be fed on fresh basis, converted into silage or can be dried
and used as dry fodder. Sweet sorghum or its bagasse can be used as sole roughage in ruminant diets
and is comparable or slightly superior to conventional sorghum fodder or stover.
References Ashok Kumar et al.2010 Animal Nutrition and feed technology.10s: 62-69
Sweet sorghum crushing-Juice and Bagasse
Nutrient requirements for growing calves (cattle)
Live wt (kg)
Growth rate (g)
DM (kg) DCP (g) TDN (kg)
ME (Kcal)
Ca (g) P (g) Carotene (mg)
Vit A (IU 100)
70 550 2.1 255 1.4 5.0 8 6 7 3
600 2.3 260 1.5 5.4 8 6 7 3
80 550 2.4 260 1.5 5.4 9 7 7 3
600 2.5 270 1.6 5.8 9 7 8 3
100 550 2.8 270 2.1 7.6 10 8 10 3
600 3.0 280 2.2 7.9 10 8 10 3
120 550 3.2 280 2.3 8.3 14 11 11 4
600 3.7 290 2.4 8.6 14 11 11 4
140 550 3.7 290 2.5 9.0 14 11 16 6
600 4.2 300 2.6 9.4 14 11 16 6
160 550 4.2 300 2.7 9.7 14 12 16 6
600 4.7 320 2.8 10.1 15 12 16 6
180 550 4.7 310 2.9 10.4 15 12 18 8
600 5.2 320 3.0 10.8 15 12 18 8
200 550 5.2 320 3.1 11.2 16 13 22 9
600 5.7 330 3.2 11.5 16 13 22 9
220 550 5.7 330 3.3 11.9 18 14 24 10
600 6.2 340 3.4 12.2 18 14 24 10
240 550 6.2 340 3.5 12.6 20 16 28 12
600 6.7 350 3.6 13.0 20 16 28 12
260 550 6.7 350 3.7 13.3 20 16 30 13
600 7.2 360 3.8 13.7 20 16 30
( Source – Ranjhan,S.K. 1991-Nutrient requirements of livestock and poultry)

46
BIS specifications for cattle feed
Characteristics Cattle type I Cattle type II Calf starter Calf grower
Moisture Max % 11 11 10 10
Crude protein Min% 22 20 23-26 22-25
Ether extract Min % 3.0 2.5 4.0 4.0
Crude fiber Max% 7 12 7 10
AIA Max% 3 4 2.5 3.5
Salt Max % 2 2
Ca Min% 0.5 0.5
Available P Min% 0.5 0.5
Vitamin A Min IU 5000 5000
Name of Feedstuff BIS specifications
ReferenceMoistur
e
(%Max)
Crude
Protein
(%Min)
Crude Fibre
(%Max)
Crude Fat
(%Min)
Ash (% Max) AIA (%
Max
Decorticated Groundnut Oil Cake-Grade-1 8.0 48.0 8.0 7.0 - 2.0 IS: l713-1986
Reaffirmed 1992Decorticated Groundnut Oil Cake-Grade-2 8.0 43.0 12.0 6.0 - 2.5
Solvent Extracted Groundnut Oil Cake-Grade-1 8.0 51.0 7.0 - - 2.5 IS:3441-1982
Reaffirmed 1995Solvent Extracted Groundnut Oil Cake-Grade-2 8.0 47.0 10.0 - - 2.5
Solvent Extracted Coconut Oil Cake 10.0 23.0 14.0 - - 1.5 IS:3591-1985
Decorticated sunflower oilcake 8.0 45.0 6.0 12.0 6.0 1.0 IS:10165-1982
Solvent Extracted Cottonseed oil Cake 10.0 42.0 16.0 - - 2.0 IS:3592-1985
Solvent Extracted Linseed Oil Cake-Grade-1 10.0 33.0 9.0 - - 2.5 IS:3440-1985
Reaffirmed 1990Solvent Extracted Linseed Oil Cake-Grade-2 10.0 29.0 11.0 - - 2.5
Linseed oil Cake-High Fat 8.0 29.0 10.0 8.0 8.0 1.5 IS:1935-1982
Reaffirmed 1995Linseed oil Cake-Low Fat 8.0 31.0 10.0 5.0 8.0 1.2
Solvent extracted Nigerseed Oilcake Grade I 9.0 35.0 18.0 1.0 - 1.5 IS:5862-1970
Solvent extracted Nigerseed Oilcake Grade II 9.0 29.0 20.0 1.0 - 2.5
Guar Meal 10.0 45.0 8.0 3.0 7.0 1.0 IS:4193-1986
BIS specifications for Indian Feedstuffs*
Export of oil meals and extractions
Source – Solvent extractors association of India
Export of oilseed extraction from India ( thousand tons)
0
1000
2000
3000
4000
5000
6000
2006-07 2007-08 2008-09 2009-10 2010-11 2011-12
Cotton
Sunflower
Rice bran
Groundnut
Rapeseed
Soybean

47
Feed assessment NIANP DAHD-NABCONS XII plan
(Planning
Com)
Availability
2011
% Deficit Availability
2010-11
%Deficit % Deficit
Million tons Million tons
Crop
residues
320 33 253 40 10
Concentrates 48 47 23 57 33
Green
fodder
144 25 143 36 35
Milk
• Milk is the single largest agricultural produce and is more than the combined value of rice aMilk ndwheat in India. India is the largest milk producer globally although the average productivity ofanimals is much low. The information pertaining to the milk production, per capita consumption,milch animals and their productivity over the recent years is presented in table.
• 2006-07 2007-08 2008-09 2009-10 2010-11 2011-12• Milk production (million tons) 102.6 107.9 112.2 116.4 121.8 127.3• Per capita availability 251 260 266 273 281 • Crossbreds in milk (000) 10142 10680 11262 11807• Desi in milk (000) 29587 29842 30199 30948• Buffalo in milk (000) 35108 35380 36166 37131• Total in milk (000) 74837 75902 77627 79886• Crossbreds average yield (kg/day) 6.47 6.71 6.80 6.63• Desi average yield (kg/day) 2.11 217 2.20 2.22• Buffalo average yield (kg/day) 4.41 3.94 4.53 4.58
Share of milk from different species (106 tons)
24.01 26.16 27.96
22.8123.65 24.24
56.6357.9
59.76
4.484.48
4.47
0
20
40
60
80
100
120
140
2007-08 2008-09 2009-10
Goats
Buffalo
Desi
Crossbred
MeatThe meat production is mainly contributed by the poultry sectorfollowed by the small ruminants, large ruminants (cattle &buffalo), and pigs. The production and productivity of differentspecies is presented in the tabular form. .
2007-08 2008-09 2009-10 2010-11 2011-12
Meat production million tons
4.0 4.2 4.5 4.9 5.1
Number of animals slaughtered
Cattle (000) 2551 2715 2477 2344
Buffalo (000) 4946 5597 6061 6890
Sheep (000) 23717 24682 26930 28882
Goat (000) 77328 78323 80274 82171
Pig (000) 10496 10733 10518 10677
Poultry (000) 147397 1599129 1740431 1816848
Average yield
Cattle (kg) 91 92 90 89
Buffalo (kg) 114 102 111 104
Sheep (kg) 12 13 13 13
Goat (kg) 10 10 10 10
Pig (kg) 35 36 37 38
Poultry (kg) 1.18 1.18 1.20 1.21
Share of meat contribution by different species (000 tons)
232 250 223 211
557 823 670 805294
312341 369
769786 814 846
370388 391
402
1755
1884 20872193
0
1000
2000
3000
4000
5000
6000
2007-08 2008-09 2009-10 2010-11
Poultry
Pig
Goat
Sheep
Buffalo
cattle
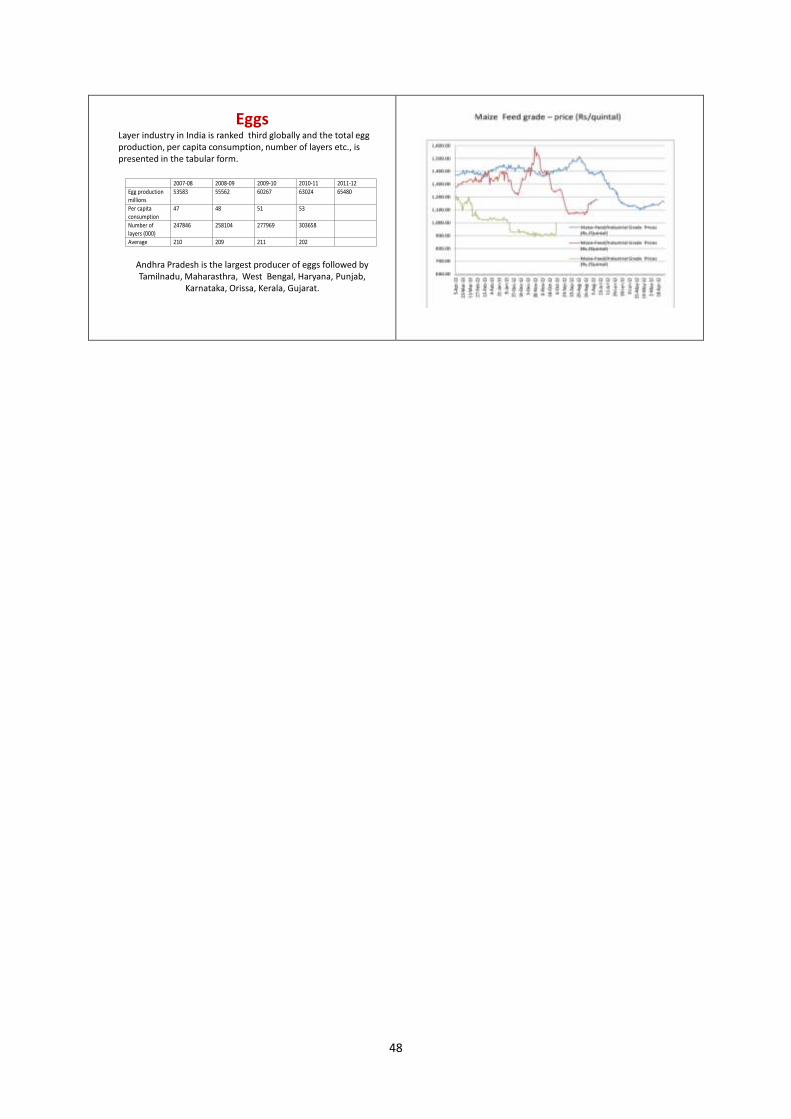
48
EggsLayer industry in India is ranked third globally and the total egg production, per capita consumption, number of layers etc., is presented in the tabular form.
2007-08 2008-09 2009-10 2010-11 2011-12
Egg production millions
53583 55562 60267 63024 65480
Per capita consumption
47 48 51 53
Number of layers (000)
247846 258104 277969 303658
Average 210 209 211 202
Andhra Pradesh is the largest producer of eggs followed by Tamilnadu, Maharasthra, West Bengal, Haryana, Punjab,
Karnataka, Orissa, Kerala, Gujarat.

49
BALANCED FEEDING AT SMALLHOLDERS’ DOORS
M. Garg
Milk Production Enhancement with the Available Feed Resources
M R Garg
General Manager (Animal Nutrition)
National Dairy Development Board
Anand 388 001, India
Production & Demand of Milk in India by 2021-22
Considering the future growth in annual income & the
growth in human population, it is estimated that the
demand for milk would be around 210 million tons in
2021-22.
To reach this level of production, annual milk
production would need to be 7.0 million tons, as
against 3.7 million tons.
It would be desirable to meet future demand of milk
with the existing population base & feed resources.
It should be possible to achieve that by improving the
milk production efficiency.
Factors Affecting Milk Production Efficiency
Milk
Production
Efficiency
Rearing Transition
management
Animal
Breeding
Animal Nutrition (Feeding)
Reproduction
efficiency
Animal
Health
Animal comfort/housing
Use of Available Feed Resources
• Compound cattle feed production.
• Use of feed resources according to their
availability & traditional feeding practices.
Use of Available Feed Resources
• Very little use of mineral mixture.
• Significant part of crop residues is wasted
in the field itself.
• Very low yield of green fodder per hectare.
Suggestive Measures• Compound cattle feed production specific to requirement.
• Need to tap potential feed resources.
• Securing crop residues from the farmers field & their
storage in the form of enriched & densified blocks/pellets
in the surplus areas.
• Various measures for green fodder production
enhancement:
– Use of quality seeds of high yielding varieties/hybrids fodder crops.
– Follow recommended agronomical practices of cultivation & suitable
crop rotation.
– Select short duration fodder crops.
• Ration balancing advisory services at milk producers
door step using local feed resources & area specific
mineral mixture.

50
7
For this purpose,
feed & fodder
chemical
composition data
library has
been created.
Master
for nutrient
requirement for
various categories
of animals has
also been
created
Computer software has been developed
to assess the nutrient status & for working
out a least cost ration according to the productivity &
physiological status.
Software has
been pilot tested in
various states
before its large-
scale
implementation.
Milk producers are advised to feed a balanced ration using locally
available feed resources & area specific mineral mixtures
RBP: Implementation Plan
• Selection of End Implementing Agencies (EIAs).
• Identification/recruitment of qualified manpower with
adequate experience.
• Training of Technical Officers & Trainers at NDDB.
• Arrangements for procurement of Net-books & other
accessories.
• Selection of villages, followed by organization of
awareness programmes.
• Ensure regular supply of area specific mineral mixture,
cattle feed & other additives.
• Selection of Local Resource Persons (LRPs) & their
training.
• RBP implementation by the LRPs.
• Monitoring at various levels.
Role of Local Resource Persons
• Identification of beneficiaries & selection of milch animals.
• Ear tagging for animal registration in INAPH.
• Recording body weight from the heart girth & the body
length.
• Measurement of daily milk yield & collection of milk samples
for fat analysis.
• Recording intake of each feed ingredient actually fed.
• Formulating least cost balanced ration with the available
feed resources, in consultation with the milk producer.
• Providing least cost ration formulation in a prescribed
format in local language.
• Advising milk producer to feed the balanced ration regularly.
• Re-visit after 3-4 weeks or whenever there is change in feed
ingredients, to re-formulate a fresh ration.
Likely income of a LRP
Items Monthly sale
(kg)
Commission
@(Rs./kg)
Monthly
income (Rs.)
Area specific mineral
mixture
240 10 2400
Bypass fat/protein
supplement(s)
50 10 500
Expected income could be Rs. 3000-5000 per month
Support from a DCS 500
Milk Replacer & Calf
Starter
20 10 200
Neutraceuticals, fodder
seeds, dewormer feed pellets,
Garbhamin Bolus etc.
500
Charging from
beneficiaries
(for 80
animals)
Charge @ Rs.
20 /ani./month
1600
Support from a union 500
Effect of ration balancing (RB) on milk yield, milk fat
& feeding cost in cows (n=5019) & buffaloes
(n=7499) under field conditions from five states
Parameter Before
RB
After
RB
Change
Milk yield (kg/day) 8.10 8.40 +0.30
Milk fat (g/kg) 58.80 61.50 +2.7
Feeding cost per kg
milk yield (Rs.)
10.098.47 -1.62
Increase in net daily income (Rs./animal) 24.0
Economic impact of implementation of RBP at the footsteps of milk producers in Banaskantha
(Cows: 11596, Buffaloes: 6407)
Parameter Before
RB
After
RB
Change
Average milk production
(kg/ani./day)10.02 10.29 +0.27
Average fat % in milk 4.43 4.71 +0.18
Average cost of feeding
(Rs./kg milk)11.99 10.53 -1.46
Average cost of feeding
(Rs./ani/day)120.2 105.5 -14.70
Increase in net daily income (Rs./animal) 25.0

51
Parameter
Cows (n=540) Buffaloes (n=1131)
Baseline After RBP Baseline After RBP
FCM yield
(kg/day)8.04c 8.66d 8.41c 9.19d
Average DMI
(kg/day)14.55c 11.06d 16.43c 13.92d
FCM* yield
(kg)/kg DMI0.58c 0.78d 0.53c 0.66d
c, d Values with different superscript in a row differ significantly (P<0.01)* 4% FCM & 6% FCM has been considered for cows & buffaloes, respectively.
Effect of ration balancing on milk production
efficiency
Parameter Cows
(n=439)
Buffaloes
(n=721)
Average milk yield
(kg/animal/day)
Before RB 9.76a 9.46a
After RB 10.16b 9.81b
Average CP intake
(g/animal/day)
Before RB 1648a 1761a
After RB 1232b 1702b
Average milk protein
output (g/animal/day)
Before RB 322a 331a
After RB 335b 343b
Dietary N secreted into
milk (%)
Before RB 19.6a 18.83a
After RB 26.83b 20.20b
Effect of ration balancing (RB) on the efficiency
of utilization of dietary N for milk production
Effect of feeding balanced ration on various parameters in cows (n=34)
ParametersBefore
RB
After
RB
Plasma IgG (mg/ml) 14.5a 22.1b
Plasma IgM (mg/ml) 2.7c 3.3d
Urinary allantoin (mmol/L) 11.7a 17.1b
Faecal eggs/g faeces 168a 81b
Parameter
Cows (n=55) Buffaloes (n=26)
Before
RB
After
RB
Before
RB
After
RB
Microbial nitrogen
yield (g CP/day)724.1a 1004.4b 485.6a 697.6b
Efficiency of microbial
protein synthesis
(g MCP/kg DOM)
68.3a 93.3b 56.6c 78.3d
Effect of ration balancing (RB) on efficiency of
microbial protein synthesis
Balanced feeding & water foot print of
milk in lactating animals (n=28)
52
54
56
58
60
62
64
66
65.0
56.7
Wate
r in
tak
e (k
g/d)
Before balanced feeding
00.020.040.060.080.1
0.120.140.16
0.12
0.15
Dri
nkin
g w
ate
r use
eff
icie
ncy
Before balanced feeding
Drinking water use
efficiency for milk
production
Water intake (kg/d) of
milch animals
CH4
Bacteria ProtozoaFungi
Methanogens
Fibrous Feed
CO2 + 4H
Methane
Balanced feeding & methane emission reduction

52
Balanced feeding & methane emission
Methane emission (g/day) % reduction
Before RBP After RBP (n=73)
237.74
4.37
206.13
1.5013.0
Methane emission (g/day) % reduction
Before RBP After RBP (n=61)
232.48
5.93
199.60
4.9815.0
Monitoring by the
TO at HO
Monitoring by the
TO at EIAs
RB software loaded in desktops/laptops/netbooks at field level
INAPH server
Data Monitoring of RBP Implementation
Field data synchronized & stored in a central server can be monitored
Reports Generation for Future Planning
INAPH
Report on lactation length and milk yield
during the entire lactation by local/CB & buffaloes
Report on cost of milk production
amongst different breeds, species,
seasons & regions
Report on nutrient status of different
categories of animals during
different phases of lactation
Animal-wise details of recommended balanced ration
Animal-wise and village-wise
ration balancing programme
impact report
Summary
Future demand for milk can
be met if the available feed
resources are utilized judiciously
for improving productivity &
productive life of dairy animals

53
USE OF CO-PRODUCTS OF BIO-FUEL INDUSTRIES AS LIVESTOCK FEED
H. Makkar
Harinder MakkarLivestock Production Systems Branch
Animal Production and Health Division,
FAO, Rome
Biofuel co-products as
livestock feed
Outline of presentation
1. Introduction
2. Co-products from bioethanol production
3. Co-products from biodiesel production
4. Co-products from biodiesel production from toxic oilseed plants
5. Future areas of research
6. Concluding remarks
Biofuel
Livestock production
Biofuels : first, second and third generation
Bioethanol production: 5-fold increase
From what bioethanol is being produced?
Maize Wheat Other
Grain
Total
USA 186 0 9 195
EU 9 9 8 26
CANADA 8 5 3 16
Wheat
Maize
Sorghum
Sugarcane
Wheat,
Barley,
Rye
Number of plants
2010 world feedstock usage for fuel ethanol (thousand tonne)
Source: F.O. Licht, 2011
Approximately 1/3 of
grain used for fuel
ethanol is protein-rich
co-products
292 300
142 500
18 4006 900 1 280 680
Sugar cane
Grains (gross)*
Cane/beet molasses
Sugar beet
Fresh cassava
Other (whey, beverage waste, etc.)

54
Ethanol and co-product formation from grains
Wet-milling processes and co-products
SOURCE: Erickson et al., 2005
MaizeSteeping
Milling
Cyclone
separation
Starch-Gluten
SeparationStarch
Germ
Separation
Germ
Oil
Refining
Maize Oil
Cake
(Fibre)
Maize Germ
Meal
Wet Gluten
Maize
Gluten
Meal
Drying Fermentation Syrup
Refining
Dextrose
Maize
Syrup
Starch
Ethanol
Chemicals
High
Fructose
Maize
Syrup
Maize
Gluten
Feed
Historical production of ethanol co-products
SOURCE: RFA, 2011
Animal feed/other
co-productsCrude protein (%) Fat (%)
Corn 8.3 3.9
Soy bean meal 45-50 1.4
DDGS 30.8 11.2
WDGS 36.0 15.0
d-DGS1 34.0 2.7
HP-DDG2 48.6 3.4
Corn gluten feed 23.8 3.5
Corn germ 17.2 19.1
1 De-oiled DGS
2 High-protein dry distillers’ grains
Properties of corn ethanol co-products
For normal inclusion levels of DDGS in animal diets, the limiting EAAs are
lysine and tryptophan for maize DDGS, and lysine and threonine for wheat
DDGS.
Wheat (11% CP)
Wheat DDGS
(36% CP)
Exports of US DDGS
Shurson et al. 2012
U.S. Distillers grains exports
Distillers grain use in the US
USA annual production

55
Distillers grains in ruminant diets
Corn co-products:
primarily as a source of dietary protein in feedlot diets
at high levels of grain replacement, fat & fibre contribute meaningful
amounts of energy).
WDGS has a feeding value 30–40% > maize at 10–40% of diet DM.
Distillers grains are an excellent supplement for cattle on high-forage diets
(because: high energy, protein and P contents).
Reduced rumen degradability of crude protein and increased un-degraded protein
increase.
Maximum recommended levels of DG with solubles (on DM Basis):
pre-weaned calves 25%
growing heifers 30%
dry cows 15%
lactating dairy cows 20%
• Growing pigs (2-3 wks after weaning): 30% of corn
DDGS
• Gestating sows: 50% of DDGS.
• Lactating sows: 30 % DDGS
• With finishers: Necessary to withdraw DDGS 3 to 4
wks before slaughter
(because high amount of PUFA in the corn oil
-- reduce pork fat quality)
• Laying hens: DDGS (~15%)
• Broilers :>10% wheat DDGS reduce performance
--NSP degrading enzymes needed to overcome adverse
effects
Distillers grains in pigs and poultry diets
Safety issues
Contamination resulting from the process: excess mycotoxins, antibiotics,
pesticides, harmful bacteria (shedding of E. coli 0157:H7 in beeflot cattle),.
Oil present in DDGS (maize oil has high PUFA) -- if oxidised, produce toxic
aldehydes -- affecting pig health and performance, and meat quality.
At high levels of S (0.47%) it inhibits oxidative processes in nervous tissue –
leading to Polioencephalomalacia.
(Distillers grains may be high in S (0.5–1.7 percent, DM basis)
High S may decrease bio-availability of selenium and vitamin E
Bioethanol co-products – Vinasses
• Vinasse is produced from cassava, sugar cane, sweet potato, and sweet
sorghum.
• Vinasse: preparation of multi-nutrient blocks – increase nutrient utilization
& productivity of animals on low quality roughage diets
Multi-nutrient blocks
Bioethanol co-products – baggase
• Sugarcane bagasse – mainly contains cellulose and hemicellulose --
degradability in the rumen is very poor.
• High levels of lignin, low levels of soluble carbohydrates and nitrogen -- not an
attractive feed.
• Feeding of sugarcane and sorghum bagasse -- unsuccessful economically –
Use as a fuel.
Growth and anticipated world expansion of biodiesel production
SOURCE: National Biodiesel Board, 2008

56
2010 world feedstock usage for biodiesel (thousand tonne)
Source: F.O. Licht, 2011
5 750
5 700
2 440
2 230
211 161
Rapeseed oil
Soybean oil
Palm oil
Animal fats & yellow grease
Sunflower oil
Other
Biodiesel co-products – Fatty acid distillate
• Fatty acid distillate: good source of energy.
• Fatty acids distillate reacted with calcium oxide to develop a
rumen-protected fat --- an effective way to protect fatty acids
against ruminal biohydrogenation
• Augment the oleic, linoleic, α-linolenic and stearic acid content
in the milk of dairy cows and reduce that of palmitic acid.
Biodiesel co-products – Glycerol in ruminant diets
• Glycerol: 15% of the diet (recommended inclusion)
• In dairy cow diets as an energy source (often shortly
after calving)
• or as a preventative for ketosis.
• In beef cattle, feed value of glycerine is greatest at < 10%.
• Glycerine (similar to starch) has a deleterious effect on
fibre digestion on high-grain diets.
Oil palm co-products
Palm oil and palm kernel oil = ~30% of the total global production of oils & fats
Co-products CP ME (MJ/kg)
Palm kernel cake (PKC) 17.2 11.13
•a good energy and protein sources – ruminant & non-ruminants
• Recommended levels of PKC feeding
• Growing beef cattle: 30–80%
• Goats: 20–50%
• Lactating dairy cattle: 20–50%
• Poultry and freshwater fish: < 10%
Limiting AA: Lys, met, try
Jatropha curcas kernel meal
Fruits
Kernel meal (58 % protein of 90% digestibility
& excellent amino acid composition)
Kernel meal
Seeds
U*: 1 mg of meal that produced haemagglutination per ml assay medium. (Source: Makkar and Becker, 2009)
New detoxification method
Trypsin inhibitor
18 – 27 TIU/g
Antinutrients /Toxic components in Jatropha kernel meal
Lectin 50 – 102 U*
Phorbol esters
1-3 mg/g Phytate
8.2 – 10.1%
Moist heating Phytase enzyme
Antinutritional and toxic factors in Jatropha meal

57
Biodiesel co-products – Camelina sativa meal
Crude protein: 36-40% (rich in EAA including lys & meth)
Poultry (layer and broiler) diet : 10%
When compared to control birds fed a corn-soy diet:
• 8-10 fold increase in total omega-3 fatty acids and α-linolenic acid
• Omega-6: omega-3 fatty acid ratio in eggs -- Decreased
Two large eggs from hens fed Camelina meal: provides over
300 mg omega-3 fatty acids to the human diet.
Camelina sativa or false flax - the Brassica (Cruciferae) family
Knowledge gaps and future research needs
Need for standardisation of products from within a
plant and between plants
Co-product feeding value – especially aquaculture
Search for new feedstocks, particularly those
indigenous to an area and underutilized
Safety standards for use of co-products (including
detoxification of seed meals where necessary)
FAO document: Biofuel co-products as livestock feed - Opportunities and challenges
http://www.fao.org/docrep/016/i3009e/i3009e.pdf
Converts energy source fed stocks to protein-rich feeds
Enlarged feed resource base through the use of co-products
as livestock feed
Enhanced future availability of some novel feed resources
Ongoing research on identification and production of novel
enzymes -- spillover beneficial effects for the crop residue
utilization
Gains to livestock industry from biofuel industry?
“ An array of co-products of the bio-fuel industry
are available, which are good source of protein
and energy and can replace soymeal and cereals
such as maize in animal diets -- easing food-feed
competition”
Concluding remarks

58
INDONESIA COUNTRY REPORT
M. Hutasuhut
INDONESIA COUNTRY REPORT
Report presented at FAO Regional Workshop on
“Animal Feed Resources and their Management
in the Asia-Pacific Region”
Bangkok, 13-15 August 2013
byMaradoli Hutasuhut
Budi TangendjajaDahlanuddin
Nurhayati Diah PurwantariDesianto Budi Utomo
Outline• INDONESIAN LIVESTOCK AND POULTRY
INDUSTRIES• NATIONAL FEED INVENTORY• APPROACH, DATA SOURCE AND METHODOLOGY• MAIN LIVESTOCK FEEDING SYSTEMS• COMPOUND AND CONCENTRATE FEED USE• FACTORS THAT DETERMINE USE OF FEED
INGREDIENTS• FEED BALANCE SHEETS• SUMMARY AND CONCLUSION
Livestock and poultry population, 2007 to 2011 (head)
Beef cattle 11,514,871 12,256,604 12,759,838 13,581,570 14,824,373 6.53
Dairy cattle 374,067 457,577 474,701 488,448 597,213 12.81
Buffalo 2,085,779 1,930,716 1,932,927 1,999,604 1,305,078 9.65-
Goat 14,470,214 15,147,432 15,815,317 16,619,599 16,946,000 4.03
Sheep 9,514,184 9,605,339 10,198,766 10,725,488 11,791,000 5.56
Pig 6,710,757 6,837,528 6,974,732 7,476,665 7,525,000 2.93
Horse 401,081 392,864 398,758 418,618 409,000 0.53
Poultry
Native chicken 272,251,141 243,423,389 249,963,499 257,544,104 264,340,000 0.56-
Layer 111,488,877 107,955,170 111,417,637 105,210,062 124,636,000 3.23
Broiler 891,659,345 902,052,418 1,026,378,580 986,871,712 1,177,991,000 7.62
Duck 35,866,833 39,839,520 40,675,995 44,301,805 43,488,000 5.06
Miscellaneous
Quail 6,683,000 7,543,000 7,054,000 7,357,000 2.67
Pigeon 1,499,000 1,815,000 490,000 1,209,000 23.70
Rabbit 886,588 833,666 915,140 0.95
2011
Average
growth
rate (%)
Livestock 2007 2008 2009 2010
Commercial compound feed sales in 2009 to 2012 (tonnes)
Broiler Layer Breeder Others TotalGrowth
(%)
Total
+aquaculture
Growth
(%)
2009 4,093,994 4,599,531 868,484 298,389 9,860,398 10,855,465
2010 4,409,074 4,380,977 863,361 265,751 9,919,163 0.60 10,945,004 0.82
2011 5,176,490 4,825,120 1,029,233 270,441 11,301,284 13.93 12,445,971 13.71
2012 5,991,099 5,261,394 1,283,996 417,680 12,954,169 14.63 14,188,900 14.00
Fish Shrimps TotalGrowth
(%)
2009 794,472 200,595 995,067
2010 797,276 228,565 1,025,841 3.09
2011 904,826 239,861 1,144,687 11.59
2012 981,975 252,756 1,234,731 7.87
Source: Indonesia Feedmill Association (2013); Note: others include ruminant feed (10% ), pig feed (75%) and pet feed (15%)
Distribution and production capacity of large-scale feed manufacturers
Province Number of plant Production capacity
(million ton/year)
Sumatera 13 4.00
North Sumatera 8 2.25
South Sumatera 4 1.50
West Sumatera 1 0.25
Java 49 (72%) 13.00 (70)
Banten 11 3.50
DKI Jakarta 4 0.75
West Java 8 2.00
Central Java 6 1.50
East Java 20 5.25
Other regions 6 1.50
South Sulawesi 5 1.25
South Kalimantan 1 0.25
Total 68 18.50
Source: Indonesia Feedmiller Association (2013)
Value of export and import of animal related products (US$)
Export 2010 2011 2012
Live animals 50,554,481 61,818,585 31,577,401
Animal products 585,117,577 1,161,287,963 86,634,016
Non-food animal products 129,496,149 143,708,725 57,697,454
Vet medicine 5,346,775 22,446,611 14,565,908
Others 181,146,918 209,809,188 83,946,117
Total export 951,661,900 1,599,071,072 274,420,896
Import
Live animals 450,478,663 328,509,198 166,186,096
Animal products 1,723,325,607 1,909,965,938 870,761,121
Non-food animal products 436,459,152 593,927,458 230,190,225
Vet medicine 46,465,313 47,744,727 24,597,230
Others 11,610,361 164,653,611 4,078,642
Total import 2,668,339,096 3,044,800,932 1,295,813,314
Source: DGLAHS (2012a)

59
Value of export and import of live animal and animal related products, 2010 to 2012 (US$)
-
200
400
600
800
1,000
1,200
1,400
2010 2011 2012
Val
ue
(US$
)M
illio
ns
Export Live animals
Animal products
Non-food animal products
Vet medicine
-
500
1,000
1,500
2,000
2,500
2010 2011 2012
Val
ue
(US$
)M
illio
ns
Import Live animals
Animal products
Non-food animal products
Vet medicine
-
500
1,000
1,500
2,000
2,500
3,000
3,500
2010 2011 2012
Val
ue
(US$
)M
illio
ns
Total export
Total import
Source: DGLAHS (2012a)Note: 2011 data were up to August 2011, 2012 data are preliminary figures
Production of main food crops and their residues, 2011 (million tonnes)
65.76
50.97
Crop prod Residues
Paddy
17.64
8.08
Crop prod Residues
Corn
0.85
0.99
Crop prod Residues
Soybean
0.69
1.15
Crop prod Residues
Peanut
0.34
0.47
Crop prod Residues
Mung bean
Source: Food Crop Production (CBS, 2013a)
Estate crop production and by-products, 2010 to 2012 (tonnes)
-
5
10
15
20
25
Oil palm Sugar cane Coffee Coconut Cocoa
Mill
ion
s
Production
2010
2011
2012
-
20
40
60
80
100
120
140
Oil palm Sugar cane Coffee Coconut Cocoa
Mill
ion
s
By-products
2010
2011
2012
Source: 2012 Estate Crop Statistic (DGEC, 2013)
Forage production by region (%)
Source: 2003 Agricultural Census (CBS, 2004a), Abdullah (2006)
Sumatera46%
Java5%
Nusa Tenggara
5%
Kalimantan27%
Sulawesi17%
Forage
Sumatera46%
Java5%
Nusa Tenggara
5%
Kalimantan27%
Sulawesi17%
Native grasses
Sumatera49%
Java4%
Nusa Tenggara
4%
Kalimantan27%
Sulawesi17%
Legumes
Sumatera45%
Java5%
Nusa Tenggara
5%
Kalimantan27%
Sulawesi18%
Others
a) Crop residues 61,659,824 10.39 4
b) Oil seed cakes/meals 6,322,059 1.07 9
c) Grain by-products 25,321,927 4.27 7
d) Grains 85,284,071 14.37 3
e) Roots, tubers and their by-products 7,957,689 1.34 8
f) Other by products:
Estate crops 131,606,546 22.18 2
Pineapple 539,219 0.09 11
Aquaculture 396,448 0.07 12
Sea fish 571,427 0.10 10
Vegetables 150,968 0.03 13
g) Native grasses 210,299,335 35.44 1
h) Legume forages 40,915,056 6.89 5
i) Other forages 22,430,094 3.78 6
Type of feed ingredient Production in 2011 (ton) % Rank
Total 593,454,663 100.00
Production of feed ingredients in Indonesia, in 2011 (tonnes)
Source: Authors’ calculation
Production of feed ingredients in Indonesia, in 2011 (tonnes)
0
50
100
150
200
250
Crop residues
Oil seed cakes/meals
Grain by-products
Grains Roots, tubers and
their by-products
Other by products:
Native grasses
Legume forages
Other forages
Mill
ion
s
Source: Authors’ calculation

60
Estimates of feed ingredients availability
• Crop residues:– Most is used for feed, some retained in field, burned or unused
• Oil seed cake/meal:– Soybean meal (SBM) all are imported– PKC: in 2012 exported 3.6 mill tonnes and domestic used 284
thousand tonnes – Coconut meal: 80% exported; 20% imported– Peanut meal: all for human consumption
• Grain by-products:– Rice bran: almost all used as feed; in 2012 imported 211,160
tonnes; hull: 1.5% used as feed– Corn: hominy and corn gluten feed 105,000 tonnes in 2012
Estimates of feed ingredients availability (continued)
– Wheat: in 2012 imported 8.5 mill tonnes; wheat pollard & bran 2.6 mill tonnes, wheat sort 0.43 mill tonnes
• Grains:– Rice: almost all for human consumption; broken rice used
to be as feed but not now– Corn: about 22% of corn production data (CBS) used as
feed; corn imports varies from thousands to millions tonnes per years
– Soybean: all for human consumption
• Roots, tubers & their by-product:– Cassava: 2012 production 24 mill tonnes, 2 mill tonnes
used for feed (100,000 tonnes fed as fresh cassava) – Sweet potatoes: limited use as feed
Conversion factors used for crop residues
Food cropsConversion
factorsNotes Sources
Paddy 3.86 ton/ha/year in DW UGM (1982)
Corn 2.09 ton/ha/year in DW UGM (1982)
Soybean 1.59 ton/ha/year in DW UGM (1982)
Peanut 2.14 ton/ha/year in DW UGM (1982)
Mung bean 1.59 ton/ha/year in DW UGM (1982)
Conversion factors used for oil seed cakes/meals
Oil seed cakes/meals
Conversion
factorsNotes Sources
Palm kernel meal
(PKC)0.514 ton/ha/year in DW
Mathius and
Wina (2013)
Coconut cakes/
meals0.37 of coconut production DLF(2006)
Peanut cakes/
meals0.675 of peanut production DLF(2006)
Possible contribution of non-pasture lands to forage supply
Forage source Wetland Dry landOil palm
plantation
Rubber
plantation
Albizia
plantation
Native grasses 87.49 81.52 62.94 85.64 79.21
Legumes 3.65 9.33 32.95 4.66 10.16
Other forages 8.86 9.15 4.11 9.7 10.63
The composition of forage sources under different land use (%)
Source: Abdullah (2006)
Land useDry Matter a/
(ton/ha/year)
Average land suitable for
herbage production
(% ha)
Wetland 2.355 2.26Dry land 5.852 24.45Oil palm (3-4 years) 13.280 80.04Rubber (8-12 years) 11.118 72.76Timber: Albizia (8-10 years) 10.504 68.55
Note: a/ Natural herbage production of non-pasture land area
Classification of feed ingredients availability in different altitudes and seasons in Java
Region Altitude Season Feed ingredient availability
Java
Lowland
Wet season
Native and improved grasses and legumes,
mixtures of corn stovers, peanut and soybean
residues, sugar cane tops
Dry season
Mixture of rice straw, sugar cane tops, Sesbania,
Gliricidia, jackfruit leaves; increased
supplementary feed from agro-industrial by-
products: rice bran, wheat pollard, copra meal,
tofu wastes, soya sauce waste
Highland
Wet season
Native and improved grasses and legumes, legume
straw (eg peanut straw), corn stover, straw from
pulses and beans, improved pastures (elephant
grass, Brachiaria sp, Setaria sp etc.)
Dry season
Increased use of corn stover, rice straw, jackfruit
leaves, legume: Leucaena sp, Calliandra sp.;
increased supplementary feed from agro-industrial
by-products: rice bran, wheat pollard, copra meal,
tofu wastes, soya sauce waste

61
Classification of feed ingredients availability in different altitudes and seasons in Nusa Tenggara
Nusa
Tenggara
Lowland
Wet season
Mainly native pasture supplemented
by palm trees (putak), natural grasses,
legumes, corn stovers
Dry season
Mainly native pasture supplemented
by palm trees (putak), natural grasses,
legumes (Gliricidia sp), corn stovers,
supplementation of rice bran
Highland
Wet season
Natural grasses, legumes, corn stovers,
palm trees (putak), Leucaena sp and
Calliandra sp, dry grasses
Dry season
Natural grasses, legumes, corn stovers
supplemented by palm trees (putak),
legume trees (Leucaena sp and
Calliandra sp) supplementation of rice
bran
Region Altitude Season Feed ingredient availability
Classification of feed ingredients availability in different altitudes and seasons in South Sulawesi
South
Sulawesi
Lowland
Wet season
Mainly pasture, crop residues and agro-
industrial by-products
Dry season
Mainly pasture, crop residues and agro-
industrial by-products, tree legumes,
supplementation of rice bran
Highland
Wet season
Natural grasses and legumes, crop residues
and agro-industrial by-products.
Dry season
Natural grasses and legumes, crop residues
and agro-industrial by-products, tree
legumes, supplementation of rice bran
Region Altitude Season Feed ingredient availability
Ruminant production system
Livestock type
Ruminant production system
Total
(%)Extensive
and mixed-
extensive (%)
Mixed crop
livestock (%)
Intensive
(%)
Beef cattle 29 65 6 100
Dairy cattle 0 10 90 100
Beef buffalo 100 0 0 100
Dairy buffalo 0 0 100 100
Sheep a/ 20 70 10 100
Goats 20 70 10 100
Source: Tangendjaja (2013), personal communicationNote: a/ sheep is assumed the same with goat
Monogastric production system
Livestock type
Monogastric production system
Total
(%)Extensive
(%)
Semi-
intensive
(%)
Intensive
(%)
Native chicken 78.16 13.89 7.96 100
Breeders 0 0 100 100
Layers 0 0 100 100
Broilers 0 0 100 100
Ducks 70 20 10 100
Quail 0 0 100 100
Pigs 80 10 10 100
Sources: Tangendjaja (2013), personal communication
Proportion of each animal species by regions (%)
RuminantRegion Beef cattle Dairy cattle Buffalo Sheep Goat
Sumatera 18.38 0.40 39.29 5.66 22.50
Java 50.68 99.21 27.82 93.17 57.23
Bali-Nusa Tenggara 14.18 0.03 19.74 0.85 7.16
Kalimantan 2.95 0.06 3.18 0.05 2.27
Sulawesi 12.08 0.29 8.46 0.08 8.57
Papua and Maluku 1.74 0.00 1.51 0.18 2.26
Total 100.00 100.00 100.00 100.00 100.00
MonogastricRegion Native chicken Layer Broiler Duck Quail Pig
Sumatera 23.31 23.20 14.76 20.93 3.45 21.98
Java 41.25 60.89 72.77 49.23 93.54 2.86
Bali-Nusa Tenggara 7.30 3.76 0.85 3.78 0.06 35.09
Kalimantan 10.49 5.07 9.03 12.42 0.64 10.21
Sulawesi 15.12 6.89 2.32 12.38 2.31 17.87
Papua and Maluku 2.54 0.18 0.27 1.26 0.00 11.99
Total 100.00 100.00 100.00 100.00 100.00 100.00
Source: DGLAHS (2012a)
Forage requirements of ruminants at NATIONAL level (tonnes/year) - DW
NATIONAL
Extensive MCLS Intensive Total Total
2.00% 2.50% 3% (kg/day) (ton/year)
Beef cattle <12 months 1,447,429 1,414,899 82.5 82.5 29% 65% 6% 1,369,624 3,837,308 425,056 5,631,988 29,462,921
12-24 months 1,818,935 2,010,543 255.8 175.6 29% 65% 6% 4,746,343 13,297,943 1,473,003 19,517,288
>24 months 1,454,733 6,677,834 307.0 282.0 29% 65% 6% 13,514,135 37,862,879 4,194,042 55,571,056
Dairy cattle <12 months 55,959 73,817 200 175 0% 10% 90% - 60,274 650,964 711,238 2,385,929
12-24 months 50,169 93,285 480 350 0% 10% 90% - 141,827 1,531,733 1,673,561
>24 months 19,608 304,375 486 431 0% 10% 90% - 351,864 3,800,130 4,151,994
Buffalo <12 months 108,403 104,485 221.7 218.4 100% 0% 0% 937,049 - - 937,049 3,012,541
12-24 months 126,728 143,186 326 300 100% 0% 0% 1,685,448 - - 1,685,448
>24 months 172,642 649,634 349 341 100% 0% 0% 5,631,039 - - 5,631,039
Goat <12 months 2,043,710 2,114,884 21 19 20% 70% 10% 327,413 1,432,430 245,559 2,005,402 5,453,997
12-24 months 1,742,068 2,743,588 35 30 20% 70% 10% 573,120 2,507,400 429,840 3,510,360
>24 months 1,757,319 7,422,429 50 40 20% 70% 10% 1,539,052 6,733,354 1,154,289 9,426,696
Sheep <12 months 1,472,772 1,788,788 45 29 20% 70% 10% 471,630 2,063,381 353,723 2,888,734 5,142,673
12-24 months 1,370,185 1,358,394 58 37 20% 70% 10% 516,738 2,260,727 387,553 3,165,018
>24 months 1,622,526 3,847,603 70 56 20% 70% 10% 1,311,961 5,739,830 983,971 8,035,762
45,458,061
Forage requirement (in DW) = 2-3% x BWHerd structure Production systems
SpeciesAge group Male Female Male (kg) Female (kg) Extensive MCLS Intensive
Source: Authors’ calculation

62
Balance
Native grasses Legume Other forages Total Beef cattle Dairy cattle Buffalo Sheep Goat Total (tonnes/year)
National 210,299,333 40,915,056 22,430,093 273,644,482 29,462,921 2,385,929 3,012,541 5,142,673 5,453,997 45,458,061 228,186,421
Java
DKI Jakarta 89,014 9,893 9,982 108,888 3,998 11,034 636 414 3,228 19,309 89,579
West Java 4,193,966 801,080 453,573 5,448,619 871,940 610,266 130,157 3,138,984 900,032 5,651,379 202,760-
Central Java 1,711,616 264,836 188,902 2,165,353 3,769,137 611,910 213,624 984,848 1,689,722 7,269,241 5,103,888-
DI Yogyakarta 297,668 36,644 37,102 371,415 739,152 14,472 3,521 66,127 154,460 977,733 606,318-
East Java 2,820,785 493,305 306,778 3,620,869 9,431,206 1,229,784 94,475 942,915 1,270,455 12,968,835 9,347,966-
Banten 895,628 146,044 101,666 1,143,338 96,356 88 352,306 282,843 340,291 1,071,884 71,454
Total 10,008,677 1,751,801 1,098,004 12,858,482 14,911,789 2,477,553 794,718 5,416,132 4,358,189 27,958,382 15,099,899-
Forage supply (tonnes/year) Forage requirement (tonnes/year)
Feed Balance: Forage for ruminants at national level and in Java (tonnes/year) - DW
Source: Authors’ calculation
Corn, rice bran and PKC requirements in compound feed production, NATIONAL, in
2012 (tonnes/year)
NATIONAL
Pig Pet Ruminant Total
75% 15% 10% 100%
Compound feed prod 5,992,099 5,261,394 1,283,996 981,975 252,756 313,260 62,652 41,768 417,680
Corn
Corn proportion (%) 50.0% 45.0% 47.5% 50.0% 50.0% 40.0% 45.0% 10.0%
Corn requirement 2,996,050 2,367,627 609,898 490,988 126,378 125,304 28,193 4,177 157,674 6,748,615
Rice bran
Rice bran proportion (%) 7.5% 2.5% 7.5% 7.5% 7.5% 22.5% 2.5% 25.0%
Rice bran requirement 449,407 131,535 96,300 73,648 18,957 70,484 1,566 10,442 82,492 852,339
PKC
Rice bran proportion (%) 3.0% 3.0% 0.0% 3.0% 3.0% 3.0% 3.0% 10.0%
Rice bran requirement 179,763 157,842 - 29,459 7,583 9,398 1,880 4,177 15,454 390,101
Total
requirements
(tonnes/year)
Item Fish Shrimp
Others
Broiler Layer Breeder
Source: Authors’ calculation
Corn, rice bran and PKC requirements in compound feed production, JAVA, in 2012
(tonnes/year)
JAVA
Pig Pet Ruminant Total
75% 15% 10% 100%
Compound feed prod 4,194,469 3,682,976 898,797 687,383 176,929 219,282 43,856 29,238 292,376
(70% of national prod)
Corn
Corn proportion (%) 50.0% 45.0% 47.5% 50.0% 50.0% 40.0% 45.0% 10.0%
Corn requirement 2,097,235 1,657,339 426,929 343,691 88,465 87,713 19,735 2,924 110,372 4,724,030
Rice bran
Rice bran proportion (%) 7.5% 2.5% 7.5% 7.5% 7.5% 22.5% 2.5% 25.0%
Rice bran requirement 314,585 92,074 67,410 51,554 13,270 49,338 1,096 7,309 57,744 596,637
PKC
Rice bran proportion (%) 3.0% 3.0% 0.0% 3.0% 3.0% 3.0% 3.0% 10.0%
Rice bran requirement 125,834 110,489 - 20,621 5,308 6,578 1,316 2,924 10,818 273,071
Others Total
requirements
(tonnes/year)
Item Broiler Layer Breeder Fish Shrimp
Source: Authors’ calculation
Corn, rice bran and PKC requirements for ruminant concentrate, NATIONAL, 2012
(tonnes/year)
NATIONALCorn, rice bran and palm kernel cake (PKC) requirements for concentrate feed of ruminants, national, 2012 (tonnes/year)
Extensive MCLS Intensive Extensive MCLS Intensive kg/day tonnes/year
Beef cattle 14,824,373 29% 65% 6% - - 8.50 7,560,430 2,759,557 10.00% 275,956 40.00% 1,103,823 10.00% 275,956
Dairy cattle 597,213 0% 10% 90% - - 9.00 4,837,425 1,765,660 7.50% 132,425 35.00% 617,981 5.00% 88,283
Buffalo 1,305,078 100% 0% 0% - - - - - - - - - - -
Sheep 11,791,000 20% 70% 10% - 0.25 0.80 3,006,705 1,097,447 - - 35.00% 384,107 10.00% 109,745
Goat 16,946,000 20% 70% 10% - 0.25 0.80 4,321,230 1,577,249 - - 35.00% 552,037 10.00% 157,725
Total 408,380 2,657,948 631,708
Rice bran
propor-
tion
Total rice
bran
(tonnes/
year)
PKC
propor-
tion
Total PKC
(tonnes/
year)
Concentrate use
(kg/head/day)Production systems Total concentrate use Corn
propor-
tion
Total corn
(tonnes/
year)
Species Population
Source: Authors’ calculation
Corn, rice bran and PKC requirements for ruminant concentrate, JAVA, 2012
(tonnes/year)
JAVA Corn, rice bran and palm kernel cake (PKC) requirements for concentrate feed of ruminants, Java, 2012 (tonnes/year)
Extensive MCLS Intensive Extensive MCLS Intensive kg/day tonnes/year
Beef cattle 7,512,273 29% 65% 6% - - 8.50 3,831,259 1,398,410 10.00% 139,841 40.00% 559,364 10.00% 139,841
Dairy cattle 592,520 0% 10% 90% - - 9.00 4,799,412 1,751,785 7.50% 131,384 35.00% 613,125 5.00% 87,589
Buffalo 363,049 100% 0% 0% - - - - - - - - - - -
Sheep 10,985,877 20% 70% 10% - 0.25 0.80 2,801,399 1,022,511 - - 35.00% 357,879 10.00% 102,251
Goat 9,697,565 20% 70% 10% - 0.25 0.80 2,472,879 902,601 - - 35.00% 315,910 10.00% 90,260
Total 271,225 1,846,278 419,941
Total corn
(tonnes/
year)
Rice bran
propor-
tion
Total rice
bran
(tonnes/
year)
PKC
propor-
tion
Total PKC
(tonnes/
year)
Species PopulationProduction systems
Concentrate use
(kg/head/day)Total concentrate use Corn
propor-
tion
Source: Authors’ calculation

63
Corn and rice bran requirements for monogastric concentrate, NATIONAL, 2012
(tonnes/year)
NATIONALCorn and rice bran requirements in concentrate feed of monogastrics, national, 2012 (tonnes/year)
Nat. Chicken 264,340,000 92.04% 7.96% 0.01 0.10 4,537,132 1,656,053 50% 828,027 30% 496,816
Duck 43,488,000 90.00% 10.00% 0.06 0.16 3,044,160 1,111,118 25% 277,780 40% 444,447
Pig 7,525,000 90.00% 10.00% 0.00 2.00 1,505,000 549,325 50% 274,663 40% 219,730
Total 1,380,469 1,160,993
Concentrate use
(kg/head/day)Total concentrate use
Species Population Semi
intensive/
semi
scavenging
Intensive/
industrial
Semi
intensive/
semi
scavenging
Intensive/
industrialkg/day
tonnes/
year
Corn
propor-
tion
Total corn
(tonnes/
year)
Rice
bran
propor-
tion
Total rice
bran
(tonnes/
year)
Production systems
Source: Authors’ calculation
Feed balance: corn, rice bran and PKC, NATIONAL, 2012 (tonnes/year)
Total corn, rice bran and PKC requirements, national, 2012 (tonnes/year)
Rice bran PKC
Compound feed 6,748,615 852,339 390,101
Concentrate feed of ruminants 408,380 2,657,948 631,708
Concentrate feed of monogastric 1,380,469 1,160,993 -
Total 8,537,463 4,671,279 1,021,809
Predicted production in 2012: 19,377,030 a) 8,100,000 b) 5,868,837 284,000 c)
Sutplus/deficit 10,839,567 437,463- 1,197,558 737,809-
Corn
Source: Authors’ calculationNote: a) CBS (2013)
b) USDA/industry estimatesc) available for domestic use (PSD online, FAS-USDA, accessed on 2nd of August 2013)
Feed balance: corn, rice bran and PKC, JAVA, 2012 (tonnes/year)
Source: Authors’ calculationNote: a) CBS (2013)
b) USDA/industry estimates (51% of corn produced in Java)c) it is assumed none of PKC produced in Java
Total corn, rice bran and PKC requirements, Java, 2012 (tonnes/year)
Rice bran PKC
Compound feed 4,724,030 596,637 273,071
Concentrate feed of ruminants 271,225 1,846,278 419,941
Concentrate feed of monogastric 486,200 430,042 -
Total 5,481,455 2,872,957 693,012
Predicted production in 2012: 9,842,089 a) 4,131,000 b) 2,700,336 - c)
Sutplus/deficit 4,360,633 1,350,455- 172,620- 693,012-
Corn
SUMMARY AND CONCLUSION
Indonesia has abundance of feed ingredient resources but some efforts have to put in place to speed up and meet the high demand of feed ingredients both from modern large-scale feed manufacturers and medium and small-scale feed processors. The GOI has responded to the situation by launching programs to improve quality, increase quantity and reduce prices of feed and feed ingredients.
Although Java island is only 7% of the total land area of Indonesia, current production of food crops and horticulture, their residues and by-products produced more than 50% in this most populated areas. Currently, intensive production systems are suitable in Java and most of livestock and poultry industry are located in Java but future expansion of livestock and poultry production is in outer islands due to availability of huge land areas.
Seasons have a significant effect on the level of production of feed ingredients. Of the total food crop production (rice, corn, soybean, peanut and mung bean) from 2010 to 2012, 46% was produced during January to April, 32% in May-August and 22% in September to December. Food crop production in September to December is only about half of the production in January to April.
1
2
3
SUMMARY AND CONCLUSION (continued)
In 2011, the main feed ingredients which are available in Indonesia were 593.4 million ton and the five majors sources are: native grasses 210.3 million ton (34.4% of the total production) estate crop by-products 131.6 million ton (22.2%) grains 85.3 million ton (14.4%) crop residues 61.7 million ton (10.4%) legume forages 40.9 million ton (6.9%)
For ruminants, three regions have been choosen to represent feeding systems in Indonesia: Java respresents a densely populated humand and ruminants with more
intensive cropping, heavy vegetations and more rainfall. East and West Nusa Tenggara represent a drier part of Indonesia with
extensive and semi-intensive production. South Sulawesi represents a more moderate agro-ecological zones with
less rainfall than Java but higher than Nusa Tenggara.
Commercial and intensive poultry and pig are raised in intensive and industrial production systems. Feeding systems for these animals are not influenced by agro-ecological zones and regions.
4
5
6
SUMMARY AND CONCLUSION (continued)
The main factors that determine the use of feed ingredient are their availability all year round, quality that meets the demand of feed industry and competitive prices.
The government programs to increase the availability of locally produced feed ingredients include provision of equipment for farmer groups to increase the availability of local feed ingredients and trainings. In the eastern part of Indonesia, the GOI rejuvenates native pastures to increase the availability of grasses and legumes particularly during hot and long dry seasons.
A more comprehensive and sistimatically survey at nation-wide level has to be conducted to collect more and up to date information on the availability of feed ingredients and feeding systems in Indonesia. Expertise and funding from international donors such as FAO, ADB, IFAD, World Bank are needed to improve the state-of-the-art of feed and feeding in Indonesia.
7
8
9

64
LAO PDR COUNTRY REPORT
S. Nakesene
FAO-APHCA workshop on “ Animal Feed
Resources and their Management in Asia-
Pacific Region” Bangkok, 13-15 August 2013
Laos Country ReportSisouphanh NAKASENE
Livestock Farming Technical Standard Control Center (LSCC)
Department of Livestock and Fisheries
Livestock production in Lao PDR is characterized almost
extensively by smallholder production
In lowland areas buffaloes and cattle are raising primarily as draft
animals for plowing, for other farm activities, transportation,
saving bank when necessary, and as a source of fertilizers.
80% of the population in the provinces are smallholders, 48% have
buffaloes, 31% cattle, 49% pigs and 73% poultry, which are
farmed using low cost production technologies based on common
pastures, agricultural residues and family labor with no specific
feed provision.
Some groups characteristically raise large ruminants or goats
integrated into their shifting cultivation activity.
Almost all animals are free-range, scavenging animals within a
low input - low output system.
7
Livestock production system
Number of livestock by species during the year 2010Provinces Cattle Buffalo Goat Pigs chicken
Vientiane Capital 108,200 15,100 11,800 32,800 1,149,000
Phonsaly 14,000 20,200 2,400 68,100 310,600
Luangnamtha 13,800 8,800 3,400 45,300 271,000
Oudomxay 31,500 21,200 10,700 71,200 563,800
Bokeo 44,700 20,500 5,600 50,000 359,400
Luang Prabang 65,700 44,000 22,900 113,100 997,700
Huaphanh 74,500 53,200 16,700 98,800 614,500
Xayabouly 111,200 43,800 7,200 95,700 1,200,500
Xiengkhuang 134,900 38,100 8,100 69,100 790,400
Vientiane Province 192,200 61,200 11,100 70,200 1,242,200
Borikhamxay 99,700 33,600 12,500 40,600 427,800
Khammuane 110,200 59,700 16,100 42,000 403,900
Savannakhet 313,000 148,000 56,500 72,800 1,057,300
Saravanh 97,600 57,100 14,600 43,700 460,600
Sekong 14,900 13,100 4,600 16,400 92,400
Champasak 134,200 99,700 8,300 30,300 887,600
Attapeu 26,000 36,800 3,200 18,300 275,900
Total: 1,586,200 774,200 215,600 978,300 11,104,700
Source: Agricultural census 2010
21 Dec 2005 9
- Over 90% of all livestock is produced by smallholders,
while large intensive commercial enterprises are few in
number, most producing pigs and poultry and located close
to major urban markets.
- There is trend to more towards industrial farming using
imported hybrids in peri-urban: mainly layers, broilers, pigs,
exotic sex-reversed fish but still limited by many factors.
- Most of these agribusinesses are small cottage industries
with few employees
- In general, production costs tend to be high since semi-
intensive pig and poultry production is dependent on
concentrate feed which, in many cases, is imported from
Thailand
GENERAL OUTLOOK ON LIVESTOCK INDUSTRY IN LAOS
Livestock Feeding system:
For Buffalo, Cattle, Goat and sheep
Ways of feeding managing animals have evolved in response
to the predominant cropping system and available feed
resources. Meaning that fallow cropland, communal area along
the roads, rivers, around the paddy fields and villages,
secondary forest, an other non cropped communal land and by
crop products including rice straw.
Smallholder farmers operate mixed farming systems, growing
both crops and farming animals.
In the lowland area for the most of the year cattle and
buffaloes are usually grazed on the vacant cropping field,
utilizing rice stubble, re-growth of rice after harvest, grasses
and weeds growing in and around rice fields and rice straw
21 Dec 2005 11
Land use systems in the past
Land use systems in present
(À²ˆDiversitification of landuse system for food/feed production
Water
source
construction
area Shifting
agricultural area
Natural forest
Pasture
Water
source
Low land rice
area
Mixed farming
system area
Natural forest
Agricultural
mixing system
area
Upland
rice
areaShifting
agricultural
areaconstruction
area
Pasture
Low land
rice area

65
Livestock Feeding system (cont.)
For Buffalo, Cattle, Goat and sheep
The management system tends to be extensive with animals
being allowed to graze and mix freely in sometime large herds.
Providing salt or mineral block is commonly used to entice
animals back to the pens.
During the wet season when farmer cultivate their rice field,
animals are grazed in upland, grazing and secondary forest
areas way from rice field in order to ovoid the damage to the
crops; buffaloes are kept near the rice field for land preparation
and fed them by supplementary grass and rice bran to ensure
their health condition
21 Dec 2005 13
Livestock Feeding system(cont.)For Buffalo, Cattle, Goat and sheep
The main feed resource remains forage from range and forest
grazing together with straws, stoves and weed grass from
cropped land .
The management system tends to be extensive with animals
being allowed to graze and mix freely in sometime large herds.
Providing salt or mineral block is commonly used to entice
animals back to the pens.
During the wet season when farmer cultivate their rice field,
animals are grazed in upland, grazing and secondary forest
areas way from rice field in order to ovoid the damage to the
crops; buffaloes are kept near the rice field for land preparation
and fed them by supplementary grass and rice bran to ensure
their health condition14
16
For Beef Cattle and buffalo
1. Extensive production system (EPS)
• Wet season: Natural grasses-crop residue-other based feeding system; average daily
provision per animal of 5-6 kg Natural grass- crop residue-other by-products in a 95:5:5
• Dry season: Natural grasses(GR, LF, FT)-crop residue-other based feeding system;
average daily provision per animal of 5-6 kg Natural grass- crop residue-other in a
70:25:5 ratio
2. Mixed extensive system (MES)
• Wet season :Natural grasses-crop residue-agro by-product based feeding
system; average daily provision per animal of 5-6 kg grass- crop residue-other
in a 70:25:5 ratio
• Dry season: Natural grasses-crop residue-agro by-product based feeding
system; average daily provision per animal of 5-6 kg grass- crop residue-other
by-products in a 60:35:5 ratio
3. Mixed crop-livestock system (MCLS)
• Wet season : Grasses-crop residue-agro by-product based feeding system;
average daily provision per animal of 5-6 kg grass- crop residue-other in a
50:45:5 ratio
•Dry season: Grasses-crop residue-agro by-product based feeding system; average daily
provision per animal of 5-6 kg grass-crop residue- other by-products in a 30:65:5 ratio
Livestock Feeding system(cont.)For pigs production:
Upland systems: invariably with local black pigs fed on home
prepared feeds and foraging. Feed is usually is base on root
crops of cassava/artichoke with maize grain and sometimes
alcohol production residues with vegetable material.
Intensive Systems: Modern intensive production systems have
developed especially near to main urban centers. Many of
these systems depend on commercial feeds compounded I Laos
or imported from abroad countries.
Integrated Alcohol and pig production intensive systems: This
lowland systems and also in maize growing area along the
Mekong River. Feeding systems are based on the use of
fermentation residues after distillation to produce alcohol. The
feeds are frequently made with addition of some commercial
pig concentrate mixture and vegetable. 18
For Pigs
1. Extensive production system (EPS)
• Wet season: average daily provision per animal of 2.4kg Grain-grain by product-
other 15:35:50 ratio
Dry season: average daily provision per animal of 2.4kg Grain-grain by product-
other 15: 40:35 ratio
2. Mixed extensive system (MES)
• Wet season :average daily provision per animal of 2.4 kg Grain-grain by product-
other 20:55:25 ratio
• Dry season: average daily provision per animal of 2.4kg Grain-grain by product-
other by-product 40:30:30
3. Mixed crop-livestock system (MCLS)
•Wet season : average daily provision per animal of 2.6kg Grain-oil seed cake -other by-
product 50:15:35
•Dry season:average daily provision per animal of 2.6kg Grain-oil seed cake -other y-
product 55:15:30
4. Intensive system (IPS)
•Wet season : average daily provision per animal of 3kg Grain-oil seed cake -other by-
product 50:20:30
•Dry season:average daily provision per animal of 3kg Grain-oil seed cake -other by-
product 55:20:25
Livestock Feeding system:For Poultry Production:
Commercial Broiler systems are in operation near to major
urban centers including Vientaine, Thakhek and Savannakhet.
These systems are depend on commercial feed either from Lao
feed ( CP) in Vientiane or feeds from Thailand.
Semi-intensive Poultry and Egg production systems:
insufficient data has been gathered by the project to assess the
profitability of dual-purpose egg production/meat production
systems whether intensive or semi-intensive.
Commercial Egg Production: Feed for layers and for growth
and development of layers represent a little over 50% of sales
of mixed feeds manufactured in Vientiane.
21
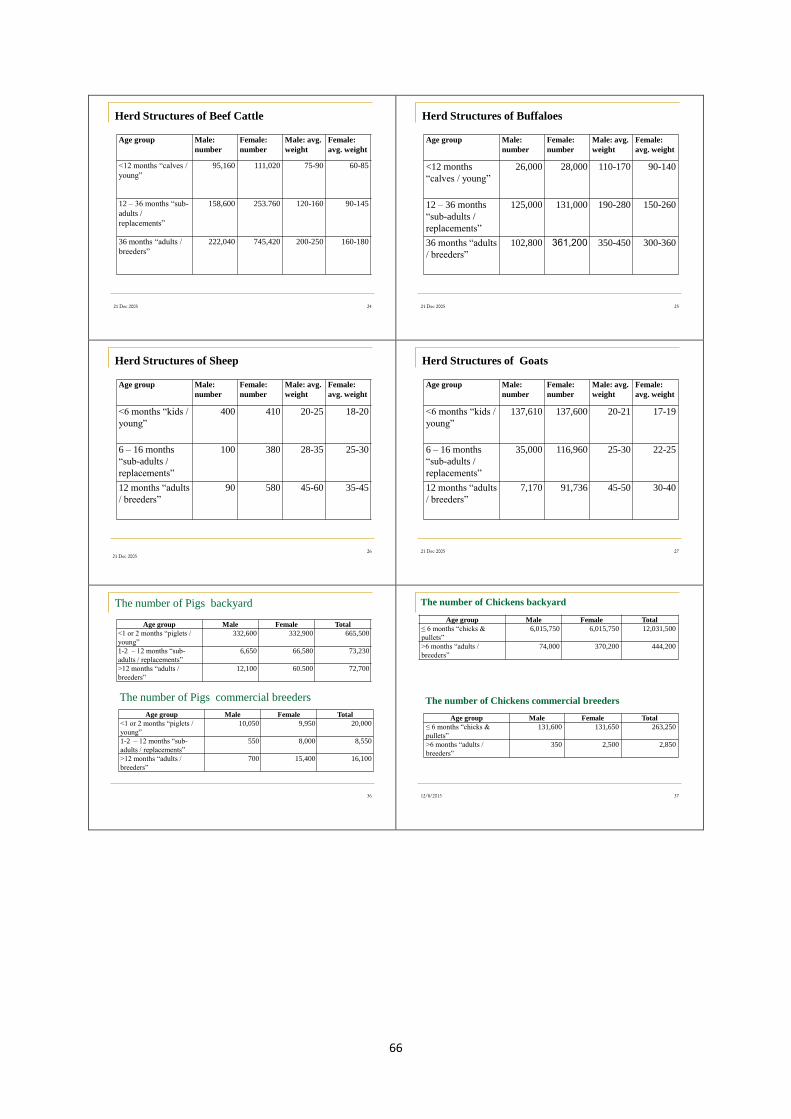
66
21 Dec 2005 24
Herd Structures of Beef Cattle
Age group Male:
number
Female:
number
Male: avg.
weight
Female:
avg. weight
<12 months “calves /
young”
95,160 111,020 75-90 60-85
12 – 36 months “sub-
adults /
replacements”
158,600 253.760 120-160 90-145
36 months “adults /
breeders”
222,040 745,420 200-250 160-180
21 Dec 2005 25
Herd Structures of Buffaloes
Age group Male:
number
Female:
number
Male: avg.
weight
Female:
avg. weight
<12 months
“calves / young”
26,000 28,000 110-170 90-140
12 – 36 months
“sub-adults /
replacements”
125,000 131,000 190-280 150-260
36 months “adults
/ breeders”
102,800 361,200 350-450 300-360
21 Dec 2005
26
Herd Structures of Sheep
Age group Male:
number
Female:
number
Male: avg.
weight
Female:
avg. weight
<6 months “kids /
young”
400 410 20-25 18-20
6 – 16 months
“sub-adults /
replacements”
100 380 28-35 25-30
12 months “adults
/ breeders”
90 580 45-60 35-45
21 Dec 2005 27
Herd Structures of Goats
Age group Male:
number
Female:
number
Male: avg.
weight
Female:
avg. weight
<6 months “kids /
young”
137,610 137,600 20-21 17-19
6 – 16 months
“sub-adults /
replacements”
35,000 116,960 25-30 22-25
12 months “adults
/ breeders”
7,170 91,736 45-50 30-40
The number of Pigs backyard
36
Age group Male Female Total
<1 or 2 months “piglets /
young”
332,600 332,900 665,500
1-2 – 12 months “sub-
adults / replacements”
6,650 66,580 73,230
˃12 months “adults /
breeders”
12,100 60.500 72,700
Age group Male Female Total
<1 or 2 months “piglets /
young”
10,050 9,950 20,000
1-2 – 12 months “sub-
adults / replacements”
550 8,000 8,550
˃12 months “adults /
breeders”
700 15,400 16,100
The number of Pigs commercial breeders
The number of Chickens backyard
12/8/2013 37
Age group Male Female Total
≤ 6 months “chicks &
pullets”
6,015,750 6,015,750 12,031,500
˃6 months “adults /
breeders”
74,000 370,200 444,200
Age group Male Female Total
≤ 6 months “chicks &
pullets”
131,600 131,650 263,250
˃6 months “adults /
breeders”
350 2,500 2,850
The number of Chickens commercial breeders

67
Feed Resources
1. Natural Pasture: The total areas is bout 870.000 ha, there are :
• Native grasses species: Brachiaria sp., Imperata
cylindrical, Eleusine indica, airstida cumirrgiana,
paspalum conjugatum, paspalum serobiculatum,
Erianthus arundinaceus, Eragrostis superb, thysanolaena
fleknosa,etc;
• Natural Legumes species: Pueraria phasealoid, mimosa
invisa, etc;
• Natural Fodder trees: Oroxylum indicum, sandoricum
koetjape, wrightia tomentosa var cochinchinesis, orosia
cambodiana, broussonela papyfera, leucaena sp., ficus
sp., etc.
Feed Resources
2. Developed pasture: Increase the feeds for smallholder farmers
through backyard pasture establishment and a tree-strata-forage
system. Improved animal nutrition for ruminants through pasture
development like Mulato, quinea, Ruzzi, Gamba, Nepia, and Stylo
In the total areas is bout 8.500 ha.
3. Crop residues: rice straw, maize stovers, …
4. Raw materials
• local raw materials: Maize, Rice, Sorghum, Soy, Groud nut,
Cotton Meal/Cake, Ground nut Meal/Cake, Soy Meal/Cake,
Sesame Cake, Fishmeal, Oilseeds Meal/Cake, DDG ,
Molasse, Cereal Brans, Pulses, Cassava, Others.
• Import raw materials: , Soy Meal/Cake, Fishmeal and
Others ( Mineral Premix, Vitamin Premix).
In general smallholders traditionally have fed animals on freely
available forage resources, which have no value to smallholders
except as livestock feed. These include grasses, herbs, tree leaves
and legumes that can be used for feeding animals.
As livestock numbers and cropping area have increased these
once abundant feed resources have become increasingly limited.
Once the quantity and quality of available feed is limited toward
the end of dry season when all available feed resources have been
exhausted. Over -stocking and poor range management practices
cause seasonal shortage of good quality grass. Lack of control on
the burning of rangeland and pasture is very detrimental to
livestock nutrition
Technical constraints in livestock feeding system
The knowledge gap
To sets out the principles, technical standards,measures & methods related to the establishment, monitoring &control of livestock farms for effective
feed production, feed safety and environment friendly.
Understand and use the principle techniques to assess or estimate the
quantity and quality of the locally available in the provincial and district
area
Identify the types of feed or forage resources that can be used for livestock
production
Understand the principle of livestock production which relates to
nutritional requirements and their feeding systems
Develop a feed year planning to meet the feed requirement of existing
livestock population in their own provincial and district area
Understand the participatory approach in problem diagnosis and assessment
of community need for livestock development, and
Develop forage and other appropriate feeding technologies that may lead to
improve livestock productivity in their provincial and district area.

68
MALAYSIA COUNTRY REPORT
F. Muhayat
By
FUZIAH MUHAYAT
DEPARTMENT OF VETERINARY SERVICES
MINISTRY OF AGRICULTURE MALAYSIA
1. Introduction
2. National Feed Inventory
3. Approach and Methodology
4. Feeding System
5. Compound Feed
6. Gaps and Approaches to Bridge those Gaps
7. Conclusion
Population (2010) 27 million
Total land area 33 million ha
Forested land area (2007) 56% - 18.5 million ha
Total cultivated land 20% - 6.6 million ha
Oil palms 13.6% - 4.5 million ha
Essential for producing animal protein food for the country
Contributed about 11 percent of GDP agriculture sector (GDP agriculture sector –7.3% of GDP Malaysia)
The poultry and swine production dominate the local livestock scenario
They were contribute more than 93% of the total meat produced by the country
55% Malaysia farmers are in the poultry and swine industries.
Parameters 2008 2009 2010
Broilers Population (Million heads) 137.86 146.54 158.71
Production (‘000 TM) 1,162.57 1,202.00 1,295.60
Consumption (‘000 TM) 953.71 983.63 1,012.9
Per capita consumption (kg/yr) 34.4 34.7 35.0
SS (%) 121.9 122.2 127.9
Layers/Eggs Population of Birds(Million heads) 45.34 49.02 49.71
Production (Million eggs) 8,715.00 9,270.00 9,826.00
Consumption (Million eggs) 7,760.4 8,081.9 8,514.7
Per capita consumption (eggs/yr) 280 285 295
SS (%) 112.3 114.7 115.4
Pigs/Pork Population (‘000 heads) 1,728.31 1,725.72 1,710.95
Production (‘000 TM) 195.07 206.03 234.00
Consumption (‘000 TM) 201.92 212.65 230.11
Per capita consumption (kg/yr) 18.2 18.8 19.9
SS (%) 96.6 96.9 101.7
Beef Cattle Population (‘000 heads) 1,003.13 1,021.02 1,039.90
Production (‘000 TM) 38.25 42.18 46.5
Consumption (‘000 TM) 150.5 156.20 162.50
Per capita consumption (kg/yr) 5.4 5.5 5.6
SS (%) 25.4 27.0 28.6
Sheep/goat
Mutton
Population (‘000 heads) 608.74 635.64 665.74
Production (‘000 TM) 1.96 2.16 2.39
Consumption (‘000 TM) 19.6 20.9 22.5
Per capita consumption (kg/yr) 0.7 0.7 0.8
SS (%) 10.00 10.30 10.6
Dairy cattle/Milk Population (‘000 heads) 36.00 36.76 37.02
Production (Million liter) 56.49 62.30 67.00
Consumption (Million liter) 1,152.80 1,271.40 1,367.30
Per capita consumption (Liter/yr) 42.5 45.1 47.5
SS (%) 4.9 4.9 4.9

69
More than 70% feed raw materials imported especially for mono-gastric animal industries.
For ruminant industries – used forages and PKE
Since Malaysia area planted in big area of palm oil tree, agro waste from this industry used widely such as PKE, POME and oil farm frond
Some other agro waste used – paddy straw and rice bran
Malaysia doesn’t planting some other grain except rice.
Some other agriculture waste like sweet corn Stover and vegetable actually cannot be captured because under Agriculture Department.
For the grasses, legume tree and forages tree we have plenty, the problem is the quality of that forages is questionable.
Import of Feeding stuff for animals 2009 – 2011in MT(MOA 2012)
Subgroup Trade 2009 (MT) 2010 (MT) 2011 (MT)
Oil-cake & other solid
residues from soyabean oil 980,570.55 1,104,591.82 978,552.57
Bran and pollard of wheat 66,855.58 83,625.23 75,419.84
Oil-cake & other solid
residues from ground-nut 19.88 - 200.00
Oil-cake & other solid
residues of rape seed 18,939.03 16,287.54 11,220.38
Oil-cake & other solid
residues of coconut/copra 3,768.97 707.00 755.40
Bran and residues of rice - - -
Meat offal; greaves 28,904.27 39,184.68 7,888.06
Residues of starch
manufacture and similar
residue 6,702.57 7,033.48 21,258.17
Maize (not including sweet
corn) 2,398,438.14 2,995,358.24 2,906,272.39
Other preparations of a kind
used in animal feeding130,113.34 128,352.74 150,102.49
Other feeding stuff for
animals 295,978.10 266,210.32 315,817.13
Palm kernel cake 3,404.39 15,451.00 19,740.47
3,933,694.81 4,656,802.04 4,487,226.88
Value Import of Feeding stuff for animals 2010 – 2011in RM (MOA 2012)
Subgroup Trade 2009 (RM) 2010 (RM) 2011 (RM)
Oil-cake & other solid residues from
soyabean oil 1,499,903,828 1,497,959,027 1,392,265,838
Bran and pollard of wheat51,304,482 71,492,781 72,497,115
Oil-cake & other solid residues from
ground-nut 18,418 - 91,865
Oil-cake & other solid residues of
rape seed 18,255,409 14,514,376 10,373,284
Oil-cake & other solid residues of
coconut/copra 1,908,632 423,300 500,263
Bran and residues of rice - - -
Meat offal; greaves 47,415,884 83,077,961 16,469,664
Residues of starch manufacture and
similar residue 15,000,427 15,503,609 44,779,731
Maize (not including sweet corn)1,826,804,863 2,454,167,292 2,924,263,828
Other preparations of a kind used in
animal feeding 440,413,390 447,983,445 499,060,932
Other feeding stuff for animals491,010,112 532,533,594 696,203,634
Palm kernel cake 2,191,073 4,087,091 7,088,712
4,394,226,518 5,121,742,476 5,663,594,866
Note: 1 United States dollar = RM3.20
Agriculture Waste Production (MT)/year
Oil Palm Tree
Oil Palm Frond
Palm Kernel Cake
POME
Paddy
Rice Straw
Rice Bran
26.2 Million MT
2.3 Million MT
1.5 Million MT
1.8Million MT
300,000MT
Volume of agro industrial waste in Malaysia (MOA 2009)
Improved grasses like Bracharia Decumben, Guinea grass, Bracharia humidicola, Napier and few others species only represent about 10,000 hectares.
Intensive system – 80%
Producing more than 80% of poultry products in the country
Using about 90% of maize and soya bean in the country
Mainly situated nearby urban area under close house system
Semi Intensive and Extensive – 20%
Producing less than 20% of poultry products in the country
Using about 5% of maize and soya bean in the country
Mainly situated at the remote area

70
Intensive system -58%
Feed lot cattle
100% PKE
Semi intensive system – 12%
Under Plantation (Palm Oil Tree)
Grazing and 10% PKE
Extensive system – 44%
Traditional farmers
Grazing and fodder
Most of them under Intensive system (80%)
40% concentrate (Dairy Cattle Pellet)
60% fodder
Some using TMR (Total Mixed Ration) with base raw material is 40%PKE
Kept most of the time in the shed
Semi Intensive – 20%
During milking time the dairy cattle brought back to the shed
Giving concentrate (DCP) or TMR in the shed.
After milking the cattle will be grazing under plantation.
Intensive system – 70%
40% goat pellet and fodder
Semi intensive and extensive system – 20%
Grazing and fodder
Small and traditional farmers
State Number of mills
Penang
Perak
Selangor
Negeri Sembilan
Malacca
Pahang
Johor
Sarawak
Sabah
Total
12
2
10
2
7
1
6
6
4
50
• The feed demand in the country full filled by about 50 feed mills located in East and West Malaysia
COMPANY TOTAL PRODUCE % SHARE
TON / MTH
CP 34,224 9.0%LEONG HUP 46,615 12.3%HUAT LAI 31,805 8.4%DINDING 25,448 6.7%FFM 14,711 3.9%GOLD COIN 13,232 3.5%SINMAH 11,838 3.1%LAY HONG 10,463 2.8%KFC 9,877 2.6%SELFMIX 120,346 31.8%OTHERS 59,648 15.8%
TOTAL 378,207 100%
Malaysia produces about 450,000MT compound feed per year
Most of complete feed produced in Malaysia , in pellet form due to demand from farmer
Malaysia Government policy in livestock industry - to transform the small farmers become semi commercial and commercial farmers.
Due that strategies the compound feed demand always high
Most of feed miller in Malaysia still under capacity and can produced any demand amount

71
The quantity of feed resources especially from agriculture waste like from sweet corn, sweet potato, cassava, vegetable, pineapple need to be captured precisely even though the volume is small
Well prediction of dynamics of animal population covering different stages of growth
The precise data of feed requirement from feeding system need to organized and established for better future livestock industries planning.
Continued preparation of feed inventory covering resource base, feeding systems for feed balance towards balance diet
MOA just agreed DVS suggestion to form National Animal Feed Council for finding solution in animal feed issues
The members of this Council are from varies agriculture agencies in Malaysia like DVS, DOF, DOA, MARDI, MOA, MADA, MPOB, National Pineapple Board and other agencies related with animal feed resources.
The Chairman will be Minister of Agriculture Malaysia This Council is a right platform to get precise information
for feed inventory and management for Malaysia
More than 70% Malaysia feed raw materials were imported
Importing more than 2 million MT corn and 1 million MT soya bean meal per year.
Producing 2.3 Million MT of PKE per year
PKE can be used 100% as feed to feed lot cattle and as main raw material for TMR for Dairy cattle
PKE as potential feed for poultry
Stabilized price of feed for farmers and consumer sake
Price of PKE in Malaysia need to be stabilized by government since it was produced locally
More aggressive R&D on PKE to ensure it can be used efficiently in mono-gastric animal
More encouragement from government for private sector to do reverse investment in corn planting at the neighboring country which suitable with low cost in production
Use National Animal Feed Council (Malaysia) as platform to solve any animal feed issues.

72
MONGOLIA COUNTRY REPORT
M. Batjargal
ANIMAL FEED RESOUIRCES AND THEIR MANAGEMENT
IN MONGOLIA
Mr.N.Batjargal, Delegate, Mongolia
COUNTRY REPORT
GENERAL INTRODUCTION
• Mongolia - largest
landlocked country
situated in East-
Central Asia between
Russian and China ;
• Total area: 1,5 mln sq
km;
• Population: 2.8 mln;
GENERAL INTRODUCTION
• Continental climate with 4 seasons: hot and short
summer /extremely cold long winter /January
averages dropping as low as −30 C (−22 F)/
• Limited growing season: /about three months or 90
days/
• Annual precipitation: 100 mm to 350 mm
Role and specifics of livestock sector•About 10 percent of GDP comes from livestock
sector;
• Livestock production - almost entirely pastoral;
• livestock sector is the major occupation of the rural
population,
• 1/3 of Mongolians engaged in animal husbandry
Species 2012
Camel 0.3
Horse 2.3
Cattle 2.5
Sheep 17.9
Goat 17.4
Total 40.4
NUMBER OF LIVESTOCK POPULATION BY SPECIES /in
million heads/
National feed inventory
Grassland:
• Grassland/natural pastures - major source and most
available livestock feed /almost 98% nutrition comes
from natural grasslands : 2 % supplements/;
• 147.1 million ha area suitable for grazing;
• Yield of native pastures is low and seasonal;
• Nutritive value decreased by 2-3, protein by 3-4 times
winter and spring.

73
• Annual average of nutritional resource of
pasture - 46.5 million tonnes hay;
• nutritional resource of summer-autumn
pasture - 26.3 million tonnes;
• winter-spring pasture - 18.9 million tonnes.
• Natural pasture provides livestock sector by
feed all year round.
National feed inventory
Major constraint –
inadequate provision
of nutrition especially
due to seasonal fodder
shortages;
Weight losses of 25 to
30% of live weight are
common during winter
and spring;
National feed inventory
Types 2008 2009 2010 2011 2012
Natural hay /forest
steppe/
618.6 547.4 682.4 717.2 705.1
Natural hay /steppe
zone/
412.3 364.9 454.9 478.0 470.0
Salt/minerals 53.8 44.4 48.0 40.4 36.6
Wheat residues 2.4 8.9 11.1 4.5 14.5
Wheat straw 11.1 8.5 8.3 7.9 4.6
Silage of corn or oa
ts
0.9 0.5 4.0 8.5 2.1
Types of prepared supplement feeds /thousand tonnes/
Species Summer and Autumn % Winter and Spring %
Total Natural
pasture
Hay Concen
trate
Silage Salt Total Natural
pasture
Hay Concen
trate
Silage Salt
Cattle:
Dairy cows of
exotic breeds
Mongolian
native breed
cows
Sheep and
Goats
Camel
Horses
100
100
100
100
100
95.2
100
100
100
100
-
-
-
-
-
4.7
-
-
-
-
-
-
-
-
-
0.09
0.09
0.01
0.01
-
100
100
100
100
100
-
75
75
100
100
22
15
15
-
-
22.5
10
5
-
-
48.4
-
-
-
-
0.09
0.09
0.01
0.01
0.01
Proportion of feeds consumed by different species
Ecologic
al
Zones
Species % Summe
r and
Autum
n
Winter and Spring
Natural
Pasture
Natural
Pasture
Hay Concent. Silage Salt
Forest-
steppe
and high
mountai
nous
Mongolian cow
Mongolian sheep and
goats
100
100
100
100
70
70
20
30
0
0
0
0
0.1
0.1
Steppe Mongolian cow
Mongolian sheep and
goats
100
100
100
100
75
95
15
5
0
0
0
0
0.1
0.1
Gobi Camels
Mongolian sheep and
goats
100
100
100
100
100
95
0
5
0
0
0
0
0
0
Livestock feeding by ecological zones
Main feeding system in Mongolia
Feeding system can be divided into two categories:
• Extensive production (grassland)
• summer feeding of native Mongolian breeds -
entirely based on grassland based feeding system
(GR-100);
• Winter feeding based on grassland + hay
• Semi-intensive or mixed /dairy cows mostly pure and cross breeds are kept in
summer/autumn under the grassland-crop residue based
feeding system/ winter

74
Challenges related to National Feed
inventory and possible solutions
Different data sources exist at different institutions,
however limited access to data sources (State
statistical office, Ministry gathers data through
surveys, Customers office, research institutions).
What needs to be done:
there is a need to establish systematic approach to
gather the data and database so that everybody can
have easy access;
revise methodologies according to demand to gather
data on animal feeds at the country level and agree
on unified approaches amongst main actors;
Challenges related to National Feed
inventory and possible solutions
Determine the main leading institution to
coordinate all aspects of National Feed Inventory;
in our case, Ministry of Agriculture and Industry
should lead the process;
Establish national task force responsible for
improving national feed inventory;
Improve linkages of institutions involved in data
gathering.

75
MYANMAR COUNTRY REPORT
T. Soe
Dr. Tin Maung Soe
Research Officer
Livestock Breeding and Veterinary Department
Myanmar
Animal Feed Resources and their Management in Myanmar
- Myanmar is an agro-based country
- Total cultivated area is about 29.7 million acres
- 75% of the population involve in Agriculture Sector
- 38.7% of GDP (Agriculture, Livestock & Fisheries)
ဴဴ(1) Located in South East Asia, Tropical country and three
season
(2) Average annual rainfall
100 to 200 inches in coastal and hilly regions
below 40 inches in the central Myanmar
40 to 80 inches during monsoon in other parts of Myanmar
Temperature - different according to above sea level
4 to 20 C - 30 to 40 ဴ C
(3) Soil Type muddy
(4) Main Crop Paddy and secondary crops are maize, peanut, jute, cotton and rubber,
N. Year Reserved
Forests
Current
Fallows
Net Area
Sown
Occupied
Area
Culturable
Waste
Other than
Fallows
Other
Wood
Land
Others Total
Area
1 1990-1991 25062 4724 20127 24851 20625 54970 41678 167186
2 1995-1996 25503 3042 22017 25059 19697 54557 42370 167186
3 2000-2001 31910 1695 24486 26181 17804 48892 42399 167186
4 2004-2005 38009 1086 25984 27070 15855 44808 41444 167186
5 2005-2006 38813 910 26989 27899 15516 44055 40903 167186
6 2006-2007 40678 736 28118 28854 14758 41969 40927 167186
7 2007-2008 41404 653 28930 29583 14304 40891 41004 167186
8 2008-2009 41604 634 29351 29985 14011 40570 41016 167186
9 2009-2010 41752 597 29591 30188 13861 40166 41219 167186
10 2010-2011 44271 569 29703 30272 13333 38621 40689 167186
Thousand acres
Area classified by type of land
Crop 1990-
1991
1995-
1996
2000-
2001
2004-
2005
2005-
2006
2006-
2007
2007-
2008
2008-
2009
2009-
2010
2010-
2011
CEREALS
Paddy 13748.3 17669.6 20986.9 24360.9 27245.8 30435.0 30954.1 32058.5 32165.8 32065.1
Wheat 121.5 76.7 92.1 150.0 156.2 140.2 155.3 170.4 179.2 181.0
Maize 184.1 270.4 358.9 771.1 903.5 1015.8 1128.1 1184.7 1225.7 1354.4
Millet 124.4 147.2 166.2 177.7 208.7 204.9 187.8 190.0 209.9 212.6
OIL SEEDS
Groundnut,r 196.8 206.2 241.6 335.1 379.3 414.7 453.8 477.8 513.3 529.3
Groundnut,w 267.8 377.2 477.9 596.1 643.6 673.2 748.4 806.4 827.2 840.8
Sesame,e 148.0 187.9 286.5 351.3 285.4 433.7 489.4 537.0 521.8 528.5
Sesame,l 64.4 110.9 89.3 122.6 153.1 179.8 211.7 228.7 268.3 258.9
Mustard 8.1 8.2 29.9 42.6 50.5 57.2 66.3 83.0 85.2 87.1
Production of selected crops
Thousand ton
Prevention and control of infectious diseases of animals
Veterinary Health Certificate
Artificial Insemination service
Animal feed quality assessment
Capacity building (local / Abroad)
Production of UMMB and EM
Livestock Research and Development
Vaccine production & Diagnostic work
Upgrading animal genetic by natural and artificial insemination.
Public awareness ( or ) extension work

76
Particulars 1990-
1991
1995-
1996
2000-
2001
2004-
2005
2005-
2006
2006-
2007
2007-
2008
2008-
2009
2009-
2010
2010-
2011
Cattle 9310 9862 10982 11944 12150 12393 12664 12964 13185 13609
Baffalo 2061 2203 2441 2651 2710 2773 2845 2927 2875 2977
S&Goat 1354 1504 1807 2250 2437 2661 2922 3233 3609 4084
Pig 2278 2970 3974 5366 5786 6432 7092 7817 8496 9416
Fowl 23323 28452 47755 77116 84829 96847 110614 124993 138938 156407
Duck 3245 5014 6556 8591 9271 10239 11234 12368 12835 14051
Livestock Production
Sr.
No.
Particulars 2012-2013
(Estimates)
1 Cattle 14.51
2 Buffalo 3.20
3 Sheep 0.88
4 Goat 4.35
5 Pig 11.43
6 Poultry 194.22
7 Duck 16.77
8 Quail 0.89
( number in millions)
Feedstuffs in
Super Cow’s Diet
• Rice straw (46%)
• Wheat bran (9.18%)
• Maize (9.72%)
• Sesame meal (7.56%)
• Chickpea husk (13.5%)
• Point (14.04%)
Feedstuffs in Kaung
Htet San’s Diet
• Rice straw (21%)
• Broken chickpea (35%)
• Cotton seed meal (32%)
• Chickpea husk (5%)
• Rice (7%)
46:54 (roughage & concentrate ratio)
21:79 (roughage & concentrate ratio)
Estimated values of ME, RDP, UDP, Total protein, RDN/OMDR and milk yield
of cross-bred Holstein Friesian lactating cows in compared with adopted valuesreferenced to NRC
Description Estimated value Adopted value
Super Cow
ME, Mcal 22.12 23.83
RDP, g 777.95 753.00
UDP, g 162.73 511.00
Total protein, g 940.68 1264.00
RDN/OMDR, g/kg 22.47 32.00*
Milk yield, kg 8.25 8.00
Kaung Htet San
ME, Mcal 31.58 27.24
RDP, g 2550.87 883.00
UDP, g 199.83 540.00
Total protein, g 2750.70 1423.00
RDN/OMDR, g/kg 47.61 32.00*
Milk yield, kg 11.53 9.00
Estimated values of ME, Total protein, Milk yield and Feed cost
DescriptionCD FD-I FD-II
ME, Mcal/kg of DM 2.1a
2.6b
2.6b
Total CP intake, kg 1.0a
1.5b
1.8c
Milk yield, kg, 4.5% FCM 9.1a 12.2b
11.2c
Feed cost, kyat/cow/d 1380 1320 1540
Feed cost, kyat/kg of milk 170b
130a 170b
Nitrogen utilization of dairy cattle fed respective diets
Description Control
group
Treatment 1
group
Treatment
2 group
Total N intake,
g/d 481.25a 362.33b 422.65c
Faecal N, g/d 156.08 145.52 166.24
Urinary N, g/d 182.00a 73.52b 76.20b
N retention, g/d 143.17a 143.29ab 180.22b
Nf/NI, % 32.43a 40.16b 39.33b
Nu/NI, % 37.82a 20.29b 18.03b
Nr/NI, % 29.75a 39.55ab 42.64b

77
Estimated values of milk yield and feed cost in cross-bredHolstein Friesian lactating cows fed on rations
Description Control
group
Treatment 1
group
Treatment
2 group
Milk yield, kg 13.81 13.54 14.22
Feed
cost/cow/d (kt)2776.91a 2264.07b 2640.34c
Feed cost/kg of
milk (kt)201.08a 167.21b 185.68c
Feed cost/kg of
TDN (kt)284.81a 239.58b 235.96c

78
THAILAND COUNTRY REPORT
T. Phonbumrung, K. Rimkeeree, and A. Permphol
1. BACKGROUND
• Thailand is one of the world largest food producing and
exporting countries with a GDP of US$ 382.46 billion and population of 64.6 million in 2012 (NESDB, 2013).
• The agriculture and livestock sectors account for 12.2% and 2.5% of GDP, respectively.
•The major livestock industry species are chicken, swine, dairy cattle, beef cattle with goat and sheep occupying minor positions .
Year Beef
Cattle
Dairy
Cattle
Buffalo Goats Sheep Swine Chicken Ducks
2008 9.11 0.47 1.36 0.37 0.04 7.74 235.60 22.72
2009 8.60 0.48 1.39 0.38 0.04 8.54 281.67 27.57
2010 6.43 0.53 1.19 0.38 0.04 8.35 266.03 29.23
2011 6.58 0.56 1.23 0.43 0.05 9.68 316.53 32.18
2012 6.33 0.58 1.24 0.49 0.04 10.98 384.18 36.69
%change, 2002-2012 14.05 61.21 -23.46 176.37 -4.97 63.88 67.94 46.58
%change, 2008-2012 -30.52 22.96 -8.82 31.48 -14.55 41.86 63.06 61.49
Table 1: Livestock population (million heads) in Thailand.
North Northeast Central South Total
1. Major rice
1.1 Planted area, ha 2,413,724 6,298,874 1,524,987 162,060 10,399,645
1.2 Production, tons 7,873,856 13,208,883 5,462,249 405,339 26,950,327
1.3 Yield, kg/ha 3,262 2,097 3,582 2,501 2,591
2. Second crop rice
2.1 Planted area, ha 1,218,525 459,309 1,135,323 70,883 2,884,040
2.2 Production, tons 5,196,586 1,626,533 5,164,356 234,050 12,221,525
2.3 Yield, kg/ha 4,265 3,541 4,549 3,302 4,238
3. Total rice production
3.1 Planted area, ha 2,413,724 6,298,874 1,524,987 162,060 10,399,645
3.2 Production, tons 13,070,442 14,835,416 10,626,605 639,389 39,171,852
3.3 Yield, kg/ha 5,415 2,355 6,968 3,945 3,767
Table 2: Rice cultivation areas, production and yield 2012
North Northeast Central South Total
1. Corn
1.1 Planted area, ha 754,549 299,070 125,100 1,178,719
1.2 Production, tons 3,131,627 1,314,931 518,073 4,964,631
1.3 Yield, kg/ha 4,150 4,397 4,141 4,212
2. Mungbeans
2.1 Planted area, ha 139,512 3,331 3,534 226 146,603
2.2 Production, tons 98,520 1,975 2,525 160 103,180
2.3 Yield, kg/ha 706 593 714 709 704
3. Cassava
3.1 Planted area, ha 307,729 790,183 382,749 1,480,661
3.2 Production, tons 6,197,571 15,203,382 8,009,167 29,410,120
3.3 Yield, kg/ha 20,140 19,240 20,925 19,863
Table 3: Crop cultivation areas and yield
North Northeast Central South Total
4. Sugarcane
4.1 Planted area, ha 348,769 518,393 414,919 1,282,082
4.2 Production, tons 28,912,702 37,209,173 32,278,590 98,400,465
4.3 Yield, kg/ha 82,899 71,778 77,795 76,751
5. Oil palm
5.1 Planted area, ha 4,691 16,444 82,799 586,581 690,516
5.2 Production, tons 10,560 100,860 1,144,790 10,070,450 11,326,660
5.3 Yield, kg/ha 2,251 6,133 13,826 17,168 16,403
6. Soybeans
6.1 Planted area, ha 33,804 14,870 169 48,844
6.2 Production, tons 55,581 22,992 310 78,883
6.3 Yield, kg/ha 1,644 1,546 1,830 1,615
Table 3: Crop cultivation areas and yield

79
North Northeast Central South Total
7. Groundnuts
7.1 Planted area, ha 16,475 10,490 1,936 582 29,483
7.2 Production, tons 27,280 16,485 3,240 675 47,680
7.3 Yield, kg/ha 1,656 1,572 1,674 1,159 1,617
8. Coconuts
8.1 Planted area, ha 1,950 1,403 96,681 113,945 213,978
8.2 Production, tons 11,791 6,948 484,055 533,864 1,036,658
8.3 Yield, kg/ha 6,047 4,953 5,007 4,685 4,845
9. Pineapples
9.1 Planted area, ha 19,406 3,009 78,395 869 101,679
9.2 Production, tons 462,543 72,701 1,890,118 25,004 2,450,366
9.3 Yield, kg/ha 23,835 24,159 24,110 28,785 24,099
Table 3: Crop cultivation areas and yield
Major crops Production
(tons)
Grain for feed Residue Oil cake/meals Bran/husk/waste
HI
Quantity
(tons) HI
Quantity
(tons) HI
Quantity
(tons) ER
Quantity
(tons)
1. Rice 39,171,852 0 1 39,171,852 0 0.25 9,792,963
2. Corn 4,964,631 1.00 4,964,631 2.5 12,411,578 0 0.1 496,463
3. Cassava 29,410,120 1.00 29,410,120 0.08 2,352,810 0 0.1 2,941,012
4. Sugarcane 98,400,465 0 0.25 24,600,116 0 0
5. Palm oil 11,326,660 0 0.25 2,831,665 0.3 3,397,998 0.2 2,265,332
6. Soybeans 78,883 0 2 157,766 0.7 55,218 0.3 23,665
7. Coconuts 1,036,658 0 0 0.4 414,663 0
8. Pineapple 2,450,366 0 2 4,900,732 0 0.25 612,592
186,839,635 34,374,751 8 86,426,518 1 3,867,879 1 16,132,027
Table 4: Primary production, residues and by-products of major crops in Thailand 2012
Source Adapted from OAE, Agricultural Statistics of Thailand, 2012HI Harvest IndexER Extraction rate
Species North Northeast Central South Total
1. Communal pasture 107,596 220,338 31,706 9,578 369,218
2. Improved pastures
2.1 Areas 31,381 92,759 24,387 35,869 184,396
2.2 Farmers 6,196 45,974 4,585 3,826 60,581
2.3 Average 5 2 5 9 3
3. Number of farms by Species
3.1 Ruzi grass 4,958 27,654 2,740 1,276 36,628
3.2 Guinea grass 512 16,654 222 866 18,254
3.3 Pangola grass 531 475 1,205 44 2,255
3.4 Napier grass 47 304 291 525 1,167
3.5 Atratum grass 21 241 77 859 1,198
3.6 Plicatulum grass 40 234 274
3.7 Hamata grass 127 583 35 21 766
3.8 Others 23 15 1 39
Total 6,196 45,974 4,585 3,826 60,581
Table 5 Areas of communal areas and improved pastures (hectare) in Thailand 2012
Data sources Data available Availability
Office of Agricultural
Economic
Cultivation areas, production and Annually
Department of Livestock
Development
- Number of livestock by species by age
groups and by regions.
Annually
- Number of feed factories, feed
suppliers, feed distributer statistics.
Annually
- Quantity of raw material feed import
and export
Annually
- Cultivation areas of communal lands
and improved pasture
Annually
- Quantity of pasture seed production by
species
Annually
- Chemical composition and nutritional
value of feedstuffs, forage and
compound feeds in Thailand
Table 6: Data sources and their availability
Data sources Data available Availabili
ty
Thailand Feed Mill Association - Quantity of compound feed production,
raw material requirement
Annually
Harvest index of major crops data On the process of developing
Extraction index of major crops
data
On the process of developing
National feed resources inventory On the process of developing
National livestock feed and
nutrient requirement
On the process of developing
Table 6: Data sources and their availability
4. Feeding systems in Thailand
Livestock
Types
Agro-
ecological
Zone
Production
Systems
Feeding Systems
Native cattle North,
Northeast
and Central
Mixed
crop-
livestock
systems
(MCLS)
Natural grass and crop residues based
feeding systems: All year grazing on paddy
and upland crops field after or before
harvesting season with provision of crop
waste and crop by-product.
South Mixed
crop-
livestock
systems
(MCLS)
Under plantation grazing with cut and
carry and crop residue feeding systems:
Grazing under plantation i.e. rubber, palm oil,
orchard and roadside with provision of cut
and carry fodder grass and fodder tree leaves,
palm kernel meal and palm frond.

80
4. Feeding systems in Thailand
Livestock
Types
Agro-
ecological
Zone
Production
Systems
Feeding Systems
Beef cattle North,
Northeast
and Central
Mixed
crop-
livestock
systems
(MCLS)
Natural grass with cut and carry and crop
residues based feeding systems: All year
grazing on paddy and upland crops field after
or before harvesting season with provision of
cut and carry pasture or grazing on improved
pasture and supplementary of crop waste, crop
by-product and/or compound feed.
South Mixed
crop-
livestock
systems
(MCLS)
Under plantation grazing with cut and
carry and crop residue feeding systems:
Grazing under plantation i.e. rubber, palm oil,
orchard and roadside with provision of cut and
carry fodder grass and fodder tree leaves, palm
kernel meal and palm frond.
4. Feeding systems in Thailand
Livestock
Types
Agro-
ecological
Zone
Production
Systems
Feeding Systems
Fattening
cattle
Intensive
systems
Intensive confine feedlot feeding systems: Short
period confine feedlotting based on compound
concentrate feed with minimum quantity of
roughage fiber in a ratio of 70:30.
Buffalo North,
Northeast,
Central
Mixed crop-
livestock
systems
(MCLS)
Natural grass and crop residues based feeding
systems: All year grazing on paddy and upland
crops field after or before harvesting season with
provision of crop waste and crop by-product.
4. Feeding systems in Thailand
Livestock
Types
Agro-
ecological
Zone
Production
Systems
Feeding Systems
Dairy cattle North,
Northeast
Central
Intensive
Production
Systems
(IPS)
Intensive cut and carry and crop by product
systems: Roughage based on intensive improved
pasture provides by daily cut and carry systems
with equal quantity of high nutrient compound
concentrate of 50:50 ratio.
South Intensive
Production
Systems
(IPS)
Under plantation grazing with cut and carry
and crop residue feeding systems: Grazing
under plantation i.e. rubber, palm oil, orchard
and roadside with provision of cut and carry
fodder grass and fodder tree leaves, palm kernel
meal and palm frond.
5.1 Compound feed production
Types Feed production Livestock (heads)
Average
(kg/head)
1. Broiler feeds 3,904,956 986,100,000 3.96
2. Broiler parent stock feeds 608,328 12,070,000 50.40
3. Layer pullets and chicks feeds 659,967 30,460,000 21.67
4. Layer hens feeds 1,452,400 36,310,000 40.00
5. Layer parent stock feeds 18,800 470,000 40.00
6. Finishing pig feeds 3,245,000 11,000,000 295.00
7. Breeder pig feeds 790,500 850,000 930.00
8. Meat ducks feeds 252,000 30,000,000 8.40
9. Layer ducks feeds 130,000 2,000,000 65.00
10. Breeder duck feeds 21,900 300,000 73.00
11. Dairy cattle feeds 474,500 325,000 1,460.00
12. Shrimp feeds 720,000
13. Fish feeds 571,860
Total 12,850,211
5.2 Raw materials in Compound feed
Fish meal
Soybean
meals Corn Rice bran
1. Broiler feeds 117,149 1,171,487 2,421,073
2. Broiler parent stock feeds 18,250 152,082 364,997
3. Layer pullets and chicks
feeds 19,799 164,992 395,980
4. Layer hens feeds 72,620 363,100 798,820
5. Layer parent stock feeds 564 4,700 11,280
6. Finishing pig feeds 97,350 649,000 811,250 649,000
7. Breeder pig feeds 39,525 158,100 355725
8. Meat ducks feeds 15,120 50,400 37,800 88,200
9. Layer ducks feeds 10,400 19,500 52,000
10. Breeder duck feeds 1,314 6,570 2,190 9,855
11. Dairy cattle feeds 23,725 71,175
12. Shrimp feeds 72,000 144,000
13. Fish feeds 114,372 171,558 171,558
Total 578,463 3,079,214 5,086,123 1,154,780

81
5.3 Inclusion rates of raw materials
Fish meals
Soybean
meals Corn Rice bran
1. Broiler feeds 3 30 62
2. Broiler parent stock feeds 3 25 60
3. Layer pullets and chicks
feeds 3 25 60
4. Layer hens feeds 3 25 55
5. Layer parent stock feeds 3 25 60
6. Finishing pig feeds 3 20 25 20
7. Breeder pig feeds 5 20 45
8. Meat ducks feeds 6 20 15 35
9. Layer ducks feeds 8 15 45
10. Breeder duck feeds 6 30 10 40
11. Dairy cattle feeds 5 15
12. Shrimp feeds 10 20
13. Fish feeds 20 30 30
5.4 Importation of feeds and raw materialsFeed categories Exportes Quantity (tons) Value Value
(miilion Thai baht) (million USD)
1. Soybean meals Brazil 1,558,694.89 22,755.10 758.50
Argentina 1,037,496.03 15,382.19 512.74
India 458,147.76 6,522.51 217.42
United States 16,566.92 253.08 8.44
Others 52,573.66 73.18 2.44
Total 3,123,479.26 44,986.06 1499.54
2. DDGS United States 510,473.10 2,384.08 79.47
Canada 11,344.02 123.17 4.11
Australia 1,764.28 17.42 0.58
Others 2,468.79 99.44 3.31
Total 526,050.19 2,624.11 87.47
3. Wheat by-products Turkey 32,111.64 418.30 13.94
Slovania 14,582.00 227.30 7.58
China 11,271.73 193.26 6.44
United States 1,200.84 14.28 0.48
Others 1,605,544.22 16,168.19 538.94
Total 1,664,710.43 17,021.33 567.38
4. Corn products United States 34,681.92 755.77 25.19
India 3,700.00 65.17 2.17
China 2,322.15 57.54 1.92
Total 40,704.07 878.48 29.28
Other raw material 938,220.06 15,483.45 516.12
Total raw materials 6,293,164.01 80,993.43 2,699.78
5.4 Importation of feeds and raw materials
Feed categories Exportes
Quantity
(tons) Value Value
(miilion Thai baht) (million USD)
Compound feeds
5. Pet feed United States 5,743.25 392.44 13.08
France 3,939.90 303.57 10.12
Australia 3,270.65 233.00 7.77
Others 1,521.45 74.87 2.50
Total 14,475.25 1,003.88 33.46
6. Premixes Singapore 16,183.00 2,622.68 87.42
China 12,283.01 1,858.09 61.94
United States 15,018.85 1,490.67 49.69
Netherland 7,701.56 1,299.23 43.31
Taiwan 4,785.30 284.66 9.49
Canada 3,393.33 292.18 9.74
Others 44,833.20 3,681.14 122.70
Total 104,198.25 11,528.65 384.29
Total compound
feeds 118,673.50 12,532.53 417.75
5.4 Importation of feeds and raw materialsDairy products
7. Whey Netherland 3,034.78 109.04 3.63
Spain 2,100.00 81.59 2.72
German 1,785.00 40.84 1.36
Others 3,502.65 125.96
Total 10,422.43 357.43 11.91
8. Skimmilk Netherland 12,320.59 343.65 11.46
France 720.23 25.76 0.86
Total 13,040.82 369.41 12.31
9. Milk replacers Netherland 3,133.62 114.10 3.80
United States 55.25 38.54 1.28
Others 530.25 55.03 1.83
Total 3,719.12 207.67 5.09
10. Processed whay United States 13,292.40 394.55 13.15
Netherland 475.00 12.39 0.41
German 150.00 4.85 0.16
Total 13,917.40 411.79 13.73
Total dairy
products 41,099.77 1,346.30 43.04

82
CONCLUSIONS AND RECOMMENDATIONS
GENERAL CONCLUSIONS
1. Feed assessment and establishment of a national feed inventory is intimately linked with:
annual feed stock estimation,
feed and nutrition management,
stocking rate decisions,
feed resource management in response to seasonal fluctuations and natural disasters,
understanding of land use transformation,
environmental impacts of food animal production (e.g. GHGs).
2. Feeding system characterization is valuable for
efficient resource use (including non-conventional feeds),
improving productivity
3. Data are a key challenge in all countries: either data are not available or, in case of availability,
they are fragmented, scattered and not in the required format. In many countries access to data is
restricted.
4. Further development of the methods is foreseen to make them more flexible and to incorporate
country specificities.
5. This workshop is only a starting point of this type of work. It was is intended to provide
participants with a better understanding of the issues and methodological guidelines. The workshop
was an excellent base for sharing and gaining knowledge from each other.
RECOMMENDATIONS
1. Elaborating feed balances should be a continuous activity which is carried out at local, national,
and regional level (at least) annually.
2. Feed assessments should be institutionalized with national governments by identifying the key
national organization(s) and by FAO providing incentives and guidance.
3. Establishment of linkages among several institutions is recommended:
Feed mill association (can provide data especially for grains)
Ministries
Livestock and poultry associations
Breeding associations
Import export bureau
4. National feed assessment taskforces in each country may lead to institutionalize for long-term
sustainability of this work.
5. Need to operate under “coordinating center” which might be supported by FAO for the time being
that will develop a standard questionnaire for every country. Countries will fill the questionnaire
annually, and a model based on EXCEL can be developed to estimate the feed inventory in a
comparable manner in a dynamic way (time series).

83
6. Data should cover as many aspects as possible in order to allow for a comprehensive feed
inventory. Data should be collected from as many sources as possible to improve coverage and
enable consistency and plausibility checks. In case of limited/unreliable secondary data, surveys
should be conducted.
7. Applied conversion factors are major determinants of the feed assessment results. Hence,
agreement on a common approach for all countries, including the use of similar terminology, is
needed for:
Extraction factors;
Harvest indices;
Harvest losses;
Proportion of grain used as livestock feed.
For the estimation of conversion factors, it is also advisable either to collect data from secondary
sources or to conduct surveys. In case of new crop varieties, surveys are the priority option. All
estimations related with feed should be on Dry Matter basis.
8. Adult cattle units (ACU) should be replaced by actual nutrient requirements of different livestock
and poultry. It was request to India was requested to provide their feeding standard data.
9. Feeding systems from different agro-ecological zone are very important to characterize because
they determine the actual feeding practices of the farmers.
10. Participatory Feed Assessments (PFA) might be a way to generate primary data on feed
resources that can replace expensive surveys.

84
TIMETABLE
Tuesday 13 August, morning
Time Topic Speaker
08:30 – 09:00 Registration
09:00 – 09:30 Inauguration
09:00 – 09:15 Opening remarks
DRR RAP and APHCA
Secretary
09:15 – 09:45 Asia-Pacific Livestock Sector Trends Dr J. Otte
09:45 – 10:15 Importance and Role of Feed Assessments Dr H. Makkar
10:15 – 10:30 Discussion
10:30 – 11:00 Group Photo & Coffee / Tea Break
11:00 – 12:45 South Asia Country Reports, Q&A
11.00 – 11:30 Bangladesh Country Report Dr M. Uddin
11:30 – 12:00 Bhutan Country Report Dr J. Gyeltshen
12:00 – 12:30 India Country Report Dr T. Vaid and S.
Anandan
12:30 – 12:45 Discussion
12:45 – 14:00 Lunch Break
Tuesday 13 August, afternoon
Time Topic Speaker
14:00 – 15:45 South Asia Country Reports, Q&A cont.
14:00 – 14:30 Nepal Country Report Dr D. Yadav
14:30 – 15:00 Pakistan Country Report Dr G. Habib
15:00 – 15:30 Sri Lanka Country Report Dr G. Premalal
15:30 – 15:45 Discussion
15:45 – 16:15 Coffee / Tea Break
16:15 – 17:45 Topical Issues in Animal Nutrition
16:15 – 16:45 Indian Livestock Feed Portal – Features and Utility Dr S. Anandan
16:45 – 17:15 Balanced Feeding at Smallholders’ Doors and its Impact on Milk
Production, Profitability and Methane Emission
Dr M. Garg
17:15 – 17:45 Use of Co-products of Biofuel Industries as Livestock Feed:
Opportunities and Challenges
Dr H. Makkar
17:45 – 18:15 Discussion
18:30 – 20:00 Hosted Dinner

85
Wednesday 14 August, morning
Time Topic Speaker
08:30 – 10:15 East and SE Asia Country Reports, Q&A
08:30 – 09:00 Indonesia Country Report Dr M. Hutasuhut
09:00 – 09:30 Lao PDR Country Report Dr S. Nakasene
09:30 – 10:00 Malaysia Country Report Dr F. Muhayat
10:00 – 10:15 Discussion
10:15 – 10:45 Coffee / Tea Break
10:45 –12:15 East and SE Asia Country Reports, Q&A cont.
10:45 –11:15 Mongolia Country Report Dr M. Batjargal
11:15 –11:45 Myanmar Country Report Dr T. Soe
11:45 –12:15 Discussion
12:15 – 13:30 Lunch Break
Wednesday 14 August, afternoon
Time Topic Speaker
13:30 –15:00 East and SE Asia Country Reports, Q&A cont.
13:30 – 14:00 Philippine Country Report Dr L. Valcarcel
14:00 – 14:30 Thailand Country Report Dr A. Permphol
14:30 – 15:00 Discussion
15:00 – 15:30 Coffee / Tea Break
15:30 – 16:30 Facilitated Discussion
Knowledge gaps in feed assessments and characterization of feeding systems
Dr C. Prasad and Dr
H. Makkar
16:30 – 17:30 Working Groups
Approaches for characterisation of feeding systems and how countries should characterize feeding systems
17:30 – 18:00 Reporting of Working Groups and Discussion
18:30 – 20:00 Hosted Dinner

86
Thursday 15 August, morning
Time Topic Speaker
09:00 – 11:00 Working Groups
Identification of approaches for national feed assessments
Establishing and updating of national feed assessments (who, how, how often)
11:00 – 11:30 Coffee / Tea Break
11:30 – 12:30 Reporting of Working Groups and Discussion
12:30 – 13:45 Lunch Break
Thursday 15 August, afternoon
Time Topic Speaker
13:45 – 14:45 Facilitated Discussion
Establishment of a network / platform / mechanism to institutionalize feed use / availability data collection and sharing system
Dr J. Otte
14:45 – 15:30 Facilitated Discussion
Other feed and feeding related issues that APHCA should consider undertaking
Dr. H. Makkar
15:30 – 16:00 Coffee / Tea Break
16:00 – 16:30 Discussion on Way Forward and Closure

87
LIST OF PARTICIPANTS
Country Name Affiliation and Address E-mail
BANGLADESH
MOHAMMAD UDDIN
Professor Bangladesh Agriculture University Mymensingh, Bangladesh
BHUTAN
JAMBAY GYELTSHEN Program Director
National Centre for Animal Nutrition Department of Livestock Ministry of Agriculture Bumthang, Bhutan
CHINA
TIAN WEIMING
Professor China Agricultural University Room 404, Building 214 No. 2 Yuanmingyuan Xilu Beijing 100193, China
INDIA
C.S. PRASAD
Director National Institute of Animal Nutrition & Physiology (ICAR) Adugodi, Bangalore 560030 India
[email protected] [email protected]
TERINDER K. VAID
Fodder Agronomist Department of Animal Husbandry, Dairying and Fisheries Room. 501, Krishi Bhawan New Delhi, India
INDIA
SEMIRADDYPALLE ANANDAN
Principal Scientist National Institute of Animal Nutrition and Physiology (NIANP) Adugodi, Bangalore, India
MANGET R. GARG
General Manager National Dairy Development Board PB No. 40, NDDB, Anand 388001, Gujarat, India
INDONESIA
DESIANTO B UTOMO
Secretary General Indonesian Feed Mills Association Jl Ancol VIII/I, Ancol Barat North Jakarta, Indonesia
MARADOLI HUTASUHUT
Head Sub-directorate Feed Quality and Safety Directorate of Animal Feeding Ministry of Agriculture Jl Harsono RM No. 3, Pasar Minggu, Jakarta 12550, Indonesia

88
Country Name Affiliation and Address E-mail
LAO PDR
SISOUPHANH NAKASENE
Director Livestock Farming Technical Standard Control Center
MALAYSIA
FUZIAH MUHAYAT
Head Animal Feed Section Department of Veterinary Services Putrajaya, Malaysia
MONGOLIA
NATSAGDORJI BATJARGAL
Deputy Director Animal Health and Breeding Department Government Building 9 Enkhtaivan Avenue 16 am Bayazurkh District, Ulaan Baatar 2210349, Mongolia
MYANMAR
TIN MAUNG SOE
Research Officer Livestock Breeding and Veterinary Department Ministry of Livestock and Fisheries Building No. 36 Nay Pyi Taw, Myanmar
NEPAL DEVENDRA P. YADAV
Chief Livestock Development Officer National Pasture and Animal Feed Center Hariharbhawan, Lalitpur Kathmandu, Nepal
PAKISTAN
GHULAM HABIB
Professor Faculty of Animal Husbandry and Veterinary Sciences KP Agricultural University Peshawar, Pakistan
PHILIPPINES
LORNE B. VALCARCEL
Agriculturist II Bureau of Animal Industry-Department of Agriculture Visayas Ave, Diliman Quezon City, Philippines
SRI LANKA
PREMALAL G. CHANDRASIRI
Research Officer/Assistant Director Department of Animal Production and Health Veterinary Research Institute Gannoruwa, Peradeniya, Sri Lanka
Chandrasiri.Premalal. [email protected]
THAILAND
ADUL PERMPHOL
Department of Livestock Development Bangkok, Thailand
THUMRONGSAKD PHONBUMRUNG
Department of Livestock Development Bangkok, Thailand

89
Country Name Affiliation and Address E-mail
ANUROJANA PUNYAWAN
Vice President CP Group, Feed Technology Office 313 CP Tower, 14
th Floor
Silom, Bangkok 10500, Thailand
KOMKRIS EKACHAT Senior Animal Feed Expert BETAGRO Betagro Tower (North Park) 323 Viphawadee Rangsit, Laksi Bangkok 10210, Thailand
SUWANNEE TAEPAISITPONG
Senior Procurement Manager Oil and Protein Plant Products BETAGRO Betagro Tower (North Park) 323 Viphawadee Rangsit, Laksi Bangkok 10210, Thailand
VIETNAM DO ANH TUAN NGUYEN
Director Center for Agricultural Policy Institute of Policy & Strategy for Agriculture & Rural Development No. 16, Thuy Khue Str., Hanoi, Vietnam
FAO ROME DENIS DRECHSLER HARINDER MAKKAR
Economics and Trade Division (EST) Animal Production and Health Division (AGA) Food and Agriculture Organization of the UN (FAO) Viale delle Terme di Caracalla 00153 Rome, Italy
[email protected] [email protected]
FAO BANGKOK (RAP)
JOACHIM OTTE VINOD AHUJA VISHNU SONGKITTI YUPAPORN SIMUANGNGNAM KENTA SUSAKI
Senior Animal Production and Health Officer Livestock Policy Officer APHCA Liaison Officer APHCA IT Clerk Intern FAO Regional Office for Asia and the Pacific (FAORAP)
[email protected] [email protected] [email protected] [email protected]
Malian Mansion, 39 Phra Atit Rd., Bangkok, Thailand

90
Country Name Affiliation and Address E-mail
APRACA
WON SIK NOH THANAWAN AMPAIPANVIJIT UNCHANA STEANE SOFIA CHAMPANAND
Secretary General Administrative Officer Accountant Publications Assistant 469 Bank for Agriculture and Agricultural Cooperatives Nakhonsawan Rd. Suanchitlada, Dusit Bangkok, Thailand
[email protected] [email protected] [email protected] [email protected]
Related Documents


