Report of the Collaborative Benefits Committee February 14, 2012

Welcome message from author
This document is posted to help you gain knowledge. Please leave a comment to let me know what you think about it! Share it to your friends and learn new things together.
Transcript
Report of the Collaborative Benefits
Committee
February 14, 2012


Report of the
Collaborative Benefits Committee
Committee Members
Honorable Jamie Benoit Honorable Dick Ladd County Council District 4 County Council District 5
Honorable Jerry Walker Craig Oldershaw County Council District 7 IAFF 1563 President Mike Akers Jean Tinsley AFSCME 582 President Non-Represented
Employee Representative Andrea Fulton Richard Drain Personnel Officer Controller
John Hammond Budget Officer
Committee Facilitator
February 14, 2012


Report of the Collaborative Benefits Committee
Table of Contents
Executive Summary …………………………………………………… i
Committee Report
I. Introduction……………………………………………………. 1 A. Establishment of Committee……………………... 1 B. Background………………………………………. 2
1. Healthcare Costs…………………………….... 2 2. GASB 45…………………………………….... 3 3. Patient Protect & Affordable Care Act……….. 4 4. Medicare Solvency…………………………… 4
C. Benefit Cost Overview…………………………… 5 D. Principles Utilized by Committee………………... 6
II. Legal Issues…………………………………………………….. 7 III. Public & Private Sector Comparisons……………………….…. 8 IV. Anne Arundel County Health Insurance Benefit……………. ... 9
A. Benefit Description…………………………………. 9 B. Findings………………………………………….. 11 C. Recommendations…………………………….…... 11
V. Anne Arundel County Retiree Health Insurance Benefit……... 13 A. Benefit Description………………………………. 13 B. Findings…………………………………………... 15
1. Universal Alternatives……………………….. 17 2. Pre-65 Alternatives…………………………... 19 3. Post-65 Alternatives…………………………. 21 4. Basic Plan Alternatives………………………. 24
C. Recommendations…………………………….….. 28 VI. Anne Arundel County Pension Benefit……………………….. 29
A. Benefit Description…………………………….... 29 B. Findings…………………………………………. 31 C. Recommendations………………………………. 34
VII. Other Recommendations………………………………………. 35 A. Establish a Trust………………………………….. 35 B. Establish a Wellness Program……………………. 35 C. Establish a Permanent Benefits Committee………. 36
D. Develop a Strategic Plan…………………………. 36 VIII. Conclusion…………………………………………………….. 37
Minority Report ………………………………………………………… 39

Appendices
Committee Report Appendix A Resolution 50-11 Appendix B GFOA White Paper – Containing Health Care Costs Appendix C Bolton Partners Memo – The Discount Rate for OPEB Calculations Appendix D Aon Presentation – October 11, 2011 Appendix E County Code Section 6-1-308 – Group Health Insurance – Cost Share Appendix F Office of Law Memo – David Plymyer – Risk Matrix Appendix G Office of Law Memo – David Plymyer – Recommendation for Issues to Be Considered Appendix H Wage comparisons – Area Counties Appendix I Private Sector Benefit Comparisons Appendix J National Business Group on Health Article – Large Employer Survey Appendix K Wall Street Journal Article – January 4, 2012 – “Why Public Pensions Are
So Rich” Appendix L Milliman White Paper – EGWP/Wrap: Why Now? Appendix M Bolton Partners Letter – OPEB – Possible Plan Changes Appendix N News Articles on Municipal Bankruptcies Appendix O Cbiz Health Benefits Presentation – November 15, 2011 Appendix P Office of Budget Presentation – Retiree Heath Insurance County Comparisons – October 4, 2011 Appendix Q United Healthcare Presentation- Anne Arundel Retiree Options – November 15, 2012 Appendix R Milliman White Paper – Health Insurance Exchanges Explained Appendix S Extend Health Presentation – Take Control of Retiree Heath Care Costs! – January 11, 2012 Appendix T Anne Arundel County Wellness Presentation Appendix U Extend health Article – How Long Does A Retiree Transition Take:
Implementation Milestones – January 2012 Appendix V Minutes of Committee Meetings Minority Report Appendix W O’Brien Atkinson, IV Letter to Mark Atkisson – August 9, 2006 Appendix X O’Brien Atkinson, IV Letter to Andrea Fulton – February 21, 2007

Charts & Tables
Committee Report Chart 1 County Health Insurance Costs Table 1 County Funding of Major Employee Benefits Table 2 Major Benefit Costs by Component Unit Table 3 Benefit Cost for Selected Employees Table 4 Triple Choice Benefit Levels Table 5A County Health Insurance Rates Table 5B County Dental & Vision Rates Table 6 Savings from Healthcare Plan Design Changes Table 7 Healthcare – Savings from Cost Share Alternatives Table 8 Dental & Vision – Savings from Cost Share Alternatives Table 9A Retiree Health Insurance Rates Table 9B Retiree Dental and Vision Rates Table 10 CVS Caremark Drug Plan Coverage Table 11 Growth in IPEB Obligation at 4% Discount Rate Table 12 Annual Required Contribution @ 8% Discount Rate Table 13 Annual Accrued Liability @ 8% Discount Rate Table 14 Present Value of Retiree Health Benefit Table 15 Savings in AAL from Various Options @ 8% Discount Rate Table 16 Savings in ARC from Various Options @ 8% Discount Rate Table 17 Savings from Healthcare Plan Design Changes for Pre-65 Retirees Table 18 Pre-65 Retiree Healthcare – Savings from Cost Share Alternatives Table 19 Savings in ARC from Coverage Deferral @ 8% Discount Rate Table 20 Cost Comparison: CIGNA Wrap vs. Market Exchange Table 21A 20 Year Basic Benefit Plan – Future Employees Table 21B 20 Year Basic Benefit Plan – Current Employees Table 22 10 Year Revised Basic Plan – Future & Current Employees Table 23 5 Year Employee Plan – Future & Current Employees Table 24 Funded Expense Impact (ARC) Table 25 Funded Expense Impact (AAL) Table 26 Pension Plan Provisions Table 27 Rate of Return Earned on Employee Pension Contributions Table 28 Pension Plan Contribution Amounts Table 29 Cost Components of Actuarial Contribution Table 30 Pension & Retiree Health Funding Table 31 Moving from 20 Years to 25 Years of Service for Public Safety Table 32 Moving from 100% Joint & Survivor Benefit to Actuarially Reduced Table 33 Savings from Uniform Pension Plan Contributions Table 34 Increase Normal Retirement from 20 – 25 Years Transition Schedule Table 35 Summary of Recommendations


Executive Summary


i
Report of the Collaborative Benefits Committee Executive Summary
The Benefits Collaborative Study Group was created as a result of the passage of Resolution 50-11 (Appendix A), adopted by the County Council on September 6, 2011. The Study Group was created to:
1. review existing employment and post-employment benefits provided by the County; 2. assess the impact of the continued increase in the costs of the benefits on current and
projected revenues and expenditures of the County; 3. determine fair and equitable priorities in the reduction of the benefit costs, ensuring
that the benefits are fair to employees, retirees, and taxpayers of the County and can be funded on a fiscally sustainable basis; and
4. report to the County Executive and County Council recommendations on fair and equitable reductions of continued benefit costs.
Conforming to the provisions of the resolution, the Committee was composed of the
following members: Jamie Benoit – County Councilman – District 4
Richard Ladd – County Councilman – District 5 Jerry Walker – County councilman – District 7 Craig Oldershaw – Local 1563 IAFF Mike Akers – Local 582 AFSCME Jean Tinsley – Non-represented Employees Andrea Fulton – Personnel Officer Richard Drain – Controller John Hammond – Budget Officer The County provides a considerable list of benefits to its employees,
• including 14 or 15 paid holidays • two to five weeks annual leave • 15 days disability leave • a personal day • family health insurance at either a 90/10 or 80/20 cost share depending on
plan • retiree health insurance at an 80/20 cost share • defined benefit pension benefit that provides for 20-and-out retirement for
public safety employees and a maximum benefit of 70% of final earnings plus an additional 6% for eligible military service and 30-and-out for non-uniform employees with a maximum benefit of 60% of final earnings plus up to 6% for eligible military service. Employees contribute between 4% and 7.25% of salary depending upon pension plan.
• Term life insurance during employment • Optional life insurance continuing into retirement

ii
The Committee focused its efforts on three benefit categories: employee health insurance, retiree health insurance, and employee pension benefits. The majority of the Committee’s efforts were placed upon the retiree health benefit because of the significant funding issues associated with this particular benefit. This benefit also required significant review of the employee health insurance benefit since the two benefits are so closely related. Health Care Costs
The past two decades have seen an historic escalation in the cost of healthcare as a number of forces have come together to create a “perfect storm”. These include:
• advances in medical technology that have resulted in more expensive treatments that have extend expected life spans
• discovery of miracle drugs that can successfully treat medical conditions further extending life spans
• demographic trends as the post-war baby boomers in large numbers are now reaching Medicare eligibility, swelling the post-65 population
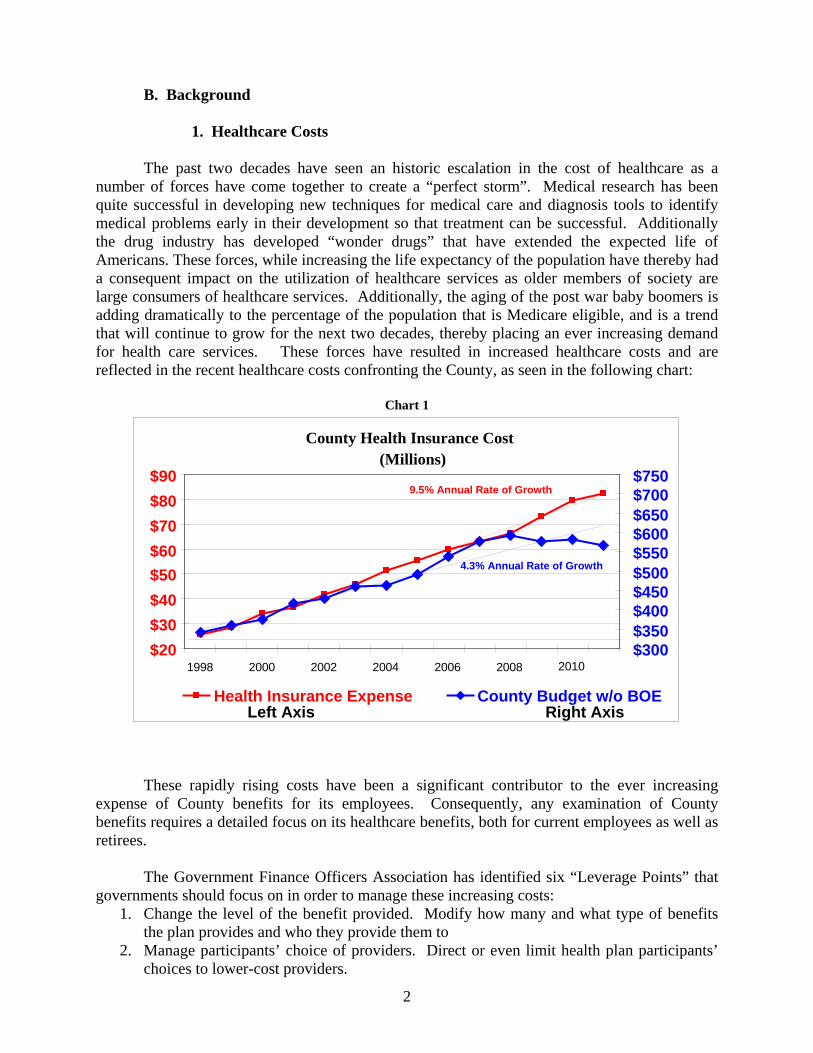
The County’s health care costs over the recent years are shown in the following graph and reflect the impact of these trends.
These rapidly rising costs have been a significant contributor to the ever increasing
expense of County benefits for its employees. Other Factors Impacting County Benefit Costs
• GASB 45 – A statement from the Government Accounting Standards Board that
requires governments to recognize the cost of their post-employment benefits
County Health Insurance Cost(Millions)
$20 $30 $40 $50 $60 $70 $80 $90
1998 2000 2002 2004 2006 2008 2010 $300$350$400$450$500$550$600$650$700$750
Health Insurance Expense County Budget w/o BOE
9.5% Annual Rate of Growth
4.3% Annual Rate of Growth
Left Axis Right Axis

iii
other than pension benefits (which are governed by another GASB statement requiring disclosure of liabilities). The requirement became effective in 2004 and has been responsible for the focus of governments on the retiree health benefit. For Anne Arundel County, at a favorable 8% discount rate, this liability totals $672.7 million across the County government, the Community College and the Public Library. The annual cost of this benefit, on a fully funded basis, is $69.16 million. Rather than recognizing the full annual cost of this benefit however, the County has been funding just the PayGo portion of the benefit which is $21 million or annually. Thus the county has been under funding this benefit by $48.16 million (the “funding hole”) which gives rise to today’s $672.7 million liability.
• Patient Protection and Affordable Care Act - The passage of the Patient Protection and Affordable Care Act (PPACA) (Public Law 111-148) has introduced many new provisos to employers in the provision of health care, including the requirement to cover children up to the age of 26 who do not have health insurance coverage available to them, prospective limits on Flexible Spending Accounts, excise taxes on “Cadillac” insurance plans, and Medicare compensation changes such as bundled payment based on an episode of care. The promise of this legislation is "to bend" the healthcare cost “curve”, but many fear that instead it will increase healthcare costs. Additionally, the Supreme Court has recently agreed to hear an appeal to lower court decisions dealing with the constitutionality of the statute.
• Medicare Solvency – Again the impact of the post-war baby boom is being felt
here as the number of Medicare (and Social Security) eligible individuals are drawing benefits which are severely straining the available program funds. The insolvency of Medicare or benefit and funding changes adopted to avoid insolvency could place an increased burden on employers, including the County.
Major Benefit Program Costs The two tables below summarize the cost to the County of its major benefit programs:
County Funding of Major Employee Benefits
Unit Salaries FICA & Medicare Amount %
Health Insurance Amount %
Pension Contribution1 Amount %
Retiree Health2 Amount %
County 206,341,900 12,966,100 6.3% 39,958,300 19.4% 48,165,000 23.3% 17,900,000 8.7%BOE 577,894,000 41,665,000 7.2% 126,919,000 22.0% 8,885,000 1.5% 30,000,000 5.2%College 52,669,100 4,000,000 7.6% 8,528,000 16.2% 525,000 1.0% 1,006,000 1.9%Library 9,939,000 770,000 7.7% 3,129,800 31.5% 226,000 2.3% 500,000 5.0%
1 State pension system picks up majority of pension cost for BOE, College & Library 2 Actual budget amount on a PayGo basis.

iv
Major Benefit Costs by Component Unit
Unit Total
Budget Salaries
Salaries as a % of Budget Benefits
Benefits as a %
of Budget
Total Salaries &
Benefits
Total as a %
of Budget
County 533,017,300 206,341,900 38.71% 118,989,400 22.32% 325,331,300 61.04%BOE 911,227,000 557,894,000 63.42% 207,469,000 22.77% 785,363,000 86.2% College 102,976,100 52,669,100 48.8% 14,059,000 13.65% 66,728,100 64.8% Library 18,417,600 9,939,000 53.96% 4,627,000 25.12% 14,566,000 79.1%
A third perspective on benefit cost to the County is on the basis of an average County employee.
The table below provides selected employee amounts (normal cost amounts for pension and retiree health).
Benefit Cost for Selected Employees
Employee Salary FICA &
Medicare
Health Insurance Coverage Pension
Retiree Health
Insurance Total
Benefits
Total as a % of Salary
Maintenance Worker I 33,300 2,500 11,200 3,200 4,400 21,300 63.96%
Management Aide 50,500 3,900 13,600 7,700 4,400 29,600 58.61%
Accountant III 81,200 6,200 13,500 7,900 4,400 32,000 39.41%
Fire Fighter III 63,600 4,900 13,500 15,900 6,600 40,900 64.31%
Police Corporal 69,800 1,000 13,900 16,700 7,700 39,300 56.30%
Detention Officer 48,500 3,700 10,100 7,400 6,700 27,900 57.53%
Deputy Sheriff I 46,300 3,500 10,200 7,100 6,700 27,500 59.40%
Committee Principles
During the discussions of the committee a set of principles that should be applied to the Committee’s work evolved. These principles were:
1. The County’s benefits should be “fair”. They should be in the middle of the pack for the County’s peer group that includes Baltimore City, Baltimore County, Howard County, Calvert County, Prince George’s County, Montgomery County and the State of Maryland.

v
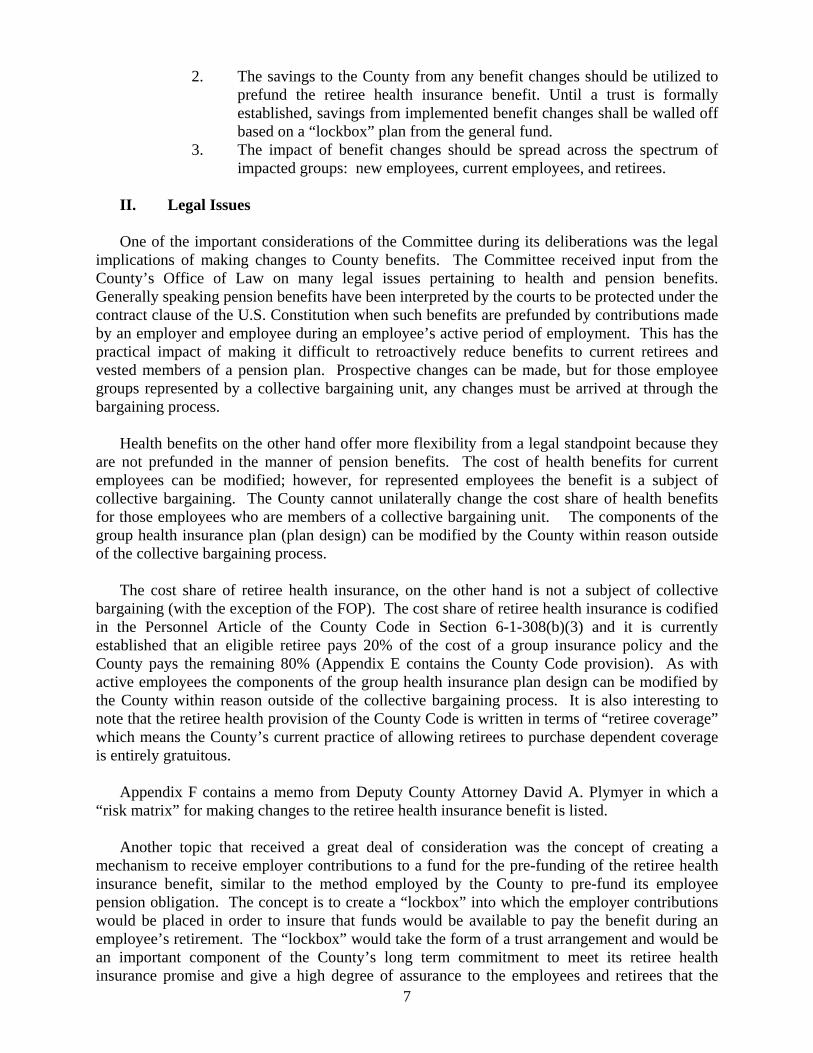
2. The savings to the County from any benefit changes should be utilized to prefund the retiree health insurance benefit. Until a trust is formally established, savings from implemented benefit changes shall be walled off based on a “lockbox” plan from the general fund.
3. The impact of benefit changes should be spread across the spectrum of impacted groups: new employees, current employees, and retirees.
Legal Issues The Committee considered a number of legal issues involved with the provision of various benefits and the ability of the employer to modify benefits for current employees and retirees. The County Office of Law provided a risk matrix to demonstrate the different legal issues presented by individual benefit changes on different groups of employees and retirees. Generally pension changes to current retirees and employees present more legal issues than modification to employee health care and retiree health care. Additionally, labor contract provisions come into play further impacting the ability to modify benefits. A further legal issue was the creation of a “lockbox” to wall off savings from the modification of existing benefits so as to provide a funding source for the retiree health insurance benefit. This will involve the need for a Charter Amendment and the creation of an eventual trust to hold the assets of a pre-funded retiree health care fund. Public & Private Sector Comparisons
The Committee reviewed several presentations comparing County salaries to other counties in the metropolitan region, as well as comparisons of health insurance benefits, retiree health insurance benefits and pension benefits. (Appendix H) These comparisons demonstrate that with respect to salaries Anne Arundel County is generally in the middle of the group for the job classifications of local governments. With respect to health benefits, the County offers a comparably better benefit package; but the overall cost to the employee is slightly better because of a more favorable employer cost share than many other jurisdictions provide and relatively favorable out of pocket limitations.
For the retiree health benefit the County again compares quite favorably to other jurisdictions, particularly with respect to the five year vesting provision for non-public safety employees and with a benefit that provides an 80-20 cost share regardless of years of service.
The pension benefit provided by the County is at least as comparable to other
jurisdictions and does offer relatively low employee contribution rates and certainly at least average annual accrual rates, with favorable age and service provisions for drawing the benefit, including a DROP program for police and fire pension plan members. The County’s benefits far exceed those available in the private sector, particularly with respect to employee health care, pension, and retiree health care. Generally private employers provide a lower cost share to employees for the health care benefit. With respect to a pension benefit, the private sector utilizes a 401k program with limited employer matching contributions,

vi
rather than a defined benefit pension. Lastly, it is the rare private sector employer who is providing a retiree health care benefit for new employees. Significant Findings
• Employee Heath Insurance The benefit offered by Anne Arundel County is generous when compared to other public sector employers in the region, particularly with respect to the low co-pays and out of pocket requirements. This situation provides little economic incentive for the user to manage his/her own health condition so as to mitigate costs to the consumer. Additionally the cost share provision at 90/10 for the two HMO plans and 80/20 for Triple Choice, as well as 100% for the dental and vision plans, is quite favorable compared to other jurisdictions (with the notable exception of the Anne Arundel County Board of education which provides a 997/3 cost share plan for some of its employees) and the private sector.
• Retiree Health Benefit The retiree health benefit is of the most concern for the County, as it is a benefit that the County is funding on a PayGo basis. This is an unsound financial practice. Absent a plan to address this liability, it will continue to spiral upwards and eventually strangle the County’s ability to provide for current services. This is a very unpleasant prospect for County taxpayers and would in all likelihood result in County retirees not receiving the promised retiree benefit as a result of a bankruptcy court determination.
Fortunately the task to reduce the County’s cost of retiree health benefits is facilitated by the number of options available to realize cost savings, and the generosity of the County’s current benefit. Indeed the benefits consultant utilized by some employee groups, Mr. Randy Hart from the firm of CBIZ during his presentation to the Committee on November 15, 2011 (Appendix O), identified the County’s current retiree health benefit as the “gold mine” as far as being able to realize cost savings.
The present benefit allows non-public safety employees to vest in this benefit after only five years of service; and allows for retirement benefits to start at an early age (20-and-out for public safety and 30-and-out for employees), and provides for an 80/20 cost share. Other rich components of the retiree health benefit include:
o No employee contribution during employment towards the benefit o Benefit is not related to years-of-service o Transfer of service from the State of Maryland permitted o Spousal and dependent coverage provided o Terminated vested employees eligible for coverage (5 year vesting)

vii
Pre-65 retiree health benefit is the same health plan as for current employees, it offers the same low co-pays and low deductibles; further adding to the County’s cost of the benefit. Also, the County’s current policies do not take advantage of the possible availability of alternate health care coverage to retirees.
There are lower cost methods to provide supplemental coverage to Medicare eligible retirees than the County’s current wrap program. One alternative is the Connector Plan where the retiree can compare and purchase qualified health and drug plans from the private sector. A Connector Plan provides personalized individual health plans to the retiree, with freedom of choice and the value of the open market. Another advantage is that it incorporates an insurance product, thereby transferring the risk which is currently borne by the County to the insurer.
• Pension Benefit
The pension benefit for County employees generally falls above the middle of the pack of surrounding local governments, and is more lucrative than the pension programs of the State of Maryland. The Police Officers and Firefighters plans have individual features (100% Joint & Survivor and DROP) that are quite employee friendly. Employee contributions across-the-board are generally below the median, particularly when the benefit provisions are taken into consideration.
The table below shows the present value of the pension benefit demonstrates how lucrative the County’s pension benefit is.
Rate of Return Earned on Employee Pension Contributions
Plan and Retirement Age Years of Service
Employee Contribution Rate
Initial AnnualPension
Present Value of Benefit
Rate of Return Required*
Employee – Age 55 30 Years of Service 4.00% $24,243 $314,080 16%
Police - Age 45 20 Years of Service 7.25% $39,690 $634,126 21%
Fire - Age 50 25 Years of Service 7.25% $47,686 $744,476 17%
Detention - Age 45 20 Years of Service 6.75% $32,919 $486,849 21%
Source: Bolton Partners * The annual rate of return required to be earned on an employee’s contributions in order to realize the present value
of the benefit.
There are inconsistent policies in play with the County’s Police and Fire pension plans in that they have a provision to encourage early retirement (20-and-out) and another to encourage continued employment (DROP plan). Employee contributions to the various public safety plans present an inequity in that the plan benefits are the same for all members of the plan, yet under current conditions, some employees are paying a discount for the same benefit.

viii
Recommendations The Committee comprehensively reviewed the employee health benefit, retiree health benefit and the pension benefit and analyzed a number of alternatives to each of the benefits. The alternatives are designed to either lower the cost of the retiree health benefit or lower the cost of other benefit programs (current employee heath insurance and pension plan) so as to free up existing County funds so that they can be applied to fund the retiree health benefit on a permanent basis. Discussion of these alternatives was spirited, and not all alternatives were unanimously supported by Committee members.
Summary of Recommendations
# Alternatives Action Required
Savings High Low
1 Plan Design Changes to Employee Health Insurance Plan (Co-pays & Deductibles) Administrative $2.90 $2.90
2
Cost Share – Current Employees HMO Plan only @ 85/15
Triple Choice at dollar amount of 85% of HMO premium (Low – 90/10 and 90%)
Negotiate $6.30 $3.40
3 Cost Share – Current Employees Dental & Vision Plans at 80/20 split Negotiate $0.90 $0.00
4 Plan Design changes to Retiree Health benefit similar to Employee Plan Administrative $1.66 $1.66
5 Terminated Vested Benefit Adjustment Legislative $0.75 $0.75
6 Eliminate Transferred Service Credit for Retiree Health Benefit Legislative $0.10 $0.00
7 Pre-65 Retirees Graduated Scale Based on an
HMO Plan @ 80/20 Max Benefit Triple Choice at dollar amount of 80% of HMO premium
Legislative $3.85 $3.85
8 10 Year Revised Basic Plan
Graduated Scale with Transition Plan (Low – 5 Year Employee Plan)
Legislative $26.60 $22.40
9 Eliminate one-time deferral and require utilization of new employer health insurance or available spousal coverage Legislative $6.51 $6.51
10 Pension Plan Consistent Employee Contribution Rates for plan members
Negotiate & Legislative $0.32 $0.32
11 Pension Plan 25 Year or Age 55 and 10 years service normal benefit Negotiate $1.00 $0.00
Total $50.89 $41.79

ix
In addition, the following other recommendations have been made: 1. Establish a trust to insulate health benefit prefunded assets 2. Establish a broad wellness program 3. Create a permanent benefits committee 4. Develop a strategic plan The $48.16 million “hole” is plugged if all of the “High” recommendations were
implemented, while 80% of the “hole” is dealt with if the “Low” recommendations were to be implemented. It is understood that some can be implemented relatively quickly (changes to the retiree health insurance benefit), and others will require more time as they are subject to collective bargaining (employee cost sharing and pension changes).
The full report serves as a blueprint to accomplish the goal of putting the County’s
retiree health insurance benefit on a sound fiscal foundation. The reader is encouraged to read the entire report so as to gain a full understanding of the current County benefit provisions, the details of the findings, and the justification for the recommendations.


Committee Report

1
Report of the Collaborative Benefits Committee I. Introduction
A. Establishment of Committee
The Benefits Collaborative Study Group was created as a result of the passage of Resolution 50-11 (Appendix A), adopted by the County Council on September 6, 2011. The Study Group was created to:
1. review existing employment and post-employment benefits provided by the County; 2. assess the impact of the continued increase in the costs of the benefits on current and
projected revenues and expenditures of the County; 3. determine fair and equitable priorities in the reduction of the benefit costs, ensuring
that the benefits are fair to employees, retirees, and taxpayers of the County and can be funded on a fiscally sustainable basis; and
4. report to the County Executive and County Council recommendations on fair and equitable reductions of continued benefit costs.
The resolution also specified that the Study Group be composed of: 1. three members of the County Council, which are filled by Councilman Jamie Benoit,
Councilman Jerry Walker and Council Chairman Dick Ladd; 2. three members of the Executive Branch, which are filled by Budget Officer John
Hammond, Personnel Officer Ande Fulton, and Controller Richard Drain; 3. three members representing employee groups of the County filled by Craig
Oldershaw as a representative of public safety represented employees, Mike Akers as a representative of non-public safety represented employees, and Jean Tinsley as a representative of employees not represented by a bargaining unit.
The resolution finally specified that the Office of the Budget and the Personnel Office
will provide technical and staff support to the Study Group, and that an interim report should be completed by October 31, 2011, and a final report and recommendations be completed by December 31, 2011.
The Committee focused its efforts on three benefit categories: employee health insurance, retiree health insurance, and employee pension benefits. The majority of the Committee’s efforts were placed upon the retiree health benefit because of the significant funding issues associated with this particular benefit. This benefit also required significant review of the employee health insurance benefit since the two benefits are so closely related. The Committee also has focused on the benefits applicable to Anne Arundel County employees. While the County is the primary funder of the Board of Education, Community College and Library, these organizations are governed by independent boards which control the pay and benefit structure for their organizations. Additionally, for the Board of Education and the Community College, the pension benefit is provided primarily by the State of Maryland. It is anticipated that to the extent that the County makes cost saving changes to its benefits, that its component units would take similar action so as to bring all units into general conformity.
2
B. Background
1. Healthcare Costs The past two decades have seen an historic escalation in the cost of healthcare as a number of forces have come together to create a “perfect storm”. Medical research has been quite successful in developing new techniques for medical care and diagnosis tools to identify medical problems early in their development so that treatment can be successful. Additionally the drug industry has developed “wonder drugs” that have extended the expected life of Americans. These forces, while increasing the life expectancy of the population have thereby had a consequent impact on the utilization of healthcare services as older members of society are large consumers of healthcare services. Additionally, the aging of the post war baby boomers is adding dramatically to the percentage of the population that is Medicare eligible, and is a trend that will continue to grow for the next two decades, thereby placing an ever increasing demand for health care services. These forces have resulted in increased healthcare costs and are reflected in the recent healthcare costs confronting the County, as seen in the following chart:
Chart 1
These rapidly rising costs have been a significant contributor to the ever increasing expense of County benefits for its employees. Consequently, any examination of County benefits requires a detailed focus on its healthcare benefits, both for current employees as well as retirees. The Government Finance Officers Association has identified six “Leverage Points” that governments should focus on in order to manage these increasing costs:
1. Change the level of the benefit provided. Modify how many and what type of benefits the plan provides and who they provide them to
2. Manage participants’ choice of providers. Direct or even limit health plan participants’ choices to lower-cost providers.
County Health Insurance Cost(Millions)
$20 $30 $40 $50 $60 $70 $80 $90
1998 2000 2002 2004 2006 2008 2010 $300$350$400$450$500$550$600$650$700$750
Health Insurance Expense County Budget w/o BOE
9.5% Annual Rate of Growth
4.3% Annual Rate of Growth
Left Axis Right Axis

3
3. Share cost with employees. Structure the health plan so that employees bear part of the burden of benefit costs.
4. Reduce use of health care services by employees. Address the economic incentives and actual need for health care services.
5. Right-source health benefits services. Use the right combination of outsourced service providers and providers within a network to deliver health benefits.
6. Maximize the value received for the health care dollar. Rather than just minimizing costs, consider the benefit received per dollar spent on health benefits.
(Appendix B -- Containing Health Care Costs; Shyne C. Kavanagh, Senior Manager of Research, GFOA Research & Consulting Center, 2011). The findings and recommendations contained in this report are consistent with these “Leverage Points.”
2. GASB 45
As previously mentioned, the retiree health benefit presents a significant funding issue to Anne Arundel County. These funding issues were brought into clear focus with the issuance of Statement Number 45 by the Governmental Accounting Standards Board (GASB) in June of 2004 that addressed the Accounting and Financial Reporting for Employers for Postemployment Benefits Other Than Pensions. This Statement established requirements that standardize the methods used to account for non-pension post employment benefits, commonly referred to as “other post employment benefits” or “OPEB”. In order to implement these changes, governments must quantify and recognize the cost of OPEB attributable to former and current employees.
Attempts to quantify these benefits have revealed sizable liabilities for many
governments. Consequently those entities have been forced to evaluate their fiscal ability to afford the current liability.
Governments offer post employment incentives to their employees as a form of deferred
compensation. The most common post employment benefits are pensions and retirement savings programs. However, other forms of these post employment benefits, including continuing healthcare and insurance coverage, are also offered.
GASB established the current accounting and reporting standards for pensions in 1994. Since that time, governments have been required to recognize the costs of the pension benefits during the years that the respective employees are working. Governments typically set aside funds during each budget year to fund the pension costs of its current employees. If funds are not set aside for this purpose, governments must record expenses and liabilities on the financial statements for any annual contributions not set aside. Until the issuance of Statement #45 in 2004, GASB had not required the same treatment for OPEB.
Anne Arundel County has funded its pension plan on a pre-funded basis as required by
GASB since 1994. The principle involved is that employee benefits should be funded over the employee’s employment years.
While Anne Arundel County has been pre-funding its pension benefits (which is now
approximately 85% funded through a pension fund with $1.3 billion of assets), it has not set aside funds for OPEB. Instead, costs of these benefits are being recognized on a PayGo basis. For instance, in this fiscal year Anne Arundel County will recognize health insurance premiums

4
paid for those retirees currently covered by County health benefits. Therefore, the County is not recording the post retirement health care liability of its former and current employees, but instead is deferring the costs until those premiums are paid. This deferral places the burden of funding the benefits on future government resources and future taxpayers.
GASB Statement 45 requires governments to recognize the value of these incentives as
they are earned. The Statement requires that governments actuarially estimate the dollar value of benefits attributable to former vested and current employees, calculate an annual contribution required to pay for these benefits, and either set aside the contribution in a trust, or record the unfunded contribution as a liability on the financial statements. In FY2012, the total liability for the County, Community College and Library System for FY2012 is nearly $1.2 billion at a 4% discount rate. At an 8% discount rate this liability is $672.7 million.
Obviously, the assumed interest rate utilized to value the liability has a significant impact
on the reported size of the liability. Which interest rate to utilize may be a function of the purpose of the measurement, which may include:
• Funding: Determining the County’s contribution to prefund the benefit • Accounting: Determining the County’s accounting expense • Value to members: Determining the market value of the promise to participants
Each of these purposes may result in a different interest rate to be utilized. Appendix C
provides a detailed discussion on this topic. For the balance of this report, an 8% discount rate has been utilized for issues related to funding. For purposes of value of benefits to members, a 4% discount rate has been employed.
3. Patient Protection and Affordable Care Act
The passage of the Patient Protection and Affordable Care Act (PPACA) (Public Law 111-148) has introduced many new provisos to employers and the provision of health care, including the requirement to cover children up to the age of 26 who do not have health insurance coverage available to them, prospective limits on Flexible Spending Accounts, excise taxes on “Cadillac” insurance plans, and Medicare compensation changes such as bundled payment based on an episode of care. Other provisions require the elimination of the consideration of pre-existing conditions in the underwriting of policies and the elimination of the coverage gap (“doughnut hole”) in the Part D (Drug) coverage of Medicare in 2020 (A comprehensive review of the PPACA is contained in Appendix D). The promise of this legislation is "to bend" the healthcare cost “curve”, but many fear that instead it will increase healthcare costs. Additionally, the Supreme Court has recently agreed to hear an appeal to lower court decisions dealing with the constitutionality of the statute.
4. Medicare Solvency
Much has been written lately concerning the solvency of not only Medicare, but the entire Social Security program. With the aging of the post-war baby boomers, the number of Social Security and Medicare eligible recipients is growing rapidly and their expected life span is also growing. These factors are rapidly accelerating the cash drain on the Social Security and Medicare programs and the forecasts are that they will be bankrupt in the next 30 years unless program changes are undertaken. In 1983, some changes were made to the Social Security system such that the full retirement age has gradually been increased to age 67. However the Medicare eligibility age still remains at 65. Given the funding status of these two programs, it is

5
not unreasonable to assume that changes will be required in order to sustain them. An obvious prospective change is to further increase the Social Security retirement age as well as increase the age for Medicare eligibility. It is indeed inconsistent to have the current situation where Medicare eligibility begins at 65, while the standard Social Security eligibility age is 67. Given the changing demographics of the country, it is not unreasonable to believe that both programs will at some point in the near future arrive at an eligibility age of at least 70.
The Patient Protection and Affordable Care Protection Act as well as the current fiscal
status of Medicare (and Social Security) have introduced additional complications and uncertainty to the County’s benefits programs. Ideally the County’s benefits program should be integrated with federal programs so as to be mutually beneficial. However, the uncertainty as to the legal status of the Patient Protection and Affordable Care Protection Act and its consequent impact on health insurance costs have significant cost implications for the County’s retiree health benefit as well as its health insurance program for current employees. Additionally, the fiscal condition of Medicare has further implications on the County’s retiree health benefit, particularly to the extent that the County’s plan is integrated with Medicare. Lastly, the fiscal status of Social Security and its impact upon increasing the Social Security retirement age will undoubtedly have an impact on County pension costs (perhaps a favorable impact if employees work longer).
C. Benefit Cost Overview
The County and its component units currently appropriate significant funds for the provision of benefits to its employees as shown in the table below for FY2012.
Table 1
County Funding of Major Employee Benefits
Unit Salaries FICA & Medicare Amount %
Health Insurance Amount %
Pension Contribution1 Amount %
Retiree Health2 Amount %
County 206,341,900 12,966,100 6.3% 39,958,300 19.4% 48,165,000 23.3% 17,900,000 8.7%BOE 577,894,000 41,665,000 7.2% 126,919,000 22.0% 8,885,000 1.5% 30,000,000 5.2%College 52,669,100 4,000,000 7.6% 8,528,000 16.2% 525,000 1.0% 1,006,000 1.9%Library 9,939,000 770,000 7.7% 3,129,800 31.5% 226,000 2.3% 500,000 5.0%
1 State pension system picks up majority of pension cost for BOE, College & Library 2 Actual budget amount on a PayGo basis.
Another perspective of the benefit costs is in relation to the overall budgets of the component units.
Table 2
Major Benefit Costs by Component Unit
Unit Total
Budget Salaries
Salaries as a % of Budget Benefits
Benefits as a %
of Budget
Total Salaries &
Benefits
Total as a %
of Budget
County 533,017,300 206,341,900 38.71% 118,989,400 22.32% 325,331,300 61.04%BOE 911,227,000 557,894,000 63.42% 207,469,000 22.77% 785,363,000 86.2% College 102,976,100 52,669,100 48.8% 14,059,000 13.65% 66,728,100 64.8% Library 18,417,600 9,939,000 53.96% 4,627,000 25.12% 14,566,000 79.1%

6
A third perspective on benefit cost to the County is on the basis of an average County employee. The table below provides selected employee amounts (normal cost amounts for pension and retiree health).
Table 3
Benefit Cost for Selected Employees
Employee Salary FICA &
Medicare
Health Insurance Coverage Pension
Retiree Health
Insurance Total
Benefits
Total as a % of Salary
Maintenance Worker I 33,300 2,500 11,200 3,200 4,400 21,300 63.96%
Management Aide 50,500 3,900 13,600 7,700 4,400 29,600 58.61%
Accountant III 81,200 6,200 13,500 7,900 4,400 32,000 39.41%
Fire Fighter III 63,600 4,900 13,500 15,900 6,600 40,900 64.31%
Police Corporal 69,800 1,000 13,900 16,700 7,700 39,300 56.30%
Detention Officer 48,500 3,700 10,100 7,400 6,700 27,900 57.53%
Deputy Sheriff I 46,300 3,500 10,200 7,100 6,700 27,500 59.40%
Other benefits available to County employees include:
1a. 14 paid holidays per year (15 every other year for Election Day) 1b. 15 paid holidays per year for public safety employees 2. Annual Leave
Non- Represented Employees Represented Employees
Years of Service Leave Per year Less than 3 13 Days 3 to less than 15 20 Days 15 or more 26 Days
3. Disability Leave – 15 days per year 4. Personal Leave – 1 day 5. Term life insurance during employment 6. Optional life insurance continuing into retirement
D. Principles Utilized by the Committee
During the discussions of the committee a set of principles that should be applied to the
Committee’s work evolved. These principles were: 1. The County’s benefits should be “fair”. They should be in the middle of
the pack for the County’s peer group that includes Baltimore City, Baltimore County, Howard County, Calvert County, Prince George’s County, Montgomery County and the State of Maryland.
Years of Service Leave Per year Less than 5 10 Days 5 to less than 10 15 Days 10 to less than 20 20 Days 20 or more 25 Days
7
2. The savings to the County from any benefit changes should be utilized to prefund the retiree health insurance benefit. Until a trust is formally established, savings from implemented benefit changes shall be walled off based on a “lockbox” plan from the general fund.
3. The impact of benefit changes should be spread across the spectrum of impacted groups: new employees, current employees, and retirees.
II. Legal Issues
One of the important considerations of the Committee during its deliberations was the legal
implications of making changes to County benefits. The Committee received input from the County’s Office of Law on many legal issues pertaining to health and pension benefits. Generally speaking pension benefits have been interpreted by the courts to be protected under the contract clause of the U.S. Constitution when such benefits are prefunded by contributions made by an employer and employee during an employee’s active period of employment. This has the practical impact of making it difficult to retroactively reduce benefits to current retirees and vested members of a pension plan. Prospective changes can be made, but for those employee groups represented by a collective bargaining unit, any changes must be arrived at through the bargaining process.
Health benefits on the other hand offer more flexibility from a legal standpoint because they
are not prefunded in the manner of pension benefits. The cost of health benefits for current employees can be modified; however, for represented employees the benefit is a subject of collective bargaining. The County cannot unilaterally change the cost share of health benefits for those employees who are members of a collective bargaining unit. The components of the group health insurance plan (plan design) can be modified by the County within reason outside of the collective bargaining process.
The cost share of retiree health insurance, on the other hand is not a subject of collective
bargaining (with the exception of the FOP). The cost share of retiree health insurance is codified in the Personnel Article of the County Code in Section 6-1-308(b)(3) and it is currently established that an eligible retiree pays 20% of the cost of a group insurance policy and the County pays the remaining 80% (Appendix E contains the County Code provision). As with active employees the components of the group health insurance plan design can be modified by the County within reason outside of the collective bargaining process. It is also interesting to note that the retiree health provision of the County Code is written in terms of “retiree coverage” which means the County’s current practice of allowing retirees to purchase dependent coverage is entirely gratuitous.
Appendix F contains a memo from Deputy County Attorney David A. Plymyer in which a
“risk matrix” for making changes to the retiree health insurance benefit is listed. Another topic that received a great deal of consideration was the concept of creating a
mechanism to receive employer contributions to a fund for the pre-funding of the retiree health insurance benefit, similar to the method employed by the County to pre-fund its employee pension obligation. The concept is to create a “lockbox” into which the employer contributions would be placed in order to insure that funds would be available to pay the benefit during an employee’s retirement. The “lockbox” would take the form of a trust arrangement and would be an important component of the County’s long term commitment to meet its retiree health insurance promise and give a high degree of assurance to the employees and retirees that the

8
funds necessary to meet this commitment are secure. A second memo from Mr. Plymyer is incorporated in Appendix G.
III. Public and Private Sector Comparisons
The Committee reviewed several presentations comparing County salaries to other counties in the metropolitan region, as well as comparisons of health insurance benefits, retiree health insurance benefits and pension benefits. (Appendix H) These comparisons demonstrate that with respect to salaries Anne Arundel County is generally in the middle of the group for the job classifications of local governments. With respect to health benefits, the County offers a comparably better benefit package; but the overall cost to the employee is slightly better because of a more favorable employer cost share than many other jurisdictions provide and relatively favorable out of pocket limitations.
For the retiree health benefit the County again compares quite favorably to other jurisdictions, particularly with respect to the five year vesting provision for non-public safety employees and with a benefit that provides an 80-20 cost share regardless of years of service.
The pension benefit provided by the County is at least as comparable to other
jurisdictions and does offer relatively low employee contribution rates and certainly at least average annual accrual rates, with favorable age and service provisions for drawing the benefit, including a DROP program for police and fire pension plan members.
While specific salary comparisons were not made with the private sector, it is believed
that County salaries are comparable to the private sector. A more detailed benefits survey of large private sector private employers in the County was undertaken. The results show that the County’s benefits are significantly better and are offered at a lower cost to employees (Appendix I). Nationally, the current benefits situation is a result of a significant movement by the private sector to reduce their benefit package because of increasing cost pressure (Appendix J). The private sector has been moving away from defined benefit pension plans over the past two decades and has replaced these plans with either defined contribution plans or simply made 401k plans available to their employees with no employer subsidy (Appendix K). It should be noted however that Calvert (5% employer contribution) and Montgomery (8% employer contribution) counties utilize a defined contribution plan for their general employees.
With respect to a retiree health program, it is the rare private sector employer that
continues to provide this benefit. Only 19% of employers offer medical coverage to Medicare eligible retirees, down 40% in 1993 (Mercer National Survey of Employer-Sponsored Health Plans 2010).
Chart 2
Employers Offering Medical Plans for Medicare-Eligible Retirees 1993-2010

9
Additionally, Towers Watson reports in a survey that 60% of employers who currently offer retiree medical plans are rethinking their programs for 2012 or 2013.
Large private sector employers generally provide an employee health insurance program, and under the Patient Protection and Affordable Care Act all employers will be required to provide a health insurance plan for employees. The cost share for health insurance coverage in the private sector is generally less for the employer than in the public sector. It is the unusual plan in the private sector that would provide employer cost sharing at the 80% level, particularly with benefits comparable to the County’s. Additionally, many private sector employers provide subsidized health insurance coverage only to the employee, making the dependent coverage a greater responsibility of the employee, indeed up to 100% of the cost.
IV. Anne Arundel County Employee Health Insurance Benefit
A. Benefit Description
Anne Arundel County government offers eligible employees the choice of three medical plans: The CareFirst Blue Choice Triple Option plan, CareFirst BlueChoice HMO plan, and CIGNA Open Access In-Network plan. None of these plans impose a pre-existing condition limitation.
The CareFirst Blue Choice Triple Option plan offers three levels of benefits in one health care plan. The benefit level determines the out-of pocket expenses.
Table 4 Triple Choice Benefit Levels
Source: 2012 Open Enrollment & Benefits Reference Guide
The CareFirst BlueChoice HMO plan offers a network of credentialed doctors in which the participant chooses a primary care physician (PCP). The PCP provides medical care or refers the participant to the most appropriate BlueChoice specialist or facility. Office visits for illness or preventive care for both the PCP and specialist require a $5 co-pay. Emergency services and inpatient hospitalizations are covered at 100% of the allowed benefit after the co-pay. Out of pocket expenses are maximized at $800 (single) and $1,600 (family) per calendar year. The yearly deductible is $0.
The CIGNA Open Access In-Network plan provides a single network of more than 50,000 credentialed primary and specialty care physicians, hospitals and facilities. This is a referral free, self-directed choice with no Primary Care Physician selection required. The plan provides coverage for both in-network and out-of-network. Primary care and specialist visits have a $5 co-pay. Emergency services and inpatient hospitalizations are covered at 100% of the

10
allowed benefit. Out of pocket expenses are maximized at $1,100 (single), $2,200 (double), and $3,600 (family) per calendar year. The yearly deductible is $0.
The employee cost share is 20% for BlueChoice Triple Option, 10% for Blue Choice
HMO and 10% for CIGNA Open Access In-Network. This amount is a pre-tax deduction from the employee’s biweekly paycheck.
In addition to medical coverage, the healthcare rates provide a prescription drug plan.
Regardless of which medical plan an active employee participates, CVS Caremark administers the prescription drug benefit. Co-pay for up to a 30 day supply of prescriptions are $5 for each generic medication, $15 for each brand name medication on the drug list, and $25 for each brand name medication not on the drug list. Co-pay for up to a 90 day supply of prescriptions are $10 for each generic medication, $30 for each brand name medication on the drug list, and $50 for each brand name medication not on the drug list.
All of the health plans also provide for a dental and vision benefit at no cost to the
employee. The dental benefit allows the employee to choose either a CIGNA DHMO plan or a CIGNA PPO plan. The DHMO provides for no annual deductable or annual maximum. It is an in-network program that provides for no cost coverage on preventive and diagnostic services and a schedule of benefits for other dental services (restorative, root canal, orthodontia, etc.). The PPO provides both in-network and out-of-network benefits with a $1,000 annual maximum benefit and an annual deductable of $10 per person for individual coverage and $25 per person for family coverage. In-network coverage is similar to the DHMO although for major restorative (crowns, bridges, etc.) and orthodontia requires co-insurance from 50% to 80% and a $1,000 lifetime maximum orthodontia benefit for dependent children applies. Out-of-network reimbursement is based on 90th percentile of reasonable and customary allowances.
The vision coverage is a VSP WellVision© plan which provides both in-network and out-
of-network coverage. The plan provides for annual allowances for various vision services including examinations ($40), lenses & frames ($120) or contact lenses ($75), as well as discounts on PRK and LASIK surgery.
The cost to the County and the employee for the various health insurance plans is shown below:
Table 5A County Health Insurance Rates

11
Table 5B County Dental & Vision Rates
Source: 2012 Open Enrollment & Benefits Reference Guide
B. Findings
The benefit offered by Anne Arundel County is generous when compared to other public sector employers in the region, particularly with respect to the low co-pays and out of pocket requirements. This situation provides little economic incentive for the user to manage his/her own health condition so as to mitigate costs to the consumer. Additionally the cost share provision at 90/10 for the two HMO plans and 80/20 for Triple Choice, as well as 100% for the dental and vision plans, is quite favorable compared to other jurisdictions (with the notable exception of the Anne Arundel County Board of Education which provides either a 97/3 or 95/5 cost share HMO plan; or a Triple Option plan with either a 92/8 or a 90/10 cost share for its employees), is quite favorable to other jurisdictions and the private sector, and consequently expensive to the County.
C. Recommendations
Based on the committee’s discussions, including the belief the users of the service should pay for the service, while healthy individuals should be more favorably treated, and in comparison to other jurisdictions the Committee recommends that the following actions be implemented:
1. Plan Design Changes
These are changes in the current plan design including co-pays, deductibles and cost shares. The associated annual savings has been provided by the County’s healthcare consultants, AON Hewitt.

12
Table 6 Savings from Healthcare Plan Design Changes
Plan Design Current Benefit
Proposed Change Cost Savings (in millions)
Office Co-pay $5 Primary/$5 Specialist $10 Primary/$20 Specialist $15 Primary/$35 Specialist $ 1.0
Emergency Co-pay $35 ER/$35 Urgent Care $75 ER/$35 Urgent Care $ 0.1 Prescription Co-pay $5/$15/$25 $5/$25/$35 $0.6
HMO Deductible $0 $200 $1.0 Triple Choice Deductible $200/$400/$600 $250/$500/$1,000 $ 0.2
Total $2.9 These changes can be implemented during the next contract period commencing January 1, 2013 and do not require negotiation with represented employee groups.
2. Cost Share Increase the employee cost share thereby reducing the County’s annual cost. Current cost
share is 90/10 for HMO plans, 80/20 for Triple Choice plan, and 100/0 for Dental and Vision plans.
A. Healthcare
Table 7 Healthcare - Savings from Cost Share Alternatives
Cost Share Cost Savings (in millions)
HMO Plan only @ 90/10 Triple Choice at dollar amount of 90% of HMO premium $ 3.4
HMO Plan only @ 85/15 Triple Choice at dollar amount of 85% of HMO premium $ 6.3
HMO Plan only @ 80/20 Triple Choice at dollar amount of 80% of HMO premium $ 9.2
HMO Plan only @ 75/25 Triple Choice at dollar amount of 75% of HMO premium $12.1
AND
B. Dental & Vision
Table 8 Dental & Vision - Savings from Cost Share Alternatives
Cost Share Cost Savings (in millions)
80/20 $ 0.9

13
Cost share changes will have to be negotiated with the various represented groups of employees. As the above tables indicate there is significant cost savings available from making a change to the cost share provision. While representative of the various employee groups were less desirous of making any change to the current cost share arrangement, the consensus of the remaining Committee members is that Dental and Vision cost sharing at 80/20 is reasonable and fair, and that a either an 85/15 or 80/20 cost share for health insurance was acceptable. V. Anne Arundel County Retiree Health Benefit A. Benefit Description
The health benefits provided to retirees are tied to the retiree’s pension eligibility and
retirement. County employees are eligible for retiree health insurance benefits if they are a retiree that currently receives a monthly County retirement pension and have not waived coverage. Once a retiree waives medical coverage, he/she may not elect coverage in the future. Dependents have administratively been eligible if they are a legal spouse, a child up to age 26, or a dependent grandchild for whom the retiree is the legal guardian.
County retirees who are eligible for Medicare must enroll in both Medicare Parts A & B
as soon as they are Medicare eligible to have full claims coverage. Retirees who are eligible for Medicare & County health insurance may elect the CIGNA PPO Medicare Wrap plan currently provided by the County. The CIGNA PPO Medicare Wrap plan is designed for benefit eligible retirees and spouses age 65 and over. This plan provides coverage for a variety of medical services and benefits not fully covered by Medicare Parts A & B alone. The CIGNA PPO Medicare Wrap plan is available nationwide and allows members the freedom to visit any provider throughout the country. In general, CIGNA pays the Medicare deductible plus 80% of the patient’s responsibility after the Medicare awarded amount.
County retirees, who are eligible for medical insurance benefits but not eligible for
Medicare, may select from the health plans provided to active employees. These plans include The CareFirst Blue Choice Triple Option plan, CareFirst BlueChoice HMO plan, and CIGNA Open Access In-Network plan.
The Retiree cost share is 20% for health coverage (Anne Arundel County Code 6-1-
308(b) (3), 100% for dental coverage and 100% for vision. Below is the Anne Arundel County retiree rate schedule for 1/1/12 -12/31/12:
Table 9A Retiree Health Insurance Rates

14
Table 9B Retiree Dental and Vision Rates
Source: 2012 Open Enrollment & Benefits Reference Guide
In addition to medical coverage, these rates provide a rich prescription drug plan. Despite
what medical plan a retiree participates in, CVS Caremark administers the prescription drug benefit. Below is a chart that outlines the coverage provided by CVS Caremark:
Table 10
CVS Caremark Drug Plan Coverage
Source: 2012 Open Enrollment & Benefits Reference Guide
For the post-65 prescription drug coverage, the County currently takes advantage of the
retiree drug subsidy (RDS) under Medicare. The program was designed to encourage employers to continue offering prescription drug coverage to retirees eligible for Medicare by providing a federal subsidiary. Employers receive a tax-free subsidiary of approximately 28% of covered prescription drug costs for their retirees, between threshold and limit amounts which are set by Center for Medical Services (CMS) and annually adjusted for inflation. The County receives approximately $900K in subsidy each year. This program will no longer be available to the County as of CY2013 under the Patient Protection and Affordable Care Act (PPACA). For employers with Medicare-eligible retirees, this change will significantly impact their post-
15
retirement benefit obligation. Many employers are re-evaluating their retiree prescription drug offerings in the short term and migrating to an Employer Group Waiver Plan (EGWP). Under a direct-contract EGWP approach, the pre-tax federal subsidiary is set at the national average less the Part D base beneficiary premium. This plan allows the County to remain self-funded, retain the current plan design and take advantage of the government’s tax free opportunities. Unlike the RDS option, the EGWP direct subsidy is a contract with EGWP that includes subsidization for administrative costs and profit margins based on the national average of commercial plans. The estimated savings is 35% over traditional methods of paying for retiree prescription expenses such as self-funding and applying for the RDS Subsidy (Appendix L). The county is pursuing this option for CY2012.
B. Findings
Background
The retiree health benefit is of the most concern for the County as it is a benefit that the County is funding on a PayGo basis. This is an unsound financial practice; and as previously noted, the Government Accounting Standards Board (GASB), through its issuance of Statement Number 45, requires governments to report the liability associated with this benefit as part its annual financial statement. As a consequence of the County’s PayGo funding this liability has been building on the County’s balance sheet and could jeopardize its bond rating (currently AAA by S&P and AA+ by Moody’s), thereby giving rise to increased cost of borrowing to support the County’s capital budget.
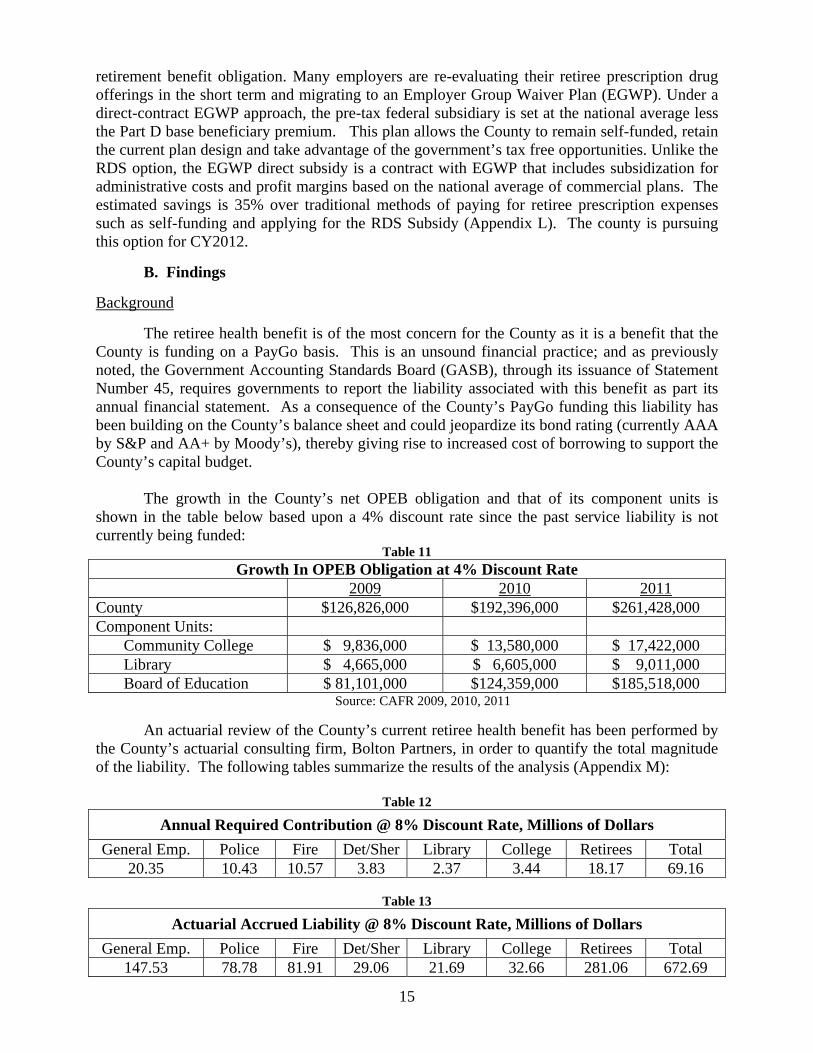
The growth in the County’s net OPEB obligation and that of its component units is
shown in the table below based upon a 4% discount rate since the past service liability is not currently being funded:
Table 11 Growth In OPEB Obligation at 4% Discount Rate
2009 2010 2011 County $126,826,000 $192,396,000 $261,428,000 Component Units: Community College $ 9,836,000 $ 13,580,000 $ 17,422,000 Library $ 4,665,000 $ 6,605,000 $ 9,011,000 Board of Education $ 81,101,000 $124,359,000 $185,518,000 Source: CAFR 2009, 2010, 2011
An actuarial review of the County’s current retiree health benefit has been performed by
the County’s actuarial consulting firm, Bolton Partners, in order to quantify the total magnitude of the liability. The following tables summarize the results of the analysis (Appendix M):
Table 12
Annual Required Contribution @ 8% Discount Rate, Millions of Dollars General Emp. Police Fire Det/Sher Library College Retirees Total
20.35 10.43 10.57 3.83 2.37 3.44 18.17 69.16
Table 13
Actuarial Accrued Liability @ 8% Discount Rate, Millions of Dollars General Emp. Police Fire Det/Sher Library College Retirees Total
147.53 78.78 81.91 29.06 21.69 32.66 281.06 672.69

16
The affect of Statement Number 45 is an incentive to advance fund this retiree liability
over the employee’s working life (normal cost), similar to the County’s current practice (and GASB incentive) of funding an employee’s retirement benefit. The County’s current accrued actuarial liability for retiree health insurance for its current employees and retirees is $672.7 million at an assumed 8% discount rate (includes the Library System and Community College, but not the Board of Education which is an approximately $600 million additional liability). (GASB allows an 8% discount rate if the liability is being funded over a 30 year amortization period, if not a lower interest rate must be utilized. At a 4% interest rate, this liability is $1.3 billion for the County, Library and Community College; including the Board of Education would add $1.3 billion additional liability, or a total of $2.5 billion.) In order to fund this liability over 30 years (past service cost) and fund the additional benefit earned each year by County employees (normal cost), an annual appropriation of $69.16 million is required, again assuming an 8% discount rate. This $69.16 million annual amount compares to the County’s FY2012 $21 million PayGo appropriation for this liability, or and increase of $48.16 million over the current budget’s PayGo appropriation.
This unfunded actuarial accrued liability needs to be addressed and has served as the
catalyst for the formation of this Committee. Absent a plan to address this liability, the liability will continue to spiral upwards and eventually strangle the County’s ability to provide for current services. This is a very unpleasant prospect for County taxpayers and would in all likelihood result in County retirees not receiving the promised retiree benefit as a result of a bankruptcy court determination.
Several local governments across the United States (including Vallejo, California, Central
Falls, Rhode Island) are currently confronting bankruptcy as a result of benefit promises that now cannot be kept, while several states including New York and California are considering changes in worker’s benefits because of the escalating costs (Appendix N). Closer to home, the State of Maryland has recently implemented a revised pension plan and is considering passing some or all of the responsibility of teacher pensions down to the counties because of dwindling state revenue and the size of the teacher pension liability. Maryland also changed its retiree health benefit by requiring Medicare eligible retirees starting in 2020 (when the “doughnut hole” is closed under the PPACA) to utilize Medicare Part D coverage instead of the state’s drug plan.
In order to address this significant problem, the Committee has spent considerable time
researching and considering alternatives described below that will place this benefit on a sound financial foundation. As previously alluded to, the ability to do so is complicated by the dynamic nature of the healthcare environment, which includes rapidly increasing costs and recent federal government action that is currently under review by the Supreme Court.
Fortunately the task to reduce the County’s cost of retiree health benefits is facilitated by
the number of options available to realize cost savings, and the generosity of the County’s current benefit. Indeed the benefits consultant utilized by some employee groups, Mr. Randy Hart from the firm of CBIZ during his presentation to the Committee on November 15, 2011 (Appendix O), identified the County’s current retiree health benefit as the “gold mine” as far as being able to realize cost savings.

17
1. Universal Alternatives Years of Service
The County’s current retiree benefit is a very rich benefit as demonstrated by the following statistics related to the present value of the benefit (assuming a 4% discount rate) for a retiree with a spouse of the same age under different circumstances:
Table 14 Present Value of Retiree Health Benefit
Retiree Years of Service Age 5 10 15 20 25 30 45 $398,227 $398,227 $398,227 $621,927 $621,927 N.A. 50 $376,749 $376,749 $376,749 $535,108 $535,108 $535,108 55 $356,214 $356,214 $356,214 $439,453 $439,453 $439,453 60 $338,365 $338,365 $338,365 $338,365 $338,365 $338,365
Shaded area discounted from the benefit at age 60 since benefit cannot be received until age 60 with less than 20 years service
These amounts are substantial, and are a result of the present benefit which allows non-
public safety employees to vest in this benefit after only five years of service and allows for retirement benefits to start at an early age (20-and-out for public safety and 30-and-out for employees). Also, there is no employee contribution towards the cost of this benefit, and everyone receives the same cost share (80/20) for the same benefit benefit, regardless of the years of service. Graduated Scale
The “all-or-nothing” feature of the current County benefit is unusual and very lucrative for those who work for the County for a relatively short time. Most of the plans of other jurisdictions utilize a type of graduated scale for the benefit, tying the amount of the benefit to years of service, and also requiring a considerable long-term commitment to the employer before the employee vests in the benefit. Indeed two of the County’s component units, the Board of Education and the Community College utilize a graduated scale and have a longer vesting period (10 years), as well as capping the benefit at a maximum of a 75/25 cost share (Appendix P). Both of these plans also do not provide for a terminated vested benefit (allow an employee who has vested but not yet eligible for a retirement benefit because of not having achieved retirement age), which the County’s current plan does allow. Transfer of Credit
A similar issue (perhaps best characterized as a mirror image) involves the transfer of
service with the State of Maryland by a new employee to Anne Arundel County. For purposes of a pension benefit, the County gives full credit for time with the State of Maryland in calculating the years of service, as long as the employee works at least five years for the County. The former State employee is required to transfer their contributions to the State’s pension system to the County’s pension system in order to receive credit for their State time in the County system. (It should be noted that the State’s contribution on behalf of the transferred employee does not

18
come to the County’s pension system, thereby resulting in a windfall gain to the State’s pension system.)
For purposes of the retiree healthcare benefit, the issue becomes whether transferred State
time should be utilized in the determination of the graduated scale benefit? Some contend that the State time should count towards determining the County healthcare benefit since it serves as a recruiting tool. This may be true, but no one has done any kind of fiscal analysis to validate the assertion.
The other side of the issue is that the time should not count towards the determination of
the benefit. The arguments for this position include: 1. By counting it towards the benefit, it values experience with the State of Maryland
as being worth more to the County than with an employee’s experience elsewhere, including the private sector, a concept that most objective views would consider farcical.
2. To do so for the retiree healthcare benefit, because time is transferable for pension purposes, ignores the important fact that for pension purposes, at least the County is receiving the transferee’s own contributions to the pension benefit, which is not the case for the retiree healthcare benefit, since there is no equivalent employee contribution for retiree healthcare in the State of Maryland’s retiree healthcare plan.
3. The retiree healthcare benefit is a very valuable benefit and should be available to County employees who have demonstrated a long term commitment to the County’s citizens, which is the reason for increasing the County’s currently short (5 year) vesting provision.
While some may contend that the impact of this item is small when related to the overall
cost of the County’s retiree healthcare benefit, it begs the strong arguments listed above, and violates an important management rule that is too often ignored – “There is no right way to do the wrong thing”.
Dependent Coverage
With respect to dependent coverage, several plans of other governmental units provide a lesser cost share for dependent coverage than for the retiree coverage. If the County were to simply change the health benefit for an employee’s spouse from the present 80/20 cost share to a 60/40 spousal cost share for future retirees, the savings would be $4.4 million in the County’s Annual Required Contribution. A reduction to 75/25 spousal cost share would result in a $1.1 million savings in the Annual Required Contribution of the County. Terminated Vested Employee Coverage
The retiree health benefit for terminated vested employees is another area of potential savings in a restructured retiree health program. Terminated vested employees are employees who have left County employment prior to being eligible to receive an immediate pension benefit. As the retiree health benefit is tied to the County’s pension benefit, most, if not all, terminated vested employees would fall into the non-public safety employee category. The following alternative options to the present 80/20 cost share for this category of former employees should be considered:

19
1. The benefit would only be available to those terminated vested employees that have 20 years of County service and the benefit would be determined as to where they fall in the transition matrix to be discussed later;
2. Regardless of the years of service a 50/50 cost share benefit would apply; or 3. Regardless of the years of service a 50/50 cost share benefit would apply and no
spousal or dependent coverage would be provided. As previously mentioned in the above legal issues section, there may be some legal
considerations to these various alternatives (Appendix F).
These universal alternatives above have been considered for modifying the current retiree health benefit and the resultant savings are summarized in the below table (Appendix M):
Table 15
Savings in AAL from Various Options @ 8% Discount Rate – Millions of Dollars Option Cost Savings from Baseline
Baseline 69.16 ---- No Retiree Health Benefit Until Age 55 or Actuarial Equivalent Reduction for Benefit Prior to Age 55 58.74 10.42
Suspend Benefit If Coverage is Available from Spouse or New Employer 62.65 6.51
Cost Share 75/25 Rather than 80/20 66.71 2.45 Spousal Cost Share 75/25 68.10 1.06 Spousal Cost Share 60/40 64.78 4.38 Eliminate Terminated Vested Employees 68.18 0.98
Table 16
Savings in ARC from Various Options @ 8% Discount Rate – Millions of Dollars Option Cost Savings from Baseline
Baseline 672.69 ---- No Retiree Health Benefit Until Age 55 or Actuarial Equivalent Reduction for Benefit Prior to Age 55 593.98 78.71
Suspend Benefit If Coverage is Available from Spouse or New Employer 622.69 50.00
Cost Share 75/25 Rather than 80/20 654.20 18.49 Spousal Cost Share 75/25 664.60 8.09 Spousal Cost Share 60/40 639.12 33.57 Eliminate Terminated Vested Employees 661.95 10.74 2. Pre-65 Alternatives Plan Design
Because the pre-65 retiree health benefit is the same health plan as for current employees, it offers the same low co-pays and low deductibles; further adding to the County’s cost of the benefit. Accordingly, it would be logical to implement the same plan design changes for the pre-65 retiree health plan as are suggested for the active employee health plan’s benefit.
20
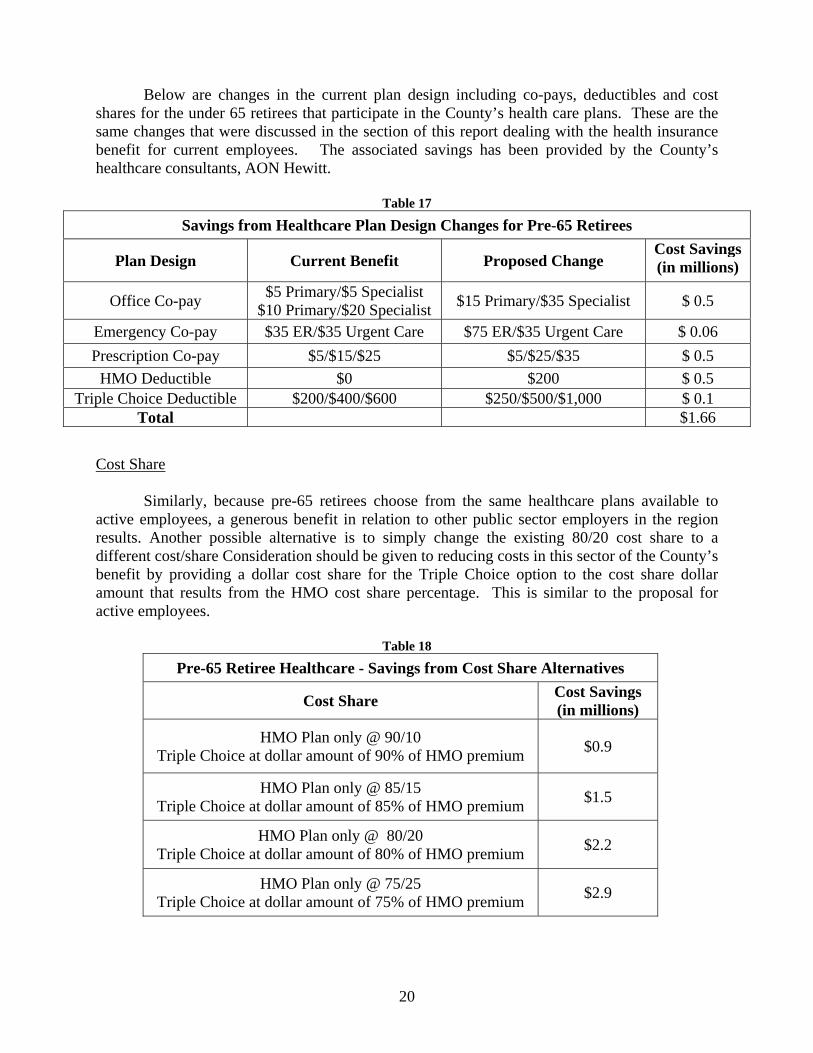
Below are changes in the current plan design including co-pays, deductibles and cost
shares for the under 65 retirees that participate in the County’s health care plans. These are the same changes that were discussed in the section of this report dealing with the health insurance benefit for current employees. The associated savings has been provided by the County’s healthcare consultants, AON Hewitt.
Table 17
Savings from Healthcare Plan Design Changes for Pre-65 Retirees
Plan Design Current Benefit Proposed Change Cost Savings (in millions)
Office Co-pay $5 Primary/$5 Specialist $10 Primary/$20 Specialist $15 Primary/$35 Specialist $ 0.5
Emergency Co-pay $35 ER/$35 Urgent Care $75 ER/$35 Urgent Care $ 0.06 Prescription Co-pay $5/$15/$25 $5/$25/$35 $ 0.5
HMO Deductible $0 $200 $ 0.5 Triple Choice Deductible $200/$400/$600 $250/$500/$1,000 $ 0.1
Total $1.66
Cost Share
Similarly, because pre-65 retirees choose from the same healthcare plans available to
active employees, a generous benefit in relation to other public sector employers in the region results. Another possible alternative is to simply change the existing 80/20 cost share to a different cost/share Consideration should be given to reducing costs in this sector of the County’s benefit by providing a dollar cost share for the Triple Choice option to the cost share dollar amount that results from the HMO cost share percentage. This is similar to the proposal for active employees.
Table 18
Pre-65 Retiree Healthcare - Savings from Cost Share Alternatives
Cost Share Cost Savings (in millions)
HMO Plan only @ 90/10 Triple Choice at dollar amount of 90% of HMO premium $0.9
HMO Plan only @ 85/15 Triple Choice at dollar amount of 85% of HMO premium $1.5
HMO Plan only @ 80/20 Triple Choice at dollar amount of 80% of HMO premium $2.2
HMO Plan only @ 75/25 Triple Choice at dollar amount of 75% of HMO premium $2.9

21
Coverage Deferral
Another cost saving option is to change the current policy of allowing the deferral of the retiree benefit one-time. It is advantageous to the County if a retiree were to defer the subscription to the retiree health benefit during retirement. Many retirees have access to health coverage through their spouse or through a subsequent employer if they choose to remain in the workforce after retiring from the County. The current policy of a one-time deferral puts the retiree in the position of rarely deferring the County’s retiree benefit, thus denying the County the savings that could be available had the employee utilized an alternative available coverage. The savings to the County could be substantial, particularly from the pre-65 retirees. As an incentive for pre-65 retirees to defer the utilization of the retiree health benefit and instead utilize alternative coverage to which they have access, a credit could be given to the graduated scale benefit such that the County’s cost share would increase if the employee deferred coverage for a sufficient period of time.
Table 19
Savings in ARC from Coverage Deferral @ 8% Discount Rate – Millions of Dollars Option Cost* Savings from Baseline*
Baseline $69.16 ---- Suspend Benefit If Coverage is Available from Spouse or New Employer $62.65 $6.51
Savings in AAL from Coverage Deferral @ 8% Discount Rate – Millions of Dollars Option Cost Savings from Baseline
Baseline $672.69 ---- Suspend Benefit If Coverage is Available from Spouse or New Employer $622.69 $50.00
3. Post-65 Alternatives
A simplistic approach to this category of the retiree health benefit would be to simply alter the cost share form the present 80/20 for the CIGNA Wrap plan to a 75/25/ split which would produce $588,000 of annual savings to the County or a 70/30 cost share which would result in $1,176,000 of annual county savings. There is a different approach to the CIGNA wrap plan however, that can result in significant savings to both the County and the retiree. This alternative is outlined next. Connector Plan
The Committee also explored concepts relating to the evolving market of private Medicare Connector or Exchange coupled with Health Reimbursement Accounts (HRA). These exchanges offer both Medicare Supplement plans (also referred to as Medigap policies) and Medicare Advantage plans. Medicare Supplement plans provide coverage for services that Medicare does not cover. These plans operate very similarly to the County’s current CIGNA PPO Medicare Wrap plan. Under a supplemental policy, Medicare will pay its share of the Medicare-approved amount for covered health care costs and then the supplemental policy pays its share. The retiree has to pay a premium for the supplemental policy. Every Medigap policy must follow federal and state laws and are identified by letters A-N. All policies offer the same

22
basic benefits, but some of the policy variations offered provide additional benefits, which the retiree can choose to best fit its individual needs. In order to gain knowledge on this topic the Committee heard a presentation from United Health Care that outlined coverage and costs associated with the AARP Medicare Supplement plans (Appendix Q). A Medicare Advantage Plan (like an HMO or PPO) is an alternative way to receive Medicare benefits. Unlike “Original Medicare,” in which the government pays for Medicare benefits when you receive them, Medicare Advantage Plans (MA Plans) are offered by private companies approved by Medicare, and Medicare pays these companies to cover your Medicare benefits. If you join a Medicare Advantage Plan, the plan will provide all of your Medicare Part A and B coverage. This is different than a Medicare Supplement plan, which just pays for costs that Medicare does not cover. All MA plans cover emergency and urgent care.
A Medicare Connector or Exchange is a centralized service whereby the retiree can
compare and purchase qualified health and drug plans. These health exchanges have existed for more than five years. Employers can provide the retiree access to this service with financial assistance to meet the employer’s coverage responsibility and help make post-retirement benefits affordable to the employer and provide a generous supplemental Medicare benefit to the retiree. The retiree will depend on the health exchange for personalized individual health plans. This provides the retiree with freedom of choice and the value of the open market. All of the above Medicare plans are available under an exchange or connector model. The exchange or connector model provides a structure to assist the employer in the transition from a group (the current Cigna PPO Medicare Wrap plan) to individual coverage with decision support tools and personalized service features that empower the retiree. Another advantage is that it incorporates an insurance product, thereby transferring the risk which is currently borne by the County to the insurer. (Appendix R)
Medicare is an ideal benefit upon which to build an insurance exchange. It allows for
huge risk pools that continue to grow since there are over 40 million retirees enrolled in Medicare, and the post-war baby boomers will swell the numbers over the next two decades. The market is a guaranteed issue market so adverse selection is not an issue. Everyone has to join Medicare at age 65 regardless of health condition. Exchanges are very competitive as carriers compete on prices that are filed annually for standardized plans and the retiree selects the best performing plan from the best performing carrier that fits the retiree’s individual needs (Appendix S).
It should also be noted that once insurance exchanges are up and running under the
provisions of PPACA (assuming the statute is held to be Constitutional), there is the prospect that a cost saving insurance mechanism would be available for the pre-65 retirees.
The Committee reviewed presentations from a vendor, Extend Health Inc, which outlined
an example of a Medicare Connector model. Extend Health’s private Medicare exchange enables individuals to shop for enhanced Medicare coverage through an integrated website and call center. Their health exchange has over 70 national and regional health insurance carriers, with 3,500 different available plans. This connector model provides all Medicare plan types (Medicare Advantage, Medigap/Medicare Supplement plans), Prescription Drug plans, vision and dental plans. Plans were compared side-by-side with the existing CIGNA PPO Medicare Wrap plan (which includes the CVS-Caremark Drug Plan), both from the coverage and cost perspectives.

23
The committee reviewed a fiscal comparison (Table below) of the current CIGNA Wrap plan to a Connector model (market exchange) plan that includes a County subsidy of $3,000 per year, and concluded that the County could save up to 50% and the retiree could save approximately 74% of costs by utilizing a Connector model.
Table 20
Cost Comparison CIGNA Wrap vs. Market Exchange
(Includes CVS-Caremark Drug Plan) Number of Participants: 1120
Current Plan: CIGNA Wrap (80/20)
Retiree Pays Catastrophic Healthy CIGNA Premium $1,514 $1,514 Medical OOP $1,354 $104 Drug OOP $1,206 $147
Total $4,074 $1,765 County Pays
CIGNA Premium $6,055 $6,055
Individual Medicare Market Exchange¹ Catastrophic Healthy
AARP Plan F
& AARP Plan F
& Retiree Pays Humana PDP Humana PDP
Premium $3,169 $3,169 Medical OOP $0 $0 Drug OOP² $886 $281
Total $4,055 $3,450 County HRA ($3,000) ($3,000)
Net $1,055 $450 Savings to Retiree $3,019 $1,315 Percentage Savings 74% 74% Savings to County $3,067 $3,067 Percentage Savings 51% 51% Total Savings to County $ 3,434,592 $ 3,434,592 Notes: (1) Does not include ExtendHealth admin costs (2) Catastrophic Drug OOP costs include approximately $2,400 in anticipated donut hole funding for the top 10% of seniors
To meet the affordability of retiree health insurance and provide flexibility to the retiree,
the County could provide financial support through a tax-advantaged savings account, such as a health reimbursement account (HRA). As the employer, the County can provide a specific

24
amount of funds into a retiree’s account to be used only for federal qualified health related expenses. This account could purchase a retiree’s health and drug plan, as well as pay for co-pays and deductibles. Any unused funds can be used for other qualified expenses. As mentioned, the above table includes a $3,000 annual County subsidy provided through an HRA.
The Connector model offers a win-win situation for the County and the retiree. From the
County’s perspective it offers the promise of substantial cost savings from its current retiree health benefit costs, as well as bringing some predictability to cost. It also eliminates carrier negotiations as all carriers will be competing on price for the individual retiree, and will reduce the County’s administrative burden. From the retiree’s perspective, it offers increased personalization and choice, while at the same time providing equal or better benefits at a substantial savings to the retiree, thereby enhancing the retiree’s peace of mind.
The Committee also examined the elimination of its Part D Coverage in the year 2020, an alternative the State of Maryland recently adopted in order to reduce its actuarial accrued liability. This option is predicated on a provision in the Patient Protection and Affordable Care Act that closes the “donut hole” in the year 2020. While this option may have been attractive to the State of Maryland, since it results in an approximate 45% reduction in its unfunded actuarial accrued liability because of the demographics of its retiree population (fewer pre-65 retirees than the County because of the County’s predominance of public safety retirees); it is based upon the assumption that the Patient Protection and Affordable Care Act will be found constitutional by the Supreme Court and that Medicare will be able to afford this increased cost responsibility. If the County were to follow the State of Maryland’s lead, the reduction in the annual required contribution (ARC) would be $14.3 million or 21% and the unfunded accrued liability would be reduced by $133.8 million or 20%.
Based on the committee’s discussions and presentations from outside groups, the
following proposals for reductions in retiree medical benefits (both pre & post 65) were reviewed: 4. Basic Benefit Plan Alternatives
20 year Basic Benefit Plan – This is a graduated scale retiree health benefit with Medicare Connector coverage. The basic benefit is based on a 20 year vesting requirement. It provides a percentage cost share for retirees under the age of 65 and a fixed dollar amount (indexed to a medical cost inflation factor of 4% annually) for retirees over the age of 65 to apply to a Connector Model plan. The dollar amount for the 65 and over benefit are for the individual, therefore a husband and wife would receive twice the amount.
Table 21A
20 Year Basic Benefit Plan Future Employees
Service <65 Cost Share 65 & Over Dollar Subsidy
20-24 50/50 $ 200 25-29 65/35 $ 225 30+ 75/25 $ 250
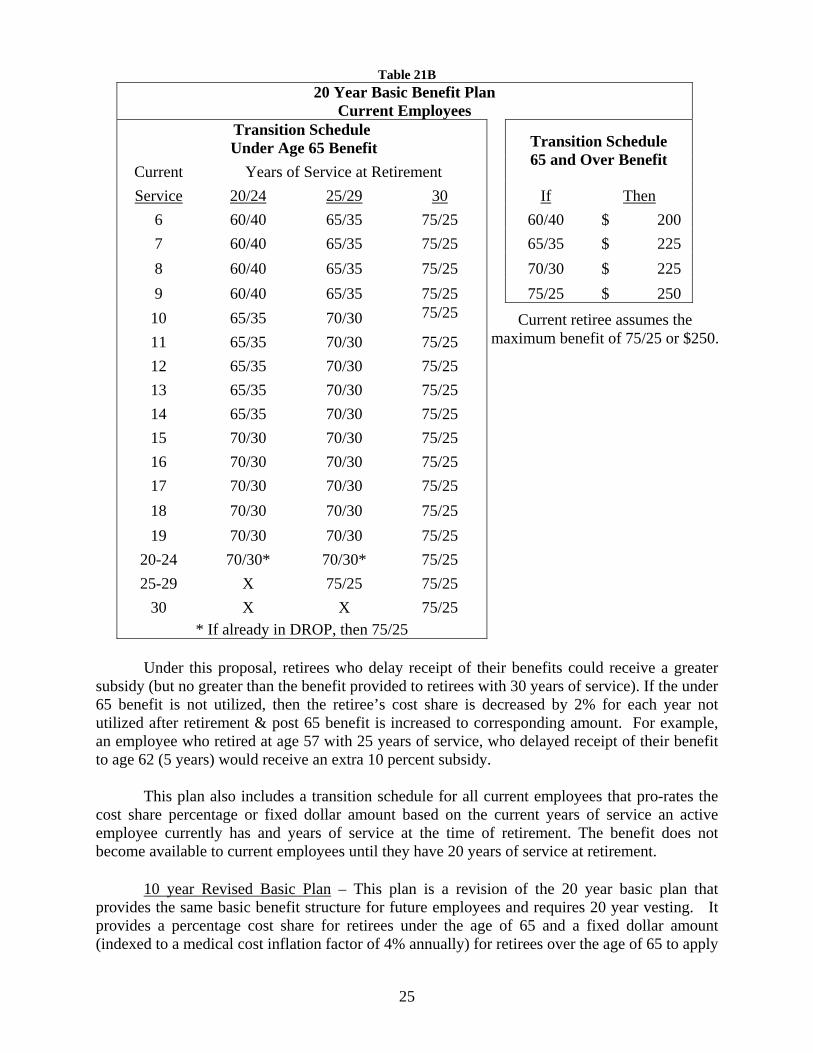
25
Table 21B
20 Year Basic Benefit Plan
Current Employees
Transition Schedule
Under Age 65 Benefit
Current Years of Service at Retirement
Transition Schedule 65 and Over Benefit
Service 20/24 25/29 30 If Then
6 60/40 65/35 75/25 60/40 $ 200
7 60/40 65/35 75/25 65/35 $ 225
8 60/40 65/35 75/25 70/30 $ 225
9 60/40 65/35 75/25 75/25 $ 250
10 65/35 70/30 75/25
11 65/35 70/30 75/25
12 65/35 70/30 75/25
13 65/35 70/30 75/25
14 65/35 70/30 75/25
15 70/30 70/30 75/25
16 70/30 70/30 75/25
17 70/30 70/30 75/25
18 70/30 70/30 75/25
19 70/30 70/30 75/25
20-24 70/30* 70/30* 75/25
25-29 X 75/25 75/25
30 X X 75/25 * If already in DROP, then 75/25
Under this proposal, retirees who delay receipt of their benefits could receive a greater
subsidy (but no greater than the benefit provided to retirees with 30 years of service). If the under 65 benefit is not utilized, then the retiree’s cost share is decreased by 2% for each year not utilized after retirement & post 65 benefit is increased to corresponding amount. For example, an employee who retired at age 57 with 25 years of service, who delayed receipt of their benefit to age 62 (5 years) would receive an extra 10 percent subsidy.
This plan also includes a transition schedule for all current employees that pro-rates the
cost share percentage or fixed dollar amount based on the current years of service an active employee currently has and years of service at the time of retirement. The benefit does not become available to current employees until they have 20 years of service at retirement.
10 year Revised Basic Plan – This plan is a revision of the 20 year basic plan that
provides the same basic benefit structure for future employees and requires 20 year vesting. It provides a percentage cost share for retirees under the age of 65 and a fixed dollar amount (indexed to a medical cost inflation factor of 4% annually) for retirees over the age of 65 to apply
Current retiree assumes the maximum benefit of 75/25 or $250.

26
to a Connector Model plan. The dollar amount for the 65 and over benefit are for the individual, therefore a husband and wife would receive twice the amount.
Table 22
10 Year Revised Basic Plan Future Employees
Service <65 Cost Share 65 & Over Dollar Subsidy 20-24 50/50 $ 200 25-29 65/35 $ 225 30+ 75/25 $ 250
10 Year Revised Basic Plan
Current Employees
Transition Schedule
Under Age 65 Benefit Current ------Years of Service at Retirement-------
Transition Schedule 65 and Over Benefit
Service 10/14 15-19 20/24 25/29 30 If Then 0.1-9 25/75 50/50 60/40 65/35 75/25 25/75 $ 125 10 25/75 60/40 65/35 70/30 75/25 35/65 $ 150 11 35/65 60/40 65/35 70/30 75/25 50/50 $ 175 12 35/65 60/40 65/35 70/30 75/25 60/40 $ 200 13 35/65 60/40 65/35 70/30 75/25 65/35 $ 225 14 35/65 60/40 65/35 70/30 75/25 70/30 $ 225 15 X 65/35 70/30 70/30 75/25 75/25 $ 250 16 X 65/35 70/30 70/30 75/25 17 X 65/35 70/30 70/30 75/25 18 X 65/35 70/30 70/30 75/25 19 X 65/35 70/30 70/30 75/25 20-24 X X 70/30* 70/30* 75/25 25-29 X X X 75/25 75/25 30 X X X X 75/25 * If already in DROP, then 75/25
The transition schedule differs from the 20 year in that 10 year vesting rather than 20 year
vesting applies. 5 year Employee Plan – This is a graduated scale retiree health benefit with Medicare
Connector coverage. The basic benefit is based on the years of service starting at 10 years (10 year vesting). It provides a percentage cost share for retirees under the age of 65 and a fixed dollar amount for retirees over the age of 65 to apply to a Connector Model plan. The dollar amount for the 65 and over benefit are for the individual, therefore a husband and wife would receive twice the amount. Future hires would get a 50% subsidy after 10 years, a 60% subsidy
Current retiree assumes the maximum benefit of
75/25 or $250.

27
with 15-19 years and a 70% subsidy for 20 or more years of service. The dollar subsidiary for the Connector model would be $175 after 10 years, $200 with 15-19 years, and a $225 for 20 or more years of service at retirement. As with the previous alternatives the fixed dollar post 65 benefit is indexed to a medical cost inflation factor of 4% annually.
Table 23
5 Year Employee Plan Future Employees
Service <65 Cost Share 65 & Over Dollar Subsidy 10-14 50/50 $175 15-19 60/40 $200
20 70/30 $225
5 Year Employee Plan
Current Employees Transition Benefit for Connector Benefit Current Employees Post 65 Benefit Years of If Then Service Benefit 50/50 $ 175 5-9 50/50 60/40 $ 200 10-14 60/40 70/30 $ 225 15-19 70/30 80/20 $ 250 20-29 80/20 85/15 $ 275 30 85/15
This plan includes a transition schedule for all current employees that pro-rates the cost
share percentage or fixed dollar amount based on the years of service the retiree has. The benefit becomes available at 5 years (5 year vesting).
The cost savings of the three above proposal were calculated by the County’s actuarial
consultants, Bolton Partners, Inc. as follows:
Table 24
Funded Expense Impact (ARC)
8% Discount Rate (in millions)
Current Plan $69.1 Future & Current Retirees Cost $ Savings $ Savings % 20 Yr Basic Plan - Connector 36.9 32.3 46.6% 10 Yr Revised Basic Plan - Connector 42.5 26.6 38.5% 5 Yr Employee Plan - Connector 46.7 22.4 32.4%
Current retiree assumes the maximum benefit of 85/15 or $275

28
Table 25
Funded Expense Impact (AAL)
8% Discount Rate (in millions)
Current Plan $672.7 Future & Current Retirees Cost $ Savings $ Savings % 20 Yr Basic Plan - Connector 405.4 267.3 39.7% 10 Yr Revised Basic Plan - Connector 441.1 231.6 34.4% 5 Yr Employee Plan - Connector 470.1 202.6 30.1%
C. Recommendations
1. Plan Design Changes - Based on the committee’s discussions, including the belief the users of the service should pay for the service, while healthy individuals should be more favorably treated, and in comparison to other jurisdictions the Committee recommends the above plan design changes be adopted. The cost savings from these changes as indicated above total $1.66 million
2. Graduated Scale – Given the value of this benefit and its cost, a graduated
scale similar to that employed for the County’s pension benefit should be implemented. There is inherent fairness in the concept that longer service to the County warrants a greater benefit to the employee.
3. Vesting – a longer vesting requirement is called for, again due to the
significant value and cost of the benefit. The current five year vesting for non-public safety employees is untenable. A twenty year vesting requirement is equitable and is consistent with the current defacto vesting requirement for the public safety units. Given that current employees were hired on the basis of five year vesting, a change to ten year vesting for current employees in a transition plan seems equitable. Some Committee members continue to believe that a ten year vesting plan for new employees is preferable.
4. Connector Model – Offers the prospect of savings to both the County and the
post-65 retiree. The ability to utilize consumer driven healthcare whereby individuals are empowered to select the best healthcare plan for their individual circumstances is a significant improvement to the benefit and should be incorporated in the County’s retiree healthcare benefit. It provides a retiree friendly solution that is sustainable and cost effective.
5. The Ten Year Revised Basic Plan and Connector should be adopted by the
County as it incorporates a graduated scale, results in 20 year vesting for new employees, and provides for a fair transition schedule for current employees.

29
This recommendation incorporates the Graduated Scale, 20 Year Vesting for
new employees, and the utilization of a Connector Model, resulting in a total reduction in the County’s annual required contribution (ARC) of $26.6 million and a reduction in the accrued actuarial liability (AAL) of $231.6 million (both at an 8% discount rate). Similar to recommendation #3 above, some Committee members prefer the Employee 5 Year plan alternative that preserves five year vesting for current employees, while still moving to a graduated scale benefit and utilization of a Connector model. This alternative results in a reduction in the County’s annual required contribution (ARC) of $22.4 million and a reduction in the accrued actuarial liability (AAL) of $202.6 million (both at an 8% discount rate).
6. The one-time deferral of the retiree health benefit should be eliminated so as
to allow greater utilization of non-County healthcare options that may be available to retirees through either subsequent employers of available spousal coverage. A credit schedule to the retiree’s benefit for the non-utilization of the retiree benefit should also be adopted. The savings from this recommendation would be approximately $6.51 million.
7. The pre-65 retiree benefit, in addition to being based on a graduated scale,
should include a provision that ties the dollar amount of the Triple Choice benefit plan to the dollar amount that results from the cost share provision of the HMO plan.
8. Terminated Vested Employees – Given that current employees will
experience a reduction in their current benefit, it is equitable that terminated vested employees experience a benefit adjustment. Accordingly, a 50/50 cost share benefit, regardless of years of service, would apply and no spousal or dependent coverage would be provided.
9. Transfer of service credit for the retiree health plan benefit should be
eliminated for new employees. A transition plan for current employees who have prior State service could be utilized, such as allowing one year credit for each two years of State service or requiring a minimum of 10 or 15 years County service before credit is given for State service.
VI. Anne Arundel County Pension Benefit
A. Benefit Description
The County has established four separate pension plans for various groups of employees, General Employees, Police Officers, Firefighters, and Detention Center Officers and Deputy Sheriffs. All plans require an employee contribution. Plan provisions are subject to collective bargaining for represented employees. The basic terms of the individual plans are presented in the following table:
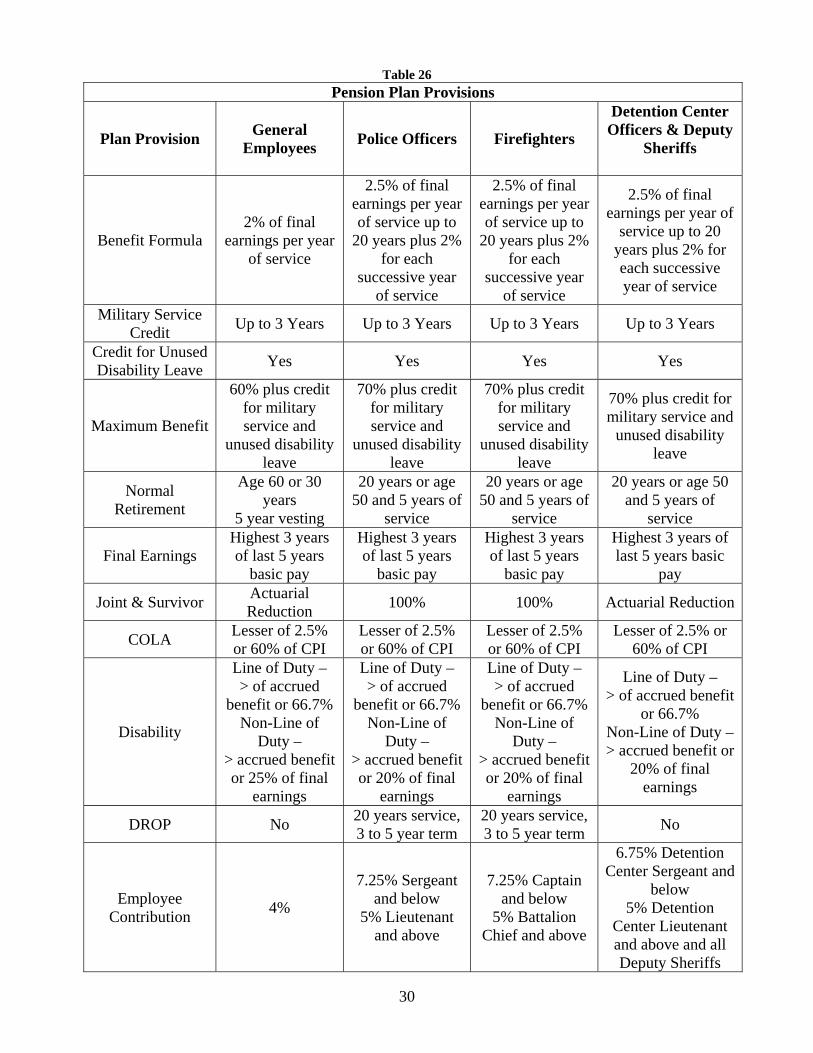
30
Table 26 Pension Plan Provisions
Plan Provision General Employees Police Officers Firefighters
Detention Center Officers & Deputy
Sheriffs
Benefit Formula 2% of final
earnings per year of service
2.5% of final earnings per year of service up to
20 years plus 2% for each
successive year of service
2.5% of final earnings per year of service up to
20 years plus 2% for each
successive year of service
2.5% of final earnings per year of
service up to 20 years plus 2% for each successive year of service
Military Service Credit Up to 3 Years Up to 3 Years Up to 3 Years Up to 3 Years
Credit for Unused Disability Leave Yes Yes Yes Yes
Maximum Benefit
60% plus credit for military service and
unused disability leave
70% plus credit for military service and
unused disability leave
70% plus credit for military service and
unused disability leave
70% plus credit for military service and
unused disability leave
Normal Retirement
Age 60 or 30 years
5 year vesting
20 years or age 50 and 5 years of
service
20 years or age 50 and 5 years of
service
20 years or age 50 and 5 years of
service
Final Earnings Highest 3 years of last 5 years
basic pay
Highest 3 years of last 5 years
basic pay
Highest 3 years of last 5 years
basic pay
Highest 3 years of last 5 years basic
pay
Joint & Survivor Actuarial Reduction 100% 100% Actuarial Reduction
COLA Lesser of 2.5% or 60% of CPI
Lesser of 2.5% or 60% of CPI
Lesser of 2.5% or 60% of CPI
Lesser of 2.5% or 60% of CPI
Disability
Line of Duty – > of accrued
benefit or 66.7% Non-Line of
Duty – > accrued benefit or 25% of final
earnings
Line of Duty – > of accrued
benefit or 66.7% Non-Line of
Duty – > accrued benefit or 20% of final
earnings
Line of Duty – > of accrued
benefit or 66.7% Non-Line of
Duty – > accrued benefit or 20% of final
earnings
Line of Duty – > of accrued benefit
or 66.7% Non-Line of Duty – > accrued benefit or
20% of final earnings
DROP No 20 years service, 3 to 5 year term
20 years service, 3 to 5 year term No
Employee Contribution 4%
7.25% Sergeant and below
5% Lieutenant and above
7.25% Captain and below
5% Battalion Chief and above
6.75% Detention Center Sergeant and
below 5% Detention
Center Lieutenant and above and all Deputy Sheriffs

31
B. Findings
The pension benefit for County employees generally falls above the middle of the pack of surrounding local governments, and is more lucrative than the pension programs of the State of Maryland. The Police Officers and Firefights plans have individual features (100% Joint & Survivor and DROP) that are quite employee friendly. Employee contributions across-the-board are generally below the median, particularly when the benefit provisions are taken into consideration.
The table below shows the present value of the pension benefit demonstrates how
lucrative the County’s pension benefit is.
Table 27
Rate of Return Earned on Employee Pension Contributions
Plan and Retirement Age Years of Service
Employee Contribution Rate
Initial AnnualPension
Present Value of Benefit
Rate of Return Required*
Employee – Age 55 30 Years of Service 4.00% $24,243 $314,080 16%
Police - Age 45 20 Years of Service 7.25% $39,690 $634,126 21%
Fire - Age 50 25 Years of Service 7.25% $47,686 $744,476 17%
Detention - Age 45 20 Years of Service 6.75% $32,919 $486,849 21%
Source: Bolton Partners * The effective annual rate of return required to be earned on an employee’s contributions in order to realize the
present value of the benefit. The County’s pension system is well funded when compared to governmental units in
general, with a funded ratio of approximately 85%. This level of funding, which represents nearly 9% of the General Fund’s general county funding, comes at a price to the taxpayer as the following table shows the calendar year 2010 pension contributions in dollars and as a percent of plan payroll.
Table 28
Pension Plan Contribution Amounts General Police Detention Officers Employees Officers Firefighters & Deputy Sheriffs Total
Employer Contributions $17,284,080 $14,055,660 $14,648,580 $4,907,130 $ 50,895,450
Employer Contributions as a % of Payroll 14.0% 33.1% 30.6% 25.4% 25.2%
Employee Contributions $4,556,815 $2,297,386 $2,494,043 $1,084,820 $10,433,064 Employee Contributions
as a % of Payroll 3.7% 5.4% 5.2% 5.6% 5.2% Source: 2010 CAFR of Retirement & Pension system – pages 85-88

32
It should be noted however, that these contribution amounts are not driven by poor
investment performance. Indeed the County’s investment performance has been quite good, having achieved the 8% actuarially assumed rate of return over the past twenty years.
The above pension contributions for the County are composed of two parts. The first part
is the “normal cost”, which is the cost of the benefit for another year of service. The second part of the cost is the “past service cost” which is the amortization of the previously unfunded component of the benefit. For fiscal year 2012 the breakdown of these costs and other cost adjustments is shown in the table below:
Table 29
Cost Components of Actuarial Contribution
General Police Detention Officers Employees Officers Firefighters & Deputy Sheriffs Total
Normal Cost $10,645,732 $8,994,810 $10,688,840 $2,655,651 $32,985,033
Past Service Cost $6,356,231 $4,035,801 $2,434,655 $1,979,435 $14,806,122
Expenses $482,000 $398,000 $377,000 $77,000 $1,334,000
Total $17,483,963 $13,428,611 $13,500,495 $4,712,086 $49,125,155
8% Interest Cost $1,398,717 $1,074,289 $1,080,040 $376,967 $3,930,012
Total Recommended Contribution $18,882,680 $14,502,900 $14,580,535 $5,089,053 $53,055,167 Source: January 1, 2011 Actuarial Reports
The above pension funding data demonstrates the difference between the County’s funding of its pension obligation and its retiree health obligation. As the above table demonstrates, for the pension obligation the County is annually funding the year’s annual accrual of the benefit for employees (the normal cost) and is funding the past service liability of employees over a thirty year time-frame (past service cost). This situation is significantly different from the retiree health insurance obligation, where the funding is not even meeting the normal cost responsibility (the annual cost of the benefit for the current year), much less making a payment on the unfunded liability (the past service liability). Consequently the overall liability continues to increase annually. On the other hand, because of the County’s pension funding program, the normal cost is funded every year and a payment towards the past service liability is also made, thereby steadily reducing the total past service liability (the Pension System liability is 85% funded). Once the past service liability is funded, the County’s annual funding cost will be able to be reduced as the only cost will be the normal cost component. (See table on next page)

33
Table 30 Pension & Retiree Health Funding
Pension
Budgeted – To Be
Funded in FY2012
FY2012 Actuarial Requirement
Normal Cost 32,985,033 32,985,033 Past Service Cost 14,806,122 14,806,122 Expenses & Interest 5,264,012 5,264,012
Total 53,055,167 53,055,167
FY2012 Actuarial Requirement* Retiree Health
Budgeted – To Be
Funded in FY2012 County Library College Total
Normal Cost 23,384,000 963,000 1,328,000 25,675,000 Past Service Cost 39,962,000 1,402,000 2,110,000 43,474,000
Total 27,469,000 63,346,000 2,365,000 3,438,000 69,149,000
PayGo Cost 24,793,000 1,187,000 1,489,000 27,469,000 *Determined using 8% discount rate, CAFR Uses 4% rate
Some of the current provisions of the County’s pension plan present inconsistent policy objectives. On the one hand the public safety plans all offer a generous option for the employee to retire after 20 years of service and immediately begin to collect a 50% retirement benefit. The justification for this policy is that these positions require a great deal of physical effort and mental stress. On the other hand, the County offers police officers and firefighters the option of a Deferred Retirement Option Plan (DROP), whereby an individual can “retire” (the retirement benefit is frozen at the current amount) and continue to work for up to five additional years. While the employee continues to work, their retirement benefit is paid into an account that currently earns a guaranteed 4.25% interest. Consequently an employee who stays in the DROP program can accumulate a substantial nest egg (often times in excess of $250,000) when he/she finally leave active service. The justification for the DROP program is that it provides an incentive for experienced employees to remain with the County. From an overall cost standpoint to the County, it is advantageous for an employee to work longer rather than retire, as the incremental pension and retiree health benefits earned cost less than the payment of the retiree pension and health benefit.
In recognition of this inconsistency, the Committee examined the cost savings from
increasing the normal retirement provision for the Police and Fire pension plans from 20 years to 25 years or age 55 with ten years service. The cost savings, totaling nearly $3.5 million, are displayed below:

34
Table 31
Moving from 20 Years to 25 Years of Service for Public Safety Normal Retirement
20 Years Service
January 2011 Valuation 25 Years Service
Cost Savings Cost % Pay Cost % Pay Cost % Pay
Police Plan $ 14,502,900 34.2% $ 12,817,978 30.2% $1,684,922 4.0% Fire Plan $ 14,580,535 30.5% $ 13,162,141 27.5% $1,418,394 3.0%
Detention/Sheriff $ 5,089,053 26.4% $ 4,746,130 24.6% $ 342,923 1.8% Total $ 34,172,488 $ 30,726,249 $3,446,239
Additionally, an unusual and expensive provision of the Police and Fire plans is the 100% Joint and Survivor benefit. The cost savings, $5 million, from modifying this provision to an actuarially reduced benefit for the spousal survivor benefit is shown below:
Table 32
Moving from 100% Joint & Survivor Benefit to Actuarially Reduced Benefit
January 2011 Valuation J&S Elimination Savings Cost % Pay Cost % Pay Cost % Pay
Police Plan $ 14,502,900 34.2% $ 12,289,666 29.0% $2,213,234 5.2% Fire Plan $ 14,580,535 30.5% $ 11,762,046 24.6% $2,818,489 5.9%
Total $ 29,083,435 $ 24,051,712 $5,031,723 As previously mentioned any change in retirement benefits presents legal issues and must be negotiated with the respective bargaining units.
Finally, the provision dealing with the employee contribution to the various public safety plans presents an inequity in that the plan benefits are the same for all members of the plan, yet under current conditions, some employees are paying a discount for the same benefit. This situation was created by the requirement to negotiate pension contributions with each bargaining unit and the number of different bargaining units that participate in the public safety pension plans.
C. Recommendations 1. Consistency in employee contributions – Given that the benefit for participants
in individual pension plans is the same for all participants, it would be logical that all participants in a plan pay the same percentage of pay. The cost savings from bringing all members to the higher level or contributions of the plans in question are shown below:
Table 33
Savings from Uniform Pension Plan Contributions Applicable Rate Savings
Police Plan 7.25% $ 124,851 Fire Plan 7.25% $ 108,831
Detention/Deputy Sheriff Plan 6.75% $ 84,983 Total $ 318,665
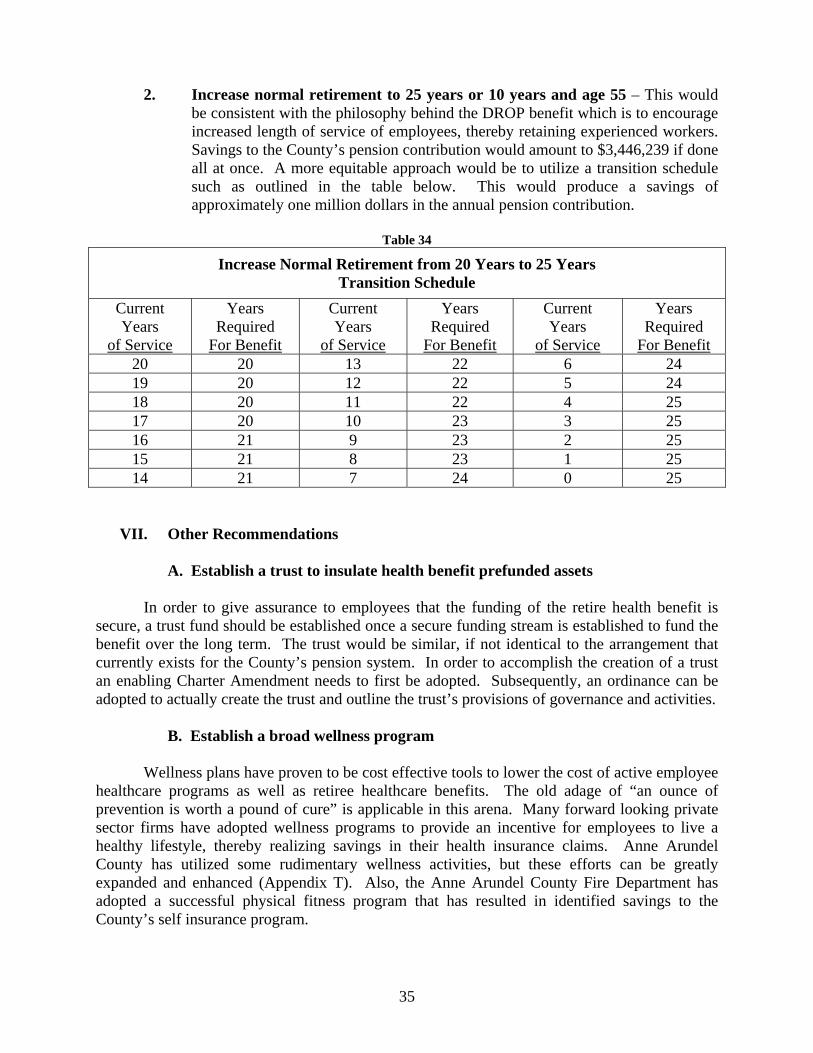
35
2. Increase normal retirement to 25 years or 10 years and age 55 – This would
be consistent with the philosophy behind the DROP benefit which is to encourage increased length of service of employees, thereby retaining experienced workers. Savings to the County’s pension contribution would amount to $3,446,239 if done all at once. A more equitable approach would be to utilize a transition schedule such as outlined in the table below. This would produce a savings of approximately one million dollars in the annual pension contribution.
Table 34
Increase Normal Retirement from 20 Years to 25 Years Transition Schedule
Current Years
of Service
Years Required
For Benefit
Current Years
of Service
Years Required
For Benefit
Current Years
of Service
Years Required
For Benefit 20 20 13 22 6 24 19 20 12 22 5 24 18 20 11 22 4 25 17 20 10 23 3 25 16 21 9 23 2 25 15 21 8 23 1 25 14 21 7 24 0 25
VII. Other Recommendations
A. Establish a trust to insulate health benefit prefunded assets In order to give assurance to employees that the funding of the retire health benefit is secure, a trust fund should be established once a secure funding stream is established to fund the benefit over the long term. The trust would be similar, if not identical to the arrangement that currently exists for the County’s pension system. In order to accomplish the creation of a trust an enabling Charter Amendment needs to first be adopted. Subsequently, an ordinance can be adopted to actually create the trust and outline the trust’s provisions of governance and activities.
B. Establish a broad wellness program Wellness plans have proven to be cost effective tools to lower the cost of active employee healthcare programs as well as retiree healthcare benefits. The old adage of “an ounce of prevention is worth a pound of cure” is applicable in this arena. Many forward looking private sector firms have adopted wellness programs to provide an incentive for employees to live a healthy lifestyle, thereby realizing savings in their health insurance claims. Anne Arundel County has utilized some rudimentary wellness activities, but these efforts can be greatly expanded and enhanced (Appendix T). Also, the Anne Arundel County Fire Department has adopted a successful physical fitness program that has resulted in identified savings to the County’s self insurance program.

36
C. Create a permanent benefits committee Because of the importance of benefits in the personnel equation and the significance of their cost in the County’s operating budget, continuous attention should be focused on this area. A cross-functional committee should be established to formally monitor and review the County’s benefit structure, funding, and performance. The Committee should include membership from the County’s component units (Board of Education, Community college and the Library system) as well.
D. Develop a Strategic Plan
In order to continue the momentum of dealing with County benefits a strategic plan should be developed to include immediate, intermediate and long range milestones so as to keep a focus on this important aspect of County compensation and cost. Such a plan would consist of the following components: Immediate Actions (Present to One Year)
1. Formalize a permanent Benefits Committee 2. Implement plan design changes 3. Commence education program for Connecter Plan for post-65 retirees
(Appendix U) 4. Develop RFP for Connection Plan 5. Establish mechanism for the formation of a Trust for managing pre-
funding assets (Charter Amendment) 6. Initiate discussions with component units to result in collaboration
over entire benefit spectrum to result in comparative benefits and cost savings from economies of scale
Intermediate Actions (One to Three Years)
1. Initiate Connector Plan 2. Monitor and evaluate public and private sector benefit developments 3. Negotiate changes to current health care cost shares with employee
organizations 4. County Council to provide a written policy statement with details
including the degree of merging or commonality of benefits between component units
5. Implement component unit cost savings from collaborative efforts 6. Undertake a new hire pension benefit study 7. Monitor PPACA developments, evaluate changes and make
adjustments in County benefits accordingly 8. Evaluate utilization of an insurance exchange for pre-65 retirees with
2014 implementation of exchanges under PPACA 9. Develop an enhanced Wellness Program, to include possibility of
establishing a third party clinic for County employees and retirees 10. Commence funding of retiree heath benefit trust

37
Long Term Actions (Three Years and Beyond)
1. Assure funding of the retiree benefit trust such that annual contributions will fully fund obligation by 2045
2. Consider ways to provide for self adjusting programs to provide a balance between protecting benefits and controlling cost
3. Evaluate and adjust health benefits and wellness program as environment changes
VIII. Conclusion The primary focus of the Committee is to develop a retiree heath benefit and funding mechanism in order to insure that the County can deliver on its promise to employees. As detailed in this report the current benefit, at an 8% discount rate has a cost of $69.16 million annually. Currently the County is funding its retiree health insurance obligation on a PayGo basis which requires $21 million for FY2012. Thus there is a $48.16 million “hole” in the County’s funding program for this benefit, which is resulting in an ever increasing overall liability, which annually increases the annual funding requirement. The recommendations in this report are designed to either lower the cost of the retiree health benefit or lower the cost of other benefit programs (current employee heath insurance and pension plan) so as to free up existing County funds so that they can be applied to fund the retiree health benefit on a permanent basis. The alternatives are summarized on the Table 35 on the next page.
The $48.16 million “hole” in the County’s funding of retiree health benefit is plugged if all of the “High” recommendations were to be implemented, while 80% of the “hole” is dealt with if the “Low” recommendations were to be implemented. It is understood that some can be implemented relatively quickly (changes to the retiree health insurance benefit), and others will require more time as they are subject to collective bargaining (employee cost sharing and pension changes). However, this report serves as a blueprint to accomplish the goal of putting the County’s retiree health insurance benefit on a sound fiscal foundation.
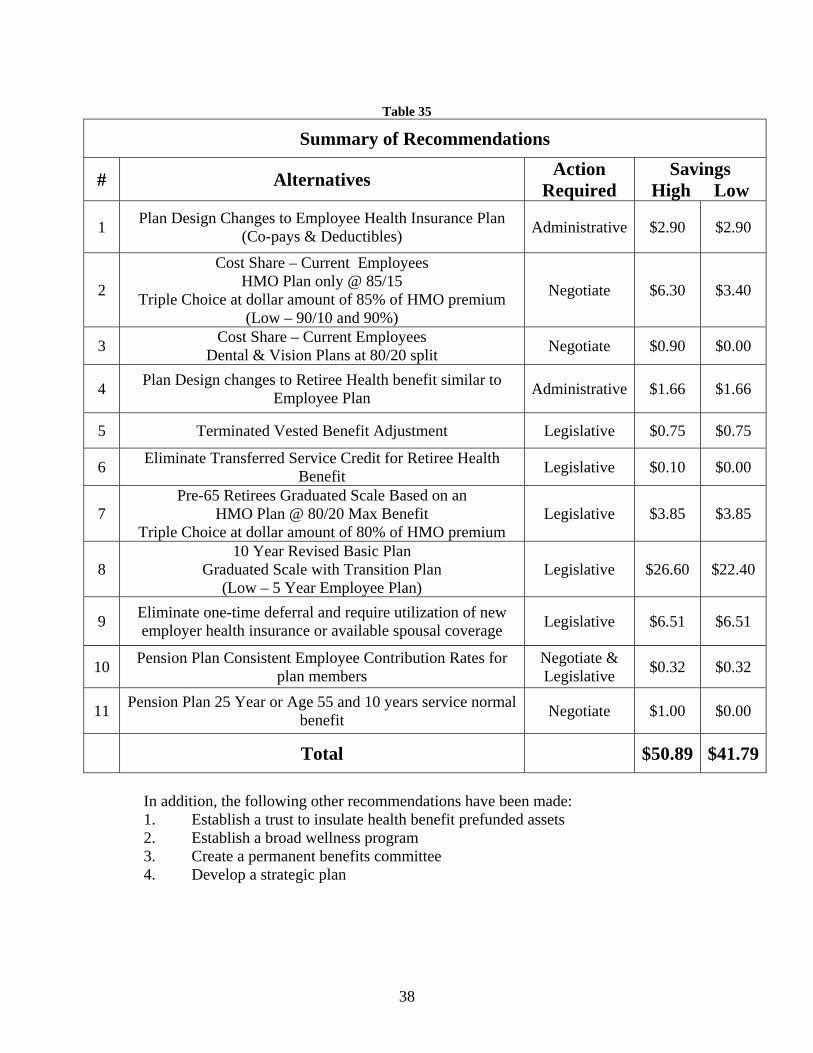
38
Table 35
Summary of Recommendations
# Alternatives Action Required
Savings High Low
1 Plan Design Changes to Employee Health Insurance Plan (Co-pays & Deductibles) Administrative $2.90 $2.90
2
Cost Share – Current Employees HMO Plan only @ 85/15
Triple Choice at dollar amount of 85% of HMO premium (Low – 90/10 and 90%)
Negotiate $6.30 $3.40
3 Cost Share – Current Employees Dental & Vision Plans at 80/20 split Negotiate $0.90 $0.00
4 Plan Design changes to Retiree Health benefit similar to Employee Plan Administrative $1.66 $1.66
5 Terminated Vested Benefit Adjustment Legislative $0.75 $0.75
6 Eliminate Transferred Service Credit for Retiree Health Benefit Legislative $0.10 $0.00
7 Pre-65 Retirees Graduated Scale Based on an
HMO Plan @ 80/20 Max Benefit Triple Choice at dollar amount of 80% of HMO premium
Legislative $3.85 $3.85
8 10 Year Revised Basic Plan
Graduated Scale with Transition Plan (Low – 5 Year Employee Plan)
Legislative $26.60 $22.40
9 Eliminate one-time deferral and require utilization of new employer health insurance or available spousal coverage Legislative $6.51 $6.51
10 Pension Plan Consistent Employee Contribution Rates for plan members
Negotiate & Legislative $0.32 $0.32
11 Pension Plan 25 Year or Age 55 and 10 years service normal benefit Negotiate $1.00 $0.00
Total $50.89 $41.79
In addition, the following other recommendations have been made: 1. Establish a trust to insulate health benefit prefunded assets 2. Establish a broad wellness program 3. Create a permanent benefits committee 4. Develop a strategic plan

Minority Report


Collaborative Benefits Committee
Minority Report
February 7, 2012
Some members of the Collaborative Benefits Committee are not supportive of the scope of change recommended in the committee’s final report as it conflicts with the fairness principal included in the September 16, 2011 County Council resolution establishing this study group.
The committee members objecting to the pace of change outlined in this report include
Public Safety, AFSCME and Hourly Non-Represented leaders (“employee stakeholders”). The need to examine the cost of active and retiree benefits is fully understood and supported by the employee stakeholder groups. Many concepts and changes in this report are acceptable to employee stakeholders and in fact have been originally proposed by the dissenting employee stakeholder members. Specifically, the employee stakeholder members of this committee agree with the following recommendations put forth by the committee at large:
Table 35
Summary of Recommendations
#
Alternatives Action
Required Savings
High Low
1
Plan Design Changes to Employee Health Insurance Plan (Co-pays,& Deductibles)
Administrative
$2.90
$2.90
3
Cost Share – Current Employees Dental & Vision Plans at 80/20 split
[provided that plan design enhancements are made in connection with a competitive bidding (RFP) process
for these services]
Negotiate
$0.90
$0.00
4 Plan Design changes to Retiree Health benefit similar to
Employee Plan
Administrative
$1.66
$1.66
The employee stakeholder groups remain an open and interested party to this important discussion. However, the employee stakeholders desire a balanced approach to a sustainable level of benefits for both active and retired County employees that is fair to all current employees and affordable for the County. The magnitude of change proposed in this report is not acceptable to employee stakeholders without additional thoughtful discussion and analysis. Recommended action item #8 below is the best example of the need for more discussion and review as it does not provide for any grandfather provisions for current long term employees.
39

Specifically, the employee stakeholders represented on this committee cannot give endorsement at this time to the following recommendations put forth by the committee at large:
Table 35
Summary of Recommendations
#
Alternatives Action
Required Savings
High Low
2
Cost Share – Current Employees HMO Plan only @ 85/15
Triple Choice at dollar amount of 85% of HMO premium (Low – 90/10 and 90%)
Negotiate
$6.30
$3.40
5
Terminated Vested Benefit Adjustment
Legislative
$0.75
$0.75
6 Eliminate Transferred Service Credit for Retiree Health Benefit
Legislative
$0.10
$0.00
7
Pre-65 Retirees Graduated Scale Based on an HMO Plan @ 80/20 Max Benefit
Triple Choice at dollar amount of 80% of HMO premium
Legislative
$3.85
$3.85
8
10 Year Revised Basic Plan (Graduated Scale with Transition Plan)
(Low – 5 Year Employee Plan)
Legislative
$26.60
$22.40
9
Eliminate one-time deferral and require utilization of new employer health insurance or available spousal coverage Legislative $6.51 $6.51
10 Pension Plan Consistent Employee Contribution Rates for
plan members Negotiate & Legislative
$0.32
$0.32
11 Pension Plan 25 Year or Age 55 and 10 years service normal
benefit
Negotiate
$1.00
$0.00
Total
$50.89
$41.79
The employee stakeholder groups have participated in past committees (2002, 2005 and 2008 Health Insurance Fund Committee) created to examine the cost of health benefits and/or GASB obligations for our County. As a major participant in the County’s benefit plans, the employee stakeholders are a willing participant in these workgroups and seek value for the County and its employees regarding the funding for benefits. However, the spirit of past employee benefit committees as well as this 2011 Collaborative Benefits Committee is to solve the fiscal issues presented by the cost of benefit plans with simple cost shifting to the County’s employees, and not by the utilization of progressive employee benefit management techniques. The past and proposed benefit reductions via cost shifting are damaging to the County’s long term employees and are often deployed with little consideration for the impact that such changes have on an employee’s total compensation position.
40

A full and complete total compensation study has not been part of this committee’s work. Such a study would place values on the salary, paid time off, health (active and retiree) and pension benefits for County employees versus other local counties. Some basic salary and benefit comparisons have been constructed but they are each either limited, incomplete or inaccurate. Some counties are included as peers such as Harford County and Calvert County when they are clearly not peers of our county at all. An example of the benchmarking inaccuracy is the comparison to Baltimore County’s health benefits. The plans included in the comparison are for post 7/1/2007 employees only. The more generous benefits for the grandfathered pre 7/1/2007 employees are omitted entirely from the comparison. The Federal Employees’ plans are utilized in the health benefits comparison but only 2 out of 21 federal health options for Marylanders are included in the analysis. Employee contributions for each county are shown as a percentage of premiums but not as dollar amounts. Without values assigned to each current benefit (salary, active heath, retiree health and pension) for the peer group the comparisons are of limited value and lead to inaccurate conclusions about our total compensation relativity. It is highly doubtful that County employees today are middle of the pack on total compensation. With the implementation of each recommended change, Anne Arundel County employees (but not BOE) will fall further and further below the peer group in total compensation. This outcome would clearly violate the Collaborative Benefits Committee’s stated principle to position our benefit plans in the middle of the pack of the peer group.
Isolated comparative references in the final report to private sector benefits are of little
value when private sector salaries and bonuses are not also included. We suggest the private sector is not a fair total compensation comparison at all since unique County jobs like public safety do not exist in the private sector.
Some background on cost shifting to County employees is required as we consider the
next set of benefit changes. Prior to 2003, the County’s rich PPN health plan was available at a 97/3% split and HMO’s were 100% County funded for public safety employees. Reductions and changes to the County subsidy and available plans for health insurance in 2003, 2004, 2005 and 2006 diminished the previous 97/3% contribution split to 80/20% for the less rich PPO style plan (Triple Choice) and 90/10% for HMO options. These reductions in the County’s subsidy and benefit levels for health insurance had a dramatic impact on an employee’s take home pay and out of pocket expenses. Further proposed reductions in the contribution split would be in direct conflict with the County Council’s September 16, 2011 resolution from the fairness concept it espoused. It would be inappropriate to shift additional payroll contribution costs for health care on the heels of County employee furloughs and/or -5% on average pay cuts that saved the County (and cost the employees) about $21M over the past two years.
Employee stakeholders understand the rapid rise in the cost of healthcare over the past
decade. They understand how that drove the need to find solutions to the long term fiscal problem of healthcare, but they are dismayed that the solution is always rooted in shifting a greater percentage of the cost from the County to its employees. The dramatic increase in employee contributions noted above came about without a strategic employee benefits plan being developed by the County. How can the County continue to ask its employees to consistently pay more for their benefits without any formal strategic benefits plan in place? If benefits are roughly 21% of the County’s budget, why hasn’t a short term and long term benefits strategy
41
been developed by the County? Why have savings from a decade of cost shifting from the County to its employees not been utilized to begin formal funding of the GASB 45 OPEB obligation that was identified in 2004 (see Labor Coalition memos from 2006 & 2007)? The employee stakeholder members of this Collaborative Benefits Committee respectfully request that the pattern of cost shifting from the County to the employees ends while the committee’s recommended strategic approach to employee benefits is adopted by the County. We support this committee’s recommendation to develop a strategic plan moving forward but ask that major benefit changes to our current benefits configuration be put on hold until we reach consensus on a strategic plan and better understand the impact of the Federal PPACA law.
This committee has steadfastly refused to discuss grandfathering retiree health provisions
for long term County employees. We understand that the County may have to offer a different set of benefits to newly hired employees due to the cost of post retirement benefits. This approach over time will address the GASB issue. But current employees, who have worked for the county for 5, 10 and 15 years or more with the understanding that they had a certain compensation package, should not lose the benefits they have earned. It is unfair to now radically change this approach midway through an employee’s career of government service. The committee members supporting this minority report feels strongly that the absence of any grandfathering provisions fails the fairness principle espoused by the overall committee. Many local government entities in Maryland like Baltimore County (peer group) and the Anne Arundel County Board of Education have used grandfathering concepts when making dramatic benefits changes affecting long term employees. This is particularly true regarding post retirement benefits.
The County’s employee benefit plans are an important investment in the County’s
Human Capital. All stakeholders in these benefit plans need to feel confident that the County is getting a fair value for the considerable sum it spends on benefits and a return on the investment in its Human Capital. We should maximize the value received for our benefits dollars, not just look to minimize costs. For example, a well designed wellness program funded with incentives for employee participation will yield a positive return for the County in future years. Other progressive employers begin sophisticated wellness programs over a decade ago because of the positive impact on future health costs and productivity. A healthy, productive employee work force is a value to the citizens of our county. A prudent and well managed benefits program for our entire workforce, including the Board of Education, can put the County on the right long term financial path.
The employee stakeholders have retained a national benefits consulting firm (CBIZ) to
evaluate the health benefits program and to offer input regarding the structure of the County’s health plans. CBIZ was permitted to present its ideas and concepts to the Collaborative Benefits Committee in November 2011. The basic premise of the high level CBIZ input on the County’s benefits is closely aligned with a 2011 report on public sector health care costs from Colonial Life sponsored by the Government Finance Officers Association (GFOA). Essentially, CBIZ and the Colonial Life report highlight that Anne Arundel County has historically not utilized proven strategies to control the rise of health care costs except for merely cost shifting to employees.
42

The CBIZ and the Colonial Life/ GFOA Report itemized leverage points available to the County that would provide a more superior approach to managing the benefit plans than exists today. Briefly, the seven ROI All-Stars in the report are:
• Utilize on-site health clinics • Review variable premium contributions • Add high deductible health plans with H.S.A. accounts • Add/expand wellness programs • Use self insurance • Use Cooperative Purchasing • Add value based plan design concepts
These leverage points have been widely available for at least 5 years or more yet the
County has only utilized two of the seven recommendations. The employee stakeholders ask that the ongoing benefits committee suggested in the final committee report evaluate and analyze these important and cost effective leverage points before the Collaborative Benefits Committee recommends major changes to our current benefit plans.
The Cooperative Purchasing point above likely represents a solid near term cost control
opportunity for the County. Historically, the County’s record on managing the fees and performance of the employee benefit vendors has been mediocre at best. Requests for Proposals have not been routinely conducted every 3-5 years and generally do not include the Board of Education’s (BOE) plans. Yet, due to the advantage of larger volumes and economies of scale, the Anne Arundel Community College has been part of the County plans. When RFP’s have been conducted for the government and college plans, they have produced positive financial results for the County (Pharmacy RFP 2008). With the additional volume of the BOE plans, the County could have gained substantial financial results over the past decade without shifting costs to the employees. There could have also been substantial administrative and communications savings realized by cooperative purchasing without shifting costs to the employees. Since the premise behind the County Council’s resolution is the unsustainable trend of future health care costs for the County, we ask for the development of a strategic plan that over time brings the BOE plans into alignment with the County government plans. It is inherently unfair to ask a teacher to contribute 4% of a health plan’s cost and a public safety employee to pay 20% of a similar health plan. The County’s fiscal concerns cannot be addressed without consideration of the BOE benefit plans as the BOE funding makes up 51% of the County’s FY2012 budget.
One of the points made by CBIZ during their presentation focused on opportunities for
the County to save health care dollars in the post retiree health program. Progressive employers over the past decade have moved away from +65 retiree medical supplement plans such as the one in place at the County today. Other employers, including governments, have made use of Group Medicare Advantage plans to deeply reduce the cost of retiree health care while giving retirees better benefits. Part D pharmacy plans (PDP plans) and EGWPs have also been successful used to reduce the cost of retiree health plans. None of these successful retiree plan management changes have been utilized by the County during our era of cost shifting and GASB obligations. Nor have they been fully vetted by this committee.
43

CBIZ also noted, with the stakeholders support, that a Medicare Connector plan for post 65 retirees could be a win for all parties associated with retiree health care. In fact, the savings in item 8 from the list of recommended changes generates over $22M in savings related in part to the use of the connector concept for current and future retirees. The dissenting members of the Collaborative Benefits Committee remain open to this concept after it is more fully studied and compared to the other post 65 retirement options that could replace the current plan and the County’s 80% funding.
The three employee stakeholder members to the Collaborative Benefits Committee are in
agreement with short term changes to the active and retiree plan designs as noted above and to the potential introduction of the connector approach for post 65 retiree benefits. These plan changes will generate deep savings for the County in 2013 and beyond while also reducing the GASB obligation over $200M. Future benefit changes that may further reduce the rate of growth in health care costs are also likely to come out of the new benefits committee and the development of a long term strategic benefits plan for Anne Arundel County. It is a thoughtful long term strategy that considers total employee compensation that we favor over the simple and damaging employee cost shifting of the past eight years. It is our premise that we move forward with diligence on these important benefit issues and with an appreciation of all that the long time County employees have done to make this County a great place to live and work.
44

Appendix A
Resolution 50-11


COUNTY COUNCIL OF ANNE ARUNDEL COUNTY, MARYLAND
Legislative Session 2011, Legislative Day No. 32-11
Resolution No. 50-11
Introduced by Mr. Ladd, Chairman (by request of the County Executive)
and The Entire Council
By the County Council, September 6, 2011
RESOLUTION establishing a Collaborative Study Group to review existing employment and post-employment benefits provided by Anne Arundel County and assess the impact of and make recommendations on the continued increase in the costs of such benefits
1 2 3 4 5 6 7 8 9
10 11 12 13 14 15 16 17 18 19 20 21 22 23 24 25 26 27 28 29 30 31 32 33 34 35
WHEREAS, the costs to Anne Arundel County of providing employment and post-employment benefits are increasing at rates that exceed projected rates of increase in County revenues on both a short-term and long-term basis; and WHEREAS, the continuing national, regional, and local economic recession has dramatically reduced the amount of County tax revenues generally and thus limited the amount of revenue that can be appropriated to the current costs as well as future liabilities for such benefits; and WHEREAS, such limitations have resulted in a structural deficit in the Anne Arundel County budget that has adversely affected the ability of the County to make the Annual Required Contribution under Government Accounting Standards Board Statement No. 45; and WHEREAS, the implementation of changes in Federal health care law will significantly affect the cost of health care services and the manner in which those services are administered, paid for and delivered; and WHEREAS, there is an immediate necessity for representatives of the Executive and Legislative Branches of County government to work collaboratively with representatives of bargaining units of County employees as well as non-represented County employees to develop short-term and long-term priorities and recommendations to address the costs to the taxpayers of Anne Arundel County and to the employees of Anne Arundel County of providing employment and post-employment benefits; and WHEREAS, such a collaborative effort should include a factual comparison of Anne Arundel County employment and post-employment benefits with those benefits provided by the State of Maryland and other local governments and governmental units as well as the utilization of such comparison in the development of options, plans, and modifications that can control costs and fairly allocate risk over time; and A – 1

Resolution No. 50-11 Page No. 2
1 2 3 4 5 6 7 8 9
10 11 12 13 14 15 16 17 18 19 20 21 22 23 24 25 26 27 28 29 30 31 32 33 34 35 36 37 38 39 40 41 42 43 44 45 46 47
WHEREAS, utilization of such a comparison in the formulation of options, plans, and recommendations can help ensure that Anne Arundel County will remain competitive in its efforts to hire and retain competent employees, while funding such benefits on a structurally sound basis in current and future budgets; now, therefore be it
Resolved by the County Council of Anne Arundel County, Maryland, That it endorses the creation of a Collaborative Study Group (the “Group”) to review existing employment and post-employment benefits provided by Anne Arundel County and assess the impact of and make recommendations on the continued increase in the costs of such benefits; and be it further Resolved, that the Group shall be charged to: 1. review existing employment and post-employment benefits provided by Anne Arundel County; 2. assess the impact of the continued increase in the costs of the benefits on current and projected revenues and expenditures in the Anne Arundel County Budget; 3. determine fair and equitable priorities in the reduction of the benefit costs, ensuring that such benefits are fair to employees, retirees, and taxpayers of Anne Arundel County and can be funded on a fiscally sustainable basis; and 4. report to the County Executive and County Council their recommendations on fair and equitable reduction of continued benefit costs and; and be it further Resolved, that the Group shall consist of: 1. three members of the County Council, not more than two of whom shall be of the majority party, selected by the Chairman of the County Council; 2. three representatives of the Executive Branch of County government, one of whom shall be the Budget Officer, and one of whom shall be the Personnel Officer and the other of whom shall be selected by the County Executive; and 3. three representatives of the employees of Anne Arundel County, one of whom shall be a representative of public safety employees selected by the bargaining units representing public safety employees, one of whom shall be a representative of non-public safety employees who are represented by a bargaining unit selected by the bargaining units representing non-public safety employees, and one of whom shall be a representative of employees who are not members of a bargaining unit selected by the current Representative of the non-represented employees; and be it further Resolved, that the Group shall be provided with technical and staff support from the Budget Office and the Personnel Office; and be it further
A – 2

Resolution No. 50-11 Page No. 3
1 2 3 4
Resolved, that the Group shall hold its initial meeting as soon as practicable after passage of this Resolution, submit an interim report to the County Council and County Executive no later than October 31, 2011, and submit a final report and recommendations no later than December 31, 2011. READ AND PASSED this 6th day of September, 2011
By Order:
Elizabeth E. Jones Administrative Officer I HEREBY CERTIFY THAT RESOLUTION NO. 50-11 IS TRUE AND CORRECT AND DULY ADOPTED BY THE COUNTY COUNCIL OF ANNE ARUNDEL COUNTY. Richard B. Ladd Chairman
A – 3


Appendix B
GFOA White Paper – Containing Health Care Costs


Proven strategiesfor success in the public sector
ContainingHealth Care Costs
Government FinanceOfficers Association
B – 1

The cost of employee health-care benefits has increased rapidly over recent years, contribut-ing to the budgetary stress that governments are already facing as a result of declining orstagnant revenues and escalating costs in other areas. While public employers are underpressure to contain employee benefit costs, they are also motivated to provide benefits thathelp them maintain a healthy and productive workforce and attract the best employees to pub-lic service.
The GFOA, with a grant from Colonial Life, conducted independent research to identify themost innovative and effective strategies local governments can employ to meet the dual goalsof containing costs and managing the quality of employee health-care benefits. Our studyincluded a survey of GFOA members, case studies, and secondary sources. The findings andresulting publication were reviewed and approved by an independent panel of GFOA mem-bers who are experienced in employee benefit management.
We found that public employers have a range of potential strategies available, each of whichrelies on different underlying approaches to containing costs and preserving benefit quality.For example, wellness programs reduce employees’ need for costly medical interventions andincrease quality of life by focusing on preventative strategies like nutrition and fitness. Onsiteclinics direct public employees toward a low-cost provider while increasing accessibility tocare. High deductible health plans have the potential to significantly reduce employer premi-ums by introducing a consumer approach into employees’ decisions about how they use theirhealth benefit, while putting more money in the pockets of employees through a health sav-ings account.
Of course, a change to health benefits can be an emotional and potentially controversial topicbecause it can affect the well-being of employees and their families. This report also providesadvice for considering which strategies to pursue. It also suggests ways of building support forthe selected strategies among elected and appointed officials and public employees.
It is our hope that public officials are able to use this report as they consider ways to managecosts and maintain effective benefit programs for their employees.
Anne Spray KinneyDirector, Research and Consulting CenterGovernment Finance Officers Association
Patrick McCulloughAssistant Vice President, Public Sector Practice LeaderColonial Life
Foreword
B – 2

This paper is a product of a partnership between GFOA and Colonial Life. You can learn more about the GFOA at www.gfoa.org.Colonial Life is a market leader in providing insurance benefits for public-sector employees and their families through the workplace. You can learn more about Colonial Life at www.coloniallife.com.
This paper was written by Shayne C. Kavanagh, Senior Manager of Research for the GFOA’s Research and Consulting Center inChicago, Illinois. He can be reached at [email protected].
GFOA would like to recognize the following individuals for contributing their experiences to our research case studies:John D. Sullivan, Director of Risk Management and Purchasing, Anoka County, MinnesotaRandy Hutchison, Finance Director, Bexar Appraisal District, TexasJohanna Ray, MPH, ACE, Health and Wellness Manager, Cabarrus County, North CarolinaDarin Schulz, Director of Finance, Chautauqua County, New YorkSusan Iverson, Director of Finance and Administrative Services, City of Arden Hills, MinnesotaVictoria A. Runkle, Finance Director, City of Arvada, ColoradoCheryl Walker, Health and Wellness Manager, City of Asheville, North CarolinaGeorge M. DeHority, CPA, CGFM, Finance Director, City of Havre de Grace, MarylandRick DeOrdio, Benefits Supervisor, City of Irving, TexasMax S. Duplant, Chief Financial Officer, City of Irving , TexasZ. Ike Obi, Strategic Resources Administrator, City of Irving , TexasHeather Hunter, MBA, Finance Director, City of Lewiston, MaineThe City of Ludington, Michigan Don Simons, Director of Finance, City of Mesquite, TexasJames A. Hanson, CPA, Director of Finance, City of Montgomery, OhioMichael A. Hermanson, CPA, Pension and Benefits Administrator, City of Tucson, ArizonaCarolyn Williams, Benefits Manager, Clackamas County, OregonLinda D. Quinley, Chief Financial Officer, Columbia Public Schools, MissouriSusan Vinson, CPA, Director of Finance, Corpus Christi Regional Transportation Authority, TexasCarol L. Caviness, C.E.B.S., Assistant Director, Elkhart County Personnel Office, Elkhart County, IndianaThomas P. Durkin, CPA, Chief Financial Officer, Lackawanna County, PennsylvaniaNelia Larson-Mann, SPHR, CBP, Manager, Employee Benefits & Risk Management, Loudoun County, VirginiaKristi Kordus, Finance Director, Marathon County, WisconsinRhonda Foster, S.P.H.R., Human Resources Director, Monroe County Government, IndianaRobert M. Bendzick, CPA, CGFM, Chief Financial Officer, Olmsted County, MinnesotaDave Sherden, Benefit Coordinator, Olmsted County, MinnesotaSusan Smith, Executive Director, Texas Municipal League Intergovernmental Employee Benefits PoolMichael W. Griffin, Clerk-Treasurer, Town of Highland, IndianaWilliam St. Amour, President, Cobalt Community Research
GFOA would like to recognize the following individuals for the review and guidance of the research:Catherine Walker, Assistant Chief Executive Officer, Alameda County Employees Retirement AssociationBarbara Avard, Administrator, Charlotte Firefighters Retirement System, North CarolinaPatsy K. Cantrell, Administrator, Retiree Health Care Systems, City of Farmington, MichiganChristopher Morrill, City Manager, City of Roanoke, VirginiaCarolyn H. Glover, Director of Human Resources, City of Roanoke, VirginiaMichael A. Hermanson, CPA, Pension and Benefits Administrator, City of Tucson, ArizonaJ. Virgil Moon, CPA, Support Services Director, Cobb County, GeorgiaPatrick McCullough, Assistant Vice-President, Public Sector Practice Leader, Colonial Life InsuranceBarrie Tabin Berger, Assistant Director, GFOA’s Federal Liaison Center Anne Kinney, Director, Research and Consulting, GFOA's Research and Consulting CenterChristopher S. Sears, Partner, Ice Miller LLPKate Clarke Buch, Finance Director, Town of Darien, ConnecticutMarcy Boggs, Managing Editor, GFOA’s Research and Consulting Center
The survey research was conducted using www.surveymethods.com.
Credits
B – 3
CONTENTS
Introduction ..............................................................................................................................................1The Leverage Points of Health Benefit Cost Management......................................................................2
1. Change Level of Benefit Provided ..........................................................................................22. Manage Participants’ Choice of Providers ..............................................................................33. Share Cost with Employees ....................................................................................................44. Reduce Employees’ Use of Health Care Services ..................................................................65. Right-Source Health Benefit Services ..................................................................................126. Maximize the Value Received for the Health Care Dollar ....................................................15
From Ideas to Action ..............................................................................................................................17Considering Strategies ..............................................................................................................17
Building Support ....................................................................................................................................18Conclusion..............................................................................................................................................20Appendix 1..............................................................................................................................................21Notes ......................................................................................................................................................23
Copyright 2011 by theGovernment Finance Officers Association203 N. LaSalle Street, Suite 2700Chicago, Illinois 60601www.gfoa.org
Sponsored by the Government Finance Officers Associationand Colonial Life.GFOA received a grant from Colonial Life to study best practices foremployee health benefit cost management strategies for public employers.GFOA used the grant to conduct independent research using a survey ofGFOA members, case studies, and secondary sources. The findings andresulting publication were reviewed and approved by an independentpanel of GFOA members with experience in managing employee benefits.
Contents
B – 4

INTRODUCTION
The escalating cost of employee health care benefits has been an intractable problem for employers, both pub-lic and private, across the United States. Health insurance premiums have grown a cumulative 138% between1999 and 2010. This compares to cumulative wage growth of 42% over the same period.1 Unfortunately, thistrend is not expected to abate in the near future – employer health care cost trends are projected to increase byan average of 8.5% in 2011, up from 8% in 2010.2
What is behind this budget-busting trend? A number of factors are thought to be at work. The leading onesinclude increasingly sophisticated (and expensive) medical technology and an aging population.3 Other reasonsmight include provider consolidation (decreasing competition) and cost-shifting from Medicare and Medicaid toprivate insurance plans as reimbursements from these federal programs fails to keep up with rising costs andproviders look to make up the difference elsewhere.4
Public employers might not be able to do a lot to counteract these kinds of forces, but GFOA’s research hasfound that there are still important leverage points for public employers to manage and contain the cost ofemployee health care benefits, while still promoting a healthy workforce. This paper describes these leveragepoints and includes specific cost management strategies within each point. The discussion focuses on thestrategies that have been found to have the most profound effects and that have proven successful in the publicsector.
The paper focuses on more innovative strategies, though the tried-and-true are discussed too. Wherever possi-ble, the we cite concrete return-on-investment estimates. Of course, strategies with profound impacts will oftenrequire multiple years to yield their full benefit, so the paper also highlights “fiscal first aid” tactics that can beused to help control costs in the short term.
The paper concludes with a discussion on how to move from strategy to action, including selecting specificstrategies to implement and build support for changes to the benefit plan.
About our SourcesGFOA and Colonial Life surveyed a sample of GFOA members, conducted case study interviews of public man-agers who reported successful use of innovative cost management strategies, and reviewed secondaryresearch. The survey has a margin of error of +/- about 6%.5
1
Containing Health-Care Costs: Proven Strategies for Success in the Public Sector
B – 5

THE LEVERAGE POINTS OF HEALTH BENEFIT COST MANAGEMENT
GFOA research identified six primary leverage points governments can use to manage employee health carebenefits costs. These are:1. Change the level of the benefit provided. Modify how many and what type of benefits the plan provides
and who they provide them to.2. Manage participants’ choice of providers. Direct or even limit health plan participants’ choices to lower-
cost providers.3. Share cost with employees. Structure the health plan so that employees bear part of the burden of benefit
costs.4. Reduce use of health care services by employees. Address the economic incentives and actual need for
health care services.5. Right-source health benefit services. Use the right combination of outsourced service providers and
providers within a network to deliver health benefits. 6. Maximize the value received for the health care dollar. Rather than just minimizing costs, consider the
benefit received per dollar spent on health benefits.
1. Change Level of Benefit ProvidedEmployers can control how many and what type of benefits the plan provides and who they are provided to. Ofcourse, the more benefits a plan provides and the greater the number of participants in the plan, the greater thetotal cost of the plan will be.
As such, a public employer can consider reducing the benefit level provided to contain costs. This could include,for example, making dental, vision or other non-core coverage a voluntary option for which the employee wouldbear the full cost. This strategy was sparsely used by GFOA survey respondents (33%), but 86% of thoserespondents would recommend it, and 70% would recommend it highly — mainly because it allows employeesaccess to expanded benefits without increasing the cost to the employer.
Certain types of services could also be dropped from the plan. For instance, one city in GFOA’s research droppedbariatric surgery. However, eliminating core benefits is a rarely used strategy, according to GFOA’s survey: Fewerthan 5% have eliminated benefits for active employees. Indeed, eliminating benefits is a blunt instrument for costcontainment, as it can decrease the quality of the benefits offered. Benefits have often been considered an impor-tant part of the attraction to public sector work, so this is not an insignificant consideration. In fact, about a quarterof the survey respondents cited the negative impact on employees as a reason for not eliminating benefits, whileanother 30% cited the lack of familiarity with the impacts as a reason for avoiding the technique.
2
Containing Health-Care Costs: Proven Strategies for Success in the Public Sector
The ROI All-StarsWithin the six leverage points, GFOA’s research found that these strategies had the best return on invest-ment potential. These strategies will be discussed in detail in the paper:• Onsite clinics. Direct employees toward a low-cost provider while increasing satisfaction with care.• Variable premium contributions. Structure employee premium contributions as a percentage of the
total premium or a flat employer contribution where employees must cover the balance.• High-deductible health plan and health savings account. Introduce a consumer-driven mentality to
employee health care in order to reduce excess usage.• Wellness program. Take a structured approach to improving employee health and, therefore, reduce
need for more costly health care interventions. • Self-insurance. Retain the risk associated with health insurance, as well as the profit.• Cooperative purchasing. Pool with other employers to augment purchasing power.• Value-based insurance design disease management. Use cost differentials to direct limited medical
resources to their best effect.
B – 6

Another option is to encourage employees to waive benefit coverage. For example, some governments offercash incentives to employees to drop coverage, especially if they have coverage from other sources (e.g., aspouse), or to at least drop spousal coverage if the spouse has their own insurance. The Village of Romeoville,Illinois, for example, offered employees cash payments ranging from $2,000 to $4,000 per year to waive cover-age.6 However, this sort of strategy was not often used by GFOA’s survey respondents (only 35% used it), but76% of those that did would recommend it to others. Reservations about this strategy centered around thepotentially small number of employees who would take the incentive and the possibility of the most healthyemployees opting to drop coverage, thus leading to an increase in premiums.
2. Manage Participants’ Choice of Providers Employers can take steps to direct or even limit health plan participants’ choices to lower cost providers. Mostpublic mangers are familiar with the trade-offs between plan cost and degree of insurance provider control inhealth care delivery. A health maintenance organization (HMO) will typically cost less than a preferred providerorganization (PPO) because it manages care more tightly.7 A “narrow network HMO” will reduce costs more byfurther restricting choice in available providers. However, less choice typically translates into less perceived ben-efit on the part of employees.
One strategy to manage choice of providers while improving the quality of the health benefit for employees is on-site health centers, also known as on-site clinics. An on-site clinic is essentially a doctor’s office that is provided bythe public employer, on or near the employer’s premises. Staffing varies with expected use of the clinic, from onlynurse practitioners and physician assistants to a full medical staff. The services offered range from just immuniza-tions and limited acute care to physicals, lab work, behavioral health services, and even pharmacy services. A vari-ety of management models is available for clinics, but GFOA’s case study research suggests that most govern-ments favor relying on a third-party vendor to manage the clinic on their behalf. That’s because doing so, if con-tracted properly, reduces the government's responsibility for regulatory compliance and liability concerns that wouldotherwise come with operating a clinic.
An on-site clinic provides savings to the employer through the following advantages:• On-site clinics can provide services more cheaply than commercial providers.8 To provide one example,
Elkhart County, Indiana (903 employees and 756 plan participants), performs a full panel blood draw at its clin-ic as part of its wellness program.9 Elkhart pays about $10 for each test, while a private provider might chargeup to $100 to a patient for a comparable service.
• Because an on-site clinic is more accessible to employees than commercial providers (i.e., closer andcheaper), employees seek treatment for minor conditions before they become major conditions that aremore costly to treat.
3
Containing Health-Care Costs: Proven Strategies for Success in the Public Sector
Fiscal First Aid: Health Benefit Eligibility AuditAn audit of the health benefit plan could reveal that a number of participants aren’t technically eligible toparticipate. This could include, for example, dependents who are over age or who aren’t blood relatives ora spouse. Also, former employees may not have been removed from the plan. For example, the City ofMontgomery, Alabama (population 205,764), found a potential annual savings of over $1.3 million when itdiscovered that 288 dependents, or 8.9%, were ineligible for benefits coverage. Smaller governments canalso realize savings. Upon an initial audit, a town of 20,000 people found $20,000 in potential savings onan annual $1.2 million budget for employee health benefits.
Federal health care reform might reduce the yield available from eligibility audits because it expands cover-age requirements for dependents, but audits will still remain an important cost management technique.
B – 7

• Employees take less time off from work both because they don’t need to travel to get medical attention andbecause scheduling is usually better integrated with the employer’s needs.
Research has found that on-site clinics offer a substantial return on investment (ROI): figures range from $1.60to $4 saved for every dollar invested.10 The experience of GFOA’s cases study research confirms substantialbenefits are available. For example, Cabarrus County, North Carolina, offers a full-service clinic to 1,300employees and dependents and realized a net cost savings of $624,000 over a four-year period.
Of course, an on-site clinic does not have guaranteedreturns. First, to be effective, a clinic must have a certainnumber of potential patients — about 800 to 1000.11 Thisdoes not mean that on-site clinics are an impossibility forsmaller employers — multiple employers can share aclinic. In Texas, the City of Mesquite is on the border ofwhat is required to run a cost-effective clinic (1,148employees), so it joined with the Mesquite School District(4,700 employees) to offer a full-service clinic. Corpus Christi Regional Transit Authority (213 employees) con-tracted with a local physician group to provide preferential rates at their clinics (see sidebar below).
Once in place, employees must have an incentive to visit the clinic instead of a commercial provider. GFOA’scase studies used a number of enticements to make the clinics less expensive and more convenient than otheralternatives:• Waive or substantially reduce co-pays when visiting the clinic.• Provide convenient scheduling options such as web-based appointment setting. Employers can also negotiate
wait time standards with the managers of the clinic to ensure visits are expeditious. • Develop advantageous time-off policies for using the clinic, such as not requiring the use of sick time to visit
clinic or allowing flexible work scheduling.• Make sure the clinic staff is professional and friendly. • Provide services that are focused but cover major employee needs. Clinics that provide only the most basic
services will not see high utilization, and services that are too specialized will not enjoy economies of scale.
3. Share Cost with EmployeesHealth care costs have escalated at a rate that far exceeds inflation. Sharing costs with employees is a way toshare this burden. In addition to reducing the employer’s cost, cost sharing should help make the case withemployees for strategies that reduce the total costs of the health plan because employees become more cognizantof the trade-offs between increasing health care costs and other uses of resources (e.g., their take home pay). To
4
Containing Health-Care Costs: Proven Strategies for Success in the Public Sector
Fiscal First Aid: Urgent Care ClinicsThe Corpus Christi Regional Transportation Authority used urgent care clinics to rapidly access some ofthe benefits of on-site clinics. Essentially, the CCRTA contracted with a commercial provider to give theAuthority highly preferential rates for the urgent care needs of CCRTA health plan participants in exchangefor directing plan participants to the clinic. The clinics are neither exclusive to CCRTA employees nor onCCRTA premises. Rather, the contracted physician group has thee separate clinics in different parts of thecommunity, so is still convenient for employees. CCRTA found that the clinic showed a positive return inthe first year because there were no start-up costs to speak of – the CCRTA just had to encourage employ-ees to use the clinics.
Research has found that on-siteclinics offer a substantial returnon investment: figures rangefrom $1.60 to $4 saved for everydollar invested.
B – 8

illustrate, restricting the plan participants’ choices of providers decreases the quality of the benefit to employees,but research shows that employees typically prefer less choice to higher premium costs.12 Hence, structuringemployee contributions to premiums such that their contribution depends on the total cost of the plan they selectgives employees an incentive to choose a less costly plan (e.g., an HMO over a PPO).
Increasing premiums, co-pays, or deductible are all formsof cost sharing. These methods were used by 47% ofGFOA’s survey respondents. Increasing deductible wasslightly more popular, with 56% of respondents indicatingthey had used it. Among those that haven’t used thesestrategies, the most important barrier was usually thenegative impact on employees.
While increasing an employee's cost-sharing might be a strategy, employers should also be aware that doing socould cause a loss of "grandfathered" status under the Patient Protection and Affordable Care Act of 2010(PPACA). Under PPACA, an employer group health plan that was in existence on March 23, 2010, can retaingrandfathered status and avoid several of PPACA's new coverage mandates that are applicable to group healthplans (e.g., providing no-cost preventive care benefits and providing greatly expanded claims and appealsrights, including a right to an external appeal to an independent review organization). A group health plan canlose grandfathered status if it raises employees' coinsurance rates, raises fixed-dollar cost sharing (such asdeductible, co-pays, or out-of-pocket maximums) by more than the increase in medical inflation plus 15%, orreduces the percentage of the plan's premium paid by the employer by more than 5% (all as measured fromMarch 23, 2010). Many employer group health plans have already lost grandfathered status and have becomesubject to PPACA's full range of coverage mandates. However, plans that have not yet lost grandfathered sta-tus and want to retain it should carefully review the limits imposed by PPACA on increasing employee cost-shar-ing mechanisms.
For plans that intend to increase employee cost-sharing, one way to mitigate some of this negative impact onemployees is to implement a health reimbursement account (HRA). An HRA is an account the employer fundsfor each employee, and it can be used to give the employee tax-free reimbursement for qualified medicalexpenses.13 An HRA can be used to complement a traditional type of plan, like an HMO or PPO. If any employeris able to realize significant savings from the cost-sharing strategies described above, it can use part of the sav-ings to fund HRAs. Because the money provided to employees through the HRA is tax-free, it can go a longway toward offsetting the increased out-of-pocket expenses they incur with the health plan. It should be notedthat this strategy is, in some ways, similar to a health savings account (HSA) and high-deductible health plan(HDHP). However, the HRA strategy described here can be used when the deductible faced by employees arenot high enough to qualify for an HSA, under IRS rules. HDHPs and HSAs are explained further in the next sec-tion of this paper.
Another option to help alleviate some of the potential for employees to experience higher out-of-pocket costsassociated with cost sharing strategies (and higher deductible and co-insurance requirements in particular) issupplemental insurance. This supplement applies to higher cost, less common uses of medical services, likehospital confinement or outpatient surgery. The concept is that it will cost less to provide this more limited insur-ance than more comprehensive coverage, but employees still have some measure of protection. Hence,
5
Containing Health-Care Costs: Proven Strategies for Success in the Public Sector
Fiscal First Aid: Section 125 Plan Flexible Spending AccountA Section 125 or “FSA” allows employees to make before-tax contributions from their wages to a personalaccount that can be used for qualified expenses. In addition to providing a nice way for employees to makewages go further (perhaps reducing the bite of cost sharing strategies), it can also reduce the employer’spayroll tax burden. For example, a community college in North Carolina (with about 1,000 employees)streamlined enrollment and enhanced communication of its FSA, increasing participation by 68%. Thisbrought employees more than $100,000 in tax savings and $26,000 in FICA savings.
Increasing premiums, co-pays, ordeductible are all forms of costsharing.
B – 9

employees have the supplemental insurance to guard against exorbitant out-of-pocket expenses owing touncommon use of services, while the employer saves money through the more advantageous employee cost-sharing arrangements for more mundane services.
4. Reduce Use of Health Care Services by EmployeesThe extent to which plan participants use benefits is a key driver of the cost to the employer. There are twomain factors underlying participants’ use of care. First is participants’ economic incentive to use health care. Thetypical health insurance model provides an incentive to overuse health care services because there is not a verydirect connection between participants’ out-of-pocket costs and the actual cost of services. For example, if par-ticipants’ only cost is a $30 co-pay, there is no incentive to choose a physician who charges $100 for an officevisit over one who charges $150. In fact, total overuse of service in the health care system has been estimatedat between 30% and 50%.14 The second factor underlying participants’ use of health services is their need forservice owing to their health conditions. Chronic health conditions and employees’ poor health habits are majorcontributors to the cost of an employer’s health plan.15
Hence, employers can seek to: 1) create incentives for employees to make economically efficient choices when theyneed care; and 2) help employees become healthier so they need less medical care. The consumer-directed healthcare movement has evolved to address the first point, and employer wellness programs address the second.
Consumer-Directed Health CareThe basic premise behind consumer-directed health care is to make plan participants discerning consumers ofhealth care services, including improved information on cost-effective choices and incentives to reduce spend-ing. The overarching goal is to give participants a stake in containing costs. The practical incarnation of this phi-losophy with the greatest potential impact for an employer’s bottom line is a high-deductible health plan (HDHP)paired with health savings account (HSA) or health reimbursement account (HRA).
The most prominent feature of an HDHP is a very high deductible. To qualify as an HDHP, a plan must havedeductible of a certain minimum size. The standards are set by the IRS each year and in 2011 are a bit morethan $1,100 per year for individuals and $2,300 for families. However, in practice, HDHPs often have higherdeductible than the IRS minimum – GFOA’s case studies commonly reported deductible of between $2,000 and$5,000, but deductible as high as $10,000 are not unheard of in the private sector. Once a plan participantmeets the deductible, the health insurance benefit is activated. At this point, the participant will have a coinsur-ance obligation, usually paying from 10% to 20% of the claims. This obligation continues until the participantreaches an out-of-pocket maximum, at which point the insurer becomes totally responsible for all coveredclaims. HDHPs can be designed to limit or expand the choice of providers, much like an HMO or PPO — adesign feature that becomes most germane once the deductible is met.
An HDHP is usually accompanied by an HSA or HRA. An HSA can be used only with HDHPs; it is a tax-advan-taged savings account that can be used to put aside money to pay for qualified medical expenses. Employeescan make tax-free contributions to an HSA, and employers can contribute as well. A key difference between an
6
Containing Health-Care Costs: Proven Strategies for Success in the Public Sector
Fiscal First Aid: Multi-Tiered Drug BenefitProviding a drug benefit that includes a smaller employee co-pay for generic drugs, a larger co-pay forbrand name drugs, and perhaps an even larger co-pay for lifestyle drugs is consistent with consumerdirected health care principles.
B – 10

HRA and an HSA is that the employee has “ownership” of the money in the HSA upon separation from theemployer. With an HRA, the employer is the “owner” and can design the plan to provide a former employee andqualified dependents access to the funds or to require the employee to forfeit the funds upon separation fromservice. GFOA’s case studies demonstrated a strong preference for using HSAs over HRAs for supplementingan HDHP (though it is possible to use both16). This is because they believe that employee ownership of the HSAcontributes to the “consumer driven” nature of the plan and to employee acceptance of HDHP.17
Because employees are completely responsible for healthservice costs up to relatively large amount with an HDHP,compared to a traditional plan, they will presumably will bemore discerning about which health providers to use orwhether to use services at all, and they might even scruti-nize provider invoices more closely. This should translateinto a lower claims experience for the employer and,hence, lower overall costs for the health plan.
It is, however, difficult to obtain a good estimate of totalreturn on investment for an HDHP. One reason is thatHDHPs have gained popularity only in the last few years,so there is limited data on which to base an evaluation.Second, because HDHPs have an important financialimpact on employees as well as employers, a serious eval-uation of ROI must encompass both parties. One studythat attempts to overcome these two problems ran 24 sim-ulated scenarios of HDHP/HSA against a more traditional plan and found that the total financial benefit (for bothemployee and employer) was greater under HDHP/HSA in 21 cases, with a total average differential of $2,019 infavor of HDHP/HSA over the entire simulated 40-year time period.18 Furthermore, at the end of the simulated peri-od, the employee had built up an average HSA balance of $35,147. This indicates that an HDHP/HSA shouldn’thave a negative effect on employees and should even provide a net benefit.
With respect to just the employer’s costs, other research indicates savings of between 12% and 30% of premi-ums.19 Anecdotal evidence from GFOA’s case studies seems to support the proposition that HDHPs can providesignificant savings in at least some cases: 20
• The City of Ludington, Michigan (population, 8,300, 53 full-time employees in the health plan), saved$100,000 in the first year.
• Chautauqua County, New York (population 135,000, 83 employees enrolled in HDHP), saved about $2,000per participant.
• Columbia Public Schools, Missouri (2,550 full-time equivalent), reduced the total annual cost increases forits benefit plan to 5%, down from 9%, with only half of eligible employees choosing the HDHP option, (Therest remained in a traditional plan.)
• The City of Havre de Grace, Maryland (population 13,000, 130 employees), reduced premiums by morethan $250,000 per year.
However, HDHPs have been subjected to three important criticisms. These concerns, along with the commonresponses of HDHP advocates, are presented below.
Cash flow challenges for plan participants. Some plan participants can experience cash flow problems if theydon’t have enough money available to meet the deductible for their medical expenses. The essential startingpoint for dealing with this problem is to pair the HDHP with an HSA and/or HRA so employees will haveresources available to offset the higher out-of-pocket costs. For reasons explained earlier, HSAs were more pre-ferred by GFOA’s case studies.
7
Containing Health-Care Costs: Proven Strategies for Success in the Public Sector
Because employees are com-pletely responsible for healthservice costs up to relativelylarge amount with an HDHP,compared to a traditional plan,they will presumably be morediscerning about their health careusage, which should translate into a lower claims experience forthe employer.
B – 11

Even with an HSA in place, the employee may not be able to put aside enough cash to make payments ondeductible. To alleviate this concern, it was very common for the case study governments to “seed” the HSA forthe employee each year. This contribution was often equal to the entire amount of the deductible, but was in allcases a substantial percentage of the deductible. This was seen as necessary to both alleviate cash flow con-cerns and, in cases where employees had choices between HDHP and traditional plans, to attract employees toHDHP. However, it should be noted that all of the case study governments were relatively new to HDHPs, so itwas unclear if annual seeding will remain an ongoing trend or a limited-term tactic to build a cushion in employ-ees’ HSAs.
A last tool to help with cash flow concerns is a short-term loan program. Such a program is much like overdraftprotection at a bank. Chautauqua County set up a small loan fund to help employees with problems meeting thedeductible. Any loans made have to be paid back by the end of the year at a nominal interest rate.
Underutilization of preventative care. Given the incentive to minimize medical costs, plan participants mayunderutilize preventative services because they are often not perceived as an immediate, pressing need. Thiswould, of course, lead to worse long-term health outcomes and higher costs for the employer. The commonlyaccepted solution is to provide for “first dollar coverage” for preventative services,21 which means coverage isprovided for certain services regardless of whether the HDHP deductible is met. This means that preventativecoverage under an HDHP is comparable to that of traditional plans. Among the most common covered servicesare immunizations, well-baby and well-child care, mammography, pap tests, and annual physical exams andscreenings.22
Adverse selection. HDHPs are thought to hold the greatest attraction for younger and healthier individualsbecause they have less need for medical care and will therefore benefit from lower premiums and/or building upfunds in an HSA. The other side of this coin is that less healthy individuals will gravitate toward traditional plans,thereby driving up the claims experience for these types of plans, making them even more expensive. Perhapsdue to the relative novelty of HDHPs and HSAs (having only gained popularity in recent years) and the long timeperiod over which adverse selection problems would manifest, GFOA could not find any definitive secondaryresearch on whether adverse selection does in fact occur in employer plans or the impact of adverse selection onemployer costs. GFOA’s case study governments that offer traditional plans in addition to an HDHP have report-ed that adverse selection has not yet proven to be a problem, though they remain aware of the possibility.
Regardless of the potential gains for employees, HDHP can be a tough sell. Here are some suggestions fromGFOA’s case studies for making an HDHP a positive experience:• Do not reduce the overall scope of coverage under the HDHP compared to the traditional plan. For
example, if certain services are excluded from the HDHP, employees might associate the change with thevery concept of HDHP (rather than just recognizing it as change in coverage levels that could haveoccurred under any plan type).
• If possible, offer the HDHP as an option with traditional plans. This will allow a smoother transition. Bepatient, though; for employers that offer multiple plans, reaching participation goals might take some time.Persistence and planning can pay off, however. Columbia Public Schools reached 55% HDHP participationin the first couple of years, though they were hoping for just 50%.
8
Containing Health-Care Costs: Proven Strategies for Success in the Public Sector
Health Care Reform and Preventative CareIt is worth noting that health care reform promotes preventive care by requiring non-grandfathered plans toprovide specified preventive care services to plan participants without any employee cost-sharing. Thepreventive care services required by PPACA range from immunizations to screenings for various types ofcancer to annual physicals and mammograms. The goal of the legislation is to encourage employees toseek preventive care by eliminating the employees' out-of-pocket costs for doing so.
B – 12

• Complement the HDHP with an HSA and seed it. Employees like having an individual account to whichthey can make tax-free contributions that earn them interest, and an account that they control and get tokeep. An HRA does not offer these advantages to the employee. Once established, it is wise for theemployer to make contributions to the HSA for the employee. This will build goodwill and shouldn’t preventthe employer from realizing bottom-line savings.
• Educate employees on what HDHP is and what its implications are. Studies show that most peopledon’t really understand HDHPs.23 In-person meetings, printed materials, and online tools to help employeesunderstand the individual financial impact an HDHP are all important. Our case studies advise not toassume too much when working with different employee groups. For example, the conventional wisdom isthat low-wage employees would be least receptive to HDHP because of cash flow concerns. ColumbiaPublic Schools, however, found that its lower-wage employees were among some of the most interested inthe plan because of the opportunity to put more money in their own pockets through lower premium costsand an HSA.
• Find good HDHP and good HSA vendors. Some vendors specialize in HDHPs, so offering an HDHP maynot be as simple as asking the current health insurance provider for an HDHP option. Selectivity is alsoimportant for the financial institution that acts as the custodian for the HSA. Our case studies reported thatHSA administration can be a significant irritant to the employee, if not handled well. In particular, look forcustodians that have low fee structures and high interest rates, easy access to funds (though a debit cardoption, for example), and customer service systems that are tailored to HSAs.
• Make the cost of providing health benefits transparent. Many of GFOA’s case studies used employee ben-efit committees to keep employees informed of the cost of health care. This can make the rationale for going toan HDHP much more compelling, especially if the public employer already has a system for variable sharing ofpremium costs. In fact, in Ludington, Michigan, employees welcomed the HDHP as a way to escape the contin-uing concern about health benefits becoming totally unaffordable for the City and its employees.
Wellness ProgramsWellness programs are initiatives employers offer in an attempt to affect the overall health of employees (andsometimes dependents), decreasing health care costs and increasing productivity. Wellness programs can takea number of forms, including a health risk assessment (e.g., lifestyle questionnaire, biometric evaluation), self-help educational materials, individual counseling, educational classes and seminars, or behavioral modificationprograms such as coaching. Wellness programs can have a specific focus of intervention such as weight loss,fitness, or smoking cessation, or address multiple risk factors.
Wellness programs have generated a great deal of enthusiasm among public and private employers. Almost80% of GFOA’s survey respondents have undertaken at least some form of wellness initiative. Of those respon-dents, 90% would be willing to recommend it to others, and 65% would recommend it enthusiastically. Theseattitudes are consistent with those of private firms.24 This enthusiasm is not misplaced. A number of rigorousstudies have shown the significant ROI potential of wellness. One meta-study of ROI for large employers(defined as more than 1,000 employees) showed that for every dollar spent, the return was $3.27 over an aver-age three-year period.25 Other studies have found higherand lower ROIs, but it does seem clear that wellness pro-grams have significant potential financial benefits, andnot just for larger employers:
9
Containing Health-Care Costs: Proven Strategies for Success in the Public Sector
Spend Money to Save MoneyWellness programs might actually result in increased utilization of preventative services. However, thisshould lead to lower utilization of more costly interventions over time.
A number of rigorous studieshave shown the significant ROIpotential of wellness programs.
B – 13

• The City of Arden Hills, Minnesota (pop 9,550, 25 employees participating in the health plan), improved itsexperience, leading to a $24,000 refund from their carrier and a 13% decrease in premiums.
• Since the City of Lewiston, Maine (pop 41,500, employees 443), implemented a wellness program in 2006,its health care premiums have decreased by $736,757 (through 2008). From 2007 through 2010, premiumshave increased an average of 3.3%, less than the national averages of about 4.5% to 5% during that sameperiod.26
Wellness programs sometimes have an additional ROI benefit for public employers that offer health care toretirees. The City of Irving, Texas (population 216,000, 1,800 employees), was able to reduce its GASB 45unfunded actuarial accrued liability by 50% (from $52 million to $26 million) within two years of implementing anew retiree health insurance strategy that includes a comprehensive wellness program as a key component.The City of Irving’s approach shows that wellness programs do not have to end when active employees retire.
Given that wellness programs are fairly well established in the public sector, this paper will not address thebasics of such programs but will examine the best practices of wellness programs revealed by GFOA research:
Assess the population. ROI can be best achieved byfocusing wellness activities on the areas of greatestneed. Biometric evaluations, claims analysis, andemployee surveys are all helpful sources of data. Seek todetermine the most common types of claims, the mostcommon predictive factors, and the highest cost dis-eases. This will enable the employer to develop afocused, limited program. For instance, Olmsted County,Minnesota (population 141,000, enrolled employees 930),found that weight loss was its most pressing need, so theCity started there. It was then able to demonstrate clear positive results to the County Board (the initiative paidfor itself in the first year, and employees who benefited testified in front of the Board), thereby paving the wayfor additional wellness activities.
Individualize the intervention. Wellness programs that rely solely on one-size-fits all interventions are lesssuccessful than programs that recognize and address participants at multiple risk levels and provide specialsupport for those at greatest risk. For example, Olmsted County has two levels of weight loss support:• Intermediate: This program is open to plan participants with a body mass index (BMI) of more than 25. The
12-week program takes place in a support group setting and features advice from personal trainers, dieti-cians, and health coaches. Also, the County’s wellness coordinator reviews participants’ weekly food jour-nals and provides weigh-in opportunities.
• Intensive: The intensive weight loss program is open to plan participants with a BMI of more than 35, ormore than 30 with one co-morbid condition.27 The program can last up to 48 weeks, and it consists of indi-vidual sessions with a personal trainer and dietician, weekly food and physical activity accounting andweigh-ins, and consultations with a certified health coach.
As the Olmsted example illustrates, different intervention methods, like support groups, individualized counseling,and feedback, all have a role. Some research suggests that telephone counseling can be a particularly effectiveintervention because it is a low-cost way to provide individualized expert attention for plan participants.28
Incentives. Incentives are becoming an increasingly regular feature of wellness programs29 and were in com-mon use among the governments participating in GFOA’s case studies. GFOA found several types of financialincentives in use:
10
Containing Health-Care Costs: Proven Strategies for Success in the Public Sector
ROI can be best achieved byfocusing wellness activities onthe areas of greatest need.Biometric evaluations, claimsanalysis, and employee surveysare all helpful sources of data.
B – 14

• Employees in the City of Irving, Texas, can earn a monthly reward of up to $150 for meeting standards inphysical fitness or biometric screening, and also accumulate premium credit for retiree health insurancepremiums.
• Employees in the City of Lewiston, Maine, can reduce their share of monthly health insurance premiumsfrom 25% to as little as 10% by meeting body fat composition goals, not using tobacco, following an exer-cise program, and completing a health risk assessment.
• Manatee County, Florida (pop. 322,000, employees 3,200), has a three-tier health benefit with significantdifferences in cost-sharing arrangements between each tier. To qualify for the most preferred plan, employ-ees must complete an array of wellness activities.
Some research suggests that $100 for a single instance ofbehavior (i.e., completing a health risk assessment) is thepoint at which an incentive becomes meaningful to employ-ees. Further, the reward should be paid soon after the activi-ty is completed in order to maximize positive reinforce-ment.30 Finally, rewards are often more effective if they arenot included in the regular paycheck (e.g., a gift card).31
However, an incentive program can work even if it does notfollow these standards. In Lewiston, 86% of eligible planparticipants take part in the wellness program, and a littlemore than 50% participate in Irving. In Manatee, 93% of employees completed the wellness actions necessaryto qualify for the most advantageous plan.
Incentives need not necessarily be monetary. For example, the City of Arden Hills found that a relevant gift — apedometer— was effective for increasing employees’ interest in the wellness program. Many of GFOA’s casestudies found that inter-departmental challenges were also useful. For example, departments can complete witheach other to see which group of employees can lose the most weight, walk the most miles, or complete thegreatest number of wellness activities.
Finally, more employers might begin considering disincentives for unhealthy behaviors more seriously.32 Forexample, Elkhart, Indiana, assesses an “up charge” equal to 10% of the employee’s monthly premium share ifthe employee fails to complete biometric screening. Other employers have started assessing tobacco users asurcharge on top of their existing contributions to the health benefit.
Design a program for the whole person. The wellness program should integrate various approaches to improvingemployee health. For example, Olmsted County found that it was necessary to address the psychological issuesbehind overeating to reach weight loss objectives. Another illustration is that a smoking cessation initiative should beaccompanied by a weight management program.
Leading wellness programs are recognizing the importance of stress in employee health.33 Programs address the driv-ers of stress and increase employee coping capabilities. Specific interventions can include stress management coach-ing, worksite exercise programs, discounted gym memberships, or massage therapy.
Track results. Employers should track the results of the wellness program over time and adjust the programaccordingly. This includes both employee health results and financial impacts. The same sources of data usedto originally assess the workforce can be used to gauge progress. Are claims decreasing? Are biometric resultsimproving? Also, more timely data can be gathered, such as participation in wellness events. Wireless technolo-gy has the potential to greatly improve result tracking by monitoring employee exercise regimens and submittinginformation like calories burned or steps taken.34
11
Containing Health-Care Costs: Proven Strategies for Success in the Public Sector
Some research suggests that$100 for a single instance ofbehavior — for instance, com-pleting a health risk assessment— is the point at which anincentive becomes meaningfulto employees.
B – 15

Engage participants. Of course, for the wellness program to achieve the best results, plan participants have toparticipate and, ideally, participate enthusiastically .This starts with communication. An insight revealed by GFOA’scase studies was that the human resources office needs to be seen as credible and trustworthy. If employees havelittle confidence that information from biometric scans, lifestyle questionnaires, etc. will be used properly, then theywill be less likely to join the wellness program. Also, GFOA’s case studies related that it can be helpful to have“wellness champions” throughout the organization to help communicate the program. It is usually not especially dif-ficult to find a handful of employees who would be enthusiastic about the program and spread that enthusiasm toothers.
Perhaps the greatest challenge the case studies encoun-tered with their programs was engaging dependents. Notonly do dependents generate a significant portion of theclaims in virtually any plan, but they can sabotage theemployee’s efforts to achieve personal wellness goals(imagine trying to lose weight when the rest of the family isnot supportive). None of the GFOA case studies are com-pletely satisfied with their solution to this problem, but many are trying. King County, Washington, provides anexample of one approach.35 Much like Manatee County, King County presents employees with three tiers of plans,ranging from the least cost-beneficial for the employee to the most. King County requires both the employee andthe spouse to meet certain wellness objectives to quality for the best plan.
Remain aware of legal restrictions. Wellness programs must comply with a number of legal issues, so publicemployers need to be careful about how programs are designed. Some of the most important legal concernsinclude:36
• Make the program voluntary. The program must be voluntary in name and in fact. For example, employerscan’t set the rewards for participating so high as to be a significant part of compensation, or predicate partici-pation in the health care benefit on participation in the wellness program.
• Provide everyone with an opportunity for reward. If a wellness program provides rewards based onhealth status factors, then the program must comply with requirements under the Public Health Service Actthat are intended to make awards available to a broad range of participants, not just the healthiest.
• Keep data secure. Employers often collect a lot of health data through wellness programs, so privacy lawsmust be respected. This includes developing appropriate privacy policies and procedures as well as beingmindful of using aggregate data, rather than individual data, to operate the wellness program.
• Tax issues with incentives. Some incentives, like gift cards, create a tax liability, while others, likereduced premiums, do not.
5. Right-Source Health Benefit Services As with many services, third-party organizations can often provide health benefits more cost-effectively than in-house resources. However, this is not always the case. Governments have important opportunities to retainsome parts of the work of providing benefits while still lowering their overall costs. Hence, a public employerneeds to consider the opportunities and settle on the right mix of outsourced and in-sourced services, takinginto account factors such as internal capacity, risk tolerance, and economies of scale. The largest such opportu-nity is self-insurance, so it will be the first point of discussion in this section, including considerations about mov-ing to self insurance and what employers that are already self-insured can do to maximize the benefits of thisstrategy. Cooperative purchasing of health care benefits will be explored next, and finally, a number other right-sourcing strategies.
12
Containing Health-Care Costs: Proven Strategies for Success in the Public Sector
Wellness programs must complywith a number of legal issues, sopublic employers must be carefulwith how programs are designed.
B – 16
Self-InsuranceThe largest potential gain from right-sourcing, for many employers, will come from self-insuring or self-fundingthe health plan. Self-insured employers assume the risk for providing health care benefits, rather than transfer-ring it to a third-party insurer. Under this system, the employer pays for each claim as it is incurred, rather thanpaying a fixed premium to the health insurance provider. The financial benefits to self-insurance can be substan-tial — a reduction of approximately 10% in health care costs.37 These savings arise from eliminating the profitmargin of commercial insurers, being able to design the benefit plan to the employer’s exact specifications, andavoiding legislative mandates that apply to commercial insurers, the costs of which are passed on to customers.
However, it should be noted that self-insurance has gen-erally been regarded as the province of larger employers— generally those with more than 200 employees. This isconfirmed by research that shows only 16% of privatefirms with fewer than 200 employees are self-insured,compared to 59% when all firms are considered.38
Smaller employers usually aren’t able to spread the riskor realize administrative economies of scale for processing claims and dealing with legal compliance require-ments. However, smaller employers could gain the benefits of self-funding if they have the financial wherewithal(cash reserves) to withstand the variable expenses associated with paying actual claims as they are incurred orif they join a multi-employer benefit pool that is self-funded.
Public employers that wish to pursue self-funding need to decide how to best use third-party (e.g., private contrac-tor) assistance. As a first step, the employer should find a consultant experienced in self-funded plans to help with:evaluating how much risk the public employer is willing and able to retain versus transferring it to a third-partyinsurer; negotiating terms with other service providers; and assessing the need for stop-loss insurance.
Stop-loss insurance reduces the risks associated with self-insurance by reimbursing the employer for claims thatexceed a specified level. Stop-loss coverage can be especially important for risk-adverse employers. Publicagencies are generally thought to be risk adverse, and GFOA’s survey bears this out, showing that only about40% of respondents are self-insured. When looking at only respondents that have budgets of more than $50 mil-lion, the percentage of self-insured employers is still just 46% – making it appear that public agencies make sig-nificantly less use of self-insurance than private firms. Hence, a good stop-loss strategy might be essential togaining acceptance of self-insurance among decision makers. Also, factors such as an aging workforce andincreasingly sophisticated treatments are making high-cost claims more commonplace, which makes an evenstronger case for stop-loss coverage.39
Stop-loss coverage can apply to individuals whose claims exceed a given ceiling in a single year, in order toprotect against infrequent but severe cases. Stop-loss coverage can also apply to the employer’s total costs forhealth care. The former is probably the more important of the two because it protects against impossible-to-pre-dict events. The latter may be of interest to more risk adverse or smaller employers, but on average will be lessbeneficial because insurers typically set stop loss limits at a level of aggregate spending that is rather unlikely to
be reached in any given year.40
Finally, a self-insured employer should consider the roleof a third-party administrator. Self-insured employers canadminister claims in-house or contract out to a third-partyadministrator. The tasks of an administrator could includeenrolling employees, providing customer service, pro-cessing claims, reviewing and validating invoices, provid-
13
Containing Health-Care Costs: Proven Strategies for Success in the Public Sector
The largest potential gain fromright-sourcing, for many employ-ers, will come from self-insuringor self-funding the health plan.
A self-insured employershould consider the role of a third-party administrator.Self-insured employers canadminister claims in-house or contract out to a third-party administrator.
B – 17

ing wellness programming, and analyzing claims data. Further, a third-party administrator handles many regula-tory compliance issues, although employers should never forget that they — not their third-party administrators— are ultimately responsible for the legal compliance of a self-funded plan. As a result, it is critical that employ-ers carefully review their contracts with their third-party administrators and ensure that they have legal protec-tions if the third-party administrator fails to perform its duties properly. An administrator should be more than justan outsourced transaction processor, though; third-party administrators can save significant costs by providingadditional analysis of invoices, spending trends, and claims patterns.
Beyond these fundamentals, there are a number of other ways that employers can optimize their self-insurancestrategies:41
• Carve out high-cost claims. Claims that are rare but extremely costly can be covered by conventionalinsurance, thereby proving protection against low-frequency, high-cost claims. Examples include organtransplants and specialty pharmaceuticals.
• Carefully manage high-cost areas. Because a self-insured employer has more control over plan design, itcan more rigorously manage high-cost areas. While the specific areas of greatest cost will vary for eachemployer, managing chronic diseases and conducting billing audits offer benefit for all employers.
• Use data to drive wellness programs. The previous section on wellness advocated analyzing claim todata to focus wellness activity. Self-insured employers typically have much greater access to claims data. Infact, GFOA’s case studies with the greatest returns from wellness programs cited self-insurance as one ofthe keys to their success.
Cooperative PurchasingCooperative arrangements are a staple of government purchasing, and the same idea can be applied to healthbenefits. According to GFOA’s survey, only about a third of governments use cooperative purchasing for healthcare, but of those that do, most (70%) recommend it enthusiastically. This suggests untapped potential.Cooperative arrangements can take a variety of forms, from pooling purchasing power, to negotiating with ven-dors, to implementing a self-insurance strategy for employers that are too small to do it on their own, to design-ing benefit packages, to providing specialized analysis and administration services.
Cooperative purchasing can have important benefits. TheTexas Municipal League’s Intergovernmental EmployeeBenefits Pool (with more than 150,000 covered lives intwo separate pools) estimates that new members cansave 5% to 20% on their premiums. Further, the Pool hasthe resources to design a plan to fit available budgets, sonew members can reduce costs as much as they need.In another example, Marathon County, Wisconsin, gainsaccess to benchmarking information and predictive cost modeling technology through its cooperative —resources it would not otherwise have.
Cooperative purchasing is not without its limits, foremost among which is the fact that public employers must bewilling to sacrifice some flexibility when joining a pool. For example, if the cooperative decides to switch vendorsfor a given service, all members need to be ready to make the switch, even if they liked the old vendor. In addi-tion, cooperative purchasing arrangements will not necessarily provide a benefit to all employers. Large employ-ers might be better off self-insuring on their own. Also, depending on how the cooperative’s rates are structured,employers with particularly good claims experience might find they can get lower rates outside of the coopera-tive. Finally, traditional insurers might object to the cooperative and raise their concerns with members of thegovernment’s governing board. Cooperatives obviously pose a threat to insurers’ business model, so they mighttake steps to poison the idea.
14
Containing Health-Care Costs: Proven Strategies for Success in the Public Sector
Only about a third of govern-ments use cooperative purchas-ing for health care, but of thosethat do, most recommend itenthusiastically.
B – 18
Other Right-Sourcing StrategiesMoving to self-insurance or cooperative purchasing is a fairly significant change. Here are some other strategiesto make sure a public agency is getting the most from third-party providers.
Re-bidding or renegotiating. It is no secret that government budgets are shrinking. Third-party providers canbe asked to share the pain via re-bidding or renegotiating. Among GFOA’s survey respondents, this was a com-mon and well-regarded technique — 64% have used it, and 85% would recommend it. The benefits can be sub-stantial. For example, Lackawanna County, Pennsylvania (pop. 214,000, 1,110 employees), regularly re-bids itsinsurance and recently saved $400,000 on its prescription drug plan over three years. However, this strategycan be used only so often (generally, every three to five years for medical benefits), and the organization mustbe committed to changing vendors, if necessary, lest the procurement process lose credibility.
Shift benefits education and communication expense to suppliers. Employers can transfer the cost of benefitplan communication (e.g., annual benefits booklet printing, employee benefit statement software, and educationalwebsites) to the benefits suppliers. More than half of GFOA’s survey respondents use this technique and about83% would recommend it, while 70% would recommend it enthusiastically. Respondents cited the economies ofscale and specialization the vendor brings as well as the opportunity to reduce the government’s administrativecosts. However, some governments found that this strategy wasn’t cost effective. For example, larger governmentsthat administer much of their plans in-house may already have the requisite scale and expertise.
Use an external service provider for benefits enrollment. Employers can use an outside party to supply anenrollment system and manage open enrollment on behalf of the employer, rather than maintaining and manag-ing a system and processing fully in-house. The rationale for this strategy is much the same as for the strategydiscussed above: economies of scale and specialized expertise can be accessed through a third party. Theresults of GFOA’s survey were also somewhat similar. In this instance, just less than half use this strategy, ofwhich 77% would recommend it, and 63% would recommend it enthusiastically. The survey again found thatlarge, self-insured employers might already have in-house capabilities in this area, but it also showed that smallgovernments might have less use for this strategy, given the small number of people who make any changes totheir benefits each year.
6. Maximize the Value Received for the Health Care DollarRather than just minimizing costs, the employer should also consider the value received from health care: thebenefit received per dollar spent. A value-based approach seeks to maximize use of treatments that are of highvalue to patients and minimize the use of unnecessary or ineffective treatments. This should lead to a betterlong-term cost experience because the medical services used have the greatest impact both now and in thelong term.
When applied to employer-provided health plans, avalue-based approach to health care is known specificallyas value-based insurance design (VBID). The premise ofVBID is that high-cost and chronic cases account for thebulk of an employer’s overall costs.42 These kinds ofpatients usually agree to follow the course of treatmentrecommended by the provider.43 Therefore, containingcosts requires that providers recommend cost-effective treatments and that the patient then follow through ontheir agreement with the provider. For example, studies have shown that higher co-payments will reduce usageof drugs, even if the drugs are of high value and would lead to better long-term outcomes.44 Hence, eliminatingor lowering co-payments for high-value treatments eliminates an important barrier to patients’ maintaining theirtreatment regimen. To illustrate, it is far better to subsidize an employee’s $2-a-day drug cost for a high-valuedrug for a heart condition and potentially avoid a heart bypass surgery at more than $100,000 later on.45
15
Containing Health-Care Costs: Proven Strategies for Success in the Public Sector
Rather than just minimizingcosts, the employer should con-sider the value received fromhealth care: the benefit receivedper dollar spent.
B – 19

In the most basic approach to VBID, the employer simply lowers or eliminates co-payments for drugs or treat-ments that are proven to have high value relative to other treatment regimens. An elaboration on this basicmodel is to have more individualized cost-sharing arrangements, depending on a plan participant’s specific con-dition. For example, a plan participant with heart problems may have no co-payments for a drug with provenvalue for heart conditions, while another participant, who doesn’t have a heart problem, would have to make co-payments if they sought to use the drug for another condition, where value hasn’t been demonstrated. The cruxof the idea is to adjust the out-of-pocket costs for health services based on how clinically beneficial a service isto a particular patient. This concept can also be extended to providers — employees can be given a financialincentive for using the most cost-effective providers. For example, a hospital with a lower rate of hospital-acquired infections would have lower co-pays than one with a higher rate.
VBID is still an emerging best practice in both the publicand private sector. However, one notable long-term suc-cess is the City of Asheville, North Carolina (population83,000, 1,130 employees). Since 1996, the City has runa highly successful disease management program thatconforms to VBID principles. Asheville currently has fiveprograms covering diabetes, asthma, depression, hyper-tension, and cholesterol. The program works as follows:• A plan participant is identified as eligible and enrolls. Eligibility can be determined by a referral from a doc-
tor, the City’s on-site clinic, or self-referral. Once enrolled, the patient receives co-pay waivers for medica-tions that are of proven value to treating the disease.
• Patients are assigned to pharmacist care manager and enrolled in an educational program. The programfocuses on the importance of complying with the treatment regimen.
• The patient meets with the pharmacist care manager on regular basis and gets lab tests. This information iscoordinated with the patient’s doctor. All labs, drug co-pays, and pharmacist visits are 100% covered solong as the patient complies with the education classes, care manager visits, and lab draws. If patients failto comply, they are removed from the program and must resume full co-payments.
The Asheville model is especially interesting because it has been widely studied and replicated. The City hasseen positive results from each of its five programs within one year and has received an ROI of about $4 forevery dollar invested.46 The program results in fewer trips to the emergency room for participants, less time offfrom work, and, of course, lower costs for the City. To illustrate the hard-dollar cost savings, the city’s programfor hypertension resulted in a 46.5% reduction in cardiovascular-related medical costs during the period of onestudy.47 It is notable that cardiovascular medication use increased three-fold during this same period, therebyillustrating the premise of value-based insurance design.
16
Containing Health-Care Costs: Proven Strategies for Success in the Public Sector
The City of Asheville has seenpositive results from each of itsfive programs within one yearand has received an ROI of about$4 for every $1 invested.
B – 20

FROM IDEAS TO ACTIONThis part of the paper addresses how public employers can implement the cost management ideas describedearlier. The first section provides guidance about which strategies to pursue, and the second addresses how tobuild support for the required changes.
Considering StrategiesEmployers have a number of leverage points available for managing the cost of employee benefits and an evengreater number of specific strategies within those leverage points. The employer must choose which strategiesto go with based on factors such as the organization’s size, political environment, cost management goals, andimpact on employee health and access to care. Below is a summary of the strategies with the most potential,based on GFOA’s research, along with points germane to the consideration of each strategy.
Onsite clinic. Direct employees toward a low-cost provider while simultaneously increasing their satisfactionwith the care they receive.• ROI ranges from $1.60 to $4 saved for every dollar invested, including soft-dollar saving such as increased
productivity. • Must have approximately 800 to 1,000 potential patients to be cost-effective.• Employees must be encouraged to choose the clinic over alternatives.• Clinic can provide more accessible and cheaper services to employees.
Premium contributions that are variable with total premium. Structure employee premium contributions as apercentage of the total premium or a flat employer contribution where employees must cover the balance.• Contributions rise with increases in premiums so the employer does not bear full burden of increases.• Gives employees a stake in other strategies that will reduce premium costs.• Could conflict with collective bargaining agreements.
High-deductible health plan and health savings
accounts. Introduce a consumer-driven mindset toemployee health care to reduce excess usage.• Saves between 12% and 30% of total premium
costs.• Might save employees money, especially if variable premium contributions are in place.• Can produce unintended negative consequences if not designed properly.• Higher deductible could conflict with collective bargaining agreements.
Wellness program. Take a structured approach to improving employee health and, therefore, reduce the needfor more costly health care interventions. • ROI for large employers averages $3.27 over a three-year period (includes soft dollar savings). Smaller
employers can see a return on investment as well. • The program can start with a limited scope of interventions or delivery mechanisms, but more comprehen-
sive programs will have the greatest effect.• Steps must be taken to encourage employees to participate.• Wellness programs have clear health benefits for employees.
Self-insurance. Retain the risk associated with health insurance, as well as the profit.• Can result in about a 10% reduction in health care costs.• Self-insurance is generally effective only for cost-beneficial for larger employers (with at least 200 employees)• Requires active management of risk (e.g., stop-loss insurance)• Gives employer great flexibility to design the benefit. This provides the opportunity to design benefits that
best meet employee and employer needs.
17
Containing Health-Care Costs: Proven Strategies for Success in the Public Sector
To reduce excess usage, intro-duce a consumer-driven mindsetto employee health care .
B – 21

Cooperative purchasing. Pool with other employers to augment purchasing power.• Can help reduce costs by approximately 5% to 20%• Provides economies of scale and access to best practices that might not otherwise be available.• Members of the pool must give up some flexibility for the pool to work.• Some governments (e.g., larger jurisdictions and/or those with very good claims experience) might be bet-
ter off outside of the pool.
VBID disease management. Use cost differentials to direct limited medical resources to their best effect.• ROI of about $4 for every $1 invested, over a multi-year period (including soft-dollar savings).• Can start with a focus on one or two diseases and expand from there.• Improves health outcomes for targeted employee groups.• VBID is perhaps the least common of the strategies presented here, but the Asheville Project provides a
solid model.
Besides considering the individual strategies, employersshould consider the potential for interactions amongstrategies, both positive and negative. Examples includethe following:• GFOA’s most successful users of wellness and dis-
ease management cited their self-insurance pro-grams as crucial to their success. This is becauseself-insurance typically grants access to a greateramount of claims detail than would be available frommany commercial insurers. The data can be used to tailor the program to the greatest needs and to trackprogress. Also, a self-insured arrangement means that the employer will capture the full monetary benefit ofa wellness or disease management program.
• An on-site clinic can boost participation in a wellness program because it makes it much more convenientfor employees to get blood screens, visit a medical professional, etc.
• A cooperative purchasing arrangement can provide the economies of scale necessary for strategies thatare normally limited to larger employers, such as an on-site clinic or self-insurance.
• An on-site clinic that charges less than “market value” for services in order to entice employees to use itcould run afoul of IRS rules for the types of health plans that HDHP employees are allowed to participatein. This would prevent employees or employers from making contributions to an HSA, for example.
Building SupportChanges to the benefit plan can be a controversial subject. Employees could see a change in the level of bene-fits as a change in their compensation, and a change in the benefit plan might reduce their total take-home pay.Decision makers (i.e., elected officials, executive management) are concerned with the job satisfaction of thegovernment’s workforce, the ROI of changes to the plan, and public perceptions. Below are strategies for work-ing with employees and decision makers to build support for changes to the health care benefit.
EmployeesA first strategy to consider for building support with employees is an employee benefit committee. A committeeshould include members drawn from collective bargaining groups, employees who aren’t represented by collec-tive bargaining, and management. The committee should be given substantive responsibility over the design ofthe benefit plan. For example, in Clackamas County, Oregon (population 375,000, 1,800 employees in benefit-eligible positions), the committee decides the level, scope, and design of benefit plans offered to employees formedical and vision coverage, dental coverage, and for disability and life insurance. However, the committeemust also take responsibility for designing a plan that is affordable, including examining claims data to account
18
Containing Health-Care Costs: Proven Strategies for Success in the Public Sector
Besides considering the indi-vidual strategies, employersshould consider the potentialfor interactions between strategies, both positive andnegative.
B – 22

for high cost areas and respecting financial constraints the government is subject to. Further, committee mem-bers serve as ambassadors to the employee group they were drawn from by soliciting feedback on planchanges and helping to explain cost drivers and decisions. GFOA’s case studies have found that benefit com-mittees can go a long way toward building acceptance of benefit changes; however, the success of the commit-tee depends on a collaborative spirit and transparency of information (e.g., claims, costs, available resources).
Another strategy is to educate employees about the value of their benefit so that they better appreciate thecosts involved and the need for the benefit to be managed carefully. One popular tool is a benefit value state-ment. Benefits are significant piece of employee compensation, yet most employees don’t understand the valueof what they are receiving. A benefit value statement lists out the benefits that are available to the employee,along with the monetary value of those benefits. However, it is important that the benefit statement not just enu-merate the employer’s costs, but that it also helps the employee understand what benefits are available andhow to get the best use of them. This makes it more likely that employees will read the information and evenshare it with their spouses. In addition, group and individual meetings around enrollment time can supplementthe written statement, giving employers the opportunity to explain benefits in person and make sure employeesunderstand what is available.
Many of the strategies discussed in this paper have potential value for employees. While the primary objectiveof these strategies is to control employer costs, GFOA’s case studies have highlighted some examples of posi-tive effects on employees:• On-site clinics are convenient for employees and can reduce their out-of-pocket costs for medical care.• If employees share a variable of the premium cost (e.g., a percentage of total), any strategy that reduces
premium costs can put more money in their pockets.• A health savings account and high deductible health plan could provide a means for some employees to
start saving money, tax free, for the future.• A wellness program or a disease management program can lead to better long-term health outcomes.• Self-insurance allows the employer more freedom to design a plan that most precisely meets the needs of
the workforce.
Decision MakersDecision makers have multiple concerns when it comes to changes to the benefit plan. By following the guidelinesabove for gaining employee support, decision makers’ concerns about workforce satisfaction can be alleviated.However, that still leaves concerns about public perceptions as well as return on investment.
Public employee compensation has been a hot topic in the news, so decision makers will naturally be cognizantof public perceptions. A first step is to do a total compensation study that compares the total value of compensa-tion packages with those of comparable governments. Appendix 1 provides a table of employer costs per hour
19
Containing Health-Care Costs: Proven Strategies for Success in the Public Sector
Unions: An Impediment to Health Benefit Reform?Conventional wisdom is that unions are a serious barrier to cost containment of the health benefit. Indeed,GFOA’s survey showed that collective bargaining restrictions were cited by about a quarter of respondentsfor not using strategies like increasing deductible, increasing employees’ premium costs, or eliminatingbenefits. However, the survey also showed no relationship between the level of total savings experiencedfrom all cost containment strategies and the extent to which the workforce is unionized. At least part of theexplanation seems to be that the strategies where collective bargaining restrictions are most important arethe same strategies that almost all employers would prefer to avoid as much as possible anyway. Also,strategies with high potential ROI, like wellness, on-site clinics, self-insurance, or disease management,typically would not run afoul of collective bargaining restrictions.
B – 23

worked for total employee compensation and costs as a percent of total compensation for state and local govern-ment workers, including by employer size and bargaining unit status. The table was provided to GFOA by theBureau of Labor Statistics using unpublished data from the Bureau’s National Compensation Survey. Appendix 1also provides advice from the Bureau on using its National Compensation Survey data for comparative purposes.
In today’s political climate, decision makers might also wish to compare compensation costs with regional aver-ages for all employers of a similar size (public or private) to get better sense of the compensation of public ser-vants compared to those they serve. While this is certainly a valid question, the Bureau of Labor Statistics cau-tions against using National Compensation Survey data for cross-sector comparisons, given differences in com-pensation structures and occupations. As such, public managers will have to undertake a more customized andnuanced analysis if they wish to address this question.
The final concern decision makers have is the ROI from pursuing health benefit cost containment strategies.The first step to achieving a positive ROI is to take a long-term approach. GFOA’s best practice, StrategicHealth-Care Plan Design, recommends that governments develop and adopt a formal multi-year plan to man-age health care costs. This helps emphasize to all decision makers that the economics of many cost manage-ment strategies can take a while to fully develop, so a long-term commitment is required.
A long-term plan also makes it easier to take smaller stepstoward a larger ultimate goal. An incremental approach lim-its the upfront investment and allows managers to assessthe impacts of relatively small changes, and then makeadjustments before proceeding further. It also limits theamount of change that employees will have to adjust to atone time. Many cost management strategies are compati-ble with an incremental approach. Here are some exam-ples from GFOA’s case studies:• A wellness or disease management program can start
off by focusing on just one or two particular types ofintervention (e.g., weight loss, diabetes). Use anemployee health risk assessment and/or claims analy-sis to suggest which intervention would offer the bestROI.
• A high deductible health plan could start off with a deductible at the IRS minimum and move up over time.Employers can seed the employees’ health savings accounts, at least temporarily, to help them make thetransition.
• An employer could self-insure the dental plan as a low-risk way to get experience with self-insurance. If itproves successful, self-insurance of other benefits could be explored.
CONCLUSIONPublic employers face relentless upward pressures on health care costs. This paper has identified six leveragepoints employers have available for managing costs, as well as specific strategies for each. The optimal strate-gies for any given employer will vary with size, political environment, and the needs of the employees. However,the positive experiences many governments across the United States have had with health care cost contain-ment illustrates that success is possible. By selecting and sticking to focused strategies, public employers canbegin to change their approach to employee health care, both saving money and preserving the value of thebenefit for employees.
20
Containing Health-Care Costs: Proven Strategies for Success in the Public Sector
Public employee compensation has been a hot topic in thenews, so decision makers arecognizant of public perceptions.A first step is to do a total com-pensation study that comparesthe total value of compensationpackages with those of compa-rable governments.
B – 24

State and Local Government Employer Costs per Hour Worked for Employee Compensation
and Costs as a Percent of Total Compensation
The information in the appendix (see chart on the following page) was provided to GFOA by the Bureau ofLabor Statistics, using unpublished data from the Bureau’s National Compensation Survey.
What is the National Compensation Survey (NCS)?
• Comprehensive employer-based survey of approximately 36,000 establishments• Represents almost all industries in the private sector and state and local government (note: the table in this
appendix uses only state and local government data)• Includes all employee size classes
Employer Costs for Employee Compensation
• NCS provides estimates of employer costs for wages and salaries and individual benefits• Includes all major benefits but does not include low-cost benefits, items that are a cost of doing business,
training, or payments in kind• Estimates are expressed as a cost per hour worked (CPHW)• Produced four times a year
Making Comparisons
• You can compare any grouping of employees to NCS data that makes sense for your purposes. • Wages and salaries are calculated by:
� Wages = Hourly wage rate� Salary = Pay divided by the hours worked for that specific time period
• Benefits are calculated according to cost per hour worked (CPHW)� CPHW = Annual cost divided by annual hours worked � Annual hours worked = Scheduled hours - leave hours (paid and unpaid) + overtime hours
• Avoid double counting and excluding costs• Make apples-to-apples comparisons:
� Government versus government� Occupation versus occupation
21
Appendix 1
B – 25

Exhibit 1: Employer Costs per Hour Worked for Employee Compensation and Costs as a Percent of Total Compensation:State and Local Government Workers, by Establishment Employment Size and Bargaining Unit Status, June 2011
100 Workers or More
Cost Percent Cost Percent Cost Percent Cost Percent Cost Percent Cost Percent Cost Percent Cost Percent
Total Compensation $29.92 100.0 $27.86 100.0 $33.28 100.0 $42.01 100.0 $37.11 100.0 $43.72 100.0 $48.95 100.0 $33.38 100.0
Wages and Salaries $19.75 66.0 $18.61 66.8 $21.62 65.0 $27.43 65.3 $24.32 65.5 $28.52 65.2 $30.99 63.3 $22.65 67.8
Total Benefits $10.17 34.0 $9.26 33.2 $11.66 35.0 $14.58 34.7 $12.79 34.5 $15.20 34.8 $17.96 36.7 $10.73 32.2
Paid Leave $2.13 7.1 $1.95 7.0 $2.43 7.3 $3.16 7.5 $2.61 7.0 $3.35 7.7 $3.62 7.4 $2.54 7.6
Vacation $0.93 3.1 $0.89 3.2 $0.99 3.0 $1.18 2.8 $0.99 2.7 $1.25 2.9 $1.25 2.6 $1.06 3.2
Holiday $0.66 2.2 $0.63 2.2 $0.71 2.1 $0.91 2.2 $0.72 1.9 $0.98 2.2 $1.02 2.1 $0.76 2.3
Sick $0.44 1.5 $0.37 1.3 $0.56 1.7 $0.84 2.0 $0.68 1.8 $0.89 2.0 $1.05 2.2 $0.56 1.7
Personal $0.11 0.4 $0.07 0.3 $0.17 0.5 $0.23 0.6 $0.22 0.6 $0.23 0.5 $0.29 0.6 $0.15 0.5
Supplemental Pay $0.24 0.8 $0.25 0.9 $0.22 0.7 $0.35 0.8 $0.29 0.8 $0.37 0.9 $0.45 0.9 $0.25 0.7
Overtime and Premium(1) $0.12 0.4 $0.13 0.5 $0.11 0.3 $0.18 0.4 $0.17 0.5 $0.19 0.4 $0.26 0.5 $0.11 0.3
Shift Differentials $0.02 0.1 $0.02 0.1 $0.02 (2) $0.05 0.1 $0.03 0.1 $0.06 0.1 $0.06 0.1 $0.04 0.1
Non‐production Bonuses $0.10 0.3 $0.10 0.4 $0.09 0.3 $0.12 0.3 $0.09 0.2 $0.13 0.3 $0.13 0.3 $0.10 0.3
Insurance $3.43 11.5 $2.94 10.6 $4.23 12.7 $5.05 12.0 $4.67 12.6 $5.18 11.9 $6.59 13.5 $3.39 10.2
Life $0.04 0.1 $0.04 0.2 $0.04 0.1 $0.09 0.2 $0.05 0.1 $0.11 0.2 $0.13 0.3 $0.05 0.1
Health $3.34 11.2 $2.86 10.3 $4.12 12.4 $4.89 11.6 $4.55 12.3 $5.01 11.4 $6.38 13.0 $3.29 9.9
Short‐term Disability $0.02 0.1 $0.02 0.1 $0.03 0.1 $0.03 0.1 $0.02 0.1 $0.03 0.1 $0.04 0.1 $0.02 (2)
Long‐term Disability $0.03 0.1 $0.02 0.1 $0.04 0.1 $0.04 0.1 $0.04 0.1 $0.04 0.1 $0.05 0.1 $0.04 0.1
Retirement and Savings $1.98 6.6 $1.68 6.0 $2.47 7.4 $3.52 8.4 $2.90 7.8 $3.74 8.6 $4.46 9.1 $2.38 7.1
Defined Benefit $1.71 5.7 $1.37 4.9 $2.25 6.8 $3.20 7.6 $2.64 7.1 $3.40 7.8 $4.21 8.6 $2.02 6.0
Defined Contribution $0.28 0.9 $0.31 1.1 $0.22 0.7 $0.32 0.8 $0.26 0.7 $0.34 0.8 $0.26 0.5 $0.36 1.1
Legally Required Benefits $2.38 8.0 $2.42 8.7 $2.32 7.0 $2.49 5.9 $2.32 6.2 $2.55 5.8 $2.84 5.8 $2.17 6.5
Social Security and Medicare $1.50 5.0 $1.44 5.2 $1.60 4.8 $1.92 4.6 $1.71 4.6 $2.00 4.6 $2.16 4.4 $1.63 4.9
Social Security(3) $1.19 4.0 $1.15 4.1 $1.25 3.8 $1.49 3.5 $1.32 3.6 $1.54 3.5 $1.66 3.4 $1.27 3.8
Medicare $0.31 1.0 $0.29 1.1 $0.34 1.0 $0.44 1.0 $0.39 1.0 $0.46 1.0 $0.50 1.0 $0.36 1.1
Federal Unemployment Insurance (4) (2) (4) (2) (4) (2) (4) (2) (4) (2) (4) (2) (4) (2) (4) (2)
State Unemployment Insurance $0.12 0.4 $0.13 0.5 $0.11 0.3 $0.11 0.3 $0.16 0.4 $0.09 0.2 $0.11 0.2 $0.11 0.3
Workers' Compensation $0.76 2.5 $0.85 3.1 $0.61 1.8 $0.45 1.1 $0.45 1.2 $0.45 1.0 $0.57 1.2 $0.43 1.3
1 Includes premium pay for work in addition to the regular work schedule (such as overtime, weekends, and holidays)
2 Less than .05%.
3 Comprises the old‐age, survivors, and disability insurance (OASDI) program Source: Bureau of Labor Statistics 4 Cost per hour worked is $0.01 or less. National Compensation SurveyNote: The sum of individual items may not equal totals due to rounding. UNPUBLISHED DATA
100‐499 Workers50‐99 Workers100 Workers or
More
Bargaining Unit Status
Union Non‐union500 Workers or
More
1‐99 WorkersCompensation Component
1‐99 Workers 1‐49 Workers
B – 26
1 Kaiser Family Foundation/Health Research and Educational Trust, Employer HealthBenefits 2010 Annual Survey. Available online at http://ehbs.kff.org/.
2 PriceWaterhouseCoopers. “Behind the numbers: Medical cost trends for 2012.” March2011.
3 See “Growth in Health Care Costs,” Congressional Budget Office testimony given by PeterR. Orszag, January 31, 2008.
4 PriceWaterhouseCoopers. “Behind the numbers: Medical cost trends for 2012.” March2011.
5 The margin of error represents a 90% confidence level, which is to say that GFOA is 90%certain the true population statistic falls within the margin of error range.
6 Joseph Ruzich. “Romeoville, IL, offering cash for employees who opt out of health care.”Chicago Tribune TribLocal online service. October 2010.
7 A 2003 survey by the International City/County Managers Association showed about a 15%cost advantage for HMOs versus PPOs.
8 Xuguang Tao, MD, PhD; David Chenoweth, PhD, FAWHP; Amy S. Alfriend, RN, MPH,COHN-S/CM; David M. Baron, MBA, CISSP; Tracie W. Kirkland, MS, APRN/PNP; Jill Scherb,PAC; Edward J. Bernacki, MD, MPH. “Monitoring Worksite Clinic Performance Using a Cost-Benefit Tool.” Journal of Occupational and Environmental Medicine. Volume 51, Number 10,October 2009.
9 A full panel blood draw provides a variety of measures for cholesterol, glucose, liver func-tion, etc.
10 See Xuguang Tao, et al. for a discussion of ROI. ROI figures often include soft-dollar sav-ings like less sick time used and higher productivity. Xuguang and colleagues cite the mostmodest ROI figures; consulting groups and industry advocates cite higher figures. Differenceslikely stem from differences in how ROI is calculated (e.g., which benefits of clinics are includ-ed in calculation and how they are monetized) and the structure of the clinics being evaluated.
11 “Employers Implement On-Site Health Clinics to Manage Costs.” Hewitt Associates LLC,August 2008.
12 A. Mark Fendrick, MD. “Value-Based Insurance Design Landscape Digest.” Center forValue-Based Insurance Design at University of Michigan. July 2009.
13 The rules for HRAs are set by the IRS. See, for example, IRS publication 969.
14 Steve Neeleman. “Making Health Savings Accounts Work.” Compensation & BenefitsReview. 2005 37:33.
15 One author estimates that 80% of an employer’s costs are caused by 10% of plan partici-pants, due to chronic disease. Adapted from Samuel H. Fleet. “Self-Funding: Taking Control ofan Employer's Health Benefits Destiny Under the Patient Protection and Affordable Care Act.”Compensation & Benefits Review. 43: 30. 201l.
16 While it is possible to use both an HRA and HSA, doing so creates many complicationsunder IRS rules, so is uncommon in practice.
23
Notes
B – 27
17 This belief is supported by research that showed a greater level of savings and participantengagement with HSAs than HRAs. See Joanne Sammer and Stephen Miller. “Consumer-Driven Decision: Weighing HSAs vs. HRAs.” Society for Human Resource Management. May201l.
18 Manoj Athavale, Stephen M. Avila, and Kevin M. Gatzlaff. “An Empirical Comparison of aLow-Deductible Health Plan with an HSA-Qualified Plan.” Compensation & Benefits Review2010 42: 102
19 Paul Brucker, in a white paper by Alliant Benefit Solutions titled “Is an HDHP/HSA the rightprescription for your company?” quotes benefit consultants who estimate typical savings ofabout 30%, and as high as 40%. Other studies by United Health Group and Council forAffordable Health Insurance show savings of closer to 12%.
20 All figures are net of seed contributions made to employees’ HSAs.
21 Research shows that more than 90% of group HDHPs offer first-dollar care. See “ASurvey of Preventive Benefits in Health Savings Account (HSA) Plans, July 2007.” America’sHealth Insurance Plans. November, 2007.
22 “A Survey of Preventive Benefits in Health Savings Account (HSA) Plans, July 2007,”America’s Health Insurance Plans, November, 2007.
23 In a study by Alliant, only 32% of survey respondents had heard of an HDHP if their com-pany did not offer one. Another study by Guardian Life Insurance showed, for example, that60% of workers do not realize they would own an HSA, and 55% aren’t aware that spendingfor qualified expenses from HSAs is tax free.
24 Results from the Kaiser Family Foundation Survey of Employer-Sponsored HealthBenefits, 2010, show that 81% of firms with more than 200 employees see wellness programsas effective in improving employee health, and 69% see them as effective in controlling costs.
25 ROI figures include soft-dollar savings like productivity gains and reduced absenteeism.See Katherine Baicker, David Cutler, and Zirui Song. “Workplace Wellness Programs CanGenerate Savings.” Health Affairs. February 2010.
26 National averages are based on information from The Kaiser Family Foundation and theHealth Research & Educational Trust Employee Health Benefits Survey 2010.
27 A co-morbid condition is an illness that occurs along with obesity at greater rates thanwould be found in the normal population. An example is diabetes.
28 Such programs have been shown to have an ROI of 1.00 to 1.70 after three years. GeorgeThomas DeVries III. “Innovations in Workplace Wellness: Six New Tools to Enhance Programsand Maximize Employee Health and Productivity.” Compensation & Benefits Review. 2010 42: 46.
29 A 2008 survey of large employers by Watson Wyatt showed that 74% expected to beusing incentives in 2009, up from 50% in 2008. See the 13th Annual National Business Groupon Health/Watson Wyatt study “The One Percent Strategy: Lessons Learned From BestPerformers.”
30 Ha T. Tu and Ralph C. Mayrell. “Employer Wellness Initiatives Grow, but EffectivenessVaries Widely.” Research Brief. National Institute for Health Care Reform. July 2010.
24
Notes
B – 28

25
31 “Behavioral Economics: Seven Ways to Engage Employees in Health Care.” TowersWatson. March 2010.
32 “Trim staff, fat profits? American firms are offering staff carrots to stay fit. Soon they willwield sticks.” The Economist. July 30, 2011.
33 George Thomas DeVries III. “Innovations in Workplace Wellness: Six New Tools toEnhance Programs and Maximize Employee Health and Productivity.” Compensation &Benefits Review. 2010 42: 46.
34 Ibid.
35 King County was not investigated directly by GFOA, but its experience is described in: HaT. Tu and Ralph C. Mayrell. “Employer Wellness Initiatives Grow, but Effectiveness VariesWidely.” Research Brief. National Institute for Health Care Reform. July 2010.
36 For more information, see Christopher S. Sears and Shalina A. Schaefer. “LegalImplications of Employee Wellness Programs for Governmental Employers.” Ice Miller, LLP.2011.
37 Samuel H. Fleet. “Self-Funding: Taking Control of an Employer's Health Benefits DestinyUnder the Patient Protection and Affordable Care Act.” Compensation & Benefits Review. 43:30. 2011.
38 The Kaiser Family Foundation and the Health Research & Educational Trust EmployeeHealth Benefits Survey 2010.
39 Fleet.
40 Ibid.
41 Adapted from Fleet, op cit.
42 One author estimates that 80% of an employers costs are caused by 10% of plan partici-pants. Adapted from Fleet, op cit.
43 Peter R. Orszag. “How Health Care Can Save or Sink America: The Case for Reform andFiscal Sustainability.” Foreign Affairs Magazine. July/August, 2011.
44 A. Mark Fendrick, MD. “Value-Based Insurance Design Landscape Digest.” Center forValue-Based Insurance Design at University of Michigan. July 2009.
45 Example taken from A. Mark Fendrick, MD. “Value-Based Insurance Design LandscapeDigest.” Center for Value-Based Insurance Design at University of Michigan. July 2009.
46 These programs are collectively known as “The Asheville Project” and were extensivelystudied and written about in the Journal of the American Pharmacists Association. ROI figuresinclude soft-dollar savings (e.g., productivity enhancements, less time off work, etc.).
47 Barry A. Bunting, Benjamin H. Smith, and Susan E. Sutherland. “The Asheville Project:Clinical and economic outcomes of a community-based long-term medication therapy man-agement program for hypertension and dyslipidemia.” Journal of American PharmacistsAssociation. January/February 2008.
Notes
B – 29


Appendix C
Bolton Partners Memo – The Discount Rate for OPEB Calculations


1
Memorandum To: John Hammond From: Tom Lowman Date: January 13, 2012 Re: The discount rate for OPEB calculations
The following are some of my thoughts and opinions on the question of whether 4% or 8% is the right assumption1 to measure the value of the County's OPEB promises. The answer is largely based on the "purpose" of the measurement. For example, here are three different purposes for this assumption:
• Funding: Determine the County's contribution to prefund the benefit • Accounting: Determining the County's accounting expense • Value to members: Determining the market value of the promise to participants
Each of these purposes likely has a different answer. There may also be differences due to whether we are (1) following existing rules, (2) creating our own theoretical basis for choosing a rate or (3) considering political realities within certain ranges of reasonableness. Why 4%? Under current accounting rules the County must use a short term interest rate. In the past the County has used 4% for this purpose. We could argue that the 4% rate is too high in the current market but in the long term might be appropriate. A 4% rate is lower than the rate expected to be earned on money invested like the pension fund (which would be closer to 8%). If the County moved from the pay-as-you-go funding approach to prefunding like with the pension fund, the discount rate could be increased to 8% under existing GASB accounting rules. When we usually discuss 4% or 8% it is tied the impact under current accounting rules and the choice between pay-as-you-go vs. prefunding. Accounting rules are not static. However, the 2011 proposed changes in the GASB pension accounting rules would change the basis from short term rates to a long term government bonds index but for unfunded plan but the result in the current market environment would be about the same. (There are many other types of proposed changes).
1 For the purpose of this memo we will not distinguish between the expect return on investments and the discount rate. However, generally we are taking about the correct discount rate.
C – 1

January 13, 2012
2
Why 8%? We expect about an 8% return on pension fund investing. Some pension plans assume less than 8% but few are lowering expectations below 7%. 8% remains a common assumption for pension plans and is used for funding and accounting purposes. This 7% to 8% range is not a risk free return expectation, meaning that future taxpayers will bear investment risk (the larger the fund the larger the risk) and we have seen over the last decade how expensive the investment risk can be. If we were to determine the value of the benefit to a member, the right discount rate is probably closer to 4%. Employees could not "buy" this benefit on their own in the market place based on an 8% discount rate. Setting a proper discount rate to measure employee value also is complicated since it is difficult to determine the risk premium associated with the likelihood that the payment of the benefit continues. The commission's goals seem to include reducing OPEB benefits to a level the County can afford to fund fully on a prefunding basis (thus reducing the benefit but adding security by creating a dedicated trust fund). At one extreme this could mean to fund at a conservative discount rate (e.g. 4%) and fund any unfunded liability immediately (not over 30 years). Politically this is not going to happen and this would be more conservative than even the pension plan is managed. Anything less conservative leaves a cost (or risk) to future taxpayers or requires virtual elimination of benefits. Therefore, for practical reasons we would expect many on the commission to select the highest reasonable discount rate and push out the amortization period as far as they deem reasonable. For this reason, we would expect that many on the Commission would support using an 8% return assumption (to match the pension plan) and a 30-year amortization period (the current allowable maximum GASB 45 period). Will some look back later and complain that this choice was not conservative enough? Yes, but that is why we created this memo. Because this benefit has not been funded in the past, to ask the current generation of taxpayers to pay for both current and past promises on a more conservative basis is perhaps too much to ask. Also, the more conservative the assumptions, the deeper the needed cuts. Political will and fairness often limit what can be done.
C – 2

Appendix D
Aon Presentation – October 11, 2011

111
Aon Consulting Health Reform
Anne Arundel County OverviewOctober 11, 2011
22
Overview and Current Environment0
Case Studies and Impact Analysis3
Select Health Reform Provisions 5
Key Action Steps for Plan Sponsors2
Today’s Discussion
Considerations for Dropping Group Coverage4
Latest Regulatory Guidance1
D – 1

3
Health Reform Overview
• Health reform is a journey; not an event
– Legislation spans 2010 – 2018 and beyond
• The legislation is complex and lacks clarity
– Employers will need professional advice and services to achieve compliance, assess cost implications, redesign benefit structure, and establish long term strategy
– Employers should review all legal issues with their counsel
• Legislation drives coverage expansion and insurance market reform
– Minimal near-term assistance for employers to help control costs
4
Healthcare Reform – Impact on Stakeholders
Increase in CustomersFees/Taxes
Min Loss Ratio Requirements
Consumer Protections
Individuals
Employers InsuranceCompanies
HealthcareProviders
Increase in DemandChanges in
Medicare Reimbursements
AccessAffordabilityConsumer ProtectionsIndividual Mandate
Reform Builds on Employer-Sponsored SystemPlay-or-Pay Starting 2014Short-term Trend Increase
Reform focus is on Access, not on Cost Control
D – 2

Health Reform Overview—Coverage v. Cost
Health InsuranceExchanges with Reformed Rules
Expanding/Improving Coverage Paying for Expanded Coverage
Expansion of Medicaid
EmployerMandate
IndividualMandate
Federal Coverage Subsidies
Medicare/MedicaidPayment Changes
High-Cost EmployerCoverage Taxation
IncreaseOther Taxes
= Direct impact to employers
= Indirect impact to employers
= Direct and indirect impact to employers
Taxation of HighIncome Individuals
Free Rider Penalty
The Price Tag
CBO Estimate—New Savings, New Revenue Will Offset Higher Costs
$32
Excisetaxes
System Savings
$517 billion
New Revenue
$564 billion
Total Cost of Expanded Coverage: $938 BillionImpact: $143 Billion reduction to the federal deficit (without “doc fix”)
$65
PenaltyPayments
MedicareAdvantage Cuts
$136
Reduction in Medicare
growth rate
$196
Other net savings
$115
CLASSProgram
$70 $107
IndustryFees
$210
Medicare Taxes
$150
Other net revenues
D – 3

If Past is Prologue, Expect More Health Care Legislation
Federal health care legislation enacted into law (1985-2010)COBRA (1985)*
Section 89 (1986)* and repeal of section 89 (1990)*
The Medicare catastrophic coverage program and repeal (1990)*
The Clinton Health Care Debate (1992-1994)
HIPAA (1996)*
Medicare + Choice (1996)*
The Patients’ Bill of Rights (1996-2001)*
The Women's Health and Cancer Rights Act (1998)*
* White House and Congress controlled by different political parties
If Past is Prologue, Expect More Health Care Legislation
Medicare Part D, Medicare Advantage, and Health Savings Accounts (2003)
Mental Health Parity (2008)*
Michelle's Law and GINA (2008)*
COBRA subsidies (2009 and 2010)
Patient Protection and Affordable Care Act (2010)
* White House and Congress controlled by different political parties
D – 4

The Agencies—Moving Forward . . .
Implementation of PPACA continues Claims and appeals process, including IROs, effective this year for non-grandfathered plans
Guidance due by March on new communication rules (4 page summary) for group health plans
Employers still awaiting guidance on “essential health benefits”
– TMJ syndrome
– Chiropractic benefits
– Infertility treatments
Effective date of automatic enrollment postponed until guidance is issued (likely 2014)
. . . But Not in All Areas
Nondiscrimination testing rules for fully insured group health plans will not go into effect until after the issuance of regulations
– Were originally scheduled to become effective January 1, 2011 for calendar year, non-grandfathered insured plans
– Now will become effective 2012, at the earliest
Guidance postpones imminent implementation of testing rules that were expected to result in the termination or restructuring of many executive-only medical plans
– These plans get a reprieve until at least 2012, and possibly later
– W-2 reporting of value of group benefits delayed until 2012 (reportable in 2013)
D – 5

Potential Market Impact of MLR (Medical Loss Ratio) Requirements
New MLR requirements are as follows:
– 85% minimum MLR for large market (100+EEs)
– 80% minimum MLR for individual and small group markets
States still reviewing new regulations on MLRs and carriers continue to adopt a low profile on how MLR rules will impact renewals and new business.
Carriers must determine potential rebate exposure from new MLR calculations
Carrier must begin paying rebates to policyholders beginning in 2012
11
Potential Market Impact of MLR (Medical Loss Ratio) Requirements
Some smaller carriers/health plans may downsize their product offerings and/or exit insured business in response to potential MLR exposure
Carriers (and consultants) may look to convert insured business to ASO funding
Carrier may re-assess administrative costs of internal programs based on MLR impact
Big question is the impact of MLR regulations on individual products offered in the state Insurance Exchanges given the high probability of adverse selection of Exchange enrollees
MLRs (combined with excise tax on insured plans) will impact carrier profitability and may affect ASO fees for self funded plans
12
D – 6
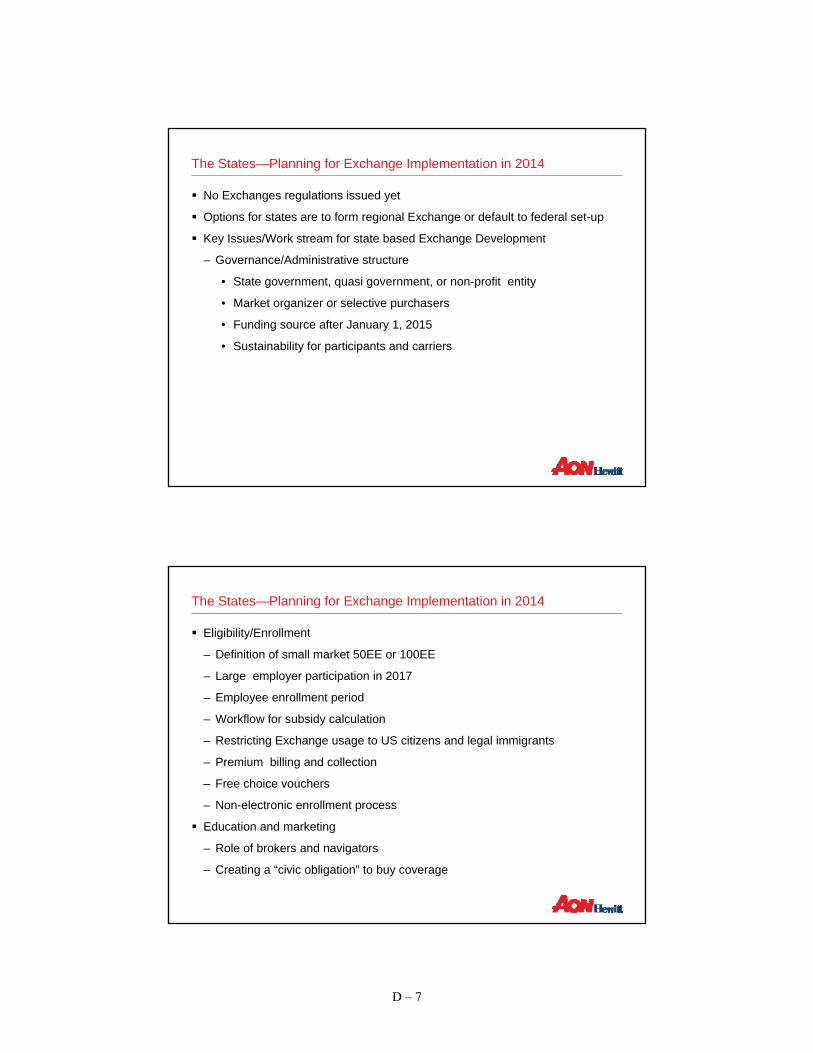
The States—Planning for Exchange Implementation in 2014
No Exchanges regulations issued yet
Options for states are to form regional Exchange or default to federal set-up
Key Issues/Work stream for state based Exchange Development
– Governance/Administrative structure
• State government, quasi government, or non-profit entity
• Market organizer or selective purchasers
• Funding source after January 1, 2015
• Sustainability for participants and carriers
The States—Planning for Exchange Implementation in 2014
Eligibility/Enrollment
– Definition of small market 50EE or 100EE
– Large employer participation in 2017
– Employee enrollment period
– Workflow for subsidy calculation
– Restricting Exchange usage to US citizens and legal immigrants
– Premium billing and collection
– Free choice vouchers
– Non-electronic enrollment process
Education and marketing
– Role of brokers and navigators
– Creating a “civic obligation” to buy coverage
D – 7

The States—Planning for Exchange Implementation in 2014
Information TechnologyCalculation of costs and benefit levels and what is visible to the applicant
Linkage to other state and federal databases
Paperless system accessible by consumer, brokers, and navigators
Web site development and maintenance
Carrier and Plan SelectionInnovation of new plan options
Quality ratings and member decision support
Definition of small markets and non-Exchange market
Risk adjustment mechanism to deal with risk selection
How many carriers will play?
15
The States—Planning for Exchange Implementation in 2014
Financial ManagementShould individual & small markets be merged
Cost control
Funding sources in 2015
Rate review of Exchange plans
Dealing with potential selection bias from weak penalties for individual mandate
16
D – 8

1717
Latest Regulatory Guidance1
Case Studies and Impact Analysis3
Select Health Reform Provisions 5
Key Action Steps for Plan Sponsors2
Today’s Discussion
Reference: Health Reform Chronology8
6 Health Reform Self-Service Tools
Appendix: Legislative Details and Model Notices7
Considerations for Dropping Group Coverage4
Overview and Current Environment0
The States—Adult Child Rule and State Income Tax Laws
Employers that adopted adult child coverage during 2010 might have to report imputed income for state income tax purposes on coverage of employees' adult children
In 2010, IRS ruled that adult child coverage would not be taxable to employees for federal income tax purposes
Some state income tax laws (e.g., Connecticut, New York) automatically mirror the Federal definition of adjusted gross income when defining adjusted gross income for state income tax purposes
– Additional state legislative action not necessary to incorporate new enactments of Federal law
D – 9

The States—Adult Child Rule and State Income Tax Laws
Many state income tax laws do not automatically mirror Federal definition
– Definitions in the state income tax codes are tied to Federal definitions as of a particular date
– State legislation is necessary to incorporate newly enacted Federal provisions
According to the American Payroll Association, as of November 2010, several states had not yet amended their income tax laws to exclude the value of health insurance coverage for adult children who do not otherwise qualify as Federal income tax dependents
A New Compliance Era Began March 23, 2010
Patient Protection and Affordable Care Act (“PPACA”) now governs all health care plans
There are three types of employer health care plans:
– “Grandfathered Health Plans” as of March 23, 2010;
– “Grandfathered Health Plans” that lose their “grandfather” status; and
– “New” health care plans established after March 23, 2010
Each type also can be collectively or non-collectively bargained
D – 10
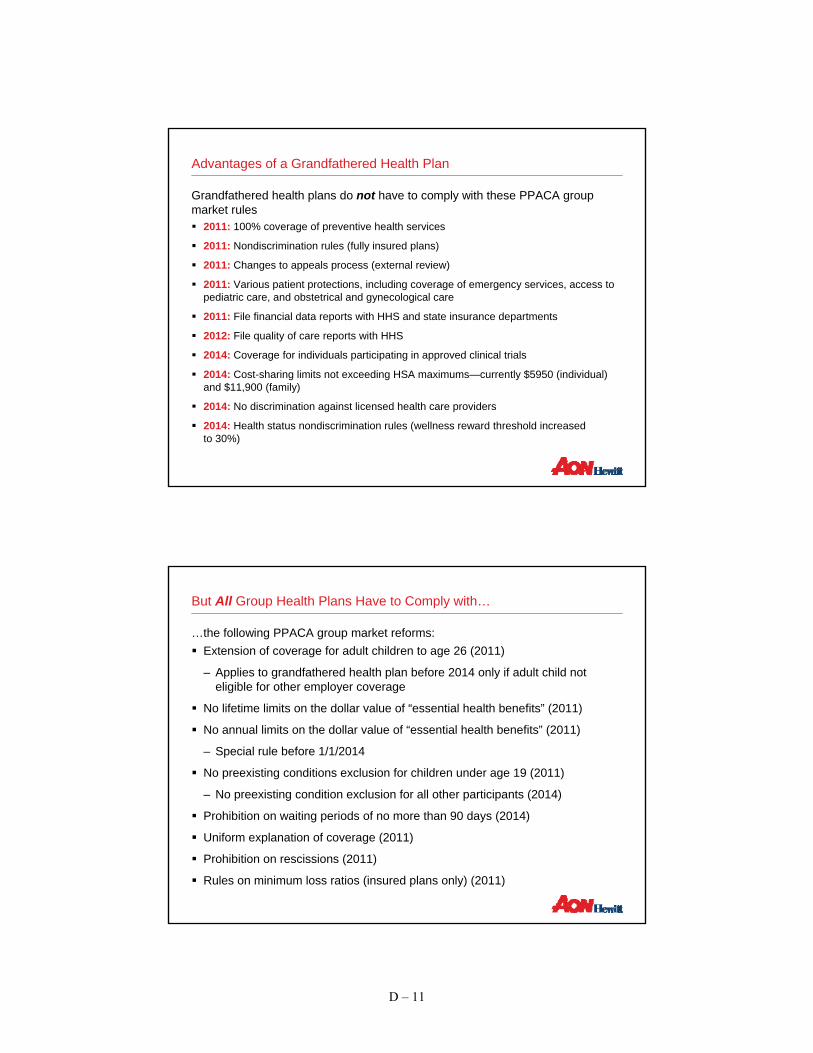
Advantages of a Grandfathered Health Plan
Grandfathered health plans do not have to comply with these PPACA group market rules
2011: 100% coverage of preventive health services
2011: Nondiscrimination rules (fully insured plans)
2011: Changes to appeals process (external review)
2011: Various patient protections, including coverage of emergency services, access to pediatric care, and obstetrical and gynecological care
2011: File financial data reports with HHS and state insurance departments
2012: File quality of care reports with HHS
2014: Coverage for individuals participating in approved clinical trials
2014: Cost-sharing limits not exceeding HSA maximums—currently $5950 (individual) and $11,900 (family)
2014: No discrimination against licensed health care providers
2014: Health status nondiscrimination rules (wellness reward threshold increased to 30%)
But All Group Health Plans Have to Comply with…
…the following PPACA group market reforms:Extension of coverage for adult children to age 26 (2011)
– Applies to grandfathered health plan before 2014 only if adult child not eligible for other employer coverage
No lifetime limits on the dollar value of “essential health benefits” (2011)
No annual limits on the dollar value of “essential health benefits” (2011)
– Special rule before 1/1/2014
No preexisting conditions exclusion for children under age 19 (2011)
– No preexisting condition exclusion for all other participants (2014)
Prohibition on waiting periods of no more than 90 days (2014)
Uniform explanation of coverage (2011)
Prohibition on rescissions (2011)
Rules on minimum loss ratios (insured plans only) (2011)
D – 11

Prevalence Data on Plans Losing Grandfather Status
About 85% of employers anticipate losing grandfather status for one or more medical plans by 2014
10%
51%
21%
8% 8%7%
18%
46%
0%
10%
20%
30%
40%
50%
60%
2011 2012 2013 2014
Self-Insured Plans Fully-Insured Plans
15%
16%
16%
39%
72%
0% 20% 40% 60% 80%
UnionNegotiations
ChangingCarriers
PlanConsolidation
SubsidyChanges
DesignChanges
Employers’ Estimate of Year in Which Grandfathering Will Be Lost
(n = 466)
Anticipated Cause of Lost Grandfathering
Source: 2010 Hewitt survey of employers’ reaction to grandfathered plan rules and guidance surrounding preventive care and other group market insurance reforms.
(n = 466; participants could select multiple responses)
24
Adult Child Dependent Coverage to Age 26
• Interim Final Regulations Issued May 10, 2010 – Addresses coverage extension– Effective for plan years beginning on or after September 23, 2010 regardless of plan’s
grandfathered status– Requires plans that provide dependent coverage to children to make coverage available to all
“children” under the age of 26• Student status, marital status, residency, financial support, dependent status for tax purposes,
or other criteria not applicable• Exception for grandfathered plans until January 1, 2014 if coverage under nonparent
eligible employer sponsored plan available– Mandates special enrollment opportunity for certain adult children
• Timing: No later than 1st day of plan year; must last 30 days • Must provide written notice to eligible adult children
• IRS Notice 2010-38 issued April 27 – Addresses taxation of coverage– Health coverage or reimbursement of medical expenses for a child who has not attained age 27
by the end of the taxable year will not be taxable to the employee • Tax exclusion applies even if the child is not a tax dependent• Effective on or after March 30, 2010• Special rule for cafeteria plans permitting retroactive amendments in 2010
D – 12

25
• Interim Final Regulations Issued June 28, 2010– Plans cannot impose annual or lifetime dollar limits on essential health benefits for plan years
beginning on or after September 23, 2010 except as noted below (regardless ofgrandfathered status)
• Restricted Annual Limit Exception– For plan years beginning before January 1, 2014, a group health plan or group health insurance
policy may impose the following restricted annual limits on essential health benefits:
• “Mini-Med” or Limited Benefit Plans Annual Limit Exception– A process will be established by which such plans may seek a waiver until 2014 to permit lower
restricted annual limits, if compliance with the higher limits would result in a significant decrease in access to benefits or a significant increase in premiums
• Grandfathered Plan Status Implications– A change in annual limits, even if permissible, can result in the loss of grandfathered plan status
Annual/Lifetime Dollar Limits
26
Patient Protections
Primary Care Providers Emergency Services• Interim Final Regulations Issued
– Require plans that offer a network of providers to permit any practitioner in the network to be designated as an individual’s primary care provider, pediatrician, or gynecologist• Notice must be provided informing
each participant of his/her right to make such a designation
– Do not apply to grandfathered plans
• Interim Final Regulations Issued– Require plans to cover emergency
services without the need for pre-authorization and without regard to whether the provider is in its network • Group health plan or group health
insurance coverage that offers a network of providers, covers emergency services, and subjects such services to a co-payment or to co-insurance, must ensure that the rate imposed for out-of-network emergency providers does not exceed the cost-sharing requirements that would be imposed if the services were rendered by a network provider [balance billing is permissible subject to minimum reimbursement requirements]
– Do not apply to grandfathered plans
D – 13

27
Patient Protections (Cont’d)
Pre-Existing Conditions Rescissions• Interim Final Regulations Issued
– Prohibit the exclusion of coverage of specific benefits associated with a pre-existing condition
– Prohibit a complete exclusion from the plan if based on a pre-existing condition
– Leave unchanged the existing rule under HIPAA that permits an exclusion of benefits for a condition if the exclusion applies regardless of when the condition arose relative to the effective date of coverage
– Apply to plan years beginning on or after January 1, 2014, except for individuals under age 19, applies for plan years beginning on or after September 23, 2010
– Apply to grandfathered plans
• Interim Final Regulations Issued– Prohibit the retroactive rescission of
health coverage except in the case of fraud or intentional misrepresentation of a material fact
– Apply to insured plans in the group and individual markets, as well as self-insured plans
– Do not prohibit coverage from being cancelled on a prospective basis
– Do not prohibit coverage from being cancelled retroactively if the cancellation is attributable to a failure to pay required premiums or contributions
– Require 30 days advance notice of a rescission, when still permitted
– Apply to grandfathered plans
28
Preventive Care Services
• Interim Final Regulations Issued July 19, 2010
– Require nongrandfathered group health plans and health insurers to:
• Cover “recommended” preventive health services, and
• Eliminate cost-sharing requirements for required preventive health services (cost-sharing permitted for out-of-network services)
– Effective for plan years beginning on or after September 23, 2010
– Permit the use of reasonable medical management techniques for determining the frequency, method, treatment, or setting for the provision of preventive services, if not otherwise specified in guidelines
– Grant a one year delay following the release of a new or modified recommendation or guideline for implementation
– If a preventive service is no longer “recommended”, plans are not required to cover or waive cost-sharing
D – 14
29
Required Preventive Services
• The following preventive services must be covered without cost sharing:
– For all plan participants, United States Preventive Services Task Force (USPSTF) recommendations that have a current rating of A or B
– For children, adolescents, and adults, Centers for Disease Control and Prevention (CDC)-approved immunizations recommended for routine use by its Advisory Committee on Immunization Practices
– For infants, children, and adolescents, Health Resources and Services Administration (HRSA) guidelines for preventive care and screenings
– For women, HRSA guidelines for preventive care and screening not otherwise addressed by the recommendations of the USPSTF, which are expected to be released by August 1, 2011
• Special Rule for Breast Cancer Screening:– The most recent recommendations issued in November 2009 (begin screening at age 50) will be
disregarded and the prior recommendations issued in 2002 (begin screening at age 40) will be considered current until new recommendations are issued
For a complete list of required preventive services, visit: http://www.healthcare.gov/center/regulations/prevention/recommendations.html
30
Physician Office Visits and Cost Sharing
• The rules clarify that:
– If physicians provide recommended preventive services during office visits, and bill or track separately for the services, plans may still require copayments or other cost-sharing for the office visits but not the preventive services
– If physicians don’t bill or track separately for recommended preventive services, and the primary purpose for the office visits is to deliver the preventive services, plans may not require copayments or other cost-sharing for the office visits
– If physicians don’t bill or track separately for recommended preventive services, and the primary purpose of the office visits is not to deliver the preventive services, plans may still require copayments or other cost-sharing for the office visits
D – 15

31
Internal & External Appeals Regulations
• Interim Final Regulations Issued July 23, 2010
– Require nongrandfathered individual and group health plans to:
• Make changes to internal claims and appeals processes, and
• Institute a new mandatory, external review under either a State or Federal process
– Effective for plan years beginning on or after September 23, 2010
• Transition period until July 1, 2011 for establishment of compliant State externalreview processes
• For plan years beginning before July 1, 2011, existing State external review processes apply
32
Internal Claims & Appeals Process
• Regulations build upon existing DOL claims procedures and require the following changes:
– Adverse Benefit Determinations – Rescissions of coverage are now included in the definition
– Expedited Notice for Urgent Care – Plans must notify claimants of benefit determination of urgent care claims within 24 instead of 72 hours
– Full and Fair Review – Before an adverse benefit determination is issued, a plan must now also provide the claimant, free of charge, any new or additional evidence considered and the rationale for a decision as soon as possible and sufficiently in advance of the final internal adverse benefit determination to give the claimant an opportunity to respond
– Conflict of Interest – Plans must ensure that all claims determinations and appeals are designed to ensure impartiality and independence of the persons making the decisions
• Denial Notices – Notices of adverse benefit determinations must be "culturally and linguistically appropriate,” and include:
– Sufficient information necessary to identify the claim involved (date of service, provider, claim amount, diagnosis and treatment codes and meanings)
– The reason(s) for the adverse determination (including the denial code and its meaning and a discussion of the decision)
– A description of available internal and external appeal processes; and
– Contact information for office of health insurance consumer assistance or ombudsman
D – 16
33
Internal Claims & Appeals Process (Cont’d)
• Exhaustion of Internal Appeal – If plans fail to adhere to the new requirements, the internal claims review process is deemed exhausted and the claimant can proceed to external claims review and/or applicable judicial remedies
• Continued Coverage – Plans must provide continued coverage pending the outcome of the appeal
34
External Claims & Appeals Process
• Nongrandfathered plans must comply with either a State external review process (if applicable) or a new Federal external review process– Insured and non-ERISA self-funded plans (church and governmental plans) need to comply with
existing or future State external review process
– Self-insured group health plans will need to comply with Federal external review process standards which are described in temporary regulatory guidance
• Regulations provide minimum requirements for qualifying State external review processes, including the consumer protections of the National Association of Insurance Commissioners (NAIC) Model Act requirements– Provides transition period for State external review processes until the plan year beginning on or
after July 1, 2011; before then, existing processes will be deemed compliant
– If no applicable State process, then will need to comply with Federal process
• Interim rules regarding federal external review process standards are contained in recentregulatory guidance
• HHS Secretary can deem external review processes in effect as of March 23, 2010, as compliant
D – 17
35
Break Time for Nursing Mothers – DOL Fact Sheet• DOL Wage and Hour Division Fact Sheet #73 Issued July 15, 2010
– Requires employers to grant break time to an employee to express breast milk for her nursing child for one year after child’s birth
– PPACA amended Section 7 of the Fair Labor Standards Act (FLSA); the FLSA amendment took effect when PPACA was signed into law on March 23, 2010
• Break Timing– “Reasonable” amount of time “as frequently as needed”
• Break Location – A place other than a bathroom– Functional as a space for expressing breast milk– Shielded from view, and– Free from any intrusion by co-workers or the public
• Coverage– Only employees not exempt from FLSA’s overtime pay requirements are eligible– State law may impose similar requirements for exempt employees– Employers with less than 50 employees are exempt if compliance would pose an undue hardship
• Compensation– Employers are not required to compensate employees for these breaks; however:
• An employer allowing paid breaks must compensate a nursing employee in the same way it does others if she uses such a break to express breast milk; and
• The lactation break must be treated as time worked if the employee is not "completely relieved from duty“during the break
36
Early Retiree Reinsurance Program
• Interim Final Regulations Issued
– Program began June 1, 2010
– Applications must be submitted and approved before claim submission
– Plan must have programs/provisions in place designed to reduce costs for members with chronic and high-cost conditions
– Plan sponsors must have programs and policies in place to detect fraud, waste and abuse
– Payments used to "reduce plan’s costs" or reduce retiree contributions or cost sharing
“First Come First Serve” – One time application opened June 2010:
$5 billion limit for the entire period program offered
Ceases 12/31/2013 in anticipation of Exchanges in 2014
D – 18

37
Grandfathered Plan Regulations
• Interim Final Regulations Issued June 17, 2010
– Grandfathered Health Plan Definition:
• A plan in which individuals were enrolled on March 23, 2010 and continuously covers at least one individual since then (need not be same individual)
– Exempt from certain health reform provisions
– Permitted to add family members and new enrollees
– Grandfather status applies separately to each “benefit package” (e.g., option)
– If no impermissible changes are made, plan can retain grandfather status indefinitely
38
Changes Resulting in Loss of Grandfathered Plan Status• Issuance of new policy, certificate or contract of insurance (exception for certain bargained plans)
• Elimination of all or substantially all benefits to diagnose or treat a particular condition
• Increase in percentage coinsurance requirements
• Increase in copays by more than the greater of $5 (adjusted for medical inflation) or medical inflation since March 23, 2010 plus 15 percentage points
• Increase deductibles or OOP maximum by more than medical inflation since March 23, 2010 plus 15 percentage points
• Decrease in employer contribution rate toward cost of any coverage tier for similarly situated individuals by more than 5 percentage points (if the rate is based on cost of coverage) or by more than 5% (if the rate is based on a formula such as hours worked)
• Decrease or add a new annual limit on the dollar value of benefits (exception for plans that had a lifetime, but no annual, limit on March 23, 2010)
• Transfer of employees into another grandfathered plan to avoid new consumer protections
• Merger, acquisition or similar business restructuring primarily to cover new individuals under a grandfathered health plan
Plans that lose grandfather status become subject to all health reform law provisions
D – 19

39
Changes Permitted Without Loss of Grandfathered Plan Status
• Change amount of premiums (as long as employer contribution rates towards cost of any coverage tier for similarly situated individuals do not decrease by more than 5 percentage points since March 23, 2010)
• Increase benefits
• Changes to third party administrator (for self-insured plans)
• Changes to comply with federal/state laws
• Voluntary health reform plan changes
• Renewal of policy, certificate, or contract of insurance
• Changes to fixed amount copayments (within specified limits)
• Changes to employer contribution rates (within specified limits)
• Increase deductibles or OOP maximum (within specified limits)
• Addition of annual limits (within specified limits)
• Special transition rules
– Changes made to comply with contracts, plan amendments, or State insurance department filings entered into prior to March 23, 2010
– Good faith changes prior to the issuance of regulations
– Revocation/modification of any impermissible changes
40
Collectively Bargained Plans
• No delayed effective date for self-funded collectively bargained plans in effect on March 23, 2010 (need to comply with health reform law provisions at the same time as other grandfathered plans)
• Fully-insured collectively bargained plans may make changes and still retain grandfather status until the end of the last collectively bargained agreement in effect on March 23, 2010
– At that time, collectively bargained plan either retains or immediately loses grandfather status, depending on changes made
– A change in insurers until that time does not, by itself, cause loss of grandfather status
D – 20
41
Grandfathered Plan Disclosure & Record-Keeping Requirements
• Participant Disclosure Requirements
– Plan materials (e.g., open enrollment materials, SPDs, SMMs, etc.) must include a statement indicating that the plan is considered to be grandfathered, and must provide contact information for questions or complaints
– Model language provided
• Maintenance of Records– Plans must maintain records that document the benefit terms that were in effect on
March 23, 2010, and that verify grandfathered status
– Must make records available upon request to any participant, beneficiary, policy subscriber, or state or Federal agency official
42
Changes That May Result in Loss of Grandfathered Plan Status
• Changes the agencies are considering adding to the list of impermissible changes:
– Changes to plan structure (i.e., switching from Health Reimbursement Arrangement to major medical coverage)
– Changes in a network plan’s provider network
– Changes to a prescription drug formulary
– Any other substantial changes to the overall benefit design
• Any new standards that are more restrictive than the interim final regulations would only apply prospectively to changes to plans or health insurance coverage after issuance of the final rules
D – 21

43
Health Reform Provisions Applicable to Grandfathered Plans
Health Reform Provision Effective Date (calendar year plans)
• No lifetime or annual dollar limits on essential health benefits (restricted annual limits allowed 2011-2014; “mini-med” plans may apply for a waiver of those limits)
2011
• Extension of dependent coverage until age 26 (grandfathered planexception until 2014 if coverage is available under nonparent plan)
2011
• Prohibition of preexisting condition exclusions Under age 19: 2011
All: 2014• Prohibition on rescissions (retroactive) of coverage 2011• Uniform explanation of coverage 2012
• Auto-enrollment for large plans (200+ FTEs) Unclear (subject to issuance of regulatory
guidance)
• Prohibition on waiting periods >90 days 2014
44
Health Reform Provisions Not Applicable to Grandfathered Plans (i.e., What Plans That Lose Grandfather Status Need to Comply With)
• Coverage of preventive health services without any cost-sharing (2011)
• Nondiscrimination by insured plans in favor of highly compensated individuals (2011)
• No prior authorizations to select doctors for obstetrical/gynecological care or for emergency services (2011)
• Claims and appeals procedures (2011)
• Uniform rating rules (2011)
• Quality of care reporting requirements (2011)
• Transparency in coverage disclosures (2011)
• Coverage of adult children to age 26 who have other nonparent eligible employer-sponsored health plan coverage (until 2014 when grandfathered plans must cover all adult children to age 26)
• Coverage for individuals participating in approved clinical trials (2014)
• Insurance premiums rating restrictions (2014)
• Guaranteed availability of health insurance coverage (2014)
• Guaranteed renewability of insurance coverage (2014)
• Nondiscrimination based on health status (2014)
• Nondiscrimination with respect to health providers (2014)
• Essential health benefits package requirements [for insured small group market plans] (2014)
• Annual cost-sharing limits (2014)
D – 22

4545
Latest Regulatory Guidance1
Case Studies and Impact Analysis3
Select Health Reform Provisions 5
Key Action Steps for Plan Sponsors2
Today’s Discussion
Reference: Health Reform Chronology8
6 Health Reform Self-Service Tools
Appendix: Legislative Details and Model Notices7
Considerations for Dropping Group Coverage4
Overview and Current Environment0
46
Implementation of Health Reform
Regulatory Challenges Plan Sponsor Near-Term Challenges
• Complex and challenging new law to implement
• 2,400 pages plus 153 page reconciliation bill plus managers’ amendments
• Date of enactment was March 23, 2010 and amended on March 30, 2010
• HHS (Health and Human Services), DOL and IRS on point for implementation
• Many regulations are already issued, and many more are to come
• Limited or delayed guidance from agencies
• Some market reform changes must be implemented for plan years beginning on or after September 23, 2010, e.g.,
– Coverage of dependents up to 26
– Elimination of lifetime/annual maximums
• Medical plan impact
– Accounting changes related to Medicare retiree drug subsidy tax
– Early retiree reinsurance program
D – 23

47
Key Action Steps for Plan Sponsors
Year – Provision Action Steps
2010 – Temporary Reinsurance for Pre-65 Retirees
• Determine if eligible per May 3 guidelines
• Apply for claim re-imbursement
• File quickly
2010 – Insurance Market Reforms • Conduct actuarial impact modeling
• Update plan documents, HIPAA certificates,& SPDs
• Communicate plan design changes
2011 – Comply with Class Act • If participating, prepare enrollment and payroll systems
• Communicate value of enrollment for long term care & disability
2011 – OTC Drugs (except insulin) Paid through Accounts Need Prescription
• Update administrative process with vendors
• Communicate new guidelines prior to and during annual enrollment
48
Key Action Steps for Plan Sponsors (Cont’d)
Year – Provision Action Steps
2011 – Model the cost impact of the health reform law
• Conduct cost modeling over a 3-5 year period• Model the cost to the organization to drop
sponsorship of group health coverage beginning in 2014 when the Exchanges are operational
• Model the cost impact of remaining “grandfathered” versus moving to a new plan with modified plan design
• If the employer has retiree medical coverage, model the cost impact of insurance market reforms and other provisions of the new law
2013 – Implement federal requirement to auto enroll new hires and continue enrollment of existing enrollees (subject to regulatory guidance yet to be issued)
• Comply with federal requirements to provide enrollment to new hires– Determine medical plan in which to enroll
new hires– Create opt-out procedures
• Update SPDs and plan documents• Work with employee benefit outsourcing
partner to update systems
D – 24
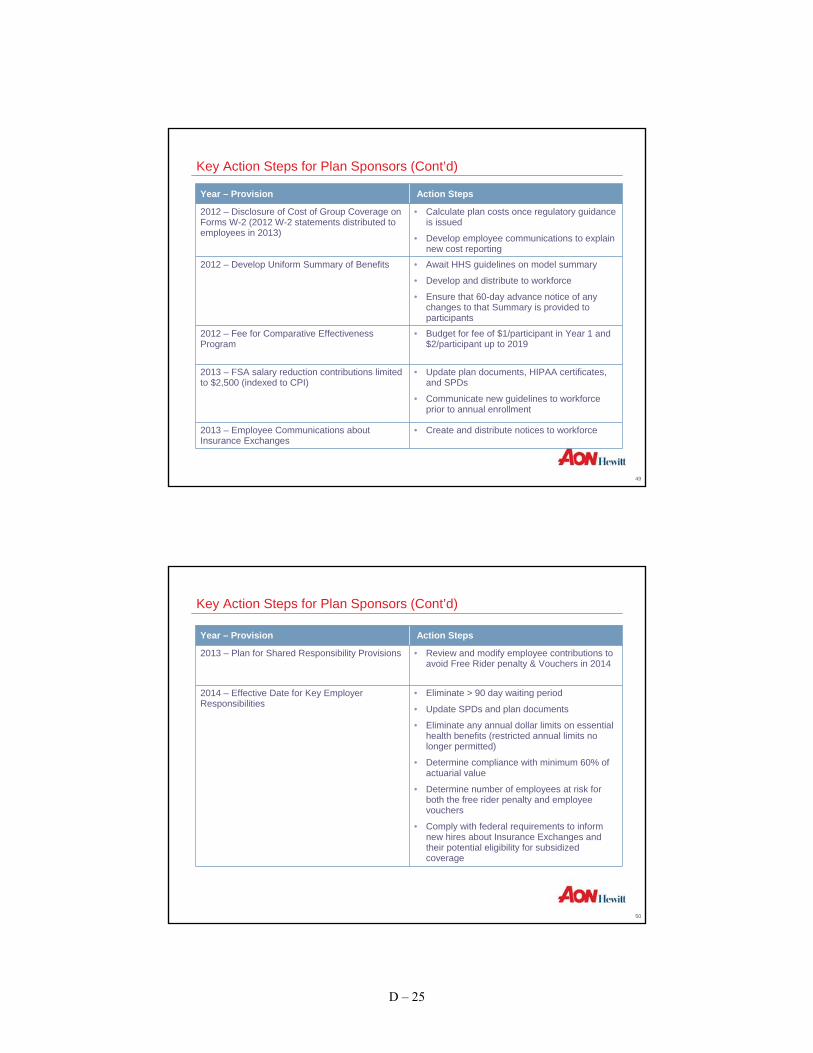
49
Key Action Steps for Plan Sponsors (Cont’d)
Year – Provision Action Steps
2012 – Disclosure of Cost of Group Coverage on Forms W-2 (2012 W-2 statements distributed to employees in 2013)
• Calculate plan costs once regulatory guidance is issued
• Develop employee communications to explain new cost reporting
2012 – Develop Uniform Summary of Benefits • Await HHS guidelines on model summary
• Develop and distribute to workforce
• Ensure that 60-day advance notice of any changes to that Summary is provided to participants
2012 – Fee for Comparative Effectiveness Program
• Budget for fee of $1/participant in Year 1 and $2/participant up to 2019
2013 – FSA salary reduction contributions limited to $2,500 (indexed to CPI)
• Update plan documents, HIPAA certificates, and SPDs
• Communicate new guidelines to workforce prior to annual enrollment
2013 – Employee Communications about Insurance Exchanges
• Create and distribute notices to workforce
50
Key Action Steps for Plan Sponsors (Cont’d)
Year – Provision Action Steps
2013 – Plan for Shared Responsibility Provisions • Review and modify employee contributions to avoid Free Rider penalty & Vouchers in 2014
2014 – Effective Date for Key Employer Responsibilities
• Eliminate > 90 day waiting period
• Update SPDs and plan documents
• Eliminate any annual dollar limits on essential health benefits (restricted annual limits no longer permitted)
• Determine compliance with minimum 60% of actuarial value
• Determine number of employees at risk for both the free rider penalty and employee vouchers
• Comply with federal requirements to inform new hires about Insurance Exchanges and their potential eligibility for subsidized coverage
D – 25
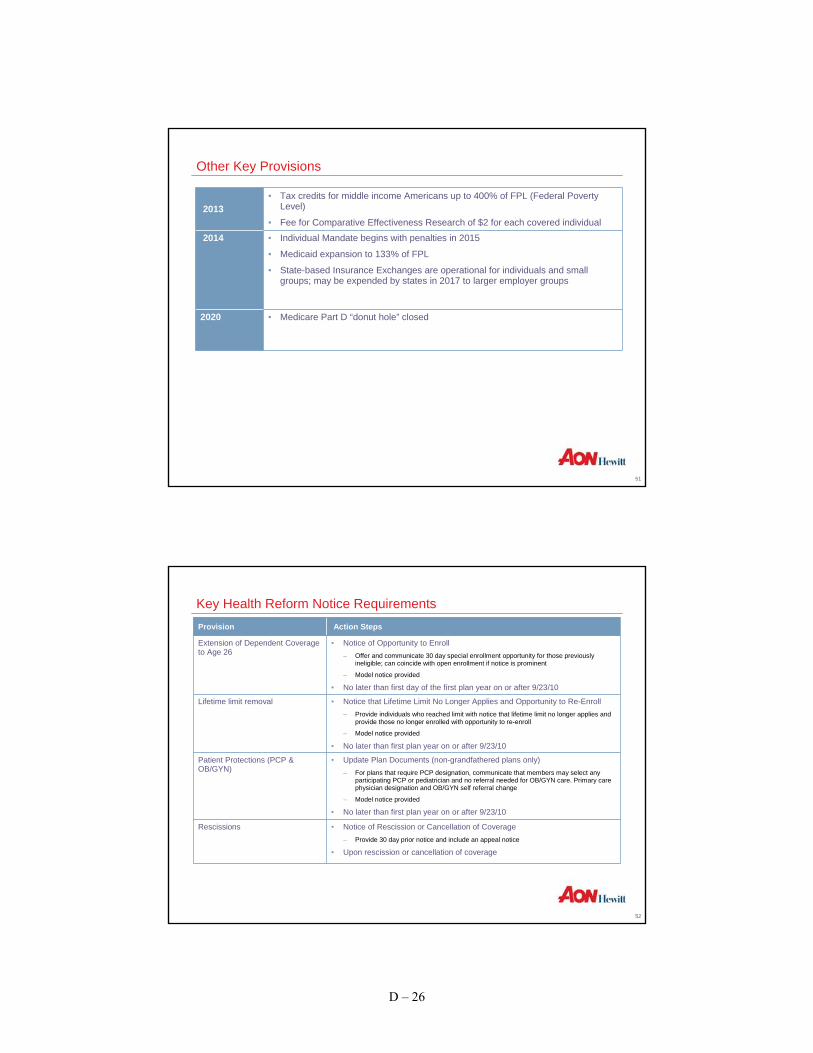
51
Other Key Provisions
2013• Tax credits for middle income Americans up to 400% of FPL (Federal Poverty
Level)
• Fee for Comparative Effectiveness Research of $2 for each covered individual2014 • Individual Mandate begins with penalties in 2015
• Medicaid expansion to 133% of FPL
• State-based Insurance Exchanges are operational for individuals and small groups; may be expended by states in 2017 to larger employer groups
2020 • Medicare Part D “donut hole” closed
52
Key Health Reform Notice RequirementsProvision Action Steps
Extension of Dependent Coverage to Age 26
• Notice of Opportunity to Enroll – Offer and communicate 30 day special enrollment opportunity for those previously
ineligible; can coincide with open enrollment if notice is prominent
– Model notice provided
• No later than first day of the first plan year on or after 9/23/10
Lifetime limit removal • Notice that Lifetime Limit No Longer Applies and Opportunity to Re-Enroll– Provide individuals who reached limit with notice that lifetime limit no longer applies and
provide those no longer enrolled with opportunity to re-enroll
– Model notice provided
• No later than first plan year on or after 9/23/10
Patient Protections (PCP & OB/GYN)
• Update Plan Documents (non-grandfathered plans only)– For plans that require PCP designation, communicate that members may select any
participating PCP or pediatrician and no referral needed for OB/GYN care. Primary care physician designation and OB/GYN self referral change
– Model notice provided
• No later than first plan year on or after 9/23/10
Rescissions • Notice of Rescission or Cancellation of Coverage– Provide 30 day prior notice and include an appeal notice
• Upon rescission or cancellation of coverage
D – 26

53
Key Health Reform Notice RequirementsProvision Action Steps
Grandfather Status • Notice of Grandfathered Plan Status (grandfathered plans only)– Plan materials (e.g., open enrollment materials, SPDs, SMMs, etc.) must include a
statement indicating that the plan is considered to be grandfathered, and must provide contact information for questions or complaints
– Model notice provided
• No later than first plan year on or after 3/23/10
Health Account Changes • Update Plan Documents– Health accounts (FSAs, MSAs and HSAs) can no longer be used to pay for OTC
medications without a prescription (except insulin)
– Penalty for using HSA for non- qualified medical expense doubles from 10% to 20%
• Effective 1/1/2011
W-2 Reporting • W-2 Reporting of value of health benefits– W-2 Forms provided to each employee must include “value” of health benefit coverage
(value defined as COBRA cost)
• Effective 1/1/2012 (2012 Forms W-2 delivered to employees in 2013)
CHIP Notice • CHIP Notice– Describe the availability of premium assistance for certain employees/dependents
residing in participating states
– Model notice provided
• No later than the latter of (1) the first day of the first plan year beginning after 2/4/2010 or (2) 5/1/2010
54
Employer Call to Action
Potential Factor How to Determine Cost Impact
Direct impact of health reform legislation • Aon’s actuarial cost modeling
Expected cost increases by insurers from significantly increased tax and regulatory burden
• Cost impact to become clearer upon renewal
Cost - shifting from reduced Medicare payments over the next 10 years
• Difficulty to quantify employer impact by location; partially offset by less cost shifting from coverage expansion
An employer’s long-term strategy should consider all potential factors that impact costs:
D – 27

55
Employer Call to Action
• National health reform law addresses coverage for the uninsured and insurance market reforms; little help for plan sponsors to lower long term medical trend
• Health reform could add an additional 2% to 5% health care costs for plan sponsors. Engaging in cost modeling offered by Aon actuaries can determine 3-5 year cost impact
• Congress is likely to raise the $2,000/EE free rider penalty by 2014 for employers who that do not offer group coverage or that provide unaffordable coverage. The penalty is not tax deductible
• Employers will get little help from Washington to lower EE health costs, resulting in the need for new health care strategy
56
Next Steps for Plan Sponsors
• Focus on near-term compliance with insurance market reforms
• Model the long term impact of national health reform on costs of group coverage.
• Consider new strategies to lower long-term medical trend.
• Decide on communication approach for employees on impact of new national health reform law
• Focus on participation in temporary re-insurance program for pre-65 retirees (if applicable)
• Monitor development of HHS regulations providing guidance on implementation of newhealth reform law
D – 28

5757
Latest Regulatory Guidance1
Case Studies and Impact Analysis3
Select Health Reform Provisions 5
Key Action Steps for Plan Sponsors2
Today’s Discussion
Reference: Health Reform Chronology8
6 Health Reform Self-Service Tools
Appendix: Legislative Details and Model Notices7
Considerations for Dropping Group Coverage4
Overview and Current Environment0
58
Impact of Health Reform
Change
Effective for Calendar Year Plans Estimated Cost to Claims
• Adult children up to age 26, regardless of marital or full-time student status, can be covered under our grandfathered plans unless they are eligible for coverage under a nonparent employer-sponsored health plan (beginning 2014, can be covered under parent plans even if coverage available elsewhere)
2011 <1%
• Elimination of lifetime plan benefit maximum 2011 <0.5%• Pre-existing exclusions are waived for children age
19 and under2011 <0.5%
• Over-The-Counter (OTC) drugs, except insulin, are not reimbursable under the healthcare FSA without a prescription
2011 None
• Forms W-2 must disclose value of health benefits 2012 Administrative cost only• CLASS Act – national voluntary Long Term Care
(LTC) insurance – auto-enrollment with payroll deductions (unless employee opts-out)
2011 Administrative cost only
• Auto-enrollment in health coverage (unless employee opts-out)
2013 Administrative cost only
D – 29

59
Impact of Health Reform
ChangeYear of Enactment Estimated Cost to Claims
• Comparative Effectiveness Fee of $1 per participant in year 1, $2 per participant thereafter. Endson 1/1/2020
2013 <0.1%
• Cap salary deferral contributions to Healthcare Flexible Spending Account (HCFSA) at $2,500
2013 None
• Increase Medicare tax by .9% for individuals earning over $200,000 for an individual
2013 None
• Free Rider Penalty invoked if plan has less than a 60% actuarial value, is considered “unaffordable” or if employer does not offer health coverage at all
– 60% actuarial value (i.e., plan must pay at least 60% of covered expenses)
– “Unaffordable” defined as employee premiums (medical and Rx) in excess of 9.5% of AGI
2014 • Lesser of $3,000 for each EE receiving subsidy or $2,000 for each full-time EE
• Low risk of EEs meeting eligibility
• Penalty is cost savings as our subsidy is greater than the current penalty
60
Impact of Health Reform
ChangeYear of Enactment Estimated Cost to Claims
• Employer must offer free choice vouchers to qualified employees
• Employees eligible if income <400% FPL and employer plan contributions are 8%-9.8% of AGI
2014 Administrative cost only –voucher is equal to employer subsidy amount
• Pre-existing exclusions are waived for all 2014 ~1%
• Excise Tax on High Cost Plans (also known as “Cadillac Tax”)
2018 Varies by plan
D – 30

6161
Latest Regulatory Guidance1
Case Studies and Impact Analysis3
Select Health Reform Provisions 5
Key Action Steps for Plan Sponsors2
Today’s Discussion
Reference: Health Reform Chronology8
6 Health Reform Self-Service Tools
Appendix: Legislative Details and Model Notices7
Considerations for Dropping Group Coverage4
Overview and Current Environment0
62
Considerations for Dropping Group Coverage
• Exchange costs for employers may significantly increase by the time Exchanges are availablein 2014
– The $2,000 annual employer assessment (free ride penalty) for not providing coverage, or for providing unaffordable coverage, will probably increase over time due to medical inflation, adverse claims experience, new benefits being added to Exchange programs as a result of lobbying efforts and public demand, etc., and become a more significant percentage of payroll
• Employers likely will be pressured to provide additional compensation to employees who participate in an Exchange
– Some employees may need greater compensation initially to afford coverage through an Exchange if they are ineligible for subsidy
– If government subsidies to individuals for Exchange coverage are reduced or eliminated, employers may need to provide employees with additional compensation so they canafford coverage
– State Exchanges could emerge as insurers of last resort, becoming even more expensivefor employees
• Any additional compensation to cover Exchange costs may increase payroll (FICA/FUTA) taxes for the employer, and income and payroll (FICA) taxes for the employee
D – 31

63
Considerations for Dropping Group Coverage (cont’d)
• Some employees (e.g., higher compensated employees making more than 4 times the federal poverty limit, which is now approximately $88,000 for a family of 4) will have to pay premiums in the Exchanges that may be higher than for group coverage
• Paying for coverage of younger employees through an Exchange will result in a cost “subsidy” for higher compensated Exchange participants
• Employers with employees in multiple states may have different Exchange benefit structures according to the employee’s state of residence
• Employers may lose control over health and wellness initiatives, which may impact absenteeism or productivity
• If most other employers continue to provide health insurance and you do not, you may no longer be considered an “employer of choice.”
64
The Drivers of Employee Attraction, Retention and Engagement Encompass Total Rewards
Top Attraction Drivers Top Retention Drivers Top Engagement Drivers
1 Competitive base pay Necessary tools Clear career path
2 Competitive healthcare benefits Necessary resources Involved in decisions that affect my work
3 Financial stability of company Career development Career development
4 Flexible work schedule Reliable workgroup Necessary resources
5 Competitive retirement benefits Senior leadership making right decisions for the future
Teamwork
6 Competitive vacation/time-off Competitive healthcare benefits Co-workers make personal sacrifices to drive success
7 Reputation as a great placeto work
Clear career path Co-workers make personal efforts to improve their skills needed to contribute
8 Opportunity for advancement Manager understands what motivates me
Manager understands what motivates me
9 Challenging work People-oriented culture Appropriate decision-making authority
10 Company culture Stress management Good understanding of how healthcare benefits work
Total Rewards
Note: Attraction, retention and engagement drivers vary by age, tenure, job group, level, etc.Source: 2009 Aon Consulting Engagement 2.0 Employee Survey
D – 32

65
Total Rewards Design Trade-offs and the Impact on Employee Engagement
ENGAGEMENT 3.4 3.8 4.1 4.3 4.5 5.7 6.1 6.1 6.2Base Pay Below Avg Below Avg Average Below Avg Below Avg Average Above Avg Above Avg Above AvgIncentive Below Avg Below Avg Average Below Avg Below Avg Average Below Avg Average Above Avg
Pay fairness Below Avg Below Avg Average Below Avg Below Avg Average Above Avg Above Avg Above AvgPerf Management Below Avg Below Avg Average Below Avg Below Avg Average Average Above Avg Above Avg
H&W benefits Below Avg Average Average Above Avg Below Avg Average Above Avg Above Avg Above AvgRetirement Benefits Below Avg Below Avg Average Above Avg Below Avg Average Above Avg Above Avg Above Avg
Career Development Below Avg Below Avg Average Below Avg Below Avg Above Avg Above Avg Above Avg Above AvgImmediate Manager Below Avg Below Avg Average Below Avg Above Avg Above Avg Above Avg Above Avg Above Avg
Engagement by Perceived Value of Total Rewards Mix
3.43.8 4.1 4.3 4.5
5.76.1 6.1 6.2
1
2
3
4
5
6
7
Source: 2009 Aon Consulting Engagement 2.0 Employee Survey
6666
Latest Regulatory Guidance1
Case Studies and Impact Analysis3
Select Health Reform Provisions5
Key Action Steps for Plan Sponsors2
Today’s Discussion
Reference: Health Reform Chronology8
6 Health Reform Self-Service Tools
Appendix: Legislative Details and Model Notices7
Considerations for Dropping Group Coverage4
Overview and Current Environment0
D – 33

6767
Latest Regulatory Guidance1
Case Studies and Impact Analysis3
Select Health Reform Provisions – Early Retiree Reinsurance Program5
Key Action Steps for Plan Sponsors2
Today’s Discussion
Reference: Health Reform Chronology8
6 Health Reform Self-Service Tools
Appendix: Legislative Details and Model Notices7
Considerations for Dropping Group Coverage4
Overview and Current Environment0
68
Early Retiree Reinsurance Program – Overview
• Interim Final Regulations Issued
– Intended to provide relief for plan sponsors providing early retirement (pre-Medicare) health benefits
– Provides federal reimbursement for 80% of individual claims between $15,000 and $90,000 incurred during the plan year
– Legislation funded $5 billion for reimbursement through HHS
– Reimbursement provisions are effective June 21, 2010
– Program ends no later than January 1, 2014, (may end sooner if funds are exhausted)
D – 34

69
What Do Employers/Plan Sponsors Need to Do Now?
• Prepare to apply for certification to participate in the program
– Applications are now available
– Plan sponsors reimbursed on a first-come, first-serve basis
– Unlikely that $5 billion funding will be adequate to pay all claims – Therefore early certificationis critical
– Must demonstrate that retiree health plan meets all applicable requirements
• Certification application must meet all requirements– Applications failing requirements will be denied
– Plan sponsor may have to reapply, losing original “place in line”
70
What are the Participation Rules for the Program?
• Plan Sponsor submits application for participation
– Use same definition of plan sponsor as RDS
– Plan Sponsor will receive the reimbursement payments
• Plan must be “employment based” plan– Use same definition as “group health plan” for RDS
• Plan must have programs to generate cost savings for “chronic and high cost conditions”– Health conditions likely to generate claims above $15,000 in a year for one participant
– Program must be in place as of the start of the plan year beginning in 2010
– Sponsor must be able to demonstrate (if audited) that program has generated, or had potential to generate, savings through audit
D – 35
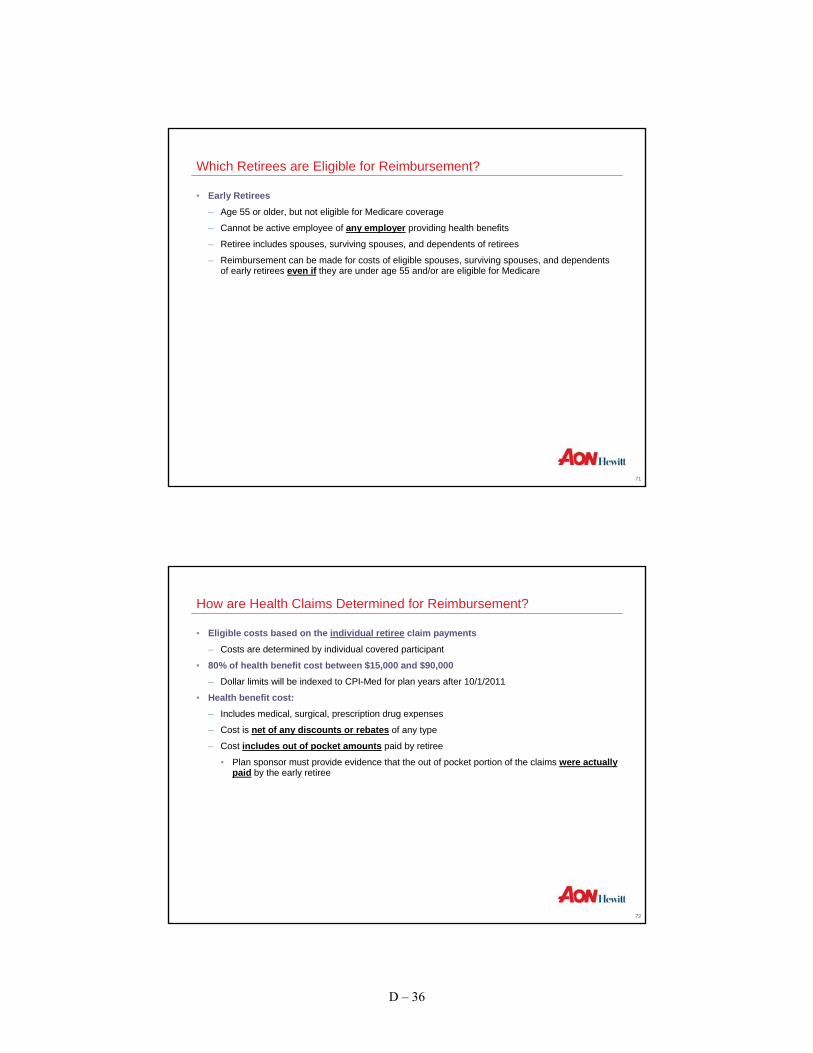
71
Which Retirees are Eligible for Reimbursement?
• Early Retirees
– Age 55 or older, but not eligible for Medicare coverage
– Cannot be active employee of any employer providing health benefits
– Retiree includes spouses, surviving spouses, and dependents of retirees
– Reimbursement can be made for costs of eligible spouses, surviving spouses, and dependents of early retirees even if they are under age 55 and/or are eligible for Medicare
72
How are Health Claims Determined for Reimbursement?
• Eligible costs based on the individual retiree claim payments
– Costs are determined by individual covered participant
• 80% of health benefit cost between $15,000 and $90,000– Dollar limits will be indexed to CPI-Med for plan years after 10/1/2011
• Health benefit cost:– Includes medical, surgical, prescription drug expenses
– Cost is net of any discounts or rebates of any type
– Cost includes out of pocket amounts paid by retiree
• Plan sponsor must provide evidence that the out of pocket portion of the claims were actually paid by the early retiree
D – 36

73
How are Health Claims Determined for Reimbursement?
• Transition rule for 2010
– Plan Sponsors may apply for reimbursement for plan year starting prior to June 1 2010 and ending during 2010
– Claims incurred prior to June 1 are counted toward reimbursement but only to a maximumof $15,000
• Example:
– An early retiree incurs $23,000 of claims between January and June 1, 2010
– After June 1, the early retiree incurs an additional $32,000 of claims
Incurred amount
Used in determination of the reimbursement amount
Reimbursement would be 80% of $32,000 (the allowed claims above $15,000)
Jan Jun Jan
$15,000 $32,000
$23,000$32,000
74
Other Plan Sponsor Requirements
• Application of reinsurance reimbursements
– Must reduce the benefit costs (or premiums) to the Plan Sponsor or the plan participants
– May not be used as general revenue for the Plan Sponsor
– Tax treatment of reimbursement amounts not yet clarified
• Claims documentation for reimbursement– List of early retirees with individual claim costs documented
– HHS will provide guidance on format for claim submission
• Plan Sponsor must maintain required records
D – 37

7575
Latest Regulatory Guidance1
Case Studies and Impact Analysis3
Select Health Reform Provisions – Insurance Exchanges5
Key Action Steps for Plan Sponsors2
Today’s Discussion
Reference: Health Reform Chronology8
6 Health Reform Self-Service Tools
Appendix: Legislative Details and Model Notices7
Considerations for Dropping Group Coverage4
Overview and Current Environment0
76
Insurance Exchanges
Features Key Challenges• State-based marketplace for buyers and
sellers of health insurance
• Operational in 2014 for uninsured individuals and ERs with <50EE
• Family of 4 earning less than $88,000 is eligible for subsidized coverage when purchasing in the Exchange
• Federal funding to states to design Exchange but must be self-sufficientby 2016
• Reforms such as guarantee issue, guaranteed renewal, 3:1 age banding, & insurance market reforms will drive premiums higher
• Weak individual mandate with modest penalties for not purchasing health insurance
• Use of traditional health plans such as PPOs and HMOs will not result in lower costs under the Exchange
• Only insured medical products –self-funding not permitted
D – 38
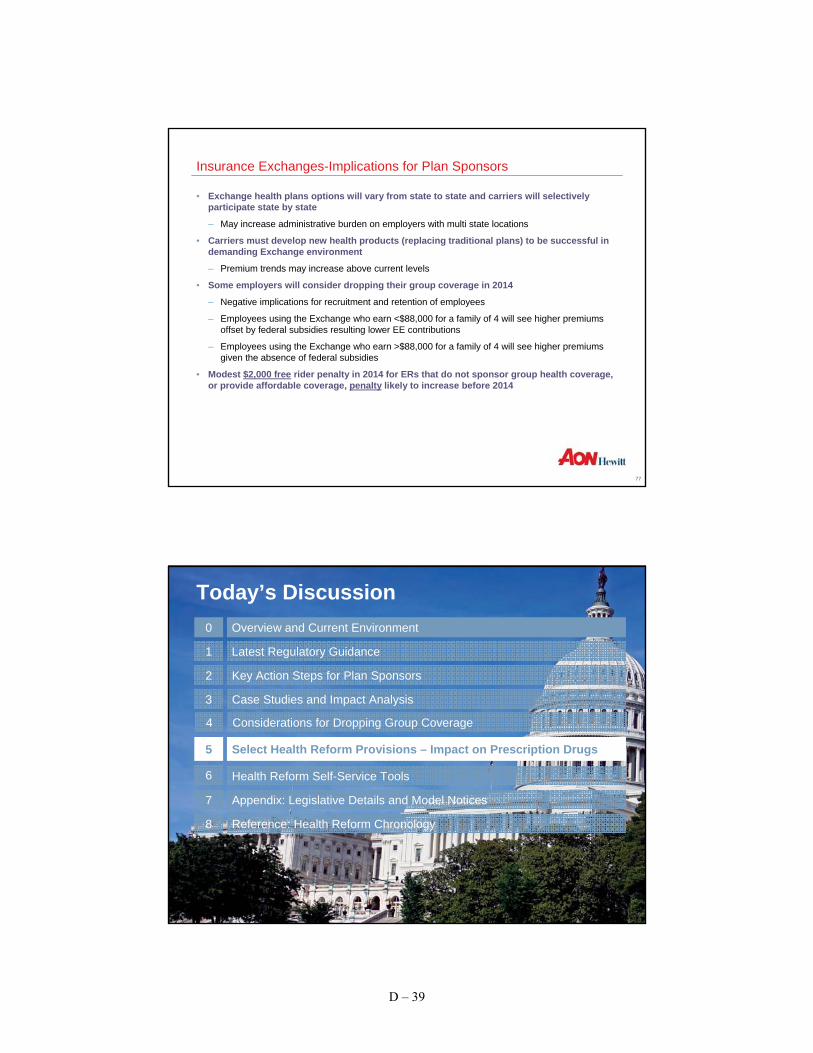
77
Insurance Exchanges-Implications for Plan Sponsors
• Exchange health plans options will vary from state to state and carriers will selectively participate state by state
– May increase administrative burden on employers with multi state locations
• Carriers must develop new health products (replacing traditional plans) to be successful in demanding Exchange environment
– Premium trends may increase above current levels
• Some employers will consider dropping their group coverage in 2014
– Negative implications for recruitment and retention of employees
– Employees using the Exchange who earn <$88,000 for a family of 4 will see higher premiums offset by federal subsidies resulting lower EE contributions
– Employees using the Exchange who earn >$88,000 for a family of 4 will see higher premiums given the absence of federal subsidies
• Modest $2,000 free rider penalty in 2014 for ERs that do not sponsor group health coverage, or provide affordable coverage, penalty likely to increase before 2014
7878
Latest Regulatory Guidance1
Case Studies and Impact Analysis3
Select Health Reform Provisions – Impact on Prescription Drugs5
Key Action Steps for Plan Sponsors2
Today’s Discussion
Reference: Health Reform Chronology8
6 Health Reform Self-Service Tools
Appendix: Legislative Details and Model Notices7
Considerations for Dropping Group Coverage4
Overview and Current Environment0
D – 39

79
Impact of HCR on Prescription Drugs
Enhancements Restrictions
• Increased Rx volume
– PBMs are the biggest winners
Retiree Drug Subsidy no longer tax-deductible income
• New FDA authorized process for generic availability of biologics
Annual Fees for Pharma
• Grants for reimbursements for MTM services Health FSA cap and reimbursement restrictions on OTC drugs
• Federal Upper Limit (FUL) pricing calculated by new Average Manufacturer Price (AMP)
Excise taxes on medical device manufacturers and importers
• Contracts with Long Term Care (LTC) facilities for waste reduction
Increase in Medicaid drug rebate percentage
• Closing of coverage gap from 100 – 25% Payments cuts to Medicare Advantage Plans
• $250 rebate to Part D enrollees in coverage Decreased bargaining power for pharmacy benefit managers due to transparency requirements?
8080
Latest Regulatory Guidance1
Case Studies and Impact Analysis3
Select Health Reform Provisions – Wellness Grants5
Key Action Steps for Plan Sponsors2
Today’s Discussion
Reference: Health Reform Chronology8
6 Health Reform Self-Service Tools
Appendix: Legislative Details and Model Notices7
Considerations for Dropping Group Coverage4
Overview and Current Environment0
D – 40

81
Where Can I Find Out More?
• Aon’s Health Care Reform Microsite is a great resource:
– Weekly briefings
– Webinar recordings
– FAQs
– Side-by-side comparison of the Senate and Reconciliation Bills
– Survey findings
www.aon.com/healthcarereform
82
Employer Shared Responsibility Provisions
Free Rider Provision Employee Voucher• Applies to large ERs with 50 or more full-
time equivalent employees (FTEs)
– FTE = 30+ hours/week
• Employers not offering health coverage to all FTEs pay $2,000 per FTE if any FTE enrolls in Exchange
• Employer offering coverage pay $3,000 for each FTE who receives Exchange subsidy/credit (subject to a certain maximum penalty) if:
– Coverage <60% of allowed costs
– EE pays >9.5% of their household income for health coverage
• First 30 employees not included in calculation of assessment
• Effective 1/1/2014
• Applies to ERs who offer minimum essential coverage
• Employers would convert health coverage subsidy to cash for any employees who:
– Pay between 8% and 9.8% of their household income for health coverage
– Whose household income is less than 400% of poverty line
– Opt out of employer sponsored coverage for coverage in an Exchange based plan
• No penalties imposed for EEs who receive vouchers
• Effective 1/1/2014
D – 41

83
Administrative Requirements
Auto Enrollment• Applies to new hires and existing enrollees
• Employees can opt out
• Employer can choose plan for auto enrollment
• Effective date unclear; may be 3/23/2010 upon enactment or until regulatory guidance issued
Appeals Process• Employer plans must have HHS-approved
external review process
• Effective for plan years beginning on or after September 23, 2010 6 months after enactment (1/1/2011 for CY plans)
W-2 Reporting• Employers required to report the “value” of
health benefits provided to each employee
– Value defined asCOBRA cost
• Effective 1/1/2012(Forms W-2 deliveredin 2013)
84
Administrative Requirements (cont’d)
Uniform Explanation of Coverage Exchange Notification• Annual distribution of summary of benefits
and coverage
– Not to exceed 4 pages; 12 point font
– Culturally and linguistically appropriate
• Uniform Explanation is in addition to the SPD required by ERISA
• HHS to issue standards
• Effective 2012 (first summary due within 24 months of enactment)
• 60 days advance notice to participants required if any information in Uniform Explanation changes
• Employers must notify employees at time of hire of the availability of Exchanges and their potential eligibility for a subsidy
– No requirement to offer same coverage as Exchange based plans
• Effective 1/1/2013
Transparency Requirements• Same transparency requirements as
Exchange based plans
• Claims payment policies and data
• Information on rating policies, cost sharing and payment for OON
D – 42

85
Administrative Requirements (cont’d)
CLASS Act• Voluntary federal LTC insurance program
• No underwriting restrictions
• 5-year waiting period
• Eligible for benefit if at least 2 ADLs for 90 days
• Lifetime benefit payments
• ERs may auto-enroll EEs and offer access via payroll deductions
– EEs may opt-out
– Must be actively employed to enroll
• Effective 1/1/2011
86
Tax Provisions
Medicare Payroll Surtax High Cost Plan Excise Tax• Adjusted gross income >$200K for
individuals and >$250K for couples
• Additional surtax on wages of 0.9%
• Additional surtax on investment income of 3.8%
• Additional taxes on higher income individuals replaces lost revenue from delayed enactment of high cost excise tax (estimated $210 billion)
• Effective 1/1/2013
• 40% excise tax on health plans whose annual cost exceeds:
– $10,200 single/$27,500 family
• Cost includes all health plans, including FSAs or HRAs, ER HSA contributions
• Higher thresholds for retirees and high risk professions; age/gender differences
• Indexed to CPI-U (+1% in 2019)
• Effective 2018; no delayed effective date for collectively bargained plans
D – 43

87
Tax Provisions (cont’d)
Comparative Effectiveness Research Fee• Fee to fund federal comparative clinical effectiveness research
• Applies to insurers and plan sponsors
• Applies to all plans, regardless of grandfather status
• $2 for each covered individual annually ($1 for plan years ending in 2013), indexed to CPI
• Effective for plan years ending after 9/30/2012 (1/1/2013 for CY plans)
• Fee sunsets after 2019
88
CLASS Act (Title VIII of the Patient Protection and Affordable Care Act)
Provision
• CLASS Program nominally effective January 1, 2011, but still subject to:– HHS finalizing operating
details and structure during 2011
– HHS finalizing benefit design and premium structure by October 1, 2012
• Benefits expected to be $50-$75 per day, graded based on level of impairment. No benefit duration limit
• Eligibility for benefits requires– 5 years prior enrollment and
premium payment (“Vesting Period”)
– Loss of 2 or 3 (TBD) of 6 Activities of Daily Living or substantial cognitive impairment
Objective Employer Impact
• Creates a voluntary, government-administered Long Term Care Insurance plan
• To enable those in need to remain at home or in their community. Pays for home care and related services
• To guarantee access to basic coverage for all working, taxable wage earners over age 18
• Current average monthly premium estimates vary widely:– Congressional Budget
Office: $123– Centers for Medicare and
Medicaid Services: $240– American Academy of
Actuaries: $160
• Benefits unlikely to fully cover costs in most cases. CLASS does not eliminate the need for private Long Term Care Insurance
• No penalty for employers who do not offer CLASS. Individual enrollment alternative will be available
• Employer Option: offer CLASS coverage and payroll deductions. All employees are automatically enrolled unless they opt-out. Employer may contribute but not required
D – 44
89
Model Language Notice - Lifetime Limit No Longer Applies and Enrollment Opportunity
Plans and issuers are required to give written notice that the lifetime limit on the dollar value of all benefits no longer applies and that an individual, if covered, is once again eligible for benefits under the plan. Additionally, if the individual is not enrolled in the plan or health insurance coverage, or if an enrolled individual is eligible for but not enrolled in any benefit package under the plan or health insurance coverage, then the plan or issuer must also give such an individual an opportunity to enroll that continues for at least 30 days (including written notice of the opportunity to enroll). The notices and enrollment opportunity must be provided beginning not later than the first day of the first plan year beginning on or after September 23, 2010. For individuals who enroll under this opportunity, coverage must take effect not later than the first day of the first plan year beginning on or after September 23, 2010.
These notices may be provided to an employee on behalf of the employee’s dependent. In addition, the notices may be included with other enrollment materials that a plan distributes to employees, provided the statement is prominent. For either notice, if a notice satisfying the requirements is provided to an individual, the obligation to provide the notice with respect to that individual is satisfied for both the plan and the issuer.
The following model language can be used to satisfy the notice requirement:
The lifetime limit on the dollar value of benefits under [Insert name of group health plan or health insurance issuer] no longer applies. Individuals whose coverage ended by reason of reaching a lifetime limit under the plan are eligible to enroll in the plan. Individuals have 30 days from the date of this notice to request enrollment. For more information contact the [insert plan administrator or issuer] at [insert contact information].
This slide is for internal information purposes only. The suggested legal language is the only content approved for external use.
90
Model Language Notice – Grandfathered Plans
To maintain status as a grandfathered health plan, a plan or health insurance coverage must include a statement, in any plan materials provided to a participant or beneficiary describing the benefits provided under the plan or health insurance coverage, that the plan or coverage believes it is a grandfathered health plan within the meaning of section 1251 of the Patient Protection and Affordable Care Act and must provide contact information for questions and complaints.
The following model language can be used to satisfy this disclosure requirement:
This [group health plan or health insurance issuer] believes this [plan or coverage] is a “grandfathered health plan” under the Patient Protection and Affordable Care Act (the Affordable Care Act). As permitted by the Affordable Care Act, a grandfathered health plan can preserve certain basic health coverage that was already in effect when that law was enacted. Being a grandfathered health plan means that your [plan or policy] may not include certain consumer protections of the Affordable Care Act that apply to other plans, for example, the requirement for the provision of preventive health services without any cost sharing. However, grandfathered health plans must comply with certain other consumer protections in the Affordable Care Act, for example, the elimination of lifetime limits on benefits.
Questions regarding which protections apply and which protections do not apply to a grandfathered health plan and what might cause a plan to change from grandfathered health plan status can be directed to the plan administrator at [insert contact information]. [For ERISA plans, insert: You may also contact the Employee Benefits Security Administration, U.S. Department of Labor at 1-866-444-3272 or www.dol.gov/ebsa/healthreform. This website has a table summarizing which protections do and do not apply to grandfathered health plans.] [For individual market policies and nonfederal governmental plans, insert: You may also contact the U.S. Department of Health and Human Services at www.healthreform.gov.]
This slide is for internal information purposes only. The suggested legal language is the only content approved for external use.
D – 45

91
Model Language Notice - Opportunity to Enroll in connection with Extension of Dependent Coverage to Age 26
The interim final regulations extending dependent coverage to age 26 provide transitional relief for a child whose coverage ended, or who was denied coverage (or was not eligible for coverage) under a group health plan or health insurance coverage because, under the terms of the plan or coverage, the availability of dependent coverage of children ended before the attainment of age 26. The regulations require a plan or issuer to give such a child an opportunity to enroll that continues for at least 30 days (including written notice of the opportunity to enroll), regardless of whether the plan or coverage offers an open enrollment period and regardless of when any open enrollment period might otherwise occur. This enrollment opportunity (including the written notice) must be provided not later than the first day of the first plan year beginning on or after September 23, 2010. The notice may be included with other enrollment materials that aplan distributes, provided the statement is prominent. Enrollment must be effective as of the first day of the first plan year beginning on or after September 23, 2010.
The following model language can be used to satisfy the notice requirement:
Individuals whose coverage ended, or who were denied coverage (or were not eligible for coverage), because the availability of dependent coverage of children ended before attainment of age 26 are eligible to enroll in [Insert name of group health plan or health insurance coverage]. Individuals may request enrollment for such children for 30 days from the date of notice. Enrollment will be effective retroactively to [insert date that is the first day of the first plan year beginning on or after September 23, 2010.] For more information contact the [insert plan administrator or issuer] at [insert contact information].
This slide is for internal information purposes only. The suggested legal language is the only content approved for external use.
92
Patient Protection Model DisclosureWhen applicable, it is important that individuals enrolled in a plan or health insurance coverage know of their
rights to (1) choose a primary care provider or a pediatrician when a plan or issuer requires designation of a primary care physician; or (2) obtain obstetrical or gynecological care without prior authorization. Accordingly, the interim final regulations regarding patient protections under section 2719A of the Affordable Care Act require plans and issuers to provide notice to participants of these rights when applicable. The notice must be provided whenever the plan or issuer provides a participant with a summary plan description or other similar description of benefits under the plan or health insurance coverage. This notice must be provided no later than the first day of the first plan year beginning on or after September 23, 2010.
The following model language can be used to satisfy the notice requirement:
For plans and issuers that require or allow for the designation of primary care providers by participants or beneficiaries, insert:[Name of group health plan or health insurance issuer] generally [requires/allows] the designation of a primary care provider. You have the right to designate any primary care provider who participates in our network and who is available to accept you or your family members. [If the plan or health insurance coverage designates a primary care provider automatically, insert: Until you make this designation, [name of group health plan or health insurance issuer] designates one for you.] For information on how to select a primary care provider, and for a list of the participating primary care providers, contact the [plan administrator or issuer] at [insert contact information].
For plans and issuers that require or allow for the designation of a primary care provider for a child, add: For children, you may designate a pediatrician as the primary care provider.
For plans and issuers that provide coverage for obstetric or gynecological care and require the designation by a participant or beneficiary of a primary care provider, add:You do not need prior authorization from [name of group health plan or issuer] or from any other person (including a primary care provider) in order to obtain access to obstetrical or gynecological care from a health care professional in our network whospecializes in obstetrics or gynecology. The health care professional, however, may be required to comply with certain procedures, including obtaining prior authorization for certain services, following a pre-approved treatment plan, or procedures for making referrals. For a list of participating health care professionals who specialize in obstetrics or gynecology, contact the [plan administrator or issuer] at [insert contact information].
This slide is for internal information purposes only. The suggested legal language is the only content approved for external use.
D – 46
93
Medicaid and the Children’s Health Insurance Program (CHIP) Offer Free Or Low-Cost Health Coverage To Children And Families
If you are eligible for health coverage from your employer, but are unable to afford the premiums, some States have premium assistance programs that can help pay for coverage. These States use funds from their Medicaid or CHIP programs to help people who are eligible for employer-sponsored health coverage, but need assistance in paying their health premiums.
If you or your dependents are already enrolled in Medicaid or CHIP and you live in a State listed below, you can contact your State Medicaid or CHIP office to find out if premium assistance is available. If you or your dependents are NOT currently enrolled in Medicaid or CHIP, and you think you or any of your dependents might be eligible for either of these programs, you can contact your State Medicaid or CHIP office or dial 1-877-KIDS NOW or www.insurekidsnow.gov to find out how to apply. If you qualify, you can ask the State if it has a program that might help you pay the premiums for an employer-sponsored plan.
Once it is determined that you or your dependents are eligible for premium assistance under Medicaid or CHIP, your employer’s health plan is required to permit you and your dependents to enroll in the plan – as long as you and your dependents are eligible, but not already enrolled in the employer’s plan. This is called a “special enrollment”opportunity, and you must request coverage within 60 days of being determined eligible for premium assistance.
94
Contact Information for State CHIP and Medicaid Programs
ALABAMA – Medicaid COLORADO – Medicaid and CHIP
Website: http://www.medicaid.alabama.govPhone: 1-800-362-1504
Medicaid Website: http://www.colorado.gov/Medicaid Phone: 1-800-866-3513CHIP Website: http:// www.CHPplus.orgCHIP Phone: 303-866-3243
ALASKA – Medicaid FLORIDA – Medicaid
Website: http://health.hss.state.ak.us/dpa/programs/medicaid/Phone (Outside of Anchorage): 1-888-318-8890Phone (Anchorage): 907-269-6529
Website: http://www.fdhc.state.fl.us/Medicaid/index.shtmlPhone: 1-866-762-2237
ARIZONA – CHIP GEORGIA – Medicaid
Website: http://www.azahcccs.gov/applicants/default.aspxPhone: 1-877-764-5437
Website: http://dch.georgia.gov/ Click on Programs, then Medicaid
Phone: 1-800-869-1150
ARKANSAS – CHIP IDAHO – Medicaid and CHIP
Website: http://www.arkidsfirst.com/Phone: 1-888-474-8275
Medicaid Website: www.accesstohealthinsurance.idaho.govMedicaid Phone: 1-800-926-2588CHIP Website: www.medicaid.idaho.govCHIP Phone: 1-800-926-2588
CALIFORNIA – Medicaid INDIANA – Medicaid
Website: http://www.dhcs.ca.gov/services/Pages/TPLRD_CAU_cont.aspxPhone: 1-866-298-8443
Website: http://www.in.gov/fssa/2408.htmPhone: 1-877-438-4479
If you live in one of the following States, you may be eligible for assistance paying your employer health plan premiums. The following list of States is current as of September 1, 2010. You should contact your State for further information on eligibility.
D – 47

95
Contact Information for State CHIP and Medicaid Programs (cont.)IOWA – Medicaid MONTANA – Medicaid
Website: www.dhs.state.ia.us/hipp/Phone: 1-888-346-9562
Website: http://medicaidprovider.hhs.mt.gov/clientpages/clientindex.shtmlTelephone: 1-800-694-3084
KANSAS – Medicaid NEBRASKA – Medicaid
Website: https://www.khpa.ks.govPhone: 800-766-9012
Website: http://www.dhhs.ne.gov/med/medindex.htmPhone: 1-877-255-3092
KENTUCKY – Medicaid NEVADA – Medicaid and CHIP
Website: http://chfs.ky.gov/dms/default.htmPhone: 1-800-635-2570
Medicaid Website: http://dwss.nv.gov/Medicaid Phone: 1-800-992-0900CHIP Website: http://www.nevadacheckup.nv.org/CHIP Phone: 1-877-543-7669
LOUISIANA – Medicaid NEW HAMPSHIRE – MedicaidWebsite: http://www.lahipp.dhh.louisiana.govPhone: 1-888-342-6207
Website: http://www.dhhs.state.nh.us/DHHS/MEDICAIDPROGRAM/default.htmPhone: 1-800-852-3345 x 5254
MAINE – Medicaid NEW JERSEY – Medicaid and CHIPWebsite: http://www.maine.gov/dhhs/oms/Phone: 1-800-321-5557
Medicaid Website: http://www.state.nj.us/humanservices/dmahs/clients/medicaid/Medicaid Phone: 1-800-356-1561CHIP Website: http://www.njfamilycare.org/index.htmlCHIP Phone: 1-800-701-0710
MASSACHUSETTS – Medicaid and CHIP NEW MEXICO – Medicaid and CHIPMedicaid & CHIP Website: http://www.mass.gov/MassHealthMedicaid & CHIP Phone: 1-800-462-1120
Medicaid Website: http://www.hsd.state.nm.us/mad/index.htmlMedicaid Phone: 1-888-997-2583CHIP Website: http://www.hsd.state.nm.us/mad/index.htmlClick on Insure New Mexico
CHIP Phone: 1-888-997-2583MINNESOTA – Medicaid NORTH DAKOTA – Medicaid
Website: http://www.dhs.state.mn.us/Click on Health Care, then Medical Assistance
Phone (Outside of Twin City area): 800-657-3739Phone (Twin City area): 651-431-2670
Website: http://www.nd.gov/dhs/services/medicalserv/medicaid/Phone: 1-800-755-2604
MISSOURI – Medicaid OKLAHOMA – Medicaid
Website: http://www.dss.mo.gov/mhd/index.htmPhone: 573-751-6944
Website: http://www.insureoklahoma.orgPhone: 1-888-365-3742
OREGON – Medicaid and CHIP VERMONT– Medicaid
Medicaid & CHIP Website: http://www.oregonhealthykids.govMedicaid & CHIP Phone: 1-877-314-5678
Website: http://ovha.vermont.gov/Telephone: 1-800-250-8427
PENNSYLVANIA – Medicaid VIRGINIA – Medicaid and CHIP
Website: http://www.dpw.state.pa.us/partnersproviders/medicalassistance/doingbusiness/003670053.htmPhone: 1-800-644-7730
Medicaid Website: http://www.dmas.virginia.gov/rcp-HIPP.htmMedicaid Phone: 1-800-432-5924CHIP Website: http://www.famis.org/CHIP Phone: 1-866-873-2647
RHODE ISLAND – Medicaid WASHINGTON – Medicaid
Website: www.dhs.ri.govPhone: 401-462-5300
Website: http://hrsa.dshs.wa.gov/premiumpymt/Apply.shtmPhone: 1-877-543-7669
SOUTH CAROLINA – Medicaid WEST VIRGINIA – Medicaid
Website: http://www.scdhhs.govPhone: 1-888-549-0820
Website: http://www.wvrecovery.com/hipp.htmPhone: 304-342-1604
TEXAS – Medicaid WISCONSIN – Medicaid
Website: https://www.gethipptexas.com/Phone: 1-800-440-0493
Website: http://dhs.wisconsin.gov/medicaid/publications/p-10095.htmPhone: 1-800-362-3002
UTAH – Medicaid WYOMING – Medicaid
Website: http://health.utah.gov/medicaid/Phone: 1-866-435-7414
Website: http://www.health.wyo.gov/healthcarefin/index.htmlTelephone: 307-777-7531
Contact Information for State CHIP and Medicaid Programs (cont.)
D – 48

9797
Latest Regulatory Guidance1
Case Studies and Impact Analysis3
Select Health Reform Provisions 5
Key Action Steps for Plan Sponsors2
Today’s Discussion
Reference: Health Reform Chronology8
6 Health Reform Self-Service Tools
Appendix: Legislative Details and Model Notices7
Considerations for Dropping Group Coverage4
Overview and Current Environment0
98
Health Care Reform – Chronology
2010
March(date of enactment)
June(90 days after enactment)
September(plan years beginning
6 months after enactment)
Senate Bill (H.R. 3590) enactment
March 23, 2010
Reconciliation Bill(H.R. 4872) enactment
March 30, 2010
• Small business under 25 full-time equivalent employees and average annual wages under $50,000 eligible for tax credit (retroactive to 1/1/2010)
• Temporary reinsurance program for employers who provide coverage for early retirees
• Provides immediate access to high risk pools for uninsured (pre-existing conditions)
• Seniors will receive a $250 rebate to help fill the Medicare “donut hole”
• Bans pre-existing conditions exclusions for dependents under age 19
• Prohibits lifetime/restrictive annual dollar maximums
• Mandates dependent coverage to age 26 for those not eligible for other group coverage
• Prohibits rescissions except for fraud
• Preventive care covered without cost sharing (new plans)
• Group plans must cover ER services without prior authorizations and in- or out-of-network (new plans)
• Group plans must allow designation of OB/GYN or pediatrician as PCP (new plans)
• Employer plans must have HHS approved external appeal process (new plans)
• Insured group health plans subject to nondiscrimination rules re: highly compensated individuals (new plans)
D – 49

99
Health Care Reform – Chronology (cont’d)
2011
• OTC drugs (except insulin) without prescription no longer eligible under FSA, HRA, or HSA
• Higher penalty on withdrawal of HSA funds for non-medical expenses
• Employers with less than 100 employees are eligible for wellness grants (up to 5 years)
• New federal voluntary LTC program established (CLASS Act)
• Requires insurers to annually report percent of premiums spent on medical services; if less than 80%, must provide rebate to enrollees (large group plans must spend 85%)
• Auto-enrollment of new hires for employers with more than 200 employees* (likely effective when HHS regulations issued)
2012
• Employers required to provide employees with Uniform Summary of Coverage (24 months post-enactment)
• Plans must report annually to HHS and participants regarding improving quality of care (24 months post-enactment)
• Employers must satisfy expanded Forms 1099 reporting requirements for payments to corporate service providers
• Employers required to disclose value of health benefits on Forms W-2
2013
• Caps FSA salary reduction contributions to $2,500/year
• Imposes an additional hospital insurance tax of.9 percent on high income individuals ($200,000 individual, $250,000 joint)
• Imposes an additional 3.9% Medicare payroll tax on unearned income for high income individuals ($200,000 individual, $250,000 joint)
• Imposes a comparative effectiveness fee of $2 per participant for insurers
• Employers required to provide written notice to employees about Exchange and subsidies
• Tax exclusion of Medicare Part D drug subsidy eliminated
*auto-enrollment effective date is still unclear
D – 50
Appendix E
County Code Section 6-1-308 – Group Health Insurance – Cost Share


Anne Arundel County Code, 2005
§ 6-1-308. Group health insurance.
(a) Generally. The County shall provide a group health plan for employees who are members of the group health plan; employees permanently and totally disabled from performing an occupation who have been retired from County service as a consequence of the disability; and, in accordance with criteria established by the Personnel Officer, employees who retire from County service.
(b) Cost. The cost of each employee's benefits under the group health plan shall be shared by the County and the employee:
(1) for employees represented by an exclusive representative, as provided in a memorandum of agreement negotiated and signed under Title 4 between the County and the exclusive representative;
(2) for employees who are not represented by an exclusive representative, as determined by the Personnel Officer;
(3) for employees who retire from County service, the County shall pay 80% of the cost and the employee shall pay 20% of the cost; and
(4) for part-time employees who work at least 50% of the normal work week, the County shall pay a prorated portion of the cost paid for full-time employees.
(c) Health care accounts. The County may establish health care accounts approved by the Internal Revenue Service to permit the accumulation of monies to pay for the health care expenses of employees and retirees.
(1985 Code, Art. 8, § 1-307) (Bill No. 33-89; Bill No. 34-93; Bill No. 23-04; Bill No. 86-04) Disclaimer: This Code of Ordinances and/or any other documents that appear on this site may not reflect the most current legislation adopted by the Municipality. American Legal Publishing Corporation provides these documents for informational purposes only. These documents should not be relied upon as the definitive authority for local legislation. Additionally, the formatting and pagination of the posted documents varies from the formatting and pagination of the official copy. The official printed copy of a Code of Ordinances should be consulted prior to any action being taken. For further information regarding the official version of any of this Code of Ordinances or other documents posted on this site, please contact the Municipality directly or contact American Legal Publishing toll-free at 800-445-5588.
© 2011 American Legal Publishing Corporation [email protected]
1.800.445.5588.
Page 1 of 1
1/6/2012http://www.amlegal.com/alpscripts/get-content.aspx
E – 1


Appendix F
Office of Law Memo – David Plymyer – Risk Matrix

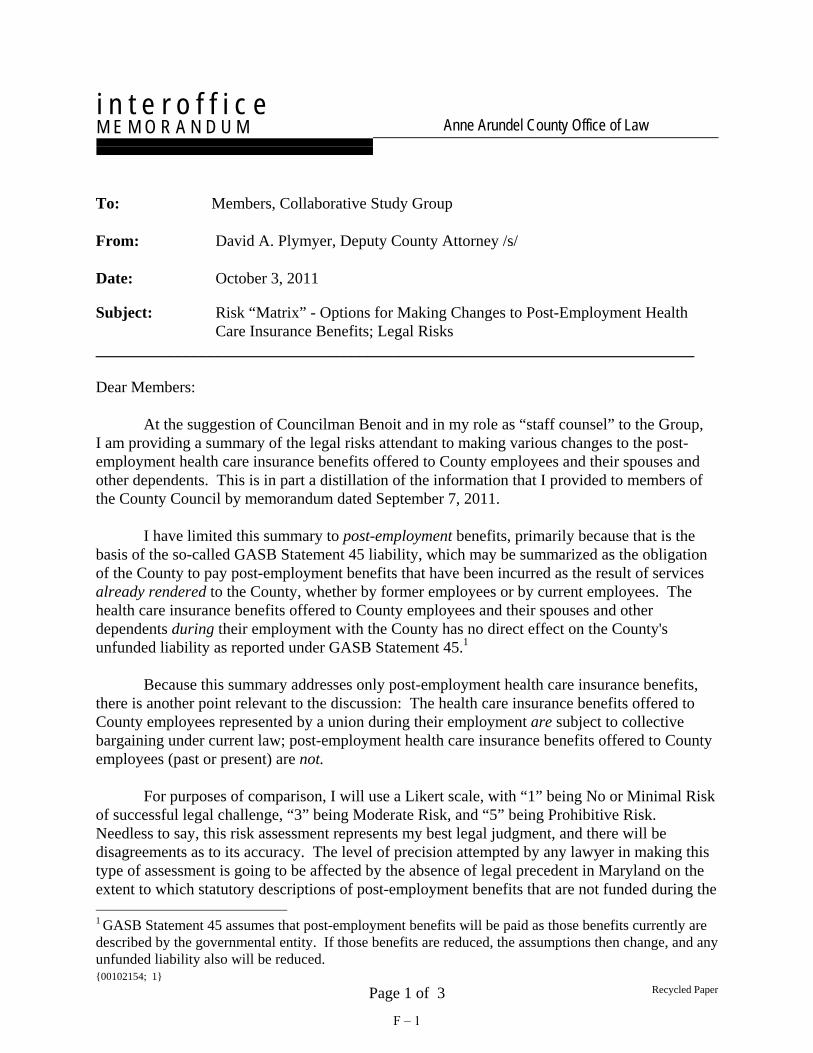
{00102154; 1} Recycled Paper Page 1 of 3
i n t e r o f f i c e
M E M O R A N D U M Anne Arundel County Office of Law
To: Members, Collaborative Study Group From: David A. Plymyer, Deputy County Attorney /s/ Date: October 3, 2011 Subject: Risk “Matrix” - Options for Making Changes to Post-Employment Health
Care Insurance Benefits; Legal Risks ___________________________________________________________________________ Dear Members: At the suggestion of Councilman Benoit and in my role as “staff counsel” to the Group, I am providing a summary of the legal risks attendant to making various changes to the post-employment health care insurance benefits offered to County employees and their spouses and other dependents. This is in part a distillation of the information that I provided to members of the County Council by memorandum dated September 7, 2011. I have limited this summary to post-employment benefits, primarily because that is the basis of the so-called GASB Statement 45 liability, which may be summarized as the obligation of the County to pay post-employment benefits that have been incurred as the result of services already rendered to the County, whether by former employees or by current employees. The health care insurance benefits offered to County employees and their spouses and other dependents during their employment with the County has no direct effect on the County's unfunded liability as reported under GASB Statement 45.1 Because this summary addresses only post-employment health care insurance benefits, there is another point relevant to the discussion: The health care insurance benefits offered to County employees represented by a union during their employment are subject to collective bargaining under current law; post-employment health care insurance benefits offered to County employees (past or present) are not. For purposes of comparison, I will use a Likert scale, with “1” being No or Minimal Risk of successful legal challenge, “3” being Moderate Risk, and “5” being Prohibitive Risk. Needless to say, this risk assessment represents my best legal judgment, and there will be disagreements as to its accuracy. The level of precision attempted by any lawyer in making this type of assessment is going to be affected by the absence of legal precedent in Maryland on the extent to which statutory descriptions of post-employment benefits that are not funded during the 1 GASB Statement 45 assumes that post-employment benefits will be paid as those benefits currently are described by the governmental entity. If those benefits are reduced, the assumptions then change, and any unfunded liability also will be reduced.
F – 1

{00102154; 1} Recycled Paper Page 2 of 3
active service of an employee create contractual obligations enforceable against a local government. The adjective "modest" is used to describe certain changes to benefits. Suffice it to say at this point that, in general, the more "modest" the change, the lower the risk of successful legal challenge. A. Benefits of employees who already have retired. BENEFIT CHANGE RISK LEVEL
A modest increase in the percentage of the costs paid for coverage other than the Medicare Supplement, currently established by ordinance at 20%. (E.g., increase to 30%.)
3
Elimination of Medicare Supplement coverage entirely, or a significant increase in the retiree’s percentage of the costs from 20%.
2
Elimination of Prescription Drug Coverage for Medicare-eligible retirees by “transition” to Medicare Part D.
2
Modest changes to the structure of the Group Health Plan offered to retirees, including increases to deductibles and co-pays.
1
B. Benefits of spouses and dependents of employees who already have retired. (Also applies to surviving spouses.) BENEFIT CHANGE RISK LEVEL
Elimination of all coverage, including Medicare Supplement and Prescription Drug Coverage.
1
A significant increase in the percentage of costs paid for all coverages. 1 Significant changes to the structure of the Group Health Plan offered to spouses and dependents of retirees, including increases to deductibles and co-pays.
1
C. Future benefits of active employees who have “vested” in the benefits of their pension plans either by becoming eligible for normal retirement or by accruing the number of years of “credited service” required to vest in plan benefits. (Also applies to “terminated vested” former employees.) BENEFIT CHANGE RISK LEVEL
A modest increase in the percentage of the costs paid for coverage other than the Medicare Supplement, currently established by ordinance at 20%. (E.g., increase to 30%.)
2
Elimination of Medicare Supplement coverage entirely, or a significant increase in the retiree’s percentage of the costs from 20%.
2
Elimination of Prescription Drug Coverage for Medicare-eligible retirees by “transition” to Medicare Part D.
1
Modest changes to the structure of the Group Health Plan offered to 1
F – 2
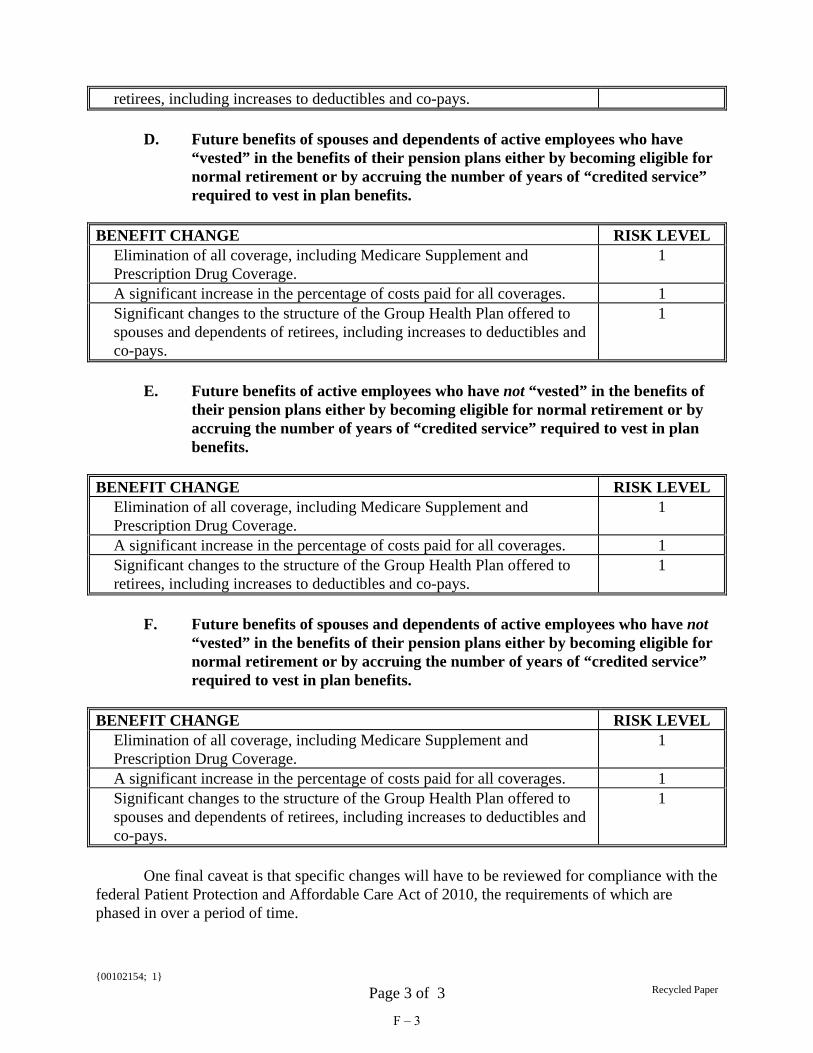
{00102154; 1} Recycled Paper Page 3 of 3
retirees, including increases to deductibles and co-pays. D. Future benefits of spouses and dependents of active employees who have “vested” in the benefits of their pension plans either by becoming eligible for normal retirement or by accruing the number of years of “credited service” required to vest in plan benefits. BENEFIT CHANGE RISK LEVEL
Elimination of all coverage, including Medicare Supplement and Prescription Drug Coverage.
1
A significant increase in the percentage of costs paid for all coverages. 1 Significant changes to the structure of the Group Health Plan offered to spouses and dependents of retirees, including increases to deductibles and co-pays.
1
E. Future benefits of active employees who have not “vested” in the benefits of their pension plans either by becoming eligible for normal retirement or by accruing the number of years of “credited service” required to vest in plan benefits. BENEFIT CHANGE RISK LEVEL
Elimination of all coverage, including Medicare Supplement and Prescription Drug Coverage.
1
A significant increase in the percentage of costs paid for all coverages. 1 Significant changes to the structure of the Group Health Plan offered to retirees, including increases to deductibles and co-pays.
1
F. Future benefits of spouses and dependents of active employees who have not “vested” in the benefits of their pension plans either by becoming eligible for normal retirement or by accruing the number of years of “credited service” required to vest in plan benefits. BENEFIT CHANGE RISK LEVEL
Elimination of all coverage, including Medicare Supplement and Prescription Drug Coverage.
1
A significant increase in the percentage of costs paid for all coverages. 1 Significant changes to the structure of the Group Health Plan offered to spouses and dependents of retirees, including increases to deductibles and co-pays.
1
One final caveat is that specific changes will have to be reviewed for compliance with the federal Patient Protection and Affordable Care Act of 2010, the requirements of which are phased in over a period of time.
F – 3

Appendix G
Office of Law Memo David Plymyer
Recommendation for Issues to Be Considered


{00102251; 1} Recycled Paper Page 1 of 2
i n t e r o f f i c e
M E M O R A N D U M Anne Arundel County Office of Law
To: Members, Collaborative Study Group From: David A. Plymyer, Deputy County Attorney /s/ Date: October 3, 2011 Subject: Recommendations for Issues to Be Considered ___________________________________________________________________________ Dear Members: There are three actions that I recommend that the Group consider. These actions do not involve specific health care insurance benefit changes, and address the legal structure within which such benefits are established and funded. 1. A charter amendment authorizing the County Council to establish an Other Post-Employment Benefits (OPED) Trust. Under County law, a charter amendment is required in order to set up a continuing, non-lapsing fund as a means of setting aside money for funding “other post-employment benefits” (i.e., other than pension benefits). A charter amendment also is required in order to give the entity chosen to administer such a "trust fund" any degree of autonomy from the other operations of County government, such as purchasing requirements. My recommendation has been to propose an amendment to the County Charter that authorizes the County Council to pass an ordinance establishing such a trust fund, designating an entity responsible for the trust, and conferring on that entity the autonomy that the County Council believes is appropriate. There is a certain element of timing that has to do with the Charter Revision Commission, which meets once every ten years and is meeting now. I am aware that there are policy considerations that go into the timing of creating such a trust, not the least of which is the availability of money to put into it. Consequently, my recommendation is limited to giving the County Council the authority to act if and when it deems such action appropriate. For what it is worth, the "conventional wisdom" is that eventually state and local governments will have to establish OPED trusts as vehicles for funding a sustainable program of health insurance benefits. 2. An ordinance that adequately sets forth the County’s "program" for providing health insurance benefits to employees, retirees, and their spouses and other dependents.
G – 1
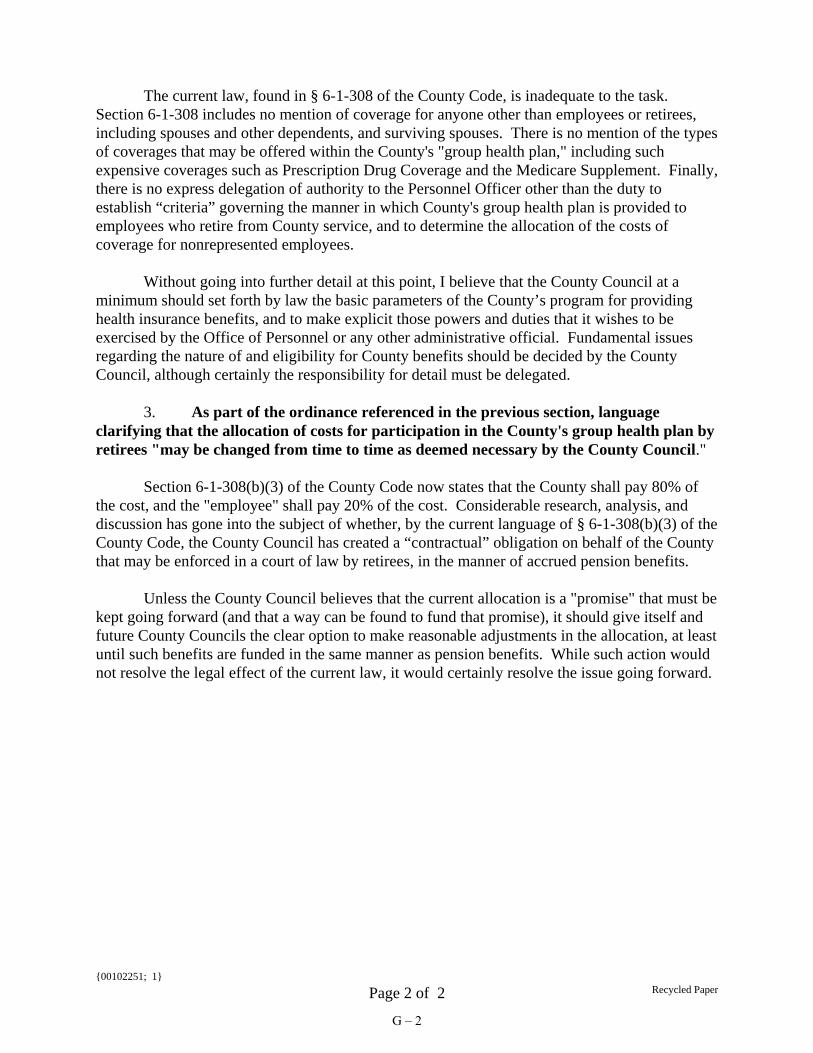
{00102251; 1} Recycled Paper Page 2 of 2
The current law, found in § 6-1-308 of the County Code, is inadequate to the task. Section 6-1-308 includes no mention of coverage for anyone other than employees or retirees, including spouses and other dependents, and surviving spouses. There is no mention of the types of coverages that may be offered within the County's "group health plan," including such expensive coverages such as Prescription Drug Coverage and the Medicare Supplement. Finally, there is no express delegation of authority to the Personnel Officer other than the duty to establish “criteria” governing the manner in which County's group health plan is provided to employees who retire from County service, and to determine the allocation of the costs of coverage for nonrepresented employees. Without going into further detail at this point, I believe that the County Council at a minimum should set forth by law the basic parameters of the County’s program for providing health insurance benefits, and to make explicit those powers and duties that it wishes to be exercised by the Office of Personnel or any other administrative official. Fundamental issues regarding the nature of and eligibility for County benefits should be decided by the County Council, although certainly the responsibility for detail must be delegated. 3. As part of the ordinance referenced in the previous section, language clarifying that the allocation of costs for participation in the County's group health plan by retirees "may be changed from time to time as deemed necessary by the County Council." Section 6-1-308(b)(3) of the County Code now states that the County shall pay 80% of the cost, and the "employee" shall pay 20% of the cost. Considerable research, analysis, and discussion has gone into the subject of whether, by the current language of § 6-1-308(b)(3) of the County Code, the County Council has created a “contractual” obligation on behalf of the County that may be enforced in a court of law by retirees, in the manner of accrued pension benefits. Unless the County Council believes that the current allocation is a "promise" that must be kept going forward (and that a way can be found to fund that promise), it should give itself and future County Councils the clear option to make reasonable adjustments in the allocation, at least until such benefits are funded in the same manner as pension benefits. While such action would not resolve the legal effect of the current law, it would certainly resolve the issue going forward.
G – 2

Appendix H
Wage comparisons – Area Counties

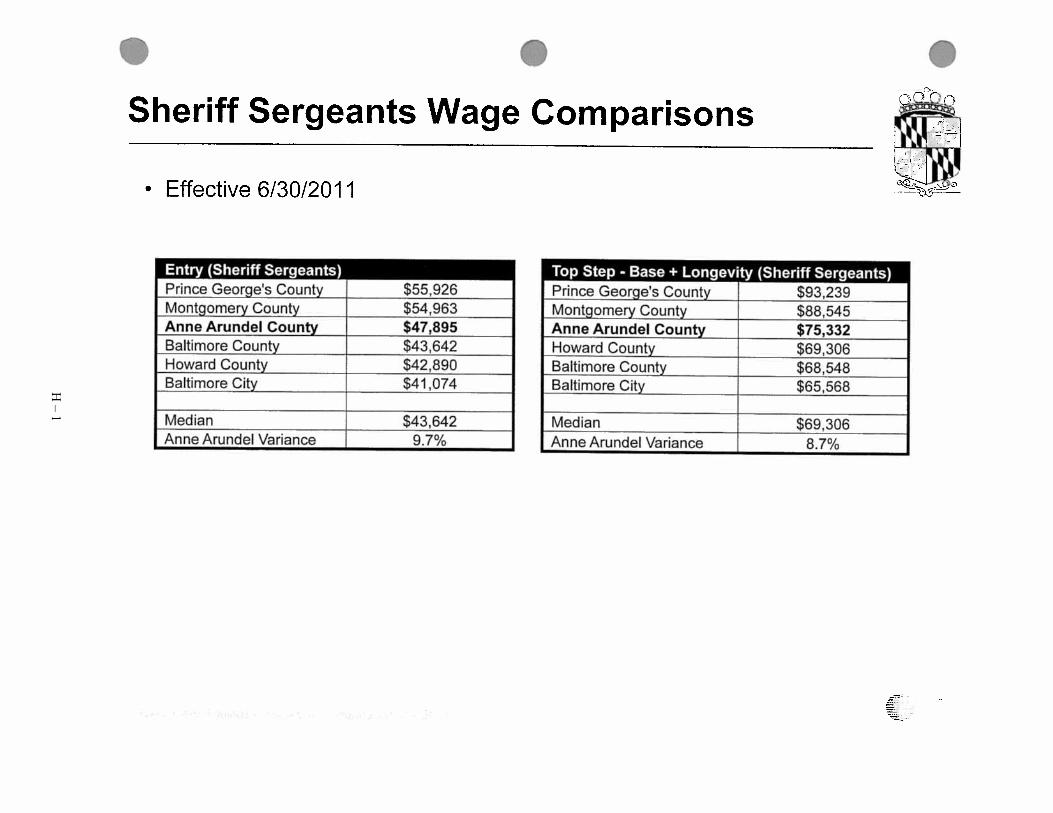
H – 1

H – 2

H – 3

H – 4

H – 5
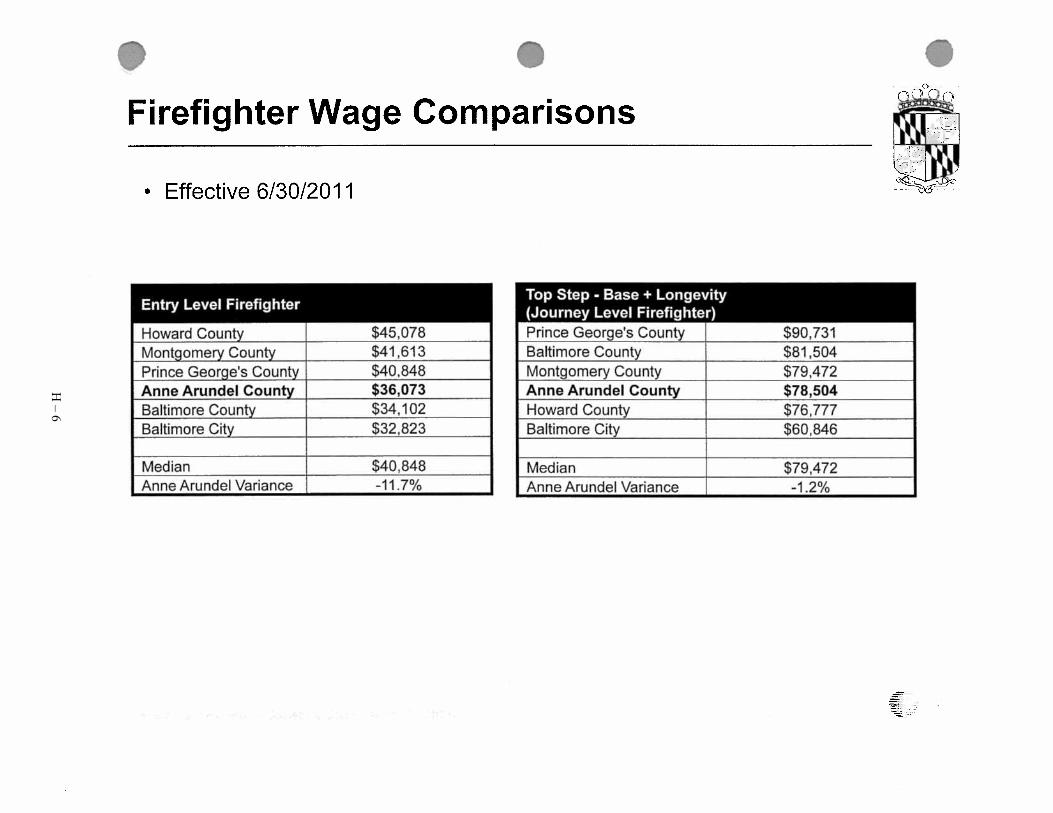
H – 6

H – 7

H – 8
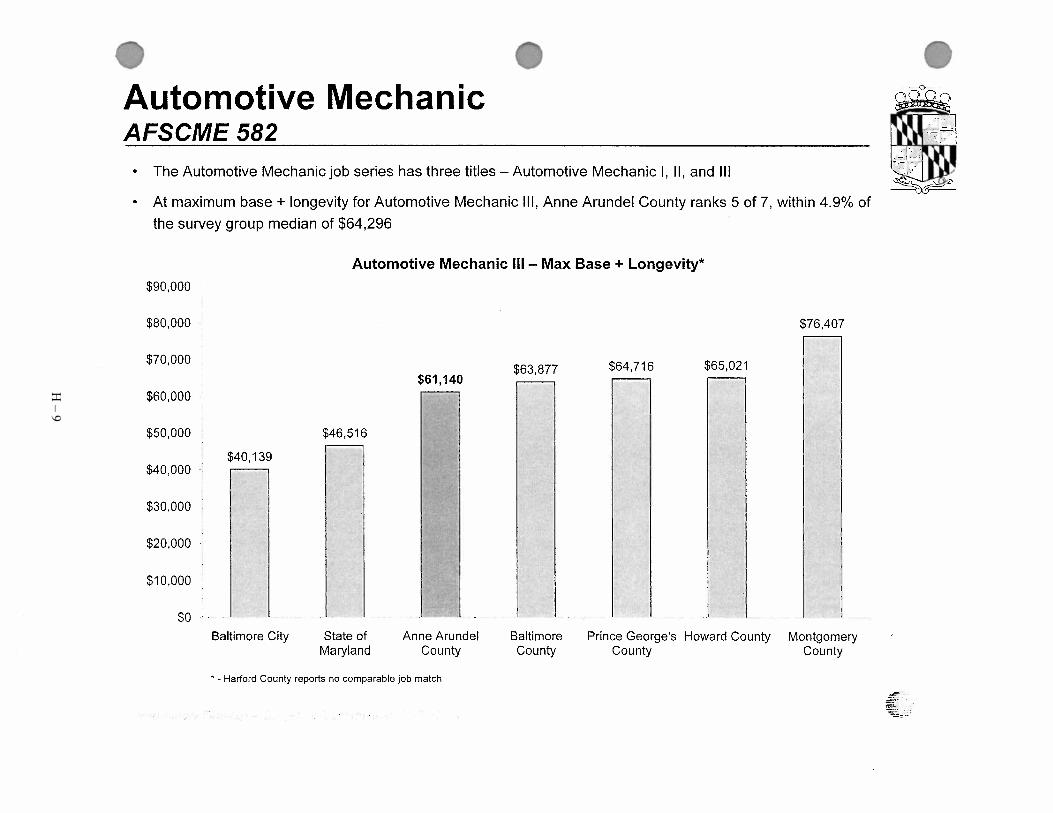
H – 9

H – 10
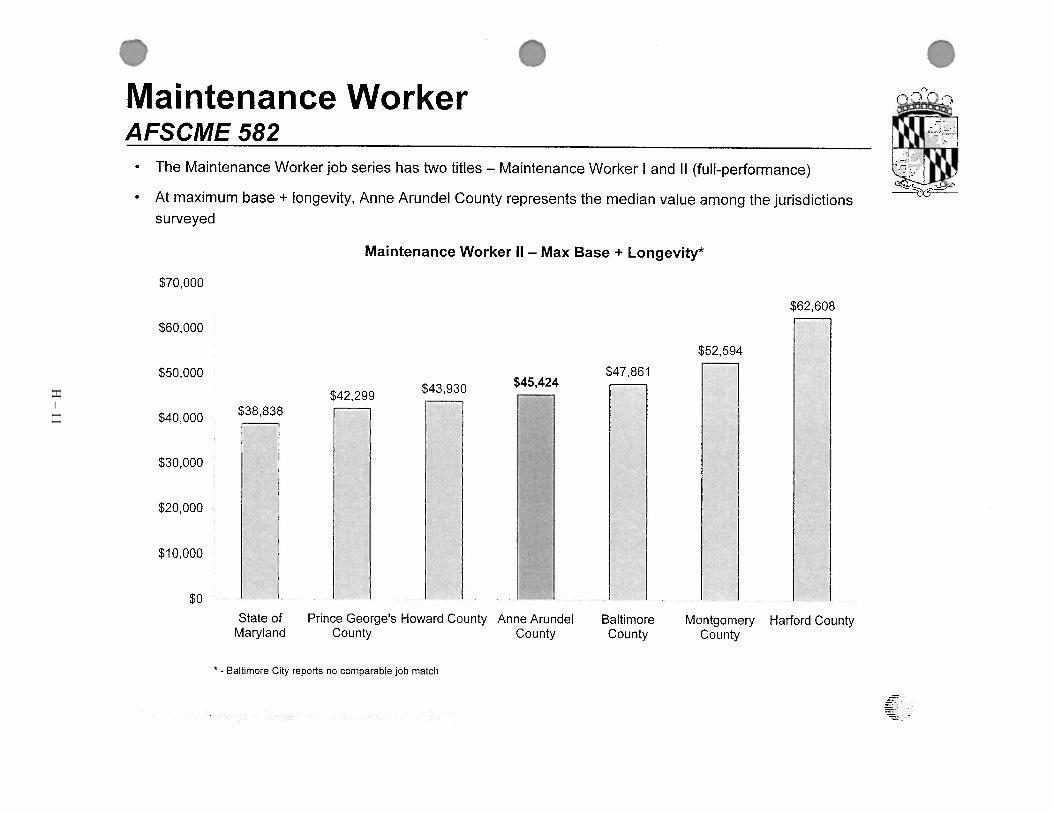
H – 11

H – 12

H – 13

H – 14
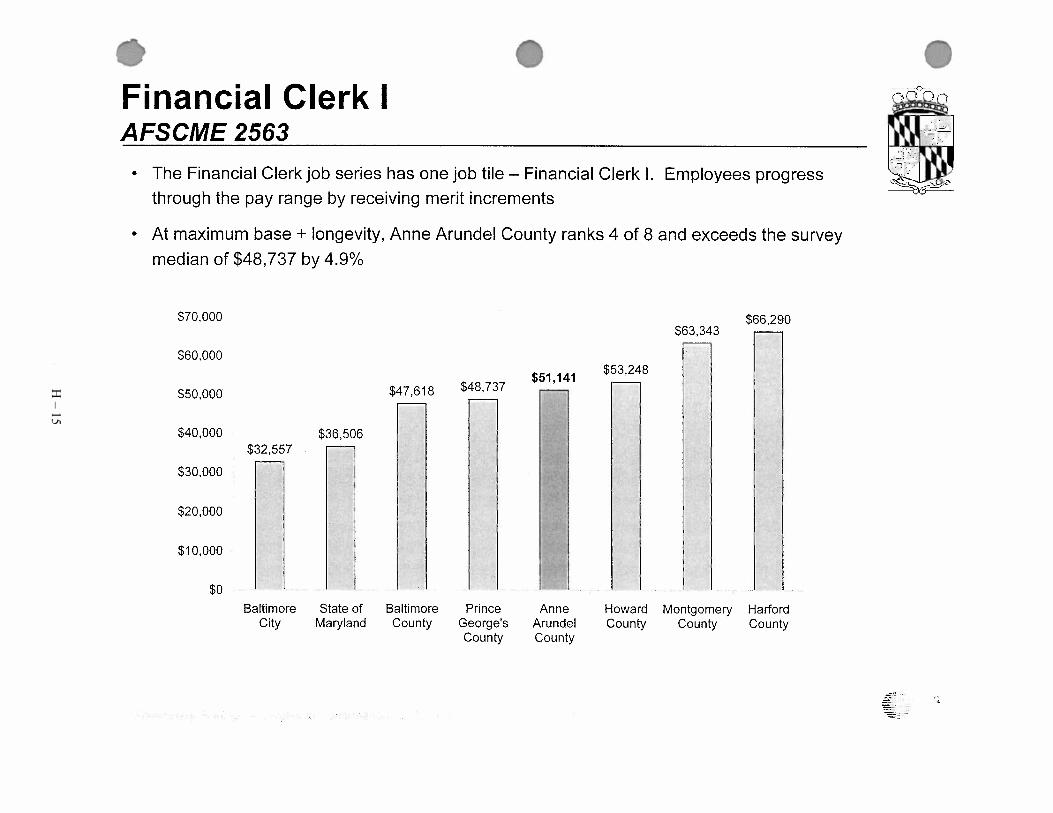
H – 15

H – 16

H – 17

H – 18

H – 19

H – 20

H – 21

H – 22

H – 23

H – 24

H – 25

H – 26

H – 27


Appendix I
Private Sector Benefit Comparisons


Private Sector Benefit Comparisons
Pension Health - Employee Share Prescription Coverage Dental - Employee Share Vision - Employee Share Retiree HealthComcast 401k Up to 6% Match dollar-for-dollar Aetna Choice POS 2 Open AccessFamily $400/Month $10 Copay Generic HMO Family $30/Month Offered None
POS H&W $300/Month UCCI Advantage Plus $41/MonthDeductable: $200 Single/$400 Family In Network $10 Co-PayCoinsurance: In-Network 90%/Out of Network 70%Coinsurance OOP Max: In-Network Family $2500/OON $6,000$15 Copay/$25 Copay specialistIn patient Hospital $250ER $150 Copay
Verizon Salaried 401k 6% Match, dollar for dollar Plans (Salaried): Co-Pays (Salaried ) Plans (Salaried): Plans (Salaried): Currently Active Future Retirees Plans (Salaried):
PPO Plan Design: Ded.$1K/$3K;.80% plan; $2K/$6K OOP Generic 20% ($25 max)PDO Plan Design: Ded. $50/$100 (waived for diagnostic & preventive); Annual Plan Max $1,500/ $2,000 Ortho Life Max
Vision Plan Design: Included in Medical; Copay $25 exams None for lenses, frames or contacts Pre-65 PPO : Ded.$1K/$3K.80% plan;$2K/$6K OOP
Monthly Employee Contribution: $22.50/ $60.83/ $97.50/ Smoker surcharge$50 per household Formulary 30% ($60 max)
Monthly Employee Contribution: $10/ $20/ $30/ Smoker surcharge-$5 per household
Rates:2011 full cost: $658.42/ $1,277.33 NoEmployer Contribution
EPO Plan Design: Ded. None; 90% Plan; $1k/$3k OOP Non-Formulary 40% ($80 max) DHMO Plan Design: Ded. None; Unlimited maxPre-65 POS: Ded.None/$90% plan;$1K/no family limit OOP
Monthly Employee Contribution: $55.00/ $148.33/ $237.50/ SmokerSurcharge-$50 per household
Monthly Employee Contribution: $7.50/ $15.00/ $22.50Smoker surcharge-$5 per household
Rates:2011 full cost: $895.92/ $1,738.08 NoEmployer Contribution
Verizon Hourly Union Plans (Hourly Union) Co-Pays (Hourly Union ) Plans (Hourly Union) Plans (Hourly Union)
Currently Active Future Retirees Plans (Hourly Union)
POS Plan Design: Ded. None; 100% plan; N/A OOP Generic 20% ($40 max)PDO Plan Design: Ded. None; Annual Plan Max $1,500/ $2,000 Ortho Lifetime Max
Vision Plan Design: Separate; Copay $10 exams, $25 lenses, frames or contacts Pre- 65 POS: Ded.None;100% plan;N/A OOP
Monthly Employee Contribution: None (100% for first 3 mths of Service) Formulary 30% ($60 max) Monthly Employee Contribution: None Monthly Employee Contribution: None Rates:2011 full cost: $927.58/ $1,855.17
Indemnity Plan Design: Ded.$250/$625; 100% plan; $1K/no family OOP Non-Formulary 40% ($80 max)Indemnity Plan Design: Ded. None; Annual Plan Max $1,500/ $2,000 Ortho Lifetime Max
Employer Defined Contributions: Varies by service: $430 per year x service years (maximum 30 years) per retiree
Monthly Employee Contribution: None (100% for first 3 mths of Service) Monthly Employee Contribution: None Pre-65 Indemnity; Opt Out; HMO: Ded.$250/$625;100% plan;$1K/no family lmtOOP
EPO Plan Design: Ded.None; 100% plan; N/A OOP DHMO Plan Design: Ded. None; Unlimited max Rate: 2011 full cost: $927.58/$1,855.17Monthly Employee Contribution: None (100% for first 3 mths of Service) Monthly Employee Contribution: None Employer Defined Dollar Contributions: Varies by
service: $430 per year x service years (maximum 30 years) per retiree
Northrup Savings Plan - Either a 401(K) pre-tax or a Cost Pref PPO CDHP EPO OOP Pref PPO CDHP EPO Cost Individual H & W Family VSP Plan Provided, Retiree responsible for full cost of coverage401(K) after tax, or a Roth 401(K) and a Individual $720 $96 $2,448 Ind/Family $2,000/$4,000 None $1,500/$3,000 Prev. Care $48 $132 $228Northrop Grumman Retirement Account H & W $2,004 $924 $5,448 CIGNA HMO $60 $168 $264 Exam:
Family $2,676 $1,116 $6,948 Delta $60 $204 $312 In-Network: $10 co-pay, Plan pays balDelta Plus $132 $312 $480 Out of Network: $40
Savings Plan Deductable In/Out In/Out In/Out Co-Pays* Treatment* Prev. Care Fillings Crowns RX glasses:Employee Contribution 1% to 75% Individual $500/$800 $800/$800 $0/$0 Generic $5 10% $5 Prev. Care 100% No No In-Network: $10 co-pay, Plan pays balEmployer Basic Contribution 1% to 8.5% & H & W $1,200/$1,200 $0/$0 Formulary $20 10% $20 CIGNA HMO 100% 100% Co-Pays Out of Network: $40 -$80Employer Matching Contribution 1% to 4.5%, Plus Family $1,000/$1,600 $1,600/$1,600 $0/$0 Non-Formulary $40 10% $40 Delta 100% 80% 80% Frames:Retirement Account contribution of 3% to 5% Delta Plus 100% 80% 80% In-Network: $10 co-pay, Plan pays $120(Based on Age) Co-Pays* In/Out In/Out In/Out *Percentages apply after deductables have been met *Percentage is Coverage Per Cent Out of Network: $45Employee responsible for investment of funds Primary Dr. $20/50% 10%/40% $20 Contacts:
Specialist $40/40% 90%/40% $40 In-Network: 100% of evaluation & int supply *Percentages apply after deductables have been met Out of Network: $105
OOP Max In/Out In/Out In/Out Maximum Per PersonIndividual $3,000/$5,000 $5,000/$5,000 $0/$0 Prev. Care $500H & W $7,500/$7,500 $0/$0 CIGNA HMO Does Not ApplyFamily $6,000/$10,000 $10,000/$10,000 $0/$0 Delta $1,500
Deta Plus $2,000Emerg. Room* 10%/10% 10%/10% 0% after
$250 Co-Pay *Percentages apply after deductables have been met
AAMC 403b PPO Individual 75/25 ($125/Month) On site Pharmacy PPO 50/50 ($26/Month) $6 per month NoneIf employee participates Family 70/30 ($390/Month) Co-pays 10%, 25%, 35% $1200 annual maximum benefit One visit every other year
Must contribute 4% No OOP Maximum Pair of glasses coveredEmployer matches at 50% for first
12 years, then matches at 75% after 12 years
I – 1


Appendix J
National Business Group on Health Article – Large Employer Survey


Printed from National Business Group on Health website (www.BusinessGroupHealth.org) Jan 17, 2012
Majority of Large Employers Revamping Health Benefit Programs for 2012, National Business Group on Health Survey Finds August 18, 2011
For more information contact: Ed Emerman [email protected] 609-275-5162
For Immediate Release
Employers Projecting Costs to Increase 7.2% Next Year; Nearly Two-Thirds Expect to Increase Employee Share of Premiums
WASHINGTON, DC, August 18, 2011 -- With the cost of employee health care benefits expected to increase next year at more than twice the rate of inflation, large U.S. employers are planning to have workers share more of the cost next year, according to a new survey by the National Business Group on Health, a non-profit association of 329, mostly large employers. The survey also found that more employers are adopting consumer-directed health plans and making other changes to their benefit programs as various components of the health care reform law take effect.
According to the survey, employers estimate their health care benefit costs will increase an average of 7.2% in 2012. That is slightly lower than this year's 7.4% average increase, but it is on a higher base and it still sharply outpaces the economy's anemic growth and business conditions. To help control those increases and begin driving down costs to avoid the Cadillac tax, employers are planning to use a wider variety of cost-sharing strategies. More than half of respondents (53%) plan to increase the percentage that employees contribute to the premiums, while 39% plan to increase in-network deductibles. Additionally, about one in four employers plans to increase out-of-network deductibles (23%) and out-of-pocket maximums (22%) next year. The survey, based on responses from 83 of the nation's largest corporations, was conducted in June 2011.
"Employers are facing a multitude of challenges posed by rising health care costs, the weak economy and the financial and administrative impact of complying with the new health reform law," said Helen Darling, President and CEO of the National Business Group on Health. "As a result, employers are being much more aggressive in their use of cost-sharing techniques and cost control programs, and are making certain that employees have more reasons to be cost-sensitive health care consumers."
Indeed, according to the survey, nearly three in four employers (73%) will offer employees at least one consumer-directed health plan (CDHP) in 2012, a sharp increase from 61% that offer a plan this year. In addition, about two in ten employers (17%) will have or move to a total replacement consumer-directed health plan in 2012. The most common type of CDHP plan is a high-deductible health plan with a health savings account (75%).
The survey also found that more than half (57%) provide employees' spouses and domestic partners access to telephonic or online weight management coaches while 54% provide access to online weight management tools. Approximately one-third of employees also make these programs available to employees' children.
Changes as a Result of Health Care Reform
Respondents were asked what changes they made or are planning to make as regulations from the Patient Protection and Affordable Care Act continue to come into effect. The survey found the following:
-- Annual Benefit Limits: The majority of employers (59%) are not making any changes for 2012, (full restrictions on benefit limits will be banned in2014). However, more than one-fourth (27%) are making changes to annual limits for preventive and wellness services. Another 14% are making changes to annual limits for mental health and substance abuse services.
-- Grandfather Status: Nearly one fourth (23%) will have at least one benefit option that keeps its grandfather status in 2012 while 19% will drop its grandfather status. About one half (49%) did not have any benefit option in grandfather status this year.
-- Default Plan for New Hires: More than one fourth (27%) plan to use their least costly health plan for employees as their default plan for new full-time hires as required. Slightly fewer (19%) plan to use the least costly plan for employers as
Page 1 of 2National Business Group on Health: Pressroom
1/17/2012http://www.businessgrouphealth.org/pressrelease.cfm?printPage=1&ID=179
J – 1

the default plan.
"Employers understand that affordability is tied to employees' premium costs and household incomes so they have two strong arguments for aggressively driving down costs -- both theirs and employees. That said, the federal government has to start helping reduce costs too. Like the national debt crisis that we are struggling to solve, we have to solve the health care cost crisis, which is seriously undermining our economy, businesses' abilities to create jobs, working families, our global competitiveness and our standard of living. This is our other national crisis, and they are so intertwined that if we don't reduce costs and medical trend, we will continue to barrel toward insolvency," said Darling.
About the National Business Group on Health The National Business Group on Health is the nation's only non-profit organization devoted exclusively to representing large employers' perspective on national health policy issues and providing practical solutions to its members' most important health care problems. The Business Group helps drive today's health agenda while promoting ideas for controlling health care costs, improving patient safety and quality of care and sharing best practices in health benefits management with senior benefits, HR professionals, and medical directors from leading corporations. Business Group members, which include 66 Fortune 100 companies, provide health coverage for more than 55 million U.S. workers, retirees and their families. For more information, visit www.businessgrouphealth.org.
Copyright 2012 National Business Group on Health 20 F Street NW, Suite 200, Washington, DC 20001-6700 - P: 202-558-3000 - F: 202-628-9244 E-mail: [email protected]
Page 2 of 2National Business Group on Health: Pressroom
1/17/2012http://www.businessgrouphealth.org/pressrelease.cfm?printPage=1&ID=179
J – 2

Appendix K
Wall Street Journal Article – January 4, 2012 – “Why Public Pensions Are
So Rich”


K – 1

K – 2

Appendix L
Milliman White Paper – EGWP/Wrap: Why Now?


L – 1

L – 2

Appendix M
Bolton Partners Letter – OPEB – Possible Plan Changes


Bolton Partners, Inc. 100 Light Street 9th Floor Baltimore, Maryland 21202 (410) 547-0500 (800) 394-0263 Fax (410) 685-1924
Actuarial, Benefit and Investment Consultants
October 28, 2011 Ms. Judi Lohn, Assistant Personnel Officer Anne Arundel County Government Office of Personnel 2660 Riva Road Annapolis, MD 21401
Re: OPEB- Possible Plan Changes Dear Judi, This letter is in response to your request for the expense impact for 10 proposed plan changes provided to us in an October 19th e-mail. They are:
1) Eliminate post age 65 coverage (A -both for current and future retirees, and B- future retirees only)
2) Eliminate post age 65 prescription drug Coverage after 2019 (A both for current and future retirees and B for future retirees only)
3) Institute service based subsidies (future retirees only) A. For general employees (60% after 10-14 Years, 70% 15-19 Year, 80% 20-24 years,
85% 25-29 Years, 90% 30+ years. B. Public safety and corrections: 60% with 20 years of service, increasing 1.5% per year
of service to a 75% maximum with 30 or more years of service. C. All Employees: 50% with 15 years of service, increasing 2% per year per year of
service to an 80% maximum with 30 or more years of service. D. All Employees: 3.0% per year to a 75% maximum, 20 year service requirement.
4) No retiree health benefits Until Age 55 (future retirees only) 5) Actuarial equivalent reduction of health benefits for retirement commencement before age 55
(future retirees only) 6) Suspend health coverage if retired employee can obtain health insurance through a new
employer or spouse. Benefit recommences at full retirement (future retirees only). 7) Change existing plan from an 80 percent subsidy to a 75 percent subsidy (future retirees only). 8) Change existing plan from an 80 percent subsidy to a 75 percent subsidy for spouse only
(future retirees only). 9) Change Existing Plan from and 80 percent subsidy to a 60 percent subsidy for spouse only
(future retirees only). 10) Eliminate coverage for term vested individuals (future retirees only)
We did not separately price option 4 and 5 because if the reduction is truly actuarially equivalent the cost should be the same.
M – 1

Bolton Partners, Inc.
Ms. Judi Lohn October 28, 2011 Page Two The following tables summarize the results for the ARC and the Accrued Liability.
Anne Arundel County Impact on FY2012 – Funded 8 Percent ARC
$ millions Option General Library Police Fire Detention College Retirees Total
Baseline $20.35 $2.37 $10.43 $10.57 $3.83 $3.44 $18.17 $69.16 1A $7.76 $0.56 $7.42 $7.40 $2.52 $0.84 $7.77 $34.27 1B $8.05 $1.06 $7.42 $7.40 $2.53 $1.42 $18.17 $46.05 2A $14.77 $1.73 $8.92 $8.96 $3.18 $2.61 $14.73 $54.90 2B $14.90 $1.84 $8.92 $8.96 $3.19 $2.70 $18.17 $58.68 3A $17.84 $2.03 $10.43 $10.57 $3.83 $4.24 $18.17 $67.11 3B $20.35 $2.37 $6.83 $7.65 $1.89 $3.44 $18.17 $60.70 3C $14.24 $1.70 $7.73 $8.43 $2.38 $3.56 $18.17 $56.21 3D $12.69 $1.56 $7.06 $7.94 $1.93 $3.12 $18.17 $52.47
4 & 5 $16.96 $1.98 $7.48 $7.87 $2.86 $3.42 $18.17 $58.74 6 $18.02 $2.22 $8.32 $9.56 $3.09 $3.27 $18.17 $62.65 7 $19.29 $2.24 $9.90 $10.04 $3.63 $3.44 $18.17 $66.71 8 $19.92 $2.32 $10.17 $10.33 $3.75 $3.44 $18.17 $68.10 9 $18.62 $2.20 $9.40 $9.58 $3.52 $3.29 $18.17 $64.78 10 $19.48 $2.34 $10.43 $10.57 $3.75 $3.44 $18.17 $68.18
Anne Arundel County
Impact on FY2012 – Funded 8 Percent Accrued Liability $ millions
Option General Library Police Fire Detention College Retirees Total Baseline $147.53 $21.69 $78.78 $81.91 $29.06 $32.66 $281.06 $672.69
1A $58.71 $4.76 $55.30 $56.60 $18.67 $7.25 $120.23 $321.52 1B $63.15 $12.51 $55.30 $56.60 $18.89 $16.26 $281.06 $503.77 2A $108.76 $16.38 $67.08 $69.11 $24.07 $25.49 $227.98 $538.87 2B $110.83 $18.10 $67.08 $69.11 $24.18 $26.89 $281.06 $597.25 3A $140.01 $20.42 $78.78 $81.91 $29.06 $38.57 $281.06 $669.81 3B $147.53 $21.69 $54.88 $64.13 $14.93 $32.66 $281.06 $616.88 3C $116.54 $18.16 $61.51 $69.28 $18.67 $33.81 $281.06 $599.03 3D $106.72 $17.24 $56.69 $66.47 $15.28 $30.79 $281.06 $574.25
4 & 5 $122.59 $18.13 $56.61 $61.13 $21.96 $32.50 $281.06 $593.98 6 $129.08 $20.52 $63.03 $74.03 $23.73 $31.24 $281.06 $622.69 7 $139.88 $20.52 $74.73 $77.75 $27.60 $32.66 $281.06 $654.20 8 $144.33 $21.37 $76.80 $79.89 $28.49 $32.66 $281.06 $664.60 9 $134.73 $20.42 $70.86 $73.84 $26.77 $31.44 $281.06 $639.12 10 $137.71 $21.53 $78.78 $81.91 $28.30 $32.66 $281.06 $661.95
M – 2

Bolton Partners, Inc.
Ms. Judi Lohn October 28, 2011 Page Three Assumptions and Method The assumptions and methods are based on revised valuation report sent to Anne Arundel County on October 25, 2011. However we have used an 8 percent discount rate, which is the funded discount rate used for the pension plan. Under the GASB45 standard a funded discount rate assumption can be used if an irrevocable trust is established and the County contributes at least the funded ARC to the trust. Anne Arundel County has not yet established a trust. There could be some cost impacts due to employees who are eligible to retire, electing to retire before the plan change came into effect, which would lower the savings. We have not factored behavioral changes into our analysis. Under Option 5 Actuarially equivalent factors would have to be developed. The actuarial equivalent factors would depend on the discount rate used for the calculation. If a higher discount rate (e.g. 8 percent) is used to calculate the factors, then there will be larger reduction for early commencement than would result if you assume a lower interest rate more like the current GASB45 discount rate of 4 percent to calculate the actuarial equivalence factors. So if actuarial equivalence factors were developed at an 8 percent discount rate and a lower discount rate was used to determine the expense there could be some additional reductions in cost. To estimate the cost of Option 6 an assumption as to the percentage of retiring employees who are employed by a new employer with available health insurance or who have spouses with health insurance is required. We also must make an assumption as to when they might ultimately retiree and rejoin the plan.
M – 3

Bolton Partners, Inc.
Ms. Judi Lohn October 28, 2011 Page Four The following table provides our assumptions for Option 6.
Percent Who Work with Other Employers with Medical Coverage or with Spouse Coverage
Age at Retirement from Anne
Arundel County General/Library Police Fire Detention College 50 or younger 80.00% 50.00% 25.00% 50.00% 80.00%
51 75.00% 45.00% 22.50% 45.00% 75.00% 52 70.00% 40.00% 20.00% 40.00% 70.00% 53 65.00% 35.00% 17.50% 35.00% 65.00% 54 60.00% 30.00% 15.00% 30.00% 60.00% 55 55.00% 25.00% 12.50% 25.00% 55.00% 56 50.00% 20.00% 10.00% 20.00% 50.00% 57 45.00% 15.00% 10.00% 15.00% 45.00% 58 40.00% 10.00% 10.00% 10.00% 40.00% 59 35.00% 10.00% 10.00% 10.00% 35.00% 60 30.00% 10.00% 10.00% 10.00% 30.00% 61 20.00% 10.00% 10.00% 10.00% 20.00% 62 10.00% 10.00% 10.00% 10.00% 10.00%
Full Retirement Age 64 62 62 62 64 Recently the Actuarial Standards of Practice were revised to require that the actuary consider mortality improvements. This new standard is effective for valuations after July 1, 2011. We have not yet determined how the new standard might impact Anne Arundel County actuarial valuation but it could increase liabilities significantly. We did not include a provision for mortality improvement in these estimates. Including a service requirement to be eligible for benefits may change employee behavior. Retirement may be delayed until eligibility for the OPEB plan is met. We have not factored this possible behavioral change into our analysis.
M – 4

Bolton Partners, Inc.
Ms. Judi Lohn October 28, 2011 Page Five Actuarial Certification This letter has been prepared for the Anne Arundel County Government for the purposes of estimating the impact on the funded ARC under the proposed plan changes. It is neither intended nor necessarily suitable for other purposes. Bolton Partners is not responsible for the consequences of any other use. In general Post Retirement medical valuations are based on an assumption for post-retirement medical increases. If medical costs increase at a rate greater than our assumption there could be a dramatic increase in the cost. Future actuarial measurements may differ significantly from the current measurements presented in this letter, due to such factors as the following: plan experience differing from that anticipated by the economic or demographic assumptions; changes in economic or demographic assumptions; increases or decreases expected as part of the natural operation of the methodology used for these measurements (such as the end of an amortization period or additional cost or contribution requirements based on the plan’s funded status); and changes in plan provisions, applicable law or accounting rules. The actuarial methods and assumptions used in this letter comply with GASB 45 and the actuarial standards of practice promulgated by the American Academy of Actuaries. Bolton Partners is completely independent of Anne Arundel County, its programs, activities, or any of its officers of key personnel. We and anyone closely associated with us does not have any relationship which would impair our independence on this assignment. Kevin Binder is a Member of the American Academy of Actuaries and meets the Qualification Standards of the American Academy of Actuaries to render the actuarial opinion contained in this letter. Please let us know if you have any questions concerning this letter, Sincerely, BOLTON PARTNERS, INC.
Kevin Binder, FSA, EA (443) 573-3906 [email protected]
M – 5


Appendix N
News Articles on Municipal Bankruptcies


N – 1

N – 2

N – 3

N – 4

N – 5
N – 6

N – 7

N – 8
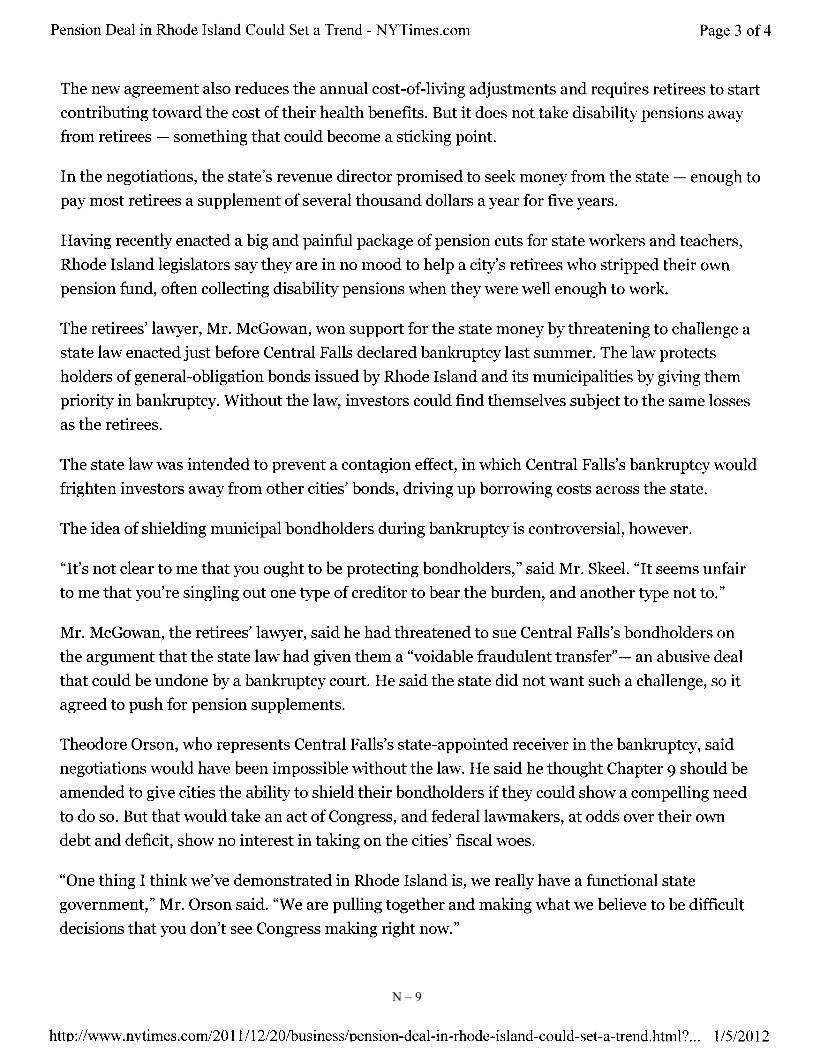
N – 9

N – 10

Appendix O
Cbiz Health Benefits Presentation – November 15, 2011


Health Benefits DiscussionNovember 15, 2011
Anne Arundel CountyBenefits Collaborative Study Group
O – 1

Current IssuesHealth Plan Costs
Employee cost sharing
OPEB and GASB 45Retiree Cost-Sharing Retiree Eligibility Provisions
Health Reform Legislation – PPACA
Health Benefits Strategy
O – 2
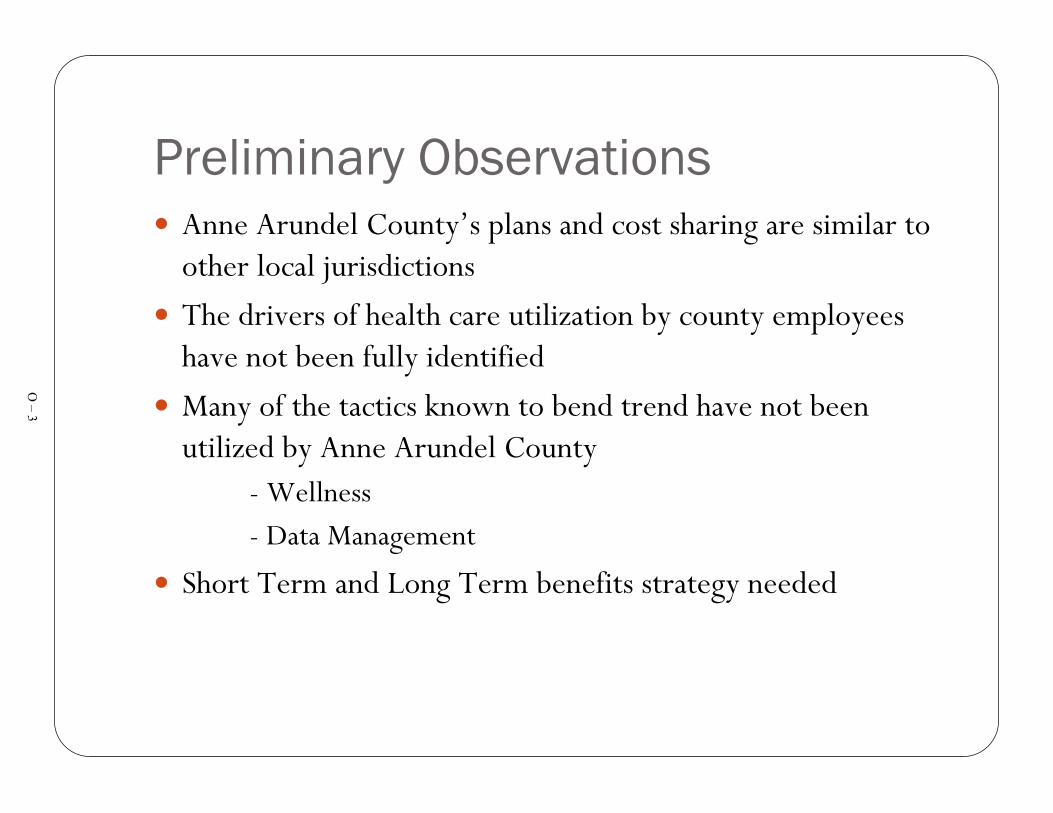
Preliminary ObservationsAnne Arundel County’s plans and cost sharing are similar to other local jurisdictions
The drivers of health care utilization by county employees have not been fully identified
Many of the tactics known to bend trend have not been utilized by Anne Arundel County
- Wellness- Data Management
Short Term and Long Term benefits strategy needed
O – 3

Plan Management Concepts
Category Initiatives Current Situation Recommended / Consideration Conduct RFP for Medical/Rx Plans Last marketed in 2008 and 2009 Market every five yearsVendor Consolidation Medical plans split between Cigna and
Carefirst. Carve out pharmacy - CaremarkExplore consolidation strategies and carve in pharmacy
Implement and manage performance guarantees
Performance Guarantees in place? Trend guarantee? DM ROI guarantee?
Monitor results against guaranteed metrics; continue to negotiate improved, meaningful metrics and guarantees
Vendor Audits Last medical claim audit? Rx audit? Dependent eligibility audit?
Audit plans every 3-5 years
Hold regular vendor meetings Meet with vendors 2 - 4 times / year Hold annual vendor summit regarding strategy, integration, and service expectations
Vendor Management
O – 4

Plan Management ConceptsCategory Initiatives Current Situation Recommended / Consideration
Actives: modify plan designs Three similar medical options today. Copays and deductibles are low.
Consider value based plan designs, over time drive participant behavior change
Pre 65 retirees PPO and HMO option Consider unique plan design for early retirees. Post 2014; consider health exchanges and county subsidy (define contribution). Special requirements needed for public safety employees.
Post 65 retirees Medicare wrap approach Review Medicare Advantage plans and Medicare connector model. Deep savings for plan sponsors and retirees over the past 5 years. EGWP or other unique pharmacy strategies for retirees should be considered to capture Part D donut hole subsidy to 2020. RFP needed. Review eligibility.
Pharmacy Low copays. Value based approach. Develop specialty strategy.
Benchmark against peer group Benchmarked plans to other local subdivisions; AA Co is currently near the mean in health benefits.
Maintain competitive position. Need a total compensation analysis.
Implement high performance network Not currently offered Evaluate carrier options. Cost and quality implications
Participate in PCMH or ACO program Not currently offered Evaluate carrier options. Potential to drive more primary care. Global payments with ACO (future).
Implement an onsite clinic Pharmacy in place. Not currently offered for medical or WC.
Evaluate cost / benefit of onsite clinic. Integration opportunities.
Plan Management
O – 5

Plan Management ConceptsCategory Initiatives Current Situation Recommendation/Consideration
Wellness & DM RFP Lunch and learns, on-site classes, screenings Expand wellness program. Add incentives, measure ROI
Conduct health risk appraisals Add to the wellness programConduct biometric exams Employees encouraged to obtain from PCP Consider onsite vendorOffer chronic condition coaching Available from carriersProvide employee wellness incentive Monitor participation and obtain feedbackProvide spousal wellness incentive Monitor participation and obtain feedbackImplement tobacco surcharge Monitor % of tobacco users each yearReward/penalize based on health outcome
Create long-term incentive strategy with the goal of rewarding health outcomes within 3-5 years
Obtain senior leaders and managers' supportDesignate department health champions Identify health plan budget Results tracked monthly Share results with stakeholdersEstablish employee cost share goals Under review Identify cost share from contributions as well as
plan designIdentify wellness incentive budget Track participation and cost of incentives in
2013Consider stop loss coverage No stop loss policy is in place As catastrophic claims increase, re-evaluate
need for this annually; review captive options
Health & Productivity
O – 6
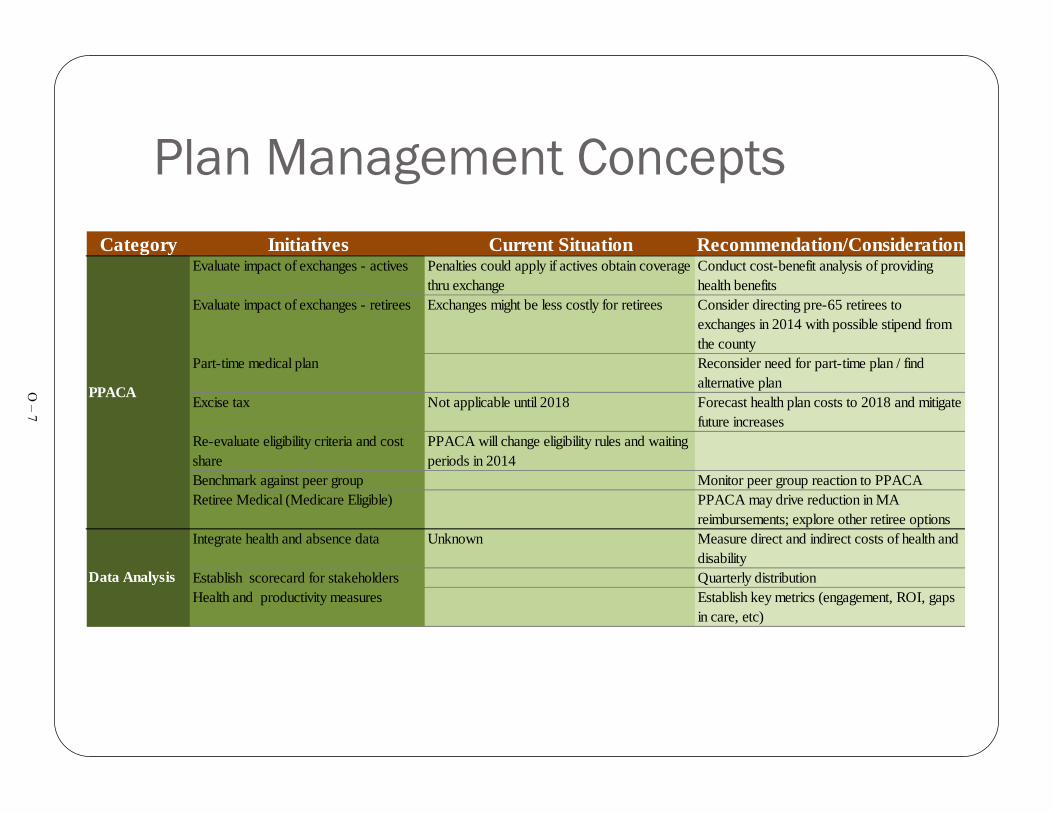
Plan Management ConceptsCategory Initiatives Current Situation Recommendation/Consideration
Evaluate impact of exchanges - actives Penalties could apply if actives obtain coverage thru exchange
Conduct cost-benefit analysis of providing health benefits
Evaluate impact of exchanges - retirees Exchanges might be less costly for retirees Consider directing pre-65 retirees to exchanges in 2014 with possible stipend from the county
Part-time medical plan Reconsider need for part-time plan / find alternative plan
Excise tax Not applicable until 2018 Forecast health plan costs to 2018 and mitigate future increases
Re-evaluate eligibility criteria and cost share
PPACA will change eligibility rules and waiting periods in 2014
Benchmark against peer group Monitor peer group reaction to PPACARetiree Medical (Medicare Eligible) PPACA may drive reduction in MA
reimbursements; explore other retiree optionsIntegrate health and absence data Unknown Measure direct and indirect costs of health and
disabilityEstablish scorecard for stakeholders Quarterly distributionHealth and productivity measures Establish key metrics (engagement, ROI, gaps
in care, etc)
Data Analysis
PPACAO – 7


Appendix P
Office of Budget Presentation – Retiree Heath Insurance County Comparisons – October 4, 2011


Retiree Health Insurance(OPEB – GASB 45)
County Comparisons
Office of the BudgetOctober 4, 2011
P – 1
Principles
• Reduce County cost; be fair to the Taxpayer• Be fair to each employee group; “share the pain”• Benefit should be in the “middle of the pack”
P – 2

Existing Benefit by Unit
YesYesYesSpousal
YesNoYesDependents
NoNoYesTerm Vesting
2.5% Per Year75% Max
10-14 25%15-19 50%20+ 75%
80%Employer Cost Share
10 Years10 YearsEmployees – 5 yearsPublic Safety – 20 years
Eligibility (vesting)
CollegeBOECounty
P – 3

County Benefit Comparisons
Yes/Yes
Hired Before Jan 1, 198780% for equal yrs worked, then 0%
Hired after December 31, 19865 yrs 50% 10 yrs 60% 15+ yrs 70%
By Retirement Group & AgeMontgomery
Yes/Yes
Retired before July 1, 1984 Maximum 80%Hired after 6/30/11 Graduated up to 25 yrs
Medicare Part D by 2020
Employees - 5 Yrs Hired after June 30, 2011 –
10 yrsMaryland
Yes/Yes
HM0 78% POS 73%Vision & Rx 88%
Employees – 10 yrsPublic safety – 5 yrs
P.G.
Harford
Baltimore
Howard
Anne Arundel
County
Yes/YesNon Medicare Dependents
62.5%-75%
Graduated Scale 25% to 92%
All Employees – 10 yrs
Yes/Yes
Hired Before July 201020 yrs - 85% 25 yrs – 90%
Hired after July 201012-14 yrs 75 15–19 yrs 80%20-24 yrs 85% 25+ yrs 90%
Employees – 20 yrsPublic Safety – 12 yrs
Yes (25%)/No (access)
15-19 years 50%20-24 years 75%25+ years 90%
All Employees – 15 yrs
Yes/Yes
80%Employees – 5 yrs
Public Safety – 20 yrs
Spousal/Dependent
EmployerCost Share
Eligibility
P – 4

Appendix Q
United Healthcare Presentation – Anne Arundel Retiree Options –
November 15, 2012

November 15, 2011
Anne Arundel Retiree Options
Q – 1
2Proprietary Information of UnitedHealth Group. Do not distribute or reproduce without express permission of UnitedHealth Group.
A National Medicare Leader
Confidential Property of UnitedHealth Group. Do not distribute or reproduce without express permission of UnitedHealth Group.
Largest provider of Medicare plans – provider of choice for more than 9 million Medicare eligible adults for over 25 years
Time-tested and proven expertise to work with employers to design, deliver and maintain a variety of cost-effective retiree solutions
A broad portfolio of all available market products that gives retirees meaningful choice in an overwhelming marketplace
2
Retiree health care specialists that focus exclusively on delivering the personalized service your retirees deserve
Q – 2

3Proprietary Information of UnitedHealth Group. Do not distribute or reproduce without express permission of UnitedHealth Group.
United Healthcare’sEmployer Group Retiree Experience
• More than 3,000 employers utilize our employer group retiree products and services• Over the past 10 years, UnitedHealthcare has transitioned hundreds of thousands of
Medicare retirees from employer group plans to individual health insurance plans through our retiree solutions
• We administer more than 100,000+ Retiree Reimbursement Accounts that deliver defined contribution employer financial support towards individual insurance plans
Q – 3

4
Strategic ConsiderationsCurrent Plan DesignsReform ImpactPlan Options
Q – 4

5Proprietary Information of UnitedHealth Group. Do not distribute or reproduce without express permission of UnitedHealth Group.
Anne Arundel County Objectives
Key Objectives for Retiree benefits plan
• Reduce Anne Arundel’s overall retiree plan costs
• Offer choice and flexibility to retirees with multiple plan options available
• Minimize disruption to retirees: make transition as simple as possible
• Provide ongoing support to retirees through outstanding customer service pre and post transition
• Shift benefits questions and administration away from HR Dept.
Q – 5

6Proprietary Information of UnitedHealth Group. Do not distribute or reproduce without express permission of UnitedHealth Group.
Current Post-65 Plan Offerings
Medical: Cigna Medicare Supplement Plan
Annual deductible: Not ApplicableCoinsurance: 80%/20%Out of pocket max: $2,000 per indv; $4,000 per familyLifetime max: $1,000,000
Prescription Drug:CVS Caremark$ 5 Generic$15 Preferred$25 Non Preferred
Average Monthly Premium For Anne Arundel Retirees: $630.69
Medicare Coordination
RDS
Average age of your retirees is 77
Q – 6

7Proprietary Information of UnitedHealth Group. Do not distribute or reproduce without express permission of UnitedHealth Group.
• 50% brand name coverage gap discount program (2011)*
• Closing of the coverage gap for generics and brand name drugs (2011-2020)
• Payments are taxable income beginning in 2013
• Future expected payments have never been allowable as an offset to GASB 45 liabilities
Part D PlansRetiree Drug Subsidy (RDS)
Compared with typical RDS eligible plans:•Group PDPs (EGWP) = same level of benefits at a lower net cost•Individual PDPs = slightly less rich benefits at a much lower cost
Which is the best solution for you and your retirees?
PPACA: A Game-Changer for RDS vs. Part D
*Discount dollars are applied toward True-Out-of-Pocket annual limit further reducing retiree’s costs
Q – 7

8Proprietary Information of UnitedHealth Group. Do not distribute or reproduce without express permission of UnitedHealth Group.
Phased elimination of the Part D Coverage Gap
Brand-name drugs Generic drugs
Beginning in 2011, Pharmaceutical manufacturers will discount the price of brand-name drugs by 50% for non-LICS members in the coverage gap. Member coinsurance for brand-name drugs shown above is net of this discount.
Between now and 2020, the Coverage Gap closes, eliminating any need for Employer sponsored supplemental benefits
Q – 8

9Proprietary Information of UnitedHealth Group. Do not distribute or reproduce without express permission of UnitedHealth Group.
Individual and group Part D plans deserve consideration by employers
Note1: 50% brand name coverage gap discount program (2011).
Note 2: Phased elimination of Part D coverage gap (full 2020 impact shown. Initial impact will be minimal)
$1,200
$1,100
$1,000
$900
$800
$700
$600
$500
$400
$300
$200
$100Retiree Drug
Subsidy
RDS
Individual PDP
Or EGWP + wrap
Part D
Note 1
Note 2
Third party$PMPY
A survey by a leading industry consulting firm predicts that 75% of large employers will move to Part D by 2013.
Q – 9

10Proprietary Information of UnitedHealth Group. Do not distribute or reproduce without express permission of UnitedHealth Group.10Proprietary Information of UnitedHealth Group. Do not distribute or reproduce without express permission of UnitedHealth Group.
Who is UnitedHealthcare Medicare Pharmacy Solutions?
Benefit Compilation: 100% accuracyMember retention: > 96% retention rate^ Leading mail order: 97% satisfaction
Experienced TeamExtensive knowledge and leadership in Part D
Formulary ManagementOptions that cover up to 100% of Part D Eligible Drugs
Retiree SatisfactionAccess, communication, support
Operational and Member Excellence
Flexible Benefit DesignValue, innovation, choice
Empl
oyer
Val
ue
UnitedHealthcare service data, Dec 2009. ^AARP Preferred Plan 2008-2010
The largest Part D plan, with experience successfully managing and communicating pharmacy benefits to the Medicare population
We serve over 6.8 Million Part D members (the largest market share by far, including retirees of over 600 employers) and have developed systems and processes leading to:
• Better experience and support for a retiree population
• Greater value for clients based on breadth and scale of industry partnerships
• Improved communication due to the use of plain language material
Our mail order pharmacy ranked highest in customer satisfaction and cost competitiveness factors in J.D.
Power and Associates’ 2010 National Pharmacy StudySM
Q – 10

11Proprietary Information of UnitedHealth Group. Do not distribute or reproduce without express permission of UnitedHealth Group.
EGWP Part D Options – Leveraging 50% Discounts
This example assumes that the claim occurs in the Part D Coverage Gap, on a brand-name retail drug that costs $200 with a $15 Copayment
* in a retail setting, not via home delivery
Plan Pays Remainder
Of $185
Member Pays $15
Pharmapays $0
Current Plan EGWP Plan
Member pays $15
Pharmapays $100
Plan Pays Remainder
of $85
Employer realizes the $100 savings in this claim example, by leveraging the Pharma discounts, while the member continues with the same OOP expense!
Q – 11

12Proprietary Information of UnitedHealth Group. Do not distribute or reproduce without express permission of UnitedHealth Group.
2012 UnitedHealthcare IndividualMedicare Part D Product Portfolio Summary
$82.00 - $98.90
Tier 1: $0Tier 2: $7Tier 3: $105Tier 4: $213Tier 5: 33%
Tier 1: $0Tier 2: $8-12Tier 3: $90-120Tier 4: $252-270Tier 5: 33%
Copays for 90-day Preferred Mail Service supply
Greater of 5% of drug cost, or $2.60 for generics and $6.50 for brands.
Greater of 5% of drug cost, or $2.60 for generics and $6.50 for brands.
Phase IVCatastrophic Coverage(2012 TrOOP $4,700)
Retail (31 day)Tier 1 : $4 ; Tier 2: $7
Mail (90 day)Tier 1 : $0 ; Tier 2: $7
50% discount on brands (non-LICS)86% generic coinsurance (non-LICS)
50% discount on brands (non-LICS)86% coinsurance on generics (non-LICS)
Phase IIICoverage Gap
Tier 1: $4Tier 2: $7Tier 3: $40Tier 4: $76Tier 5: 33%
Tier 1: $4-8Tier 2: $8-12Tier 3: $35-45Tier 4: $89-95Tier 5: 33%
Copays for a 30-day preferred retail supply
Phase IIInitial Coverage Limit(2012 $2,930)
$0$0DeductiblesPhase I (Deductible)
Formulary A12• 96%
Formulary C12• 74%
FormularyDrugs covered
$28.80 - $48.20 (excludes territories)2012 Monthly Premium
110,0004,570,000Membership (June 2011)
Gap CoverageOpen MarketHigh Utilizers
Open MarketT65Dual Eligible/LIS
Target Segment
Enhanced AlternativeBasic AlternativePlan Type
AARP MedicareRx EnhancedAARP MedicareRx Preferred /United MedicareRx
Q – 12

13Proprietary Information of UnitedHealth Group. Do not distribute or reproduce without express permission of UnitedHealth Group.
Medical Product Offering Considerations
2,8621,3311,1004313,117Employer 3
748350384141,093Employer 4
12,6026,0085,8217737,997Employer 2
959573333531,102Employer 1
Total UHC plans
Medicare SupplementPart DMedicare
AdvantageTotal # Eligible
RetireesGroup Name
When retirees were given a stipend to choose a UHC plan (MAPD or Med Supp) for 1/1/11, 87% of retirees chose Medicare Supplement and Part D; 13% chose
Medicare Advantage*
Because your population has an extremely high average age and the current plan structure is very similar to a Medicare Supplement plan, we believe that the vast majority
of your retirees would prefer and choose a Medicare Supplement and rich Part D plan over a Medicare Advantage plan
* Based on UHC Connector Model data
Q – 13

14Proprietary Information of UnitedHealth Group. Do not distribute or reproduce without express permission of UnitedHealth Group.
Group Portfolio Solution
• UHG offers the Group Portfolio Solution in response to market interest in offering an array of choice across group Medicare plans to a retiree
• “Group Portfolio” refers to offering a retiree a choice of different Group coverage offerings. Not to be confused with “Connector Model” which refers to services that are available to help an employer move its retirees from a Group Coverage environment to an Individual Coverage environment.
• Group Portfolio allows an employer to take the first step in allowing retiree choice without moving the retirees to the individual market.
• Multiple products with multiple plans can be offered to retirees using a defined dollar contribution approach and supported by either split billing or RRA. The unique financial and health needs of each member will determine the appropriate plan for your retiree and will be discovered by our retiree specialists after doing a full needs assessment.
Q – 14

15Proprietary Information of UnitedHealth Group. Do not distribute or reproduce without express permission of UnitedHealth Group.
XXXXXXXForeign Travel Emergency
XXXPart B Excess Charges
XXXXXXXXXXXPart B Preventive Care Coinsurance
50%X75%XCopay max: $20 OV$50 ER
XXXXXXMedical Expenses: Part B coinsurance
XXXPart B Deductible
50%X75%XXXXXXXXHospice
50%X75%XXXXXXSkilled Nursing Co-insurance
50%X75%XXXXXXXXBlood: First three pints of blood each
XXXXXXXXXXXPart A Coinsurance (plus coverage for 365 add’l days after Medicare benefits end)
50%X75%X50%XXXXXPart A Deductible
K(1)F ($2000
Deductible)
L(2)ANMGFDCBPLAN
Tier 3Tier 2Tier 1
[1] $4,640 maximum out of pocket, indexed to Medicare costs X = Covered up to plan limits[2] $2,320 maximum out of pocket, indexed to Medicare costs
2012 Group Portfolio Retiree Standard Senior Supplement Plans A-N
Q – 15

16Proprietary Information of UnitedHealth Group. Do not distribute or reproduce without express permission of UnitedHealth Group.
Advantages – Insured AARP Medicare Supplement Plans
• Freedom to choose doctors and hospitals anywhere in U.S.
• Choice of Plans – up to 7 Plans with varying coverage and price points
Choice
Access
Trust
Ease of Administration
Financial Security
• Guaranteed-issue, guaranteed-renewable
• No pre-existing condition exclusions – virtually no claim forms
• Medical underwriting (for rate class placement) is waived, most favorable rate class is granted for most subsidized groups
• Endorsed by AARP, a name trusted by seniors
• 3.0 million insured members protected by rate stabilization reserve• No minimum employer subsidy for endorsing or sponsoring employer
• Turn Key – all administrative services (enrollment, eligibility, and splitbilling and direct bill)
• Turn Key – all member calls, claims and correspondence
You may recognize our Medicare Supplement Insurance plans
in the market as:
Q – 16

17Proprietary Information of UnitedHealth Group. Do not distribute or reproduce without express permission of UnitedHealth Group.
Fully-Insured AARP Medicare Supplement Insurance Plans
Why AARP Medicare Supplement Insurance Plans?
• Competitive, cost-effective rates – Rates for AARP Medicare Supplement Plans have increased an average of only 4.6% each year nationally in the past ten years.**
• We also cover over 3.0 million members nationwide, so we can keep costs lower nationally.
• 96% member satisfaction rate with AARP Medicare Supplement Insurance Plans • 98% customer representative satisfaction rate with most problems resolved on the first call
Annual Medicare Supplement Rate Change
0.0%
5.0%
10.0%
15.0%
20.0%
25.0%
30.0%
199119921993199419951996199719981999200020012002200320042005200620072008200920102011
Q – 17

18Proprietary Information of UnitedHealth Group. Do not distribute or reproduce without express permission of UnitedHealth Group.
AARP Medicare Supplement Plans
9.2%1.2%1.8%75.2%7.4%2.7%2.5%Membership - Percentage of Total Enrolled$134$117$80$197$196$165$125Average Monthly Premiums**
75%50%Skilled Nursing Facility Care CoinsurancePreventive Care Coinsurance
75%50%Hospice Care Coinsurance or CopaymentForeign Travel Emergency
75%50%Blood – First 3 PintsPart B Excess Charges*Part B Deductible
$20 / $5075%50%Part B Coinsurance or Copayment
75%50%Part A DeductiblePart A Coinsurance and Hospital Benefits
NL [2]K [1]FCBAPlan
Fully insured individual Medicare supplement insurance; Group Administered= Benefits covered up to Plan limits
*If a provider does not accept Medicare assignment they may charge up to 115% of Medicare allowable charges.
**The above monthly premium amounts are the 2011 national weighted averages. Actual premium rates vary by state, plan, discount availability, age, area, and underwriting application. Average rates are net of discounts. Not available on a group basis to pre-65 disableds. Excludes Medicare Select and High Deductible
Plans.
[1] $4,640 maximum out of pocket, indexed to Medicare costs [2] $2,320 maximum out of pocket, indexed to Medicare costs
Q – 18

19Proprietary Information of UnitedHealth Group. Do not distribute or reproduce without express permission of UnitedHealth Group.
Illustrative Rates
Proposed BenefitsAARP Plan F $216.76AARP Plan L $137.28AARP Plan N $151.85
AARP Preferred $ 37.92AARP Enhanced $ 89.31
Combining the two richest plans (F and Enhanced, individual Part D) will cost approximately $306.07
Q – 19

20Proprietary Information of UnitedHealth Group. Do not distribute or reproduce without express permission of UnitedHealth Group.
AARP Medicare supplement insurance plans
No networks, no referralsYour retirees’ coverage goes with them anywhere in the United States. Includesaccess to specialists. Convenient for travelers
Coverage anywhere in the United StatesRetirees who live part time in different states can see doctors for their medical needs, not just for emergency care like other Medicare plans
Flexibility Retirees can change plans with just a phone call* No medical underwriting
What makes AARP Medicare supplement plans stand out?*• 96% member satisfaction• 98% customer representative satisfaction rate, with most problems resolved on
the first call• 9 out of 10 members would recommend the plan
*http://www.uhcmedsupstats.com or call to request a copy of the full report.*change is made the 1st of the month, following the member’s request. Members can change plans up to 12 times a year
Q – 20
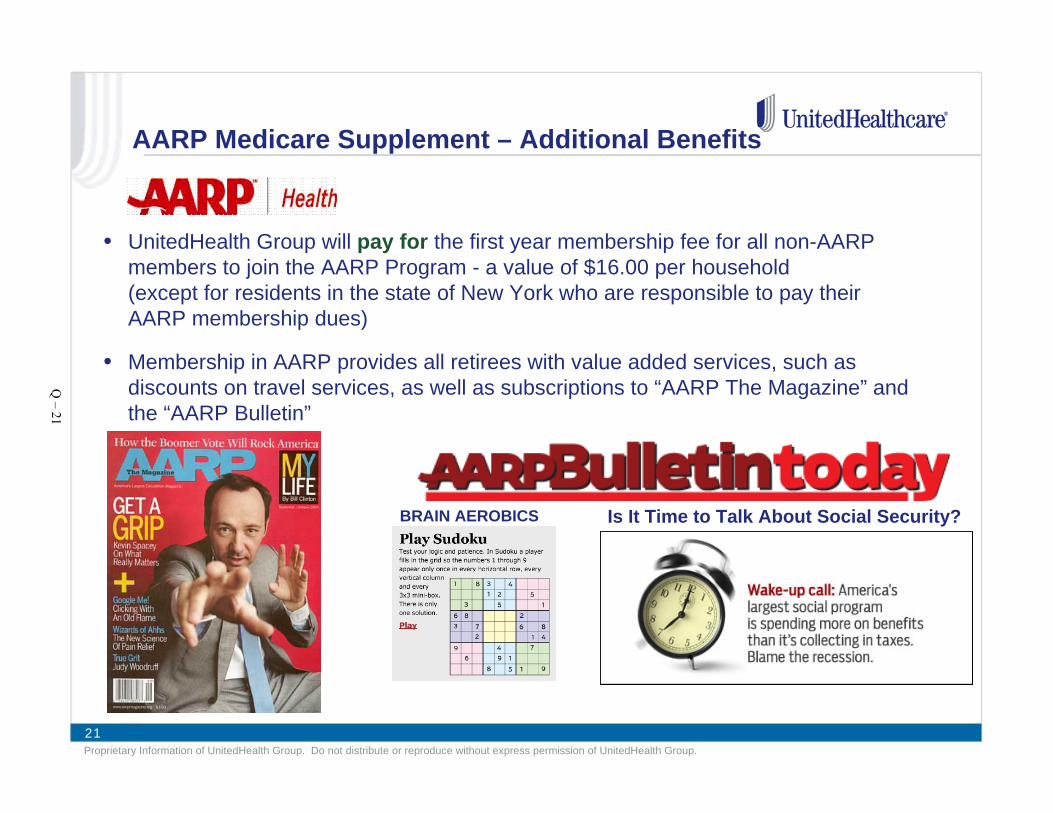
21Proprietary Information of UnitedHealth Group. Do not distribute or reproduce without express permission of UnitedHealth Group.
AARP Medicare Supplement – Additional Benefits
• UnitedHealth Group will pay for the first year membership fee for all non-AARP members to join the AARP Program - a value of $16.00 per household (except for residents in the state of New York who are responsible to pay their AARP membership dues)
• Membership in AARP provides all retirees with value added services, such as discounts on travel services, as well as subscriptions to “AARP The Magazine” and the “AARP Bulletin”
Is It Time to Talk About Social Security?BRAIN AEROBICS
Q – 21
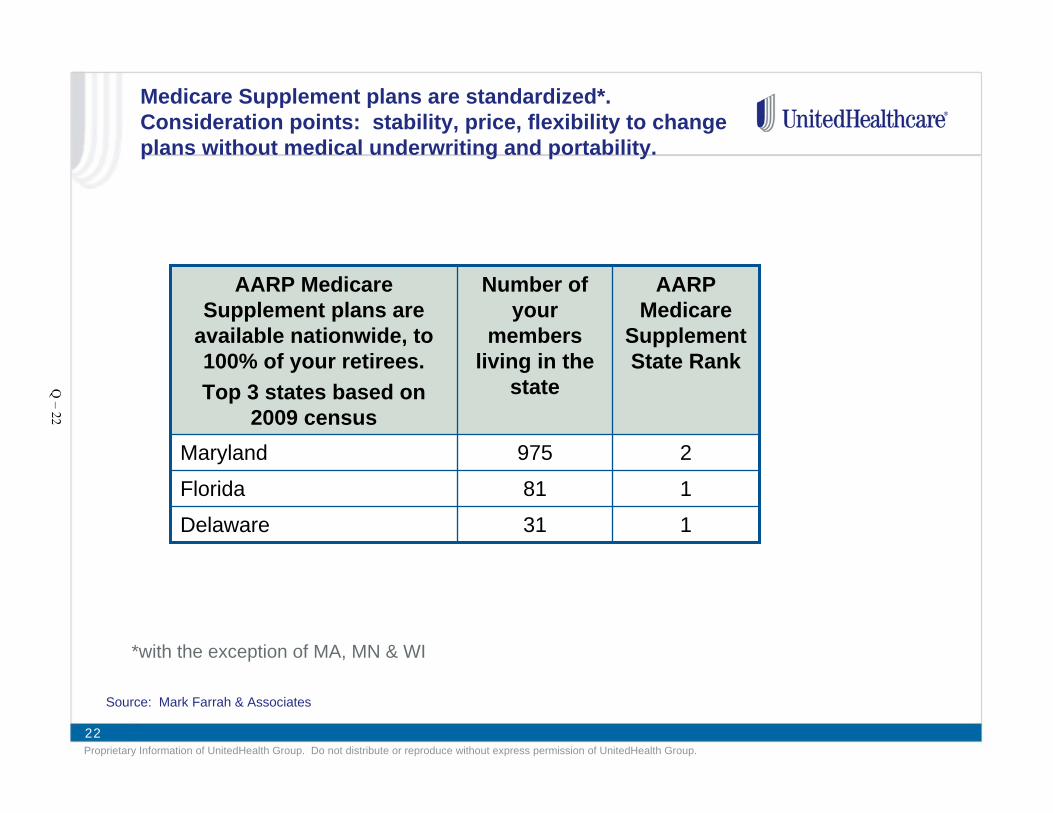
22Proprietary Information of UnitedHealth Group. Do not distribute or reproduce without express permission of UnitedHealth Group.
Medicare Supplement plans are standardized*. Consideration points: stability, price, flexibility to change plans without medical underwriting and portability.
131Delaware
181Florida
2975Maryland
AARP Medicare
Supplement State Rank
Number of your
members living in the
state
AARP Medicare Supplement plans are
available nationwide, to 100% of your retirees. Top 3 states based on
2009 census
Source: Mark Farrah & Associates
*with the exception of MA, MN & WI
Q – 22
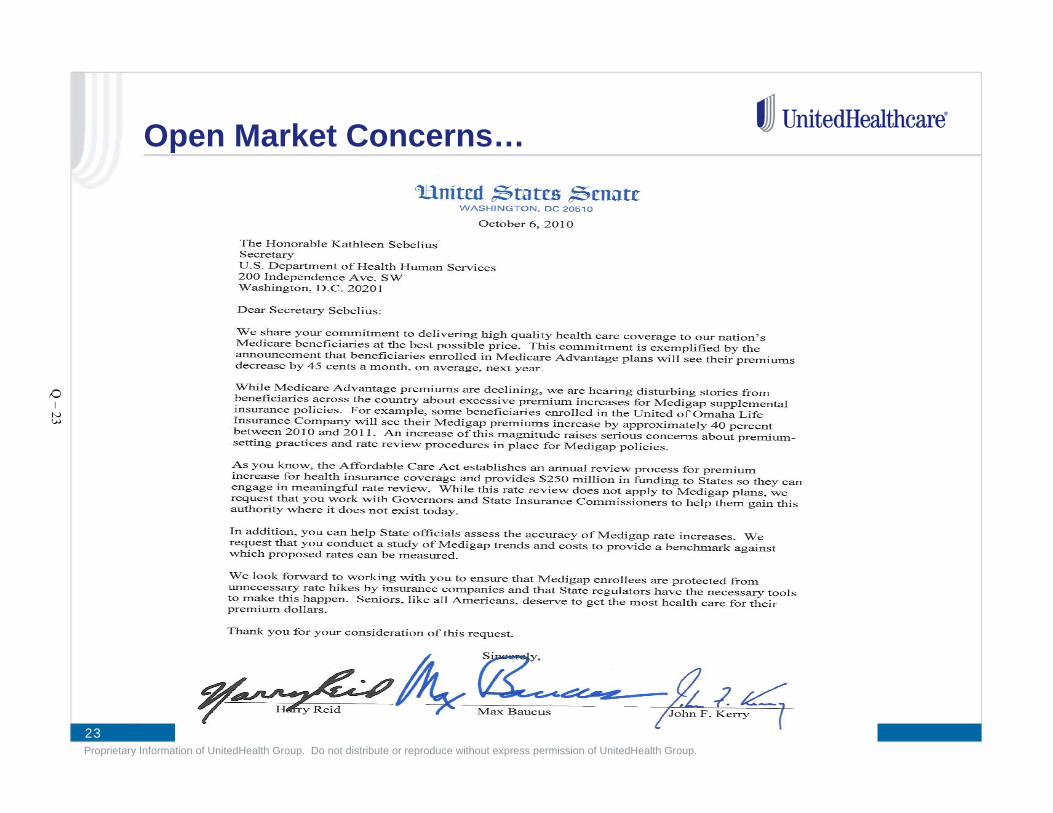
23Proprietary Information of UnitedHealth Group. Do not distribute or reproduce without express permission of UnitedHealth Group.
Open Market Concerns…
Q – 23
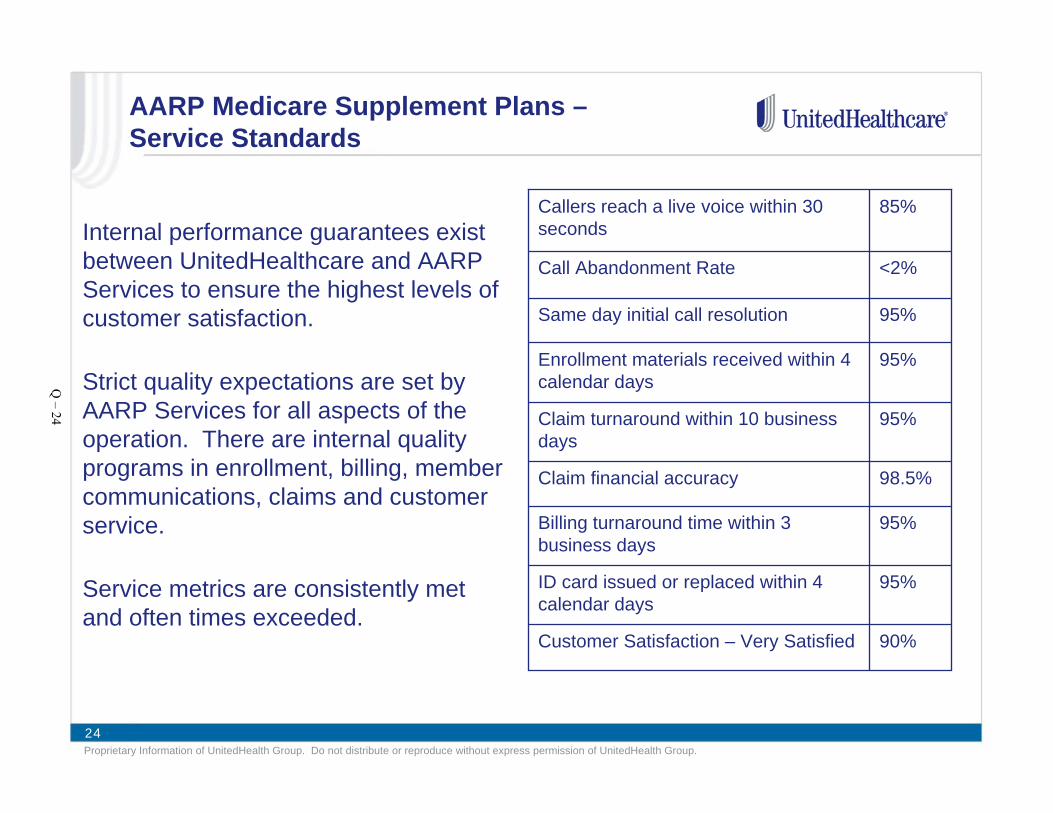
24Proprietary Information of UnitedHealth Group. Do not distribute or reproduce without express permission of UnitedHealth Group.
AARP Medicare Supplement Plans –Service Standards
Internal performance guarantees exist between UnitedHealthcare and AARP Services to ensure the highest levels of customer satisfaction.
Strict quality expectations are set by AARP Services for all aspects of the operation. There are internal quality programs in enrollment, billing, member communications, claims and customer service.
Service metrics are consistently met and often times exceeded.
95%Same day initial call resolution
85%Callers reach a live voice within 30 seconds
<2%Call Abandonment Rate
90%Customer Satisfaction – Very Satisfied
95%ID card issued or replaced within 4 calendar days
95%Billing turnaround time within 3 business days
98.5%Claim financial accuracy
95%Claim turnaround within 10 business days
95%Enrollment materials received within 4 calendar daysQ
– 24

25Proprietary Information of UnitedHealth Group. Do not distribute or reproduce without express permission of UnitedHealth Group.
AARP Medicare Supplement – Enrollment
• Toll-free customer service call centers for help with applications
• Paper applications are mailed to processing center and outbound contacts are made for missing information.
• 97.8% of members receive their enrollment materials in 4 calendar days
• Web access through www.aarphealthcare.com for enrollment and general education
• 100% of members receive their ID cards and welcome packages in 4 calendar days
• 97.4% of members receive replacement cards within 4 calendar days
Customized enrollment kits are developed from the employer roster and mailed to each retiree and spouse
Q – 25
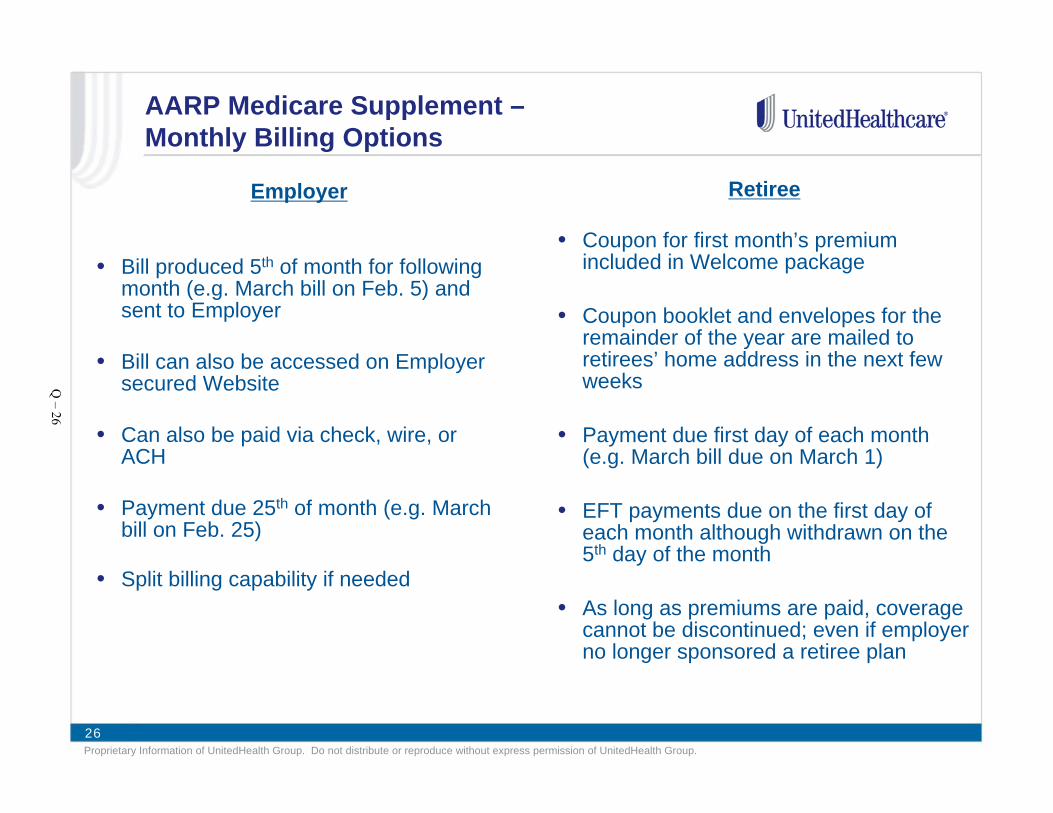
26Proprietary Information of UnitedHealth Group. Do not distribute or reproduce without express permission of UnitedHealth Group.
AARP Medicare Supplement –Monthly Billing Options
Employer
• Bill produced 5th of month for following month (e.g. March bill on Feb. 5) and sent to Employer
• Bill can also be accessed on Employer secured Website
• Can also be paid via check, wire, or ACH
• Payment due 25th of month (e.g. March bill on Feb. 25)
• Split billing capability if needed
Retiree
• Coupon for first month’s premium included in Welcome package
• Coupon booklet and envelopes for the remainder of the year are mailed to retirees’ home address in the next few weeks
• Payment due first day of each month (e.g. March bill due on March 1)
• EFT payments due on the first day of each month although withdrawn on the 5th day of the month
• As long as premiums are paid, coverage cannot be discontinued; even if employer no longer sponsored a retiree plan
Q – 26

27Proprietary Information of UnitedHealth Group. Do not distribute or reproduce without express permission of UnitedHealth Group.
Anne Arundel Considerations
• Design and plan flexibility to offer group or individual options
• National market leader, as well as your top 3 states
• Lowest cost Medicare Supplement provider in the majority of the U.S.
• Offers a 10-year proven record of rate stability
• Demonstrates 96% member satisfaction with the plans
• Allows retirees to change plans as their needs change with no medical questions or pre-existing conditions
• Minimizes disruption to all retirees
• Offers retirees meaningful choice of up to 7 Medicare Supp. options
Q – 27
28Proprietary Information of UnitedHealth Group. Do not distribute or reproduce without express permission of UnitedHealth Group.
Thank You
Questions?
Q – 28

Appendix R
Milliman White Paper – Health Insurance Exchanges Explained


R – 1

R – 2

R – 3

R – 4

R – 5

R – 6

R – 7

R – 8

Appendix S
Extend Health Presentation – Take Control of Retiree Heath Care Costs!
January 11, 2012


Take Control of Retiree Health Care Costs!
Richard K. Wheeler, SVP Extend Health, Inc.
Judy Locatis, Benefits Manager, Whirlpool Corporation
1/11/2012
Do not copy or distribute without the express written consent of Extend Health, Inc.
S – 1

Agenda
Employer Challenges with Retiree Health Benefits
Medicare Market Dynamics
Why Medicare works in an Exchange Model
Extend Health Overview
Whirlpool Corporation – Case Study
2
Do not copy or distribute without the express written consent of Extend Health, Inc.
S – 2

The Challenge: Sustainable Retiree Health
Care Benefits
S – 3
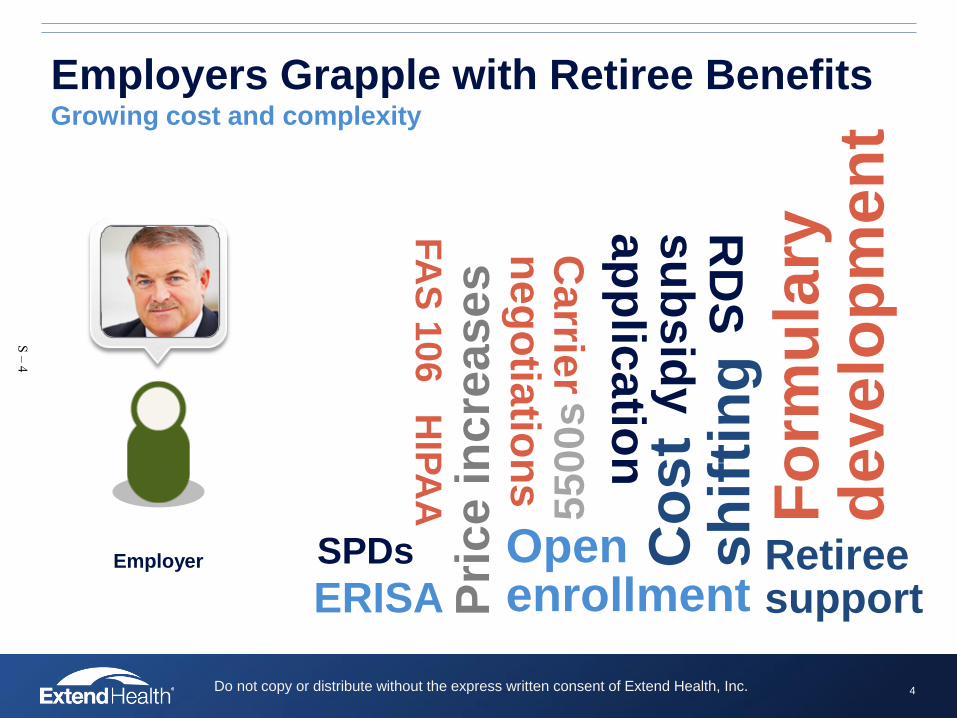
Employers Grapple with Retiree Benefits Growing cost and complexity
Employer
ERISA
Open enrollment
Retiree support
SPDs FA
S 1
06
HIP
AA
Ca
rrier
ne
go
tiatio
ns
RD
S
su
bs
idy
ap
plic
atio
n
5500s
Pri
ce
in
cre
as
es
Co
st
sh
ifti
ng
Fo
rmu
lary
d
eve
lop
me
nt
4 Do not copy or distribute without the express written consent of Extend Health, Inc.
S – 4

Health Care Costs Rising Faster than corporate profits - even in a down economy
Sources: Kaiser/HRET Survey of Employer Sponsored Health Benefits, 2011; U.S. Economic Watch, BBVA Research, August 2011
5
Do not copy or distribute without the express written consent of Extend Health, Inc.
S – 5

Retiree Health Benefit Trends 2010: Only 19% of employers offer medical coverage to Medicare-eligible
retirees, down from 40% in 1993*
Towers Watson survey: 60% of employers who currently offer retiree medical plans are rethinking their programs for 2012 or 2013
0%
5%
10%
15%
20%
25%
30%
35%
40%
45%
1993 1995 1997 1999 2001 2003 2005 2007 2009 2010
Employers Offering Medical Plans for Medicare-Eligible Retirees 1993 - 2010
Employers offering plans
*Source: Mercer National Survey of Employer-Sponsored Health Plans 2010
6
Do not copy or distribute without the express written consent of Extend Health, Inc.
S – 6

Defined Benefit vs. Defined Contribution
“We used to get pensions, now we get 401K plans and IRAs”
• Participation in defined contribution plans has increased from 36% of private sector employees in 1999 to 43% in 2008
• Participation in defined benefit plans hovered around 20% throughout the same period
Today: defined contribution for Medicare-eligible retirees
2014: Health care reform opens up defined contribution for active employees
7
Do not copy or distribute without the express written consent of Extend Health, Inc.
S – 7

Why Medicare is Ideal for an Exchange
1. Huge risk pools…..and growing
• Large individual market ~ 40mm retirees enrolled in Medicare
2. Guaranteed issue…..no adverse selection issue
• Everyone joins at 65: Healthy, episodic, chronic and catastrophic
3. Best-in-Market plans
• Retiree picks the best performing plan from best performing carrier
4. Carriers compete on price
• File rates every year
• Standardized plans
5. Federal subsidies
6. PPACA
• 2011+ Donut hole closing
• 2013 RDS subsidy tax
• 2014 Affordable Care for pre-65
8
Do not copy or distribute without the express written consent of Extend Health, Inc.
S – 8

Medicare Market Stability
Medicare Advantage enrollees in 2012 will pay an avg. monthly premium of $38.31, a 3.4% increase over 2011 avg. premium of $37.52*
Part D enrollees in 2012 will pay an avg. monthly premium of $39.62, a 3.7% increase over 2011 avg. premium of $38.22*
In 2012, nearly 88% of Medicare beneficiaries will have access to an MA plan with $0 premium*
MediGap plans continue to be affordable, plentiful and stable on a national scale – avg. monthly Plan F premium is $175
*Source: MEDICARE ADVANTAGE 2012 SPOTLIGHT: PLAN AVAILABILITY AND PREMIUMS, November 2011, The Henry J. Kaiser Family Foundation
9
Do not copy or distribute without the express written consent of Extend Health, Inc.
S – 9
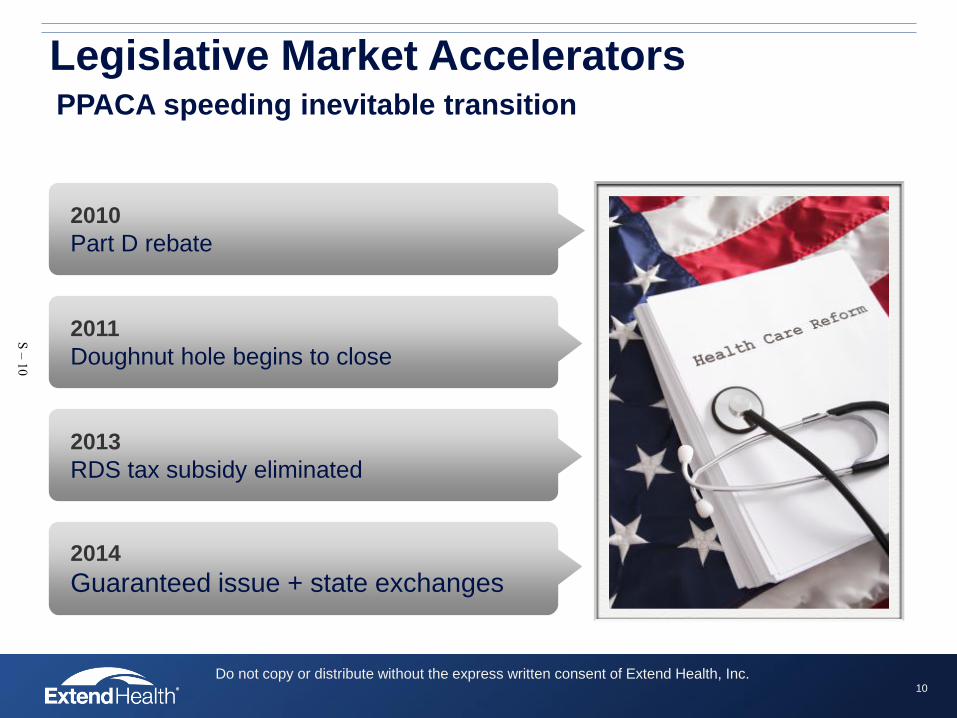
2011
Doughnut hole begins to close
Legislative Market Accelerators PPACA speeding inevitable transition
2010
Part D rebate
2013
RDS tax subsidy eliminated
2014
Guaranteed issue + state exchanges
10
Do not copy or distribute without the express written consent of Extend Health, Inc.
S – 10
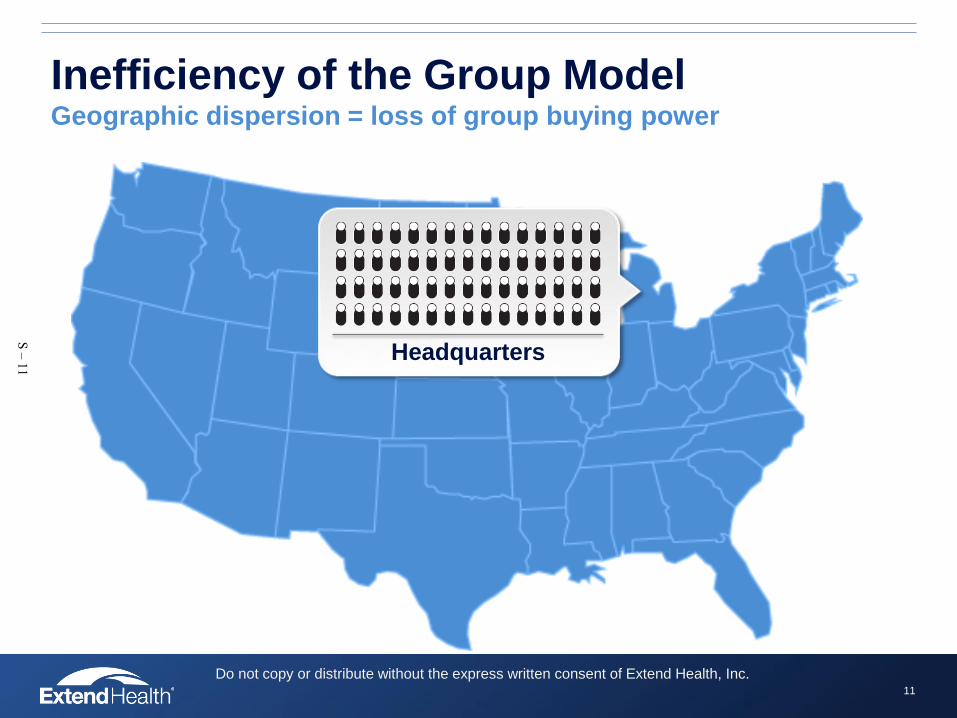
Inefficiency of the Group Model Geographic dispersion = loss of group buying power
Headquarters
11
Do not copy or distribute without the express written consent of Extend Health, Inc.
S – 11

Headquarters
Inefficiency of the Group Model Geographic dispersion = loss of group buying power
12
Do not copy or distribute without the express written consent of Extend Health, Inc.
S – 12

Paying more for less with no control or choice
Impact on Retirees
13
Do not copy or distribute without the express written consent of Extend Health, Inc.
S – 13

Extend Health runs the country’s largest
private Medicare exchange
14
More than 30 Fortune
500 companies
More then 75 health insurance carriers
More than 4,000 plans
offered
Hundreds of
thousands served!
Do not copy or distribute without the express written consent of Extend Health, Inc.
S – 14

Employers Deliver retirement benefits through a defined contribution solution
Employer
Provide subsidy
Engage retiree health exchange coordinator
The Solution
15
Do not copy or distribute without the express written consent of Extend Health, Inc.
S – 15

How Our Exchange Works Technology + human advocacy + carrier relationships
Retiree Benefit Advisor Extend Health
Exchange
Individual
Carriers
16
Do not copy or distribute without the express written consent of Extend Health, Inc.
S – 16

Benefits for Both Employers and Retirees
17
Employers Retirees
Substantial retiree benefits saving Increase personalization and choice
Make costs sustainable & predictable Provide equal or better benefits
Eliminate carrier negotiations Substantial retiree savings
Reduce administrative burden Enhance peace of mind
Do not copy or distribute without the express written consent of Extend Health, Inc.
S – 17

Market-Leading Private Sector Clients Fortune 1000, including 31 Fortune 500 companies
18
Do not copy or distribute without the express written consent of Extend Health, Inc.
S – 18

Labor and Public Sector Experience
19
Do not copy or distribute without the express written consent of Extend Health, Inc.
S – 19

Introducing: Judy Locatis, Benefits Manager,
Whirlpool Corporation
20
Do not copy or distribute without the express written consent of Extend Health, Inc.
S – 20

About Whirlpool Corporation
World’s top home appliance maker with more than $18
billion in annual sales
Celebrating 100 years
11/11/11!
Whirlpool is the world’s #1 global appliance brand
Ranked #143 on the
Fortune 500 list
71,000 employees and 66 manufacturing and tech centers
around the globe
Vision:
Every Home…Everywhere…with Pride, Passion and Performance
21
Do not copy or distribute without the express written consent of Extend Health, Inc.
S – 21

Whirlpool Corporation Retirees
24,000 retirees across the U.S.
20,000 are enrolled in benefits
Our retirees:
• Pre and post Medicare
• Hourly and salaried
• Union and non-union
• Many retirees are associated with legacy organizations acquired by Whirlpool Corporation
22
Do not copy or distribute without the express written consent of Extend Health, Inc.
S – 22
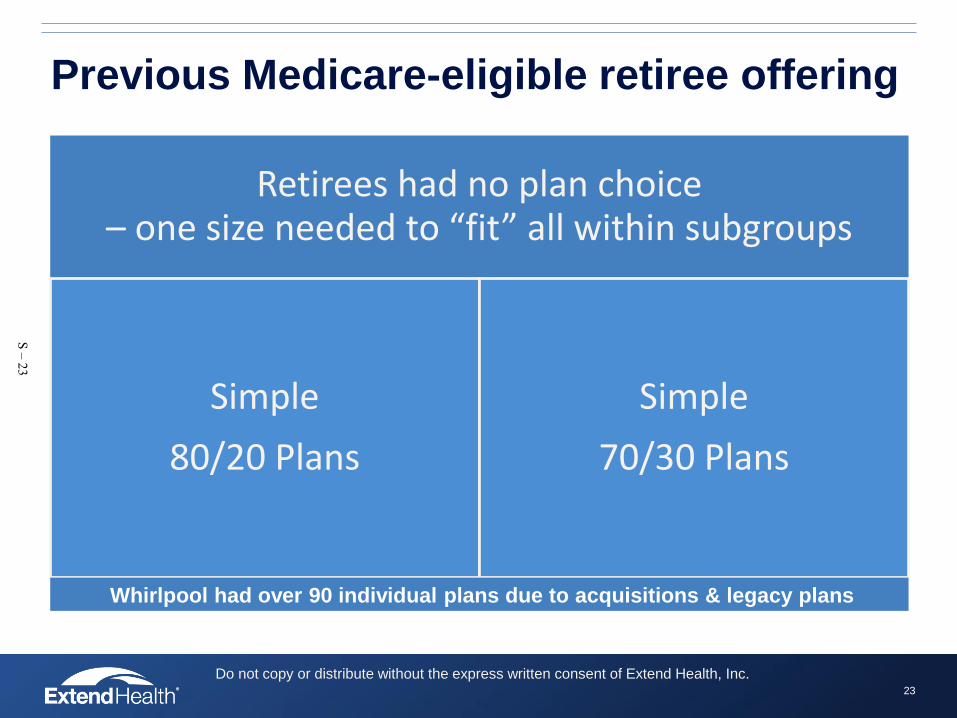
Previous Medicare-eligible retiree offering
Retirees had no plan choice – one size needed to “fit” all within subgroups
Simple
80/20 Plans
Simple
70/30 Plans
23
Whirlpool had over 90 individual plans due to acquisitions & legacy plans
Do not copy or distribute without the express written consent of Extend Health, Inc.
S – 23

Need for predictability and limit Whirlpool Corporation’s exposure trend
To reduce administrative costs and burden
Desire to provide retirees with plan choice
Wanted to provide a sustainable, cost effective, retiree friendly solution
What drove the change
24
Do not copy or distribute without the express written consent of Extend Health, Inc.
S – 24

Desired Outcomes
Provide competitive
benefits
Offer flexibility
and choice to retirees
Manage benefit costs
Comply with laws and
regulations
Reduced FAS 106 (OPEB)
liabilities and RDS subsidy
25
Do not copy or distribute without the express written consent of Extend Health, Inc.
S – 25

Approval & buy-in process
Anticipated and managed internal and external pushback; built anticipated pushback into the communication plan
Towers Watson provided actuarial modeling
Laid foundation to obtain leadership buy-in
RFP process – toll gates with leadership
26
Do not copy or distribute without the express written consent of Extend Health, Inc.
S – 26
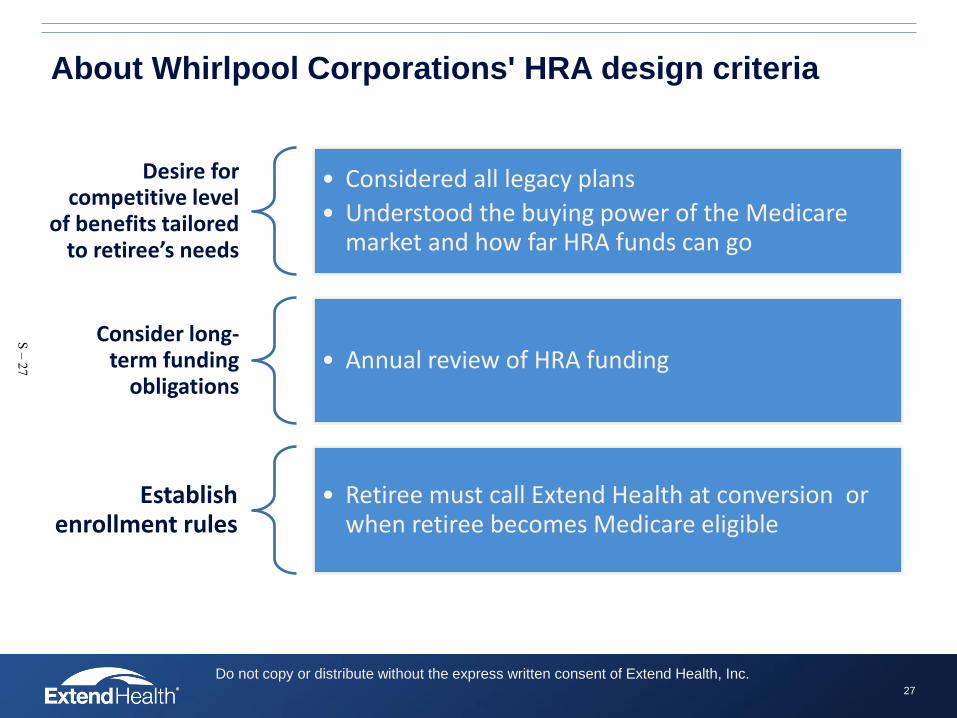
About Whirlpool Corporations' HRA design criteria
Desire for competitive level
of benefits tailored to retiree’s needs
• Considered all legacy plans
• Understood the buying power of the Medicare market and how far HRA funds can go
Consider long-term funding
obligations • Annual review of HRA funding
Establish enrollment rules
• Retiree must call Extend Health at conversion or when retiree becomes Medicare eligible
27
Do not copy or distribute without the express written consent of Extend Health, Inc.
S – 27

How Whirlpool Corporation's HRA works
Most reimbursements occur automatically – via electronic feeds from the carrier, to Extend Health, to HSB
Subsidy provided each year, however, Whirlpool reserves the right to change or terminate at anytime
Use funds in HRA to reimburse qualified healthcare expenses
Subsidy of $1,020 to each retiree and eligible spouse
Allocated monthly ($85) Each member is given an individual account
28
S – 28
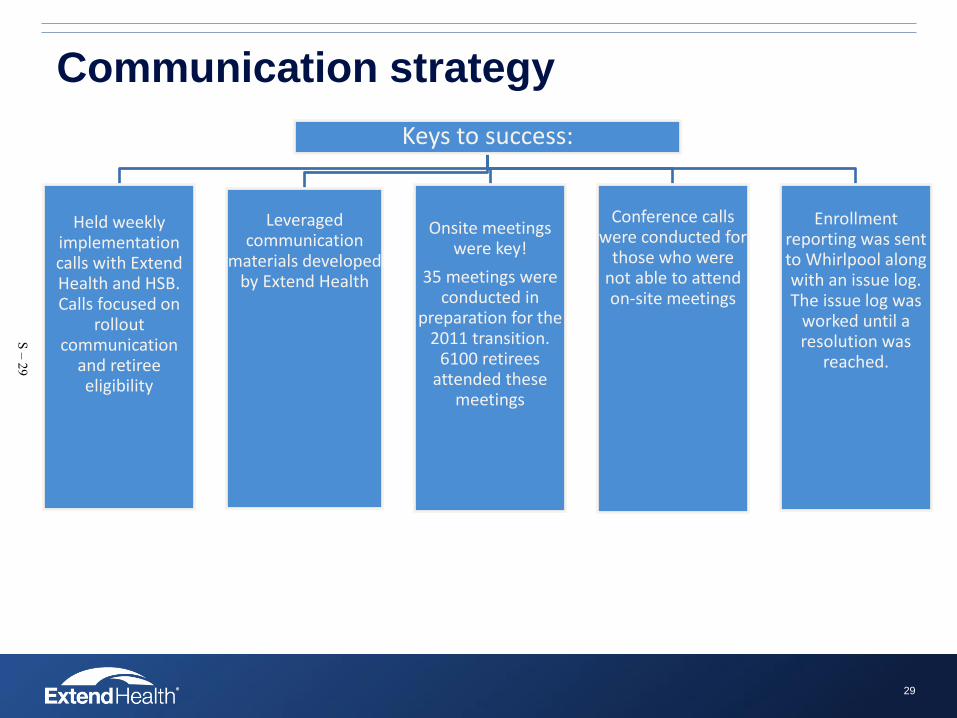
Communication strategy
Keys to success:
Held weekly implementation calls with Extend Health and HSB. Calls focused on
rollout communication
and retiree eligibility
Leveraged communication
materials developed by Extend Health
Onsite meetings were key!
35 meetings were conducted in
preparation for the 2011 transition.
6100 retirees attended these
meetings
Conference calls were conducted for
those who were not able to attend on-site meetings
Enrollment reporting was sent to Whirlpool along with an issue log. The issue log was
worked until a resolution was
reached.
29
S – 29

Results: No retiree left behind
70% of those eligible
enrolled in 401 plans sold by 48 carriers
77% enrolled in Medigap
plans & 23% enrolled in Medicare
Advantage plans
Annual FAS 106 and 112
liabilities were significantly
reduced in the past 5 years
Members are happy with having an affordable
choice
30
Do not copy or distribute without the express written consent of Extend Health, Inc.
S – 30

Lessons learned
What worked: What we’d change:
• Our communication plan strategy. We communicated early and often!
• Live meetings were well received! • Retirees loved the personal attention
they received from Extend Health! They were able to call as often as they wanted, for as long as they wanted. They could even have neighbors, relatives, etc. call with them so that there was another person listening to the conversation!
• Phased approach of eligibility
• Whirlpool and Extend Health met to conduct a post audit after year 1 (2009). - Added appointment setting
- Were better prepared for the influx of calls
• Better understanding of auto reimbursement process on the front end
31
Do not copy or distribute without the express written consent of Extend Health, Inc.
S – 31

Advice to other companies:
It takes work and open communication to make your transition a success
Initial messaging from Whirlpool was critical; build time in the process to set the stage
Help retirees understand that this is not a take away, but rather an opportunity to get a plan that is right for their needs and budget
Once members use Extend Health’s services, they are satisfied
Extend Health provides the experts; follow their lead!
32
Do not copy or distribute without the express written consent of Extend Health, Inc.
S – 32

For more information Visit: extendhealthnow.com
Email: [email protected] or [email protected]
Call: 1-888-232-3034
33
Do not copy or distribute without the express written consent of Extend Health, Inc.
S – 33

© 2010 Extend Health, Inc. All Rights Reserved.
34
S – 34

Appendix T
Anne Arundel County Wellness Presentation


T – 1

Mission Statement
• Anne Arundel County Government cares about the health and wellness of County employees.
• The Wellness Program will provide information and inspiration to encourage each employee to lead healthier lifestyles.
T – 2

Participants• Anne Arundel County Government• Anne Arundel County Public Schools• Anne Arundel County Library• Anne Arundel Community College• Aetna• CareFirst BC/BS • CIGNA • Health Department• Anne Arundel Medical Center
T – 3

Our First Year 2009-2010Wellness ConsortiumLogoMission StatementWellness SurveyFive Year PlanWellness FairSunscreen MailingNutrition ClassesOpen Enrollment
T – 4

Our Second Year 2011
• Negotiated Money From the Vendors• Member of the Mid-Atlantic Wellness Council• Walking Program • My Plate• Biometric Screening• Yoga• Holiday Survival
T – 5

Open Enrollment• Education, Education, Education• What’s New• Reaching Out, Presentations at sites• Flu Shots• Guide Book Photos
*ChallengeLimited ReachRetireesCommunication/VisibilityContracts
*SuccessMore participation, more educations because we had none!Flu Shots keeping our employees healthier, staying at work?More employees reading the bookFeedback
T – 6

Appendix U
Extend Health Article – How Long Does A Retiree Transition Take:
Implementation Milestones January 2012


U – 1

U – 2

Appendix V
Minutes of Committee Meetings


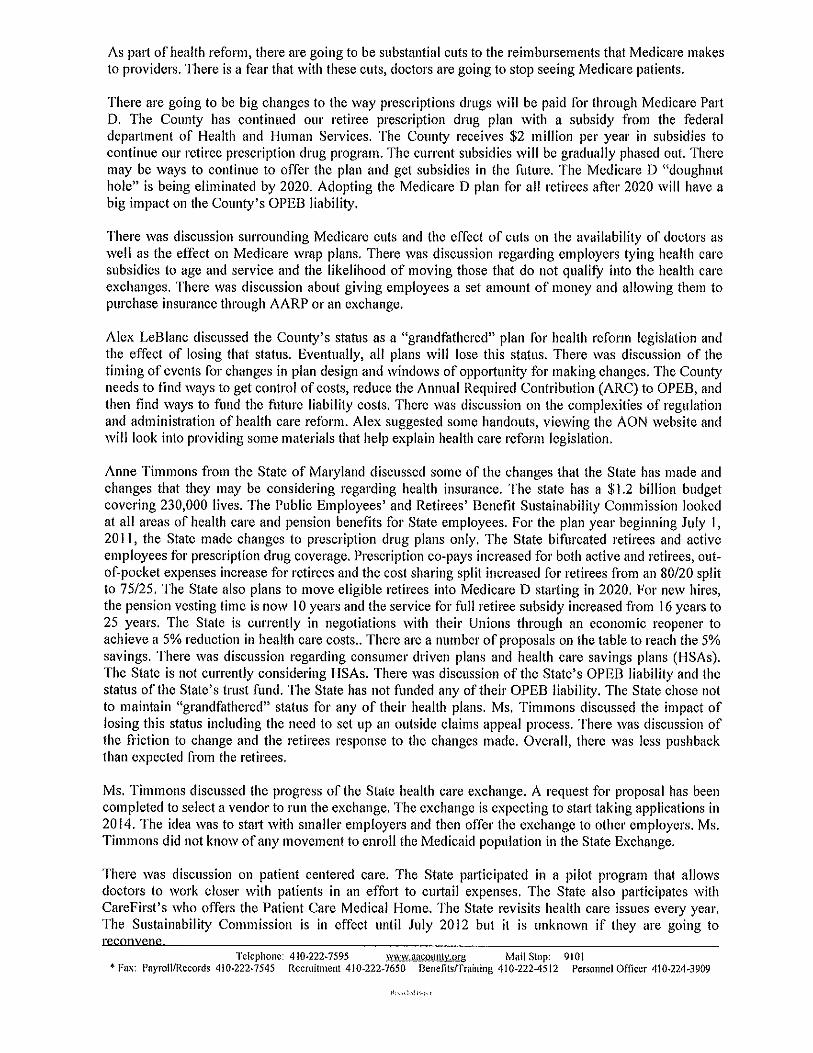


Appendix W
O’Brien Atkinson, IV Letter to Mark Atkisson – August 9, 2006


Anne Arundel County Labor Coalition 1311 General’s Highway Crownsville, MD 21032
August 9, 2006
Mark Atkisson, Personnel Officer Anne Arundel County Maryland Post Office Box 6675 Annapolis, MD 21401
RE: 2007 Health Insurance Program
Dear Mr. Atkisson,
The Anne Arundel County Labor Coalition would like to thank the Office of Personnel for hosting the ongoing series of Health Insurance Committee meetings concerning the future direction of the Anne Arundel County Government’s health insurance program.
As you are aware, Labor has historically been a responsive partner to the County Government in helping to control the cost increase of health care. For example, the introduction of the Triple Choice health plan and mandatory mail order for prescription drugs have helped to limit cost increases for health care over the last three years. During the same time period, increases to the employee share of premiums for the Triple Choice health plan have risen from 3% to 20% of total premium for some employees. In total, we estimate that the County has saved almost $3 million dollars from increases to the employees’ share of health care premiums for the entire program over the last three years.
At this point in time, it is the Labor Coalition’s position that there should be no changes to the current employee cost sharing (percentage splits) for health insurance premiums and that no changes to the benefit plan designs be made for the plan year beginning 1/1/2007.
The ongoing Health Insurance Committee meetings have brought to the surface questions concerning the overall management of the health insurance program. It is the Labor Coalition’s belief that more attention needs to be focused on vendor management to ensure that the program is operating in a highly efficient and cost effective manner before any further changes are implemented.
A few examples of our concerns surrounding the health insurance program are as follows:
• The fact that the County’s health insurance benefits program has not undertaken a formal
RFP (excluding Piggybacking) evaluation since 1994 is troubling to us. A well conducted RFP process would reveal the most capable and cost effective vendors for the County to partner with in accordance with the Five Principles surrounding the health insurance program.
• Further investigation into and a more thorough accounting of the potential savings to be
gained by combining the respective County Government and Board of Education health insurance benefit programs should be pursued.
W – 1

• The elimination of the CareFirst MPOS provider network in favor of the CareFirst BlueChoice provider network may be premature without a compete study of this proposed change. We are still awaiting the results of a disruption analysis comparing the two networks. In addition, we question the cost savings cited by CareFirst for this proposed change and recommend that the County get assurances of these savings from CareFirst in the form of a guarantee.
• We are intrigued by the potential benefits of consumerism based plan designs in health care.
However, such a change in course from the benefit plan designs offered today would obviously require a significant investment in communication and education that could not possibly be completed between now and the Open Enrollment period. Additionally, any consideration of consumerism based plan designs should include a review of the marketplace to identify best in class vendors.
• FutureHealth’s potential for effectively managing those with chronic diseases needs to be
more fully supported by the County. Greater incentives and more effective communication of this program is sorely needed to improve upon the poor participation rate today in this program.
• Caremark’s running of the pharmacy benefit plan has been hampered by poor customer
service, especially surrounding the mail service program, and nebulous claims of cost savings. Their current contract with the County expires and the end of 2007 and we recommend that pharmacy management be put out for competitive bidding, including consideration of a fully transparent contract.
• We just recently began receiving reporting data for the health care program from the County.
A process for us to receive monthly enrollment and claims data by health plan on an ongoing basis still needs to be put into place. The receipt of this data is critical for us to conduct a comprehensive analytical study of the health care program.
With precious little time between now and the scheduled Open Enrollment, we do not see how any new plans could be fully evaluated and implemented for a 1/1/2007 start date.
We look forward to continuing our efforts with the County in working towards the goal of the high quality, cost effective health insurance benefits program.
Sincerely,
O’Brien Atkinson, Chairman Anne Arundel County Labor Coalition
cc: John P. O’Connor, Assistant Personnel Officer Anne Arundel County Council
W – 2

Appendix X
O’Brien Atkinson, IV Letter to Andrea Fulton – February 21, 2007


Anne Arundel County Labor Coalition 1311 General’s Highway Crownsville, MD 21032
February 21, 2007
Ms. Andrea Fulton, Personnel Officer Anne Arundel County Maryland Post Office Box 6675 Annapolis, MD 21401
RE: 2007 Health Insurance Program
Dear Ms. Fulton,
I am writing you this correspondence on behalf of the Anne Arundel County Labor Coalition, which represents each of the eleven bargaining groups that are currently involved in contract negotiations with the County. It is imperative that we have a meeting as soon as possible to address a very serious concern that will in all likelihood result in stalled negotiations with all represented employee groups.
As you may know, early last year, the Office of Personnel under Mark Atkisson called for a committee on Health Insurance Benefits to identify potential cost saving ideas including alternative healthcare plans. Mr. Atkisson encouraged the committee to research and consult on best practices. Knowing very little about the healthcare industry or practices of the Office of Personnel with regard to healthcare, we formed a Labor Coalition outside of this committee consisting of the leadership of the bargaining units that the County deals with. We retained a professional healthcare consulting firm (CBIZ) to assist us and ultimately assist the County in reaching its goal of more affordable healthcare.
The attached correspondence was presented to the Office of Personnel regarding our position following numerous meetings with our prospective groups. This was rapidly becoming a collaborative effort to reduce the County's exposure to further healthcare costs and reduce the effect that these costs were having on County employees.
It was our understanding that we had come to agreement on these issues. Shifting cost shares once again is not the solution to our healthcare crisis. In spite of our agreement, your representatives are introducing further cost share-shifting proposals to our individual groups in negotiations and we have to, at very least, meet to clarify our relationship with regard to healthcare concerns.
Please call me at your earliest convenience to set up a meeting.
Sincerely, O'Brien Atkinson, IV Chairman, AACo Labor Coalition
X – 1

Related Documents