Report of Profiles of Slums/Underserved Areas of 08 Largest Cities of Pakistan Punjab (Lahore, Rawalpindi, Multan, Gujranwala, Faisalabad) Khyber Pakhtunkhwa (Peshawar) Balochistan (Quetta) Federal Capital (Islamabad) July 2020

Welcome message from author
This document is posted to help you gain knowledge. Please leave a comment to let me know what you think about it! Share it to your friends and learn new things together.
Transcript

Report of Profiles of Slums/Underserved Areas of
08 Largest Cities of Pakistan
Punjab (Lahore, Rawalpindi, Multan, Gujranwala, Faisalabad)
Khyber Pakhtunkhwa (Peshawar)
Balochistan (Quetta)
Federal Capital (Islamabad)
July 2020

Acknowledgements
This study was conducted with the technical support and oversight from UNICEF Immunization team Pakistan, with financial support of Gavi- the vaccine alliance and executed by Civil Society Human and Institutional Development Programme (CHIP) under the leadership of Provincial and Federal EPI programs. The report in hand presents the results of ‘Profiling of Urban Slums/Underserved Areas’ held in 08 largest cities of Pakistan. Our sincere thanks to UNICEF for their technical support throughout the process to achieve the planned results. Our sincere thanks to UNICEF Provincial and Country office colleagues, CSOs and expanded partners for their technical support and facilitation to complete this assignment. Special acknowledgement is extended to Federal and Provincial EPI Programs, Directorate of Health Islamabad and District Department of Health in 10 largest cities of Pakistan who extended their leadership and fullest cooperation for the successful execution of the survey. Specific acknowledgement is also extended to all the respondents for participating in this study and adding their valuable input to this discourse. It would not have been possible to present such in-depth, relevant and reliable information without their cooperation.

Table of Contents
Executive Summarys ................................................................................................................................... 1
Chapter 1: Introduction ....................................................................................................................... 3 1.1 Global Context ............................................................................................................................. 3 1.2 National Context .......................................................................................................................... 4 1.3 Provincial Context ........................................................................................................................ 5 1.4 Objectives .................................................................................................................................. 10 1.5 Rationale .................................................................................................................................... 10
Chapter 2: Methodology .................................................................................................................... 13
2 Methodology ...................................................................................................................................... 13 2.1 Study Design .............................................................................................................................. 13 2.2 Study Sites ................................................................................................................................. 13 2.3 Study Duration ........................................................................................................................... 13 2.4 Study Respondents .................................................................................................................... 14 2.5 Sampling Procedures and Sample Size .................................................................................... 14 2.6 Key Variables ............................................................................................................................. 15 2.7 Data Collection Instruments ....................................................................................................... 15 2.8 Operational Definitions ............................................................................................................... 15 2.9 Data Analysis Techniques ......................................................................................................... 17 2.10 Monitoring Mechanism ............................................................................................................... 17 2.11 Study Team & Training .............................................................................................................. 17
Chapter 3: Profile of Slums/Underserved Areas ............................................................................. 19 3.1 Slums/Underserved Areas ......................................................................................................... 19 3.2 Demography .............................................................................................................................. 21 3.3 Health Resources ...................................................................................................................... 22 3.4 Infrastructure .............................................................................................................................. 24 3.5 Social Welfare ............................................................................................................................ 27
Chapter 4: Health Resources in Union Councils ............................................................................ 31 4.1 Administrative Lay Out ............................................................................................................... 31 4.2 Health Facilities .......................................................................................................................... 32 4.3 EPI Facilities .............................................................................................................................. 33 4.4 Nutrition Services ....................................................................................................................... 34 4.5 Human Resources ..................................................................................................................... 34
Chapter 5: Status of EPI Facilities ................................................................................................... 37 5.1 Infrastructure .............................................................................................................................. 37 5.2 Systems ..................................................................................................................................... 40 5.3 Equipment and Supplies ............................................................................................................ 40 5.4 Waste Management ................................................................................................................... 41 5.5 Human Resource ....................................................................................................................... 42
Chapter 6: Situation in Super High Risk Union Councils .............................................................. 44 6.1 Health Resources of SHRUCs ................................................................................................... 44 6.2 Slums/Underserved Areas ......................................................................................................... 46 6.3 Status of Childhood Vaccination ................................................................................................ 47
Chapter 7: Conclusion and Recommendations .............................................................................. 50 7.1 Conclusion ................................................................................................................................. 50 7.2 Study Limitations ........................................................................................................................ 51 7.3 Recommendations ..................................................................................................................... 51
Annex 1: Questionnaire for Group Discussion in Slums/Underserved Areas............................... 54
Annex 2: Questionnaire for Compiling Health Resource in Union Councils ................................. 59
Annex 3: Questionnaire for EPI Facility Assessment ...................................................................... 61
Annex 4: Analysis of Profiling of Slums/Underserved Areas.......................................................... 63
Annex 5: Analysis of Health Resources of Union Councils ............................................................ 79
Annex 6: Analysis of Results of EPI Facility Assessment............................................................... 84

i
Abbreviations
AIDS Acquired Immune Deficiency Syndrome
BCG Bacille Calmette Guerin
CBVs Community Based Volunteers
CHIP Civil Society Human and Institutional Development Programme
CI Confidence Interval
cMYP Country Multiyear Plan
CNIC Computerized National Identity Card
CSO Civil Society Organisation
DDMA District Disaster Management Authority
DEFF. Design Effect Factor
DPT Diphtheria, Pertussis, and Tetanus
DSV District Supervisor Vaccination
EOC Emergency Operation Centre
EPI Expanded Programme on Immunization
ESS Effective Sample Size
FSD Faisalabad
GDP Gross Domestic Product
GJR Gujranwala
IBD Islamabad
ILR Ice-Lined Refrigerator
Lead Leadership for Environment and development
LHR Lahore
LHV Lady Health Visitor
LHW Lady Health Worker
MDGs Millennium Development Goals
MICS Multiple Indicators Cluster Survey
MMR Maternal Mortality Rates
MTN Multan
NDC Natural Disaster Consortium
OPV Oral Polio Vaccine
PCV Pneumococcal Conjugate Vaccine
PDHS Pakistan Demographics and Health Survey
PKR Pakistani Rupee
PSLM Pakistan Social Living Measurement Survey
PWR Peshawar
QTA Quetta
RWP Rawalpindi
SDGs Sustainable Development Goals
SHRUCs Super High Risk Union Councils
SoP Standard Operating Procedures
SPSS Statistical Package for the Social Sciences
STATA Statistics and Data
TB Tuberculosis
TDP Temporary Displaced People
UC Union Council
UN United Nations
UN HABITAT United Nations Human Settlements Programme
UNDP United Nations Development Programme
UNHCR United Nations High Commissioner for Refugees
UNICEF United Nations Children Fund
US $ United States Dollar
WASH WCBA
Water, Sanitation and Hygiene Women of Child Bearing Age
WHO World Health Organization
WMC Waste Management Company

1
Executive Summary 8 largest cities including 05 cities of Punjab, one city of Khyber Pakhtunkhwa (Peshawar), one city of Balochistan (Quetta) and Federal Capital Islamabad house 3114 slums/underserved areas. These slums/underserved areas are located in 76% of the total 626 UCs. Approximately 11.9 Million people reside in slums/underserved areas. 86% inhabitants of such areas are permanent settlers with the remaining 13% are temporarily displaced and 1% belong to other nationalities. 36% slums are found to be unregistered and hence lacked access to basic amenities such as adequate water supply and sanitation systems as well as fully functional health systems. The housing conditions in such vulnerable areas are very poor with the residents living in abysmal and dilapidated housing structures. Around 36% of the housing structures present in slums are Kacha or Kacha-Pacca (mixed). From the 99% houses having toilets, 51% have traditional/open pit toilets. On an average, 8 people use a single toilet facility. 28% slums/underserved areas do not have drains and where available 49% of them have choked/filthy drains. 75% slums/underserved areas are devoid of access to the government water supply system and hence acquire water through other sources. 25% slums/underserved areas do not have schools. Slums/underserved areas where schools are available, 44% of them are Madrassas and 74% of them are privately run set ups. 31% Union Councils (UCs) do not have Public health facility and 26% UCs do not have any EPI facility. 2% UCs do not have vaccination outreach services and 37% UCs do not have any kind of Nutrition services. 25% UCs are uncovered by Lady Health Workers (LHWs). When these variables are checked in slums/underserved areas, only 7% slums/underserved areas report access to Public/Private health and EPI facilities within 2 kilometers radius. 29% slums/underserved areas report non-provision of outreach vaccination in their respective areas. 58% slums/underserved areas are uncovered by LHWs. Two of the eight cities namely Peshawar (18) and Quetta (6) house 24 Super High Risk Union Councils (SHRUCs) for polio and routine immunization. 83% of them house 212 slums/underserved areas having 0.5 Million population residing in them. Over 90% slums/underserved areas located in SHRUCs report non-presence of health/EPI facilities. 56% of them are uncovered by LHWs. A holistic assessment of 422 EPI facilities reveal that 59% EPI facilities do not have Standard Operating Procedures (SoPs), 36% have inadequate seating capacity and 31% of such facilities do not have gender segregated waiting areas. 35% of them do not have drinking water available and 26% report unavailability of toilets. Toilets of 31% EPI facilities are gender mixed hence a cultural barrier for females for easy use. 18% report shortage of supplies, namely 2% report infrequent shortage of vaccines. 14% work for less than 6 hours a day. Findings of this report unmask a bitter truth: residents of slums/underserved areas are living in extremely vulnerable and despicable conditions. Their housing structures are dilapidated and weak and access to adequate water and sanitation facilities is meager at best. Adequate channels of waste management system are absent from such areas and low immunity levels among residents are common place with the probability of disease outbreaks being exceptionally high. Keeping in view these reprehensible conditions, it is of utmost importance that realistic micro planning of vaccinators, Community-Based Volunteers (CBVs) and LHWs is done so that adequate demand for health and EPI facilities can be generated. The holistic profiles of slums/underserved areas call for such a well-integrated delivery model so that the prevalent issues can be suitably addressed.
Box 1: Major Inequities
Health Facilities
93% slums/underserved areas have difficult access to health and EPI facilities.
58% slums/underserved areas are not covered by LHWs.
Infrastructure
59% houses of slums are Kacha (un-cemented) or Kacha-Pacca (mixed structures);
36% slums are not registered. WASH Facilities
75% slums/underserved areas do not have access to Government water supply system.
77% slums/underserved areas either do not have drains or have choked and filthy drains.
Education Facilities
25% slums/underserved areas do not have schools.
Social Welfare
51% slums/underserved areas do not have access to any kind of Public welfare schemes

2
Chapter 1 Introduction
Survival is More Important than Preventive Health Care
Bilo is Aged 13 months, is not yet aware about the conditions in which he is born and would be raised into. Bilo is a resident of Rimsha colony, a slum situated in H-9 sector, Islamabad. His father, Bagha, is a daily wage worker. Bilo has two other siblings, a brother and a sister. This family of five lives in a one room tented house where the toilet is not available. The family has high debt burden. Bilo’s mother is a 23 years old illiterate woman who is unaware about the working of Lady Health Workers in her area. She is not aware of routine immunization and does not believe in preventive healthcare.
As per Bilo’s mother! “when you do not have food, you do not worry about something as lavish as preventive healthcare”.
She quotes how she has only seen the children of her neighbors being suffering from temperature after they receive a vaccination. She comments that they have almost little to no resources to spend on healthcare in case Bilo falls sick due to a vaccination. Moreover, she highlights how taking her child to a health center, which is a few kilometers away, is an ordeal for her and family. It is due to the irrational fear of Bilo’s mother and the prevailing socio-economic conditions of the household, that Bilo has not yet received even one routine vaccination.

3
Chapter 1: Introduction 1.1 Global Context The World Population Growth index indicates that the current population of the world is 7.7 billion, with an annual growth rate of 1.08%1. The growth in world population has led to urbanization, where the people from rural areas are migrating towards urban areas for better economic opportunities. In 2014, over half of the population of the world (54%) was residing in the urban areas2. This proportion is expected to increase to 66% by 2050, adding an additional 2.5 billion dwellers to the urban areas, of whom around 90% will be in the urban areas of Africa and Asia3. In developing countries of these areas, the migration from rural to urban areas is mostly more-than-proportionate, leading to the development of unplanned settlements in and around cities, identified and known as “slums”. The United Nations Habitat defines “slums” as the informal settlements with high population density, poor living conditions and weak infrastructural provisions (United Nations (UN), 2016)4.
According to a study conducted on “Size distributions of slums across the globe”, around 900 million people reside in the slum areas worldwide, a number which is expected to double by 2030 (Friesen, Taubenbock & Wurm, 2019). These slums are mainly concentrated in the cities of the Global South; where the world’s largest slum regions include Khayeltisha Cape Town in South Africa; Kibera, Nairobi in Kenya; Dharavi, Mumbai in India; Orangi Town Karachi in Pakistan; Neza-Chalco-Itza and Mexico City in Mexico. As per the UN statistics of 2014, around one billion of slum dwellers are residents of the developing world (Young, 2015)5. Out of this, the percentage ratio of urban population as slum-dwellers has been lowest for Northern Africa (11.1%) and highest for Sub-Saharan Africa (55.2%), (Figure 1). South Asia stands at second highest with 30.7% of its population
living in slums as per the statistics of 2014, (UN, 2015)6. World Bank (2014) has further conducted a trend analysis on urban slum population for Brazil, China, India and Nigeria (Figure 2). The data indicates that in 1990 the percentage share of population living in slums was drastically higher for all the four countries when compared to the year 2014 (Ritchie & Roser, 2018)7. India decreased its slum population the most by 31% in the last 24 years. However, the number of slums present in India and other countries is still significant and their presence cannot be
ignored.
1 World Population Clock: 7.7 Billion People (2019) - Worldometers. (2019). Retrieved from https://www.worldometers.info/world-population/ 2 UN Habitat. World Cities Report 2016. Urbanization and Development: Emerging Futures. New York: Pub. United Nations; 2016. 3 United Nations. World Urbanization Prospects: 2014 Revision. New York: Pub. United Nations; 2014. 4 Habitat, United Nations. 2016. Housing & slum upgrading. Retrieved from http://unhabitat.org/urban-themes/housing-slum-upgrading/) 5 Young, T. (2015). 5 Largest Slums in the Pakistan [Blog]. The Borgen Project. Retrieved from https://borgenproject.org/5-largest-slums-world/ 6 United Nations. (2015). Report of the Secretary-General on the work of the Organization. Retrieved from http://mdgs.un.org/unsd/mdg/Resources/Static/Products/Progress2015/Statannex.pdf 7 Ritchie, H., & Roser, M. (2018). Urbanization. Retrieved 20 September 2019, from https://ourworldindata.org/urbanization#urban-slum-populations
11.120.5 24.7 25.2 27.4 30.7
55.2
NorthernAfrica
LatinAmerica &
theCaribbean
WesternAsia
EasternAsia
SouthernEast Asia
SouthernAsia
SubSaharan
Africa
Brazil, 37%
China, 44%
India, 55%
Nigeria, 77%
Brazil, 22%
China, 25% India, 24%
Nigeria, 50%
% of Slums Population 1990
Source: OWID based on World Bank, World Development Indicators –
Figure 1: Continent wise Slum Population in 2014
Figure 2: Slums Population in 1990 & 2014
4
The comparison of these countries with Pakistan reveals that, Pakistan lists much lower in the number of urban slum settlements. However, when compared on the parameter of population growth between 1990 and 2014, it has been discovered that Pakistan has shown an increase in population growth for slums from nearly 16.79 million in 1990 to around 32.34 million in 2014 (Our World in Data, 2014). The conditions of slums in Pakistan in terms of population growth, health and immunization and social problems have been further investigated from the secondary data sources hereafter. 1.2 National Context 1.2.1 Population Growth The current estimated population of Pakistan is 212 Million8, making it the 5th most populous country of the world. According to the UN Population estimations, the population of Pakistan will reach to 242 Million by 20259. According to the estimation of UN for 2014, the slum population was 32 Million in urban areas of Pakistan10. Currently, 36.9% of the total population of Pakistan makes up urban population, which is expected to increase to 50.2% by 205011. The urban population is growing at the rate of 3% annually (Shaikh & Nabi, 2017). It is expected that the cities of Pakistan will accommodate 250 million people by the year 203012. The rapid urbanization can be seen in the increase of population of 8 largest cities of Pakistan in which 12.9 Million population (census 1998) has increased to 24.3 Million (census 2017). Highest population increase is noticed in Lahore where population increased from 5 Million to 11 Million. Smallest cities like Quetta and Islamabad also shows double population growth. Considering the growth rate of urban population of present day, the slum population is likely to increase even further by 2030 in absence of proper urban planning1314. To improve the living conditions of these settlements and to meet the Sustainable Development Goals, an improvement in the health and socioeconomic conditions of the slum-dwellers is required. However, a better understanding of the individual slum environment and the factors contributing to poor health conditions is essential to be taken into account to maintain a balance between the demand and supply of health services for the slum-dwellers. The social inequities are also to be evaluated to target the areas of improvement for slum-dwellers. 1.2.2 Status of Health Studies on the levels of immunization coverage in Pakistan reveals that the coverage has remained lower15 for urban poor, including slum residents, when compared to rural poor16. Pakistan Demographic and Health Survey (PDHS) for 2018 indicates that the 66% of children age 12-23 months have received all basic vaccinations. The coverage data is bifurcated by
8 World Bank. (2019). Population Total. Retrieved from https://data.worldbank.org/indicator/SP.POP.TOTL?locations=PK 9 United Nations, Department of Economic and Social Affairs, Population Division (2019). World Population Prospects 2019, custom data acquired via website. 10 UNMDGs. (2019). Retrieved from mdgs.un.org 11 United Nations, Department of Economic and Social Affairs, Population Division (2018). World Urbanization Prospects: The 2018 Revision. 12 Shaikh, H., & Nabi, I. (2017). The six biggest challenges facing Pakistan’s urban future. Pakistan’s Growth Story. Retrieved from https://pakistangrowthstory.org/2017/01/10/6-challenges-facing-pakistans-urban-future/ 13 Ibid. 14 Buque, Mindra & Duncan, T. (2016). Immunization, urbanization and slums: A review of evidence. UNICEF. 15 Ibid 16 Gotlife.gavi.org
Table 1: Population in 8 Largest Cities City Census-2017 Census-1998
Lahore 11,126,285 5,143,495
Faisalabad 3,203,846 2,008,861
Rawalpindi 2,098,231 1,409,768
Gujranwala 2,027,001 1,132,509
Peshawar 1,970,042 982,816
Multan 1,871,843 1,197,384
Islamabad 1,014,825 529,180
Quetta 1,001,205 565,137
Total 24,313,278 12,969,150
130.87 122.04
21.8640.52
16.79
187.06
100.5
41.5838.91
32.34
China India Nigeria Brazil Pakistan
Population in Millions in 2014
Population in Millions in 1990
Figure 3: Comparison of Slum Population in 1990s & 2014

5
urban and rural areas, province-wise but it does not specifically highlight the disparities of the slum areas in these provinces. However, marginalization, both ethnic and economic, low awareness level including carelessness of caregivers and inaccessibility to the healthcare centers have been identified as the major reasons for low immunization coverage in the slums17. Some of the interventions like awareness programmes, community engagements, vaccination campaigns and medicine coupon incentives have yielded results in Pakistan to overcome health related issues of slums, (Crocker-Buque, Mindra, Duncan & Mounier-Jack, 2017). 1.3 Provincial Context 1.3.1 Population & Status of Health in Punjab According to Pakistan Economic Survey (2018-19), Punjab is the most populous province of Pakistan and accounts for 110 Million of population for the year 201718. The second largest city of Pakistan, and the capital of Punjab Lahore, has roughly 30% of the settlements as slums (Abubakar, 2016)19. The slums of Lahore are home to an estimated population of 1.7 million people (National Report of Pakistan for Habitat III, 2015). The proportion of slum population in Lahore has reached the upper limit threshold of the city’s total population. It has a population density of 400 persons/km (National Report of Pakistan for Habitat III, 2015). In case of the slums of Faisalabad, the number of slum-dwelling units ranges from 42 to 2,851 (Ahmed, Mustafa & Khan, 2015)20. Lahore has approximately 308 informal settlements or slums (National Report of Pakistan for Habitat III, 2015)21. Faisalabad ranks as the third most populous city of Pakistan and it is a home to 104 slums (Ahmed, Mustafa & Khan, 2015)22. A study conducted on 104 slums of Faisalabad indicates that 84% of the children are vaccinated and have received any dose of vaccine; whereas, 3.3% of the children are not vaccinated. On the other hand, 12% of the respondents are without any knowledge of vaccination22. Another study is conducted on the slums of Bahawalpur where out of the 306 children surveyed, only 26% have the vaccination cards. The highest coverage is for BCG vaccine. First dose against measles is received by as many as 84% of the children; whereas, second dose is received by only 42% of the children. 59% mothers of the children who have completed their vaccination schedule are educated over intermediate level23. 1.3.2 Population & Status of Health in Sindh Sindh is situated in the southeast of the country and is one of the four provinces of Pakistan. By area, it is the third largest province of the country and is second largest in terms of population. Sindh is the most urbanized province of Pakistan with around 52% population residing in the urban areas (Noh, 2018)24. According to 2017 Census of Pakistan, the population of the Sindh province is 47.89 million; whereas Karachi has a population of 14.9 million, which is projected to increase to 18.7 million by 2025 (Pakistan Bureau of Statistics, 2017)25. The population density for the city of Karachi is approximately 6,000 people per square kilometer. In the year 2016, UN ranked Karachi as the 12th top megacity by size in the world, the number which is expected to
17 Aleemi, A. R., Khaliqui, H., & Faisal, A. (2018). Challenges and patterns of seeking primary health care in slums of Karachi: a disaster lurking in urban shadows. Asia Pacific Journal of Public Health, 30(5), 479-490. 18 Pakistan Economic Survey 2018-19, Ministry of Finance, Government of Pakistan. Retrieved from: http://finance.gov.pk/survey/chapters_19/Economic_Survey_2018_19.pdf 19 Abubakar, M. (2016). Women and slums. Retrieved 21 September 2019, from http://www.lead.org.pk/lead/postDetail.aspx?postid=326 20 Ibid. 21 National Report of Pakistan for HABITAT III. (2015). Islamabad. 22 Ahmed, R., Mustafa, U., & Khan, A. (2015). Socio-economic Status of Transferred and Non-transferred Urban Slums: A Case Study from Faisalabad. The Pakistan Development Review, 54(4I-II), 947-962. doi: 10.30541/v54i4i-iipp.947-962 23 Badar, S., Qadri, S., (2016). Childhood Immunization in Slums of Bahawalpur City. Journal of University Medical and Dental College. 7 (2). 35-40. 24 Noh, J. (2018). Factors affecting complete and timely childhood immunization coverage in Sindh, Pakistan; A secondary analysis of cross-sectional survey data. PLOS. 25 Sparkman, G. (2018). Challenges of slum life in Orangi Town, Karachi, Pakistan. Sparkman Center for Global Health.

6
rise to 7th by 2030 (Sparkman, 2018)26. Hyderabad, on the other hand is the fourth-largest city in Pakistan with the population of 1.73 million. Hyderabad is the second most urbanized city of Sindh with around 80% of the people living in the cities27. Karachi and Hyderabad are key focus areas when it comes to unplanned urbanization and are the home to around 1,300 slums. About 70% of these slums are situated in 18 towns of Karachi, whereas, the remaining 25-30% slums are located in four towns of Hyderabad28. According to a detailed study conducted on “Challenges and patterns of seeking primary healthcare in slums of Karachi: A disaster lurking in urban shadows” it has been highlighted that there are more than 600 slums in Karachi. Karachi is also a home to the largest slum in Asia i.e. Orangi Town with the estimated population of 2.4 Million29. The MICS survey of 2014 for the Sindh province reveals that the vaccination coverage for Measles 1 in Karachi was 65.3%; whereas, it was 62.9% for Hyderabad. According to the study of Aleemi and Khalique (2018), the coverage rates are even lower for urban slums30. The study formulates that in the sample population of 400 people from 8 slums of Karachi, only 11.7% of the respondents reported the visits by Lady Health Workers (LHWs). The regular visits of LHWs in the slum communities is important because these health workers educate and promote healthy behavior and provide basic curative healthcare services. In the slum areas, where the level of education and awareness is already low, the absence of LHWs is an alarming sign, which demands immediate attention. The study further formulates that 75% of the sample population is not vaccinated for hepatitis and tetanus against 23% of the population which has received vaccination31. The reasons for no vaccination are reported to be inaccessibility, unawareness, cost and family belief system. The slums are prone to communicable diseases due to unhygienic living conditions and poor waste disposal system and therefore attention needs to be paid to improving coverage rates for routine immunization. According to the recent findings of Emergency Operation Centre (EOC) for Polio in Sindh, the vaccination coverage demands special attention in the province since 6 new cases of polio are reported in the province, out of which 3 have occurred in Karachi, whereas, two were present in Hyderabad32. Systematic approach to healthcare and vaccination coverage is required to solve the healthcare related problems of the province. 1.3.3 Population & Status of Health in Balochistan Quetta is the largest City and the Provincial Capital of Balochistan, Pakistan. The city shars its boundaries with Pishin district in the north, Ziarat in the East, Mastung in the South and Afghanistan in the West. The city is located near the Bolan Pass, which is among one of the major gateways from Central Asia to South Asia. The City is known as the “Fruit Garden of Pakistan” due to various fruit orchids in and around the city. As per the National Census of 2017, the population of Quetta City is One Million and the population of Quetta District is Two Million. Quetta is the most urbanized city of Balochistan and hosts 29% of all urban population of the province33. Though Balochistan is the largest province by area, the population of the province is the lowest at 7.7 million and is thinly dispersed around the province. The Quetta city accommodates multiple ethnic groups including Pashtuns, Baloch, Brahvi, Hazara and Punjabi and is enriched with cultural and language diversity. The multi-dimensional poverty at headcount for Quetta stands at 46% and the Average Intensity of Deprivation is 46%,
26 Sparkman, G. (2018). Challenges of slum life in Orangi Town, Karachi, Pakistan. Sparkman Center for Global Health. 27 Sparkman, G. (2018). Challenges of slum life in Orangi Town, Karachi, Pakistan. Sparkman Center for Global Health. 28 Khawar, H. (2019). A virulent strain. [online] DAWN.COM. Available at: https://www.dawn.com/news/1514595 [Accessed 15 Nov. 2019]. 29 Aleemi, A. and Khaliqui, H. (2019). Challenges and Patterns of Seeking Primary Health Care in Slums of Karachi: A Disaster Lurking in Urban Shadows. Asia Pacific Journal of Public Health, pp.1-12. 30 MICS, S. (2014). MICS Survey. [online] Mics-surveys-prod.s3.amazonaws.com. Available at: https://mics-surveys-prod.s3.amazonaws.com/MICS5/South%20Asia/Pakistan%20%28Sindh%29/2014/Final/Pakistan%20%28Sindh%29%202014%20MICS_English.pdf [Accessed 15 Nov. 2019]. 31 Aleemi, A. and Khaliqui, H. (2019). Challenges and Patterns of Seeking Primary Health Care in Slums of Karachi: A Disaster Lurking in Urban Shadows. Asia Pacific Journal of Public Health, pp.1-12. 32 Khuhro, N. (2019). Over 120,000 children in Sindh left unvaccinated per campaign: report - Daily Times. [online] Daily Times. Available at: https://dailytimes.com.pk/472464/over-120000-children-in-sindh-left-unvaccinated-per-campaign-report/ [Accessed 15 Nov. 2019]. 33 State of Pakistani Cities, 208

7
thus making poverty rate in Quetta the highest among all provincial capitals of Pakistan34. Furthermore, about 17% of the population is living below poverty line in this city35. The literacy rate stands at 66% in Quetta city, however, there is a noticeable difference between literacy rates, and female literacy stands at 83%36. Major challenges of Quetta city are exponential growth-rate, lack of resources and city planning for managing a large influx of economic migrants and those affected by natural disasters or conflict. Poor access to health and Expanded Programme on Immunization (EPI) services, safe water and almost non-existent drainage system also pose serious health risks as cited by different researchers. The housing structures accommodating over 800,000 residents of Quetta lack the facilities and infrastructure for adequate drainage and sanitation37. While the situation of disposal and drainage of wastewater in the city remains poor, drainage system in the slums is almost non-existent 38. The provision of safe water is available to only 39% of the households39. Water is found to be scarce due to which a majority of residents end up paying private vendors for their water-supply40. To assess the quality of consumable water, a study was conducted in 16 different locations of Quetta, which revealed high contamination in tap water owed to the seepage and leakage of the water supply and sewer lines41. Furthermore, fecal contamination of drinking water is known to cause 30% of all diseases42. There are 47 identified slum areas as per the records of the Katchi Abadi Directorate43, although the actual numbers are higher than this. These slums are mostly accompanied by temporary houses (mud houses) with substandard basic and health facilities44. The slum areas are highly populated with poor or no infrastructure45. The slum dwellers of Quetta lack accessibility to basic resources and are living far beyond the standards laid down by the Sustainable Development Goals (SDGs). Comprehensive Multi Year Plan (cMYP) Balochistan 2014-2018 depicts acute shortage of health personnel in Quetta46. To address the health needs, there are 07 health programmes that are running in Quetta city, namely TB (Tuberculosis) Control Programme, Malaria Control Programme, Hepatitis Prevention Control Programme, AIDS (Acquired Immune Deficiency) Control Programme, National Programme on Family Planning and Primary Healthcare and National, Maternal, Newborn & Child Healthcare Programme47. Among the most common diseases reported by the health facilities are Respiratory Tract Infections, Gastrointestinal, Urinary Tract Infection and Diarrhea/ Dysentery, whereas other communicable diseases include Malaria, Meningitis, Fever and Scabies48. In terms of immunization, the Pakistan Social Living Measurement Survey (PSLM) for the year 2014-2015 reveals 65% of children aged 12-23 months in Quetta (recorded both by record ad recall) have received all basic vaccination, with the low coverage rates of 52% in rural areas and comparatively high rates of 71% in urban areas. Although 94% of the children in Quetta have received at least one vaccination, there are marked differences in the immunization status of first and third doses of DPT, Polio and Hepatitis B. About 28.5% children of age 12-23 months have
34 http://www.pk.undp.org/content/dam/pakistan/docs/MPI/MPI%204pager.pdf 35 Geography of Poverty and Public Service Delivery in Pakistan. Research Brief April 2017, Pakistan Poverty Alleviation Fund 36 http://emis.gob.pk/Uploads/QUETTA%20DISTRICT%20EDUCATION%20PLAN%20FOR%202016-2017%20TO%202020-2021.pdf 37 Urbanization Challenges in Balochistan, 2015. Pakistan Urban Forum, The Urban Unit 38 http://www.balochistan.gov.pk/index.php?option=com_content&view=article&id=839&Itemid=1087 39 Pakistan Economist 40 State of Pakistani Cities, 2018 41 Khattak M I. (2011). Study of Common Inorganic Anions in Water Samples of Quetta City By Technique Of Ion Chromatography. Sci.Int. (Lahore).23(2):135–141. 42 Aziz J A. (2005). Management of source and drinking-water quality in Pakistan. Eastern Mediterranean Health Journal. 11(5-6):1087–98 43 Qutub, S.A.; Salam, N.; Shah, K. and Anjum D. (2008). Community-based sanitation for urban poor: the case of Quetta, Pakistan 44 Growth of slum areas on rise in Balochistan Pakistan Economist, Sep 11, 2017. 45 Huma Batool.; Mega cities And Climate Change Sustainable Cities in a Changing World. LEAD Pakistan. 46 Comprehensive multi-year plan 2014-2018. Islamabad, Expanded Programme on Immunization, Balochistan 47 http://www.ndma.gov.pk/Publications/Development%20Profile%20District%20Quetta.pd 48 http://www.ndma.gov.pk/Publications/Development%20Profile%20District%20Quetta.pd
8
received their first dose of BCG, while 54.2% and 13% have received doses of Polio and Hepatitis B vaccines respectively and 18% have received vaccination for measles. Balochistan Comprehensive Development Strategy (2013-2020) reveals that the health sector of the province has extremely underperformed in the last decade. The poor performance has been attributed to financial deficit of the province. The detailed evaluation of the health sector of the province indicates that the biggest challenge faced by the province is related to primary and preventive healthcare specifically in the context of mother and childcare. The study indicates that only 26% of the deliveries of the mothers in the province take place at designated health facilities, a figure 10% lower than the rest of the provinces. In the rural areas of Balochistan, over 80% deliveries by mothers take place at home and by untrained attendants increasing the risk of mother and child mortality. The sparsely populated and sparsely developed province contributes to the problems of access to health facilities. The conditions of prenatal and postnatal care delivery are also quite dismal for the province of Balochistan. Urban areas of Balochistan reveal only 55% cases of prenatal consultation, whereas, this figures drops further in the urban slums and for rural areas. The postnatal care reception is also poor for the province and only 31% of pregnant women in the province receive Tetanus Toxoid injections. Pertaining to these alarming statistics, the PDHS 2006-2007 reveals that the MMR (Mother Mortality Rate) was highest for Balochistan among four provinces at 785 maternal deaths per 100,000 births. According to the MICS report of 2010, the Infant Mortality Rate of Balochistan is also the highest among all the other provinces of the country. IMR is reported to be 89 per 1000 live births against the MDG targets of 52 per 1000 births. As per the PSLM results of 2010-2011 the overall immunization coverage rate for Balochistan is only 45% for the children under 5 years of age when compared to Punjab (86%), Khyber Pakhtunkhwa (77%) and Sindh (67%). When checked for BCG coverage of the province, the results reveal that the coverage for 12-23 months of children is only 35%, Polio 1 has been administered to 61% of the children, a figure that dipped to 46% for Polio 3 (MICS, 2010). Recently polio epidemic has reemerged in Pakistan. As per the report by Independent Monitoring Board of the Global Polio Eradication Initiative, for Balochistan, the majority of the cases for Balochistan occur in three major areas: Pishin, Killa Abdullah and Quetta. As for the status on child health, it is reported that for every 1,000 live births, 59 babies do not survive up to their first birthday and another 12 die before reaching the age of 5 years49. The prevalence of water-borne disease indicates 44% of the households are affected by Diarrhea, 25% by Gastrointestinal (GI), 21% by Cholera, 5% by Typhoid and 3% by other common diseases50. 1.3.4 Population & Status of Health in Khyber Pakhtunkhwa According to the 2017 Census of Pakistan, the population of Peshawar is 1.97 million distributed into four towns, which are further distributed into 79 Union Councils (UCs). With the highest annual growth rate of 4% in the province, the city has seen a rapid increase in population, with huge influx of Afghan refugees. According to estimates out of 80% of the Afghan refugees living in Khyber-Pakhtunkhwa, 60% resides in Peshawar valley (United Nations High Commissioner for Refugees (UNHCR) 2012). Displaced populations having low financial resources tend to settle in and around the city in squatter settlements (Katchi Abadis). Besides Afghan refugees being the main reason of slum formation in Peshawar, the floods of 2005 made 3.5 million homeless, causing destruction of more than 600,152 houses (UN-Habitat-III, 2015)51.
49 http://www.ndma.gov.pk/Publications/Development%20Profile%20District%20Quetta.pdf 50 Butt, M., & Khair, S. M. (2016). Cost of illness of water-borne diseases: a case study of Quetta. Journal of applied and emerging sciences, 5(2), pp133-143 51 National Report of Pakistan for HABITAT III. (2015). Islamabad

9
A study of UN-Habitat52, identified 18 informal settlements in Peshawar city. It constitutes about 15% of the total population of Peshawar with the estimated population of 250,00053, although the actual number of people living in slums are higher than this54. As some of the studies report that slums and squatter settlements almost constitute 50-60% of the city.55 Unhygienic living condition, open defecation and lack of access to clean drinking water are a root cause of diarrheal diseases and together contribute to about 1.5 billion deaths of children below 5 years of age (UN 2007). Slums are considered to be the incubator and transmitter of infectious diseases. Tuberculosis is also reportedly prevalent in congested and densely populated slums, malaria diarrhea and respiratory infections are common among slum dwellers and children are more exposed to these diseases (Fernando 2010). With the residents living in extremely poor living conditions, the incidents of disease remain high in Peshawar. A study conducted by Urban Unit Khyber Pakhtunkhwa in the selected slums of Peshawar revealed 74% of the frequently occurring diseases are linked to unhygienic living conditions. It was also revealed that 72% of these diseases were found in children. For health services, 74% of the residents use public health facilities while 30% seek services from private health care units. A study on measles vaccination reported immunization coverage of 58% in children of age 1-2 years in Peshawar with no major gender disparity56. For better understanding of the reasons for its low prevalence, this study also revealed mother’s education as a strong factor affecting the vaccination coverage, which was found to be low for children with illiterate mothers (36%) and considerably higher (83%) for children having literate mothers. Despite all the factors, levels of immunization in slums of Pakistan have remained low57. The main cause of low levels of immunization is lack of awareness and proper policies. Lack of mother’s education regarding child’s health and diseases like measles, polio, TB, typhoid, lead to high child mortality rates58. Hence maternal knowledge is equally important in preventing children from diseases (National Disaster Consortium (NDC), 2019)59. Interventions like awareness programs, community engagements, and vaccination campaigns, medicine coupon incentives are some of the initiatives taken by Government of Pakistan to overcome health issues of slums (Crocker-Buque, Mindra, Duncan & Mounier-Jack, 2017). 1.3.5 Population & Status of Health in Islamabad Islamabad is the federal capital of Pakistan and is located within the federal Islamabad Capital Territory. According to World Population Review, the population of Islamabad is 1,095,06460. The trend analysis for population growth for the city reveals that by 2020, the city population will be almost 1.7 million and it is expected to exceed 2.2 million by the year 2030 (Review, 2019). Islamabad has also seen a proliferation in its slum development in the last two decades. About 20 years ago, there were only 12 slums in and around the city; whereas, the number is now at more than 4261. The areas in and around Sihala, Tarnol, Rawal Dam, Bani Gala, Barakahu and Golra have seen an evident surge in the population and the number of slums62. Analysis of the rapid urban development in Islamabad further reveals that the expansion of new slums, along
52 District Disaster Management Plan Peshawar. (2017). Retrieved 25 September 2019, from http://kp.gov.pk/uploads/2018/08/DDM_Plan.pdf UNHCR (2012) KP and FATA IDP Statistics (As of 01 Dec 2012). 54 DDM Plan Peshawar - Khyber Pakhtunkhwa. Accessed From: http://kp.gov.pk/uploads/2018/08/DDM_Plan.pdf 55 The walled slums : Through the looking glass into Peshawar’s belly, Accessed From: https://tribune.com.pk/story/704975/the-walled-slums-through-the-looking-glass-into-peshawars-belly/ 56 Rehman, H., Mahesar, A. L., Khalid, S. N., & Ishaq, M. (2014). Assessment of Measles Immunization in Children 1-2 Year Age in District Peshawar, Khyber Pakhtunkhwa Pakistan. In Medical Forum (Vol. 25, No. 10, pp. 50-51). 57 Haider, S. (2017). Growth of Slum Areas on the rise in Baluchistan. Pakistan Economist. 58Crocker-Buque, T., Mindra, G., Duncan, R., & Mounier-Jack, S. (2017). Immunization, urbanization and slums – a systematic review of factors and interventions. BMC Public Health, 17(1). doi: 10.1186/s12889-017-4473-7 59 Natural Disasters Consortium (NDC)., 2019. Balochistan Drought Needs Assessment 60 Review, W. (2019). World Population Review. [online] Worldpopulationreview.com. Available at: http://worldpopulationreview.com/world-cities/islamabad-population/ [Accessed 17 Oct. 2019]. 61 Qureshi, Z. (2018). Concern over proliferation of slums in Islamabad. Gulf News Asia. 62 Butt, T. (2017). Islamabad — a city with maximum slums. [online] Thenews.com.pk. Available at: https://www.thenews.com.pk/print/227624-Islamabad-a-city-with-maximum-slums [Accessed 17 Oct. 2019].

10
with the old ones are appearing in the sectors like I-12 and I-14, which will further stress the already dwindling natural resources of the city. It has been estimated that more than 0.1 million people reside in more than two dozen slums situated around sectors G-7, H-9, F-6, F-7, I-11 and I-1263. Additionally, a study by (Leadership for Environment and Development (LEAD)) refers to the three slums of Islamabad named, Chora Stop Slum, Akram Gill Colony, and Mera Jaffar Slum64 with the approximate population as 5,000, 2,000 and 1,000 respectively. It is significant to note that a dozen of these slums are legally occupied by their inhabitants and are given ‘ownership’ rights by the courts65. However, everyday amenities, including clean water and sanitation, gas and electricity are unavailable to many of them. Absence of basic facilities has led to poor health conditions, social and economic disparities in these slums. According to PDHS (2017-18), all basic vaccinations are provided to 67.8% residents of Islamabad66. A study on the reasons of incomplete vaccination in children of Islamabad, sampled 803 children, of which 70.6% were completely vaccinated, 4.1% had ongoing status on vaccination, another 4.4% were partially vaccinated; whereas, 20.7% had never been vaccinated67 (zero dose). Most of the zero-dose children had uneducated parents, or those who had received education up-to primary level only. 15.4% of the parents were unaware about the need for vaccination or about the existing Expanded Programme on Immunization (EPI). 84.3% of the parents were not acquainted about the existence of vaccinators in their area. 64.7% of the parents of zero-dose children report long waiting hours, ranging between 04-05 hours, as the major reason for not vaccinating their children. 55.3% of the parents were apprehensive of the long distance to the health facility68. Around 40% of the parents of zero-dose children had trust issues when it comes to vaccination or vaccinator; whereas 38% reported the regular absence of vaccinator from their health facility69. The findings of the study indicate that an improvement is needed in the provision of vaccination facilities so that they are more accessible to the underprivileged residents of slums. Moreover, awareness about the need for vaccination in the prevailing unhygienic living conditions of slums is essential for the urban poor. 1.4 Objectives The general objective of this study was to prepare the in-depth profiling of slums and underserved areas located within the 8 largest cities located in three provinces and Islamabad, the federal capital, of Pakistan. The specific objectives of this study were to: a. To collect the socio-demographic information of the residents of slums and underserved
areas b. To assess the fixed EPI facilities located in the slums and underserved areas c. To compile the data of health and EPI recourses at the union councils level d. To determine the childhood immunization coverage rates in the slums and underserved
areas 1.5 Rationale The review of literature reveals that the data on housing infrastructures, water and sanitation practices and immunization status of children in slum areas is limited. Therefore, this study was designed and conducted for the following reasons:
63 Mohal, S. (2018). Slums continue to mushroom across Islamabad. [online] Pakistantoday.com.pk. Available at: https://www.pakistantoday.com.pk/2018/05/28/slums-continue-to-mushroom-across-islamabad/ [Accessed 17 Oct. 2019]. 64 Quadri, F., Nasrin, D., Khan, A., Bokhari, T., Tikmani, S., & Nisar, M. et al. (2013). Health Care Use Patterns for Diarrhea in Children in Low-Income Periurban Communities of Karachi, Pakistan. The American Journal of Tropical Medicine and Hygiene, 89(1_Suppl), 49-55. doi: 10.4269/ajtmh.12-0757 65 65 Mohal, S. (2018). Slums continue to mushroom across Islamabad. [online] Pakistantoday.com.pk. Available at: https://www.pakistantoday.com.pk/2018/05/28/slums-continue-to-mushroom-across-islamabad/ [Accessed 17 Oct. 2019]. 66 All basic vaccination includes; BCG, three doses of DPT-HepB-Hib (pentavalent), three doses of oral polio vaccine (excluding polio vaccine given at birth), and one dose of measles. 67 Shah, H. and Pervaiz, S. (2016). Reasons for Incomplete Vaccination in Children of Rawalpindi and Islamabad. 68 68 Shah, H. and Pervaiz, S. (2016). Reasons for Incomplete Vaccination in Children of Rawalpindi and Islamabad. 69 69 Shah, H. and Pervaiz, S. (2016). Reasons for Incomplete Vaccination in Children of Rawalpindi and Islamabad.

11
There is no comprehensive report or tangible dataset available specifically for
slums/underserved areas. The studies are carried out in one specific slum or a few sampled
slums and are not a true representation of inequities prevalent in all slums. Moreover,
existing studies rely on outdated or nationally non-representative datasets, bringing the
validity of research in question;
The cities are growing very fast and are most popular for urban migration. Systematically collected scientific data on geographical scale, locations and population of slums is not only essential to inform policy-makers for needed interventions. ;
The available literature does not have comprehensive information about the scale and situation of slums/ underserved areas;
A comprehensive list and profile of slums is not available which would inform planners about the geographical scale, locations and population of slums;
Additionally, it is not clear whether people living in slums which are not considered legal/registered/regularized in the records of relevant public departments were included in the National Census or not. The current resource allocations and provision of public services is decided according to the available information hence do not cater slums which are not recognised officially;
No secondary dataset is available which provides a complete picture of the status of health and immunization practices in slums and underserved areas. Although some studies mention a few reasons for zero-dose and unimmunized children, an extensive approach on the pattern of coverage survey has not been adopted by any of the studies to understand the reasons for under-immunization. An extensive understanding of slum lifestyle and their socioeconomic conditions is to be undertaken to draft and implement better immunization-related policies;
Coverage surveys have never been undertaken in slums hence status of immunization was never known for realistic planning and resource allocation.
The micro plans of vaccinators and LHWs are prepared based on targets only and do not include specific coverage of slums. The comprehensive data on slums/underserved areas would help in setting up realistic targets for slums/underserved areas.
Action plans for improvement of vaccination and general health conditions in slums/underserved areas would become possible.
There is little or no data available on the role of private and not-for-profit sector on the kind of interventions undertaken by these sectors for the urban poor. The potential for these sectors to provide for the urban poor has not yet been explored.

12
Chapter 2 Methodology
Vaccination Vs Whole Day’s Wages
Nisha lives in Kachi Abadi (unorganized settlements) of Laasi Para in Bin Qasim of District Malir of Karachi City. She has 6 siblings including 3 elder brother and 3 elder sisters. Her father is a daily wage worker. Daily wage income forces family to live hand to mouth and sometime it becomes very difficult to have three times meal. The household structure is very shabby. 9 members lives in one small room using one toilet. Available public water supply lines in their locality remains dry for whole month except 2 days for few hours. To meet their daily needs, they acquire water from the small communal water tank that comes at the street corner. Nisha’s mother cannot read and write and spend most of her time at home taking care of children. She does not have any knowledge about vaccination and have not vaccinated any of her child. At the time of survey, Nisha was one and a half years old but still was not been vaccinated for any dose. With a very small age gap among 7 children, Nisha’s mother explains:
“It is very difficult to find time to go out of home. My husband takes care of responsibilities outside home. The vaccination facility is situated at the distance from our place and it cost extra time and money to go outside of the area only for vaccination. And this is not one time
activity and required many visits as well. My husband does not allow to go outside home alone and he cannot find time to take kids for vaccination by himself as it cost the loss of whole day
wage.”

13
Chapter 2: Methodology
2 Methodology This chapter describes the detailed methodology adopted for the profiling of slums / underserved areas. This methodology was designed in close consultation with the UNICEF Pakistan Country Office, UNICEF Pakistan Field Office and Provincial Expanded Programme on Immunization (EPI) Cell. The process was made participatory and engaging for having community driven perspectives. Triangulation, validation and supportive monitoring were adopted as the key principles and formed the backbone of the entire process. The methodology was finalized according to the security situation and local context.
2.1 Study Design
This was a cross-sectional study undertaken to prepare the in-depth profiling of slums / underserved areas. The following three key activities were conducted for the purpose of this study (Figure 4).
2.2 Study Sites
The study was conducted in the slums / underserved areas located in the city and its periphery. The administrative structure of Pakistan distributes the country into four provinces and Islamabad, Azad Kashmir and Gilgit Baltistan as federally administered areas. The provinces are further distributed into districts. Each district is distributed into multiple towns (tehsils), which are further distributed into union councils. Each union council has 5 to 15 villages/areas depending on the context and rural/urban settings in each province. Previously, the performance of the country used to be assessed either at the provincial level and or at the district level. Gradually it has been realized that the performance needs to be monitored at the administrative unit level, which is union council. Each union council has a union council office, which is headed by the Secretary. The Secretary gets certain resources for the development of villages/areas for that particular union council. The resources of each union council have direct correlations with the performance outputs of that particular union council.
2.3 Study Duration
This study was conducted between 2018 and 2019 with different intervals. The total span of the study was Nine Months.
• Slums located in 100% Union Councils of Each Largest City Line ListedProfiling of
Slums/Underserved Areas
• Public Health & EPI Facilities i& Resources in Union Councils
Compile Health & EPI Resources
• Gender Analysis of Basic Facilities
• Supplies and Vaccine
Assess Fixed EPI Facilities
Figure 4: Key activities in the study

14
2.4 Study Respondents
For the purpose of this study, three key activities were conducted and each activity had different respondents.
Table 2: Respondents of the study
Activities Study Respondents Study Instruments
In-depth profiling of slums and underserved areas
Residents of slums / underserved areas
A. Questionnaire for Group Discussion in Slums / Underserved Areas
Assess the fixed EPI facilities In-charge of EPI facilities B. Questionnaire for EPI Facility Assessment
Compile the health and EPI recourses data at union council levels
District Health Officer, District EPI Coordinator and District Supervisor Vaccination or their nominees
C. Questionnaire for District or Town Health Office
2.5 Sampling Procedures and Sample Size Activities 1: In-depth profiling of slums and underserved areas Slums/underserved areas form a major portion of the largest cities’ population. Consolidated information about the names, addresses and population sizes of slum / underserved areas were not available for realistic planning and extension of the health and EPI services. In order to identify the locations and scale of slums/underserved areas, to know the approximate size of target population and to prepare basic characteristics of these locations, their holistic profiles were prepared. Step 1: Desk Research: For the purpose of this activity, initially desk research were carried out by the study team. The purpose was to understand the different dynamics of the urban poor living in the five largest cities of Pakistan. These conditions were assessed by gathering the literature retrieved from search engines on internet, academic research journals, and policy papers on slums / underserved areas Step 2: Verification of the Study Areas: As there was no data (i.e. listing) available on the slums / underserved areas, the study team visited and physically verified these areas. Step 3: Interactive Group Discussions: Once these areas were verified and listed by the study team, the process of collecting socio-demographic information of the residents of slums and underserved areas were started through interactive group discussions. The study team conducted one group discussion from each union council located in the slums and underserved areas. Sampling Method: A convenience sampling method was used for the purpose of interactive group discussions among the residents of slums and underserved areas. This was done because of the following three key reasons: A. There were no lists or records of the households. The lists of households prepared by
Community Based Volunteers (CBVs) did not differentiate between the slums and non-slums areas
B. The security situations and general hostility as well as unwillingness to share information rendered a simple random sampling nearly improbable
C. Considered to be close knit communities, slums represent wide information sharing networks. Therefore estimates by these informants were deemed to be close to accurate through cross-validation
Sample Size: One group discussion was conducted in each slum or underserved area. 3 to 5 respondents were selected based on inclusion and exclusion criteria for the interactive group discussions. Inclusion and Exclusion Criteria: Following criteria were designed and adopted for the purpose of identifying the respondents for these interactive group discussions.

15
Inclusion Criteria Exclusion Criteria
A. Resident of either slum or underserved area which was to be profiled
A. Not the resident of either slum or underserved area which was to be profiled
B. Have been living there for more than two years B. Have been living there for less than two years
C. Have knowledge about physical infrastructure and other facilities of that particular area
C. No knowledge about the physical infrastructure and other facilities available in the area
Activities 2: Assess the Fixed EPI Facilities The overall objectives of the assessment of fixed EPI facilities were to know the strengths and weaknesses of the service delivery system.
Step 1: Obtaining the list of fixed EPI facilities: The study team obtained the list of all fixed EPI facilities from the department of health authorities.
Step 2: Assessment of fixed EPI facilities: Once the lists were obtained, fixed EPI facilities were physically visited by the study team for assessment.
No sampling method was used for this activity. All listed fixed EPI facilities (i.e. 228) were physically visited and assessed by the study team.
Activities 3: Compile the Health & EPI Resources Data Step 1: Obtaining data of health and EPI resources: The data of health and EPI resources available at the union council’s level were collected from the department of health. The study team used ‘Questionnaire for District or Town Health Office’ for this purpose.
Step 2: Triangulation of Data: This data was triangulated with the information collected from the residents of slums and underserved areas through interactive group discussions (activity 1).
No sampling method was used and data on the key variables (section 2.6) were collected by the study team through study instrument.
2.6 Key Variables Table 3: Key variables in the study
Activities Key Variables
In-depth profiling of slums and underserved areas
1. Slums and Underserved Areas 2. Demography 3. Health and EPI Resources 4. Infrastructure 5. Social Welfare Services
Assess the fixed EPI facilities 1. Infrastructures 2. System 3. Management and Facilities 4. Equipment and Supplies 5. Waste Management 6. Human Resources
Compile the health and EPI recourses data
1. Administrative Layout 2. Healthcare Facilities 3. Equipment and Supplies 4. Human Resources 5. Nutrition Services
2.7 Data Collection Instruments
The data collection instruments were designed by the senior investigators and finalized in consultation with the UNICEF Pakistan officials. The instruments were pre-tested in order to ensure the consistency, appropriateness of language and sequencing of the questions. Based on the feedback from the pre-testing, the instruments were modified and rephrased, where necessary. These data collection instruments were not only translated into local languages but also culturally adopted, where necessary. All study instruments are attached in annexures. 2.8 Operational Definitions The operational definitions were defined based on the desk reviews as well as discussions with the health authorities.

16
2.8.1 Slums The definition of slums was reviewed from UN Habitat, Kachi Abadi Cell, Town Municipal Offices and Offices of Development Authority. Slums are a contiguous settlement where the inhabitants are characterized as having inadequate housing and basic services. A slum is often not recognized and addressed by the public authorities as an integral or equal part of the city. According to UN Habitat, the generic definition of a slum suggests that it is:
...a contiguous settlement where the inhabitants are characterized as having inadequate housing and basic services. A slum is often not recognized and addressed by the public authorities as an integral or equal part of the city (UN Habitat, 2010, p. 1370).
Similarly, a slum household is defined as a group of individuals who live under the same roof that lacks one or more71 of the following conditions:
Limited access to improved water and sanitation
Weak housing structures
Insufficient living area
Uncertain about legal ownership of the residential area
2.8.2 Peri-Urban Slums Slums located at the periphery of urban areas that join the borders of cities and rural areas.
2.8.3 Legal Status Concerned government department recognizes slums as either registered or regularized officially. Documentary evidence such as electricity bill or Computerized National Identity Card (CNIC) shows the address.
2.8.4 Underserved Areas Underserved Areas includes both planned residential areas with majority of the plastered housing structures. Underserved areas have one or more of the following conditions:
Low immunisation coverage or
High number of refusal
2.8.5 Expanded Programme on Immunization Expanded Programme on Immunization of the government of Pakistan for children and women of child-bearing age.
2.8.6 Outreach Vaccination Within remote and inaccessible areas where EPI or healthcare facilities have difficult access or do not exist, an outreach vaccinator covers the area through house to house visits.
2.8.7 Ice Lined Refrigerators Ice Lined Refrigerator (ILR) for maintaining a particular temperature required for storage of vaccines.
2.8.8 Kacha Housing Structure All walls and ceilings are made of mud, straws, bamboos or material other than cement, concrete and iron and are vulnerable to damage due to excessive rains, floods or earthquake etc.
2.8.9 Pacca Housing Structure All walls and ceilings are made of cement, concrete and iron. 2.8.10 Kacha-Pacca Housing Structure Walls are made of concrete and iron while ceiling is made of mud, straw or bamboo or vice versa.
70 UN Habitat (2010), The Challenge of Slums: Global Report on Human Settlements 2003 71 This definition may be locally adapted for where some factors may be similar between the slums and majority of the society (UN Habitat).

17
2.9 Data Analysis Techniques Systematic approach was adopted for cleaning, and verification and further entering of data in excel sheets as per the variables defined for this study. The data was analyzed by the Data Manager in Statistical Package for Social Sciences (SPSS) and Statistics and Data (STATA). The processed data is interpreted through tabular and graphical presentation required for quantitative analysis. The data of slums was segregated in the following categories.
Table 4: Categories of slums data
Categories Size Housing Structure
Legal Status
Facilities Location
Category A More than 60 households
Mostly Kacha/mud made/Tented
Mostly illegal
No solid/liquid waste management system No government water supply
Mostly under the bridge, near river, railway station and any empty land within the city
Category B Less than 60 households
Mostly Kacha/mud made/Tented
Mostly Illegal
No solid/liquid waste management system No government water supply
Surrounded by big houses
Category C More than 60 households
Mostly Pacca/ Plastered
Mostly legal
Mostly garbage management system and drains exist
Mostly upgraded from slums or housing societies or extension of towns
Category D More than 100 households
Mostly un-plastered
Mostly legal
No solid/liquid waste management system No government water supply
Originally rural area but gradually became part of the city hence located at the periphery of the city
2.10 Monitoring Mechanism For the purpose of this study, timely review and rigorous monitoring system was put in place to ensure there were no detractions. This included engagement of a full-time team dedicated to holding surveys and field visits, timely submission of data, physical verification and further cleaning process of the data, and assignment for each team member. The monitoring ensured the following:
Verification of data either through telephonic correspondence or physical on-field visits Supportive supervision and daily review of field performance Trouble shooting in case of problems Review of survey forms to ensure that no information was missed or fake or contradictory
2.11 Study Team & Training A three-tiered teams were engaged in in-depth profiling of slums and underserved areas, assessment of fixed EPI facilities in slums and underserved areas and compilation of health and EPI resources data of union councils.
The first tier of team comprised of a team leader, survey supervisors and data collectors. The team leader provided overall guidelines and end-to-end management of the process, the supervisors extended supportive supervision and monitoring of the data collection and ensured quality standards while surveyors collected the data from the field through physical visits, group discussions and individual interviews.
The 2nd tier of the team consisted of data validation, cleaning, entry and analysis.
The 3rd tier of the team comprised report writers responsible for undertaking desk researches and interpreting the results in an effective manner.
The training of study teams was conducted by the professionals prior to commencing data collection activities that includes study objectives, basic concepts on healthcare and immunization services, data collection, ethical considerations as well as confidentiality. In addition, they were trained on data entry processes (i.e. validation and cleaning before their final consolidation).
1. Team Leader Supervisors
Data Collectors
Data Entry Operators
2. Data Validation Team
Data Assistant
3. Report Writer Data Analyst
Graphic Designer
Figure 5: Study team composition

18
Chapter 3 Profile of Slums/Underserved Areas
11.9 Million
People live in Slums/
Underserved Areas
93% Slums/ Underserved
Areas Report No
Access to EPI
Facilities
98% Slums/ Underserved
Areas
Report No Access to
Public Health Facilities
58% Slums/ Underserved
Areas are not covered
by LHWs
29% Slums/ Underserved
Areas Report No
Coverage for
Outreach

19
Chapter 3: Profile of Slums/Underserved Areas
Slums/Underserved areas form a major portion of the largest cities’ population. Consolidated information about names, addresses and population sizes of these areas are unavailable for realistic planning and extension of health and EPI services. In order to identify the locations and scale of slums/underserved areas, to know the approximate size of target population and to prepare basic characteristics of these locations, their holistic profiles are being prepared. This chapter presents the profile of slums/underserved areas of 8 largest cities located in three provinces and Islamabad, the federal capital, of Pakistan. The profiles are presented around the following five broader categories: 3.1 Slums/Underserved Areas 3.1.1 Union Councils with/without Slums/Underserved Areas 3.1.2 Number of Slums/Underserved Areas 3.1.3 Timelines of Existence 3.1.4 Legal Status 3.2 Demography 3.2.1 Population 3.2.2 Types of Residents 3.3 Health Resources 3.3.1 Health Facilities 3.3.2 EPI Facilities 3.3.3 Outreach Vaccination 3.3.4 Health Workers 3.3.5 Emergency Health Services 3.4 Infrastructure 3.4.1 Housing Structures 3.4.2 Household Toilets 3.4.3 Domestic Water 3.4.4 Waste Management 3.5 Social Welfare 3.5.1 Schools 3.5.2 Civil Society Organizations 3.5.3 Informal Groups 3.5.4 Social Welfare Schemes
3.1 Slums/Underserved Areas
3.1.1 Union Councils with/without Slums/Underserved The 08 cities are sub-divided into 31 towns, which are further divided into 626 UCs. 76% Union Councils house 3114 slums/underserved areas. These 76% UCs house a greater number of slums (1779) compared to underserved areas (1335). Highest percentage of spread of slums/underserved areas across UCs is found in Gujranwala (91%). The lowest spread of slums/underserved areas across UCs is found in Quetta (44%). Around 70% UCs house slums/underserved areas in remaining cities.
44%
73%
76%
77%
77%
77%
88%
91%
76%
QTA
RWP
FSD
IBD
MTN
LHR
PWR
GJR
Total
Figure 6: % UCs with Slums/Underserved

20
3.1.2 Slums/Underserved Areas Overall, there are 1779 slums and 1335 underserved areas located in 478 UCs. The highest number of slums is found in Peshawar (550) followed by Lahore (356) and Quetta (281). While the number of underserved areas is highest in Lahore (637) and Faisalabad (297). The lowest number of slums/underserved areas is found in Islamabad. The greater number of slums/underserved does not refer to greater number of population size. The sizes of slums vary across each city hence these numbers need to be analysed according to their population sizes (Annex 4 Table 4).
3.1.3 Timelines of Existence Overall, the emergence of slums has been lowest before 1950s (24%) and after 1991 (18%). The growth of slums is highest during 1950 to 1990 (58%) at a similar pace for all 08 cities. The lowest growth during 1950s to 1990s is found in Peshawar (48%). The highest growth of slums before 1990s is found in Islamabad (72%) and Faisalabad (65%). The growth of slums during 1950s to 1990s could be because of industrial growth or decline of agricultural profits. The lowest growth of slums after 1991 is seen in Peshawar where percentage of slum growth drops from 48% to only 9%. 3.1.4 Legal Status 36% slums are not registered72 with highest unregistered slums in Quetta (57%), Islamabad (57%) and Peshawar (50%). In Punjab, the percentage varies across cities, as Gujranwala (43%) has the highest percentage of unregistered slums. whereas, they are lowest for Faisalabad (11%), Multan (17%) and Lahore (18%). The registration status of slums determines the eligibility to have resource allocation for having public services such as health, education, water and sanitation etc. The variation in the status of registration reflects the regularization of slums across different cities.
72 Registration status is reported against address mentioned on electricity bill and CNIC
Table 5: Number of Slums/Underserved
Cities Slums Underserved Total
Faisalabad 169 297 466
Gujranwala 82 165 247
Lahore 356 637 993
Multan 216 104 320
Rawalpindi 76 62 138
Islamabad 49 14 63
Quetta 281 34 315
Peshawar 550 22 572
Total 1779 1335 3114
21%
15%
20%
21%
10%
0%
9%
43%
24%
59%
60%
61%
63%
65%
72%
62%
48%
58%
20%
25%
19%
16%
25%
28%
29%
9%
18%
GJR
MTN
RWP
LHR
FSD
IBD
QTA
PWR
Total
1991 onwards 1951-1990 Before 1950
11%17% 18%
24%
43%
50%
57% 57%
36%
FSD MTN LHR RWP GJR PWR IBD QTA Total
Figure 7: Timelines of Existence of Slums
Figure 8: % of Unregistered Slums

21
3.2 Demography 3.2.1 Population There are approximately 11.9 Million people living in slums/underserved areas, which is about 49% of the total population (24.3 Million)73 of the 8 cities surveyed. The higher population share resides in underserved areas as compared to slums. The largest population size in slums/underserved areas is found in Lahore (4.6 Million) followed by slums/underserved areas of Peshawar (1.5 Million). The lowest population size is found in slums/underserved areas of Islamabad (0.37 Million). Overall, approximate population of children aged 0-11 months74 residing in slums/underserved areas is 0.38 Million. City wise comparison reflects highest number of target population resides in Lahore followed by Peshawar. Lowest number of target population resides in Islamabad, Quetta and Multan. The population of children under 5 75 years of age residing in slums/underserved area is 2 Million. With the similar trends, the highest number of children under 5 years of age is found in Lahore followed by Peshawar. The lowest number of children under 5 years of age is found in Islamabad. The approximate population of child bearing age women76 residing in slums/underserved areas of 8 largest cities of Pakistan is 2.6 Million. Slums/Underserved areas of Lahore stand first with the highest concentration of population of child bearing age women. Slums/Underserved areas of Islamabad share merely 3% of the total population residing in slums/underserved areas.
73 National census 2017 74 3.5% and 92% survival of total population 75 17% of total population 76 22% of total population
Table 6: Approximate Population of Slums/Underserved
Cities Slums Underserved Total
Faisalabad 459,327 881,049 1,340,376
Gujranwala 289,610 1,179,940 1,469,550
Lahore 1,519,936 3,130, 318 4, 650, 254
Multan 491,250 432,270 923,520
Rawalpindi 532,155 434,844 966,999
Islamabad 273,840 105,800 379,640
Quetta 633,508 78,896 712,404
Peshawar 1,480,942 51,536 1,532,478
Total 5,680,568 6,294,653 11,975,221
Table 7: Approximate Population of Children 0-11 Months
Cities Slums Underserved Total
Faisalabad 14,790 28,370 43,160
Gujranwala 9,325 37,994 47,319
Lahore 48, 942 100,796 149,738
Multan 15,818 13,919 29,737
Rawalpindi 17,135 14,002 31,137
Islamabad 8,818 3,407 12,224
Quetta 20,399 2,540 22,939
Peshawar 47,686 1,659 49,346
Total 182,913 202,687 385,600
Table 8: Approximate Population Children Under 5 Years of Age
Cities Slums Underserved Total
Faisalabad 78,086 149,778 227,864
Gujranwala 49,234 200,589 249,823
Lahore 258,389 532,154 790,543
Multan 83,513 73,486 156,999
Rawalpindi 90,466 73,923 164,389
Islamabad 46,553 17,986 64,539
Quetta 107,696 13,412 121,108
Peshawar 251,760 8,761 260,521
Total 965,697 1,070,089 2,035,786
Table 9: Population of Child Bearing Age Women
Cities Slums Underserved Total
Faisalabad 101,052 193,831 294,883
Gujranwala 63,714 259,587 323,301
Lahore 334,386 688,670 1,023,056
Multan 108,075 950,99 203,174
Rawalpindi 117,074 956,66 212,740
Islamabad 60,245 23,276 83,521
Quetta 139,372 17,357 156,729
Peshawar 325,807 11,338 337,145
Total 1,249,725 1,384,824 2,634,549

22
3.2.2 Types of Residents 3.2.2a Permanent Settlers Overall 86% residents of slums/underserved areas are living in these locations for more than two years hence are called permanent settlers. Highest proportion of permanent settlers is found in slums/underserved areas of Gujranwala (92%) and Islamabad (90%). Lowest proportion of permanent settlers is found in Quetta (76%). Over 80% of residents of slums/underserved areas are permanent in all other cities. 3.2.2.b Temporary Displaced Overall 13% residents of slums/underserved areas are temporarily displaced. Highest proportion of temporary displaced is found in Peshawar (19%), Rawalpindi (19%) and Faisalabad (18%). Lowest proportion of temporary displaced is found in Islamabad (3%), Quetta (7%) and Gujranwala (8%). Over 10% residents are found temporary displaced in Lahore (11%) and Multan (11%). 3.2.2c Other Nationalities Overall 1% residents of slums/underserved areas belong to other Nationalities. Residents belonging to other Nationalities are found in five out of eight cities. Highest concentration of residents belonging to other Nationalities are found in Islamabad (10%) followed by Peshawar (6%) and Quetta (5%). A negligible percentage of residents belonging to other Nationalities are found in slums/underserved areas of Multan (1%) and Rawalpindi (2%). 3.3 Health Resources 3.3.1 Health Facilities 31% UCs do not have Public health Facilities. Intra-city comparison within Punjab reveals the highest percentage of UCs lacking public health facilities being driven mainly from Gujranwala where 70% UCs do not house such facilities followed by Faisalabad (54%) and Rawalpindi (53%). A large percentage of UCs in Islamabad (35%) followed by Quetta (20%) and Peshawar (18%) are also without public health facilities. It is interesting to note that only 2% slums/underserved areas report their access to Public/Private health facilities within 2 kilometers, radius.
Table 10: Permanent Settlers
Cities Slum Underserved Total
Faisalabad 81% 83% 82%
Gujranwala 96% 91% 92%
Lahore 87% 89% 89%
Multan 87% 91% 89%
Rawalpindi 76% 81% 78%
Islamabad 88% 95% 90%
Quetta 88% 76% 87%
Peshawar 75% 89% 75%
Total 83% 88% 86%
Table 11: Temporary Displaced Cities Slum Underserved Total
Faisalabad 19% 17% 18%
Gujranwala 4% 9% 8%
Lahore 13% 10% 11%
Multan 12% 9% 11%
Rawalpindi 20% 19% 19%
Islamabad 2% 5% 3%
Quetta 7% 8% 7%
Peshawar 19% 10% 19%
Total 14% 12% 13%
Table 12: Residents Belonging to Other Nationalities
Cities Slum Underserved Total
Faisalabad 0% 0% 0%
Gujranwala 0% 0% 0%
Lahore 0% 0% 0%
Multan 1% 1% 1%
Rawalpindi 3% 0% 2%
Islamabad 10% 0% 8%
Quetta 5% 16% 6%
Peshawar 6% 0% 6%
Total 3% 0% 1%
Table 13: UCs with/without Health Facilities Cities
UCs with Health Facilities
UCs without Health Facilities Total
Faisalabad 46% 54% 100%
Gujranwala 30% 70% 100%
Lahore 96% 4% 100%
Multan 68% 32% 100%
Rawalpindi 47% 53% 100%
Islamabad 65% 35% 100%
Quetta 80% 20% 100%
Peshawar 82% 18% 100%
Total 69% 31% 100%

23
3.3.2 EPI Facilities Overall, 26% Union Councils do not have any EPI facilities. The percentage of UCs without EPI facilities is highest in Gujranwala (72%) followed by Rawalpindi (52%), Faisalabad (45%) and Multan (32%). 99% UCs of Lahore have EPI facilities. It is interesting to note that only 7% slums/underserved areas report about the presence of EPI facility within 2 km radius. The highest percentage of slums/underserved areas that mention about the presence of EPI facility with an easy access is in Lahore (8%) and Peshawar (8%). 3.3.3 Outreach Vaccination 71% slums/underserved areas report provision of outreach vaccination services in their areas. When non-provision of outreach vaccination service is analyzed, the highest percentage of slums/underserved areas of Gujranwala (69%), Quetta (64%) and Faisalabad (36%) stands out. Whereas this percentage is comparatively lowest in slums/underserved areas of Peshawar (4%), Multan (5%) and Rawalpindi (7%). 3.3.4 Health Workers 3.3.4a Lady Health Workers Overall, LHWs are not found in 58% slums/underserved areas.77 More underserved areas are uncovered by LHWs (62%) as compared to slums (55%). Majority of the slums/underserved of Gujranwala (85%) and Faisalabad (78%) report that their areas are uncovered by LHWs. The percentage of slums/underserved areas uncovered for LHWs is low in Peshawar (41%) and Lahore (45%). 3.3.4b Dengue Workers Overall 36% slums/underserved areas do not have dengue workers present in them. 83% slums/underserved areas of Peshawar are without dengue workers; while in Faisalabad (55%), Islamabad78 54% and Gujranwala (45%) slums/underserved areas do not have dengue workers in them. Although all slums/ underserved areas of Rawalpindi have dengue workers available but a small percentage of slums/underserved areas of Lahore (20%) and Multan (13%) do not have dengue workers.
77 The percentage total is calculated by dividing the number of slums and underserved areas with LHWs to the total number of slums and underserved areas per city. 78 In Islamabad Capital Development Authority (CDA) deploy staff on temporary basis only during dengue season. .
Table 13: UCs with/without EPI Facilities
Cities UCs with EPI Facilities
UCs without EPI Facilities Total
Faisalabad 55% 45% 100%
Gujranwala 28% 72% 100%
Lahore 99% 1% 100%
Multan 68% 32% 100%
Rawalpindi 48% 52% 100%
Islamabad 69% 31% 100%
Quetta 82% 18% 100%
Peshawar 97% 3% 100%
Total 74% 26% 100%
Table 14: Availability of Outreach Vaccination Cities Slums Underserved Total
Faisalabad 64% 64% 64%
Gujranwala 27% 33% 31%
Lahore 83% 67% 73%
Multan 93% 100% 95%
Rawalpindi 95% 90% 93%
Islamabad 71% 57% 68%
Quetta 36% 35% 36%
Peshawar 96% 100% 96%
Total 77% 65% 71%
Table 15: LHWs Uncovered Slums/Underserved Areas Cities Slums Underserved Total
Faisalabad 82% 76% 78%
Gujranwala 94% 81% 85%
Lahore 38% 49% 45%
Multan 68% 63% 66%
Rawalpindi 57% 71% 63%
Islamabad 65% 64% 65%
Quetta 67% 68% 67%
Peshawar 40% 68% 41%
Total 55% 62% 58%
Table 16: Unavailability of Dengue Workers Cities Slums Underserved Total
Faisalabad 57% 54% 55%
Gujranwala 0% 68% 45%
Lahore 24% 17% 20%
Multan 17% 7% 13%
Rawalpindi 0% 0% 0%
Islamabad 55% 50% 54%
Quetta NA NA NA
Peshawar 83% 64% 83%
Total 46% 31% 36%
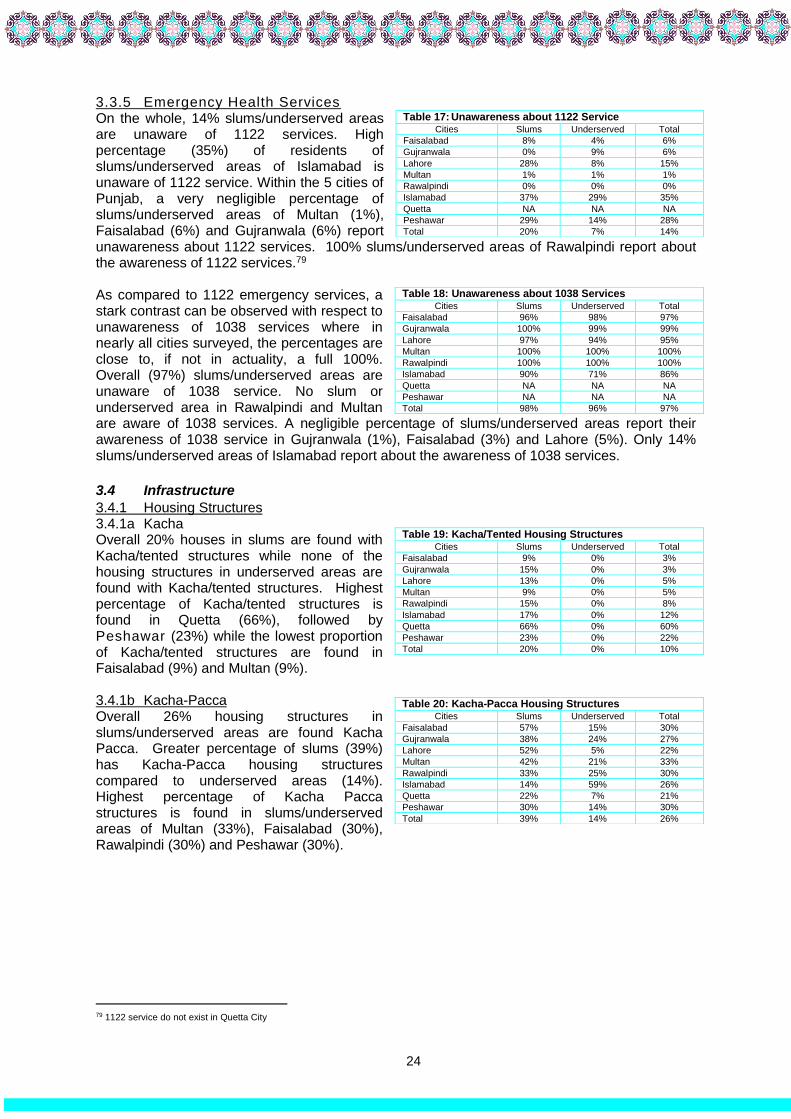
24
3.3.5 Emergency Health Services On the whole, 14% slums/underserved areas are unaware of 1122 services. High percentage (35%) of residents of slums/underserved areas of Islamabad is unaware of 1122 service. Within the 5 cities of Punjab, a very negligible percentage of slums/underserved areas of Multan (1%), Faisalabad (6%) and Gujranwala (6%) report unawareness about 1122 services. 100% slums/underserved areas of Rawalpindi report about the awareness of 1122 services.79 As compared to 1122 emergency services, a stark contrast can be observed with respect to unawareness of 1038 services where in nearly all cities surveyed, the percentages are close to, if not in actuality, a full 100%. Overall (97%) slums/underserved areas are unaware of 1038 service. No slum or underserved area in Rawalpindi and Multan are aware of 1038 services. A negligible percentage of slums/underserved areas report their awareness of 1038 service in Gujranwala (1%), Faisalabad (3%) and Lahore (5%). Only 14% slums/underserved areas of Islamabad report about the awareness of 1038 services.
3.4 Infrastructure
3.4.1 Housing Structures 3.4.1a Kacha Overall 20% houses in slums are found with Kacha/tented structures while none of the housing structures in underserved areas are found with Kacha/tented structures. Highest percentage of Kacha/tented structures is found in Quetta (66%), followed by Peshawar (23%) while the lowest proportion of Kacha/tented structures are found in Faisalabad (9%) and Multan (9%). 3.4.1b Kacha-Pacca Overall 26% housing structures in slums/underserved areas are found Kacha Pacca. Greater percentage of slums (39%) has Kacha-Pacca housing structures compared to underserved areas (14%). Highest percentage of Kacha Pacca structures is found in slums/underserved areas of Multan (33%), Faisalabad (30%), Rawalpindi (30%) and Peshawar (30%).
79 1122 service do not exist in Quetta City
Table 17: Unawareness about 1122 Service Cities Slums Underserved Total
Faisalabad 8% 4% 6%
Gujranwala 0% 9% 6%
Lahore 28% 8% 15%
Multan 1% 1% 1%
Rawalpindi 0% 0% 0%
Islamabad 37% 29% 35%
Quetta NA NA NA
Peshawar 29% 14% 28%
Total 20% 7% 14%
Table 18: Unawareness about 1038 Services Cities Slums Underserved Total
Faisalabad 96% 98% 97%
Gujranwala 100% 99% 99%
Lahore 97% 94% 95%
Multan 100% 100% 100%
Rawalpindi 100% 100% 100%
Islamabad 90% 71% 86%
Quetta NA NA NA
Peshawar NA NA NA
Total 98% 96% 97%
Table 19: Kacha/Tented Housing Structures Cities Slums Underserved Total
Faisalabad 9% 0% 3%
Gujranwala 15% 0% 3%
Lahore 13% 0% 5%
Multan 9% 0% 5%
Rawalpindi 15% 0% 8%
Islamabad 17% 0% 12%
Quetta 66% 0% 60%
Peshawar 23% 0% 22%
Total 20% 0% 10%
Table 20: Kacha-Pacca Housing Structures Cities Slums Underserved Total
Faisalabad 57% 15% 30%
Gujranwala 38% 24% 27%
Lahore 52% 5% 22%
Multan 42% 21% 33%
Rawalpindi 33% 25% 30%
Islamabad 14% 59% 26%
Quetta 22% 7% 21%
Peshawar 30% 14% 30%
Total 39% 14% 26%

25
3.4.1c Pacca Overall 64% houses in slums/underserved areas are found with Pacca structures. Greater percentage of housing structures of underserved areas is Pacca (86%) compared to slums (41%). The lowest percentage of Pacca housing structures is found in slums of Quetta (12%). Over 70% housing structures of underserved areas of all cities have Pacca housing structures except Islamabad (41%). The highest percentage of Pacca housing structures is found in underserved areas of Lahore (95%) and Quetta (93%). 3.4.2 Household Toilets 3.4.2a Housing Structures without Toilets Overall 1% housing structures in slums/underserved areas are found without toilets. Greater percentage of housing structures in slums (2%) is found without toilets compared to underserved areas (1%). Highest percentage of housing structures in Quetta (5%) is found without toilets across eight cities. None of the housing structures are without toilets in underserved areas of four cities. The only exception is Quetta where 6% housing structures of underserved areas are found without toilets. 3.4.2b Types of Toilets Overall 51% housing structures have open pit/traditional toilets. Housing structures of almost an equal percentage of slums/ underserved areas have open pit/traditional toilets. Highest percentage of open pit/traditional toilets is found in Quetta (87%) followed by Peshawar (62%). Over 50% toilets in slums/underserved areas of six cities are open pit/traditional.
About half of the available toilets in slums/underserved areas are connected with the street drains. Highest percentage of toilets connected with street drains are found in slums/underserved areas of Gujranwala (68%) and Faisalabad (61%). Lowest percentage of toilets connected with street drains are found in Quetta (13%). Less than 50% toilets connected with street drains are found in Peshawar (38%), Rawalpindi (41%), Multan (47%) and Lahore (49%). On an average, 8 persons use single toilet facility. Highest number of average users of single toilet is found in Quetta (9) and Peshawar (9). In the absence of toilet facility, residents of slums/underserved areas practice open defecation. 11% slums report open defecation and 3% underserved areas. The practice of open defecation is highest in slums/underserved areas of Islamabad (21%) and Peshawar (12%) (Table 21c Annex 5).
Table 21: Pacca Housing Structures Cities Slums Underserved Total
Faisalabad 34% 85% 67%
Gujranwala 47% 76% 70%
Lahore 35% 95% 74%
Multan 49% 79% 61%
Rawalpindi 52% 75% 62%
Islamabad 69% 41% 62%
Quetta 12% 93% 19%
Peshawar 47% 86% 48%
Total 41% 86% 64%
Table 22: Housing Structures without Toilets Cities Slums Underserved Total
Faisalabad 2% 1% 1%
Gujranwala 1% 0% 1%
Lahore 2% 0% 1%
Multan 1% 6% 3%
Rawalpindi 1% 0% 0%
Islamabad 3% 0% 2%
Quetta 5% 6% 5%
Peshawar 2% 1% 2%
Total 2% 1% 1%
Table 23: Open Pit/Traditional Toilets Cities Slums Underserved Total
Faisalabad 45% 36% 39%
Gujranwala 36% 30% 32%
Lahore 37% 58% 51%
Multan 48% 60% 53%
Rawalpindi 55% 64% 59%
Islamabad 49% 51% 50%
Quetta 88% 79% 87%
Peshawar 61% 79% 62%
Total 52% 50% 51%
Table 24: Toilet with Connected Street Drains Cities Slums Underserved Total
Faisalabad 55% 64% 61%
Gujranwala 64% 70% 68%
Lahore 63% 42% 49%
Multan 52% 40% 47%
Rawalpindi 45% 36% 41%
Islamabad 51% 49% 50%
Quetta 12% 21% 13%
Peshawar 39% 21% 38%
Total 48% 50% 49%

26
3.4.3 Domestic Water Overall, only 25% slums/underserved areas have access to government water supply for domestic use. Highest percentage of slums/underserved areas of Rawalpindi (41%) and Lahore (39%) has access to government water supply. A very low percentage of slums/underserved areas of Peshawar (12%) and Gujranwala (12%) have access to government water supply. Overall almost half of the slums/underserved areas use ground water for domestic purposes. When slums/underserved areas are compared for the use of ground water, it is found that majority of slums (60%) use ground water compared to underserved areas (34%). Highest percentage of users of ground water is found in slums/underserved areas of Peshawar (87%) and Multan (64%). Lowest percentage of users of ground water is found in slums/underserved areas of Quetta (26%). Overall about a quarter of slums/underserved areas use other sources80 of water for domestic purposes. Higher percentage of underserved areas (31%) relies on other sources of water compared to slums (22%). Highest percentage of underserved areas in Faisalabad (55%) and Quetta (53%) rely on other sources of water for domestic purposes. 3.4.4 Waste Management 3.4.4a For Liquid Waste Overall, 28% slums/underserved areas do not have drains. Highest percentage of slums/underserved areas in Lahore (46%) followed by Quetta (37%), Islamabad (35%) and Gujranwala (32%) are found without drains. Lowest percentage of slums/underserved areas in Peshawar (4%) report about absence of drains in them. More than half of the slums/underserved areas have choked/filthy drains. Highest percentage of slums/underserved area in Peshawar (63%) followed by Faisalabad (56%), Multan (52%) and Gujranwala (52%) has choked/filthy drains. Similarly a substantial percentage of slums/underserved areas in Quetta (47%), Islamabad (40%) and Lahore (38%) have choked/filthy drains.
80 Other sources of water include water tanks, Masjid, neighboring areas etc.
Table 25: Access to Government Water Supply Cities Slums Underserved Total
Faisalabad 17% 30% 25%
Gujranwala 9% 14% 12%
Lahore 32% 43% 39%
Multan 18% 27% 21%
Rawalpindi 28% 56% 41%
Islamabad 25% 36% 27%
Quetta 12% 35% 15%
Peshawar 12% 9% 12%
Total 18% 35% 25%
Table 26: Ground Water Cities Slums Underserved Total
Faisalabad 74% 15% 36%
Gujranwala 67% 39% 48%
Lahore 33% 41% 38%
Multan 73% 45% 64%
Rawalpindi 50% 20% 36%
Islamabad 63% 36% 56%
Quetta 27% 12% 26%
Peshawar 87% 91% 87%
Total 60% 34% 49%
Table 27: Acquire from Other Sources Cities Slums Underserved Total
Faisalabad 9% 55% 38%
Gujranwala 24% 47% 40%
Lahore 35% 16% 22%
Multan 8% 29% 15%
Rawalpindi 22% 25% 22%
Islamabad 12% 28% 17%
Quetta 61% 53% 59%
Peshawar 1% 0% 1%
Total 22% 31% 25%
Table 28: No Drains Cities Slums Underserved Total
Faisalabad 27% 16% 20%
Gujranwala 37% 30% 32%
Lahore 34% 52% 46%
Multan 18% 36% 24%
Rawalpindi 14% 13% 14%
Islamabad 39% 22% 35%
Quetta 40% 15% 37%
Peshawar 4% 5% 4%
Total 22% 36% 28%
Table 29: Choked/Filthy Drains Cities Slums Underserved Total
Faisalabad 54% 57% 56%
Gujranwala 46% 55% 52%
Lahore 40% 38% 38%
Multan 56% 43% 52%
Rawalpindi 26% 50% 37%
Islamabad 33% 64% 40%
Quetta 47% 53% 47%
Peshawar 64% 59% 63%
Total 51% 46% 49%
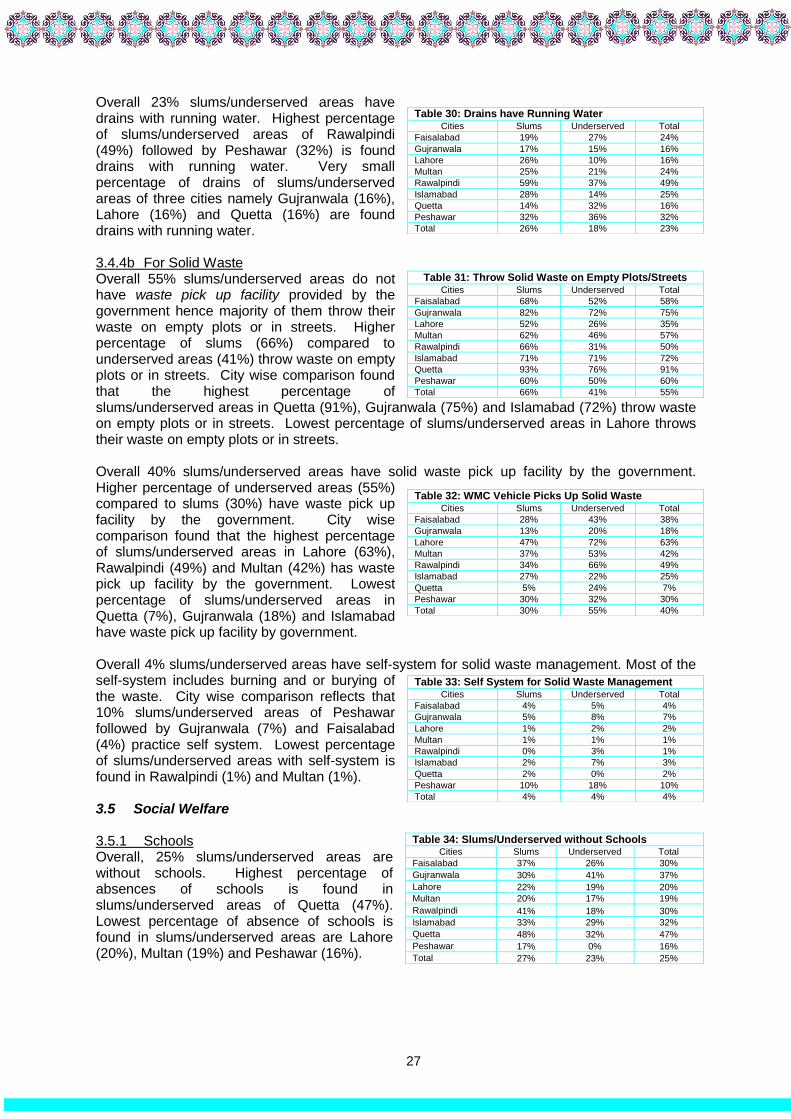
27
Overall 23% slums/underserved areas have drains with running water. Highest percentage of slums/underserved areas of Rawalpindi (49%) followed by Peshawar (32%) is found drains with running water. Very small percentage of drains of slums/underserved areas of three cities namely Gujranwala (16%), Lahore (16%) and Quetta (16%) are found drains with running water. 3.4.4b For Solid Waste Overall 55% slums/underserved areas do not have waste pick up facility provided by the government hence majority of them throw their waste on empty plots or in streets. Higher percentage of slums (66%) compared to underserved areas (41%) throw waste on empty plots or in streets. City wise comparison found that the highest percentage of slums/underserved areas in Quetta (91%), Gujranwala (75%) and Islamabad (72%) throw waste on empty plots or in streets. Lowest percentage of slums/underserved areas in Lahore throws their waste on empty plots or in streets. Overall 40% slums/underserved areas have solid waste pick up facility by the government. Higher percentage of underserved areas (55%) compared to slums (30%) have waste pick up facility by the government. City wise comparison found that the highest percentage of slums/underserved areas in Lahore (63%), Rawalpindi (49%) and Multan (42%) has waste pick up facility by the government. Lowest percentage of slums/underserved areas in Quetta (7%), Gujranwala (18%) and Islamabad have waste pick up facility by government. Overall 4% slums/underserved areas have self-system for solid waste management. Most of the self-system includes burning and or burying of the waste. City wise comparison reflects that 10% slums/underserved areas of Peshawar followed by Gujranwala (7%) and Faisalabad (4%) practice self system. Lowest percentage of slums/underserved areas with self-system is found in Rawalpindi (1%) and Multan (1%). 3.5 Social Welfare
3.5.1 Schools Overall, 25% slums/underserved areas are without schools. Highest percentage of absences of schools is found in slums/underserved areas of Quetta (47%). Lowest percentage of absence of schools is found in slums/underserved areas are Lahore (20%), Multan (19%) and Peshawar (16%).
Table 30: Drains have Running Water
Cities Slums Underserved Total
Faisalabad 19% 27% 24%
Gujranwala 17% 15% 16%
Lahore 26% 10% 16%
Multan 25% 21% 24%
Rawalpindi 59% 37% 49%
Islamabad 28% 14% 25%
Quetta 14% 32% 16%
Peshawar 32% 36% 32%
Total 26% 18% 23%
Table 31: Throw Solid Waste on Empty Plots/Streets Cities Slums Underserved Total
Faisalabad 68% 52% 58%
Gujranwala 82% 72% 75%
Lahore 52% 26% 35%
Multan 62% 46% 57%
Rawalpindi 66% 31% 50%
Islamabad 71% 71% 72%
Quetta 93% 76% 91%
Peshawar 60% 50% 60%
Total 66% 41% 55%
Table 32: WMC Vehicle Picks Up Solid Waste Cities Slums Underserved Total
Faisalabad 28% 43% 38%
Gujranwala 13% 20% 18%
Lahore 47% 72% 63%
Multan 37% 53% 42%
Rawalpindi 34% 66% 49%
Islamabad 27% 22% 25%
Quetta 5% 24% 7%
Peshawar 30% 32% 30%
Total 30% 55% 40%
Table 33: Self System for Solid Waste Management Cities Slums Underserved Total
Faisalabad 4% 5% 4%
Gujranwala 5% 8% 7%
Lahore 1% 2% 2%
Multan 1% 1% 1%
Rawalpindi 0% 3% 1%
Islamabad 2% 7% 3%
Quetta 2% 0% 2%
Peshawar 10% 18% 10%
Total 4% 4% 4%
Table 34: Slums/Underserved without Schools Cities Slums Underserved Total
Faisalabad 37% 26% 30%
Gujranwala 30% 41% 37%
Lahore 22% 19% 20%
Multan 20% 17% 19%
Rawalpindi 41% 18% 30%
Islamabad 33% 29% 32%
Quetta 48% 32% 47%
Peshawar 17% 0% 16%
Total 27% 23% 25%

28
Overall, 64% slums/underserved areas have government schools. Higher percentage of government schools is found in slums/underserved of Quetta (78%), Multan (78%), Peshawar (74%) and Islamabad (70%). About half of the slums/ underserved areas of Gujranwala (55%) and Faisalabad (51%) report presence of Government schools. A higher percentage of slums (69%) have presence of Government schools compare to underserved areas (58%). Highest percentage of Government schools is found in slums of Multan (81%), Peshawar (73%) and Islamabad (73%). Lowest presence of government schools found in Faisalabad (52%) and Gujranwala (56%). Similarly highest percentage of Government schools is found in underserved areas of Quetta (96%), Peshawar (91%) and Multan (71%). Lowest presence of government schools found in Faisalabad (51%), Gujranwala (54%) and Lahore (57%). A significantly higher percentage of schools are run by Madrassa (44%) and Private agencies (74%) in slums/underserved areas (Table 25 c Annex 4). 3.5.2 Civil Society Organizations (CSOs) Overall CSOs are working in 3% slums/ underserved areas. City wise comparison reflects that slums/underserved areas of Quetta and Multan have no presence of CSOs. CSOs are found in highest percentage of slums/underserved areas of Islamabad (31%). A negligible percentage of slums/underserved areas of Lahore (4%), Rawalpindi (3%), Faisalabad (3%), Peshawar (1%) and Gujranwala (1%) also report about working of CSOs. Slums/underserved areas where CSOs are found, majority of them are working either on education and or health (Table 28c Annex 4). Slums of Quetta, Multan and Gujranwala do not report presence of any CSO within them. CSOs are found in highest percentage of slums of Islamabad (29%). A negligible percentage of slums of Lahore (3%), Rawalpindi (4%), Faisalabad (1%) and Peshawar (1%) also report about working of CSOs. Underserved areas of Quetta and Peshawar have no presence of CSOs. Less than 10% underserved areas of Islamabad (7%), Faisalabad (4%) and Lahore (4%) report about working of CSOs within them. A negligible percentage of underserved areas of Rawalpindi (2%), Multan (1%) and Gujranwala (1%) also report about working of CSOs within them. 3.5.3 Informal Groups Overall 35% slums/underserved areas have informal groups. Highest percentage of informal groups is found in slums/underserved areas of Rawalpindi (59%) and Islamabad (46%) while lowest percentage of informal groups is found in slums of Quetta (14%). The percentage of presence of informal groups is higher in underserved areas (39%) compared to slums (32%) Highest percentage of informal groups is found in slums of Rawalpindi (57%) and Islamabad (51%). The lowest presence of informal groups is found in slums of Quetta (15%).
Table 35: Presence of Government Schools Cities Slums Underserved Total
Faisalabad 52% 51% 51%
Gujranwala 56% 54% 55%
Lahore 68% 57% 60%
Multan 81% 71% 78%
Rawalpindi 60% 63% 61%
Islamabad 73% 60% 70%
Quetta 75% 96% 78%
Peshawar 73% 91% 74%
Total 69% 58% 64%
Table 36: Presence of CSOs Cities Slums Underserved Total
Faisalabad 1% 4% 3%
Gujranwala 0% 1% 1%
Lahore 3% 4% 4%
Multan 0% 1% 0%
Rawalpindi 4% 2% 3%
Islamabad 29% 7% 31%
Quetta 0% 0% 0%
Peshawar 1% 0% 1%
Total 2% 3% 3%
Table 37: Informal Groups Cities Slums Underserved Total
Faisalabad 33% 39% 37%
Gujranwala 32% 22% 23%
Lahore 39% 43% 42%
Multan 40% 32% 37%
Rawalpindi 57% 63% 59%
Islamabad 51% 29% 46%
Quetta 15% 6% 14%
Peshawar 27% 45% 28%
Total 32% 39% 35%

29
Highest percentage of informal groups is found in underserved areas of Rawalpindi (63%), Peshawar (45%) and Lahore (43%). Lowest percentage of informal groups is found in underserved areas of Quetta (6%).
3.5.4 Public Welfare Schemes Overall 49% slums/underserved areas have public welfare schemes. The highest percentage of public welfare schemes is found in slums/underserved areas of Lahore (66%), Gujranwala (55%) and Peshawar (54%). The lowest percentage of public welfare schemes is found in Quetta (11%). Highest percentage of public welfare schemes is found in slums of Peshawar (54%), Islamabad (43%) and Gujranwala (49%). The lowest availability is found in slums of Quetta (12%). The majority of Public welfare schemes include loan schemes, stipend schemes, social benefit card and vocational skills schemes. (Table 32 Annex 4). The percentage of public welfare schemes in underserved areas is higher (61%) than slums (40%). The highest percentage of public welfare schemes is found in underserved area of Lahore (80%), Gujranwala (59%) and Faisalabad (46%). The lowest availability of public welfare schemes is found in underserved areas of Multan (27%) and Islamabad (29%). No public welfare schemes are found in underserved areas of Quetta.
Table 38: Availability of Public Welfare Schemes Cities Slums Underserved Total
Faisalabad 33% 46% 41%
Gujranwala 49% 59% 55%
Lahore 41% 80% 66%
Multan 37% 27% 34%
Rawalpindi 38% 35% 37%
Islamabad 43% 29% 40%
Quetta 12% 0% 11%
Peshawar 54% 41% 54%
Total 40% 61% 49%

30
Chapter 4 Health Resources in Union Councils
76% 478 UCs have
either Slum or
Underserved Areas
26% 165 UCs are Without
EPI Facilities
31% 196 UCs are Without
Public Health
Facilities
37% 230 UCs are Without
Nutrition Services
25% 159 UCs are not
Covered by Lady
Health Workers

31
Chapter 4: Health Resources in Union Councils
Administratively, Pakistan is sub divided into four provinces and federally administered areas including Islamabad, Azad Kashmir and Gilgit Baltistan. These provinces are sub-divided into districts, which are further divided into tehsils/towns. The latter are split into smaller administrative structures called UCs. Depending on the context and rural/urban settings of each province, each UC has approximately 5-15 villages/areas located within them. Headed by the UC Secretary, each UC has a UC office and has at his disposal, certain resources for the development of villages/areas of that particular UC. These resources are directly correlated to the performance output of that particular UC. This chapter is focused on the status of health resources of 626 UCs of eight cities of three provinces namely Punjab (Lahore, Gujranwala, Multan, Faisalabad and Rawalpindi), Khyber Pakhtunkhwa (Peshawar), Balochistan (Quetta) and Islamabad. For each city, the data has been collected from the District Health Department with heavy reliance on the data provided by District EPI Coordinator/ DOH Preventive and District Supervisor Vaccination (DSV). The prevalent situation of health resources at the level of UC is split into the following sub-topics: 4.1 Administrative Lay Out 4.1.1 UCs with/without
Slums/Underserved Areas 4.2 Health Facilities 4.2.1 UCs with/without Health
Facilities, 4.2.2 Number of health Facilities
Vs. UCs 4.3 EPI Facilities 4.3.1 UCs with/without EPI
Facilities 4.3.2 Number of EPI Facilities
Vs. UCs 4.3.3 Outreach Vaccination 4.3.4 Cold Chain 4.4 Nutrition Services 4.4.1 Presence of Nutrition Services 4.4.2 Types of Nutrition Services 4.5 Human Resources 4.5.1 Vaccinators Per EPI Facilities 4.5.2 Lady Health Workers 4.5.3 Dengue Workers
4.1 Administrative Lay Out
The eight largest cities are administratively distributed into 31 towns and 626 UCs. 76% of 626 UCs house slums/underserved areas. Highest spread of slums/underserved areas across UCs is found in Gujranwala (91%) and lowest spread of slums/underserved areas across UCs is found in Quetta (44%). More than 70% of UCs of seven cities house slums/underserved areas.
Table 39: UCs with/without Slums/Underserved
Cities Towns Total UCs UCs With Slums & Underserved
Faisalabad 4 113 86 76%
Gujranwala 4 64 58 91%
Lahore 10 166 127 77%
Multan 4 50 36 72%
Rawalpindi 3 60 44 73%
Islamabad NA 26 20 77%
Quetta 2 50 22 44%
Peshawar 4 97 85 88%
Total 31 626 478 76%

32
Although, the spread of slums/ underserved areas are higher in some cities but their population sizes are lower. For example 91% UCs of Gujranwala (1.4 Million) house slums/ underserved areas but their population size is lower than Peshawar (1.5 Million) where 88% UCs house slums/ underserved areas. Similarly, 77% UCs of Islamabad house slums/ underserved areas but their population size is lower than Quetta where 44% UCs house slums/ underserved areas. From the above facts, it can be concluded that the spread of slums/underserved areas across UCs may not always be linked with greater population size.
4.2 Health Facilities
4.2.1 UCs with/without Health Facilities On the whole, 31% UCs do not have public health facilities. Within 05 cities of Punjab, the city that contributes the most to this percentage is Gujranwala with 70% of its UCs not having such facilities. This is followed by 54% UCs not having public health facilities in Faisalabad and 53% of Rawalpindi. On the other end of the spectrum lies Lahore, having only 04% of UCs devoid of any such facilities. About less than a quarter of the UCs in Peshawar (18%) and Quetta (20%) are found without health facilities. Of the 31% UCs where no public health facilities are found, residents are expected to visit and access services of health facilities located in other UCs. It is important to know that density of population and distances to and from health facilities are important considerations for making decision about the establishment of public health facilities. For example, the population density in Quetta is very low compared to that of 05 cities of Punjab. Similarly, distances to and from health facilities in Quetta are greater than distances of 05 cities of Punjab. 4.2.2 Health Facilities Vs UCs Overall, there are 578 Public Health facilities located in 430/626 UCs. The highest number of such facilities is located in Lahore (217) followed by Peshawar (110) and Quetta (63). Gujranwala (29) and Islamabad (30) has the lowest number of public health facilities. It is important to have at least one public health facility in each UC, which is not the case for 07 cities except Lahore where only 02 UCs remain without any public health facility.
Table 40: Population of Slums/Underserved
Cities
UCs With Slums/ Underserved
Population of total Slums/Underserved
# %
Faisalabad 86 76% 1,340,376
Gujranwala 58 91% 1,469,550
Lahore 127 77% 4, 650, 254
Multan 36 72% 923,520
Rawalpindi 44 73% 966,999
Islamabad 20 77% 379,640
Quetta 22 44% 712,404
Peshawar 85 88% 1,532,478
Total 478 76% 11,975,221
Table 41: UCs with/without Health Facilities
Cities # of UCs with Health
Facilities # of UCs without Health Facilities
Faisalabad 52 46% 61 54%
Gujranwala 19 30% 45 70%
Lahore 160 96% 6 4%
Multan 34 68% 16 32%
Rawalpindi 28 47% 32 53%
Islamabad 17 65% 9 35%
Quetta 40 80% 10 20%
Peshawar 80 82% 17 18%
Total 17 65% 196 31%
Table 42: Health Facilities Vs. UCs
Cities Total UCs # of Public Health Facilities in
Total UCs
Faisalabad 113 52
Gujranwala 64 29
Lahore 166 217
Multan 50 45
Rawalpindi 60 32
Islamabad 26 30
Quetta 50 63
Peshawar 97 110
Total 626 578

33
4.3 EPI Facilities
4.3.1 UCs with/without EPI Facilities Overall, 26% UCs do not have any EPI facilities. Within 05 cities of Punjab, the trend is mainly driven by Gujranwala with 72% UCs not having EPI facilities. On the other hand, Lahore is the only city in which all UCs have EPI facilities available within them. About half of the UCs of Rawalpindi (52%) is devoid of EPI facilities. 4.3.2 EPI Facilities Vs. Union Councils There are a total of 592 EPI facilities located in 461 UCs. Within 05 cities of Punjab, more than half of the (220) EPI facilities are located in Lahore whereas the lowest number of such facilities is found in Gujranwala (18). 165 UCs across eight cities are devoid of any EPI facilities. Highest number of UCs without EPI facilities is found in Gujranwala (72%), Rawalpindi (52%) and Faisalabad (45%). A small percentage of Peshawar (3%) and Quetta (18%) are devoid of any EPI facility while more than quarter of the UCs in Islamabad (31%) and Multan (32%) are devoid of EPI facilities. It is important to know that the total population of 08 cities is 24 Million and on average, each EPI facility has a load of 40540 persons. It is extremely important to improve the service delivery gap in the largest cities of Pakistan to improve the access of common people especially those residing in slums/underserved areas to EPI facilities. Although the average population per EPI facility in Quetta seems lowest but the distances and low population density requires more EPI facilities than the current number. 4.3.3 Outreach Vaccination Overall 98% UCs have outreach vaccination services available within them. Five cities of Punjab and Peshawar and Quetta have 100% outreach vaccination services available at the UC level. Only 62% UCs of Islamabad have outreach services available to them. It is important to know that 29% slums/underserved areas are devoid of any outreach vaccination services. It is important to assess the effectiveness of outreach vaccination from the percentage of unimmunized and under immunized children in slums/underserved areas (see results of coverage survey in slums/ underserved areas of 10 largest cities of Pakistan). 4.3.4 Cold Chain Overall, 98% EPI facilities have functional Ice Lined Refrigerators available within them. All EPI facilities located in five cities of Punjab, Quetta and Peshawar have functional Ice Lined Refrigerators available within them. In some instances, it is possible that the proper functionality of ILRs is disrupted by frequent power breakdowns.
Table 43: UCs with/without EPI Facilities
Cities UCs with EPI
Facilities UCs without EPI
Facilities
Faisalabad 62 55% 51 45%
Gujranwala 18 28% 46 72%
Lahore 165 99% 1 1%
Multan 34 68% 16 32%
Rawalpindi 29 48% 31 52%
Islamabad 18 69% 8 31%
Quetta 41 82% 9 18%
Peshawar 94 97% 3 3%
Total 461 74% 165 26%
Table 44: EPI Facilities Vs. UCs
Cities Total UCs # of EPI Facilities in Total
UCs
Faisalabad 113 67
Gujranwala 64 18
Lahore 166 220
Multan 50 45
Rawalpindi 60 29
Islamabad 26 24
Quetta 50 69
Peshawar 97 120
Total 626 592
Table 45: Outreach Vaccination Services Cities Availability of Outreach Vaccination Services
Faisalabad 113 100%
Gujranwala 64 100%
Lahore 166 100%
Multan 50 100%
Rawalpindi 60 100%
Islamabad 16 62%
Quetta 50 100%
Peshawar 97 100%
Total 616 98%
Table 46: Status of Functional ILR
Cities EPI facilities with Functional ILR
EPI facilities with Non Functional ILR
Faisalabad 67 100% 0 0%
Gujranwala 18 100% 0 0%
Lahore 220 100% 0 0%
Multan 45 100% 0 0%
Rawalpindi 27 93% 2 7%
Islamabad 24 100% 0 0%
Quetta 111 93% 9 8%
Peshawar 67 97% 2 3%
Total 579 98% 13 2%

34
4.4 Nutrition Services
4.4.1 Presence of Nutrition Services Overall, 50% UCs have nutrition services in 4 cities namely Multan (68%), Peshawar (66%), Faisalabad (56%) and Islamabad (50%). Nutrition services are not available in 37% UCs. This is primarily driven by Quetta (82%) and Gujranwala (70%) being devoid of such services. On the other extreme, all UCs of Lahore (100%) have nutrition services available within them.
4.4.2 Types of Nutrition Services Overall, there are four types of nutrition services being offered:
Fixed Sites
Temporary Sites
School Sessions
Sessions by LHWs 4.4.2a Fixed Sites Overall, half of the UCs of Multan (68%), Faisalabad (56%) and Rawalpindi (47%) have fixed nutrition services. Around quarter of the UCs of Islamabad (19%) have fixed nutrition site. A very small percentage of UCs in Quetta (2%) has these services available. None of the UCs of Peshawar has fixed nutrition sites available within it. 4.4.2b Sessions by LHWs Overall, 42% UCs have nutrition services by LHWs. More than half of the UCs of Lahore (87%), Peshawar (66%) and Rawalpindi (47%) have nutrition services by LHWs. Multan, Gujranwala and Faisalabad does not offer any nutrition services by LHWs. (Table 9 Annex 5). 4.4.2c School Sessions Three cities namely Lahore (13%), Quetta (7%) and Peshawar (2%) offer school nutrition sessions. None of the other city has school nutrition sessions. 4.4.2d Temporary Sites Only Quetta (18%) city have temporary nutrition sites available. None of the other seven cities have temporary sites for nutrition services. 4.5 Human Resources 4.5.1 Vaccinators The number of vaccinators to be deployed for each EPI facility is dependent on the type of health facility where the EPI facility in question is housed. Health facilities operating at a secondary or tertiary level have a higher number of vaccinators as these are expected to cater to a larger number of patients and caregivers. A total of 931 vaccinators are working within 592 EPI facilities. On average, there are 1.6 vaccinator available per EPI facility. Within Punjab, Lahore takes the lead with a total of 356 vaccinators followed by Peshawar (246) and Quetta (120) while the lowest number is contributed by Gujranwala having a merely 19 vaccinators and Rawalpindi having 29 vaccinators.
Table 47: Nutrition Services
Cities UCs with Nutrition
Services UCs without Nutrition
Services
Faisalabad 63 56% 50 44%
Gujranwala 19 30% 45 70%
Lahore 166 100% 0 0%
Multan 34 68% 16 32%
Rawalpindi 28 47% 32 53%
Islamabad 13 50% 13 50%
Quetta 9 18% 41 82%
Peshawar 64 66% 33 34%
Total 396 63% 230 37%
Table 48: Types of Nutrition Services
Cities Fixed Sites School Session
Sessions by LHWs
Faisalabad 56% 0% 0%
Gujranwala 30% 0% 16%
Lahore 7% 13% 87%
Multan 68% 0% 0%
Rawalpindi 47% 0% 47%
Islamabad 19% 0% 31%
Quetta 2% 18% 18%
Peshawar 0% 2% 66%
Total 26% 5% 42%
Only Quetta have (18%) temporary nutrition sites
Table 49: Number of Vaccinators
Cities Total EPI Facilities
# of Vaccinators in Total UCs
Faisalabad 67 75
Gujranwala 18 19
Lahore 220 356
Multan 45 45
Rawalpindi 29 29
Islamabad 24 41
Quetta 69 120
Peshawar 120 246
Total 592 931

35
4.5.2 Lady Health Workers Overall, 25% UCs remains uncovered by LHWs. There are total 3793 Lady Health Workers deployed in 75% UCs. Highest percentage of UCs uncovered by LHWs is in Rawalpindi (52%) and Islamabad (46%). A negligible percentage of UCs in Lahore (2%) and Multan (16%) are uncovered by LHWs. 4.5.3 Dengue Workers Overall, dengue workers are available in 92% UCs of 6 cities. 100% UCs of 05 cities of Punjab and Peshawar have dengue workers. Since dengue is not an issue for Quetta therefore, department of health have not deployed any dengue workers. Similarly in Islamabad, temporary staff is deployed during dengue seaso
Table 50: UCs Uncovered by LHWs
Cities Total # of
LHWs Total UCs Uncovered by LHW
Faisalabad 173 44 39%
Gujranwala 64 9 14%
Lahore 1335 3 2%
Multan 265 8 16%
Rawalpindi 135 31 52%
Islamabad 145 12 46%
Quetta 516 19 38%
Peshawar 1160 33 34%
Total 3793 159 25%
Table 51: Dengue Workers Cities UCs with Dengue Workers
Faisalabad 113 100%
Gujranwala 64 100%
Lahore 166 100%
Multan 50 100%
Rawalpindi 60 100%
Islamabad NA NA
Quetta 0% 0%
Peshawar 97 100%
Total 550 92%
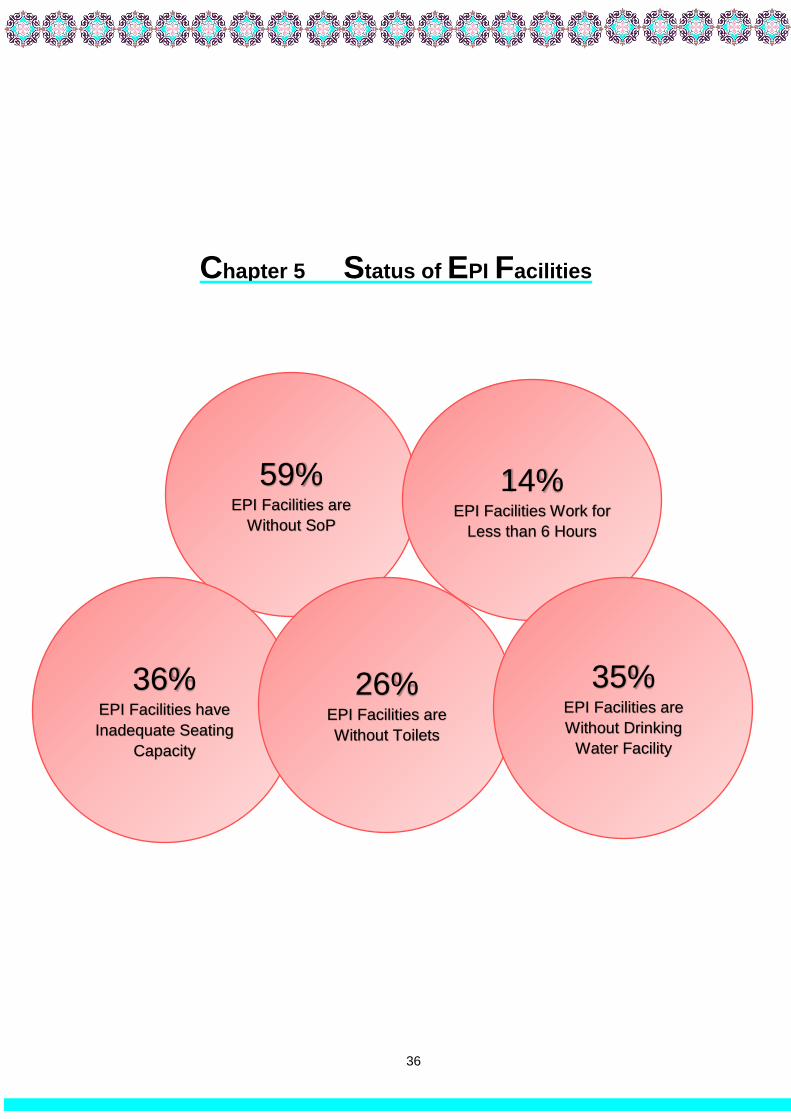
36
Chapter 5 Status of EPI Facilities
59% EPI Facilities are
Without SoP
36% EPI Facilities have
Inadequate Seating
Capacity
14% EPI Facilities Work for
Less than 6 Hours
26% EPI Facilities are
Without Toilets
35% EPI Facilities are
Without Drinking
Water Facility

37
Chapter 5: Status of EPI Facilities
In Pakistan, vaccine service delivery for children and women is being offered through EPI facilities, outreach camps and mobile services according to the systems and procedures of each Provincial EPI Cell. The previous chapters describe the situation of slums/underserved areas and availability of health resources in the Union Councils of 08 largest cities of Pakistan. Chapter 4 clearly articulates that besides availability of health and EPI facilities at the Union Council levels, their access and utilization at the slum/underserved areas are very low. This chapter amplifies the situation of 422 EPI facilities located across largest cities of three provinces and Islamabad based on the physical assessment. The overall objectives of the assessment of EPI facilities were to know the strengths and weaknesses of the service delivery system and analyze correlations between coverage rates and strengths and weakness of the system. The physical assessment of 422 EPI facilities checked the following variables: 5.1 Infrastructure 5.1.1 Ownership of Buildings 5.1.2 Waiting Areas 5.1.3 Drinking Water 5.1.4 Toilets
5.2 System 5.2.1 Standard Operating Procedures 5.2.2 Working Hours
5.3 Equipment and Supplies 5.3.1 Ice Line Refrigerators 5.3.2 Supplies 5.3.3 Vaccines
5.4 Waste Management 5.4.1 Types of Practices
5.5 Human Resource 5.5.1 Vaccinators 5.5.2 Lady Health Visitors These EPI facilities have various levels i.e. some of them are EPI facility while some of them are either housed in Basic Health Units and or tertiary/secondary level hospitals. A small percentage of EPI facilities are housed in Private and or Welfare health facilities but run and managed by government. 5.1 Infrastructure
5.1.1 Ownership of Buildings Overall, 85% buildings of EPI facilities are owned by the government, while 15% facilities are either present in rented buildings or housed in private or welfare health facilities. 100% EPI facilities in Faisalabad and Rawalpindi are owned by the government. Majority of the EPI facilities of Quetta (93%), Lahore (94%), Islamabad (79%) and Peshawar (78%) are also owned by government, while the about half of the facilities in Gujranwala (50%) and Multan (57%) are housed in rented/ or private buildings.
50%
57%
78%
79%
93%
94%
100%
100%
85%
50%
43%
22%
21%
7%
6%
0%
0%
15%
GJR
MTN
PWR
IBD
QTA
LHR
RWP
FSD
Total
Rented/Housed in Private/Welfare Owned
Figure 4: Ownership Status of Buildings of EPI Facilities

38
Overall, out of the 15% EPI facilities, which are located in the rented buildings or in Private/welfare health facilities, 96% are run and managed by government. 100% EPI facilities in five cities of Punjab are run and administered by the government while 21% EPI facilities of Islamabad are located in privately owned hospital and 4% EPI facilities are housed in charity/trust set up. Whereas, 4% EPI facilities in Quetta and 2% EPI facilities in Peshawar are being run by a charity organization (Table 3 and Annex 6). 5.1.2 Waiting Areas The waiting areas of the EPI facilities were assessed for two main parameters, which include availability of adequate space and gender-segregated space for women. The cultural and religious requirements demand for a gender segregated waiting area especially for women caregivers. 5.1.2a Gender Mixed Waiting Areas
Two cities namely Peshawar and Quetta have relatively higher preferences for gender-segregated services. Overall, 59% EPI facilities do not have gender segregated waiting areas. Highest percentage of EPI facilities in Gujranwala (78%), Lahore (73%) and Faisalabad (65%) report about the unavailability of gender segregated waiting areas. Over half of the EPI facilities in Islamabad (54%), Peshawar (52%) and Quetta (52%) also report about unavailability of gender segregated waiting areas. Only Rawalpindi (42%) and Multan (40%) have relatively better situation where less than half of the waiting areas are not gender segregated. 5.1.2b Inadequate Seating Capacity Overall 36% EPI facilities have inadequate seating capacity in their waiting areas. Over 30% EPI facilities of seven out of eight cities report about inadequate seating capacity. Highest percentage of EPI facilities with inadequate seating capacity is found in Gujranwala (44%). Lowest percentage of inadequate seating capacity is found in EPI facilities of Islamabad (17%). In order to attract caregivers towards EPI facilities, it is extremely important to ensure caregiver friendly gender segregated adequate seating capacity.
5.1.3 Drinking Water Overall 35% EPI facilities do not have drinking water facility. Highest percentages of EPI facilities that report about unavailability of drinking water are found in three cities of Punjab (Gujranwala - 72%, Multan - 43%, Lahore - 42%) and Quetta (48%). A small percentage of Islamabad (21%) and Peshawar (25%) also report about unavailability of drinking water in their respective EPI facilities.
40% 42%
52% 52% 54%
65%
73%78%
59%
MTN RWP QTA PWR IBD FSD LHR GJR Total
17%
30%32%
37% 37% 37% 38%
44%
36%
IBD MTN RWP LHR QTA PWR FSD GJR Total
12%16%
21%25%
42% 43%48%
72%
35%
FSD RWP IBD PWR LHR MTN QTA GJR Total
Figure 10: Gender Mixed Waiting Areas
Figure 11: Inadequate Seating Capacity
Figure 12: Unavailability of Drinking Water

39
5.1.4 Toilets
5.1.4a Unavailability of Toilets Availability of useable toilets is extremely important for the patients and their attendants. Overall 26% of the total assessed EPI facilities report about unavailability of toilets. Highest percentages of EPI facilities that report about unavailability of toilets are in Rawalpindi (42%). The situation of Peshawar (21%) and Quetta (26%) is comparatively better. The trend varies across cities of Punjab as 100% EPI facilities of Faisalabad have toilet facilities but three cities namely Gujranwala (39%), Lahore (35%) and Multan (33%) report unavailability of toilets in their EPI facilities. 5.1.4b Gender Mixed Toilets From those EPI facilities where toilets are available, it is interesting to put a gender lens on them. Majority of the women in Pakistan feel more comfortable in using gender-segregated toilets. Because of the limited number of toilets in EPI facilities, majority of the toilets are gender mixed. Overall 31% of the total EPI facilities do not have gender-segregated toilets. Highest percentage of EPI facilities without gender-segregated toilets is found in Faisalabad (68%), Gujranwala (44%) and Peshawar (41%). Highest percentage of gender-segregated toilets is available in Islamabad (71%), Quetta (56%) and Multan (50%). Less than 40% toilets in EPI facilities of five out of eight cities are gender segregated. (Table 14 Annex 6). 5.1.4c Unusable Toilets
In EPI facilities where toilets are available 14% are not usable. Highest percentage of unusable toilets is found in Peshawar (27%), Multan (20%) and Gujranwala (17%). None of toilets of EPI facilities of Rawalpindi (0%) are unusable. Less than 15% toilets are unusable in EPI facilities of four cities namely Quetta (13%), Islamabad (9%), Lahore (8%) and Faisalabad (6%). The low usability of toilets is because of multiple factors including unavailability of water, filthiness or physical damage of toilet facility.
0%
8%
21%
26%
33%35%
39%42%
26%
FSD IBD PWR QTA MTN LHR GJR RWP Total
11%17% 19% 21%
25%
41%44%
68%
31%
RWP MTN QTA IBD LHR PWR GJR FSD Total
Gender Mixed Toilets
0%
6%8%
9%
13%
17%
20%
27%
14%
RWP FSD LHR IBD QTA GJR MTN PWR Total
Figure 5: Unavailability of Toilets
Figure 14: Gender Mixed Toilets
Figure 15: Unusable Toilets

40
5.2 Systems
5.2.1 Standard Operating Procedures Standard Operating Procedures (SoP) guide facility staff about the quality standards and help them avoid malpractices thus availability of SoP is a basic step towards its compliance. Overall SoPs are not available in 59% of the total assessed EPI facilities. Gujranwala (89%), Islamabad (83%) and Quetta (81%) have the highest percentage of EPI facilities without SoPs. The lowest percentage of EPI facilities in Faisalabad (21%), report unavailability of SoPs.
5.2.2 Working for Less than 6 Hours The EPI facilities usually work for 08 hours a day. Two hours are dedicated for the working of vaccinators for record keeping while 06 hours are dedicated for the provision of vaccination services. Overall 14% of the assessed EPI facilities work for less than 6 hours a day. EPI facilities of six out eight cities report about their working for less than 6 hours per day. Highest percentage of EPI facilities in Quetta (69%) work for less than 6 hours. About a quarter of EPI facilities of Islamabad also report working for less than 6 hours a day. A very small percentage of assessed EPI facilities of Gujranwala (6%), Lahore (2%), Rawalpindi (5%) and Peshawar (9%) report about their working duration for less than 6 hours a day.
5.3 Equipment and Supplies
5.3.1 Non Functional Ice Lined Refrigerators Overall only 3% Ice lined refrigerators are found non functional in total assessed EPI facilities. City wise comparison reflects a small percentage of EPI facilities in Rawalpindi (11%) and Peshawar (08%) and Quetta (04%) with non-functional ILR. EPI facilities of five cities have functional ILR. There are multiple reasons of non-functional ILR such as technical damage or power break down. It is important to ensure proper cold chain in all available EPI facilities to continue uninterrupted quality provision of vaccine service delivery. 5.3.2 Availability of Supplies As per SoPs, EPI facilities are supposed to have full stock of vaccines and its related supplies for ensuring uninterrupted vaccination service provision. Availability of the important supplies namely ice packs, vaccine carrier, safety boxes and auto disable syringes were checked while assessing 422 EPI facilities.
21%
51%55%
63%67%
81% 83%89%
59%
FSD LHR PWR RWP MTN QTA IBD GJR Total
0% 0% 2%5% 6%
9%
25%
69%
14%
MTN FSD LHR RWP GJR PWR IBD QTA Total
0%
0%
0%
0%
0%
4%
8%
11%
3%
GJR
MTN
FSD
LHR
IBD
QTA
PWR
RWP
Total
Figure 16: Standard Operating Procedures
Figure 17: Working for Less than Six Hours
Figure 6: Non Functional ILR

41
5.3.2a Ice Packs Overall 3% EPI facilities report about shortage of ice packs from five cities. These are Rawalpindi (11%), Quetta (7%), Multan (10%), Peshawar (2%) and Lahore (2%). 5.3.2b Vaccine Carrier Overall 2% EPI facilities report about shortage of vaccine carrier from four cities. These are Rawalpindi (11%), Peshawar (1%), Quetta (2%) and Lahore (2%). 5.3.3c Safety Boxes Overall 1% EPI facilities report about shortage of safety boxes from only one city Peshawar (3%). All other facilities have safety boxes available. 5.3.4d Auto disable Syringes Overall 4% EPI facilities report about shortage of auto disable syringes from four cities infrequently. These are Rawalpindi (21%), Peshawar (9%), Gujranwala (6%) and Islamabad (4%).
5.3.2b Vaccines In order to ensure, uninterrupted vaccination service provision, it is important to ensure sufficient stock of vaccine at all times. Although majority of EPI facilities report no shortage of vaccine, a small percentage report about frequent and infrequent shortage of vaccines. Overall only 1% EPI facilities report frequent shortage of vaccines from Quetta (6%) and Peshawar (2%) only and infrequent shortage of vaccine from four cities namely Gujranwala (83%), Quetta (29%) and Peshawar (14%).
5.4 Waste Management
Waste management of supplies is extremely important and it has to be done according to the laid down SoP to avoid the misuse of syringes. Majority of the EPI facilities (98%) report burning and burial of the waste as a waste management practice. A small percentage of EPI facilities in Multan (20%) and Lahore (2%) report about the waste pick up system by Waste Management Company (WMC) vehicle.
79%
91%
94%
96%
100%
100%
100%
100%
96%
100%
97%
100%
100%
100%
100%
100%
100%
99%
89%
99%
100%
100%
98%
100%
100%
98%
98%
89%
98%
100%
100%
93%
90%
100%
98%
97%
RWP
PWR
GJR
IBD
QTA
MTN
FSD
LHR
Total
Auto Disable Syringes Safety BoxesVaccine Carrier Ice Packs
0% 0% 0% 0%3%
14%
29%
83%
12%
0% 0% 0% 0% 0% 2%6%
0% 1%
RWP MTN LHR IBD FSD PWR QTA GJR Total
Sometimes Shortage Mostly Shortage
80%
98%
100%
100%
100%
100%
100%
100%
98%
20%
2%
0%
0%
0%
0%
0%
0%
2%
MTN
LHR
GJR
RWP
FSD
IBD
QTA
PWR
Total
Waste Management
WMC Vehicle
Burn & Buried
Figure 19: Availability of Supplies
Figure 20: Shortage of Vaccine
Figure 21: Waste Management Practices

42
5.5 Human Resource
5.5.1 Vaccinators Overall 99% EPI facilties report availability of one or more vaccinators in seven out of eight cities. The number of vaccinator for each EPI facility varies but at least one vaccinator is available in 100% assessed EPI facilities. A small percentage of EPI facilities of Islamabad (12%) do not have vaccinators. It is important to know that the number of vaccinators for each facility varies according to its administrative status and population of the UC where this facility is located. EPI facilities located in secondary or tertiary hospitals have more than one vaccinator hence large number of children can be catered on a daily basis.; 5.5.2 Lady Health Visitors The deployment of Lady Health Visitors (LHVs) is done according to the administrative level of each health facility. EPI facilities housed in secondary and tertiary hospitals and Basic Health Unit may have deployment of LHVs but an independent EPI Facility may not have deployment of LHVs under the administrative system. Primary purpose of the LHV in any of the health facilities is to offer maternal child health care, but they are also made responsible for the vaccination as well. 39% EPI facilities do not have LHVs hence maternal health services are not available in these EPI facilities. Highest percentage of LHVs in EPI facilities is found three cities namely Islamabad (79%), Faisalabad (76%) and Rawalpindi (74%). Lowest percentage of EPI facilities with LHVs is found in Gujranwala (22%).
22%
57% 59% 60%64%
74% 76% 79%
61%
GJR LHR QTA MTN PWR RWP FSD IBD Total
88%
100% 100% 100% 100% 100% 100% 100%99%
IBD QTA GJR RWP MTN FSD LHR PWR Total
Figure 22: Availability of Vaccinators
Figure 23: Availability of Lady Health Visitors

43
Chapter 6 Situation in Super High Risk Union Councils
88% Super High Risk UCs
are With Slums/
Underserved Areas
92% Slums/ Underserved
Areas Reported Non
Presence of EPI
Facility
56% Slum/ Underserved
Areas are Not
Covered by LHWs
41% Children in
Slums/Underserved
are Partially
Vaccinated
21% Children in
Slums/Underserved
Areas Are Zero Dose

44
Chapter 6: Situation in Super High Risk Union Councils
The detailed analysis of union councils for polio high risk segregates 40 UCs as Super High Risk due to certain factors, which requires context specific planning for improving the situation. 32 of the 40 UCs are located in three largest cities of Pakistan namely Karachi, Peshawar, Quetta. This chapter compiles information for Super High Risk UCs (SHRUCs) extracted from the following three sources: a. Profiling of slums/underserved areas held in 10 largest cities of Pakistan (Chapter 3); b. Coverage survey in slums/underserved areas of 10 largest cities of Pakistan. The report
for coverage survey held in slums/underserved areas of 10 largest cities of Pakistan exist separately.
c. Data of health resources of SHRUCs collected from the department of health (Chapter 4) The data for profiling of slums and SHRUCs of Karachi is extracted from the separate report on profiling of slums of Karachi and Hyderabad81. The objective of this chapter is to present the key highlights of SHRUCs with the above stated data sets. The following variables are analysed and presented: 6.1 Health Resources in SHRUCs 6.1.1 Number Health Facilities 6.1.2 SHRUCs with/without Health Facilities 6.1.3 Number of EPI Facilities 6.1.4 Number of Vaccinators 6.1.5 SHRUCs with/without EPI Facilities 6.1.6 SHRUCs with/without Outreach Vaccination 6.1.7 SHRUCs with/without LHWs 6.2 Slums/Underserved Areas Located in SHRUCs 6.2.1 SHRUCs with/without Slums/Underserved Areas 6.2.2 Slums/Underserved Areas in SHRUCs 6.2.3 Types of Residents in Slums/Underserved Areas 6.2.4 Population of Slums/Underserved Areas 6.2.5 Slums/Underserved Areas Uncovered by LHWs 6.2.6 Slums/Underserved Areas with/without Health Facilities 6.2.7 Slums/Underserved Areas with/without EPI Facilities 6.2.8 Slums/Underserved Areas with/without Outreach Vaccination 6.3 Status of Childhood Vaccination 6.3.1 Sample Size 6.3.2 Retention of Vaccination Card 6.3.3 Fully Immunized 6.3.4 Partially Vaccinated 6.3.5 Zero Dose 6.3.6 Reasons of Zero Dose The above stated variables are analysed specifically for 32 SHRUCs located in three cities namely Peshawar, Quetta and Karachi.
6.1 Health Resources of SHRUCs
6.1.1 Health Facilities 32 SHRUCs have 45 health facilities. When number of health facilities is compared with the number of SHRUCs, it shows highest number of health facilities in Karachi where 8 SHRUCs
81 Profiling of slums in Karachi and Hyderabad was done in 2017
Table 52: Health Facilities in SHRUCs Cities Number of SHRUCs Number of Health Facilities
Peshawar 18 22
Quetta 6 9
Karachi 8 14
Total 32 45

45
have 14 health facilities. Quetta has the lowest number of health facilities where 6 SHRUCs have only 9 health facilities. 6.1.2 SHRUCs with/without Health Facilities Although 45 health facilities are found for 32 UCs but a deeper analysis reflects 16% SHRUCs are without any health facility. About a quarter of the SHRUCs of Karachi (33%) and Peshawar (20%) are found without Public health facilities. None of the SHRUCs of Quetta are found without health facility. 6.1.3 EPI Facilities 32 SHRUCs have 55 EPI facilities. When number of EPI facilities is compared with the number of SHRUCs, it shows highest number of EPI facilities in Karachi where 8 SHRUCs have 22 EPI facilities. Peshawar has lowest number of health facilities where 18 SHRUCs have 24 EPI facilities while 6 SHRUCs of Quetta have only 9 EPI facilities. Number of EPI facilities per UC is determined according to the population size and distances to and from residential areas. 6.1.4 SHRUCs with/without EPI Facilities 55 EPI facilities are found for 32 SHRUCs. None of SHRUCs are without any EPI facility. It would be interesting to analyse the following two factors to assess the appropriateness of the number of EPI facility per UC: (a) Population of each UC; (b) distance of residential areas to and from EPI facility location and duration. 6.1.5 Number of Vaccinators Overall 79 vaccinators are working in 55 EPI facilities located in 32 SHRUCs. Highest number of vaccinators is found in EPI facilities of Peshawar (47) while lowest number of vaccinators is found in EPI facilities of Karachi (14). 6.1.6 SHRUCs with/without Outreach Vaccination None of the SHRUCs of three cities are found without outreach vaccination. The low vaccination coverage and polio high risk factor in these SHRUCs imply either service delivery has some gaps or caregivers are unaware of importance of vaccination and component on demand generation is weak. 6.1.7 SHRUCs with/without LHWs Coverage Overall 78% SHRUCs have deployment of LHWs while a small percentage of SHRUCs in Quetta (33%) and Peshawar (28%) are without deployment of LHWs. LHWs are important health resource which may play an important role in demand generation and reduce number of refusals through their house to house mobilization.
Table 53: SHRUCs with/without Health Facilities
Cities SHRUCs with Health Facilities
SHRUCs without Health Facilities
Total SHRUCs
Peshawar 15 3 18
Quetta 6 0 6
Karachi 6 2 8
Total 27 5 32
% 84% 16% 100%
Table 54: Number of EPI Facilities in SHRUCs Cities Number of SHRUCs Number of EPI Facilities
Peshawar 18 24
Quetta 6 9
Karachi 8 22
Total 32 55
Table 55: SHRUCs with/without EPI Facilities Cities SHRUCs with
EPI Facilities SHRUCs without EPI Facilities
Total SHRUCs
Peshawar 18 0 18
Quetta 6 0 6
Karachi 8 0 8
Total 32 0 32
% 100% 0% 100%
Table 56: Number of Vaccinators Vs. Number of EPI Facilities
Cities Number of EPI Facilities
Number of Vaccinators
Peshawar 24 47
Quetta 9 18
Karachi 22 14
Total 55 79
Table 57: SHRUCs with/without Outreach Vaccination Cities SHRUCs with
Outreach SHRUCs without Outreach
Total SHRUCs
Peshawar 10 0 18
Quetta 6 0 6
Karachi 8 0 8
Total 32 0 32
% 100% 0% 100%
Table 58: SHRUCs with/without LHWs Coverage
Cities SHRUCs with LHWs
SHRUCs without LHWs
Total SHRUCs
Peshawar 13 5 18
Quetta 4 2 6
Karachi 8 0 8
Total 25 7 32
% 78% 22% 100%

46
6.2 Slums/Underserved Areas
6.2.1 SHRUCs with/without Slums/Underserved Areas Overall 88% SHRUCs house slums/underserved areas. A small percentage of SHRUCs in Peshawar and Quetta do not have slums/underserved areas while 100% SHRUCs of Karachi are with slums/underserved areas. It is important to know the number of slums/underserved areas and target population residing in these areas for effective planning. 6.2.2 Slums/Underserved Areas in SHRUCs 28 SHRUCs house 299 slums/underserved areas. Highest number of slums/underserved areas is found in Quetta (120) followed by Peshawar (102). The concentration of slums/underserved areas in relation to the number of SHRUCs shows highest concentration in Quetta where 120 slums/underserved areas exist in 6 UCs only while Karachi has the lowest concentration where 77 slums exist in 8 UCs. It is important to know that the size of slums/underserved areas varies in each city. A city may have a smaller number of slums/underserved areas but high population size. For example Karachi has the lowest number of slums (77) while population size of slums is highest amongst all three cities (6.2.4). 6.2.3 Types of Residents82 in Slums/Underserved Areas Majority of the residents of slums/underserved areas are permanent settlers (70%). More than quarter of the residents of slums/underserved areas in Peshawar (29%) are temporary displaced and another 9% residents belong to other Nationalities. Similarly slums/underserved areas of Quetta have highest percentage for permanent settlers (86%) and lowest percentages for temporary displaced (7%) and residents belonging to other Nationalities (7%). 6.2.4 Population of Slums/Underserved Areas Approximate population of slums/underserved areas is about 1 Million. Although lowest number of slums/underserved areas are found in 8 SURUCs of Karachi but the population size is highest here. The population size of slums/underserved areas of Peshawar and Quetta have 0.2 Million people. 6.2.5 Slums/Underserved Areas Uncovered by LHWs Overall 44% slums/underserved areas are covered by LHWs with highest percentage in Peshawar (52%). Almost 70% slums/underserved areas in Quetta and 45% slums/underserved areas in Karachi are not covered by LHWs.
82 This information is not available for Karachi
Table 59: SHRUCs with/without Slums/Underserved Cities SHRUCs SHRUCs with
Slums/ Underserved
SHRUCs without Slums/ Underserved
Peshawar 18 15 3
Quetta 6 5 1
Karachi 8 8 0
Total 32 28 4
% 100% 88% 12%
Table 60: Slums/Underserved Areas in SHRUCs
Cities Slums Underserved Total
Peshawar 102 0 102
Quetta 110 10 120
Karachi 77 0 77
Total 289 10 299
Table 61: Types of Residents in Slums/Underserved
Cities Permanent Temporary Displaced
Other Nationality
Peshawar 62% 29% 9%
Quetta 86% 7% 7%
Total 70% 21% 9%
Karachi This information was not collected while profiling slums
Table 62: Population of Slums/Underserved Areas
Cities Slums Underserved Total
Peshawar 281,813 0 281,813
Quetta 177,684 43,480 221,164
Karachi 510,993 0 510,993
Total 970,490 43,480 1,013,970
Table 63: Slums/Underserved Areas Uncovered by LHWs
Cities LHW Covered LHW Uncovered Total
Peshawar 52% 48% 100%
Quetta 30% 70% 100%
Karachi 55% 45% 100%
Total 44% 56% 100%

47
6.2.6 Slums/Underserved Areas with/without Health Facilities Majority of the slums/underserved areas do not mention about presence of health facilities beyond 2 kilometers radius (94%). A very small percentage in slums/underserved areas of Peshawar (2%), Quetta (3%) and Karachi (14%) mention about presence of health facilities within 2 kilometers radius. 6.2.7 Slums/Underserved Areas with/without EPI Facilities Majority of the slums/underserved areas are without EPI facilities (92%). Residents of 92% slums/underserved areas are expected to travel beyond 2 kilometers to access EPI facilities. A small percentage of slums/underserved areas in Peshawar (5%), Quetta (7%) and Karachi (13%) report about presence of EPI facilities within 2 kilometers radius. 6.2.8 Slums/Underserved with/without Outreach Vaccination Majority of the slums/underserved areas report that they are covered for outreach vaccination 81%). A small percentage of slums/underserved areas in Quetta (27%) and Karachi (31%) report that they are not covered for outreach vaccination.
6.3 Status of Childhood Vaccination
The status of childhood vaccination for slums/underserved areas located in SHRUCs was an integral part of larger coverage survey held in 10 largest cities of Pakistan. A separate report exists for the results of coverage survey. Specific results of childhood vaccination are presented are extracted only for slums/underserved areas of 32 SHRUCs. 6.3.1 Retention of Vaccination Card Overall vaccination card retention is 30% with higher percentage of card retention in boys (54%) compared to girls (46%). Highest card retention is found in slums/underserved areas of Karachi (41%) and lowest card retention is found in slums/underserved areas of Quetta (26%). 6.3.2 Fully Immunized Overall 38% children are found fully immunized based on records and recall basis. Higher percentage of boys (54%) is found fully immunized compared to girls (46%). Highest percentage of fully immunized children is found in slums/underserved areas of Karachi (45%). Lowest percentage of fully immunized children is found in Quetta (21%).
Table 64: Slums/Underserved with/without Health Facilities
Cities With Health Facilities
Without Health Facilities
Total
Peshawar 2% 98% 100%
Quetta 3% 97% 100%
Karachi 14% 86% 100%
Total 6% 94% 100%
Table 65: Slums/Underserved with/without EPI Facilities
Cities With EPI Facilities
Without EPI Facilities
Total
Peshawar 5% 95% 100%
Quetta 7% 93% 100%
Karachi 13% 87% 100%
Total 8% 92% 100%
Table 66: Slums/Underserved with/without Outreach
Cities With Outreach Without Outreach Total
Peshawar 100% 0% 100%
Quetta 73%% 27% 100%
Karachi 69% 31% 100%
Total 81% 19% 100%
Table 67: Retention of Vaccination Card
Cities Girls Boys Total
Peshawar 44% 56% 29%
Quetta 50% 50% 26%
Karachi 46% 54% 41%
Total 46% 54% 30%
Table 68: Fully Immunized (Records+ Recall)
Cities Girls Boys Total
Peshawar 46% 54% 47%
Quetta 49% 51% 21%
Karachi 43% 57% 45%
Total 46% 54% 38%

48
6.3.3 Partially Vaccinated Overall 41% children are found partially vaccinated. Gender difference was not significant for partially vaccinated children in Peshawar and Quetta. In slums/underserved areas of Karachi, a higher percentage of girls (54%) are found partially vaccinated compared to boys (46%). 6.3.4 Zero Dose Overall 21% children are found having no antigens administered. Highest percentage of zero dose are found in slums/underserved areas of Quetta (27%) and lowest percentage of zero dose are found in slums/underserved areas of Karachi (11%). 6.3.5 Reasons of Zero Dose Majority of the mothers (48%) state non-permission as one of the major reasons for not getting their children immunized. City wise analysis of reasons reflects highest intensity of non-permission in slums of Karachi (71%) compared to Quetta (36%) and Peshawar (54%). Intensity of other reasons varies for each city. Other reasons include ‘fear of side effects’, ‘no time for vaccination’ and unaware of vaccination timings etc. All other reasons stated by mothers are highlight low levels of awareness about the importance of immunization.
Table 69: Partially Vaccinated (Records+ Recall)
Cities Girls Boys Total
Peshawar 50% 50% 32%
Quetta 49% 51% 52%
Karachi 54% 46% 44%
Total 50% 50% 41%
Table 70: Zero Dose
Cities Girls Boys Total
Peshawar 51% 49% 21%
Quetta 46% 54% 27%
Karachi 50% 50% 11%
Total 49% 50% 21%
0%
1%
1%
5%
10%
29%
54%
Unaffordability ofTransport Cost
Unaware of Vaccination
Fear of Injection
Unaware of VacinationTimings
No time for Vaccination
Fear of Side Effects
No Permission
Peshawar
3%
10%
11%
12%
16%
17%
36%
Fear of Injection
Fear of Side Effects
Unaware of VacinationTimings
Unaware of Vaccination
No time for Vaccination
Unaffordability ofTransport Cost
No Permission
Quetta
0%
0%
4%
21%
21%
46%
71%
Unaware of Vaccination
Unaware of VacinationTimings
Unaffordability ofTransport Cost
Fear of Injection
No time for Vaccination
Fear of Side Effects
No Permission
Karachi
Figure 24: Reasons of Zero Dose

49
Chapter 7 Conclusion and Recommendations
No Time for Vaccination
Rasheeda, a 27 year old is a mother of Murad (22 months old) lives in a small Kacha house of one room with 10 family members (5 males and 5 females) in Basti Kili Balochabad of Chilton town of Quetta Balochistan. Some part of the Basti is situated in Zarghoun town as well. The other residents of the Basti are mostly Pashtun like her family. There are around 50 households in her Basti with mixed Kacha and Pacca housing structures. Majority of the male population of this Basti work on daily wages. The financial situation of the residents are not good and many families face the situation of only one meal per day due to the unavailability of the wages in different seasons. The hygiene condition of Basti is very poor. Mostly the drains are open and filthy and water is over flowing from the drains. The residents feel difficulty while passing through the street due to the drains water. The toilets also have traditional pits and dirty water mixed in the drains that caused more smell in the area. Small children play in the streets that are very harmful for their health. Although the households’ latrines are available inside the houses but small children often urinate in streets as well. There is also no solid waste management system in the Basti. Residents throw their waste in nearby plot. There is no health center or lady health worker in Basti.
“There is no health center in our Basti and its surroundings and We never saw any LHW in our area. Many of the mothers in our Basti do not have any knowledge about vaccination. My husband is also against the vaccination. We and our forefathers were grown without any vaccination and are healthier than today’s children”.
It is very unfortunate that Murad is not alone in this case there are 15 other children of his age in the Basti who never got any dose of vaccination.

50
Chapter 7: Conclusion and Recommendations
7.1 Conclusion
During 1950-1990, a significant proportion of the slums were formed, a period of rapid urbanization within the country. Even though a high proportion of these vulnerable areas are registered and have Pacca housing structures, a critical analysis of information gathered through profiling reveals that residents of such areas live in despicable conditions with minimal access to basic amenities such as proper sanitation and waste disposal management systems. A significant proportion, especially those residing in slums as compared to those living in underserved areas, have Kacha or Kacha-Pacca (mixed) housing structures in place, thereby making them more vulnerable to unfavorable weather conditions. Regardless of such poor conditions, a significant proportion of the residents have been residing in such areas for more than 2 years with only a negligible percentage of population being temporarily displaced or belonging to other nationalities. The presence of toilets in such areas is common, with only a very minute percentage of slums/underserved areas not having them. With respect to the types of toilets available, nearly half of the available toilets are connected with street drain and the other half is a traditional/open pit toilet. In areas where toilets are not available within their private abode, residents have to rely on other sources for defecation including using neighbor’s toilets, using public toilets or in instances where even these options are unavailable, ultimately resorting to open defecation. The lack of adequate solid and liquid waste disposal systems is commonplace, with a significant proportion of these areas having filthy and choked drains even where they do happen to exist. Dumping of waste on empty plots and streets is a practice adopted by nearly half of the areas surveyed with the other half reporting heavy reliance on government/WMC vehicles for proper waste disposal. Government water supply for domestic consumption purposes is available in only a quarter of slums/underserved areas with the remaining areas resorting to using ground water and acquiring water from tankers. A quarter of slums/underserved areas surveyed did not have any schools available shedding light on the dismal reality that children residing in such areas have to cover long distances by foot to gain education or, in a starker scenario, end up not getting educated at all. Health facility assessments reveal that about a third of the UCs of the 8 cities surveyed are devoid of public health facilities. Even in UCs where these facilities along with EPI facilities are present, the available resources to immunize children are inadequate and fall short of the prerequisite needed to meet the population’s vaccination needs. Furthermore, a very small percentage of these facilities are located within slums/underserved areas highlighting the fact that access to such facilities is limited to those who are most in need of utilizing such facilities’ services. Coupled with financial hardship, lack of accessibility to health facilities plays a pivotal role in resulting low immunization coverage rates of such areas. Nearly half of the UCs has nutrition services available within them with the highest percentage of such services being provided by LHWs followed by fixed nutrition services. Along similar lines, even in areas where EPI facilities are present, they lack the required resources and services to meet the population’s vaccination needs. More than half of the facilities surveyed lack gender segregated waiting areas and gender segregated toilets. This is a cause of concern, especially in provinces such as Peshawar and Quetta where female caregivers may be considerably discouraged to get their children vaccinated due to the lack of such facilities. More than half of these EPI facilities do not have SoPs available when checked at the time of visit indicating the crucial need for an adequate monitoring system to be in place. Even though vaccinators are available in nearly all facilities, LHVs, on the other hand, are available in nearly 60% of facilities only. This proves to be a discouraging factor for female caregivers to visit such facilities and to get their children immunized. In order to counter this problem, it is imperative that the number of LHVs be increased so that their services can be provided to those in need.

51
7.2 Study Limitations
The profiling of slums / underserved areas is done by conducting interactive group interviews. There is a possibility of exaggeration and biased input from the participants due to prevailing group dynamics.
The study provides accurate listing of the slums and provides substantial details on the profiling of the slums. However, since it is a sample-based study, the input from the sample does not precisely represents the true opinion of the entire slum population.
Although the study provides an insight into the water and sanitation conditions of the dwellers of slums/underserved areas, the study does not, in detail covers the hygiene of water in terms of water safety for human consumption. The study also does not cover the poor sanitation related ordeals of the slum dwellers.
The data on existing healthcare facilities has been collected from the department of health. It has been organised and analysed under the existing study but the healthcare facilities (except EPI facilities) located in the union councils, were not physically visited and verified by the study team.
The data presented on EPI facilities is the observation/input of the survey team and information provided by the technical staffs / doctors. The department of health may have different information about EPI facilities in their records.
The profiling of slums/underserved areas was conducted to have a cursory view of the situation therefore participatory groups discussions were conducted in each slum and underserved areas. Since the detailed house-to-house information has not been collected from the residents, some of the information may have exaggeration according to the participants of the group.
The status of vaccinations explored through childhood vaccination coverage survey in the community were not triangulated with the data obtained from fixed EPI facilities through assessment. Therefore, the survey records for recall basis may have some variation.
The childhood vaccination coverage survey was conducted only with mothers of children aged between 12 and 23 months, living in slums/underserved areas. The majority of mothers were either had no formal education or had very low levels of education. Their responses may have some understanding gaps.
Since majority of the respondents of coverage survey were mothers with no formal education therefore the status of vaccination on recall basis has limited reliability.
Since majority of the mothers of zero dose children had no formal education therefore reasons of zero dose may have missed some more aspects.
Almost 75 percent population (slums and underserved areas) has access to school (i.e. access to primary education) in the study areas. However, type and quality of school education had not been assessed.
7.3 Recommendations
The following recommendations are made according to the gaps in health resources and coverage rates in slums/underserved areas. 7.3.1 Health Facilities
Improve access to health facilities by ensuring availability of health and EPI facilities according to the population size and access of majority of the residents.
Improve the availability and accessibility of health and EPI facilities for residents of slums/underserved areas. It is important to utilize the private sector health facilities for improving the access of slums/underserved areas to vaccination services.
7.3.2 Nutrition
Add component of Nutrition services in the current set of health and EPI facilities. This would economize the costs and multiply the impact of vaccination services.
Include topics like balanced diet, assessment of nutrition levels in children and mothers as part of the regular job of LHWs and vaccinators. This would help in enhancing the effectiveness of LHWs and vaccinators working.

52
7.3.3 EPI Facility
Ensure Standard Operating Procedures are updated according to current changes in the system and practices and that the staff is trained and followed up for its adherence.
Standard Operating Procedures is a guiding document for maintaining quality standards for running and managing the EPI facilities. It is extremely important to maintain quality standards according to approved Standard Operating Procedures, which will keep facilities working, more smooth, standardized and regular to attract more caregivers. There is an immediate need to ensure provision of Standard Operating Procedures and its compliance in all fixed EPI and health facilities.
Provide gender specific infrastructure facilities in buildings of EPI facilities. For example, women and men specific waiting areas with adequate seating capacity.
Ensure availability of drinking water, women and men specific functional, clean toilets to facilitate and encourage caregivers for visiting the EPI facilities particularly females.
Ensure timely availability of vaccines and vaccine supplies without any interruption to vaccination services.
7.3.4 Flexibility of Timings
Reconsider total timings and duration for offering vaccination services according to the preference of caregivers. Either introduce flexible hours for the outreach vaccination services according to the availability of residents of slums/underserved areas or introduce double shift system for vaccination services in EPI facilities and ensure availability of vaccination for extended hours as well.
7.3.5 Accountability
Ensure strict accountability and performance management system for the staff of EPI facilities. The EPI facility must operate for 06 hours per day consecutively for 5 days a week.
Introduce performance-based payments together with effective performance management measures. For example, offer non-financial incentives to high performing LHWs and vaccinators such as certificate for best employee. Any LHW or vaccinator securing 12 certificates consecutively could be recommended for salary increments etc. This would improve the coordination and teamwork between LHWs and vaccinators.
Offer periodic performance-based incentives to vaccinators to improve effectiveness of outreach vaccination services.
7.3.6 Outreach Vaccination
Ensure availability of outreach vaccination services in 100% slums/underserved areas.
Undertake awareness raising sessions about the existence and availability of the public health facilities and importance of its utilization.
Create permanent outreach vaccination points in or near slums/underserved areas. Health houses of LHWs can also be transformed into outreach vaccination points.
7.3.7 Health Work Force
Ensure all EPI facilities have vaccinators according to its workload. It is a missed opportunity for those children who happen to visit the facilities but go without any vaccination due to unavailability of the vaccinator.
Ensure timely availability of vaccines and vaccine supplies without any interruption to vaccination services
Facilitate vaccinators in preparing realistic micro plans and covering children living in both planned and unplanned areas (slums).
Create system for tracking new born and moving population to prepare realistic micro plans.
Guide LHWs about their awareness raising topics on a monthly basis.
Ensure deployment of LHVs in 100% EPI facilities as LHVs offer multiple benefits because of their qualifications and gender. They provide maternal child health care, services for safe delivery and vaccination to women and children. The cultural practices of Pakistan demand for women friendly services in which gender of the vaccinator is one such service, which may

53
attract women caregivers. Presence of LHVs encourages female caregivers to access EPI facilities not only for childhood vaccination but also for maternal child health care.
Ensure administration of vaccination in private health facilities, which offer MNCH services.
Ensure child registry as part of micro planning. 7.3.8 Community Engagement
Create a support structure in the form of influencers and religious leaders for mobilizing the hard-core refusals of childhood vaccination.
Organise residents of slums/underserved areas into an organised group to become a support tier for facilitating mobilization of caregivers during outreach vaccination.
Facilitate LHWs in raising awareness levels of caregivers on importance of childhood immunization as a priority.
Ensure regular follow up of caregivers by front line health workers (vaccinators or LHWs or social organisers or local community activists) before and after outreach vaccination in their respective areas.
Ensure announcement and positioning of Kit Station through community engagement. 7.3.9 Practical vs. Strategic Needs
Coordinate and combine vaccination services together with public and private welfare initiatives that contribute to improvements in economic conditions of urban poor. This would directly contribute to an increase in coverage rates as this addresses their practical as well as strategic problems.
Coordinate and combine vaccination services together with public and private welfare initiatives that contribute to the improvements in economic conditions of urban poor. This would directly contribute the increase in coverage rates as this addresses their practical as well as strategic problems.
7.3.10 Water
The containers used for the storage of water are very dirty and open. Most of these containers become breeding places for dengue mosquitoes. Establish regular water supply system in slums/underserved areas to avoid contamination as well as prevent any breeding place for dengue mosquitoes.
7.3.11 Household Toilets
Although majority of the slums are registered even then a large majority of them do not have access to proper sewerage system. Any outbreaks due to unhygienic conditions may affect the residents of entire city of Islamabad. Engage CSOs for introducing safe sanitation in slums/underserved areas.
7.3.12 Waste Management
The solid waste is thrown in either streets and or on empty plots in majority of the slums/underserved areas. Streets are playing area for children and make them highly vulnerable to catch preventable diseases. Provide solid waste management system in slums/underserved areas as part of preventing diseases and outbreaks.
7.3.13 Registration of Slums
36% slums are unregistered or illegal; this lack of official recognition makes these communities prone to evictions and deprived of basic facilities. Share list of unregistered slums to Kachi Abaadi Cells and Deputy Commissioner Offices and advocate them to regularise them. The provision of secure tenure for slum dwellers is a prerequisite to receiving delivery of basic services.

54
Annex 1: Questionnaire for Group Discussion in Slums/Underserved Areas
BS02 Name of facilitator of group interview
BS04
What is the name of your province? Select from below by typing the correct number: 1. Punjab 2. KP 3. Balochistan 4. Islamabad
BS05 Enter the name of your city
BS06 Enter name of your town
Bs07a What is the NEW NAME of this Union Council?
BS07b What is the NEW NUMBER of this Union Council?
BS08a What is the OLD name of this Union Council? If there is no OLD name, type X
BS08b What is the OLD NUMBER of this Union Council? If there is no old number, type X
BS09 Is this a 1. Slum 2. Underserved area
PART B
SP01 Please share current publicly known name of slum or underserved area (this should be name of the slum/underserved area that is also used in their postal address)
SP02
What is the status of registration of slum or underserved area with the relevant government department? Type 1 if its registered, or 2 if its unregistered. 1. Registered 2. Unregistered
SP03 Do you have documentary evidence? Type 1 for "yes" or 2 for "no". Skip if answer to question S02 is no. 1. Yes – check the evidence. If any utility bill is available in the name of the area, this can be treated as evidence 2. No
SP04 Which year was this area established?
SP05a What is the name of the nearest landmark of this area?
SP05b Please enter distance in kilometers from the slum/underserved area to the landmark
SP06 How many Mohallas do you have in this slum or underserved area?
SP07a How many total families live in this slum or underserved area?
SP07b What is the total population of this slum/underserved area?
PART C
MT01
Do you have families other than permanent residents living here? If answer to this question is no then skip questions MT02b 1. Yes 2. No
MT02a What is the number of permanent resident families settled here? Please enter number of FAMILIES only, and not individuals
MT02b What is the number of temporary displaced families settled here? Please enter number of FAMILIES only, and not individuals. If none, type 0. Skip this question if answer to the question MT01 is no
MT02c What is the number of nomad families settled here? Please enter number of FAMILIES only, and not individuals. If none, type 0. Skip if answer to questions SP08a is no
MT02d What is the number of families from conflict affected areas that are settled here? Please enter number of FAMILIES only, and not individuals. If none, type 0. Skip if answer to questions SP08a is no
MT02e What is the number of non-Pakistani families settled here? Please enter number of FAMILIES only, and not individuals. If none, type 0. Skip if answer to questions SP08a is no
MT02f Any there families settled other than explained in answers to the earlier questions? Please enter number of FAMILIES only, and not individuals. If none, type 0. Skip if answer to questions SP08a is no
PART D
HF01
Are there any functional public or private health facilities having MBBS qualified doctors in this slum or underserved area? If answer to this question is no then skip questions from HF02a to HF02d 1. Yes 2. No
HF02a If there are any functional health facilities having MBBS qualified doctor then how many of these are public health facilities? Reply with a number. If there are none, type X. Skip this question if the answer to the question HF01 is no
HF04
Please share distance of nearest Public health facility located within your slum or underserved area in kilometers from the centre of your slum or underserved area. Skip this question if the answer to the question HF01 is no. Type a number from the select: 1) 0 - 1 Km 2) 1 - 2 Km 3) 2 - 3 Km 4) 3 - 4 Km 5) 4 - 5 Km 6) 5 + Km
HF05a
Does this public health facility offer the service of vaccination of children? Skip this question if the answer to the question HF01 is no 1. Yes 2. No

55
HF05b
Does this public health facility offer the service of maternal and child health care? Skip this question if the answer to the question HF01 is no 1. Yes 2. No
HF05c
Does this public health facility offer the service of administration of polio drops? Skip this question if the answer to the question HF01 is no 1. Yes 2. No
HF05d
Does this public health facility offer the service of obstructive care and delivery? Skip this question if the answer to the question HF01 is no 1. Yes 2. No
HF05e Does this public health facility offer any other facilities? Skip this question if the answer to the question HF01 is no If yes, please describe. If none other, type X
HF 06 Does this public health facility have functional ambulance? 1. Yes 2. No
HF02b How many Private profit making health facilities having MBBS doctor are located in this slum or underserved area? Reply with a number. If there are no private health facility in this slum or underserved area then type X
HF07.
Please share distance of nearest private facility (for-profit) in kilometers from the centre of the area. Type a number from the select. Skip this question if the answer to the question HF01 is no 1) 0 - <1 Km 2) 1 - <2 Km 3) 2 - <3 Km 4) 3 - <4 Km 5) 4 - <5 Km 6) 5 + Km
HF 08.
Does this private for-profit health facility have functional ambulance? Skip this question if the answer to the question HF01 is no 1. Yes 2. No
HF09a.
Does this private for-profit facility offer vaccination of children? Skip this question if the answer to the question HF01 is no 1. Yes 2. No
HF09b.
Does this private for-profit facility offer maternal and child health care services? Skip this question if the answer to the question HF01 is no 1. Yes 2. No
HF09c.
Does this private for-profit facility offer the service of administration of polio drops? Skip this question if the answer to the question HF01 is no 1. Yes 2. No
HF09d.
Does this private for-profit facility offer obstructive care and delivery services? Skip this question if the answer to the question HF01 is no 1. Yes 2. No
HF09e. Does this private for-profit facility offer any other services? If yes, please describe what those services are in meaningful text and correct spellings. If the private health facility does not offer any other services defined in earlier questions then type "X". Skip this question if the answer to the question HF01 is no
HF02c. How many health facilities having MBBS qualified doctor located in your slum or underserved area are run by any WELFARE or TRUST? Reply with a number. If none of the health facilities are run by any welfare or trust then type X. Skip this question if the answer to the question HF01 is no
HF02d.
Are there any other types of functional health facilities having MBBS qualified doctor which are not been mentioned by you in the answers of earlier questions? If yes how many of these are located in your slum or underserved area. Please answer in number. if there is no health facility other than already explained in the answers of earlier questions then type X. Skip this question if the answer to the question HF01 is no
HF10. Are you aware of transport services offered by the government for any health related emergencies? 1. Yes 2. No
HF11a. Are you aware of 1122 by the government to respond to any domestic accidental emergency? 1. Yes 2. No
HF11b. Are you aware of 1038 by the government to respond to emergency related to the situation of pregnant women? 1. Yes 2. No
HF12.
Do Lady Health Workers work in this slum or underserved area? If the answer to this question is no then skip questions from HF13a to HF14f 1. Yes 2. No
PART E
EP01. Are there any vaccination services offered for children and women in this slum or underserved area?If the answer to this question is no then skip questions from EP02a to EP02f 1. Yes

56
2. No
EP02a
Are there any fixed EPI facilities for vaccination in this slum or underserved area? Skip this question if answer to question EP01 is no 1. Yes 2. No
EP03.
Who is running this fixed EPI facility? Skip this question if answer to question EP01 is no 1. Government 2. Private 3. Welfare organisation 4. Cantonment 5. Other
EP04.
What is the average distance of the facility from the centre of the slum? Skip this question if answer to question EP01 is no 1. 0 - 1 Km 2. 1 - 2 Km 3. 2 - 3 Km 4. 3 - 4 Km 5. 4 - 5 Km 6. 5 + Km
EP02b.
Are there outreach vaccination camps in this slum or underserved area? Skip this question if answer to question EP01 is no 1. Yes 2. No
EP02c.
Do Lady Health Workers do the vaccination? Skip this question if answer to question EP01 is no 1. Yes 2. No
EP02d.
Are there overnight stay of mobile vaccinators for vaccination camps Skip this question if answer to question EP01 is no 1. Yes 2. No
EP02e.
Do doctors in private health facility do the vaccination? Skip this question if answer to question EP01 is no 1. Yes 2. No
EP02f. Are there any system for vaccination in this slum or underserved area which is not explained in the answers to earlier questions? If yes, please explain in a meaningful sentence and there is no other system for vaccination which is not explained in earlier questions then type X. Skip this question if answer to question EP01 is no
PART F & G
WA01
What is the MAIN source of water for domestic purposes for the majority of the houses of this slum or underserved area? 1. Government water supply 2. Well 3. Hand pump 4. Tube wells 5. Other
WA02 If acquire domestic water through any water supply system is available in this slum what is the duration of water availability? Please enter number of hours, e.g., type "4" if the water comes for 4 hours. If no running water available, type X
TO01.
Are toilets available in any of the houses of this slum or underserved area? Skip questions TO02a if the answer to this question is no 1. Yes 2. No
To02a. Approximately how many houses of this slum or underserved area have toilets? Enter number only. If the answer to the question TO01 is no then skip this question
To02b. How many total houses of this slum or underserved area do NOT have toilets? Enter number only. if answer of TO02a is less than the total number of houses in this slum or underserved area then this question will filled otherwise skip it
To02c. How many total houses are located in this slum or underserved area? Enter number only. (This question is asked to check that the answer to the question TO02a and To02b should not be greater than the total houses located in this slum or underserved area
TO 03a
If toilet exists in any of the houses of this slum or underserved area, please specify how many flush to sewage toilets are there? (Flush to sewage toilet refers to sewer connected pour flush toilet fixed with a household and main sewer outside the house leading to a disposal point or sedimentation tank). Please enter NUMBER of such type of toilets only. If there are none, type 0. Skip if answer to question TO01 is no
TO 03b
If toilets exist in any of the houses of this slum or underserved area, please specify how many traditional pits toilets are there in the slum/underserved area? (Constructed over simple dug well without any p-trap provision). Please enter NUMBER of such type of toilets only. If there are none, type 0. Skip if answer to question TO01 is no
TO 03c
If toilets exist in any of the houses of this slum or underserved area, please specify how many open pits are there in the slum/underserved area which people use as toilets? Please enter NUMBER of such type of toilets only. If there are none, type 0. Skip if answer to question TO01 is no
TO 03d Please specify if there are ANY OTHER types of toilets in the slum/underserved area, which we have not asked you

57
about yet. If so, please describe what type and how many are there. If there is no other type, type X. Skip if answer to question TO01 is no
TO 04. If toilet exists in all or some of the houses of this slum or underserved area, please explain approximately how many persons in majority of the houses share one toilet? Enter number only. Skip if answer to question TO01 is no
To05.
If there are houses without any toilets in this slum or underserved area then where do generally men and women go for defecation? 1. Neighbor’s toilet 2. Public toilet 3. Open defecation 4. Other
PART H, I & J
TH 01a. How many total houses are located in this slum or underserved area
TH 01b. How many houses of this slum or underserved area have Kacha type of infrastructure as the main residential area of the household? If yes, please enter answer in number only. If there are no Kacha houses in this slum or underserved area then type X
TH 01c. How many houses of this slum or underserved area have Pacca type of infrastructure as the main residential area of the household? If yes then enter answer in number only. If there are no Pacca houses in this slum or underserved area then type X
TH 01d. How many houses of this slum or underserved area have mixed type of infrastructure (partially Pacca and partially Kacha) as the main residential area of the household. If yes then enter answer in number only. If there are no houses having mixed infrastructure in this slum or underserved area then type X
TH 01e.
How many houses of this slum or underserved area have tented type of infrastructure as the main residential area of the household? If yes then enter answer in number only. If there are no tented houses in this slum or underserved area then type X
TH01f
Are there houses in this slum or underserved area having infrastructure other than explained in earlier questions as the main residential area of the household? If yes then enter answer in number. If there are no houses constructed in infrastructure other than explained above in this slum or underserved area then type X
SWM 01a
Are there any paved or unpaved drains in this slum or underserved area. If the answer to this question is no then skip question SWM01b 1. Yes 2. No
SWM 01b
What is the condition of drains regarding disposal of waste water? 1. Drains have running water 2. Drains are filthy 3. Drains are choked 4. Any other
SWM02a.
Is there any system available for disposal of solid waste in this slum or underserved area? If the answer to this question is no then question SWM02b will be skipped 1. Yes 2. No
SWM 02b.
What is the system for the disposal of solid waste in this slum or underserved area? Type a number to select from the following list. Skip this question if answer to the question SWM02a is no 1. Government/WMC vehicle comes to pick 2. Welfare organisation arrange disposal with some intervals 3. Residents dump it on an empty plot 4. Residents throw it on streets 5. Any other
ED 01.
Are there schools in this slum or underserved area? If the answer to this question is no then skip questions ED02a to ED03a 1. Yes 2. No
ED02a. Are there schools by government? Skip this question if the answer to question ED01 is no 1. Yes 2. No
ED02b. Are there for profit schools by private sector? Skip this question if the answer to question ED01 is no 1. Yes 2. No
ED02c. Are there schools by welfare trust or charity? Skip this question if the answer to question ED01 is no 1. Yes 2. No
ED02d. Are there any Maktab schools by religious group(s)? Skip this question if the answer to question ED01 is no 1. Yes 2. No
ED02e.
Are there any other type of schools which are not explained while answering earlier questions? If yes, please describe what type of schools in meaning full text and correct spellings. If there are no schools types, which are not explained in earlier questions, then type X. Skip this question if the answer to question ED01 is no
Ed03a.
What is the approximate distance of nearest school (it could be any type of school) from the centre of the slum or underserved area? Type a number to select: Skip this question if the answer to question ED01 is no 1. Less than 1 km 2. Between 1-2 km 3. Between 2-3 km 4. Between 3-4 km 5. More than 4 km
PART K

58
CSO01.
Are there any not for profit registered welfare or charity organisation working in this slum or under served area (NGOs-CSOs)? If the answer to this question is no then skip questions from CSO02 and CSO03. 1. Yes 2. No
CSO02 If registered not for profit organisations are working in this slum or underserved area, please mention its number? This question will be answered if the answer to question CSO01 is yes otherwise type X. Skip this question if answer to the question CSO1 is no
CSO03 If registered not for profit organisations are working in this slum or underserved area, please share their full names in correct spellings. Skip this question if the answer to question CSO01 is no
CSO04
Are there any informal groups or committee working in this slum or underserved area? If answer to this question is no then skip question CSO05 1. Yes 2. No
CSO05
Do the informal groups/committees include the following. Skip this question if the answer to the question CSO04 is no 1. Health committee 2. School committee 3. Masjid/church committee 3. Jirga or Punchait 4. Zakat committee 5. Unregistered Community Based Organisation 6. If other than stated above then explain in meaningful text in correct spellings
CSO06a
Are there any public welfare schemes or initiatives by government? If answer to this question is no then skip questions CSO06b, CSO06c, CSO06d, CSO06e, CSO06f 1. Yes 2. No
CSO06b Does the government provide a loan scheme? Skip this question if the answer to the question CSO06a is no 1. Yes 2. No
CSO06c Does the government provide a stipend scheme? 1. Yes 2. No
CSO06d
Does the government provide a Social Benefit Card scheme? Skip this question if the answer to the question CSO06a is no 1. Yes 2. No
CSO06e
Does the government provide a vocational skills scheme? Skip this question if the answer to the question CSO06a is no 1. Yes 2. No
CSO06f Are there any other types of government scheme for the welfare of people of slum or underserved area, which is not explained in the answers of earlier questions? If the answer is yes, please explain it in a meaningful text and correct spelling and if there is no other type of welfare scheme by the government then type X.
Please enter names and mobile phone numbers of participants of this group discussion (minimum three names and numbers required).
Participant 1 name ------------------------------ Participant 1 number----------------------
Participant 2 name-------------------------------- Number---------------------------------
Participant 3 name------------------------------- Number---------------------------------

59
Annex 2: Questionnaire for Compiling Health Resource in Union Councils
BASIC INFORMATION: This questionnaire is to be filled in through individual interview of district health officer or district EPI coordinator
BS 01. Date: _ _ / _ _ / 201_
BS 02. Name of Interviewer
BS 03. Signature of Interviewer
BS 04. Name of Province:
BS 05. Name of District:
BS 06. Name of Town / Tehsil:
BS 07. New Name of Union Council:
TEHSIL/TOWN INFORMATION
TI 01. How many Union Councils are in this city? Please include all towns of this city.
Number…………………………..
TI 02. Enlist new and old names and number of all the Union Councils of this city for each town
# List of New Name of Union Council
List of Old name of Union Council
List of New Number of Union Council
List of Old Number of Union Council
TI 03. Enlist Union Council wise names of slum or underserved area if available. (you may attach separate list of slums or underserved area in case of long list)
# New Names of Union Council Name of slums Name of underserved area
TI 04. What is the population in each Union Council? (Kindly mention population including and excluding population of slum or underserved area). Please define source of population size as well
# New Names of Union Council
Population of Slum or underserved area
Population of Union Council (Excluding Population of Slum or underserved are
Total Population of Union Council
HF 01. How many Public Health Facilities are in each Union Council?
# Names of Union Council List of Public Health Facilities
HF 02. How many Public Health Facilities are located in slum or underserved areas?
# New Names of Union Council
Name of slum or underserved area
List of Public Health Facilities
List of Private Health Facilities
Total
HF 04. How many Lady Health Worker are currently active in each Union Council?
# Names of Union Council List of Lady Health Workers
HF 06. Is Dengue staff working in union council 1. Yes 2. No
HF 7. If yes, then how many staff members are working Total
NUTRITION
NU 01. Any nutrition service delivered in the Union Councils? 1. Yes 2. No
NU 02. If yes than what type of nutrition services are delivered? 1. Fixed 2. Temporary 3. School Nutrition Session 4. LHW Sessions on Nutrition in Communities 9. Other…………………
VACCINATION
VA 01. How many Fixed EPI Facilities (Vaccination centres) are available in each Union Council?
# Names of Union Councils
List Public of Fixed EPI Facilities
List of Private Fixed EPI Facilities
List of Welfare Fixed EPI Facilities
List of Any Other Type of Fixed EPI Facilities
No EPI Facility
VA 02. State the number and functionality of ILR or Refrigerator in Fixed EPI Facility (vaccination centres)?
# Names of Union Council
Public Fixed EPI Facilities
Private Fixed EPI Facilities
Welfare Fixed EPI Facilities
Any Other Type of Fixed EPI Facilities

60
Functional Non Functional
Functional
Non Functional
Functional
Non Functional
Functional Non Functional
VA 03. What is the number and status of availability of currently active vaccinator?
# New Name of Union Council
List of vaccinator in Public Health Facility
List of vaccinator in Private Health Facility
List of Vaccinator in Fixed EPI Facility (vaccination centre) established by other than public sector organisation

61
Annex 3: Questionnaire for EPI Facility Assessment Objective: This questionnaire will be used for the assessment of fixed EPI Facility and undertake group interview with the facility team.
# Identification Answer and code
ID1 Date of assessment
ID2 Name of assessor
ID3 Signature of assessor
ID4 Name of Province
ID5 Name of District
ID6 Name of Town (or Tehsil)
ID7 Name of the EPI Facility
ID8 Record longitude and latitude of the fixed EPI Facility ……. Longitude ……. Latitude
ID9 Take photo of the fixed EPI Facility 1 – Photos taken 2 – Not taken
# Infrastructure
IM1 What is the type of building (rented, owned)? 1 - Rented 2 - Owned 9 - Other (specify):
# Management
IM2 Are Standard Operating Procedures for child immunizations available in this facility at the time of visit? 1 – Yes (Assessor: Please verify) 2 – Not available today 3 – Facility never had Standard Operating Procedures
IM4 a Are auto disable syringes available in this facility at the time of visit? 1.-Yes 2.-No
IM4 b Are sharp containers available in this facility at the time of visit? 1.-Yes 2.-No
IM4 c Are vaccine carrier(s) available in this facility at the time of visit? 1.-Yes 2.-No
IM4 d Set of icepacks for vaccine carriers available in this facility at the time of visit? 1.-Yes 2.-No
IM4 e Anything else available in this facility at the time of visit, which we have not asked about? If yes please specify and if not available type X
IM5 Does this facility has Ice Lined Refrigerator available at the time of visit with power supply for the storage of vaccines? Please physically verify the answer. 1 – Available with power supply 2 – Available but no regular power supply 3 – Ice Lined Refrigerator is out of order 4 – No Ice Lined refrigerator is available
IM6 Did the facility experience any problem in getting vaccines in last one year? 1 – No 2 – Yes, sometimes 3 - Yes, facility has frequent shortage of supplies 4. – Other (specify):
# Human Resource
EP4a Are vaccinators available in this EPI Facility? 1- Yes 2- No
EP4b If vaccinators are available, please share number of vaccinators currently providing services in this EPI facility? If there are no vaccinators type X
EP4c Are LHVs available in this EPI facility
EP4d If LHVs are available, please share number of LHVs currently providing services in this EPI facility? If there are no LHVs type X
EP5a What are the timings of this fixed health facility open? type number only “8” (24 hours format) Opens at: ………
EP5b What are the timings of this fixed health facility closed? type number only “15” (24 hours format) Closes at: …………
EP5c What are total working hours of the facility per day? Type a number only e.g.“8” Total working hours………..
# Environment & Facilities For The Patients
EN1 Is there any waiting area (separate for men and women patients) in the facility?
62
1 – Yes, separate for men and women 2 – Yes, mixed waiting area for men and women 3 – No waiting area available
EN2 Is adequate seating capacity/ arrangement available in the waiting area? 1 - Yes, has adequate seating capacity 2 – No, seating capacity is not adequate 9 – No seating area available /NA
EN3 Is drinking water available for patients and their attendants in the facility? 1 – Yes 2 - No
EN4 Is toilet facility available for both men and women patients and their attendants in the facility? 1 – Yes, separate for men and women 2 – Yes but NOT separate for men and women 3 – No toilet facilities available
EN5 Is the toilet facility usable for patients and their attendants in the facility? 1 – Yes, usable 2 – Not usable
EN6 How health facility/ EPI waste is being disposed from the site 1. Buried 2. Burnt 3. Burn and Buried 4. Dumped in health facility / garbage cane 5. Others

63
Annex 4: Analysis of Profiling of Slums/Underserved Areas
Table 1: Number of Slums and Underserved
Cities Slums Underserved Sub Total
Faisalabad 169 297 466
Gujranwala 82 165 247
Lahore 356 637 993
Multan 216 104 320
Rawalpindi 76 62 138
Punjab Total 899 1265 2164
Islamabad 49 14 63
Quetta 281 34 315
Peshawar 550 22 572
Grand Total 1779 1335 3114
Table 2: Timeframe Existence of Slums
Cities Before 1950 1950-1990 1991-2005 After 2005 Total
Faisalabad 17 110 35 7 169
Gujranwala 17 48 13 4 82
Lahore 76 224 42 14 356
Multan 32 129 45 10 216
Rawalpindi 15 46 11 4 76
Punjab Total 157 557 146 39 899
Islamabad 0 35 8 6 49
Quetta 25 174 58 24 281
Peshawar 235 265 42 8 550
Grand Total 425 1023 256 71 1779
Table 3: Registration Status of Slums
Cities # of slums in each city Registered slums Unregistered slums Sub Total
Faisalabad 169 151 18 169
Gujranwala 82 47 35 82
Lahore 356 293 63 356
Multan 216 180 36 216
Rawalpindi 76 58 18 76
Punjab Total 899 729 170 899
Islamabad 49 21 28 49
Quetta 281 120 161 281
Peshawar 550 273 277 550
Grand Total 1779 1143 636 1779
Table 4: Population
Cities Population in Slums Population in Underserved Areas Sub Total
Faisalabad 459,327 881,049 1,340,376
Gujranwala 289,610 1,179,940 1,469,550
Lahore 1,519,936 3,130,318 4,650,254
Multan 491,250 432,270 923,520
Rawalpindi 532,155 434,844 966,999
Punjab Total 3,292,278 6,058,421 9,350,699
Islamabad 273,840 105,800 379,640
Quetta 633,508 78,896 712,404
Peshawar 1,480,942 51,536 1,532,478
Grand Total 5,680,568 6,294,653 11,975,221

64
Table 5a: Types of Residents in Slums
Cities Permanent Resident Temporary Displaced Other Nationality Total
Faisalabad 68,766 16,639 0 85,405
Gujranwala 54,154 2,155 0 56,309
Lahore 213,394 31,918 105 245,417
Multan 91,111 12,752 707 104,570
Rawalpindi 69,149 18,295 3,102 90,546
Punjab Total 496,574 81,759 3,914 582,247
Islamabad 30,920 590 3,806 35,316
Quetta 79,890 6,464 4,798 91,152
Peshawar 153,038 39,725 11,734 204,497
Grand Total 760,422 128,538 24,252 913,212
Table 5b: Types of Residents in Underserved
Cities Permanent Resident Temporary Displaced Other Nationality Total
Faisalabad 131,586 27,639 12 159,237
Gujranwala 170,230 16,178 0 186,408
Lahore 411,531 47,064 1,527 460,122
Multan 63,005 6,064 350 69,419
Rawalpindi 60,066 13,749 300 74,115
Punjab Total 836,418 110,694 2,189 949,301
Islamabad 12,205 620 0 12,825
Quetta 6,527 681 1,372 8,580
Peshawar 4,722 553 2 5,277
Grand Total 859,872 112,548 3,563 975,983
Table 5c: Types of Residents in Slums and Underserved (Total)
Cities Permanent Resident Temporary Displaced Other Nationality Total
Faisalabad 200,352 44,278 12 244,642
Gujranwala 224,384 18,333 0 242,717
Lahore 624,925 78,982 1,632 705,539
Multan 154,116 18,816 1,057 173,989
Rawalpindi 129,215 32,044 3,402 164,661
Punjab Total 1,332,992 192,453 6,103 1,531,548
Islamabad 43,125 1,210 3,806 48,141
Quetta 86,417 7,145 6,170 99,732
Peshawar 157,760 40,278 11,736 209,774
Grand Total 1,620,294 241,086 27,815 1,889,195
Table 6: Number of Health Facilities
Slums Underserved
Cities Public Private Welfare/Trust Other Total Public Private Welfare/Trust Other Total Grand
Total
Faisalabad 0 2 0 0 2 0 0 0 0 0 2
Gujranwala 0 0 0 0 0 1 4 0 0 5 5
Lahore 3 0 0 0 3 0 0 0 0 0 3
Multan 4 0 0 0 4 0 0 0 0 0 4
Rawalpindi 2 0 0 0 2 0 0 0 0 0 2
Punjab Total
9 2 0 0 11 1 4 0 0 5 16
Islamabad 4 10 0 0 14 0 4 0 0 4 18
Quetta 13 5 0 0 18 1 0 0 0 1 19
Peshawar 31 7 3 0 41 2 1 0 0 3 44
Grand Total 57 24 3 0 84 4 9 0 0 13 97
Table 7a: Slums having Private and Public Health Facilities
Cities With Public
Health Facilities With Private
Health Facilities With Both Public and
Private Health Facilities Total
Without any Health Facilities
Total
Faisalabad 0 2 0 2 167 169
Gujranwala 0 0 0 0 82 82
Lahore 3 0 0 3 353 356
Multan 4 0 0 4 212 216
Rawalpindi 2 0 0 2 74 76
Punjab Total 9 2 0 11 888 899
Islamabad 2 7 0 9 40 49
Quetta 13 5 0 18 263 281
Peshawar 31 10 0 41 509 550
Grand Total 55 24 0 79 1700 1779
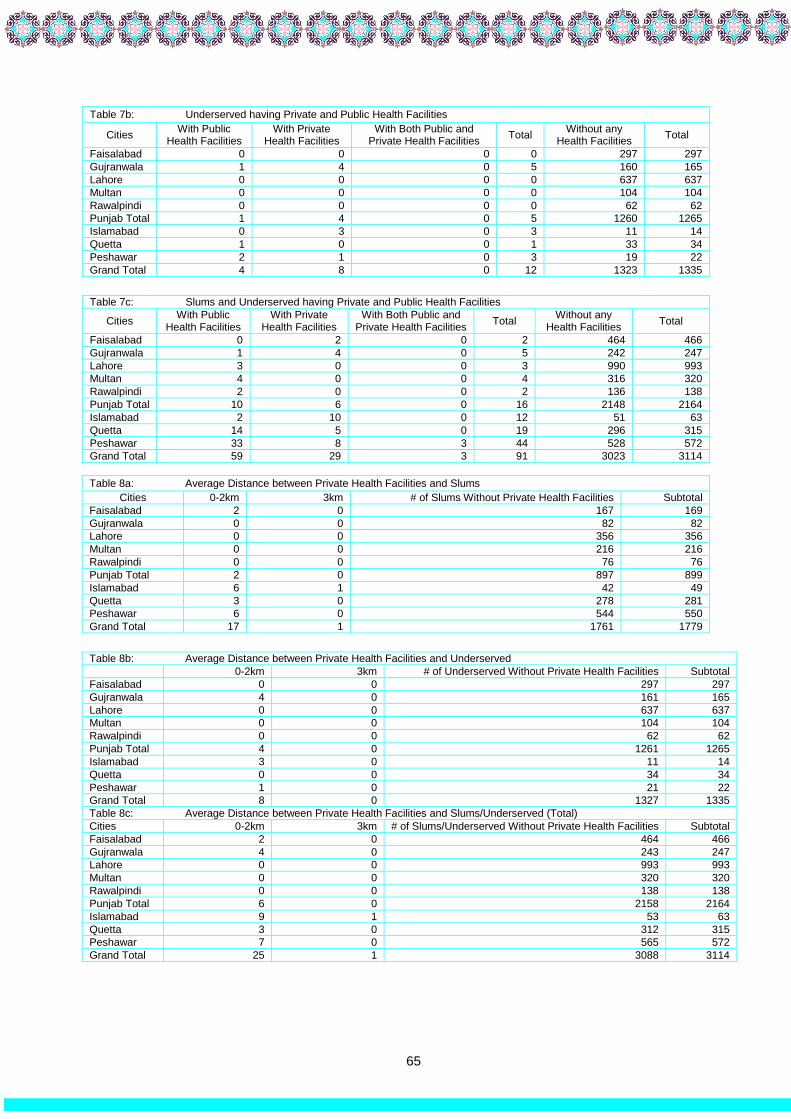
65
Table 7b: Underserved having Private and Public Health Facilities
Cities With Public
Health Facilities With Private
Health Facilities With Both Public and
Private Health Facilities Total
Without any Health Facilities
Total
Faisalabad 0 0 0 0 297 297
Gujranwala 1 4 0 5 160 165
Lahore 0 0 0 0 637 637
Multan 0 0 0 0 104 104
Rawalpindi 0 0 0 0 62 62
Punjab Total 1 4 0 5 1260 1265
Islamabad 0 3 0 3 11 14
Quetta 1 0 0 1 33 34
Peshawar 2 1 0 3 19 22
Grand Total 4 8 0 12 1323 1335
Table 7c: Slums and Underserved having Private and Public Health Facilities
Cities With Public
Health Facilities With Private
Health Facilities With Both Public and
Private Health Facilities Total
Without any Health Facilities
Total
Faisalabad 0 2 0 2 464 466
Gujranwala 1 4 0 5 242 247
Lahore 3 0 0 3 990 993
Multan 4 0 0 4 316 320
Rawalpindi 2 0 0 2 136 138
Punjab Total 10 6 0 16 2148 2164
Islamabad 2 10 0 12 51 63
Quetta 14 5 0 19 296 315
Peshawar 33 8 3 44 528 572
Grand Total 59 29 3 91 3023 3114
Table 8a: Average Distance between Private Health Facilities and Slums
Cities 0-2km 3km # of Slums Without Private Health Facilities Subtotal
Faisalabad 2 0 167 169
Gujranwala 0 0 82 82
Lahore 0 0 356 356
Multan 0 0 216 216
Rawalpindi 0 0 76 76
Punjab Total 2 0 897 899
Islamabad 6 1 42 49
Quetta 3 0 278 281
Peshawar 6 0 544 550
Grand Total 17 1 1761 1779
Table 8b: Average Distance between Private Health Facilities and Underserved
0-2km 3km # of Underserved Without Private Health Facilities Subtotal
Faisalabad 0 0 297 297
Gujranwala 4 0 161 165
Lahore 0 0 637 637
Multan 0 0 104 104
Rawalpindi 0 0 62 62
Punjab Total 4 0 1261 1265
Islamabad 3 0 11 14
Quetta 0 0 34 34
Peshawar 1 0 21 22
Grand Total 8 0 1327 1335
Table 8c: Average Distance between Private Health Facilities and Slums/Underserved (Total)
Cities 0-2km 3km # of Slums/Underserved Without Private Health Facilities Subtotal
Faisalabad 2 0 464 466
Gujranwala 4 0 243 247
Lahore 0 0 993 993
Multan 0 0 320 320
Rawalpindi 0 0 138 138
Punjab Total 6 0 2158 2164
Islamabad 9 1 53 63
Quetta 3 0 312 315
Peshawar 7 0 565 572
Grand Total 25 1 3088 3114

66
Table 9: EPI Facilities
Cities Slums Underserved Areas Slums/Underserved Total
Available Not Available Available Not Available Available Not Available
Faisalabad 16 153 18 279 34 432
Gujranwala 1 81 7 158 8 239
Lahore 15 341 62 575 77 916
Multan 9 207 6 98 15 305
Rawalpindi 5 71 2 60 7 131
Punjab Total 46 853 95 1170 141 2023
Islamabad 3 46 0 14 3 60
Quetta 19 262 2 32 21 294
Peshawar 45 505 1 21 46 526
Grand Total 113 1666 98 1237 211 2903
Table 10a: Distance Between EPI Facilities and Slums
Cities 0-2km 3km 4km 5+km Slums without EPI
facility Total
Faisalabad 16 0 0 0 153 169
Gujranwala 1 0 0 0 81 82
Lahore 15 0 0 0 341 356
Multan 8 0 0 1 207 216
Rawalpindi 5 0 0 0 71 76
Punjab Total 45 0 0 1 853 899
Islamabad 3 0 0 0 46 49
Quetta 17 2 0 0 262 281
Peshawar 45 0 0 0 505 550
Grand Total 110 2 0 1 1666 1779
Table 10b: Distance Between EPI Facilities and Underserved (Total)
Cities 0-2km 3km 4km 5+km Slums without EPI facility Total
Faisalabad 18 0 0 0 279 297
Gujranwala 7 0 0 0 158 165
Lahore 62 0 0 0 575 637
Multan 6 0 0 0 98 104
Rawalpindi 2 0 0 0 60 62
Punjab Total 95 0 0 0 1170 1265
Islamabad 0 0 0 0 14 14
Quetta 1 0 1 0 32 34
Peshawar 1 0 0 0 21 22
Grand Total 97 0 1 0 1237 1335
Table 10c: Distance Between Fixed EPI Facilities in Slums and Underserved (Total)
Cities 0-2km 3km 4km 5+km Slums without EPI facility Total
Faisalabad 34 0 0 0 432 466
Gujranwala 8 0 0 0 239 247
Lahore 77 0 0 0 916 993
Multan 14 0 0 1 305 320
Rawalpindi 7 0 0 0 131 138
Punjab Total 140 0 0 1 2023 2164
Islamabad 3 0 0 0 60 63
Quetta 18 2 1 0 294 315
Peshawar 46 0 0 0 526 572
Grand Total 207 2 1 1 2903 3114
Table 11a: Outreach of Vaccination Services in Slums
Cities Slums with Outreach Total # of Slums
Faisalabad 109 169
Gujranwala 22 82
Lahore 296 356
Multan 200 216
Rawalpindi 72 76
Punjab Total 699 899
Islamabad 35 49
Quetta 101 281
Peshawar 529 550
Grand Total 1364 1779

67
Table 11b: Outreach of Vaccination Services in Underserved
Cities Underserved with Outreach Total Underserved
Faisalabad 189 297
Gujranwala 55 165
Lahore 424 637
Multan 104 104
Rawalpindi 56 62
Punjab Total 828 1265
Islamabad 8 14
Quetta 12 34
Peshawar 22 22
Grand Total 870 1335
Table 11c: Outreach of Vaccination Services in Slums/Underserved (Total)
Cities Slums/Underserved with Outreach Total Slums/Underserved
Faisalabad 298 466
Gujranwala 77 247
Lahore 720 993
Multan 304 320
Rawalpindi 128 138
Punjab Total 1527 2164
Islamabad 43 63
Quetta 113 315
Peshawar 551 572
Grand Total 2223 3114
Table 12a: Lady Health Worker in Slums
Cities LHWs Covered LHWs Uncovered Total Slums
Faisalabad 31 138 169
Gujranwala 5 77 82
Lahore 222 134 356
Multan 70 146 216
Rawalpindi 33 43 76
Punjab Total 361 538 899
Islamabad 17 32 49
Quetta 94 187 281
Peshawar 328 222 550
Grand Total 800 979 1779
Table 12b: Lady Health Worker in Underserved
Cities LHWs Covered LHWs Uncovered Total Underserved
Faisalabad 72 225 297
Gujranwala 32 133 165
Lahore 324 313 637
Multan 39 65 104
Rawalpindi 18 44 62
Punjab Total 485 780 1265
Islamabad 5 9 14
Quetta 11 23 34
Peshawar 7 15 22
Grand Total 508 827 1335
Table 12c: Lady Health Worker in Slums/Underserved (Total)
Cities LHWs Covered LHWs Uncovered Total Slums/Underserved
Faisalabad 103 363 466
Gujranwala 37 210 247
Lahore 546 447 993
Multan 109 211 320
Rawalpindi 51 87 138
Punjab Total 846 1318 2164
Islamabad 22 41 63
Quetta 105 210 315
Peshawar 335 237 572
Grand Total 1308 1806 3114

68
Table 13a: Availability of 1122 Services
Cities # of
Slums
Slums
# of Underserved
Underserved Areas Slums/Underserved Areas
Slums With 1122
Slums Without
1122
Underserved With 1122
Underserved Without
1122
Slums/Underserved With 1122
Slums/Underserved
Without 1122
Faisalabad 169 156 13 297 284 13 440 26
Gujranwala 82 82 0 165 150 15 232 15
Lahore 356 256 100 637 585 52 841 152
Multan 216 213 3 104 103 1 316 4
Rawalpindi 76 76 0 62 62 0 138 0
Punjab Total 899 783 116 1265 1184 81 1967 197
Islamabad 49 31 18 14 10 4 41 22
Quetta 281 0 281 34 0 34 0 315
Peshawar 550 390 160 22 19 3 409 163
Grand Total 1779 1204 575 1335 1213 122 2417 697
Table 13b: Availability of 1038 Services
Cities
Slums # of
Underserved
Underserved Areas Slums/Underserved Areas
# of Slums
Slums With 1122
Slums Without
1122
Underserved With 1122
Underserved Without 1122
Slums/Underserved With 1122
Slums/Underserved Without 1122
Faisalabad 169 6 163 297 7 290 13 453
Gujranwala 82 0 82 165 1 164 1 246
Lahore 356 9 347 637 41 596 50 943
Multan 216 1 215 104 0 104 1 319
Rawalpindi 76 0 76 62 0 62 0 138
Punjab Total
899 16 883 1265 49 1216 65 2099
Islamabad 49 5 44 14 4 10 9 54
Quetta 281 0 281 34 0 34 0 315
Peshawar 550 0 550 22 0 22 0 572
Grand Total 1779 21 1758 1335 53 1282 74 3040
Table 14: Dengue Workers
Cities Slums Underserved Slums/Underserved Total
Available Not Available Available Not Available Available Not Available Sub Total
Faisalabad 72 97 136 161 208 258 466
Gujranwala 82 0 53 112 135 112 247
Lahore 269 87 527 110 796 197 993
Multan 180 36 97 7 277 43 320
Rawalpindi 76 0 62 0 138 0 138
Punjab Total 679 220 875 390 1554 610 2164
Islamabad 22 27 7 7 29 34 63
Quetta 0 281 0 34 0 315 315
Peshawar 91 459 8 14 99 473 572
Grand Total 792 987 890 445 1682 1432 3114

69
Table 15a: Types of Housing Structure in Slums
Cities Kacha or Tented Pacca Kacha-Pacca (Mixed) Total
Faisalabad 7,629 29,458 48,318 85,405
Gujranwala 8,315 26,650 21,344 56,309
Lahore 32,057 84,917 128,443 245,417
Multan 9,255 51,606 43,709 104,570
Rawalpindi 13,186 47,441 29,919 90,546
Punjab Total 70,442 240,072 271,733 582,247
Islamabad 5,826 24,383 5,107 35,316
Quetta 59,833 11,021 20,298 91,152
Peshawar 46,264 97,066 61,167 204,497
Grand Total 182,365 372,542 358,305 913,212
Table 15b: Types of Housing Structure in Underserved
Cities Kacha or Tented Pacca Kacha-Pacca (Mixed) Total
Faisalabad 0 135,313 23,934 159,247
Gujranwala 0 141,745 44,663 186,408
Lahore 0 436,371 23,751 460,122
Multan 0 54,966 14,453 69,419
Rawalpindi 0 55,402 18,713 74,115
Punjab Total 0 823,797 125,514 949,311
Islamabad 0 5,295 7,530 12,825
Quetta 0 7,978 602 8,580
Peshawar 0 4,548 729 5,277
Grand Total 0 841,618 134,375 975,993
Table 15c: Types of Housing Structures in Slums/Underserved (Total)
Cities Kacha or Tented Pacca Kacha-Pacca (Mixed) Total
Faisalabad 7,629 164,771 72,252 244,652
Gujranwala 8,315 168,395 66,007 242,717
Lahore 32,057 521,288 152,194 705,539
Multan 9,255 106,572 58,162 173,989
Rawalpindi 13,186 102,843 48,632 164,661
Punjab Total 70,442 1,063,869 397,247 1,531,558
Islamabad 5,826 29,678 12,637 48,141
Quetta 59,833 18,999 20,900 99,732
Peshawar 46,264 101,614 61,896 209,774
Grand Total 182,365 1,214,160 492,680 1,889,205
Table 16a: Sources of Domestic Water in Slums
Cities Government Water
Supply Ground Water (Well, Hand Pump, Tube Well)
Acquire From Other Sources Of Water
Faisalabad 29 125 15
Gujranwala 7 55 20
Lahore 111 118 127
Multan 40 158 18
Rawalpindi 22 38 16
Punjab Total 209 494 196
Islamabad 12 31 6
Quetta 35 74 172
Peshawar 64 477 9
Grand Total 320 1076 383
Table 16b: Sources of Domestic Water in Underserved
Cities Government Water Supply Ground Water (Well, Hand
Pump, Tube Well) Acquire From Other Sources Of Water
Faisalabad 88 45 164
Gujranwala 23 64 78
Lahore 276 261 100
Multan 28 46 30
Rawalpindi 35 12 15
Punjab Total 450 428 387
Islamabad 5 5 4
Quetta 12 4 18
Peshawar 2 20 0
Grand Total 469 457 409

70
Table 16c: Sources of Domestic Water in Slums/Underserved (Total)
Cities Government Water Supply
Ground Water (Well, Hand Pump, Tube Well) Acquire From Other Sources Of Water
Faisalabad 117 170 179
Gujranwala 30 119 98
Lahore 387 379 227
Multan 68 204 48
Rawalpindi 57 50 31
Punjab Total 659 922 583
Islamabad 17 35 11
Quetta 47 78 190
Peshawar 66 497 9
Grand Total 789 1532 793
Table 17a : Duration of Water Availability (in case of Government Water Supply) in Slums
Cities 1-5
hours 6-10 hours
11-15 hours 16-20 hours
20+ hours
Slums without Government Water Supply
Sub Total
Faisalabad 16 11 1 1 0 140 169
Gujranwala 1 5 0 1 0 75 82
Lahore 54 46 6 4 1 245 356
Multan 23 17 0 0 0 176 216
Rawalpindi 20 2 0 0 0 54 76
Punjab Total 114 81 7 6 1 690 899
Islamabad 7 3 0 0 2 37 49
Quetta 34 0 0 1 0 246 281
Peshawar 31 22 8 0 3 486 550
Grand Total 186 106 15 7 6 1459 1779
Table 17b: Duration of Water Availability (in case of Government Water Supply) in Underserved
Cities 1-5
hours 6-10 hours
11-15 hours
16-20 hours
20+ hours Slums without Government
Water Supply Sub Total
Faisalabad 41 36 10 1 0 209 297
Gujranwala 6 8 2 3 4 142 165
Lahore 70 119 27 42 18 361 637
Multan 8 20 0 0 0 76 104
Rawalpindi 30 5 0 0 0 27 62
Punjab Total 155 188 39 46 22 815 1265
Islamabad 3 0 0 0 2 9 14
Quetta 12 0 0 0 0 22 34
Peshawar 1 1 0 0 0 20 22
Grand Total 170 189 39 46 23 868 1335
Table 17c: Duration of Water Availability (in case of Government Water Supply) in Slums/Underserved (Total)
Cities 1-5
hours 6-10 hours
11-15 hours
16-20 hours
20+ hours Slums without Government
Water Supply Sub Total
Faisalabad 57 47 11 2 0 349 466
Gujranwala 7 13 2 4 4 217 247
Lahore 124 165 33 46 19 606 993
Multan 31 37 0 0 0 252 320
Rawalpindi 50 7 0 0 0 81 138
Punjab Total 269 269 46 52 23 1505 2164
Islamabad 10 3 0 0 4 46 63
Quetta 46 0 0 1 0 268 315
Peshawar 32 23 8 0 3 506 572
Grand Total 356 295 54 53 29 2327 3114

71
Table 18a-: Availability of Household Toilets in Slums
Cities # of House Having Toilets # of Household Not Having Toilet Total Household
Faisalabad 83,553 1,852 85,405
Gujranwala 55,549 760 56,309
Lahore 240,881 4,536 245,417
Multan 103,816 754 104,570
Rawalpindi 90,046 500 90,546
Punjab Total 573,845 8,402 582,247
Islamabad 34,173 1,143 35,316
Quetta 87,028 4,124 91,152
Peshawar 196,634 4,374 201,008
Grand Total 891,680 18,043 909,723
Table 18b: Availability of Household Toilet in Underserved
Cities # of House Having Toilets # of Household Not Having Toilet Total Household
Faisalabad 158,273 964 159,237
Gujranwala 185,953 455 186,408
Lahore 457,833 2,289 460,122
Multan 65,209 4,210 69,419
Rawalpindi 74,005 110 74,115
Punjab Total 941,273 8,028 949,301
Islamabad 12,825 - 12,825
Quetta 8,025 555 8,580
Peshawar 5,247 30 5,277
Grand Total 967,370 8,613 975,983
Table 18c: Availability of Household Toilet in Slums/Underserved
Cities # of House Having Toilets # of Household Not Having Toilet Total Household
Faisalabad 241,826 2,816 244,642
Gujranwala 241,502 1,215 242,717
Lahore 698,714 6,825 705,539
Multan 169,025 4,964 173,989
Rawalpindi 164,051 610 164,661
Punjab Total 1,515,118 16,430 1,531,548
Islamabad 46,998 1,143 48,141
Quetta 95,053 4,679 99,732
Peshawar 201,881 4,404 206,285
Grand Total 1,859,050 26,656 1,885,706
Table 19a: Type of Household Toilet in Slums
Cities Connected with Street Drain Traditional/Open pit Sub-Total
Faisalabad 45,876 37,677 83,553
Gujranwala 35,485 20,064 55,549
Lahore 152,361 88,520 240,881
Multan 53,970 49,846 103,816
Rawalpindi 40,111 49,935 90,046
Punjab Total 327,803 246,042 573,845
Islamabad 17,501 16,672 34,173
Quetta 10,377 76,651 87,028
Peshawar 76,581 120,053 196,634
Grand Total 432,262 459,418 891,680
Table 19b: Type of Household Toilet in Underserved
Cities Connected with Street Drain Traditional/Open pit Sub-Total
Faisalabad 101,536 56,737 158,273
Gujranwala 129,287 56,666 185,953
Lahore 191,119 266,714 457,833
Multan 25,898 39,311 65,209
Rawalpindi 26,847 47,158 74,005
Punjab Total 474,687 466,586 941,273
Islamabad 6,222 6,603 12,825
Quetta 1,680 6,345 8,025
Peshawar 1,100 4,147 5,247
Grand Total 483,689 483,681 967,370
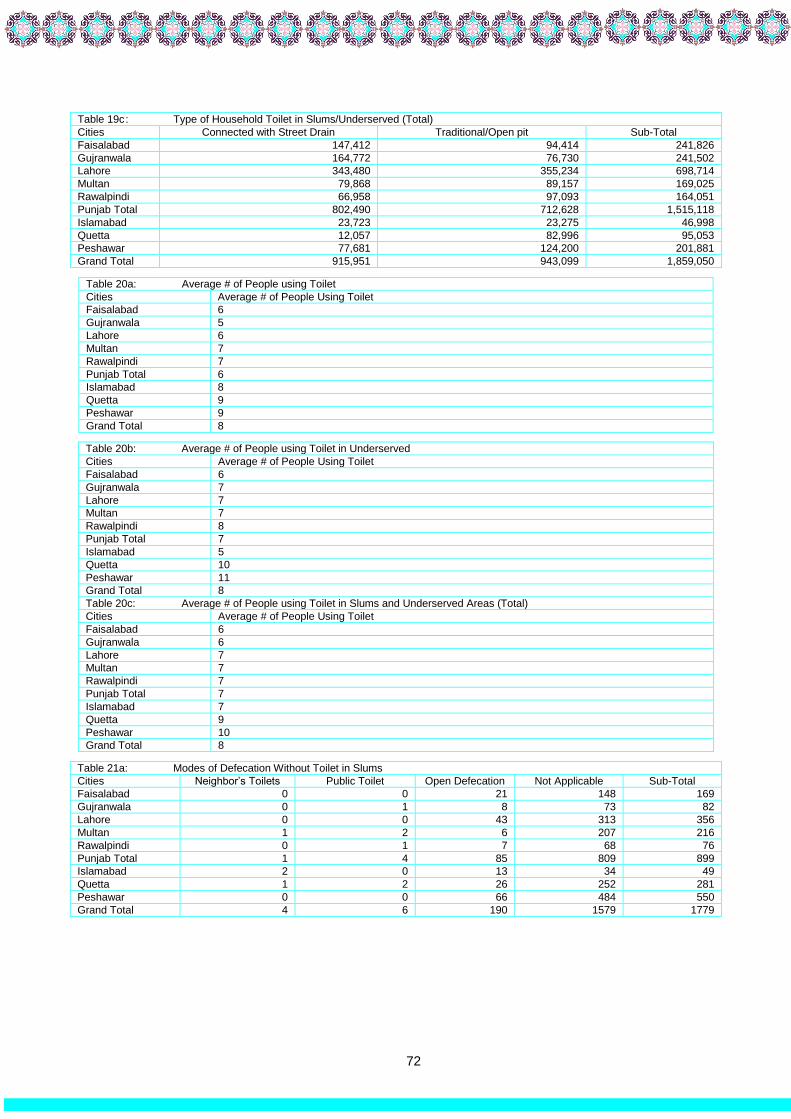
72
Table 19c : Type of Household Toilet in Slums/Underserved (Total)
Cities Connected with Street Drain Traditional/Open pit Sub-Total
Faisalabad 147,412 94,414 241,826
Gujranwala 164,772 76,730 241,502
Lahore 343,480 355,234 698,714
Multan 79,868 89,157 169,025
Rawalpindi 66,958 97,093 164,051
Punjab Total 802,490 712,628 1,515,118
Islamabad 23,723 23,275 46,998
Quetta 12,057 82,996 95,053
Peshawar 77,681 124,200 201,881
Grand Total 915,951 943,099 1,859,050
Table 20a: Average # of People using Toilet
Cities Average # of People Using Toilet
Faisalabad 6
Gujranwala 5
Lahore 6
Multan 7
Rawalpindi 7
Punjab Total 6
Islamabad 8
Quetta 9
Peshawar 9
Grand Total 8
Table 20b: Average # of People using Toilet in Underserved
Cities Average # of People Using Toilet
Faisalabad 6
Gujranwala 7
Lahore 7
Multan 7
Rawalpindi 8
Punjab Total 7
Islamabad 5
Quetta 10
Peshawar 11
Grand Total 8
Table 20c: Average # of People using Toilet in Slums and Underserved Areas (Total)
Cities Average # of People Using Toilet
Faisalabad 6
Gujranwala 6
Lahore 7
Multan 7
Rawalpindi 7
Punjab Total 7
Islamabad 7
Quetta 9
Peshawar 10
Grand Total 8
Table 21a: Modes of Defecation Without Toilet in Slums
Cities Neighbor’s Toilets Public Toilet Open Defecation Not Applicable Sub-Total
Faisalabad 0 0 21 148 169
Gujranwala 0 1 8 73 82
Lahore 0 0 43 313 356
Multan 1 2 6 207 216
Rawalpindi 0 1 7 68 76
Punjab Total 1 4 85 809 899
Islamabad 2 0 13 34 49
Quetta 1 2 26 252 281
Peshawar 0 0 66 484 550
Grand Total 4 6 190 1579 1779

73
Table 21b: Modes of Defecation Without Toilet in Underserved
Cities Neighbor’s Toilets Public Toilet Open Defecation Not Applicable Sub-Total
Faisalabad 0 0 18 279 297
Gujranwala 0 0 4 161 165
Lahore 0 0 18 619 637
Multan 0 0 2 102 104
Rawalpindi 0 1 2 59 62
Punjab Total 0 1 44 1220 1265
Islamabad 0 0 0 14 14
Quetta 0 0 0 34 34
Peshawar 0 0 1 21 22
Grand Total 0 1 45 1289 1335
Table 21c: Modes of Defecation Without Toilet in Slums/Underserved (Total)
Cities Neighbor’s Toilets Public Toilet Open Defecation Not Applicable Sub-Total
Faisalabad 0 0 39 427 466
Gujranwala 0 1 12 234 247
Lahore 0 0 61 932 993
Multan 1 2 8 309 320
Rawalpindi 0 2 9 127 138
Punjab Total 1 5 129 2029 2164
Islamabad 2 0 13 48 63
Quetta 1 2 26 286 315
Peshawar 0 0 67 505 572
Grand Total 4 7 235 2868 3114
Table 22a-: Condition of Drains in Slums
Cities Drains Have Running Water Drains Are Filthy/Choked # Of Areas With No Drains Sub-Total
Faisalabad 32 92 45 169
Gujranwala 14 38 30 82
Lahore 94 142 120 356
Multan 55 122 39 216
Rawalpindi 45 20 11 76
Punjab Total 240 414 245 899
Islamabad 14 16 19 49
Quetta 38 131 112 281
Peshawar 177 350 23 550
Grand Total 469 911 399 1779
Table 22b: Condition of Drains in Underserved
Cities Drains Have Running Water Drains Are Filthy/Choked # Of Areas With No Drains Sub-Total
Faisalabad 79 170 48 297
Gujranwala 25 91 49 165
Lahore 65 239 333 637
Multan 22 45 37 104
Rawalpindi 23 31 8 62
Punjab Total 214 576 475 1265
Islamabad 2 9 3 14
Quetta 11 18 5 34
Peshawar 8 13 1 22
Grand Total 235 616 484 1335
Table 22c: Condition of Drains in Slums and Underserved (Total)
Cities Drains have running water Drains are filthy/choked # of Areas with no drains Sub-Total
Faisalabad 111 262 93 466
Gujranwala 39 129 79 247
Lahore 159 381 453 993
Multan 77 167 76 320
Rawalpindi 68 51 19 138
Punjab Total 454 990 720 2164
Islamabad 16 25 22 63
Quetta 49 149 117 315
Peshawar 185 363 24 572
Grand Total 704 1527 883 3114

74
Table 23a: Solid Waste Disposal Practices in Slums
Cities Govt/WMC vehicle Other Systems Dumping on Empty Plot and Street Total
Faisalabad 48 6 115 169
Gujranwala 11 4 67 82
Lahore 169 4 183 356
Multan 80 3 133 216
Rawalpindi 26 0 50 76
Punjab Total 334 17 548 899
Islamabad 13 1 35 49
Quetta 15 6 260 281
Peshawar 164 56 330 550
Grand Total 526 80 1173 1779
*Note: The option of other includes burnt and buried
Table 23b: Solid Waste Disposal Practices in Underserved
Cities Govt/WMC vehicle Other Systems Dumping on Empty Plot and Street Total
Faisalabad 129 14 154 297
Gujranwala 33 14 118 165
Lahore 458 12 167 637
Multan 55 1 48 104
Rawalpindi 41 2 19 62
Punjab Total 716 43 506 1265
Islamabad 3 1 10 14
Quetta 8 0 26 34
Peshawar 7 4 11 22
Grand Total 734 48 553 1335
Table 23c: Solid Waste Disposal Practices in Slums and Underserved (Total)
Cities Govt/WMC vehicle Other Systems Dumping on Empty Plot and Street Total
Faisalabad 177 20 269 466
Gujranwala 44 18 185 247
Lahore 627 16 350 993
Multan 135 4 181 320
Rawalpindi 67 2 69 138
Punjab Total 1050 60 1054 2164
Islamabad 16 2 45 63
Quetta 23 6 286 315
Peshawar 171 60 341 572
Grand Total 1260 128 1726 3114
Table 24a: Schools in Slums and Underserved
Cities
Slums Underserved Areas
Available Not Available Total Slums Available Not Available Total
Underserved
Faisalabad 106 63 169 221 76 297
Gujranwala 57 25 82 98 67 165
Lahore 276 80 356 518 119 637
Multan 172 44 216 86 18 104
Rawalpindi 45 31 76 51 11 62
Punjab Total 656 243 899 974 291 1265
Islamabad 33 16 49 10 4 14
Quetta 145 136 281 23 11 34
Peshawar 459 91 550 22 0 22
Grand Total 1293 486 1779 1029 306 1335
Table 24 b: Schools in Slums and Underserved (Total)
Cities # of Areas With Schools # of Areas Without Schools Total slums/Underserved
Faisalabad 327 139 466
Gujranwala 155 92 247
Lahore 794 199 993
Multan 258 62 320
Rawalpindi 96 42 138
Punjab Total 1630 534 2164
Islamabad 43 20 63
Quetta 168 147 315
Peshawar 481 91 572
Grand Total 2322 792 3114

75
Table 25a: Types of Schools in Slums
Cities Government Private Welfare/Trust Maktab/Madrsa Other No Schools
Faisalabad 55 84 9 51 2 63
Gujranwala 32 27 0 6 0 25
Lahore 187 204 19 89 0 80
Multan 140 122 4 48 1 44
Rawalpindi 27 31 10 19 0 31
Punjab Total 441 468 42 213 3 243
Islamabad 24 16 8 5 0 16
Quetta 109 73 8 75 0 136
Peshawar 335 333 21 295 0 91
Grand Total 894 888 73 586 3 498
Table 25b: Types of Schools in Underserved
Cities Government Private Welfare/Trust Maktab/Madrsa Other No Schools
Faisalabad 112 194 27 111 1 76
Gujranwala 53 52 2 12 0 67
Lahore 293 426 41 230 1 119
Multan 61 69 6 33 0 18
Rawalpindi 32 41 6 19 0 11
Punjab Total 551 782 82 405 2 291
Islamabad 6 9 2 0 0 4
Quetta 22 18 2 11 0 11
Peshawar 20 17 0 17 0 0
Grand Total 600 828 84 433 2 316
Table 25c: Types of Schools in Slums and Underserved Areas (Total)
Cities Government Private Welfare/Trust Maktab/Madrsa Other No Schools
Faisalabad 167 278 36 162 3 139
Gujranwala 85 79 2 18 0 92
Lahore 480 630 60 319 1 199
Multan 201 191 10 81 1 62
Rawalpindi 59 72 16 38 0 42
Punjab Total 992 1250 124 618 5 534
Islamabad 30 25 10 5 0 20
Quetta 131 91 10 86 0 147
Peshawar 355 350 21 312 0 91
Grand Total 1494 1716 157 1019 5 810
Table 26a: Distance of Nearest School from Slums
Cities 0-2km 3km 4km 5+km Slums Without schools Sub Total
# # # # # #
Faisalabad 103 3 0 0 63 169
Gujranwala 57 0 0 0 25 82
Lahore 276 0 0 0 80 356
Multan 171 0 1 0 44 216
Rawalpindi 44 0 0 1 31 76
Punjab Total 651 3 1 1 243 899
Islamabad 33 0 0 0 16 49
Quetta 119 21 5 0 136 281
Peshawar 439 7 13 0 91 550
Grand Total 1242 31 19 1 486 1779
Table 26b: Distance of Nearest School from Underserved
Cities 0-2km 3km 4km 5+km Slums Without schools Sub Total
Faisalabad 221 0 0 0 76 297
Gujranwala 97 1 0 0 67 165
Lahore 505 9 0 4 119 637
Multan 84 2 0 0 18 104
Rawalpindi 51 0 0 0 11 62
Punjab Total 958 12 0 4 291 1265
Islamabad 10 0 0 0 4 14
Quetta 22 1 0 0 11 34
Peshawar 22 0 0 0 0 22
Grand Total 1012 13 0 4 306 1335

76
Table 26c: Distance of Nearest School and Slums/Underserved
0-2km 3km 4km 5+km Slums Without schools Sub Total
Faisalabad 324 3 0 0 139 466
Gujranwala 154 1 0 0 92 247
Lahore 781 9 0 4 199 993
Multan 255 2 1 0 62 320
Rawalpindi 95 0 0 1 42 138
Punjab Total 1609 15 1 5 534 2164
Islamabad 43 0 0 0 20 63
Quetta 141 22 5 0 147 315
Peshawar 461 7 13 0 91 572
Grand Total 2254 44 19 5 792 3114
Table 27: Availability of Working by CSOs
Cities Slums Underserved Areas Slum/Underserved Areas
Available Not Available Available Not Available Available Not Available
Faisalabad 2 167 13 284 15 451
Gujranwala 0 82 2 163 2 245
Lahore 10 346 28 609 38 955
Multan 0 216 1 103 1 319
Rawalpindi 3 73 1 61 4 134
Punjab Total 15 884 45 1220 60 2104
Islamabad 14 35 1 13 15 48
Quetta 0 281 0 34 0 315
Peshawar 4 546 0 22 4 568
Grand Total 33 1746 46 1289 79 3035
Table 28a: Types of Services by CSOs in Slums
Types of Services Faisalabad Gujranwala Lahore Multan Rawalpindi Punjab Total
Islamabad Quetta Peshawar
Education 1 0 2 0 1 4 4 0 3
Health 0 0 4 0 1 5 3 0 1
Human Rights 0 0 3 0 0 3 3 0 0
(Micro Loans) 1 0 1 0 0 2 2 0 0
Water 0 0 0 0 1 1 2 0 0
Areas with no charity organization
167 82 346 216 73 884 35 281 546
Total 169 82 356 216 76 899 49 281 550
Table 28b: Types of Services by CSOs in Underserved Areas
Types of Services Faisalabad Gujranwala Lahore Multan Rawalpi
ndi Punjab Total
Islamabad
Quetta Peshawar
Education 12 0 15 0 0 27 1 0 0
Health 0 1 6 1 1 9 0 0 0
Human Rights 0 1 6 0 0 7 0 0 0
Loans 0 0 1 0 0 1 0 0 0
Water 1 0 0 0 0 1 0 0 0
No CSO 284 163 609 103 61 1220 13 0 22
Grand Total 297 165 637 104 62 1265 14 0 22
Table 28c: Types of Services by CSOs in Slums/Underserved Areas (Total)
Types of Services Faisalabad Gujranwala Lahore Multan Rawalpindi Punjab Total
Islamabad Quetta Peshawar
Education 13 0 17 0 1 31 5 0 3
Health 1 1 10 1 2 14 3 0 1
Human Rights 0 1 9 0 1 10 3 0 0
Loans 1 0 2 0 0 3 2 0 0
Water 1 0 0 0 0 2 2 0 0
No CSO 453 245 955 319 134 2104 48 281 568
Grand Total 466 247 993 320 138 2164 63 281 572

77
Table 29: Presence of Informal Groups
Cities Slums Underserved Slum/Underserved (Total)
Available Not Available Available Not Available Available Not Available
Faisalabad 56 113 117 180 173 293
Gujranwala 26 56 36 129 62 185
Lahore 138 218 275 362 413 580
Multan 86 130 33 71 119 201
Rawalpindi 43 33 39 23 82 56
Punjab Total 349 550 500 765 849 1315
Islamabad 25 24 4 10 29 34
Quetta 42 239 2 32 44 271
Peshawar 150 400 10 12 160 412
Grand Total 566 1213 516 819 1082 2032
Table 30a: Type of Informal Groups in Slums
Types of Informal Groups Faisalabad Gujranwala Lahore Multan Rawalpindi Punjab Total
Islamabad Quetta Peshawar
Health Committee 5 5 62 12 0 84 0 0 1
Jirga/Punchaiyat 0 1 3 1 4 9 1 16 17
Masjid/Church Committee 34 15 43 37 27 156 18 23 77
School Committee 0 0 1 4 0 5 0 0 3
Unregistered Community-Based Organization
5 0 1 12 6 24 4 3 48
Zakat Committee 12 5 28 20 6 71 2 0 4
No Informal Groups or Committees
113 56 218 156 33 581 24 239 400
Total 169 82 356 216 76 899 49 281 550
Table 30b: Types of Informal Groups in Underserved Areas
Types of Informal Groups
Faisalabad Gujranwala Lahore Multan Rawalpindi Punjab Total
Islamabad Quetta Peshawar
Health Committee 1 0 18 0 1 20 0 0 0
Jirga/Punchaiyat 1 2 3 0 0 6 0 0 4
Masjid/ChurchCommittee 76 26 87 24 34 247 0 2 4
School Committee 0 0 0 0 0 0 4 0 0
Unregistered Community-Based Organization
0 0 75 1 0 76 0 0 2
Zakat Committee 39 8 92 8 4 151 0 0 0
No Informal Groups or Committees
180 129 362 71 23 765 10 32 12
Grand Total 297 165 637 104 62 1265 14 34 22
Table 30c: Types of Informal Groups in Slums/Underserved Areas
Types of Informal Groups
Faisalabad Gujranwala Lahore Multan Rawalpindi Punjab Total Islamabad Quetta Peshawar
Health Committee 6 5 80 12 1 104 0 0 1
Jirga/Punchaiyat 1 3 6 1 4 15 1 16 21
Masjid/Church Committee
110 41 130 61 61 403 18 25 81
School Committee 0 0 1 4 0 5 4 0 3
Unregistered Community-Based Organization
5 0 76 13 6 100 4 3 50
Zakat Committee 51 13 120 28 10 222 2 0 4
No Informal Groups or Committees
293 185 580 227 56 1346 34 271 412
Grand Total 466 247 993 320 138 2164 63 315 572

78
Table 31: Availability of Welfare Scheme by Government
Cities
Slums Underserved Areas Slums/Underserved
Total Slums
Covered Uncovered Total
Underserved Covered Uncovered
Total slums/Underserved
Covered Uncover
ed
Faisalabad 169 56 113 297 136 161 466 192 274
Gujranwala 82 40 42 165 97 68 247 137 110
Lahore 356 145 211 637 512 125 993 657 336
Multan 216 80 136 104 28 76 320 108 212
Rawalpindi 76 29 47 62 22 40 138 51 87
Punjab Total
899 350 549 1265 795 470 2164 1145 1019
Islamabad 49 21 28 14 4 10 63 25 38
Quetta 281 34 247 34 0 34 315 34 281
Peshawar 550 299 251 22 9 13 572 308 264
Grand Total 1779 704 1075 1335 808 527 3114 1512 1602
Table 32: Types of Welfare Schemes by Government
Cities Type of work Loan Scheme Stipend Scheme
Social Benefit Card
Vocational Skills Scheme
Other
Yes No Yes No Yes No Yes No Yes No
Faisalabad Slum 10 0 4 1 40 3 2 2 0 4
Underserved 15 0 20 2 101 2 0 2 0 2
Gujranwala Slum 13 2 5 2 20 2 1 1 1 1
Underserved 6 8 20 8 60 8 6 2 5 4
Lahore Slum 15 1 30 2 100 1 0 2 0 2
Underserved 82 7 78 11 345 15 5 15 2 20
Multan Slum 4 2 14 2 60 1 2 2 0 4
Underserved 1 2 1 2 24 2 2 1 0 3
Rawalpindi Slum 1 1 7 1 20 2 1 1 0 2
Underserved 2 0 2 0 18 0 0 0 0 0
Punjab Total
Slum 43 6 60 8 240 9 6 8 1 13
Underserved 106 17 121 23 548 27 13 20 7 29
Total 149 23 181 31 788 36 19 28 8 42
Islamabad
Slum 0 21 1 20 20 1 0 21 0 21
Underserved 1 3 1 3 2 0 0 4 0 4
Total 1 24 2 23 22 1 0 25 0 25
Quetta
Slum 0 2 0 2 32 2 2 0 0 2
Underserved 0 0 0 0 0 0 0 0 0 0
Total 0 2 0 2 32 2 2 0 0 2
Peshawar
Slum 5 294 38 261 250 13 6 293 0 299
Underserved 0 9 0 9 9 0 0 9 0 9
Total 5 303 38 270 259 13 6 302 0 308
Grand Total
Slum 48 323 99 291 542 25 14 322 1 335
Underserved 107 29 122 35 559 27 13 33 7 42
Total 155 352 221 326 1101 52 27 355 8 377

79
Annex 5: Analysis of Health Resources of Union Councils
Table 1: Town Wise Number of UCs with/ without Slums/ Underserved
Faisalabad
Town Total UCs
Iqbal Town 28
Jinnah Town 30
Laylpur Town 22
Madina Town 33
Total 113
Gujranwala
Town Total UCs
Aroop 17
Khaili Shah Pur 13
Nandipur 15
Qila Didar Singh 19
Total 64
Lahore
Town Total UCs
Allama Iqbal 20
Aziz Bhatti 13
Cantt 15
Data Gunj Bukhsh 18
Gulberg 15
Nishter 18
Ravi 19
Samanabad 19
Shalamar 17
Wagha 12
Total 166
Multan
Town Total UCs
Bosan 10
Mumtazabad 13
Shah Rukn-e-Alam 15
Sher Shah 12
Total 50
Rawalpindi
Town Total UCs
Cantt 1
Rawal 45
Potohar 14
Total 60
Islamabad
Town Total UCs
NA 26
Peshawar
Town Total UCs
Town 1 25
Town 2 25
Town 3 26
Town 4 21
Total 97
Quetta
Town Total UCs
Chiltan 24
Zarghoon 26
Total 50
Grand Total 626

80
Table 1b: Status of Slums/Underserved in Union Councils
Cities UCs with Slums/Underserved UCs without Slums/Underserved Total
Faisalabad 86 27 113
Gujranwala 58 6 64
Lahore 127 39 166
Multan 36 14 50
Rawalpindi 44 16 60
Islamabad 20 6 26
Peshawar 85 12 97
Quetta 22 28 50
Total 478 148 626
Table 2: Town wise Number of UCs and Population
Faisalabad
Town Total UCs Population
Iqbal Town 28 710089
Jinnah Town 30 766943
Laylpur Town 22 551786
Madina Town 33 879567
Total 113 2908385
Gujranwala
Aroop 17 452563
Khaili Shah Pur 13 430561
Nandipur 15 345407
Qila Didar Singh 19 415233
Total 64 1643764
Lahore
Allama Iqbal 20 1424271
Aziz Bhatti 13 705344
Cantt 15 897475
Data Gunj Bukhsh 18 772646
Gulberg 15 667087
Nishter 18 1226667
Ravi 19 1079025
Samanabad 19 936732
Shalamar 17 929103
Wagha 12 791224
Total 166 9429574
Multan
Bosan 10 316403
Mumtazabad 13 471800
Shah Rukn-e-Alam 15 504565
Sher Shah 12 375673
Total 50 1668441
Rawalpindi
Cantt 1 32550
Rawal 45 1054651
Potohar 14 604718
Total 60 1691919
Islamabad
26 1529887
Peshawar
Town 1 25 767029
Town 2 25 1185663
Town 3 26 982311
Town 4 21 941093
Total 97 3876096
Quetta
Chiltan 24 1145777
Zarghoon 26 1301752
Total 50 2447529

81
Table 3: Population of UCs
Cities Population
Faisalabad 2,908,385
Gujranwala 1,643,764
Lahore 9,429,574
Multan 1,668,441
Rawalpindi 1,691,919
Islamabad 1,529,887
Peshawar 3,876,096
Quetta 2,447,529
Grand Total 22,214,607
Table 4: Number of Health Facilities in UCs
Cities Health Facilties in Total UCs
Faisalabad 52
Gujranwala 29
Lahore 217
Multan 45
Rawalpindi 32
Islamabad 30
Peshawar 110
Quetta 63
Grand Total 578
Table 4a: UCs with/ without Health Facilities
Cities # of UCs with Health Facilities # of UCs without Health Facilities
Faisalabad 52 61 113
Gujranwala 19 45 64
Lahore 160 6 166
Multan 34 16 50
Rawalpindi 28 32 60
Islamabad 17 9 26
Peshawar 80 17 97
Quetta 40 10 50
Grand Total 430 196 626
Table 5: Number of EPI Facilities
Cities Public EPI Facilities
Faisalabad 67
Gujranwala 18
Lahore 220
Multan 45
Rawalpindi 29
Islamabad 24
Peshawar 120
Quetta 69
Grand Total 592
Table 6: UCs with/ without EPI Facilities
Cities # of UCs with EPI Facilities # of UCs without EPI Facilities Total
Faisalabad 62 51 113
Gujranwala 18 46 64
Lahore 165 1 166
Multan 34 16 50
Rawalpindi 29 31 60
Islamabad 18 8 26
Peshawar 94 3 97
Quetta 41 9 50
Grand Total 461 165 626

82
Table 7 : Availability of Functional ILR/Refrigerator in Fixed EPI Facility
Cities EPIs with Functional ILR EPIs without Functional ILR Total
Faisalabad 67 0 67
Gujranwala 18 0 18
Lahore 220 0 220
Multan 45 0 45
Rawalpindi 27 2 29
Islamabad 24 0 24
Peshawar 111 9 120
Quetta 67 2 69
Grand Total 579 13 592
Table 8: Outreach Vaccination Services
Cities UCs with Outreach Vaccination Total UCs
Faisalabad 113 113
Gujranwala 64 64
Lahore 166 166
Multan 50 50
Rawalpindi 60 60
Islamabad 16 26
Peshawar 97 97
Quetta 50 50
Grand Total 616 626
Table 9a Nutrition Services
Cities Available in UCs Not Available in UCs Total
Faisalabad 63 50 113
Gujranwala 19 45 64
Lahore 166 0 166
Multan 34 16 50
Rawalpindi 28 32 60
Islamabad 13 13 26
Peshawar 64 33 97
Quetta 9 41 50
Grand Total 396 230 626
Table 9b: Types of Nutrition Services in UCs
Cities Fixed Temporary Sites School Session Sessions by LHWs No Nutrition Services
Faisalabad 63 0 0 0 50
Gujranwala 19 0 0 0 45
Lahore 12 0 22 144 0
Multan 34 0 0 0 16
Rawalpindi 28 0 0 28 32
Islamabad 5 0 0 8 13
Peshawar 0 0 2 64 33
Quetta 1 9 9 9 41
Grand Total 162 9 33 263 230
Table 10: Number of Vaccinators in Public Health Facilities
Cities Total EPI Facilities Total Vaccinators
Faisalabad 67 75
Gujranwala 18 19
Lahore 220 356
Multan 45 45
Rawalpindi 29 29
Islamabad 24 41
Peshawar 120 246
Quetta 69 120
Grand Total 592 931

83
Table 11: Number of UCs Covered by LHWs
Cities UCs Covered by LHWs UCs Uncovered by LHWs Total UCs Total Number of LHWs
Faisalabad 69 44 113 173
Gujranwala 55 9 64 64
Lahore 163 3 166 1335
Multan 42 8 50 265
Rawalpindi 29 31 60 135
Islamabad 14 12 26 145
Peshawar 64 33 97 1160
Quetta 31 19 50 516
Grand Total 467 159 626 3793
Table 12: Availability of Dengue Workers
Cities Dengue Workers Available in UCs Dengue Workers not Available in UCs Total UCs
Faisalabad 113 0 113
Gujranwala 64 0 64
Lahore 166 0 166
Multan 50 0 50
Rawalpindi 60 0 60
Islamabad NA NA NA
Peshawar 97 0 97
Quetta 0 50 50
Grand Total 550 50 600

84
Annex 6: Analysis of Results of EPI Facility Assessment Table 1: Number of EPI Facilities
Names of Towns Number of UCs UCs with EPI Facilities Number of EPI Facilities
Faisalabad
Iqbal Town 28 17 9
Jinnah Town 30 22 0
Laylpur Town 22 19 11
Madina Town 33 28 14
Total 113 86 34
Gujranwala
Aroop 17 16 3
Khaili Shah Pur 13 13 4
Nandipur Town 15 11 5
Qila Didar Singh 19 18 6
Total 64 58 18
Lahore
Allama Iqbal 20 20 20
Aziz Bhatti 13 12 11
Cantt 15 1 0
Data Gunj Bukhsh 18 15 18
Gulberg 15 14 15
Nishter 18 15 19
Ravi 19 18 15
Samanabad 19 15 11
Shalamar 17 14 13
Wagha 12 3 5
Total 166 127 127
Multan
Bosan Town 10 4 4
Mumtaz abad 13 10 8
Shah Rukn Alam 15 13 12
Sher Sha 12 9 6
Total 50 36 30
Rawalpindi
Cantt 1 1 0
Rawal 45 32 10
Potohar 14 11 9
Total 60 44 19
Islamabad
NA 26 21 24
Quetta
Chiltan 24 11 29
Zarghoon 26 11 25
Total 50 22 54
Peshawar
Town 1 25 23 28
Town 2 25 25 29
Town 3 26 21 36
Town 4 3 3 23
Total 79 72 116
Table 2: Status of Ownership of Building of EPI Facilities
City Owned Rented Total
Faisalabad 34 0 34
Gujranwala 9 9 18
Lahore 120 7 127
Multan 17 13 30
Rawalpindi 19 0 19
Sub total – Punjab 199 23 228
Islamabad 19 5 24
Quetta 50 4 54
Peshawar 91 25 116
Grand Total 359 63 422
Note: 2 EPI Centres are donated by Peshawar University & Family Medical Care Centre

85
Table 3 Types of EPI Facilities
City Government Private Charity Total
Faisalabad 34 0 0 34
Gujranwala 18 0 0 18
Lahore 120 7 0 127
Multan 30 0 0 30
Rawalpindi 19 0 0 19
Sub total - Punjab 221 7 0 228
Islamabad 19 5 0 24
Quetta 52 0 2 54
Peshawar 114 0 2 116
Grand Total 406 12 4 422
Note: There is 1 EPI Centre Other than mentioned variables
Table 4: Average Working Hours of EPI Facilities
City Less than 6 Hours 6 Hours Total
Faisalabad 0 34 34
Gujranwala 1 17 18
Lahore 2 125 127
Multan 0 30 30
Rawalpindi 1 18 19
Sub total - Punjab 4 224 228
Islamabad 6 18 24
Quetta 37 17 54
Peshawar 11 105 116
Grand Total 58 364 422
Table 5: Availability of Standard Operating Procedures
City Available Not Available Total
Faisalabad 27 7 34
Gujranwala 2 16 18
Lahore 62 65 127
Multan 10 20 30
Rawalpindi 7 12 19
Sub total - Punjab 108 120 228
Islamabad 4 20 24
Quetta 10 44 54
Peshawar 52 64 116
Grand Total 174 248 422
Table 6: Availability of LHVs in EPI Facilities
City Available Not Available Total Total # of LHVs
Faisalabad 26 8 34 31
Gujranwala 4 14 18 5
Lahore 72 55 127 81
Multan 18 12 30 21
Rawalpindi 14 5 19 20
Sub total - Punjab 134 94 228 158
Islamabad 19 5 24 31
Quetta 32 22 54 45
Peshawar 74 42 116 143
Grand Total 259 163 422 377
LHVs are deployed according to the status of health facility. If some facilities offer only vaccination services then LHVs are not deployed there as per government system.
Table 7: Availability of Vaccinators in EPI Facilities
City Available Not Available Total Total # of Vaccinators
Faisalabad 34 0 34 40
Gujranwala 18 0 18 23
Lahore 127 0 127 225
Multan 30 0 30 31
Rawalpindi 19 0 19 19
Sub total - Punjab 228 0 228 338
Islamabad 21 3 24 31
Quetta 54 0 54 99
Peshawar 116 0 116 264
Grand Total 419 3 422 732

86
Table 8: Vaccine Supplies
Cities Availability of Types of Vaccine Supplies
Auto Disable Syringes Safety Boxes/ Sharp Containers Vaccine Carrier (s) Icepacks
Faisalabad 34 34 34 34
Gujranwala 17 18 18 18
Lahore 127 127 124 125
Multan 30 30 30 27
Rawalpindi 15 19 17 17
Sub total - Punjab 223 228 223 221
Islamabad 23 24 24 24
Quetta 54 54 53 50
Peshawar 105 112 115 114
Grand Total 405 418 415 409
Table 9: Supply of Vaccines
City Infrequent Shortage Frequent Shortage No Shortage Total
Faisalabad 1 0 33 34
Gujranwala 15 0 3 18
Lahore 0 0 127 127
Multan 0 0 30 30
Rawalpindi 0 0 19 19
Sub total - Punjab 16 0 212 228
Islamabad 0 0 24 24
Quetta 16 3 35 54
Peshawar 17 2 97 116
Grand Total 49 5 368 422
Table 10: Availability of Ice Lined Refrigerators
City Available Functional Available Non-Functional Not Available Total
Faisalabad 34 0 0 34
Gujranwala 18 0 0 18
Lahore 127 0 0 127
Multan 30 0 0 30
Rawalpindi 17 2 0 19
Sub total - Punjab 226 2 0 228
Islamabad 24 0 0 24
Quetta 52 2 0 54
Peshawar 107 9 0 116
Grand Total 409 13 0 422
Table 11: Availability of Waiting Areas
City Gender Mixed Waiting Area Gender Segregated Waiting Area Total
Faisalabad 22 12 34
Gujranwala 14 4 18
Lahore 93 34 127
Multan 12 18 30
Rawalpindi 8 11 19
Sub total - Punjab 149 79 228
Islamabad 13 11 24
Quetta 28 26 54
Peshawar 60 56 116
Grand Total 250 172 422
Table 12: Seating Capacity of Waiting Areas in EPI Facilities
City Adequate Inadequate Total
Faisalabad 21 13 34
Gujranwala 10 8 18
Lahore 80 47 127
Multan 21 9 30
Rawalpindi 13 6 19
Sub total - Punjab 145 83 228
Islamabad 20 4 24
Quetta 34 20 54
Peshawar 73 43 116
Grand Total 272 150 422
Note: 12 EPI Facilities having no waiting areas

87
Table 13: Availability of Drinking Water
City Available Not Available Total
Faisalabad 30 4 34
Gujranwala 5 13 18
Lahore 74 53 127
Multan 17 13 30
Rawalpindi 16 3 19
Sub total - Punjab 142 86 228
Islamabad 19 5 24
Quetta 28 26 54
Peshawar 87 29 116
Grand Total 276 146 422
Table 14: Availability of Toilets
City Gender Segregated
Available Gender Mixed Available Not Available Total
Faisalabad 11 23 0 34
Gujranwala 3 8 7 18
Lahore 50 32 45 127
Multan 15 5 10 30
Rawalpindi 9 2 8 19
Sub total - Punjab 88 70 70 228
Islamabad 17 5 2 24
Quetta 30 10 14 54
Peshawar 45 47 24 116
Grand Total 180 132 110 422
Table 15: Usability of Toilet
Cities Useable Not Useable Toilet Not Available Total
Faisalabad 32 2 0 34
Gujranwala 8 3 7 18
Lahore 72 10 45 127
Multan 14 6 10 30
Rawalpindi 11 0 8 19
Sub total - Punjab 137 21 70 228
Islamabad 20 2 2 24
Quetta 33 7 14 54
Peshawar 61 31 24 116
Grand Total 251 61 110 422
Table 16: Waste Management Practices
City Buries/Burnt WMC Vehicle Total
Faisalabad 34 0 34
Gujranwala 18 0 18
Lahore 124 3 127
Multan 24 6 30
Rawalpindi 19 0 19
Sub total - Punjab 219 9 228
Islamabad 24 0 24
Quetta 54 0 54
Peshawar 116 0 116
Grand Total 413 9 422

s
Related Documents