SD 2.12.04 Report No. 768 Soils Proficiency Testing Round 14 July 2012 Acknowledgments PTA wishes to gratefully acknowledge the technical assistance provided for this program by Mr G Hooper, Golder Associates Pty Ltd. Also our thanks go to The Nielson Group for the supply of the samples. © Copyright Proficiency Testing Australia, 2012 PO Box 7507 SILVERWATER NSW 2128, Australia

Welcome message from author
This document is posted to help you gain knowledge. Please leave a comment to let me know what you think about it! Share it to your friends and learn new things together.
Transcript

SD 2.12.04
Report No. 768
Soils Proficiency Testing
Round 14
July 2012
Acknowledgments
PTA wishes to gratefully acknowledge the technical assistance provided for this program by Mr G Hooper, Golder Associates Pty Ltd. Also our thanks go to The Nielson Group for the supply of the samples.
© Copyright Proficiency Testing Australia, 2012
PO Box 7507 SILVERWATER NSW 2128, Australia

SD 2.12.04
CONTENTS
1. FOREWORD .................................................................................................................. 1
2. FEATURES OF THE PROGRAM ................................................................................... 1
3. FORMAT OF THE APPENDICES ................................................................................... 2
4. STATISTICAL DESIGN OF THE PROGRAM ................................................................. 2
5. PTA AND TECHNICAL ADVISOR’S COMMENTS .......................................................... 3
Table A: Summary Statistics .......................................................................................... 4
Table D: Analysis of Grouped Methods .......................................................................... 5
Table E: California Bearing Ration by Round Comparison ............................................. 7
6. OUTLIER RESULTS ....................................................................................................... 8
Table F: Summary of Statistical Outliers ........................................................................ 8
7. REFERENCE/S .............................................................................................................. 9
APPENDIX A – Results and Data Analysis
Apparent Particle Density….......................................................................................... …A1
Liquid Limit…................................................................................................................ …A3
Plastic Limit.................................................................................................................. …A6
Plasticity Index............................................................................................................. …A8
Linear Shrinkage......................................................................................................... …A11
California Bearing Ratio at 2.5mm............................................................................... …A14
California Bearing Ratio at 5.0mm............................................................................... …A16
Achieved Dry Density before soaking.......................................................................... …A18
Achieved Moisture Content before soaking................................................................. …A20
Other Information........................................................................................................ …A22
APPENDIX B – Homogeneity Testing
Homogeneity Testing................................................................................................... …B1
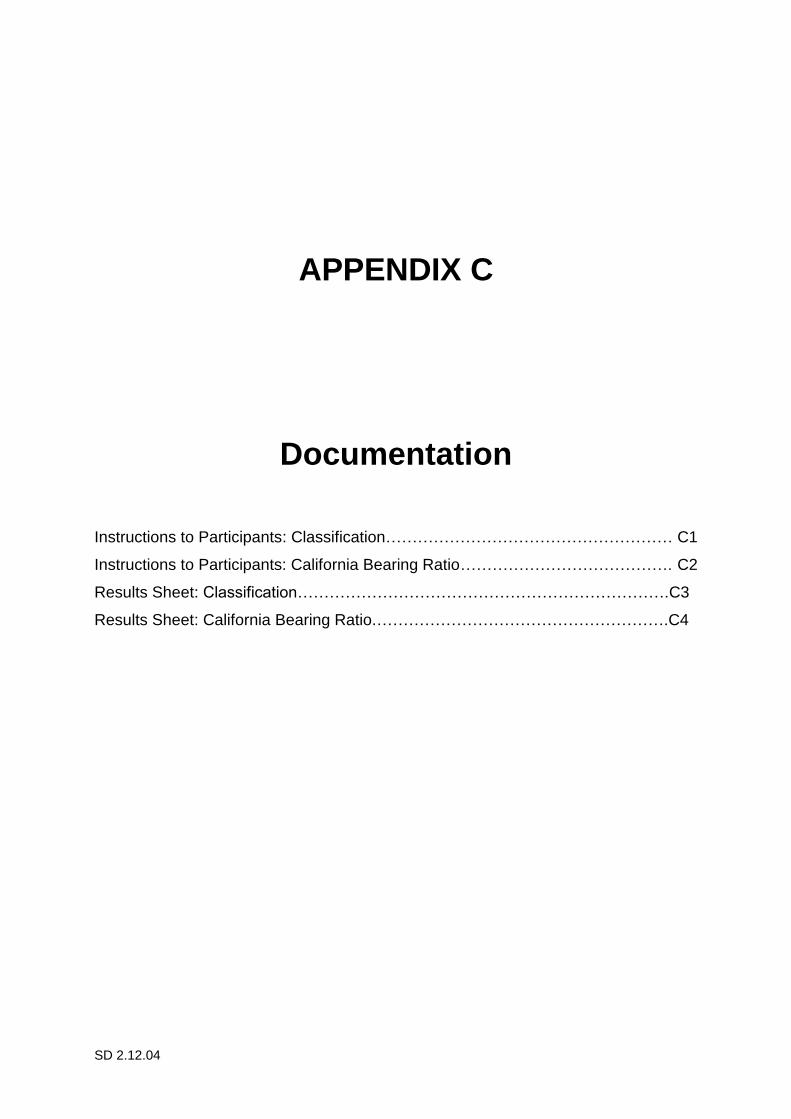
APPENDIX C – Documentation
Instructions to Participants: Classification...................................................................... …C1
Instructions to Participants: California Bearing Ratio...................................................... …C2
Results Sheet: Classification.......................................................................................... …C3
Results Sheet: California Bearing Ratio.......................................................................... …C4

1
SD 2.12.04
1. FOREWORD
This report summarises the results of a proficiency testing program on the determination of Classification and California Bearing Ratio (CBR) on a soil sample. It constitutes the fourteenth round of an ongoing series of programs. The program was conducted in May 2012 by Proficiency Testing Australia (PTA). The aim of the program was to assess laboratories’ abilities to competently perform the prescribed analyses. The Program Coordinator was Ms L Galbraith and the Technical Advisor was Mr G Hooper, Golder Associates Pty Ltd. This report was authorised by Dr M Bunt, PTA Statistician.
2. FEATURES OF THE PROGRAM (a) Participants were provided with 1 labelled soil sample containing a clayey
gravel mix. (b) A total of 63 laboratories received samples, comprising:
- 62 Australian participants; and
- 1 Papua New Guinean participant.
Of these 63 laboratories, 7 were unable to submit results by the due date. (c) Laboratories were provided with the Instructions to Participants and Results
Sheet (see Appendix C). Laboratories were requested to perform the tests according to their routine methods and to record their results on the Results Sheet.
(d) Prior to sample distribution, a number of randomly selected samples were
analysed for homogeneity. Based on the results of this testing (see Appendix B), the homogeneity of the samples was established.
(e) Each laboratory was randomly allocated a unique code number for the
program to ensure confidentiality of results. Reference to each laboratory in this report is by code number only. Please note that a number of laboratories reported more than one set of results and, therefore, their code numbers (with letter) could appear several times in the same data set.
(f) Results (as reported by participants) with corresponding summary statistics
(i.e. number of results, median, uncertainty of the median, normalised interquartile range, robust coefficient of variation, minimum, maximum and range) are presented in Appendix A (for each sample and for each of the analyses performed.
2
SD 2.12.04
(g) A robust statistical approach, using z-scores, was utilised to assess laboratories’ testing performance (see Section 3). Robust z-scores and z-score charts relevant to each test are presented in Appendix A.
(h) The document entitled Guide to Proficiency Testing Australia, 2011 (reference
[1]) defines the statistical terms and details the statistical procedures referred to in this report.
(i) A tabulated listing of laboratories (by code number) identified as having outlier
results can be found on page 8.
3. FORMAT OF THE APPENDICES
(a) Appendix A contains the analysis of results reported by laboratories for the
samples. This section contains the following for each determinant, where appropriate: - a table of results and calculated z-scores;
- a list of summary statistics; and
- ordered z-score charts.
(b) Appendix B contains details of the homogeneity testing. (c) Appendix C contains copies of the Instructions to Participants and Results
Sheet.
4. STATISTICAL DESIGN OF THE PROGRAM (a) Outlier Results and Z-scores In order to assess laboratories’ testing performance, a robust statistical
approach, using z-scores, was utilised. Z-scores give a measure of how far a result is from the consensus value (i.e. the median), and gives a "score" to each result relative to the other results in the group.
A z-score close to zero indicates that the result agrees well with those from
other laboratories. Whereas, a z-score with an absolute value greater than or
equal to 3.0 is considered to be an outlier and is marked by the symbol “§”. (b) Results Tables and Summary Statistics Each of these tables contains the results returned by each laboratory,
including the code number for the method used, and the robust z-score calculated for each result.

3
SD 2.12.04
Results have been entered exactly as reported by participants. That is, laboratories which did not report results to the precision (i.e. number of
significant figures) requested on the Results Sheet have not been rounded to the requested precision before being included in the statistical analysis.
A list of summary statistics appears at the bottom of each of the tables of results and consists of:
- the number of results for that test/sample (No. of Results);
- the median of these results, i.e. the middle value (Median);
- the uncertainty of the median;
- the normalised interquartile range of the results (Normalised IQR);
- the robust coefficient of variation, expressed as a percentage (Robust CV) - i.e. 100 x Normalised IQR / Median;
- the minimum and maximum laboratory results; and
- the range (Maximum - Minimum).
The median is a measure of the centre of the data. The normalised IQR is a measure of the spread of the results. It is calculated by multiplying the interquartile range (IQR) by a correction factor which converts the IQR to an estimate of the standard deviation. The IQR is the difference between the upper and lower quartiles (i.e. the values above and below which a quarter of the results lie, respectively).
Please see reference [1] for further details on these robust summary statistics.
(c) Ordered Z-Score Charts On these charts each laboratory's robust z-score is shown, in order of
magnitude, and is marked with its code number. From these charts, each laboratory can readily compare its performance relative to the other laboratories.
These charts contain solid lines at +3.0 and -3.0, so that outliers are clearly
identifiable as those laboratories whose "bar" extends beyond these "cut-off" lines. The y-axis of these charts has been limited, so very large z-scores appear to extend beyond the chart boundary.
5. PTA AND TECHNICAL ADVISOR’S COMMENTS Analysis of Results by Method Groups Due to differences in the methods used by participants, results were grouped and analysed separately as Method 1 or Method 2. Method 1 includes the AS methods (relevant sections) and equivalent methods and Method 2 includes Q methods (relevant sections).

4
SD 2.12.04
No other methods were so prevalent in these groups that they could be analysed according to the method. The following table summarises the results submitted by participants for the program.
TABLE A: SUMMARY STATISTICS METHOD 1
Test No. of Results Median Normalised IQR
Liquid Limit (nearest 1%) 39 40.0 3.0
Linear Shrinkage (0.5%) 39 8.00 2.04
Plasticity Index (nearest 1%) 39 17.0 4.8
TABLE B: SUMMARY STATISTICS METHOD 2
Test No. of Results Median Normalised IQR
Liquid Limit (nearest 1%) 15 40.0 1.9
Linear Shrinkage (0.5%) 15 8.00 0.56
Plasticity Index (nearest 1%) 15 15.0 3.3
For the remaining tests as part of Soils Round 14, methods were grouped together. It has been found that there are little differences between methods and thus could be analysed as part of one consensus. The following table summarises the results submitted by participants for the program.

5
SD 2.12.04
TABLE C: SUMMARY STATISTICS ALL METHODS
Test No. of Results Median Normalised IQR
Apparent Particle Density (0.01 g/cm
3)
23 2.780 0.080
Plastic Limit (nearest 1%) 54 23.5 3.0
California Bearing Ratio @ 2.5mm (1%)
51 10.0 6.7
California Bearing Ratio @ 5.0mm (1%)
51 13.0 7.0
Achieved Dry Density before soaking (0.001 t/m
3)
51 1.8540 0.0056
Achieved Moisture Content (0.1%)
51 16.80 0.37
Grouped analysis was performed for methods appearing greater than or equal to 10 times in each test. The results are tabulated below.
TABLE D: ANALYSIS OF GROUPED METHODS
Test Grouped
method
No. of results Median Normalised
IQR Apparent
Particle Density (0.01 g/cm
3)
AS1289.3.5.1 13 2.720 0.193
Plastic Limit (nearest 1%)
AS1289.3.2.1
Q105
37
11
23.0
24.0
3.0
1.9 California
Bearing Ratio @ 2.5mm (1%)
AS1289.6.1.1 32 9.5 6.9
California Bearing Ratio @
5.0mm (1%) AS1289.6.1.1 28 13.0 6.9
Achieved Dry Density before
soaking (0.001 t/m
3)
AS1289.6.1.1 26 1.8555 0.0044
Achieved Moisture
Content (0.1%)
AS1289.6.1.1
AS1289.2.1.1
16
11
16.85
16.80
0.46
0.11

6
SD 2.12.04
Results returned for Soils Round 14 Proficiency Testing Program included Australian Standards (AS) and another predominate method (Q method). Due to the differences in each method the AS test method and Q test method were split into two separate consensus groups for tests relating to Sample 1: Classification. For Sample 2: California Bearing Ratio (CBR), both AS and the Q method were analysed together in the same consensus group.
5.1 Apparent Particle Density
Three outliers were reported for this test. Laboratory code 78 is encouraged to review their procedures.
5.2 Liquid Limit, Plastic Limit and Plasticity Index
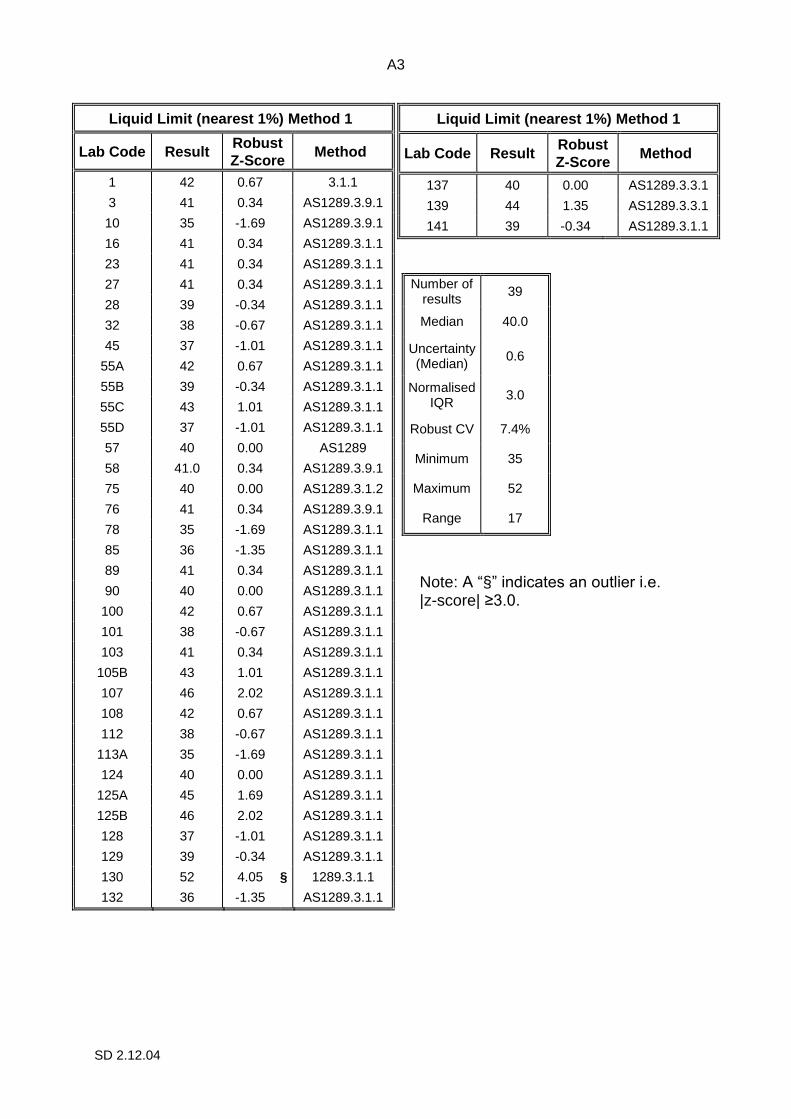
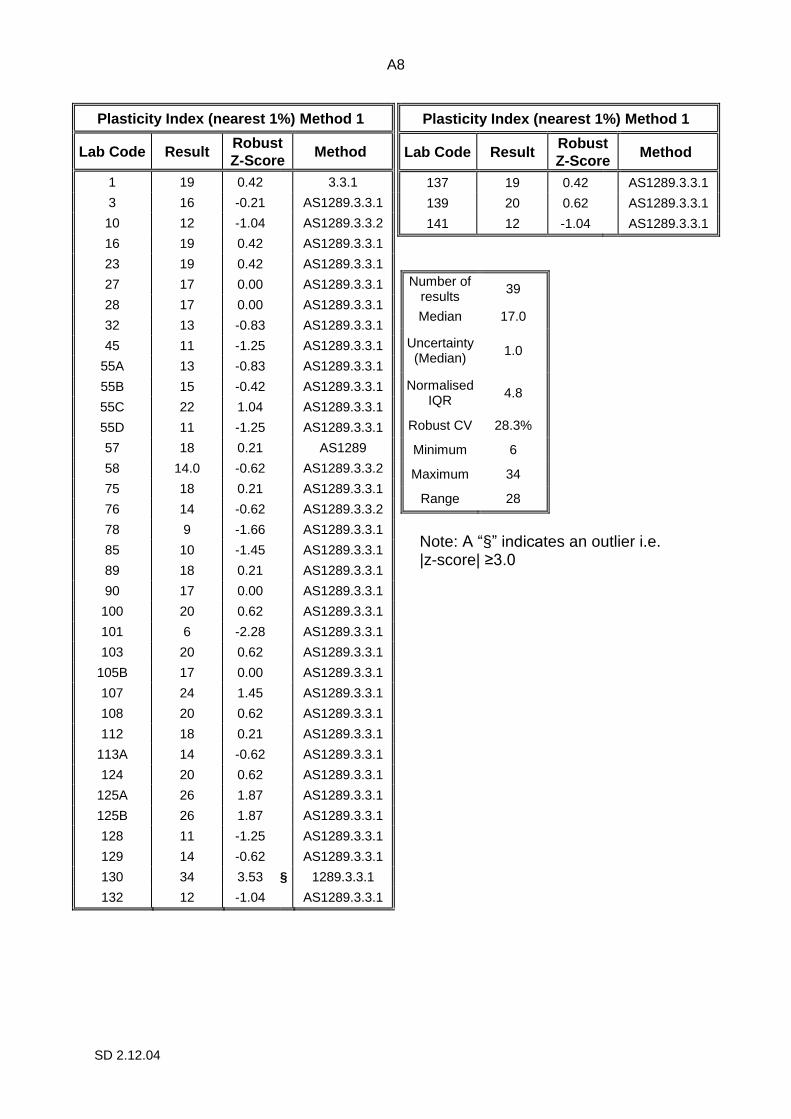
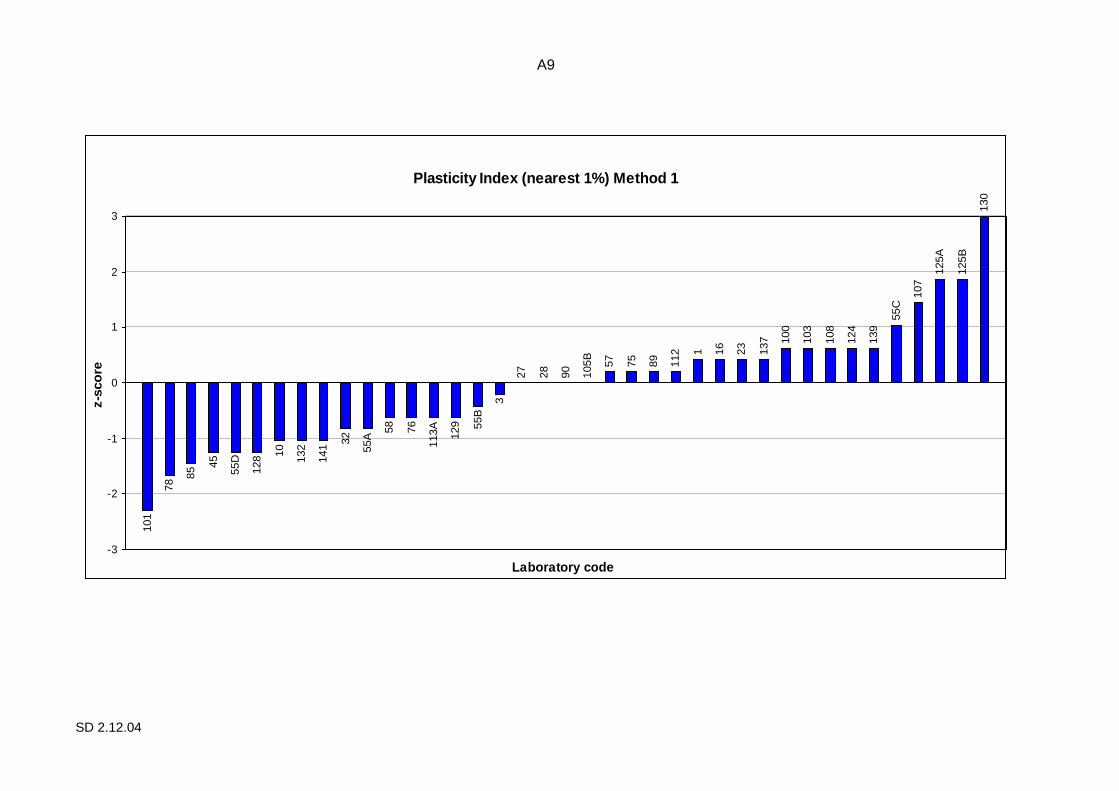
Method one received one outlier for Liquid Limit and one outlier for Plasticity Index. Method two received one outlier for Liquid Limit. No outliers were reported for Plastic Limit. Laboratory Code 130 is encouraged to review their procedures for Plasticity Index. Plasticity Index is the calculation of the difference between the Liquid Limit (LL) and the Plastic Limit (PL) i.e. LL-PL. Thus Laboratory Code 130 may need to review its procedures for Liquid Limit in particular.
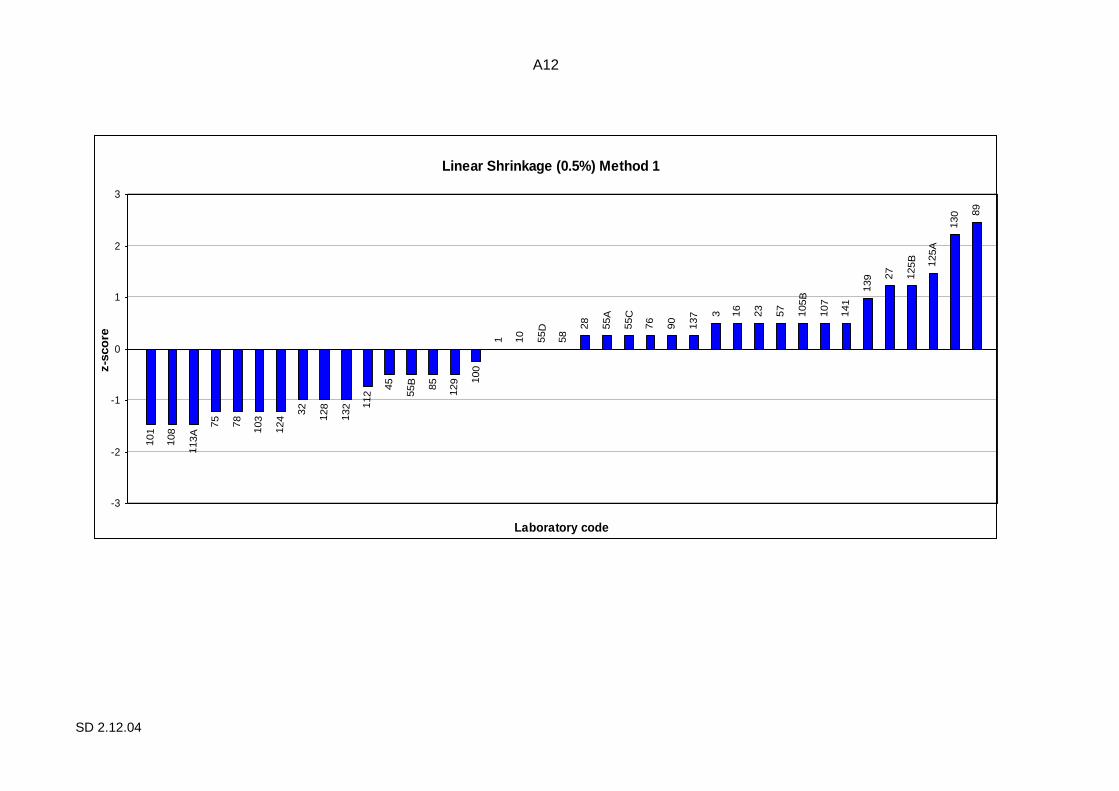
5.3 Linear Shrinkage and Linear Shrinkage Mould Length
Laboratory Code 61 and 122 received an outlier for Linear Shrinkage and was the only two outliers received in both method groups. No statistical analysis was performed on Linear Shrinkage Mould Length as it was for informational purposes only.
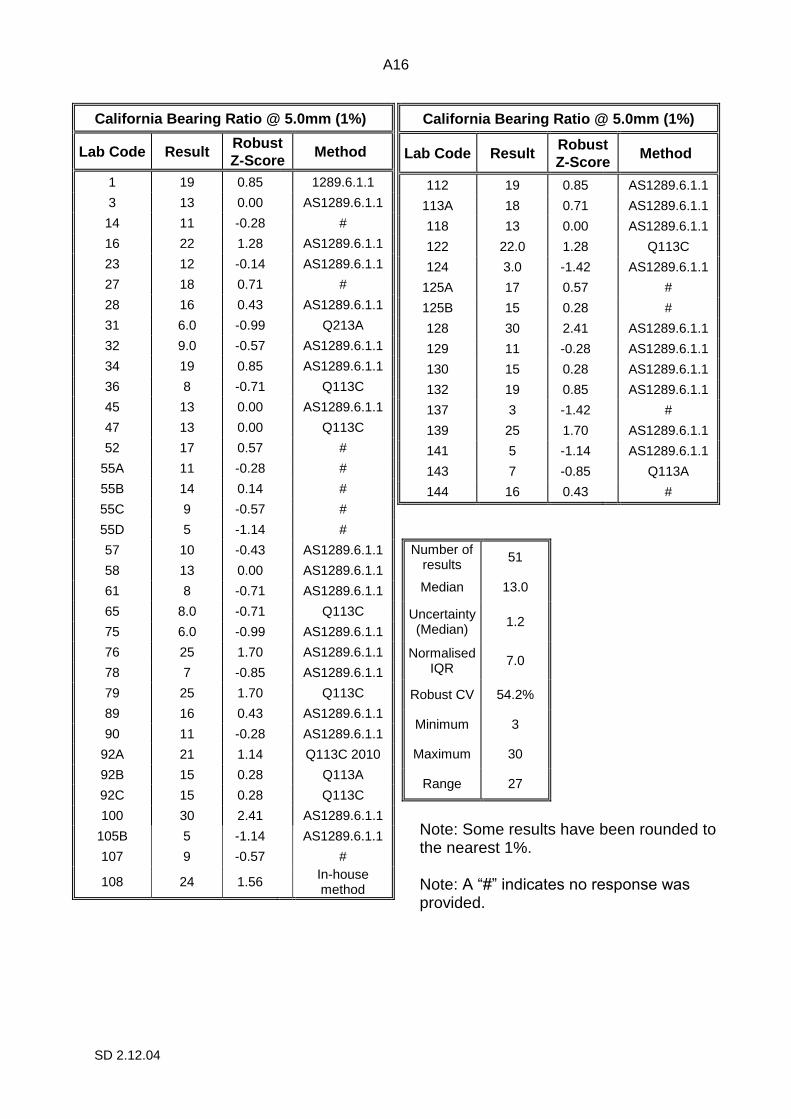
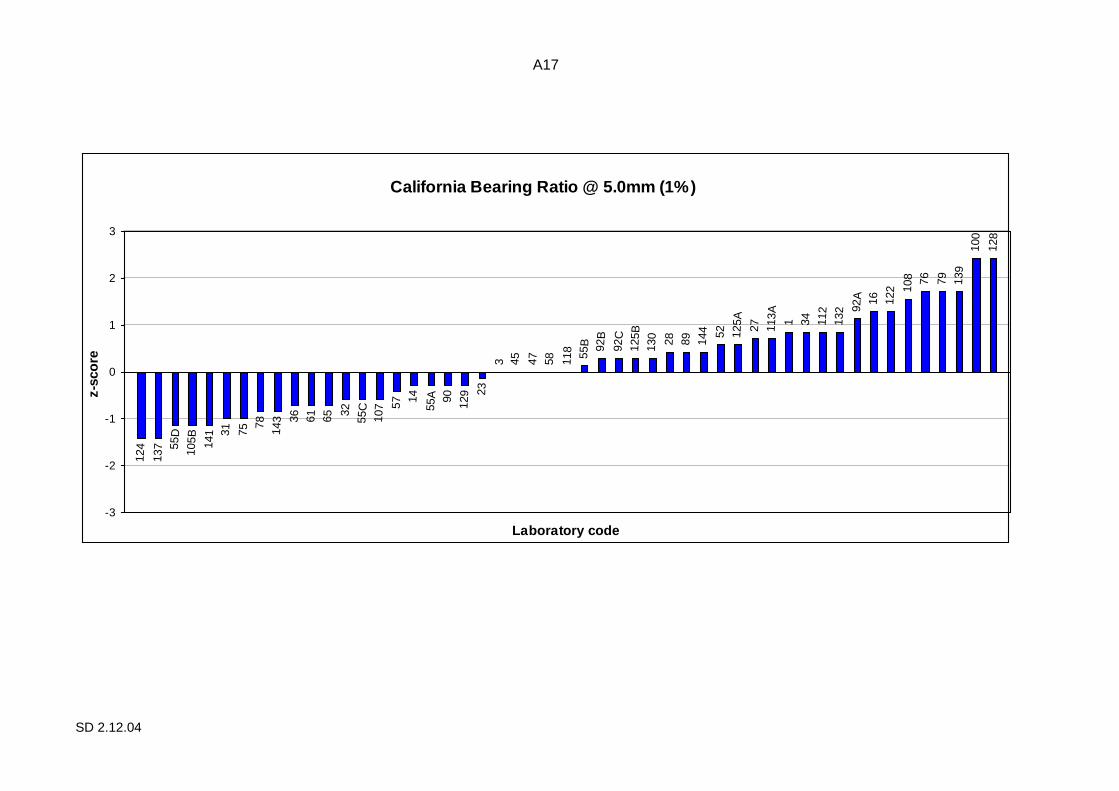
5.4 California Bearing Ratio at 2.5mm and 5.0mm
The spread of results received for CBR at 2.5 and 5.0 in Round 14 Soils Proficiency Testing Program is large. Although, the statistical analysis does not result in any outliers a smaller spread of results would be expected. As there is no industry standard for accepting a CBR result, a result within +/- 5 of the median would be expected. Laboratories reporting results outside this range are strongly encouraged to review their procedures. An analysis of laboratories’ uncorrected results was attempted to determine if it would reduce the spread, however, not all results were received and therefore the analysis could not be performed.
7
SD 2.12.04
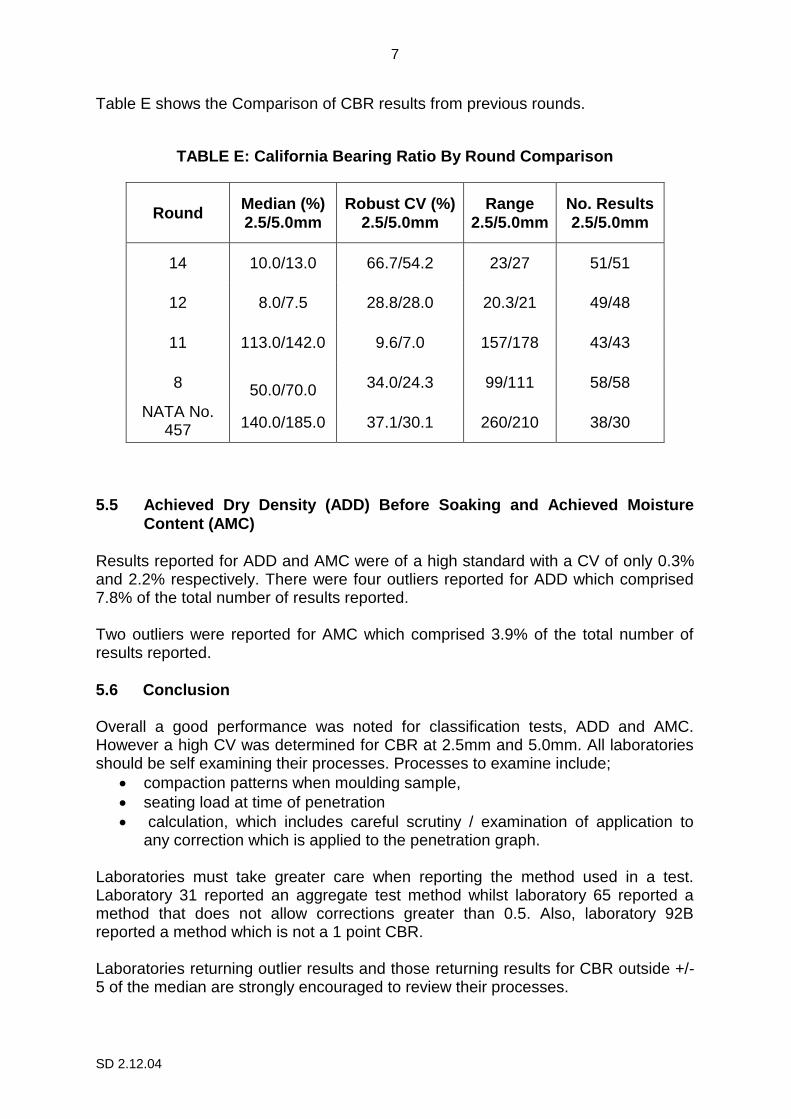
Table E shows the Comparison of CBR results from previous rounds.
TABLE E: California Bearing Ratio By Round Comparison
Round Median (%)
2.5/5.0mm
Robust CV (%)
2.5/5.0mm
Range
2.5/5.0mm
No. Results
2.5/5.0mm
14 10.0/13.0 66.7/54.2 23/27 51/51
12 8.0/7.5 28.8/28.0 20.3/21 49/48
11 113.0/142.0 9.6/7.0 157/178 43/43
8
50.0/70.0 34.0/24.3 99/111 58/58
NATA No. 457
(July ’04)
140.0/185.0 37.1/30.1 260/210 38/30
5.5 Achieved Dry Density (ADD) Before Soaking and Achieved Moisture
Content (AMC)
Results reported for ADD and AMC were of a high standard with a CV of only 0.3% and 2.2% respectively. There were four outliers reported for ADD which comprised 7.8% of the total number of results reported. Two outliers were reported for AMC which comprised 3.9% of the total number of results reported.
5.6 Conclusion Overall a good performance was noted for classification tests, ADD and AMC. However a high CV was determined for CBR at 2.5mm and 5.0mm. All laboratories should be self examining their processes. Processes to examine include;
compaction patterns when moulding sample,
seating load at time of penetration
calculation, which includes careful scrutiny / examination of application to any correction which is applied to the penetration graph.
Laboratories must take greater care when reporting the method used in a test. Laboratory 31 reported an aggregate test method whilst laboratory 65 reported a method that does not allow corrections greater than 0.5. Also, laboratory 92B reported a method which is not a 1 point CBR. Laboratories returning outlier results and those returning results for CBR outside +/-5 of the median are strongly encouraged to review their processes.

8
SD 2.12.04
Metrological Traceability and Measurement Uncertainty of Assigned Values Consensus values (median) derived from participants’ results are used in this program. These values are not metrologically traceable to an external reference. As the assigned value for this program is the median of the results submitted by the participants, the uncertainty of the median has been calculated and is presented in the corresponding tables of Appendix A.
6. OUTLIER RESULTS
Laboratories reporting outlier results are listed in the following table:
TABLE F: SUMMARY OF STATISTICAL OUTLIERS
Test Laboratory
Code No.
Apparent Particle Density (0.01 g/cm
3)
32, 125A, 125B
Liquid Limit (nearest 1%) 61, 130
Plasticity Index (nearest 1%) 130
Linear Shrinkage (0.5%) 61, 122
Achieved Dry Density before soaking (0.001 t/m
3)
55D, 76, 92B, 105B
Achieved Moisture Content (0.1%) 55D, 76

9
SD 2.12.04
TABLE G: CBR RESULTS OUTSIDE +/-5 OF THE MEDIAN
Test Laboratory
Code No.
California Bearing Ratio @ 2.5mm (1%)
1, 16, 27, 31, 55D, 75, 76, 79, 92A, 100, 105B,
108, 113A, 122, 124, 128, 137, 139, 141
California Bearing Ratio @ 5.0mm (1%)
1, 16, 31, 34, 55D, 75, 76, 78, 79, 92A, 100, 105B, 108, 112, 122,
124, 128, 132, 137, 139, 141, 143
7. Reference
[1] Guide to Proficiency Testing Australia, 2011 (This document can be found on the PTA website, www.pta.asn.au)

SD 2.12.04
APPENDIX A
Results and Data Analysis
Apparent Particle Density.......................................................................................... …A1
Liquid Limit................................................................................................................ …A3
Plastic Limit............................................................................................................... …A6
Plasticity Index......................................................................................................... …A8
Linear Shrinkage...................................................................................................... …A11
California Bearing Ration at 2.5mm......................................................................... …A14
California Bearing Ration at 5.0mm......................................................................... …A16
Achieved Dry Density before soaking....................................................................... …A18
Achieved Moisture Content before soaking.............................................................. …A20
Other Information..................................................................................................... …A22
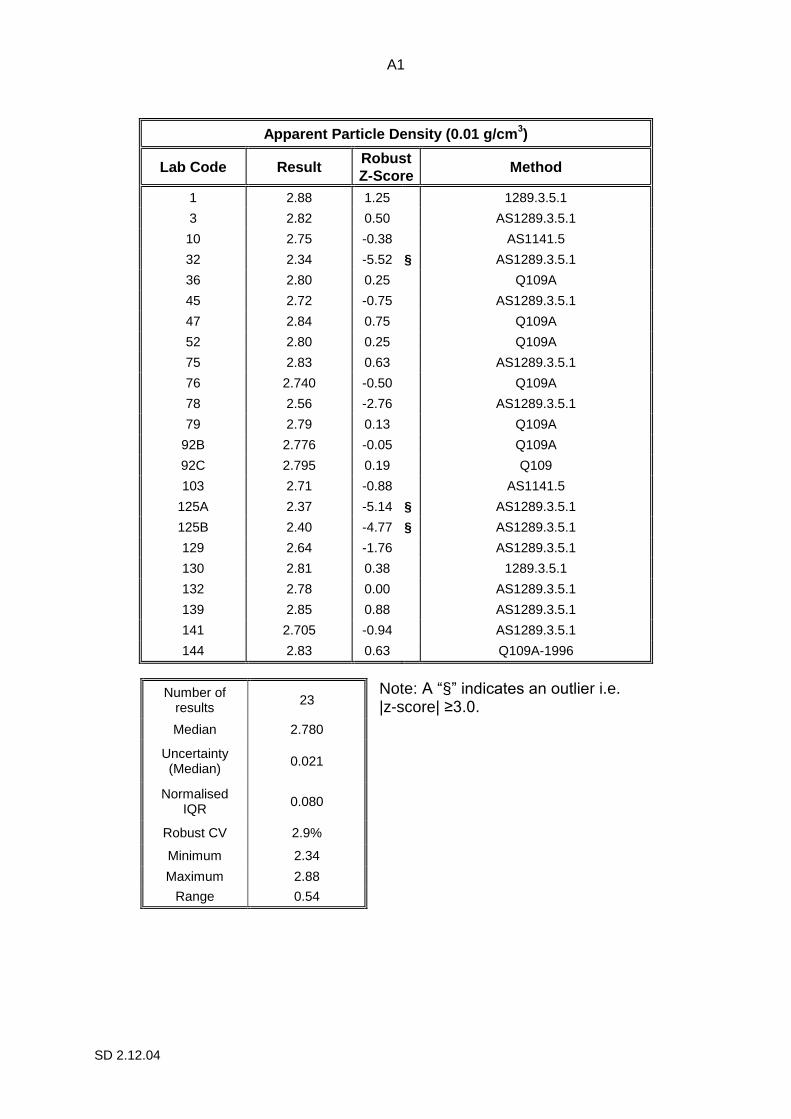
A1
SD 2.12.04
Apparent Particle Density (0.01 g/cm3)
Lab Code Result Robust
Z-Score Method
1 2.88 1.25 1289.3.5.1
3 2.82 0.50 AS1289.3.5.1
10 2.75 -0.38 AS1141.5
32 2.34 -5.52 § AS1289.3.5.1
36 2.80 0.25 Q109A
45 2.72 -0.75 AS1289.3.5.1
47 2.84 0.75 Q109A
52 2.80 0.25 Q109A
75 2.83 0.63 AS1289.3.5.1
76 2.740 -0.50 Q109A
78 2.56 -2.76 AS1289.3.5.1
79 2.79 0.13 Q109A
92B 2.776 -0.05 Q109A
92C 2.795 0.19 Q109
103 2.71 -0.88 AS1141.5
125A 2.37 -5.14 § AS1289.3.5.1
125B 2.40 -4.77 § AS1289.3.5.1
129 2.64 -1.76 AS1289.3.5.1
130 2.81 0.38 1289.3.5.1
132 2.78 0.00 AS1289.3.5.1
139 2.85 0.88 AS1289.3.5.1
141 2.705 -0.94 AS1289.3.5.1
144 2.83 0.63 Q109A-1996
Note: A “§” indicates an outlier i.e. |z-score| ≥3.0.
Number of results
23
Median 2.780
Uncertainty (Median)
0.021
Normalised IQR
0.080
Robust CV 2.9%
Minimum 2.34
Maximum 2.88
Range 0.54

A2
SD 2.12.04
Apparent Particle Density (0.01 g/cm3)
78
129
141
103 45 7
6
132
79 36
52 130
3 75
144
1
47 139
32
125A
125B
92C
10 9
2B
-3
-2
-1
0
1
2
3
Laboratory code
z-s
co
re
A3
SD 2.12.04
Liquid Limit (nearest 1%) Method 1
Lab Code Result Robust
Z-Score Method
1 42 0.67 3.1.1
3 41 0.34 AS1289.3.9.1
10 35 -1.69 AS1289.3.9.1
16 41 0.34 AS1289.3.1.1
23 41 0.34 AS1289.3.1.1
27 41 0.34 AS1289.3.1.1
28 39 -0.34 AS1289.3.1.1
32 38 -0.67 AS1289.3.1.1
45 37 -1.01 AS1289.3.1.1
55A 42 0.67 AS1289.3.1.1
55B 39 -0.34 AS1289.3.1.1
55C 43 1.01 AS1289.3.1.1
55D 37 -1.01 AS1289.3.1.1
57 40 0.00 AS1289
58 41.0 0.34 AS1289.3.9.1
75 40 0.00 AS1289.3.1.2
76 41 0.34 AS1289.3.9.1
78 35 -1.69 AS1289.3.1.1
85 36 -1.35 AS1289.3.1.1
89 41 0.34 AS1289.3.1.1
90 40 0.00 AS1289.3.1.1
100 42 0.67 AS1289.3.1.1
101 38 -0.67 AS1289.3.1.1
103 41 0.34 AS1289.3.1.1
105B 43 1.01 AS1289.3.1.1
107 46 2.02 AS1289.3.1.1
108 42 0.67 AS1289.3.1.1
112 38 -0.67 AS1289.3.1.1
113A 35 -1.69 AS1289.3.1.1
124 40 0.00 AS1289.3.1.1
125A 45 1.69 AS1289.3.1.1
125B 46 2.02 AS1289.3.1.1
128 37 -1.01 AS1289.3.1.1
129 39 -0.34 AS1289.3.1.1
130 52 4.05 § 1289.3.1.1
132 36 -1.35 AS1289.3.1.1
Liquid Limit (nearest 1%) Method 1
Lab Code Result Robust
Z-Score Method
137 40 0.00 AS1289.3.3.1
139 44 1.35 AS1289.3.3.1
141 39 -0.34 AS1289.3.1.1
Number of results
39
Median 40.0
Uncertainty (Median)
0.6
Normalised IQR
3.0
Robust CV 7.4%
Minimum 35
Maximum 52
Range 17
Note: A “§” indicates an outlier i.e. |z-score| ≥3.0.
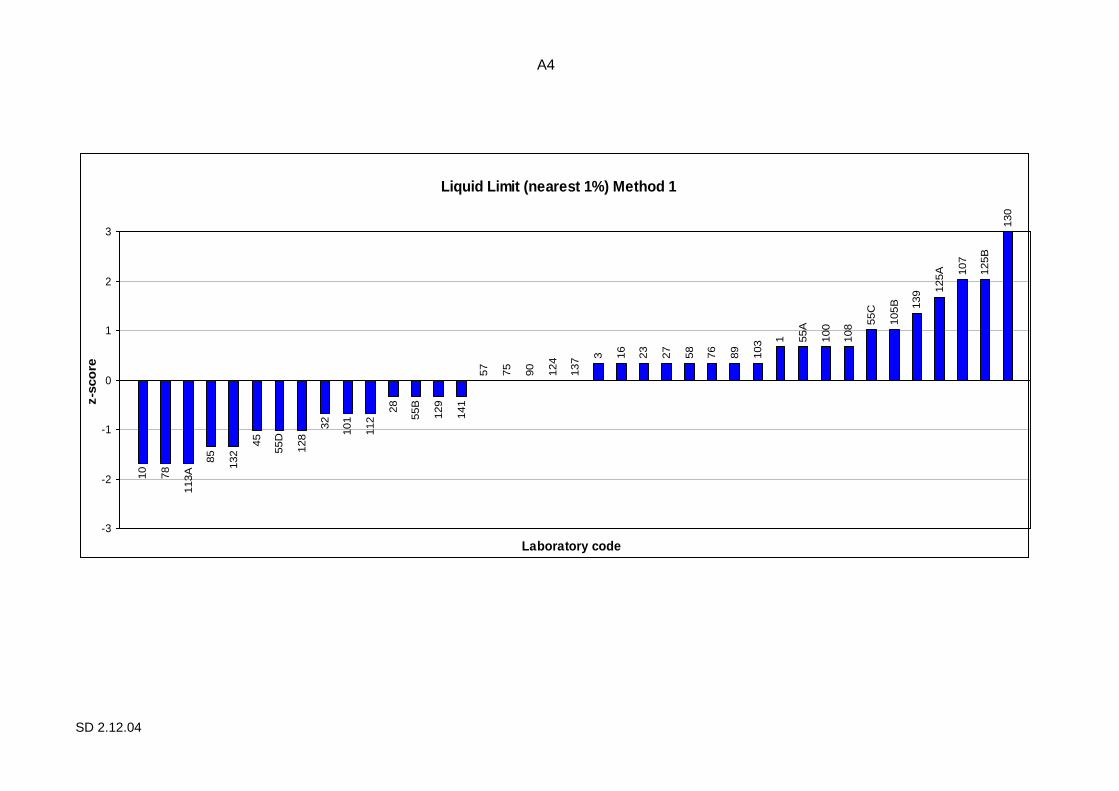
A4
SD 2.12.04
Liquid Limit (nearest 1%) Method 1
85
132
45
55D
128
32
28
55B
141
57
75
90
124
137
23
27
58
76
89
103 1 5
5A
100
108
55C
105B 139 1
25A 107
125B
130
3 16
10
78
113A
129
101
112
-3
-2
-1
0
1
2
3
Laboratory code
z-s
co
re

A5
SD 2.12.04
Liquid Limit (nearest 1%) Method 2
Lab Code Result Robust
Z-Score Method
6 40 0.00 Q104A-1986
31 41 0.54 Q104A
36 40 0.00 Q104A
47 40 0.00 Q104A
52 37 -1.62 Q104A
61 33 -3.78 § Q104A
65 41.0 0.54 Q104A
70 40 0.00 Q104A-1986
79 40 0.00 Q104A
92A 41.0 0.54 Q104A 2010
92B 38 -1.08 Q104A
92C 39 -0.54 Q104A
122 45.0 2.70 Q104A
143 41 0.54 Q104A
144 38 -1.08 Q104A-2010
Number of results 15
Median 40.0
Uncertainty (Median)
0.6
Normalised IQR 1.9
Robust CV 4.6%
Minimum 33
Maximum 45
Range 12
Note: A “§” indicates an outlier i.e. |z-score| ≥3.0.
Liquid Limit (nearest 1%) Method 2
144
92C
6 36
47
70
65
92A
122
31
79
143
92B
52
61
-3
-2
-1
0
1
2
3
Laboratory code
z-s
co
re

A6
SD 2.12.04
Plastic Limit (nearest 1%)
Lab
Code Result
Robust
Z-Score Method
1 23 -0.17 3.2.1
3 25 0.51 AS1289.3.2.1
6 22 -0.51 Q105-1987
10 23 -0.17 AS1289.3.2.1
16 22 -0.51 AS1289.3.2.1
23 22 -0.51 AS1289.3.2.1
27 24 0.17 AS1289.3.2.1
28 22 -0.51 AS1289.3.2.1
31 22 -0.51 Q105
32 25 0.51 AS1289.3.2.1
36 24 0.17 Q105
45 26 0.84 AS1289.3.2.1
47 23 -0.17 Q105
52 27 1.18 Q105
55A 29 1.85 AS1289.3.2.1
55B 24 0.17 AS1289.3.2.1
55C 21 -0.84 AS1289.3.2.1
55D 26 0.84 AS1289.3.2.1
57 22 -0.51 AS1289
58 27.0 1.18 AS1289.3.2.1
61 23 -0.17 Q105
65 28.0 1.52 Q105
70 28 1.52 Q105-1987
75 22 -0.51 AS1289.3.2.1
76 27 1.18 AS1289.3.2.1
78 26 0.84 AS1289.3.2.1
79 25 0.51 Q105
85 26 0.84 AS1289.3.2.1
89 23 -0.17 AS1289.3.2.1
90 23 -0.17 AS1289.3.2.1
92A 25.0 0.51 Q105 2010
92B 25 0.51 Q105
92C 26.0 0.84 Q105
100 22 -0.51 AS1289.3.2.1
101 32 2.87 AS1289.3.2.1
103 21 -0.84 AS1289.3.3.1
105B 26 0.84 AS1289.3.2.1
107 22 -0.51 AS1289.3.2.1
108 22 -0.51 AS1289.3.2.1
Plastic Limit (nearest 1%)
Lab
Code Result
Robust
Z-Score Method
112 20 -1.18 AS1289.3.2.1
113A 21 -0.84 AS1289.3.2.1
122 24.0 0.17 Q105
124 20 -1.18 AS1289.3.2.1
125A 19 -1.52 AS1289.3.2.1
125B 20 -1.18 AS1289.3.2.1
128 26 0.84 AS1289.3.2.1
129 25 0.51 AS1289.3.2.1
130 18 -1.85 1289.3.2.1
132 24 0.17 AS1289.3.2.1
137 21 -0.84 AS1289.3.2.1
139 24 0.17 AS1289.3.2.1
141 27 1.18 AS1289.3.2.1
143 19 -1.52 Q105
144 23 -0.17 Q105-2010
Number of results
54
Median 23.5
Uncertainty (Median)
0.5
Normalised IQR
3.0
Robust CV 12.6%
Minimum 18
Maximum 32
Range 14

A7
SD 2.12.04
Plastic Limit (nearest 1%)112
124
125B
55C
103
113A
16
23
31
57
75
100
107
108
1
47
61
89
90
144
27
36
55B
122
132
139
3 32
79
92A
92B
129 4
5
55D
78
85
92C
105B
128
52
58
76
141 6
5
70
55A
101
10
130 125A
143
28
137
6
-3
-2
-1
0
1
2
3
Laboratory code
z-s
co
re
A8
SD 2.12.04
Plasticity Index (nearest 1%) Method 1
Lab Code Result Robust
Z-Score Method
1 19 0.42 3.3.1
3 16 -0.21 AS1289.3.3.1
10 12 -1.04 AS1289.3.3.2
16 19 0.42 AS1289.3.3.1
23 19 0.42 AS1289.3.3.1
27 17 0.00 AS1289.3.3.1
28 17 0.00 AS1289.3.3.1
32 13 -0.83 AS1289.3.3.1
45 11 -1.25 AS1289.3.3.1
55A 13 -0.83 AS1289.3.3.1
55B 15 -0.42 AS1289.3.3.1
55C 22 1.04 AS1289.3.3.1
55D 11 -1.25 AS1289.3.3.1
57 18 0.21 AS1289
58 14.0 -0.62 AS1289.3.3.2
75 18 0.21 AS1289.3.3.1
76 14 -0.62 AS1289.3.3.2
78 9 -1.66 AS1289.3.3.1
85 10 -1.45 AS1289.3.3.1
89 18 0.21 AS1289.3.3.1
90 17 0.00 AS1289.3.3.1
100 20 0.62 AS1289.3.3.1
101 6 -2.28 AS1289.3.3.1
103 20 0.62 AS1289.3.3.1
105B 17 0.00 AS1289.3.3.1
107 24 1.45 AS1289.3.3.1
108 20 0.62 AS1289.3.3.1
112 18 0.21 AS1289.3.3.1
113A 14 -0.62 AS1289.3.3.1
124 20 0.62 AS1289.3.3.1
125A 26 1.87 AS1289.3.3.1
125B 26 1.87 AS1289.3.3.1
128 11 -1.25 AS1289.3.3.1
129 14 -0.62 AS1289.3.3.1
130 34 3.53 § 1289.3.3.1
132 12 -1.04 AS1289.3.3.1
Plasticity Index (nearest 1%) Method 1
Lab Code Result Robust
Z-Score Method
137 19 0.42 AS1289.3.3.1
139 20 0.62 AS1289.3.3.1
141 12 -1.04 AS1289.3.3.1
Number of results
39
Median 17.0
Uncertainty (Median)
1.0
Normalised IQR
4.8
Robust CV 28.3%
Minimum 6
Maximum 34
Range 28
Note: A “§” indicates an outlier i.e. |z-score| ≥3.0
A9
SD 2.12.04
Plasticity Index (nearest 1%) Method 1
45
55D
128
10
132
141
58
76
129 55B
3
27
28
90 7
5
89
112 1 16
23
137 100
103
108
124
139
55C
107
125A
125B
130
105B
57
101
78
85
113A
32
55A
-3
-2
-1
0
1
2
3
Laboratory code
z-s
co
re

A10
SD 2.12.04
Plasticity Index (nearest 1%) Method 2
Lab Code Result Robust
Z-Score Method
6 18 0.90 Q105-1987
31 19 1.20 Q105
36 17 0.60 Q105
47 17 0.60 Q105
52 10 -1.50 Q105
61 10 -1.50 Q105
65 13.0 -0.60 Q105
70 12 -0.90 Q105-1987
79 15 0.00 Q105
92A 16.2 0.36 Q105 2010
92B 13 -0.60 Q105
92C 13.0 -0.60 Q105
122 21.0 1.80 Q105
143 22 2.10 Q105
144 15 0.00 Q105-2010
Number of results
15
Median 15.0
Uncertainty (Median)
1.1
Normalised IQR 3.3
Robust CV 22.2%
Minimum 10
Maximum 22
Range 12
Plasticity Index (nearest 1%) Method 2
65
92B
92C
79
144 9
2A
6
31
143
47
36
122
70
61
52
-3
-2
-1
0
1
2
3
Laboratory code
z-s
co
re

A11
SD 2.12.04
Linear Shrinkage (0.5%) Method 1
Lab Code Result Robust
Z-Score Method
1 8.0 0.00 3.4.1
3 9.0 0.49 AS1289.3.4.1
10 8.0 0.00 AS1289.3.4.1
16 9 0.49 AS1289.3.4.1
23 9.0 0.49 AS1289.3.4.1
27 10.5 1.23 AS1289.3.3.1
28 8.5 0.25 AS1289.3.4.1
32 6.0 -0.98 AS1289.3.4.1
45 7.0 -0.49 AS1289.3.4.1
55A 8.5 0.25 AS1289.3.4.1
55B 7.0 -0.49 AS1289.3.4.1
55C 8.5 0.25 AS1289.3.4.1
55D 8.0 0.00 AS1289.3.4.1
57 9.0 0.49 AS1289
58 8.0 0.00 AS1289.3.4.1
75 5.5 -1.23 AS1289.3.4.1
76 8.5 0.25 AS1289.3.4.1
78 5.5 -1.23 AS1289.3.4.1
85 7.0 -0.49 AS1289.3.4.1
89 13 2.45 AS1289.3.4.1
90 8.5 0.25 AS1289.3.4.1
100 7.5 -0.25 AS1289.3.4.1
101 5.0 -1.47 AS1289.3.4.1
103 5.5 -1.23 AS1289.3.4.1
105B 9.0 0.49 AS1289.3.4.1
107 9.0 0.49 AS1289.3.4.1
108 5.0 -1.47 In-house method
112 6.5 -0.74 AS1289.3.4.1
113A 5.0 -1.47 AS1289.3.4.1
124 5.5 -1.23 AS1289.3.4.1
125A 11.0 1.47 AS1289.3.4.1
125B 10.5 1.23 AS1289.3.4.1
128 6.0 -0.98 AS1289.3.4.1
129 7.0 -0.49 AS1289.3.4.1
130 12.5 2.21 1289.3.4.1
132 6.0 -0.98 AS1289.3.4.1
Linear Shrinkage (0.5%) Method 1
Lab Code Result Robust
Z-Score Method
137 8.5 0.25 AS1289.3.4.1
139 10.0 0.98 AS1289.3.4.1
141 9.0 0.49 AS1289.3.4.1
Number of results
39
Median 8.00
Uncertainty (Median)
0.41
Normalised IQR
2.04
Robust CV 25.5%
Minimum 5
Maximum 13
Range 8.0
A12
SD 2.12.04
Linear Shrinkage (0.5%) Method 1
75
78
103
124
32
128
45
55B
129 1
00
1 10
55D
58
28
55C
76
90
137 3 1
6
23
57
105B
107
141
139 2
7
125B
125A
130 8
9
112
132
85
113A
108
101
55A
-3
-2
-1
0
1
2
3
Laboratory code
z-s
co
re

A13
SD 2.12.04
Linear Shrinkage (0.5%) Method 2
Lab Code Result Robust
Z-Score Method
6 8 0.00 Q106-1989
31 7.5 -0.90 Q106
36 8.5 0.90 Q106
47 8.0 0.00 Q106
52 8.0 0.00 Q106
61 10 3.60 § Q106
65 9.0 1.80 Q106
70 8 0.00 Q106-1989
79 8.0 0.00 Q106
92A 9.0 1.80 Q106-1989
92B 7.5 -0.90 Q106
92C 8.5 0.90 Q106
122 10.0 3.60 § Q106
143 8.0 0.00 Q106
144 7.5 -0.90 Q106-1989
Number of results
15
Median 8.00
Uncertainty (Median)
0.18
Normalised IQR 0.56
Robust CV 6.9%
Minimum 7.5
Maximum 10
Range 2.5
Note: A “§” indicates an outlier i.e. |z-score| ≥3.0
Linear Shrinkage (0.5%) Method 2
6 47
52
70
79
143
65
92A
122
92C
36
61
144
92B
31
-3
-2
-1
0
1
2
3
Laboratory code
z-s
co
re

A14
SD 2.12.04
California Bearing Ratio @ 2.5mm (1%)
Lab Code Result Robust
Z-Score Method
1 18 1.20 1289.6.1.1
3 9.0 -0.15 AS1289.6.1.1
14 8 -0.30 #
16 16 0.90 AS1289.6.1.1
23 9 -0.15 AS1289.6.1.1
27 17 1.05 #
28 10 0.00 AS1289.6.1.1
31 3 -1.05 Q213A
32 6 -0.60 AS1289.6.1.1
34 15 0.75 AS1289.6.1.1
36 6 -0.60 Q113C
45 11 0.15 AS1289.6.1.1
47 8 -0.30 Q113C
52 15 0.75 #
55A 8 -0.30 AS1289.6.1.1
55B 11 0.15 AS1289.6.1.1
55C 7 -0.45 AS1289.6.1.1
55D 4 -0.90 AS1289.6.1.1
57 6 -0.60 AS1289.6.1.1
58 5 -0.75 AS1289.6.1.1
61 5 -0.75 AS1289.6.1.1
65 5.0 -0.75 Q113C
75 4.0 -0.90 AS1289.6.1.1
76 19 1.35 AS1289.6.1.1
78 5 -0.75 AS1289.6.1.1
79 22 1.80 Q113C
89 15 0.75 AS1289.6.1.1
90 8 -0.30 AS1289.6.1.1
92A 18 1.20 Q113C 2010
92B 15 0.75 Q113A
92C 12 0.30 Q113C
100 25 2.25 AS1289.6.1.1
105B 3 -1.05 AS1289.6.1.1
107 7 -0.45 #
108 23 1.95 In-house method
California Bearing Ratio @ 2.5mm (1%)
Lab Code Result Robust
Z-Score Method
112 14 0.60 AS1289.6.1.1
113A 18 1.20 AS1289.6.1.1
118 10 0.00 AS1289.6.1.1
122 18.0 1.20 Q113C
124 2.0 -1.20 AS1289.6.1.1
125A 13 0.45 #
125B 11 0.15 #
128 23 1.95 AS1289.6.1.1
129 9 -0.15 AS1289.6.1.1
130 11 0.15 AS1289.6.1.1
132 15 0.75 AS1289.6.1.1
137 3 -1.05 #
139 18 1.20 AS1289.6.1.1
141 3 -1.05 AS1289.6.1.1
143 5 -0.75 Q113A
144 10 0.00 #
Number of results
51
Median 10.0
Uncertainty (Median)
1.17
Normalised IQR
6.7
Robust CV 66.7%
Minimum 2
Maximum 25
Range 23
Note: Some results have been rounded to the nearest 1%. Note: A “#” indicates no response was provided.

A15
SD 2.12.04
California Bearing Ratio @ 2.5mm (1%)141 31 75
55D 5
8
61
143 3
2
57
55C
107 1
4
47
90 2
3
129
28
118
144
45 55B
125B
130 92C 125A
112 34
52
89
92B
132 16 2
7 1 92A
113A
122
139 76
79 1
08
128 1
00
55A
3
124
105B
137
36
65
78
-3
-2
-1
0
1
2
3
Laboratory code
z-s
co
re
A16
SD 2.12.04
California Bearing Ratio @ 5.0mm (1%)
Lab Code Result Robust
Z-Score Method
1 19 0.85 1289.6.1.1
3 13 0.00 AS1289.6.1.1
14 11 -0.28 #
16 22 1.28 AS1289.6.1.1
23 12 -0.14 AS1289.6.1.1
27 18 0.71 #
28 16 0.43 AS1289.6.1.1
31 6.0 -0.99 Q213A
32 9.0 -0.57 AS1289.6.1.1
34 19 0.85 AS1289.6.1.1
36 8 -0.71 Q113C
45 13 0.00 AS1289.6.1.1
47 13 0.00 Q113C
52 17 0.57 #
55A 11 -0.28 #
55B 14 0.14 #
55C 9 -0.57 #
55D 5 -1.14 #
57 10 -0.43 AS1289.6.1.1
58 13 0.00 AS1289.6.1.1
61 8 -0.71 AS1289.6.1.1
65 8.0 -0.71 Q113C
75 6.0 -0.99 AS1289.6.1.1
76 25 1.70 AS1289.6.1.1
78 7 -0.85 AS1289.6.1.1
79 25 1.70 Q113C
89 16 0.43 AS1289.6.1.1
90 11 -0.28 AS1289.6.1.1
92A 21 1.14 Q113C 2010
92B 15 0.28 Q113A
92C 15 0.28 Q113C
100 30 2.41 AS1289.6.1.1
105B 5 -1.14 AS1289.6.1.1
107 9 -0.57 #
108 24 1.56 In-house method
California Bearing Ratio @ 5.0mm (1%)
Lab Code Result Robust
Z-Score Method
112 19 0.85 AS1289.6.1.1
113A 18 0.71 AS1289.6.1.1
118 13 0.00 AS1289.6.1.1
122 22.0 1.28 Q113C
124 3.0 -1.42 AS1289.6.1.1
125A 17 0.57 #
125B 15 0.28 #
128 30 2.41 AS1289.6.1.1
129 11 -0.28 AS1289.6.1.1
130 15 0.28 AS1289.6.1.1
132 19 0.85 AS1289.6.1.1
137 3 -1.42 #
139 25 1.70 AS1289.6.1.1
141 5 -1.14 AS1289.6.1.1
143 7 -0.85 Q113A
144 16 0.43 #
Number of results
51
Median 13.0
Uncertainty (Median)
1.2
Normalised IQR
7.0
Robust CV 54.2%
Minimum 3
Maximum 30
Range 27
Note: Some results have been rounded to the nearest 1%. Note: A “#” indicates no response was provided.
A17
SD 2.12.04
California Bearing Ratio @ 5.0mm (1%)105B
141 31
75 7
8
143 65 32
107 5
7 14
55A 90
129 2
3
45
47
58
118
55B 92B
92C
125B
130
28
89
144 52
125A
27
113A
1 34
112
132 9
2A 16
122 108 76
79
139
100
128
61
36
55C
55D
137
124
3
-3
-2
-1
0
1
2
3
Laboratory code
z-s
co
re

A18
SD 2.12.04
Achieved Dry Density before soaking
(0.001 t/m3)
Lab Code Result Robust
Z-Score Method
1 1.858 0.72 1289.6.1.1
3 1.851 -0.54 AS1289.6.1.1
14 1.852 -0.36 #
16 1.861 1.26 AS1289.6.1.1
23 1.859 0.90 AS1289.6.1.1
27 1.856 0.36 #
28 1.854 0.00 AS1289.6.1.1
31 1.848 -1.08 Q213A
32 1.866 2.16 AS1289.6.1.1
34 1.857 0.54 AS1289.6.1.1
36 1.842 -2.16 Q113C
45 1.842 -2.16 AS1289.6.1.1
47 1.856 0.36 Q113C
52 1.856 0.36 #
55A 1.854 0.00 #
55B 1.854 0.00 #
55C 1.850 -0.72 #
55D 1.737 -21.04 § #
57 1.853 -0.18 AS1289.6.1.1
58 1.850 -0.72 #
61 1.858 0.72 AS1289.6.1.1
65 1.849 -0.90 Q113C
75 1.850 -0.72 AS1289.6.1.1
76 1.877 4.14 § AS1289.5.1.1
78 1.855 0.18 AS1289.6.1.1
79 1.857 0.54 Q113C
89 1.858 0.72 AS1289.6.1.1
90 1.845 -1.62 AS1289.6.1.1
92A 1.849 -0.90 Q113C 2010
92B 1.830 -4.32 § Q113A
92C 1.853 -0.18 Q113C
100 1.854 0.00 AS1289.6.1.1
105B 1.835 -3.42 § AS1289.6.1.1
107 1.849 -0.90 #
108 1.848 -1.08 In-house method
Achieved Dry Density before soaking
(0.001 t/m3)
Lab Code Result Robust
Z-Score Method
112 1.855 0.18 AS1289.6.1.1
113A 1.856 0.36 AS1289.6.1.1
118 1.857 0.54 AS1289.6.1.1
122 1.859 0.90 Q113C
124 1.841 -2.34 AS1289.6.1.1
125A 1.850 -0.72 #
125B 1.860 1.08 #
128 1.859 0.90 AS1289.5.1.1
129 1.863 1.62 AS1289.6.1.1
130 1.852 -0.36 AS1289.6.1.1
132 1.856 0.36 AS1289.6.1.1
137 1.855 0.18 #
139 1.852 -0.36 AS1289.6.1.1
141 1.854 0.00 AS1289.5.1.1
143 1.859 0.90 Q113A
144 1.858 0.72 #
Number of results
51
Median 1.8540
Uncertainty (Median)
0.0010
Normalised IQR
0.0056
Robust CV 0.3%
Minimum 1.737
Maximum 1.877
Range 0.14
Note: A “§” indicates an outlier i.e. |z-score| ≥3.0. Note: A “#” indicates no response was provided.

A19
SD 2.12.04
Achieved Dry Density before soaking (0.001 t/m3)124 3
6
45
90
31
108 107 55C
75
125A
3 14
130
139 5
7
28
55A
55B
100
141 78
112
137 27
47
52
113A
132 34
79
118 1 61
89
144 23
122
128
143 125B
16
129
32
76
92A65 5
8
105B
92B
55D
92C
-3
-2
-1
0
1
2
3
Laboratory code
z-s
co
re
A20
SD 2.12.04
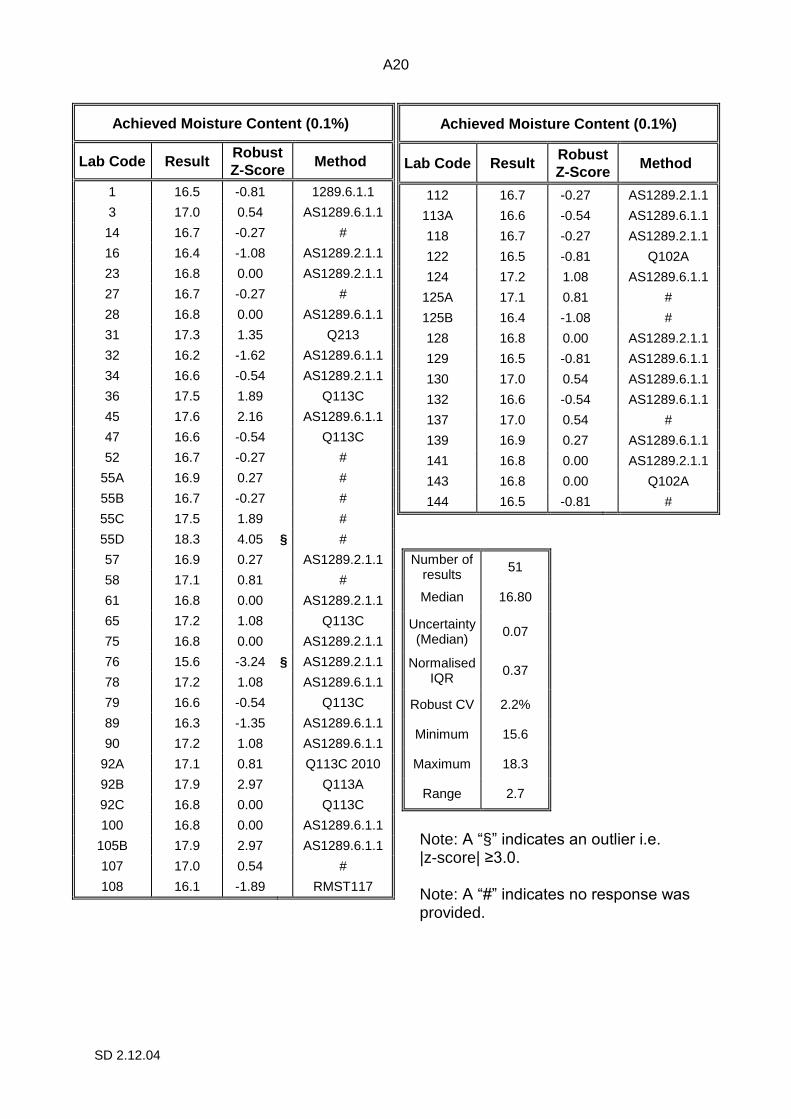
Achieved Moisture Content (0.1%)
Lab Code Result Robust
Z-Score Method
1 16.5 -0.81 1289.6.1.1
3 17.0 0.54 AS1289.6.1.1
14 16.7 -0.27 #
16 16.4 -1.08 AS1289.2.1.1
23 16.8 0.00 AS1289.2.1.1
27 16.7 -0.27 #
28 16.8 0.00 AS1289.6.1.1
31 17.3 1.35 Q213
32 16.2 -1.62 AS1289.6.1.1
34 16.6 -0.54 AS1289.2.1.1
36 17.5 1.89 Q113C
45 17.6 2.16 AS1289.6.1.1
47 16.6 -0.54 Q113C
52 16.7 -0.27 #
55A 16.9 0.27 #
55B 16.7 -0.27 #
55C 17.5 1.89 #
55D 18.3 4.05 § #
57 16.9 0.27 AS1289.2.1.1
58 17.1 0.81 #
61 16.8 0.00 AS1289.2.1.1
65 17.2 1.08 Q113C
75 16.8 0.00 AS1289.2.1.1
76 15.6 -3.24 § AS1289.2.1.1
78 17.2 1.08 AS1289.6.1.1
79 16.6 -0.54 Q113C
89 16.3 -1.35 AS1289.6.1.1
90 17.2 1.08 AS1289.6.1.1
92A 17.1 0.81 Q113C 2010
92B 17.9 2.97 Q113A
92C 16.8 0.00 Q113C
100 16.8 0.00 AS1289.6.1.1
105B 17.9 2.97 AS1289.6.1.1
107 17.0 0.54 #
108 16.1 -1.89 RMST117
Achieved Moisture Content (0.1%)
Lab Code Result Robust
Z-Score Method
112 16.7 -0.27 AS1289.2.1.1
113A 16.6 -0.54 AS1289.6.1.1
118 16.7 -0.27 AS1289.2.1.1
122 16.5 -0.81 Q102A
124 17.2 1.08 AS1289.6.1.1
125A 17.1 0.81 #
125B 16.4 -1.08 #
128 16.8 0.00 AS1289.2.1.1
129 16.5 -0.81 AS1289.6.1.1
130 17.0 0.54 AS1289.6.1.1
132 16.6 -0.54 AS1289.6.1.1
137 17.0 0.54 #
139 16.9 0.27 AS1289.6.1.1
141 16.8 0.00 AS1289.2.1.1
143 16.8 0.00 Q102A
144 16.5 -0.81 #
Number of results
51
Median 16.80
Uncertainty (Median)
0.07
Normalised IQR
0.37
Robust CV 2.2%
Minimum 15.6
Maximum 18.3
Range 2.7
Note: A “§” indicates an outlier i.e. |z-score| ≥3.0. Note: A “#” indicates no response was provided.

A21
SD 2.12.04
Achieved Moisture Content (0.1%)89
16
125B
1
122
129
47
79
132
14
27
52
55B
112
118
28
61
75
92C
100
128
141
143 5
5A
57
139 3 1
07
130
137 5
8
92A
125A
65
78
90
124 3
1
36
55C 4
5
92B
105B
55D
34
144
113A
32
108
76
23
-3
-2
-1
0
1
2
3
Laboratory code
z-s
co
re

A22
SD 2.12.04
Other information
Lab
Code
Emerson
Class
Number
Method
Linear
Shrinkage
Mould
Length
(nearest
1.0mm)
Method
California
Bearing
Ratio Load
@ 2.5mm
(1N)
Method
1 # # 250 250 2380 1289.6.1.1
3 # # 250 250 1228 AS1289.6.1.1
6 # # 150 150 # #
10 # # 254 254 # #
14 # # # # 1104 #
16 4 AS1289.3.8.1 250 250 2110 AS1289.6.1.1
23 # # 250.0 250.0 1175 AS1289.6.1.1
27 # # 250.0 250.0 2200 AS1289.6.1.1
28 # # 250 250 1301 AS1289.6.1.1
31 # # 152 152 440 Q213A
32 # # 250 250 35 AS1289.6.1.1
34 # # # # 2000 AS1289.6.1.1
36 # # 150.0 150.0 636 Q113C
45 3 AS1289.3.8.1 124 124 1412 AS1289.6.1.1
47 4 AS1289.3.8.1 150 150 782 Q113C
52 # # 150 150 1923 Q113C
55A # AS1289.3.8.1 250 250 601 #
55B 4 AS1289.3.8.1 250 250 1040 #
55C 4 AS1289.3.8.1 250 250 430 #
55D 4 AS1289.3.8.1 251 251 290 #
57 # # 250 250 844 AS1289.6.1.1
58 # # 250 250 590 AS1289.6.1.1
61 # # 151 151 651 AS1289.6.1.1
65 # # 150.0 150.0 440 Q113C
70 # # 150 150 # #
75 8 AS1289.3.8.1 254 254 317 AS1289.6.1.1
76 # # 128 128 1814 AS1289.6.1.1
78 4 AS1289.3.8.1 250 250 680 AS1289.6.1.1
79 # # 150.0 150.0 2961 #
85 # # 250 250 # #
89 # # 250 250 2012 AS1289.6.1.1
90 # # 252 252 450 AS1289.6.1.1
92A # # 150.0 150.0 1959 Q113C 2010
92B # # 150.0 150.0 1992 Q113A
92C # # 150.0 150.0 1544 Q113C
100 # # 250.0 250.0 3432 AS1289.6.1.1
101 # # 253.8 253.8 # #
103 # # 254.0 254.0 # #
105B # # 254 254 450 AS1289.6.1.1
107 4 AS1289.3.8.1 251 251 560 AS1289.6.1.1
108 # # 254 254 2995 RMST117
112 4 AS1289.3.8.1 251 251 1900 AS1289.6.1.1

A23
SD 2.12.04
Other information
Lab
Code
Emerson
Class
Number
Method
Linear
Shrinkage
Mould
Length
(nearest
1.0mm)
Method
California
Bearing
Ratio Load
@ 2.5mm
(1N)
Method
113A 4 AS1289.3.8.1 250 250 3081 AS1289.6.1.1
118 # # # # 1320 AS1289.6.1.1
122 # # 149.9 149.9 2380 Q113C
124 4 AS1289.3.8.1 14 14 276 AS1289.6.1.1
125A 2.0 AS1289.3.8.1 250 250 104 AS1289.6.1.1
125B 2 AS1289.3.8.1 250 250 82 AS1289.6.1.1
128 # # 250 250 2970 AS1289.6.1.1
129 3 AS1289.3.8.1 127.2 127.2 1152 AS1289.6.1.1
130 4 1289.3.8.1 250 250 1400 AS1289.6.1.1
132 4 AS1289.3.8.1 250.0 250.0 1930 AS1289.6.1.1
137 # # 254 254 344 #
139 N/A # 249.92 249.92 2380 AS1289.6.1.1
141 N/A N/A 250 250 428 AS1289.6.1.1
143 N/A N/A 150 150 560 Q113A
144 # # 150.0 150.0 # Q113C-1998
Note: A “#” indicates no response was provided.

A24
SD 2.12.04
Other Information
Lab
Code
California
Bearing
Ratio Load
@ 5.0mm
(1N)
Method
Penetration
Correction
applied
(0.1mm)
Method
Compaction
Apparatus
Type
1 3800 1289.6.1.1 # # Mechanical
3 2574 AS1289.6.1.1 0.3 AS1289.6.1.1 Mechanical
14 2172 # 1.3 # Manual
16 4330 AS1289.6.1.1 1.0 AS1289.6.1.1 Manual
23 2317 AS1289.6.1.1 0.8 AS1289.6.1.1 Manual
27 3500 # 3.0 # Manual
28 3100 AS1289.6.1.1 0 AS1289.6.1.1 Manual
31 1190 Q213A 0.5 Q213A Manual
32 85 AS1289.6.1.1 At 2.5mm is
13.2 At 5.0mm is 19.8
AS1289.6.1.1 Manual
34 3700 AS1289.6.1.1 0.1 AS1289.6.1.1 Mechanical
36 1489 Q113C # # Manual
45 2653 AS1289.6.1.1 1.3 AS1289.6.1.1 Manual
47 2238 Q113C 0.50 Q113C Manual
52 3295 # 0.0 # Manual
55A 1578 # 1.5 # Manual
55B 2370 # 0.7 # Manual
55C 1120 # 1.7 # Manual
55D 690 # 1.6 # Manual
57 2047 AS1289.6.1.1 0.0 AS1289.6.1.1 Manual
58 2630 AS1289.6.1.1 0.0 AS1289.6.1.1 Manual
61 1493 AS1289.6.1.1 0.0 AS1289.6.1.1 Mechanical
65 1312 Q113C 2.0 Q113C Manual
75 796 AS1289.6.1.1 1.25 AS1289.6.1.1 Manual
76 4118 AS1289.6.1.1 0.7 AS1289.6.1.1 Manual
78 1300 AS1289.6.1.1 2.0 AS1289.6.1.1 Manual
79 5102 # 0.4 Q113C Manual
89 3143 AS1289.6.1.1 0 AS1289.6.1.1 Manual
90 1360 AS1289.6.1.1 1.9 AS1289.6.1.1 Manual
92A 3858 Q113C 2010 0.5 Q113C 2010 Manual
92B 2941 Q113A 0.0 Q113A Manual
92C 3029 Q113C 0.4 Q113C Manual
100 5958 AS1289.6.1.1 0.5 AS1289.6.1.1 Manual
105B 970 AS1289.6.1.1 0.5 AS1289.6.1.1 Mechanical
107 1460 # 1.0 # Mechanical
108 4790 RMST117 0.1 RMST117 Manual
112 3705 AS1289.6.1.1 0.6 AS1289.6.1.1 Manual
A25
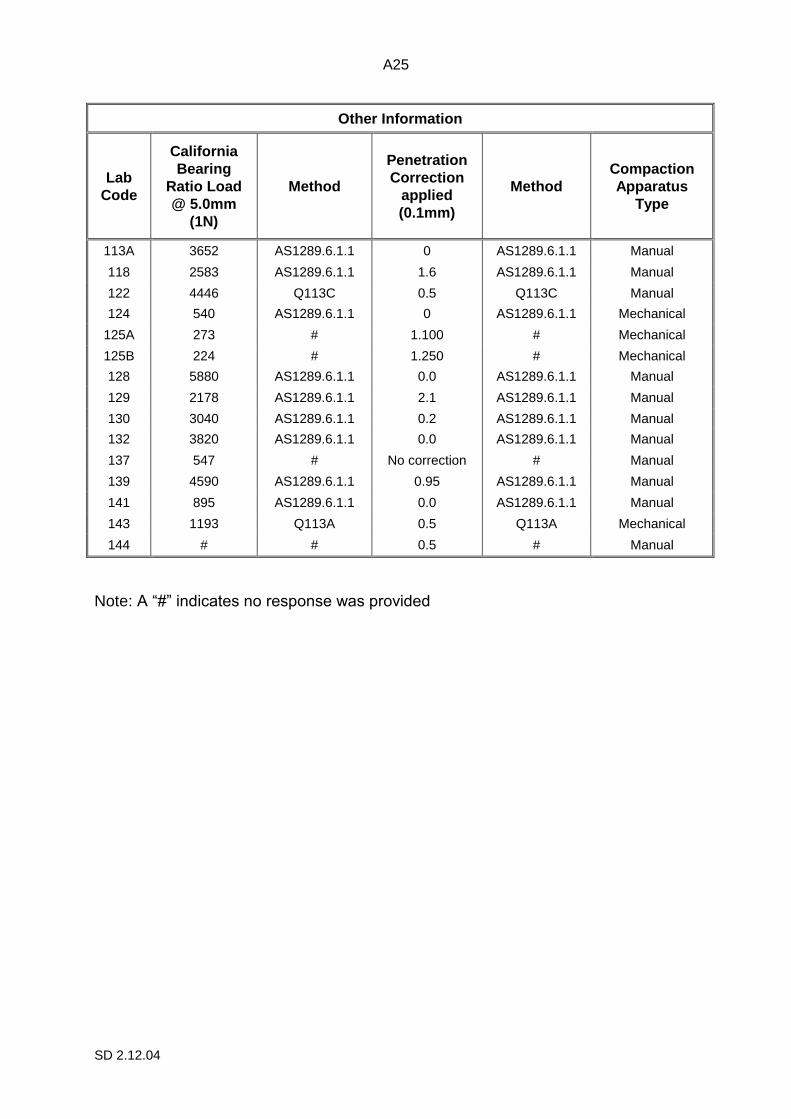
SD 2.12.04
Other Information
Lab
Code
California
Bearing
Ratio Load
@ 5.0mm
(1N)
Method
Penetration
Correction
applied
(0.1mm)
Method
Compaction
Apparatus
Type
113A 3652 AS1289.6.1.1 0 AS1289.6.1.1 Manual
118 2583 AS1289.6.1.1 1.6 AS1289.6.1.1 Manual
122 4446 Q113C 0.5 Q113C Manual
124 540 AS1289.6.1.1 0 AS1289.6.1.1 Mechanical
125A 273 # 1.100 # Mechanical
125B 224 # 1.250 # Mechanical
128 5880 AS1289.6.1.1 0.0 AS1289.6.1.1 Manual
129 2178 AS1289.6.1.1 2.1 AS1289.6.1.1 Manual
130 3040 AS1289.6.1.1 0.2 AS1289.6.1.1 Manual
132 3820 AS1289.6.1.1 0.0 AS1289.6.1.1 Manual
137 547 # No correction # Manual
139 4590 AS1289.6.1.1 0.95 AS1289.6.1.1 Manual
141 895 AS1289.6.1.1 0.0 AS1289.6.1.1 Manual
143 1193 Q113A 0.5 Q113A Mechanical
144 # # 0.5 # Manual
Note: A “#” indicates no response was provided
SD 2.12.04
APPENDIX B
Homogeneity Testing
Homogeneity Testing................................................................................................ …B1
B1
SD 2.12.04
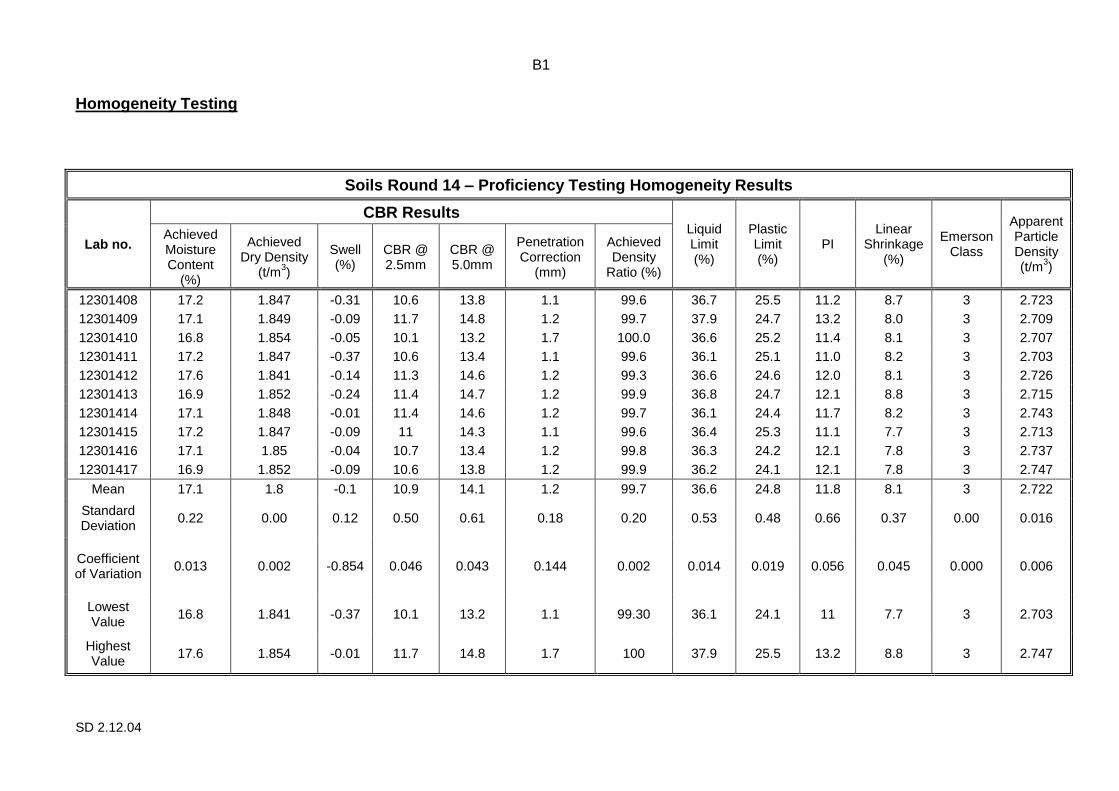
Homogeneity Testing
Soils Round 14 – Proficiency Testing Homogeneity Results
Lab no.
CBR Results Liquid Limit (%)
Plastic Limit (%)
PI Linear
Shrinkage (%)
Emerson Class
Apparent Particle Density (t/m
3)
Achieved Moisture Content
(%)
Achieved Dry Density
(t/m3)
Swell (%)
CBR @ 2.5mm
CBR @ 5.0mm
Penetration Correction
(mm)
Achieved Density
Ratio (%)
12301408 17.2 1.847 -0.31 10.6 13.8 1.1 99.6 36.7 25.5 11.2 8.7 3 2.723
12301409 17.1 1.849 -0.09 11.7 14.8 1.2 99.7 37.9 24.7 13.2 8.0 3 2.709
12301410 16.8 1.854 -0.05 10.1 13.2 1.7 100.0 36.6 25.2 11.4 8.1 3 2.707
12301411 17.2 1.847 -0.37 10.6 13.4 1.1 99.6 36.1 25.1 11.0 8.2 3 2.703
12301412 17.6 1.841 -0.14 11.3 14.6 1.2 99.3 36.6 24.6 12.0 8.1 3 2.726
12301413 16.9 1.852 -0.24 11.4 14.7 1.2 99.9 36.8 24.7 12.1 8.8 3 2.715
12301414 17.1 1.848 -0.01 11.4 14.6 1.2 99.7 36.1 24.4 11.7 8.2 3 2.743
12301415 17.2 1.847 -0.09 11 14.3 1.1 99.6 36.4 25.3 11.1 7.7 3 2.713
12301416 17.1 1.85 -0.04 10.7 13.4 1.2 99.8 36.3 24.2 12.1 7.8 3 2.737
12301417 16.9 1.852 -0.09 10.6 13.8 1.2 99.9 36.2 24.1 12.1 7.8 3 2.747
Mean 17.1 1.8 -0.1 10.9 14.1 1.2 99.7 36.6 24.8 11.8 8.1 3 2.722
Standard Deviation
0.22 0.00 0.12 0.50 0.61 0.18 0.20 0.53 0.48 0.66 0.37 0.00 0.016
Coefficient of Variation
0.013 0.002 -0.854 0.046 0.043 0.144 0.002 0.014 0.019 0.056 0.045 0.000 0.006
Lowest Value
16.8 1.841 -0.37 10.1 13.2 1.1 99.30 36.1 24.1 11 7.7 3 2.703
Highest Value
17.6 1.854 -0.01 11.7 14.8 1.7 100 37.9 25.5 13.2 8.8 3 2.747
SD 2.12.04
APPENDIX C
Documentation
Instructions to Participants: Classification……………………………………………… C1
Instructions to Participants: California Bearing Ratio…………………………………. C2
Results Sheet: Classification…………………………………………………………….C3
Results Sheet: California Bearing Ratio.……………………………………………….C4

C1
SD 2.12.04
PROFICIENCY TESTING AUSTRALIA
Proficiency Testing Program
Soils Round Part 14A: Classification
INSTRUCTIONS TO PARTICIPANTS
Please read instructions carefully BEFORE commencing testing. To ensure that the results of this program can be analysed properly, participants are asked to carefully note the following: 1. The following tests are to be conducted:
Apparent Particle Density Emersion Class
Liquid Limit Linear Shrinkage
Plastic Limit Linear Shrinkage Mould Length
Plasticity Index
2. These tests are based on AS1289, however other methods may be used.
Apparent Particle Density AS1289.3.5.1 Determination of the soil particle density of a soil – standard method. The -2.36mm fraction only to be tested.
Liquid Limit AS1289.3.1.1. Determination of the liquid limit of a soil – Four point Casagrande Method.
Plastic Limit AS1289.3.2.1. Determination of the plastic limit of a soil – standard method.
Plasticity Index AS1289.3.3.1. Calculation of the plasticity index of a soil.
Emerson Class AS1289.3.8.1. Methods of testing soils for engineering purposes.
Linear Shrinkage AS1289.3.4.1. Determination of the linear shrinkage of a soil – standard method.
3. For each test on the sample, the result is to be reported on the results sheet to the
accuracy and reporting basis indicated. 4. Testing may commence as soon as the sample is received. All laboratories must return
the result sheet no later than 14 May 2012 to:
Ms Laura Galbraith
Proficiency Testing Australia
PO Box 7507, SILVERWATER NSW 2128
Phone: 02 9736 8397 Fax: 02 9743 6664 Email: [email protected]
C2
SD 2.12.04
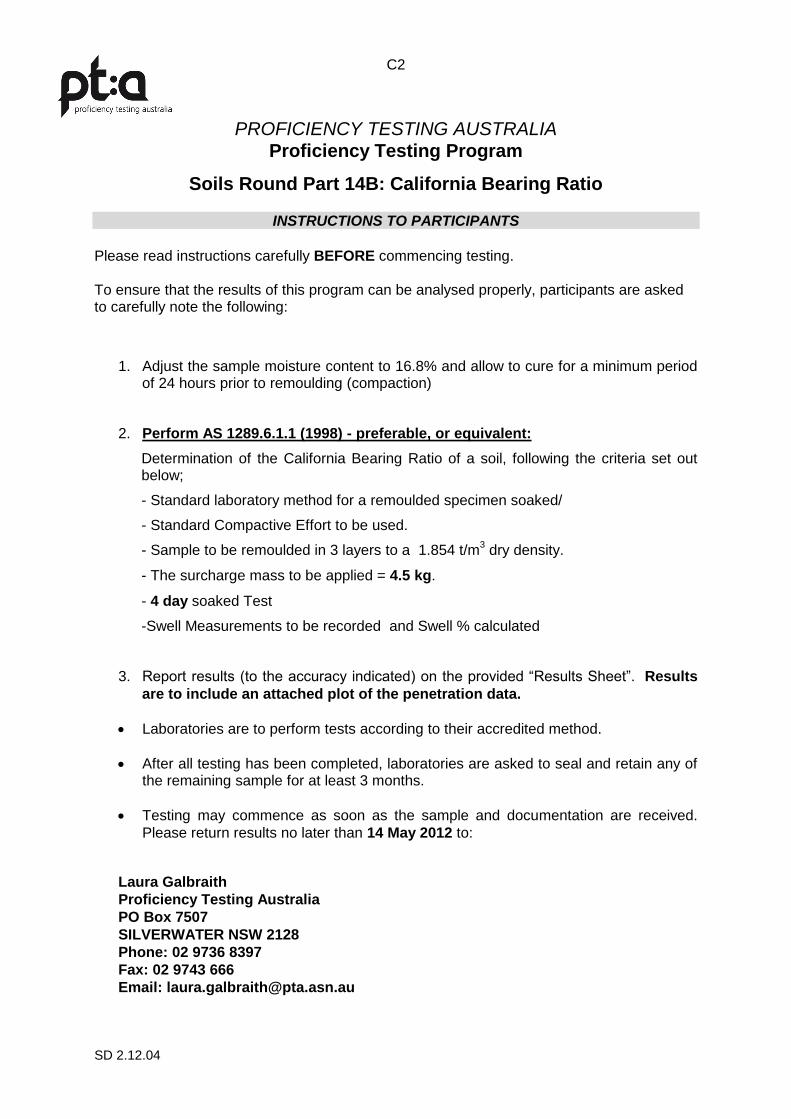
PROFICIENCY TESTING AUSTRALIA
Proficiency Testing Program
Soils Round Part 14B: California Bearing Ratio
INSTRUCTIONS TO PARTICIPANTS
Please read instructions carefully BEFORE commencing testing. To ensure that the results of this program can be analysed properly, participants are asked to carefully note the following:
1. Adjust the sample moisture content to 16.8% and allow to cure for a minimum period of 24 hours prior to remoulding (compaction)
2. Perform AS 1289.6.1.1 (1998) - preferable, or equivalent:
Determination of the California Bearing Ratio of a soil, following the criteria set out below;
- Standard laboratory method for a remoulded specimen soaked/
- Standard Compactive Effort to be used.
- Sample to be remoulded in 3 layers to a 1.854 t/m3 dry density.
- The surcharge mass to be applied = 4.5 kg.
- 4 day soaked Test
-Swell Measurements to be recorded and Swell % calculated
3. Report results (to the accuracy indicated) on the provided “Results Sheet”. Results
are to include an attached plot of the penetration data.
Laboratories are to perform tests according to their accredited method.
After all testing has been completed, laboratories are asked to seal and retain any of the remaining sample for at least 3 months.
Testing may commence as soon as the sample and documentation are received.
Please return results no later than 14 May 2012 to:
Laura Galbraith
Proficiency Testing Australia
PO Box 7507
SILVERWATER NSW 2128
Phone: 02 9736 8397
Fax: 02 9743 666
Email: [email protected]
C3
SD 2.12.04
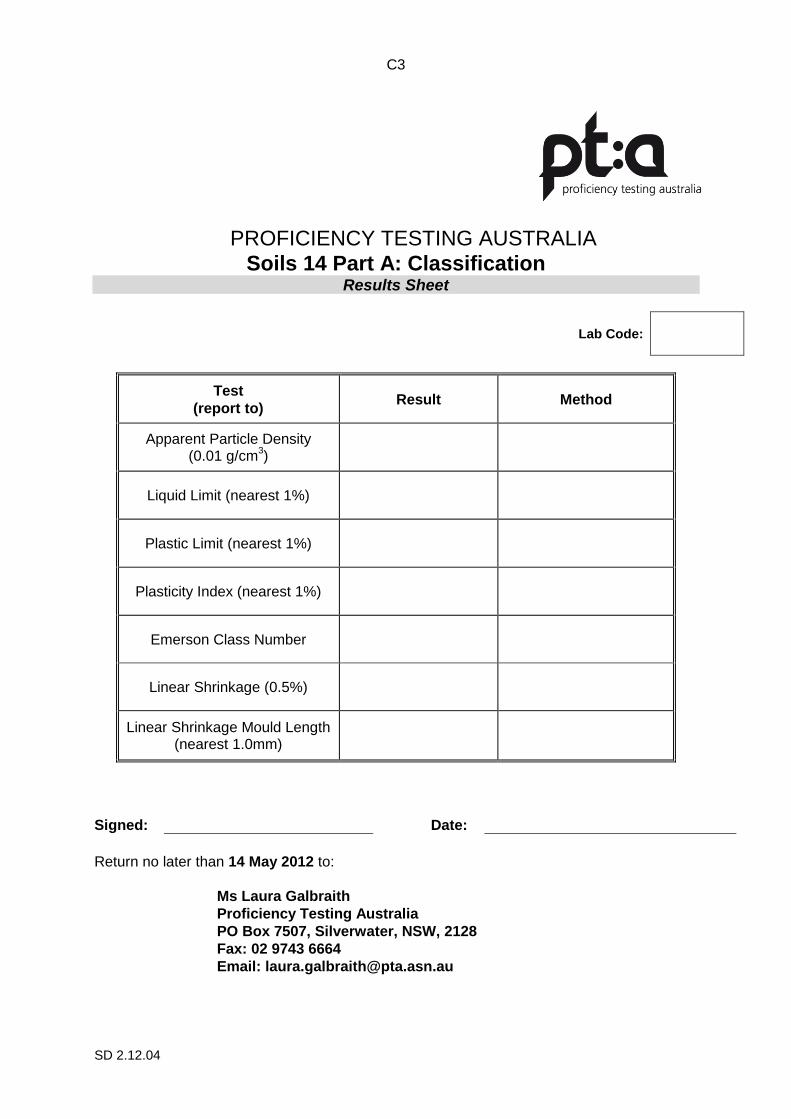
PROFICIENCY TESTING AUSTRALIA
Soils 14 Part A: Classification
Results Sheet
Lab Code:
Test
(report to) Result Method
Apparent Particle Density (0.01 g/cm
3)
Liquid Limit (nearest 1%)
Plastic Limit (nearest 1%)
Plasticity Index (nearest 1%)
Emerson Class Number
Linear Shrinkage (0.5%)
Linear Shrinkage Mould Length (nearest 1.0mm)
Return no later than 14 May 2012 to:
Ms Laura Galbraith
Proficiency Testing Australia
PO Box 7507, Silverwater, NSW, 2128
Fax: 02 9743 6664
Email: [email protected]
Signed: Date:

C4
SD 2.12.04
PROFICIENCY TESTING AUSTRALIA
Soils Part 14B: CBR
Results Sheet
Lab Code:
Test
(report to) Result Method
California Bearing Ratio Load @ 2.5mm
(1N)
California Bearing Ratio Load @ 5.0mm
(1N)
California Bearing Ratio @ 2.5mm (1%)
California Bearing Ratio @ 5.0mm (1%)
Penetration Correction applied (0.1mm)
Achieved Dry Density before soaking (0.001 t/m3)
Achieved Moisture Content before soaking (0.1%)
Compaction Apparatus Type (circle type used)
Manual Mechanical
Return no later than 14 May 2012 to:
Ms Laura Galbraith
Proficiency Testing Australia
PO Box 7507, Silverwater, NSW, 2128
Fax: 02 9743 6664
Email: [email protected]
Signed: Date:

SD 2.12.04
- End of Report -
Related Documents