Report No. 23351 -ET Ethiopia Focusing Public Expenditures on Poverty Reduction (In ThreeVolumes) Volume ll: Appendixes and Statistical Tables December 20, 2001 World Bank Country Office in Ethiopia Country Department 6 Africa Region Document of the World Bank Public Disclosure Authorized Public Disclosure Authorized Public Disclosure Authorized Public Disclosure Authorized Public Disclosure Authorized Public Disclosure Authorized Public Disclosure Authorized Public Disclosure Authorized

Welcome message from author
This document is posted to help you gain knowledge. Please leave a comment to let me know what you think about it! Share it to your friends and learn new things together.
Transcript
Report No. 23351 -ET
EthiopiaFocusing Public Expenditures onPoverty Reduction(In ThreeVolumes) Volume ll: Appendixes and Statistical Tables
December 20, 2001
World Bank Country Office in EthiopiaCountry Department 6Africa Region
Document of the World Bank
Pub
lic D
iscl
osur
e A
utho
rized
Pub
lic D
iscl
osur
e A
utho
rized
Pub
lic D
iscl
osur
e A
utho
rized
Pub
lic D
iscl
osur
e A
utho
rized
Pub
lic D
iscl
osur
e A
utho
rized
Pub
lic D
iscl
osur
e A
utho
rized
Pub
lic D
iscl
osur
e A
utho
rized
Pub
lic D
iscl
osur
e A
utho
rized
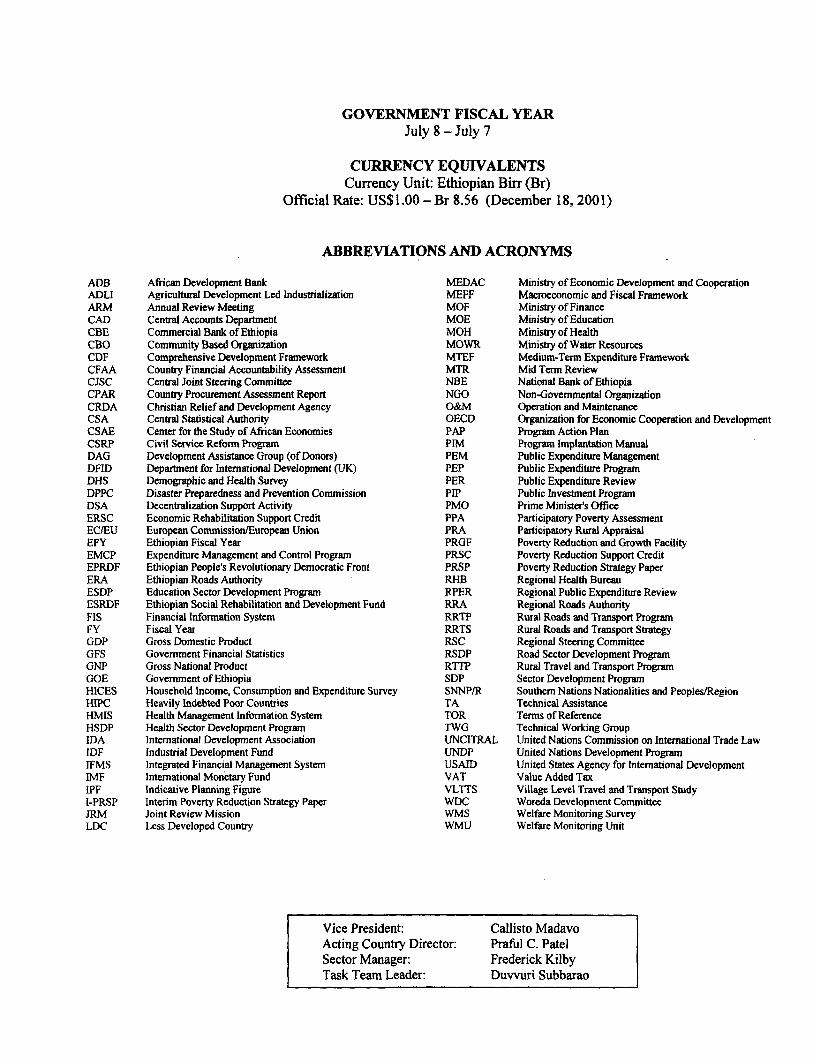
GOVERNMENT FISCAL YEARJuly 8 - July 7
CURRENCY EQUIVALENTSCurrency Unit: Ethiopian Birr (Br)
Official Rate: US$1.00-Br 8.56 (December 18, 2001)
ABBREVI4TIONS AND ACRONYMS
ADB African Development Bank MEDAC Ministry of Economic Development and CooperationADLI Agricultural Development Led Industrialization MEFF Macroeconomic and Fiscal FrameworkARM Annual Review Meeting MOF Ministry of FinanceCAD Central Accounts Department MOE Ministry of EducationCBE Commercial Bank of Ethiopia MOH Ministry of HealthCBO Community Based Organization MOWR Ministry of Water ResourcesCDF Comprehensive Development Framework MTEF Medium-Term Expenditure FrameworkCFAA Country Financial Accountability Assessment MTR Mid Term ReviewCJSC Central Joint Steering Committee NBE National Bank of EthiopiaCPAR Country Procurement Assessment Report NGO Non-Governmental OrganizationCRDA Christian Relief and Development Agency O&M Operation and MaintenanceCSA Central Statistical Authonty OECD Organization for Economic Cooperation and DevelopmentCSAE Center for the Study of African Economies PAP Program Action PlanCSRP Civil Service Reform Program PIM Program Implantation ManualDAG Development Assistance Group (of Donors) PEM Public Expenditure ManagementDFID Department for International Development (UK) PEP Public Expenditure ProgramDHS Demographic and Health Survey PER Public Expenditure ReviewDPPC Disaster Preparedness and Prevention Commission PIP Public Investment ProgramDSA Decentralization Support Activity PMO Prime Minister's OfficeERSC Economic Rehabilitation Support Credit PPA Participatory Poverty AssessmentECIEU European CommissionlEuropean Union PRA Participatory Rural AppraisalEFY Ethiopian Fiscal Year PRGF Poverty Reduction and Growth FacilityEMCP Expenditure Management and Control Program PRSC Poverty Reduction Support CreditEPRDF Ethiopian People's Revolutionary Democratic Front PRSP Poverty Reduction Strategy PaperERA Ethiopian Roads Authority RHB Regional Health BureauESDP Education Sector Development Program RPER Regional Public Expenditure ReviewESRDF Ethiopian Social Rehabilitation and Development Fund RRA Regional Roads AuthorityFIS Financial Information System RRTP Rural Roads and Transport ProgramFY Fiscal Year RRTS Rural Roads and Transport StrategyGDP Gross Domestic Product RSC Regional Steering CommitteeGFS Govemment Financial Statistics RSDP Road Sector Development ProgramGNP Gross National Product RTTP Rural Travel and Transport ProgramGOE Govemment of Ethiopia SDP Sector Development ProgramHICES Household Income, Consumption and Expenditure Survey SNNP/R Southem Nations Nationalities and Peoples/RegionHIPC Heavily Indebted Poor Countries TA Technical AssistanceHMIS Health Management Information System TOR Terms of ReferenceHSDP Health Sector Development Program TWG Technical Working GroupIDA Intemational Development Association UNCITRAL United Nations Commission on Intemational Trade LawIDF Industrial Development Fund UNDP United Nations Development ProgramIFMS Integrated Financial Management System USAID United States Agency for Intemational DevelopmentIMF Intemational Monetary Fund VAT Value Added TaxIPF Indicative Planning Figure VLTTS Village Level Travel and Transport StudyI-PRSP Interim Poverty Reduction Strategy Paper WDC Woreda Developnment CommitteeJRM Joint Review Mission WMS Welfare Monitoring SurveyLDC Less Developed Country WMU Welfare Monitoring Unit
Vice President: Callisto MadavoActing Country Director: Praful C. PatelSector Manager: Frederick KilbyTask Team Leader: Duwuri Subbarao
CONTENTS
A PPEN D IX I ........................................................................ .
ETHIOPIA TRACKING POVERTY REDUCING SPENDING IN HIPCS ASSESSMENT OFBUDGETING SYSTEMS ......................................................................... 1
ETHIOPIA CONTEXT ......................................................................... I
1. INVOLVEMENT OF DIFFERENT LEVELS OF GOVERNMENT ................................................................... III. BUDGET FORMULATION ........................................................................ 2
A. Comprehensiveness ......................................................................... 2B. Classification ........................................................................ 6C. Multiyear Projections ......................................................................... 6D. Budget Composition ......................................................................... 7
III. BUDGET EXECUTION ......................................................................... 8A. Internal Control ......................................................................... 8B. Recording Expenditures ........................................................................ 10
IV. BUDGET REPORTING ........................................................................ 11A. Regularity and Reliability of Reports ...................................... .................................. 11B. Final Audited Accounts ........................................................................ 12
V. BUDGET EVALUATION ........................................................................ 13
APPENDIX 2 ......... ................................................................ 17
POVERTY AND PUBLIC POLICY IN ETHIOPIA .............................. .......................................... 17Commitment to Poverty Reduction ..................... ................................................... 17I-PRSP Analysis and Strategy ........................................................................ 17
APPENDIX 3 ........ ................................................................ 19
WELFARE MONITORING IN ETHIOPIA ........................................................................ 19Overview of Available Data ........................................................................ 19Scope of Data and Institutional Responsibilities for Monitoring and Analysis .............................. 19
APPENDIX 4 ........ ................................................................. 25
EXPENDITURE TRACKING AND RESULTS MONITORING ........................................................................ 25IN EDUCATION AND HEALTH ......................................................................... 25
Introduction ........................................................................ 25Institutional Responsibilities and Expenditure Shares ................................................................... 25Poverty Relevance of Expenditures ........................................................................ 26Expenditures and Expenditure Tracking ........................................................................ 26Issues in Performance and Impact of Expenditure (Education) ..................................................... 28Issues in Performance and Impact of Expenditure (Health) ........................................................... 29
APPENDIX 5 ........................................................................ 31
RoAD SECTOR POLICY AND INSTITUTIONS ........................................................................ 31Introduction ........................................................................ 31Institutional Framework ........................................................................ 31Expenditures and Expenditure Tracking ........................................................................ 32Performance Indicators ........................................................................ 33Rural Roads and Transport Strategy ........................................................................ 34The Road Fund ........................................................................ 35
APPENDIX 6 ........................................................................ 37
TAX AND EXPENDITURE ASSIGNMENTS ........................................................................ 37Budgetary Resources ........................................................................ 37Sub-national Borrowing ........................................................................ 37Tax Assignment ........................................................................ 37Federal-Regional Tax Shares ........................................................................ 38
Relative Distribution of Taxes ......................................................................... 40Expenditure Assignment ......................................................................... 40
APPENDIX 7 ......................................................................... 43
FEDERAL BUDGET GRANT FORMULA AND BUDGET OFFSET SYSTEM .................................................... 43The Federal Grant Formula ......................................................................... 43The Budget Offset ......................................................................... 44
STATISTICAL TABLES .......................................................................... 47
BOXESBox 3.1: Selected Welfare Monitoring Data ......................................................................... 20Box 3.2: Key Welfare Indicators From National Data ......................................................................... 21Box 3.3: Welfare Monitoring System and Role of the Welfare Monitoring Unit ........................................ 23Box 3.4: Monitoring of Food Relief Requirements .......................................................................... 24
TABLESTable 1.1: Federal - Regional Shares in Poverty Related Spending, 2000/01 ............................................... 2Table 1.2: Extemal Aid in the Capital Budget ......................................................................... 5Table 1.3: Technical Assistance ......................................................................... 15Table 1.4: Action Plan to Upgrade the PEM Capacity to Track Poverty-Related Expenditure (PRE) ........ 16Table 5.1: Total Disbursement Under RSDP 1, 1997/98-1999/00 .............................................................. 32Table 5.2: Roads Sector Monitoring Indicators ......................................................................... 33Table 6.1: Federal-Regional Revenue Assigmnent .......................................................................... 38Table 6.2: Shares of Federal and Regional Govermnents in Revenues 1997 - 2001 ................................... 39Table 6.3: Regional Revenue Variations .......................................................................... 40Table 7.1: Changes in the Federal Grant Formula ......................................................................... 44Table 7.2: Value of Indices in the Federal Grant Formula 20011 ................................................................ 45Table 7.3: Changes in the Regional Shares of the Federal Grant ................................................................ 45Table 1: Ethiopia - Fiscal trends, 1996/97-2001/02 ......................................................................... 47Table 2: Ethiopia - Fiscal trends, 1996/97-2001/02 ......................................................................... 48Table 3: Functional Classification of General Government Recurrent Expenditures, 1996/97-2001/02 .... 49Table 4: Functional Classification of General Govemment Capital Expenditures, 1996/97-2001/02 ......... 50Table 5: Functional Classification of General Government Total Expenditures, 1996/97-2001/02 ............ 51Table 6: Selected Expenditures as a Share of Total Govemment Expenditure, 1996/97-2001/02 ............. 52Table 7: Real Per Capita Expenditure, 1996/97-2001/02 ......................................................................... 52Table 8: General Govemment Revenue and Extemal Grants, 1996/97-2001/02 ......................................... 53Table 8a: General Govemment Revenue and Extemal Grants, 1996/97-2001/02 ....................................... 54Table 9: Federal Government Revenue and External Grants, 1996/97-2001/02 ......................................... 55Table 9a: Federal Government Revenue and External Grants, 1996/97-2001/02 ....................................... 56Table 10: Regional Governments' Revenue and External Grants, 1996/97-2001/02 ................................... 57Table 1 Oa: Regional Governments' Revenue and External Grants, 1996/97-2001/02 ................................. 58Table 11. Budget Transfers from Federal Government to Regions - 1996/97 - 2001/02 ........................... 59Table 12: Ethiopia - Selected Macroeconomic Indicators ......................................................................... 60
Appendix 1
ETIHOPIA TRACKING POVERTY REDUCING SPENDING IN IHIPCS ASSESSMENTOF BUDGETING SYSTEMS
1.1 This assessment is based on the standard checklist prepared by the World Bank and theIMF to assess the budgeting systems in potential recipients of HIPC relief.' This was originallyprepared as part of the PER task on Tracking Public Expenditures for Poverty Reduction; and wassubsequently updated during the joint World Bank-IMF HIPC mission during October 15-20,2001. The draft was discussed and reviewed with the Ministry of Finance and EconomicDevelopment during the IMF-PRGF mission in November 2001.
ETHIOPIA CONTEXT
1.2 To appreciate this assessment, it is important to bear in mind two contextual issues:
(a) The Government's medium term program for public expenditurereform is contained in the Expenditure Management and ControlProgram (EMCP) which is one of the five components of the ongoingCivil Service Reform Program (CSRP). The main objectives of theEMCP are to bring about institutional and structural changes in publicexpenditure management so as to improve both its strategic andtechnical components. EMCP consists of the following components: (i)development and adoption of a new financial legal framework; (ii)basing planning and budgeting on a medium term Macroeconomic andFiscal Framework; (iii) reform of the budgeting system; and (iv)improvement of and capacity building in the accounting and auditingsystems.
(b) The evolution of fiscal decentralization is a crucial factor indetermining the pace and sequencing of public expenditure reforms. InEthiopia, the federal financial regulations are echoed at regional level.Nevertheless decentralization has important practical implications, e.g.in terms of the required information flows between federal anddecentralized levels. In addition, the unusual degree of regionalautonomy in Ethiopia raises fundamental questions about the setting ofexpenditure targets as well as the tracking of them. These arediscussed in the main text of the PER (both in Chapter 3 and inChapter 5, which addresses the regional perspective of publicexpenditures).
I. INVOLVEMENT OF DIFFERENT LEVELS OF GOVERNMENT
Ql. What amount of total government poverty related spending is carried out by sub-nationallevels of government?
Q2. What amount of expected additional spending (following receipt of HIPC debt relief) will beexecuted by sub-national levels of government?
' The most recent version consulted for this assessment is Guidance for HIPC Tracking Missions andFinalization of Assessment and Action Plans, April 25, 2001.
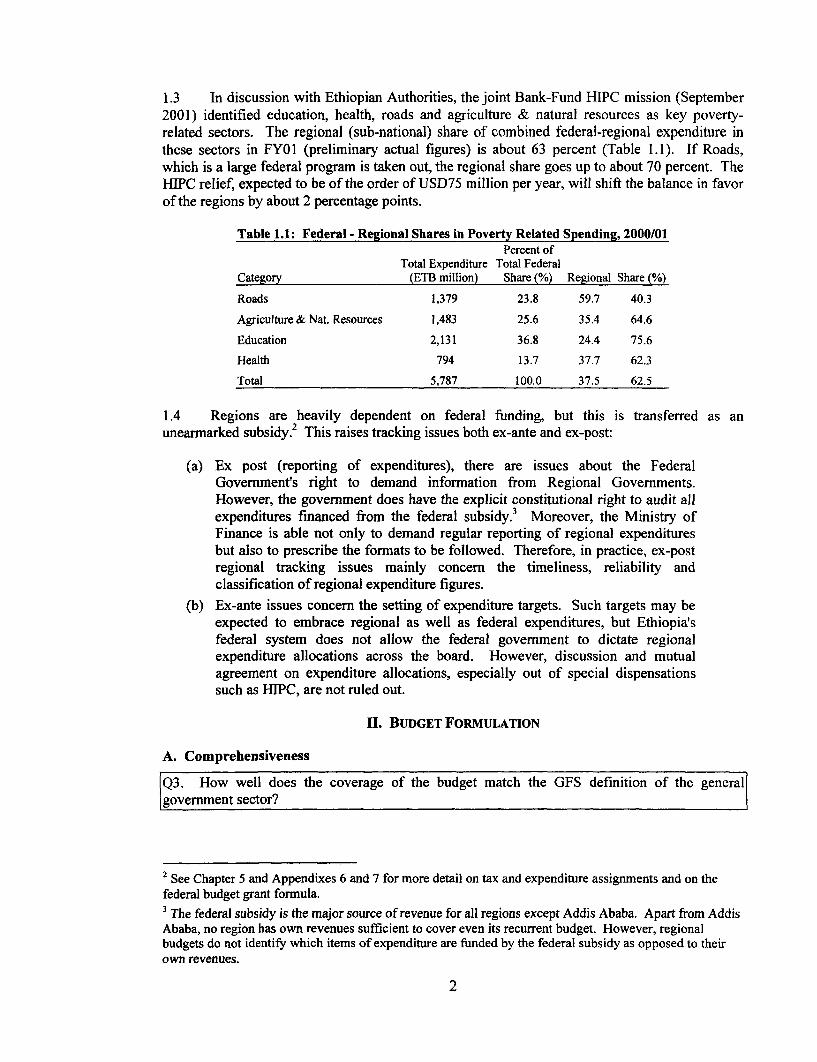
1.3 In discussion with Ethiopian Authorities, the joint Bank-Fund HIPC mission (September2001) identified education, health, roads and agriculture & natural resources as key poverty-related sectors. The regional (sub-national) share of combined federal-regional expenditure inthese sectors in FY01 (preliminary actual figures) is about 63 percent (Table 1.1). If Roads,which is a large federal program is taken out, the regional share goes up to about 70 percent. TheHIPC relief, expected to be of the order of USD75 million per year, will shift the balance in favorof the regions by about 2 percentage points.
Table 1.1: Federal - Regional Shares in Poverty Related Spending, 2000/01Percent of
Total Expenditure Total FederalCategory (ETB million) Share (%) Regional Share (%)
Roads 1,379 23.8 59.7 40.3
Agriculture & Nat. Resources 1,483 25.6 35.4 64.6Education 2,131 36.8 24.4 75.6
Health 794 13.7 37.7 62.3
Total 5,787 100.0 37.5 62.5
1.4 Regions are heavily dependent on federal funding, but this is transferred as anunearmarked subsidy. 2 This raises tracking issues both ex-ante and ex-post:
(a) Ex post (reporting of expenditures), there are issues about the FederalGovernment's right to demand information from Regional Governments.However, the government does have the explicit constitutional right to audit allexpenditures financed from the federal subsidy.3 Moreover, the Ministry ofFinance is able not only to demand regular reporting of regional expendituresbut also to prescribe the formats to be followed. Therefore, in practice, ex-postregional tracking issues mainly concern the timeliness, reliability andclassification of regional expenditure figures.
(b) Ex-ante issues concern the setting of expenditure targets. Such targets may beexpected to embrace regional as well as federal expenditures, but Ethiopia'sfederal system does not allow the federal government to dictate regionalexpenditure allocations across the board. However, discussion and mutualagreement on expenditure allocations, especially out of special dispensationssuch as HIPC, are not ruled out.
II. BUDGET FORMULATION
A. Comprehensiveness
Q3. How well does the coverage of the budget match the GFS definition of the general|government sector?
2 See Chapter 5 and Appendixes 6 and 7 for more detail on tax and expenditure assignments and on thefederal budget grant formula.3The federal subsidy is the major source of revenue for all regions except Addis Ababa. Apart from AddisAbaba, no region has own revenues sufficient to cover even its recurrent budget. However, regionalbudgets do not identify which items of expenditure are funded by the federal subsidy as opposed to theirown revenues.
2

1.5 The Federal Government compiles reports both on its own budgetary expenditures and onthe consolidated expenditures of federal and regional governments to give aggregates for generalgovernment. There is a reasonable fit with GFS definitions, and the revised chart of accounts(discussed below) will further enhance the ability to provide analytical reports. However, extra-budgetary funds are not included in the budget, and monthly or quarterly reports following theeconomic classification are not available.
|Q4. How far are general government activities funded through defined extra budgetary funds?
1.6 There are a number of funds and activities which are not fully incorporated in theappropriation and reporting of the budget4. These include:
(a) The Road Fund. Its revenues and associated expenditures are not appropriatednor are they incorporated in the government's financial statements. However,the operating expenses of the Office of the Road Fund Administration that aremet by the govemment are appropriated and the Road Fund operates in a quitetransparent manner.! Transfer of payments from the Fund to operating agencies(mainly the ERA and RRAs) are based on production of physical and financialperformance reports against the agreed work plans and budget. Each roadagency is required to keep a separate road fund account exclusive to roadmaintenance financing. In contrast to what happens with treasury funds,unexpended balances in these accounts are carried forward from one fiscal yearto the next. The Road Fund Board is accountable to the Prime Minister.
(b) Ethiopian Social Rehabilitation and Development Fund (ESRDF). This fundingmechanism supplements expenditures which are directly appropriated throughthe budget. A comprehensive view of poverty-relevant public expenditureswould require that ESRDF expenditures also be reported in detail. (Indeed, atan early stage in HIPC discussions, the use of the ESRDF itself as a mechanismfor disbursement of HIPC resources was suggested).
(c) Food Aid. The Disaster Prevention and Preparedness Fund also operates as anextra-budgetary fund. More generally, food aid, of which Ethiopia is a majorrecipient, is not well reflected in the budget and expenditure reports.6
(d) Industrial Development Fund (IDF) and Privatization Receipts. Publicenterprises are required to deposit dividend income to the IndustrialDevelopment Fund Account at the National Bank of Ethiopia (NBE). The IFMSreport7 was unable to ascertain whether all revenues are transferred from the IDF
4 In response to this comment, the Government have clarified as follows: There are special funds which areestablished by law for specific purposes such as the Road Fund, Pension Fund etc. These funds have aspecial, as opposed to annual, appropriation. Government are contemplating displaying the status of thesefunds as an annex to the annual budget book. Similarly, in a further effort towards making the budgetcomprehensive and transparent, since the FY0 I budget, Government have adopted the practice of showingfood aid as an annex to the annual budget book.5 See Road Fund in Ethiopia: From Inception to Realization, Office of the Road Fund Administration,January 2001. Requiring the administrative costs of the road fund to be appropriated is a check againstextravagant or inappropriate use of road fund revenues.6 The issues involved are thoroughly discussed in a recent study for the European Commission: PublicExpenditure Management Aspects of Food Security, Resal Ethiopia, April 2001. Table 4 on page 21 of thestudy estimates the value of food aid relative to regional budgets, and estimates that for most regions thevalue of food aid averaged at least 10 percent of budgeted expenditures over the five years to 2000; forSomali, Amhara and Tigray, the estimates were 30 percent, 37 percent and 52 percent respectively.7 IFMS scope, objectives and broad strategy, Main report, PricewaterhouseCoopers, May 2001 (see ¶4.26).
3
to the Treasury Central Account. The Prime Minister's Office (PMO) maintainsa separate fund for privatization which is operated along the same lines as theIDF. However, transfers to this account comprise only the sale proceeds whilethe liabilities are transferred to another entity, the Board of Trustees for thePrivatization of Enterprises.
1.7 The absence of regional extra-budgetary funds or accounts or extra-budgetary resourcescould not be confirmed at this stage.
1.8 The Budget Reform component of EMCP has led to the introduction, starting FY02, of anannex which describes expected food aid (though this does not form part of the budgetappropriation). Additional annexes are planned to cover Special Funds, such as those noted in theprevious paragraph, contingent liabilities, pensions and debt, and aid. Making these componentsof public resources more visible will increase the transparency of the budget, and is a necessarystep towards increased accountability for resources that are, at present, extra-budgetary. Thegovernment is committed to produce consolidated federal and regional budget, including allextra-budgetary funds and accounts, for the past year and the current year, starting in FY02, aspart of the HIPC completion point trigger.
Q5. To what extent are non-tax receipts (which are not included in the budget) or other non-budgeted funds available to spending units?
1.9 In general, accountability for and transparency in the area of retained revenues is weak.There is a standing finance instruction that enjoins all public bodies to submit to MOFED theamount they have collected and details of its utilization. Even so, the quantum of retainedrevenues is not regularly and accurately reported on, and this erodes both efficiency ofexpenditure allocation as well as accountability. Both the ongoing EMCP and the recent IFMShave recommended a single consolidated treasury account system.
Q6. How would you describe the composition of the budget outturn at a functional or vote level|relative to the originating budgeting?
1.10 Budget outturns in aggregate tend to be very close to the totals appropriated by thelegislature. Expenditure controls are effective in preventing excess or unauthorized expenditures.Large gaps between capital budget estimates and actual implementation are precluded byincluding in the budget only those projects with secured financing. Additional projects arebrought in via supplementary budgets if mid-year financing is secured on a confirmed basis.
Q7. Are donor funds included in the budget?Q8. Are outturn data on expenditures financed by donors made generally available?Q9. Are outturn data on such expenditures timely?
1.11 Government's financial regulations require the inclusion of all donor funds in the budgetand in reported expenditures. In practice this has been difficult to achieve. Ability to capturefunds (either ex-ante in budget appropriations or ex-post as memorandum information) variesaccording to the nature of the aid and the channel of funding adopted. Thus:
- Channel 1 funds (which follow the normal government financial channels)are, by definition, fully captured. Channel 2 funds (where funds aredisbursed via the sector rather than the financial bodies of government) aremore likely to be captured than Channel 3 funds (disbursed directly bydonors).
4
- Certain categories of assistance (notably food aid and technical assistance)are generally not included and not appropriated.
- Loans are captured more thoroughly than grants.
1.12 Efforts to improve the capture of donor funds in the budget are continuing, 8 and the issuewas extensively reviewed in PER 2000. It noted that MEDAC has the responsibility formaintaining an overview of aid flows, but that its ability to collect reliable data on actualdisbursements is complicated by several factors:
(a) many donor programs are very segmented and different disbursementchannels and procedures are being used; (b) many projects are implemented atregional or zonal level and these administrative entities do not always have thecapacity to report adequately on disbursements; (c) MEDAC depends to a largeextent on supplementary information provided by line ministries (notably forSDPs) which are not necessarily the most efficient in gathering andcommunicating the relevant data; and (d) unwillingness, according to MEDAC,of some donors to provide information. (PER 2000, 14.15)
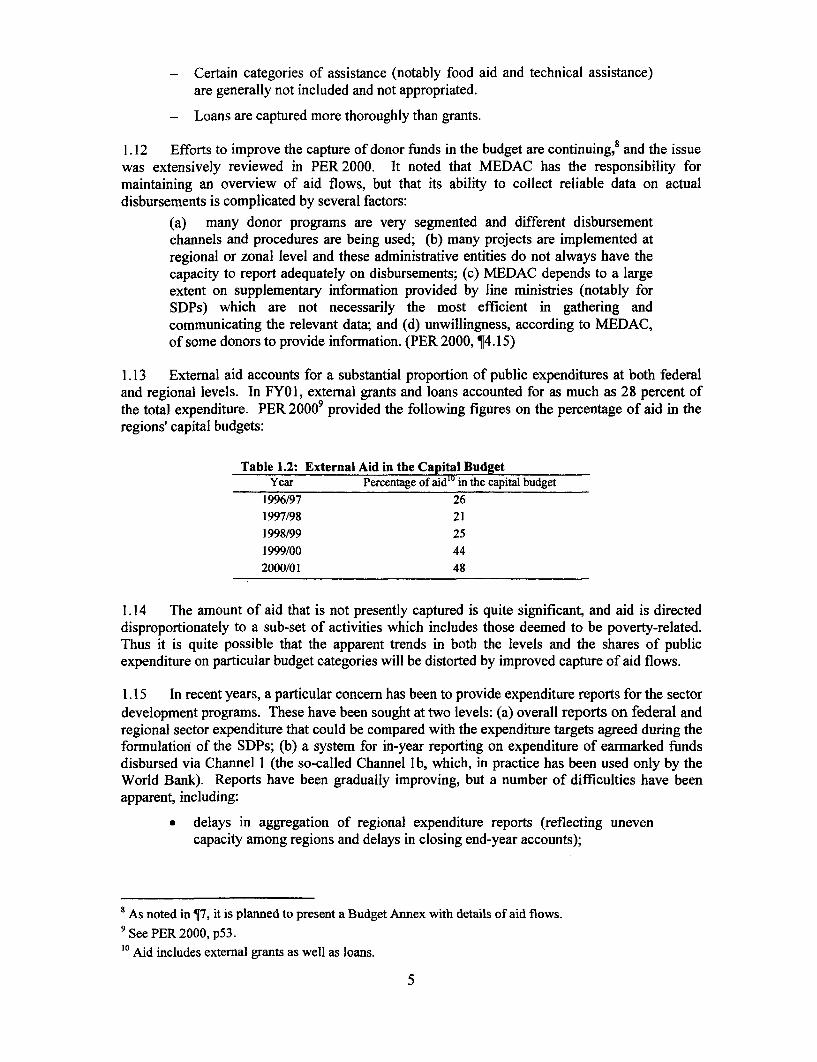
1.13 External aid accounts for a substantial proportion of public expenditures at both federaland regional levels. In FY01, external grants and loans accounted for as much as 28 percent ofthe total expenditure. PER 20009 provided the following figures on the percentage of aid in theregions' capital budgets:
Table 1.2: External Aid in the Capital BudgetYear Percentage of aid'" in the capital budget
1996/97 261997/98 211998/99 251999/00 442000/01 48
1.14 The amount of aid that is not presently captured is quite significant, and aid is directeddisproportionately to a sub-set of activities which includes those deemed to be poverty-related.Thus it is quite possible that the apparent trends in both the levels and the shares of publicexpenditure on particular budget categories will be distorted by improved capture of aid flows.
1.15 In recent years, a particular concern has been to provide expenditure reports for the sectordevelopment programs. These have been sought at two levels: (a) overall reports on federal andregional sector expenditure that could be compared with the expenditure targets agreed during theformulation of the SDPs; (b) a system for in-year reporting on expenditure of earmarked fundsdisbursed via Channel 1 (the so-called Channel lb, which, in practice has been used only by theWorld Bank). Reports have been gradually improving, but a number of difficulties have beenapparent, including:
* delays in aggregation of regional expenditure reports (reflecting unevencapacity among regions and delays in closing end-year accounts);
8 As noted in 17, it is planned to present a Budget Annex with details of aid flows.9 See PER 2000, p53.'° Aid includes external grants as well as loans.
5
* lack of desired detail in reporting (reflecting weaknesses in the classificationsystem - see below - and the fact that the original SDP expenditureprojections did not follow the government budget format);
* introduction of an interim tracking system for Channel lb expenditureswhich did not fulfill expectations; and
* continued difficulty in capturing donor funding via Channels 2 and 3.
B. Classification
Q 10. Indicate the levels of classification that apply to budget transactions.Q] 1. To what level does the functional classification break down?
1.16 Ethiopia has administrative and functional (sector and some sub-sectors) classificationsfor expenditure. The systems for making an economic classification are in place, but theiroperationalization is hampered by capacity constraints. In its present form, the economicclassification is both unreliable and highly aggregated. As part of the EMCP, a new classificationsystem and chart of accounts are being introduced, which will enable expenditures to be taggeddown to cost center and program level. The revised classification scheme is fully described inVersion 2.1 of the Budget Reforrm Design Manual. Among other features, it will ensure commoncoding across recurrent and capital budgets, rationalize expenditure codes into a single series witha more consistent economic classification and assign unique revenue codes to each (donor ordomestic) source of funding.
1.17 The new classification is currently being introduced at federal level, and will be rolledover to the regions in the next 2-3 years.
Q 12. What is the principal means for executing, tr.acking and recording HIPC- related spending? ]
1.18 There are at present no explicit systems to track poverty-related spending. However, thereformed budget classification would allow for: (a) the tracking of specific functionalclassifications of expenditure; (b) the assignment of a distinct revenue code for HIPC-derivedfunding (the 'virtual fund' approach); or (c) a hybrid of both approaches.
C. Multiyear Projections
Q 1 3. How would you describe the out-year estimates (medium terrn) for spending?Q14. What level of detail is provided for such estimates?
1.19 The government has adopted financial regulations committing itself to systematicmedium term planning of expenditures. A federal Macroeconomic and Fiscal Framework(MEFF) is to be prepared each year, on the basis of which funds available for federal recurrentand capital expenditure and for the regional subsidy are to be calculated. The MEFF is expectedto provide the basis for the setting, and approval by the Council of Ministers, of ceilings --Indicative Planning Figures (IPFs) - for the capital expenditures of federal public bodies, whichare consolidated into a three-year rolling Public Investment Program. According to regulations,only projects that are prioritized in the PIP are eligible for inclusion in the annual capital budget.A detailed financial calendar, developed as part of the budget reform, spells out theresponsibilities of different bodies as well as the annual timing of each stage of the exercise."1
The PIP was intended to be a stepping stone towards a Public Expenditure Program (PEP), whichwould program federal recurrent as well as capital expenditure. Implementation of these reforms
The proposed financial calendar is reproduced in Appendix 2 of PER 2000 (Volume II).
6
to planning and budgeting would amount to the application of a Medium Term ExpenditureFramework.
1.20 In practice, as successive PERs have noted, preparation of MEFFs and PIPs has hithertobeen only a shadow exercise. The MEFF and PIP have never been submitted to the Council ofMinisters for approval, and neither the procedures nor the timing mandated in the financialcalendar have been adhered to. The Government's principal explanations for the failure toimplement these reforms have been (a) the uncertainties associated with the border conflict, and(b) difficulties in forecasting of external resources. However, in connection with the EconomicRehabilitation Support Credit, the government has now given undertakings to make these reformseffective.'2
1.21 The regions have adopted similar financial regulations committing themselves to thedevelopment of PIPs and PEPs but, through the preparation cycles for budgets up to FY2001/02,none had begun to do so. However, the Sector Development Programs (Health, Education,Roads) did incorporate five-year expenditure projections for both recurrent and capitalexpenditures, taking account of anticipated external as well as domestic resources, and settingtargets for regional as well as federal expenditure. Timely medium-term projections by thegovernment are virtually a precondition for meaningful medium-term planning by the regions,because they need to know the projected level of the federal subsidy which is under the controlof the government, and the availability of external aid which is managed by the government.
1.22 In September 2001, there was a pilot initiative to begin preparation of PEPs at regionallevel, with the federal government undertaking to provide two-year projections of the federalsubsidy as a basis for medium-tern plans at regional level.'3 This timely intimation of resourceenvelope will enable the regions to make budget allocations better matching the prioritiesascertained from the communities.
D. Budget Composition 14
The HUPC Expenditure Tracking questionnaire does not address the issue of budget composition,but this is relevant because an apparently appropriate expenditure allocation may be underminedif there are chronic imbalances within it (e.g. between recurrent and capital expenditures, orbetween wage and non-wage recurrent expenditures).
1.23 PER 2000 examined this issue, and found that while Ethiopia avoids the extremecompression of recurrent expenditures that is found in many countries, there are still significantconcerns about the adequacy of funding of operating costs. (These concerns were reiterated inthe Regional PERs undertaken as part of the PER 2001 cycle). Moreover, there is no analysis ofthe balance between wage and non-wage recurrent expenditure. The present budget formulation
12 See World Bank, Report No. P7441-ET (Economic Rehabilitation Support Credit), April 30, 2001.Annex B (Letter of Development Policy), ¶121, includes the following undertakings:Before the end of 2001/02, we are planning to undertake the following measures. By October 2001, theCouncil of Ministers will adopt a Macro-Economic and Fiscal Framework (MEFF) and a Public InvestmentProgramme (PIP), which will lead to the budget for 2001/2002 [sic, but should read 2002/003] .. and byDecember 2001 it will submit it to the Council of People's Representatives. We will also prepare anylegislation relating to the PEP and present it to the Council of Ministers. Furthermore, MEDaC, incoordination with the MOF, will prepare a plan that lays out the resource requirements and a timetable tohelp the regional states in carrying forward their multi-year planning and budgeting process.13 The planned approach is described in Perran Penrose, Medium Term Expenditure Framework (MTEF)and Public Expenditure Programme (PEP), DSA Project Report P-43, April 2001.14 The importance of this issue was pointed out by Stephen Peterson, US-AID consultant.
7

system fails to address such issues in a systematic fashion. It is expected that the introduction ofPEP will improve the balance between recurrent and capital expenditures and thereby theefficiency of overall expenditures.
m. BUDGET EXECUTION
A. Internal Control
Q15. What are the principal forms of control to ensure that spending reflects the authorizedbudget?
Q16. (i) Do these controls involve or are they supplemented with commitment controls to limitexpenditure commitments to available cash resources?(ii) If cash rationing is a feature of the control system, describe the basis of decisions made aboutwhich activities should receive cash and which should not? Is there a way to protect cash forpoverty reducing expenditures (describe)?
Q1 7. What do you estimate as the level of the stock of expenditure arrears at the end of the lastfinancial year?
Q1 8. Are (govemment approved) supplementary budgets used to add to or substantially changethe pattern of government spending?
1.24 Disbursement procedures are concisely described in the IFMS report.' 5 Disbursements topublic bodies are made by the MOF Treasury Department on request. Procedures are differentfor salaries, recurrent operating expenditure, and capital expenditure. For salaries, Treasury cashflow projections assume a monthly outflow of one twelfth of the annual allocation, but actualdisbursements depend on requests supported by payroll documentation. Requests for recurrentoperating expenditure, normally submitted monthly, also require supporting documentation.Requests for capital expenditure financed from the Treasury Central Account are made only whenfunding is required, and again require documentation such as payment certificates and biddocuments.
1.25 Disbursement processes at regional government level are very similar, except that:* For recurrent operational expenditure, regions may request the Treasury
Department to make direct payments to suppliers; alternatively, theremay be months when cash flow requirements are such that a regionrequires more than the average monthly federal allocation; Treasurytakes these factors into account in its monthly instructions to the centralbank - the National Bank of Ethiopia (NBE).
* Funds for capital expenditure are routed through the NBE and theCommercial Bank of Ethiopia (CBE); Treasury Department notifies theNBE of each region's appropriated subsidy, and this governs the fundingfacilities allowed to each region by CBE. CBE reports all withdrawals toNBE which provides periodic consolidated reports to the TreasuryDepartment.
* Regional finance bureaus are responsible for authorizing disbursementrequests and releasing the subsidy element of funding to sector bureausat the regional level, and to zone finance departments, which in tumauthorize and disburse funds to zone sector departments and woredafinance offices. Disbursements are made net of revenue collections at
5 ibid., ¶4.42-4.47.
8
the woreda level, and are therefore cyclical, reflecting the seasonality ofcollections (see under Question 5 above).
1.26 Spending agencies must keep each line item of expenditure within approved estimates.As a part of the reformn effort, effective last year, public bodies have been delegated the power totransfer resources from one budget head to another within certain limits. For transfers beyondtheir delegated powers, public bodies have to approach MOF. Approval of the Council ofMinisters is required for (a) transfers from one public body to another; and (b) transfers fromrecurrent to capital expenditures. Supplementary expenditures require legislative approval, andquite rightly so.
1.27 This system has generally been effective in controlling expenditure without the need forcash rationing, although cash controls were reportedly applied during the later stages of theconflict with Eritrea.
1.28 The main weaknesses of the system are the following:
* Sub-optimal cash management. The system operates through largenumbers of bank accounts (the federal government has around 500 bankaccounts at NBE and some regional governments have over 100 bankaccounts), and this makes it difficult to manage overall liquidityefficiently. Studies under the EMCP have recommended Single TreasuryAccount system.
* Lack of any effective system of commitment control. This was aweakness noted in early analyses by the Civil Service Reform TaskForce. Although financial regulations require heads of public bodies tomaintain commitment records, this does not appear to happen.(However, the insistence that projects do not appear in the budget beforefunding is secured, makes it less likely that a serious overhang ofunbudgeted commitments could build up, at least on the capital side).
* The rigor with which expenditure controls are applied has costs in termsof ability to utilize available resources efficiently. Essentially, theprocess of expending the capital budget is not allowed to begin beforefunds are budgeted (and notification of capital budgets may reachspending agencies only well after the commencement of the FY). Oneresult is an extreme bunching of capital expenditures in the final monthsof the FY. Utilization of donor funds for SDPs has been delayed by theneed to follow the standard procedures for budgeting the funds assupplementary expenditures before they could be disbursed.
Ql9. How would you describe the internal audit function?
1.29 Both internal and external audit functions have been targeted for reform under the EMCP,but for various reasons have experienced delay in securing donor TA.
1.30 Internal auditing is not developed within Ethiopia's civil service. Traditionally internalaudit activities have been more of a "pre-audit" nature, serving simply as an additional step in theexpenditure approval process.
1.31 The internal audit component of EMCP has been designed to develop and implement aproper, modern internal audit capacity in all government institutions, federal and regional, but inthe absence of donor assistance there has been little progress beyond the design phase.
9
Ito the u timate service provider or beneficiary?
1.32 There have been no specific tracking surveys along the lines carried out in othercountries. However, given the strength of expenditure controls, it is believed that budgeted fundsreach the intended spending agency. Prima facie, the more important issues appear to be thequality and usage of public services and facilities, rather than the diversion of funds.
Procurement procedures and standardsThe HIPC tracking questionnaire has no explicit enquiry on the quality of public procurementprocedures, although these would appear very relevant to an assessment of the overall quality ofpublic expenditure management. Moreover, donors often cite concerns over procurement as areason for earmarking their aid and insisting that their own procurement rules take precedenceover the government's.
1.33 A Country Procurement Assessment Review (CPAR) was undertaken in 1998. Nationalprocedures for procurement of works, goods and services were found to be wanting in severalareas; the government responded by making some changes in its financial directives in this regardbut further revisions are needed to make the procedures acceptable in terms of their rigor andtransparency. An ideal system would be for government procurement procedures to attainUNCITRAL certification. Experience from other countries indicates that analysis, adoption andabsorption of the system under UNCITRAL could take up to 4-5 years. This is an issue that needsto be taken up in the bank's CPAR scheduled for FY02/FY03.
B. Recording Expenditures
Q21. When are budget tracking reports from line ministries and treasury received?Q22. Are the(intemal) tracking reports supplemented by information on accounts payable orpending bills?Q.23. Is there regular reconciliation of all government bank accounts (those held in the centralbank and the commercial banks) with the government's accounting records?
1.34 Each level of the financial disbursement system receives monthly reports from the bodiesto which it disburses funds. These reports are suited more for expenditure control rather thananalysis of expenditures for management purposes. However, it is very difficult to obtainaggregate reports at regional and national levels because of delays and lack of comprehensivenessof reports from lower levels.'6 Thus ESDP and HSDP have experienced great difficulty in
16 The recent Diagnosis of Existing Control Capacities in Ethiopia (page 23) comments on reporting asfollows:
The legal framework requires that all administrations (federal, regional, zonal and woreda) reporton their financial and physical performance on a monthly, quarterly, semi-annual and annual basis.However in practice we found that this was not the case. A delay in collating data at all levelsrenders the basic monthly reports impossible to prepare reliably and consequently has an impacton other reports.In addition there is a potential misunderstanding as to the definition of what the reports shoulddisclose. Some bodies show disbursement while others try to show actual expenditure, similarlydisclosure of revenue is either actual revenue or predicted. Without clear definitions the regions,and then the federal level, are receiving reports that are inconsistent. The problem is compoundedby the lack of detailed checking. Our investigations identified the source of the problem at theworeda level where there is difficulty in collating data from remote regions and there isinsufficient trained staff.
10
obtaining periodic aggregate expenditure reports for their sectors (although in their case theproblem is compounded by the fact that initial expenditure targets were not configured to matchthe government budget structure and classification). Systematic information on commitments isnot available.
1.35 The IFMS report notes that the federal and regional governments maintain very largenumbers of bank accounts. While the NBE indicated that they send a reconciliation statement onthe consolidated fund account to the MOF daily and reconciliation statements on respectiveaccounts to the spending agencies on a monthly basis, reconciliation of fiscal and monetaryaccounts is a major weakness in the current system. No aggregate systematic reconciliation isperformed on a regular basis, among others because of difference in timing of accounts (Fiscalaccounts use the Ethiopian year, while monetary accounts use the calendar year). Thegovernment's annual consolidated reports do not provide an account of how government hasobtained and utilized cash and cash equivalents (this would normally be done by showing"below-the-line" accounts).17
Q24. In (monthly or otherwise) reports of the consolidated operations of government, how largehas the statistical discrepancy between revenue minus expenditures (derived from MOF data)and financing items (derived from banking data) been on average over the past two years?
1.36 The gap between estimated deficits and financing totals can be as high as 1.5 percent ofGDP. The gap is attributed, among others, to gaps in reporting by sub-national governments andlack of reconciliation between monetary and fiscal accounts.
IV. BUDGET REPORTING
A. Regularity and Reliability of Reports
Q25. What in-year reports are published for tracking budget performance?
1.37 The IFMS report describes the reporting system as follows:18
All institutions that receive budget allocations are required to submit the followingreports to MOF:
* Monthly reports referred to as the Ge/He 29xxs series incorporateinformation on recurrent revenue, recurrent expenditure, capitalexpenditure and fund transfers between the treasury and the relevantinstitution.
* Annual reports referred to as "Zegeba reports". Essentially Zegebareports analyze variances between budget appropriations, actualdisbursements from Treasury and actual expenditure incurred by theinstitution.
1.38 The Central Accounts Department [CAD] uses the accounts module of the BDA system[a computerized Budget Disbursement and Accounts system developed under the budget reformproject] to capture and consolidate monthly returns received from public bodies and regionalgovernments. CAD reconciles consolidated information from the BDA system with Zegebareports and seeks explanations for any variances from the relevant public body/regionalgovernment. This provides a basis for generating annual reports on "budgetary revenue andexpenditure".
17 ibid_ $l4.86-49 918 ibid., ¶4.83ff.
1 1

1.39 In addition, the Policy and Research Department of MOF compiles reports on the federalgovernment's fiscal performance on a monthly basis within six weeks from the end of the month.The lag in preparing a consolidated statement for the combined federal-regional governments islonger. These reports provide information on revenue, expenditure and financing. To compilethis report the department depends largely on the disbursement records maintained by theTreasury.
1.40 While the system is well established, actual reports remain highly aggregated, and thereare considerable delays in obtaining reports that incorporate regional as well as federalexpenditures. These deficiencies reflect (a) the weaknesses of the classification system (whichare being addressed as indicated under Question 10 above); and (b) delays in receivinginformation from lower decentralized levels, which reflect the length of the communication chaininvolved, weaknesses in capacity, and the operation of manual systems.
|Q26. How often does the public and/or legislature receive budget tracking reports?
1.41 Budget estimates are reported on an annual basis to the legislature, and hence the public.There is no routine in-year reporting to legislature or public.
B. Final Audited Accounts
Q27. What is the period between the end of the fiscal year and the routine booking oftransactions?
Q28. How soon after the end of the relevant year are the accounts forwarded to audit?
Q29. How soon after the end of the relevant year are the audited final accounts presented to thepublic and/or the legislature?
1.42 Routine booking of transactions is closed after a grace period of one month following theend of the fiscal year. The gap could be longer, extending up to four months, in the regions.
1.43 One of the primary objectives of the accounts project within EMCP has been to clear afour-year backlog in closing regional and federal accounts. Progress was held up by a diversionof attention to the introduction of the interim tracking system for Channel lb funds, but thebacklog has again been substantially reduced and at least two major regions are now effectivelycurrent.
1.44 However, there are a number of outstanding issues concerning the auditing of accounts.Within the present constitutional framework, each Regional State has a responsibility to audit itsown accounts. The Federal Auditor General is responsible for auditing the accounts of federalministries and other federal agencies, but the Federal Government also has the right to audit allregional expenditures that are funded through the federal subsidy. The IFMS report'9 raises twosets of concerns: (a) that the accounting information available to the Auditor General is not asatisfactory basis for arriving at the required judgments (e.g. because the AG is not presentedwith sufficient information on assets such as bank accounts to support the MOF accounts ofrevenues and expenditures); and (b) lack of transparency, in that there seems to be nocomprehensive report by the Auditor General that is in the public domain.
1.45 It was intended that expenditure reports on ESDP and HSDP would be certified by theAuditor General, but this has not occurred.
'9 ibid., ¶3.26-3.30.
12

1.46 An EC-sponsored study to review the quality of financial controls in Ethiopia hasconcluded that:
On the whole the project team found controls to exist but not necessarily to comply withthose prescribed by the Ethiopian Government in the relevant proclamations and directives.The controls over financing are strong, and there is no evidence of overspending of thebudget. The major weaknesses found in the existing system were:
* the budget process is seriously affected by resource and time constraintsleading to inconsistencies in the way budgets are prepared and seriousdelays in setting the budget;
* the reporting process is seriously delayed due to lack of qualified staff atthe local government levels. As a result, the Federal administration isthree years behind schedule in the preparation of the annual consolidatedaccounts;
* the role played by Internal Audit is confused and ineffective; and
* the external audit department is understaffed and, as a result, is notcapable of fulfilling all of its duties.
1.47 The study makes a number of recommendations for rationalization of procedures and, inparticular, for strengthening of staffing in audit and accounting units across regional and federalgovernment. There is particular stress on the need for targeted training for woreda and zonefinancial staff, and for review of staff complements at local levels.
1.48 Within the CSRP/EMCP, the component for strengthening external audit has, as yet,failed to obtain donor funding.
V. BUDGET EVALUATION
Q30. Are any efforts being mounted to assess the effects of spending on the incidence ofpoverty?
a) Tracking studies of H1PC-related funds or targeted evaluation of sector or otherpoverty programs.b) Broad social indicators of poverty.c) None.
1.49 The relationship between public expenditure and poverty has been one of the main topicsinvestigated by PER 2001. Findings are fully set out in a background paper 20 and also reported inChapter 3 of the main PER document. In brief the findings are:
(a) The sector programs for health and education include agreed sets ofperformance indicators and a procedure for annual joint donor/governmentreviews of performance. Tracking studies of IiIPC-related funds is not yetapplicable.
(b) Basic surveys to monitor poverty overall are adequate in scope, frequencyand sample size. They form part of an overall welfare monitoring systemwhich is well-conceived but has yet to be made properly effective. The mainproblems are to do with timely processing of data and reporting, and the needto go beyond the basic measures of income poverty in order to exploit
20 Mokoro Limited, Tracking of Public Expendituresfor Poverty Reduction, Ethiopia PER 2001 DiscussionPaper, August 2001.
13
available data more effectively. Delays in reporting means that use ofpoverty information in policy formulation and resource allocation is limited.There is a particular need to disaggregate data, especially on a geographicalbasis, and to make the resulting information available at regional and zonallevels.
(c) General program evaluation of outcomes is extremely rare, thoughsystematic information on outputs is available for a number of sectors,including health, education and roads.2 '
Q3 1. Please identify current providers of technical or donor assistance and their plans in the tableprovided.
21 PER 2000 included (in Chapter 5) a review of the scope for shifting attention from inputs to results, andits Appendix S provided an overview of available output and outcome indicators.
14
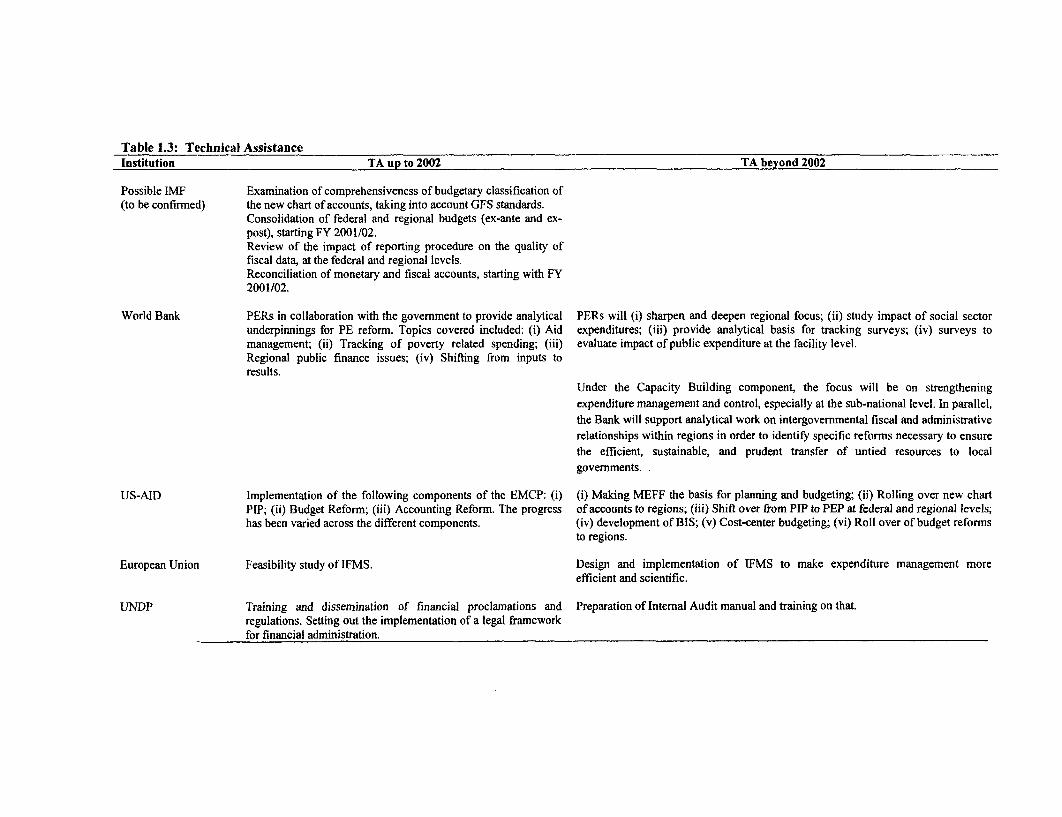
Table 1.3: Technical AssistanceInstitution TA up to 2002 TA beyond 2002
Possible IMF Examination of comprehensiveness of budgetary classification of(to be confirmed) the new chart of accounts, taking into account GFS standards.
Consolidation of federal and regional budgets (ex-ante and ex-post), starting FY 2001/02.Review of the impact of reporting procedure on the quality offiscal data, at the federal and regional levels.Reconciliation of monetary and fiscal accounts, starting with FY2001/02.
World Bank PERs in collaboration with the govemment to provide analytical PERs will (i) sharpen and deepen regional focus; (ii) study impact of social sectorunderpinnings for PE reform. Topics covered included: (i) Aid expenditures; (iii) provide analytical basis for tracking surveys; (iv) surveys tomanagement; (ii) Tracking of poverty related spending; (iii) evaluate impact of public expenditure at the facility level.Regional public finance issues; (iv) Shifting from inputs toresults.
Under the Capacity Building component, the focus will be on strengtheningexpenditure management and control, especially at the sub-national level. In parallel,the Bank will support analytical work on intergovernmental fiscal and administrativerelationships within regions in order to identify specific reforms necessary to ensurethe efficient, sustainable, and prudent transfer of untied resources to localgovernments. .
US-AID Implementation of the following components of the EMCP: (i) (i) Making MEFF the basis for planning and budgeting; (ii) Rolling over new chartPIP; (ii) Budget Reform; (iii) Accounting Reform. The progress of accounts to regions; (iii) Shift over from PIP to PEP at federal and regional levels;has been varied across the different components. (iv) development of BIS; (v) Cost-center budgeting; (vi) Roll over of budget reforms
to regions.
European Union Feasibility study of IFMS. Design and implementation of IFMS to make expenditure management moreefficient and scientific.
UNDP Training and dissemination of financial proclamations and Preparation of Intemal Audit manual and training on that.regulations. Setting out the implementation of a legal frameworkfor financial administration.
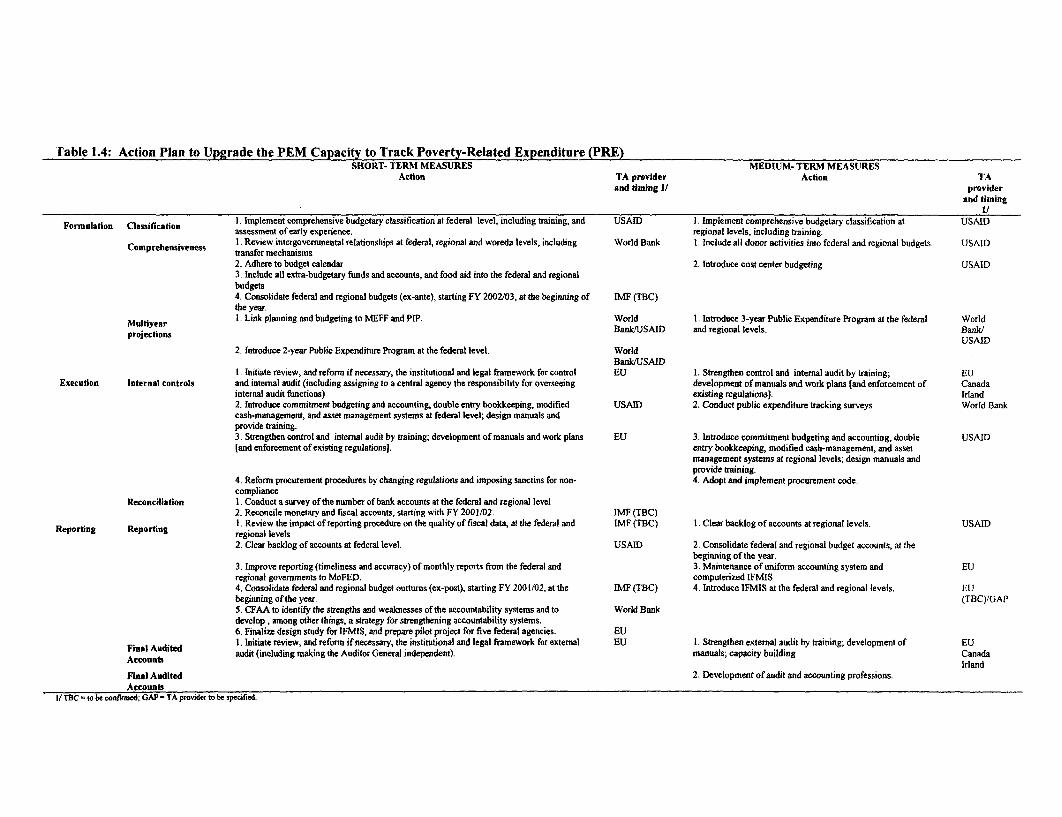
[able 1.4: Action Plan to Upgrade the PEM Capacity to Track Poverty-Related Expenditure (PRE)SHORT- TERM MEASURES MEDIUM- TERM MEASURES
Action TA provider Action TAand timing 1/ provider
and timing
Formulation Classification 1. Implement comprehensive budgetary classification at federal level, including training, and USAID I. Implement comprehensive budgetary classification at USAIDassessment of early experience. regional levels, including training.
Comprehensiveness I .Review intergovernmental relationships at federal, regional and woreda levels, including World Bank 1. Include all donor activities into federal and regional budgets. USAIDtransfer mechanisms2. Adhere to budget calendar 2. Introduce cost center budgeting USAID3. Include all extra-budgetary funds and accounts, and food aid into the federal and regionalbudgets4. Consolidate federal and regional budgets (ex-ante), starting FY 2002/03, at the beginning of IME (TBC)the year.
Multiyear I. Link planning and budgeting to MEFF and PIP. World I. Introduce 3-year Public Expenditure Program at the federal Worldprojections Bank/USAID and regional levels. BankW
USAID2. Introduce 2-year Public Expenditure Program at the federal level. World
BankWUSAIDI. Initiate review, and reform if necessary, the institutional and legal framework for control EU 1. Strengthen control and intemal audit by training; EU
Execution Internal controls and internal audit (including assigning to a central agency the responsibility for overseeing development of manuals and work plans land enforcement of Canadainternal audit functions) existing regulationsl. Irland2. Introduce commitment budgeting and accounting, double entry bookkeeping, modified USAID 2. Conduct public expenditure tracking surveys World Bankcash-management, and asset management systems at federal level; design manuals andprovide training.3. Strengthen control and internal audit by training; development of manuals and work plans EU 3. Introduce commitment budgeting and accounting, double USAID[and enforcement of existing regulations]. entry bookkeeping, modified cash-management, and asset
management systems at regional levels; design manuals andprovide training.
4. Reform procurement procedures by changing regulations and imposing sanctins for non- 4. Adopt and implement procurement code.compliance
Reconciliation I. Conduct a survey of the number of bank accounts at the federal and regional level2. Reconcile monetary and fiscal accounts, starting with FY 2001/02. IMg (TBC)I. Review the impact of reporting procedure on the quality of fiscal data, at the federal and IMg (TBC) I. Clear backlog of accounts at regional levels. USAID
Reporfing Reporting regional levels2. Clear backlog of accounts at federal level. USAID 2. Consolidate federal and regional budget accounts, at the
beginning of the year.3. Improve reporting (timeliness and accuracy) of monthly reports from the federal and 3. Maintenance of uniform accounting system and EUregional governments to MoFED. computerized IFMIS4. Consolidate federal and regional budget outtums (ex-post), starting FY 2001/02, at the IMg (TBC) 4. Introduce IFMIS at the federal and regional levels. EUbeginning of the year. (TBC)/GAP5. CFAA to identify the strengths and weaknesses of the accountability systems and to World Bankdevelop, among other things, a strategy for strengthening accountability systems.6. Finalize design study for IFMIS, and prepare pilot project for five federal agencies. EUI. Initiate review, and reform if necessary, the institutional and legal framework for extemal EU I. Strengthen external audit by training; development of EU
Final Audited audit (including making the Auditor General independent). manuals; capacity building CanadaAccounts Irland
Final Audited 2. Development of audit and accounting professions.Accounts
I/ TBC - to be confirmed: GAP = TA provider to be specified.
Appendix 2
POVERTY AND PUBLIC POLICY IN ETHIOPLA
[This Annex briefly reviews the approach to poverty that is reflected in Ethiopia's public policydocuments, and especially the I-PRSP].
Commitment to Poverty Reduction
2.1 There is no doubt that attacking poverty - especially rural poverty - is at the center ofGovernment's concerns, although many policy documents express this concern in terms of equityrather than poverty as such. The Prime Minister has stated that our only 'holy cow' is protectingthe interests of the rural poor - the vast majority, and this is reflected, among other things, in aland policy that aims to ensure universal access to land, in an overall development strategy(Agricultural Development Led Industrialization - ADLI) that focuses on agriculturaldevelopment, and in social sector programs that prioritize the extension of basic services acrossthe country.22 To the extent that there is policy debate between GOE and its developmentpartners, this concerns the effectiveness of government's poverty strategy: the Government'scommitment to poverty reduction is not in doubt.
I-PRSP Analysis and Strategy
2.2 The key document laying out the government's poverty focus and strategy is now theInterim Poverty Reduction Strategy Paper (I-PRSP). 23 This is presented not as a new initiative,but as a broad picture of the poverty reduction strategy that Ethiopia has pursued in recent yearsand intends to elaborate in its preparation of a full-fledged PRSP. In its account of poverty inEthiopia, the I-PRSP concurs with the now widely-accepted view of poverty as multi-dimensionaland complex, and commits Ethiopia to attain, at least, the internationally accepted targets for thereduction of poverty by the year 2015. A series of indicators and targets are presented in tabularform, and, where possible, compared with the relevant International Development Goals.
2.3 The I-PRSP and other official documents describe poverty in Ethiopia as widespread andmulti-faceted. Although consumption poverty is used as the main yardstick of the extent ofpoverty, there are numerous references to indicators of other dimensions of poverty. Theseinclude education participation rates, health and nutrition indicators and the extent of householdfood insecurity. Poverty is seen as predominantly a rural problem and a problem of hunger. Thestrategies outlined in the I-PRSP aim to reduce poverty through ensuring macro-economicstability, promoting market liberalization, and increasing social sector spending. The main pillarsof poverty reduction as described in the I-PRSP are: ADLI, reform of the judiciary and civilservice, decentralization and empowerment, and capacity-building. Strategies includedevelopment programs in agriculture, education, health (including HIV/AIDS), roads and theESRDF.
22 The 1994 Constitution (Article 90, ¶1) mandates that: to the extent the country's resources permit,policies shall aim to provide all Ethiopians access to health and education, clean water, housing, food andsocial security.
23 Conveniently published in World Bank Report No. 21769-ET: Ethiopia: Interim Poverty ReductionStrategy Paper 2000/01 - 2002/03 and Joint IDA/IMF StaffAssessment, January 30, 2001.
2.4 The I-PRSP focuses on how to reduce poverty among resource-poor small-scale farmerswho represent almost 90 percent of Ethiopia's poor. The I-PRSP also notes that poverty inEthiopia is less homogeneous than is implied by that figure. It acknowledges that regionalvariations in poverty exist and that there are gaps in understanding with respect to pastoralists,farmers in dry-land areas and the urban unemployed. Other official documents show clearlydifferentiated regional trends in welfare indicators, worryingly high numbers of malnourishedchildren and marked female disadvantage as measured by illiteracy rates and other indicators ofwelfare. Figures from the Disaster Preparedness and Prevention Commission (DPPC) appear tosuggest that the number of food aid recipients is increasing.
2.5 On the links between poverty and public expenditure, the I-PRSP anticipates thatreduction in military expenditure will provide room for increasing expenditure oriented towardspoverty reduction, such as the social sector. These expenditures will be duly costed to ensureconsistency with resource availability. Furthermore, public expenditure management will bestrengthened to facilitate the identification and tracking of poverty related expenditures.
2.6 This is reflected in the following specific policy measures which are included in thePoverty Reduction Policy Matrix 2000/01 - 2002/03:
* Give priority to education, health, agriculture and roads in programming andbudgeting.
* Maintain consistency between current and capital expenditures.
* Increase the share of public expenditure in education, health, agriculture andnatural resources, and roads to 14.7, 7, 10.2 and 10.1 percent of totalexpenditure.
* Introduce macroeconomic and fiscal framework (MEFF) in planning andbudgeting (2001/02).
* Adhere to the Financial Calendar.
* Define a time frame for introducing cost-center budgeting.
2.7 The strategy for decentralization and empowerment links fiscal federalism to furtherdecentralization to the district (woreda) level within the regional states. This is noted as amedium to long term process, but one which will create room for tackling poverty directly at thegrass roots level. It is expected to provide a basis for meaningful participation by the people inlocal development programs (especially primary education, primary health care, rural watersupply, rural roads and agricultural extension). The I-PRSP states that fiscal federalism "grantsthe regions full autonomy in budgetary expenditures", but does not explain how this is reconciledwith the policy matrix targets for the shares of key sectors in total (i.e. federal plus regional)expenditures.
18
Appendix 3
WELFARE MONITORING IN ETHIOPIA
Overview of Available Data
3.1 Ethiopia has a large number of different data sources that can be used for welfare andpoverty analysis. Box 3.1 summarizes the main potential sources, and also shows the reportinglevels that each of the surveys allows for - i.e. the lowest level of geographical disaggregation atwhich the results can be reported without compromising statistical representativeness. Samplesizes have been increasing in recent years. This increases the scope for meaningfuldisaggregation, but also increases the logistical problems involved in getting the data to theresponsible analysts in a reasonable time. Broadly speaking, however, the Central StatisticalAuthority delivers an elaborate and complicated survey program with relatively limited time lags.
3.2 Box 3.2 gives an overview of the type of information available in the main national datasets and matches potential data sources to the four principal dimensions of poverty. These dataare sufficient for a broad, multi-dimensional analysis of poverty and welfare. For example, thenationally representative Welfare Monitoring Surveys interviewed in 1995 and in 2000 the samehouseholds as those covered by the Household Income, Consumption and Expenditure Survey(HICES) survey. Consequently, monetary and non-monetary welfare indicators can be compared.In other words, links between consumption (monetary indicators) and health, education ornutrition outcomes can be explored. Also, links between assets (e.g. livestock) and poverty canbe explored in the most recent data.
Scope of Data and Institutional Responsibilities for Monitoring and Analysis
3.3 Primary responsibility for conducting national surveys rests with the Central StatisticalAuthority (CSA) which is accountable to the Ministry of Economic Development andCooperation (MEDAC). The CSA has significant capacity constraints (its draft program for thenext 5 years envisages a near trebling of its professional staff and similar increases in otherresources) 24. Nevertheless, the CSA does a generally commendable job in managing its surveyprogram. The CSA has published data reports on the HICES/WMS of 1995/96 and the WMS of1998. However, since the CSA's main role is to gather data and make it available to users, thesereports do not go beyond a set of descriptive statistics and cross tabulations by reporting levels.The Demographic and Health Survey, conducted in 2000 by CSA, was the first of its kind and isintended to be repeated every 5 years. A report of the key indicators from this survey is nowavailable.
24 MEDAC, January 2001, A Medium Term National Statistical Program for Ethiopia (2000/01 - 2004/05),Executive Summary, p23, Table 3.2.

Box 3.1: Selected Welfare Monitoring Data
Source Survey type Coverage (time) Coverage (place) Reporting Levels Collection/AnalysisA. Nation-wide official dataWelfare Monitoring Survey (WMS) Cross-section household 1995/96, 1997, 1998, Nationally Representative National, Regional, Zonal, CSA, WMU
data 2000/01 Urban/Rural
Household Income, Consumption and Cross-section household 1995/96, 2000/01 Nationally Representative National, Regional, Zonal, CSA, WMUExpenditure Survey (HICES) data Urban/Rural
Demographic and Health Survey Cross-section household 2000 Nationally representative National, Regional, CSAdata Urban/Rural
Census Household and 1994 National National down to Woreda CSAindividual data
Data from Health Sector Development Administrative reporting Yearly National Currently National down to Min of HealthProgram Region **
Data from Education Sector Development Administrative reporting Yearly National Currently National down to Min of EducationProgram Region **
Numbers eligible for food aid Administrative reporting yearly Aggregation from Region, Zone, Woreda DPPCadministrative data
B. Independent quantitative sourcesEthiopian Rural Household Survey - sub- Panel household data 1994, 1994b, 1995, 15 Villages * Villages (reflecting livelihood Economics Dept, AAUsample (i.e. same households) 1997, 1999, 2000 diversity, not statistically with Oxford University
representative)Ethiopian Urban Household Survey Panel household data 1994, 1995, 1997, 10 major towns, 1,400 Main towns Economics Dept, AAU
1999 households with GothenburgUniversity
C. Otialitative data collection and analysisPar .c patory Poverty Assessment Multiple qualitative 1997 10 specific communities, 6 Diverse communities, but not World Bank in
methods rural and 4 urban statistically representative collaboration withGovemment
Consultations with the Poor Multiple qualitative 2000 10 specific communities Poor villages, not Forum for Socialmethods (drawn from Addis Ababa representative beyond specific Studies/World Bank
and two regional woredas) communities
* For 6 communities (350 households) data go back to 1989; for 4 communities data (500 households) data extend to 2001.** Reporting levels are a statistical issue for survey based data (i.e the lowest level of geographical disaggregation at which the results can be reported without compromising statisticairepresentativeness). For administrative data, we give the reporting levels typically used in publications and data bases.
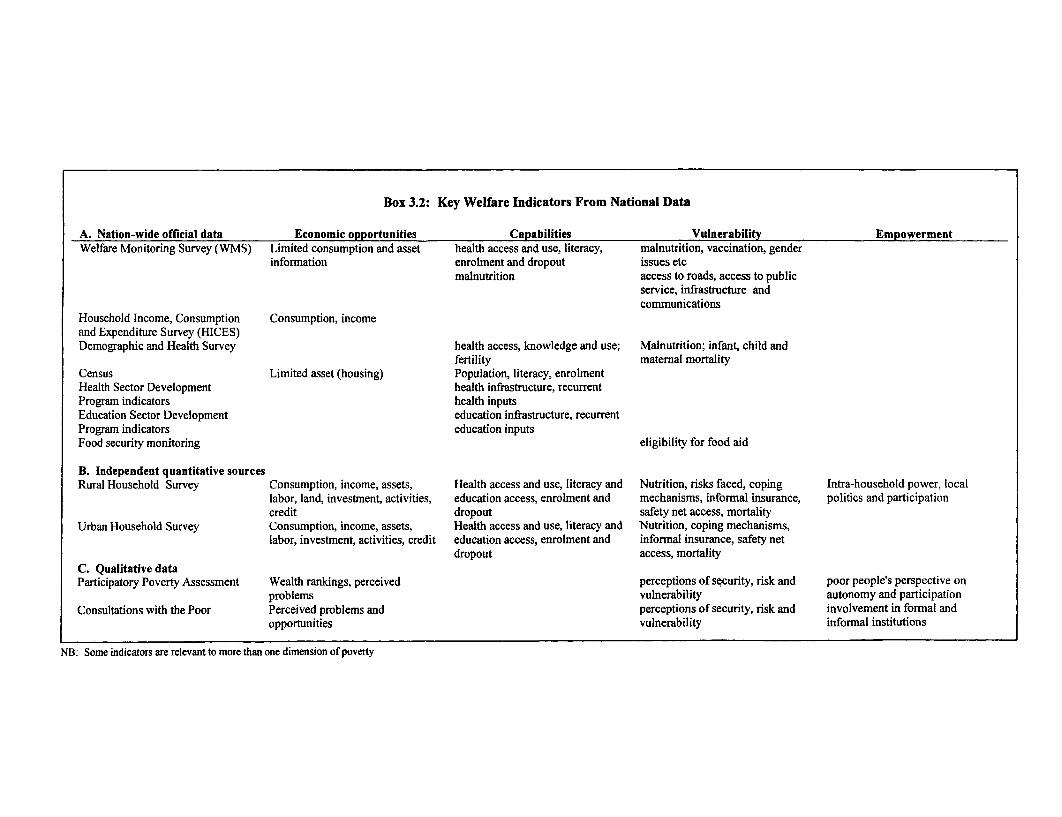
Box 3.2: Key Welfare Indicators From National Data
A. Nation-wide official data Economic opportunities Capabilities Vulnerability EmpowermentWelfare Monitoring Survey (WMS) Limited consumption and asset health access and use, literacy, malnutrition, vaccination, gender
information enrolment and dropout issues etcmalnutrition access to roads, access to public
service, infrastructure andcommunications
Household Income, Consumption Consumption, incomeand Expenditure Survey (HICES)Demographic and Health Survey health access, knowledge and use; Malnutrition; infant, child and
fertility maternal mortalityCensus Limited asset (housing) Population, literacy, enrolmentHealth Sector Development health infrastructure, recurrentProgram indicators health inputsEducation Sector Development education infrastructure, recurrentProgram indicators education inputsFood security monitoring eligibility for food aid
B. Independent quantitative sourcesRural Household Survey Consumption, income, assets, Health access and use, literacy and Nutrition, risks faced, coping Intra-household power, local
labor, land, investment, activities, education access, enrolment and mechanisms, informal insurance, politics and participationcredit dropout safety net access, mortality
Urban Household Survey Consumption, income, assets, Health access and use, literacy and Nutrition, coping mechanisms,labor, investment, activities, credit education access, enrolment and informal insurance, safety net
dropout access, mortalityC. Qualitative dataParticipatory Poverty Assessment Wealth rankings, perceived perceptions of security, risk and poor people's perspective on
problems vulnerability autonomy and participationConsultations with the Poor Perceived problems and perceptions of security, risk and involvement in formal and
opportunities vulnerability informal institutions
NB: Some indicators are relevant to more than one dimension of poverty
3.4 Within MEDAC there is a Welfare Monitoring Unit (WMU), which is responsible foranalysis and reporting. The WMU was intended to be the focal point of a coherent WelfareMonitoring System, as described in Box 3.3. Up to now, the WMU has fulfilled only a smallpart of its intended role. Initially, the WMU identified the analysis of the HICES to deriveconsumption poverty information as its main priority. Analysis of the Welfare MonitoringSurvey was also on the agenda, but after the first task was completed. The WMU produced areport (Poverty Situation in Ethiopia), in March 1999, which analyzed the HICES 1995/96, butonly with respect to consumption poverty and some basic descriptive statistics on the non-monetary data. For example, there was no attempt to link the non-monetary and monetarycharacteristics. The report also drew on the 1996 WMS and described national and geographicalpoverty levels based on an absolute poverty line and some limited analysis of the non-monetarywelfare data. This is the WMU's only substantial report so far, and the complementary activitiesdescribed in Box 3.3 have not yet been undertaken.2 5
3.5 The education and health data collected under the ESDP and HSDP are drawn from avariety of administrative sources and are collated by the respective federal Ministries. Health andEducation indicators are reviewed in more detail in Annex 3.4.
3.6 Food insecurity is one of the principal symptoms of poverty, and the DisasterPreparedness and Prevention Commission (DPPC) is responsible for monitoring the food securitysituation in order to determine requirements for food aid. This is based on continuous monitoringof household vulnerability, and therefore provides valuable additional insights into the povertystatus of the Ethiopian population. The avoidance of major famines since 1984 is an indicationthat the system is quite effective. Box 3.4 describes the monitoring system. Because its datafocus on whole woredas, the DPPC monitoring is quite "broad brush". There is strong continuity- each year the majority of woredas requiring relief also needed help in previous years, whichstrongly suggests that the most of the food relief requirements stem from chronic poverty ratherthan temporary emergencies.26 There are discrepancies in the way that the 'food insecure' and 'thepoor' are counted by the DPPC and the Welfare Monitoring Survey respectively. The WMS maybe more comprehensive because DPPC excludes poor households not in need of food aid.However, the WMS has excluded people without addresses (pastoral populations and thehomeless) - who may be a significant percentage of the poor population in particular areas.
3.7 In 1999 and 2000 the regional governments of Oromiya, Amhara, SNNP and Tigrayregions created Food Security Offices, which are in charge of identifying food insecure areas,analyzing the causes of food insecurity, designing actions to remedy these situations and tocoordinate with line administrations for the implementation of these actions.27 USAID isproviding support to the Food Security Units in Amhara, Oromiya, SNNP and Tigray to produce"vulnerability profiles" which should elucidate the socio-economic and physical causes ofvulnerability, out of which should come packages of appropriate solutions. This is being pilotedin 16 woredas.
3.8 Boxes 3.3 and 3.4 below also highlight two fairly large-scale surveys based on non-government research. These panel data sources are not suitable for describing the evolution ofnational welfare outcomes, but their panel nature (following the same households over time) anddetail in the questionnaires allows a substantive analysis of the link between welfare outcomes,
25 However, as noted in the main chapter, there is now a renewed impetus for the WMU's work.26 See Resal Ethiopia, Public expenditure management aspects offood security, April 2001, p28.27 See Resal Ethiopia, ibid. page iii.
22

events and policies for the communities involved. The administrative data can provide furthercomplementary information.
3.9 Two major participatory surveys have been undertaken (with research in 1997 and 2000).Both were sponsored by the World Bank. The participatory surveys are again not representative,but they give useful specific contextual information that may help understanding of thecomplexities of the poverty situation beyond the communities involved.
3.10 Although the regional governments have a substantial degree of autonomy, they do nothave separate statistical programs of their own, and therefore rely mainly on statistics compiledby federal agencies. The Medium Term Statistical Program document stresses the importance ofimproving the links between federal and regional governments for the consolidation ofadministrative statistics, and highlights the need for close coordination of statistics work betweendifferent levels of government. It is envisaged that future statistics legislation would clarify therespective roles of federal and decentralized levels of government, and lay the basis fordevelopment of stronger regional statistical systems.28
Box 3.3: Welfare Monitoring System and Role of the Welfare Monitoring Unit
A Welfare Monitoring System (WMS) was set up in 1996, at the same time as the Ethiopian Social Rehabilitation and Development Fund(ESRDF) was established. It was intended to operate as follows.
Objectives of the WMS. The WMS exists to monitor the social impact of the Government's economic reform program and itscontribution to poverty reduction, helping decision-making and planning. The WMS is built around an Annual Review of Social Trendsand Welfare reflecting changes in the status of different population groups, and identifying key policy issues for further consideration.The system is designed to: (i) present a national and regional review of welfare indicators showing their spatial distribution andmovements over time; (ii) identify poor and vulnerable groups that require targeted assistance; (iii) assess the short and medium termeffects of macro-economic and sectoral policies and programs on the poor; and (iv) monitor changes in status of the poor and vulnerablepopulation groups.
Features of the WMS. The WMS has supported the establishment of a Welfare Monitoring Unit (WMU) in MEDAC. The WMU isresponsible for (i) coordination of the various elements of the system; (ii) creation and maintenance of the socio-economic database tofacilitate the preparation of an annual Review of Social Trends and Welfare, and to support further analytical work and evaluation studies;(iii) analysis and policy advice, commissioning position papers on the social impact of Government policies, working with researchagencies as well as private sector consultants; (iv) workshops and seminars at central and regional levels to disseminate and promotediscussion of information generated by the monitoring system. The WMU also controls a Study Fund to support studies or surveys onspecific issues relevant to the WMS. The Fund aims to promote and foster the development of in-country analytical and research skills,both in government agencies and independent research groups and the private sector. It may also be used to promote methodologicalinnovation (including the application of beneficiary and participatory poverty assessments), and the development, testing and applicationof rapid low cost processes for data collection, entry and processing. The Central Statistical Authority is also a key player in the WMSand has received support to implement a household survey program designed to provide annual indicators to monitor welfare levels acrossthe country.
Institutional Structures and Responsibilities. The WMS is overseen by a national inter-ministerial Welfare Review Committee (WRC)chaired by the Minister of Economic Development and Cooperation. The WRC should regularly review the policy implications of WMSreports. The Welfare Monitoring Unit (WMU) serves as the secretariat for the WRC. A small technical multi-agency WMS AdvisoryGroup has been established and is chaired by the Head of the WMU, and with members drawn from line ministries, CSA, researchinstitutions, and NGOs. The Advisory Group is to meet regularly to help ensure that implementation of the WMS benefits from a widerange of views and technical experience, and to review the quality of WMS outputs. The group may (i) contribute to the review of theAnnual Review of Social Trends and the impact of economic and social policies and programs on welfare levels; (ii) contribute to thereview of applications for use of the Study Fund and make recommendations to the Steering Committee; (iii) carry out a technical reviewof Study Fund outputs; and (iv) review and comment on questionnaires for household and community surveys implemented as part of theWMS. The Central Statistical Authority (CSA) is represented on the Advisory Group and is a major supplier of data for the WMS. TheWelfare Monitoring System supports the strengthening of the CSA's capacity for data collection, data processing, data storage anddissemination. Sectoral Ministries and the DPPC also undertake data collection and analysis in their own sectors, and maintain their owninformation systems. The results of these analytical activities should also be fed into the WMS.
The WMS is intended to encourage stronger links between government agencies and research establishments such as the Ethiopian Healthand Nutrition Research Institute (EHNRI), the Institute of Development Research (IDR) and the Economics Department of Addis AbabaUniversity (EDIAAU). The Advisory Group includes representatives from the academic community, and the Study Fund is intended tohelp promote policy-relevant research. The WMU and CSA are also expected to provide technical support for building up regionalwelfare monitoring capacity.
23

Box 3.4: Monitoring of Food Relief Requirements'
According to DPPC training manuals (dated March 2000) being prepared and circulated by the DPPC, the general methodfor assessment of those requiring relief is as follows.(i) Monthly grass roots early warning information is sent from woreda "early warning units" in the woreda level of the
Bureau of Agriculture (BOA) to zonal level. If this information reveals a serious situation, the woreda (through itsWoreda Disaster Preparedness and Prevention Committee = WDPPC) is invited to apply for Woreda Relief Assistanceon a special form which requires the following information:
* the total. number for PAs (Peasant Associations) and the "affected" PAs in each agro-ecological zone in theworeda
* the total population of the affected PAs* the degree of affectedness (on a 3-point scale)* the percent of the population affected in each PA in each "degree of affectedness scale".
These lead to an estimate of the number of people affected which in turn leads to an estimate of the number "eligible forrelief'. The precise operating criteria for a household's eligibility seem to be locality specific (in many areas it is "not evenhaving one ploughing ox") but guided by the general principle that to be eligible a household has to be:
* expected to experience a major fall in household income (below a "normal" level) AND* unable to cope with the fail by its own coping mechanisms AND* likely to face a significant fall in food consumption to the point of risk of starvation OR* likely to have to take drastic measures such as the sale of essential assets so as to avoid starvation.* the estimated duration (in months) of the relief required* the start date for the required relief* the estimated number of people not now eligible but requiring close monitoring of their condition.
(ii) These woreda level assessments of the need for relief are collected at zonal level, checked there for consistency andaccuracy, and forwarded to the regional level (where the Disaster Prevention and Preparedness Bureaus act as thesecretariat for the Regional Early Warning Committees) where the same procedure is repeated
(iii) The regional level may send out field assessment missions to clarify and adjust woreda and zonal-level demands. Inany case it decides on the level of needs and forwards a request for relief to the National Early Warning Committee ofwhich the Early Warning Department of the DPPC is the secretariat.
The National Early Waming Committee then in tum sends out inter-agency field assessment missions to the regions andthese missions will visit a number of the woredas requesting assistance. In the light of these missions' reports the nationalEarly Waning Committee makes decisions and in most years launches an appeal to donors.
2S MEDAC, January 2001, A Medium Term National Statistical Program for Ethiopia (2000/01 - 2004/05).
24

Appendix 4
EXPENDITURE TRACKING AND RESULTS MONITORINGIN EDUCATION AND HEALTH
Introduction
4.1 The education and health sectors have a prominent role in Ethiopia's poverty reductionstrategy. Sector-wide strategies have been developed and the management frameworks for boththe Education Sector Development Program (ESDP) and the Health Sector Development Program(HSDP) are innovative in the way they seek to coordinate federal and regional activities with aidagencies' support. Both ESDP and HSDP have a system for monitoring and review ofperformance, with efforts to track results as well as expenditures. These sectors therefore offerimportant insights into the poverty focus of services, expenditure levels and shares, the ability totrack expenditures and monitor results, and the respective roles of federal and regional bodies.There are also important lessons to be drawn about effective aid management.
4.2 This Annex summarizes the detailed findings on which the main Chapter's overallconclusions are based. For both ESDP and HSDP, the Mid Term Reviews, which were carriedout in March/April 2001 by mixed teams provided by government and donors, are the principalsource of the information presented here.29
Institutional Responsibilities and Expenditure Shares
4.3 In both these sectors the lower levels of service provision, and hence the bulk of publicexpenditures, are a regional responsibility. However, the inter-relationships between federal andregional levels are complex. The constitutional framework requires the regions to follow nationalpolicies even though the federal government does not specify regional budgets in detail or evenearmark the federal subsidy to particular sectors. Comprehensive Sector Development Programs(ESDP and HSDP) were initiated in 1997/98. The initiative came from the Ethiopiangovernment, which had prepared 20 year strategies for each sector, and details of the first five-year phases were worked out through intensive collaboration between the federal and regionalsector bureaus in dialogue with a series of joint donor technical assistance missions.
4.4 Key features of the SDPs were:
* Detailed expenditure programs for 1997/98-2001/02 were developed.These specified recurrent and capital expenditure targets for each regionand the federal government, broken down by year and by broadcomponents of expenditure. Expenditure projections included donor aswell as domestic funding.
* For each sector a monitoring system was specified, focused on a core setof performance indicators.
29 See Report of the Mid Term Review Mission, 7 February to 8 March 2001, Ethiopia Health SectorDevelopment Programme 1997/98-2001/02 (EC 1990-1994), 81 March 2001, and Mid Term ReviewMission February 13' - March 3 'd 2001, (2 volumes), Ethiopia Education Sector Development Programme1997/8 - 2001/2.

* Governance mechanisms were established, in which a Central Joint SteeringCommittee (CJSC), chaired by the Minister for Social and AdministrativeAffairs in the Prime Minister's Office (PMO), brings together governmentand donors to oversee and coordinate the two programs. Regional JointSteering Committees perform similar functions in the Regions. Each yearjoint review missions (JRMs) are conducted, prior to an Annual ReviewMeeting (ARM) of federal, regional and donor stakeholders.
* Expenditure tracking became a prominent concern, not only for the purposeof reporting on SDP expenditures as a whole, but also for tracking earmarkedfunds disbursed (by the World Bank) through Channel lb.
4.5 Thus, as well as being intrinsically important, these sectors offer practical lessons ofexperience on expenditure tracking and performance monitoring undertaken jointly byGovernment and donors. Implementation of the SDPs, and, in particular, donor participation, wasseverely disrupted by the conflict with Eritrea. This experience, too, offers general lessons aboutthe management and targeting of aid which are developed in Chapter 4 of this PER.
Poverty Relevance of Expenditures
4.6 Education and health are identified as priority sectors for poverty reduction, andfeature strongly in Ethiopia's Interim PRSP where "a healthy, literate and active labor force" isidentified as critical for enabling society "to carry out its economic activities and to effectivelyshoulder its political and social responsibilities". Primary health care and primary education areidentified as especially poverty-targeted, given the larger numbers of poor people who useservices at this level, compared with their use of higher levels of provision. Even by Africanstandards, current welfare indicators in Ethiopia are poor partly because of extremely low levelsof health and education provision.30
4.7 The first objective for both SDPs is to increase service coverage at primary levels so as toensure greater access by a higher percentage of the population and of the poor. From an equitypoint of view, both programs explicitly identify a need to redress acute shortfalls in provision inrural areas and in the Emerging Regions, and to give attention to gender. At the same time, theprograms recognize the importance of providing quality services so as to achieve a positive andsustained impact on welfare. For monitoring purposes, the programs have agreed a range ofindicators to measure both access to and quality of provision, and these have been reported onannually.
Expenditures and Expenditure Tracking
4.8 The Mid Term Review's (MTR's) principal findings on ESDP expenditures were asfollows:
- Absolute levels of expenditure. In spite of the country's difficult situation,Govemment expenditures, 4,842 million birr, were slightly higher than the4,748 million birr projected. However, considerably more resources thaninitially planned have gone to federal programs and less to regional
30 For example, Collier et al report government expenditure on health during the 1990s, at $1.4 per annumper capita, as amnong the lowest in the world. (see Density versus Quality in Health Care Provision: the useof household datafor budgetary choices in Ethiopia, Collier, P., Dercon, S. and Mackinnon, J. June 2001,CSAE Working Paper, Oxford.)
26

programs. Donors were expected to provide about 28 percent of totalfunding. Donor disbursements were between $114 million and $150 million(depending on whether or not overall budget support attributable to educationis included) during the first three years of implementation, which was onlyabout 40-50 percent of the $284 million indicated in the PAP for this period.
- Sector share of total expenditure. It was planned that education's share of thenational budget would increase throughout the ESDP period from 14.6percent in 1996/97 to 19 percent in 2001/02. Instead it fell to 14.3 percent in1997/98, then to 11.9 percent in 1998/99 and to a low of 10.5 percent in1999/2000. The decline in sector share was not due to a reduction inGovernment spending on the sector, but rather to the increase in expenditureon other sectors, including defense, and the shortfall in donor funds.
- Composition of expenditures. There was a substantial departure from theoriginal expenditure priorities. Federally managed programs (i.e. tertiarylevel education) have spend 21.5 percent more than planned over the threeyear period, while the regional States have spend 28.5 percent less. It wasinitially expected that the federal programs would use 16.9 percent ofavailable resources over the first three years of ESDP implementation but infact have used 25.1 percent. The under allocations and expenditures at theregional level are partly due to a reduction of Federal subsidies to the regionssince the beginning of the program. In 1997/98 the block grant to the regionswas 5,443 million birr. This fell to 3,142 million birr by 1999/2000 (it hasrisen to 4,418 million birr in the 2000/01 FY budget).
- Efficiency of expenditures. The squeeze on funding has meant thateducational institutions have not received adequate funding for non-salaryexpenditures.
- Quality of expenditure reporting. In order to encourage donors to providebudgetary support to ESDP through channel 1, it was essential that allresources provided to the educational sector from whatever source, inwhatever form, at whatever level be accounted for very soon after the end ofeach fiscal year. On the basis of these accounts, there would be a sector wideaudit which would provide channel I donors the assurances that their fundswere being effectively utilized for education. Unfortunately regionalaccounts are taking one or two years to be closed, and this may havediscouraged donors from providing budgetary support. Regional accountsare nevertheless being closed increasingly rapidly. An overall summary ofESDP expenditures (collated by MOF) has been available 6-8 months fromthe end of the FY, but regions cannot relate this precisely to their budgets,and the figures do not give all the desired breakdowns. The originalintention to have expenditure figures audited by the Federal Auditor Generalhas not been realized. (The annual Joint Review Mission provides aperformance review but is not a formal financial audit).
4.9 The MTR findings for the HSDP are similar:
- Levels and shares of expenditure. Overall budgetary allocations to the healthsector increased over the three years of the HSDP, despite a shift within thebudget towards defense expenditures in EFY 1991 and EFY 1992. Absolutelevels of health expenditure have not increased in every region, but, overall,health as a share of regions' total budget has increased. Nevertheless,
27

allocations to the sector, in every region, have remained below HSDPprojections, with capital and recurrent expenditure at 76 percent and 62percent of target.
- Composition and efficiency of expenditures. The cut-backs have beenprimarily absorbed in non-salary recurrent expenditures. As a result,recurrent expenditures have not been commensurate with the expansion inthe sector. Also, allocations to the components of the HSDP that are of asupporting nature (monitoring and evaluation, health sector management,HMIS and operational research, and health financing initiatives) have beenextremely low and related activities consequently slowed down. Actualexpenditures have been even lower due to difficulties in utilizing donorfunds. The overall result is that while there has been steady expansion,serious shortages in funding are evident at the facility level, particularly inrecurrent expenditures, e.g. for per diems and drugs, resulting in under-utilization of the facilities.
- Quality of expenditure reporting. Financial information (along with drug-related information) is one of the weakest elements of the managementinformation system. The regional and donor dimensions of expenditure posea particular challenge. While donor procedures require reporting onutilization of funds at the national level and government budgetaryprocedures require more accurate information than presently available on theflow of donor resources (in the case of channels 2 and 3), fiscalresponsibilities and authority has been devolved to the regions and in somecases even to the zonal levels. Financial information does not necessarilyflow up the system. The MTR thus encountered delays and gaps in financialreporting resulting in parallel systems and off budget allocations,interruptions in the flow of resources due to inadequate reporting on the useof advances, as well as inconsistencies in financial accounts at differentlevels of the system. Shortage of trained staff has been shown to delay thedisbursement, accounting and reporting of fund utilization. Anotherconsideration is that the structure of the government budget, financialreporting and associated organizational structures differ from HSDPcomponents (particularly in the case of the recurrent budget). It is thereforedifficult to track expenditures in accordance with the HSDP budgetcategories. Thus, in the event that donor resources are fully integrated intothe budget, as is the vision under channel I arrangements, the extent to whichsuch resources contribute to the various components of the program isunclear.
Issues in Performance and Impact of Expenditure (Education)
4.10 The following objectives were defined for the first phase of the ESDP:
- Increasing access to primary education by expanding enrolments from3.1 million to 7 million.
- Increasing equity by increasing the number of schools in rural areas andincreasing the number of girls enrolled.
- Improving quality by providing a text book for each child in coresubjects and improving teacher training.
- Improving relevance by reforming the curricula.
28
- Increasing education's share of the budget and encouraging privatesector and community financing.
4.11 Education's performance indicators show that of these only access has been achieved sofar during Phase I with 6.5 million children enrolled in Grades 1-8 in 1999/2000. Indicators ofquality declined in most respects over the same period, with particular shortfalls in the numbersof qualified primary school teachers and of text books, and with increases in class sizes. As aresult primary school dropout rates in 1999/00, at 18.9 percent, were more than four times the2001/02 target of 4.2 percent and the repetition rate for grades 4-8, at 12.9 percent, was doublethe 20001/02 target of 6.4 percent. A survey conducted by the National Organization ofExaminations reported poor performance of students at Grade 4 as measured by competence inEnglish language, environmental science and in reading comprehension. In terms of equity, thegross primary enrolment rate in the two most under-served areas stood at 8.5 percent as against a2001/02 target of 25 percent. Girls' share of primary enrolment rose from a baseline figure of 38percent to 39.2 percent, as against the 2001/02 target of 45 percent, and girls' participation showsa progressively declining trend through the higher levels of the education system.
4.12 Lack of qualified teachers, of management capacity, and of equipment and transport wereidentified at all levels as the main problem hindering implementation. Another relevant issuehere was limited involvement by the private sector in publishing text books, with poorer qualitybooks being produced as a result. Paying attention to increasing capacity was identified as themain priority for the ESDP in its next phase. As noted earlier (14.9) delay in closing regionalaccounts has discouraged donors from providing funds through channel 1. This further reducesthe funds available to enhance capacity.
4.13 Overall, the Mid Term Review came to the following key conclusions:- Children had been encouraged to enroll in school even though there were
insufficient resources or funds for operational costs, with consequentdecline in quality of service and outcomes.
- A new, less poverty-targeted focus had emerged of expansion in thetertiary sector.
- Capacity shortfalls in all departments and at all levels were the mainobstacle to effective implementation.
Issues in Performance and Impact of Expenditure (Health)
4.14 Similar objectives were identified for the first phase of the HSDP as for the ESDP. Thesewere:
- Increasing accesslcoverage of health facilities and therefore ofutilization.
- Improving service quality through training and an improved supply ofessential inputs.
- Strengthening management of health services at Federal and Regionallevels.
- Encouraging participation by the private sector and NGOs by creating anenabling environment for participation, coordination and mobilization of
funds.
4.15 The review found that there had been a steady increase in the number of health facilitiesbeing provided nation wide and - with an emphasis on health posts and centers - that a focus on
29
primary levels of care had been maintained. The number of hospitals, at 78, exceeded the2001/02 target figure of 66, and there was an enormous increase in health posts from 67 to 833.Expansion of health centers was 44 percent of target: to 338 from a baseline of 243 in 1996/97and against a 2001/02 target of 459. Numbers of health stations, which were due to be phased outin favor of health posts, remained more or less at their original level, reflecting popularpreference for facilities that offer curative as well as preventive services.3 '
4.16 The public's utilization of the services, however, did not match the expansion in physicalprovision and grew no faster than the population growth rate of 2.9 percent. Outpatient visits thusremained unchanged at about 27 new consultations per 100 persons per year, contraceptive userose from 9.8 percent in 199617 to 10.8 per cent in 1999/00 compared with the 2001/02 target of20 percent. All immunization rates except for polio registered a decline. For example, DPT3coverage of children under 1 year old declined from 67 percent to 38 percent and TT2 coverageof pregnant women from 32 percent to 26 percent between 1996/7 and 1999/00. It was noted thatthere is no budget line for immunization in regional budgets, which makes the program verydependent on outside funding; regional councils should consider providing regional funds for EPIactivities.
4.17 The review found that, so far, the HSDP had had limited impact on the delivery of basichealth care to mothers and children, and had made slow progress in implementing child healthactivities. Malnutrition was noted as one of the most common problems affecting children andadults, with more than half of under-5s being stunted. The review noted the complex causes ofmalnutrition (poverty, inadequate care, low levels of female education, natural and manmadedisasters) and the lack of effective focal points for nutrition in the RHBs. The Review pointed tothe need for a concerted response to malnutrition, coordinated with other relevant bodies like theMinistry of Agriculture.
4.18 The quality of care available in health facilities is constrained by a lack of staff capacity,reckoned both in terms of numbers and in terms of skill levels. Ethiopia has an average of 20trained health workers for 100,000 people which is extremely low even by African standards.32
Furthermore, there are significant disparities in provision so that some Regions fare considerablyworse: 17 and 28 doctors per 100,000 in Addis Ababa and Harari respectively against 2 per100,000 in Somali. Particular areas of concern are shortages of midwives and junior nurses.Given the range of problems presented at health posts, stations and centers, the Review alsorecommended that a cadre of general nurses should be created for the lower levels of the servicewho would provide more effective treatment than the existing first level health workers. TheMinistry of Health has taken a number of initiatives to encourage, motivate and retain staff, andstaffing levels are projected to double over the next 10 years. Notwithstanding this, the Reviewestimates that acceptable staffing levels will not be attained within 25 years.
31 Health posts are intended to deliver preventive care and to carry out public health activities.32 The Review notes averages of 100 trained health workers for 100,000 people in Uganda and almost 200to 100,000 for Tanzania.
30
Appendix 5
ROAD SECTOR POLICY AND INSTITUTIONS
Introduction
5.1 Roads represent a major expenditure commitment and are considered one of the "pro-poor" sectors. This Annex provides the background to the issues which are discussed in the mainchapter. It summarizes the institutional framework, notes the performance indicators in use, andalso describes the Rural Roads and Transport Strategy (RRTS) and the Road Fund.
Institutional Framework
5.2 The main institutions responsible for investment in and maintenance of the road networkare (a) the Ethiopian Roads Authority (ERA), responsible for overall sector planning, fordevelopment and maintenance of the federal road system, and for overseeing and extendingtechnical support to Regional Road Agencies; (b) the regional Rural Road Authorities (RRAs),responsible for rural (feeder) roads; and (c) the Road Fund which started operating in 1998, andfinances road maintenance of both federal, regional and municipal roads with income fromearmarked fuel taxes (to be supplemented from other sources in the future).
5.3 Roads can be grouped roughly into four categories: trunk roads, link roads, regional roads(also called rural roads) and village level rural roads. Of the total road network of 30,000 km(excluding village level roads), 16,000 km are trunk and link roads administered by the ERA.The Federal Government accounts for roughly three quarters of total government spending onroads, which is allocated to the ERA. In selecting road projects, the ERA relies primarily on theexpected economic rate of return. 33 Most of federal road construction work (almost 90 percent in2000/01) is contracted out to international and local sector, with the ERA concentrating oncontract management. It supervises and provides technical support to the regional RRAs, four ofwhich (in Gambela, Benishangul, Afar and Somali regions) are quite weak.
5.4 At present, the income of the Road Fund consists of the earmarked fuel levy and of thesales and municipal tax on fuel. The sales tax has been assigned to the Fund as a proxy for theGovernment's contribution towards covering the cost of the maintenance backlog. It is meant tobe replaced by increases in the fuel levy and other specified, but as yet unused, sources of fundsin the future. The Road Fund allocates its resources according to a formula: 70 percent to theERA, 20 percent for regional roads and 10 percent for municipalities.
5.5 As in health and education, there is a comprehensive sector development program,designed to incorporate both government and donor funded activities. The 10-year Road SectorDevelopment Program (RSDP), covering the period 1997-2007, sets out the Government'sstrategy for development of the road system and spending priorities for both the Federal andRegional governments. However, the RSDP is administratively simpler, and less radical in itsapproach to aid management, than ESDP and HSDP. The more straightforward technology, thelarge size of individual projects, and the dominant role of the federal agency (ERA) means that
33 The RSDP1 Mid Term Review and Revised Implementation Plan (p13) notes also that project prioritieswere set in the following order of importance based on their facilitation of:
- access to the ports- access to the existing resource areas- access to new resource areas- access to food deficit areas- balancing of the distribution of rural infrastructure among regions

the RSDP mainly comprises a coordinated set of projects which are financed in traditional projectfashion by individual donors.
Expenditures and Expenditure Tracking
Financing of expenditures
5.6 Roads construction, rehabilitation and maintenance are financed through three channels:(a) allocations from the Federal budget to the ERA for road construction, upgrading andrehabilitation; (b) allocations from Regional budgets to the respective Rural Roads Authorities forconstruction of rural roads; and (c) allocations from the extra-budgetary Road Fund to the ERAand the RRAs for road maintenance. In 1999/00, government expenditure on roads of BirrI billion accounted for some 8 percent of the total budget, to which must be added a further Birr250 million (equivalent to 2 percent of the budget) from the extra-budgetary Road Fund for roadmaintenance.
5.7 RSDP I (1997-2002) focuses on rehabilitation, upgrading and maintenance of federalroads (accounting for three quarters of planned expenditure) as well as construction andmaintenance of regional (rural) roads. Disbursements to date are shown in Table 5.1 below. TheMid Term Review of the RSDP shows implementation delays for the federal program, butregional investment well in excess of targets. Regions financed some 2000 km of rural roadsmore than was planned, evidence of the high priority attached to improving the rural roadnetwork. Maintenance expenditures were financed through the Road Fund.
5.8 The bulk of funds for road construction/rehabilitation and maintenance have been spenton the federal network, while village level rural roads have received no allocations under theRSDP for either expansion or maintenance, in part because it was still under formulation duringthe RSDPI period. These past few years show signs of a drive towards greater efficiency andcost-effectiveness in the use of funds for road development as evidenced by: (a) the preparationof the RSDP; (b) the establishment of the Road Fund, resulting in increased and sustainablefinancing of maintenance; (c) improved management of resources by the road authorities, whichhave become more accountable and performance oriented (greater reliance on private contractors,establishment and monitoring of performance indicators, establishment of technical and financialaudit system).
Table 5.1: Total Disbursement Under RSDP 1, 1997/98-1999/00Construction* Maintenance Other Total %
Federal 2,396 367 234 2,997 74Regional 925 110 1,035 26Total 3;321 477 234 4,032% 82 12 6 100
* Includes rehabilitation and upgrading.
Tracking expenditures on roads
5.9 Virtually all government expenditure on roads can be tracked through the federal andregional budgets, which show allocations to the ERA and the RRAs, and through the Road Fund.Some spending on roads may be included elsewhere in the budget, as part of projects in othersectors (e.g. access roads) while DPPC spending on roads would be extra-budgetary. Somebilateral projects that bypass the budget may include outlays on roads. However, suchexpenditures are thought to be minor (it should be possible to track most of these once the newbudget format is in place). There is no reliable information on road expenditures funded byNGOs.
5.10 The ERA has received a great deal of technical assistance to improve accountability andperformance. It prepares monthly technical and financial progress reports. Quarterly reports areprepared for individual donor-financed projects. ERA's Monitoring and Evaluation branchregularly monitors the progress of the various components of the RSDP. With regard to road
32
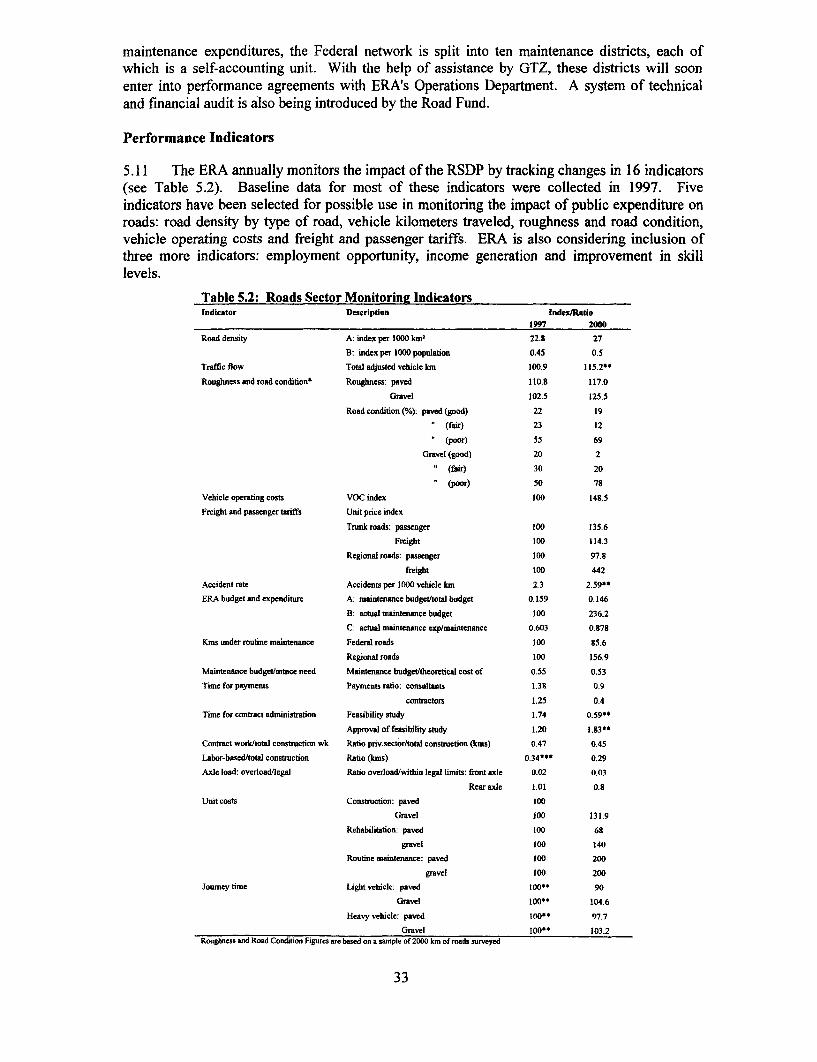
maintenance expenditures, the Federal network is split into ten maintenance districts, each ofwhich is a self-accounting unit. With the help of assistance by GTZ, these districts will soonenter into performance agreements with ERA's Operations Department. A system of technicaland financial audit is also being introduced by the Road Fund.
Performance Indicators
5.11 The ERA annually monitors the impact of the RSDP by tracking changes in 16 indicators(see Table 5.2). Baseline data for most of these indicators were collected in 1997. Fiveindicators have been selected for possible use in monitoring the impact of public expenditure onroads: road density by type of road, vehicle kilometers traveled, roughness and road condition,vehicle operating costs and freight and passenger tariffs. ERA is also considering inclusion ofthree more indicators: employment opportunity, income generation and improvement in skilllevels.
Table 5.2: Roads Sector Monitoring IndicatorsIndicator Description Index/Ratio
1997 2000
Road density A: index per O00 km' 22.8 27
B: index per 1000 population 0.45 0.5
Traffic flow Total adjusted vehicle Ian 100.9 115.2*0
Roughness and road conditions Roughness: paved 110.8 117.0
Gravel 102.5 125.5
Road condition (%6): paved (good) 22 19
(fair) 23 12
(poor) 55 69
Grvel (good) 20 2
(fair) 30 20
* (poor) 50 78
Vehicle operating costs VOC index 100 148.5
Freight and passenger tariffs Unit price index
Tnrnk roads: passenger 100 135.6
Freight 100 114.3
Regional roads: passenger 100 97.8
freight 100 442
Accident rate Accidents per 1000 vehicle km 2.3 2.59"
ERA budget and expenditure A: maintenance budget/total budget 0,159 0.146
B: actual maintenance budget 100 236.2
C: actual maintenance exp/maintenance 0.603 0.878
Kins under routine maintenance Federal roads 100 85.6
Regional roads 100 156.9
Maintenance budget/mtnce need Maintenance budgetttheoretical cost of 0.55 0.53
Time for paynents Payments ratio: consudtants 1.38 0.9
contractors 1.25 0.4
Time for contract administration Feasibility study 1.74 0.59*"
Approval of feasibility study 1.20 1.3**
Contract work/total construction wk Ratio priv.sector/total construction (kms) 0.47 0.45
Labor-based/total construction Ratio (kms) 0,34*$ 0.29
Axle load: overload/legal Ratio overload/within legal linits: front axle 0.02 0.03
Rear axle 1.01 0.8
Unit costs Construction: paved 100
Gravel 100 131.9
Rehabilitation: paved 100 68
gravel 100 140
Routine maintenance: paved 100 200
gravel 100 200
Journey time Light vehicle: paved 100" 90
Gravel 100** 104.6
Heavy vehicle: paved 100*" 97.7
Gravel 100** 103.2Roughness and Road Condition Figures are based on a sample of 2000 km of roads surveyed
33

Rural Roads and Transport Strategy
Evolution of rural transport strategy
5.12 Of all public expenditure on roads, the rural road program may be of most direct benefitto the poor. While the focus of RSDP I was on the federal road network, RSDP 11 (2002-2007) isintended to stress development of rural roads, including village level rural roads. The broadframework for rural transport development is set out in the Rural Road and Transport Strategy(RRTS). The findings of the Village Level Travel and Transport Study (VLTTS) helped to gain abetter understanding of transport problems at the village level and have been used to develop anapproach (the RTTS) towards reducing the village level transport burden as part of the broaderRural Roads and Transport Program (RRTP). The Rural Roads and Transport Strategy (RRTS)addresses the problems of rural transport through a program (RRTP) that combines investment ininfrastructure, institutional changes, capacity building and the development of new financingarrangements. The Rural Travel and Transport Program (RTTP) is part of this broader programand focuses on transport development at the village level.
Rural Travel and Transport Program
5.13 The RTTP includes three main components: (a) expansion of the village level roadsystem; (b) an increase in conventional and intermediate means of transport; and (c) assistancetowards the citing of socio-economic facilities (water points, schools, grinding mills etc.) thatwould reduce the transport burden of rural communities. Targets have been set for the entire(high and low level) rural roads program. They are: (a) to reduce the proportion of farms that aremore than half a day's walk from an all-weather road from 65 percent to 25 percent by 2007; and(b) to reduce the average distance of rural households from any type of motorable road from 6hours to 3 hours.
5.14 In marked contrast to the rest of the RSDP program, which is largely centrally plannedand financed from the budget, the RTTP relies on the initiative, and to some extent on thefinancing, of local communities. The rationale for this approach is that priorities for local roadsare best decided upon by the communities themselves, and that their financial contribution wouldensure ownership of the roads and hence responsibility for maintaining them. Special emphasiswill be given to the use of labor intensive methods in the development and maintenance of villagelevel roads as a way of generating income in rural areas.
5.15 The RTTP structure. Village Development Associations (VDAs) will be responsible forplanning and implementing local road projects as well as for mobilizing funds. Roads servingseveral villages will be the responsibility of the Woreda Development Committees (WDCs), whoalso play a coordinating role regarding village level projects and resource mobilization At theregional level, Regional Steering Committees (RSCs) will guide and monitor the execution of therural transport program. The RRAs will assist the RSCs and provide back-up support to theWDCs and VDAs. Finally, at the national level the Central Coordinating Board (CCB) carriesoverall responsibility for the planning and coordination of the RTTP, assisted by the ERA.
5.16 Resource mobilization. The funding for the development of rural roads and transport isexpected to come from various sources. Central to it will be the contribution from communitiesin the form of labor, materials and cash, which is to be channeled through Community RuralDevelopment Funds to be established at woreda level. Additional resources would come from theregional rural roads budget, which would include donor funding, and from the Road Fund, NGOsand possibly the DPPC. These same sources of funds would be expected to finance theinvestments in socio-economic facilities (schools, health posts, boreholes etc.) that are an integralpart of the effort to reduce the rural transport burden.
5.17 RTTP Implementation. The RTTP contains several new features that require carefulpreparation if the program is to be implemented successfully. Villages and woredas are not
34
accustomed to playing an active role in making investment decisions and in raising funds for theirprojects. The proper functioning of the institutional structure, with responsibility for planning,execution and monitoring split between various levels of authority, and with the ERA and RRAsplaying a supporting role, needs to be tested. To gain experience with the program and drawlessons before implementing it nation wide, a pilot project will explore the difficulties involved inplanning, formulating and executing investments in rural roads and related areas at communitylevel as well as issues concerning mobilization of local resources. Eight woredas have beenselected to serve as demonstration models. In parallel, manuals will be prepared to assistcommunities in dealing with administrative, technical and operational aspects of the RTTP.While VDAs and WDCs will plan and implement road projects, regional sector bureaux areplanning investments in related areas (health posts, schools, water points). These plans, preparedat different levels, need to be carefully coordinated.
The Road Fund
5.18 The Road Fund was established in 1997 and started functioning, i.e. providing funds forroad maintenance, in 1998. The Furid was set up to ensure that adequate and sustainableresources would be available for proper maintenance of the road network. Road user charges,based on the fee-for-service principle are its main source of income. These consist, apart from agovernment budget allocation, of a fuel levy, vehicle license renewal fee based on axle load, finesfrom overloading and any other road tariffs that may be levied in future. Currently, the Fundrelies only on a fuel levy and a contribution from the Government, which is meant to cover thecost of dealing with the maintenance backlog at the time the Fund was established. As a proxyfor its contribution, the Government has assigned the sales tax on fuel to the Fund. In addition,the Fund receives the municipal fuel tax as a proxy for financing the maintenance of municipalroads. As the Road Fund started collecting the levy and taxes on fuel a year before it startedoperations, and as initially its annual income exceeded its disbursements, it currently has asubstantial positive balance. At the end of 1999/00, it had total resources of Birr 727.8 millionagainst total disbursements for maintenance of Birr 524.6 million (see Table 5.3).
Table 5.3: Road Fund Operations (Birr million)1997/98 1998/99 1999/00 2000/01
Collection of fuel taxes 328.9 181.9 217.0Allocations 163.0 212.0 264.2 250.0
Of which to: ERA (118.0) (152.0)* (194.2)* (169.8)RRAs (30.0) (40.0) (40.0) (48.5)Municipalities (15.0) (20.0) (30.0) (24.2)Road safety (7.5)
Disbursements 158.9 117.5 248.2Includes allocations for emergency maintenance of Birr 12m. in 1998/99 and 54m. in 1999/00.
Maintenance needs
5.19 The assessment of total maintenance needs takes into account road length and unitmaintenance costs by category of road (trunk, link or rural road) and type of maintenance (routineor periodic). These past few years, efforts have focused on routine maintenance due to thelimited capacity of the road authorities. A good deal of periodic maintenance needs is beingtaken care of as part of the ongoing rehabilitation and upgrading of the road network. Withreliance on private contractors growing, expenditure on periodic maintenance is expected toincrease. Total routine maintenance costs are expected to fall as the share of improved roads inthe total road network increases as a result of ongoing and planned rehabilitation and upgradingof roads at both federal and regional level. The Maintenance Action Plan for the next five yearsforesees an initial sharp rise in the cost of periodic maintenance to be financed by the Fund.However, as in the case of routine maintenance, unit costs, and hence total costs are expected tofall significantly over the next few years as a result of the ongoing road rehabilitation andupgrading works.
35
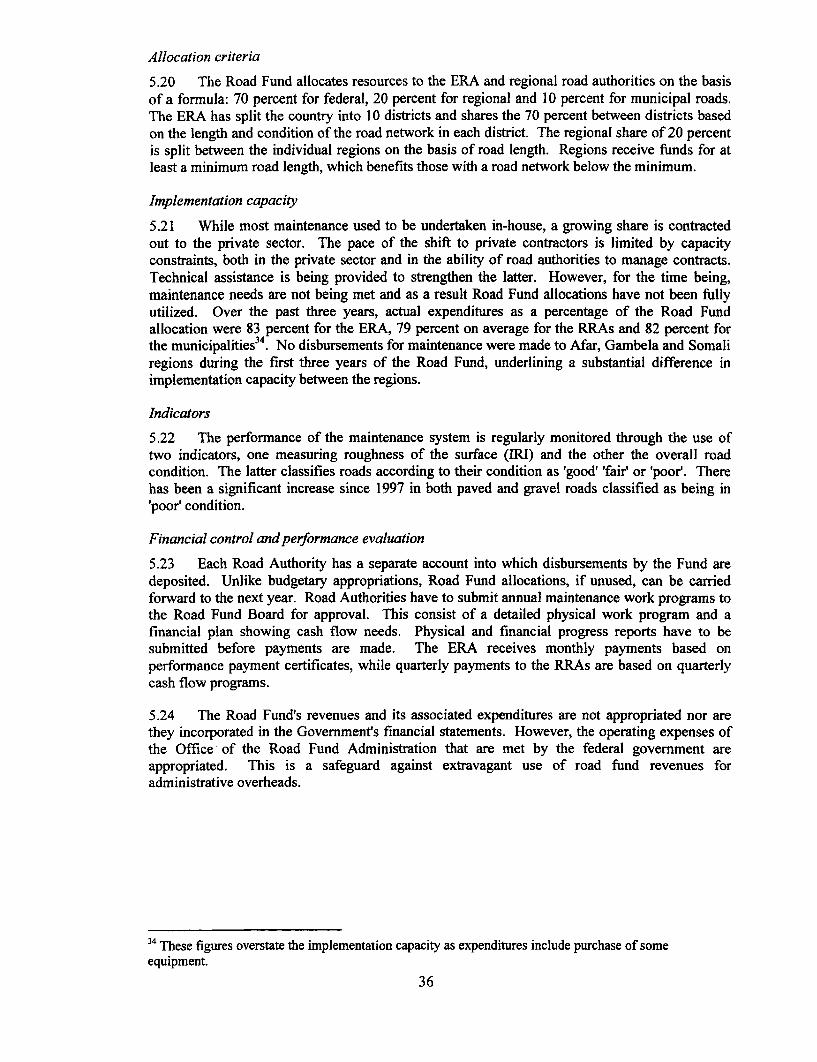
Allocation criteria
5.20 The Road Fund allocates resources to the ERA and regional road authorities on the basisof a formula: 70 percent for federal, 20 percent for regional and 10 percent for municipal roads.The ERA has split the country into 10 districts and shares the 70 percent between districts basedon the length and condition of the road network in each district. The regional share of 20 percentis split between the individual regions on the basis of road length. Regions receive funds for atleast a minimum road length, which benefits those with a road network below the minimum.
Implementation capacity
5.21 While most maintenance used to be undertaken in-house, a growing share is contractedout to the private sector. The pace of the shift to private contractors is limited by capacityconstraints, both in the private sector and in the ability of road authorities to manage contracts.Technical assistance is being provided to strengthen the latter. However, for the time being,maintenance needs are not being met and as a result Road Fund allocations have not been fullyutilized. Over the past three years, actual expenditures as a percentage of the Road Fundallocation were 83 percent for the ERA, 79 percent on average for the RRAs and 82 percent forthe municipalities34. No disbursements for maintenance were made to Afar, Gambela and Somaliregions during the first three years of the Road Fund, underlining a substantial difference inimplementation capacity between the regions.
Indicators
5.22 The performance of the maintenance system is regularly monitored through the use oftwo indicators, one measuring roughness of the surface (IRI) and the other the overall roadcondition. The latter classifies roads according to their condition as 'good' 'fair' or 'poor'. Therehas been a significant increase since 1997 in both paved and gravel roads classified as being in'poor' condition.
Financial control andperformance evaluation
5.23 Each Road Authority has a separate account into which disbursements by the Fund aredeposited. Unlike budgetary appropriations, Road Fund allocations, if unused, can be carriedforward to the next year. Road Authorities have to submit annual maintenance work programs tothe Road Fund Board for approval. This consist of a detailed physical work program and afinancial plan showing cash flow needs. Physical and financial progress reports have to besubmitted before payments are made. The ERA receives monthly payments based onperformance payment certificates, while quarterly payments to the RRAs are based on quarterlycash flow programs.
5.24 The Road Fund's revenues and its associated expenditures are not appropriated nor arethey incorporated in the Government's financial statements. However, the operating expenses ofthe Office of the Road Fund Administration that are met by the federal government areappropriated. This is a safeguard against extravagant use of road fund revenues foradministrative overheads.
34 These figures overstate the implementation capacity as expenditures include purchase of someequipment.
36

Appendix 6
TAX AND EXPENDITURE ASSIGNMENTS
Budgetary Resources
6.1 Budgetary resources at the regional level are drawn mainly from three sources: Regions'own revenues derived from tax and non-tax sources assigned to them under the Constitution,federal devolution, customarily called treasury subsidies, which are driven by a formula(discussed in detail in Appendix 6) and external aid. Although federal financial regulationsrequire that all external aid be channeled through the federal consolidated fund, a significantproportion of aid flows to the regions directly. This happens for a variety of reasons, most notablydue to the budget offset system, whereby the formula based federal subsidy due to each region isreduced by an amount equal to the expected aid flow to the region in the year.35
Sub-national Borrowing
6.2 Article 51 of the Constitution empowers the regions to 'borrow from internal sources'subject to terms and conditions set by law. According to a 1992 proclamation predating theConstitution, the only law to date on the subject, a region could borrow for projects that have afeasibility study showing its ability to repay the debt and subject to approval by the federalgovernment. Presumably the federal decision will depend on the merits of the project and theability to repay the debt although this is not clear since no region has reportedly made such arequest so far. It is also not clear where the regions are to borrow from - the federal government,the National Bank of Ethiopia (the central bank), or commercial banks. Given the problems thatsub-national borrowing has caused in terms of macroeconomic management in other federation,this is an option that should be pursued with caution.
Tax Assignment
6.3 Table 6.1 shows the assignment of tax and non-tax revenues between the federal andregional governments as well as concurrent powers of taxation as mandated by the Constitution(Articles 96-98).
6.4 There are some noteworthy points in the arrangement of tax assignment. First, thefederal government has exclusive jurisdiction over international taxes, as is the case with allfederations, as also over a lion's share of the domestic indirect tax base. The share of the regionsis concentrated mostly in direct taxes and land use fees. Second, in the case of public enterprises,by far the largest contributors to domestic taxes, jurisdiction is determined by the type of taxpayer rather than the type of tax. For example, the federal government taxes the income and salesof federal public enterprises and the regions of the regional public enterprises. Third, the formulafor sharing joint revenues is not yet settled. So far the federal government has been levying andcollecting these taxes and sharing them with the regions on an ad hoc basis. As of now, these arerelatively small in value, but their sharing could become potentially important as the volume ofrevenues grows. Finally, the residuary powers of taxation are not pre-assigned to the federal orregional governments, but are to be assigned by a joint decision of both houses of the federalparliament.
35 The rationale for the offset, the problems it creates in practice and the way forward to reform are alsodiscussed in Appendix 6.
37
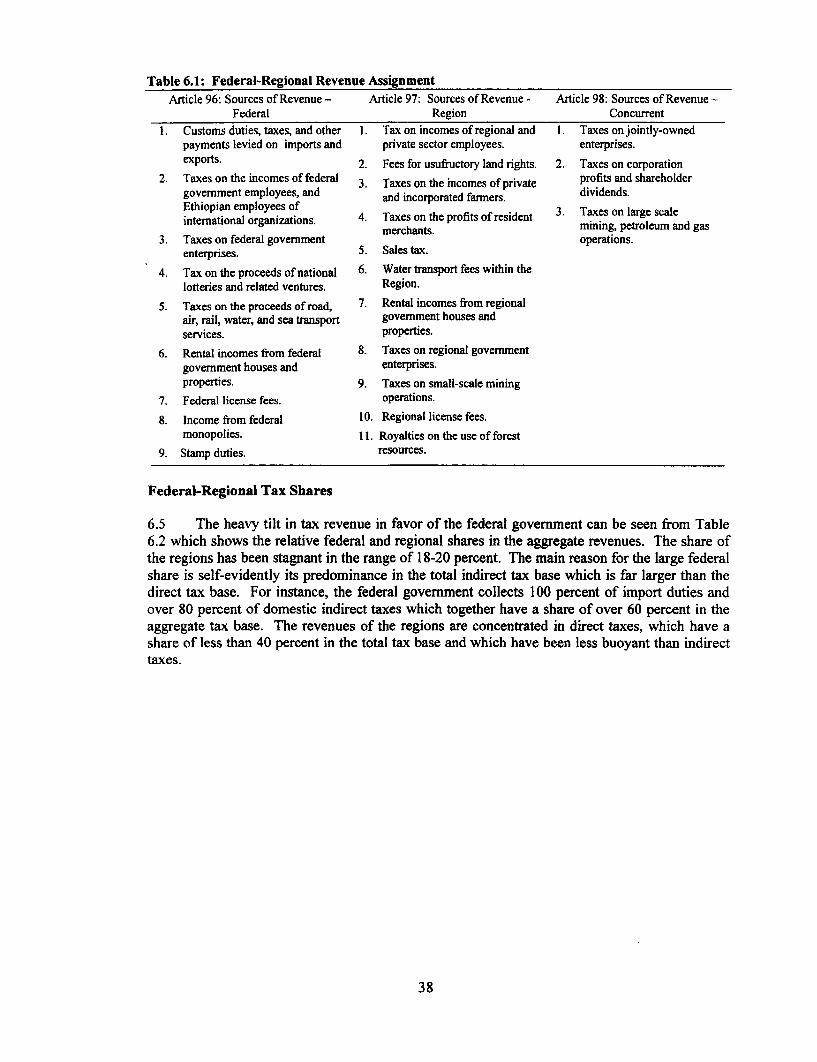
Table 6.1: Federal-Regional Revenue AssignmentArticle 96: Sources of Revenue - Article 97: Sources of Revenue - Article 98: Sources of Revenue -
Federal Region Concurrent1. Customs duties, taxes, and other I. Tax on incomes of regional and I. Taxes on jointly-owned
payments levied on imports and private sector employees. enterprises.exports. 2. Fees for usufructory land rights. 2. Taxes on corporation
2. Taxes on the incomes of federal 3. Taxes on the incomes of private profits and shareholdergovemment employees, and and incorporated farmers. dividends.Ethiopian employees of 3intemational organizations. 4. Taxes on the profits of resident mn Taxes on large scale
merchants. mining, petroleum and gas3. Taxes on federal government operations.
enterprises. 5. Sales tax.
4. Tax on the proceeds of national 6. Water transport fees within thelotteries and related ventures. Region.
5. Taxes on the proceeds of road, 7. Rental incomes from regionalair, rail, water, and sea transport govemment houses andservices. properties.
6. Rental incomes from federal 8. Taxes on regional govemmentgovemment houses and enterprises.properties. 9. Taxes on small-scale mining
7. Federal license fees. operations.
8. Income from federal 10. Regional license fees.monopolies. 11. Royalties on the use of forest
9. Stamp duties. resources.
Federal-Regional Tax Shares
6.5 The heavy tilt in tax revenue in favor of the federal government can be seen from Table6.2 which shows the relative federal and regional shares in the aggregate revenues. The share ofthe regions has been stagnant in the range of 18-20 percent. The main reason for the large federalshare is self-evidently its predominance in the total indirect tax base which is far larger than thedirect tax base. For instance, the federal government collects 100 percent of import duties andover 80 percent of domestic indirect taxes which together have a share of over 60 percent in theaggregate tax base. The revenues of the regions are concentrated in direct taxes, which have ashare of less than 40 percent in the total tax base and which have been less buoyant than indirecttaxes.
38
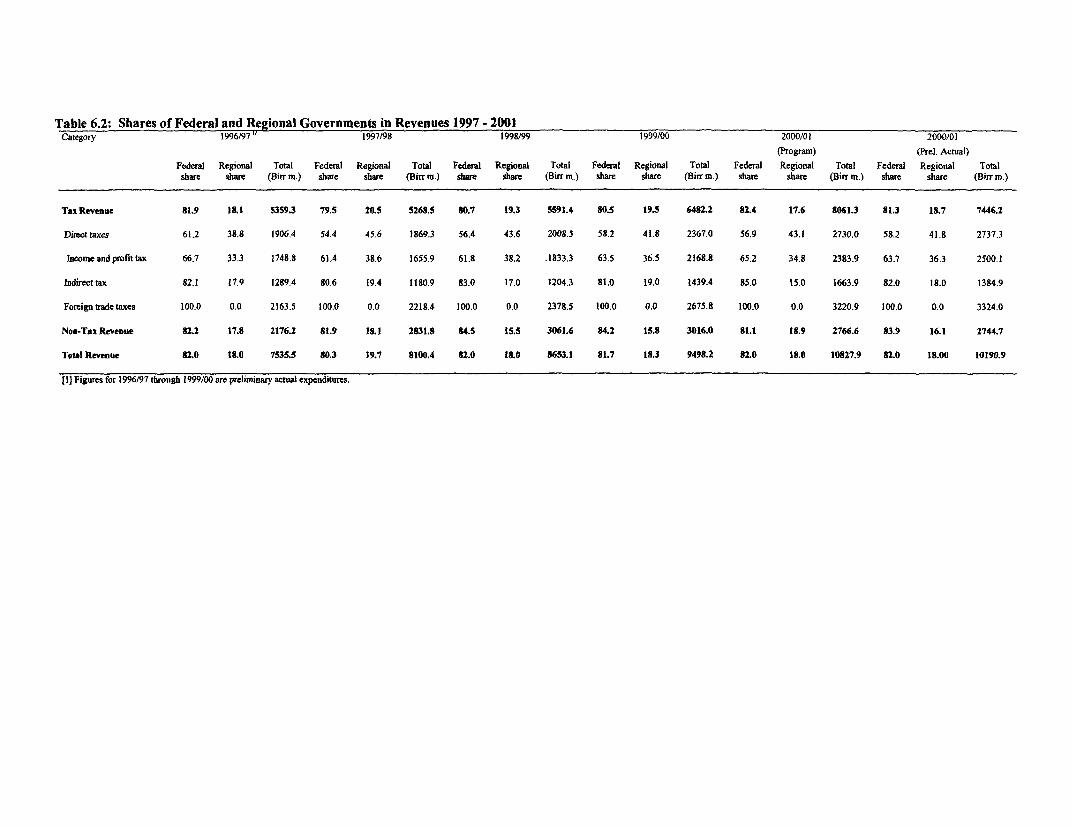
Table 6.2: Shares of Federal and Regional Governments in Revenues 1997 - 2001Category 1996/97 1997198 1998/99 1999/00 2000/01 2000/01
(Program) (Prel. Actual)Federal Regional Total Federal Regional Total Federal Regional Total Federal Regional Total Federal Regional Total Federal Regional Totalshare share (Birr m.) share share (Birr m.) share share (Birr m.) share share (Biff m.) share share (Birr m.) share share (Birr m.)
Tax Revenue 81.9 II 5359.3 79.5 20.5 5268.5 80.7 19.3 5591.4 80.5 19.5 6482.2 82.4 17.6 8061.3 81.3 18.7 7446.2
Direct taxes 61.2 38.8 1906.4 54.4 45.6 1869.3 56.4 43.6 2008.5 58.2 41.8 2367.0 56.9 43.1 2730.0 58.2 41.8 2737.3
lncomeandprofittax 66.7 33.3 1748.8 61.4 38.6 1655.9 61.8 38.2 .1833.3 63.5 36.5 2168.8 65.2 34.8 2383.9 63.7 36.3 2500.1
lndirecttax 82.1 17.9 1289.4 80.6 19.4 1180.9 83.0 17.0 1204.3 81.0 19.0 1439.4 85.0 15.0 1663.9 82.0 18.0 1384.9
Foreign trade taxes 100.0 0.0 2163.5 100.0 0.0 2218.4 100.0 0.0 2378.5 100.0 0.0 2675.8 100.0 0.0 3220.9 100.0 0.0 3324.0
Non-Tax Revenue 82.2 17.8 2176.2 81.9 I8.I 2831.8 84.5 15.5 3061.6 84.2 15.8 3016.0 81.1 18.9 2766.6 83.9 16.1 2744.7
Total Revenue 82.0 18.0 7535.5 80.3 19.7 8100.4 82.0 18.0 8653.1 81.7 18.3 9498.2 82.0 18.0 10827.9 82.0 18.00 10190.9
[I] Figures for 1996/97 through 1999/00 are preliminary actual expenditures.
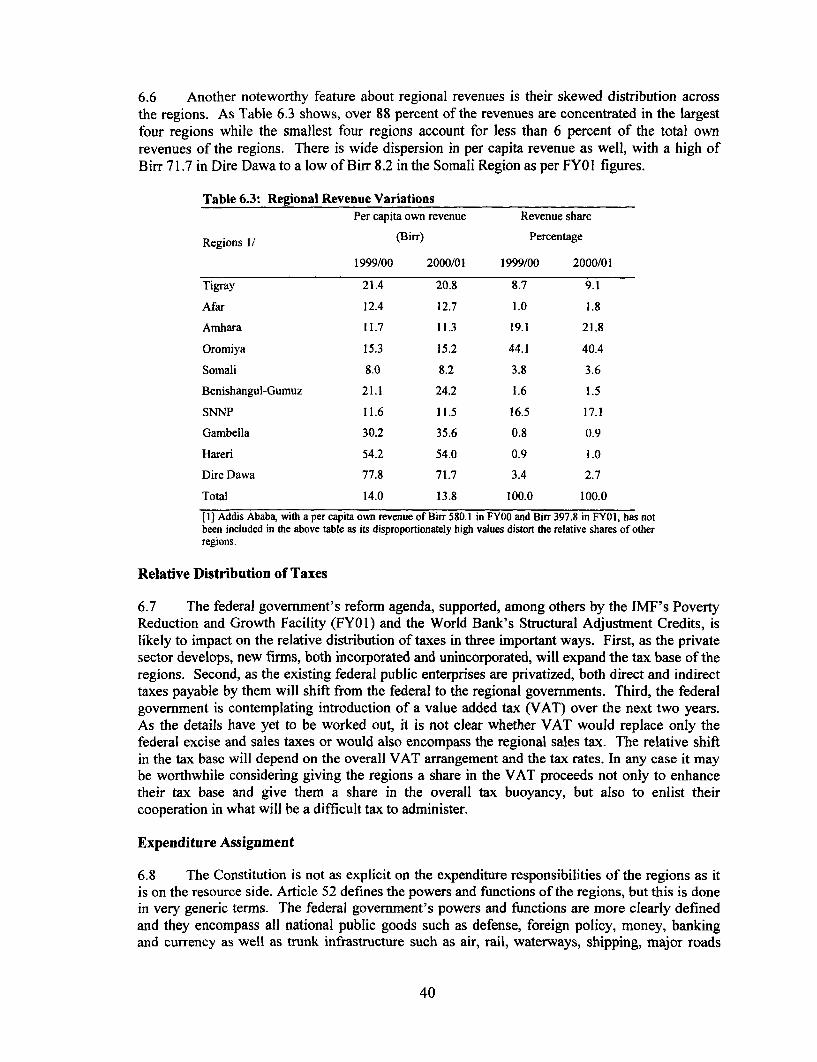
6.6 Another noteworthy feature about regional revenues is their skewed distribution acrossthe regions. As Table 6.3 shows, over 88 percent of the revenues are concentrated in the largestfour regions while the smallest four regions account for less than 6 percent of the total ownrevenues of the regions. There is wide dispersion in per capita revenue as well, with a high ofBirr 71.7 in Dire Dawa to a low of Birr 8.2 in the Somali Region as per FYOI figures.
Table 6.3: Regional Revenue VariationsPer capita own revenue Revenue share
Regions 1/ (Biff) Percentage
1999/00 2000/01 1999/00 2000/01
Tigray 21.4 20.8 8.7 9.1
Afar 12.4 12.7 1.0 1.8
Amhara 11.7 11.3 19.1 21.8
Oromiya 15.3 15.2 44.1 40.4
Somali 8.0 8.2 3.8 3.6
Benishangul-Gumuz 21.1 24.2 1.6 1.5
SNNP 11.6 11.5 16.5 17.1
Gambella 30.2 35.6 0.8 0.9
Hareri 54.2 54.0 0.9 1.0
Dire Dawa 77.8 71.7 3.4 2.7
Total 14.0 13.8 100.0 100.0
[1] Addis Ababa, with a per capita own revenue of Biff 580.1 in FY00 and Biff 397.8 in FY01, has notbeen included in the above table as its disproportionately high values distort the relative shares of otherregions.
Relative Distribution of Taxes
6.7 The federal government's reform agenda, supported, among others by the IMF's PovertyReduction and Growth Facility (FYOI) and the World Bank's Structural Adjustment Credits, islikely to impact on the relative distribution of taxes in three important ways. First, as the privatesector develops, new firms, both incorporated and unincorporated, will expand the tax base of theregions. Second, as the existing federal public enterprises are privatized, both direct and indirecttaxes payable by them will shift from the federal to the regional governments. Third, the federalgovernment is contemplating introduction of a value added tax (VAT) over the next two years.As the details have yet to be worked out, it is not clear whether VAT would replace only thefederal excise and sales taxes or would also encompass the regional sales tax. The relative shiftin the tax base will depend on the overall VAT arrangement and the tax rates. In any case it maybe worthwhile considering giving the regions a share in the VAT proceeds not only to enhancetheir tax base and give them a share in the overall tax buoyancy, but also to enlist theircooperation in what will be a difficult tax to administer.
Expenditure Assignment
6.8 The Constitution is not as explicit on the expenditure responsibilities of the regions as itis on the resource side. Article 52 defines the powers and functions of the regions, but this is donein very generic terms. The federal government's powers and functions are more clearly definedand they encompass all national public goods such as defense, foreign policy, money, bankingand currency as well as trunk infrastructure such as air, rail, waterways, shipping, major roads
40

and postal and telecommunication services. Furthermore, the federal govermnent is asked toformulate the country's policies in respect of 'overall economic and social development, anddraw up and implement plans and strategies for development'. The Constitution also calls on thefederal government to set national policies in, inter alia, public health and education. As perArticle 52, however, all powers not given separately to the regions, or powers not given expresslyto the regions and the federal state, are reserved for the regions. This residuary clause therebyplaces substantial expenditure responsibilities on the regions, including significantly, much of theanti-poverty expenditure.
6.9 In practice, the precise demarcation of responsibilities between federal and regionalbodies emerges from national policies as well as from various statutes and regulations that definethe responsibilities of federal and regional agencies. Thus, for example, there are variousinstruments that describe the current understanding of the respective responsibilities of federaland regional health and education agencies, 36 but the importance of regional expenditures in thesesectors is strongly driven by national policies which prioritizes the expansion of the primaryservices which regions deliver.
36 These are described in detail in Implementing Sector Development Programmes in Ethiopia, StephenLister, December 1998.
41

Appendix 7
FEDERAL BUDGET GRANT FORMULA AND BUDGET OFFSET SYSTEM
The Federal Grant Formula
7.1 As noted in the main text, resource transfers from federal government to regions aredominated by a block grant commonly referred to as the federal subsidy. This is unearmarked,which means that the grant is not used to try to influence regional expenditure allocations indetail. The grant is intended not only to shift resources from federal to regional level but also toredress imbalances across the regions, and to do so in a way that does not undermine theirincentive to draw on their own revenue sources. The formula thus aims to strike a balancebetween equitable distribution of resources and promotion of efficiency.
7.2 The World Bank's Regionalization Study included a detailed description and analysis ofthe grant formula as it had operated up to 1998. At that point its main components werepopulation, a composite 'level-of-development' index (known as the I-distance factor), and anelement intended to reward revenue effort. The study made some technical criticisms of the I-distance part of the formula, and pointed out that, in spite of the incentive for revenuemobilization under the revenue variable, regions might still be penalized for additional revenuecollection.
7.3 Based on evaluation of international experience and keeping in view the Ethiopianreality, the federal budget grant formula in operation since FY98 was modified with effect fromFY01. The prime objective of the proposed revision is to "cover the portion of each regionalgovermnent's expenditure requirements that cannot be covered with its own revenue sources. Indoing so, the formula distributes the pool of regional grant resources among the regionalgovernments in a way that narrows the horizontal fiscal imbalance. Moreover, the formularecognizes also that efficiency in allocation must also be taken into consideration - i.e. regionalgovernments must have incentives to raise their own revenues.37" The formula is thus clearly aneffort to strike a balance between equitable distribution of resources and promotion of efficiency.
7.4 The following is an analysis of the variables and the main changes effected in the 2001formula:
Population index: The weight for population, which increased from one-thirdprior to 1998 to 60 percent in the 1998 formula, has been marginally reduced to 55percent. Also the index peg has been shifted from the 1998 population estimate tothe 2001 estimate. It should be noted that population has a high weight in mostfederal transfer formulae and a weight of 55 percent seems reasonable.
Composite index of development: This index comprises two sets of variables.The first is a set of sectoral indicators to reflect the level of development, and thesecond a set of unit expenditure variables to reflect the differing expenditure needs.The revision has effected three main changes. First, from among the six sectoralvariables in the 1998 formula (education, health, water, roads, electricityconsumption and telephone lines), two, electricity consumption and telephonelines, have been removed in response to the grievance of the regions that these arefederal provisions beyond the ambit of the regions. Second, the expenditure needs
37 The Federal Budget Grant Formula in Ethiopia, Ministry of Economic Development and Cooperation,March 2000.

variables have been expanded to better reflect unit costs, especially in theeducation, health and rural roads sectors. Third a new variable, administrative costindicator (based on area and number of woredas) has been introduced. While this isa commendable effort at striking a balance between level of development andexpenditure needs, it is also complex and non-transparent. Perhaps a betteralternative that subsumes all theses variables will be regional per capita income,but this would have to await more accurate and statistically robust regional incomeestimates.Poverty index: The poverty index, intended to reflect 'variations in foodconsumption and food insecurity and hence the expenditure requirements for theagriculture sector', is a new variable in the formula. The index is derived from the1995/96 Household Income, Consumption and Expenditure Survey and the 1996Welfare Monitoring Survey. It is worth noting that theses surveys excluded non-sedentary populations in the predominantly pastoralist Afar and Somali Regions.Given that settled population in these regions is better off than the non-sedentarypopulation, the index underestimates the poverty level in these areas.Revenue raising effort and sectoral output performance index: This index is acomposite of two variables in a 73:27 proportion. The first, ratio of the region'srevenue to its income, multiplied by the share of population to adjust fordifferences in revenue base, is aimed at rewarding regions which maximize theirown revenue effort. The second, sectoral output performance indicator, derivedfrom three sub-variables (changes in the primary school participation rate, numberof health centers and the length of rural roads), is aimed at encouraging budgetaryoutput performance.
7.5 Table 7.1 shows a comparative picture of the 1998 and 2001 formulae for federal grantdistribution, Table 7.2 shows the value of indices for each region and Table 7.3 shows theresulting changes in the relative entitlements of the regions.
Table 7.1: Changes in the Federal Grant FormulaVariable Weight in
FY98 formula FYOI formulaIndex of population 0.60 0.55
Composite inverted index of development 0.25 0.20Index of revenue raising effort 0.15 0.15Poverty index 0.00 0.10Total 1.00 1.00
7.6 It is intended to retain the formula in its present form for three years before furtheradjustments. Thereafter increased availability of relevant data may support further refinements.The changes have been carefully thought out, but perhaps what is most striking is that the netchanges in most regions' share of the pool (see Table 7.3) are very marginal. Clearly, the level offunds available to a particular region is much more affected by the decision on the total size of thepool, and by the 'offset' adjustment which takes account of aid flows to each region.
The Budget Offset
7.7 Although it has been discussed in previous PERs, the budget offset mechanism remains arecurrent theme and a relevant concern. Essentially, the mechanism consists of the federalgovernment combining its contribution from its own resources with external aid flowing to theregions (whether directly or via the federal government) to determine the overall divisible pool.The federal grant formula for horizontal distribution of resources across the regions is then
44

applied to this pool. In other words, external aid flowing to the regions is subsumed in thedivisible pool rather than flowing as an additionally to the formula driven federal subsidy. Theobjective for the offset is to ensure inter-regional equity as mandated by Article 94 (2) of theConstitution.
7.8 The logic of the offset system is not disputed, but there have been two main practicalconcerns:
* Aid is perceived as an inferior substitute for treasury funds, reducing theincentive for regions to utilize aid, and thereby running the risk that thecountry as a whole will draw down less aid than it could.
* Regions perceived a lack of transparency in how the offset was calculated(e.g. certain types of aid are not counted towards the offset) and could alsolose out if their grant was reduced on account of anticipated aid which didnot in fact materialize.
Table 7.2: Value of Indices in the Federal Grant Formula 2001'Population Poverty Level of Revenue raising
Development effort and sectoralperformance
Regions 2/ Index Weighted Index Weighted Index Weighted Index Weighted Aggregate Regionalindex index index index index share of
entitlementWeights (percentage) 55 10 20 15 100Tigray 0.0604 0.0332 0.1330 0.0133 0.0972 0.0194 0.1130 0.0169 0.0829 8.2902Afar 0.0197 0.0108 0.1190 0.0119 0.1501 0.0300 0.0128 0.0019 0.0547 5.4660Amhara 0.2665 0.1466 0.1303 0.0130 0.1344 0.0269 0.1833 0.0275 0.2140 21.3997Oromia 0.3670 0.2019 0.0797 0.0080 0.1202 0.0240 0.3050 0.0457 0.2796 27.9640Somali 0.0604 0.0332 0.0795 0.0079 0.1771 0.0354 0.0310 0.0046 0.0812 8.1235Benishangul-Gumuz 0.0088 0.0049 0.1093 0.0109 0.0897 0.0179 0.0498 0.0075 0.0412 4.1199SNNP 0.2058 0.1132 0.1298 0.0130 0.1211 0.0242 0.1951 0.0293 0.1797 17.9682Gambella 0.0034 0.0019 0.0960 0.0096 0.0690 0.0138 0.0422 0.0063 0.0316 3.1605Hareri 0.0026 0.0014 0.0669 0.0067 0.0103 0.0021 0.0349 0.0052 0.0154 1.5439Dire Dawa 0.0053 0.0029 0.0565 0.0057 0.0307 0.0061 0.0330 0.0049 0.0196 1.9640Reg. Ave./Total 1.0000 0.5500 1.0000 0.1000 1.0000 0.2000 1.0000 0.1500 1.0000 100.00001/ Source: The Federal Budget Grant Formula in Ethiopia, March 2000, MEDAC2/ Addis Ababa is not included as it doesn't receive any federal subsidy.
Table 7.3: Changes in the Regional Shares of the Federal GrantRegion Percentage share
FY98 formula FY01 formnulaTigray 8.2680 8.2902Afar 5.4367 5.4660
Amhara 20.7164 21.3997Oromiya 27.2924 27.9640Somali 8.1709 8.1235Benishangul 3.9222 4.1199SNNP 17.1650 17.9682Gambela 3.0212 3.1605Harari 1.9241 1.5439Dire Dawa 4.0383 1.9640Total 100.0000 100.0000
7.9 The RPERs reveal that these concerns are still present. For example, the Tigray RPER(§ 5.3.1) reported persistent confusion over what is and is not included in the offset calculation, aswell as frustration that "the Regional Government, being only an indirect recipient of funds and
45
not the main negotiator, has little or no leverage over the discussions held and decisions madewith the donors, especially under the SDPs, [while] the realization of donor pledges has beenparticularly unreliable in the past".
7.10 Beginning in FY00 there was an important change to the offset. It is now applied on only30 percent of external grants and 70 percent of external loans thus reducing the bias of the regionsagainst external resources. The higher percentage of offset for loans than for grants is to create apositive bias in favor of grants which carry no repayment obligation. The offset will diminish inimportance if donors shift from project to sector and budget support as envisaged under thePRSP. Since that shift will take some years yet to materialize, the following suggestions forreform, as proposed in PER 2000, remain relevant:
* Maintain the principle that offset should be substantially less than 100 percentof the funds received (in other words, regions which go to the extra trouble ofutilizing donor funds, and thereby expanding the total resource envelope forEthiopia, should get some reward for doing so - this is the same principle as therevenue raising effort variable of the basic subsidy formula).
* Base the offset on actual recorded aid flows in the preceding year. This wouldbe transparent, and would also be seen as fairer: regions are particularly upsetwhen the offset reduces their funds on account of aid funds which wereexpected but did not, in the end, arrive.
* Determine, and publish, clear guidelines on what is and is not included in theoffset calculation, and avoid continual changes. (Although, MEDAC informseach region of the amount of its offset by donor and sector, it should makeadditional efforts to provide complete information to the regions - and thedonors - on how the offset is exactly calculated).
* Publish comprehensive annual figures on actual aid flows by region (and ifpossible by zone), showing sectoral breakdowns as well as levels of aid.38
This would enable the equity of resource distribution to be monitored in atransparent way.
38 This is especially relevant for regions which devolve budgeting to the zonal level and divide their federalsubsidy among the zones accordingly.
46

STATISTICAL TABLES
Table 1: Ethiopia - Fiscal trends, 1996/97-2001/02million birT
1996/97 1997/98 1998/99 1999/00 2000/01 2000/01 2001/02Pre. Act. Program 1/ Pre. Act. Budget 2/
GDP (current prices) 41,465.1 44,840.3 48,687.5 52,074.2 57,746.0 52,871.7 59,108.6
Total revenue and grants 9036.8 9373.7 10415.2 11222.3 14273.9 12818.8 14628.6Total revenue 7535.5 8100.4 8653.1 9498.2 10827.9 10190.9 11506.5
Tax revenue 5359.3 5268.5 5591.4 6482.2 8061.3 7446.2 8646.52Non-tax revenue 2176.2 2831.8 3061.6 3016.0 2766.6 2744.7 2860
External grants 1501.3 1273.3 1762.1 1724.1 3446.0 2627.9 3122.1
Total expend. (including net lending) 9906.3 11327.2 14916.4 17183.7 17994.2 15370.1 17417.7Of which:
Recurrentexpenditure 5737.9 7080.6 10126.3 13741.7 12438.9 10352.0 11390olw Defense 834.8 2189.5 4232.9 6842.2 4204.4 3307.0 3000
Capital expenditure 4168.4 4146.6 4790.1 3442.0 5555.3 5018.1 6027.6Net lending 0.0 100.0 0.0 0.0 0.0 0.0
Emergency program 1115.0 404.0 1715
Fiscal balance (cash basis) No emergency programBefore grants (excl. emergency -7166.4 -5179.2 -5911.2
program)After grants (excl. emergency -3720.4 -2551.3 -2789.1
program)
Fiscal balance (cash basis)Before grants -2370.8 -3226.8 -6263.3 -7685.5 -8281.4 -5583.2 -7626.2After grants -869.5 -1953.5 -4501.2 -5961.4 -4835.4 -2955.3 -4504.1
Financing 869.5 1953.5 4501.2 5961.4 4835.4 2955.3 4504.1
External net 627.4 780.2 1708.4 868.0 4089.0 2051.0 4105.0Gross borrowing 911.5 1121.6 2142.8 1366.0 4858.0 2667.0 4755.0
Capital budget 780.6 1037.2 1773.1 1120.0 1965.0 1744.0 1899.0CPF generations/loans 130.9 84.4 369.7 246.0 1776.0 171.0 1141.0Special prograrn 1117.0 752.0 1715
Amortization paid 284.1 341.4 434.4 498.0 769.0 616.0 650.0
Domestic -420.8 592.0 1514.7 4975.0 246.0 54.0 0.0Banking system -824.0 575.0 885.3 5499.0 -195.0 -213.0 -422.0Non-bank sources 403.2 17.0 629.4 -524.0 441.0 267.0 422.0
Privatization 347.0 313.0 800.0 650.0 500.0 400.0 400.0
Otherandresidual 315.9 268.3 478.1 -531.6 0.4 450.3 -0.9
Memo items:Capital Expenditure by sources of 4168.4 4146.6 4790.1 3442.0 5555.3 5018.1 6027.6Financing
Domestic treasury 3246.5 2614.4 2486.0 1917.3 2647.3 2601.1 2818.5External assistance 141.3 495.0 531.0 404.7 943.0 673.0 1310.1External loan 780.6 1037.2 1773.1 1120.0 1965.0 1744.0 1899.0
Reserves in months of imports 4.4 3.0 2.8 2.1 2.6 2.0 3.6Source: Ministry of Finance. MEDAC, National Bank of Ethiopia, WB & IMFMissions.1/ Program under the three-year IMF PRGF arrangement.2/ Consistent with program under PRGF arrangement, with lower defense expenditure, and excluding Enhanced HIPC assistance.
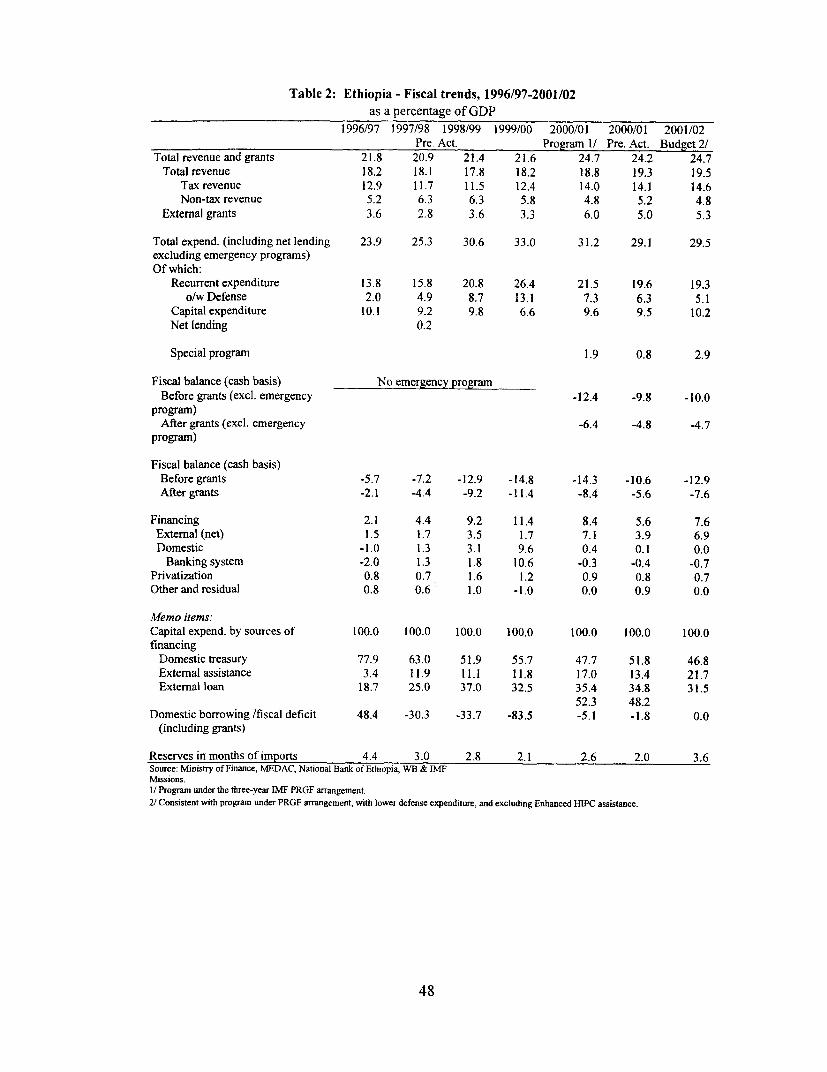
Table 2: Ethiopia - Fiscal trends, 1996/97-2001/02as a percentage of GDP
1996/97 1997/98 1998/99 1999/00 2000/01 2000/01 2001/02Pre. Act. Program I / Pre. Act. Budget 2/
Total revenue and grants 21.8 20.9 21.4 21.6 24.7 24.2 24.7Total revenue 18.2 18.1 17.8 18.2 18.8 19.3 19.5
Tax revenue 12.9 11.7 11.5 12.4 14.0 14.1 14.6Non-tax revenue 5.2 6.3 6.3 5.8 4.8 5.2 4.8
External grants 3.6 2.8 3.6 3.3 6.0 5.0 5.3
Total expend. (including net lending 23.9 25.3 30.6 33.0 31.2 29.1 29.5excluding emergency programs)Of which:
Recurrent expenditure 13.8 15.8 20.8 26.4 21.5 19.6 19.3o/wDefense 2.0 4.9 8.7 13.1 7.3 6.3 5.1
Capital expenditure 10.1 9.2 9.8 6.6 9.6 9.5 10.2Net lending 0.2
Special program 1.9 0.8 2.9
Fiscal balance (cash basis) No emergency programBefore grants (excl. emergency -12.4 -9.8 -10.0
program)After grants (excl. emergency -6.4 -4.8 -4.7
program)
Fiscal balance (cash basis)Before grants -5.7 -7.2 -12.9 -14.8 -14.3 -10.6 -12.9After grants -2.1 -4.4 -9.2 -11.4 -8.4 -5.6 -7.6
Financing 2.1 4.4 9.2 11.4 8.4 5.6 7.6External (net) 1.5 1.7 3.5 1.7 7.1 3.9 6.9Domestic -1.0 1.3 3.1 9.6 0.4 0.1 0.0
Banking system -2.0 1.3 1.8 10.6 -0.3 -0.4 -0.7Privatization 0.8 0.7 1.6 1.2 0.9 0.8 0.7Other and residual 0.8 0.6 1.0 -1.0 0.0 0.9 0.0
Memo items:Capital expend. by sources of 100.0 100.0 100.0 100.0 100.0 100.0 100.0financing
Domestic treasury 77.9 63.0 51.9 55.7 47.7 51.8 46.8External assistance 3.4 11.9 11.1 11.8 17.0 13.4 21.7External loan 18.7 25.0 37.0 32.5 35.4 34.8 31.5
52.3 48.2Domestic borrowing/fiscal deficit 48.4 -30.3 -33.7 -83.5 -5.1 -1.8 0.0
(including grants)
Reserves in months of imports 4.4 3.0 2.8 2.1 2.6 2.0 3.6Source: Ministry of Finance, MEDAC, Natonal Bank of Ethiopia, WB & IMFMissions.I/ Program under the three-year IMF PRGF arrangement.
2/ Consistent with program under PRGF arrangement, with lower defense expenditure, and excluding Enhanced HIPC assistance.
48

Table 3: Functional Classification of General Government Recurrent Expenditures, 1996/97-2001/02
In million birr1996/97 1997/98 1998/99 1999/00 2000/01 (Program) 2000/01 (Pre Act) 2001/02 (Budget)
Federal Regional National Federal Regional National Federal Regional National Federal Regional National Federal Regional National Federal Regional National Federal Regional National
General administration 1245 636 1881 2577 747 3324 4699 905 5604 7444 878 8322 4953 912 5865 3989 1037 5026 3785 1083 4867
o/w Defense 835 0 835 2190 0 2190 4233 0 4233 6842 0 6842 4204 0 4204 3307 0 3307 3000 0 3000
Economicinfrastructure 131 49 180 26 79 105 84 61 146 90 75 165 117 76 193 112 73 185 96 101 196
o/w Road construction 1/ 130 40 170 23 6R 91 22 54 76 25 69 94 34 63 97 33 66 99 33 86 120
Economic services 96 387 483 124 429 553 148 484 632 183 460 643 250 518 768 195 558 753 396 632 1028
o/wAgricult.&nat.res. 58 357 414 82 391 473 90 440 530 112 419 531 130 466 596 115 515 630 197 584 781
Social services 286 1216 1502 379 1327 1707 394 1504 1897 622 1480 2102 470 1933 2404 503 1754 2258 531 2036 2567
o/wEducation 148 886 1034 166 949 1115 176 1065 1240 218 1087 1305 327 1407 1734 244 1289 1533 395 1473 1868
Health 61 274 334 79 316 394 88 368 456 69 326 395 56 450 506 90 385 475 62 472 534
Others 1481 212 1693 1162 230 1392 1785 62 1847 2435 74 2509 3129 80 3209 2080 51 2131 2596 136 2732
o/winterest&charges 919 0 919 836 0 836 957 0 957 1122 0 1122 1416 0 1416 1080 0 1080 1183 0 1183
external assistance 257 0 257 160 0 160 813 0 813 1289 0 1289 1349 0 1349 978 0 978 1027 0 1027
TotalRecurrentexpenditure 3239 2499 5738 4268 2812 7081 7110 3016 10126 10774 2968 13742 8919 3520 12439 6879 3473 10352 7403 3987 11390
as a percentage of recurrent expenditure
Generaladmninistration 384 25.4 328 60.4 266 46.9 66.1 30.0 55.3 69.1 29.6 60.6 555 25.9 47.2 580 298 48.5 51 1 272 42.7
o/w Defense 25.8 0.0 14.5 513 0.0 309 59.5 0.0 41.8 63.5 00 49.8 47.1 0.0 33.8 48.1 0.0 319 40.5 0.0 263
Economic infrastructure 4.0 2.0 3 1 0.6 2.8 1.5 1.2 2.0 14 0 8 2.5 1.2 1 3 2.2 1.6 1.6 2.1 1 8 1.3 2.5 1 7
o/wRoadconstruction I/ 40 1.6 3.0 0.5 24 13 0.3 18 0.7 0.2 2.3 07 04 1.8 0.8 0.5 1.9 1.0 0.5 2.2 1.1
Economic services 30 155 8.4 2.9 153 7.8 2.1 16.0 62 1.7 15.5 4.7 28 14.7 6.2 28 16.1 7.3 53 158 90
n/w Agricult. & nat. res. 1.8 143 7.2 1.9 13.9 67 13 14.6 5.2 10 14.1 3.9 1.5 13.2 4.8 1 7 14.8 6.1 2.7 146 6.9
Social services 8.8 48.7 262 8.9 47.2 241 5.5 49.9 18.7 5.8 49,9 15.3 53 54.9 19.3 7.3 50.5 21.8 7.2 51 1 225
o/w Education 4.6 355 180 3.9 33.8 157 25 35.3 12.2 20 366 9.5 3.7 400 13.9 36 371 148 5.3 369 164
Health 1.9 110 58 18 11.2 5.6 12 12.2 4.5 06 11.0 2.9 0.6 12.8 4.1 1.3 11.1 4.6 0.8 119 41
Others 45.7 8.5 29.5 27.2 8.2 197 25.1 2.1 182 226 2.5 18.3 35.1 2.3 25.8 30.2 15 20.6 35.1 34 240
o/winterest&ccharges 28.4 0.0 160 19.6 0.0 118 135 0.0 94 10.4 0.0 8.2 15.9 0.0 11.4 157 0.0 10.4 160 00 104
cxternal assistance 7.9 0.0 4.5 3.7 00 2.3 11.4 0.0 8.0 12.0 0.0 94 151 0.0 10.8 142 0.0 9.4 139 00 9.0
Total Recurrent expenditure 100.0 100.0 100.0 100.0 100.0 100.0 100.0 100.0 100.0 100.0 100 0 100.0 100.0 100.0 1000 100.0 100.0 100 0 1000 1000 100.0
1/ Includes urban development.
2/ Figures for 1996/97 through 1999/00 are preliminary actualexpenditures.

Table 4: Functional Classification of General Government Capital Expenditures, 1996197-2001/02
In million birr1996/91 1997/98 1998199 1999/00 2000/01 (PTograM) 2000/01 (Pre. Act) 2001t02 (Budget)
Federal Regional National Federal Regional National Federal Regional National Federal Regional Nutional Federal Regional National Federal Regional National Federal Regional National
Eco~onoicina6trncture S36 33j t1168 648 445 10tt3 1020 376 1396 697 296 993 1744 499 2243 106t 494 1561 1322 547 2369
./w R.oad on nia 457 324 7n6 463 436 890 747 3t71 1117 S0 292 797 13t41 4S9 1730 790 490 1230 1445 039 1984
F.coamic deelopment 12S7 704 199t 827 413 1240 1030 484 1514 764 308 1072 1021 412 1433 7S6 446 1232 990 433 1422
o/w Agficult. & nat res 212 654 966 313 409 723 364 481 1044 447 305 752 861 408 1269 410 442 852 8S1 427 1278
Socialdevelopment 184 510 694 417 597 1013 536 473 1009 429 284 714 1137 393 1530 640 553 1193 1309 531 1840
o/w Education 154 238 393 194 242 437 207 182 469 265 76 341 517 133 650 276 321 597 837 259 1096
Health 19 202 221 58 219 277 57 766 221 31 I10 140 600 133 733 210 109 319 417 129 546
Others 143 172 316 620 181 S01 667 205 B71 518 146 664 154 196 333 866 167 1033 292 105 397
oAaExtamalassistamce 0 0 0 495 0 495 531 0 531 405 0 405 0 0 673 673 0
Total apitaln penditurc 2452 1716 4168 Z512 1635 4147 3252 1538 4790 2407 1035 3442 4055 1I00 5335 3358 1660 5019 4413 1615 6028
as a percentage of capital expenditure
Economicinalrstructure 342 192 28.0 258 272 26.4 31.4 24.5 291 2950 286 208 430 333 40.4 31.8 29.8 31 1 413 33.9 393
n/w Roadcoangruction 184 189 1806 184 267 11.7 239 24.1 23.3 210 282 232 306 326 31.1 235 29.5 20S 327 334 321
flcootnicdevelopment 52 5 410 47.8 329 25 2 29.9 317 315 31.6 317 29.8 31 1 25.2 27.5 25.8 23 4 26 9 24 5 22 4 26 8 23 6
/w Agricult&nat.res 86 383 200 t25 250 17.4 173 312 21.8 106 295 219 212 272 22LS 12.2 266 170 19.3 264 212
Sncialdevelopment 7 5 297 167 166 365 244 165 300 21.1 178 275 20.7 280 262 275 19.0 333 238 297 329 305
otwEducatior 63 139 94 77 148 105 88 118 9.8 110 74 99 127 89 11.7 82 197 119 190 160 182
Health 0S IIS 53 23 i34 6.7 17 10S 46 12 307 41 140 89 132 63 66 6.4 94 80 91
Others S8 100 76 247 110 193 205 133 \S2 215 141 193 38 13 1 63 25.S 10.1 206 66 69 66
o/wtExternalassistance 00 0.0 0.0 197 03 11 9 16.3 00 1S.I 16.8 00 13.8 0.0 00 00 20.0 0.0 134 00 00 00
Totalcapitalexpenditure 1000 0 1000 0 300 100 0 100.0 1000 100.0 100.0 1000 100 0 10000 100.0 700.0 7009 13 00.0 t3000 100.0 100.0 1000
11 Regions capital expenditures do not include external loan tad assistance for FY98, FY99, FY00 aad FY0tdisaggreitaed figurts sre not available.21 Figures for 1996/97 throuRh 1999/00 are preliminary actualepenpditores
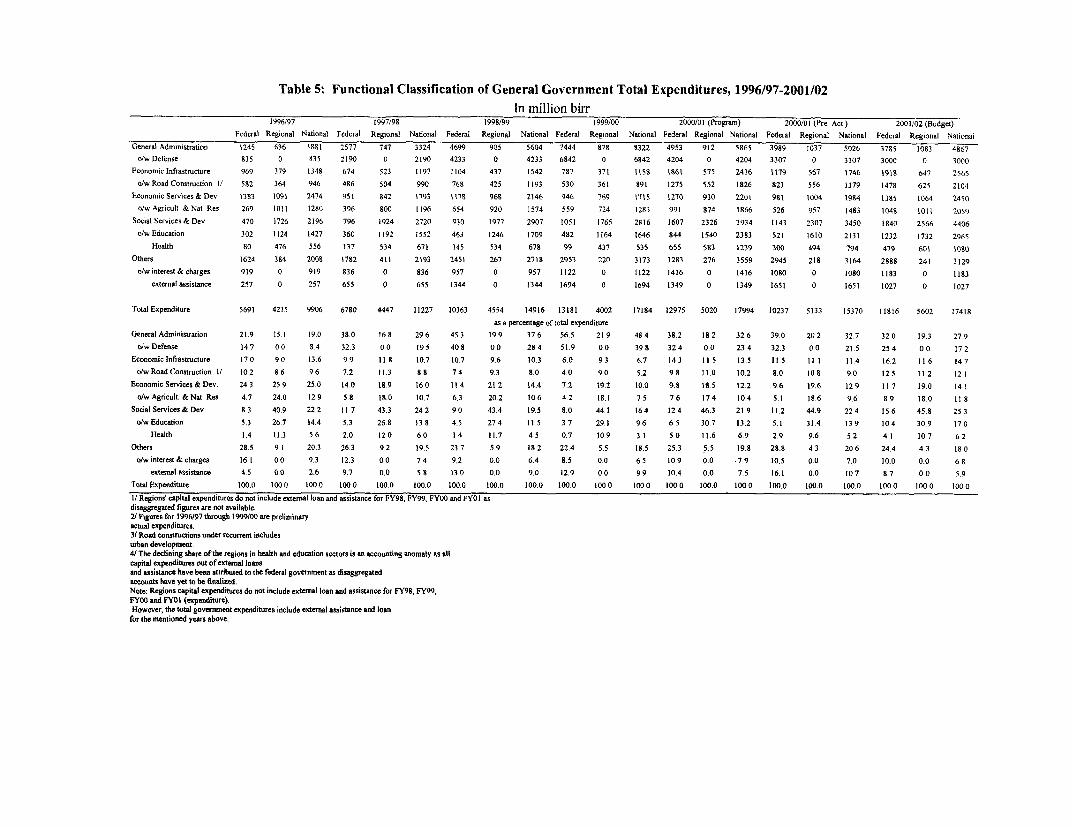
Table 5: Functional Classification of General Government Total Expenditures, 1996/97-2001/02
In million birr1996/97 t997/98 1998/99 1999/00 2000/01 (Program) 2000/01 (Pre Act) 2001/02 (Budget)
Federal Regional National Federal Regional National Federal Regional National Federal Regional National Federal Regional National Federal Regional National Federal Regional Nationai
General Administration 1245 636 1881 2577 747 3324 4699 905 5604 7444 878 8322 4953 912 5865 3989 1037 5026 3785 1083 4867
o/w Defense 835 0 835 2190 0 2190 4233 0 4233 6842 0 6842 4204 0 4204 3307 0 3307 3000 0 3000
Economic Infratstucture 969 379 1348 674 523 1197 1104 437 1542 787 371 1158 1861 575 2436 1179 567 1746 1918 647 2565
o/wRoadConstruction 1/ 582 364 946 486 504 990 768 425 1193 530 361 891 1275 552 1826 823 556 1379 1478 625 2104
EconomicServices&Dev 1383 1091 2474 951 842 1793 1173 968 2146 946 769 1715 1270 930 2201 981 1004 1984 1385 1064 2450
o/wAgricult &Nat Res 269 1011 1280 396 800 1196 654 920 1574 559 724 1283 991 874 1866 526 957 1483 104S 1011 2059
SocialServices&Dev 470 1726 2196 796 1924 2720 930 1977 2907 1051 1765 2816 1607 2326 3934 1143 2307 3450 1840 2566 4406
o/w Education 302 1124 1427 360 1192 1552 463 1246 1709 482 1164 1646 844 1540 2383 521 1610 2131 1232 1732 2965
Health 80 476 556 137 534 671 145 534 678 99 437 535 655 583 1239 300 494 794 479 601 10S0
Others 1624 384 2008 1782 411 2193 2451 267 2718 2953 220 3173 3283 276 3559 2945 218 3164 2888 241 3129
o/winterest&charges 919 0 919 836 0 836 957 0 957 1122 0 1122 1416 0 1416 1080 0 1080 1183 0 1183
extemal assistance 257 0 257 655 0 655 1344 0 1344 1694 0 1694 1349 0 1349 1651 0 1651 1027 0 1027
TotalExpenditure 5691 4215 9906 6780 4447 11227 10363 4554 14916 13181 4002 17184 12975 5020 17994 10237 5133 15370 11816 5602 17418
as a percentage of total expenditure
General Adminitaration 21.9 151 19.0 38.0 168 29.6 45.3 199 376 56.5 219 484 38.2 182 326 39.0 202 327 320 19.3 27.9
o/wDefense 14.7 00 8.4 32.3 00 195 408 00 284 51.9 0.0 398 324 0.0 234 32.3 00 21.5 254 00 172
Economic Infrastructure 17 0 9 0 13.6 9.9 118 10.7 10.7 9.6 10.3 6.0 9 3 6.7 14 3 11 5 13.5 11.5 II 1 11.4 16 2 116 14 7
o/wRoadConstraction 1/ 102 8 6 9.6 7.2 11.3 8.8 74 9.3 8.0 4.0 90 5.2 9 8 11.0 10.2 8.0 10 8 9.0 12.5 11.2 12 1
Economic Services& Dev. 24.3 259 25.0 14.0 18.9 160 114 21.2 14.4 7.2 19.2 10.0 9.8 185 12.2 9.6 19.6 129 117 19.0 141
o/wAgricult. &Nat. Res 4.7 24.0 129 5.8 18.0 10.7 6.3 20.2 106 4.2 18.1 75 76 174 10.4 5.1 18.6 9.6 89 18.0 118
Social Services&Dev- 83 40.9 22.2 117 43.3 242 90 43.4 19.5 8.0 44.1 164 124 46.3 21.9 11.2 44.9 224 156 45.8 253
o/w Education 5.3 26.7 14.4 5.3 26.8 138 4.5 274 115 37 29.1 9.6 65 30,7 13.2 5.1 31.4 139 104 30.9 170
Health 1.4 11.3 5.6 2.0 120 6.0 14 11.7 45 0.7 10.9 31 50 11.6 6.9 2.9 9.6 52 41 107 62
Others 28.5 9 1 20.3 26.3 9 2 19.5 23.7 5.9 18 2 22.4 5.5 18.5 25.3 5.5 19.8 28.8 4 3 20 6 24.4 4.3 18 0
ovw interest & charges 161 0.0 9.3 12.3 00 74 9.2 0.0 6.4 8.5 0.0 6.5 10.9 0.0 .7.9 10.5 0.0 7.0 10.0 0.0 68
external assistance 4.5 0.0 2.6 9.7 0.0 58 13.0 0.0 9.0 12.9 00 99 10.4 0.0 7.5 16.1 0.0 107 87 00 5.9
Total Fxpenditure 100.0 1000 100.0 100 0 1000 100.0 100.0 100.0 100.0 100.0 1000 100.0 1000 100.0 1000 100.0 100.0 100.0 1000 1000 1000
1/ Regions capital expenditures do not include extemal loan and assistance for FY98, FY99, FY00 and FY01 as
disaggregated figures are not available.2t Figures for 1996v97 through 1999/00 are preliminatyactual expenditures.31 Road constructions under recurrent includesurban development.4/ The declining share of the regions in health and education sectors is an accounting anomaly as allcapital expenditures out of extemal loansand assistance have been attrihuted to the federal govemment as disaggregatedaccounts have yet to be finalized.Note: Regions capital expenditures do not include external loan and asnistance for FY98, FY99,
FY00 and FY01 (expenditure).However, the total government expenditures include external assistnce and loanfor the mentioned years above.

Table 6: Selected Expenditures as a Share of Total Government Expenditure, 1996/97-2001/021996/97 1997/98 1998/99 1999/00 2000/01 2000/01 2001/02
Pre. Act Program Pre. Act. Budget
In million bin
Total Government Expenditure 99063 11227.2 14916.4 17183.7 17994.2 15370.1 17418O/w Defense 834.8 2189.5 4232.9 6842.2 4204.4 3307.0 3000
Education 1426.5 1551.7 1709.1 1646.0 2383.3 2130.8 2965
Health 555.6 671.1 678.3 535.4 1238.5 794.2 1080
Agriculture & Natural Resources 1280.3 1195.8 1573.9 1283.0 1865.5 1482.8 2059
Road constructions 946.2 989.6 1192.9 890.8 1826.4 1379.3 2104
as a share of govemment expenditure
Total Government Expenditure 100 100 100 100 100 100 100
O/w Defense 8.4 19.5 28.4 39.8 23.4 21.5 17.2
Education 9.6 8.8 8.0 5.2 10.2 9.0 12.1
Health 12.9 10.7 10.6 7.5 10.4 9.6 11.8
Agriculture & Natural Resources 14.4 13.8 11.5 9.6 13.2 13.9 17.0
Road constructions 5.6 6.0 4.5 3.1 6.9 5.2 6.2
Source; Ministry of Finance
Table 7: Real Per Capita Expenditure, 1996/97-2001/02Bin 1996/97 1997/98 1998/99 1999/00 2000/01 2000/01 2001/02
Pre. Act Progrun Pre. Act. Budget
Total expenditureCurrent prices 170.21 187.43 241.76 270.61 275.14 235.02 258.42
Constant prices: GDP deflator 60.40 60.79 76.77 84.71 82.85 78.15 82.25
Total capital expenditure
Current prices 71.62 69.23 77.64 54.20 84.94 76.73 89.43
Constant prices: GDP deflator 25.41 22.45 24.65 16.97 25.58 25.52 28.46
Total education expenditure
Current prices 24.51 25.90 27.70 25.92 36.44 32.58 43.98
Constant prices: GDP deflator 8.70 8.40 8.80 8.11 10.97 10.83 14.00
Capital expenditure in education sectorCurrent prices 6.74 7.29 7.60 5.37 9.94 9.13 16.27
Constant prices: GDP deflator 2.39 2.36 2.41 1.68 2.99 3.04 5.18
Total health expenditure
Currentprices 9.55 11.20 10.99 8.43 18.94 12.14 16.02
Constant prices: GDP deflator 3.39. 3.63 3.49 2.64 5.70 4.04 5.10
Capital expenditure in health sectorCurrentprices 3.80 4.62 3.61 2.21 11.20 4.88 8.09
Constantprices:GDPdeflator 1.35 1.50 1.15 0.69 3.37 1.62 2.58
Total road expenditure
Current prices 16.26 16.52 19.33 14.03 27.93 21.09 31.21
Constant prices: GDP deflator 5.77 5.36 6.14 4.39 8.41 7.01 9.93
Capital expenditure in road sector
Cuffent prices 13.34 15.00 18.11 12.55 26.45 19.58 29.44
Constant prices: GDP deflator 4.73 4.86 5.75 3.93 7.96 6.51 9.37
Memo items:Population (in million) 58.20 59.90 61.70 63.50 65.40 65.40 67.40
GDPDeflator(1980/81=100) 2.82 3.08 3.15 3.19 3.32 3.01 3.14
Source: MEDAC and WB & Ibf Missions.
1/ Recurrent expenditure for road construction from 1994/95 onwardsincludes urban development.Notc:1999/00 PER projection figures are used to calculate the averagefor years of 1998/99-1999/00.
Projections for 199/00 are as of end of January,2000.
52
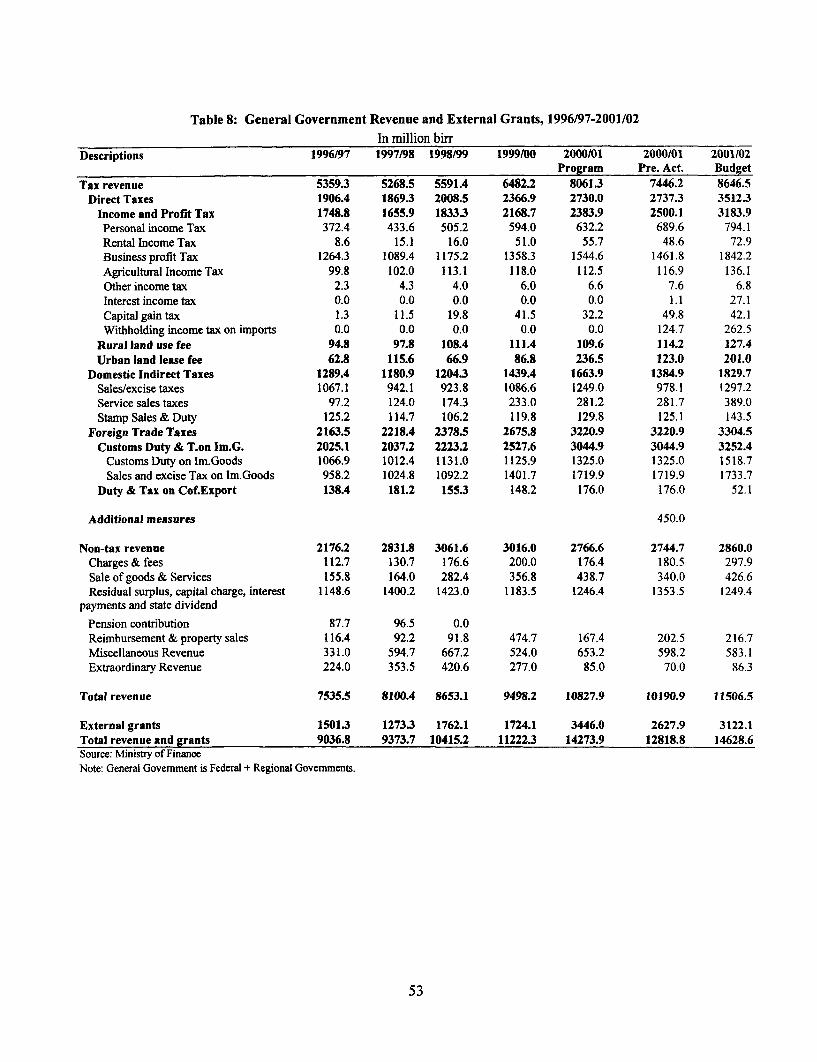
Table 8: General Government Revenue and External Grants, 1996/97-2001/02
In million birrDescriptions 1996/97 1997/98 1998/99 1999/00 2000/01 2000/01 2001/02
Program Pre. Act. BudgetTax revenue 5359.3 5268.5 5591.4 6482.2 8061.3 7446.2 8646.5
Direct Taxes 1906.4 1869.3 2008.5 2366.9 2730.0 2737.3 3512.3Income and Profit Tax 1748.8 1655.9 1833.3 2168.7 2383.9 2500.1 3183.9
Personal income Tax 372.4 433.6 505.2 594.0 632.2 689.6 794.1Rental Income Tax 8.6 15.1 16.0 51.0 55.7 48.6 72.9Business profit Tax 1264.3 1089.4 1175.2 1358.3 1544.6 1461.8 1842.2Agricultural Income Tax 99.8 102.0 113.1 118.0 112.5 116.9 136.1Other income tax 2.3 4.3 4.0 6.0 6.6 7.6 6.8Interestincometax 0.0 0.0 0.0 0.0 0.0 1.1 27.1Capitalgaintax 1.3 11.5 19.8 41.5 32.2 49.8 42.1Withholding income tax on imports 0.0 0.0 0.0 0.0 0.0 124.7 262.5
Rural land use fee 94.8 97.8 108.4 111.4 109.6 114.2 127.4Urban land lease fee 62.8 115.6 66.9 86.8 236.5 123.0 201.0
Domestic Indirect Taxes 1289.4 1180.9 1204.3 1439.4 1663.9 1384.9 1829.7Sales/excise taxes 1067.1 942.1 923.8 1086.6 1249.0 978.1 1297.2Service sales taxes 97.2 124.0 174.3 233.0 281.2 281.7 389.0Stamp Sales&Duty 125.2 114.7 106.2 119.8 129.8 125.1 143.5
Foreign Trade Taxes 2163.5 2218.4 2378.5 2675.8 3220.9 3220.9 3304.5Customs Duty & T.on Im.G. 2025.1 2037.2 2223.2 2527.6 3044.9 3044.9 3252.4
CustomsDutyonlm.Goods 1066.9 1012.4 1131.0 1125.9 1325.0 1325.0 1518.7Sales and excise Tax on lm.Goods 958.2 1024.8 1092.2 1401.7 1719.9 1719.9 1733.7
Duty & Tax on Cof.Export 138A 181.2 155.3 148.2 176.0 176.0 52.1
Additional measures 450.0
Non-tax revenue 2176.2 2831.8 3061.6 3016.0 2766.6 2744.7 2860.0Charges & fees 112.7 130.7 176.6 200.0 176.4 180.5 297.9Sale of goods & Services 155.8 164.0 282.4 356.8 438.7 340.0 426.6Residual surplus, capital charge, interest 1148.6 1400.2 1423.0 1183.5 1246.4 1353.5 1249.4
payments and state dividend
Pension contribution 87.7 96.5 0.0Reimbursement & property sales 116.4 92.2 91.8 474.7 167.4 202.5 216.7Miscellaneous Revenue 331.0 594.7 667.2 524.0 653.2 598.2 583.1Extraordinary Revenue 224.0 353.5 420.6 277.0 85.0 70.0 86.3
Total revenue 7535.5 8100.4 8653.1 9498.2 10827.9 10190.9 11506.5
External grants 1501.3 1273.3 1762.1 1724.1 3446.0 2627.9 3122.1Total revenue and grants 9036.8 9373.7 10415.2 11222.3 14273.9 12818.8 14628.6Source: Ministry of FinanceNote: General Govemment is Federal + Regional Govemments.
53
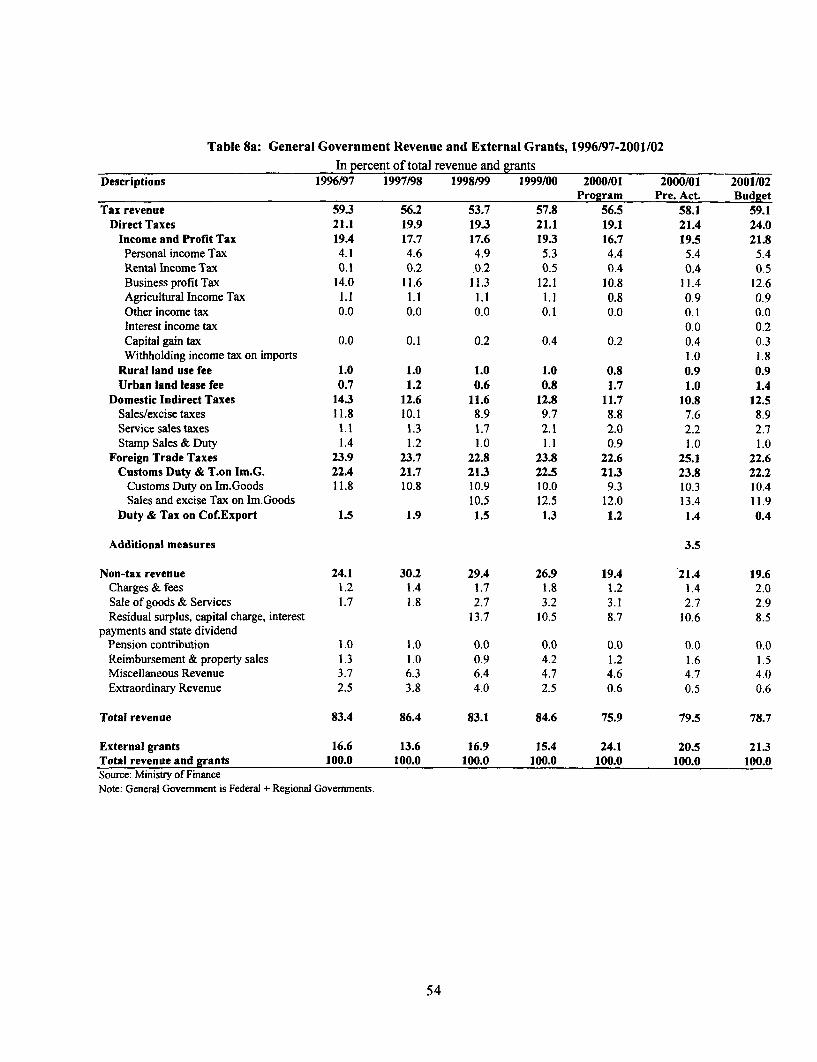
Table 8a: General Government Revenue and External Grants, 1996/97-2001/02
In percent of total revenue and grantsDescriptions 1996/97 1997/98 1998/99 1999/00 2000/01 2000/01 2001/02
Program Pre. Act. BudgetTax revenue 59.3 56.2 53.7 57.8 56.5 58.1 59.1
Direct Taxes 21.1 19.9 19.3 21.1 19.1 21.4 24.0Income and Profit Tax 19.4 17.7 17.6 19.3 16.7 19.5 21.8
Personal income Tax 4.1 4.6 4.9 5.3 4.4 5.4 5.4Rental Income Tax 0.1 0.2 .0.2 0.5 0.4 0.4 0.5BusinessprofitTax 14.0 11.6 11.3 12.1 10.8 11.4 12.6AgriculturallncomeTax 1.1 1.1 1.1 1.1 0.8 0.9 0.9Other income tax 0.0 0.0 0.0 0.1 0.0 0.1 0.0Interest income tax 0.0 0.2Capital gain tax 0.0 0.1 0.2 0.4 0.2 0.4 0.3Withholding income tax on imports 1.0 1.8
Rural land use fee 1.0 1.0 1.0 1.0 0.8 0.9 0.9Urban land lease fee 0.7 1.2 0.6 0.8 1.7 1.0 1.4
Domestic Indirect Taxes 14.3 12.6 11.6 12.8 11.7 10.8 12.5Sales/excise taxes 11.8 10.1 8.9 9.7 8.8 7.6 8.9Service sales taxes 1.1 1.3 1.7 2.1 2.0 2.2 2.7Stamp Sales & Duty 1.4 1.2 1.0 1.1 0.9 1.0 1.0
Foreign Trade Taxes 23.9 23.7 22.8 23.8 22.6 25.1 22.6Customs Duty & T.on Im.G. 22.4 21.7 21.3 22.5 21.3 23.8 22.2
CustomsDutyonlm.Goods 11.8 10.8 10.9 10.0 9.3 10.3 10.4Sales and excise Tax on Im.Goods 10.5 12.5 12.0 13.4 11.9
Duty & Tax on Cof.Export 1.5 1.9 1.5 1.3 1.2 1.4 0.4
Additional measures 3.5
Non-tax revenue 24.1 30.2 29.4 26.9 19.4 21.4 19.6Charges & fees 1.2 1.4 1.7 1.8 1.2 1.4 2.0Sale of goods & Services 1.7 1.8 2.7 3.2 3.1 2.7 2.9Residual surplus, capital charge, interest 13.7 10.5 8.7 10.6 8.5
payments and state dividendPension contribution 1.0 1.0 0.0 0.0 0.0 0.0 0.0Reimbursement & property sales 1.3 1.0 0.9 4.2 1.2 1.6 1.5Miscellaneous Revenue 3.7 6.3 6.4 4.7 4.6 4.7 4.0Extraordinary Revenue 2.5 3.8 4.0 2.5 0.6 0.5 0.6
Total revenue 83.4 86.4 83.1 84.6 75.9 79.5 78.7
External grants 16.6 13.6 16.9 15.4 24.1 20.5 21.3Total revenue and grants 100.0 100.0 100.0 100.0 100.0 100.0 100.0Source: Ministry of FinanceNote: General Govemment is Federal + Regional Govemments.
54
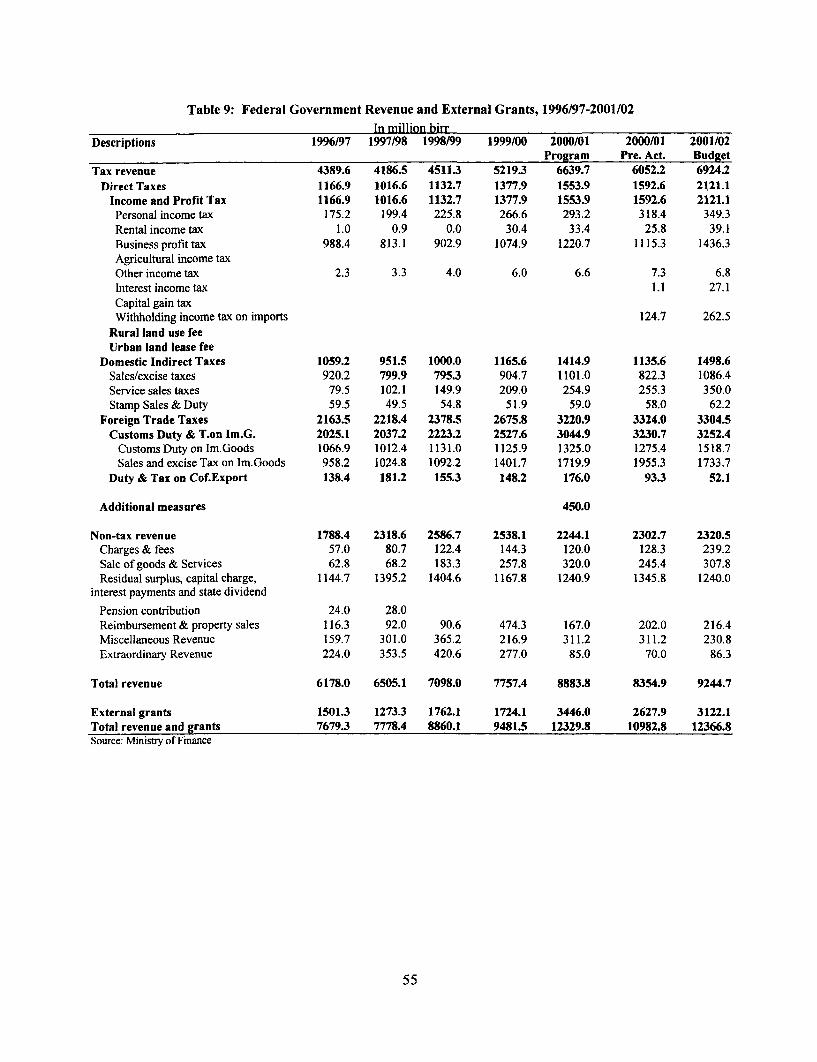
Table 9: Federal Government Revenue and External Grants, 1996/97-2001/02in million birr
Descriptions 1996/97 1997/98 1998/99 1999/00 2000/01 2000/01 2001/02Program Pre. Act. Budget
Tax revenue 4389.6 4186.5 4511.3 5219.3 6639.7 6052.2 6924.2Direct Taxes 1166.9 1016.6 1132.7 1377.9 1553.9 1592.6 2121.1
Income and Profit Tax 1166.9 1016.6 1132.7 1377.9 1553.9 1592.6 2121.1Personal income tax 175.2 199.4 225.8 266.6 293.2 318.4 349.3Rental income tax 1.0 0.9 0.0 30.4 33.4 25.8 39.1Businessprofittax 988.4 813.1 902.9 1074.9 1220.7 1115.3 1436.3Agricultural income taxOther income tax 2.3 3.3 4.0 6.0 6.6 7.3 6.8Interest income tax 1.1 27.1Capital gain taxWithholding income tax on imports 124.7 262.5
Rural land use feeUrban land lease fee
Domestic Indirect Taxes 1059.2 951.5 1000.0 1165.6 1414.9 1135.6 1498.6Sales/excise taxes 920.2 799.9 795.3 904.7 1101.0 822.3 1086.4Service sales taxes 79.5 102.1 149.9 209.0 254.9 255.3 350.0Stamp Sales & Duty 59.5 49.5 54.8 51.9 59.0 58.0 62.2
Foreign Trade Taxes 2163.5 2218.4 2378.5 2675.8 3220.9 3324.0 3304.5Customs Duty & T.on Im.G. 2025.1 2037.2 2223.2 2527.6 3044.9 3230.7 3252A
Customs Duty on Im.Goods 1066.9 1012.4 1131.0 1125.9 1325.0 1275.4 1518.7Sales and excise Tax on Im.Goods 958.2 1024.8 1092.2 1401.7 1719.9 1955.3 1733.7
Duty & Tax on Cof.Export 138.4 181.2 155.3 148.2 176.0 93.3 52.1
Additional measures 450.0
Non-tax revenue 1788.4 2318.6 2586.7 2538.1 2244.1 2302.7 2320.5Charges & fees 57.0 80.7 122.4 144.3 120.0 128.3 239.2Sale of goods & Services 62.8 68.2 183.3 257.8 320.0 245.4 307.8Residual surplus, capital charge, 1144.7 1395.2 1404.6 1167.8 1240.9 1345.8 1240.0
interest payments and state dividend
Pension contribution 24.0 28.0Reimbursement & property sales 116.3 92.0 90.6 474.3 167.0 202.0 216.4Miscellaneous Revenue 159.7 301.0 365.2 216.9 311.2 311.2 230.8Extraordinary Revenue 224.0 353.5 420.6 277.0 85.0 70.0 86.3
Total revenue 6178.0 6505.1 7098.0 7757.4 8883.8 8354.9 9244.7
External grants 1501.3 1273.3 1762.1 1724.1 3446.0 2627.9 3122.1Total revenue and grants 7679.3 7778.4 8860.1 9481.5 12329.8 10982.8 12366.8Source: Ministry of Finance
55
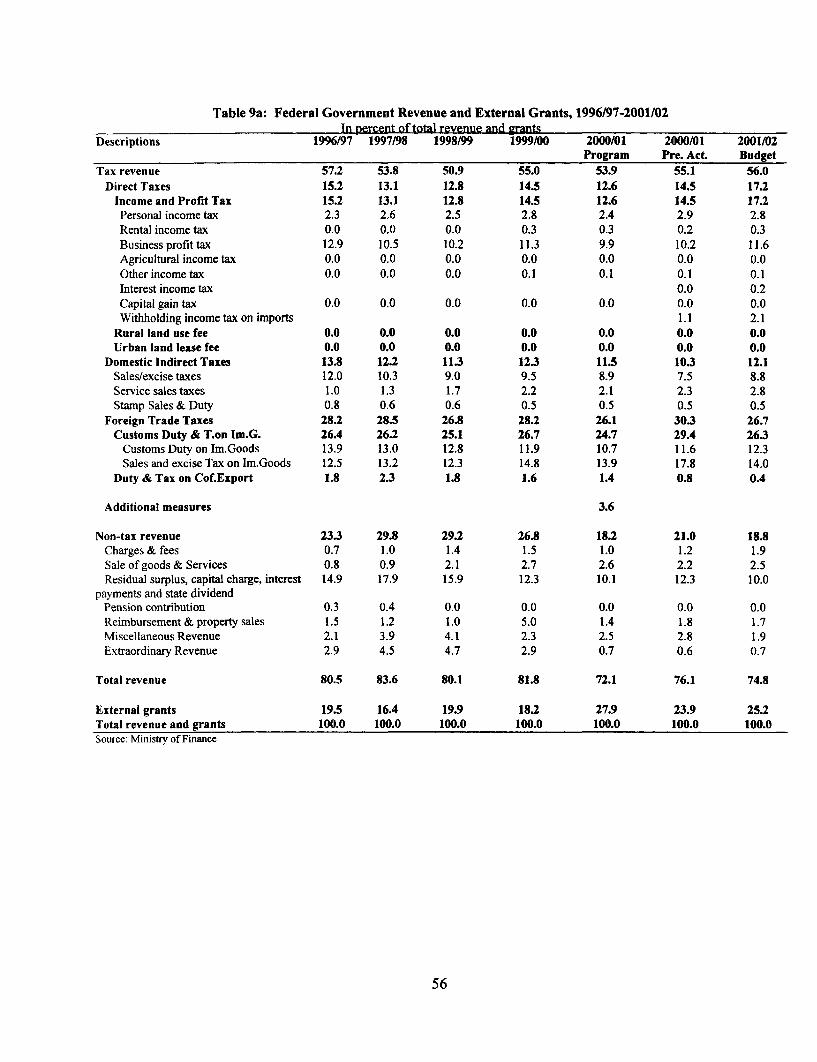
Table 9a: Federal Government Revenue and External Grants, 1996/97-2001/02In percent of total revenue and grarts
Descriptions 1996/97 1997/98 1998/99 1999/00 2000/01 2000101 2001/02Program Pre. Act. Budget
Tax revenue 57.2 53.8 50.9 55.0 53.9 55.1 56.0Direct Taxes 15.2 13.1 12.8 14.5 12.6 14.5 17.2
Income and Profit Tax 15.2 13.1 12.8 14.5 12.6 14.5 17.2Personal income tax 2.3 2.6 2.5 2.8 2.4 2.9 2.8Rental income tax 0.0 0.0 0.0 0.3 0.3 0.2 0.3Business profit tax 12.9 10.5 10.2 11.3 9.9 10.2 11.6Agricultural income tax 0.0 0.0 0.0 0.0 0.0 0.0 0.0Other income tax 0.0 0.0 0.0 0.1 0.1 0.1 0.1Interest income tax 0.0 0.2Capital gain tax 0.0 0.0 0.0 0.0 0.0 0.0 0.0Withholding income tax on imports 1.1 2.1
Rural land use fee 0.0 0.0 0.0 0.0 0.0 0.0 0.0Urban land lease fee 0.0 0.0 0.0 0.0 0.0 0.0 0.0
Domestic Indirect Taxes 13.8 12.2 113 123 11.5 10.3 12.1Sales/excise taxes 12.0 10.3 9.0 9.5 8.9 7.5 8.8Service sales taxes 1.0 1.3 1.7 2.2 2.1 2.3 2.8Stamp Sales & Duty 0.8 0.6 0.6 0.5 0.5 0.5 0.5
Foreign Trade Taxes 28.2 28.5 26.8 28.2 26.1 30.3 26.7Customs Duty & T.on Im.G. 26.4 26.2 25.1 26.7 24.7 29.4 26.3
Customs Duty on Im.Goods 13.9 13.0 12.8 11.9 10.7 11.6 12.3Sales and excise Tax on Im.Goods 12.5 13.2 12.3 14.8 13.9 17.8 14.0
Duty & Tax on Cof.Export 1.8 2.3 1.8 1.6 1.4 0.8 0.4
Additional measures 3.6
Non-tax revenue 23.3 29.8 29.2 26.8 18.2 21.0 18.8Charges & fees 0.7 1.0 1.4 1.5 1.0 1.2 1.9Sale of goods & Services 0.8 0.9 2.1 2.7 2.6 2.2 2.5Residual surplus, capital charge, interest 14.9 17.9 15.9 12.3 10.1 12.3 10.0
payments and state dividendPension contribution 0.3 0.4 0.0 0.0 0.0 0.0 0.0Reimbursement& property sales 1.5 1.2 1.0 5.0 1.4 1.8 1.7Miscellaneous Revenue 2.1 3.9 4.1 2.3 2.5 2.8 1.9Extraordinary Revenue 2.9 4.5 4.7 2.9 0.7 0.6 0.7
Total revenbe 80.5 83.6 80.1 81.8 72.1 76.1 74.8
External grants 19.5 16.4 19.9 18.2 27.9 23.9 25.2Total revenue and grants 100.0 100.0 100.0 100.0 100.0 100.0 100.0Source: Ministry of Finance
56
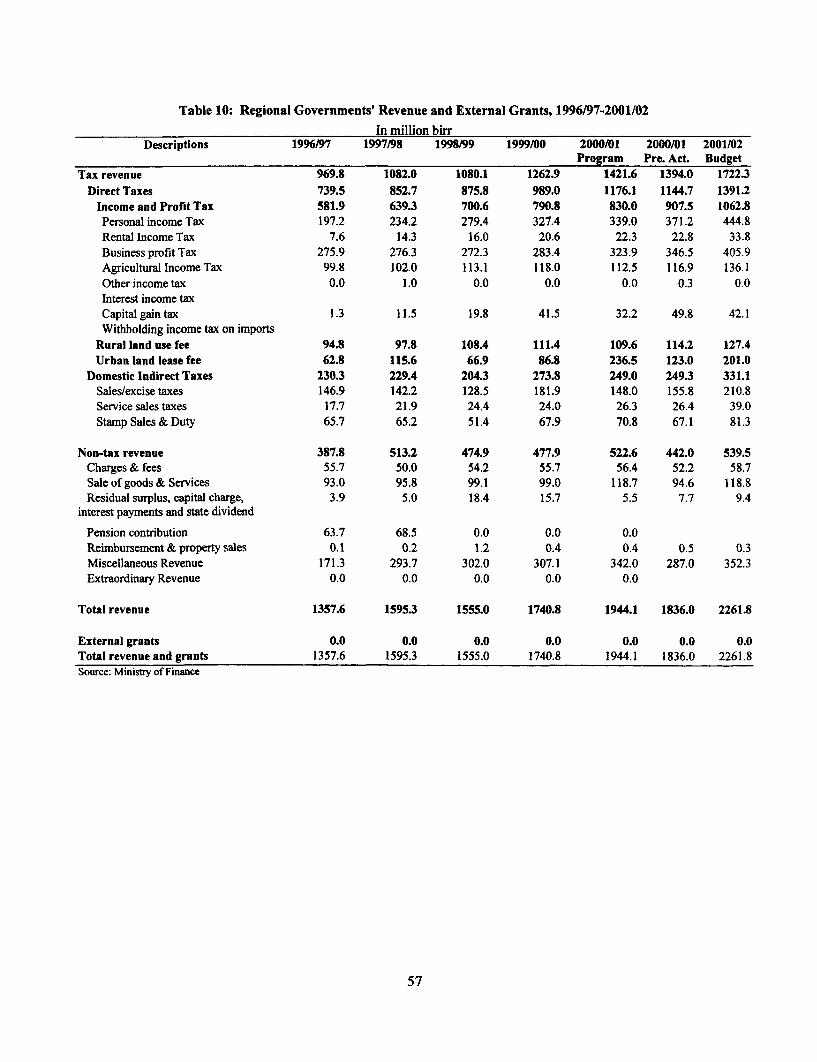
Table 10: Regional Governments' Revenue and External Grants, 1996/97-2001/02
In million birrDescriptions 1996/97 1997/98 1998/99 1999/00 2000/01 2000/01 2001/02
Program Pre. Act. BudgetTax revenue 969.8 1082.0 1080.1 1262.9 1421.6 1394.0 1722.3
Direct Taxes 739.5 852.7 875.8 989.0 1176.1 1144.7 1391.2Income and Profit Tax 581.9 639.3 700.6 790.8 830.0 907.5 1062.8Personal income Tax 197.2 234.2 279.4 327.4 339.0 371.2 444.8Rental Income Tax 7.6 14.3 16.0 20.6 22.3 22.8 33.8Business profit Tax 275.9 276.3 272.3 283.4 323.9 346.5 405.9Agricultural Income Tax 99.8 102.0 113.1 118.0 112.5 116.9 136.1Other income tax 0.0 1.0 0.0 0.0 0.0 0.3 0.0Interest income taxCapital gain tax 1.3 11.5 19.8 41.5 32.2 49.8 42.1Withholding income tax on imports
Rural land use fee 94.8 97.8 108.4 111.4 109.6 114.2 127.4Urban land lease fee 62.8 115.6 66.9 86.8 236.5 123.0 201.0
Domestic Indirect Taxes 230.3 229.4 204.3 273.8 249.0 249.3 331.1Sales/excise taxes 146.9 142.2 128.5 181.9 148.0 155.8 210.8Service sales taxes 17.7 21.9 24.4 24.0 26.3 26.4 39.0Stamp Sales & Duty 65.7 65.2 51.4 67.9 70.8 67.1 81.3
Non-tax revenue 387.8 513.2 474.9 477.9 522.6 442.0 539.5Charges & fees 55.7 50.0 54.2 55.7 56.4 52.2 58.7Sale of goods& Services 93.0 95.8 99.1 99.0 118.7 94.6 118.8Residual surplus, capital charge, 3.9 5.0 18.4 15.7 5.5 7.7 9.4
interest payments and state dividend
Pension contribution 63.7 68.5 0.0 0.0 0.0Reimbursement & property sales 0.1 0.2 1.2 0.4 0.4 0.5 0.3Miscellaneous Revenue 171.3 293.7 302.0 307.1 342.0 287.0 352.3Extraordinary Revenue 0.0 0.0 0.0 0.0 0.0
Total revenue 1357.6 1595.3 1555.0 1740.8 1944.1 1836.0 2261.8
External grants 0.0 0.0 0.0 0.0 0.0 0.0 0.0Total revenue and grants 1357.6 1595.3 1555.0 1740.8 1944.1 1836.0 2261.8Source: Ministry of Finance
57

Table 10a: Regional Governments' Revenue and External Grants, 1996/97-2001/02
In percent of total revenue and grantsDescriptions 1996/97 1997/98 1998/99 1999/00 2000/01 2000/01 2001/02
Program Pre. BudgetAct.
Tax revenue 71.4 67.8 69.5 72.5 73.1 75.9 76.1
Direct Taxes 54.5 53.5 56.3 56.8 60.5 62.3 61.5Income and Profit Tax 42.9 40.1 45.1 45.4 42.7 49.4 47.0
Personal income Tax 14.5 14.7 18.0 18.8 17.4 20.2 19.7Rental Income Tax 0.6 0.9 1.0 1.2 1.1 1.2 1.5BusinessprofitTax 20.3 17.3 17.5 16.3 16.7 18.9 17.9Agricultural Income Tax 7.4 6.4 7.3 6.8 5.8 6.4 6.0Other income tax 0.0 0.1 0.0 0.0 0.0 0.0 0.0Interest income tax 0.0 0.0 0.0 0.0 0.0 0.0 0.0Capital gain tax 0.1 0.7 1.3 2.4 1.7 2.7 1.9Withholding income tax on imports
Rural land use fee 7.0 6.1 7.0 6.4 5.6 6.2 5.6Urban land lease fee 4.6 7.2 4.3 5.0 12.2 6.7 8.9
Domestic Indirect Taxes 17.0 14.4 13.1 15.7 12.8 13.6 14.6Sales/excise taxes 10.8 8.9 8.3 10.4 7.6 8.5 9.3Service sales taxes 1.3 1.4 1.6 1.4 1.4 1.4 1.7Stanp Sales & Duty 4.8 4.1 3.3 3.9 3.6 3.7 3.6
Non-tax revenue 28.6 32.2 30.5 27.5 26.9 24.1 23.9Charges & fees 4.1 3.1 3.5 3.2 2.9 2.8 2.6Saleofgoods&Services 6.9 6.0 6.4 5.7 6.1 5.2 5.3Residual surplus, capital charge, interest
payments and state dividendPension contribution 4.7 4.3 0.0 0.0 0.0 0.0 0.0Reimbursement & property sales 0.0 0.0 0.1 0.0 0.0 0.0 0.0Miscellaneous Revenue 12.6 18.4 19.4 17.6 17.6 15.6 15.6Extraordinary Revenue 0.0 0.0 0.0 0.0 0.0 0.0 0.0
Total revenue 100.0 100.0 100.0 100.0 100.0 100.0 100.0
External grants 0.0 0.0 0.0 0.0 0.0 0.0 0.0Total revenue and grants 100.0 100.0 100.0 100.0 100.0 100.0 100.0Source: Ministry of Finance
58

Table 11. Budget Transfers from Federal Government to Regions - 1996/97 - 2001/02million birr
1996/97 1997/98 1998/99 1999/00 2000/01 2001/02Regions Recurrent Capital Total Recurrent Capital Total Recurrent Capital Total Recurrent Capital Total Recurrent Capital Total Total
Tigray 110.4 167.8 278.2 132.0 134.0 266.0 109.8 119.6 229.4 128.8 53.5 182.3 238.7 85.5 324.2 213.5
Afar 49.6 87.0 136.6 70.0 102.2 172.2 86.3 123.5 209.8 69.6 106.4 176.0 181.2 87.0 268.2 206.2
Amnhara 404.7 302.0 706.7 415.5 306.9 722A4 443.9 233.7 677.6 402.1 134.4 536.5 675.2 203.0 878.2 709.8
Oromia 445.7 435.0 880.7 506.5 330.1 836.6 528.2 351.0 879.2 466.0 146.6 612.6 905.9 255.0 1,160.9 1003.95
Somali 10.4 113.6 124.0 308 173.1 203.9 55.2 157.9 213.1 81.6 152.8 234.4 265.1 161.6 426.7 301.3
Benshangul 35.2 71.9 107.1 59.9 102.2 162.1 68.0 75.0 143.0 67.6 52.8 120.4 135.2 57.4 192.6 147
SNNP 286.9 230.1 517.0 340.1 222.6 562.7 394.6 169.1 563.7 361.5 78.5 440.0 447.4 45.7 493.1 503.8
Gambella 41.3 47.0 88.3 54.5 11.0 65.5 57.9 72.7 130.6 60.1 37.5 97.6 107.6 43.5 151.1 121.7
Harari 22.0 15.0 37.0 37.1 39.5 76.6 35.0 6.0 41.0 34.5 24,1 58.6 50.3 13.5 63.8 57
Addis Ababa 1.2 1.2 2.2 2.2 1.0 1.0 0.0 0.0 0
DireDawa 4.2 10.0 14.2 14.8 1i.1 31.9 13.7 19.5 33.2 8.6 8.0 16.6 24.1 5.0 29.1 75.65
Total 1,411.4 1,479.4 2,890.8 1,663.4 1,438.7 3,102.1 1,793.6 1,328.0 3,121.6 1,680.4 794.6 2,475.0 3,030.7 957.2 3,987.9 3,339.9
Source: Ministry of FinanceNote: The capital budget transfer doesn't include external Ian and assistance.
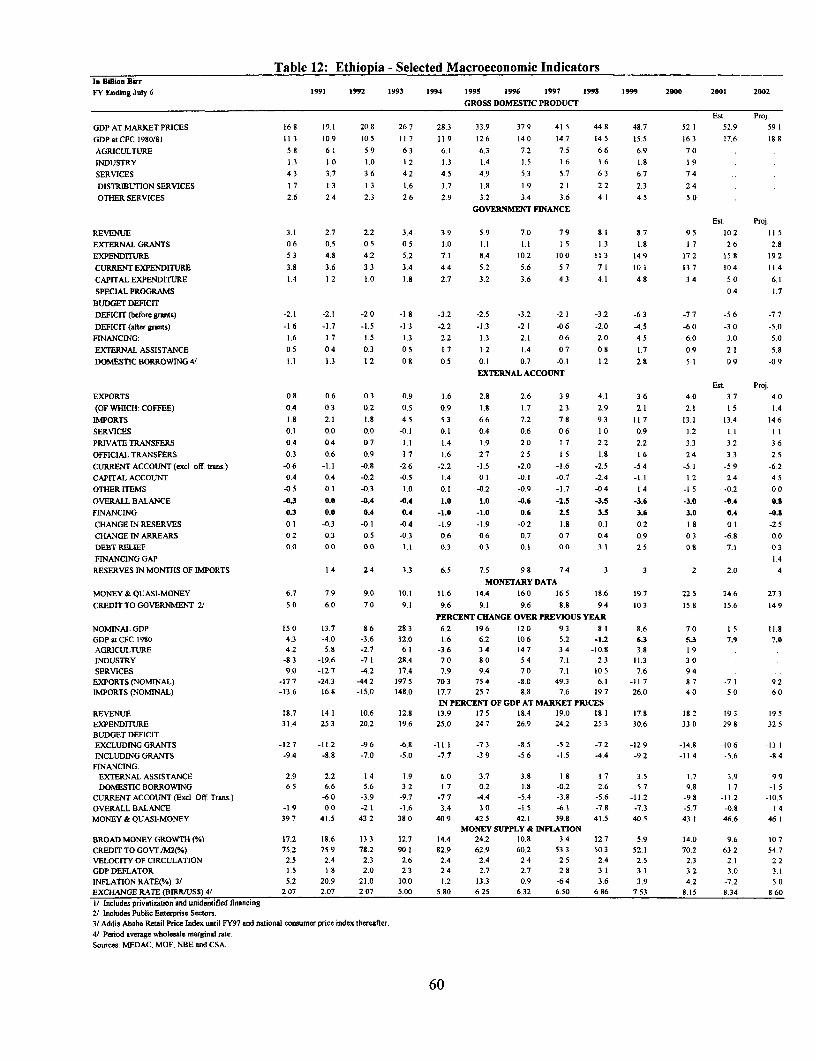
Table 12: Ethiopia - Selected Macroeconomic IndicatorsIn Billion BirrFY Ending July 6 1991 1992 1993 1994 1995 1996 1997 1998 1999 20010 2001 2002
GROSS DOMESITIC PRODUCT
Est. Proj.
GDP AT MARKETI'PRICES 1618 19.1 20.8 26 7 28.3 33.9 37 9 41.5 44 8 48.7 52 1 52.9 59 1
GDP atCFC 1980181 11 3 10.9 lOS5 11 7 11 9 12 6 14 0 14.7 14.5 15.5 16 3 17.6 IS88
AGRICULTURE 5.8 6 1 5 9 6 3 6.! 6.3 7.2 7.5 6 6 6.9 7 0
INDUSTRY 1.3 1 0 1.0 1 2 1.3 1.4 1.5 1 6 1.6 1.8 1 9
SERVICES 4.3 3.7 3 6 4 2 4.5 4.9 5.3 5.7 6 3 6.7 7 4
DISTRIBUTION SERVICES 1 7 1 3 1.3 1.6 1.7 1.8 1.9 2 1 2.2 2.3 2 4
OTHER SERVICES 2.6 2 4 2.3 2 6 2.9 3.2 3.4 3.6 4 I 4.5 5.0
GOVERNMENT FIANCEEst. Proj.
REVENUE 3.1 2.7 2.2 3.4 3.9 5.9 7.0 7 9 8.1 8.7 9.5 10 2 1 15
EXTERNAL GRANTS 0 6 0.5 0 5 0 5 1.0 1.1 1.1 15 1.3 1.8 1.7 2 6 2.1
EXPENDITURE 5 3 4.8 4.2 5.2 7.1 8.4 10.2 10 0 11 3 14.9 17.2 1598 19 2
CURRENT EXPENDITUIRE 3.8 3.6 3 3 3.4 4.4 5.2 5.6 5.7 71 10.1 13.7 10 4 11.4
CAPITAL EXPENDITRE 1.4 12 1.0 1.8 2.7 3.2 3.6 4.3 4.1 4 8 3.4 50 6.1
SPECIA,L PROGRAMS 0 4 1.7
BUDGET DEFICITDEFICIT (before grnts) -2.1 -2.1 -2.0 -1 8 -3.2 -2.5 -3.2 -2 1 -3.2 -6 3 -7 7 -5 6 -7.7
DEFICIT (after grants) -1 6 -1.7 -1.5 -1.3 -2.2 -1.3 -2 1 -0 6 -2.0 -4.5 -6 0 -3 0 -5.0
FINANCING: 1.6 I 7 1.5 1.3 2.2 1.3 2.1 0.6 2.0 45 6.0 3.0 5.0
EXTERNAL ASSISTANCE 0.5 04 0.3 05 17 1.2 1.4 0.7 0.8 1.7 0.9 21 5.8
DOMESTIC BORROWING 41 1.1 1.3 12 019 0.5 0.1 0.7 -0. 1 1.2 2.8 51 3 9 -0 9EXTERNAL ACCOUNT
Est. Proj.
EXPORTS 0 8 0.6 0.3 0,9 1.6 2.8 2.6 3 9 4.1 3 6 4.0 3 7 4 0
(OF WHICH: COFFEE) 0.4 0.3 0.2 0.5 0.9 1.8 1.7 2 3 2.9 2.1 2.1 I 5 1.4
IMPORTS 1.8 2.1 1.8 4.5 5.3 6.6 7.2 78 9.3 117 13.1 13.4 14 6
SERVICES 0.1 0.0 0.0 -0.1I 0.1 0.4 0.6 06 10 0.9 1.2 L.1 II
PRIVATE TRANSFERS 0.4 0.4 0 7 1.1 1.4 1.9 2 0 17 2.2 2.2 3.3 3.2 3 6
OFFICIAL TRANSFERS 0.3 0.6 0.9 17 1.6 2 7 25 IS 1.1 16 2.4 3.3 2.5
CURRENT ACCOUNT (exci off, trans.) -0 6 -1.1 -0.1 -2 6 -2.2 -1.5 -2.0 -1.6 -2.5 -5 4 -5.1 -5 9 -6.2
CAPITAL ACCOUNT 0.4 0.4 -0.2 -0.5 1.4 0 I -0. 1 -0.7 -2.4 -1.1 1.2 2 4 4 5
OTHERITEMS -0 5 0.1 -0.3 1.0 0.1 -0.2 -0.9 -1.7 -04 14 -1 5 -0.2 00
OVERALL BALANCE -0.3 0.8 -0.4 -0.4 1.8 LO0 -0.6 -2.5 -3.5 -3.6 -3.0 -0.4 0.8
FINANCING. 0.3 0.0 0.4 0.4 -1.0 -1.0 0.6 2.5 3.5 3.6 3.0 0.4 -0.8
CHANGE IN RESERVES 01 -0.3 -01I -0 4 -1.9 -1.9 -0 2 1.8 0.1 0.2 Is 0 I -2.5
CHANGE IN ARREARS 02 0.3 0.5 -0.3 0.6 0.6 0.7 0.7 0.4 0.9 0 3 -6.8 00
DEBT RELIEF 0.0 0.0 0.0 1.1 0.3 0 3 0.1 00 3.1 25 0.8 7.1 0 3
FINANCING GAP 1.4
RESERVES IN MONTHS OFIMPORTS 1.4 2 4 3.3 6.5 7.5 9 8 7 4 3 3 2 2.0 4
MONETARY DATA
MONEY &QUASI-MONEY 6.7 7.9 9.0 10.1 11.6 14.4 16 0 16 5 18.6 19.7 22.5 24.6 27.3
CREDIT TO GOVERNMENT 2/ 50 6.0 70 9.1 9.6 9.1 9.6 8.8 9.4 10 3 15.1 15.6 14 9PERCENT CHANGE OVER PREVIOUS YEAR
NOMINAL GDP ISO 13.7 1 6 28.3 6.2 19.6 120 9.3 8.1 8.6 7 0 I 5 1 1.8GDP at CEC 1910 4.3 -4.0 -3.6 12.0 1.6 6.2 10 6 5.2 -1.2 6.3 5.3 7.9 7.0AGRICULTURE 4.2 5.8 -2.7 6.1 -3.6 3 4 14 7 3.4 -10.8 38 19INDUSTRY -8 3 -19.6 -7 1 28.4 70 8 0 5 4 7.1 23 11.3 3 0
SERVICES 9.0 -12 7 -4.2 17.4 7.9 9.4 7 0 7.1 10 5 7.6 94EXPORTS (NOMINAL) -17 7 -24.3 -44 2 197.5 70.3 75.4 -8.0 49.3 6.1 -11.7 87 .7 1 9.2IMPORTS (NOMINAL) -13.6 16.8 -15.0 148.0 17.7 25 7 1.8 7.6 197 26.0 4 0 5 0 6 0
IN PERCENT OF GDP AT MARKET PRICESREVENUE 18.7 14 1 10.6 12.8 13.9 17 5 18.4 19.0 Is I 17.8 11 2 19.3 19.5EXPENDITURE 31.4 25 3 20.2 19.6 25.0 24 7 26.9 24.2 25 3 30.6 33 0 29 8 32 5
BUDGET DEFCIT.EXCLUD3ING GRANTS -12.7 -11.2 -9 6 -6.8 -11.1 -7 3 -8.5 -5 2 -7 2 -12 9 -14.8 -10 6 -13 1
INCLUDING GRANTS -9.4 -1.1 -7.0 -5.0 -7.7 -3 9 -5 6 -1.5 -4.4 -9 2 -11 4 .5.6 -1 4FINANCING.
EXTERNAL ASSISTANCE 2.9 2.2 14 1.9 6.0 3.7 3.8 II 17 3.5 1.7 3.9 9 9D3OMESTIC BORROWING 6.5 6.6 5.6 3.2 1.7 0.2 1.8 -0.2 2.6 5.7 9.8 17 -IS5
CURRENT ACCOUINT (Excl OfF Trans.) -6 0 -3.9 -9.7 .7 7 -4.4 -5.4 -3.1 -5.6 -11.2 -9 8 -11.2 -10.5
OVER.ALL BALANCE -1.9 00 -2 1 -1.6 3.4 3 0 -1.5 -6 1 -7.1 .7.3 -5.7 -0.8 14MONEY &QUASI-MONEY 39 7 41.5 43 2 38.0 40 9 42.5 42.1 39.8 41.5 40.5 43 1 46.6 46 I
MONEY SUPPLY & INFLATIONBROAD MONEY GROWTH ()17.2 18.6 13 3 12.7 14.4 24.2 10.8 3.4 12.7 5.9 14.0 9.6 10 7CREDIT TO GOVT./M2(%/) 75.2 75 9 71.2 90.l1 82.9 62.9 60.2 53 3 50.3 52.1 70.2 63 2 54.7VELOCIT OF CIRCULATION 2.5 2.4 2.3 2.6 2.4 2.4 2 4 25 2.4 2.5 2.3 2.1 2 2GDP DEFLATOR 1.5 II 2.0 2.3 24 2.7 2.7 2 8 31I 3.1 3 2 3.0 3.1
INFLATIONRPATE(-%) 3/ 5.2 20.9 21.0 10.0 1.2 13.3 0.9 -6 4 3.6 3.9 4.2 7.2 5 0EXCHANGE RATE (BIRR/USS) 41 207 2.07 2 07 5.00 5.80 6 25 6.32 6.50 6.86 7 53 1.15 1.34 1 60
I/ Includes privatizalion and unidentified financing2/ Includes Public Entterprise Sectors.3/ Addis Ababa Retail Price Index until FY97 and national consumer price index thereafter.4/ Period averge wholesale marginal rate.Sources MEDAC. MOF. NBE and CSA.
60
Related Documents