THIS REPORT CONTAINS ASSESSMENTS OF COMMODITY AND TRADE ISSUES MADE BY USDA STAFF AND NOT NECESSARILY STATEMENTS OF OFFICIAL U.S. GOVERNMENT POLICY Voluntary Report – Voluntary - Public Distribution Date: March 24, 2021 Report Number: ET2021-0006 Report Name: Ethiopia Oilseeds Report Annual Country: Ethiopia Post: Addis Ababa Report Category: Oilseeds and Products Prepared By: FAS/Addis Ababa Staff Approved By: Rachel Bickford Report Highlights: Total production of sesame seed, Niger seed, and soybeans in marketing year 2020/21 (October to September) is estimated to reach 705,000 metric tons, slightly down by 0.3 percent over previous year. With expansion of acreage and improved yields due to good weather conditions, production of soybeans and Niger seed is expected to increase nearly by 14 percent and 2 percent, respectively. While, sesame seed production is estimated to drop by 9 percent because of reduction in planted area. The projected impact of Covid-19 on supply chain disruptions has pushed farmers to slash sesame seed plantings and shifted to cultivation of food crops mainly sorghum to enhance local supply. The expansion of local edible oil complexes and integrated agro-industries in the country is anticipated to stimulate oilseeds production to meet the rapidly growing local demand for cooking oils as well as livestock feed.

Welcome message from author
This document is posted to help you gain knowledge. Please leave a comment to let me know what you think about it! Share it to your friends and learn new things together.
Transcript

THIS REPORT CONTAINS ASSESSMENTS OF COMMODITY AND TRADE ISSUES MADE BY USDA STAFF AND NOT NECESSARILY STATEMENTS OF OFFICIAL U.S. GOVERNMENT POLICY
Voluntary Report – Voluntary - Public Distribution Date: March 24, 2021
Report Number: ET2021-0006
Report Name: Ethiopia Oilseeds Report Annual
Country: Ethiopia
Post: Addis Ababa
Report Category: Oilseeds and Products
Prepared By: FAS/Addis Ababa Staff
Approved By: Rachel Bickford
Report Highlights:
Total production of sesame seed, Niger seed, and soybeans in marketing year 2020/21 (October to
September) is estimated to reach 705,000 metric tons, slightly down by 0.3 percent over previous year.
With expansion of acreage and improved yields due to good weather conditions, production of soybeans
and Niger seed is expected to increase nearly by 14 percent and 2 percent, respectively. While, sesame
seed production is estimated to drop by 9 percent because of reduction in planted area. The projected
impact of Covid-19 on supply chain disruptions has pushed farmers to slash sesame seed plantings and
shifted to cultivation of food crops mainly sorghum to enhance local supply. The expansion of local
edible oil complexes and integrated agro-industries in the country is anticipated to stimulate oilseeds
production to meet the rapidly growing local demand for cooking oils as well as livestock feed.
2
Executive Summary
Ethiopia’s oilseed sector plays an important role in generating foreign exchange earnings and supporting
the livelihoods of market actors across the value chain. Oilseed crops are the third largest foreign
exchange earners, next to coffee and cut flowers, and the oilseeds of sesame, soybean, and Niger seed
contribute to nearly 17 percent of Ethiopia’s agricultural exports. In the 2019/20 marketing year
(October to September), exports of sesame, Niger seed, and soybeans generated $376 million in foreign
exchange earnings. A survey report of Central Statistics Agency (CSA) shows close to 1.4 million
farmers produce oilseed crops in the country.
The production quantities of Niger seed and soybean in marketing year (MY) 2020/21 is estimated to
increase by 2 and 14 percent, respectively, over last year’s level. Expansion in planted acreage and
improved yield due to good weather conditions have propelled production upward. On the other hand,
sesame seed production is estimated to decline by nearly 9 percent over the previous year due to a
reduction in crop area and planting of alternative crops, largely sorghum, to increase food security.
COVID-19 induced supply chain disruptions had effect on sesame productions where farmers cultivated
alternative food crops to minimize the projected impact of the pandemic on local food supplies.
Looking ahead, Post expects oilseeds production to increase to meet the growing demand for cooking oil
and livestock feed. The inauguration of Integrated Agro-Industrial Parks and entry of large-scale edible
oil complexes in the market will offer new opportunities to process this anticipated increase in oilseed
production. This suggests that cooking oil imports could thus decline in the future. A new edible oil
industrial complex began operations recently that could ultimately meet 60 percent of the country’s
demand for cooking oils. Furthermore, several other edible oil complexes are expected to commence
productions by end of this year. This expansion in agro-industries and edible oil processing is projected
to strengthen oilseeds production in the longer term, but as current production of oilseeds is not
sufficient, imports are expected in the short term. Table 1 below summarizes production of major
oilseed crops.
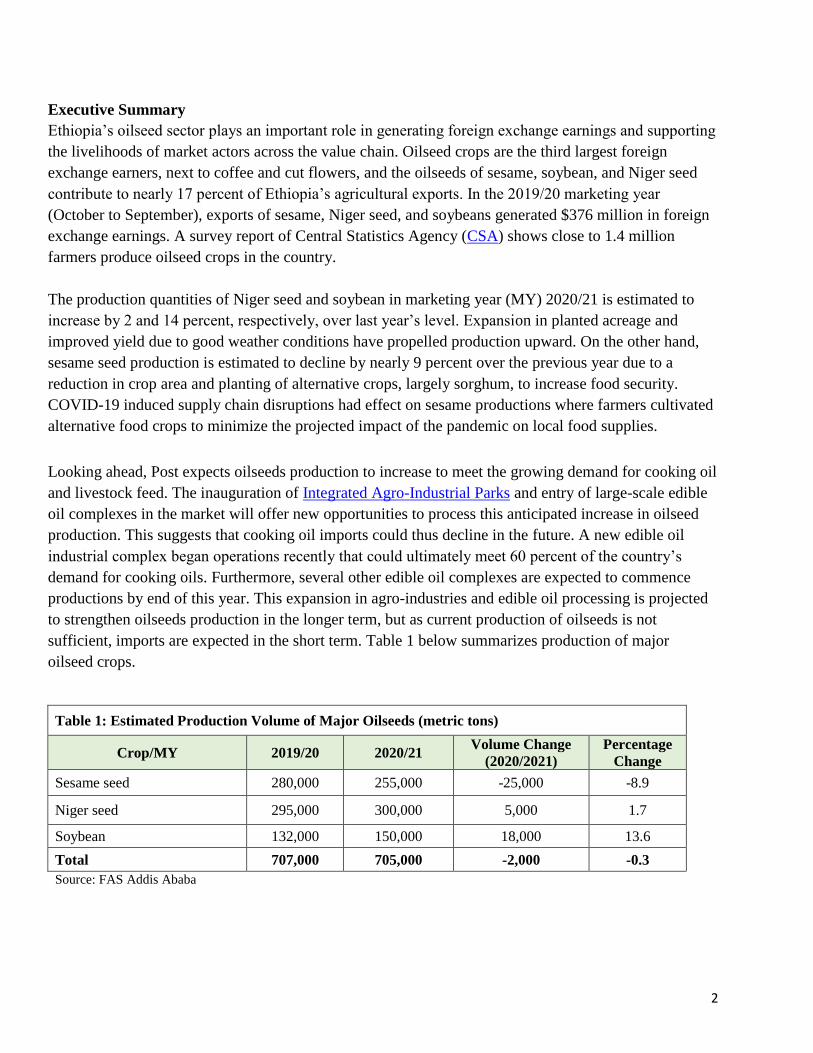
Table 1: Estimated Production Volume of Major Oilseeds (metric tons)
Crop/MY 2019/20 2020/21 Volume Change
(2020/2021)
Percentage
Change
Sesame seed 280,000 255,000 -25,000 -8.9
Niger seed 295,000 300,000 5,000 1.7
Soybean 132,000 150,000 18,000 13.6
Total 707,000 705,000 -2,000 -0.3
Source: FAS Addis Ababa
3
Sesame Seed
Production
Sesame seed production in MY 2020/21(October-September) is projected at 255,000 metric tons (MT),
which declined by 25,000 MT over the previous year’s estimate and is mainly attributable to reduction
in acreage. Total area for sesame production is estimated at 520,000 hectares (HA), down by 13 percent
compared to the prior year. The contraction in sesame acreages is driven by shifts in production of
alternative food crops, namely sorghum. During 2020/21 crop year, sesame farmers in major growing
regions have switched to planting sorghum. The impact of COVID-19 pandemic on supply chain
disruptions and weakening food supplies contributed significantly to the shift in productions. Ethiopia
held a national campaign calling for farmers to focus on planting food crops to address anticipated food
security challenges posed by the pandemic, and many sesame farmers in the states of Amhara and
Tigray switched to sorghum cultivation to minimize the pandemic’s effect on local food supplies.
Some farmers have also planted alternative crops such as soybeans and sunflower seeds in expectation
of better price returns. That sesame production costs have steadily increased over the past years with a
decline in yield have pushed some producers to explore cultivating other oilseed crops with better profit
margins. Although pest and disease did not affect sesame productions, conflicts erupted in Tigray while
tensions along the Sudanese border during the harvest season affected logistics and supply. COVID-19
and military conflicts in the sesame growing regions affected the mobilization of casual laborers.1
Post revised production estimate for MY 2019/20 down to 280,000 MT to reflect actual export figures.
In addition, the revised production figure has taken into account adjustments on beginning and ending
stock levels.
Looking forward, sesame seed production in MY 2021/22 will likely trend downward due to persistent
conflict and border tension near major growing areas. Farmers may also cut sesame seed planting for
next year’s crop and continue transitioning to alternative crops including sorghum, mung beans,
soybeans, and sunflower seeds. With an improved security situation, the reduction in sesame seed
plantings could be offset by expanding commercial productions in regions such as Oromia, Benshangul-
Gumuz, Southern Nations, Nationalities, and People (SNNP), and Somali.
Sesame seed is one of the most widely produced oilseed crop, representing 30 percent of Ethiopia’s
oilseed production. Production is mainly concentrated in the northern and northwestern Ethiopia,
bordering Sudan and Eritrea. According to the Ministry of Trade and Industry (MOTI), 44 percent of the
national sesame seed production comes from Amhara, followed by Tigray (31 percent), and Oromia (13
percent); the regions of Benshangul-Gumuz, SNNP, and Gambela account, respectively, for 9, 2, and 1
percent of total production.
1 Sesame seed farming attracts about 500,000 seasonal laborers at all stages of production, from land preparation to harvest
collection.

4
Although Ethiopia is one of the major global producers and exporters of sesame seed, the country faces
a growing challenge to both supply and demand. On the one hand are the supply pressures of
diminishing productivity levels, pests, disease, lack of easy access to modern technology, and rising
production costs while on the other (demand side) are easy entry for new traders, market distortion,
international price instability, highly concentrated export market, and strong competition abroad. These
constraints threaten Ethiopia’s sesame seed growth potential and unless farmers, traders, and the
government strategically address these challenges, the country could decline in its longer-term
competitive position.
Consumption
MY 2020/21 consumption is projected at 57,000 MT, down 4,000 MT over the previous year. Current
domestic consumption is small as compared to production, and consumption is expected to rise in the
future thanks to local and international demand.
Domestic demand for sesame, especially in local food processing industry is projected to grow as new
integrated agro-industries and edible oil industrial facilities open. Sesame hulling, roasting, and further
processing and production of various value-added products is set to expand in the agro-industrial parks.
This said, the rising popularity of sesame seeds as an important ingredient in various cuisines and
application in the pharmaceutical and medical industry will drive up global demand for it. This
international trend should continue due to increasing health consciousness, growing number of vegans,
and burgeoning demand for specialty foods like tahini, hummus, halva, and etc. Growth of other niche
segments that produce sesame-based foods is also expected to increase demand in the future.
Trade
Sesame seed exports are forecast to reach 213,000 MT in MY 2020/21, declining slightly by 1,000 MT
from the previous year’s actual figure. This decrease in exports is due to the estimated contraction in
production and anticipated growth in the local processing industry.
Ethiopia is one of the key players in the global market for sesame seed and remains a major exporter.
However, annual export volume has been falling at cumulative average growth rate (CAGR) of 8.1
percent over the past decade. Industry experts mention that international price volatility, currency
fluctuations, excessive speculations, distortion of local market price, illicit trade, and squeezed
productivity levels are the main reasons for the deteriorating export trade performance during the
previous years. The distortion of local market price was particularly evident from the significant price
disparity between export prices and local trading prices at ECX. Local prices were considerably above
international market prices over the past several years, and it has been common among some Ethiopian
exporters to sell oilseeds and other agricultural export commodities at a loss margins and then to
compensate by importing other products that may be sold locally with a higher profit margin.

5
Local price distortions have been tempered since the implementation of a directive by the Ministry of
Trade and Industry (MOTI) that enforces registration and execution of export contracts. During MY
2018/19, monthly average price of sesame seed at the ECX market was higher than export prices by
$176 per MT. After the directive came into effect, local price distortions reversed and prices stabilized.
In MY 2019/20, the monthly average export prices soared above local prices by $210 per metric ton.
This positive price pattern was repeated in MY 2020/21 when monthly average export prices (October
2020 to February 2021) exceeded local prices by $115 per MT. In February 2021, for instance, average
export price of sesame seed was $1,490 per MT, whereas trading price at ECX market was $1,334 per
MT.
In February 2021, monthly average price of Whitish Humera/Gondar sesame seed on the ECX trading
floor stood at $1,371 per MT compared to $1,324 per MT in February 2020. Prices of Whitish
Humera/Gondar sesame contracts in February 2021 showed an increase of $47 per MT (4 percent) over
the same period last year. The Whitish Humera/Gondar sesame seed contracts serves as reference price
for international markets. Similarly, the local trading price for Whitish Wellega type sesame seed at the
ECX increased by 6 percent when prices soared to $1,308 from $1,237 per MT during same period.
Conversely, the season’s average export price and local trading price of sesame during MY
2020/21(Oct-Feb) was down by 6.5 and 2.3 percent, respectively, compared to the previous season.
Figures 1, 2, and 3 capture ECX market price, export price, and monthly-traded volume trends during
the current and past MY.
Israel has maintained its position as the top export destination for Ethiopian sesame seed, followed by
the United Arab Emirates (UAE), and Singapore.2 Israel accounted for around 27 percent of the total
exported volume while the UAE and Singapore respectively seized a 26 and 10 percent market share,
respectively. China and Vietnam – the fourth and fifth largest destinations – accounted for 10 and 9
percent, respectively. Except for the UAE and Singapore, the major traditional buyers of Ethiopian
sesame seed (such as China, Turkey, and Saudi Arabia) have reduced imports during MY 2020/21. This
could be likely stem from COVID-19 economic restrictions and competition from other suppliers like
Sudan.
China remains the leading market for imported sesame seed globally. China’s import demand is
estimated at 1.2 million MT per year, which satisfies about 75 percent of its demand; the balance is
filled with local production. China has historically been the top destination for Ethiopian sesame seed
exports, although this tendency is changing as China diversifies its imports and turns to other African
markets and Ethiopia’s exports have been declining steadily over the last four years—a trend likely to
continue.
2 Trade Data Monitor, which derives Ethiopia’s official trade statistics from the Ethiopian Customs Commission.

6
Stocks
MY 2020/21 total ending stocks are estimated at 20,000 MT and Post has revised beginning and ending
inventory levels of the previous MY to reflect actual export figures. Out of the total ending inventory
levels, the largest volume is expected to be kept at exporters’ warehouse. And, the balance is anticipated
at producers’ and local suppliers’ warehouses.
Policy
In MY 2019/20, MOTI passed a directive to enhance export performance and to create a healthy and
competitive market. This directive enforces registration and execution of export product contracts while
also strictly regulating trading prices, product quality, and the administration of export sales contracts.
Registration of export sales contracts is required for all export commodities traded at ECX, including
sesame seed. In addition, the directive implements price controls to tackle local price distortion and local
traders may be penalized if they are caught exporting commodities below domestic price levels and
default on their export sales contracts. Ethiopia has approved a tax reform policy that provides access to
duty-free imports of agricultural machinery and farm equipment to improve agricultural mechanization
and commercial farming.
Table 2: Annual Trend of Ethiopia’s Sesame seed Exports, MY 2010-2021 (October-
September)
Marketing
Year
Volume
(MT)
Value
(in thousands USD)
Volume Change (Year-to-Year)
Absolute Percentage
2010/11 317,071 230,332 - -
2011/12 406,741 307,911 89,670 28.3
2012/13 238,549 428,820 (168,192) -41.4
2013/14 264,060 608,371 25,511 10.7
2014/15 318,195 509,505 54,135 20.5
2015/16 414,777 447,753 96,582 30.4
2016/17 279,347 307,918 (135,430) -32.7
2017/18 275,021 367,072 (4,326) -1.5
2018/19 215,190 347,252 (59,831) -21.8
2019/20 213,905 320,197 (1,285) -0.6
2020/21* 213,000 - (905) -0.4
Sources: Trade Data Monitor and FAS Addis Ababa
Notes: Export volume for 2020/21 is an estimated figure.
7
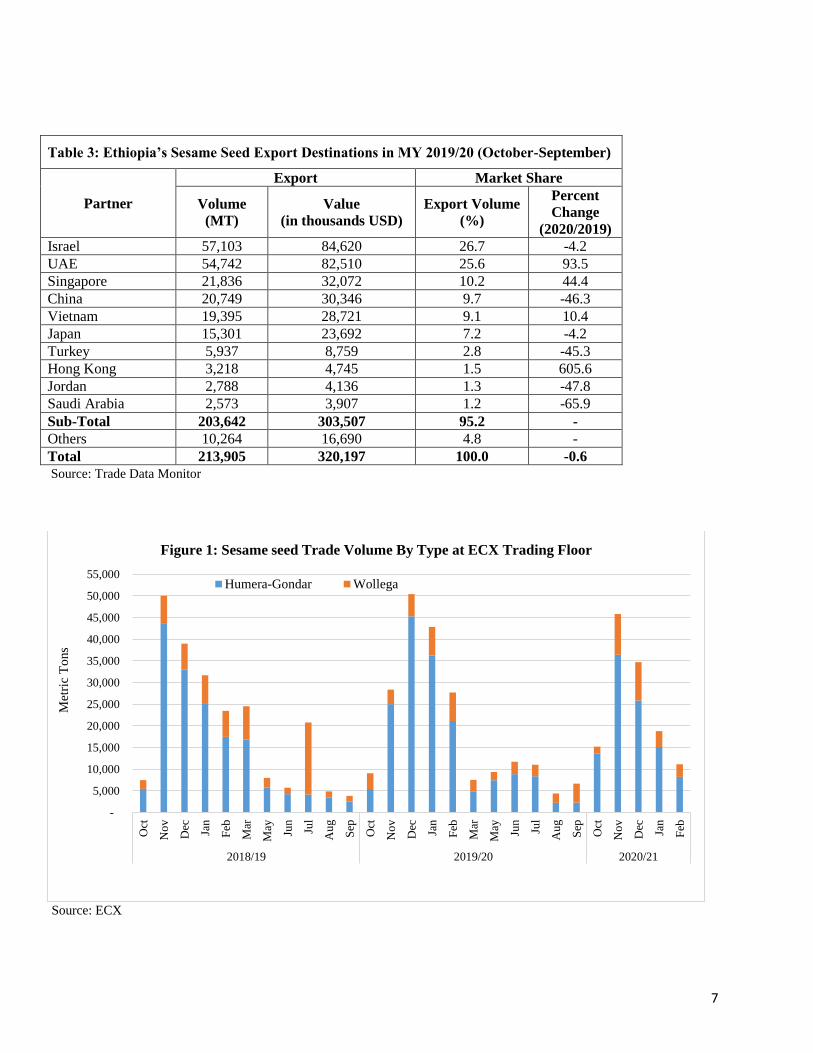
Table 3: Ethiopia’s Sesame Seed Export Destinations in MY 2019/20 (October-September)
Partner
Export Market Share
Volume
(MT)
Value
(in thousands USD)
Export Volume
(%)
Percent
Change
(2020/2019)
Israel 57,103 84,620 26.7 -4.2
UAE 54,742 82,510 25.6 93.5
Singapore 21,836 32,072 10.2 44.4
China 20,749 30,346 9.7 -46.3
Vietnam 19,395 28,721 9.1 10.4
Japan 15,301 23,692 7.2 -4.2
Turkey 5,937 8,759 2.8 -45.3
Hong Kong 3,218 4,745 1.5 605.6
Jordan 2,788 4,136 1.3 -47.8
Saudi Arabia 2,573 3,907 1.2 -65.9
Sub-Total 203,642 303,507 95.2 -
Others 10,264 16,690 4.8 -
Total 213,905 320,197 100.0 -0.6
Source: Trade Data Monitor
Source: ECX
-
5,000
10,000
15,000
20,000
25,000
30,000
35,000
40,000
45,000
50,000
55,000
Oct
No
v
Dec Jan
Feb
Mar
May Jun
Jul
Au
g
Sep
Oct
No
v
Dec Jan
Feb
Mar
May Jun
Jul
Au
g
Sep
Oct
No
v
Dec Jan
Feb
2018/19 2019/20 2020/21
Met
ric
To
ns
Figure 1: Sesame seed Trade Volume By Type at ECX Trading Floor
Humera-Gondar Wollega

8
Source: ECX. (Price is converted to US $ based on prevailing exchange rates)
Sources: ECX and Trade Data Monitor
500
750
1000
1250
1500
1750
2000
2250
2500
Oct
No
v
Dec Jan
Feb
Mar
Ap
r
May Jun
Jul
Au
g
Sep
Oct
No
v
Dec Jan
Feb
Mar
Ap
ril
May Jun
Jul
Au
g
Sep
Oct
No
v
Dec Jan
Feb
2018/19 2019/20 2020/21
US
D/M
T
Figure 2: Sesame Seed Trading Price (USD per MT): Export vs ECX Market
ECX Price Export Price
2015/16 2016/17 2017/18 2018/19 2019/20
ECX Trade 420,030 269,826 273,500 226,521 210,237
Export Trade 414,777 279,347 275,021 215,190 213,905
-
50,000
100,000
150,000
200,000
250,000
300,000
350,000
400,000
450,000
Met
ric
To
ns
Figure 3: Sesame seed Export vs ECX Trade Volume (MT) by Marketing Year

9
Source: Trade Data Monitor
Table 4: Production, Supply, and Distribution (1000 HA, 1000 MT)
Oilseed, Sesame seed 2018/19 2019/20 2020/21
Market Year Begins October October October
Ethiopia New Post New Post New Post
Area Harvested 600 600 520
Beginning Stocks 35 30 35
Production 260 280 255
MY Imports 0 0 0
MY Imports from the United States 0 0 0
Total Supply 295 310 290
MY Exports 215 214 213
Crush 2 4 4
Food Use Domestic Consumption 10 16 16
Feed Waste Domestic Consumption 38 41 37
Total Domestic Consumption 50 61 57
Ending Stocks 30 35 20
Total Distribution 295 310 290 Source: FAS Addis Ababa Estimate
-
5,000
10,000
15,000
20,000
25,000
30,000
35,000
40,000
45,000
50,000
55,000
60,000
65,000
Oct Nov Dec Jan Feb Mar Apr May Jun Jul Aug Sep
Met
ric
To
ns
Figure 4: Sesame Seed Monthly Export Volume Trends by Marketing Year
2016/17 2017/18 2018/19 2019/20

10
Niger Seed
Production
Production of Niger seed in MY 2020/21 is forecast at 300,000 MT, which is up slightly by 5,000 MT
over last year’s revised figure. This estimate assumes improved yields due to good weather conditions
and increase in area harvested. Over the last several years, Niger seed production has shown steady
growth, most of which is driven by increases in area harvested as farmers respond to the rising price of
Niger seed-based cooking oil and other derived products such as animal feed. Recently, this important
oilseed has been added to the list of ECX traded commodities, which is expected to create improved
market incentives for farmers to expand production of the seed in the years to come.
Niger seed, also known as noug, is the second most produced oilseed in Ethiopia, accounting for a little
more than one-fourth of oilseed production. Close to 800,000 small-scale farmers produce Niger seed
and more than 95 percent of production is concentrated in the highlands of Oromia and Amhara.
Ethiopia, India, and Myanmar are the largest producers of Niger seed in the world.
Consumption
MY 2020/21 consumption is projected to reach 288,000 MT, up roughly by 10,000 MT from the
preceding year due to increased domestic demand for cooking oil. Consumption is expected to keep
growing in the coming years as demand for cooking oil and livestock feed continue to grow. Expansion
of edible oil processing facilities and new integrated agro-industrial parks are anticipated to spur demand
for Niger seed. The agro-industrial parks are expected to utilize Niger seeds as a raw material for
cooking oil productions and other by-products such as Niger seed cake for animal feed.3Recently, a new
edible oil industrial facility has been inaugurated in Bure Integrated Agro-Industrial Park and has a
capacity to produce 60 percent of the country’s demand for cooking oils. In addition, there are a couple
of other privately owned large-scale edible oil factories under construction that are anticipated to go
operational in the next couple of years. Together, the large factories should produce cooking oil that
would satisfy Ethiopia’s demand and to substitute imports with local productions.
3 The by-product from Niger seed oil extraction can be used for livestock feed, especially in animal fattening and
dairy rations.
11
Trade
Export of Niger seed in MY 2020/21 is forecasted at 12,000 MT, which remains unchanged from the
previous year’s actual figures. Export volumes have contracted a little more than by half due to increase
in local market price. The surge in local prices of Niger seed has resulted in squeezed export margins,
which discouraged traders to export the crop. Some traders are opting for exporting other oilseeds (such
as groundnuts) with relatively better price margins. Besides, the volatile security situation in major
growing areas (especially in the zones of East and West Wellega) has affected Niger seed trade in the
past couple of years.
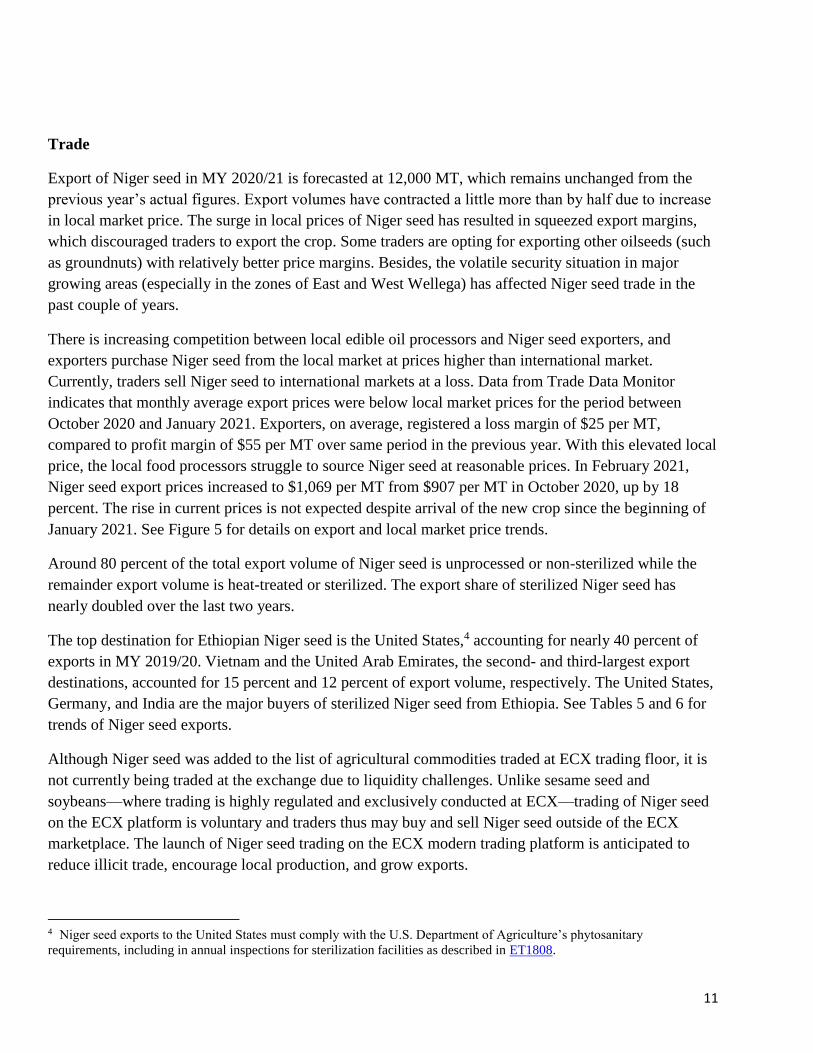
There is increasing competition between local edible oil processors and Niger seed exporters, and
exporters purchase Niger seed from the local market at prices higher than international market.
Currently, traders sell Niger seed to international markets at a loss. Data from Trade Data Monitor
indicates that monthly average export prices were below local market prices for the period between
October 2020 and January 2021. Exporters, on average, registered a loss margin of $25 per MT,
compared to profit margin of $55 per MT over same period in the previous year. With this elevated local
price, the local food processors struggle to source Niger seed at reasonable prices. In February 2021,
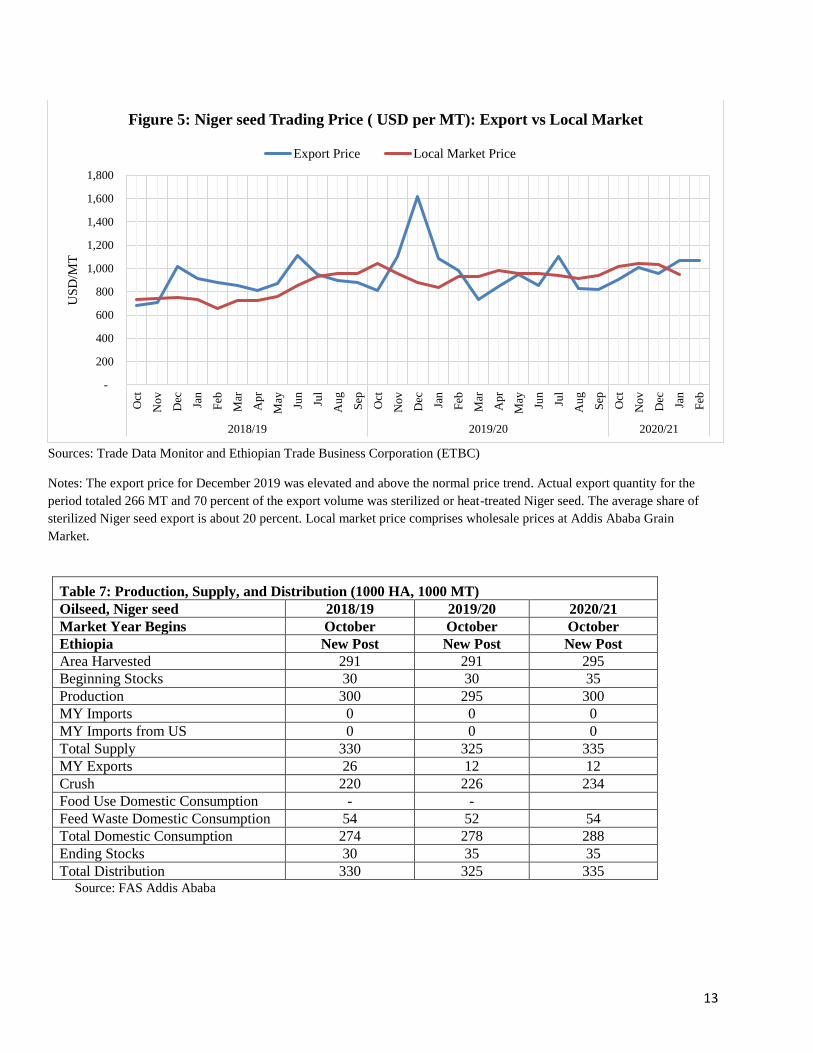
Niger seed export prices increased to $1,069 per MT from $907 per MT in October 2020, up by 18
percent. The rise in current prices is not expected despite arrival of the new crop since the beginning of
January 2021. See Figure 5 for details on export and local market price trends.
Around 80 percent of the total export volume of Niger seed is unprocessed or non-sterilized while the
remainder export volume is heat-treated or sterilized. The export share of sterilized Niger seed has
nearly doubled over the last two years.
The top destination for Ethiopian Niger seed is the United States,4 accounting for nearly 40 percent of
exports in MY 2019/20. Vietnam and the United Arab Emirates, the second- and third-largest export
destinations, accounted for 15 percent and 12 percent of export volume, respectively. The United States,
Germany, and India are the major buyers of sterilized Niger seed from Ethiopia. See Tables 5 and 6 for
trends of Niger seed exports.
Although Niger seed was added to the list of agricultural commodities traded at ECX trading floor, it is
not currently being traded at the exchange due to liquidity challenges. Unlike sesame seed and
soybeans—where trading is highly regulated and exclusively conducted at ECX—trading of Niger seed
on the ECX platform is voluntary and traders thus may buy and sell Niger seed outside of the ECX
marketplace. The launch of Niger seed trading on the ECX modern trading platform is anticipated to
reduce illicit trade, encourage local production, and grow exports.
4 Niger seed exports to the United States must comply with the U.S. Department of Agriculture’s phytosanitary
requirements, including in annual inspections for sterilization facilities as described in ET1808.

12
Table 5: Annual Trend of Ethiopia’s Niger seed Exports, 2010-2021 (October-September)
Marketing Year Volume (MT)
Value
(in thousands USD)
Volume Change (Year-to-Year)
Absolute Percentage
2010/11 18,797 25,413 - -
2011/12 21,429 27,182 2,632 14.0
2012/13 32,428 40,389 10,999 51.3
2013/14 22,292 28,106 (10,136) -31.3
2014/15 24,273 24,699 1,981 8.9
2015/16 46,480 44,959 22,207 91.5
2016/17 32,572 29,237 (13,908) -29.9
2017/18 30,077 22,148 (2,495) -7.7
2018/19 25,596 22,122 (4,481) -14.9
2019/20 12,057 10,927 (13,539) -52.9
2020/21* 12,000 - (57) -0.5
Sources: Trade Data Monitor and FAS Addis Ababa
Notes: Export volume for MY2020/21 is an estimated figure.
Table 6: Ethiopia’s Niger seed Export Destinations in 2019/20 (October-September)
Partner
Export Market Share
Volume
(MT)
Value
(in thousands USD)
Export
Volume (%)
% Change
(2020/2019)
United States 4,634 4,130 38.4 -59.6
Vietnam 1,792 1,261 14.9 -30.4
United Arab Emirates 1,384 1,058 11.5 -8.2
Germany 986 853 8.2 -46.7
China 720 484 6 -71.5
Jordan 422 650 3.5 -47.1
Hong Kong 360 346 3 -
Algeria 285 458 2.4 -25.0
Yemen 278 439 2.3 -65.3
India 236 158 2 -61.5
Sub-Total 11,097 9,879 92 -50.7
Other 960 1,047 8 -68.7
Total 12,057 10,927 100 -52.9 Source: Trade Data Monitor
13
Sources: Trade Data Monitor and Ethiopian Trade Business Corporation (ETBC)
Notes: The export price for December 2019 was elevated and above the normal price trend. Actual export quantity for the
period totaled 266 MT and 70 percent of the export volume was sterilized or heat-treated Niger seed. The average share of
sterilized Niger seed export is about 20 percent. Local market price comprises wholesale prices at Addis Ababa Grain
Market.
Table 7: Production, Supply, and Distribution (1000 HA, 1000 MT)
Oilseed, Niger seed 2018/19 2019/20 2020/21
Market Year Begins October October October
Ethiopia New Post New Post New Post
Area Harvested 291 291 295
Beginning Stocks 30 30 35
Production 300 295 300
MY Imports 0 0 0
MY Imports from US 0 0 0
Total Supply 330 325 335
MY Exports 26 12 12
Crush 220 226 234
Food Use Domestic Consumption - -
Feed Waste Domestic Consumption 54 52 54
Total Domestic Consumption 274 278 288
Ending Stocks 30 35 35
Total Distribution 330 325 335 Source: FAS Addis Ababa
-
200
400
600
800
1,000
1,200
1,400
1,600
1,800
Oct
No
v
Dec Jan
Feb
Mar
Ap
r
May Jun
Jul
Au
g
Sep
Oct
No
v
Dec Jan
Feb
Mar
Ap
r
May Jun
Jul
Au
g
Sep
Oct
No
v
Dec Jan
Feb
2018/19 2019/20 2020/21
US
D/M
T
Figure 5: Niger seed Trading Price ( USD per MT): Export vs Local Market
Export Price Local Market Price
14
Soybeans
Production
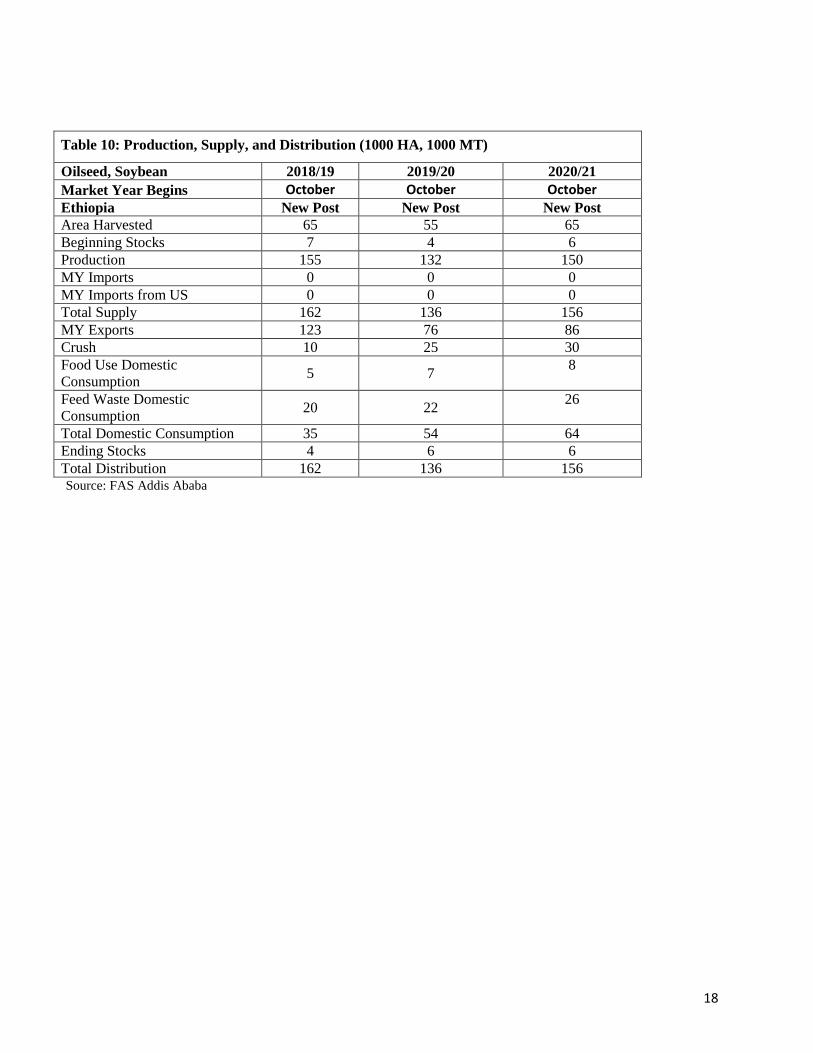
Soybean production in MY 2020/21 (October to September) is estimated at 150,000 MT, up 18,000 MT
in response to growing local demand for cooking oil, soy-based foods, and livestock feed. Industry
contacts confirm that production has expanded in new growing areas, particularly in Amhara and
Benshangul-Gumuz. Future production is expected to continue its upward climb to respond to rising
consumer demand.
Soybean production has been rapidly increasing over the last two decades. Most of this growth in
production was due to an expansion in the area planted, especially from the limited number of
commercial farms. About half of total soybean production is believed to come from these bigger
commercial operations, some of which are rotating or intercropping soybeans with other crops. National
research and soybean breeding programs, extension supports, improved local varieties, and better yields
also contributed to the production increases.
Soybeans contribute nearly 18 percent to the country’s total oilseed production and account for only six
percent of area planted to oilseeds. According to Central Statistics Agency (CSA) survey report, there
are nearly 209,000 farmers producing soybeans on a small scale. The main soybean-producing areas are
in the western part of the country in Oromia, Benishangul-Gumuz, and Amhara.
Consumption
Soybean consumption in MY 2020/21 is projected to reach 64,000 MT and expected to continue its
upward climb as consumers demand more soy-based edible oil and as the poultry sector demands more
soybean meal. Expansion of integrated ago-processing industrial parks and the launch of new edible oil
manufacturing plants will also expand soybean demand. In addition to oil, soybeans are used to make a
variety of local foods, as well as corn-soy blend for emergency food assistance programs.
Trade
MY 2020/21 soybean exports are forecasts at 86,000 MT, up by 10,000 MT from the previous year’s
export levels. Exports are projected to grow but could still face stiff competition from the local food
processing industry, which has witnessed a rising demand for soybeans.
India is the largest destination market for Ethiopia’s soybean exports, accounting for about 52 percent of
the total exports in MY 2019/20. Vietnam, Turkey, and China are the next important destinations, with
respective market share of 13, 10, and 7 percent of total exports. During the previous marketing season,
China bought 5,000 MT of Ethiopian origin soybeans valued at $2.5 million. In MY 2019/20, Chinese
import demand for Ethiopian soybeans rebounded after imports slumped in MY 2018/19. A record level
of 23,000 MT of soybeans was shipped to China during MY 2017/18, following the U.S.-China tariff
retaliatory actions.

15
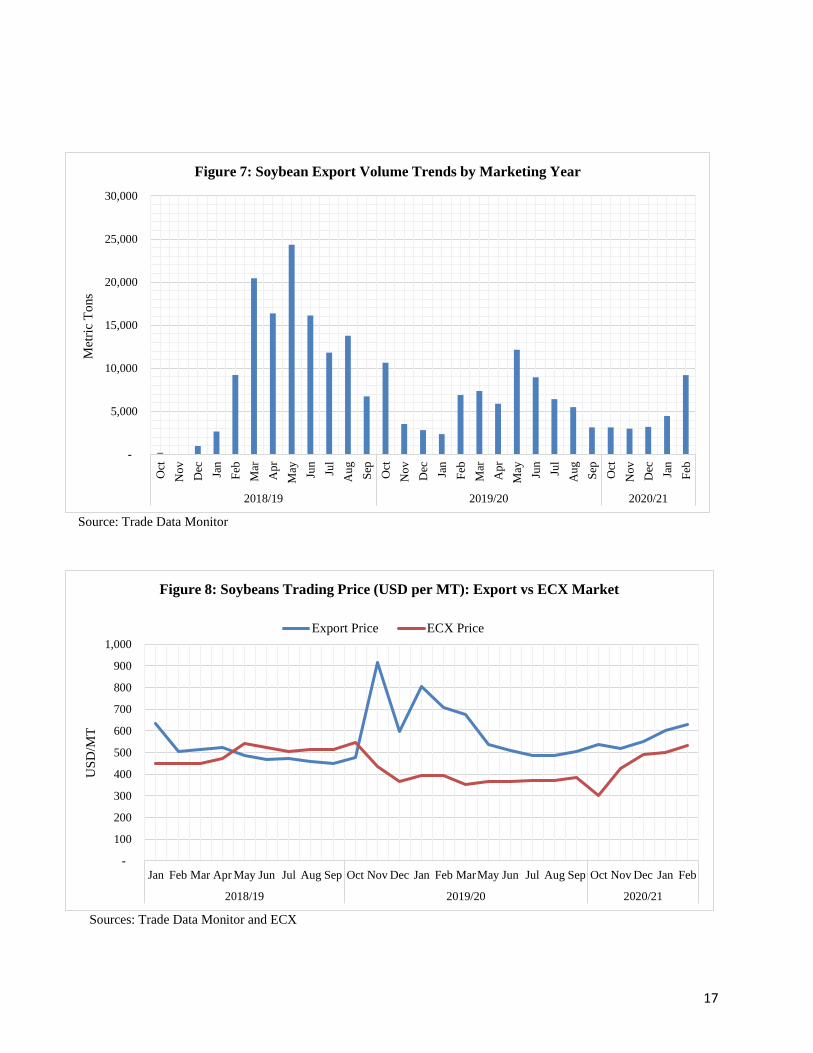
In February 2021, soybeans export prices (FoB Djibouti) averaged $630 per MT while local trading
price stood at $531 per MT. Due to A surge in demand, soybean export prices and local trading prices at
ECX have climbed by 18 and 76 percent, respectively, since the start of the current marketing year in
October 2021.
As of October 2019, the MOTI directive on registration and administration of export contracts went into
effect. Since then, the directive has enabled soybeans price at ECX market to stabilize and go below
export price. For instance, between October 2020 and February 2021, soybean export prices were above
ECX market prices by $116 per MT, on average. Local prices are expected to continue an upward swing
owing to strong demand for the beans in domestic and overseas markets. See Table 8 and 9 and Figures
6 through 8 for details on the performance of the soybeans trade.
MOTI regulations require soybean trading to be conducted through the ECX, and trading at the ECX
officially started in January 2019. Recently, local food processors have a special window to purchase
soybeans for local processing. This regulation is expected to drive up local production, streamline
trading, and improve exports.
Table 8: Annual Trend of Ethiopia’s Soybean Exports by Marketing Year (October-September)
Marketing
Year
Volume
(MT)
Value
(in thousands USD)
Volume Change (Year-to-Year)
Absolute Percentage
2010/11 1,380 656 - -
2011/12 2,569 1,570 1,189 86.2
2012/13 33,839 18,831 31,270 1217.2
2013/14 36,630 20,473 2,791 8.2
2014/15 28,517 13,177 (8,113) -22.1
2015/16 74,555 31,606 46,038 161.4
2016/17 41,234 17,750 (33,321) -44.7
2017/18 88,803 41,477 47,569 115.4
2018/19 122,642 61,101 33,839 38.1
2019/20 75,670 44,881 (46,972) -38.3
2020/21* 86,000 - 10,330 13.7 Sources: TDM and FAS Addis Ababa
Notes: Export volume for MY2020/21 is an estimated figure.

16
Table 9: Ethiopia's Soybean Export Destinations in 2019/20 (October-September)
Partner
Export Market Share
Volume
(MT)
Value
(in thousands USD)
Export
Volume (%)
% Change
(2020/2019)
India 39,228 18,936 51.8 -62.2
Vietnam 9,769 4,799 12.9 2,306.1
Turkey 7,330 3,788 9.7 262.1
China 4,998 2,475 6.6 351.9
Singapore 4,823 5,223 6.4 434.7
Israel 3,270 4,935 4.3 274.1
United Arab
Emirates 2,156 2,358 2.9 -28.7
Canada 1,412 671 1.9 0.0
Spain 660 341 0.9 -87.5
United States 660 325 0.9 0.0
Sub-Total 74,306 43,851 98.0 3,451.0
Other 1,364 1,030 2.0 -3,489.0
Total 75,670 44,881 100.0 -38.3 Source: Trade Data Monitor
Source: ECX
-
5,000
10,000
15,000
20,000
25,000
30,000
Jan
Feb
Mar
Ap
r
May Jun
Jul
Au
g
Sep
Oct
No
v
Dec Jan
Feb
Mar
Ap
r
May Jun
Jul
Au
g
Sep
Oct
No
v
Dec Jan
Feb
2018/19 2019/20 2020/21
Met
ric
To
ns
Figure 6: Soybeans Traded Volume at ECX by Marketing Year
17
Source: Trade Data Monitor
Sources: Trade Data Monitor and ECX
-
5,000
10,000
15,000
20,000
25,000
30,000
Oct
No
v
Dec Jan
Feb
Mar
Ap
r
May Jun
Jul
Au
g
Sep
Oct
No
v
Dec Jan
Feb
Mar
Ap
r
May Jun
Jul
Au
g
Sep
Oct
No
v
Dec Jan
Feb
2018/19 2019/20 2020/21
Met
ric
To
ns
Figure 7: Soybean Export Volume Trends by Marketing Year
-
100
200
300
400
500
600
700
800
900
1,000
Jan Feb Mar Apr May Jun Jul Aug Sep Oct Nov Dec Jan Feb MarMay Jun Jul Aug Sep Oct Nov Dec Jan Feb
2018/19 2019/20 2020/21
US
D/M
T
Figure 8: Soybeans Trading Price (USD per MT): Export vs ECX Market
Export Price ECX Price
18
Table 10: Production, Supply, and Distribution (1000 HA, 1000 MT)
Oilseed, Soybean 2018/19 2019/20 2020/21
Market Year Begins October October October Ethiopia New Post New Post New Post
Area Harvested 65 55 65
Beginning Stocks 7 4 6
Production 155 132 150
MY Imports 0 0 0
MY Imports from US 0 0 0
Total Supply 162 136 156
MY Exports 123 76 86
Crush 10 25 30
Food Use Domestic
Consumption 5 7
8
Feed Waste Domestic
Consumption 20 22
26
Total Domestic Consumption 35 54 64
Ending Stocks 4 6 6
Total Distribution 162 136 156 Source: FAS Addis Ababa

19
Oils
Production
Local production of edible oils in fiscal year 2020/21 (July to June) is forecast at 63,000 MT. Niger
seed, cottonseed, soybeans, and sunflower seeds are used mainly to locally produce cooking oils. The
remainder is made up of rapeseed, linseed, and groundnuts. In February 2021, Phibella Industrial
Complex, Ethiopia’s largest edible oil facility, begun production of refined palm oil. This giant edible
oil plant now has capacity to produce 1,500 MT of cooking oil per day and at full production should
cover 60 percent of Ethiopia’s demand for cooking oil. The 30-HA industrial complex has huge
processing facilities for palm oil refining, sesame seed processing, and margarine and vegetable oil
production, among others.
In addition to the recently inaugurated edible oil complex, there are a couple of other large-scale edible
oil plants under construction. When all of these edible oil factories become operational in a few years,
the country is likely to substitute cooking oil imports more and more with local production and in the
long-term, it should drive increased production of oilseeds locally (soybeans, sunflower, sesame seed,
and Niger seed). In the short-term, however, local production of oilseeds cannot meet raw materials
demand for the local food processing industry, and local production of edible oils thus has a tremendous
growth potential. In fact, it is projected to expand rapidly in the coming years as the population grows
and consumer income rises.
Consumption
Total edible oil consumption in fiscal year 2020/21 (July to June) is projected at 630,000 MT, of which
90 percent is imported. Most of the oil consumed is palm oil, followed by sunflower oil and locally
produced Niger seed oil. Small amounts of soybean, linseed, groundnut, and cottonseed oils are also
consumed. With increasing demand, limited domestic production and the country’s heavy reliance on
imported oil, there have been supply shortages especially in urban areas. In addition, as some consumers
become increasingly diet conscious, they are looking for healthier alternatives to palm oil. There is an
increasing preference towards alternative edible oils containing non-saturated oils and fats. Most
Ethiopian consumers prefer sunflower, Niger seed, and soybean oils as healthier alternatives, and due to
these changes in consumer preferences, consumption of sunflower oil has almost tripled over the last
couple of years; palm oil has dropped considerably.
Trade
Imports of edible oil have been rapidly increasing with an average annual growth rate of a little more
than 10 percent for the period covering 2014 to 2018. Post expects imports to gradually decline with the

20
expansion of local productions by new edible oil complexes. In fiscal year 2019/20 (July to June),
Ethiopia imported palm oil, sunflower oil, and soybeans oil valued at nearly $283 million. Of this
imported edible oil, about 71 percent by value was palm oil, followed by sunflower oil (27 percent) and
soybean oil (1 percent).
Ethiopia imports palm oil mostly from Indonesia (48 percent) and Malaysia (36 percent). On the other
hand, the largest suppliers of sunflower oil to the Ethiopian market are Turkey (58 percent) and Ukraine
(21%) while the leading suppliers of soybean oil are Ukraine and China (market shares of 33 and 26
percent, respectively). See Tables 11, 12, and 13 below for breakdown of oil imports by value, volume,
and country of origin.
Policy
Ethiopia subsidizes edible oil imports to make it affordable to the majority of the Ethiopian population.
The edible oil sector is also highly regulated sectors where the country controls price and caps selling
prices at local market. Recently, Ethiopia reduced import duties and taxes to minimize the economic
effects of COVID-19 on consumers and to manage food price inflation, and a five percent tariff is
currently in effect for edible oil imports. The country is encouraging investment in the edible oil-
manufacturing sector to expand productions and substitute imports with local production. And since last
year, Ethiopia has permitted local and foreign companies to import and supply food commodities,
including edible oils, to the local market using the companies’ hard currencies.
Table 11: Annual Edible Oil Import Volume (MT): July to June
HS
Code Commodity 2013/14 2014/15 2015/16 2016/17 2017/18 2018/19 2019/20
1511
Palm oil
348,561
409,711
466,806
446,620
488,824
513,027
322,659
1512
Sunflower oil
3,426
5,125
10,605
25,435
50,571
53,838
74,822
1507
Soybean oil
2,647
3,327
9,161
5,303
5,155
3,343
5,593
Total
356,648
420,178
488,588
479,375
546,568
572,227
405,094 Source: Trade Data Monitor
Notes: Annual import figures are based on Ethiopian fiscal year starting in July and ending in June.

21
Table 12: Annual Edible Oil Import Value (in thousands USD), July to June
HS
Code Commodity 2013/14 2014/15 2015/16 2016/17 2017/18 2018/19 2019/20
1511
Palm oil
374,517
413,097
429,081
434,563
476,967
399,238
200,015
1512
Sunflower oil
5,862
8,620
16,588
36,939
51,654
52,989
77,779
1507
Soybean oil
4,135
4,529
11,129
6,014
5,616
3,087
3,130
Total
386,528
428,261
458,814
479,533
536,255
457,333
282,944 Source: Trade Data Monitor
Table 13: Ethiopia’s Major Edible Oil Imports by Trading Partner, July 2019- June 2020
Edible Oil Partner Market Share
Value (in millions USD) Percentage
Palm oil
Indonesia 95 47.5%
Malaysia 71 35.5%
Djibouti 29 14.5%
Others 5 2.5%
Total 200 100.0%
Sunflower oil
Turkey 45 57.7%
Ukraine 16 20.5%
Egypt 7 9.0%
Others 10 12.8%
Total 78 100.0%
Soybean oil
Ukraine 1 33.3%
China 0.788 26.3%
Egypt 0.616 20.5%
Others 0.596 19.9%
Total 3 100.0%
Source: Trade Data Monitor
Attachments:
No Attachments.
Related Documents