Threading the Needle Value Creation in a Low-Growth Economy Report The 2010 Value Creators Report

Welcome message from author
This document is posted to help you gain knowledge. Please leave a comment to let me know what you think about it! Share it to your friends and learn new things together.
Transcript
Threading the NeedleValue Creation in a Low-Growth Economy
Report
The 2010 Value Creators Report

The Boston Consulting Group (BCG) is a global manage-ment consulting firm and the world’s leading advisor on business strategy. We partner with clients in all sectors and regions to identify their highest-value opportunities, address their most critical challenges, and transform their businesses. Our customized approach combines deep in sight into the dynamics of companies and markets with close collaboration at all levels of the client organization. This ensures that our clients achieve sustainable compet-itive advantage, build more capable organizations, and secure lasting results. Founded in 1963, BCG is a private company with 69 offices in 40 countries. For more infor-mation, please visit www.bcg.com.

Threading the NeedleValue Creation in a Low-Growth Economy
The 2010 Value Creators Report
bcg.com
Eric Olsen
Frank Plaschke
Daniel Stelter
September 2010

The financial analyses in this report are based on public data and forecasts that have not been verified by BCG and on assump-tions that are subject to uncertainty and change. The analyses are intended only for general comparisons across companies and industries and should not be used to support any individual investment decision.
© The Boston Consulting Group, Inc. 2010. All rights reserved.
For information or permission to reprint, please contact BCG at:E-mail: [email protected]: +1 617 850 3901, attention BCG/PermissionsMail: BCG/Permissions The Boston Consulting Group, Inc. One Beacon Street Boston, MA 02108 USA

Threading the Needle 3
Contents
Executive Summary 4
The Coming Era of Low Growth 6Why Low Growth Is Likely 6Challenges—and Opportunities 8
Value Creation in Low-Growth Environments 12The Declining Importance of Capital Gains 12The Growing Importance of Cash Payout 12The Growth Paradox 15
A Fresh Look at Value Creation Strategy 19Value-Creating Growth 19Balanced Capital Deployment 22Scenario-Based Strategic Planning 24
Ten Questions Every CEO Should Know How to Answer 27
Appendix: The 2010 Value Creators Rankings 28Global Rankings 31Industry Rankings 33
For Further Reading 47
Note to the Reader 48

4 The Boston Consulting Group
Threading the Needle: Value Creation in a Low-Growth Economy is the twelfth annual report in the Value Creators series published by The Boston Consulting Group. Each year, we publish detailed empirical rankings of the
stock-market performance of the world’s top value creators and distill managerial lessons from their success. We also highlight key trends in the global economy and world capital markets and describe how these trends are likely to shape future priorities for value creation. Finally, we share our lat-est analytical tools and client experiences to help companies better manage value creation.
This year’s report addresses the challenges of delivering above-average shareholder returns in a global economy char-acterized by below-average growth.
Although 2009 saw a strong rebound in equity values, global capital markets are still laboring under the shadow of the worldwide financial crisis that began in 2008.
Global market indexes were up roughly 30 percent in ◊ 2009, but the weighted average annual total sharehold-er return (TSR) for this year’s Value Creators database, which covers the five-year period from 2005 through 2009, was 6.6 percent. This is still considerably below the long-term historical average of approximately 10 percent
Market volatility remains high; as of this writing, most ◊ equity indexes are flat for 2010
Despite real signs of economic recovery, macroeco-◊ nomic fundamentals in the developed economies re-main under significant pressure
BCG believes that the world’s developed economies are entering an extended period of below-average growth.
Recessions that are preceded by financial crisis tend to ◊ be followed by significant shortfalls in postrecession GDP, according to a recent report by the International Monetary Fund (IMF)
In recent decades, growth in U.S. GDP has been the en-◊ gine of the global economy; but the high indebtedness of U.S. consumers makes it unlikely that the U.S. econ-omy will be able to continue to play that role—despite unprecedented stimulus spending by the U.S. govern-ment and the Federal Reserve
Although developing economies such as Brazil, China, ◊ and India continue to grow rapidly, they will not be able to pull the Western economies forward (indeed, these economies continue to depend on exports to fuel their rapid growth)
BCG estimates that the average annual GDP growth in ◊ developed economies from 2010 through 2015 will be in the neighborhood of 2.4 percent, with some coun-tries experiencing growth rates as low as 1 percent or even less
A low-growth economy has big implications for how companies create shareholder value.
Lower revenue growth, growing pressure on margins ◊ as companies compete for fewer growth opportunities, and declining valuation multiples (reflecting shifting investor expectations), will make capital gains a rela-tively less important source of TSR
Executive Summary

Threading the Needle 5
As multiples decline, the yield from payouts of free ◊ cash flow will increase, making these direct payments to shareholders in the form of dividends or stock re-purchases a more important source of TSR
This shift means that there will be opportunities for ◊ companies to achieve above-average shareholder re-turns by emphasizing cash payout as the primary source of TSR
The very best performers (those that make our annual ◊ rankings of the top ten value creators by industry) will be companies that find ways to “thread the needle”—that is, to combine increased cash payouts with above-average profitable growth in what is a much tougher and more competitive economic environment
One of the key challenges facing every company will ◊ be how best to deploy its ongoing free cash flow—as well as the substantial cash it has accumulated on its balance sheet as a result of cost cutting during the downturn and subsequent recovery—in order to opti-mize value creation over the long term
This year’s Value Creators report addresses the spe-cial challenges and opportunities for value creation in a low-growth economy.
We begin by making the case that the world’s devel-◊ oped economies face an extended period of below- average growth
Next, we describe the distinctive dynamics of value ◊ creation in a low-growth environment
We then suggest steps companies should take to re-◊ think their approach to growth and capital deployment and to reset their value-creation strategy in response to these new dynamics
We conclude with extensive rankings of the top value ◊ creators worldwide for the five-year period from 2005 through 2009
About the AuthorsEric Olsen is a senior partner and managing director in the Chicago office of The Boston Consulting Group and the firm’s global leader for value creation strategy; you may contact him by e-mail at [email protected]. Frank Plaschke is a partner and managing director in BCG’s Munich office and the firm’s European leader for value creation strategy; you may contact him by e-mail at [email protected]. Daniel Stelter is a senior part-ner and managing director in BCG’s Berlin office and the global leader of the firm’s Corporate Development prac-tice; you may contact him by e-mail at stelter.daniel@ bcg.com.

6 The Boston Consulting Group
A lthough 2009 saw a strong recovery in eq-uity values, global capital markets are still laboring under the shadow of the world-wide financial crisis that began in 2008. Market volatility remains high; as of this
writing, most equity indexes are flat for 2010. And de-spite real signs of economic recovery, macroeconomic fundamentals in the developed economies remain un-der significant pressure—most recently from the sover-eign-debt crisis in European countries such as Greece, Portugal, and Spain.
We don’t know precisely how the recovery will play itself out. But we do feel confident about one prediction: the developed world is entering an extended period of be-low-average growth—with profound implications for how companies create value. That’s why we have devoted this year’s Value Creators report to the theme of value cre-ation in a low-growth economy.
Why Low Growth Is Likely
At first glance, this focus may seem misguided. After all, economic growth in 2010 has been better than most ob-servers had anticipated. Just as we were writing this re-port, the International Monetary Fund (IMF) announced that it was raising its global growth forecast for 2010 to 4.6 percent—up from the 4.2 percent projection it had is-sued in April.1
And yet, the same IMF forecast estimates that growth will slow in the second half of 2010 and will be lower (4.3 per-cent) in 2011. What’s more, it points out that in the world’s developed economies, growth rates in 2011 will average only 2.4 percent—with the growth rate in some,
such as Japan, as low as 1.8 percent. And although emerg-ing markets in Asia and other parts of the developing world will grow much faster (8.5 percent, on average, in 2011), the growth rates in these economies will also slow down compared with their growth rates this year.
There are at least four reasons for believing that the world’s developed economies are likely to experience a period of below-average growth.
The Nature of the “Great Recession.” The downturn that began in late 2008 was a globally synchronized reces-sion brought on by a worldwide financial crisis. History shows that recessions preceded by systemic financial up-heaval tend to be far deeper and longer lasting than oth-er recessions, and the subsequent recovery is slower. In 2009, for instance, the IMF released a study analyzing the medium-term implications of 88 historical financial crises in developed, emerging, and developing countries.2 It found that in the seven years after such a crisis, econo-mies tend to have a significant output gap (that is, a devi-ation of actual output from what one would expect by extrapolating from the precrisis growth trend) of, on aver-age, a negative 10 percent.
Earlier this year, BCG used empirical data from the IMF study to simulate GDP growth rates from 2010 through 2015.3 Our model suggests that while major developing countries such as Brazil, China, and India will soon return
The Coming Era of Low Growth
1. See “I.M.F. Says Growth to Continue, but at Slower Pace,” The New York Times, July 8, 2010.2. See IMF, World Economic Outlook: Sustaining the Recovery, October 2009.3. See Collateral Damage, Part 8: Preparing for a Two-Speed World; Accelerating Out of the Great Recession, BCG White Paper, January 2010.

Threading the Needle 7
to a level of GDP growth that approaches their precrisis growth rates, the more developed economies may see sig-nificantly lower growth for a number of years. Specifical-ly, the simulation shows GDP growth rates of less than 2 percent per year for the United States, Europe, and Japan, leading to an overall output gap ranging from a negative 8.7 percent (France) to a negative 16.7 percent (United Kingdom). (See Exhibit 1.)
The Indebtedness of U.S. Consumers. In the two decades preceding the downturn, median inflation-ad-justed U.S. hourly wages remained relatively flat. And yet, the American consumer (whose spending accounts for 70 percent of U.S. GDP) continued to spend with the sort of abandon that only unconstrained credit can pro-vide. That spending was a critical engine of global eco-nomic growth.
Now, however, U.S. consumers are worried about jobs, reduced asset values from the bursting of property and stock bubbles, and the consequent threat to their retire-ment accounts. Their spending is unlikely to fuel a new wave of global growth. And although economies of the developing world are growing at a significantly faster
pace than those in the developed world, they remain too small and too focused on exports to pick up the slack.
Reduced Availability of Credit. Although the situation has improved somewhat since the dark days of late 2008, the damaged global banking system is still leery about granting credit. Given that in recent years it has taken about five dollars of credit to sustain each dollar of GDP growth, less credit is also a serious constraint on growth.
The End of Government Stimulus. To be sure, the fast reaction and unprecedented financial stimulus by the Obama administration and other governments has propped up growth rates and contributed to the econom-ic recovery in 2010. But as of this writing, all signs indi-cate that world governments are shifting from economic stimulus to deficit reduction.4 Once government stimulus winds down, can private demand sustain the recovery?
For all these reasons, both executives and investors are anticipating an economic environment characterized by
Estimated decline in GDP growth, 2010–2015 Estimated gap in GDP
0 2 4 6 8
1.9
7.3
9.5
Italy
Eurozone
UnitedStates
Germany
France
0.6
Average annual GDP growth (%)
1.6
Brazil
0 5
Brazil
Output gap (%)
France
–2.5
Italy
2.1
Germany
Eurozone
PrecrisisPostcrisis
China
India
UnitedKingdom
Japan
7.7
6.4
3.1 3.3
1.1 2.6
1.1
1.0 2.6
1.0 1.8
0.7 1.6
0.7 1.6
–4.3
–8.7
–10.4
–11.7
–12.8
–13.9
–15.7
–16.7
India
China
UnitedStates
JapanUnited
Kingdom10 –20 –15 –10 –5
Exhibit 1. Lower Growth Rates Could Lead to Significant Gaps in GDP
Sources: Economist Intelligence Unit; Bloomberg; IMF; OECD; BCG analysis.Note: The output gap is the estimated shortfall in total 2015 GDP owing to the financial crisis, based on regressions derived from an IMF analysis of 88 historical examples. The precrisis growth rate is calculated by a various-length ordinary least squares (OLS) regression spanning at least ten years before the financial crisis. The postcrisis growth rate is the amount of growth necessary to achieve postcrisis GDP, using the Solow growth model. Brazil shows a positive value (output surplus) because its growth rate was above its precrisis trend in 2008 and was relatively unaffected by the downturn.
4. See “Governments Move to Cut Spending, in 1930s Echo,” The New York Times, June 29, 2010.

8 The Boston Consulting Group
low growth. In March 2010, BCG surveyed 440 senior ex-ecutives in seven major world economies.5 When asked what “shape” they thought the emerging recovery would take, fully half said that they expected the recovery to be “L-shaped”—that is, relatively slow and difficult. This re-sponse is significantly higher than in March 2009, when only 17 percent of respondents to a similar survey were so pessimistic.
In April 2010, we surveyed 110 profession-al investors and equity analysts in the Unit-ed States and Europe who cover econo-mies around the world and represent some $1 trillion in assets under management.6 Although respondents disagreed on pre-cisely when the recovery would be in full gear (in general, those covering Europe and other global markets were more pessimistic than those covering the United States), they agreed that lower GDP growth would have an impact on corporate net income. The vast major-ity were convinced that growth in company net income in the years to come would be below the long-term historical average for developed markets of approximately 5 per-cent. A plurality (46 percent) estimated that annual net-income growth rates in the next few years could be as low as 2 to 4 percent during the recovery. Another 40 percent were slightly more optimistic, seeing net income growth in the neighborhood of 4 to 6 percent. And only 9 percent expected earnings growth to be 6 percent or higher.
Challenges—and Opportunities
Whatever the precise level of future growth, a low-growth economy poses major challenges when it comes to value creation. Lower GDP growth will put pressure on corpo-rate revenues and profits. For many companies, maintain-ing historical levels of revenue growth will only come by winning market share. Competitive intensity will in-crease, and real winners (and losers) will emerge. How to deliver profitable growth that beats the average without undermining other drivers of total shareholder return (TSR)—in particular, margins?
After a 20-year period in which valuation multiples have been above the long-term historical average, lower growth is also likely to mean lower multiples as investors factor lower growth expectations into a company’s stock price. (See Exhibit 2.) What’s more, after nearly all companies
have, first, suffered from the late-2008 market selloff and, then, benefited from the 2009 rebound in equity values, valuation multiples will become more differentiated as investors reward those companies that combine above-average growth with clear competitive advantage, strong margins, and appropriate capital deployment. How to en-sure that a company benefits from the increasing differ-
entiation in valuation multiples and avoids becoming its victim?
An irony of the current economic environ-ment is that opportunities for growth are becoming constrained precisely at the mo-ment when, due to widespread cost cut-ting and cash accumulation in response to the recession, corporations have built up
an unprecedented amount of cash on their balance sheets. For example, the U.S. Federal Reserve reported in early June that U.S. companies, excluding financial ser-vices companies, held $1.84 trillion in cash, the highest level as a percentage of assets since the 1960s.7 To be sure, the size of any company’s cash hoard has to be eval-uated in terms of its level of debt and its potential need to use that cash to pay down that debt in the future.8 Still, the question remains, how should companies best deploy this cash and their high levels of ongoing free cash flow to create value in the future?
Finally, as a result of the turmoil over the past several years, governments are becoming more involved in the private sector, and many observers are questioning the legitimacy of shareholder value as an appropriate model for corporate governance. How to balance the interests and priorities of different stakeholders (investors includ-ed) in an environment in which the “economic pie” is likely to grow at a lower rate than in the recent past? (See the sidebar “Why Shareholder Value Still Matters.”)
But if an extended period of low growth presents chal-lenges for public companies, it also presents a singular opportunity. The stagflation of the 1970s, Japan’s “lost
5. See Collateral Damage, Part 9: In the Eye of the Storm; Ignore Short-Term Indicators, Focus on the Long Haul, BCG White Paper, May 2010.6. See “Investors’ Priorities in the Postdownturn Economy,” BCG article, July 2010.7. See “US Companies Tap Cash Piles for Share Buy-Backs,” Finan-cial Times, June 17, 2010.8. See “Show Us the Money,” The Economist, July 1, 2010.
A low-growth
economy poses major
challenges for value
creation.

Threading the Needle 9
0
10
20
30
40
1980 2010
June 2010 P/E = 19.9Median P/E2 = 17.5
1970 20001990
P/E1
50
Exhibit 2. Valuation Multiples Remain Above the Historical Average
Sources: Robert Shiller, Yale University; BCG analysis.1Cyclically adjusted price-to-earnings (P/E) ratios are based on a ten-year moving average of price index and earnings for S&P 500 composite. 2From January 1970 through June 2010.
Critics argue that managing for shareholder value con-tributed to the global economic crisis by encouraging ex-ecutives to overemphasize the short term, oversimplify their company’s actual performance, and overpay for dan-gerous risk taking by corporate management.1 What’s more, considering that in late 2008 many investments de-clined in market value by half or more in the space of a few short weeks, why should we still trust shareholder val-ue as a relevant measure of corporate performance?
To blame the concept of shareholder value management for such negative outcomes is to mistake remarkably poor—and in some cases, self-interested—corporate gov-ernance for defects of principle in the idea itself. There is nothing in the theory or practice of shareholder value management that forces companies to maximize short-term returns at the expense of long-term sustainability or to reward owners at the expense of alienating customers, employees, or other stakeholders.
Understood correctly, the principles of managing for shareholder value are simple: First, ensure that a compa-
ny delivers enduring economic returns above the cost of any new capital it employs; and second, increase the re-turns earned by its existing capital over time. There are three basic ways to achieve these goals. The first is to grow healthy (that is, high-return) businesses. The second is to fix or shrink unhealthy businesses with returns that are below the cost of capital. And the third is to return cash to investors in the form of dividends or stock buybacks when a company has more cash on hand than it has opportuni-ties for profitable growth.
From this perspective, managing for shareholder value has nothing to do with “managing earnings” to fool inves-tors into thinking that a company’s fundamental perfor-mance is better than it actually is. It doesn’t necessitate “borrowing from the future” to maximize today’s returns
Why Shareholder Value Still Matters
1. For some examples, see “Welch Condemns Share Price Focus,” Financial Times, March 12, 2009; N. Craig Smith and Luk Van Was-senhove, “How Business Schools Lost Their Way,” Bloomberg Busi-nessweek, January 11, 2010; and Roger Martin, “The Age of Customer Capitalism,” Harvard Business Review, January–February 2010.

10 The Boston Consulting Group
or playing an “expectations game” with the goal of always beating quarterly estimates.
The tools of shareholder value enable managers to devel-op a granular view of where strategies, activities, and re-sources add or subtract value. Cash-based metrics such as cash flow return on investment, economic profit, and TSR allow managers to compare performance across different businesses, identify and address wasteful or uncompeti-tive practices, quantify potential growth opportunities and tradeoffs, and measure performance outcomes against expectations and against peers. Such metrics also force companies to be disciplined about how they allocate capital and to evaluate potential investments carefully against the alternative of returning cash to investors.
Perhaps even more important, managing for long-term shareholder value gets management teams thinking of the company’s owners as a resource to leverage rather than an audience to spin. Almost all companies have a core group of long-term owners who would like to see the business run in a way that drives fundamental perfor-mance over a three-, five-, or even ten-year period. These owners are professional investors, and they embody so-phisticated views of the company, its businesses, and its changing competitive landscape. They represent a valu-able feedback loop for senior management about the ob-jective prospects of the company’s strategies and its pri-orities.
Finally, managing for shareholder value is one of the best ways for a public company to continue to serve not only its investors but also its other stakeholders. When a compa-ny delivers consistent and sustainable improvements in shareholder value, it lays the foundation not only for its own long-term survival but also for long-term returns to all stakeholders: to customers in the form of new innova-tions and ever-greater customer value, to employees in the form of rising wages and salaries, to governments in the form of taxes, and to communities in the form of sta-ble jobs. Indeed, the more effectively a company monitors and adapts its strategy to deliver long-term shareholder value, the more likely it is to avoid crisis situations that re-quire radical restructuring, massive employee layoffs, or government bailouts.
To illustrate this point, consider the breakdown of Procter & Gamble’s $79 billion in 2009 revenue (a result of de- livering value to customers) as it flows to various stake-holders of the company. (See the exhibit above.) Its almost $39 billion in cost of goods sold represents value to suppliers and to the employees who make its products. Its $24 billion in selling, general, and administrative ex-penses represents value to marketing and admin- istrative employees in the form of salaries and benefits. Its $4 billion in taxes is value flowing to governments. And its more than $1 billion in interest expense represents value to bondholders. Only after all these bills are paid does P&G have a net income of approximately $11 bil-lion—the economic value created for shareholders—which represents a relatively low 7 percent return on the company’s market capitalization of roughly $150 billion. Unless P&G can find some way to grow its revenues at a profit in the future, not only the company’s investors but also all its other stakeholders are likely to suffer.
Why Shareholder Value Still Matters (continued)
Revenue 79.0 Revenue reflects value delivered to customers
Cost of goods sold 38.9 Suppliers and manufacturing employees
Selling, general, and 24.0 Service providers andadministrative expenses administrative employees
Taxes 4.0 Governments
Interest expense 1.4 Bondholders
Net income from 11.3 Shareholderscontinuing operations1
Market capitalization ~150
Breakdown of P&G’s 2009 stakeholder value
($billion) Stakeholders who benefit
Returns to P&G Investors Were Only About 7 Percent of Market Capitalization
Sources: Procter & Gamble 2009 annual report; BCG analysis.1Includes $560 million of other nonoperating income.
Threading the Needle 11
decade,” and even the Great Depression all offer exam-ples of companies that prospered in tough economic times.9 The big winners didn’t succeed by playing it safe—that is, paying down debt, driving down costs to preserve the bottom line, conserving cash, and simply waiting for conditions to get better. Rather, they took ad-vantage of their competitors’ paralysis to create new sources of competitive advantage that endured for a long time.
What’s more, the belief that the downturn is ushering in a period of below-average growth is creating a fundamen-tal shift in investor expectations.10 For the first time in a long time, investors are focusing on longer-term funda-mentals. Instead of riding marketwide trends, they are as-sessing the quality and sustainability of individual com-pany stocks. They care more about a company’s business strategy and management track record and less about
quarterly earnings growth rates. In short, they are giving companies permission to focus on long-term competitive-ness and sustainable value creation—more so than in a long time.
No one knows how long this shift will last. But investors have reset their focus and strategies to achieve superior TSR. Managements need to do the same. The first step is understanding the distinctive dynamics of value creation in a low-growth environment.
9. See David Rhodes and Daniel Stelter, Accelerating Out of the Great Recession: How to Win in a Slow-Growth Economy, McGraw-Hill, 2010.10. See Collateral Damage: Function Focus; Valuation Advantage—How Investors Want Companies to Respond to the Downturn, BCG White Paper, April 2009; and “Investors’ Priorities in the Postdownturn Economy,” BCG article, July 2010.

12 The Boston Consulting Group
What characterizes value creation in low-growth environments? Two broad trends and a paradox. Their implications for an individual com-pany will, of course, depend on its
particular situation. But understanding the underlying dynamics of value creation in a low-growth economy is a necessary first step.
The Declining Importance of Capital Gains
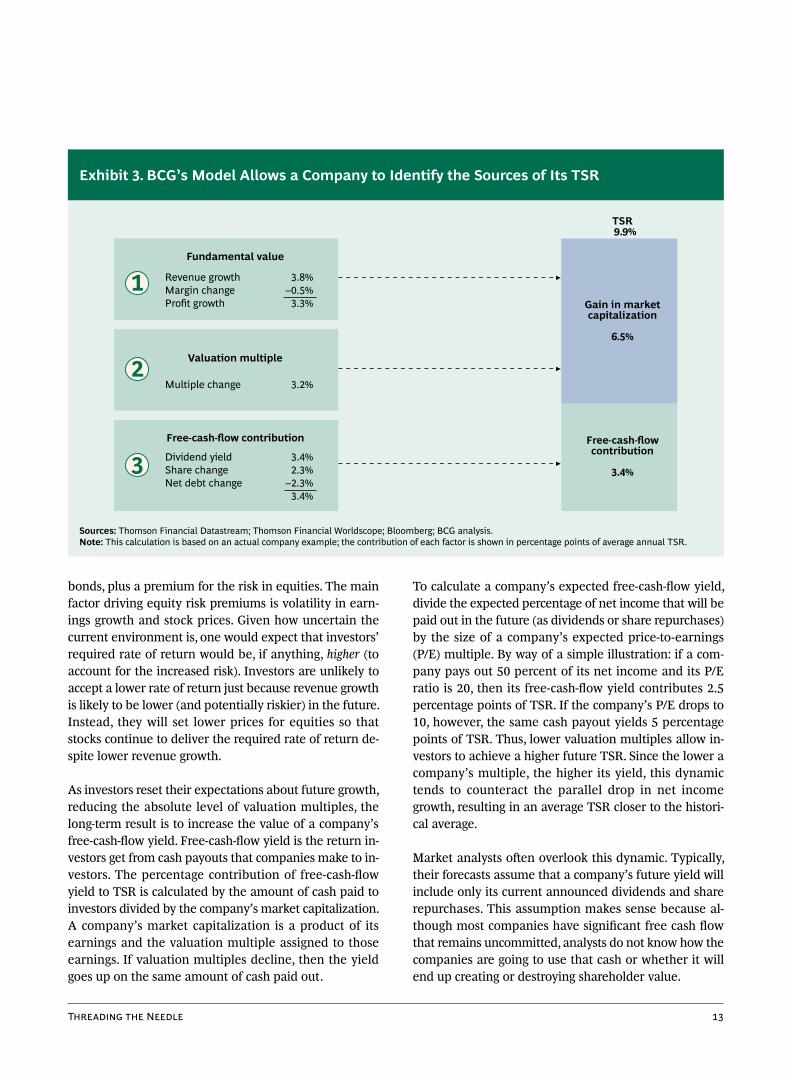
As regular readers of the Value Creators reports know, BCG has a model for quantifying the relative contribution of the various sources of TSR. (See Exhibit 3.) The model uses the combination of revenue (that is sales) growth and change in margins as an indicator of a company’s im-provement in fundamental value. It then uses the change in the company’s valuation multiple to determine the im-pact of investor expectations on TSR.11 Together, these two factors determine the change in a company’s market capitalization. Finally, the model also tracks the distribu-tion of free cash flow to investors and debt holders in the form of dividends, share repurchases, or payments on debt in order to determine the contribution of free-cash-flow payouts to a company’s TSR. Using this model, exec-utives can analyze the sources of TSR for their company, its business units, a peer group of companies, an industry, or an entire market index over a given period.
How is low GDP growth likely to affect these drivers of TSR? Although it will vary by industry, in general lower economic growth will mean lower sales growth for many companies. Lower revenue growth will also mean lower profits—a result of reduced operational leverage and
pressure on margins owing to increased competition. What’s more, as a company’s growth in net income de-clines, the overall level of its valuation multiple will likely drop as well, as investors factor that decline into the com-pany’s stock price. To be sure, earnings are currently re-bounding from their depth-of-recession lows and corpo-rate profitability is at an all-time high, but that won’t stop valuation multiples from declining as a reflection of the low-growth future outlook.
All these changes will cut significantly into a company’s ability to deliver capital gains, making this source of TSR relatively less important in the future than in the past. At first glance, this might seem to imply that overall TSR will be lower as well. For example, when we asked the respon-dents to our investor survey what they thought the market average TSR would be in the years to come, 89 percent said that it would be below the long-term historical aver-age of roughly 10 percent, with the median estimate at 8.8 percent. This logic is true as far as it goes; however, it ne-glects the inherently dynamic nature of TSR.
The Growing Importance of Cash Payout
Investors set stock prices in order to earn a required rate of return on their capital. The required rate of return for equities is a function of expected returns on risk-free
Value Creation in Low-Growth Environments
11. There are many ways to measure a company’s valuation multi-ple, and different metrics are appropriate for different industries and different company situations. In the Value Creators rankings, we use the EBITDA multiple—the ratio of enterprise value (the market value of equity plus the market value of debt) to EBITDA—in order to have a single measure with which to compare perfor-mance across our global sample. (See “Appendix: The 2010 Value Creators Rankings.”)
Threading the Needle 13
bonds, plus a premium for the risk in equities. The main factor driving equity risk premiums is volatility in earn-ings growth and stock prices. Given how uncertain the current environment is, one would expect that investors’ required rate of return would be, if anything, higher (to account for the increased risk). Investors are unlikely to accept a lower rate of return just because revenue growth is likely to be lower (and potentially riskier) in the future. Instead, they will set lower prices for equities so that stocks continue to deliver the required rate of return de-spite lower revenue growth.
As investors reset their expectations about future growth, reducing the absolute level of valuation multiples, the long-term result is to increase the value of a company’s free-cash-flow yield. Free-cash-flow yield is the return in-vestors get from cash payouts that companies make to in-vestors. The percentage contribution of free-cash-flow yield to TSR is calculated by the amount of cash paid to investors divided by the company’s market capitalization. A company’s market capitalization is a product of its earnings and the valuation multiple assigned to those earnings. If valuation multiples decline, then the yield goes up on the same amount of cash paid out.
To calculate a company’s expected free-cash-flow yield, divide the expected percentage of net income that will be paid out in the future (as dividends or share repurchases) by the size of a company’s expected price-to-earnings (P/E) multiple. By way of a simple illustration: if a com-pany pays out 50 percent of its net income and its P/E ratio is 20, then its free-cash-flow yield contributes 2.5 percentage points of TSR. If the company’s P/E drops to 10, however, the same cash payout yields 5 percentage points of TSR. Thus, lower valuation multiples allow in-vestors to achieve a higher future TSR. Since the lower a company’s multiple, the higher its yield, this dynamic tends to counteract the parallel drop in net income growth, resulting in an average TSR closer to the histori-cal average.
Market analysts often overlook this dynamic. Typically, their forecasts assume that a company’s future yield will include only its current announced dividends and share repurchases. This assumption makes sense because al-though most companies have significant free cash flow that remains uncommitted, analysts do not know how the companies are going to use that cash or whether it will end up creating or destroying shareholder value.
TSR 9.9%
Dividend yieldShare changeNet debt change
Revenue growthMargin changeProfit growth
3.2%
3.4%2.3%
–2.3%3.4%
3.8%–0.5%
3.3%
Fundamental value
Valuation multiple
Multiple change
Gain in marketcapitalization
6.5%
Free-cash-flowcontribution
3.4%
Free-cash-flow contribution
1
3
2
Exhibit 3. BCG’s Model Allows a Company to Identify the Sources of Its TSR
Sources: Thomson Financial Datastream; Thomson Financial Worldscope; Bloomberg; BCG analysis.Note: This calculation is based on an actual company example; the contribution of each factor is shown in percentage points of average annual TSR.

14 The Boston Consulting Group
However, this approach has the effect of underestimating a company’s actual TSR potential. The significant amount of cash that companies have accumulated on their bal-ance sheets and the currently high levels of free cash flow that resulted from cost cutting during the downturn have given many companies the opportunity to improve their free-cash-flow yield dramatically.
There are signs that at least some companies are realizing that cash payout is becoming a more important source of TSR. After cutting back on dividends and share buybacks during the depths of the downturn, more and more com-panies are starting to return some of that cash to share-holders. As of late June 2010, 136 companies in the S&P 500 had either increased their dividend payouts in 2010 or initiated new dividends—bolstering payments by a total of $11 billion.12 Only two S&P 500 companies had de-creased or suspended dividends during this period. (These actions are in sharp contrast to those in 2009, when there were 157 dividend increases and 78 decreases or suspen-sions that together cut payments to shareholders by a record $37 billion.) And according to a recent study by Bank of America Merrill Lynch, by mid-June 2010, there were some 343 new authorizations for stock buybacks at
U.S. companies, totaling roughly $178 billion.13 Projected over the full year, this rate of stock repurchases would be the highest volume since 2007 and total some $898 bil-lion—in contrast to only $128 billion in 2009.
There are also indications that investors have begun to put a higher value on cash returned to shareholders, re-sulting in positive impact on a company’s valuation mul-tiple as well. When we asked participants in our investor survey to set their priorities for the use of excess cash, in-creases in a company’s dividend shot up to number three on the list, chosen by 32 percent of respondents as either their first or second priority. (See Exhibit 4.) Last year, by contrast, it was the lowest priority on the list, chosen by only 10 percent. This shift in investor sentiment helps ex-plain why, as of late June, the Dow Jones Select U.S. Divi-dend Index was up 1.9 percent for 2010—in contrast to the S&P 500 which was down 2.5 percent.14
11
19
22
32
43
73
0 20 40
n = 110
60 80
Organic-growth investments
Strategic M&A
Dividend increases
Stock repurchaseprogram
Debt retirement
+9
Accumulation of cashon the balance sheet
+20
–1
+22
–22
–11
Options for the use of excess cash
Percentage of respondents who chose option as a high priority
Variationfrom 2009
(%)
Exhibit 4. Investors Are Putting a Higher Value on Dividend Increases
Source: BCG 2010 Investor Survey.Note: Respondents were asked, “How would you rank the following options based on your preference for the use of excess cash?” For each option, the exhibit shows the percentage of respondents who ranked it first or second.
12. See “Dividends Are Rising. Will Stocks Follow?” The New York Times, June 25, 2010.13. See “US Companies Tap Cash Piles for Share Buy-Backs,” Finan-cial Times, June 17, 2010.14. See “Dividends Are Rising. Will Stocks Follow?” The New York Times, June 25, 2010.
Threading the Needle 15
For some companies, a value creation strategy that em-phasizes cash payout and strong free-cash-flow yield may be a sensible approach in a low-growth environment. This is especially true for companies in mature, consoli-dated industries with high returns on invested capital that are generating far more cash than they can invest in profitable growth. But there are two important caveats to this scenario. First, it is unclear how long the current high levels of free cash flow will last. As governments around the world cope with high deficits and anemic tax revenues, cash-rich corporations will become a tempting new revenue source—whether through new corporate taxes such as the recent U.K. tax on bonuses in the finan-cial sector or through the kind of political pressure that forced BP to contribute to a $20 billion cleanup fund to defray the economic losses due to the Deepwater Hori-zon oil spill.15
Second, although a value creation strategy emphasizing free-cash-flow yield can occasionally generate superior TSR, it is extremely difficult to sustain that performance over time. As a company’s yield rises, investors will even-tually bid up its valuation multiple—which, of course, has the parallel effect of causing the yield to decline. Only in
special situations, when a company’s valuation multiple remains low, can it sustainably deliver superior TSR from a value creation strategy based on free-cash-flow yield.16 In order to be a top TSR performer, most companies will, sooner or later, need to find a way to grow. To understand why requires grasping a phenomenon that we call the growth paradox.
The Growth Paradox
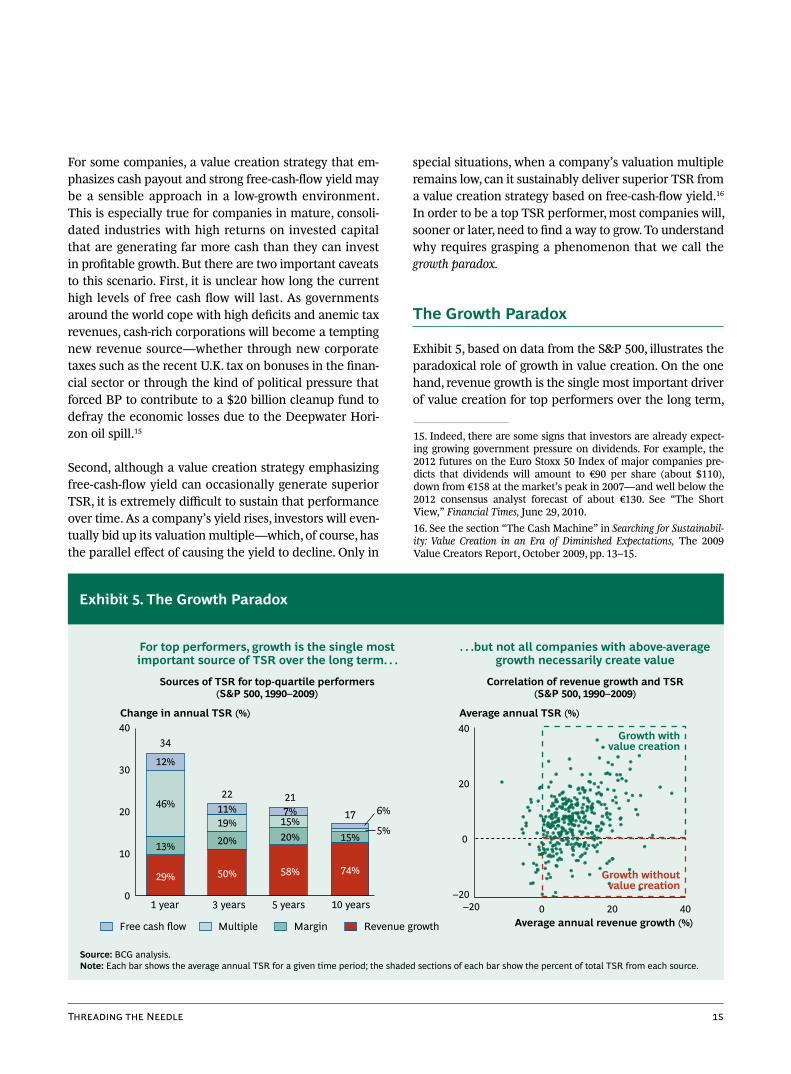
Exhibit 5, based on data from the S&P 500, illustrates the paradoxical role of growth in value creation. On the one hand, revenue growth is the single most important driver of value creation for top performers over the long term,
15. Indeed, there are some signs that investors are already expect-ing growing government pressure on dividends. For example, the 2012 futures on the Euro Stoxx 50 Index of major companies pre-dicts that dividends will amount to €90 per share (about $110), down from €158 at the market’s peak in 2007—and well below the 2012 consensus analyst forecast of about €130. See “The Short View,” Financial Times, June 29, 2010.16. See the section “The Cash Machine” in Searching for Sustainabil-ity: Value Creation in an Era of Diminished Expectations, The 2009 Value Creators Report, October 2009, pp. 13–15.
0
10
20
30
40
10 years
17
74%
15% 5%
6%
5 years
21
58%
20%15%7%
3 years
22
50%
20%
19%11%
1 year
34
29%
13%
46%
12%
Revenue growthMarginMultipleFree cash flow Average annual revenue growth (%)
Growth withoutvalue creation
0
20
40
0 20 40
Sources of TSR for top-quartile performers(S&P 500, 1990–2009)
Correlation of revenue growth and TSR(S&P 500, 1990–2009)
Change in annual TSR (%) Average annual TSR (%)
–20–20
Growth withvalue creation
For top performers, growth is the single mostimportant source of TSR over the long term. . .
. . .but not all companies with above-averagegrowth necessarily create value
Exhibit 5. The Growth Paradox
Source: BCG analysis.Note: Each bar shows the average annual TSR for a given time period; the shaded sections of each bar show the percent of total TSR from each source.

16 The Boston Consulting Group
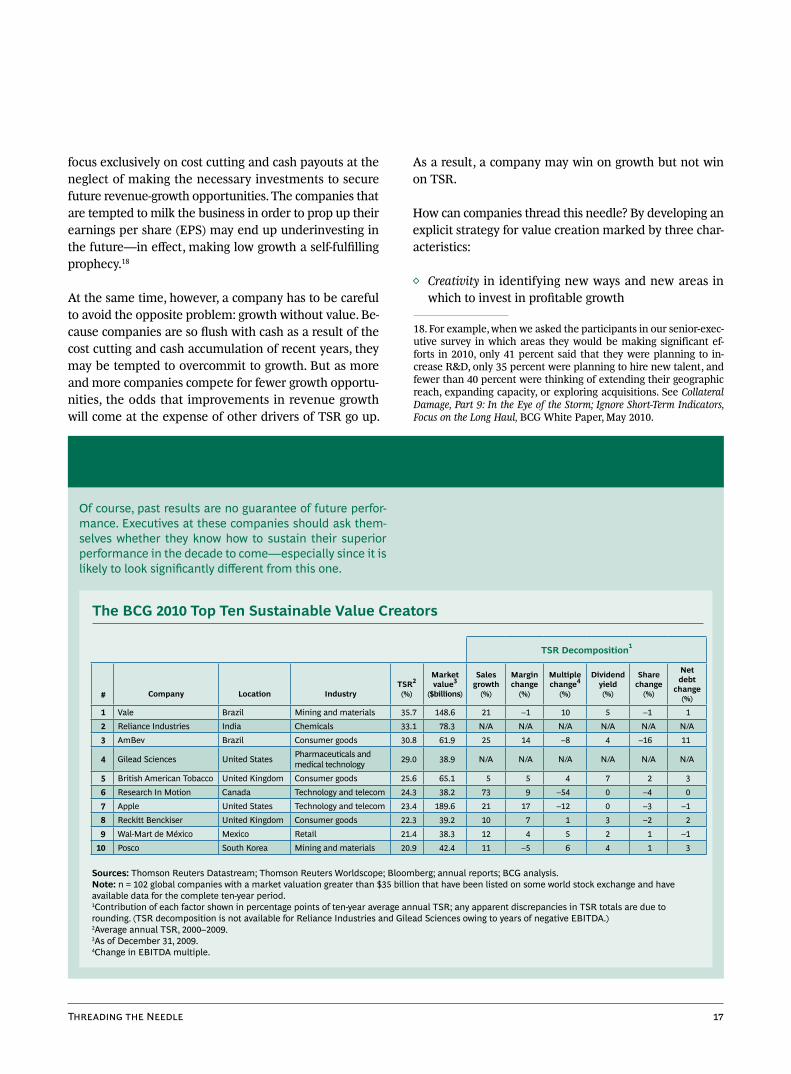
responsible for nearly three quarters of average annual TSR for top-quartile performers over rolling ten-year pe-riods from 1990 through 2009. Put simply, revenue growth is by far the main driver of superior value creation. That’s why, for example, most of the top ten companies in our sustainable value-creators rankings have revenue growth rates in the double digits—and one as high as 73 percent. (See the sidebar “The BCG Top Ten Sustainable Value Creators.”)
And yet, not all companies that deliver above-average growth necessarily create above-average TSR. The right-hand chart in Exhibit 5 shows that a great many compa-nies grow without creating value because their growth comes at the expense of other drivers of TSR—for exam-ple, declining margins or a lower valuation multiple.
A macroeconomic environment characterized by low growth exacerbates this growth paradox. Precisely be-cause it is the scarce resource in a low-growth economy, a company’s ability to generate even modestly above-aver-age sales growth will be a key differentiator between TSR winners and losers. For example, during the last pro-longed bear market—from 1966 through 1982—nearly all of the top 20 companies that most strongly outper-formed their industry peers in TSR did so through growth in sales rather than growth in margins or dividends.17
Therefore, it is critical that companies do not become so reconciled to the lack of growth opportunities that they
17. See Megatrends: Tailwinds for Growth in a Low-Growth Environ-ment, BCG Focus, May 2010.
For more than a decade, the BCG Value Creators report has included rankings of the top ten value creators in the world and in 14 global industries, on the basis of their av-erage annual TSR during the previous five years.1 Last year, however, in order to emphasize that shareholder val-ue management is all about long-term performance, we decided to supplement our traditional rankings with a new one. This ranking identifies those large global compa-nies that have been most successful at sustaining superi-or value creation over an even longer period of time: ten years. We call these high-performing companies sus-tainable value creators.
The companies on BCG’s list of top ten sustainable value creators this year are large global companies with a mar-ket capitalization of at least $35 billion. We limit our rank-ings to the world’s largest companies because the bigger the company, the harder it is to exceed expectations and deliver superior TSR year after year. Of the 712 global companies in this year’s Value Creators database, 102 cleared that hurdle. We tracked performance over an en-tire decade because we believe that ten years is the mini-mum time frame necessary to evaluate the staying power of a company’s value-creation performance.
The exhibit to the right lists the top ten value creators for the period from 2000 through 2009. The exhibit highlights the arrival of what BCG calls global challengers from rapid-ly developing economies on the world value-creation stage. Both the number one company on the list, the di-versified mining giant Vale, and the number three compa-
ny, the beverage conglomerate AmBev, are from Brazil. And the number two company, chemical maker Reliance Industries, is from India.
But that’s not to say that companies from developed economies aren’t also well represented—that is, as long as they are from the English-speaking world. The United States has two companies on the list: drug maker Gilead Sciences at number four and Apple at number seven. So does the United Kingdom with British American Tobacco at number five and the consumer goods company Reckitt Benckiser at number eight. And Canada is represented by BlackBerry maker Research In Motion at number six.
As one might expect, high-growth, innovation-based in-dustries such as pharmaceuticals and technology appear on our list. But more traditional sectors such as consumer goods, mining and materials, chemicals, and retail are also represented. All told, 6 of the 14 industrial sectors covered in the Value Creators report have companies among the top ten sustainable value creators.
But what is most striking about our list is the way these top performers combine significant—usually double-dig-it—revenue growth with high free-cash-flow yield. For ex-ample, our number-one company, Vale, had sales growth of 21 percent per year and at the same time managed to have a dividend yield of an unusually high 5 percent.
The BCG Top Ten Sustainable Value Creators
1. Readers interested in previous Value Creators reports can down-load them from the BCG website.
Threading the Needle 17
focus exclusively on cost cutting and cash payouts at the neglect of making the necessary investments to secure future revenue-growth opportunities. The companies that are tempted to milk the business in order to prop up their earnings per share (EPS) may end up underinvesting in the future—in effect, making low growth a self-fulfilling prophecy.18
At the same time, however, a company has to be careful to avoid the opposite problem: growth without value. Be-cause companies are so flush with cash as a result of the cost cutting and cash accumulation of recent years, they may be tempted to overcommit to growth. But as more and more companies compete for fewer growth opportu-nities, the odds that improvements in revenue growth will come at the expense of other drivers of TSR go up.
As a result, a company may win on growth but not win on TSR.
How can companies thread this needle? By developing an explicit strategy for value creation marked by three char-acteristics:
Creativity◊ in identifying new ways and new areas in which to invest in profitable growth
Of course, past results are no guarantee of future perfor-mance. Executives at these companies should ask them-selves whether they know how to sustain their superior performance in the decade to come—especially since it is likely to look significantly different from this one.
The BCG 2010 Top Ten Sustainable Value Creators
Sources: Thomson Reuters Datastream; Thomson Reuters Worldscope; Bloomberg; annual reports; BCG analysis.Note: n = 102 global companies with a market valuation greater than $35 billion that have been listed on some world stock exchange and have available data for the complete ten-year period.1Contribution of each factor shown in percentage points of ten-year average annual TSR; any apparent discrepancies in TSR totals are due to rounding. (TSR decomposition is not available for Reliance Industries and Gilead Sciences owing to years of negative EBITDA.) 2Average annual TSR, 2000–2009. 3As of December 31, 2009. 4Change in EBITDA multiple.
TSR Decomposition1
# Company Location IndustryTSR2 (%)
Market value3
($billions)
Sales growth
(%)
Margin change
(%)
Multiple change4
(%)
Dividend yield(%)
Share change
(%)
Net debt
change (%)
1 Vale Brazil Mining and materials 35.7 148.6 21 –1 10 5 –1 1 2 Reliance Industries India Chemicals 33.1 78.3 N/A N/A N/A N/A N/A N/A 3 AmBev Brazil Consumer goods 30.8 61.9 25 14 –8 4 –16 11
4 Gilead Sciences United States Pharmaceuticals and medical technology 29.0 38.9 N/A N/A N/A N/A N/A N/A
5 British American Tobacco United Kingdom Consumer goods 25.6 65.1 5 5 4 7 2 3 6 Research In Motion Canada Technology and telecom 24.3 38.2 73 9 –54 0 –4 0 7 Apple United States Technology and telecom 23.4 189.6 21 17 –12 0 –3 –1 8 Reckitt Benckiser United Kingdom Consumer goods 22.3 39.2 10 7 1 3 –2 2 9 Wal-Mart de México Mexico Retail 21.4 38.3 12 4 5 2 1 –1 10 Posco South Korea Mining and materials 20.9 42.4 11 –5 6 4 1 3
18. For example, when we asked the participants in our senior-exec-utive survey in which areas they would be making significant ef-forts in 2010, only 41 percent said that they were planning to in-crease R&D, only 35 percent were planning to hire new talent, and fewer than 40 percent were thinking of extending their geographic reach, expanding capacity, or exploring acquisitions. See Collateral Damage, Part 9: In the Eye of the Storm; Ignore Short-Term Indicators, Focus on the Long Haul, BCG White Paper, May 2010.

18 The Boston Consulting Group
Discipline◊ to invest only in those growth initiatives that will truly be value creating—and then to pay back ex-cess cash to investors once the necessary investments to pursue those opportunities have been made
Long-term focus ◊ that privileges sustainable value cre-ation over a three- to five-year period, rather than try-ing to maximize short-term gains in EPS
The challenge for companies today: to shift from an ap-proach to value creation that is focused on delivering quarterly earnings growth to one that emphasizes man-aging TSR over the long term. How companies can begin charting a course to deliver superior TSR over the long term is the subject of the next section of this report.
Threading the Needle 19
The shift to a low-growth economy requires a parallel shift in how companies set their value-creation strategy. Put simply, they need to stop managing to momentum tar-gets for short-term revenue and earnings
growth and start managing for superior TSR over the long term. Doing so requires rethinking their approach to growth and their criteria for capital deployment. It also requires innovations in the strategic-planning process.
Value-Creating Growth
Achieving profitable growth is going to be harder in a low-growth economy. There will be more competition—especially from global challengers from the fast-growing emerging economies. It is no coincidence, for instance, that all of the companies in our list of the top ten global performers for the five-year period from 2005 through 2009 are from Asia. (See the exhibit “The Global Top Ten, 2005–2009” in The 2010 Value Creators Rankings appen-dix.) As everyone competes for relatively fewer growth opportunities, margins will be under threat to a degree not seen in recent years.
Coping with these challenges will require discipline. Com-panies will need to take a tough look at existing business plans so as to weed out those growth investments that do not create value and to focus on those that do. It will also require creativity. Companies will have to be far more sys-tematic in finding new ways and new places to grow.
Given the likelihood of increased competition, companies should start by making any investments necessary to build a competitive moat around the core business. Com-petitors will be coming after that business, so it is critical
to preserve and protect existing sources of competitive advantage.
As a company develops its growth strategy, it also must be especially alert to the impact of growth on margins. In the high-growth era of the 1990s and first decade of this century, companies chased easy growth. Many got out of the habit of tracking the impact of that growth on their margins. In today’s environment, achieving profitable growth will be harder, and margins will be under threat. Therefore, it is necessary to manage the growth-margin tradeoff very carefully. To be sure, there may be situa-tions in which it is necessary to accept lower margins in order to remain competitive. But, by all means, compa-nies should avoid simply chasing share based on a weak competitive position because such a move is likely to wreak havoc on margins.
Once weaknesses in a company’s core business have been addressed, a company can begin thinking about new ways and new markets in which to grow. For example, is there some way to exploit the “two-speed” economy by expanding in emerging markets? And if so, what is the best way to do so—through organic growth, M&A, or part-nerships? (See the sidebar “Five Growth Strategies for a Low-Growth Economy.”)
When a company has few opportunities for organic growth, growing through acquisitions can be an effective way to create value.19 For example, acquisitions that con-solidate an industry can be a good way to preserve a com-
A Fresh Look at Value Creation Strategy
19. See Growing Through Acquisitions: The Successful Value Creation Record of Acquisitive Growth Strategies, BCG report, May 2004; and Searching for Sustainability: Value Creation in an Era of Diminished Ex-pectations, The 2009 Value Creators Report, October 2009, p. 12.

20 The Boston Consulting Group
Through its work with clients around the world, BCG has identified five growth strategies that have served compa-nies well during periods of low growth.
Invest in innovation. During periods of low growth, innovation becomes more important, not less. In the Great Depression, for example, DuPont, IBM, Chrysler, and GE all outspent their rivals and developed products ahead of their competitors. And many companies— P&G most dramatically—acquired unassailable brand leadership by systematic investment in their brands.1 Through a commitment to innovation when other compa-nies were cutting back, these companies established a dominant position in their industries that would last for decades.
Exploit megatrends. Megatrends are major trends with the power to shape the landscape of economic opportu-nity and risk for decades to come. They can take decades to gather strength and then suddenly burst forth to re- arrange the competitive environment. But because of the long buildup before takeoff, companies often underesti-mate the power of megatrends or assume that they have already accounted for them in their plans. BCG has been tracking the development and interaction of 78 mega-trends since 2005. Nearly 80 percent continued to grow during the downturn—with 23 actually strengthening in importance.2 Of the trends that kept growing, we estimate that 44 percent represent opportunities with a global mar-ket size greater than $500 billion. Take, for example, the demographic trend of the aging of the population. The so-called silver market (goods and services for consumers over 60) is now worth more than $700 billion worldwide and is fast become a valuable source of growth for compa-nies in sectors as diverse as cosmetics and financial ser-vices. Spotting the megatrends that will sweep through a company’s markets over the next decade is a critical step in reigniting growth.
Pursue breakout growth. Some industries grow faster than others. But in every industry, there are always a few companies that achieve breakout growth at rates that are anywhere from two to seven times the average for the in-dustry as a whole and that create correspondingly above-average shareholder value. These companies do so by ac-tively managing their corporate portfolio, focusing on developing and expanding their core business, exercising discipline to sustain or expand margins while pursuing top-line growth, and expanding aggressively outside their home market.
Engage in business model innovation. A company’s business model—the value proposition that it offers cus-tomers and the operating model it creates to deliver that value at a profit—is key to creating shareholder value in any economic environment. In times of instability, when the potential for competitive disruption is high, business model innovation is especially important. Business mod-el innovation can provide companies with a way to break out of intense competition, establish competitive barriers around new markets, or create new growth opportunities where none existed before.3
Practice pricing fluency. In a low-growth environment in which margins are likely to be under pressure, a compa-ny’s pricing policies and implementation will be a critical lever to manage. The winners will be those companies that resist the temptation to offer concessions on prices in order to maintain share. Companies that can defend their prices with disciplined processes will have a competitive advantage. But it requires building a capability that reach-es deep into a company’s sales and marketing organiza-tion. A comprehensive “pricing fluency” program focuses on improving a company’s pricing model with better poli-cies for setting prices and on enhancing the pricing plat-form for organizational implementation. In our experi-ence, the result is sustainable revenues that are 1 to 3 percent greater than those of competitors.4
Five Growth Strategies for a Low-Growth Economy
1. See David Rhodes and Daniel Stelter, Accelerating Out of the Great Recession: How to Win in a Slow-Growth Economy, McGraw-Hill, 2010.2. See Megatrends: Tailwinds for Growth in a Low-Growth Environment, BCG Focus, May 2010.3. See Business Model Innovation: When the Game Gets Tough, Change the Game, BCG White Paper, December 2009.4. See Crisis Pricing for the Downturn and After, BCG White Paper, Sep-tember 2009; and “Pricing Fluency: A Program for Pricing Excel-lence,” BCG Opportunities for Action, December 2009.

Threading the Needle 21
pany’s competitive advantage and protect margins. Simi-larly, buying businesses with strong future growth prospects can be a way to expand a company’s growth opportunities and build new growth platforms for the fu-ture. But investments in M&A tend to be riskier than equivalent investments in organic growth, so a company needs to assess its opportunities carefully and be realistic about its capabilities, both for doing deals and for the subsequent postmerger inte-gration (PMI).20
When it comes to M&A, the main shift companies need to make is to think less about whether a particular deal is “EPS accretive” in the short term and more about whether it is actually going to create shareholder value in the long term. A deal may appear to be “cheap” and deliver one-time EPS gains without nec-essarily improving a company’s TSR. For example, when a company that is trading at a P/E ratio of 20 acquires a company with a P/E ratio of 10, whatever benefit is ob-tained from combining the earnings of the two compa-nies can be undermined by declines in the acquirer’s val-uation multiple.
By the same token, deals that dilute EPS in the near term can improve TSR over the long term. Indeed, in a low-growth economy, some of the most value-creating acqui-sitions—those of companies with a higher growth rate than that of the acquirer—will initially dilute EPS be-cause the target will likely be trading at a higher valua-tion multiple than the acquirer. But over time, such an acquisition will lead to higher revenue growth and a high-er overall multiple.
Last but not least, no company should be thinking about where to grow without at the same time thinking about where not to—because it lacks advantage, is not produc-ing returns above the cost of capital, or faces an industry environment that makes a cash payout strategy prefera-ble. It is the rare company, for example, that knows pre-cisely where it is creating value—by business unit, by product line, or by customer segment. Yet, that kind of detailed assessment is all the more necessary in today’s environment.
For an illustration of the right way to navigate these choices, consider the example of a $5 billion industrial conglomerate with a portfolio of some 20 business units.
The company had a long history of acquisitive growth that had fed a rising dividend. But, in a situation similar to that faced by many companies today, the company’s recent TSR performance was lagging; it was experiencing weak demand in many of its core business segments, and its customers were becoming far more cost conscious, making it harder for the company to set prices at levels
that would sustain its margins.
To address this worrisome situation, senior executives decided that they need-ed to do a detailed business-by-business health check. They evaluated their entire corporate portfolio on three critical dimen-sions—the long-term attractiveness of the market both in terms of its growth pros-
pects and the company’s competitive position, the likely financial results in terms of return on investment, and the expected future TSR contribution of each of the com-pany’s business units.
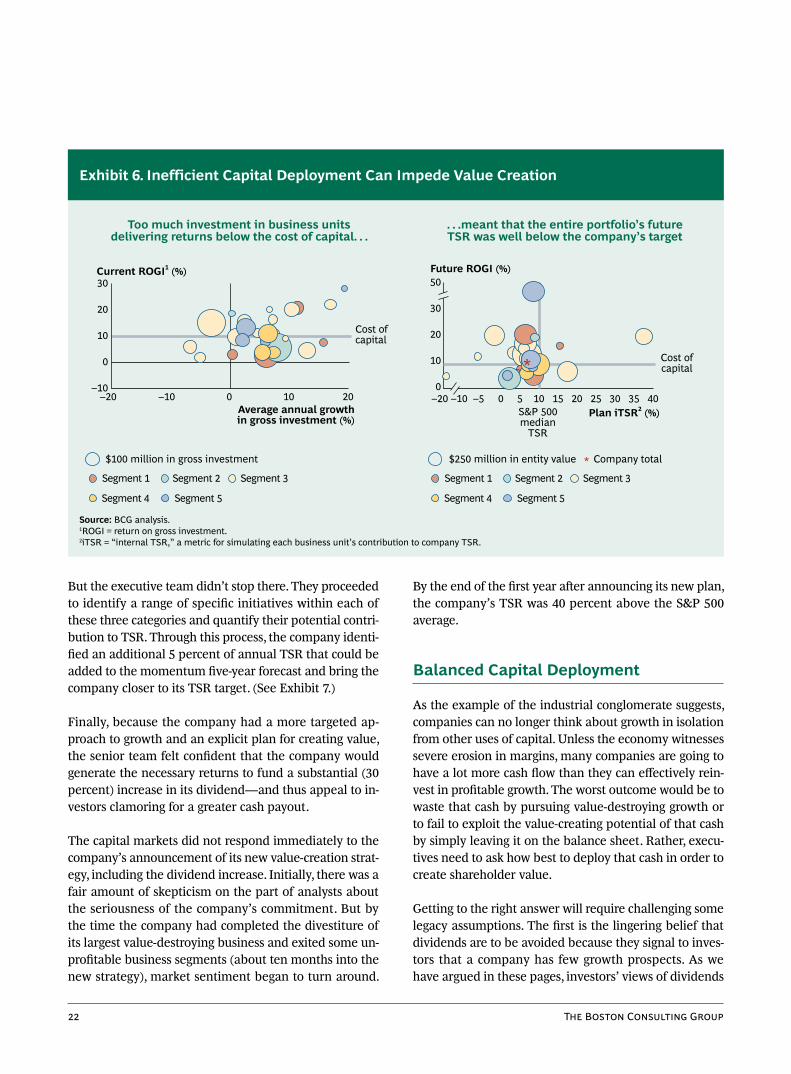
The results were disconcerting. The executives discovered that not only was a significant portion of the company’s business portfolio delivering returns below the compa-ny’s cost of capital, but also the majority of capital invest-ment—60 percent—was going to those value-destroying businesses. As a result, the likely TSR that the entire port-folio could generate was well below the company’s target. (See Exhibit 6.)
The company took three major steps to address these problems. First, it adopted a more nuanced approach to how it managed its business units, allocating each to one of three broad categories or roles. Those delivering re-turns above the cost of capital and in markets with sig-nificant growth prospects were designated “growth” busi-nesses that would receive the lion’s share of investment. Meanwhile, in “core” businesses that were generating sig-nificant cash but had fewer prospects for profitable growth, the emphasis would be on tighter management and improved efficiency to maximize cash generation. Finally, those business units that were destroying value would either be managed in order to improve returns or divested.
No company should
think about where to
grow without thinking
about where not to.
20. See Accelerating Out of the Great Recession: Seize the Opportunities in M&A, BCG report, June 2010; and Real-World PMI: Learning from Company Experiences, BCG Focus, June 2009.
22 The Boston Consulting Group
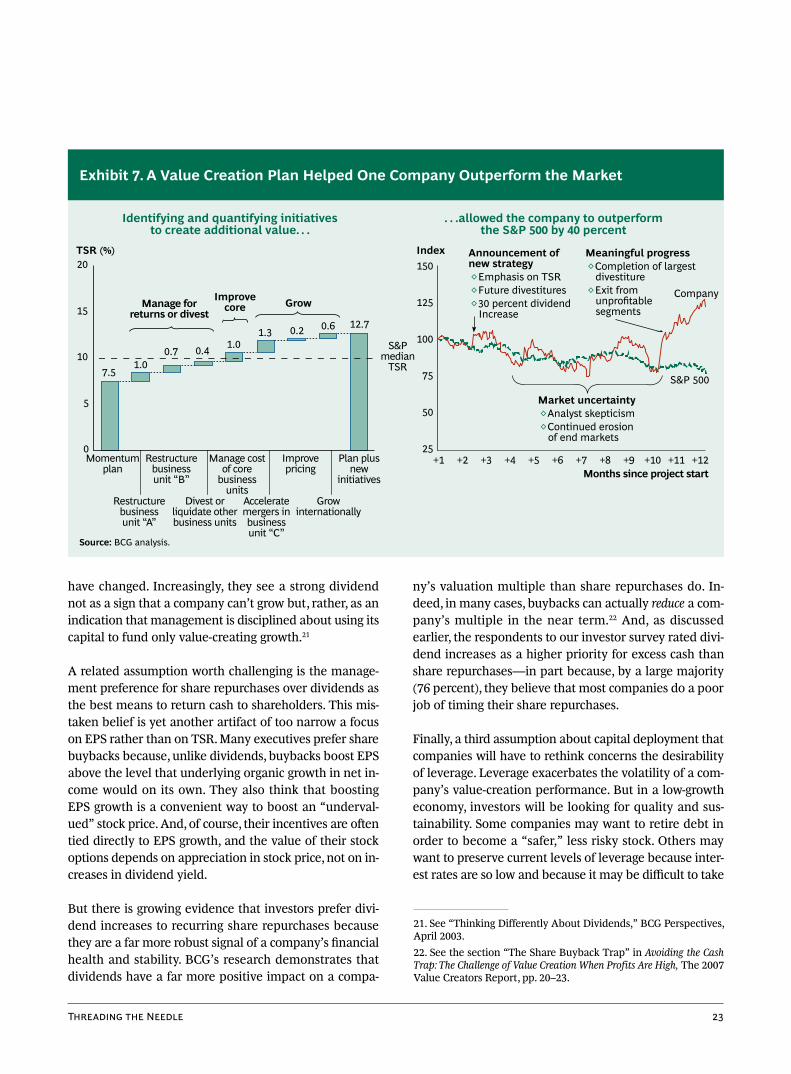
But the executive team didn’t stop there. They proceeded to identify a range of specific initiatives within each of these three categories and quantify their potential contri-bution to TSR. Through this process, the company identi-fied an additional 5 percent of annual TSR that could be added to the momentum five-year forecast and bring the company closer to its TSR target. (See Exhibit 7.)
Finally, because the company had a more targeted ap-proach to growth and an explicit plan for creating value, the senior team felt confident that the company would generate the necessary returns to fund a substantial (30 percent) increase in its dividend—and thus appeal to in-vestors clamoring for a greater cash payout.
The capital markets did not respond immediately to the company’s announcement of its new value-creation strat-egy, including the dividend increase. Initially, there was a fair amount of skepticism on the part of analysts about the seriousness of the company’s commitment. But by the time the company had completed the divestiture of its largest value-destroying business and exited some un-profitable business segments (about ten months into the new strategy), market sentiment began to turn around.
By the end of the first year after announcing its new plan, the company’s TSR was 40 percent above the S&P 500 average.
Balanced Capital Deployment
As the example of the industrial conglomerate suggests, companies can no longer think about growth in isolation from other uses of capital. Unless the economy witnesses severe erosion in margins, many companies are going to have a lot more cash flow than they can effectively rein-vest in profitable growth. The worst outcome would be to waste that cash by pursuing value-destroying growth or to fail to exploit the value-creating potential of that cash by simply leaving it on the balance sheet. Rather, execu-tives need to ask how best to deploy that cash in order to create shareholder value.
Getting to the right answer will require challenging some legacy assumptions. The first is the lingering belief that dividends are to be avoided because they signal to inves-tors that a company has few growth prospects. As we have argued in these pages, investors’ views of dividends
. . .meant that the entire portfolio’s futureTSR was well below the company’s target
Too much investment in business unitsdelivering returns below the cost of capital. . .
0
10
20
0 10
$100 million in gross investment
Cost ofcapital
20
30
00 5 10 15 20 25 30 35 40
Cost ofcapital
50
–20
Segment 1 Segment 2
Segment 3
Segment 5 Segment 4
Segment 1 Segment 2 Segment 3
Segment 5 Segment 4
$250 million in entity value
Current ROGI1 (%)
–10 –20
Average annual growthin gross investment (%)
–10
Future ROGI (%)
30
20
10
–10 –5Plan iTSR2 (%)S&P 500
medianTSR
Company total
Exhibit 6. Inefficient Capital Deployment Can Impede Value Creation
Source: BCG analysis.1ROGI = return on gross investment.2iTSR = “internal TSR,” a metric for simulating each business unit’s contribution to company TSR.
Threading the Needle 23
have changed. Increasingly, they see a strong dividend not as a sign that a company can’t grow but, rather, as an indication that management is disciplined about using its capital to fund only value-creating growth.21
A related assumption worth challenging is the manage-ment preference for share repurchases over dividends as the best means to return cash to shareholders. This mis-taken belief is yet another artifact of too narrow a focus on EPS rather than on TSR. Many executives prefer share buybacks because, unlike dividends, buybacks boost EPS above the level that underlying organic growth in net in-come would on its own. They also think that boosting EPS growth is a convenient way to boost an “underval-ued” stock price. And, of course, their incentives are often tied directly to EPS growth, and the value of their stock options depends on appreciation in stock price, not on in-creases in dividend yield.
But there is growing evidence that investors prefer divi-dend increases to recurring share repurchases because they are a far more robust signal of a company’s financial health and stability. BCG’s research demonstrates that dividends have a far more positive impact on a compa-
ny’s valuation multiple than share repurchases do. In-deed, in many cases, buybacks can actually reduce a com-pany’s multiple in the near term.22 And, as discussed earlier, the respondents to our investor survey rated divi-dend increases as a higher priority for excess cash than share repurchases—in part because, by a large majority (76 percent), they believe that most companies do a poor job of timing their share repurchases.
Finally, a third assumption about capital deployment that companies will have to rethink concerns the desirability of leverage. Leverage exacerbates the volatility of a com-pany’s value-creation performance. But in a low-growth economy, investors will be looking for quality and sus-tainability. Some companies may want to retire debt in order to become a “safer,” less risky stock. Others may want to preserve current levels of leverage because inter-est rates are so low and because it may be difficult to take
Momentum plan
Restructurebusiness unit “B”
Manage cost of core
business units
Improvepricing
Plan plus new
initiatives
Restructurebusiness unit “A”
Divest orliquidate other business units
Accelerate mergers in business unit “C”
Grow internationally
Months since project start
Identifying and quantifying initiativesto create additional value. . .
. . .allowed the company to outperformthe S&P 500 by 40 percent
0
5
10
15
20TSR (%)
Improvecore Grow
25
50
75
100
125
150Index
+1 +2 +3 +4 +5 +6 +7 +8 +9 +10 +11 +12
S&P 500
Company
Announcement of new strategy◊ Emphasis on TSR◊ Future divestitures◊ 30 percent dividend
Increase
Market uncertainty◊ Analyst skepticism◊ Continued erosion
of end markets
7.51.0
0.7 0.4 1.01.3 0.2 0.6 12.7
Manage forreturns or divest
S&Pmedian
TSR
Meaningful progress◊ Completion of largest
divestiture◊ Exit from
unprofitable segments
Exhibit 7. A Value Creation Plan Helped One Company Outperform the Market
Source: BCG analysis.
21. See “Thinking Differently About Dividends,” BCG Perspectives, April 2003.22. See the section “The Share Buyback Trap” in Avoiding the Cash Trap: The Challenge of Value Creation When Profits Are High, The 2007 Value Creators Report, pp. 20–23.
24 The Boston Consulting Group
on new debt in the future. But whatever a company’s situation, it would be prudent to plan future value- creation strategy on the assumption that the company will need to fund that strategy out of its ongoing operat-ing free cash flow. One big advantage this kind of “living within our means” discipline has for planning purposes is that it will force sharpened consideration of a compa-ny’s potential tradeoffs around capital de-ployment.
Scenario-Based Strategic Planning
By now, it should be clear that the ap-proach to value creation strategy we are describing is not something that can take place within the normal strategic-planning process. As strategic planning exists at most companies today, business units develop their momentum plans, which are then aggregated into an overall corporate strategy. Rethinking value creation strategy requires a top-down overlay to that process, led actively by the CEO and involving the board.
One approach that helps sharpen the tradeoffs a compa-ny faces is to create alternative future scenarios that em-phasize significantly different uses of capital. For exam-ple, assign three different teams to develop the “best-case scenario” for three different value-creation strategies—one emphasizing investments in organic growth, one em-phasizing acquisitive growth, and one emphasizing cash payouts. What would be the differential impact of each of these scenarios on TSR? What would be the associated risks given the company’s starting position, organization-al capabilities, and investor base?
The point of this exercise is not necessarily for any one scenario to win out over the others. It is likely that the fi-nal strategy will include elements drawn from each sce-nario, perhaps with different moves playing a more cen-tral role at different moments in time. But developing multiple scenarios has the advantage of surfacing unan-ticipated opportunities, sharpening the choices and tradeoffs that a company has to make, and forcing a tough, realistic assessment of what the company can ac-tually achieve.
As a company develops and evaluates these different sce-narios, it should keep in mind the likely impact of various
moves on its investor base and, therefore, on its valuation multiple. One way to do so is to develop a fine-grained understanding of the factors that actually determine dif-ferences in valuation multiples in a company’s peer group. This will be especially important in an environ-ment in which multiples, on average, will be declining and in which ensuring “full valuation” of a company’s
plans will be critical.
BCG’s research shows that it is possible to identify and actively manage the factors that determine approximately 80 percent of the differences in valuation multiples across a company’s peer set.23 The key questions are: What are the specific driv-ers of differences in valuation multiples
within a company’s industry? What are the likely impacts of the company’s business strategy, financial policies, and investor messaging on its valuation multiple?
Another way to gauge investor reactions to a company’s plans is by conducting a detailed investor segmentation to determine who the company’s dominant investors are and to identify their key priorities for the company.24 Hav-ing this kind of detailed information is important in any situation, but it is especially important today, when many companies have experienced significant churn in their in-vestor base and when investor priorities themselves have been evolving.
Once a company has identified its dominant investors, it should bring their perspectives into the planning process. BCG regularly conducts interviews with the fund manag-ers at leading investors in our client companies, as well as at potential target investors. In our experience, only by talking directly to investors, asking probing questions, and carefully listening to and interpreting their responses can a company’s management gain a clear view of the expectations and priorities of the company’s investor base.25 The point of acquiring that view is not in order to
23. See the section “Understand What Drives Relative Valuation Multiples” in Balancing Act: Implementing an Integrated Strategy for Value Creation, The 2005 Value Creators Report, November 2005, pp. 15–18.24. See the section “The Investors Who Matter—and What Matters to Them” in Missing Link: Focusing Corporate Strategy on Value Cre-ation, The 2008 Value Creators Report, pp. 26–27.25. See “Treating Investors Like Customers,” BCG Perspectives, June 2002.
Creating alternative
future scenarios
sharpens the tradeoffs
a company faces.
Threading the Needle 25
do precisely what investors want in every situation. Rath-er, it is to anticipate how investors are likely to respond to a company’s strategic moves. But in some cases, in-depth interaction with leading investors can go a long way to-ward helping a company clarify the most sustainable path for value creation in the future.
Take the example of a $10 billion U.S. distribution com-pany. Based on its strategic plan, the company’s TSR out-look was weak. In order to meet its targets, the company needed to find additional ways to create value, but man-agers were pessimistic about their ability to find more growth in their slow-growing markets. As a result, they were thinking about M&A as an alternative path to growth.
When they analyzed the drivers of multiples in the com-pany’s industry, however, executives discovered that in-vestors didn’t really take future growth rates into account in assigning a multiple to a company’s earnings. Far more important were the relative size of a company’s margins and of its operating expense (as a percentage of revenue).
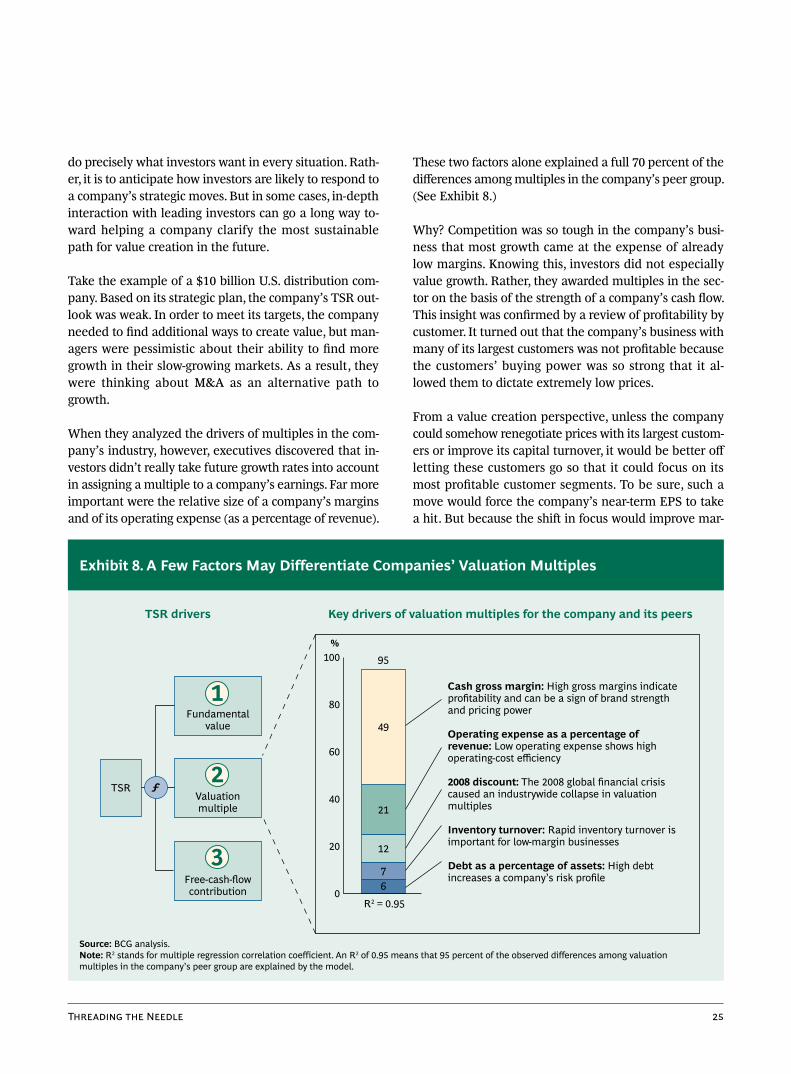
These two factors alone explained a full 70 percent of the differences among multiples in the company’s peer group. (See Exhibit 8.)
Why? Competition was so tough in the company’s busi-ness that most growth came at the expense of already low margins. Knowing this, investors did not especially value growth. Rather, they awarded multiples in the sec-tor on the basis of the strength of a company’s cash flow. This insight was confirmed by a review of profitability by customer. It turned out that the company’s business with many of its largest customers was not profitable because the customers’ buying power was so strong that it al-lowed them to dictate extremely low prices.
From a value creation perspective, unless the company could somehow renegotiate prices with its largest custom-ers or improve its capital turnover, it would be better off letting these customers go so that it could focus on its most profitable customer segments. To be sure, such a move would force the company’s near-term EPS to take a hit. But because the shift in focus would improve mar-
Key drivers of valuation multiples for the company and its peersTSR drivers
Cash gross margin: High gross margins indicate profitability and can be a sign of brand strength and pricing power
Operating expense as a percentage of revenue: Low operating expense shows high operating-cost efficiency
2008 discount: The 2008 global financial crisis caused an industrywide collapse in valuation multiples
Inventory turnover: Rapid inventory turnover is important for low-margin businesses
Debt as a percentage of assets: High debt increases a company’s risk profile
67
12
21
49
0
20
40
60
80
100
Valuationmultiple
Fundamentalvalue
TSR
95%
Free-cash-flowcontribution
R2 = 0.95
ƒ
1
3
2
Exhibit 8. A Few Factors May Differentiate Companies’ Valuation Multiples
Source: BCG analysis.Note: R2 stands for multiple regression correlation coefficient. An R2 of 0.95 means that 95 percent of the observed differences among valuation multiples in the company’s peer group are explained by the model.

26 The Boston Consulting Group
gins and lower operating expenses, taking this step would actually fuel an increase in the company’s valuation mul-tiple. Although additional growth in the form of strategic M&A made sense in the long term, it was best to hold off until after the company had fixed its core business.
Getting rid of some of its largest (although least profit-able) customers would force the company to lower its guidance for growth in EPS. But interviews with leading investors revealed that if such a move were put in the context of a newfound commitment to managing for TSR, investors would be ready to accept it. The company has begun to address its profitability problems by renegotiat-ing its contracts with some customers and by dropping others. It has also signaled its commitment to maximizing cash flow by significantly increasing its dividend (which,
because of low growth in the sector, contributed the lion’s share of the company’s TSR). In the three months since announcing its new strategy, the company has outper-formed the S&P 500 by 15 percent.
Adapting to low growth after decades of relatively high growth is a bit like having to use muscles that one has not exercised in a long time. It can
be painful—but in the end, it produces a healthier organ-ism. By focusing on value-creating growth, optimizing the tradeoffs among various uses of capital, and taking a sce-nario-based approach to strategic planning, companies will be in good shape to address the challenges of value creation in a low-growth economy.

Threading the Needle 27
In conclusion, we offer ten questions about value creation in a low-growth economy that every CEO should know how to answer. The questions syn-thesize the basic arguments and recommenda-tions made in this year’s report.
Do you know where and how your businesses are creat- 1. ing value? By business unit, by product category, by customer segment?
Do you have a process in place for discovering new 2. ways to deliver value-creating growth? Are you invest-ing to create long-term sustainable TSR or merely managing the business to maximize your short-term EPS?
Are you emphasizing shareholder value performance 3. over relatively long time horizons (three to five years), rather than quarterly or annual EPS?
Are you evaluating future acquisitions by their long- 4. term value-creation potential, not by whether the deals would happen to accrete or dilute EPS in the short term?
Do you know what drives differences in valuation mul- 5. tiples in your peer group?
Do you know the segmentation of investors who own 6. your stock? Which types of investors dominate? Are they the right ones given your value-creation strat-egy? Are you engaged in an active dialogue with your core investors in order to understand their ob-jectives and priorities?
Are your financial policies—such as debt-to-capital ra- 7. tio and dividend payout—likely to appeal to your tar-get investors in a low-growth environment?
Are your management processes—for example, plan- 8. ning, budgeting, and capital allocation—aligned with the goal of increasing shareholder value over the long term?
Are you rethinking your executive-compensation sys- 9. tem for an environment in which capital gains will be a less important contributor to TSR? Does your sys-tem require that senior executives have substantial “skin in the game” in the form of long-term direct equity exposure (not stock options)?
Have you thoroughly explored different scenarios for 10. creating value in the future? Do you know the differ-ent benefits and risks of emphasizing organic growth, M&A, or cash payout?
Ten Questions Every CEO Should Know How to Answer

28 The Boston Consulting Group
The 2010 Value Creators rankings are based on an analy-sis of total shareholder return at 712 global companies for the five-year period from 2005 through 2009.
To arrive at this sample, we began with TSR data for more than 4,000 companies provided by Thomson Reu-ters. We eliminated all companies that were not listed on a world stock exchange for the full five years of our study or did not have at least 25 percent of their shares avail-able on public capital markets. We also eliminated cer-tain industries from our sample—for example, financial services.1 We further refined the sample by organizing the remaining companies into 14 industry groups and es-tablishing an appropriate market-valuation hurdle to eliminate the smallest companies in each industry. (The size of the market valuation hurdle for each individual industry can be found in the tables in the “Industry Rank-ings.”) In addition to our 712-company comprehensive sample, we also separated out those companies with mar-ket valuations of more than $35 billion. We have included rankings for these large-cap companies in the “Global Rankings.”
The global and industry rankings are based on five-year TSR performance from 2005 through 2009.2 We also show TSR performance for 2010, through June 30. In addition, we break down TSR performance into the six investor-oriented financial metrics used in the BCG decomposi-tion model.3
The average annual return for the 712 companies in our sample was 6.6 percent—and in 3 of the 14 industry sam-ples, TSR was actually negative, on average, during the past five years. (See Exhibit 1.) This relatively poor per-formance (considerably below the long-term historical av-erage of approximately 10 percent) reflects the precipi-
tous decline in market values in late 2008 owing to the global financial crisis—a decline that the rebound in 2009 equity values only partly recovered.4
As always, however, the leading companies in our sample substantially outpaced not only their own industry aver-age but also the total sample average. For example, the average annual TSR of the global top ten was more than 11 times greater than that of the sample as a whole—75 percent. (See Exhibit 2.) The top ten companies in each industry outpaced their industry averages by between 13.2 percentage points (in pulp and paper) and 34.5 per-centage points (in machinery and construction). And in every industry we studied, the top ten companies also did substantially better than the overall sample average—by at least 6.6 percentage points of TSR. The lesson for ex-ecutives is this: Coming from a sector with below-average market performance is no excuse. No matter how bad an industry’s average performance is relative to other sec-tors and to the market as a whole, it is still possible for
AppendixThe 2010 Value Creators Rankings
1. We chose to exclude financial services because measuring value creation in that sector poses unique analytical problems that make it difficult to compare the performance of financial services compa-nies with companies in other sectors. For BCG’s view of value cre-ation in financial services, see After the Storm, The 2010 Creating Value in Banking Report, February 2010.2. TSR is a dynamic ratio that includes price gains and dividend payments for a specific stock during a given period. To measure performance from 2005 through 2009, end-of-year 2004 data must be used as a starting point in order to capture the change from 2004 to 2005, which drives 2005 TSR. For this reason, all exhibits in the report showing 2005–2009 performance begin with a 2004 data point.3. This model has been described in previous Value Creators re-ports. See, for example, Missing Link: Focusing Corporate Strategy on Value Creation, The 2008 Value Creators Report, September 2008, p. 20.4. See “Rebound but Not Yet Recovery,” BCG article, March 2010.

Threading the Needle 29
companies in that industry to deliver superior sharehold-er returns.
What kind of improvement in TSR was necessary to achieve truly superior performance, given the sample av-erage? A company had to deliver an average annual TSR of at least 16.3 percent per year to be in the top quartile of the global sample and 61.7 percent to make the top ten. And the most successful companies delivered TSR above 80 percent per year, and as high as 106.3 percent.
Exhibits 1 and 2 and the exhibits in the rankings them-selves suggest five other broad trends of interest:
In the past five years, companies from rapidly develop-◊ ing economies have come to dominate the Value Cre-ators rankings. Of the 142 companies listed in this year’s rankings, 81 are located in emerging mar-kets—57 percent of the total. What’s more, all of the
top ten value creators in our global sample are from Asia, and seven of the top ten large-cap value creators are from rapidly developing economies as well. The only industry sector that does not have any companies from emerging markets in its top ten is pharmaceuti-cals and medical technology.
The big industry winner in this year’s rankings is the ◊ mining and materials sector, with a weighted average annual TSR of 18 percent. This performance is a func-tion of the rise in commodity prices from 2005 through 2009, driven in part by rapid development in emerg- ing markets. In second and third place are the chemi-cals industry and the machinery and construction in-dustry.
Looking at the TSR decomposition of the major indus-◊ tries in our sample, it is striking that only 3 of the 14 industries we analyze each year—consumer goods,
Utilities
Mining and materials
Machinery and construction
Chemicals
Consumer goods
Transportation and logistics
Retail
Technology and telecommunications
Pharmaceuticals and medical technology
Travel and tourism
Media and publishing
Multibusiness
Total sample
Automotive and supply
Pulp and paper
TSR1 (%) Sales
growth (%)Margin
change (%)Multiple
change (%)Dividendyield (%)
Sharechange (%)
Net debt change (%)
7
–1
4
5
7
9
5
1
8
7
9
6
9
612.0
11.7
9.5
8.6
6.7
4.2
3.9
3.8
3.5
0.3
–0.7
–1.5
–1.7
6.6
1018.0
–1
–1
0
–2
–2
1
–1
–6
0
–1
–4
1
3
–1
–4
3
3
3
2
3
2
2
2
2
2
4
3
2
3
3
–1
–2
0
–4
–1
–1
–2
–3
0
1
–2
0
–1
0
–3
–1
–1
–1
–2
–2
–2
–1
0
0
0
0
–1
0
0
1
0
0
–6
–1
–4
–6
–1
10
–5
–2
2
1
–1
5
11
Value creation
Fundamental value
Valuationmultiple
Cash flow contribution= + +
Exhibit 1. Robust Sales Growth Was Often Accompanied by Margin Erosion
Sources: Thomson Reuters Datastream; Thomson Reuters Worldscope; Bloomberg; annual reports; BCG analysis.Note: Decomposition is shown in percentage points of five-year average annual TSR; any apparent discrepancies in TSR totals are due to rounding.1Five-year average annual TSR (2005–2009) for weighted average of the respective sample.

30 The Boston Consulting Group
utilities, and automotive and supply—have generated positive TSR from margin improvement. The margin erosion in other sectors is either a sign of growing pres-sure on margins owing to higher input prices or in-creased competition, or perhaps a signal of a general lack of managerial discipline around margins. As we argue in the body of this report, lower revenue growth is likely to produce additional pressure on margins. So this trend may be a sign of things to come. Alternative-ly, the TSR decomposition of the top ten value creators in each industry illustrates that many of these compa-nies found a way to grow and to improve margins at the same time.
In 2008, the majority of our industries saw a major nar-◊ rowing of the gap between the EBITDA multiples of the top ten in a sample and the average multiple of the sample as a whole. This trend reversed itself in 2009, as the EBITDA multiples of the best performers and those
of the rest began to diverge. In other words, although multiples increased, on average, they increased more for the top value creators—and, in some industries, sig-nificantly more. This is a sign of the growing divergence in valuation multiples that we expect to be a character-istic of a low-growth economic environment.
Another striking change between 2008 and 2009 is the ◊ increase in dividend yields, both on average and for the top ten—in the global sample and in every indus-try. Given the sharp rise in stock prices in 2009, one would expect dividend yields (which are the ratio of dividend payout to stock price) to decline. The rise in 2009 would seem to indicate that the companies in our sample are devoting a larger portion of their cash flow to dividend payouts, a move that is in line with inves-tor preferences as revealed by our investor survey.
Utilities
Machinery and construction
Mining and materials
Chemicals
Consumer goods
Transportation and logistics
Retail
Technology and telecommunications
Pharmaceuticals and medical technology
Travel and tourism
Media and publishing
Multibusiness
Total sample top ten
Automotive and supply
Pulp and paper
TSR1 (%) Sales
growth (%)Margin
change (%)Multiple
change (%)Dividendyield (%)
Sharechange (%)
Net debt change (%)
Value creation
Fundamental value
Valuationmultiple
Cash flow contribution= + +
40
6
12
11
9
8
15
13
13
8
13
17
17
18
2846.2
42.1
41.4
28.6
26.5
26.3
26.2
20.4
20.1
19.1
19.1
17.8
15.7
12.1
75.0 10
–1
2
8
9
0
1
–1
3
0
0
7
–5
6
10
22
6
–2
–3
0
0
1
7
7
10
8
0
23
14
9
2
3
3
1
2
4
3
2
3
2
2
2
3
3
2
–1
–4
–2
0
–4
–1
0
–2
–1
0
–4
1
0
3
–2
3
2
3
–1
3
8
1
2
1
6
7
1
3
4
0
Exhibit 2. The Top Ten Combined Sales Growth with Margin Improvement
Sources: Thomson Reuters Datastream; Thomson Reuters Worldscope; Bloomberg; annual reports; BCG analysis.Note: Decomposition is shown in percentage points of five-year average annual TSR; any apparent discrepancies in TSR totals are due to rounding.1Five-year average annual TSR (2005–2009) for weighted average of the respective sample.

Threading the Needle 31
Global RankingsTotal Global Sample
The Global Top Ten, 2005–2009
Sources: Thomson Reuters Datastream; Thomson Reuters Worldscope; Bloomberg; annual reports; BCG analysis.Note: n = 712 global companies.1Contribution of each factor shown in percentage points of five-year average annual TSR; any apparent discrepancies in TSR totals are due to rounding.2Average annual TSR, 2005–2009.3As of December 31, 2009.4Change in EBITDA multiple.5As of June 30, 2010.
’04 ’05 ’06 ’07 ’08 ’09’04 ’05 ’06 ’07 ’08 ’09’04 ’05 ’06 ’07 ’08 ’09
’04 ’05 ’06 ’07 ’08 ’09 ’04 ’05 ’06 ’07 ’08 ’09Salesgrowth
Marginchange
Multiplechange
Dividendyield
1
00
10
20
30
40
1,750
0
1,500
1,250
1,000
750
500
250
1,643
737
1,335
501
180
116
138 161 104 138
254
130
334
142
421
135
174122
118108
25
15
10
20
5
17.7 17.7 17.8 18.7
21.4
24.4
16.3 17.6 17.5 18.3 17.616.7
2
3
4
2.8
2.6 2.6
3.4
2.4
2.8
1.8
2.3
0.4
1.6
3.6
1.4
8.910.3
19.5
31.9
12.4
18.7
8.96.6
9.69.69.28.1
2 30
–1
7
–10
20
30
40
10
0
40
10
22
0
100
200
300
400
500
ƒ
Total global sample, n = 712Global top ten
Total shareholder return
Simplified five-year TSR decomposition2
Sales growth
EBITDA multiple1 Dividend yield3
EBITDA margin1
TSR index (2004 = 100) Sales index (2004 = 100) EBITDA/revenue (%)
TSR contribution (%) Enterprise value/EBITDA (x) Dividend/stock price (%)
Value Creation at the Global Top Ten Versus Total Global Sample, 2005–2009
Sources: Thomson Reuters Datastream; Thomson Reuters Worldscope; Bloomberg; annual reports; BCG analysis.1Total sample calculation based on aggregate of entire sample.2Share change and net debt change not shown.3Total sample calculation based on sample average.
TSR Decomposition1
# Company Location IndustryTSR2 (%)
Market value3
($billions)
Sales growth
(%)
Margin change
(%)
Multiple change4
(%)
Dividend yield(%)
Share change
(%)
Net debt
change (%)
2010TSR5
(%)
1 Tencent Hong Kong Technology and telecom 106.3 39.5 70 4 37 1 –1 –6 –22.4 2 Jindal Steel & Power India Mining and materials 88.2 14.3 57 9 19 2 0 2 –11.3 3 Suning Appliance China Retail 81.4 14.2 52 15 16 0 –2 1 –17.5 4 OCI South Korea Chemicals 70.9 4.4 7 24 8 2 –4 34 14.0 5 Sany Heavy Industry China Machinery and construction 67.4 8.0 50 1 13 1 –1 4 –25.1 6 Tingyi Hong Kong Consumer goods 67.3 13.8 33 14 13 5 0 2 1.7
7 Changsha Zoomlion Heavy Industry China Machinery and construction 66.4 6.4 49 3 13 2 0 0 –36.6
8 Kweichow Moutai China Consumer goods 63.4 23.5 30 5 29 2 0 –3 –25.0 9 TBEA China Machinery and construction 62.3 6.3 37 7 6 1 –1 12 –38.1 10 Perusahaan Gas Negara Indonesia Utilities 61.7 10.3 36 9 10 3 –2 5 –0.6
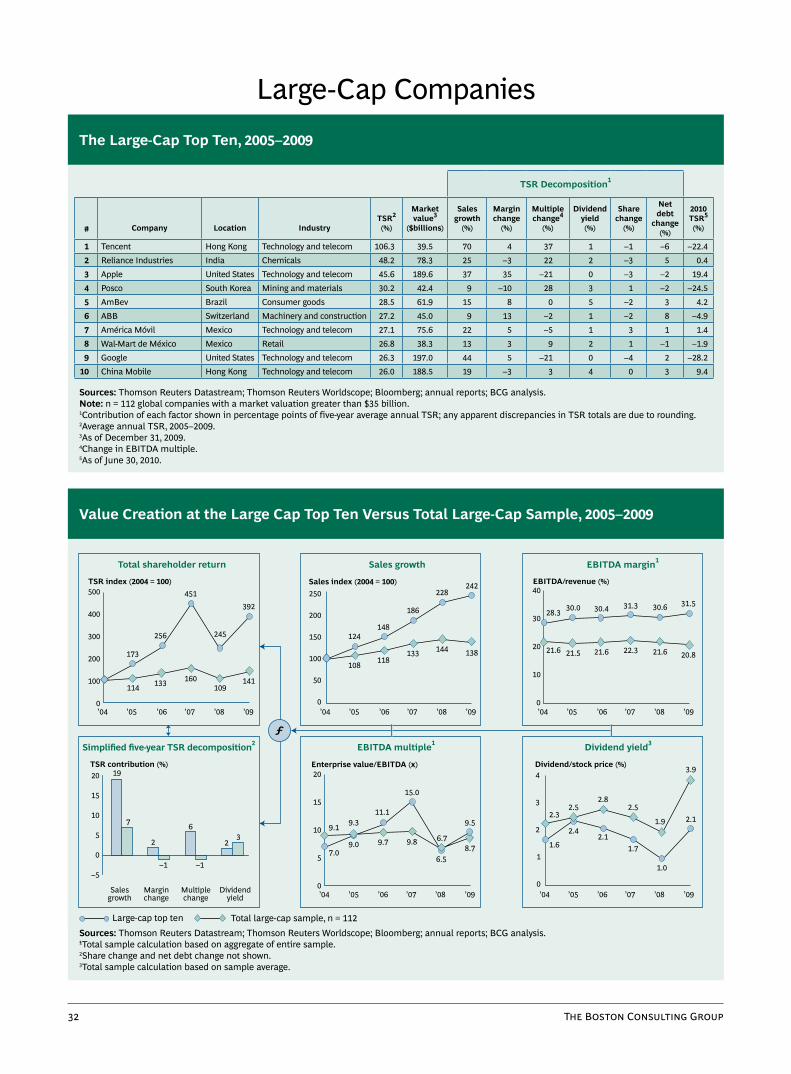
32 The Boston Consulting Group
Large-Cap CompaniesThe Large-Cap Top Ten, 2005–2009
Sources: Thomson Reuters Datastream; Thomson Reuters Worldscope; Bloomberg; annual reports; BCG analysis.Note: n = 112 global companies with a market valuation greater than $35 billion.1Contribution of each factor shown in percentage points of five-year average annual TSR; any apparent discrepancies in TSR totals are due to rounding.2Average annual TSR, 2005–2009.3As of December 31, 2009.4Change in EBITDA multiple.5As of June 30, 2010.
’04 ’05 ’06 ’07 ’08 ’09’04 ’05 ’06 ’07 ’08 ’09’04 ’05 ’06 ’07 ’08 ’09
’04 ’05 ’06 ’07 ’08 ’09 ’04 ’05 ’06 ’07 ’08 ’09Salesgrowth
Marginchange
Multiplechange
Dividendyield
1
00
5
10
15
20
0
500
400
300
200
100
392
245
451
256
173
114 133 160109
141
186
133
228
144
242
138
148124
118108
40
20
10
30
0
28.3 30.0 30.4 31.3 30.6 31.5
21.6 21.5 21.6 22.3 21.6 20.8
2
3
4
2.3
1.6
2.4
2.5
2.1
2.8
1.7
2.5
1.0
1.9
3.9
2.19.1 9.3
11.1
15.0
6.7
9.5
8.76.5
9.89.79.07.0
23
–1–1
7
–5
10
15
20
5
0
19
2
6
0
50
100
150
200
250
ƒ
Total large-cap sample, n = 112Large-cap top ten
Total shareholder return
Simplified five-year TSR decomposition2
Sales growth
EBITDA multiple1 Dividend yield3
EBITDA margin1
TSR index (2004 = 100) Sales index (2004 = 100) EBITDA/revenue (%)
TSR contribution (%) Enterprise value/EBITDA (x) Dividend/stock price (%)
Value Creation at the Large Cap Top Ten Versus Total Large-Cap Sample, 2005–2009
Sources: Thomson Reuters Datastream; Thomson Reuters Worldscope; Bloomberg; annual reports; BCG analysis.1Total sample calculation based on aggregate of entire sample.2Share change and net debt change not shown.3Total sample calculation based on sample average.
TSR Decomposition1
# Company Location IndustryTSR2 (%)
Market value3
($billions)
Sales growth
(%)
Margin change
(%)
Multiple change4
(%)
Dividend yield(%)
Share change
(%)
Net debt
change (%)
2010TSR5
(%)
1 Tencent Hong Kong Technology and telecom 106.3 39.5 70 4 37 1 –1 –6 –22.4 2 Reliance Industries India Chemicals 48.2 78.3 25 –3 22 2 –3 5 0.4 3 Apple United States Technology and telecom 45.6 189.6 37 35 –21 0 –3 –2 19.4 4 Posco South Korea Mining and materials 30.2 42.4 9 –10 28 3 1 –2 –24.5 5 AmBev Brazil Consumer goods 28.5 61.9 15 8 0 5 –2 3 4.2 6 ABB Switzerland Machinery and construction 27.2 45.0 9 13 –2 1 –2 8 –4.9 7 América Móvil Mexico Technology and telecom 27.1 75.6 22 5 –5 1 3 1 1.4 8 Wal-Mart de México Mexico Retail 26.8 38.3 13 3 9 2 1 –1 –1.9 9 Google United States Technology and telecom 26.3 197.0 44 5 –21 0 –4 2 –28.2 10 China Mobile Hong Kong Technology and telecom 26.0 188.5 19 –3 3 4 0 3 9.4

Threading the Needle 33
Industry RankingsAutomotive and Supply
The Automotive Top Ten, 2005–2009
Sources: Thomson Reuters Datastream; Thomson Reuters Worldscope; Bloomberg; annual reports; BCG analysis.Note: n = 38 global companies with a market valuation greater than $4 billion.1Contribution of each factor shown in percentage points of five-year average annual TSR; any apparent discrepancies in TSR totals are due to rounding.2Average annual TSR, 2005–2009.3As of December 31, 2009.4Change in EBITDA multiple.5As of June 30, 2010.
’04 ’05 ’06 ’07 ’08 ’09’04 ’05 ’06 ’07 ’08 ’09’04 ’05 ’06 ’07 ’08 ’09
’04 ’05 ’06 ’07 ’08 ’09 ’04 ’05 ’06 ’07 ’08 ’09Salesgrowth
Marginchange
Multiplechange
Dividendyield
1
00
2
4
6
8
0
400
300
200
100
321
129
289
187144
127162 163
70121
128
117
140
120
142
103
120109
108106
15
10
5
11.4 11.0 11.312.3
11.510.7
11.0 10.6 10.5
12.211.9
8.0
2
3
4
2.9
2.4 2.5
2.7
2.5
3.2
1.8
2.1
1.0
1.1
2.9
2.5
4.85.6
6.4
5.2
3.4
7.6
5.9
3.2
5.04.74.63.7
2 2
10
–6
1
–5
–10
10
15
5
0
8
–1
10
0
50
100
150
ƒ
Total sample, n = 38Automotive top ten
Total shareholder return
Simplified five-year TSR decomposition2
Sales growth
EBITDA multiple1 Dividend yield3
EBITDA margin1
TSR index (2004 = 100) Sales index (2004 = 100) EBITDA/revenue (%)
TSR contribution (%) Enterprise value/EBITDA (x) Dividend/stock price (%)
Value Creation at the Automotive Top Ten Versus Industry Sample, 2005–2009
Sources: Thomson Reuters Datastream; Thomson Reuters Worldscope; Bloomberg; annual reports; BCG analysis.1Industry calculation based on aggregate of entire sample.2Share change and net debt change not shown.3Industry calculation based on sample average.
TSR Decomposition1
# Company LocationTSR2 (%)
Market value3
($billions)
Sales growth
(%)
Margin change
(%)
Multiple change4
(%)
Dividend yield(%)
Share change
(%)
Net debt change
(%)
2010TSR5
(%)
1 Faw Car China 51.4 6.2 26 0 23 4 0 –1 –41.6 2 Fuyao Group Glass China 35.6 4.4 23 4 2 1 0 7 –39.6 3 Astra International Indonesia 34.7 15.3 20 5 6 3 0 1 41.7 4 Mahindra & Mahindra India 33.3 6.4 27 15 –7 3 –3 –1 15.7
5 Chongqing Changan Automobile China 30.6 4.8 6 –16 42 2 0 –3 –37.7
6 Hero Honda Motors India 27.4 7.5 16 –3 12 3 0 0 24.1 7 Maruti Suzuki India India 26.8 9.9 17 –5 13 1 0 1 –8.7 8 Volkswagen Germany 25.2 37.8 3 –3 6 4 –1 14 14.7 9 Hyundai Mobis South Korea 22.8 14.8 19 1 2 2 –3 2 21.1 10 Hyundai Motor South Korea 18.6 22.5 12 4 1 2 2 –2 19.4

34 The Boston Consulting Group
ChemicalsThe Chemicals Top Ten, 2005–2009
Sources: Thomson Reuters Datastream; Thomson Reuters Worldscope; Bloomberg; annual reports; BCG analysis.Note: n = 53 global companies with a market valuation greater than $4 billion.1Contribution of each factor shown in percentage points of five-year average annual TSR; any apparent discrepancies in TSR totals are due to rounding.2Average annual TSR, 2005–2009.3As of December 31, 2009.4Change in EBITDA multiple.5As of June 30, 2010.
’04 ’05 ’06 ’07 ’08 ’09’04 ’05 ’06 ’07 ’08 ’09’04 ’05 ’06 ’07 ’08 ’09
’04 ’05 ’06 ’07 ’08 ’09 ’04 ’05 ’06 ’07 ’08 ’09Salesgrowth
Marginchange
Multiplechange
Dividendyield
1
00
5
10
15
20
0
800
600
400
200
578
335
648
269
148
138 145214
116176
166
140
228
158
217
136
137121
122110
25
15
20
10
5
17.5 18.1 17.2 17.7
21.919.8
15.0 15.614.8
16.7 17.0 16.6
2
3
5
43.3
2.7 2.8
2.9
2.7
2.8
2.9
3.6
1.6
1.7
4.8
4.4
8.69.7
11.9
19.9
6.5
12.1
10.8
6.3
11.29.7
7.76.6
3 35
–1
6
0
–5
15
20
10
5
18
6
14
0
100
200
300
ƒ
Total sample, n = 53Chemicals top ten
Total shareholder return
Simplified five-year TSR decomposition2
Sales growth
EBITDA multiple1 Dividend yield3
EBITDA margin1
TSR index (2004 = 100) Sales index (2004 = 100) EBITDA/revenue (%)
TSR contribution (%) Enterprise value/EBITDA (x) Dividend/stock price (%)
Value Creation at the Chemicals Top Ten Versus Industry Sample, 2005–2009
Sources: Thomson Reuters Datastream; Thomson Reuters Worldscope; Bloomberg; annual reports; BCG analysis.1Industry calculation based on aggregate of entire sample.2Share change and net debt change not shown.3Industry calculation based on sample average.
TSR Decomposition1
# Company LocationTSR2 (%)
Market value3
($billions)
Sales growth
(%)
Margin change
(%)
Multiple change4
(%)
Dividend yield(%)
Share change
(%)
Net debt change
(%)
2010TSR5
(%)
1 OCI South Korea 70.9 4.4 7 24 8 2 –4 34 14.0 2 Reliance Industries India 48.2 78.3 25 –3 22 2 –3 5 0.4 3 SQM Chile 45.0 10.3 14 13 13 4 0 0 –6.5 4 LG Chem South Korea 43.8 13.4 14 3 9 3 0 14 35.5 5 Israel Chemicals Israel 41.8 17.4 12 8 14 6 –1 3 –14.3
6 Yantai Wanhua Polyurethanes China 38.4 5.8 26 –5 15 2 0 1 –38.2
7 K+S Germany 37.6 11.1 7 5 25 4 –1 –2 –4.7 8 Incitec Pivot Australia 33.8 5.3 24 32 –17 4 –4 –5 –22.6 9 Mosaic United States 30.4 26.6 31 30 –11 1 –26 6 –34.6 10 Yara International Norway 29.5 13.5 7 –7 25 3 2 0 –28.3

Threading the Needle 35
Consumer GoodsThe Consumer Goods Top Ten, 2005–2009
Sources: Thomson Reuters Datastream; Thomson Reuters Worldscope; Bloomberg; annual reports; BCG analysis.Note: n = 59 global companies with a market valuation greater than $10 billion.1Contribution of each factor shown in percentage points of five-year average annual TSR; any apparent discrepancies in TSR totals are due to rounding.2Average annual TSR, 2005–2009.3As of December 31, 2009.4Change in EBITDA multiple.5As of June 30, 2010.
’04 ’05 ’06 ’07 ’08 ’09’04 ’05 ’06 ’07 ’08 ’09’04 ’05 ’06 ’07 ’08 ’09
’04 ’05 ’06 ’07 ’08 ’09 ’04 ’05 ’06 ’07 ’08 ’09Salesgrowth
Marginchange
Multiplechange
Dividendyield
1
00
5
10
15
0
400
300
200
100
320
210
272
190143
119144
173121
158
135
117
161
127
179
126
118106
109105
40
20
30
10
0
25.928.6 30.4 30.9 29.6 30.3
16.5 16.6 16.9 17.6 16.9 17.0
2
3
5
43.9
3.02.7
4.2
2.6
3.9
2.2
2.6
1.7
2.0
3.6
3.3
9.810.9
12.214.2
10.2
12.6
10.48.7
12.111.610.59.2
3 311
6
0
15
10
5
13
3
7
0
50
100
150
200
ƒ
Total sample, n = 59Consumer goods top ten
Total shareholder return
Simplified five-year TSR decomposition2
Sales growth
EBITDA multiple1 Dividend yield3
EBITDA margin1
TSR index (2004 = 100) Sales index (2004 = 100) EBITDA/revenue (%)
TSR contribution (%) Enterprise value/EBITDA (x) Dividend/stock price (%)
Value Creation at the Consumer Goods Top Ten Versus Industry Sample, 2005–2009
Sources: Thomson Reuters Datastream; Thomson Reuters Worldscope; Bloomberg; annual reports; BCG analysis.1Industry calculation based on aggregate of entire sample.2Share change and net debt change not shown.3Industry calculation based on sample average.
TSR Decomposition1
# Company LocationTSR2 (%)
Market value3
($billions)
Sales growth
(%)
Margin change
(%)
Multiple change4
(%)
Dividend yield(%)
Share change
(%)
Net debt change
(%)
2010TSR5
(%)
1 Tingyi Hong Kong 67.3 13.8 33 14 13 5 0 2 1.7 2 Kweichow Moutai China 63.4 23.5 30 5 29 2 0 –3 –25.0 3 Wuliangye Yibin China 46.3 17.6 14 13 18 1 0 0 –23.0 4 Brasil Foods Brazil 29.2 11.4 25 –4 28 2 –23 2 4.7 5 AmBev Brazil 28.5 61.9 15 8 0 5 –2 3 4.2 6 ITC India 24.9 20.7 19 –2 6 2 0 1 25.9 7 Grupo Modelo Mexico 22.6 18.4 11 –3 10 4 0 0 –12.0
8 British American Tobacco United Kingdom 22.4 65.1 6 6 3 5 1 1 9.4
9 Reckitt Benckiser United Kingdom 19.1 39.2 15 4 –1 3 0 –1 –5.1 10 SABMiller United Kingdom 19.0 44.5 10 1 12 3 –8 1 3.5
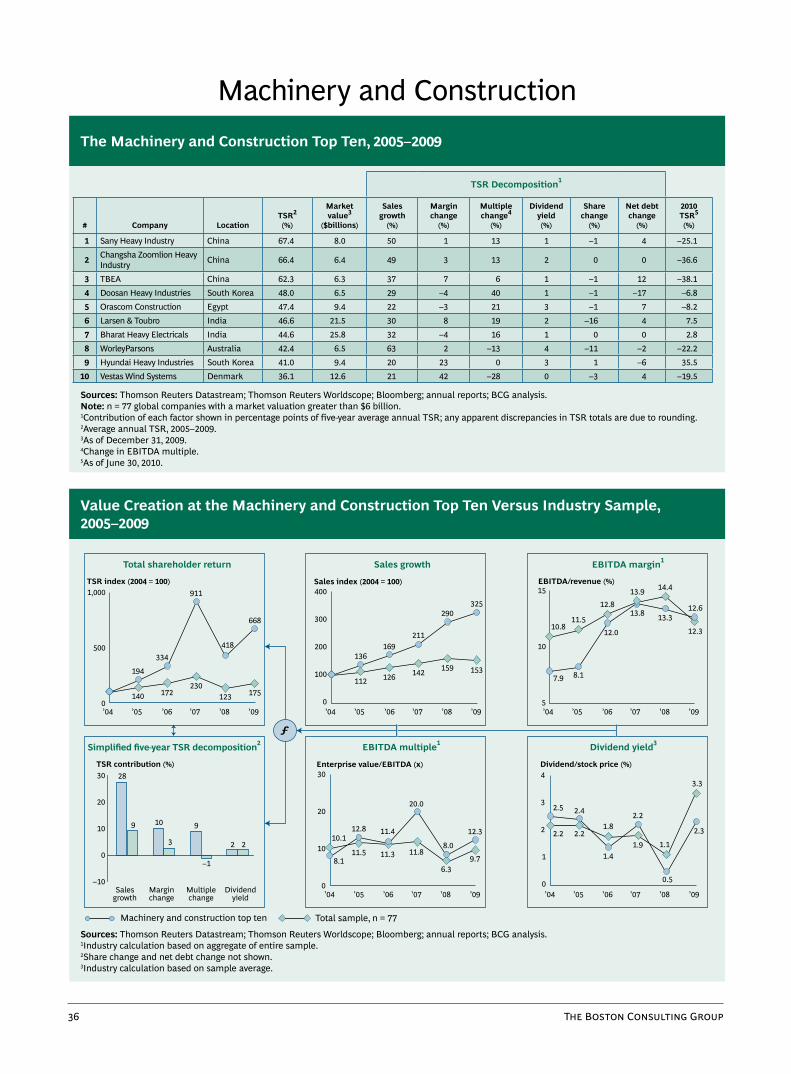
36 The Boston Consulting Group
Machinery and ConstructionThe Machinery and Construction Top Ten, 2005–2009
Sources: Thomson Reuters Datastream; Thomson Reuters Worldscope; Bloomberg; annual reports; BCG analysis.Note: n = 77 global companies with a market valuation greater than $6 billion.1Contribution of each factor shown in percentage points of five-year average annual TSR; any apparent discrepancies in TSR totals are due to rounding.2Average annual TSR, 2005–2009.3As of December 31, 2009.4Change in EBITDA multiple.5As of June 30, 2010.
’04 ’05 ’06 ’07 ’08 ’09’04 ’05 ’06 ’07 ’08 ’09’04 ’05 ’06 ’07 ’08 ’09
’04 ’05 ’06 ’07 ’08 ’09 ’04 ’05 ’06 ’07 ’08 ’09Salesgrowth
Marginchange
Multiplechange
Dividendyield
1
00
10
20
30
0
1,000
500
668
418
911
334
194
140 172230
123 175
211
142
290
159
325
153
169136
126112
15
10
5
10.811.5
12.813.9 14.4
12.6
7.9 8.1
12.0
13.8 13.3
12.3
2
3
4
2.5
2.2 2.2
2.4
1.4
1.8
1.9
2.2
0.5
1.1
3.3
2.310.1
12.8 11.4
20.0
8.0
12.3
9.76.3
11.811.311.58.1
2 2
–1
3
9
0
–10
30
20
10
28
10 9
0
100
200
300
400
ƒ
Total sample, n = 77Machinery and construction top ten
Total shareholder return
Simplified five-year TSR decomposition2
Sales growth
EBITDA multiple1 Dividend yield3
EBITDA margin1
TSR index (2004 = 100) Sales index (2004 = 100) EBITDA/revenue (%)
TSR contribution (%) Enterprise value/EBITDA (x) Dividend/stock price (%)
Value Creation at the Machinery and Construction Top Ten Versus Industry Sample, 2005–2009
Sources: Thomson Reuters Datastream; Thomson Reuters Worldscope; Bloomberg; annual reports; BCG analysis.1Industry calculation based on aggregate of entire sample.2Share change and net debt change not shown.3Industry calculation based on sample average.
TSR Decomposition1
# Company LocationTSR2 (%)
Market value3
($billions)
Sales growth
(%)
Margin change
(%)
Multiple change4
(%)
Dividend yield(%)
Share change
(%)
Net debt change
(%)
2010TSR5
(%)
1 Sany Heavy Industry China 67.4 8.0 50 1 13 1 –1 4 –25.1
2 Changsha Zoomlion Heavy Industry China 66.4 6.4 49 3 13 2 0 0 –36.6
3 TBEA China 62.3 6.3 37 7 6 1 –1 12 –38.1 4 Doosan Heavy Industries South Korea 48.0 6.5 29 –4 40 1 –1 –17 –6.8 5 Orascom Construction Egypt 47.4 9.4 22 –3 21 3 –1 7 –8.2 6 Larsen & Toubro India 46.6 21.5 30 8 19 2 –16 4 7.5 7 Bharat Heavy Electricals India 44.6 25.8 32 –4 16 1 0 0 2.8 8 WorleyParsons Australia 42.4 6.5 63 2 –13 4 –11 –2 –22.2 9 Hyundai Heavy Industries South Korea 41.0 9.4 20 23 0 3 1 –6 35.5 10 Vestas Wind Systems Denmark 36.1 12.6 21 42 –28 0 –3 4 –19.5
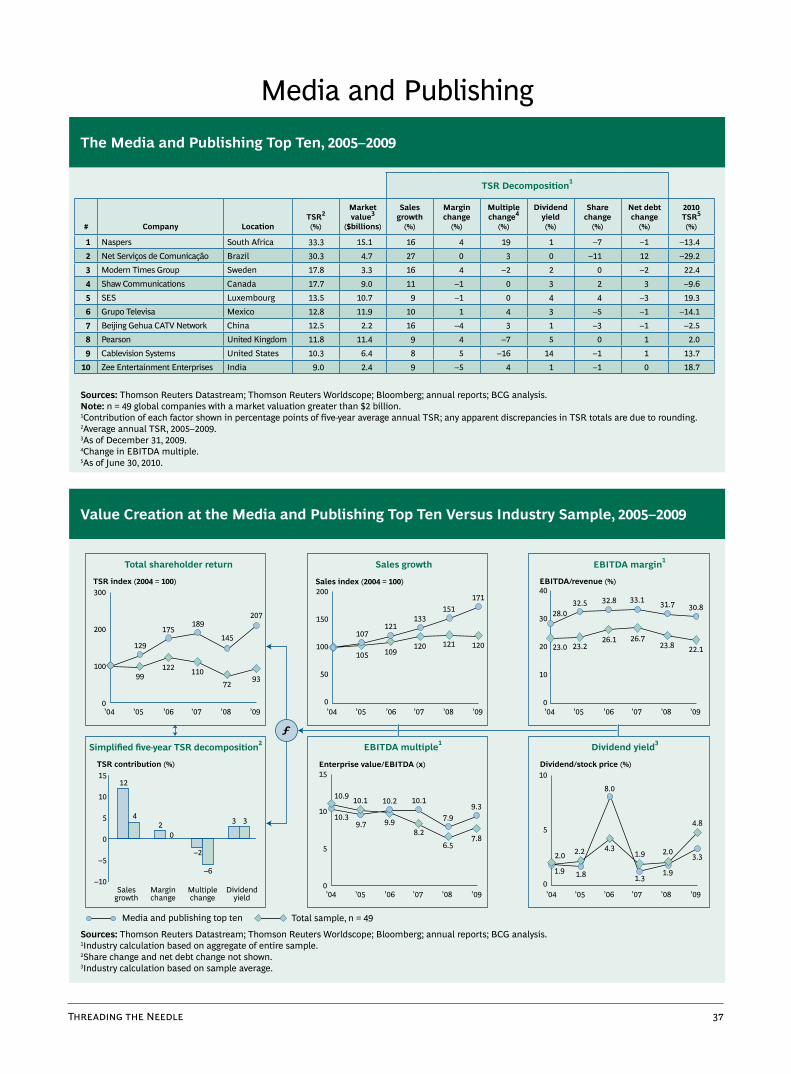
Threading the Needle 37
Media and PublishingThe Media and Publishing Top Ten, 2005–2009
Sources: Thomson Reuters Datastream; Thomson Reuters Worldscope; Bloomberg; annual reports; BCG analysis.Note: n = 49 global companies with a market valuation greater than $2 billion.1Contribution of each factor shown in percentage points of five-year average annual TSR; any apparent discrepancies in TSR totals are due to rounding.2Average annual TSR, 2005–2009.3As of December 31, 2009.4Change in EBITDA multiple.5As of June 30, 2010.
’04 ’05 ’06 ’07 ’08 ’09’04 ’05 ’06 ’07 ’08 ’09’04 ’05 ’06 ’07 ’08 ’09
’04 ’05 ’06 ’07 ’08 ’09 ’04 ’05 ’06 ’07 ’08 ’09Salesgrowth
Marginchange
Multiplechange
Dividendyield
00
5
10
15
0
300
100
200
207
145
189175
129
99122 110
7293
133
120
151
121
171
120
121107
109105
40
20
30
10
0
28.032.5 32.8 33.1 31.7 30.8
23.0 23.226.1 26.7
23.8 22.1
5
10
2.0
1.9 1.8
2.2 4.3
8.0
1.3
1.9
1.9
2.0
4.8
3.3
10.9 10.1 10.2 10.1
7.99.3
7.86.5
8.29.99.7
10.33 3
–6
0
4
0
–10
–5
15
10
5
12
2
–2
0
50
100
150
200
ƒ
Total sample, n = 49Media and publishing top ten
Total shareholder return
Simplified five-year TSR decomposition2
Sales growth
EBITDA multiple1 Dividend yield3
EBITDA margin1
TSR index (2004 = 100) Sales index (2004 = 100) EBITDA/revenue (%)
TSR contribution (%) Enterprise value/EBITDA (x) Dividend/stock price (%)
Value Creation at the Media and Publishing Top Ten Versus Industry Sample, 2005–2009
Sources: Thomson Reuters Datastream; Thomson Reuters Worldscope; Bloomberg; annual reports; BCG analysis.1Industry calculation based on aggregate of entire sample.2Share change and net debt change not shown.3Industry calculation based on sample average.
TSR Decomposition1
# Company LocationTSR2 (%)
Market value3
($billions)
Sales growth
(%)
Margin change
(%)
Multiple change4
(%)
Dividend yield(%)
Share change
(%)
Net debt change
(%)
2010TSR5
(%)
1 Naspers South Africa 33.3 15.1 16 4 19 1 –7 –1 –13.4 2 Net Serviços de Comunicação Brazil 30.3 4.7 27 0 3 0 –11 12 –29.2 3 Modern Times Group Sweden 17.8 3.3 16 4 –2 2 0 –2 22.4 4 Shaw Communications Canada 17.7 9.0 11 –1 0 3 2 3 –9.6 5 SES Luxembourg 13.5 10.7 9 –1 0 4 4 –3 19.3 6 Grupo Televisa Mexico 12.8 11.9 10 1 4 3 –5 –1 –14.1 7 Beijing Gehua CATV Network China 12.5 2.2 16 –4 3 1 –3 –1 –2.5 8 Pearson United Kingdom 11.8 11.4 9 4 –7 5 0 1 2.0 9 Cablevision Systems United States 10.3 6.4 8 5 –16 14 –1 1 13.7 10 Zee Entertainment Enterprises India 9.0 2.4 9 –5 4 1 –1 0 18.7

38 The Boston Consulting Group
Mining and MaterialsThe Mining and Materials Top Ten, 2005–2009
Sources: Thomson Reuters Datastream; Thomson Reuters Worldscope; Bloomberg; annual reports; BCG analysis.Note: n = 47 global companies with a market valuation greater than $10 billion.1Contribution of each factor shown in percentage points of five-year average annual TSR; any apparent discrepancies in TSR totals are due to rounding.2Average annual TSR, 2005–2009.3As of December 31, 2009.4Change in EBITDA multiple.5As of June 30, 2010.
’04 ’05 ’06 ’07 ’08 ’09’04 ’05 ’06 ’07 ’08 ’09’04 ’05 ’06 ’07 ’08 ’09
’04 ’05 ’06 ’07 ’08 ’09 ’04 ’05 ’06 ’07 ’08 ’09Salesgrowth
Marginchange
Multiplechange
Dividendyield
00
5
10
15
0
600
200
400
566
231
543
330
179
140188
268
134
229
227
175
257
200
217
161
169
126146
119
60
20
40
0
38.6 38.643.4
41.038.2
29.9
22.9 24.2 25.6 25.7 24.119.1
3
4
2
1
5
2.9
2.9
3.9
4.4
4.3
4.3
3.2
4.8
1.2
1.3
3.2
2.86.8
5.9
7.48.6
5.0
13.1
11.6
3.8
8.6
6.8
7.0
4.83 3
11
–4
10
0
–10
30
20
10
17
–5
23
0
100
200
300
ƒ
Total sample, n = 47Mining and materials top ten
Total shareholder return
Simplified five-year TSR decomposition2
Sales growth
EBITDA multiple1 Dividend yield3
EBITDA margin1
TSR index (2004 = 100) Sales index (2004 = 100) EBITDA/revenue (%)
TSR contribution (%) Enterprise value/EBITDA (x) Dividend/stock price (%)
Value Creation at the Mining and Materials Top Ten Versus Industry Sample, 2005–2009
Sources: Thomson Reuters Datastream; Thomson Reuters Worldscope; Bloomberg; annual reports; BCG analysis.1Industry calculation based on aggregate of entire sample.2Share change and net debt change not shown.3Industry calculation based on sample average.
TSR Decomposition1
# Company LocationTSR2 (%)
Market value3
($billions)
Sales growth
(%)
Margin change
(%)
Multiple change4
(%)
Dividend yield(%)
Share change
(%)
Net debt change
(%)
2010TSR5
(%)
1 Jindal Steel & Power India 88.2 14.3 57 9 19 2 0 2 –11.3 2 Jiangxi Copper China 50.1 17.8 37 –14 23 3 –3 4 –40.2 3 Vedanta Resources United Kingdom 48.3 12.2 39 2 10 3 0 –6 –18.6 4 Sterlite Industries India 46.7 13.4 30 –3 19 1 –13 13 –20.7 5 Anhui Conch Cement China 44.6 12.9 25 –4 20 1 –6 9 –34.8 6 Grupo México Mexico 43.7 18.3 5 –2 28 4 2 8 2.6 7 Antofagasta United Kingdom 40.1 15.8 9 –4 28 5 0 2 –19.5 8 Siderúrgica Nacional Brazil 38.7 23.5 3 –3 28 8 3 0 –2.9 9 Tenaris Italy 36.5 25.8 15 3 11 4 0 4 –3.7 10 Anglo Platinum South Africa 35.4 25.4 14 –7 26 4 –2 0 –5.4

Threading the Needle 39
’04 ’05 ’06 ’07 ’08 ’09’04 ’05 ’06 ’07 ’08 ’09’04 ’05 ’06 ’07 ’08 ’09
’04 ’05 ’06 ’07 ’08 ’09 ’04 ’05 ’06 ’07 ’08 ’09Salesgrowth
Marginchange
Multiplechange
Dividendyield
00
5
10
15
0
400
100
200
300
324
184
343
172174
114 125 150
75 101
130
129
163
146
169
139116106
10397
15
10
5
12.513.1 12.6
13.5
12.111.2
11.110.6
9.4
11.511.0 10.9
4
2
6
4.3
3.2 3.2
3.3
2.8
3.6
2.6
3.8
1.2
1.3
5.6
4.1
11.0
6.67.7
10.4
6.6
8.9
6.44.7
8.1
10.910.7
4.6
3 3
–4–2
7
0
–5
15
10
5
13
0
8
0
50
100
200
150
ƒ
Total sample, n = 48Multibusiness top ten
Total shareholder return
Simplified five-year TSR decomposition2
Sales growth
EBITDA multiple1 Dividend yield3
EBITDA margin1
TSR index (2004 = 100) Sales index (2004 = 100) EBITDA/revenue (%)
TSR contribution (%) Enterprise value/EBITDA (x) Dividend/stock price (%)
MultibusinessThe Multibusiness Top Ten, 2005–2009
Sources: Thomson Reuters Datastream; Thomson Reuters Worldscope; Bloomberg; annual reports; BCG analysis.Note: n = 48 global companies with a market valuation greater than $3 billion.1Contribution of each factor shown in percentage points of five-year average annual TSR; any apparent discrepancies in TSR totals are due to rounding.2Average annual TSR, 2005–2009.3As of December 31, 2009.4Change in EBITDA multiple.5As of June 30, 2010.
Value Creation at the Multibusiness Top Ten Versus Industry Sample, 2005–2009
Sources: Thomson Reuters Datastream; Thomson Reuters Worldscope; Bloomberg; annual reports; BCG analysis.1Industry calculation based on aggregate of entire sample.2Share change and net debt change not shown.3Industry calculation based on sample average.
TSR Decomposition1
# Company LocationTSR2 (%)
Market value3
($billions)
Sales growth
(%)
Margin change
(%)
Multiple change4
(%)
Dividend yield(%)
Share change
(%)
Net debt change
(%)
2010TSR5
(%)
1 Jaiprakash Associates India 41.7 6.8 12 6 24 1 –9 6 –12.6 2 Beijing Enterprises Hong Kong 40.1 8.2 23 –2 22 3 –11 6 –8.4 3 LG Group South Korea 35.8 11.1 8 1 0 2 0 25 –9.1 4 Hanwha Corporation South Korea 30.1 3.2 11 12 13 2 0 –8 –22.0 5 Noble Group Singapore 27.7 9.0 27 –7 13 5 –7 –3 –17.3 6 Shanghai Industrial Hong Kong 22.7 5.5 15 8 9 4 –2 –10 –19.9 7 WEG Brazil 22.5 6.6 14 –2 6 4 0 1 –7.6
8 China Resources Enterprise Hong Kong 22.5 8.8 6 9 2 5 –2 3 3.5
9 Sembcorp Singapore 21.3 4.7 10 17 –15 4 –1 7 15.1 10 Industries Qatar Qatar 20.9 17.3 13 –6 10 5 0 –1 –11.4
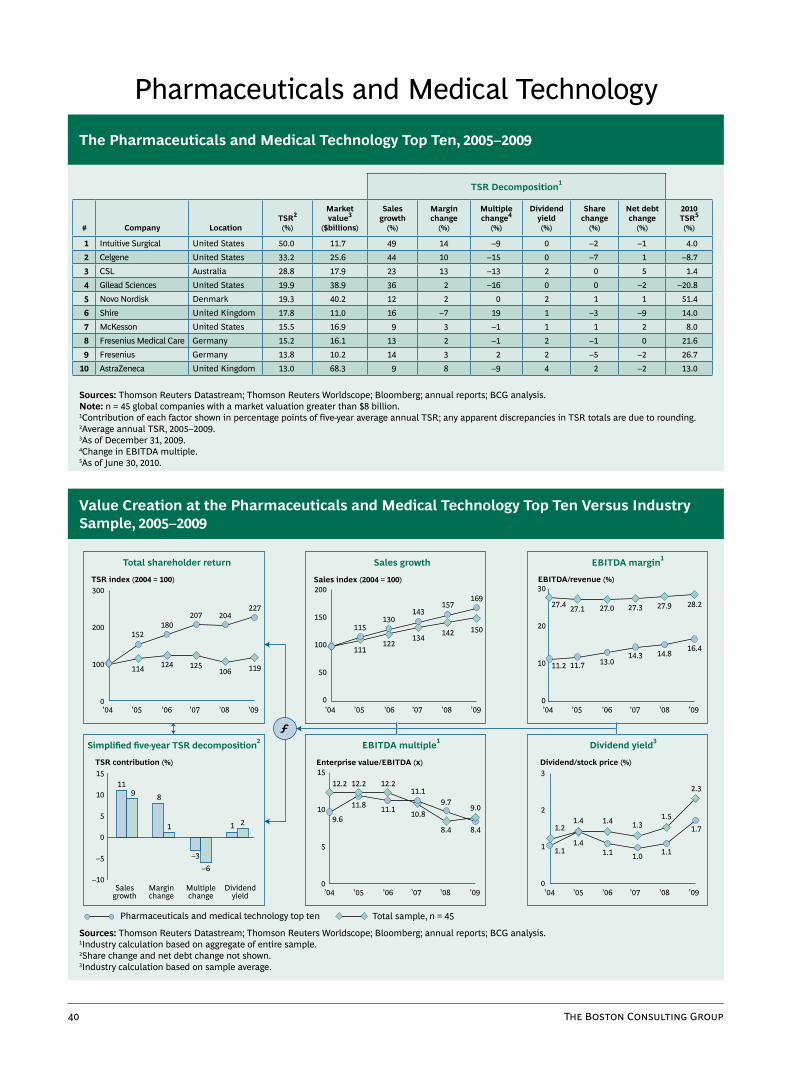
40 The Boston Consulting Group
Pharmaceuticals and Medical TechnologyThe Pharmaceuticals and Medical Technology Top Ten, 2005–2009
Sources: Thomson Reuters Datastream; Thomson Reuters Worldscope; Bloomberg; annual reports; BCG analysis.Note: n = 45 global companies with a market valuation greater than $8 billion.1Contribution of each factor shown in percentage points of five-year average annual TSR; any apparent discrepancies in TSR totals are due to rounding.2Average annual TSR, 2005–2009.3As of December 31, 2009.4Change in EBITDA multiple.5As of June 30, 2010.
’04 ’05 ’06 ’07 ’08 ’09’04 ’05 ’06 ’07 ’08 ’09’04 ’05 ’06 ’07 ’08 ’09
’04 ’05 ’06 ’07 ’08 ’09 ’04 ’05 ’06 ’07 ’08 ’09Salesgrowth
Marginchange
Multiplechange
Dividendyield
00
5
10
15
0
300
100
200
227204207
180152
114 124 125106 119
143
134
157
142
169
150130
115
122111
30
20
10
0
27.4 27.1 27.0 27.3 27.9 28.2
11.2 11.7 13.014.3 14.8
16.4
2
1
3
1.2
1.11.4
1.4
1.1
1.4
1.0
1.3
1.1
1.5
2.3
1.7
12.2
11.8 11.1
11.19.7
9.0
8.48.4
10.8
12.212.2
9.61 2
–6
1
9
0
–10
–5
15
10
5
11
8
–3
0
50
100
200
150
ƒ
Total sample, n = 45Pharmaceuticals and medical technology top ten
Total shareholder return
Simplified five-year TSR decomposition2
Sales growth
EBITDA multiple1 Dividend yield3
EBITDA margin1
TSR index (2004 = 100) Sales index (2004 = 100) EBITDA/revenue (%)
TSR contribution (%) Enterprise value/EBITDA (x) Dividend/stock price (%)
Value Creation at the Pharmaceuticals and Medical Technology Top Ten Versus Industry Sample, 2005–2009
Sources: Thomson Reuters Datastream; Thomson Reuters Worldscope; Bloomberg; annual reports; BCG analysis.1Industry calculation based on aggregate of entire sample.2Share change and net debt change not shown.3Industry calculation based on sample average.
TSR Decomposition1
# Company LocationTSR2 (%)
Market value3
($billions)
Sales growth
(%)
Margin change
(%)
Multiple change4
(%)
Dividend yield(%)
Share change
(%)
Net debt change
(%)
2010TSR5
(%)
1 Intuitive Surgical United States 50.0 11.7 49 14 –9 0 –2 –1 4.0 2 Celgene United States 33.2 25.6 44 10 –15 0 –7 1 –8.7 3 CSL Australia 28.8 17.9 23 13 –13 2 0 5 1.4 4 Gilead Sciences United States 19.9 38.9 36 2 –16 0 0 –2 –20.8 5 Novo Nordisk Denmark 19.3 40.2 12 2 0 2 1 1 51.4 6 Shire United Kingdom 17.8 11.0 16 –7 19 1 –3 –9 14.0 7 McKesson United States 15.5 16.9 9 3 –1 1 1 2 8.0 8 Fresenius Medical Care Germany 15.2 16.1 13 2 –1 2 –1 0 21.6 9 Fresenius Germany 13.8 10.2 14 3 2 2 –5 –2 26.7 10 AstraZeneca United Kingdom 13.0 68.3 9 8 –9 4 2 –2 13.0

Threading the Needle 41
’04 ’05 ’06 ’07 ’08 ’09’04 ’05 ’06 ’07 ’08 ’09’04 ’05 ’06 ’07 ’08 ’09
’04 ’05 ’06 ’07 ’08 ’09 ’04 ’05 ’06 ’07 ’08 ’09Salesgrowth
Marginchange
Multiplechange
Dividendyield
00
5
10
15
0
200
150
50
100
177
96
192
162
112
101118 117
65
92
125
98
136
101
131
92
116112
101102
20
15
10
5
18.017.0
18.3 18.016.5 16.5
14.212.6
13.5 13.9
11.112.6
2
1
5
4
3
3.5
3.02.9
3.0 3.8
3.8
2.8
3.0
1.6
2.0
4.8
4.5
8.9
8.6 9.3
10.08.3
10.5
9.07.1
8.9
9.99.6
8.33 3
0
–1–1
0
–5
10
56
–1
6
0
50
100
150
ƒ
Total sample, n = 29Pulp and paper top ten
Total shareholder return
Simplified five-year TSR decomposition2
Sales growth
EBITDA multiple1 Dividend yield3
EBITDA margin1
TSR index (2004 = 100) Sales index (2004 = 100) EBITDA/revenue (%)
TSR contribution (%) Enterprise value/EBITDA (x) Dividend/stock price (%)
Pulp and PaperThe Pulp and Paper Top Ten, 2005–2009
Sources: Thomson Reuters Datastream; Thomson Reuters Worldscope; Bloomberg; annual reports; BCG analysis.Note: n = 29 global companies with a market valuation greater than $500 million.1Contribution of each factor shown in percentage points of five-year average annual TSR; any apparent discrepancies in TSR totals are due to rounding.2Average annual TSR, 2005–2009.3As of December 31, 2009.4Change in EBITDA multiple.5As of June 30, 2010.
Value Creation at the Pulp and Paper Top Ten Versus Industry Sample, 2005–2009
Sources: Thomson Reuters Datastream; Thomson Reuters Worldscope; Bloomberg; annual reports; BCG analysis.1Industry calculation based on aggregate of entire sample.2Share change and net debt change not shown.3Industry calculation based on sample average.
TSR Decomposition1
# Company LocationTSR2 (%)
Market value3
($billions)
Sales growth
(%)
Margin change
(%)
Multiple change4
(%)
Dividend yield(%)
Share change
(%)
Net debt change
(%)
2010TSR5
(%)
1 Lee & Man Paper Hong Kong 30.2 3.1 38 –15 13 4 –6 –3 8.8 2 Rock-Tenn United States 29.4 2.0 13 18 –2 2 –2 0 –0.8 3 Shandong Huatai Paper China 19.9 1.3 17 –7 17 2 –6 –2 –34.8 4 Semapa Portugal 17.3 1.3 13 –2 –15 4 0 17 –1.9 5 Empresas CMPC Chile 11.4 9.1 12 –6 7 2 –1 –2 19.1 6 Suzano Papel e Celulose Brazil 11.3 3.6 8 –9 13 4 –2 –3 –7.2 7 Portucel Portugal 11.0 2.2 2 –1 1 5 0 4 11.3 8 Temple-Inland United States 9.6 2.3 –5 –4 11 6 1 1 –1.0 9 Mayr-Melnhof Karton Austria 5.4 2.3 2 –2 –1 3 0 3 3.5 10 Rengo Japan 5.3 1.6 4 –2 0 2 –2 5 2.6

42 The Boston Consulting Group
’04 ’05 ’06 ’07 ’08 ’09’04 ’05 ’06 ’07 ’08 ’09’04 ’05 ’06 ’07 ’08 ’09
’04 ’05 ’06 ’07 ’08 ’09 ’04 ’05 ’06 ’07 ’08 ’09Salesgrowth
Marginchange
Multiplechange
Dividendyield
00
5
10
20
15
0
300
200
100
250
177205
161122
103 117 12097
123
152
133
172
142
191
148131
114
120109
15
10
5
12.9 13.2 13.5 13.6 13.9 13.8
8.2 8.2 8.6 8.7 8.58.0
2
1
4
3 2.4
1.6 1.8
3.6
1.7
2.0
1.5
2.2
1.4
1.82.8
2.812.7
10.8 10.6
15.0
10.713.4
9.17.5
9.6
14.212.8
11.83 2
–5
0
8
0
–5
15
10
5
15
1 1
0
50
100
150
200
ƒ
Total sample, n = 50Retail top ten
Total shareholder return
Simplified five-year TSR decomposition2
Sales growth
EBITDA multiple1 Dividend yield3
EBITDA margin1
TSR index (2004 = 100) Sales index (2004 = 100) EBITDA/revenue (%)
TSR contribution (%) Enterprise value/EBITDA (x) Dividend/stock price (%)
RetailThe Retail Top Ten, 2005–2009
Sources: Thomson Reuters Datastream; Thomson Reuters Worldscope; Bloomberg; annual reports; BCG analysis.Note: n = 50 global companies with a market valuation greater than $7 billion.1Contribution of each factor shown in percentage points of five-year average annual TSR; any apparent discrepancies in TSR totals are due to rounding.2Average annual TSR, 2005–2009.3As of December 31, 2009.4Change in EBITDA multiple.5As of June 30, 2010.
Value Creation at the Retail Top Ten Versus Industry Sample, 2005–2009
Sources: Thomson Reuters Datastream; Thomson Reuters Worldscope; Bloomberg; annual reports; BCG analysis.1Industry calculation based on aggregate of entire sample.2Share change and net debt change not shown.3Industry calculation based on sample average.
TSR Decomposition1
# Company LocationTSR2 (%)
Market value3
($billions)
Sales growth
(%)
Margin change
(%)
Multiple change4
(%)
Dividend yield(%)
Share change
(%)
Net debt change
(%)
2010TSR5
(%)
1 Suning Appliance China 81.4 14.2 52 15 16 0 –2 1 –17.5 2 Wal-Mart de México Mexico 26.8 38.3 13 3 9 2 1 –1 –1.9 3 Dairy Farm Singapore 26.1 8.1 12 3 5 7 0 –1 18.3 4 Amazon.com United States 24.9 59.7 28 –4 0 0 –2 2 –18.8 5 Fast Retailing Japan 19.3 18.7 15 –1 6 2 0 –2 –22.0 6 McDonald's United States 17.3 67.2 4 7 –1 3 3 1 7.3 7 Inditex Spain 17.3 39.3 17 2 –5 2 0 1 9.6 8 Woolworths Australia 16.9 31.4 12 7 –2 4 –3 0 –1.7 9 H&M Sweden 15.3 46.7 13 2 –3 4 0 0 12.2
10 Companhia Brasileira de Distribuição Brazil 14.6 9.5 13 –6 6 1 –2 2 –2.4
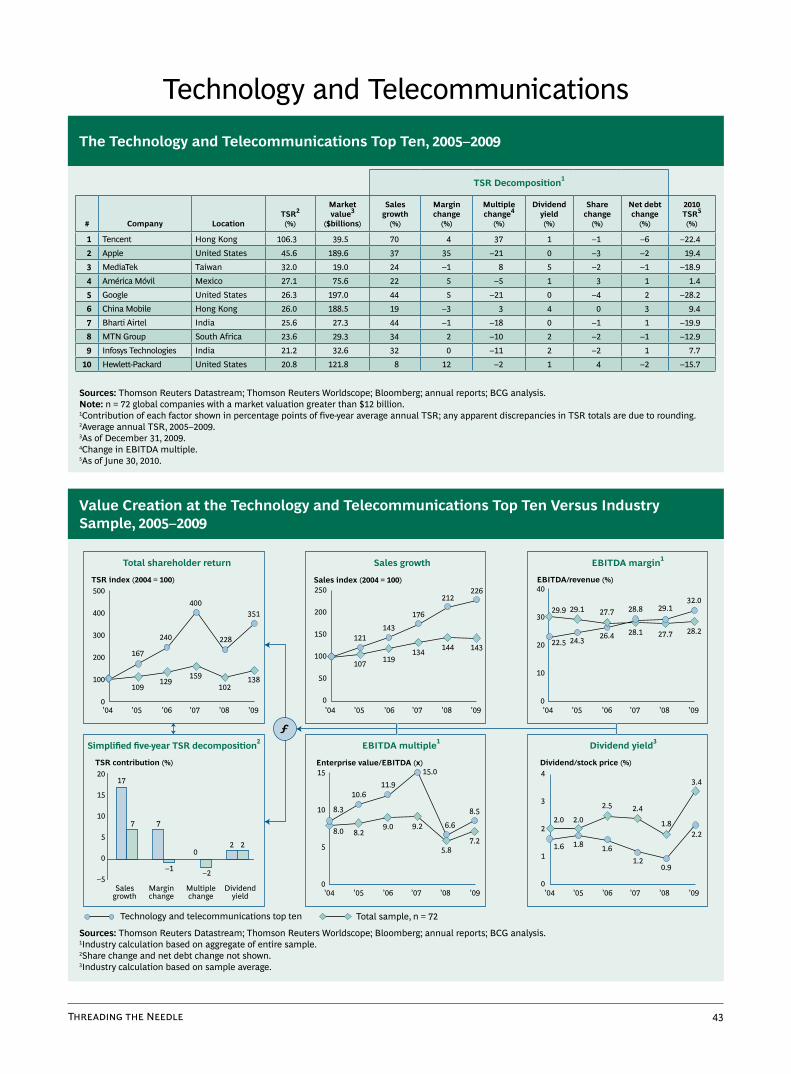
Threading the Needle 43
’04 ’05 ’06 ’07 ’08 ’09’04 ’05 ’06 ’07 ’08 ’09’04 ’05 ’06 ’07 ’08 ’09
’04 ’05 ’06 ’07 ’08 ’09 ’04 ’05 ’06 ’07 ’08 ’09Salesgrowth
Marginchange
Multiplechange
Dividendyield
00
5
10
15
0
500
400
300
100
200
351
228
400
240
167
109129
159102
138
176
134
212
144
226
143
143121
119107
40
30
20
10
0
29.9 29.1 27.7 28.8 29.132.0
22.5 24.3 26.4 28.1 27.7 28.2
2
1
4
3
2.0
1.6 1.8
2.0
1.6
2.5
1.2
2.4
0.9
1.8
3.4
2.2
8.3
8.29.0
15.0
6.6
8.5
7.25.8
9.2
11.910.6
8.0
2 2
–2–1
7
0
–5
20
5
10
15
17
7
0
0
50
150
100
250
200
ƒ
Total sample, n = 72Technology and telecommunications top ten
Total shareholder return
Simplified five-year TSR decomposition2
Sales growth
EBITDA multiple1 Dividend yield3
EBITDA margin1
TSR index (2004 = 100) Sales index (2004 = 100) EBITDA/revenue (%)
TSR contribution (%) Enterprise value/EBITDA (x) Dividend/stock price (%)
Technology and TelecommunicationsThe Technology and Telecommunications Top Ten, 2005–2009
Sources: Thomson Reuters Datastream; Thomson Reuters Worldscope; Bloomberg; annual reports; BCG analysis.Note: n = 72 global companies with a market valuation greater than $12 billion.1Contribution of each factor shown in percentage points of five-year average annual TSR; any apparent discrepancies in TSR totals are due to rounding.2Average annual TSR, 2005–2009.3As of December 31, 2009.4Change in EBITDA multiple.5As of June 30, 2010.
Value Creation at the Technology and Telecommunications Top Ten Versus Industry Sample, 2005–2009
Sources: Thomson Reuters Datastream; Thomson Reuters Worldscope; Bloomberg; annual reports; BCG analysis.1Industry calculation based on aggregate of entire sample.2Share change and net debt change not shown.3Industry calculation based on sample average.
TSR Decomposition1
# Company LocationTSR2 (%)
Market value3
($billions)
Sales growth
(%)
Margin change
(%)
Multiple change4
(%)
Dividend yield(%)
Share change
(%)
Net debt change
(%)
2010TSR5
(%)
1 Tencent Hong Kong 106.3 39.5 70 4 37 1 –1 –6 –22.4 2 Apple United States 45.6 189.6 37 35 –21 0 –3 –2 19.4 3 MediaTek Taiwan 32.0 19.0 24 –1 8 5 –2 –1 –18.9 4 América Móvil Mexico 27.1 75.6 22 5 –5 1 3 1 1.4 5 Google United States 26.3 197.0 44 5 –21 0 –4 2 –28.2 6 China Mobile Hong Kong 26.0 188.5 19 –3 3 4 0 3 9.4 7 Bharti Airtel India 25.6 27.3 44 –1 –18 0 –1 1 –19.9 8 MTN Group South Africa 23.6 29.3 34 2 –10 2 –2 –1 –12.9 9 Infosys Technologies India 21.2 32.6 32 0 –11 2 –2 1 7.7 10 Hewlett-Packard United States 20.8 121.8 8 12 –2 1 4 –2 –15.7

44 The Boston Consulting Group
’04 ’05 ’06 ’07 ’08 ’09’04 ’05 ’06 ’07 ’08 ’09’04 ’05 ’06 ’07 ’08 ’09
’04 ’05 ’06 ’07 ’08 ’09 ’04 ’05 ’06 ’07 ’08 ’09Salesgrowth
Marginchange
Multiplechange
Dividendyield
00
5
10
15
0
300
100
200
239
163
223
177
136
123 135 143
101120
150
130
167
138
142
124
138116
124109
30
20
10
0
18.521.0 22.2 22.9 23.7
25.8
18.4 19.5 18.6 18.0 19.017.7
2
1
4
3
3.5
2.5 2.4
2.9
2.2
2.4
1.7
1.8
1.6
1.7
3.8
3.210.0
9.5 9.6
10.2
7.1
10.2
9.1
7.0
10.1
9.79.8
9.82 2
–1–1
5
0
–5
10
5
9 9
0
0
50
150
100
200
ƒ
Total sample, n = 46Transportation and logistics top ten
Total shareholder return
Simplified five-year TSR decomposition2
Sales growth
EBITDA multiple1 Dividend yield3
EBITDA margin1
TSR index (2004 = 100) Sales index (2004 = 100) EBITDA/revenue (%)
TSR contribution (%) Enterprise value/EBITDA (x) Dividend/stock price (%)
Transportation and LogisticsThe Transportation and Logistics Top Ten, 2005–2009
Sources: Thomson Reuters Datastream; Thomson Reuters Worldscope; Bloomberg; annual reports; BCG analysis.Note: n = 46 global companies with a market valuation greater than $4 billion.1Contribution of each factor shown in percentage points of five-year average annual TSR; any apparent discrepancies in TSR totals are due to rounding.2Average annual TSR, 2005–2009.3As of December 31, 2009.4Change in EBITDA multiple.5As of June 30, 2010.
Value Creation at the Transportation and Logistics Top Ten Versus Industry Sample, 2005–2009
Sources: Thomson Reuters Datastream; Thomson Reuters Worldscope; Bloomberg; annual reports; BCG analysis.1Industry calculation based on aggregate of entire sample.2Share change and net debt change not shown.3Industry calculation based on sample average.
TSR Decomposition1
# Company LocationTSR2 (%)
Market value3
($billions)
Sales growth
(%)
Margin change
(%)
Multiple change4
(%)
Dividend yield(%)
Share change
(%)
Net debt change
(%)
2010TSR5
(%)
1 Huayu Automotive Systems China 41.1 4.4 44 –19 14 1 –11 13 –28.1 2 América Latina Logística Brazil 35.4 12.3 21 6 16 1 –9 –1 –38.7 3 Vopak Netherlands 31.9 5.1 10 8 7 4 0 4 11.0
4 Companhia de Concessões Rodoviárias Brazil 28.5 10.0 16 4 4 6 –2 –1 –5.7
5 CSX United States 21.1 19.1 3 10 0 2 2 5 3.4 6 Kuehne + Nagel Switzerland 18.4 11.7 10 4 2 3 0 1 13.8 7 C.H. Robinson Worldwide United States 17.9 9.8 12 9 –4 2 0 0 –4.4 8 Burlington Northern Santa Fe United States 17.6 33.6 5 7 0 2 2 1 1.9 9 Union Pacific United States 15.6 32.3 3 12 –4 2 1 3 9.7 10 China Merchants Hong Kong 14.2 7.9 8 10 –1 3 –3 –3 4.1
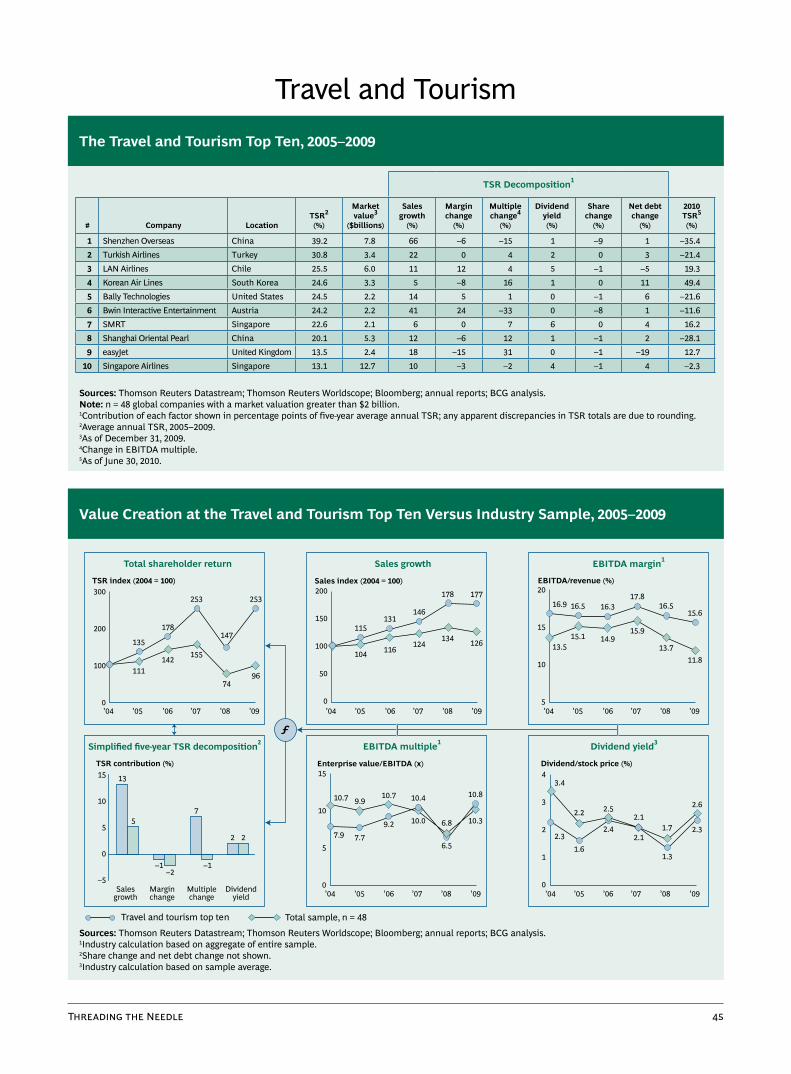
Threading the Needle 45
’04 ’05 ’06 ’07 ’08 ’09’04 ’05 ’06 ’07 ’08 ’09’04 ’05 ’06 ’07 ’08 ’09
’04 ’05 ’06 ’07 ’08 ’09 ’04 ’05 ’06 ’07 ’08 ’09Salesgrowth
Marginchange
Multiplechange
Dividendyield
00
5
10
15
0
300
100
200
253
147
253
178
135
111142 155
7496
146
124
178
134
177
126
131115
116104
20
15
10
5
16.9 16.5 16.317.8
16.515.6
13.515.1 14.9
15.9
13.711.8
2
1
4
3
3.4
2.31.6
2.2
2.4
2.5
2.1
2.1
1.3
1.7
2.6
2.3
10.7
7.7
9.2
10.4
6.8
10.8
10.3
6.5
10.0
10.79.9
7.92 2
–1–2
5
0
–5
15
10
5
13
–1
7
0
50
150
100
200
ƒ
Total sample, n = 48Travel and tourism top ten
Total shareholder return
Simplified five-year TSR decomposition2
Sales growth
EBITDA multiple1 Dividend yield3
EBITDA margin1
TSR index (2004 = 100) Sales index (2004 = 100) EBITDA/revenue (%)
TSR contribution (%) Enterprise value/EBITDA (x) Dividend/stock price (%)
Travel and TourismThe Travel and Tourism Top Ten, 2005–2009
Sources: Thomson Reuters Datastream; Thomson Reuters Worldscope; Bloomberg; annual reports; BCG analysis.Note: n = 48 global companies with a market valuation greater than $2 billion.1Contribution of each factor shown in percentage points of five-year average annual TSR; any apparent discrepancies in TSR totals are due to rounding.2Average annual TSR, 2005–2009.3As of December 31, 2009.4Change in EBITDA multiple.5As of June 30, 2010.
Value Creation at the Travel and Tourism Top Ten Versus Industry Sample, 2005–2009
Sources: Thomson Reuters Datastream; Thomson Reuters Worldscope; Bloomberg; annual reports; BCG analysis.1Industry calculation based on aggregate of entire sample.2Share change and net debt change not shown.3Industry calculation based on sample average.
TSR Decomposition1
# Company LocationTSR2 (%)
Market value3
($billions)
Sales growth
(%)
Margin change
(%)
Multiple change4
(%)
Dividend yield(%)
Share change
(%)
Net debt change
(%)
2010TSR5
(%)
1 Shenzhen Overseas China 39.2 7.8 66 –6 –15 1 –9 1 –35.4 2 Turkish Airlines Turkey 30.8 3.4 22 0 4 2 0 3 –21.4 3 LAN Airlines Chile 25.5 6.0 11 12 4 5 –1 –5 19.3 4 Korean Air Lines South Korea 24.6 3.3 5 –8 16 1 0 11 49.4 5 Bally Technologies United States 24.5 2.2 14 5 1 0 –1 6 –21.6 6 Bwin Interactive Entertainment Austria 24.2 2.2 41 24 –33 0 –8 1 –11.6 7 SMRT Singapore 22.6 2.1 6 0 7 6 0 4 16.2 8 Shanghai Oriental Pearl China 20.1 5.3 12 –6 12 1 –1 2 –28.1 9 easyJet United Kingdom 13.5 2.4 18 –15 31 0 –1 –19 12.7 10 Singapore Airlines Singapore 13.1 12.7 10 –3 –2 4 –1 4 –2.3
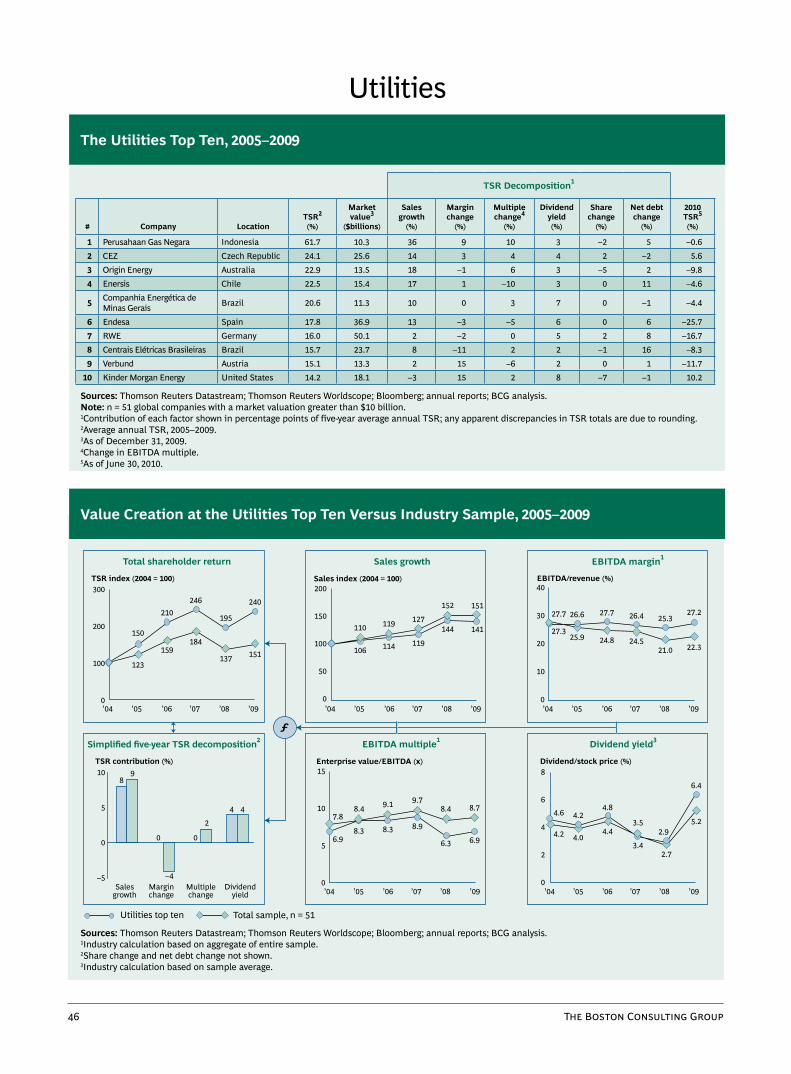
46 The Boston Consulting Group
’04 ’05 ’06 ’07 ’08 ’09’04 ’05 ’06 ’07 ’08 ’09’04 ’05 ’06 ’07 ’08 ’09
’04 ’05 ’06 ’07 ’08 ’09 ’04 ’05 ’06 ’07 ’08 ’09Salesgrowth
Marginchange
Multiplechange
Dividendyield
00
5
10
15
0
300
100
200
240
195
246210
150
123
159184
137 151
127
119
152
144
151
141119110
114106
40
20
30
10
0
27.7 26.6 27.7 26.4 25.327.2
27.325.9 24.8 24.5
21.0 22.3
4
2
8
6
4.6
4.2 4.0
4.2
4.4
4.8
3.4
3.5
2.7
2.9
6.4
5.27.8
8.3 8.3
9.78.4 8.7
6.96.3
8.9
9.18.4
6.9
4 4
2
–4
9
0
–5
10
5
8
0 0
0
50
150
100
200
ƒ
Total sample, n = 51Utilities top ten
Total shareholder return
Simplified five-year TSR decomposition2
Sales growth
EBITDA multiple1 Dividend yield3
EBITDA margin1
TSR index (2004 = 100) Sales index (2004 = 100) EBITDA/revenue (%)
TSR contribution (%) Enterprise value/EBITDA (x) Dividend/stock price (%)
UtilitiesThe Utilities Top Ten, 2005–2009
Sources: Thomson Reuters Datastream; Thomson Reuters Worldscope; Bloomberg; annual reports; BCG analysis.Note: n = 51 global companies with a market valuation greater than $10 billion.1Contribution of each factor shown in percentage points of five-year average annual TSR; any apparent discrepancies in TSR totals are due to rounding.2Average annual TSR, 2005–2009.3As of December 31, 2009.4Change in EBITDA multiple.5As of June 30, 2010.
Value Creation at the Utilities Top Ten Versus Industry Sample, 2005–2009
Sources: Thomson Reuters Datastream; Thomson Reuters Worldscope; Bloomberg; annual reports; BCG analysis.1Industry calculation based on aggregate of entire sample.2Share change and net debt change not shown.3Industry calculation based on sample average.
TSR Decomposition1
# Company LocationTSR2 (%)
Market value3
($billions)
Sales growth
(%)
Margin change
(%)
Multiple change4
(%)
Dividend yield(%)
Share change
(%)
Net debt change
(%)
2010TSR5
(%)
1 Perusahaan Gas Negara Indonesia 61.7 10.3 36 9 10 3 –2 5 –0.6 2 CEZ Czech Republic 24.1 25.6 14 3 4 4 2 –2 5.6 3 Origin Energy Australia 22.9 13.5 18 –1 6 3 –5 2 –9.8 4 Enersis Chile 22.5 15.4 17 1 –10 3 0 11 –4.6
5 Companhia Energética de Minas Gerais Brazil 20.6 11.3 10 0 3 7 0 –1 –4.4
6 Endesa Spain 17.8 36.9 13 –3 –5 6 0 6 –25.7 7 RWE Germany 16.0 50.1 2 –2 0 5 2 8 –16.7 8 Centrais Elétricas Brasileiras Brazil 15.7 23.7 8 –11 2 2 –1 16 –8.3 9 Verbund Austria 15.1 13.3 2 15 –6 2 0 1 –11.7 10 Kinder Morgan Energy United States 14.2 18.1 –3 15 2 8 –7 –1 10.2

Threading the Needle 47
The Boston Consulting Group pub-lishes many reports and articles on corporate development and value creation that may be of interest to senior executives. Examples include:
Investors’ Priorities in the Postdownturn EconomyBCG article, July 2010
Accelerating Out of the Great Recession: Seize the Opportunities in M&AA report by The Boston Consulting Group, June 2010
Cross-Border PMI: Understanding and Overcoming the ChallengesA Focus by The Boston Consulting Group, May 2010
Megatrends: Tailwinds for Growth in a Low-Growth Environment A Focus by The Boston Consulting Group, May 2010
Rebound but Not Yet RecoveryBCG article, March 2010
After the StormThe 2010 Creating Value in Banking Report, February 2010
Time to Engage—or Fade Away: What All Owners Should Learn from the Shakeout in Private Equity BCG White Paper, published with the IESE Business School of the University of Navarra, February 2010
M&A: Ready for Liftoff? A Survey of European Companies’ Merger and Acquisition Plans for 2010BCG White Paper, published with UBS Investment Bank, December 2009
Searching for Sustainability: Value Creation in an Era of Diminished ExpectationsThe 2009 Value Creators Report, October 2009
Be Daring When Others Are Fearful: Seizing M&A Opportunities While They LastA report by The Boston Consulting Group, September 2009
Fixing What’s Wrong with Executive CompensationBCG White Paper, June 2009
Real-World PMI: Learning from Company ExperiencesA Focus by The Boston Consulting Group, June 2009
The Clock Is Ticking: Preparing to Seize M&A Opportunities While They LastBCG White Paper, May 2009
Thriving Under Adversity: Strategies for Growth in the Crisis and BeyondBCG White Paper, May 2009
Collateral Damage: Function Focus; Valuation Advantage—How Investors Want Companies to Respond to the DownturnBCG White Paper, April 2009
Get Ready for the Private-Equity Shakeout: Will This Be the Next Shock to the Global Economy?BCG White Paper, published with the IESE Business School of the University of Navarra, December 2008
M&A: Down but Not Out; A Survey of European Companies’ Merger and Acquisition Plans for 2009BCG White Paper, December 2008
Missing Link: Focusing Corporate Strategy on Value CreationThe 2008 Value Creators Report, September 2008
Venturing Abroad: Chinese Banks and Cross-Border M&AA report by The Boston Consulting Group, September 2008
The Return of the Strategist: Creating Value with M&A in DownturnsA report by The Boston Consulting Group, May 2008
Managing Shareholder Value in Turbulent TimesThe 2008 Creating Value in Banking Report, March 2008
The Advantage of Persistence: How the Best Private-Equity Firms “Beat the Fade”A report by The Boston Consulting Group, published with the IESE Business School of the University of Navarra, February 2008
Eyes Wide Open: Managing the Risks of Acquisitions in Rapidly Developing EconomiesA Focus by The Boston Consulting Group, January 2008
Thinking Laterally in PMI: Optimizing Functional SynergiesA Focus by The Boston Consulting Group, January 2008
Avoiding the Cash Trap: The Challenge of Value Creation When Profits Are HighThe 2007 Value Creators Report, September 2007
The Brave New World of M&A: How to Create Value from Mergers and AcquisitionsA report by The Boston Consulting Group, July 2007
For Further Reading

48 The Boston Consulting Group
AcknowledgmentsThis report is a product of BCG’s Corporate Development practice. The authors would like to acknowl-edge the contributions of the follow-ing global experts in corporate devel-opment: Andrew Clark, a senior partner and managing director in the firm’s Auckland office and leader of the Corporate Development practice in Asia-Pacific; Danny Friedman, a senior partner and managing direc-tor in BCG’s Los Angeles office and leader of the Corporate Develop-ment practice in the Americas; Jérôme Hervé, a senior partner and managing director in the firm’s Paris office and leader of the Corporate Development practice in Europe; Lars-Uwe Luther, a partner and managing director in BCG’s Berlin of-fice and global head of marketing for the Corporate Development practice; and Brett Schiedermayer, the man-aging director of the BCG Value-Science Center in South San Francis-co, California, a research center that develops leading-edge valuation tools and techniques for M&A and corporate-strategy applications.
The authors would also like to thank Robert Howard for his contributions to the writing of the report; Hady Farag, a project leader in BCG’s Frankfurt office, for his contributions in managing the firm’s Munich-based Value Creators research team; Ker-stin Hobelsberger, Martin Link, and Dirk Schilder of the Value Creators research team for their contributions to the research; and Katherine Andrews, Gary Callahan, Angela DiBattista, Elyse Friedman, Kim Friedman, Pamela Gilfond, Sean Hourihan, Sara Strassenreiter, and Simon Targett for their contributions to the editing, design, and produc-tion of the report.
For Further ContactFor further information about the report or to learn more about BCG’s capabilities in corporate develop-ment and value management, you may contact the authors.
Eric OlsenSenior Partner and Managing DirectorBCG Chicago+1 312 993 [email protected]
Frank PlaschkePartner and Managing Director BCG Munich+49 89 23 17 [email protected]
Daniel StelterSenior Partner and Managing DirectorBCG Berlin+49 30 28 87 [email protected]
Note to the Reader

For a complete list of BCG publications and information about how to obtain copies, please visit our website at www.bcg.com/publications.
To receive future publications in electronic form about this topic or others, please visit our subscription website at www.bcg.com/subscribe.
9/10

Abu DhabiAmsterdamAthensAtlantaAucklandBangkokBarcelonaBeijingBerlinBostonBrusselsBudapestBuenos AiresCanberraCasablanca
ChicagoCologneCopenhagenDallasDetroitDubaiDüsseldorfFrankfurtHamburgHelsinkiHong KongHoustonIstanbulJakartaKiev
Kuala LumpurLisbonLondonLos AngelesMadridMelbourneMexico CityMiamiMilanMinneapolisMonterreyMoscowMumbaiMunichNagoya
New DelhiNew JerseyNew YorkOsloParisPhiladelphiaPragueRomeSan FranciscoSantiagoSão PauloSeoulShanghaiSingaporeStockholm
StuttgartSydneyTaipeiTokyoTorontoViennaWarsawWashingtonZurich
bcg.com
Related Documents


