REPORT Report Date: October 22, 2020 Contact: Matt Horne Contact No.: 604.673.8331 RTS No.: 13199 VanRIMS No.: 08-2000-20 Meeting Date: November 3, 2020 TO: Vancouver City Council FROM: General Manager of Planning, Urban Design and Sustainability and General Manager of Engineering Services SUBJECT: Climate Emergency Action Plan RECOMMENDATIONS RECOMMENDATIONS FOR HOW WE MOVE To achieve the City’s complete, walkable neighbourhoods target (by 2030, 90% of people live within an easy walk/roll of their daily needs): A. THAT Council direct staff to report back on specific recommendations and actions on achieving the City’s complete, walkable neighbourhoods target through the Vancouver Plan. B. THAT Council direct staff to seek to exceed the City’s walkable neighbourhoods target in current planning initiatives, such as the Broadway Plan, and that Council adopt a sustainable transportation target of at least 80% of trips being made on foot, bike or transit by 2030 in current and emerging planning areas around rapid transit stations. To achieve the City’s sustainable transportation target (by 2030, two thirds of all trips in Vancouver will be made on foot, bike or transit): C. THAT Council direct staff to accelerate implementation of the Transportation 2040 directions. D. THAT Council direct staff to develop a Vancouver Transport Pricing Strategy and work toward implementation within the Metro Core by 2025 in accordance with Appendix A.

Welcome message from author
This document is posted to help you gain knowledge. Please leave a comment to let me know what you think about it! Share it to your friends and learn new things together.
Transcript
REPORT
Report Date: October 22, 2020 Contact: Matt Horne Contact No.: 604.673.8331 RTS No.: 13199 VanRIMS No.: 08-2000-20 Meeting Date: November 3, 2020
TO: Vancouver City Council
FROM: General Manager of Planning, Urban Design and Sustainability and General Manager of Engineering Services
SUBJECT: Climate Emergency Action Plan
RECOMMENDATIONS
RECOMMENDATIONS FOR HOW WE MOVE To achieve the City’s complete, walkable neighbourhoods target (by 2030, 90% of people live within an easy walk/roll of their daily needs):
A. THAT Council direct staff to report back on specific recommendations and actions on achieving the City’s complete, walkable neighbourhoods target through the Vancouver Plan.
B. THAT Council direct staff to seek to exceed the City’s walkable neighbourhoods
target in current planning initiatives, such as the Broadway Plan, and that Council adopt a sustainable transportation target of at least 80% of trips being made on foot, bike or transit by 2030 in current and emerging planning areas around rapid transit stations.
To achieve the City’s sustainable transportation target (by 2030, two thirds of all trips in Vancouver will be made on foot, bike or transit):
C. THAT Council direct staff to accelerate implementation of the Transportation 2040 directions.
D. THAT Council direct staff to develop a Vancouver Transport Pricing Strategy and
work toward implementation within the Metro Core by 2025 in accordance with Appendix A.
Climate Emergency Action Plan – RTS 13199 2
E. THAT Council direct staff to develop 5-year (2021–25) active transportation and transit priority plans and begin to seek implementation in 2021 in accordance with Appendices B1–B4.
F. THAT Council direct staff to develop a City-Wide Transportation Demand
Management Action Plan, including the promotion of remote and flexible work, and begin to seek implementation in 2021 in accordance with Appendices C1–2 and Appendix D.
G. THAT Council direct staff to bring forward recommendations in 2021 aimed at
eliminating off-street motor vehicle parking requirement minimums, except for spaces required for accessibility, implementing parking maximums, and further supporting sustainable transportation choices in new developments in accordance with Appendix E;
FURTHER THAT Council direct staff to bring forward recommendations in 2021 to transition toward managing all curbside space, including an on-street parking permit system city-wide to support the elimination of parking requirements in buildings and better manage parking within neighbourhoods, and to support the introduction of carbon pollution surcharges for vehicles in accordance with Appendix F.
To achieve the City’s zero emissions vehicles target (by 2030, 50% of the kilometres driven on Vancouver’s roads will be by zero emissions vehicles):
H. THAT Council direct staff to bring forward recommendations in 2021 to apply a residential parking permit surcharge for vehicle model years 2022 and later with the surcharge price accounting for the vehicle’s carbon intensity and cost in accordance with Appendix F.
I. THAT Council direct staff to develop and seek to implement programs to provide
near-home electric vehicles (EV) charging options for residents without foreseeable access to home charging, and to expand access to Fast Charging Hubs and Level 2 charging at suitable amenities across the City in accordance with Appendix G.
J. THAT Council direct staff to develop and seek to implement programs to expand
access to off-street EV charging infrastructure for Vancouver residents in existing residential rental buildings in accordance with Appendix H.
K. THAT Council direct staff to bring forward recommendations in 2021 to increase
requirements for off-street EV charging in new non-residential buildings in accordance with Appendix H.
L. THAT Council direct staff to bring forward recommendations in 2021 to change
the business license fees for gas stations and parking lots to encourage installation of EV charging in accordance with Appendix H.
M. THAT Council direct staff to develop and seek to implement programs to support
the electrification of light-duty passenger fleets, transit and urban freight in accordance with Appendix I.
Climate Emergency Action Plan – RTS 13199 3 RECOMMENDATIONS FOR HOW WE BUILD AND RENOVATE To achieve the City’s zero emissions space and water heating target (by 2030, the carbon pollution from buildings will be cut in half from 2007 levels):
N. THAT Council direct staff to bring forward recommendations in 2021 to limit
annual carbon pollution from existing large commercial buildings and detached homes beginning in 2025 in accordance with Appendix J.
O. THAT Council direct staff to bring forward recommendations in 2021 requiring
energy and emissions reporting (benchmarking) by large commercial and multi-family building and detached home owners by 2023, and for the provision of the tools, systems and programs required to support this reporting in accordance with Appendix J.
P. THAT Council direct staff to seek authority in the Vancouver Charter to facilitate
building owner access to favourable financing and third-party investment in deep emissions retrofits by enabling long-term and secure repayment of this investment as part of property tax collection, such as property assessed clean energy (PACE) financing in accordance with Appendix J.
Q. THAT Council direct staff to seek to implement the elements of the Zero
Emissions Buildings Retrofit Strategy, including the development of incentives, the removal of barriers, support for capacity building, and collaboration with utilities on the provision of renewable energy in accordance with Appendix J.
To achieve the City’s target to reduce carbon pollution associated with new building construction (by 2030, the embodied emissions from new buildings will be reduced by 40% compared to a 2018 baseline):
R. THAT Council direct staff to bring forward recommendations on updates to the Green Buildings Policy for Rezonings in 2021 to set initial limits for embodied carbon in impacted new developments in accordance with Appendix K.
S. THAT Council direct staff to bring forward recommendations in 2021 on
incentives that encourage the use of materials and practices that substantially reduce embodied carbon from the construction of new buildings in accordance with Appendix K.
T. THAT Council direct staff to seek to implement the Embodied Carbon Strategy,
including the development of additional incentives, the removal of barriers, support for the expansion of industry capacity, and alignment of complementary City strategies for low-carbon construction in accordance with Appendix K.
RECOMMENDATIONS FOR HOW WE CAPTURE CARBON
U. THAT Council amend the timeline from fall 2020 to fall 2021 for staff to report back with nature-based carbon sequestration targets and recommended pilot projects, potentially working with local First Nations, Metro Vancouver and other local municipalities.
RECOMMENDATIONS FOR THE INVESTMENT STRATEGY & FINANCIAL FRAMEWORK
Climate Emergency Action Plan – RTS 13199 4
V. THAT Council receive for information the 5-year forecast of City investment requirements (Appendix L) as a road map to enable the City to scale up climate action over the next five years, in line with efforts to achieve our 2030 climate targets.
W. THAT Council direct staff to bring forward in 2021 potential new or additional fees
or charges that will encourage low-carbon investments and behaviours, while providing a sustainable funding source to support climate emergency actions.
X. THAT Council endorse climate action as one of the key priorities in the City’s mid
to long-term capital planning processes, including development of the next 10-year Capital Strategic Outlook and 4-year Capital plan, recognizing the scale of action needed to achieve our 2030 climate targets.
Y. THAT Council direct staff to continue pursuit of funding from senior governments
and partners to support the implementation of the Climate Emergency Action Plan, including partnering with Federation of Canadian Municipalities, Union of British Columbia Municipalities and Vancouver Economic Commission to advocate for dedicated and sustainable funding sources.
GENERAL RECOMMENDATIONS
Z. THAT Council adopt the indicators framework in accordance with Appendix M and direct staff to report annually on progress toward the City’s climate change targets and commitments in the Climate Emergency Action Plan.
AA. THAT Council direct staff to be available to share knowledge and seek to
collaborate with the xʷməθkʷəy̓əm (Musqueam), Sḵwx̱wú7mesh (Squamish), and Sel̓íl̓witulh (Tsleil-Waututh) First Nations on the development and implementation of climate plans, and explore financial support for the First Nations to help with the development and implementation of their climate plans.
BB. THAT Council approve the continuation of the Climate and Equity Working Group
and direct staff to develop for Council approval a Climate Justice Charter with the Climate and Equity Working Group to ensure equity is integrated and supported through the City’s climate actions in accordance with Appendix N.
CC. THAT Council direct staff to continue engaging with residents and businesses on
the implementation of the actions within the Climate Emergency Action Plan with careful consideration of equity and including efforts to reach disproportionately impacted communities.
DD. THAT Council direct staff to prioritize actions that support and improve the
effectiveness of the climate emergency initiatives, such as the enforcement of climate-related by-laws in accordance with Appendices J and K.
EE. THAT Council direct staff to continue working with core partners such as the
provincial and federal government, BC Hydro, FortisBC, TransLink and Metro Vancouver to advance common regional, provincial and national climate goals in accordance with Appendix O.
Climate Emergency Action Plan – RTS 13199 5
FF. THAT Council direct staff to use the Vancouver Plan to set the foundation for Vancouver’s next comprehensive environmental plan and bring forward recommendations in 2021 on the next steps to develop that comprehensive environmental plan.
REPORT SUMMARY
In January 2019, Vancouver Council declared a climate emergency in recognition of the urgent threat posed by climate change, and as a call to scale up Vancouver’s efforts to cut carbon pollution. In April 2019, Council approved the Climate Emergency Response, which established six new targets (referred to as “Big Moves”) to guide the City’s efforts in response to the climate emergency. The Climate Emergency Action Plan (this report) provides the road map to achieve the following four Big Move targets in ways that also bring financial, health and economic benefits to Vancouver:
• Big Move 2: By 2030, two thirds of all trips in Vancouver will be made on foot, bike or transit.
• Big Move 3: By 2030, 50% of the kilometres driven on Vancouver’s roads will be by zero emissions vehicles.
• Big Move 4: By 2030, the carbon pollution from buildings will be cut in half from 2007 levels.
• Big Move 5: By 2030, the embodied emissions from new buildings will be reduced by 40% compared to a 2018 baseline.
Big Move 1—by 2030, 90% of people live within an easy walk/roll of their daily needs—is still critical to the City’s overall success in fighting climate change, and the actions to achieve that target are being developed through the Vancouver Plan process. Big Move 6 focuses on the role Vancouver can play in removing carbon pollution from the atmosphere through sequestration actions, such as restoring forests and coasts, and will be reported on in 2021. The decisions made while developing the Climate Emergency Action Plan were based on the principles defined by the International Association of Public Participation—balancing staff, public and stakeholder input with technical, environmental and financial considerations. During the engagement period, staff collected feedback through an online survey, 25 dialogues, 10 stakeholder meetings, three market research surveys, and 94 interviews conducted in Mandarin, Cantonese and Punjabi. In total, 16,926 comments were received from 3,284 respondents. In declaring a climate emergency, Council placed a high priority on incorporating equity into the Climate Emergency Action Plan. To respond to this direction, the CEAP was developed with input from the Climate and Equity Working Group, and with the recommendations from three independent reviews of the engagement materials and draft actions that were undertaken through an equity lens. In response to this input, the actions have been adjusted to avoid burdening disproportionately impacted communities, and the regulatory and pricing actions have been focused on those most able to afford them. There are also numerous commitments to build on this work and more deeply integrate equity into the Climate Emergency Action Plan as we transition into implementation.
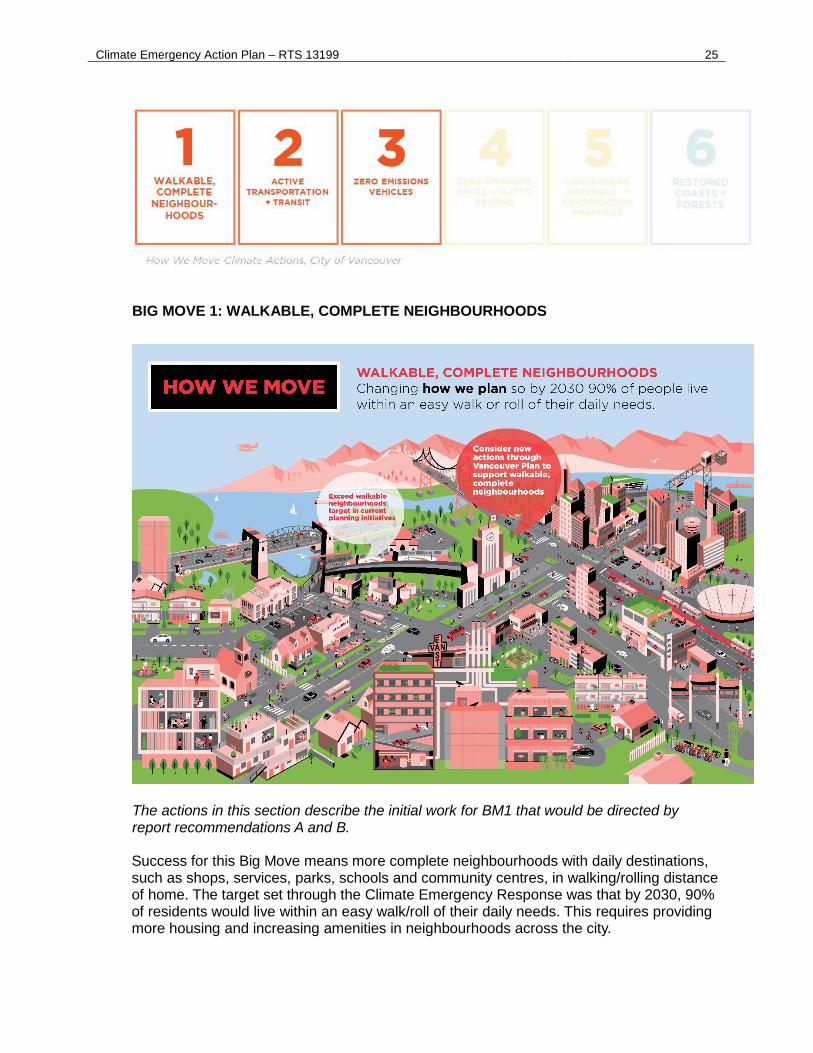
Climate Emergency Action Plan – RTS 13199 6 In total, there are 19 actions in the Climate Emergency Action Plan to support Big Moves 2, 3, 4, and 5. They have been grouped into the How We Move and How We Build/Renovate categories, as shown below. HOW WE MOVE Big Move 2: Active Transportation and Transit By 2030, two thirds of all trips in Vancouver will be made on foot, bike or transit.
Actions: • Implement Transport Pricing in the Metro Core • Expand and Improve Our Walking/Rolling, Biking Network • Improve Bus Speed and Reliability • Encourage More Walking, Biking and Transit Use • Promote Remote and Flexible Work Options • Eliminate Parking Minimums and Introduce Parking Maximums in New Developments • Implement Residential Parking Permits City-Wide
Big Move 3: Zero Emissions Vehicles By 2030, 50% of the kilometres driven on Vancouver’s roads will be by zero emissions vehicles.
Actions: • Implement a Carbon Pollution Surcharge on Residential Parking Permits • Expand Public Charging Network • Increase EV Charging on Private Property • Support Charging Infrastructure for Passenger Fleets
HOW WE BUILD/RENOVATE Big Move 4: Zero Emissions Space and Water Heating By 2030, the carbon pollution from buildings will be cut in half from 2007 levels.
Actions: • Set Carbon Pollution Limits and Streamlined Regulations • Support Early Owner Action • Build Industry Capacity • Facilitate Access to Renewable Energy
Big Move 5: Low-Carbon Construction Materials By 2030, the embodied emissions from new buildings will be reduced by 40% compared to a 2018 baseline.
Actions: • Set Embodied Carbon Pollution Limits for New Buildings • Make It Easier and Less Expensive to Use Lower-Carbon Materials in New Buildings • Support the People Using Low-Carbon Materials in New Buildings • Low-Carbon Planning and Strategies
Each of the actions has been costed and incorporated into an overall investment strategy and financial framework for the Climate Emergency Action Plan to ensure that the City is resourced to follow through on these commitments. In total, it is estimated the City will need to invest close to $500M over the next five years to implement the CEAP, with those funds expected to come
Climate Emergency Action Plan – RTS 13199 7 from the existing capital plan, new fees and charges from climate emergency actions, potential increase in investment in climate emergency actions in the next capital plan, and contributions from senior levels of government and other partners. As well, projects that rely on City investment will be delivered using more cost-effective approaches. According to modelling commissioned by the City, these actions give us a credible pathway to our targets if we implement them ambitiously and they are complemented with actions from our key partners, such as the Government of B.C. and their CleanBC plan. The pathway to the targets is narrow and the actions need to be implemented as a package in order to be successful. The same modelling also assessed the financial implications of this transition for residents and businesses. The resident and business investments in solutions, such as electric vehicles and heat pumps, that occur between 2021 and 2030 in response to the Climate Emergency Action Plan and CleanBC are estimated at $1.27B. Those investments, in turn, generate savings estimated at $2.25B over the life of the investments, for a net resident and business savings of $980M. The Climate Emergency Action Plan offers numerous non-financial benefits in addition to the $980M in savings. These include continuing to grow Vancouver’s green economy as workers and businesses develop their skills and supply chains for zero emissions mobility and buildings; improving the health of our residents through reduced pollution and noise, and more active lifestyles; and reducing the climate adaptation costs the city faces from climate change impacts, such as storm flooding, extreme heat, and wildfire smoke. If Council is supportive of the road map provided by the Climate Emergency Action Plan, staff will begin further analysis and engagement on the 19 actions as we transition to implementation. Detailed reports for by-law changes and new programs will be brought back to Council for consideration starting in 2021 and continuing over the following five years.
COUNCIL AUTHORITY/PREVIOUS DECISIONS
On April 29, 2019, Council approved the Climate Emergency Response and associated targets and directed staff to:
1. Develop strategies to achieve the following six targets (referred to as “Big Moves”) and report back to Council by fall 2020:
a. By 2030, 90% of people live within an easy walk/roll of their daily needs (Big Move 1).
b. By 2030, two thirds of trips in Vancouver will be by active transportation and transit (Big Move 2).
c. By 2030, 50% of the kilometres driven on Vancouver’s roads will be by zero emissions vehicles (Big Move 3).
d. By 2025, all new and replacement heating and hot water systems will be zero emissions (Big Move 4).
e. By 2030, the embodied emissions in new buildings and construction projects will be reduced by 40% compared to a 2018 baseline (Big Move 5).
f. By fall 2020, to develop “negative emissions” targets that can be achieved by restoring forest and coastal ecosystems (Big Move 6).
2. Begin implementing the Accelerated Actions in the Climate Emergency Response and report back to Council with an overall progress report by May 2020.
Climate Emergency Action Plan – RTS 13199 8
3. Proceed with the development of a carbon budgeting and accountability framework for corporate and city-wide carbon pollution that meets the objectives described in that report.
4. Proceed with the formation of the Climate and Equity Working Group according to the objectives, process, timelines, participants and budget described in that report.
5. Proceed with the development of Vancouver’s next environmental plan, Greenest City 2050, which will incorporate the work from the Climate Emergency Response report, as well as broader environmental sustainability objectives, and report back on the recommended strategy that will be integrated and coordinated with the Vancouver Plan.
6. Integrate the six (6) Big Moves in that report into the development of the Vancouver Plan, recognizing there will be further development and refinement of the Big Moves that will be informed by and coordinated with City-wide planning.
This report provides the strategies developed by staff to achieve Big Moves 2, 3, 4 and 5(including an accompanying financial framework), and the carbon-budgeting and accountability framework to track progress. The recommended strategies are informed by technical modelling, public and stakeholder engagement, and the discussions of the Climate and Equity Working Group. This report builds on a long history of climate mitigation planning and action at the City of Vancouver. Highlights include:
• Clouds of Change (1990) • Transportation Plan (1997) • The Climate-Friendly City (2005) • EcoDensity (2008) • Greenest City 2020 Action Plan (2011) • Transportation 2040 (2012) • The Strategic Approach to Neighbourhood Energy (2012) • Healthy City Strategy – Four Year Action Plan (2014) • The Renewable City Strategy (2015) • The Zero Emissions Building Plan (2016) • The Electric Vehicle Ecosystem Strategy (2016) • Renewable City Action Plan (2017) • Zero Waste 2040 (2018) • Climate Emergency Declaration and Response (2019)
The Climate Emergency Action Plan directly supports the Climate Change Adaptation Strategy (2012, 2018) and the Resilient Vancouver Strategy (2019), which recommend objectives and actions to build resilience to major shocks and stresses impacting Vancouver, now and in the future. Many of the impacts of those shocks and stresses (e.g., floods and extreme weather) are the result of inadequate mitigation actions.
CITY MANAGER'S/GENERAL MANAGER'S COMMENTS
Council has declared a Climate Emergency. The climate change challenge is clearly one of the greatest of our time. Since the 1990s, Vancouver has been a global leader in tackling climate change. The Climate Emergency Action Plan as outlined in this report provides a comprehensive framework for addressing climate change in Vancouver and can serve as a model for other cities. The implementation of this plan will require considerable effort in the years to come, but doing so will help to save residents and businesses money on energy, reduce air pollution, and make it easier for everyone to get around the city without requiring a
Climate Emergency Action Plan – RTS 13199 9 car. In addition to addressing affordability and reconciliation, the development of this plan has included equity as a primary pillar and the recommended actions will help to make Vancouver a more equitable city. The City Manager supports the recommendations in the report.
REPORT
BACKGROUND/SETTING THE STAGE
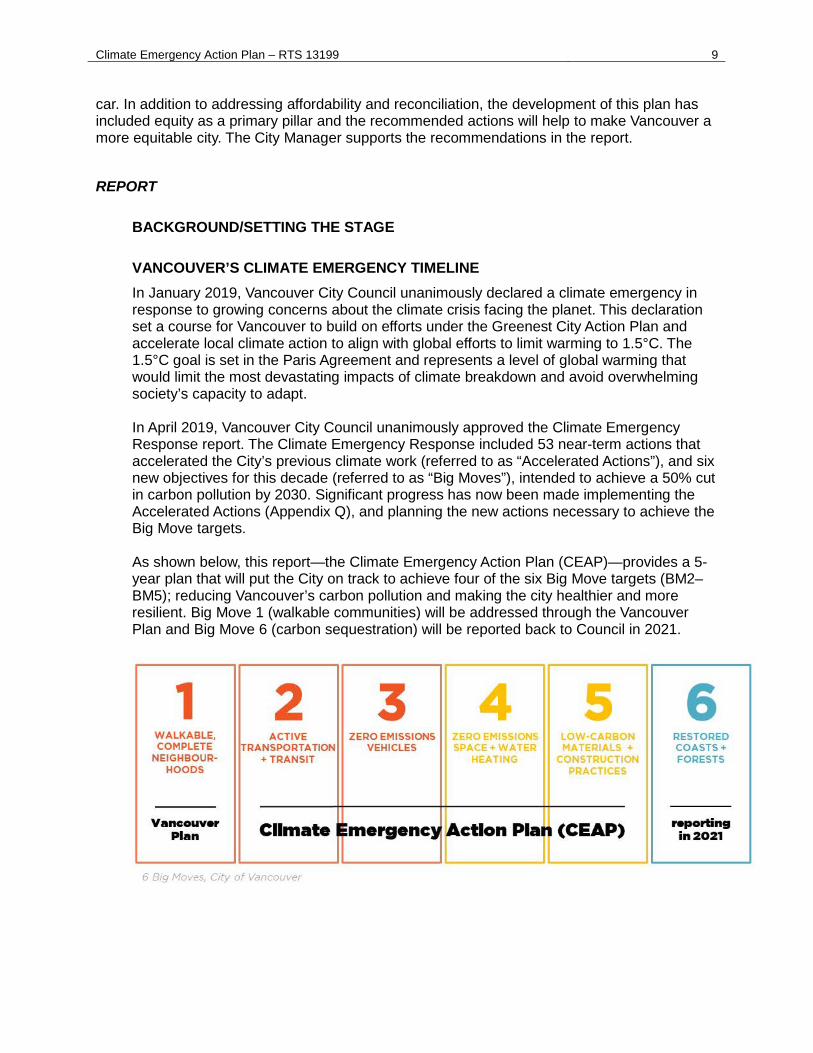
VANCOUVER’S CLIMATE EMERGENCY TIMELINE In January 2019, Vancouver City Council unanimously declared a climate emergency in response to growing concerns about the climate crisis facing the planet. This declaration set a course for Vancouver to build on efforts under the Greenest City Action Plan and accelerate local climate action to align with global efforts to limit warming to 1.5°C. The 1.5°C goal is set in the Paris Agreement and represents a level of global warming that would limit the most devastating impacts of climate breakdown and avoid overwhelming society’s capacity to adapt. In April 2019, Vancouver City Council unanimously approved the Climate Emergency Response report. The Climate Emergency Response included 53 near-term actions that accelerated the City’s previous climate work (referred to as “Accelerated Actions”), and six new objectives for this decade (referred to as “Big Moves”), intended to achieve a 50% cut in carbon pollution by 2030. Significant progress has now been made implementing the Accelerated Actions (Appendix Q), and planning the new actions necessary to achieve the Big Move targets. As shown below, this report—the Climate Emergency Action Plan (CEAP)—provides a 5-year plan that will put the City on track to achieve four of the six Big Move targets (BM2–BM5); reducing Vancouver’s carbon pollution and making the city healthier and more resilient. Big Move 1 (walkable communities) will be addressed through the Vancouver Plan and Big Move 6 (carbon sequestration) will be reported back to Council in 2021.
Climate Emergency Action Plan – RTS 13199 10
COVID-19 AND THE CLIMATE EMERGENCY The development of the Climate Emergency Action Plan began prior to the COVID-19 pandemic. The COVID-19 pandemic has placed the climate emergency work in a new and unexpected context that has caused inequitable shocks to our community and economy, and to City operations. But the urgency and severity of the climate crisis remain unchanged. Transitioning off of fossil fuels at a pace consistent with the 1.5°C goal was always going to be an immense challenge; COVID-19 accentuates that challenge. The shocks to our economic and transportation systems during the COVID-19 pandemic are expected to result in an 8% decrease in global carbon pollution in 2020 relative to 2019.1 This magnitude of reduction is illustrative of the scale of emissions reductions needed every year over the next decade to reach the carbon emissions levels recommended by the Intergovernmental Panel on Climate Change (IPCC). However, the economic and social devastation that has led to those reductions is not illustrative of the way we intend to achieve sustained emissions reductions over the next decade and beyond. To succeed, we need to combine rapid reductions in fossil-fuel use with equitable economic recovery and development. Our response to the COVID-19 pandemic and the climate crisis similarly need to include bold efforts to reduce carbon pollution and better preparations for the unavoidable impacts of climate change, while prioritizing actions that help minimize health and economic impacts and help build a more equitable society. This recognizes that health, the economy and the climate are inextricably linked and are building blocks for a strong and resilient city. In addition to our efforts to be responsive to input received through the public engagement process, staff have designed the actions in the Climate Emergency Action Plan to be as aligned as possible with the City’s COVID-19 recovery objectives—both in the near term, as residents and businesses get back on their feet, and in the medium term, as we strive to build a more resilient Vancouver. As a result of that process, the draft actions that were tested through public engagement have been adjusted in three main ways:
• Investment Actions. Where feasible, projects that rely on City of Vancouver investment will be delivered using more cost-effective approaches. For example, infrastructure projects to support safe walking and cycling will be implemented with lower-cost treatments. This approach will help reduce the budget pressure and can also enable projects to be deployed more quickly to support post-COVID-19 recovery. There are a number of successful examples of this approach around the city, including the most recent protected cycling lanes on the Cambie Bridge and Beach Avenue. Further, City investments will be ramped up gradually over the next five years to enable those investments to be matched with City resources and funding from senior governments and other partners, where possible.
• Regulatory and Pricing Actions. For actions that rely on the City’s regulatory authorities (e.g., carbon limits on buildings, parking permits, and transport pricing), the City needs to be sensitive to the fact that many residents and businesses are struggling to recover from the impacts of COVID-19. At the same time, the City needs to use these tools to meet our climate targets and ensure a resilient future for our residents and businesses. We will not be successful if we rely solely on
1 IEA, The impact of the Covid-19 crisis on clean energy progress – June 2020 - https://www.iea.org/articles/the-impact-of-the-covid-19-crisis-on-clean-energy-progress
Climate Emergency Action Plan – RTS 13199 11
incentives and government stimulus investments. To find a balance, staff have incorporated a stronger equity lens into the regulatory and pricing tools, so that the expectations are higher for the residents most able to invest in solutions, such as a new heat pump or electric vehicle. As appropriate, staff are also proposing more capacity-building for industry, and proceeding with gradual or phased implementation schedules.
• Physical Distancing Actions. The need for physical distancing in response to
COVID-19, combined with sudden changes in transportation demands and working patterns, resulted in two changes to the “How We Move” actions. First, staff are evaluating the success of programs, such as “Room to Move,” to see if there are more near-term opportunities to dedicate road space for people to walk and cycle safely, and for buses, so that they can move people more efficiently and reliably. Second, staff have added a new action to make it easier for people to work from home.
With these revisions, staff are confident we can continue to advance our climate emergency priorities in a way that is consistent with our COVID-19 recovery, and that also helps to make our city healthier, more equitable and more resilient to future shocks and stresses.
VANCOUVER PLAN AND THE CLIMATE EMERGENCY The Climate Emergency Action Plan is one of the building blocks within the Vancouver Plan. Staff are working collaboratively to ensure input into these processes informs the Vancouver Plan and vice versa. Over the course of gathering nearly 10,000 responses during Vancouver Plan’s public engagement process, and 50,000 open-ended comments, several key points relating to climate change and the environment are critical to note:
1. Climate change is a critical concern among young people, and especially those
under 20. This was clear in the engagement findings, and particularly in outreach that took place in July and August 2020.
2. Staff heard overwhelmingly that natural spaces—urban forest, waterfront, parks, community gardens, beaches—are sources of joy and that the public is committed and passionate about their preservation and expansion. These responses are important proxies for protecting our natural environment.
3. Support for compact, walkable and rollable communities and access to active transportation have been key themes since the beginning of the COVID-19 pandemic. These are critical findings in this early phase of listening, inclusive of all engagement from November 2019 to August 2020.
In October 2020, the first phase of the Vancouver Plan and the COVID-19 Community Recovery Action Plan delivered a set of quick-start actions to help our city get back on its feet. As we move forward, staff will continue to work collaboratively on implementation of these actions and further engagement as needed. The Vancouver Plan will deliver a long-term, strategic vision and an actionable plan, which will ultimately set directions to guide future priorities into 2050 and beyond. A core function of the Vancouver Plan will be to enhance the city’s resilience to future shocks and stresses, such as future pandemics, like the one we currently face, and climate change, aligning with and building upon the Resilient Vancouver Strategy. Another function will be
Climate Emergency Action Plan – RTS 13199 12
to create a more equitable and inclusive city, following the City’s emerging Equity Framework. The Climate Emergency Action Plan puts our city on a clear path for strengthened climate action that we can continue to build on. The Vancouver Plan will also support carbon reduction by advancing one of the Big Moves from the Climate Emergency Response: walkable complete communities. Together, these short- and medium-term actions will support our long-term climate target of being carbon neutral before 2050.
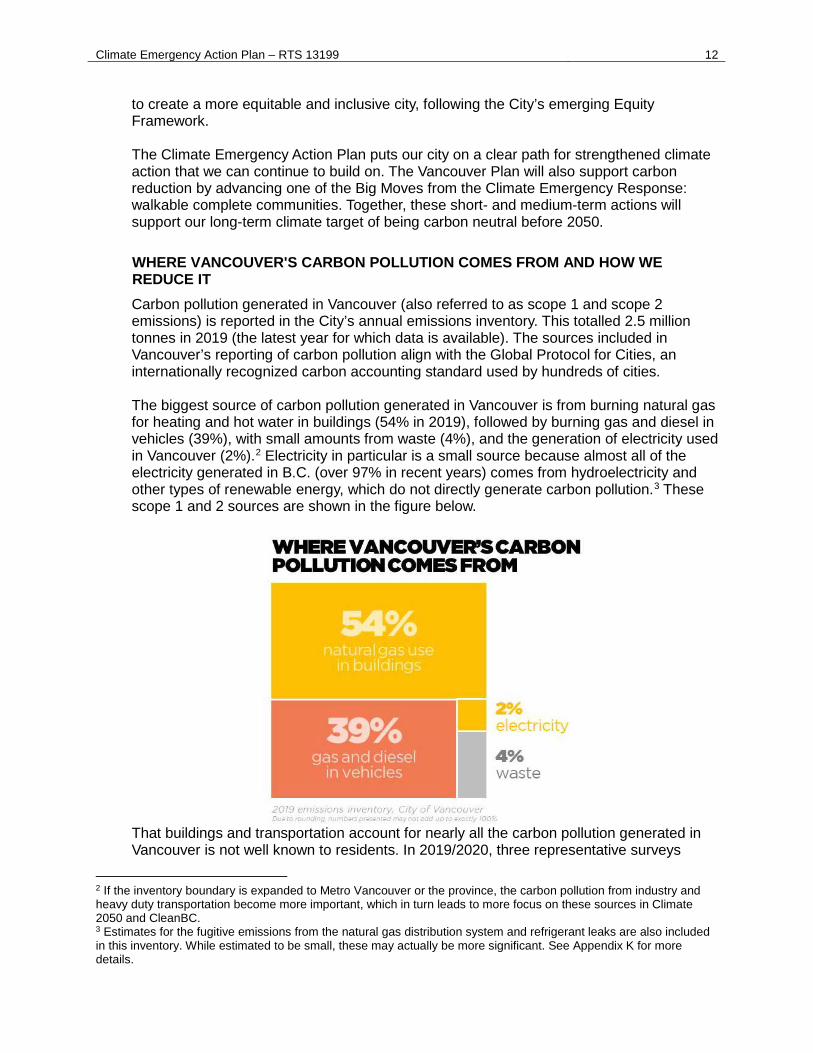
WHERE VANCOUVER'S CARBON POLLUTION COMES FROM AND HOW WE REDUCE IT Carbon pollution generated in Vancouver (also referred to as scope 1 and scope 2 emissions) is reported in the City’s annual emissions inventory. This totalled 2.5 million tonnes in 2019 (the latest year for which data is available). The sources included in Vancouver’s reporting of carbon pollution align with the Global Protocol for Cities, an internationally recognized carbon accounting standard used by hundreds of cities. The biggest source of carbon pollution generated in Vancouver is from burning natural gas for heating and hot water in buildings (54% in 2019), followed by burning gas and diesel in vehicles (39%), with small amounts from waste (4%), and the generation of electricity used in Vancouver (2%).2 Electricity in particular is a small source because almost all of the electricity generated in B.C. (over 97% in recent years) comes from hydroelectricity and other types of renewable energy, which do not directly generate carbon pollution.3 These scope 1 and 2 sources are shown in the figure below.
That buildings and transportation account for nearly all the carbon pollution generated in Vancouver is not well known to residents. In 2019/2020, three representative surveys
2 If the inventory boundary is expanded to Metro Vancouver or the province, the carbon pollution from industry and heavy duty transportation become more important, which in turn leads to more focus on these sources in Climate 2050 and CleanBC. 3 Estimates for the fugitive emissions from the natural gas distribution system and refrigerant leaks are also included in this inventory. While estimated to be small, these may actually be more significant. See Appendix K for more details.
Climate Emergency Action Plan – RTS 13199 13
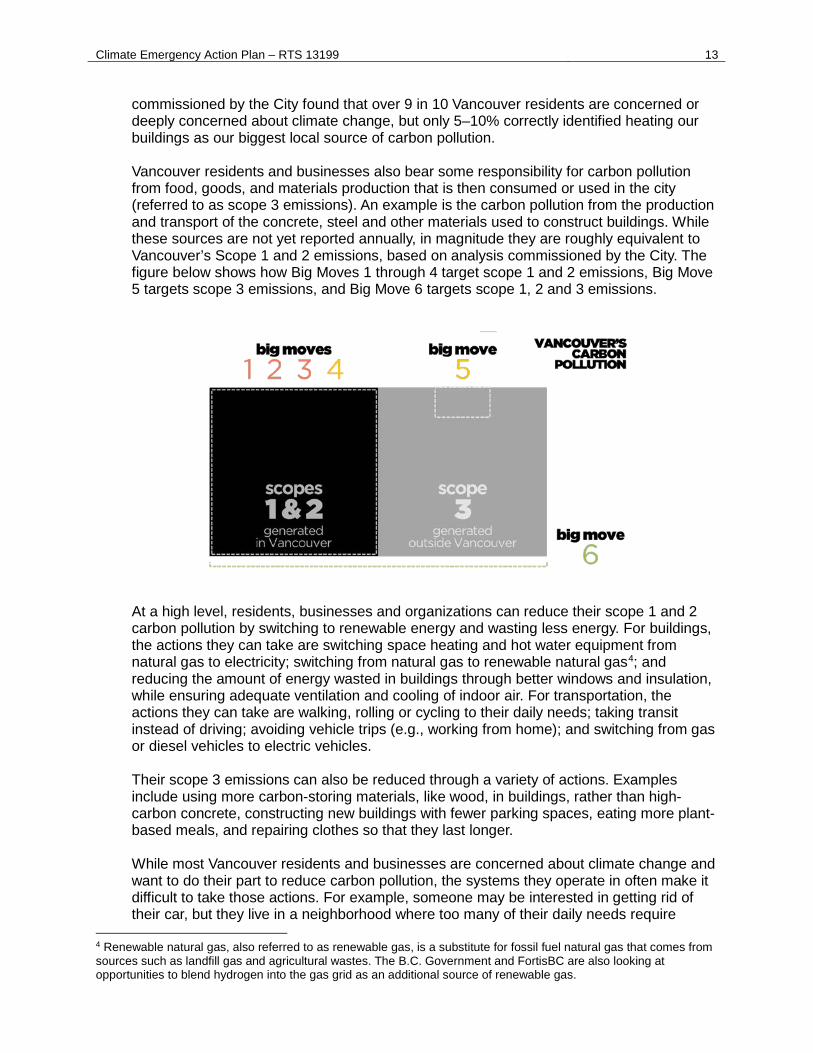
commissioned by the City found that over 9 in 10 Vancouver residents are concerned or deeply concerned about climate change, but only 5–10% correctly identified heating our buildings as our biggest local source of carbon pollution. Vancouver residents and businesses also bear some responsibility for carbon pollution from food, goods, and materials production that is then consumed or used in the city (referred to as scope 3 emissions). An example is the carbon pollution from the production and transport of the concrete, steel and other materials used to construct buildings. While these sources are not yet reported annually, in magnitude they are roughly equivalent to Vancouver’s Scope 1 and 2 emissions, based on analysis commissioned by the City. The figure below shows how Big Moves 1 through 4 target scope 1 and 2 emissions, Big Move 5 targets scope 3 emissions, and Big Move 6 targets scope 1, 2 and 3 emissions.
At a high level, residents, businesses and organizations can reduce their scope 1 and 2 carbon pollution by switching to renewable energy and wasting less energy. For buildings, the actions they can take are switching space heating and hot water equipment from natural gas to electricity; switching from natural gas to renewable natural gas4; and reducing the amount of energy wasted in buildings through better windows and insulation, while ensuring adequate ventilation and cooling of indoor air. For transportation, the actions they can take are walking, rolling or cycling to their daily needs; taking transit instead of driving; avoiding vehicle trips (e.g., working from home); and switching from gas or diesel vehicles to electric vehicles. Their scope 3 emissions can also be reduced through a variety of actions. Examples include using more carbon-storing materials, like wood, in buildings, rather than high-carbon concrete, constructing new buildings with fewer parking spaces, eating more plant-based meals, and repairing clothes so that they last longer. While most Vancouver residents and businesses are concerned about climate change and want to do their part to reduce carbon pollution, the systems they operate in often make it difficult to take those actions. For example, someone may be interested in getting rid of their car, but they live in a neighborhood where too many of their daily needs require
4 Renewable natural gas, also referred to as renewable gas, is a substitute for fossil fuel natural gas that comes from sources such as landfill gas and agricultural wastes. The B.C. Government and FortisBC are also looking at opportunities to blend hydrogen into the gas grid as an additional source of renewable gas.
Climate Emergency Action Plan – RTS 13199 14
driving. Or someone may be interested in walking, cycling or taking the bus to work, but is unlikely to do so if they do not feel safe. Or someone in need of a new furnace may be open to switching to a heat pump, but is unlikely to do so if they cannot find a contractor they trust to help them navigate the process. The City’s role is to change these systems so that zero emissions choices increasingly become the default choice.
RECONCILIATION AS A PRIORITY Vancouver is within the unceded Traditional Territory of the xʷməθkʷəy̓əm (Musqueam), Sḵwx̱wú7mesh (Squamish), and Sel̓íl̓witulh (Tsleil-Waututh) First Nations. Since time immemorial, First Nations have lived here and sustained themselves and this land. Finding a path back to sustainability requires learning from and working with the local Nations and urban Indigenous people. As a City of Reconciliation, Vancouver has committed, through the Reconciliation Framework, to form a sustained relationship of mutual respect and understanding with local First Nations and the Urban Indigenous community, incorporate a First Nations and Urban Indigenous perspective into our work and decisions, and improve City services for the First Nations and Urban Indigenous population. This commitment combined with the City’s endorsement of the United Nations Declaration of Indigenous Rights creates a responsibility to create systemic change and must inform all work at the City.
EQUITY AS A PRIORITY Climate change impacts everyone, but it impacts some of us more than others. This is true on a global and a local scale. We also know that climate action can provide significant opportunities to advance equity, through new employment opportunities, improved affordability and improved health. Systemic discrimination and past policy decisions, including City urban and transportation planning policies, have contributed to the continuing oppression of Indigenous people, racialized, and other disproportionately impacted communities. As a result, certain communities are more impacted by issues of poverty, lack of services, and unequal opportunities. Moving forward, City policies need to work to address this. The climate crisis clearly overlaps with other issues—Indigenous rights, racial justice, immigrant rights, housing justice, and gender issues, to name some examples. Throughout this CEAP, staff use the term “disproportionately impacted communities” to identify those who have been and will continue to be hit first and worst by the impacts of environmental injustice and the climate crisis. These communities face intersecting and systemic challenges that magnify climate threats, including racial discrimination, poverty, disability, housing insecurity, linguistic isolation, poor air quality and more. As a result, they are often the least able to adapt, resist, or recover from climate impacts. Who we consider as “disproportionately impacted” can change based on the specific public policy being considered. Vancouver is striving to respond to the climate crisis with ambitious carbon reduction policies and the equitable implementation of those policies. This requires ensuring that those facing the greatest impacts are deeply represented in program development and also ensuring that the benefits of our climate actions are felt by communities that have been hit hardest by social and economic injustices.
Climate Emergency Action Plan – RTS 13199 15
Implementation of the Climate Emergency Action Plan will also be informed by the City’s forthcoming Equity Framework. The Equity Framework is a City-wide initiative that states the City’s commitment and broad approach to transforming our internal practices, policies and processes in order to equitably serve our diverse communities. Grounded on the commitments identified in the City of Reconciliation Framework and the Healthy City Strategy, the emerging Equity Framework orients us to centre the voices and priorities of communities most impacted by the challenges we tackle and the solutions we propose. This will mean, in particular, centering the voices of Indigenous, Black and other racialized people, while also considering how intersections of class, gender identity and sexual orientation, ability, age, immigration status and others produce different experiences and unequal outcomes. A key part of moving to a zero emissions world is to ensure it is a “just transition”. The principle of just transition is that a healthy economy and a clean environment can and should co-exist. The process for achieving that objective should seek to ensure that the substantial benefits of a green economy are shared widely, while also supporting those who stand to lose economically (see the Economic Impacts section below for further discussion). The City’s climate equity work is in its beginning stage and there are many voices staff have not yet heard, who have a wealth of knowledge about how to transform our city into a more sustainable and resilient place. Meaningfully integrating equity into our work will take time, to allow staff to examine and change internal practices, build new relationships with impacted and systemically excluded communities, and to co-create solutions with those communities.
HEALTH IMPACTS The impact of climate change on health outcomes is inextricably linked. As a result of climate change, we can expect additional and worsening health-related shocks—from more frequent heat waves, to increased wildfire smoke, to elevated risk of infectious diseases. We can limit those impacts by reducing carbon pollution, and most of the solutions being pursued to fight climate change in an urban context also lead to better health outcomes. Zero emissions buildings are quieter and have better indoor air quality, due to improved air-tightness and filtration of incoming air, which help deal with air quality events, such as wildfire smoke. Walking/rolling and cycling are pollution-free, and they help people maintain better health by staying active, while all-ages-and-abilities cycling infrastructure is designed to reduce the risk of collisions and keep people safer. Similarly, transit riders typically lead more active lifestyles than people who are more reliant on driving. Electric vehicles produce no tail-pipe pollution, which benefits everyone in the region, particularly those most exposed to air pollution along arterials. Having healthier residents also makes our community more resilient to shocks like the COVID-19 pandemic and the climate crisis. For example, the U.S. Centers for Disease Control and Prevention found that death rates are 12 times higher for COVID-19 patients with chronic illnesses than for others who become infected. With better indoor and outdoor air quality, less noise, and more active and healthier residents, we can reduce future strains on our health system and frontline healthcare workers.
Climate Emergency Action Plan – RTS 13199 16
Like many cities across the world, Vancouver experienced a dramatic drop in vehicle trips in our region during the initial stages of the COVID-19 pandemic. This reduction in vehicle usage highlighted some of the benefits that can be achieved with a sustained shift to fewer vehicle trips and a transition to electric vehicles. For example, we could see Vancouver Island and Mount Baker more clearly, and our streets and neighborhoods were quieter, less stressful, and more supportive of social interaction. Clean air and quieter streets are important for the health of everyone, yet even more so for vulnerable residents and those who have respiratory issues.
ECONOMIC IMPACTS The climate and the economy are inextricably linked, and both are building blocks for a strong and resilient city. In many ways, the current economic system is not working for people or the planet. Examples of climate-related concerns affecting Vancouver’s economy include rising sea levels impacting our key employment lands, and heat waves and wildfire smoke reducing productivity and making some jobs unsafe. Vancouver’s work to fight climate change over the past decade has helped strengthen its economy, and Vancouver businesses have been early adopters of economic opportunities and business strategies that are better aligned with our environmental objectives. In Vancouver, the green economy employs 1 in 15 workers, well above any other North American city, and is growing at 7.8% per year on average (between 2016 and 2019). The carbon intensity of Vancouver’s economy (tonnes of carbon pollution per dollar of GDP) has fallen by 40% between 2007 and 2019. Establishing effective policies that address climate change can accelerate innovation in clean tech, green building technologies, advanced materials, recycling and circular economy initiatives, and sustainable transportation. According to research from the Vancouver Economic Commission (VEC), Vancouver’s Zero Emissions Building Plan and the Metro Vancouver-wide implementation of the BC Energy Step Code has opened a multibillion-dollar market opportunity for the local green building and construction sector over the next decade. The CEAP creates similar economic opportunities for electric vehicle charging, active transportation services and product suppliers, and low-carbon heating technology and construction materials. There are opportunities to link the CEAP with B.C.’s resource industries in ways that can help expand economic opportunity in rural communities. For example, constructing with mass timber serves to reduce the carbon pollution associated with construction materials, and relies on materials and expertise from B.C.’s forestry sector. Improvements to transportation and COVID-19 pandemic-related updates to street use, which enable consumers to walk, cycle, shop and dine with safe physical distancing, help facilitate economic activity, all while decreasing the carbon footprint of our local economy.
To help businesses and workers in Vancouver to effectively and equitably be part of the transition off of fossil fuels, VEC will undertake research and scoping to work toward developing and implementing a Zero Carbon Economic Transition Strategy and Action Plan. The intention of the strategy and action plan will be to identify and pursue economic benefits generated by the Climate Emergency Action Plan, Climate 2050 (Metro Vancouver’s climate plan), and CleanBC (B.C.’s climate plan). Targeted benefits to pursue may include expanded market potential for specific business sectors; green job growth; operations and maintenance cost savings to businesses and asset owners; and reduced risk to climate shocks.
Climate Emergency Action Plan – RTS 13199 17
The work will include forecasting sector-based impacts and opportunities, exploring the formation of new partnerships in industry, attracting investment to Vancouver companies and infrastructure projects, and helping provide a just transition for workers impacted by climate action. The Zero Carbon Economic Transition Strategy and Action Plan will align with the Vancouver Economic Development Strategy, which is being developed by VEC in collaboration with the City.
DOING THIS TOGETHER The scale of the climate crisis is beyond what can be achieved through the City of Vancouver’s jurisdiction and is not limited to our geographic boundaries. Advancing these climate goals requires the continued support and action of other governments, including First Nations, utilities, businesses, local associations and non-profits, academia, and residents. It also requires ongoing commitment from Vancouver City Council and staff to build those relationships, share our experiences and learn from others.
Collaboration with the provincial government and our utilities on the implementation of CleanBC, with TransLink on the development and implementation of Transportation 2050, and with Metro Vancouver on the development and implementation of Climate 2050 are all critical opportunities (see Recommendation EE and Appendix O). There is also an important opportunity to learn from, coordinate, and collaborate with the Musqueam, Squamish, and Tsleil-Waututh First Nations, who have been living on and sustaining this land for millennia, and who are at different stages of developing and implementing their own climate plans. On the global stage, the City of Vancouver will continue to work with organizations like C40, Urban Sustainability Directors Network and Carbon Neutral Cities Alliance to support and learn from each other and ensure that worldwide municipalities are addressing the climate emergency as effectively as possible. In partnership with VEC, the City will continue to collaborate with businesses working to address climate change through C40’s City Business Alliance and the Catalyst Business Coalition. Vancouver is fortunate to be rich with climate-focused academic groups, non-profit organizations, youth-led initiatives and citizen groups. We need to work together with residents, businesses, and youth to build stronger relationships and be bold in our leadership, if we are going to achieve these goals and find solutions to this climate emergency. To that end, the City will continue to foster diverse and multi-generational climate leadership in Vancouver, including continuing to support programs such as CityStudio and Greenest City Scholars, with a stronger emphasis going forward on integrating climate and equity. Likewise, staff will continue to seek out opportunities to collaborate with other organizations, such as the successful partnership with the Zero Emissions Building Exchange on the C40 Women4Climate Program. Lastly, staff will share our stories—successes and lessons learned—across the community, to ensure that our residents are well informed about our work and inspired by the hard work and creative solutions of others in the community.
SUMMARY OF THE PROCESS TO PRODUCE THE ACTION PLAN The decisions made while developing the Climate Emergency Action Plan were based on the principles defined by the International Association of Public Participation— balancing staff, public and stakeholder input with technical, environmental and financial considerations.
Climate Emergency Action Plan – RTS 13199 18
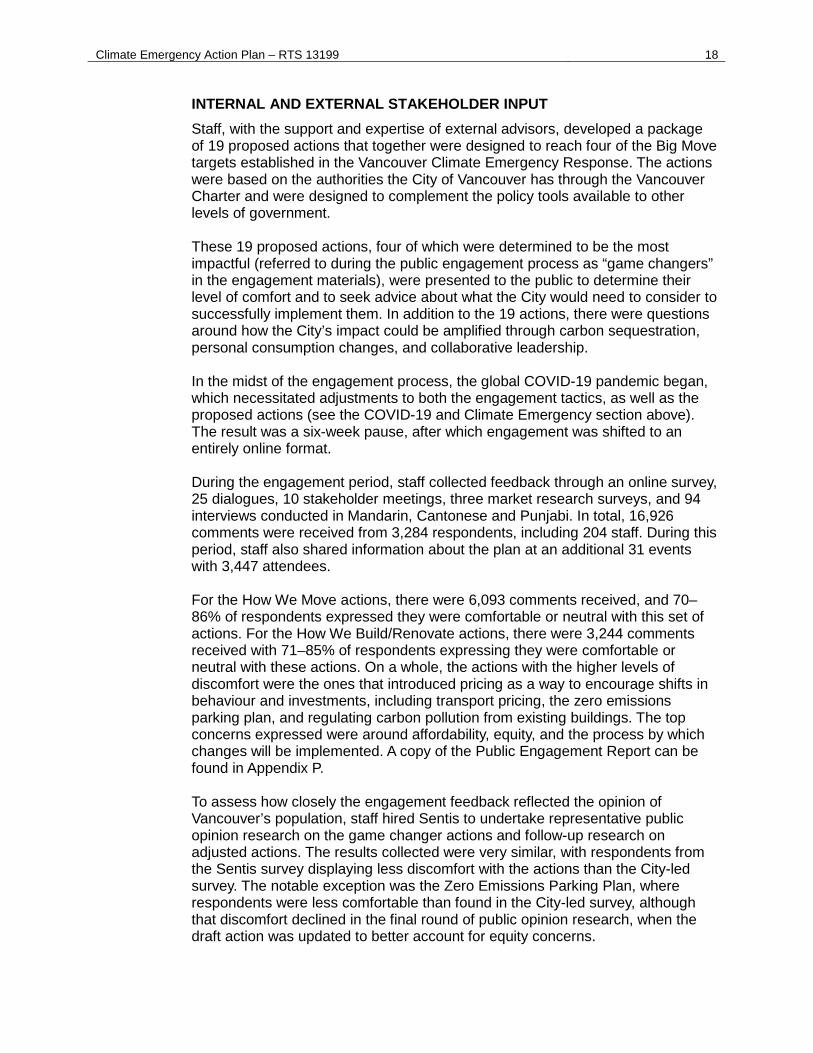
INTERNAL AND EXTERNAL STAKEHOLDER INPUT Staff, with the support and expertise of external advisors, developed a package of 19 proposed actions that together were designed to reach four of the Big Move targets established in the Vancouver Climate Emergency Response. The actions were based on the authorities the City of Vancouver has through the Vancouver Charter and were designed to complement the policy tools available to other levels of government.
These 19 proposed actions, four of which were determined to be the most impactful (referred to during the public engagement process as “game changers” in the engagement materials), were presented to the public to determine their level of comfort and to seek advice about what the City would need to consider to successfully implement them. In addition to the 19 actions, there were questions around how the City’s impact could be amplified through carbon sequestration, personal consumption changes, and collaborative leadership.
In the midst of the engagement process, the global COVID-19 pandemic began, which necessitated adjustments to both the engagement tactics, as well as the proposed actions (see the COVID-19 and Climate Emergency section above). The result was a six-week pause, after which engagement was shifted to an entirely online format. During the engagement period, staff collected feedback through an online survey, 25 dialogues, 10 stakeholder meetings, three market research surveys, and 94 interviews conducted in Mandarin, Cantonese and Punjabi. In total, 16,926 comments were received from 3,284 respondents, including 204 staff. During this period, staff also shared information about the plan at an additional 31 events with 3,447 attendees. For the How We Move actions, there were 6,093 comments received, and 70–86% of respondents expressed they were comfortable or neutral with this set of actions. For the How We Build/Renovate actions, there were 3,244 comments received with 71–85% of respondents expressing they were comfortable or neutral with these actions. On a whole, the actions with the higher levels of discomfort were the ones that introduced pricing as a way to encourage shifts in behaviour and investments, including transport pricing, the zero emissions parking plan, and regulating carbon pollution from existing buildings. The top concerns expressed were around affordability, equity, and the process by which changes will be implemented. A copy of the Public Engagement Report can be found in Appendix P. To assess how closely the engagement feedback reflected the opinion of Vancouver’s population, staff hired Sentis to undertake representative public opinion research on the game changer actions and follow-up research on adjusted actions. The results collected were very similar, with respondents from the Sentis survey displaying less discomfort with the actions than the City-led survey. The notable exception was the Zero Emissions Parking Plan, where respondents were less comfortable than found in the City-led survey, although that discomfort declined in the final round of public opinion research, when the draft action was updated to better account for equity concerns.
Climate Emergency Action Plan – RTS 13199 19
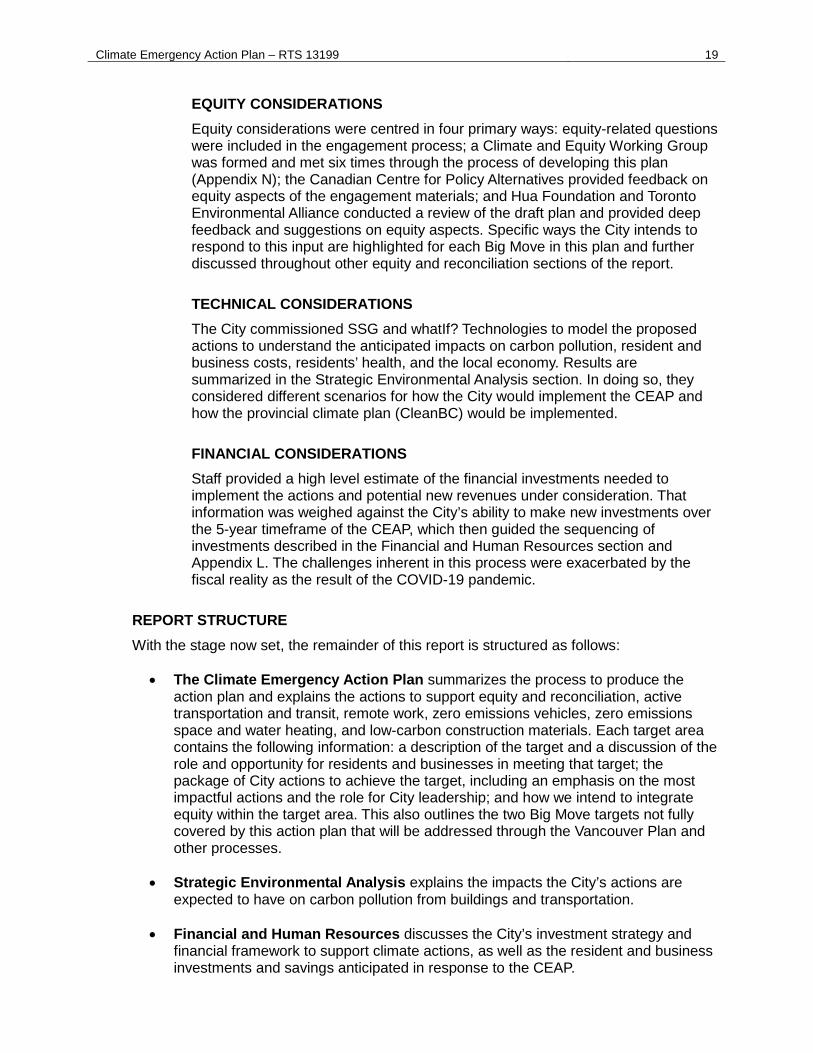
EQUITY CONSIDERATIONS Equity considerations were centred in four primary ways: equity-related questions were included in the engagement process; a Climate and Equity Working Group was formed and met six times through the process of developing this plan (Appendix N); the Canadian Centre for Policy Alternatives provided feedback on equity aspects of the engagement materials; and Hua Foundation and Toronto Environmental Alliance conducted a review of the draft plan and provided deep feedback and suggestions on equity aspects. Specific ways the City intends to respond to this input are highlighted for each Big Move in this plan and further discussed throughout other equity and reconciliation sections of the report.
TECHNICAL CONSIDERATIONS The City commissioned SSG and whatIf? Technologies to model the proposed actions to understand the anticipated impacts on carbon pollution, resident and business costs, residents’ health, and the local economy. Results are summarized in the Strategic Environmental Analysis section. In doing so, they considered different scenarios for how the City would implement the CEAP and how the provincial climate plan (CleanBC) would be implemented.
FINANCIAL CONSIDERATIONS Staff provided a high level estimate of the financial investments needed to implement the actions and potential new revenues under consideration. That information was weighed against the City’s ability to make new investments over the 5-year timeframe of the CEAP, which then guided the sequencing of investments described in the Financial and Human Resources section and Appendix L. The challenges inherent in this process were exacerbated by the fiscal reality as the result of the COVID-19 pandemic.
REPORT STRUCTURE With the stage now set, the remainder of this report is structured as follows:
• The Climate Emergency Action Plan summarizes the process to produce the action plan and explains the actions to support equity and reconciliation, active transportation and transit, remote work, zero emissions vehicles, zero emissions space and water heating, and low-carbon construction materials. Each target area contains the following information: a description of the target and a discussion of the role and opportunity for residents and businesses in meeting that target; the package of City actions to achieve the target, including an emphasis on the most impactful actions and the role for City leadership; and how we intend to integrate equity within the target area. This also outlines the two Big Move targets not fully covered by this action plan that will be addressed through the Vancouver Plan and other processes.
• Strategic Environmental Analysis explains the impacts the City’s actions are expected to have on carbon pollution from buildings and transportation.
• Financial and Human Resources discusses the City’s investment strategy and
financial framework to support climate actions, as well as the resident and business investments and savings anticipated in response to the CEAP.
Climate Emergency Action Plan – RTS 13199 20
• Legal Implications discusses how the actions fit within the City’s jurisdiction under the Vancouver Charter.
• Complementary City Initiatives describes where other areas of the City’s work (outside the scope of this report) help to reduce carbon pollution or prepare for climate change. Examples include the Greenest City Action Plan, Vancouver’s Climate Change Adaptation Strategy and Zero Waste 2040.
• The report closes with appendices that provide further information on
engagement indicators, the required City investments, and many of the actions.
Appendix A: Transport Pricing Work Plan Appendix B-1: 5-Year Walking Plan Appendix B-2: 5-Year Cycling Network Plan Appendix B-3: Adding E-Bikes to Vancouver’s Public Bike Share System Appendix B-4: 5-Year Transit Action Plan Appendix C-1: City-Wide Transportation Demand Management Action Plan Appendix C-2: School Active Travel Planning Program Appendix D: Remote and Flexible Work Options Appendix E: Eliminating Parking Minimums and Introducing More Parking Maximums in New Developments Appendix F: Residential Parking Permits and Carbon Pollution Surcharge Appendix G: Expanding The Public Charging Network Appendix H: Electric Vehicle Charging On Private Property Action Plan Appendix I: Charging Infrastructure for Passenger Fleets Work Plan Appendix J: Zero Emissions Building Retrofit Strategy Appendix K: Embodied Carbon Strategy Appendix L: 5- Year Forecast of Required City Investments Appendix M: Indicators Framework Appendix N: Climate and Equity Working Group Appendix O: Advocacy Priorities Appendix P: Public Engagement Report Appendix Q: Climate Emergency Response – Accelerated Action Status
THE CLIMATE EMERGENCY ACTION PLAN
RECONCILIATION IN THE CLIMATE EMERGENCY ACTION PLAN The action in this section describes the work that would be directed by report Recommendation AA. Indigenous communities have faced many environmental injustices and continue to bear the burden of being at the frontline of protecting land and water from harm. Early in the history of Vancouver, pressures from the City of Vancouver, senior levels of government, and various non-Indigenous public and private interests displaced Indigenous residents and dismantled reserve land holdings. The remaining reserve land of both the Musqueam and Squamish in Vancouver (part of their unceded territories) face flooding risks due to sea-level rise, a clear example of how Indigenous people are disproportionately impacted by climate change.
Climate Emergency Action Plan – RTS 13199 21
For these reasons, it is imperative that reconciliation be advanced through the City’s Climate Emergency Action Plan and that greater efforts be made to collaborate with and support First Nations throughout the implementation of this plan. Learning from and incorporating Indigenous ways of knowing from the local Nations and urban Indigenous people will also be critical to our success. The City’s Reconciliation Framework focuses on the Truth and Reconciliation Commission’s Calls to Actions outlined, identifying where City policy and programs can be brought into alignment. The City’s Climate actions will need to continue this work and continue to explore what reconciliation looks like in action.
RECONCILIATION ACTION 1. Commitment to Work with Local First Nations
We are committed to being available to share our knowledge with the xʷməθkʷəy̓əm (Musqueam), Sḵwx̱wú7mesh (Squamish), and Sel̓íl̓witulh (Tsleil-Waututh) First Nations if it is helpful to support the development and implementation of their own climate plans, and staff will continue to seek to collaborate with the Nations on the City’s climate actions. Further, the City is committed to exploring financial support for the Nations to help with the development and implementation of their climate plans.
EQUITY IN THE CLIMATE EMERGENCY ACTION PLAN The actions in this section describe the work that would be directed by report Recommendations BB and CC.
The Big Moves of Vancouver’s Climate Emergency Response were formulated with a primary objective of reducing carbon pollution, and they were then adjusted to minimize the harm to disproportionately impacted communities and identify opportunities to benefit these communities. What does a more equitable Vancouver look like if we are successful with the Climate Emergency Action Plan over the coming decades? Collectively, our actions should:
1. Make low-cost sustainable transportation options easy, safe and reliable for all
Vancouverites, so that people get to work, school and other destinations without needing to rely on gas and diesel vehicles and the noise and pollution they produce.
2. Ensure that everyone has the opportunity to live and work in zero emissions buildings, and is able to benefit from the comfort, quiet, healthy air, and lower energy costs they offer.
3. Share the costs of reducing our carbon pollution in ways that reflect people’s ability to contribute to that transition.
4. Create new and varied opportunities for people to participate in a zero-carbon economy, including the support people need to transition to those opportunities.
There is a great deal more to be done on equity within climate policy. The City’s equity work on climate policies and programs will be shaped by the proposed Climate Justice Charter, the forthcoming City Equity Framework, the City’s Reconciliation Framework, the Healthy City Strategy, Vancouver’s Housing Strategy, the Women’s Equity Strategy, and the forthcoming Accessibility Strategy.
Climate Emergency Action Plan – RTS 13199 22
For the actions in the CEAP, staff have initially focused on designing them to consider socio-economic inequities. That said, staff are committed to expanding beyond socio-economic considerations as we move forward with implementation, particularly to better understand and centre systemic racial inequity, to understand impacts and barriers for people with disabilities, and to use an intersectional approach.
The CEAP took the following approach to integrating equity:
1. Initiated work to understand the challenges and impacts from
disproportionately impacted communities themselves to inform the plan and ensure implementation occurs with these considerations front-of-mind (this work is ongoing). This engagement particularly highlighted the need to disaggregate data by race and other factors and do other work up front to identify disproportionately impacted communities and tailor implementation to meet their needs.
2. Adjusted actions to avoid burdening disproportionately impacted communities. For households that have lower ease-of-access to solutions and less ability to invest, the CEAP provides greater support and time to transition. For example, carbon limits for existing buildings are not being proposed for rental or non-market housing, to minimize the risk of renovictions and displacement. Those housing types will be supported with incentives and tools to help them assess and undertake zero emissions retrofits.
3. Focused regulatory and pricing actions on those most able to afford them.
Our wealthiest residents are typically responsible for more carbon pollution and have greater access to the solutions for transitioning from fossil fuels to renewable energy. In general, they are more likely to own larger, more carbon-intensive homes and vehicles. They are also more likely to have the option of living in compact, walkable communities that are well served by transit and active transportation infrastructure, and to be able to afford energy retrofits and electric vehicles. The regulatory and pricing actions in the CEAP are designed to focus on residents with a greater ability to invest in climate solutions. This is similar to the approach the City has taken with new low-rise homes since 2017, when an emissions cap on large homes was first implemented—a new large home in Vancouver faces more stringent environmental requirements than more modest-sized homes.
These equity considerations will be especially important as the City navigates our recovery from COVID-19, which has had disproportionate impacts on different populations, particularly low-income and racialized people. Many residents and businesses are working hard to recover from the economic, social and health impacts of COVID-19, and the City’s climate policies and programs need to recognize and be sensitive to those challenges. The transition off of fossil fuels, however, can be undertaken in ways that improve social equity and affordability over time. The City recognizes the need to go deeper on equity than just minimizing harm and has identified actions that will begin this work in climate policy.
Climate Emergency Action Plan – RTS 13199 23
EQUITY ACTIONS The following actions are cross-cutting commitments to ensure that equity continues to be integrated into the City’s climate work. Steps to advance equity are also identified within each Big Move and Equity Milestones have been identified in the CEAP’s Indicators Framework to ensure accountability.
1. Development of a Climate Justice Charter. This Charter, developed with
disproportionately impacted communities, will identify how City staff creating climate policy and programs can better address and integrate equity and racial justice. This will include, among other things:
• Development of equity indicators. There is no single measure of equity, but indicators are necessary to be transparent about and understand our progress, or lack thereof, so staff can adjust course.
• Targeting economic benefits. In any policies or programs where incentives or economic benefits are generated, these benefits and opportunities should be targeted toward populations and/or businesses in need or who are typically marginalized. The Charter will provide guidance for staff on how to do this.
• Budget analysis with an equity lens. Staff will develop a methodology to analyze the climate plan budget to determine what proportion of spending will benefit Indigenous people, racialized, and/or other disproportionately impacted communities. This information will then be used to inform prioritization of City investments.
2. Engaging impacted people. City engagement processes have historically
overlooked important voices. In the implementation of climate actions, staff commit to identifying who will potentially be impacted and then conducting engagement in a way that ensures all residents, particularly the disproportionally impacted, and those from under-engaged, racialized communities have the opportunity to provide input. Further, staff will seek out opportunities to build long-term relationships with these communities. Staff commit to using tools from the City’s forthcoming Equity Framework to scope projects, including engagement, to ensure our actions are inclusive and beneficial to all, especially those who face the greatest systemic and structural barriers.
3. Shifting current sustainability programs to include a greater focus on
equity. The City has a number of important programs to support sustainability work in the Vancouver and in the wider community. Moving forward, these programs, such as the Greenest City Grants and Greenest City Scholars, will be adjusted to focus more on incorporating equity into the work.
HOW WE MOVE How we move tells the story of individual health, community prosperity and the well-being of our environment. It can point to social inequities and neighbourhoods that need more investment and care. It is also a large part of the climate emergency, with vehicles powered by fossil fuels responsible for nearly 40% of carbon pollution generated in the city.
Climate Emergency Action Plan – RTS 13199 24
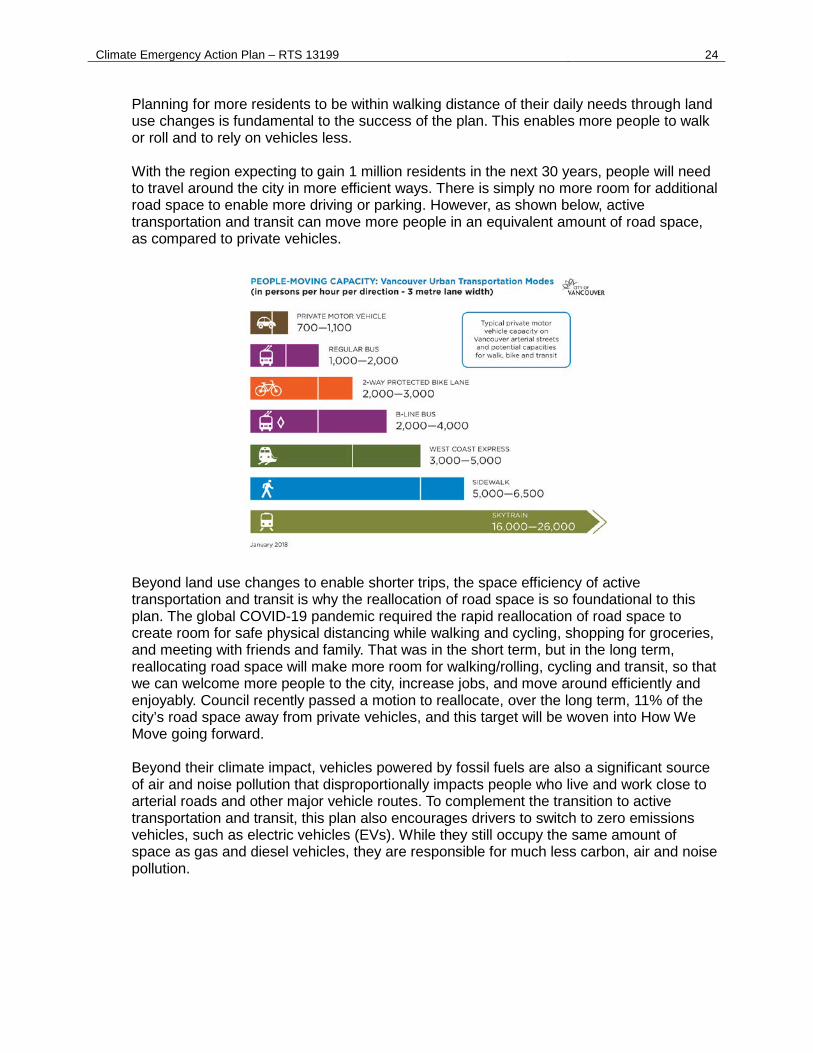
Planning for more residents to be within walking distance of their daily needs through land use changes is fundamental to the success of the plan. This enables more people to walk or roll and to rely on vehicles less. With the region expecting to gain 1 million residents in the next 30 years, people will need to travel around the city in more efficient ways. There is simply no more room for additional road space to enable more driving or parking. However, as shown below, active transportation and transit can move more people in an equivalent amount of road space, as compared to private vehicles.
Beyond land use changes to enable shorter trips, the space efficiency of active transportation and transit is why the reallocation of road space is so foundational to this plan. The global COVID-19 pandemic required the rapid reallocation of road space to create room for safe physical distancing while walking and cycling, shopping for groceries, and meeting with friends and family. That was in the short term, but in the long term, reallocating road space will make more room for walking/rolling, cycling and transit, so that we can welcome more people to the city, increase jobs, and move around efficiently and enjoyably. Council recently passed a motion to reallocate, over the long term, 11% of the city’s road space away from private vehicles, and this target will be woven into How We Move going forward. Beyond their climate impact, vehicles powered by fossil fuels are also a significant source of air and noise pollution that disproportionally impacts people who live and work close to arterial roads and other major vehicle routes. To complement the transition to active transportation and transit, this plan also encourages drivers to switch to zero emissions vehicles, such as electric vehicles (EVs). While they still occupy the same amount of space as gas and diesel vehicles, they are responsible for much less carbon, air and noise pollution.
Climate Emergency Action Plan – RTS 13199 25
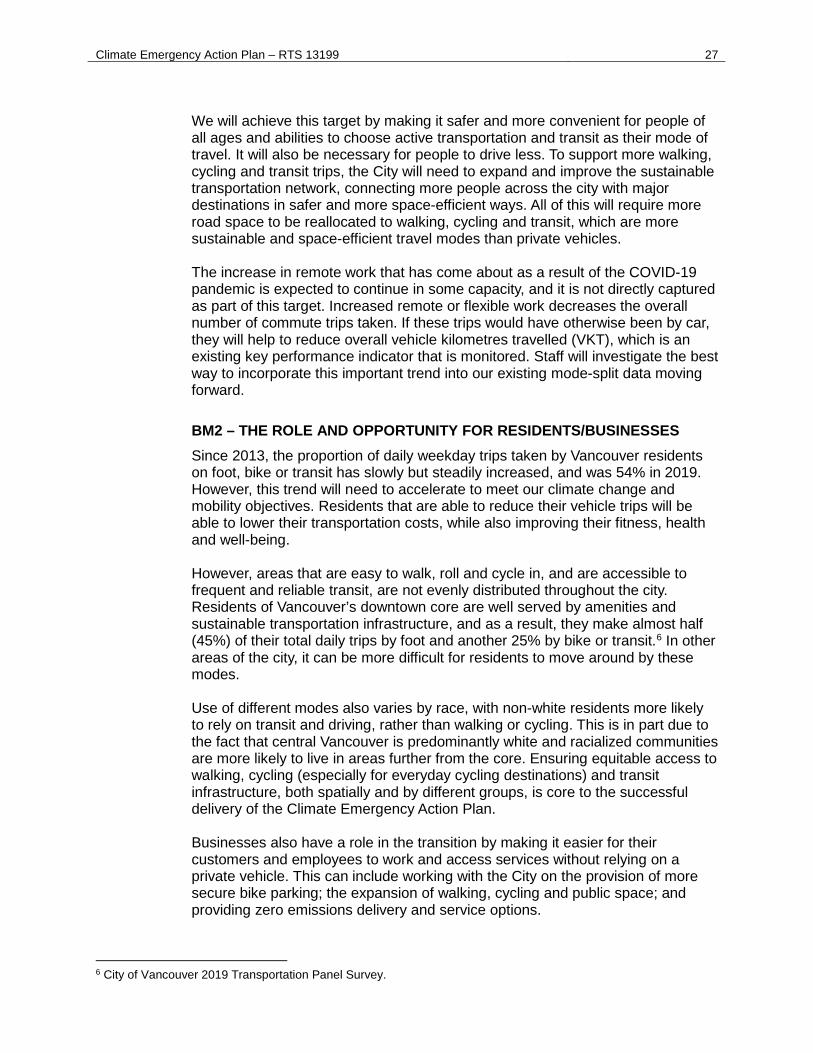
BIG MOVE 1: WALKABLE, COMPLETE NEIGHBOURHOODS
The actions in this section describe the initial work for BM1 that would be directed by report recommendations A and B. Success for this Big Move means more complete neighbourhoods with daily destinations, such as shops, services, parks, schools and community centres, in walking/rolling distance of home. The target set through the Climate Emergency Response was that by 2030, 90% of residents would live within an easy walk/roll of their daily needs. This requires providing more housing and increasing amenities in neighbourhoods across the city.

Climate Emergency Action Plan – RTS 13199 26
Walkable, complete neighbourhoods produce less carbon pollution from transportation, and, to some extent, from buildings. They can support local businesses, increase social connectedness and resilience, and improve physical and mental health. When comparing walkable neighbourhoods and car-dependent neighbourhoods, a recent study5 found those who live in a walkable neighbourhood are:
• 45% more likely to walk for transportation, and 17% more likely to meet the weekly recommended level of physical activity.
• 39% less likely to have diabetes. • 47% more likely to have a strong sense of community belonging.
The full suite of actions needed to achieve the Big Move 1 target is not included in the CEAP because they are so central to the Vancouver Plan. That said, many actions are already underway that directly contribute to more complete, walkable neighbourhoods, including:
• Identifying near-term actions to support existing neighbourhood retail/commercial amenities (including corner stores) in response to recent Council direction and as part of the Employment Lands and Economy Review.
• In coordination with the Vancouver Plan, implementing the new Secured Rental Policy to provide rental housing in proximity to schools, parks and shops and to identify additional actions for expanded housing choice in neighbourhoods.
• Establishing equity as a foundational principle for the Vancouver Plan. The City will examine the current model of development and how it could be changed to address equity and marginalization.
• Current and emerging planning areas, including the Broadway Plan, the Marpole Plan update for Marine Landing, and Jericho Lands, are adding more housing and amenities in areas where residents typically drive less. These areas would seek to exceed the City’s walkable neighborhood target, and for areas close to rapid transit stations, plans would incorporate a target for at least 80% of trips to be made on foot, bike or transit by 2030 (Recommendation B).
• Work led by Engineering and Development, Building and Licensing to support temporary patios, plazas, and other street reallocation initiatives. This work responds both to near-term COVID-19 recovery needs, particularly in commercial areas, as well as long-term opportunities for complete neighbourhoods.
• Ongoing work to implement VanPlay, which includes priorities for parks and recreation amenities in different parts of the city.
• Ongoing work to support childcare, social infrastructure and cultural spaces led by Arts, Culture and Community Services.
The City will be accelerating these actions through implementation of existing plans and policies while developing new strategies through the Vancouver Plan. In combination, those efforts will be designed to put the City on track for the objective that 90% of residents will live within an easy walk/roll of their daily needs.
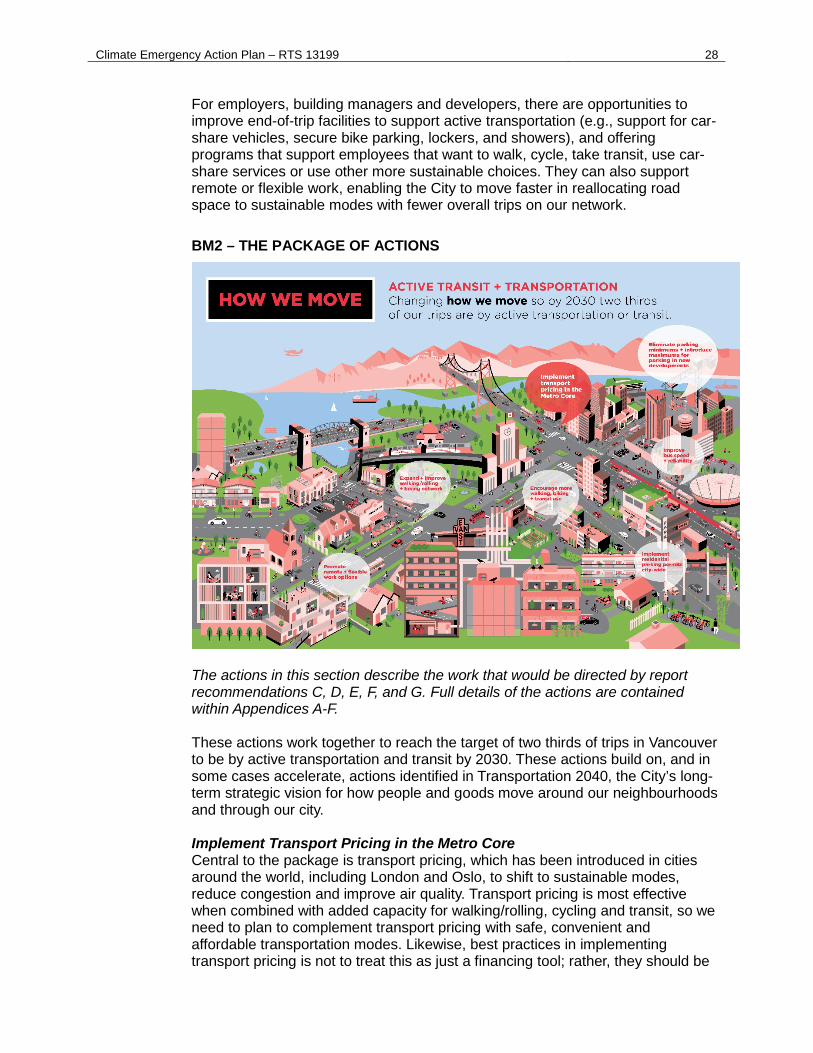
BIG MOVE 2: ACTIVE TRANSPORTATION AND TRANSIT
BM2 – WHAT IS THE TARGET? By 2030, two thirds of trips in Vancouver will be by active transportation and transit.
5 http://www.metrovancouver.org/services/regional-planning/PlanningPublications/WhereMatter-POLICYBRIEF.pdf
Climate Emergency Action Plan – RTS 13199 27
We will achieve this target by making it safer and more convenient for people of all ages and abilities to choose active transportation and transit as their mode of travel. It will also be necessary for people to drive less. To support more walking, cycling and transit trips, the City will need to expand and improve the sustainable transportation network, connecting more people across the city with major destinations in safer and more space-efficient ways. All of this will require more road space to be reallocated to walking, cycling and transit, which are more sustainable and space-efficient travel modes than private vehicles. The increase in remote work that has come about as a result of the COVID-19 pandemic is expected to continue in some capacity, and it is not directly captured as part of this target. Increased remote or flexible work decreases the overall number of commute trips taken. If these trips would have otherwise been by car, they will help to reduce overall vehicle kilometres travelled (VKT), which is an existing key performance indicator that is monitored. Staff will investigate the best way to incorporate this important trend into our existing mode-split data moving forward.
BM2 – THE ROLE AND OPPORTUNITY FOR RESIDENTS/BUSINESSES Since 2013, the proportion of daily weekday trips taken by Vancouver residents on foot, bike or transit has slowly but steadily increased, and was 54% in 2019. However, this trend will need to accelerate to meet our climate change and mobility objectives. Residents that are able to reduce their vehicle trips will be able to lower their transportation costs, while also improving their fitness, health and well-being. However, areas that are easy to walk, roll and cycle in, and are accessible to frequent and reliable transit, are not evenly distributed throughout the city. Residents of Vancouver’s downtown core are well served by amenities and sustainable transportation infrastructure, and as a result, they make almost half (45%) of their total daily trips by foot and another 25% by bike or transit.6 In other areas of the city, it can be more difficult for residents to move around by these modes. Use of different modes also varies by race, with non-white residents more likely to rely on transit and driving, rather than walking or cycling. This is in part due to the fact that central Vancouver is predominantly white and racialized communities are more likely to live in areas further from the core. Ensuring equitable access to walking, cycling (especially for everyday cycling destinations) and transit infrastructure, both spatially and by different groups, is core to the successful delivery of the Climate Emergency Action Plan.
Businesses also have a role in the transition by making it easier for their customers and employees to work and access services without relying on a private vehicle. This can include working with the City on the provision of more secure bike parking; the expansion of walking, cycling and public space; and providing zero emissions delivery and service options.
6 City of Vancouver 2019 Transportation Panel Survey.
Climate Emergency Action Plan – RTS 13199 28
For employers, building managers and developers, there are opportunities to improve end-of-trip facilities to support active transportation (e.g., support for car-share vehicles, secure bike parking, lockers, and showers), and offering programs that support employees that want to walk, cycle, take transit, use car-share services or use other more sustainable choices. They can also support remote or flexible work, enabling the City to move faster in reallocating road space to sustainable modes with fewer overall trips on our network.
BM2 – THE PACKAGE OF ACTIONS
The actions in this section describe the work that would be directed by report recommendations C, D, E, F, and G. Full details of the actions are contained within Appendices A-F. These actions work together to reach the target of two thirds of trips in Vancouver to be by active transportation and transit by 2030. These actions build on, and in some cases accelerate, actions identified in Transportation 2040, the City’s long-term strategic vision for how people and goods move around our neighbourhoods and through our city. Implement Transport Pricing in the Metro Core Central to the package is transport pricing, which has been introduced in cities around the world, including London and Oslo, to shift to sustainable modes, reduce congestion and improve air quality. Transport pricing is most effective when combined with added capacity for walking/rolling, cycling and transit, so we need to plan to complement transport pricing with safe, convenient and affordable transportation modes. Likewise, best practices in implementing transport pricing is not to treat this as just a financing tool; rather, they should be
Climate Emergency Action Plan – RTS 13199 29
used to deliver more structurally equitable, and sustainable transportation infrastructure.7 Expand and Improve the Walking, Cycling and Transit Networks Prioritizing buses over other traffic and parking improves both bus efficiency and reliability. Ten routes will be completed by 2030, six of which will be completed by 2025. Meanwhile, expanding the walking and cycling network will make it easier to move throughout the city and to access a further-improved transit network—from the dense Metro Core, to the less dense areas of Vancouver. Staff will also work to establish a pilot program of e-bikes with Mobi bike share. By improving these sustainable transportation networks and creating complete streets, people will have more comfortable and desirable walking, cycling and transit access to employment and other destinations, and feel safer as they travel around the city, whether it be for work, school, shopping or recreation. Beyond these new actions to support active transportation and transit, the Broadway Subway project is expected to be completed by the end of the CEAP, and to become a major people-mover city-wide and regionally, as well as the enabler of the Broadway Plan. This may be further enhanced in the future with a UBC SkyTrain rapid transit extension, which will also support high levels of transit use around the new rapid transit stations. Encourage Walking, Cycling, and Transit Use Promotion, education and a new City-Wide Transportation Demand Management Plan will complement the infrastructure investment, encouraging people to increase their walking and cycling trips. It will also involve working with schools and encouraging employers to provide secure bike storage and showers and to support remote and flexible work opportunities. Eliminate Off-Street Parking Minimums And Introduce More Parking Maximums With the elimination of off-street parking minimums city-wide, except for spaces required for accessibility, new developments may be built with fewer vehicle parking stalls and greater support for sustainable modes of transportation, such as high-quality, secure bike parking, and more convenient access to walking and cycling networks. The benefits of this action go beyond transportation—there are affordability benefits (an underground parking space can cost $50,000 to construct) and potential reductions in embodied carbon (underground parking structures can account for 12–20% of the embodied carbon in a new building). Modest parking maximums will be another critical component of the off-street parking policy. With the high cost of parking construction—economically, environmentally, and socially—limiting maximum parking rates can improve affordability and reduce carbon impacts, as well as all the typical benefits of reducing reliance on gas and diesel vehicles Implement Residential Parking Permits City-Wide Starting in 2021 as part of the CEAP, residential permit parking requirements will be established on every residential street in the city. Today, nearly one third of
7 Eno Center for Transportation 2020, Congestion Pricing in the United States
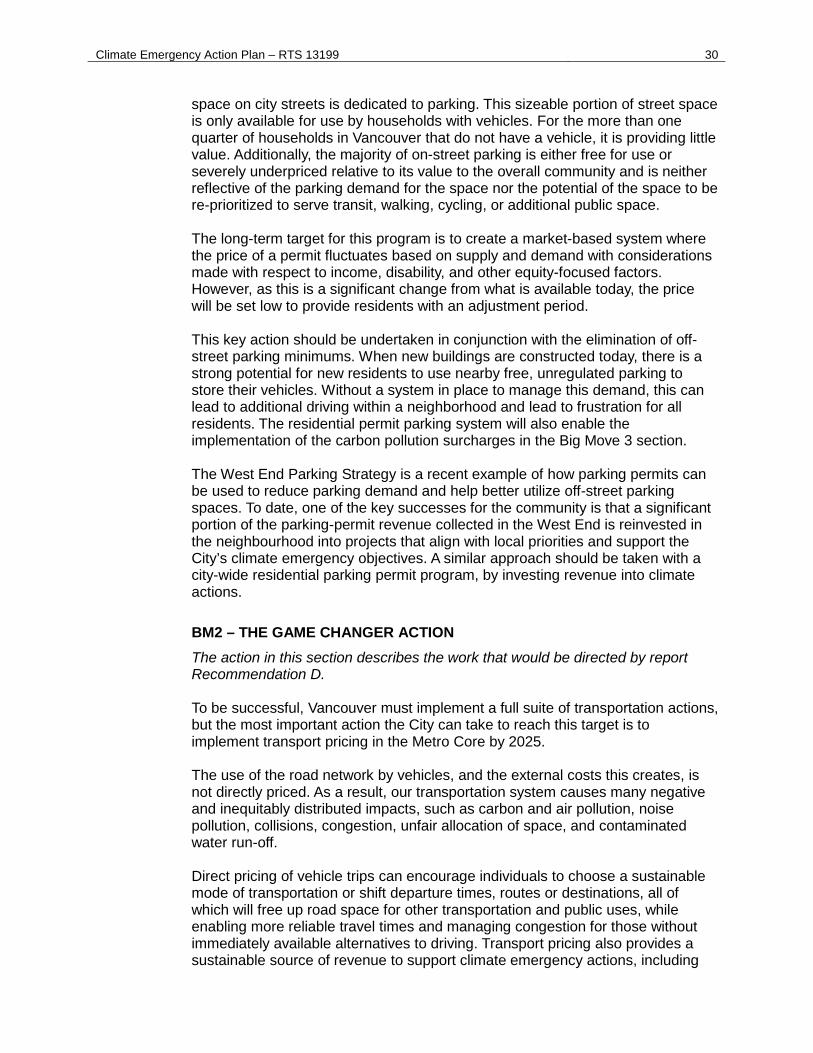
Climate Emergency Action Plan – RTS 13199 30
space on city streets is dedicated to parking. This sizeable portion of street space is only available for use by households with vehicles. For the more than one quarter of households in Vancouver that do not have a vehicle, it is providing little value. Additionally, the majority of on-street parking is either free for use or severely underpriced relative to its value to the overall community and is neither reflective of the parking demand for the space nor the potential of the space to be re-prioritized to serve transit, walking, cycling, or additional public space. The long-term target for this program is to create a market-based system where the price of a permit fluctuates based on supply and demand with considerations made with respect to income, disability, and other equity-focused factors. However, as this is a significant change from what is available today, the price will be set low to provide residents with an adjustment period. This key action should be undertaken in conjunction with the elimination of off-street parking minimums. When new buildings are constructed today, there is a strong potential for new residents to use nearby free, unregulated parking to store their vehicles. Without a system in place to manage this demand, this can lead to additional driving within a neighborhood and lead to frustration for all residents. The residential permit parking system will also enable the implementation of the carbon pollution surcharges in the Big Move 3 section. The West End Parking Strategy is a recent example of how parking permits can be used to reduce parking demand and help better utilize off-street parking spaces. To date, one of the key successes for the community is that a significant portion of the parking-permit revenue collected in the West End is reinvested in the neighbourhood into projects that align with local priorities and support the City’s climate emergency objectives. A similar approach should be taken with a city-wide residential parking permit program, by investing revenue into climate actions.
BM2 – THE GAME CHANGER ACTION The action in this section describes the work that would be directed by report Recommendation D. To be successful, Vancouver must implement a full suite of transportation actions, but the most important action the City can take to reach this target is to implement transport pricing in the Metro Core by 2025. The use of the road network by vehicles, and the external costs this creates, is not directly priced. As a result, our transportation system causes many negative and inequitably distributed impacts, such as carbon and air pollution, noise pollution, collisions, congestion, unfair allocation of space, and contaminated water run-off. Direct pricing of vehicle trips can encourage individuals to choose a sustainable mode of transportation or shift departure times, routes or destinations, all of which will free up road space for other transportation and public uses, while enabling more reliable travel times and managing congestion for those without immediately available alternatives to driving. Transport pricing also provides a sustainable source of revenue to support climate emergency actions, including
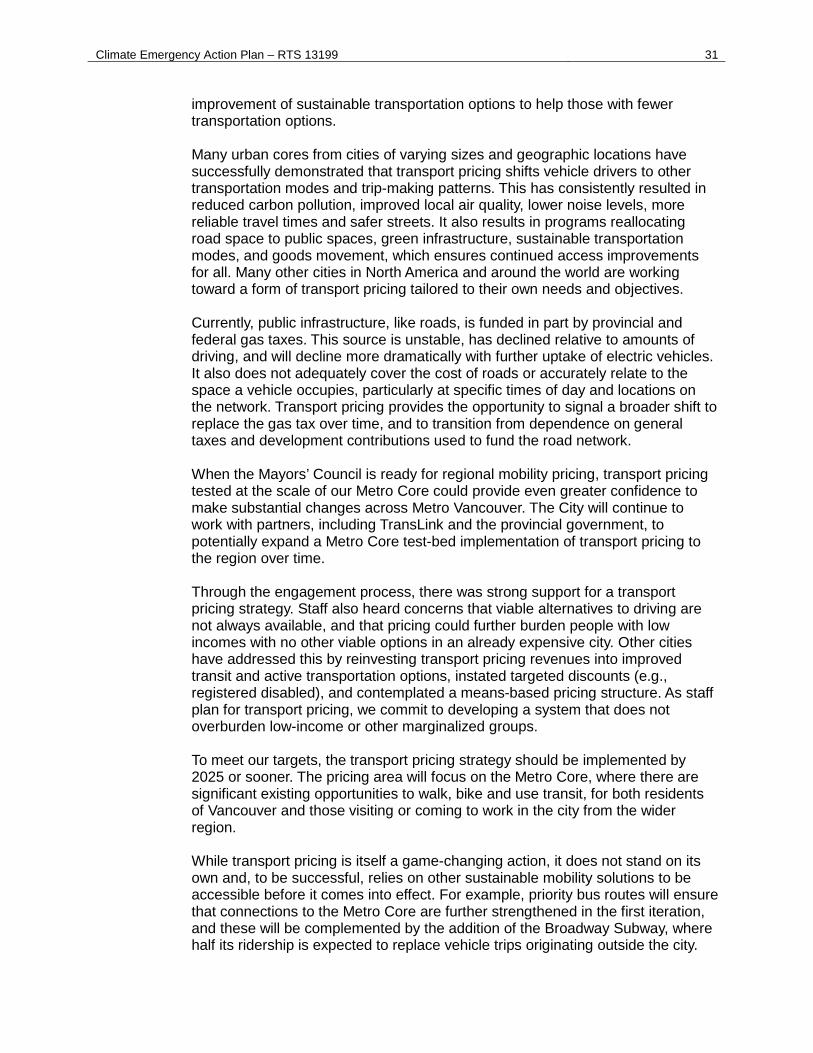
Climate Emergency Action Plan – RTS 13199 31
improvement of sustainable transportation options to help those with fewer transportation options. Many urban cores from cities of varying sizes and geographic locations have successfully demonstrated that transport pricing shifts vehicle drivers to other transportation modes and trip-making patterns. This has consistently resulted in reduced carbon pollution, improved local air quality, lower noise levels, more reliable travel times and safer streets. It also results in programs reallocating road space to public spaces, green infrastructure, sustainable transportation modes, and goods movement, which ensures continued access improvements for all. Many other cities in North America and around the world are working toward a form of transport pricing tailored to their own needs and objectives. Currently, public infrastructure, like roads, is funded in part by provincial and federal gas taxes. This source is unstable, has declined relative to amounts of driving, and will decline more dramatically with further uptake of electric vehicles. It also does not adequately cover the cost of roads or accurately relate to the space a vehicle occupies, particularly at specific times of day and locations on the network. Transport pricing provides the opportunity to signal a broader shift to replace the gas tax over time, and to transition from dependence on general taxes and development contributions used to fund the road network. When the Mayors’ Council is ready for regional mobility pricing, transport pricing tested at the scale of our Metro Core could provide even greater confidence to make substantial changes across Metro Vancouver. The City will continue to work with partners, including TransLink and the provincial government, to potentially expand a Metro Core test-bed implementation of transport pricing to the region over time. Through the engagement process, there was strong support for a transport pricing strategy. Staff also heard concerns that viable alternatives to driving are not always available, and that pricing could further burden people with low incomes with no other viable options in an already expensive city. Other cities have addressed this by reinvesting transport pricing revenues into improved transit and active transportation options, instated targeted discounts (e.g., registered disabled), and contemplated a means-based pricing structure. As staff plan for transport pricing, we commit to developing a system that does not overburden low-income or other marginalized groups. To meet our targets, the transport pricing strategy should be implemented by 2025 or sooner. The pricing area will focus on the Metro Core, where there are significant existing opportunities to walk, bike and use transit, for both residents of Vancouver and those visiting or coming to work in the city from the wider region. While transport pricing is itself a game-changing action, it does not stand on its own and, to be successful, relies on other sustainable mobility solutions to be accessible before it comes into effect. For example, priority bus routes will ensure that connections to the Metro Core are further strengthened in the first iteration, and these will be complemented by the addition of the Broadway Subway, where half its ridership is expected to replace vehicle trips originating outside the city.
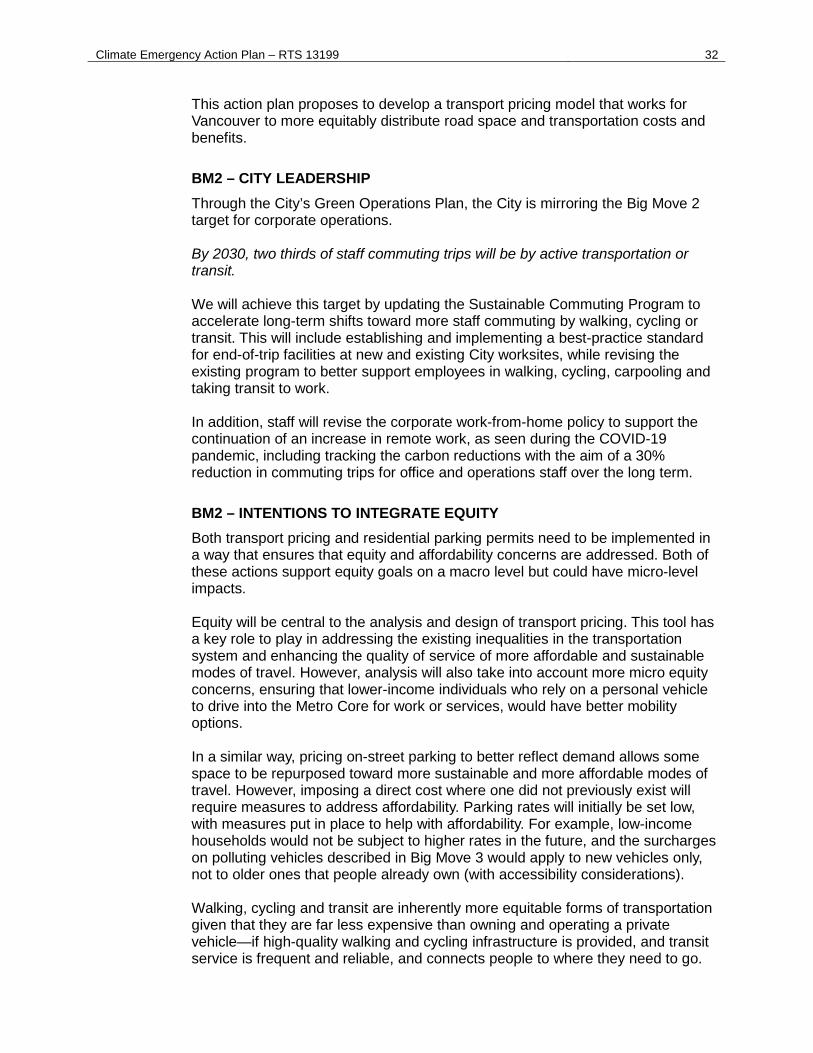
Climate Emergency Action Plan – RTS 13199 32
This action plan proposes to develop a transport pricing model that works for Vancouver to more equitably distribute road space and transportation costs and benefits.
BM2 – CITY LEADERSHIP Through the City’s Green Operations Plan, the City is mirroring the Big Move 2 target for corporate operations. By 2030, two thirds of staff commuting trips will be by active transportation or transit. We will achieve this target by updating the Sustainable Commuting Program to accelerate long-term shifts toward more staff commuting by walking, cycling or transit. This will include establishing and implementing a best-practice standard for end-of-trip facilities at new and existing City worksites, while revising the existing program to better support employees in walking, cycling, carpooling and taking transit to work. In addition, staff will revise the corporate work-from-home policy to support the continuation of an increase in remote work, as seen during the COVID-19 pandemic, including tracking the carbon reductions with the aim of a 30% reduction in commuting trips for office and operations staff over the long term.
BM2 – INTENTIONS TO INTEGRATE EQUITY Both transport pricing and residential parking permits need to be implemented in a way that ensures that equity and affordability concerns are addressed. Both of these actions support equity goals on a macro level but could have micro-level impacts. Equity will be central to the analysis and design of transport pricing. This tool has a key role to play in addressing the existing inequalities in the transportation system and enhancing the quality of service of more affordable and sustainable modes of travel. However, analysis will also take into account more micro equity concerns, ensuring that lower-income individuals who rely on a personal vehicle to drive into the Metro Core for work or services, would have better mobility options. In a similar way, pricing on-street parking to better reflect demand allows some space to be repurposed toward more sustainable and more affordable modes of travel. However, imposing a direct cost where one did not previously exist will require measures to address affordability. Parking rates will initially be set low, with measures put in place to help with affordability. For example, low-income households would not be subject to higher rates in the future, and the surcharges on polluting vehicles described in Big Move 3 would apply to new vehicles only, not to older ones that people already own (with accessibility considerations). Walking, cycling and transit are inherently more equitable forms of transportation given that they are far less expensive than owning and operating a private vehicle—if high-quality walking and cycling infrastructure is provided, and transit service is frequent and reliable, and connects people to where they need to go.
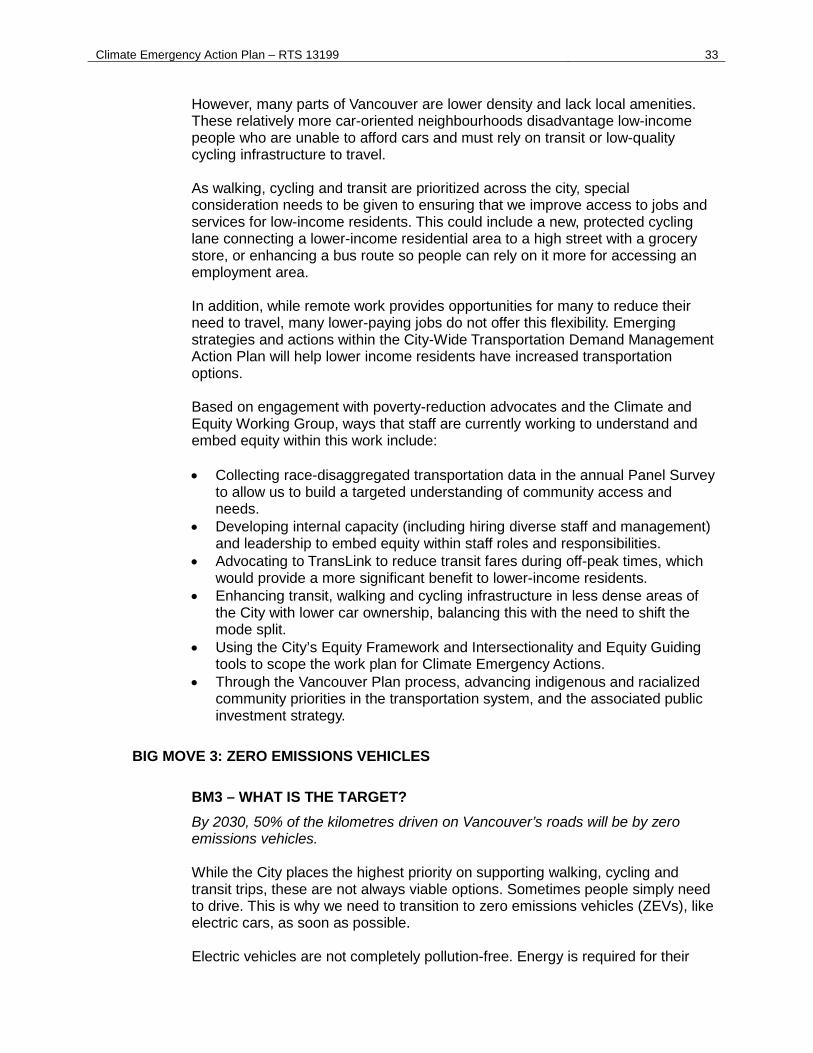
Climate Emergency Action Plan – RTS 13199 33
However, many parts of Vancouver are lower density and lack local amenities. These relatively more car-oriented neighbourhoods disadvantage low-income people who are unable to afford cars and must rely on transit or low-quality cycling infrastructure to travel. As walking, cycling and transit are prioritized across the city, special consideration needs to be given to ensuring that we improve access to jobs and services for low-income residents. This could include a new, protected cycling lane connecting a lower-income residential area to a high street with a grocery store, or enhancing a bus route so people can rely on it more for accessing an employment area. In addition, while remote work provides opportunities for many to reduce their need to travel, many lower-paying jobs do not offer this flexibility. Emerging strategies and actions within the City-Wide Transportation Demand Management Action Plan will help lower income residents have increased transportation options. Based on engagement with poverty-reduction advocates and the Climate and Equity Working Group, ways that staff are currently working to understand and embed equity within this work include: • Collecting race-disaggregated transportation data in the annual Panel Survey
to allow us to build a targeted understanding of community access and needs.
• Developing internal capacity (including hiring diverse staff and management) and leadership to embed equity within staff roles and responsibilities.
• Advocating to TransLink to reduce transit fares during off-peak times, which would provide a more significant benefit to lower-income residents.
• Enhancing transit, walking and cycling infrastructure in less dense areas of the City with lower car ownership, balancing this with the need to shift the mode split.
• Using the City’s Equity Framework and Intersectionality and Equity Guiding tools to scope the work plan for Climate Emergency Actions.
• Through the Vancouver Plan process, advancing indigenous and racialized community priorities in the transportation system, and the associated public investment strategy.
BIG MOVE 3: ZERO EMISSIONS VEHICLES
BM3 – WHAT IS THE TARGET? By 2030, 50% of the kilometres driven on Vancouver’s roads will be by zero emissions vehicles. While the City places the highest priority on supporting walking, cycling and transit trips, these are not always viable options. Sometimes people simply need to drive. This is why we need to transition to zero emissions vehicles (ZEVs), like electric cars, as soon as possible. Electric vehicles are not completely pollution-free. Energy is required for their
Climate Emergency Action Plan – RTS 13199 34
manufacture, which generates carbon pollution. More locally, braking—albeit it significantly less than fossil-fueled vehicles—and tire wear generate particulate matter. However, EVs do not emit tailpipe pollution like gasoline and diesel cars, and almost all of the electricity in B.C. comes from renewable sources. They are also quieter and do not use toxic fluids that end up in our water, like motor oil, transmission fluid and antifreeze. To achieve the target, almost all new vehicles purchased in 2030 and beyond will need to be zero emissions, and our light-duty passenger fleets, like taxis and car-share vehicles, will need to fully transition to zero emissions by 2030. Staff will also continue to work with the freight industry to help facilitate their transition to zero emission vehicles. The City also continues to support TransLink in its Low Carbon Fleet Strategy, which aims to reduce carbon emissions by 80% by 2050 and use only renewable energy in all operations by 2050, primarily through the transition to battery-powered electric buses.
BM3 – THE ROLE AND OPPORTUNITY FOR RESIDENTS/BUSINESSES As of late 2019, about 10% of new light-duty vehicle sales in B.C. are electric (among the highest rates in North America), and about 1 in 3 households say they expect their next vehicle to be electric. The variety of EVs continues to increase, their cost premium continues to drop, their fuel (electricity) is ubiquitous, and they are less expensive to operate and maintain than a gas or diesel vehicle. For residents who already own a gas or diesel vehicle, the more they can leave it at home, the better, but there is no expectation that they replace it sooner than needed. When that time does come, we want them to seriously consider electric options, depending on their needs and budget. The significant gas and maintenance savings can help offset higher initial purchase prices. To make the switch easier, the City will continue to expand the public charging network, and will require any parking stalls in new buildings to be ready to meet the charging needs of electric vehicles. Light-duty passenger fleet operators, such as taxis, ride-hailing companies and car-share companies, are able to make an even larger per-vehicle impact by converting their fleets to electric because their vehicles drive greater distances than personal vehicles. The business case for an EV gets even stronger for higher-mileage vehicles, since operators can cut fuel and maintenance costs by over 70%. As residents and businesses increasingly expect their new and used vehicles to be zero emissions, manufacturers will need to shift their vehicles to zero emissions, car dealerships will need to shift their business models to selling EVs, auto shops will need to train their staff in servicing EVs, and gas stations and parking lots will be expected to provide charging for EVs. There will be increasing opportunities for electricians with the skills to install EV-charging equipment, and there will be new business opportunities for technology companies with innovative charging solutions.
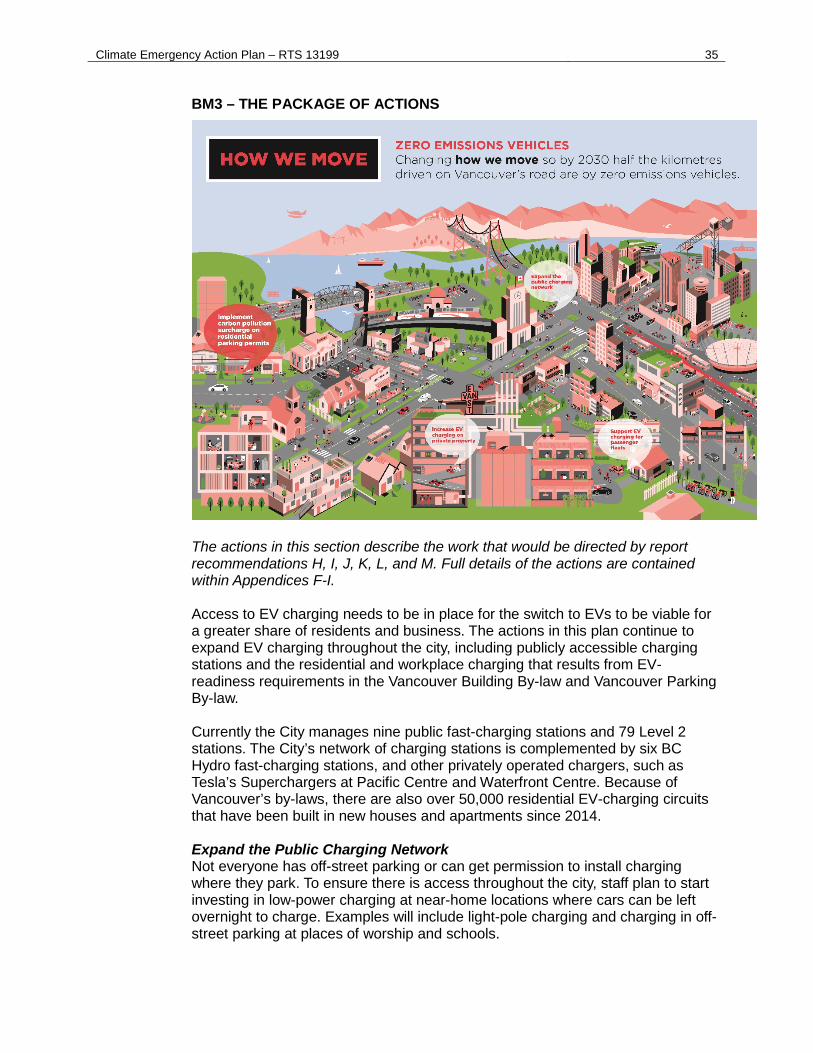
Climate Emergency Action Plan – RTS 13199 35
BM3 – THE PACKAGE OF ACTIONS
The actions in this section describe the work that would be directed by report recommendations H, I, J, K, L, and M. Full details of the actions are contained within Appendices F-I. Access to EV charging needs to be in place for the switch to EVs to be viable for a greater share of residents and business. The actions in this plan continue to expand EV charging throughout the city, including publicly accessible charging stations and the residential and workplace charging that results from EV-readiness requirements in the Vancouver Building By-law and Vancouver Parking By-law. Currently the City manages nine public fast-charging stations and 79 Level 2 stations. The City’s network of charging stations is complemented by six BC Hydro fast-charging stations, and other privately operated chargers, such as Tesla’s Superchargers at Pacific Centre and Waterfront Centre. Because of Vancouver’s by-laws, there are also over 50,000 residential EV-charging circuits that have been built in new houses and apartments since 2014. Expand the Public Charging Network Not everyone has off-street parking or can get permission to install charging where they park. To ensure there is access throughout the city, staff plan to start investing in low-power charging at near-home locations where cars can be left overnight to charge. Examples will include light-pole charging and charging in off-street parking at places of worship and schools.
Climate Emergency Action Plan – RTS 13199 36
The next five years will see hundreds of these near-home charging points added throughout the city. Priority will be given to areas with higher rates of home rental and/or lower rates of EV adoption. These investments in near-home charging for people without access to home charging will be complemented with new guidance that is based on Seattle’s approach to allow residents to safely run an extension cord from their home to charge their vehicle. Staff will also continue to expand the traditional public charging network, with 24 more fast-charging stations and at least 35 more Level 2 stations by 2025. To make our investments in this public charging and the near-home charging more cost-effective, deployments will be coordinated with other initiatives, such as piloting e-bikes as part of Mobi bike sharing, or the electrification of film and food trucks. Increase EV Charging on Private Property All new residential parking stalls are already required to be EV-ready, and staff will be updating the City’s rules for new non-residential buildings, like offices and schools, to increase the EV-readiness requirements. The City will continue to require the addition of fast-charging hubs during the development of large site rezonings; these requirements will be updated as technological capabilities and user needs evolve. Staff will also be adjusting our business license classifications to encourage gas stations and parking lots to add EV charging to serve their customers. Because access to home charging is so important to EV adoption, we have to find ways to add more charging in existing residential buildings that were constructed prior to the introduction of the City’s EV construction requirements. This is particularly important for rental buildings, which have not been well matched to provincial incentive programs for home charging. As part of the CEAP, the City will support existing rental buildings in adding charging infrastructure for tenants, so that a switch to an EV is more viable for those residents. Support EV Charging for Passenger Fleets While many of these actions focus on privately owned vehicles, due to the large number of them on Vancouver’s roads and their resulting carbon impact, there are also actions to support passenger fleets (ride hailing, taxis, etc.) in transitioning to zero emissions vehicles. In particular, staff are investigating how we can support passenger-fleet drivers in obtaining home charging, and how we can provide public charging that is targeted or even dedicated to passenger fleets (Appendix I). Establish Carbon Pollution Surcharge on Parking Permits In addition to increasing the availability of charging, the CEAP will establish a carbon pollution surcharge on parking permits for new, higher-priced gas and diesel vehicles (factoring in accessibility considerations). That surcharge will be significant enough to influence purchasing decisions and accelerate the transition to zero emissions vehicles. The parking permit surcharge for residential parking permits will complement work underway in the Urban Freight Strategy that will modernize the City’s loading zones and incorporate measures to discourage commercial gas and
Climate Emergency Action Plan – RTS 13199 37
diesel vehicles, and encourage alternatives, such as electric cargo bikes and zero emissions freight vehicles.
BM3 – THE GAME CHANGER ACTION The action in this section describes the work that would be directed by report Recommendation H. Central to reaching this target is the development of the residential parking permit surcharge indexed to the carbon intensity of the vehicle. The surcharge encourages residents and businesses purchasing new vehicles to select less-polluting vehicles, like EVs, over fossil-fueled vehicles. This would be a significant new tool for the City beyond our more established work on EV charging, and staff intend to design it in a way that complements the City’s active transportation and transit objectives, and recognizes that EVs are only starting to become an affordable option for many of our residents. While the details of the carbon pollution surcharge for parking permits still need to be determined through further engagement and technical analysis in 2021, there will be two core elements in the final design: • Residential parking permits applied city-wide. The move to residential
parking permits across Vancouver (part of the Big Move 2 actions) is predominantly about managing on-street parking demand, allowing us to eliminate parking minimums in new construction (except for accessibility needs), and helping shift some of our road space from the dedicated storage of vehicles to higher-value uses. That said, it is also an enabling tool that allows us to encourage the shift to zero emissions vehicles in ways the City cannot do if relying solely on charging infrastructure.
• Carbon intensity parking permit fee surcharge. The residential parking
permit fee will align with the City’s internal corporate carbon pricing (set at $155 per tonne of carbon pollution in 2020) and will be complemented with a surcharge designed to account for the carbon intensity of the vehicle. The more polluting the vehicle, the higher the charge.
The initial step will only apply to new vehicles with a higher purchase price. This approach will focus the policy on households that are purchasing new higher-end vehicles, where there is already a wider range of electric vehicles available on the market. The anticipated threshold for higher purchase price vehicles is $40,000 to $50,000. The surcharge would not apply to households with older vehicles or households looking to purchase a lower-cost vehicle, where electric vehicles are still limited in availability. As the availability of EVs continues to increase and their price premium continues to drop, the City will evaluate if the surcharge should increase over time and if its application should expand to more vehicles. A number of other cities around the world use similar approaches. Sydney, (Australia), and Montreal, for example, each have on-street permit programs
Climate Emergency Action Plan – RTS 13199 38
where rates vary based on both vehicle emissions and the number of permits purchased per household.
BM3 – CITY LEADERSHIP Through the City’s Green Operations Plan, we are mirroring the Big Move 3 target for corporate operations.
By 2030, 50% of the kilometres driven by on-road City vehicles will be by zero emissions vehicles. The City has already made good progress in reducing the impact of its corporate fleet, with emissions declining by 25% below 2007 levels. We currently have 130 electric vehicles in our fleet.
We will achieve this target by ensuring that all light-duty passenger vehicle purchases are electric, as long as they are viable and technically feasible, and electric or low-carbon options are considered and evaluated for all other fleet and equipment purchases. As per our internal carbon pricing policy, all of our fleet replacement projects look at total cost of ownership when considering replacement options. As electric vehicles continue to become more cost competitive with conventional internal combustion vehicles, we will adjust our capital planning process accordingly. To support the increase in electric vehicles in the City fleet, staff have also been installing electric vehicle charging infrastructure for fleet charging. The necessary infrastructure makes up an important part of our capital planning process, and it is combined with fleet replacement projects to ensure that all fleet vehicles that transition to electric are able to access the necessary charging infrastructure so that there is minimal impact to the City’s operations.
BM3 – INTENTIONS TO INTEGRATE EQUITY To avoid unintended equity impacts from the carbon intensity parking permit surcharge, the surcharge would only be applied to new, higher-cost vehicles where there are more zero emissions vehicles available and the purchaser has the means to buy a more expensive vehicle. This gives a household purchasing a new vehicle the option of avoiding the surcharge by choosing an EV or choosing a vehicle below the price threshold. If they decide to purchase a more expensive gas or diesel vehicle, the surcharge would apply. Staff recognize that potential concerns are not limited to income, and we will be assessing the policy design to account for other possible equity issues (e.g., based on gender, race, physical ability). The present up-front cost of zero emissions vehicles, while decreasing rapidly, is also still a barrier for many people considering an EV, particularly for low- and middle-income households. Active transportation and transit do not have the same financial access barriers, which is one of the reasons staff have placed such a high emphasis on them in the CEAP. At the same time, the City will not be successful in meeting our emissions reduction goals if EVs are only available to upper-income households.
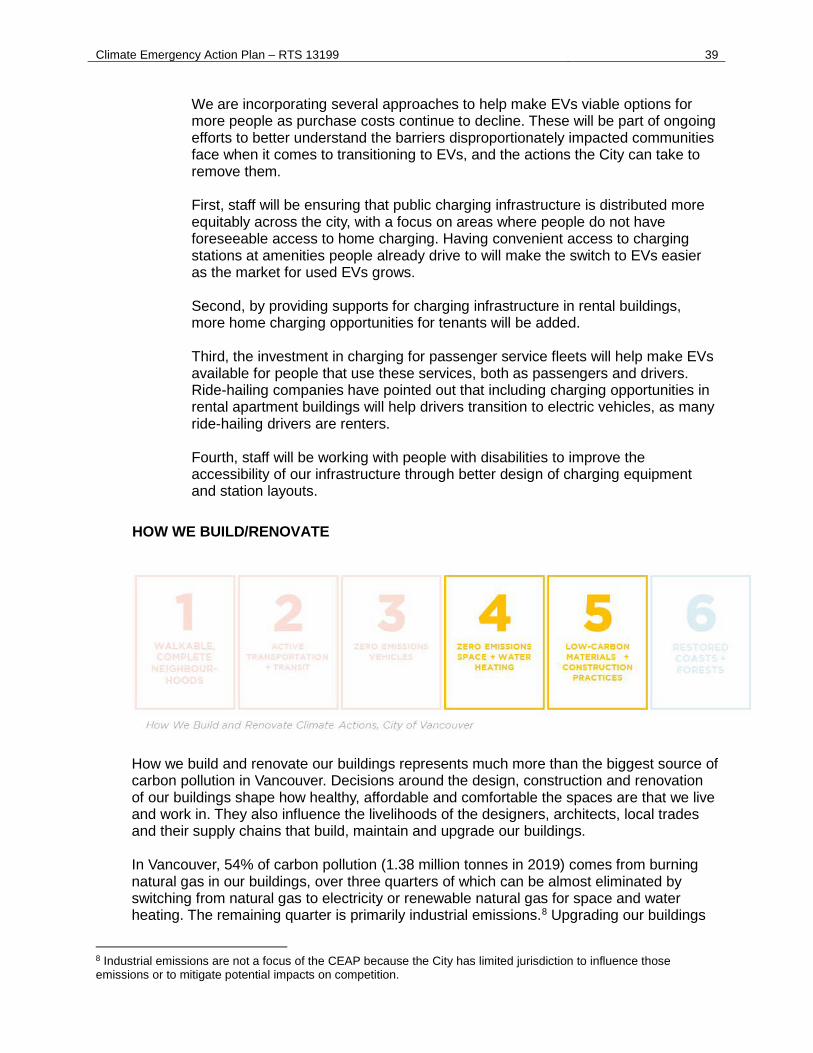
Climate Emergency Action Plan – RTS 13199 39
We are incorporating several approaches to help make EVs viable options for more people as purchase costs continue to decline. These will be part of ongoing efforts to better understand the barriers disproportionately impacted communities face when it comes to transitioning to EVs, and the actions the City can take to remove them. First, staff will be ensuring that public charging infrastructure is distributed more equitably across the city, with a focus on areas where people do not have foreseeable access to home charging. Having convenient access to charging stations at amenities people already drive to will make the switch to EVs easier as the market for used EVs grows. Second, by providing supports for charging infrastructure in rental buildings, more home charging opportunities for tenants will be added.
Third, the investment in charging for passenger service fleets will help make EVs available for people that use these services, both as passengers and drivers. Ride-hailing companies have pointed out that including charging opportunities in rental apartment buildings will help drivers transition to electric vehicles, as many ride-hailing drivers are renters. Fourth, staff will be working with people with disabilities to improve the accessibility of our infrastructure through better design of charging equipment and station layouts.
HOW WE BUILD/RENOVATE
How we build and renovate our buildings represents much more than the biggest source of carbon pollution in Vancouver. Decisions around the design, construction and renovation of our buildings shape how healthy, affordable and comfortable the spaces are that we live and work in. They also influence the livelihoods of the designers, architects, local trades and their supply chains that build, maintain and upgrade our buildings. In Vancouver, 54% of carbon pollution (1.38 million tonnes in 2019) comes from burning natural gas in our buildings, over three quarters of which can be almost eliminated by switching from natural gas to electricity or renewable natural gas for space and water heating. The remaining quarter is primarily industrial emissions.8 Upgrading our buildings
8 Industrial emissions are not a focus of the CEAP because the City has limited jurisdiction to influence those emissions or to mitigate potential impacts on competition.
Climate Emergency Action Plan – RTS 13199 40
with better windows, air-tightness and insulation is also an important step because it reduces the amount of energy we waste and makes the switch to renewable energy easier and more affordable. Another 179,500 tonnes are created outside the city annually from the manufacturing and transport of building materials, like cement and steel. These sources of carbon pollution, known as embodied carbon, can be reduced through material choices, such as increasing the use of mass timber assemblies for commercial and high-rise buildings; switching to low-carbon concrete mixes; avoiding harmful materials, such as most spray-foam insulation; and by land use development choices, such as constructing fewer parking spaces. Given the ongoing housing affordability crisis and COVID-19 challenges, the work to reduce these sources of carbon pollution will take a phased approach to ensure maximum flexibility, equitable outcomes, and the maximization of co-benefits, such as health, resilience, comfort, and opportunities for employment. We are committed to managing this transition in a way that does not displace residents.
BIG MOVE 4: ZERO EMISSIONS SPACE AND HOT WATER HEATING
BM4 – WHAT IS THE TARGET? By 2030, the carbon pollution from building operations will be cut in half from 2007 levels.9 Since 2007, the City has approved changes to building energy requirements, the latest of which will reduce emissions from new buildings by over 70% by 2022. The City is also on track to require all heating and hot water systems in new buildings to be zero emissions by 2025.10 This progress on new buildings is critical to achieve our target, because every new zero emissions building is one that does not need a zero emissions retrofit in the future. Each of these new zero emissions buildings also helps strengthen local, low-carbon supply chains. While the City is well on our way toward zero emissions new buildings, existing buildings are a bigger challenge because of our large diversity of existing buildings with varying ages, approaches and systems—few of which had carbon emissions and climate change in mind when they were built. To achieve this target, we need to make our existing buildings significantly more energy efficient and switch their space heating and hot water systems to renewable energy. In many cases, this will involve reducing energy use by adding insulation, better windows, or improving air-tightness, and switching from a fossil-fuel burning system to an electric heat pump, which are typically around 300% efficient and can provide heating, as well as cooling during our increasingly hot summers.
9 This target has evolved from the 2019 Climate Emergency Response version, “by 2025, all new and replacement heating and hot water systems will be zero emissions.” This prescriptive requirement was deemed too onerous for building owners and managers, as it did not allow for sufficient flexibility and alternative solutions. 10 “Zero emissions” buildings are categorized as those that achieve the highest standards in green building design; this includes the Passive House Standard, Net Zero Energy, and the Living Building Challenge.
Climate Emergency Action Plan – RTS 13199 41
BM4 – THE ROLE AND OPPORTUNITY FOR RESIDENTS/BUSINESSES With a focus on new buildings over the past decade, members of the local green building industry have become leaders in efficient building design and construction in order to meet the progressive building codes put in place by the City of Vancouver and the Government of B.C. As of 2020, there are over 50 zero emissions new buildings in Vancouver, representing more than 2 million square feet (185,000 m2) of new floor space either built or in development, including the world’s tallest Passive House tower.11 Green buildings present a massive economic development and recovery opportunity. Low-carbon retrofits create a high number of jobs per dollar invested, the jobs created are localized and employ a wide range of skills, and renovation projects use mostly locally sourced materials and manufactured products. The work underway through the Zero Emissions Building Plan and the BC Energy Step Code is tapping a $3.3 billion economic opportunity in British Columbia as we transition to more energy-efficient and less-polluting new buildings. Expanding that work to include existing buildings will significantly grow that economic opportunity. 12 Building owners and managers will be expected to measure and reduce the carbon pollution from their buildings, ideally when they are undertaking routine building maintenance, equipment replacement, or other planned upgrades. As their buildings are improved and carbon pollution comes down, the benefits will extend to occupants: more energy-efficient buildings are quieter and more comfortable in hot and cold weather, and they can have lower energy bills. The switch to heat pumps also comes with the benefit of air conditioning, which is becoming increasingly important in the summer during heat waves, especially when they coincide with wildfire smoke events, when occupants will want to keep their windows closed.
11 For reference, the City of Vancouver builds approximately 7.5 million square feet (700,000 m2) of new building floor space annually. In June 2020, the tallest Passive House building in the world, 1059–1075 Nelson Street in downtown Vancouver, was approved by Council. 12 Vancouver Economic Commission (VEC), Green Building Market Forecast (2019)
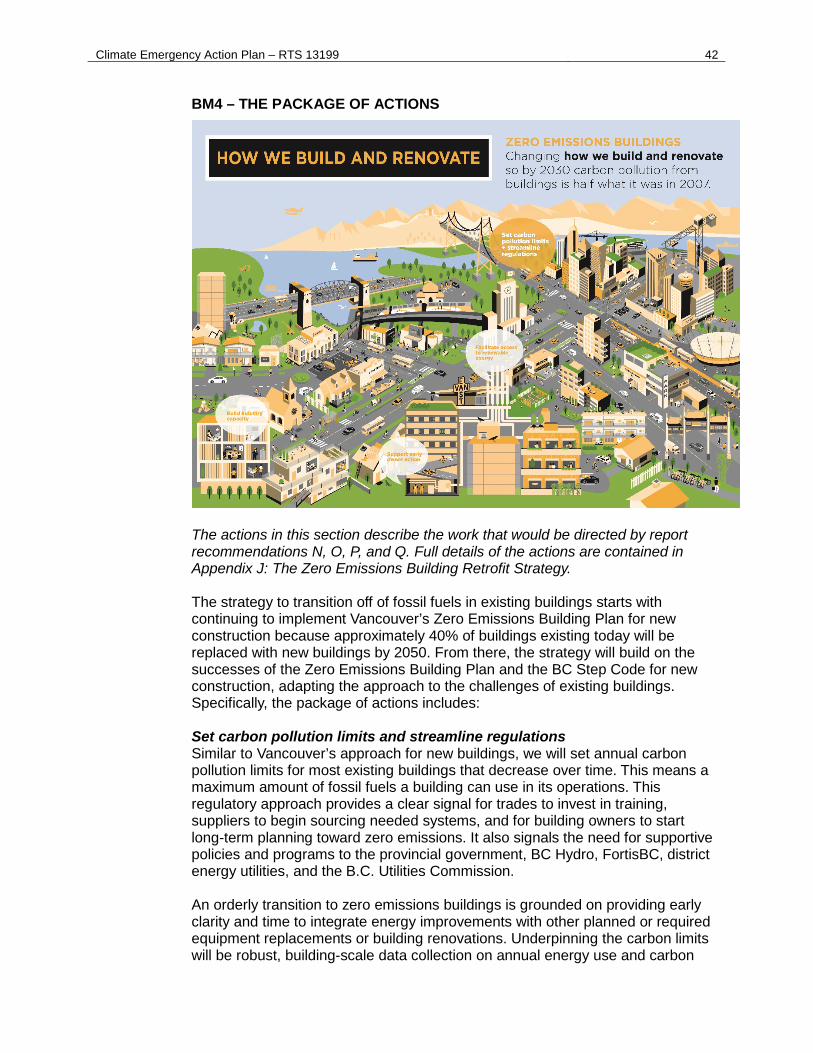
Climate Emergency Action Plan – RTS 13199 42
BM4 – THE PACKAGE OF ACTIONS
The actions in this section describe the work that would be directed by report recommendations N, O, P, and Q. Full details of the actions are contained in Appendix J: The Zero Emissions Building Retrofit Strategy. The strategy to transition off of fossil fuels in existing buildings starts with continuing to implement Vancouver’s Zero Emissions Building Plan for new construction because approximately 40% of buildings existing today will be replaced with new buildings by 2050. From there, the strategy will build on the successes of the Zero Emissions Building Plan and the BC Step Code for new construction, adapting the approach to the challenges of existing buildings. Specifically, the package of actions includes:
Set carbon pollution limits and streamline regulations Similar to Vancouver’s approach for new buildings, we will set annual carbon pollution limits for most existing buildings that decrease over time. This means a maximum amount of fossil fuels a building can use in its operations. This regulatory approach provides a clear signal for trades to invest in training, suppliers to begin sourcing needed systems, and for building owners to start long-term planning toward zero emissions. It also signals the need for supportive policies and programs to the provincial government, BC Hydro, FortisBC, district energy utilities, and the B.C. Utilities Commission. An orderly transition to zero emissions buildings is grounded on providing early clarity and time to integrate energy improvements with other planned or required equipment replacements or building renovations. Underpinning the carbon limits will be robust, building-scale data collection on annual energy use and carbon
Climate Emergency Action Plan – RTS 13199 43
pollution by 2023, as well as mechanisms to safeguard tenants from renoviction and avoid undue hardship on owners and managers. Moving to this approach will also enable us to remove many of the energy efficiency upgrade requirements currently attached to many renovation permits without compromising our environmental objectives. This will simplify the permitting process for small businesses and homeowners and facilitate their investments for other improvements or changes to their buildings. Staff will also work to streamline the permitting of heat pump retrofits to facilitate and support owners that choose to install these.
Support early owner action The switch to renewable energy needs to be as easy as possible. We will continue to partner with the provincial government to provide and expand financial incentives for retrofits of windows, adding insulation, air-tightness, and installing heat recovery ventilation and heat pumps. Staff will also develop decision-support tools that help owners and managers understand the carbon limits for their buildings, and help them select the appropriate upgrades to meet those limits in line with other planned building investments and renovations. Critical to the success of retrofitting multi-family buildings will be the assessment, planning and implementation of support programs that minimize risk and overcome the lack of capacity and expertise among owners and managers of rental buildings, non-market housing and condominiums. Finally, we will work with the provincial government, utilities, and financial institutions to develop innovative financing tools for energy and emissions retrofits. These mechanisms will be designed to enable third-party investors to pay for the retrofits of buildings they do not own and spread payments for those investments over a long period of time.
Build industry capacity Industry support and broader engagement with B.C.’s network of solution-providers, including contractors, energy advisors, architects, engineers and manufacturers/suppliers, is critical to the success of this strategy. The City will work in partnership with industry associations and utilities to ensure that there is clarity on future regulations among building owners, contractors, trades and equipment suppliers working in all building sectors. From large offices to small homes, we need well-trained contractors and engineers who can design, install and maintain zero emissions heating technologies, and undertake high-quality and cost-effective retrofits. This requires us to partner with local trades organizations and regional partners to develop both low-carbon transition training for existing contractors, as well as attract new trades to these sustainable career options. The City will work with industry, the provincial government and utilities to increase the capacity and quality of heat pump installations in detached homes through qualified trades incentives, followed eventually by requirements. This will be done by building on existing training programs where possible.
Climate Emergency Action Plan – RTS 13199 44
Further, the City will work with partners including Metro Vancouver and the Federation of Canadian Municipalities to launch a regional Low Carbon Cities Canada Centre of Excellence to continue and expand the work already underway by ZEBx in facilitating industry dialogues, tours and workshops on effective approaches to energy retrofits, so as to enable industry leaders to share their insights with their peers.
Facilitate access to renewable energy Vancouver cannot achieve its building decarbonization goals alone. The switch to renewable energy will only be possible if utilities are motivated and enabled to significantly reduce energy demands and are capable of supplying renewable energy in a cost-effective and timely manner. The City will work with BC Hydro and the provincial government to move to electricity rates that support electrification, reduce the barriers residents and businesses encounter when trying to upgrade their electricity service connections, and transition to 100% renewable electricity grid. Similarly, we will work with the provincial government and FortisBC to grow the supply of renewable natural gas and enable higher blends of renewable gas as an additional means of meeting carbon pollution limits. Finally, we will support private district energy utilities in their efforts to convert to renewable energy and will develop a roadmap to transition the City-owned Neighbourhood Energy Utility to 100% renewable energy by 2030. To complement the above package of actions, the City is partnering with key government, utility, NGO and industry stakeholders across the B.C. to develop a Building Electrification Road Map. Meeting our climate objectives will require a significant and rapid shift toward the use of electric heat pumps, and the road map will establish a shared understanding of the challenges of making this shift and will facilitate collaborative action to address them. The City will also look for opportunities to help shape a similar road map for the transition from fossil to renewable gas.
A consistent point of input through the development of the CEAP has been that the work to transition existing buildings off of fossil fuels will only be successful if it does not result in renovictions. While the four cross-cutting actions apply to all building types, the following points illustrate how they will work together for rental and non-market housing to prevent renovictions and help upgrade the City’s rental buildings:
• Rental and non-market housing will not initially be subject to carbon pollution limits, and limits will not be considered until the City is confident that they will not result in renovictions. These buildings and their residents will benefit from the streamlined permitting process when switching to heat pumps and from the removal of energy upgrade requirements triggered by unrelated, permitted work.
• Enhanced incentives, energy audits, capital planning assistance and implementation support for rental and non-market housing will be provided through the Market Rental Retrofit PLUS Resilience Program and the Zero Emissions Non-Market Housing Retrofit Program.
• To test innovative approaches and technologies and increase local capacity to undertake multi-family retrofits, the City is a partner in two
Climate Emergency Action Plan – RTS 13199 45
deep carbon pollution reduction pilot projects focused on non-market housing. The first, being led by FortisBC, will see a seniors’ subsidized housing building in the West End undergo an envelope and mechanical retrofit to achieve an 80% reduction in carbon pollution. The second project, called the Reframed Initiative, is being led by the Pembina Institute and aims to retrofit up to five non-market housing buildings to achieve zero emissions and increased seismic resilience using a combination of envelope and mechanical measures intended to be a pilot for scalable standardized retrofit packages.
BM4 – THE GAME CHANGER ACTION The action in this section describes the work that would be directed by report Recommendation N. The idea of setting carbon pollution limits for existing buildings draws on the success of Vancouver’s Zero Emissions Building Plan and other leading performance-based approaches for new construction. It also takes inspiration from New York City, which is in the process of implementing a similar approach for existing buildings under its recently adopted Local Law 97. The first limits would be established in 2021 for detached homes and large commercial buildings, with 2025 being the first year that carbon limits would need to be met. These initial limits will be modest so as to only impact the most inefficient and polluting buildings, and the upgrades needed to comply will be relatively low-cost and provide substantial energy savings and comfort improvements. This will focus owners on understanding energy use and emissions in their buildings and foster interest in opportunities to improve and take advantage of incentives for early action. They would also start building awareness of the compliance options, reporting systems and the various support tools that will be made available. To support this work, the City will need to renew investment in staff and internal systems to ensure that buildings meet their energy and emissions requirements. Notional limits for 2030 and 2035 will also be established in 2021 to bring these buildings fairly rapidly to near zero emissions levels. This will be possible in single-detached homes because heating and hot water equipment in these buildings typically lasts less than 15 years, providing owners with relative frequent opportunities to switch to a zero emissions system. Similarly, limits for large offices and retail buildings can be reduced rapidly as these buildings have significant amounts of waste heat and a positive business case to transition to heat recovery systems or other heat pump technologies. Further, these large commercial buildings are professionally managed and maintained, and the owners are frequently quite sophisticated in planning and implementing energy retrofit projects. The carbon pollution limits will provide significant flexibility in how a given building reduces its emissions—enabling improvements aligned with other planned upgrades over time. Even if the plan for capital improvements does not include good opportunities for the required emissions reductions before the annual carbon limit takes effect, owners can make operational enhancements,
Climate Emergency Action Plan – RTS 13199 46
purchase renewable gas or low-carbon district heat to lower their emissions, or alternatively, pay a carbon fee proportional to the amount they exceed the limit until the required improvements can be fully implemented. In other words, they will have the flexibility to make energy upgrades on a schedule that makes the most sense for them. The carbon limit approach also accommodates future innovative building designs, technologies and renewable fuel solutions. For some buildings, like small commercial or purpose-built rental buildings, planning and/or implementing phased retrofits will be particularly challenging due to lack of owner technical expertise, financial constraints, and the need to protect current tenants from displacement. In these cases, prescriptive requirements for specific improvements that reduce carbon pollution, have low barriers to implementation, have a strong business case, and are applicable to most buildings will be developed. These could range from requiring high-efficiency water fixtures to reduce the use of hot water to replacing rooftop ventilation units that provide heating and/or cooling with combined ventilation and heat pump systems.
BM4 – CITY LEADERSHIP As the owner and operator of over 600 buildings, the City has a great opportunity to lead the way in the renewable energy transition. Through the City’s Green Operations Plan, we are mirroring this target for our corporate operations. By 2030, the carbon pollution from City building operations will be cut in half from 2007 levels. To achieve this target, starting immediately, all new heating and hot water systems in City-owned facilities will be zero emissions, and all capital replacement and maintenance systems will be zero emissions, where feasible. To support this action, appropriate staff training will be provided on zero emissions heating and hot water systems. These actions are supported by the Renewable Energy Strategy for City-Owned Buildings (2016–2040), which sets out the City’s commitments to zero emissions retrofits of existing facilities and construction of all new facilities to zero emissions standards (since 2018). Numerous zero emissions retrofit and new construction projects are well on their way—including the recent achievement of Fire Hall 17 as the first certified zero emissions fire hall in Canada.
BM4 – INTENTIONS TO INTEGRATE EQUITY The first step to addressing equity is acknowledging that many inequities currently exist within our existing building stock and that, as policy-makers, personal and workplace biases exist in many forms that can impact policy outcomes. Examples that are relevant for Big Move 4 include:
• Vancouver has among the highest costs of living in North America and one of the highest in the world when factoring in average employment income. The 2016 Census designated 22% of Vancouver’s private
Climate Emergency Action Plan – RTS 13199 47
households as below the Low-Income Measure,13 and 7% of households are characterized as experiencing “very high energy poverty” and 4% in “extreme energy poverty.” 14
• Low-income families are more likely to live in residences that are in poor physical condition, leading to high utility bills, unsafe and unhealthy indoor environments, and high levels of carbon pollution.
• Of Vancouver’s population, 52% identify as Indigenous, Black, Chinese and other people of colour. Vancouver has a history of race inequities centred on land use policies that instigate displacement, eviction, higher exposure to air and noise pollution, and lower investment in infrastructure and community and cultural services.
• Renters account for the majority of Vancouver residents, but they have little control over capital investment decisions, and are vulnerable to displacement by a major renovation. Split incentives can discourage energy efficiency upgrades, resulting in overly high energy bills.
The intent of this strategy is to reduce carbon pollution from existing buildings in a way that acknowledges the types of inequities mentioned above and accounts for them in the design of the overall strategy and individual actions. This will be achieved with four equity-focused tenets:
1) Everyone does their fair share. We will set higher expectations in the carbon limit regulation for those with higher resources and opportunities, and lower expectations, along with additional support, for those lacking resources or facing exceptional barriers. This is why the initial carbon limits are being focused on detached homes and large commercial buildings.
2) Prevent displacement and mitigate negative outcomes. Where meeting carbon limits is not viable or where the full suite of required capital investments makes more sense to complete in the future, owners will be allowed to pay a carbon fee proportional to the amount they exceed the limit. Further, we are not initially setting carbon limits for rental buildings and non-market housing, and we will instead focus on providing the incentives and tools the owners and managers need to improve their buildings. 3) Prioritize support for highest needs. We will prioritize financial support and capacity-building to those who most need it. This includes assessment, planning, decision- and implementation-support programs, including additional incentives for the non-market and rental housing sectors. 4) Meaningful engagement and capacity-building. Community and stakeholder outreach to racialized business owners, tradespeople and
13 The Low-income measure, after tax (LIM-AT), refers to a fixed percentage (50%) of median adjusted after-tax income of private households. 14 Energy poverty is typically characterized as spending 10% or more of household income on home energy (metric: annual energy costs/annual income). Canadian Urban Sustainability Practitioners (CUSP) Energy Poverty Explorer Tool, 2020.
Climate Emergency Action Plan – RTS 13199 48
residents has not been adequate in the past and is needed going forward to ensure City objectives are met in an equitable way. In developing the carbon limits, supporting incentives and tools, and in training programs, as well as when delivering services, staff will engage residents, business owners, contractors and other stakeholders in languages and formats that are accessible and respective of Vancouver’s diversity.
Appendix J contains further information on the individual equity measures planned to support the transition off of fossil fuels in existing buildings.
BIG MOVE 5: LOW-CARBON CONSTRUCTION MATERIALS
BM5 – WHAT IS THE TARGET? By 2030, the carbon pollution from building materials and construction practices in new buildings will be reduced by 40% compared to a 2018 baseline.
The carbon pollution targeted here is from extracting, manufacturing, assembling, replacing and disposing of building materials, such as concrete, metals, insulation and others. These are scope 3 emissions, also referred to as “embodied carbon.” Action in this area is about taking responsibility for the carbon pollution resulting from our construction techniques and material choices, even if those emissions mostly occur outside Vancouver. Examples of the ways that this target will be met include: using materials more efficiently, reusing existing buildings and materials, building more from sustainably sourced wood and mass timber, using lower-carbon blends of concrete, powering construction sites with renewable energy instead of diesel fuel, using low-carbon insulation instead of spray foam, and putting less parking (and the associated concrete) in buildings. The Embodied Carbon Strategy in Appendix K sets out a vision for a healthy, equitable, circular and carbon-positive construction economy. By making use of current best practices, including materials that sequester carbon, sustainable and equitable sourcing, and building and material re-use, we can create a thriving construction economy in Vancouver that improves life for people and the planet.
BM5 – THE ROLE AND OPPORTUNITY FOR RESIDENTS/BUSINESSES For most residents and businesses, the transition to low-carbon construction materials and practices will be mostly invisible. New homes and offices will continue to look and function much as they do today (e.g., lower-carbon concrete does not look or feel any different from standard concrete). In some cases, low-carbon design choices will be more visible (e.g., exposed mass timber used as a building design feature), but these are intended to enhance the appeal and livability of a new building. For architects, developers, builders, tradespeople, and their supply chains, the transition to low-carbon construction materials will gradually come to change many of their day-to-day activities. They will need to understand the embodied carbon of different design options, and construction workers will need to become familiar with working with those materials in addition to transitioning off of fossil fuels for their own work sites. The City’s actions to reduce carbon pollution from
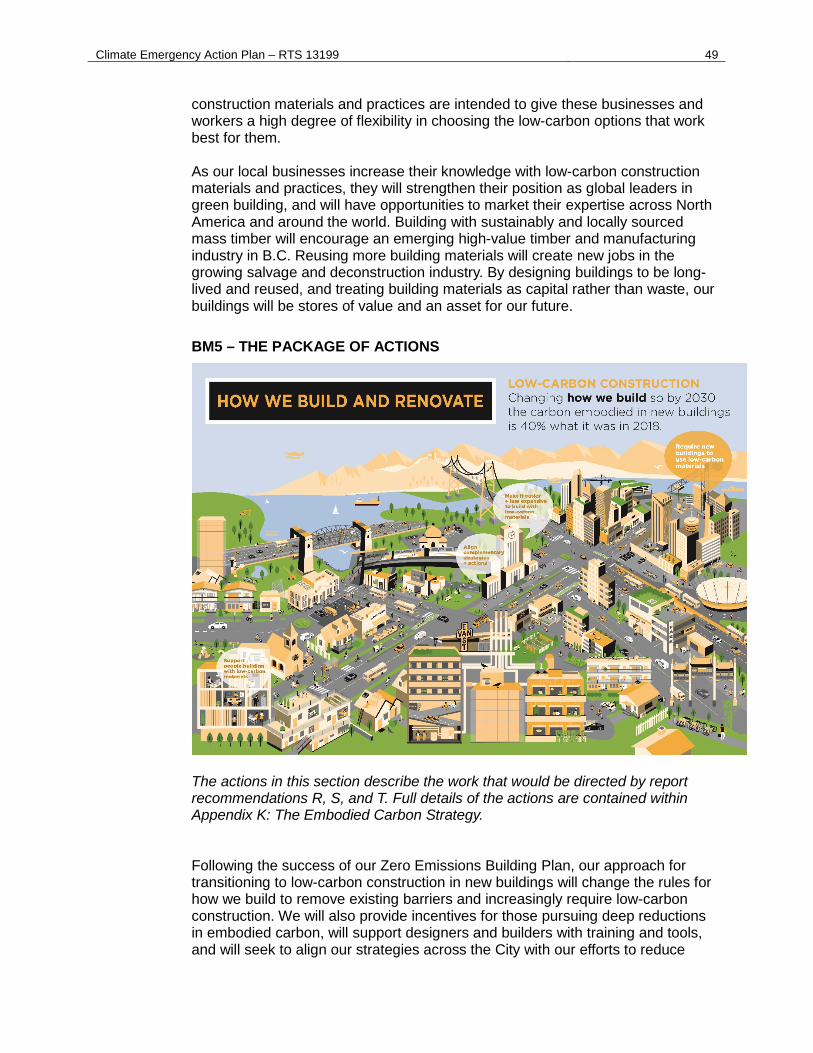
Climate Emergency Action Plan – RTS 13199 49
construction materials and practices are intended to give these businesses and workers a high degree of flexibility in choosing the low-carbon options that work best for them. As our local businesses increase their knowledge with low-carbon construction materials and practices, they will strengthen their position as global leaders in green building, and will have opportunities to market their expertise across North America and around the world. Building with sustainably and locally sourced mass timber will encourage an emerging high-value timber and manufacturing industry in B.C. Reusing more building materials will create new jobs in the growing salvage and deconstruction industry. By designing buildings to be long-lived and reused, and treating building materials as capital rather than waste, our buildings will be stores of value and an asset for our future.
BM5 – THE PACKAGE OF ACTIONS
The actions in this section describe the work that would be directed by report recommendations R, S, and T. Full details of the actions are contained within Appendix K: The Embodied Carbon Strategy. Following the success of our Zero Emissions Building Plan, our approach for transitioning to low-carbon construction in new buildings will change the rules for how we build to remove existing barriers and increasingly require low-carbon construction. We will also provide incentives for those pursuing deep reductions in embodied carbon, will support designers and builders with training and tools, and will seek to align our strategies across the City with our efforts to reduce
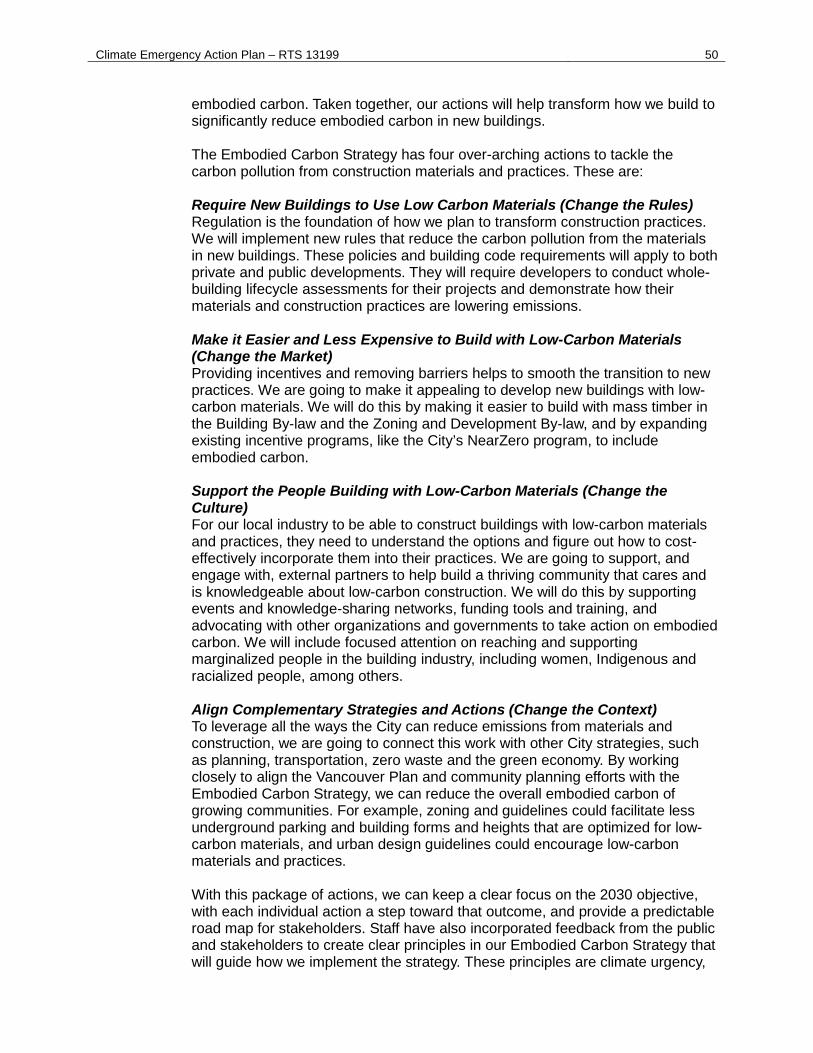
Climate Emergency Action Plan – RTS 13199 50
embodied carbon. Taken together, our actions will help transform how we build to significantly reduce embodied carbon in new buildings. The Embodied Carbon Strategy has four over-arching actions to tackle the carbon pollution from construction materials and practices. These are:
Require New Buildings to Use Low Carbon Materials (Change the Rules) Regulation is the foundation of how we plan to transform construction practices. We will implement new rules that reduce the carbon pollution from the materials in new buildings. These policies and building code requirements will apply to both private and public developments. They will require developers to conduct whole-building lifecycle assessments for their projects and demonstrate how their materials and construction practices are lowering emissions.
Make it Easier and Less Expensive to Build with Low-Carbon Materials (Change the Market) Providing incentives and removing barriers helps to smooth the transition to new practices. We are going to make it appealing to develop new buildings with low-carbon materials. We will do this by making it easier to build with mass timber in the Building By-law and the Zoning and Development By-law, and by expanding existing incentive programs, like the City’s NearZero program, to include embodied carbon.
Support the People Building with Low-Carbon Materials (Change the Culture) For our local industry to be able to construct buildings with low-carbon materials and practices, they need to understand the options and figure out how to cost-effectively incorporate them into their practices. We are going to support, and engage with, external partners to help build a thriving community that cares and is knowledgeable about low-carbon construction. We will do this by supporting events and knowledge-sharing networks, funding tools and training, and advocating with other organizations and governments to take action on embodied carbon. We will include focused attention on reaching and supporting marginalized people in the building industry, including women, Indigenous and racialized people, among others. Align Complementary Strategies and Actions (Change the Context) To leverage all the ways the City can reduce emissions from materials and construction, we are going to connect this work with other City strategies, such as planning, transportation, zero waste and the green economy. By working closely to align the Vancouver Plan and community planning efforts with the Embodied Carbon Strategy, we can reduce the overall embodied carbon of growing communities. For example, zoning and guidelines could facilitate less underground parking and building forms and heights that are optimized for low-carbon materials, and urban design guidelines could encourage low-carbon materials and practices.
With this package of actions, we can keep a clear focus on the 2030 objective, with each individual action a step toward that outcome, and provide a predictable road map for stakeholders. Staff have also incorporated feedback from the public and stakeholders to create clear principles in our Embodied Carbon Strategy that will guide how we implement the strategy. These principles are climate urgency,
Climate Emergency Action Plan – RTS 13199 51
neutrality of materials, healthy materials and buildings, circularity, equity and responsibility, affordability, and shared knowledge and vision. Further information on this package of actions and the principles is in Appendix K.
BM5 – THE GAME CHANGER ACTION The action in this section describes the work that would be directed by report Recommendation R. At the centre of this package of actions, are the regulatory requirements for low-carbon construction materials. These are the backstop that ensures we achieve the desired environmental outcomes and once they are in place, they drive early uptake of the supporting actions as industry looks for opportunities to innovate and be prepared for future requirements. The regulations provide a step-by-step road map that shows developers how expectations will change over time and what level of performance they need to be aiming for from today to ten years from now.
Since 2017, the City has required rezoning applications to include the estimated carbon pollution associated with their materials and construction practices. These reporting requirements were the first step on the road map. They initiated capacity-building with designers and modellers, and they have helped the City understand how to standardize the process so that the estimates from various developers are consistent.
The next step will be requiring that rezoning applications demonstrate a reduction of at least 10% relative to a 2018 baseline. This update to the Green Buildings Policy for Rezonings will come to Council for consideration in early 2021 and would establish one of the first limits on embodied carbon globally. In addition to performance-based requirements, the early steps in the road map will develop material-specific requirements on high-carbon foam insulation and concrete, and an embodied carbon requirement for large homes. The reduction requirements will mostly be performance based, which means the City will specify the required carbon intensity reduction and let developers and designers figure out how they want to achieve it. As developers and designers choose the solutions that best work for their projects, the City rapidly learns about the strengths and weaknesses of a range of solutions. After the early steps, the embodied carbon requirements in the rezoning policy will increase in stringency in 2025, and again in 2030, so that all rezoned buildings will be reducing their carbon pollution from construction materials and practices by 20 to 40%. Around 2025, requirements will also be added to the Vancouver Building By-law for all construction types, and those will be updated in 2030 to ensure the construction of all new buildings is at least 40% less carbon intensive than a similar project in 2018.
BM5 – CITY LEADERSHIP As with target 1, we have an opportunity to demonstrate leadership to the community by reducing carbon pollution from construction of civic facilities and
Climate Emergency Action Plan – RTS 13199 52
infrastructure. Through the City’s Green Operations Plan, we are setting the following target.
By 2030, the carbon pollution from building materials and construction practices in new civic buildings will be reduced by 50% compared to a 2018 baseline.
This more ambitious version of the climate emergency target will be achieved by undertaking embodied carbon assessments for construction of all new City-owned buildings beginning immediately, with a target of achieving at least 40% reduction in embodied carbon compared to a 2018 baseline, and exploring options to achieve reductions of 50% or more by 2030. Staff will document and share learnings from these with industry. In addition, staff will explore carbon pollution reductions in infrastructure projects. One good example of this is the Arbutus Greenway project, which achieved an approximately 20% reduction in carbon pollution from construction through an embodied carbon study approach. A similar approach is being considered for the Northeast False Creek civil works.
BM5 – INTENTIONS TO INTEGRATE EQUITY Our work to reduce embodied carbon will advance equity in two key areas: advancing sustainable, equitable and healthy sourcing of building materials, products and services; and prioritizing equity in the distribution of City resources used for incentives and capacity-building efforts. There are also opportunities to reduce construction costs as designers and builders learn to use materials more efficiently and supply chains are transformed, making it easier to build new low-carbon affordable housing. As we implement the strategy and create policy and by-law requirements, staff will include options that encourage best practices in sustainable, equitable, and healthy sourcing of building materials and products. This will include: wood products from certified sustainable forestry and Indigenous-managed territory; Just, B Corp, and other labels and certifications for equitable sourcing for organizations; sourcing from workers and owners from marginalized groups, including recognition of community benefit agreements (CBAs); Declare, Red List Free, Living Product, environmental product declarations (EPDs), products created using traditional ecological knowledge, and other labels, certifications, and techniques for healthy products and their ingredients; design for durability and longevity, adaptive re-use, material efficiency, and deconstruction; use of recycled, salvaged, and local materials; and purchase of carbon offsets.
As we create and expand incentives for low-carbon construction, staff will include ways to direct benefits from these actions toward marginalized groups, and structure them in ways that enhance equity in the construction industry and in the city. This could be through measures like adding equity requirements, conducting broad and inclusive outreach and education, and tailoring actions toward rental or non-profit housing projects.
As we aim to provide financial and other support to local capacity-building organizations that deliver education and raise awareness on embodied carbon, and to those seeking training, staff will explore ways to direct the benefits of this

Climate Emergency Action Plan – RTS 13199 53
support and training toward marginalized groups and those who may not have ready access to educational opportunities in the building industry. Our proposed actions also include removing barriers in zoning and building codes, which will make it less expensive to build new low-carbon and affordable housing. Some solutions to initial embodied carbon policy and requirements will reduce housing costs and contribute to affordability, such as those that reduce the overall amounts of material needed in new buildings (e.g., reduced parking), and those that reduce the amount of cement used in concrete (as cement is the most expensive part of concrete).
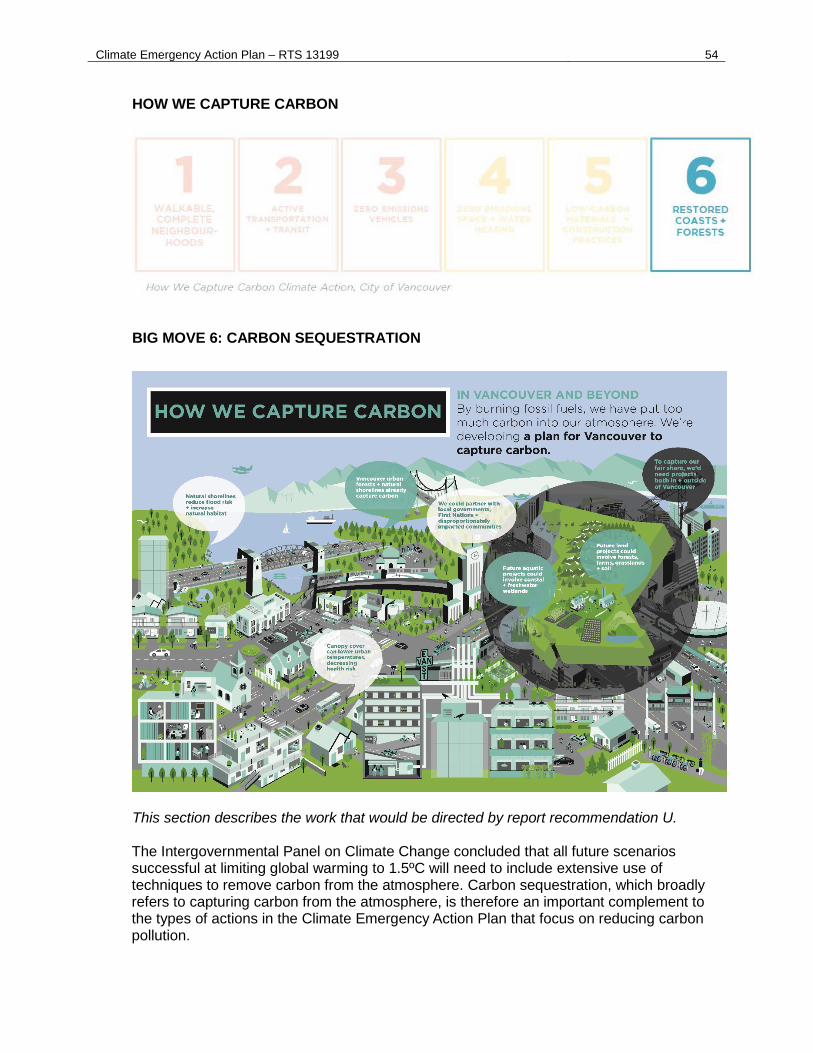
Climate Emergency Action Plan – RTS 13199 54
HOW WE CAPTURE CARBON
BIG MOVE 6: CARBON SEQUESTRATION
This section describes the work that would be directed by report recommendation U. The Intergovernmental Panel on Climate Change concluded that all future scenarios successful at limiting global warming to 1.5ºC will need to include extensive use of techniques to remove carbon from the atmosphere. Carbon sequestration, which broadly refers to capturing carbon from the atmosphere, is therefore an important complement to the types of actions in the Climate Emergency Action Plan that focus on reducing carbon pollution.
Climate Emergency Action Plan – RTS 13199 55
Natural Carbon Sequestration (NCS) refers to natural biological processes and systems that sequester carbon from the atmosphere into living systems. NCS was the focus of Big Move 6 in the Climate Emergency Response report in 2019. There are two main pathways by which NCS can occur: land-based sequestration and ocean/aquatic sequestration. Land-based sequestration activities include reforestation, improved forest management or forest protection, improved farming practices, composting and soil enhancement techniques. Ocean/aquatic sequestration actions include coastal and freshwater wetland restoration, management or protection, among others. New natural sequestration projects take time to reach full sequestration potential, as ecosystems are slow to develop. The City has many existing efforts that sequester carbon as a co-benefit to the main project driver. For example, the Greenest City Action Plan targets planting 150,000 trees between 2010 and 2020, which the City is on track to achieve. This tree-planting effort has multiple co-benefits, including carbon sequestration, improving well-being and keeping energy costs down for cooling as summers heat up with climate change. Likewise, restoration of natural shorelines, such as the New Brighton Park Shoreline Habitat Restoration Project, can reduce flood risk, sequester carbon and increase habitat toward biodiversity goals. These projects are great local examples of NCS but are not at the scale required to meet Vancouver’s anticipated sequestration targets. As a result, larger projects outside the city’s boundaries will be sought to complement local efforts. In the fall of 2020, staff will work with a consultant to convene an advisory committee of experts to provide guidance on the initiation of a Vancouver NCS program. Initial research into potential pathways for the City’s sequestration efforts identified five distinct categories, each with a range of potential activities: forests, freshwater wetlands, agriculture and grasslands, coastal wetlands, and cross-sectoral approaches. The consultant and advisory committee will explore specific project options within each pathway to determine the viability of achieving the proposed target of sequestering a million tonnes of carbon annually by 2060. An update on this research and guidance on existing sequestration projects, financial and regulatory options, potential sequestration project partners, and potential pilot projects within the city and province will be presented in 2021 aligned with a climate emergency update. A recommended or confirmed target for the City’s NCS program will be included at this time. Financing to initiate pilot projects in line with the target will be included in the process to develop the next capital plan.
TRACKING OUR PROGRESS The actions in this section describe the work that would be directed by report Recommendation Z.
DESCRIPTION Along with the carbon pollution modelling and the investment strategy and financial framework, CEAP indicators form a carbon budgeting and accountability framework to track progress transparently and accurately. The framework explains:
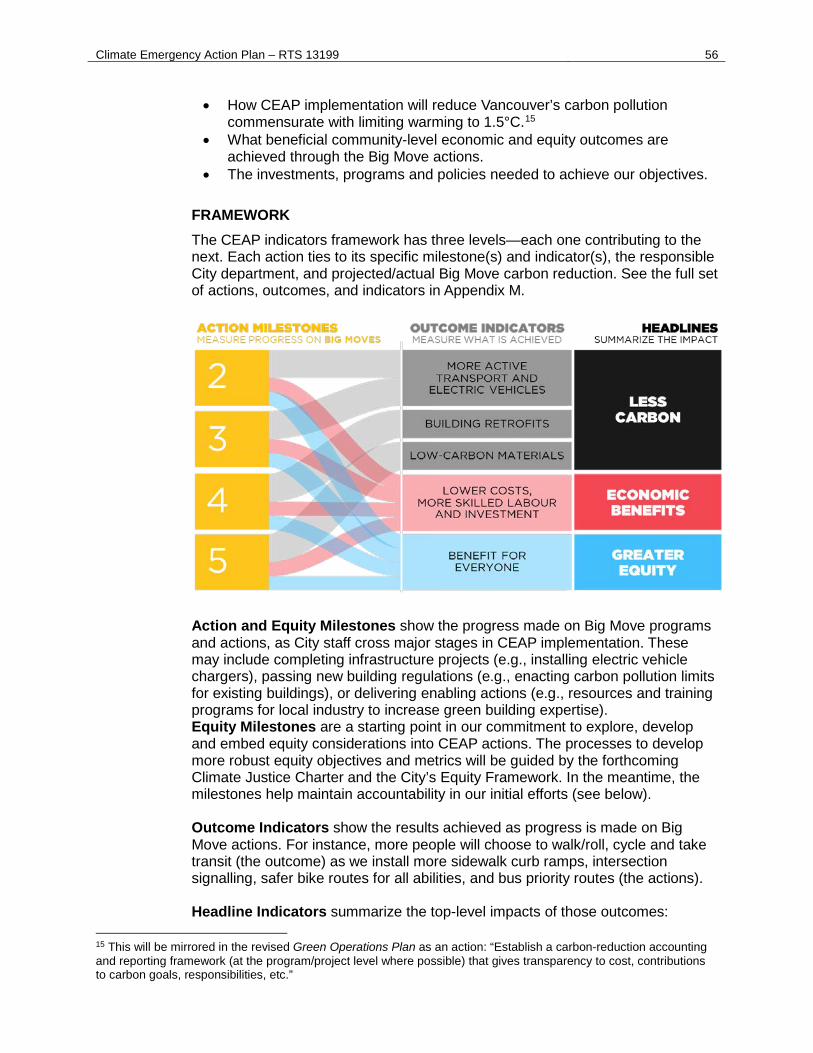
Climate Emergency Action Plan – RTS 13199 56
• How CEAP implementation will reduce Vancouver’s carbon pollution commensurate with limiting warming to 1.5°C.15
• What beneficial community-level economic and equity outcomes are achieved through the Big Move actions.
• The investments, programs and policies needed to achieve our objectives.
FRAMEWORK The CEAP indicators framework has three levels—each one contributing to the next. Each action ties to its specific milestone(s) and indicator(s), the responsible City department, and projected/actual Big Move carbon reduction. See the full set of actions, outcomes, and indicators in Appendix M.
Action and Equity Milestones show the progress made on Big Move programs and actions, as City staff cross major stages in CEAP implementation. These may include completing infrastructure projects (e.g., installing electric vehicle chargers), passing new building regulations (e.g., enacting carbon pollution limits for existing buildings), or delivering enabling actions (e.g., resources and training programs for local industry to increase green building expertise). Equity Milestones are a starting point in our commitment to explore, develop and embed equity considerations into CEAP actions. The processes to develop more robust equity objectives and metrics will be guided by the forthcoming Climate Justice Charter and the City’s Equity Framework. In the meantime, the milestones help maintain accountability in our initial efforts (see below). Outcome Indicators show the results achieved as progress is made on Big Move actions. For instance, more people will choose to walk/roll, cycle and take transit (the outcome) as we install more sidewalk curb ramps, intersection signalling, safer bike routes for all abilities, and bus priority routes (the actions).
Headline Indicators summarize the top-level impacts of those outcomes:
15 This will be mirrored in the revised Green Operations Plan as an action: “Establish a carbon-reduction accounting and reporting framework (at the program/project level where possible) that gives transparency to cost, contributions to carbon goals, responsibilities, etc.”
Climate Emergency Action Plan – RTS 13199 57
• Carbon: Total carbon pollution in Vancouver, divided into buildings, transportation, and landfilled/incinerated waste.16 These comprise Vancouver’s scope 1 and 2 emissions (previously mentioned in the Where Vancouver’s Carbon Pollution Comes From and How We Reduce It section) as defined in the Global Protocol for Community-Scale Greenhouse Gas Emission Inventories (GPC). These will be tracked against the modelled carbon pollution scenarios as detailed in the Strategic Environmental Analysis section.
• Embodied Carbon: Embodied carbon intensity of new construction. This is a subset of Vancouver’s scope 3 emissions per the GPC, corresponding to the outcomes from Big Move 5.
• Economy: Annual growth rate of green jobs, as compared to the growth rate of all jobs. This will monitor Vancouver’s green economic innovation and growth as CEAP implementation progresses.
• Equity: At present, staff are not sure if it is useful or appropriate to develop headline indicators for equity. This will be explored through the process of developing the Climate Justice Charter.
EQUITY IN THE INDICATORS FRAMEWORK
The CEAP has a mandate to ensure that equity has a central place in the City’s climate work. In practice, equity within the CEAP is both a process and an outcome. We commit to using an equity lens during design and implementation of CEAP actions. City staff will use equity as a planning tool to answer the questions “who benefits?” and “who might stand to lose?” as a result of CEAP actions. This will involve developing data, measures and analyses relevant to their action.
Data-analysis examples: • gender • age • Indigeneity • race • language • immigration
• physical ability • education • income/wealth • families/dependents • geography • home rentership/ownership
These equity analyses will be informed by the City’s Equity Framework, which includes resources such as the Equity Reference Guide and the Equity Decision-Making Tool. The forthcoming Climate Justice Charter will also guide these processes. Based on engagement with disproportionally impacted communities and/or data analysis, City staff can then determine strategies, where appropriate, to address those inequities, which could begin with learning from those who might be burdened or negatively affected. An example is the Big Move 2 objective to encourage commuting to work by bicycle. Data from 2016 shows visible-minority residents are far less likely to walk or bike to work. This type of measure prompts further inquiry into potential causes (e.g., unequal access to
16 See Complementary City Initiatives: Waste section in this report. Actions to reduce waste and waste-related emissions fall within the purview of the Zero Waste 2040 Strategy.
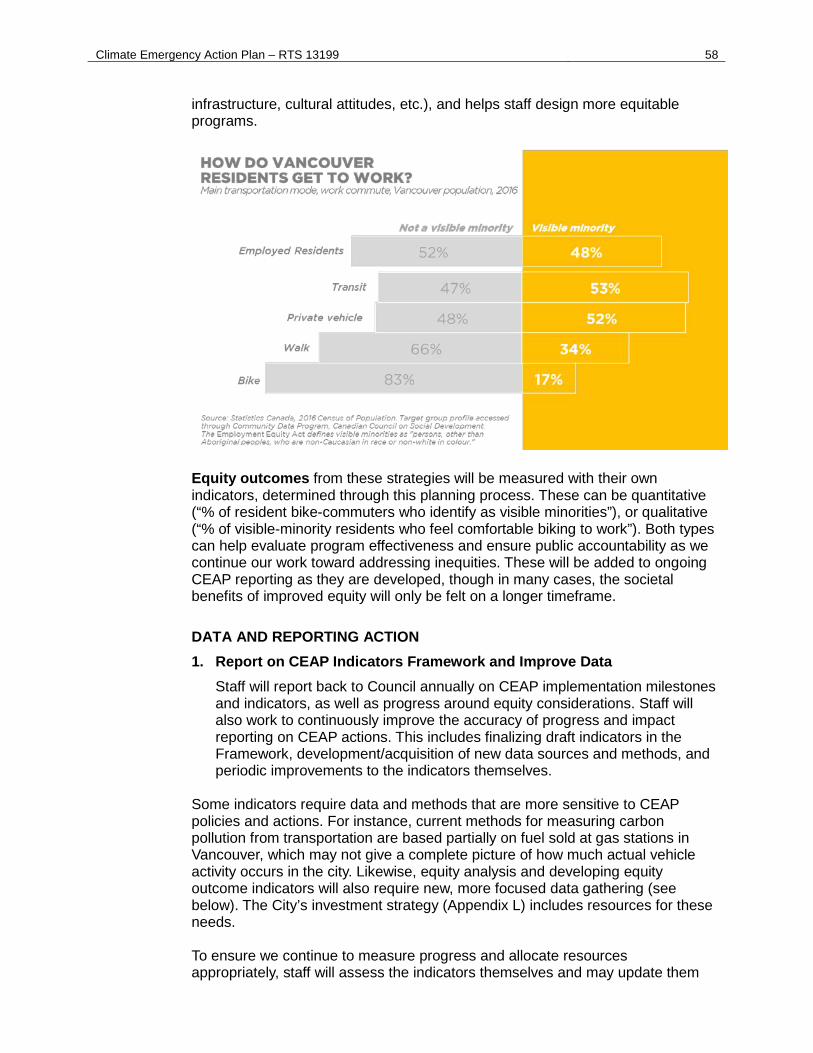
Climate Emergency Action Plan – RTS 13199 58
infrastructure, cultural attitudes, etc.), and helps staff design more equitable programs.
Equity outcomes from these strategies will be measured with their own indicators, determined through this planning process. These can be quantitative (“% of resident bike-commuters who identify as visible minorities”), or qualitative (“% of visible-minority residents who feel comfortable biking to work”). Both types can help evaluate program effectiveness and ensure public accountability as we continue our work toward addressing inequities. These will be added to ongoing CEAP reporting as they are developed, though in many cases, the societal benefits of improved equity will only be felt on a longer timeframe.
DATA AND REPORTING ACTION 1. Report on CEAP Indicators Framework and Improve Data
Staff will report back to Council annually on CEAP implementation milestones and indicators, as well as progress around equity considerations. Staff will also work to continuously improve the accuracy of progress and impact reporting on CEAP actions. This includes finalizing draft indicators in the Framework, development/acquisition of new data sources and methods, and periodic improvements to the indicators themselves.
Some indicators require data and methods that are more sensitive to CEAP policies and actions. For instance, current methods for measuring carbon pollution from transportation are based partially on fuel sold at gas stations in Vancouver, which may not give a complete picture of how much actual vehicle activity occurs in the city. Likewise, equity analysis and developing equity outcome indicators will also require new, more focused data gathering (see below). The City’s investment strategy (Appendix L) includes resources for these needs. To ensure we continue to measure progress and allocate resources appropriately, staff will assess the indicators themselves and may update them
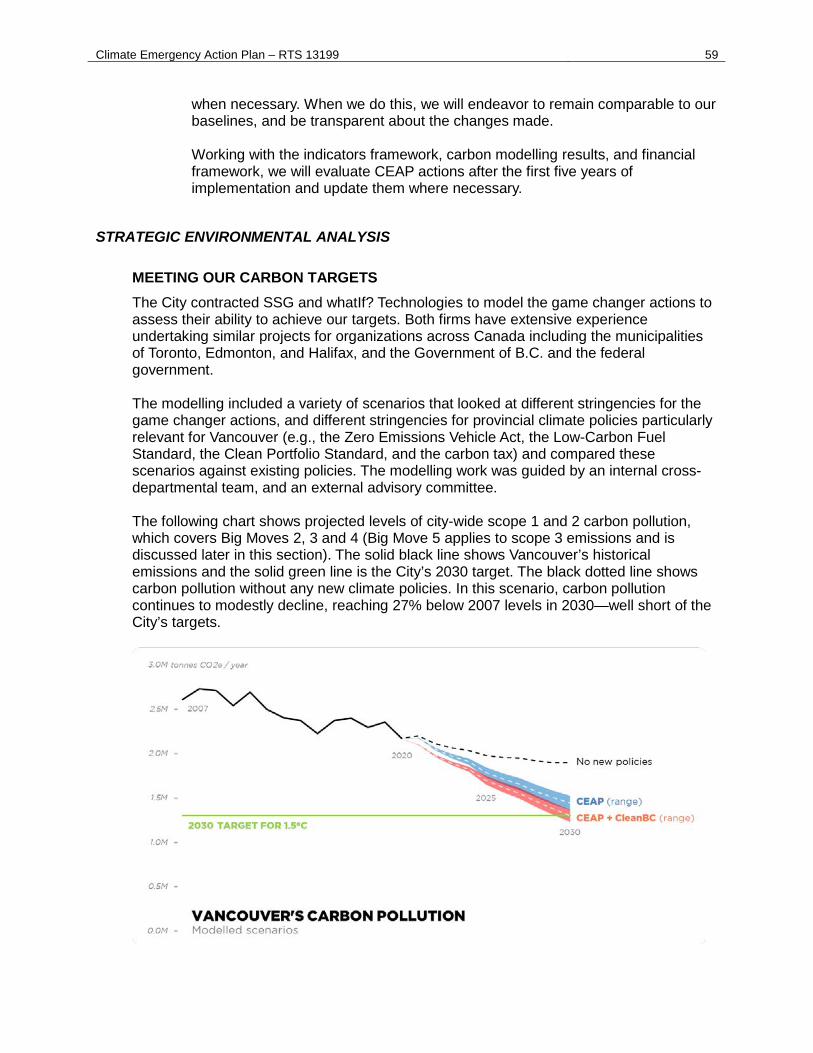
Climate Emergency Action Plan – RTS 13199 59
when necessary. When we do this, we will endeavor to remain comparable to our baselines, and be transparent about the changes made. Working with the indicators framework, carbon modelling results, and financial framework, we will evaluate CEAP actions after the first five years of implementation and update them where necessary.
STRATEGIC ENVIRONMENTAL ANALYSIS
MEETING OUR CARBON TARGETS The City contracted SSG and whatIf? Technologies to model the game changer actions to assess their ability to achieve our targets. Both firms have extensive experience undertaking similar projects for organizations across Canada including the municipalities of Toronto, Edmonton, and Halifax, and the Government of B.C. and the federal government. The modelling included a variety of scenarios that looked at different stringencies for the game changer actions, and different stringencies for provincial climate policies particularly relevant for Vancouver (e.g., the Zero Emissions Vehicle Act, the Low-Carbon Fuel Standard, the Clean Portfolio Standard, and the carbon tax) and compared these scenarios against existing policies. The modelling work was guided by an internal cross-departmental team, and an external advisory committee. The following chart shows projected levels of city-wide scope 1 and 2 carbon pollution, which covers Big Moves 2, 3 and 4 (Big Move 5 applies to scope 3 emissions and is discussed later in this section). The solid black line shows Vancouver’s historical emissions and the solid green line is the City’s 2030 target. The black dotted line shows carbon pollution without any new climate policies. In this scenario, carbon pollution continues to modestly decline, reaching 27% below 2007 levels in 2030—well short of the City’s targets.
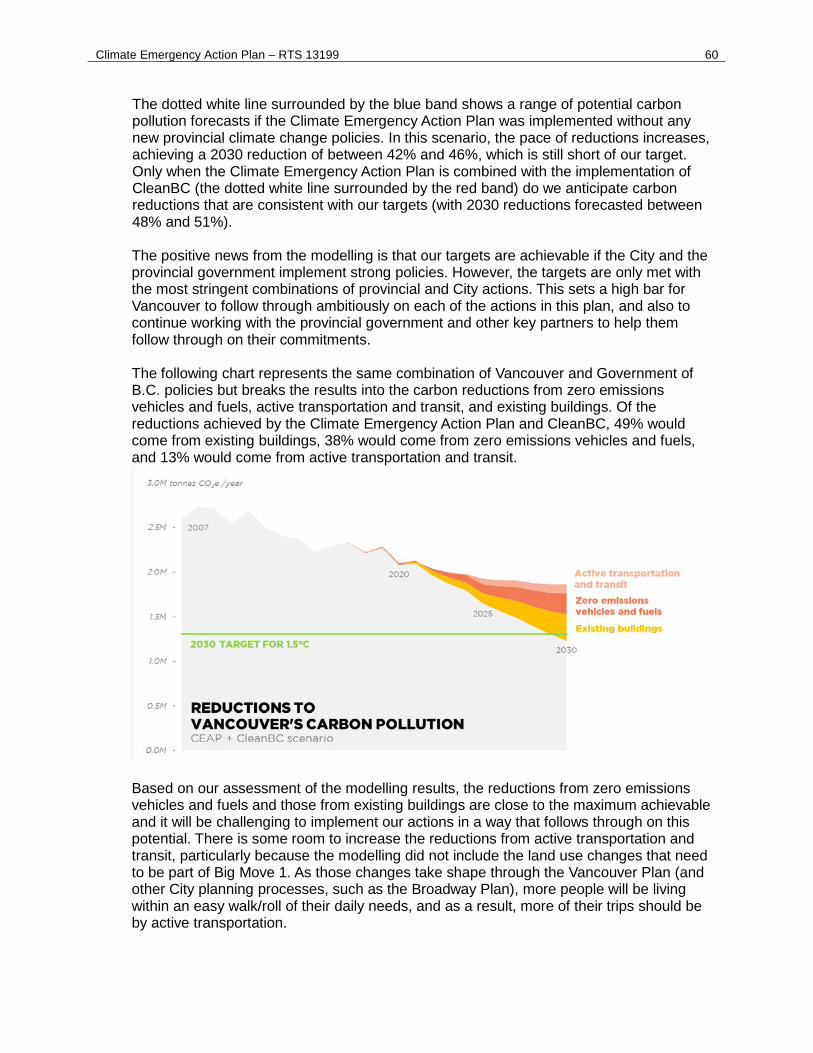
Climate Emergency Action Plan – RTS 13199 60
The dotted white line surrounded by the blue band shows a range of potential carbon pollution forecasts if the Climate Emergency Action Plan was implemented without any new provincial climate change policies. In this scenario, the pace of reductions increases, achieving a 2030 reduction of between 42% and 46%, which is still short of our target. Only when the Climate Emergency Action Plan is combined with the implementation of CleanBC (the dotted white line surrounded by the red band) do we anticipate carbon reductions that are consistent with our targets (with 2030 reductions forecasted between 48% and 51%). The positive news from the modelling is that our targets are achievable if the City and the provincial government implement strong policies. However, the targets are only met with the most stringent combinations of provincial and City actions. This sets a high bar for Vancouver to follow through ambitiously on each of the actions in this plan, and also to continue working with the provincial government and other key partners to help them follow through on their commitments. The following chart represents the same combination of Vancouver and Government of B.C. policies but breaks the results into the carbon reductions from zero emissions vehicles and fuels, active transportation and transit, and existing buildings. Of the reductions achieved by the Climate Emergency Action Plan and CleanBC, 49% would come from existing buildings, 38% would come from zero emissions vehicles and fuels, and 13% would come from active transportation and transit.
Based on our assessment of the modelling results, the reductions from zero emissions vehicles and fuels and those from existing buildings are close to the maximum achievable and it will be challenging to implement our actions in a way that follows through on this potential. There is some room to increase the reductions from active transportation and transit, particularly because the modelling did not include the land use changes that need to be part of Big Move 1. As those changes take shape through the Vancouver Plan (and other City planning processes, such as the Broadway Plan), more people will be living within an easy walk/roll of their daily needs, and as a result, more of their trips should be by active transportation.
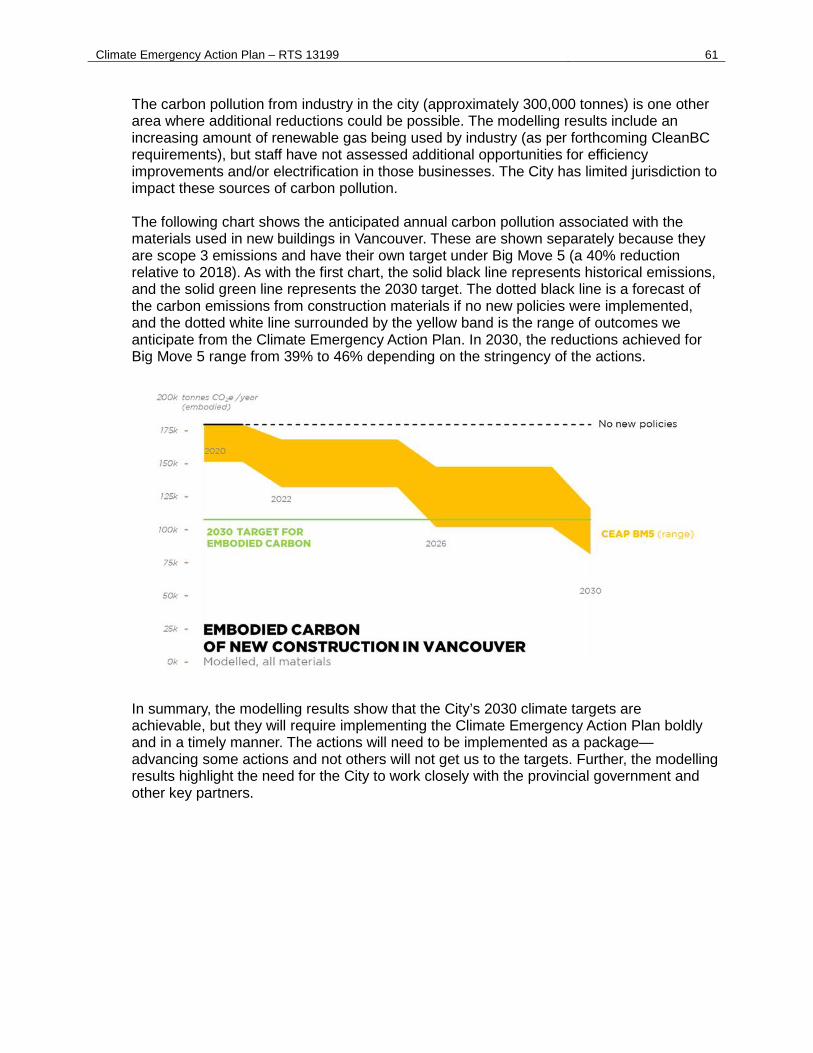
Climate Emergency Action Plan – RTS 13199 61
The carbon pollution from industry in the city (approximately 300,000 tonnes) is one other area where additional reductions could be possible. The modelling results include an increasing amount of renewable gas being used by industry (as per forthcoming CleanBC requirements), but staff have not assessed additional opportunities for efficiency improvements and/or electrification in those businesses. The City has limited jurisdiction to impact these sources of carbon pollution. The following chart shows the anticipated annual carbon pollution associated with the materials used in new buildings in Vancouver. These are shown separately because they are scope 3 emissions and have their own target under Big Move 5 (a 40% reduction relative to 2018). As with the first chart, the solid black line represents historical emissions, and the solid green line represents the 2030 target. The dotted black line is a forecast of the carbon emissions from construction materials if no new policies were implemented, and the dotted white line surrounded by the yellow band is the range of outcomes we anticipate from the Climate Emergency Action Plan. In 2030, the reductions achieved for Big Move 5 range from 39% to 46% depending on the stringency of the actions.
In summary, the modelling results show that the City’s 2030 climate targets are achievable, but they will require implementing the Climate Emergency Action Plan boldly and in a timely manner. The actions will need to be implemented as a package—advancing some actions and not others will not get us to the targets. Further, the modelling results highlight the need for the City to work closely with the provincial government and other key partners.
Climate Emergency Action Plan – RTS 13199 62 FINANCIAL IMPLICATIONS
The actions in this section describe the work that would be directed by report Recommendations V to Y.
INVESTMENT STRATEGY AND FINANCIAL FRAMEWORK Rapidly transitioning to a low-carbon future is a significant undertaking and will require the City to implement the full suite of proposed climate emergency actions. The City has three main tools to effect change — advocacy, regulation, and investment — and the Climate Emergency Action Plan relies on all three to pursue the Council-approved targets. Simply put, the climate emergency targets cannot be achieved with a business-as-usual approach. Recognizing the City’s limited financial capacity, particularly the fiscal reality brought on by the COVID-19 pandemic and the uncertainty in the pace of economic recovery over the next few years, staff’s approach has been to prioritize the City’s regulatory and advocacy tools over direct City investment in cases where they are more appropriate and effective in delivering the intended outcomes. In some cases however, City investment is needed upfront to develop, implement and incentivize adoption of regulations to drive significant city-wide carbon pollution reductions at a relatively low ongoing cost to the City. Big Move 4 is an example of this: Upfront investment in training, incentives and capacity-building will enable a successful regulation for existing building emissions beginning in 2025. Similarly, City investment in electric vehicle charging infrastructure now will support a faster transition to electric vehicles in Vancouver. In developing the investment strategy and financial framework, staff has been working closely with Federation of Canadian Municipalities, Union of BC Municipalities, Vancouver Economic Commission, community partners and stakeholders to advocate for dedicated and sustainable funding from senior governments to advance the Climate Emergency Action Plan. As well, through the 2019-22 Capital Plan recalibration process, Council approved an additional $12 million to augment priority actions for the next two year, and staff has further identified opportunities to leverage senior government funding and other partnerships, wherever possible, to support the program. The Climate Emergency Action Plan positions the City well for green stimulus funding that can be used to advance and accelerate climate actions. The investment strategy and financial framework is intended as a road map, which will need to be monitored, assessed, and recalibrated over time depending on the outcomes of specific actions. In addition to the slower pace of development as a result of the COVID-19 pandemic, the gradual transition from strata to rental development to align with Housing Vancouver targets will continue to dampen the amount of development contributions, a key funding source for the Climate Emergency Action Plan. This could be offset by increasing senior government and partner funding available. Advancing Big Move 1 (building complete, walkable communities) could also reduce infrastructure spending to achieve the target for Big Move 2 (shifting to more walking/rolling, cycling and transit). Approval of the Climate Emergency Action Plan will not immediately trigger any new regulations, policies, or resident/business costs. Approval of the plan will enable staff to develop and fine-tune the policies, actions, and regulations outlined in this report, in
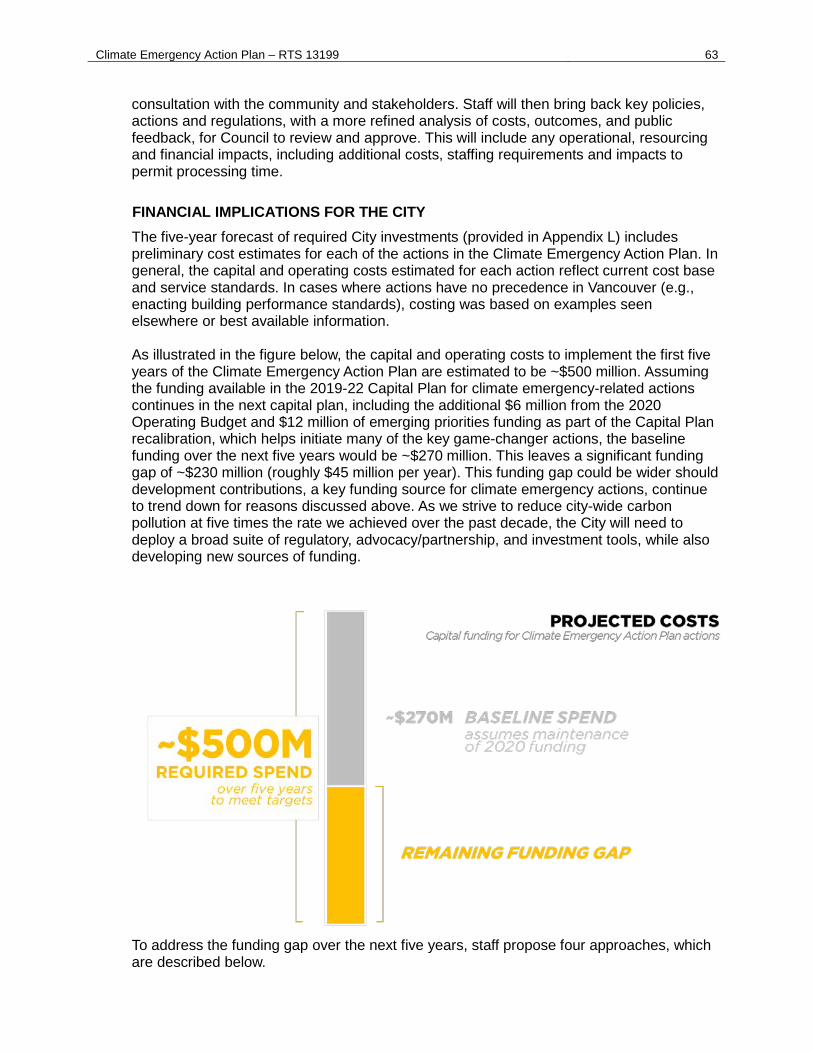
Climate Emergency Action Plan – RTS 13199 63
consultation with the community and stakeholders. Staff will then bring back key policies, actions and regulations, with a more refined analysis of costs, outcomes, and public feedback, for Council to review and approve. This will include any operational, resourcing and financial impacts, including additional costs, staffing requirements and impacts to permit processing time.
FINANCIAL IMPLICATIONS FOR THE CITY The five-year forecast of required City investments (provided in Appendix L) includes preliminary cost estimates for each of the actions in the Climate Emergency Action Plan. In general, the capital and operating costs estimated for each action reflect current cost base and service standards. In cases where actions have no precedence in Vancouver (e.g., enacting building performance standards), costing was based on examples seen elsewhere or best available information. As illustrated in the figure below, the capital and operating costs to implement the first five years of the Climate Emergency Action Plan are estimated to be ~$500 million. Assuming the funding available in the 2019-22 Capital Plan for climate emergency-related actions continues in the next capital plan, including the additional $6 million from the 2020 Operating Budget and $12 million of emerging priorities funding as part of the Capital Plan recalibration, which helps initiate many of the key game-changer actions, the baseline funding over the next five years would be ~$270 million. This leaves a significant funding gap of ~$230 million (roughly $45 million per year). This funding gap could be wider should development contributions, a key funding source for climate emergency actions, continue to trend down for reasons discussed above. As we strive to reduce city-wide carbon pollution at five times the rate we achieved over the past decade, the City will need to deploy a broad suite of regulatory, advocacy/partnership, and investment tools, while also developing new sources of funding.
To address the funding gap over the next five years, staff propose four approaches, which are described below.
Climate Emergency Action Plan – RTS 13199 64
1. Using cost-effective approaches. Given the significant funding gap, it will be critical for the City to deploy more cost-effective approaches to achieve low-carbon outcomes, wherever feasible. The most obvious opportunity is in the area of transportation. Deploying interim approaches for new active transportation routes (e.g., building on and expanding the Safe Streets and Room to Move programs) is a way to leverage the current boom in active transportation using less expensive infrastructure. A similar approach was used during the lead-up to the 2010 Olympics, when interim approaches were used to create new walking and cycling facilities, as well as car-free plazas, through downtown, including on the Georgia Viaduct and along Dunsmuir Street. These interim approaches proved to be generally successful and many were ultimately kept in place after the Olympics. By using interim approaches, there could be an estimated savings of $5–10M/year in capital costs (based on a projected 10–20% savings on active transportation infrastructure projects) while still expanding the City’s walking and cycling network at a pace commensurate with the climate emergency. It should be recognized that some of these savings would only be for the near term (more permanent infrastructure would ultimately be required in some cases). Nevertheless, given the funding challenges, staff are recommending that more cost-effective, interim approaches be used where feasible, as a meaningful way to reduce the funding gap while achieving low-carbon outcomes. 2. Ramping up climate action using new charges and fees. The Climate Emergency Action Plan contains a number of new pricing actions that will generate additional revenue to fund the Climate Emergency Actions going forward. For example, fees from an expanded residential parking permit program could help fund projects to enable more walking/rolling, cycling and transit. The approach of connecting new fees or charges to a specific outcome or priority has proven to be successful, as in the case of the Empty Homes Tax the proceeds of which support affordable housing. This approach will be incorporated as part of the broader Municipal Financial Reform project that is being initiated by Finance. The following actions are expected to generate revenue in the near term (before 2025) to support the Climate Emergency Action Plan: • Residential parking permits with carbon pollution surcharges. As described in
Appendix F, staff are aiming to expand the existing non-metered residential parking permit program to a city-wide program in late 2021. The expanded parking permit program will include a surcharge for new, more-polluting vehicles. This program will ensure more equitable use of street space, discourage private vehicle ownership and incentivize zero emissions vehicles. The program is also expected to generate significant new revenue, on the order of $1–2M/year initially and potentially scaling to upwards of $15M/year after three years. This revenue could meaningfully enable climate emergency actions to scale up over time.
• Eco-charges. There are a number of fees that the City currently charges for licenses, permits and rents that could be shifted to encourage more low-carbon behaviour choices, while also providing new revenue. An example would be an increased business license fee for gas stations (with an option to reduce the fee if EV charging is provided on site). While such fees would likely be modest, the collective impact could help reduce the funding gap for the climate emergency, particularly over the next two to five years. Staff are proposing to undertake public and stakeholder engagement in early 2021 on select fees and will report back to Council as part of the annual report on fees.
Climate Emergency Action Plan – RTS 13199 65
The following actions are expected to generate revenue in the medium term (from 2025 onwards): • Transport pricing. Building on successful transport pricing programs in London and
Oslo, staff are proposing a similar program in Vancouver to discourage driving and encourage active modes of transportation into and out of the Metro Core. This action will require further technical study and public engagement, but it is expected to launch in 2025. The revenue from transport pricing could potentially be significant, on the order of tens of millions of dollars per year or more. From 2025 onward, transport pricing could be the predominant source of funding for climate emergency actions, potentially used to fund other sustainable modes of transportation.
• Building performance standards. Under Big Move 4, regulations will be implemented to reduce the carbon pollution from existing buildings, starting with a first phase of regulations in 2025. The purpose of the regulation is to drive emergency retrofits for the most-polluting buildings owned by those most able to afford upgrades. There will be annual revenue generated from this regulation from the fees charged to building owners who do not meet their carbon limits. This revenue could be another source of funding for the Climate Emergency Action Plan, potentially used to enable more retrofits, for example.
Collectively, these new revenue sources could help scale up climate action over time to achieve the 2030 and 2050 targets. By 2025, the new revenue is estimated to be $15–20M/year. By 2030, the revenue could be higher still, depending on the level of fees charged for transport pricing and building performance regulations.
3. Leveraging funding from senior governments and other partners. While the City’s financial investment is critical to the success of the Climate Emergency Action Plan, other levels of government and partner organizations will need to play a role as well. Staff expect to leverage funding from senior governments and partner organizations for a number of the proposed actions. Within the current capital plan, the City has received roughly $12M in senior-government funding for climate-related projects, including electric vehicle charging infrastructure, a protected bike route along Richards Street, and an expansion of the False Creek Energy Centre. There is a significant opportunity to build on this successful track record going forward, particularly if there is green stimulus funding available from the federal and provincial governments to support COVID-19 recovery. In the Climate Emergency Action Plan, the potential senior funding contribution has been estimated for a number of actions based on past funding formulas (i.e., percentage contributions from senior governments). The estimated leverage from senior governments is $3–5M/year. Staff will be pursuing funding opportunities wherever possible, as a way to close the funding gap. 4. Prioritizing bold climate actions in the next capital plan. Using more cost-effective approaches, generating new revenue and leveraging external funding are all important funding tools, but are likely insufficient to fully close the funding gap. As such, it is important that climate emergency actions be embedded in all future capital investment decisions. This is particularly the case for the City’s own operations (guided by the City’s Green Operations Plan). Replacing combustion-engine vehicles with electric vehicles should be considered standard practice. Similarly, new City buildings should be planned for zero emissions, and also to be built with low-carbon materials and leading end-of-trip facilities. It is critical that the City stimulate industry learning and supply
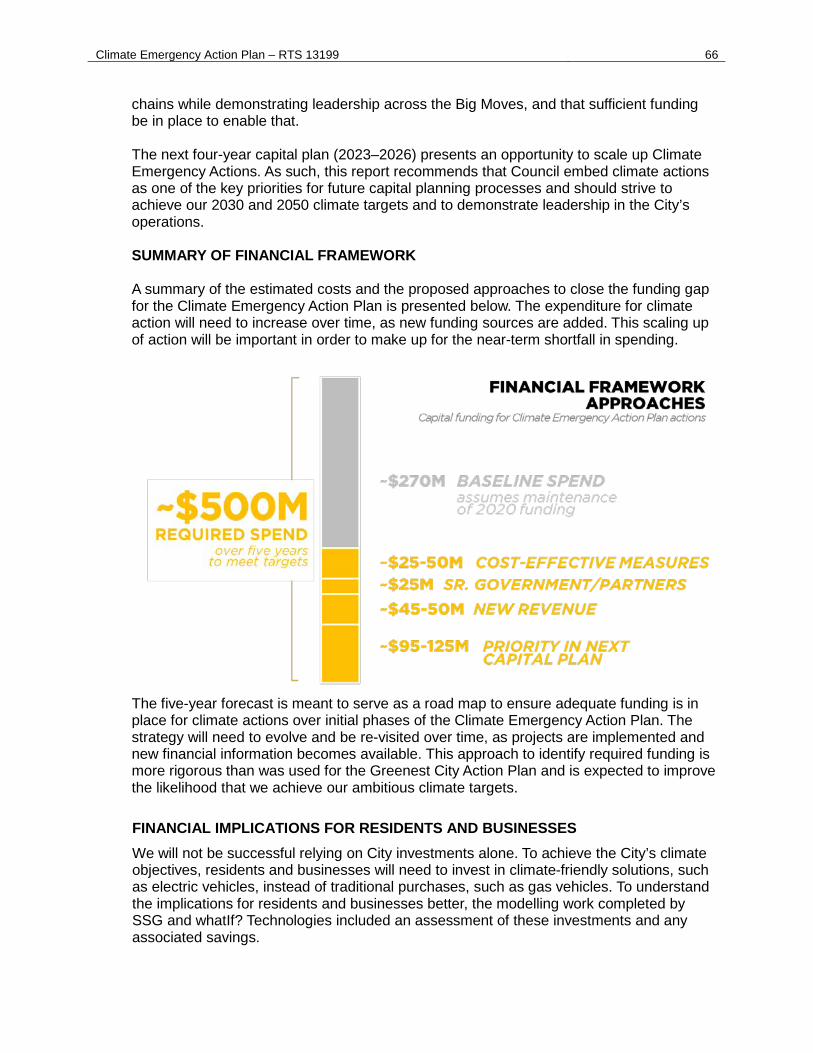
Climate Emergency Action Plan – RTS 13199 66
chains while demonstrating leadership across the Big Moves, and that sufficient funding be in place to enable that. The next four-year capital plan (2023–2026) presents an opportunity to scale up Climate Emergency Actions. As such, this report recommends that Council embed climate actions as one of the key priorities for future capital planning processes and should strive to achieve our 2030 and 2050 climate targets and to demonstrate leadership in the City’s operations. SUMMARY OF FINANCIAL FRAMEWORK A summary of the estimated costs and the proposed approaches to close the funding gap for the Climate Emergency Action Plan is presented below. The expenditure for climate action will need to increase over time, as new funding sources are added. This scaling up of action will be important in order to make up for the near-term shortfall in spending.
The five-year forecast is meant to serve as a road map to ensure adequate funding is in place for climate actions over initial phases of the Climate Emergency Action Plan. The strategy will need to evolve and be re-visited over time, as projects are implemented and new financial information becomes available. This approach to identify required funding is more rigorous than was used for the Greenest City Action Plan and is expected to improve the likelihood that we achieve our ambitious climate targets.
FINANCIAL IMPLICATIONS FOR RESIDENTS AND BUSINESSES We will not be successful relying on City investments alone. To achieve the City’s climate objectives, residents and businesses will need to invest in climate-friendly solutions, such as electric vehicles, instead of traditional purchases, such as gas vehicles. To understand the implications for residents and businesses better, the modelling work completed by SSG and whatIf? Technologies included an assessment of these investments and any associated savings.
Climate Emergency Action Plan – RTS 13199 67
The resident and business investments will happen for a number of reasons, including complying with regulations, being encouraged by incentives, and acting on personal values. While the modelling attempts to account for all these reasons, the carbon pollution, investment, and savings results reported here focus on the changes that occur in response the Climate Emergency Action Plan and CleanBC. If an investment was expected to happen without these new policy initiatives, it is included in the baseline forecasts, and not reported as an incremental carbon reduction, investment, or savings. The resident and business investments that occur between 2021 and 2030 in response to the Climate Emergency Action Plan and CleanBC are estimated at $1.27B. Those investments in turn generate savings estimated at $2.25B over the life of the investments, for a net resident and business savings of $980M. Within the range of investments that occur in response the CEAP and CleanBC, some offer significant financial savings (e.g., active transportation) whereas others are not expected to have a financial payback (e.g., heat pumps). Implementation of the full package of actions is required to put us on track for our climate targets and that package provides a net financial benefit for residents and businesses. The financial results provided above do not include the costs and fees residents and businesses will pay in response to policies, such as residential parking permits, transport pricing, and carbon pollution limits for buildings. The reason for not including them is that additional research, engagement and policy design is required before those prices can be determined and brought back to council for consideration. Further, the vast majority of the revenue from these costs and fees is expected to be reinvested into the Climate Emergency Action Plan, which will reduce the cost of investments made by residents and businesses (e.g., incentives for heat pumps or EV charging). The actions in the CEAP will be implemented between 2021 and 2025, while the resident and business investments and savings will ramp up over time in response to those actions. More refined estimates of the investments and savings associated with individual actions will be developed as policy designs are refined. The additional analysis will also look at how those investments and savings are distributed across different populations to ensure we are able to follow through on our equity commitments. Through the design of those actions, staff will also explore opportunities to reduce costs and increase savings for residents and businesses without undermining the climate emergency objectives. For example, the City’s efforts to increase industry capacity for building retrofits are expected to bring down the cost of zero emissions retrofits. Another example is the development of actions to support our complete, walkable neighborhood objective (Big Move 1), which we anticipate will help residents save more money as they are able to choose to walk and cycle to more of their daily needs. These types of opportunities are not included in the modelling work completed to date.
COMMUNITY BENEFITS NOT INCLUDED The following benefits are not included in the above analysis, and if staff were able to monetize them, the financial business case for CEAP would be substantially stronger. • Economic and employment benefits. As part of VEC’s engagement with the
business community, both local and global, Vancouver’s livability and overall green brand (valued in 2016 at $32 billion) are strong reasons why companies of all types
Climate Emergency Action Plan – RTS 13199 68
come to do business in the city. A 2019 study by VEC identified a $3.3 billion Metro Vancouver market opportunity from 2019 to 2032, resulting from materials and manufacturing for newly constructed buildings to meet the energy requirements of Vancouver’s building code and the BC Energy Step Code. Many of the policies described in the CEAP are expected to lead to new well-paying local green jobs and increased private sector investment in Vancouver.
• Health benefits. There are well-documented health benefits from safer streets, more active lifestyles, less extreme heat, less indoor and outdoor air pollution, and less noise. A 2017 study estimated that the impacts of pollution cost a Canadian family of four $4,300 per year, or $39 billion nationally. A 2017 study on road safety indicated that traffic accidents cost each Canadian an average of $1,200 per year. Many of the CEAP actions will further contribute to the benefits listed above, such as the improved indoor air quality from the building retrofits, less air pollution because of the shift to electric vehicles, and the health benefits associated with increased walking and cycling.
• Reduced climate adaptation costs. We are already experiencing the costs of climate change including storm flooding, extreme heat, and wildfire smoke. These impacts will continue to worsen unless we stop adding carbon pollution into the atmosphere. For example, Vancouver will need to spend approximately $1B to manage sea-level rise and the region over $10B to manage coastal and riverine flood risk due to carbon pollution currently in the atmosphere. The Climate Emergency Action Plan, in combination with climate plans around the world, help us to reduce these costs and ensure we have the capacity to adapt.
LEGAL IMPLICATIONS
The staff recommendations in this report are authorized by the Vancouver Charter, or otherwise fall within Council’s authority.
COMPLEMENTARY CITY INITIATIVES
Though the Climate Emergency Action Plan is the core of Vancouver’s climate change mitigation efforts, there are many complementary City initiatives not included in the CEAP scope. This next section outlines the most relevant complementary initiatives, including the City’s work on climate adaptation, the work to address the carbon pollution from waste and food (most of which are sources of scope 3 emissions), and the City’s broader environmental sustainability planning efforts.
ADAPTATION The impacts of a changing climate are being observed globally and locally and will continue to increase in intensity and severity as global temperatures rise. Vancouverites have experienced extreme rainfall causing street flooding, the king-tide storm surge flooding of Kitsilano Pool, longer summer dry spells, native tree species failing, and increasing incidence of air quality issues due to wildfires. As discussed throughout the CEAP, efforts to reduce carbon pollution are more important than ever because they will limit the extent of climate change and the associated impacts we experience. Climate adaptation or climate resilience is an imperative complement. This
Climate Emergency Action Plan – RTS 13199 69
is the ability to prepare for, respond to, and recover from shocks and stresses related to climate change, and take advantage of any opportunities. Climate mitigation and adaptation are not mutually exclusive and City staff work hard to avoid conflicting efforts and to harness co-beneficial actions that support both aims. The City of Vancouver’s nationally leading Climate Change Adaptation Strategy was first published in 2012. The process of strategy development included reviewing climate science specific to Vancouver, identifying wide-reaching impacts to the city now and in the future, completing a vulnerability and risk assessment, and action planning for the medium- and high-risk impacts. Achievements from the 2012 strategy include the internationally recognized Coastal Flood Risk Assessment, changes in the way we design and approach drainage (Rain City Strategy), and an Urban Forest Action Plan that targets tree planting in neighbourhoods with high-temperature and high-population heat vulnerability. The strategy was updated in 2018 and is composed of five core action areas and 17 enabling actions that are intended to address climate adaptation needs until the next update in 2023. Enabling actions focus on incorporating a climate resilience lens into City business. Core actions build on the success of the 2012 strategy and are divided into five areas:
1. Climate-robust infrastructure 2. Climate-resilient buildings 3. Connected and prepared communities 4. Coastal preparedness 5. Healthy and vigorous natural areas
The strategy relies on a diversity of existing City and community strategies and efforts that aim to improve the overall resilience of the city to shocks and stresses. It also relies on efforts to address inequities and systemic vulnerabilities that challenge resilience, particularly for disproportionately impacted communities. The City’s climate adaptation work will continue in parallel with the implementation of the Climate Emergency Action Plan and updates to Council will be brought forward at the same time, to ensure coordination.
WASTE The City has a goal to become a zero-waste community by 2040. Pursuing zero waste saves money and also reduces carbon pollution. Extracting resources, and producing, transporting and storing food, products, packaging and other materials creates carbon pollution (a scope 3 source of emissions that is predominantly generated outside of Vancouver). Each year the food and goods Vancouverites buy create as much carbon pollution as 382,000 gasoline vehicles. We can reduce these emissions by taking steps to change personal consumption behaviour. For example, about one half of food wasted at home is avoidable, and on average, we buy three times more clothes than we did in the 1980s17. Carbon pollution is also created when food, products and other materials have been disposed of as waste (these are scope 1 emissions). Decomposing waste in landfills
17 metrovancouver.org/thinkthrice
Climate Emergency Action Plan – RTS 13199 70
produces methane, which is 25 times more potent than carbon dioxide, in terms of its ability to warm the planet18.We can reduce these emissions by disposing of less solid waste and by capturing landfill gas for beneficial use. Reducing waste requiring disposal can also lead to landfill gas system cost savings. Actions from Zero Waste 204019 and ongoing solid waste operations that help to reduce emissions include:
• Educating residents and working with industry to become a leading city in food loss and waste prevention, reduction and diversion.
• Reducing consumption of products, such as clothing and electronics, by growing share, re-use and repair activities.
• Converting captured landfill gas to renewable natural gas for use in City operations and in the community.
• Investigating opportunities to transform Vancouver Landfill operations to recover materials, produce renewable natural gas from organic waste, and produce biofuel from non-recyclable construction and demolition materials.
FOOD The food we eat, the ways we produce it, and the amounts wasted or lost have major impacts on both human health and environmental sustainability. The food system accounts for an estimated 25–30% of total carbon emissions worldwide, and contributes to the pollution of land, marine and freshwater ecosystems. In Vancouver, over 20% of our consumption-based emissions come from food. Research has demonstrated that the two main levers to reduce food system emissions are adopting diets low in animal products (particularly beef, pork and dairy) and reducing food waste. Making these changes can be challenging because many of the contributing factors occur outside of city boundaries, and not everyone has choice in the food that they eat; rather, food consumption is shaped by financial circumstances (food security status), culture, religion, traditions, health considerations, and more. In working toward a low-carbon food system for Vancouver, we are focusing on:
• Identifying potential changes to City procurement and practices through the new Green Operations Plan.
• Continuing to implement the Vancouver Food Strategy actions to support urban agriculture as one means of increasing opportunities for sustainable food production and the harvesting and availability of plant-based foods.
GREENEST CITY ACTION PLAN The action in this section describes the work that would be directed by report Recommendation FF. Vancouver’s Greenest City Action Plan (GCAP) has been in place since 2011 and has been recognized as one of the most progressive sustainability plans done by any city. It
18 gov.bc.ca/assets/gov/environment/climate-change/cng/methodology/2018-pso-methodology.pdf 19 vancouver.ca/zerowaste
Climate Emergency Action Plan – RTS 13199 71
has won awards, been emulated by other cities and inspired residents, businesses and other levels of government to act. Part of what makes the plan so successful is a combination of clearly articulated goals, science-based targets to achieve those goals, resources to act and multiple layers of accountability. This accountability starts right at the top with the public being kept fully apprised of progress, successes and failures through the media, and the sharing of Vancouver’s work and annual reports to Vancouver City Council. This accountability flows through City Council to departments, their budgets, and the staff who are responsible to deliver the work. GCAP reflects the best science of the time and Vancouver’s connection with people, health and the environment. While not every target will be reached by 2020, GCAP has moved Vancouver significantly forward and will allow us to continue our journey toward a more balanced relationship between modern civilization and our essential ecosystem. For more information about GCAP and its outcomes, visit vancouver.ca/greenestcity. Vancouver will need a new Comprehensive Environmental Plan (CEP) to build upon GCAP as we move past the 2020 targets. The CEP will incorporate the actions from the Climate Emergency Action Plan, and integrate other environmental priorities, such as zero waste, water, and air quality. As with GCAP, the CEP will need to reflect the best current science and our community’s priorities including affordability, reconciliation and equity. The Vancouver Plan team is already weaving the next CEP into our engagement and planning and in 2021, when the final GCAP 2020 annual report is brought to Council, it will include more details on the next steps in developing Vancouver’s next environmental action plan.
CONCLUSION
This report contains significant policy changes for the City of Vancouver that are designed to help us accelerate our transition off of fossil fuels. The 19 actions in the Climate Emergency Action Plan are designed to work as a package to put us on track for four of our six Big Move targets:
• Big Move 2: By 2030, two thirds of all trips in Vancouver will be made on foot, bike or transit.
• Big Move 3: By 2030, 50% of the kilometres driven on Vancouver’s roads will be by zero emissions vehicles.
• Big Move 4: By 2030, the carbon pollution from buildings will be cut in half from 2007 levels.
• Big Move 5: By 2030, the embodied emissions from new buildings will be reduced by 40% compared to a 2018 baseline.
Each of the actions has been costed and incorporated into an overall investment strategy and financial framework to enable the City to scale up climate action over the next five years, in line with efforts to achieve our 2030 climate targets. We anticipate making those investments through the existing capital plan, new revenue from climate emergency actions, increased investment in climate emergency actions in the next capital plan, and contributions from senior levels of government and other partners.
Climate Emergency Action Plan – RTS 13199 72 In addition to putting us on track to cut our carbon pollution in half by 2030, the Climate Emergency Action Plan offers the following benefits:
• A net savings of $980M for residents and businesses. • Growth in Vancouver’s green economy as workers and businesses develop their skills
and supply chains for zero emissions mobility and buildings. • Better health of our residents through reduced pollution and noise, and more active
lifestyles • Reduced costs to the City, residents, and businesses to adapt to climate change
impacts, such as storm flooding, extreme heat, and wildfire smoke. If Council is supportive of the road map provided by the Climate Emergency Action Plan, staff will begin further analysis and engagement on the 19 actions as we transition to implementation. Detailed reports for by-law changes and new programs will be brought back to Council for consideration starting in 2021 and continuing over the following five years.
* * * * *
APPENDIX A PAGE 1 OF 11
APPENDIX A: TRANSPORT PRICING WORK PLAN
WHAT IS TRANSPORT PRICING Conceptually, transport pricing is a strategy used to improve how we account for the costs and benefits of using the transportation system. For the City to address the largest outstanding gap in how transportation is priced, this means that a portion of vehicle trips in the Metro Core area would incur a fee to account for and improve carbon emissions, air quality, noise, safety, congestion and the use of public space. If done thoughtfully, this will provide the City with the opportunity to work toward mending enduring inequities in the transportation system. This strategy could act as a test bed for eventual expansion to the broader Metro Vancouver region over time, which would significantly amplify many of the benefits expected at a local level. The COVID-19 pandemic has disrupted travel patterns and amplified existing disparities in the quality of mobility and access levels experienced by residents. The need for cleaner air; for a continued supply of goods; for residents to access jobs, services, and friends and family in a timely and reliable manner; for physical space to safely move and be in; and to become reacquainted with public spaces has never been clearer. The pandemic may have modified the underlying objectives of transport pricing, but it further elevated the need.
PRECEDENTS Urban centres around the world of varying geographic sizes, transportation systems, populations, demographics, and cultures have successfully demonstrated that transport pricing shifts vehicle drivers to other transportation modes, shifts trip departure times outside of peak hours, and changes trip-making patterns, facilitating more space to be allocated to other modes and goods movement to ensure continued access improvements for all. Many other regions around the world use or are working toward a form of transport pricing, including other North American C40 Climate Leadership Group cities, such as New York, Montreal, Seattle, San Francisco, Portland, Los Angeles and Washington, DC. Just recently, San Francisco concluded that downtown congestion pricing is still an important solution, even in the midst of their COVID-19 mobility recovery plan. In London, congestion charging allowed 23% more people to travel into the central business district and grow the economy, while reducing CO2 emissions and other air pollutants by up to 20%, collisions by 40%, and congestion by about 30%. Similar results were experienced in Stockholm, Gothenburg, Milan and Singapore. The realization of robust benefits in all these locations consistently shifted initial skepticism into approval and acceptance among the greater community.
APPENDIX A PAGE 2 OF 11
EXISTING POLICY BASIS The idea of pricing roadways for improved outcomes was first introduced 100 years ago.20 Within the Metro Vancouver Region and the City of Vancouver, mobility or transport pricing has been discussed for almost 50 years. The 1973 Transportation for a Livable Region Plan first suggested more direct user fees for drivers. More recently, Regional Transportation Strategy updates in 2008 and 2013 further established the need for and recommended some form of mobility pricing within the region. In 1990, the City’s Clouds of Change report, completed to address atmospheric (climate) change, recommended a road-pricing system to reduce pollution. The City of Vancouver’s Transportation 2040 Plan approved in 2012 identifies action items to advocate for regional road or congestion pricing and to help fund transit and other sustainable transportation improvements, noting that this and other user-pricing mechanisms are preferable to increasing property taxes to fund the transportation system. In 2018, the regionally focused Mobility Pricing Independent Commission (MPIC) completed an initial feasibility study that included principles and illustrative concepts, concluding that road-use pricing is the most effective tool to provide a systematic, meaningful and lasting reduction in traffic congestion to meet regional targets, and that this cannot be achieved with system investments alone. Importantly, the MPIC’s work found that a downtown cordon scenario, as part of a regional congestion-point pricing concept, would be the most effective component, and noted opportunities for a phased implementation, alternative governance models, and field testing. In 2019, as part the Metro Vancouver Climate 2050 and Clean Air Plan, Metro Vancouver published a transportation discussion paper identifying mobility pricing as a Big Idea to reduce emissions, reduce traffic congestion, and contribute toward transportation system investments. As part of TransLink’s Transport 2050 process, pricing is being discussed by the Mayors’ Council into 2021, as part of finalizing a compelling vision of mobility for this region out to 2050. In April 2019, Council approved the City’s Climate Emergency Response, which included policy direction to advance the exploration of a City-focused transport pricing concept. The sections below outline the preliminary outcomes, as well as the comprehensive work plan required to work toward implementation and operation by 2025.
REASON FOR ACTION Over the past century, the City’s transportation system and development have evolved to become overly reliant on private vehicle travel. About 56% of the City’s public street space is currently asphalt allocated toward vehicle movement (including buses, goods movement and emergency services) and personal or shared mobility vehicle storage,21 such that a
20 Pigou (1920) The Economics of Welfare (pg 194), London: Macmillan 21 Sidewalks, cycling and transit infrastructure make up another 13% with the remainder being made up of boulevards, medians, utility zones or other agency ROWs—these elements often in place to support vehicle travel. As such, as a percentage of the travelled portions of the street, vehicle infrastructure increased to about 81%.
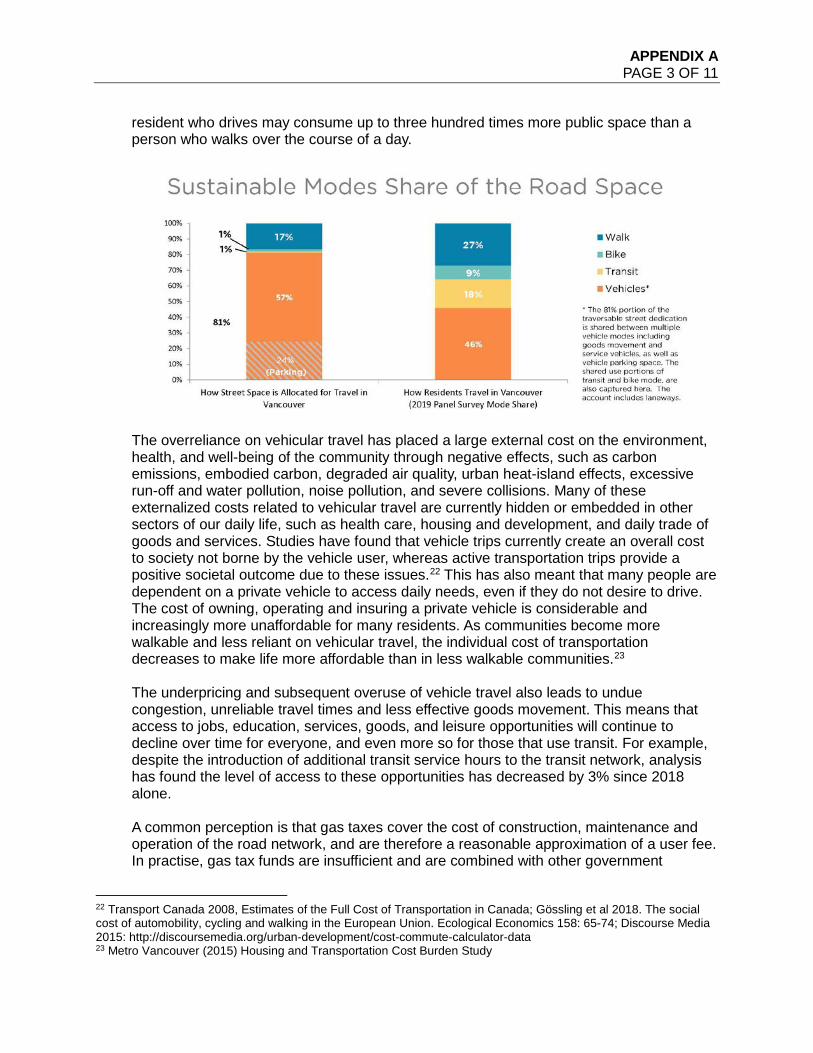
APPENDIX A PAGE 3 OF 11
resident who drives may consume up to three hundred times more public space than a person who walks over the course of a day.
The overreliance on vehicular travel has placed a large external cost on the environment, health, and well-being of the community through negative effects, such as carbon emissions, embodied carbon, degraded air quality, urban heat-island effects, excessive run-off and water pollution, noise pollution, and severe collisions. Many of these externalized costs related to vehicular travel are currently hidden or embedded in other sectors of our daily life, such as health care, housing and development, and daily trade of goods and services. Studies have found that vehicle trips currently create an overall cost to society not borne by the vehicle user, whereas active transportation trips provide a positive societal outcome due to these issues.22 This has also meant that many people are dependent on a private vehicle to access daily needs, even if they do not desire to drive. The cost of owning, operating and insuring a private vehicle is considerable and increasingly more unaffordable for many residents. As communities become more walkable and less reliant on vehicular travel, the individual cost of transportation decreases to make life more affordable than in less walkable communities.23 The underpricing and subsequent overuse of vehicle travel also leads to undue congestion, unreliable travel times and less effective goods movement. This means that access to jobs, education, services, goods, and leisure opportunities will continue to decline over time for everyone, and even more so for those that use transit. For example, despite the introduction of additional transit service hours to the transit network, analysis has found the level of access to these opportunities has decreased by 3% since 2018 alone. A common perception is that gas taxes cover the cost of construction, maintenance and operation of the road network, and are therefore a reasonable approximation of a user fee. In practise, gas tax funds are insufficient and are combined with other government
22 Transport Canada 2008, Estimates of the Full Cost of Transportation in Canada; Gössling et al 2018. The social cost of automobility, cycling and walking in the European Union. Ecological Economics 158: 65-74; Discourse Media 2015: http://discoursemedia.org/urban-development/cost-commute-calculator-data 23 Metro Vancouver (2015) Housing and Transportation Cost Burden Study
APPENDIX A PAGE 4 OF 11
revenues to cover the cost of safe and adequate roadway provision. The already insufficient and unstable gas-tax revenue will decrease further as we continue to encourage an uptake of electric vehicle use, whose drivers currently pay little toward the roadway network.24 Historically, a disproportionately greater level of transportation funding has gone toward the preferential movement of private vehicles. In more recent years, the City has made progress toward providing higher proportions of funding for more inclusive and sustainable modes of transportation; however, the legacy of past directions means significantly more needs to be done. In summary, vehicle use is heavily subsidized directly and indirectly, and often by the residents that benefit the least directly from their use while bearing a disproportionate amount of the negative impacts. How we fund, organize, and ascribe value to our transportation system (both historically and currently) has considerable equity implications that are closely tied to the climate emergency we are faced with. At its core, transport pricing is intended to contribute toward fixing the existing transportation system, which currently distributes costs and benefits inequitably.
ACTION GEOGRAPHY The work plan will study a transport pricing strategy that focuses on the Metro Core. This is the geographical area where the negative impacts of vehicular overuse disproportionally impact vulnerable street users the most, and where the highest proportion of people walk, roll, cycle and linger. The Metro Core provides the greatest transit capacity, transit accessibility, and walk, bike, and roll travel opportunities in the region, which means that there are often suitable alternatives to vehicular travel. Over two thirds of all commuters already make use of these sustainable modes to access the area. All other regions in the world that have successfully implemented mobility or congestion pricing have used an approach that initially applies the strategy to a city-centre cordon area, and they have then modified or expanded the system further based on evolving needs.
EXPECTED BENEFITS A shift toward a more direct user-pay model uncovers the otherwise external and hidden costs of vehicular travel. This will also provide a simplified means to fund transportation system improvements, reducing dependence on development levies, property taxes or other indirect sources, which is currently how much of the system is funded. This provides the opportunity to reduce the cost of housing, alongside the significant transportation and environmental benefits noted below. Historically, user-pay models have generally been supported by Vancouver residents and businesses as a fair approach.
24 There is also an important distinction between provision and use of infrastructure. While gas-tax revenue in aggregate is used to provide roadway infrastructure (and other components of the transportation system), the gas tax was knowingly implemented as an approximation of individual vehicle use due to its simplicity (Martin 1923 – The Gasoline Tax). As vehicles improve their fuel economy, and even more so with the advent of electric vehicles, the gas tax increasingly moves further away from even crudely approximating use. In any case, the gas tax has never been able to relate vehicle use to specific times or segments of the road network that see concentrated use resulting in congestion and other negative external impacts (which the gas tax was not designed to capture).
APPENDIX A PAGE 5 OF 11
CONTRIBUTION TO CLIMATE EMERGENCY TARGETS The single most important action the City can take to achieve How We Move targets and contribute toward reducing transportation-related carbon emissions is to implement a test-bed transport pricing strategy in the Metro Core. Preliminary estimates of the strategy’s impacts on key How We Move goals are described below.
• Mode-share. Numerous residents will shift their travel patterns to make more use of transit options, particularly for commute trips to work during the peak periods when transit frequencies are highest. Some residents will also shift to active modes of travel. Exploratory estimates suggest the strategy will increase the City’s overall sustainable mode-share by 1–2%. In the transport pricing area, sustainable mode-shares may increase 4–7%. This is before accounting for improvements to walking, cycling and transit options that the strategy is intended to facilitate.
• Vehicle kilometres travelled. Reducing the number of vehicle kilometres travelled is a key transportation goal, and one which relates to the CEAP’s Big Move 3 target. Exploratory estimates suggest the strategy will reduce vehicle kilometres travelled on Vancouver roads by 2–4%. Based on supplementary transportation modelling, this is an equivalent reduction to providing about five to ten new rapid bus routes.
CO-BENEFITS A transport pricing strategy is expected to provide numerous additional benefits. Through a combination of preliminary analyses, including high-level scenarios generated through the regional MPIC process and reviews of precedent pricing strategies in other cities, order-of-magnitude estimates for several co-benefits are provided below. More accurate estimates will be determined through additional study, as outlined in the work plan below, and in some cases can only be truly accurately assessed post-implementation. The realization of many of these benefits also requires the completion of the complementary How We Move actions noted in this report.
• Vehicle Trip Reduction. Based on Stockholm and London data and preliminary exploration, a reduction of vehicle trips of 10% to 20% into the priced area may be expected.
• Street Space Reallocation. By reducing vehicle trips, transport pricing will facilitate an expedited path toward achieving the City’s 11% target for road space reallocation to people-focused street spaces. Preliminary estimates suggest the strategy may reduce the demand vehicles place on public street space by 100,000 m2 to 200,000 m2, or the equivalent of up to 100 Robson Plazas.
• Access. In London, despite a 44% reduction in vehicles entering the congestion pricing zone, the more efficient use of space facilitated an increase of 23% more people to travelling into the central business district, as well as an increase in deliveries, allowing the economy to continue to grow.
APPENDIX A PAGE 6 OF 11
• Congestion Reduction. Potential congestion reduction from 50% to 80% for some vehicle trips to and within the pricing area, based on MPIC analysis. Data from Milan suggest improvement to freight delivery times by up to 10%.
• Noise Emissions. Based on Stockholm data, noise reductions of 1 to 2 dBA may be expected. This scale of reduction may only be noticed by some residents. Importantly, a reduction in vehicles and congestion also contributes to a perception of lower noise.
• Air Quality. Based on London and Milan data, pollutants such as NOx, PM10, Ammonia may decrease by between 7% to 40% in the pricing area.
• Safety. Based on London, Milan, and Stockholm data, collisions may decrease between 10% to 40% in the pricing area, and by about half these amounts in adjacent areas.
• Community Proceeds (Revenue). The strategy is estimated to generate community proceeds of between $170 million to $290 million per year, net of operating costs. These funds can be reinvested back into the community to improve sustainable transportation options, mitigate undue mobility impacts where they may arise, including providing direct positive equity outcomes, and possibly be a source of funding for other climate emergency actions.
PROPOSED WORK PLAN Transport pricing strategies are complex and require detailed technical studies, and considerable community and stakeholder engagement prior to developing an implementation plan. The City has undertaken preliminary high-level analysis to understand some of the potential benefits and impacts (as outlined above), however, significantly more work is required. Particularly, more work is needed to identify and design the program to avoid undue impacts on certain populations, and to identify ways to prioritize the needs of low-income, racialized, and other disproportionately impacted communities. The proposed work plan is summarized in the table below, with several key elements expanded on in the sections that follow it. This approach generally follows that recommended in the regionally focused MPIC Metro Vancouver Mobility Pricing Study report but is refined to a city context.
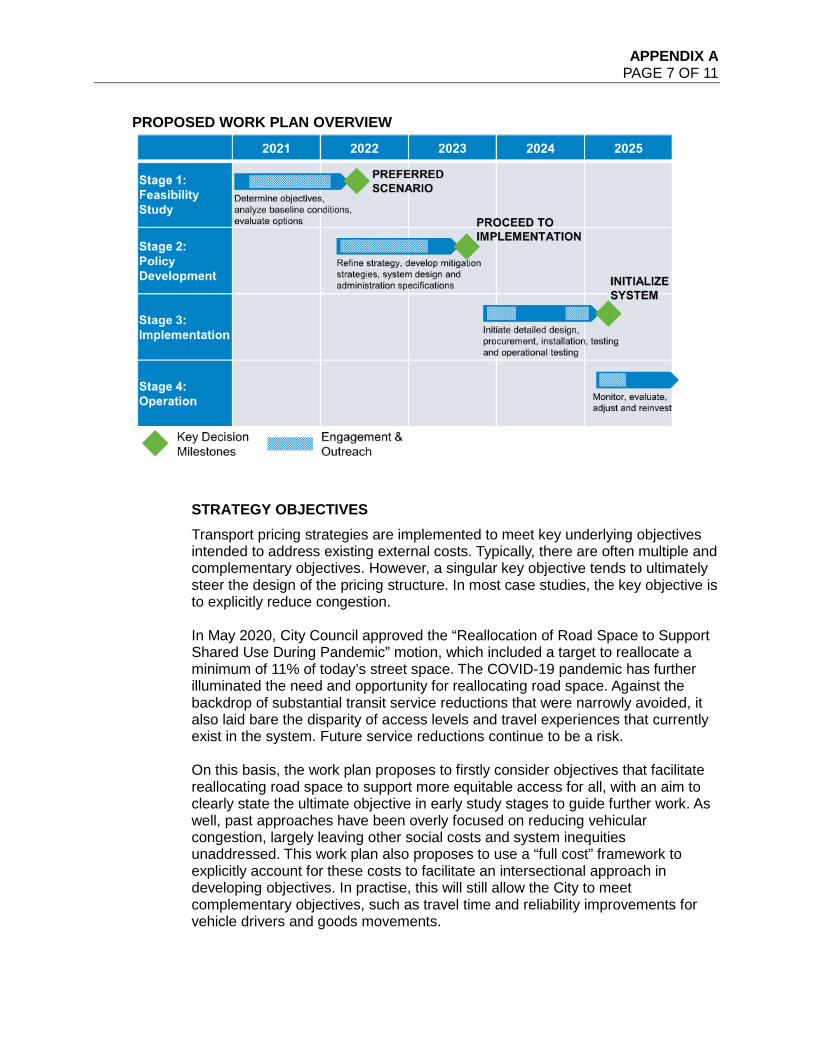
APPENDIX A PAGE 7 OF 11
PROPOSED WORK PLAN OVERVIEW
STRATEGY OBJECTIVES Transport pricing strategies are implemented to meet key underlying objectives intended to address existing external costs. Typically, there are often multiple and complementary objectives. However, a singular key objective tends to ultimately steer the design of the pricing structure. In most case studies, the key objective is to explicitly reduce congestion.
In May 2020, City Council approved the “Reallocation of Road Space to Support Shared Use During Pandemic” motion, which included a target to reallocate a minimum of 11% of today’s street space. The COVID-19 pandemic has further illuminated the need and opportunity for reallocating road space. Against the backdrop of substantial transit service reductions that were narrowly avoided, it also laid bare the disparity of access levels and travel experiences that currently exist in the system. Future service reductions continue to be a risk.
On this basis, the work plan proposes to firstly consider objectives that facilitate reallocating road space to support more equitable access for all, with an aim to clearly state the ultimate objective in early study stages to guide further work. As well, past approaches have been overly focused on reducing vehicular congestion, largely leaving other social costs and system inequities unaddressed. This work plan also proposes to use a “full cost” framework to explicitly account for these costs to facilitate an intersectional approach in developing objectives. In practise, this will still allow the City to meet complementary objectives, such as travel time and reliability improvements for vehicle drivers and goods movements.
APPENDIX A PAGE 8 OF 11
TECHNOLOGY AND INFRASTRUCTURE An early part of the work will be to explore technologies and pricing strategies that reduce implementation capital costs and system infrastructure needs. This exploration will also assess opportunities for a system that may be implemented with minimal modifications to existing regulatory frameworks, and which may be facilitated through new technologies. This work will also further explore the City’s regulatory jurisdiction, including opportunities, challenges and limitations of the current Vancouver Charter, while considering transport pricing strategy opportunities that may function within the currently understood limitations. Existing pricing strategies around the world utilize technologies that ensure privacy standards are adequately met. Any new technological solutions will also need to ensure that privacy issues and data use are similarly managed. Technological solutions that reduce reliance on direct enforcement will also be a priority.
SCENARIO DEVELOPMENT, EVALUATION AND DECISION MAKING The comprehensive development of a transport pricing strategy will be a highly complex endeavour that will need to balance numerous interests and objectives. The work plan proposes to utilize a structured decision making (SDM) approach toward developing and evaluating scenarios. Scenarios will include a combination of different geographical cordon areas in the Metro Core, pricing levels, pricing time periods, applicability, and other variables that may emerge through the process and engagement activities. Some cities have aligned lower-emissions zones with their pricing areas, meaning that the fees change according to the level of emissions vehicles emit, up to and including exemptions for electric vehicles. In some cases, these exemptions were later removed to ensure the strategies’ core objectives were met, such as reducing congestion. Based on this assessment, stakeholder feedback, and equity implications, varying pricing levels by vehicle emissions class is not proposed as part of the scenario development. There will be at least two key Council decision milestones:
• Milestone 1 (early 2022) – A decision to approve the preferred pricing scenario based on feasibility study outcomes and move the work plan into the policy development stage.
• Milestone 2 (mid 2023) – A later decision to proceed with strategy implementation, which would commit the City and any partner agencies to procurement, construction and initialization of the system.
It is anticipated that additional Council updates and involvement will be required as the work progresses, as feasible scenarios are better understood, and as additional issues arise.
APPENDIX A PAGE 9 OF 11
AFFORDABILITY AND FAIRNESS At its core, transport pricing is intended to contribute toward fixing the systemic inequities built into the existing transportation system. In terms of affordability, the individual (internal) costs of driving are already beyond the means of many. This trend will increase. There is no technological, economic, geopolitical or spatial land use trend that will reverse this trend while reducing environmental impact. The opportunity to improve affordability for all lies in providing a means of access to opportunities through other less-prohibitive modes of transportation and the provision of walkable, complete communities. In terms of fairness, those who cannot drive due to factors such as cost, disability or age, and those who choose not to drive, currently contribute toward funding the use of roads by other residents—often those with greater means. Lower-income residents who do use vehicles also drive proportionately more outside of peak travel hours and drive less overall than do more affluent residents. In the city, those with the highest incomes use roadways three times more in terms of kilometres driven than those with the lowest incomes, and are two-and-a-half times more likely to have access to a vehicle. In general, individuals with lower incomes and means currently contribute proportionately greater amounts of their income toward the road network through gas and general taxation, while contributing less to the negative effects of vehicle use and congestion. As the gas tax revenue decreases as more affluent residents increasingly transition to more fuel-efficient or electric vehicles, these disproportionate burdens will continue to magnify. The opportunity to stem this trend and increase fairness in the transportation system lies in more closely relating driving with the direct and external costs of doing so. The implementation of a pricing strategy is a significant departure from the status quo comes with its own challenges that must be carefully addressed such that it can work better for all. What much of 2020 has shown us is that we require more significant changes to respond to the multiple and interrelated crises we face. While recognizing this opportunity, the work plan will place a significant emphasis on ensuring that affordability and fairness issues can be mitigated as the system transitions to work better for all. Scenario development will include investigations of potential pricing caps, discounts or exemptions. When discussing transport pricing strategies, affordability and fairness are typically the predominant and best-understood issues. The work plan does not presuppose additional equity impacts that may arise and commits to uncovering these through a deliberate outreach and engagement program.
OUTREACH AND ENGAGEMENT The work plan proposes to build from stakeholder and public feedback received during the development of the Climate Emergency Action Plan to undertake a comprehensive outreach and engagement program. Much like climate change, transport pricing will impact some members of the community more than others; however, there is also an opportunity to ensure these impacts can be mitigated or
APPENDIX A PAGE 10 OF 11
turned into positive outcomes through thoughtful and cross-cutting co-creation of solutions. The program will identify and focus on residents and community groups that have historically and continue to be marginalized; those who are disproportionately impacted by the negative effects of vehicle use, or who may stand to benefit more from the positive effects. While wealth and income inequities will be a foundational aspect, we are committed to taking an intersectional approach, and to better understanding the unique needs of disadvantaged groups experiencing overt and systemic barriers, which include Indigenous people, women, people with disabilities, racialized people, and 2SLGBTQIA+ people. We know that many business and commerce groups are supportive of transport pricing principles given the positive impacts to goods movement, scheduling, and customer access. The COVID-19 pandemic has uncovered new challenges for some businesses and created opportunities for others. We will continue to engage the business community as we all learn how a transport pricing strategy can best respond to or leverage the changing state of the global and local economy. The need to convert street space to support outdoor restaurant operations has been one such example. Given that in all cases, visitors, workers and students commuting into the city will be affected, a robust regional outreach to the public and via the Mayors’ Council will be a core commitment.
REGIONAL COLLABORATION The City was closely involved in the TransLink-led Mobility Pricing Independent Commission process, which explored pricing scenarios for the entire region (2017–2018). Discussion through TransLink’s Transport 2050 Regional Transportation Strategy process is ongoing. The proposed work plan intends to build on this early collaboration and commits to working with TransLink, Metro Vancouver, the provincial government and other agencies to develop a transport pricing model that has the potential to integrate into or expand to a regional mobility pricing strategy at a later time, such that it will contribute additionally toward regional Transport 2050 and Climate 2050 and Clean Air Plan objectives, as well as the provincial CleanBC objectives.
TIMING The proposed work plan timeline acknowledges the need for robust study and process. It is also built around other currently known key City transportation processes and milestones that will occur over the next few years:
• Broadway Subway Construction and Completion – This will have immediate and lasting impacts on travel patterns, and ultimately provide new transportation opportunities for residents to access the Metro Core area. Closely aligning the launch of the transport pricing system with the
APPENDIX A PAGE 11 OF 11
opening of the subway will minimize disruptions to travel pattern adaptations.
• Area Transportation Plan – As part of the Broadway Subway implementation process, TransLink has committed to undertaking an Area Transportation Plan in partnership with the City in 2022–2023. This will provide the opportunity to better coordinate transport pricing technical needs and policy direction with potential transit service improvements.
• Vancouver Plan – A transport pricing strategy will play a significant role in how the City grows going forward in terms of transportation and public space. There is an opportunity to align this with other City strategic priorities that the Vancouver Plan is intended to guide.
• Transport 2050 Regional Transportation Strategy – Once completed in 2021, Transport 2050 is anticipated to build on prior regional policy direction to work toward a regional pricing model. The City has the opportunity to show leadership in the region, to proactively work with partners, and to support regional transportation goals that, in turn, also support the City’s own goals.
To accommodate these considerations and ensure a deliberate and coordinated study and implementation approach, the work plan proposes to target system initialization and operation by 2025. Once operational, the test-bed implementation will be monitored, evaluated, and adjusted against the pricing strategy objectives.
RESOURCES REQUIRED Delivering a transport pricing strategy will require a team of dedicated staff from 2021 through to 2022 as part of Stage 1 (Feasibility Study) work. In addition, there will be a need to engage external consultants to support the technical and engagement work. This requirement has been identified to be included as part of the development of the 2021 Budget and Five-Year Financial Plan, which is to be considered by Council in December 2020. Stage 2 (Policy Development) needs will become clearer once the outcomes of Stage 1 have been delivered and considered by Council, but they are anticipated to require a similar level of resources. Additional funding requirements will be requested as needed through the annual capital budgeting process. Planning and capital projects of large complexity and scope typically require their own project office. It is expected that this will also become the case as this project advances.
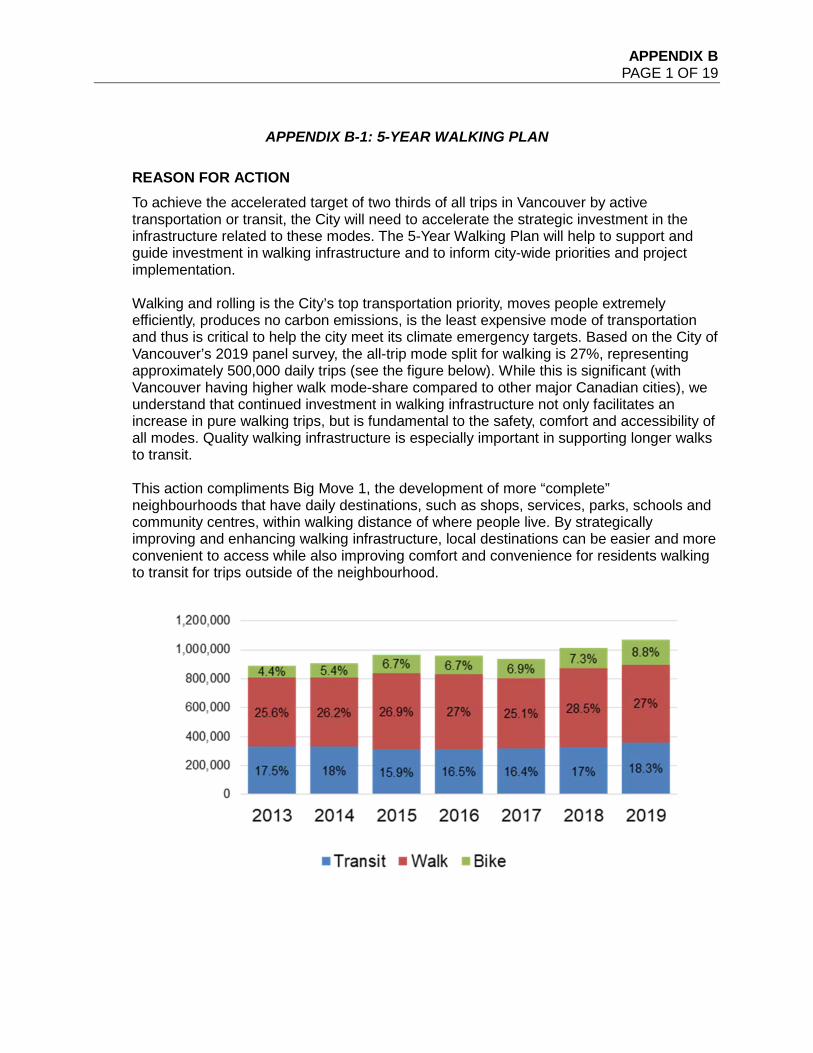
APPENDIX B PAGE 1 OF 19
APPENDIX B-1: 5-YEAR WALKING PLAN
REASON FOR ACTION To achieve the accelerated target of two thirds of all trips in Vancouver by active transportation or transit, the City will need to accelerate the strategic investment in the infrastructure related to these modes. The 5-Year Walking Plan will help to support and guide investment in walking infrastructure and to inform city-wide priorities and project implementation. Walking and rolling is the City’s top transportation priority, moves people extremely efficiently, produces no carbon emissions, is the least expensive mode of transportation and thus is critical to help the city meet its climate emergency targets. Based on the City of Vancouver’s 2019 panel survey, the all-trip mode split for walking is 27%, representing approximately 500,000 daily trips (see the figure below). While this is significant (with Vancouver having higher walk mode-share compared to other major Canadian cities), we understand that continued investment in walking infrastructure not only facilitates an increase in pure walking trips, but is fundamental to the safety, comfort and accessibility of all modes. Quality walking infrastructure is especially important in supporting longer walks to transit. This action compliments Big Move 1, the development of more “complete” neighbourhoods that have daily destinations, such as shops, services, parks, schools and community centres, within walking distance of where people live. By strategically improving and enhancing walking infrastructure, local destinations can be easier and more convenient to access while also improving comfort and convenience for residents walking to transit for trips outside of the neighbourhood.
APPENDIX B PAGE 2 OF 19
CO-BENEFITS BEYOND CLIMATE EMERGENCY TARGET In addition to a reduction in emissions and meeting mode-share targets, improved walking has broad benefits. Walking infrastructure:
• Is fundamental for movement and public life. Whether we drive, take transit
or cycle, we begin and end nearly all trips by walking or rolling. Walking also contributes to the public life of the city. Investing in high quality sidewalks, improved crossings, complete streets and plazas benefits everyone regardless of how they choose to move around. It can also be a fun way to experience the city. To quote Gil Penalosa, founder of 8 80 Cities: “bird fly, fish swim, humans walk.”
• Improves safety. Sidewalks, signals, enhanced crossings, and lighting all contribute to improving safety for people walking in the city—the most vulnerable users of the street. Enhancing safety for people walking directly supports the City’s Vision Zero goal to eliminate all fatalities from its transportation system.
• Enhances connections with others. Walking helps you get to know your neighbourhood and increases the chances of meeting your neighbours. People who walk or cycle have twice as many positive interactions with other people per trip as compared to driving trips.25
• Supports the economy. Not only is walking inexpensive, but it is good for business. Vancouver’s most successful commercial streets have the highest numbers of people walking on them. A recent study of Toronto’s Bloor Street26 indicated that non-drivers make more frequent visits and spend more money at businesses each month. Continued investment in walking will support local businesses as we shift into recovery from the COVID-19 pandemic.
• Can make the city more accessible for all. Walking infrastructure, such as new curb ramps, opens up access for people using wheelchairs and mobility aids. It also helps the broader population, including people pushing strollers and wheeling luggage. Other features, such as tactile warning strips and audible crossings, help people with limited vision.
• Improves population health. Walking 30 minutes per day reduces the risk of heart disease, high blood pressure, obesity, diabetes, osteoporosis and depression.27
• Supports density and efficient use of space. With the growing number of residents each year, there are increased demands on street space. Sidewalks and pathways are an efficient use of limited land. Walking is the most space-efficient way to move people over short distances, such as in the city core. Quality walking infrastructure can ultimately free up space for other city planning uses.
25 Per Vancouver’s 2016 Panel Survey 26 https://www.tcat.ca/wp-content/uploads/2017/12/Bloor-WestVillage-infographic.pdf 27 Healthlink BC https://www.healthlinkbc.ca/physical-activity/health-benefits
APPENDIX B PAGE 3 OF 19
WORK TO DATE • Walking programs. A number of Engineering programs support walking in the
city and contribute to the increase in the walking mode-share.
• Sidewalk repair and rehabilitation. Ongoing renewal of the sidewalk network is essential in supporting walking mode-share and improving accessibility. The City conducts periodic sidewalk condition assessments to inform program decision-making. A system-wide assessment was last completed in 2016. Based on this data, approximately 50% of the City’s sidewalk network was rated to be in good condition, with 40% in fair condition and 10% in poor condition. Renewal of poor condition sidewalks, based on the 2016 assessment, is estimated to cost approximately $30M.
• New sidewalk program. The City has approximately 260 km of sidewalks missing,28 which accounts to about 12% of total sidewalks. The City prioritizes work on new sidewalks using a number of factors: safety, accessibility, and comfort; proximity to community destinations, such as schools, community centres, parks, hospitals and senior centres; access to transit; connections to signalized intersections; and street classification.
• Curb ramp program. Curb ramps at all intersections will make the sidewalk network easily accessible to all. The City prioritizes curb ramp program funding at locations that have been requested by the public (there is currently a 600-request backlog). There are approximately 4,000 intersection corners city-wide that are currently lacking an accessible curb ramp. By 2022, the City aims to deliver 600+ curb ramps that have been requested and eliminate the backlog of requests.
• School active travel program. The School Active Travel Program (SATP) helps encourage walking to schools. The program consults with school communities and other stakeholders to identify transportation challenges and opportunities through walkabouts, travel surveys and meetings with teachers/parents. Each year, four to six schools are invited to participate in the SATP program. Typical infrastructure upgrades supported by the SATP program include raised crosswalks, curb bulges, sidewalks, curb ramps, medians, speed humps, flashing beacons and paint/signage changes.
• New signal program. Traffic signals assist pedestrians in crossing major streets in areas where there is high pedestrian demand. Providing a signal-protected pedestrian crossing phase improves pedestrian safety, particularly on higher-speed and higher-volume roadways where there may be a significant distance between existing crossings.
• Vision zero safety improvements. The City of Vancouver has a wide variety of pedestrian safety tools that can be deployed at locations that have shown the highest rates of fatalities and serious injuries. This toolbox includes new pedestrian signals, traffic signal modifications, geometric changes, LED lighting, countdown timers and enhanced crossings.
28 Based on survey data collected in 2014.
APPENDIX B PAGE 4 OF 19
• Plazas and public spaces. Creating new plazas and public spaces in Vancouver supports a vibrant public life that encourages walking trips and benefits both community and local commerce. With the support of community partners, the plaza program transforms road spaces into people places in neighborhoods with high pedestrian traffic, vibrant retail, public bike share, and a need for more public space.
DRAFT 5-YEAR WALKING PLAN GUIDING PRINCIPLES 1. Remove Barriers and Gaps. Boost sustainable travel by improving direct
pedestrian access and addressing network gaps to unlock the walking potential of neighborhoods.
2. Prioritize Pedestrian Movement. Modal trade-offs should generally favour pedestrians, as walking and rolling is at the top of Vancouver’s transportation hierarchy.
3. Advance Equity. Ensure walking infrastructure serves the entire city, prioritizing marginalized and disproportionately impacted communities and populations.
4. Ensure Safe, Accessible and Convenient Crossings. Infrastructure should be prioritized at locations that make streets more safe, accessible and convenient for the people crossing them.
5. Make Walking and Rolling Comfortable for All Ages and Abilities. Walking infrastructure should include appropriate accessibility features for people with a variety of abilities.
6. Create a Great Public Realm. The walking environment should be inviting and delightful and we should seek opportunities for resting, lighting, place-making and protection from the weather.
WALKING NETWORK ANALYSIS A geographic analysis of the walking network is being conducted to support and inform the 5-Year Walking Plan, through the lens of the guiding principles. Some areas of analysis that have been identified are arterial intersection crossings, areas with missing or inadequate infrastructure, destinations/transit stops with access challenges, safety hotspots, and corridors with unfavorable walking conditions (high vehicle traffic volumes, large distances between signals, unsafe intersection crossings). These inputs are being cross-referenced with parts of the city that are rich with walking destinations and areas that have been disproportionately impacted to develop city-wide priorities. The results of this analysis, in conjunction with prioritization work from existing walking programs, will help to identify the specific spot locations and geographic areas for investment.
PEDESTRIAN SPOT LOCATIONS A systematic analysis of ~1,400 intersections along arterial and collector streets has identified intersections that have high potential for a pedestrian crossing improvement. Each intersection has been ranked based on a set of criteria that was developed with a pedestrian-focused approach. The factors included in this analysis include residential density, commercial density, land use, mode-share, proximity to nearest adjacent signal,
APPENDIX B PAGE 5 OF 19
vehicle traffic volumes, proximity to key destinations (schools, parks, community centres and bus stops), and existing policies and procedures.
PEDESTRIAN AREA PRIORITIES A city-wide spatial analysis of high walking potential areas includes areas around rapid transit, commercial areas and areas within an easy walking distance to daily destinations. The purpose of this walking priority area analysis is to support climate emergency goals through the existing city-wide walking-related programs. By cross-referencing the areas with the highest walking potential with the locations that have experienced a historic lack of investment and/or disproportionate impacts of transportation investment, priorities areas can be identified.
TIMING Expansion and enhancements to the City’s walking infrastructure is ongoing and the 5-Year Walking Plan will be completed by 2021 to guide this work.
RESOURCES REQUIRED Additional funding made available for expanding and upgrading the walking network through the Climate Emergency Action Plan will accelerate the rate of infrastructure delivery and the ability to address the priorities identified in the 5-Year Walking Plan.
EXPECTED OUTCOMES The 5-Year Walking Plan will help guide the implementation and investment of city-wide programs and projects over the next 5 years (2021–2025) and contribute to the following:
• Improved pedestrian access to destinations, including transit and schools. • Reduce the barriers to walking and improve access for people with mobility
challenges. • Improves health and safety of the population. • Higher quality pedestrian realm in key areas of need.
APPENDIX B PAGE 6 OF 19
APPENDIX B-2: 5-YEAR CYCLING NETWORK PLAN
REASON FOR ACTION Cycling is the fastest growing mode of transportation by Vancouver residents, increasing its share of all trips from under 5% in 2013 to nearly 9% of trips in 2019. In order to meet the climate emergency mode-share target, the cycling network needs to be expanded and upgraded to make cycling safe, convenient, and comfortable for people of all ages and abilities.
CO-BENEFITS BEYOND CLIMATE EMERGENCY TARGET In addition to the environmental benefits that come from reducing vehicle trips, congestion and carbon pollution, providing opportunities for people to comfortably and safely cycle to meet their daily needs has the following co-benefits:
• Increased safety and reduction of traffic-related injuries and fatalities • Reduced dependency on vehicles to access daily needs • Providing an affordable transportation option for those without a driver’s license or
access to a vehicle • Improved mental and physical health • Increased community and social connection • Increased access to opportunity • Lower costs for maintaining transportation infrastructure
ONGOING WORK In Vancouver, the total cycling network is 331 km, of which 28% (88 km) of the network is considered comfortable for all ages and abilities (AAA). Expanding and upgrading the cycling network to safely and efficiently connect people to destinations is an ongoing effort. In the past five years, from 2016 to 2020, there have been 25 km of new cycling routes, and 23 km of route upgrades. The City will continue to develop, regularly update, and implement short-term (5-year) network improvements to address gaps and deficiencies in the network, in consultation with residents, businesses and other stakeholders. Expanding and upgrading the cycling network is based on the following principles:
• Ridership. Upgrades and new routes in areas with high existing demand, or high potential increase in ridership.
• Network Cohesion and Directness. Prioritizing critical gaps in the network and connections to key destinations, including schools, community centres, major transit stations and commercial high streets. Simple and direct connections are favoured, while also considering topography.
• Safety and Comfort. Address safety “hotspots”, which are areas with severe and/or high numbers of cycling collisions, and improve overall safety and comfort for people of all ages and abilities.
APPENDIX B PAGE 7 OF 19
• Equity. Improve cycling network to serve geographic areas, disproportionately impacted communities, or groups of people that have fewer mobility options.
• Deliverability and Coordination Opportunities. Prioritize projects feasible for delivery in the next 5 years, considering coordination opportunities with planned construction or other initiatives.
The Slow Streets and Room to Move COVID-19 Response initiatives will serve as additional inputs to the 5-Year Cycling Network update. Lessons learned from the planning and implementation process, as well as direct feedback from residents and stakeholders, will be considered when prioritizing new additions and upgrades to the cycling network. Additionally, the update will be coordinated with other initiatives, such as updating the Greenways Plan.
TIMING Expansion and upgrades to the cycling network are ongoing. The 2018–2022 5-Year Cycling Network Plan will be updated in 2021.
RESOURCES REQUIRED Additional funding made available for expanding and upgrading the cycling network through the climate emergency will accelerate the rate of infrastructure delivery. In the past 5-years, 65 km of new routes and upgrades were completed based on the past funding allocation. Additional funding is required to continue expanding the cycling network, as the cycling infrastructure increases in complexity and design standard for safety.
EXPECTED OUTCOMES • A safer, more convenient, direct, and comfortable cycling network. • More cycling trips across the city. • Improved health and safety.
APPENDIX B PAGE 8 OF 19
APPENDIX B-3: ADDING E-BIKES TO VANCOUVER’S PUBLIC BIKE SHARE SYSTEM
REASON FOR ACTION Adding electric-assist bicycles (e-bikes) to a station-based public bike share (PBS) system has been shown to reduce a number of barriers to bike sharing, which comes with an overall increase in ridership (expanded service area, increased comfort and accessibility). A portion of these bike-share trips will replace modes with higher carbon emissions (cars, transit). Many cities, such as San Francisco, New York, Paris and others, have demonstrated significant greenhouse gas emissions savings by adding e-bikes to their public bike share systems.
CO-BENEFITS BEYOND CLIMATE EMERGENCY TARGET E-bikes have been shown to vastly expand the user group of public bike sharing and improve the gender and age balance of riders. The expansion of the service area will also bring public bike sharing within physical reach of more people in Vancouver. Through the Vancity Community Pass, the system’s equity program, e-bikes will also become available and affordable to a wider range of people in Vancouver. The equity program has seen over 800 people sign up since its launch in the summer of 2018. The Vancity Community Pass provides access to the bike share at a reduced financial cost ($20 or less per year) and offers in-person sign-ups and payment options at a range of community partners throughout the city. There are also health benefits related to the use of e-bikes over other motorized modes of transportation. Research has shown that people on e-bikes see the same health benefits as those on pedal bikes.29
Stations need power to charge the e-bikes. Through the rezoning and redevelopment process, the City has been able to secure a number of locations with electrical connections that could charge e-bikes. In locations where it is necessary to bring power out to the curb, this curbside power will not only benefit the public bike share, but it can also be used for food trucks, filming and special events, and support other uses that would otherwise be powered by polluting generators—further reducing CO2 emissions.
WORK TO DATE Since its launch in the summer of 2016, Vancouver’s public bike share system has facilitated over 2.5 million trips by over 100,000 people—mostly local residents commuting to and from work. Staff have been planning station locations for a number of years and have modelled the optimal location for e-bike stations. Engagement will start in advance of station installations to determine actual locations in a similar way as we did for the existing 200 station locations.
29 Hall C., et.al. Pedal-Assist Mountain Bikes: A Pilot Study Comparison of the Exercise Response, Perceptions, and Beliefs of Experienced Mountain Bikes. JMIR Form Res 2019;3(3):e13643 (https://formative.jmir.org/2019/3/e13643) and Castro A., et.al. Physical activity of electric bicycle users compared to conventional bicycle users and non-cyclists: Insights based on health and transport data from an online survey in seven European cities. Transportation Research Interdisciplinary Perspectives, v.1 (June 2019), 100017. (https://doi.org/10.1016/j.trip.2019.100017)
APPENDIX B PAGE 9 OF 19
WORK TO BE COMPLETED Staff are currently preparing as many station sites as possible through synergies with ongoing electrical work and redevelopment. Staff are continuing to work closely with the operator of the system, Vancouver Bike Share, and the equipment supplier to plan the rollout of the stations and e-bikes.
TIMING This action, originally planned for 2020, has been delayed until spring 2021. During this period the City has continued to prepare station sites by the provision of curbside power, which benefits not only public bike sharing, but a number of other uses.
RESOURCES REQUIRED Additional funding made available through the Climate Emergency Action Plan will accelerate the rate of public e-bike share delivery and the ability to address the priorities identified in the Transportation 2040 and Healthy City plans.
EXPECTED OUTCOMES We expect that the addition of e-bikes to Vancouver’s successful public bike share system will further expand its user base by reducing a number of barriers to bike sharing. E-bikes are expected to replace even more high-carbon motorized trips than the current pedal bikes and also to facilitate longer trips. Ridership-wise e-bikes have been shown to facilitate more trips per bike per day than pedal bikes. All of these expectations can be tracked through the already existing ridership data30 that is monitored by staff, and through conducting Mobi member surveys. Overall, e-bike sharing should reduce the number of high-carbon trips in the city, greatly improve the access to bike sharing, and provide a number of co-benefits to other street uses that can utilize curbside power (food trucks, filming and special event, etc.).
30 General Bikeshare Feed Specification (https://github.com/NABSA/gbfs)
APPENDIX B PAGE 10 OF 19
APPENDIX B-4: 5-YEAR TRANSIT ACTION PLAN
INTRODUCTION Big Move 2 sets an ambitious target for the City—that by 2030, two-thirds of trips are taken by active transportation and transit. Supporting this target, Action 4 is to improve bus speed and reliability on City of Vancouver streets. This will help provide commuters with a faster and more reliable alternative to driving, while reducing carbon emissions. Faster and more reliable buses also helps reduce the costs of delivering transit service, increasing TransLink’s ability to invest in new services in the future. Several corridors have been chosen for bus speed and reliability improvements over the next five years. This package of corridor improvements, along with a Spot Improvements Plan, forms the basis of the 5-Year Transit Action Plan. One prime input into the plan has been TransLink’s Bus Speed and Reliability (BSR) Report (2019), which identified the 20 most-congested bus corridors in the region, based on hours of passenger delay. Improvements are being considered for routes in the city where bus passengers experience the most delays, and routes travelling in and out of the Metro Core have been prioritized. The City will work in partnership with TransLink through the design and implementation of these projects.
PLAN DEVELOPMENT Key aspects of plan development include:
• Initial ideas were developed based on existing data sources, including TransLink’s BSR Report (2019).
• TransLink is a critical stakeholder in the development of this plan. TransLink was consulted with on emerging-route selection, and this has been refined through subsequent conversations focused on tactical transit opportunities in support of recovery efforts.
• Proposed corridors have been assessed as part of a multiple account evaluation (MAE) framework (described below).
• Strong support for this action was reported in the climate emergency engagement feedback. There was strong support for ensuring equity was considered in the plan. This is highlighted below.
COVID-19 RESPONSE/TACTICAL TRANSIT INTERVENTIONS Transit has always been a critical component of the city, but through the COVID-19 pandemic, it has proven to be a vital lifeline. Despite fewer people taking transit, many essential workers take transit to get to their workplaces and many others rely on transit to access their everyday goods and services. In support of transit recovery, with new funding from TransLink, and in response to Council’s May 2020 motions on support for transit priority and road-space reallocation, the City is implementing a series of “quick win” tactical transit speed and reliability improvements along four corridors in Fall 2020. These measures are pilots, and if
APPENDIX B PAGE 11 OF 19
successful, will be made permanent, following an appropriate engagement process. Strategically, some of the corridors chosen for this tactical work overlap with those chosen in this plan. The four locations being implemented are:
• Robson Street (bus bulbs) • Main Street, between National Avenue and Kingsway, and Kingsway, between
Main Street and Fraser Street • Granville Street, between 5th Avenue and SW Marine Drive • 49th Avenue, between Boundary Road and Main Street
The City will monitor these locations and will build upon the lessons learned in these projects in developing further interventions for the 5-Year Transit Action Plan.
IMPORTANCE OF TRANSIT Transit is important to Vancouver for many reasons. Firstly, it is a highly efficient mode of transport, taking up much less space per person when compared to single-occupancy vehicles. With increasing pressure on the city’s existing road space from the general growth of the region, residents must increasingly shift to modes of travel that use road space more efficiently. While walking and cycling are great options for many people carrying out short to medium trips, transit is an excellent option for longer trips, or for those who are have mobility challenges. Transit in Vancouver also attracts a wide diversity of people from varying backgrounds and income levels. Transit vehicles (including conventional diesel buses) also produce much lower emissions per person when compared to single-occupancy vehicles. Given that transportation makes up approximately 40% of the city’s carbon emissions, shifting private vehicle trips to transit will reduce the emissions profile of the transport system. Emissions profiles for buses in particular are only expected to decrease over the next few decades with the anticipated uptake in battery-electric bus technology. Transit service is also an issue of equity. Vehicle ownership is a privilege for residents with the financial means to purchase a car and pay for insurance, parking, gas and maintenance over the vehicle’s lifetime. Correspondingly, driving is not a viable option for many residents with lower incomes. Many other residents are simply unable to drive, due to age, mobility challenges, or other factors out of their control. Ensuring these groups have access to their daily needs via high-quality transportation is an essential part of making the city a more equitable place to live.
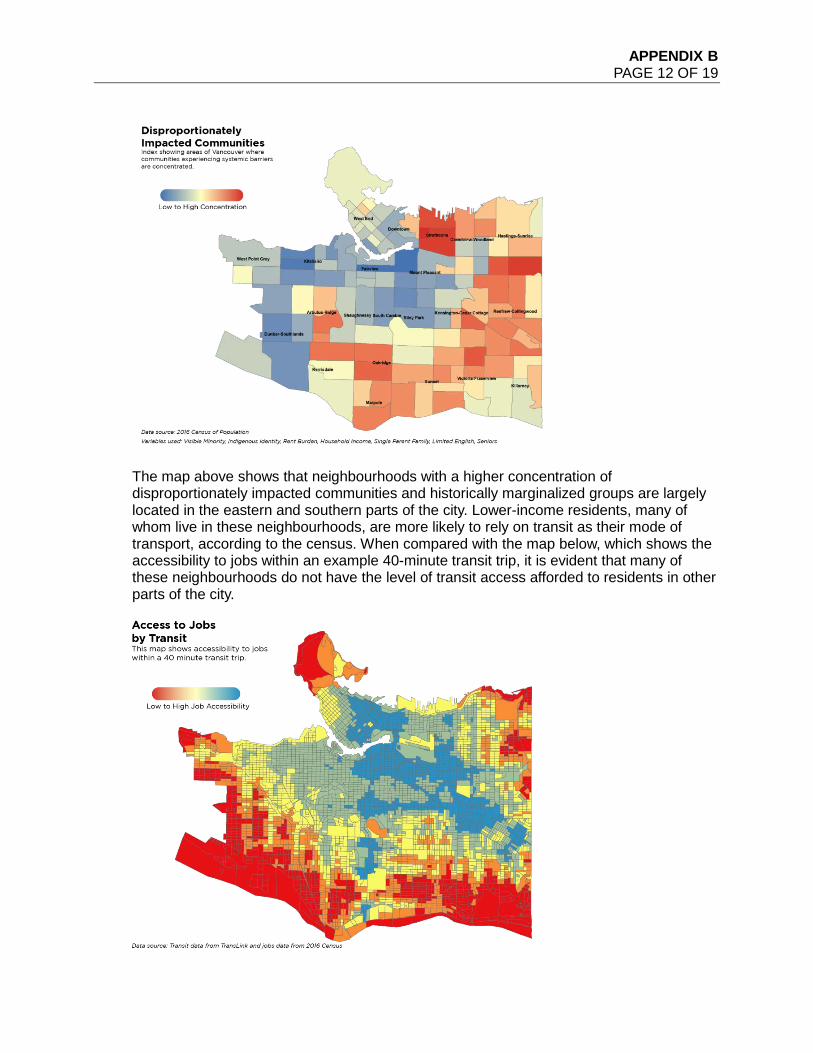
APPENDIX B PAGE 12 OF 19
The map above shows that neighbourhoods with a higher concentration of disproportionately impacted communities and historically marginalized groups are largely located in the eastern and southern parts of the city. Lower-income residents, many of whom live in these neighbourhoods, are more likely to rely on transit as their mode of transport, according to the census. When compared with the map below, which shows the accessibility to jobs within an example 40-minute transit trip, it is evident that many of these neighbourhoods do not have the level of transit access afforded to residents in other parts of the city.
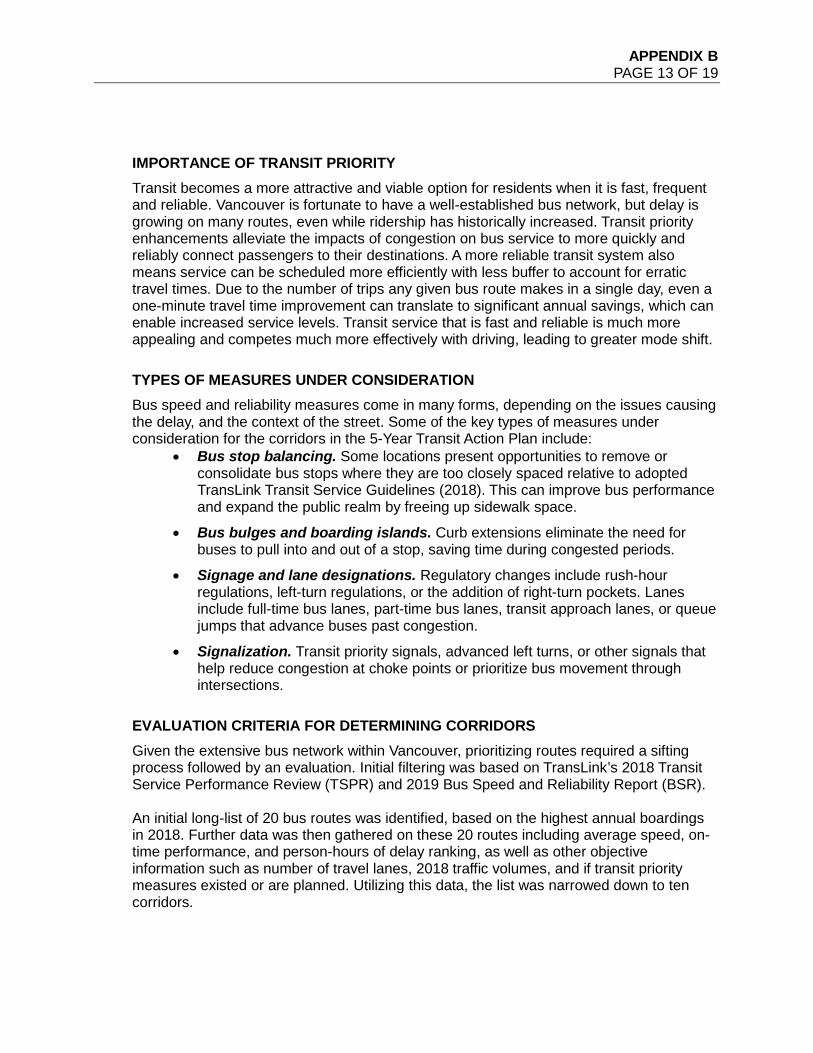
APPENDIX B PAGE 13 OF 19
IMPORTANCE OF TRANSIT PRIORITY Transit becomes a more attractive and viable option for residents when it is fast, frequent and reliable. Vancouver is fortunate to have a well-established bus network, but delay is growing on many routes, even while ridership has historically increased. Transit priority enhancements alleviate the impacts of congestion on bus service to more quickly and reliably connect passengers to their destinations. A more reliable transit system also means service can be scheduled more efficiently with less buffer to account for erratic travel times. Due to the number of trips any given bus route makes in a single day, even a one-minute travel time improvement can translate to significant annual savings, which can enable increased service levels. Transit service that is fast and reliable is much more appealing and competes much more effectively with driving, leading to greater mode shift.
TYPES OF MEASURES UNDER CONSIDERATION Bus speed and reliability measures come in many forms, depending on the issues causing the delay, and the context of the street. Some of the key types of measures under consideration for the corridors in the 5-Year Transit Action Plan include:
• Bus stop balancing. Some locations present opportunities to remove or consolidate bus stops where they are too closely spaced relative to adopted TransLink Transit Service Guidelines (2018). This can improve bus performance and expand the public realm by freeing up sidewalk space.
• Bus bulges and boarding islands. Curb extensions eliminate the need for buses to pull into and out of a stop, saving time during congested periods.
• Signage and lane designations. Regulatory changes include rush-hour regulations, left-turn regulations, or the addition of right-turn pockets. Lanes include full-time bus lanes, part-time bus lanes, transit approach lanes, or queue jumps that advance buses past congestion.
• Signalization. Transit priority signals, advanced left turns, or other signals that help reduce congestion at choke points or prioritize bus movement through intersections.
EVALUATION CRITERIA FOR DETERMINING CORRIDORS Given the extensive bus network within Vancouver, prioritizing routes required a sifting process followed by an evaluation. Initial filtering was based on TransLink’s 2018 Transit Service Performance Review (TSPR) and 2019 Bus Speed and Reliability Report (BSR). An initial long-list of 20 bus routes was identified, based on the highest annual boardings in 2018. Further data was then gathered on these 20 routes including average speed, on-time performance, and person-hours of delay ranking, as well as other objective information such as number of travel lanes, 2018 traffic volumes, and if transit priority measures existed or are planned. Utilizing this data, the list was narrowed down to ten corridors.
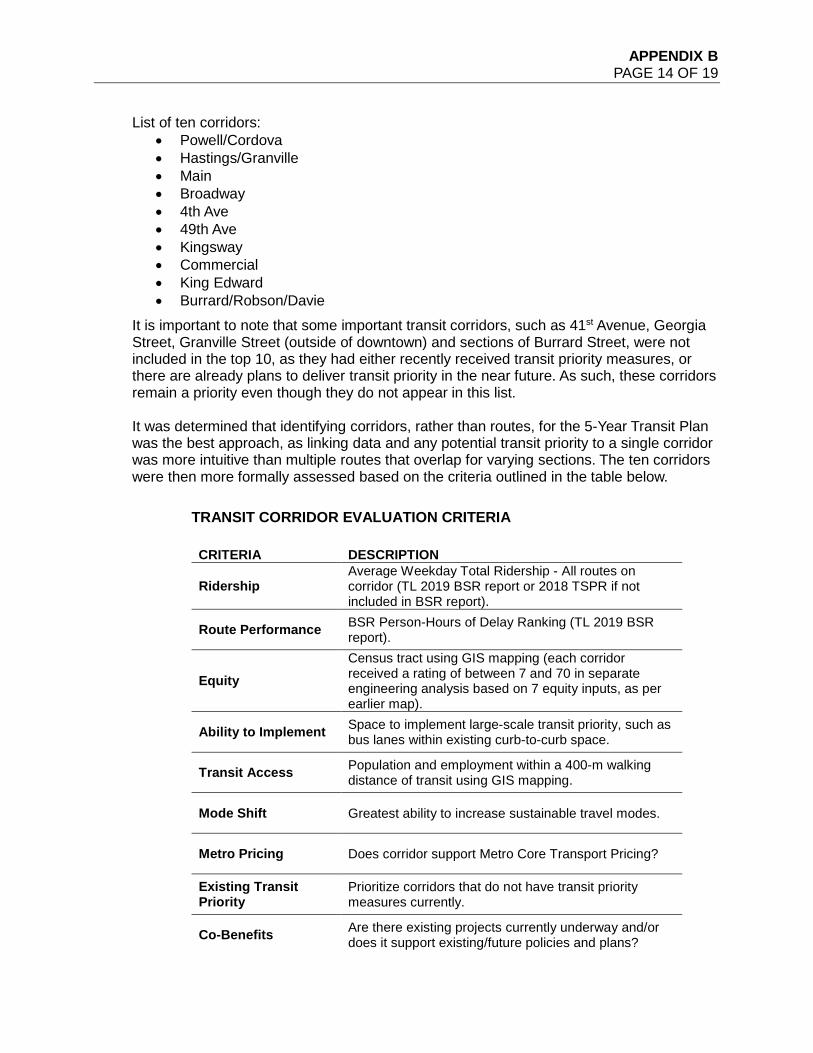
APPENDIX B PAGE 14 OF 19
List of ten corridors: • Powell/Cordova • Hastings/Granville • Main • Broadway • 4th Ave • 49th Ave • Kingsway • Commercial • King Edward • Burrard/Robson/Davie
It is important to note that some important transit corridors, such as 41st Avenue, Georgia Street, Granville Street (outside of downtown) and sections of Burrard Street, were not included in the top 10, as they had either recently received transit priority measures, or there are already plans to deliver transit priority in the near future. As such, these corridors remain a priority even though they do not appear in this list. It was determined that identifying corridors, rather than routes, for the 5-Year Transit Plan was the best approach, as linking data and any potential transit priority to a single corridor was more intuitive than multiple routes that overlap for varying sections. The ten corridors were then more formally assessed based on the criteria outlined in the table below.
TRANSIT CORRIDOR EVALUATION CRITERIA
CRITERIA DESCRIPTION
Ridership Average Weekday Total Ridership - All routes on corridor (TL 2019 BSR report or 2018 TSPR if not included in BSR report).
Route Performance BSR Person-Hours of Delay Ranking (TL 2019 BSR report).
Equity Census tract using GIS mapping (each corridor received a rating of between 7 and 70 in separate engineering analysis based on 7 equity inputs, as per earlier map).
Ability to Implement Space to implement large-scale transit priority, such as bus lanes within existing curb-to-curb space.
Transit Access Population and employment within a 400-m walking distance of transit using GIS mapping.
Mode Shift Greatest ability to increase sustainable travel modes.
Metro Pricing Does corridor support Metro Core Transport Pricing?
Existing Transit Priority
Prioritize corridors that do not have transit priority measures currently.
Co-Benefits Are there existing projects currently underway and/or does it support existing/future policies and plans?
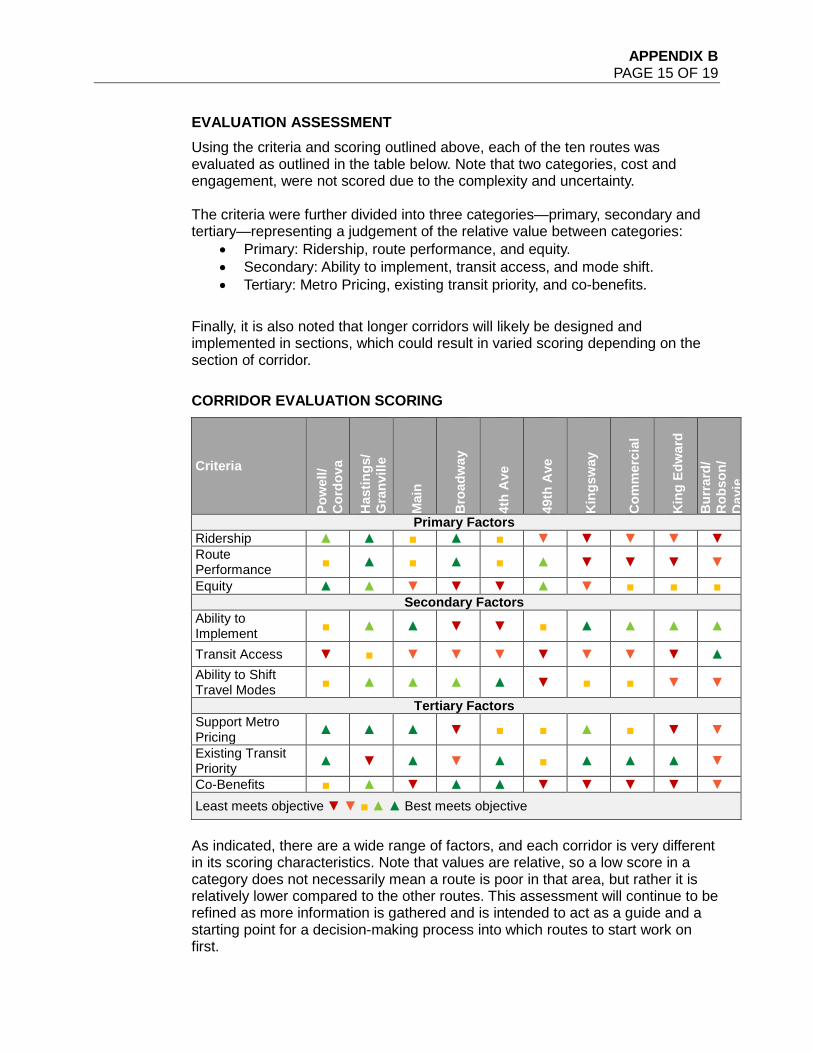
APPENDIX B PAGE 15 OF 19
EVALUATION ASSESSMENT Using the criteria and scoring outlined above, each of the ten routes was evaluated as outlined in the table below. Note that two categories, cost and engagement, were not scored due to the complexity and uncertainty. The criteria were further divided into three categories—primary, secondary and tertiary—representing a judgement of the relative value between categories:
• Primary: Ridership, route performance, and equity. • Secondary: Ability to implement, transit access, and mode shift. • Tertiary: Metro Pricing, existing transit priority, and co-benefits.
Finally, it is also noted that longer corridors will likely be designed and implemented in sections, which could result in varied scoring depending on the section of corridor.
CORRIDOR EVALUATION SCORING
Criteria
Pow
ell/
Cor
dova
Has
tings
/ G
ranv
ille
Mai
n
Bro
adw
ay
4th
Ave
49th
Ave
Kin
gsw
ay
Com
mer
cial
Kin
g Ed
war
d
Bur
rard
/ R
obso
n/
Dav
ie
Primary Factors Ridership ▲ ▲ ■ ▲ ■ ▼ ▼ ▼ ▼ ▼ Route Performance ■ ▲ ■ ▲ ■ ▲ ▼ ▼ ▼ ▼
Equity ▲ ▲ ▼ ▼ ▼ ▲ ▼ ■ ■ ■ Secondary Factors
Ability to Implement ■ ▲ ▲ ▼ ▼ ■ ▲ ▲ ▲ ▲
Transit Access ▼ ■ ▼ ▼ ▼ ▼ ▼ ▼ ▼ ▲ Ability to Shift Travel Modes ■ ▲ ▲ ▲ ▲ ▼ ■ ■ ▼ ▼
Tertiary Factors Support Metro Pricing ▲ ▲ ▲ ▼ ■ ■ ▲ ■ ▼ ▼
Existing Transit Priority ▲ ▼ ▲ ▼ ▲ ■ ▲ ▲ ▲ ▼
Co-Benefits ■ ▲ ▼ ▲ ▲ ▼ ▼ ▼ ▼ ▼ Least meets objective ▼ ▼ ■ ▲ ▲ Best meets objective
As indicated, there are a wide range of factors, and each corridor is very different in its scoring characteristics. Note that values are relative, so a low score in a category does not necessarily mean a route is poor in that area, but rather it is relatively lower compared to the other routes. This assessment will continue to be refined as more information is gathered and is intended to act as a guide and a starting point for a decision-making process into which routes to start work on first.
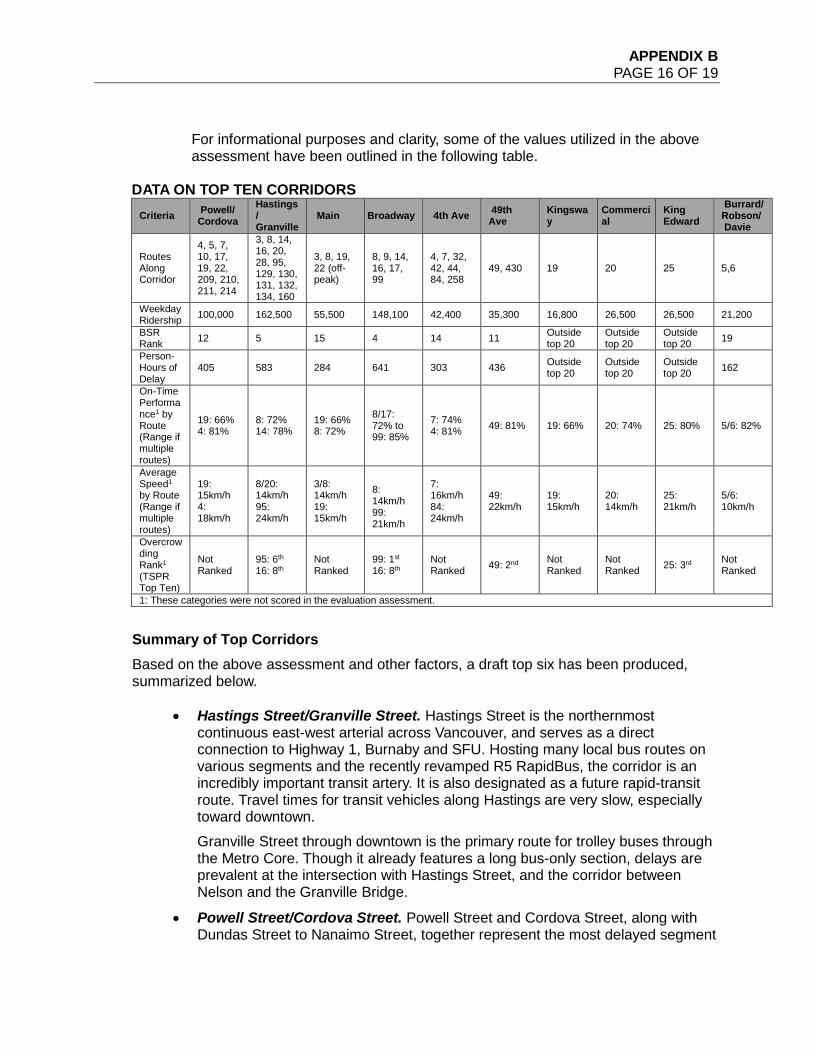
APPENDIX B PAGE 16 OF 19
For informational purposes and clarity, some of the values utilized in the above assessment have been outlined in the following table.
DATA ON TOP TEN CORRIDORS
Criteria Powell/ Cordova
Hastings/ Granville
Main Broadway 4th Ave 49th Ave
Kingsway
Commercial
King Edward
Burrard/ Robson/ Davie
Routes Along Corridor
4, 5, 7, 10, 17, 19, 22, 209, 210, 211, 214
3, 8, 14, 16, 20, 28, 95, 129, 130, 131, 132, 134, 160
3, 8, 19, 22 (off-peak)
8, 9, 14, 16, 17, 99
4, 7, 32, 42, 44, 84, 258
49, 430 19 20 25 5,6
Weekday Ridership 100,000 162,500 55,500 148,100 42,400 35,300 16,800 26,500 26,500 21,200
BSR Rank 12 5 15 4 14 11 Outside
top 20 Outside top 20
Outside top 20 19
Person-Hours of Delay
405 583 284 641 303 436 Outside top 20
Outside top 20
Outside top 20 162
On-Time Performance1 by Route (Range if multiple routes)
19: 66% 4: 81%
8: 72% 14: 78%
19: 66% 8: 72%
8/17: 72% to 99: 85%
7: 74% 4: 81% 49: 81% 19: 66% 20: 74% 25: 80% 5/6: 82%
Average Speed1 by Route (Range if multiple routes)
19: 15km/h 4: 18km/h
8/20: 14km/h 95: 24km/h
3/8: 14km/h 19: 15km/h
8: 14km/h 99: 21km/h
7: 16km/h 84: 24km/h
49: 22km/h
19: 15km/h
20: 14km/h
25: 21km/h
5/6: 10km/h
Overcrowding Rank1 (TSPR Top Ten)
Not Ranked
95: 6th 16: 8th
Not Ranked
99: 1st 16: 8th
Not Ranked 49: 2nd Not
Ranked Not Ranked 25: 3rd Not
Ranked
1: These categories were not scored in the evaluation assessment.
Summary of Top Corridors Based on the above assessment and other factors, a draft top six has been produced, summarized below.
• Hastings Street/Granville Street. Hastings Street is the northernmost continuous east-west arterial across Vancouver, and serves as a direct connection to Highway 1, Burnaby and SFU. Hosting many local bus routes on various segments and the recently revamped R5 RapidBus, the corridor is an incredibly important transit artery. It is also designated as a future rapid-transit route. Travel times for transit vehicles along Hastings are very slow, especially toward downtown. Granville Street through downtown is the primary route for trolley buses through the Metro Core. Though it already features a long bus-only section, delays are prevalent at the intersection with Hastings Street, and the corridor between Nelson and the Granville Bridge.
• Powell Street/Cordova Street. Powell Street and Cordova Street, along with Dundas Street to Nanaimo Street, together represent the most delayed segment
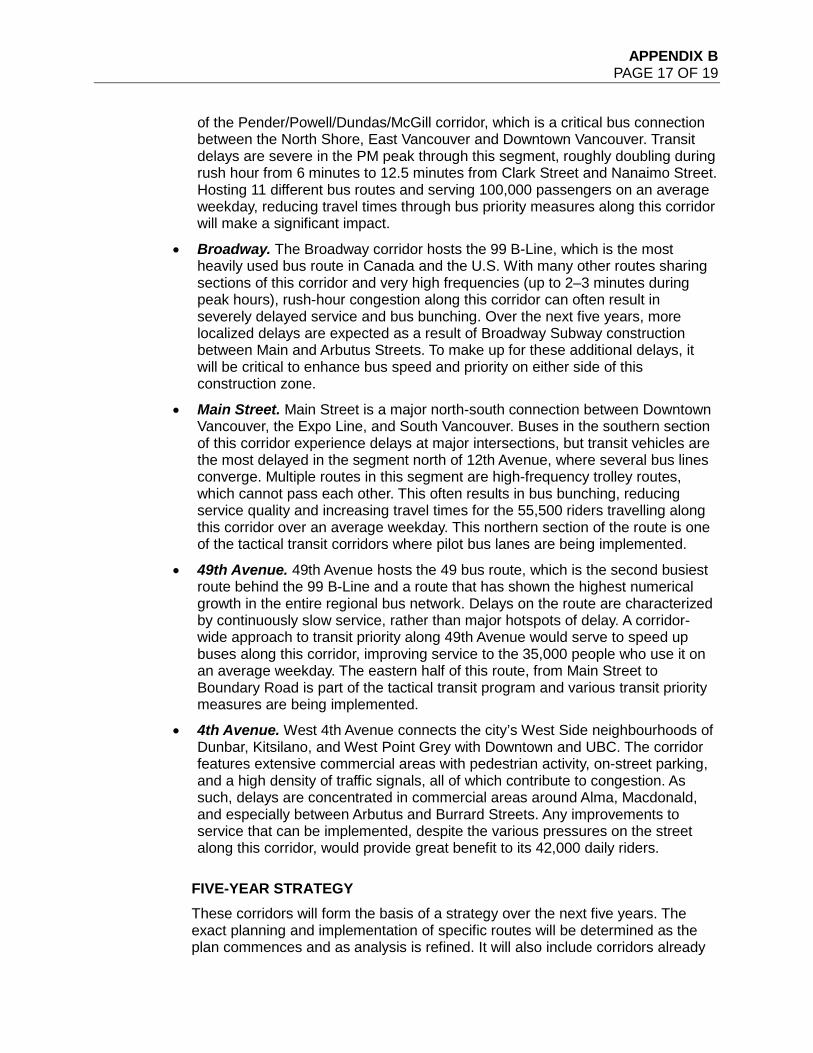
APPENDIX B PAGE 17 OF 19
of the Pender/Powell/Dundas/McGill corridor, which is a critical bus connection between the North Shore, East Vancouver and Downtown Vancouver. Transit delays are severe in the PM peak through this segment, roughly doubling during rush hour from 6 minutes to 12.5 minutes from Clark Street and Nanaimo Street. Hosting 11 different bus routes and serving 100,000 passengers on an average weekday, reducing travel times through bus priority measures along this corridor will make a significant impact.
• Broadway. The Broadway corridor hosts the 99 B-Line, which is the most heavily used bus route in Canada and the U.S. With many other routes sharing sections of this corridor and very high frequencies (up to 2–3 minutes during peak hours), rush-hour congestion along this corridor can often result in severely delayed service and bus bunching. Over the next five years, more localized delays are expected as a result of Broadway Subway construction between Main and Arbutus Streets. To make up for these additional delays, it will be critical to enhance bus speed and priority on either side of this construction zone.
• Main Street. Main Street is a major north-south connection between Downtown Vancouver, the Expo Line, and South Vancouver. Buses in the southern section of this corridor experience delays at major intersections, but transit vehicles are the most delayed in the segment north of 12th Avenue, where several bus lines converge. Multiple routes in this segment are high-frequency trolley routes, which cannot pass each other. This often results in bus bunching, reducing service quality and increasing travel times for the 55,500 riders travelling along this corridor over an average weekday. This northern section of the route is one of the tactical transit corridors where pilot bus lanes are being implemented.
• 49th Avenue. 49th Avenue hosts the 49 bus route, which is the second busiest route behind the 99 B-Line and a route that has shown the highest numerical growth in the entire regional bus network. Delays on the route are characterized by continuously slow service, rather than major hotspots of delay. A corridor-wide approach to transit priority along 49th Avenue would serve to speed up buses along this corridor, improving service to the 35,000 people who use it on an average weekday. The eastern half of this route, from Main Street to Boundary Road is part of the tactical transit program and various transit priority measures are being implemented.
• 4th Avenue. West 4th Avenue connects the city’s West Side neighbourhoods of Dunbar, Kitsilano, and West Point Grey with Downtown and UBC. The corridor features extensive commercial areas with pedestrian activity, on-street parking, and a high density of traffic signals, all of which contribute to congestion. As such, delays are concentrated in commercial areas around Alma, Macdonald, and especially between Arbutus and Burrard Streets. Any improvements to service that can be implemented, despite the various pressures on the street along this corridor, would provide great benefit to its 42,000 daily riders.
FIVE-YEAR STRATEGY These corridors will form the basis of a strategy over the next five years. The exact planning and implementation of specific routes will be determined as the plan commences and as analysis is refined. It will also include corridors already
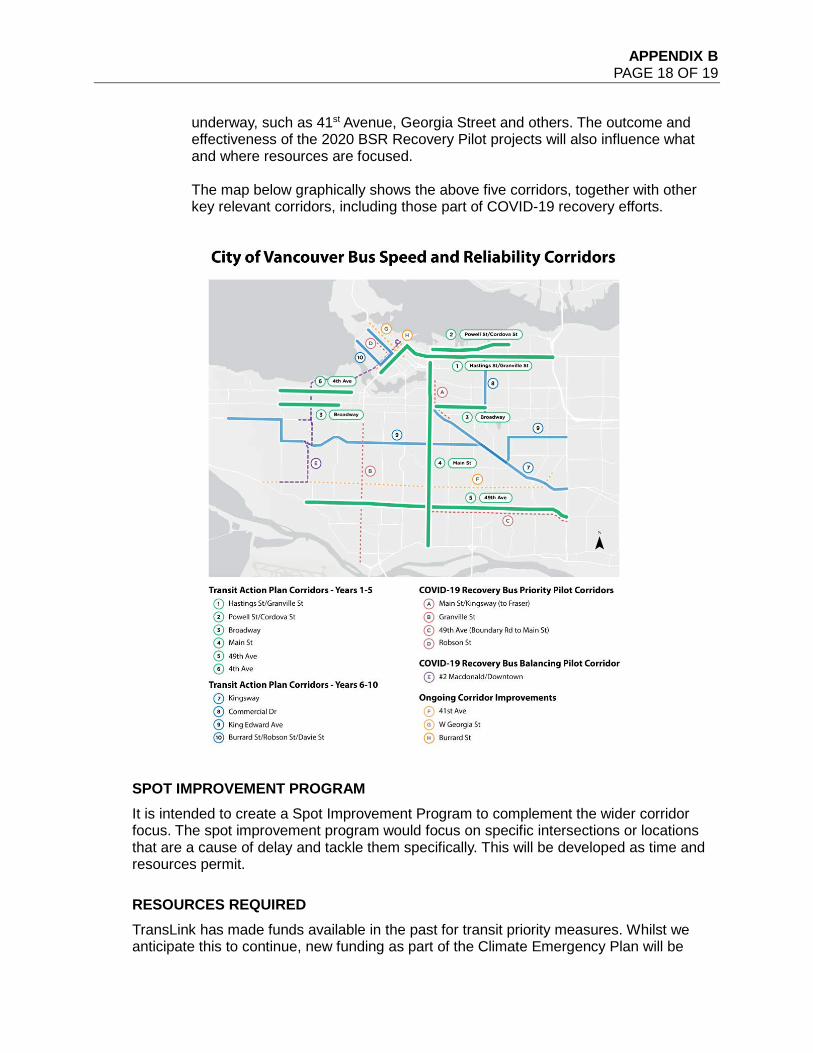
APPENDIX B PAGE 18 OF 19
underway, such as 41st Avenue, Georgia Street and others. The outcome and effectiveness of the 2020 BSR Recovery Pilot projects will also influence what and where resources are focused.
The map below graphically shows the above five corridors, together with other key relevant corridors, including those part of COVID-19 recovery efforts.
SPOT IMPROVEMENT PROGRAM It is intended to create a Spot Improvement Program to complement the wider corridor focus. The spot improvement program would focus on specific intersections or locations that are a cause of delay and tackle them specifically. This will be developed as time and resources permit.
RESOURCES REQUIRED TransLink has made funds available in the past for transit priority measures. Whilst we anticipate this to continue, new funding as part of the Climate Emergency Plan will be
APPENDIX B PAGE 19 OF 19
needed to supplement this and deliver change on the scale that is required to meet our objectives.
EXPECTED OUTCOMES The 5-Year Transit Action Plan will see six bus priority routes completed by 2025, with a total of 10 completed by 2030. They will contribute toward the following:
• Faster and more reliable journey times on key transit corridors • Improved access to destinations across the city by residents • Improved health and safety of the population through associated increase in
walking and cycling trips and lower vehicle use
APPENDIX C PAGE 1 OF 4
APPENDIX C-1: CITY-WIDE TRANSPORTATION DEMAND MANAGEMENT ACTION PLAN
REASON FOR ACTION Many factors outside of physical infrastructure act as barriers and motivators to using sustainable transportation. Transportation demand management (TDM) applies behaviour-change research, tools and incentives to encourage the use of sustainable transportation, focusing on understanding how and why people make transportation decisions. The TDM Action Plan is an internal document that will guide the City’s encouragement and promotional programming to support more active and sustainable travel, and to reduce the number of vehicle trips in the City of Vancouver. The TDM Action Plan will build upon the high-level strategies for promotion and encouragement efforts set out in the 2016 Active Transportation Promotion and Enabling Plan, as well as Transport 2040. Most cities and municipalities around the world have a TDM plan or strategy in place, and TDM initiatives cost-effectively support investments in land use and transportation infrastructure, resulting in better use of Vancouver’s transportation system.
CO-BENEFITS BEYOND CLIMATE EMERGENCY TARGET In addition to reducing the reliance on private vehicles and therefore reducing carbon pollution, TDM initiatives also provide:
• Reduced congestion and resulting time savings • Maximized return on infrastructure spending by increasing ridership and use • Health benefits of improved air quality • Fitness benefits of active transportation (biking and walking) • Enhanced quality of life in walkable, bikeable communities with many
transportation options • Reduced costs of car ownership and maintenance
WORK TO DATE Research was undertaken to inform the development of the TDM Action Plan, resulting in a TDM Plan Background Research Memo. The memo comprises the following sections:
• Overview of TDM programs and activities already happening in the City and region • A review of City policy as it relates to TDM • Precedent research from other cities and regions • Gap analysis – emerging areas of focus
Following this, the structure of the TDM Action Plan was drafted. The plan is made up of goals, strategies, actions and metrics, as described below.
• Goals: these are high-level goals that align with wider City transportation targets.
• Strategies: the strategies provide focus areas for TDM programming in order to achieve the goals.
APPENDIX C PAGE 2 OF 4
• Actions: each strategy will have a set of short- and long-term actions. These actions may support more than one strategy.
• Metrics: each goal/action will have performance indicators associated with it, to monitor the impacts of our programming.
EQUITY The TDM Action Plan embeds a commitment to advancing social equity by ensuring that the mobility needs of disproportionately impacted communities are taken into account, and that policies which are appropriate for some, are not assumed to be appropriate for all. TDM actions will take these differences into account and provide flexibility in how actions are applied. This will be guided by taking an approach that considers the multiple intersecting identities of Vancouver residents to evaluate the impacts and benefits of proposed actions.
DRAFT TDM ACTION PLAN GOALS 1. Sustainable Modes: Increase our walking, cycling, rolling and transit mode-shares
and reduce the percentage of trips taken by vehicle. 2. Build a culture: Build a culture that celebrates and recognizes walking, cycling,
rolling and transit, enabling people to access social connections, community resources and economic opportunities without a private vehicle.
3. Collaboration: Collaborate on a range of TDM initiatives locally and regionally. 4. Monitor and Evaluate: Implement a robust monitoring and evaluation feedback loop
to drive continuous improvement in TDM programming delivered by the City or its mobility partners.
5. Equity: Ensure the needs of disproportionately impacted communities are centered in the development of TDM Actions. As much as is possible, involve those who will be directly impacted or who will benefit in the design and implementation of TDM actions.
DRAFT TDM ACTION PLAN STRATEGIES • Strategy 1: Develop the necessary foundation and mechanisms to support
successful implementation of the TDM Action Plan • Strategy 2: Launch and support programs and events that reduce private vehicle
trips and incentivize sustainable modes, including programs that are tailored to enhancing mobility options for disproportionately impacted communities.
• Strategy 3: Develop public campaigns that promote sustainable transportation options, services, and programs in ways which are culturally appropriate and accessible.
• Strategy 4: Through a dedicated employer program, provide resources and guidance to help employers shift and sustain employees and/or customers to sustainable modes and/or remote or flexible working.
APPENDIX C PAGE 3 OF 4
• Strategy 5: Partner on and lead initiatives that encourage tourists and/or event attendees to use sustainable travel options.
• Strategy 6: Support and collaborate with government TDM mobility partners to enhance and improve the coordination of local and regional sustainable transportation initiatives.
• Strategy 7: Conduct and review research in order to understand and address barriers to sustainable travel.
• Strategy 8: Advocate for effective TDM programming to be supported by all levels of government.
• Strategy 9: Expand our School Active Travel Program in collaboration with the Vancouver School Board and other educational institutions in order to build and sustain an active travel culture in schools.
• Strategy 10: Support and coordinate with other City of Vancouver and Park Board branches and departments to ensure integration of TDM principles in relevant programs, policies and initiatives.
WORK TO BE COMPLETED Short- and long-term actions have been drafted to sit under each of the 10 strategies of the TDM Action Plan. Staff from ten different branches helped in the development of the draft strategies and actions. We will be seeking feedback from external stakeholders in October 2020, and will then develop associated metrics. These actions will form the basis of our TDM programming for the next five years. An estimated 50 actions will be included in the plan, and a prioritization exercise will be undertaken to decide the timeline for developing and implementing each of the actions in order to have the most impact. This will be especially important to support Vancouver’s economic and mobility recovery following the COVID-19 pandemic.
TIMING The TDM Action Plan will be complete by the end of 2020. Work to begin developing and implementing the different actions will then take place over the next five years, starting early 2021. A timeline for implementing the different actions is still to be developed and finalized.
RESOURCES REQUIRED In order to implement the strategies and actions listed in the TDM Action Plan funding will need to be provided through the Climate Emergency Action Plan.
EXPECTED OUTCOMES The TDM Action Plan will provide strategic direction and identify key actions to be developed and implemented over the next five years (2021–2025) by the City and its mobility partners. As a result of these programs and initiatives, we expect to see a demonstrated increase in the use of sustainable transportation and a reduction in vehicle kilometres travelled.
APPENDIX C PAGE 4 OF 4
APPENDIX C-2: SCHOOL ACTIVE TRAVEL PLANNING PROGRAM
REASON FOR ACTION Schools are a priority for the City when it comes to promoting active transportation and addressing related safety issues. On the one hand, school-aged children are at an ideal age to learn and internalize sustainable transportation behaviours. On the other hand, children are particularly vulnerable to safety concerns. There is a negative feedback loop that takes place for many parents, who report they drive their children to school because they perceive the streets to be dangerous. As more children are driven to school, traffic increases and the safety concerns are exacerbated. When more people take active transportation to school, we see reductions in poor air quality and carbon emissions.
CO-BENEFITS BEYOND CLIMATE EMERGENCY TARGET In addition to reductions in carbon emissions, increasing the number of students who walk, bike, roll or take transit to school results in:
• Reduced congestion • Improved safety for children and families • Health benefits of exercise and improved air quality
WORK TO DATE The School Active Travel Planning (SATP) Program, established in 2012, attempts to break the negative feedback loop. Using a combination of infrastructure, enforcement, promotions and enabling strategies, the program helps shift perceptions and address barriers to active travel, making walking, cycling, and rolling to school normal, safe, and convenient. Over 30 schools have participated in the program since 2012. Staff consult with school communities and other stakeholders to identify transportation challenges and opportunities. Staff use this feedback alongside transportation data to develop tailored action plans. In addition to infrastructure improvements, educational and promotional initiatives are undertaken to encourage active school travel. The expansion of the SATP program is a draft strategy of the TDM Action Plan (see Appendix C-1).
RESOURCES REQUIRED In order to expand our School Active Travel Program, a strategy listed in the TDM Action Plan (see Appendix C-1), funding will need to be provided through the Climate Emergency Action Plan.
EXPECTED OUTCOMES When more children take sustainable travel to school, we will see reductions in carbon emissions and congestion, as well as improved health and safety outcomes.
APPENDIX D PAGE 1 OF 2
APPENDIX D: REMOTE AND FLEXIBLE WORK OPTIONS
REASON FOR ACTION Promoting and supporting remote and flexible work options is a popular transportation demand management (TDM) strategy to help reduce vehicle trips, congestion and carbon pollution. Arrangements where employees are able to work remotely more often or with varied hours outside of the “9 to 5” workday can help reduce congestion and resulting carbon emissions and increase opportunities to reallocate road space to active modes, due to a decrease in vehicle trips during rush hours. While this is a tactic adopted by many cities and regions across the world, the impact that remote and flexible work options can have on the transportation network became evident on a much larger scale through the COVID-19 pandemic. This unprecedented shock to our community required many organizations to shift to having their staff work remotely on very short notice. As of May 25, 2020, 30% of people in B.C. were working remotely31, compared to just 7% prior to the pandemic.32 The COVID-19 pandemic has shown that remote work can be adopted successfully on a much larger scale than previously thought, and 60% of workers now realize their job is possible to do outside of the office.33 Additionally, a survey of Canadian workers found that 53% of employees would prefer to work remotely “much more often” after the COVID-19 pandemic, and a further 23% stated they would like to work remotely “a little more often.”34 Feedback collated from the climate emergency public engagement sessions held between February and the end of May 2020 showed high interest in this action at a local level. Over 200 comments were received from Vancouver residents in support of remote and flexible working opportunities.
CO-BENEFITS BEYOND CLIMATE EMERGENCY TARGET Alternative work arrangements can help reduce congestion and carbon pollution. They can also increase opportunities to reallocate road space to active modes, due to a decrease in vehicle trips during rush hour. It’s important to note that many jobs held by disproportionately impacted communities are not possible to do outside of a physical worksite. However, with less congestion, for example on transit, and with more opportunities for space for active travel, those who need to travel to a physical worksite can have improved options. Promoting and supporting remote and flexible work options is an action listed under Strategy 4 of the TDM Action Plan (See Appendix C-1). The TDM Action Plan will embed a commitment and strategy to advancing equity by ensuring that the needs of disproportionately impacted communities are actively planned for. Regular data collection
31 https://leger360.com/wp-content/uploads/2020/05/Leger-National-weekly-pandemic-tracker-May-25-2020.pdf 32 Statistics Canada, 2016 Census 33 https://www.roberthalf.ca/en/blog/office-culture/COVID-19-and-the-workplace-employees-in-canada-weigh-in 34 https://leger360.com/wp-content/uploads/2020/05/Leger-National-weekly-pandemic-tracker-May-25-2020.pdf
APPENDIX D PAGE 2 OF 2
and engagement will help to ensure that programs and initiatives are designed to help advance equity.
WORK TO DATE Precedent research was undertaken to discover what peer cities and regions are doing in regard to remote and flexible work, and to identify best practices. In addition, data has been collated from the many surveys undertaken in Canada and beyond in recent months around commuting and remote work during the COVID-19 pandemic. Informal outreach was also carried out with some Vancouver businesses to understand the needs of the business community and how the City can best support them with long-term remote and flexible work options. Supportive guidance was identified as being helpful for local employers, and a “Remote and Flexible Work Toolkit” has been created to support businesses to understand the benefits of remote and flexible work arrangements and how to implement or formalize these practices within their organization. The toolkit was made available on the City website in August 2020 via the new Remote Work web page here: Vancouver.ca/remote-work. The toolkit was promoted in the August Greenest City newsletter, and will be shared and promoted further in fall 2020.
WORK TO BE COMPLETED Next steps include:
• Promoting the Remote and Flexible Work Toolkit to organizations through marketing and direct outreach.
• Providing additional resources, guidance and incentives to help employers shift and sustain employees to more frequent remote or flexible working, where possible and desired.
Promoting remote and flexible work options will be part of a larger employer commuting program, which sits as a strategy within the TDM Action Plan. This employer program will offer a suite of resources, services and support to employers to encourage more active and sustainable commuting, as well as trip reduction.
RESOURCES REQUIRED This action requires minimal financial resources and any costs will be part of the TDM Action Plan (see Appendix C-1). Some staff time will be required to develop the larger employer program in 2021.
EXPECTED OUTCOMES The City anticipates seeing continued adoption of remote and flexible working, and numerous businesses committing to reducing their weekday commute trips. We anticipate this will contribute to reductions in vehicle kilometres travelled and carbon emissions.
APPENDIX E PAGE 1 OF 5
APPENDIX E: ELIMINATING PARKING MINIMUMS AND INTRODUCING MORE PARKING MAXIMUMS IN NEW DEVELOPMENTS
REASON FOR ACTION Off-street parking in the City of Vancouver is regulated by the Parking By-law to balance the needs of residents, businesses, commuters and visitors. The climate emergency is shifting those needs to be more sustainable, and the Parking By-law needs to shift with it. In addition to motor vehicle parking, the Parking By-law regulates off-street bicycle parking, loading areas, and passenger pick-up spaces. However, it still has a strong focus on private vehicle parking requirements and vehicle motor parking remains a strong motivating factor for new developments, especially as it is closely related to cost and perceived marketability. These requirements are not aligned with today’s climate emergency initiatives. Parking availability and pricing is a strong influencer on people’s transportation choices, both on how to complete their daily trips and on private vehicle ownership. Focusing new developments on providing high-quality, convenient, barrier-free access for walking, cycling and transit can signal to users that these modes are easy, intuitive choices for daily trips. The updates to the Parking By-law will aim to shift the focus to supporting sustainable transportation modes first, in alignment with the City of Vancouver’s mode hierarchy: walking, cycling, transit, shared vehicles/taxis, and finally, private vehicles. This work builds on the advancements made in recent years, adds new elements to reflect our current climate, and learnings from other municipalities. This work plan outlines the steps needed to move forward with those changes.
CO-BENEFITS BEYOND CLIMATE EMERGENCY TARGET • Affordability. New off-street parking in Vancouver is typically underground, which
can cost $50,000 or more per stall, plus ongoing maintenance. This cost is transferred to the renter or owner, which can significantly add to the cost of housing. Ensuring that parking requirements match actual demand can reduce unnecessary housing costs and help align prices with the spaces that people want to utilize.
• Health. Non-auto modes tend to be more active and social, leading to a healthier lifestyle.
• Embodied Carbon in New Buildings. Big Move 5 calls for a 40% reduction of embodied carbon in new buildings and construction projects by 2030. Typically, underground parking structures can account for 12% to 20% of the embodied carbon in a new building, ranging up to 40% in extreme cases. For example, reducing parking in a concrete high-rise building from 6 parking levels to 3 parking levels can lower the overall embodied carbon of the building by 3–5%. This can also support lower rates of private vehicle ownership, which reduces embodied carbon.
• Support One Water Initiatives. Potential changes to the Parking By-law could improve groundwater management and rainwater infiltration opportunities.
APPENDIX E PAGE 2 OF 5
• Support changing regulations to further enable bike parking retrofits. The Parking By-law currently allows for conversions, however, seeking a permit to convert motor vehicle parking to bicycle parking can be cumbersome, complicated, and can present a barrier to building owners and managers. Changes to the Parking By-law will better enable this option to reduce red tape and simplify this process. There will also be a component of education and promotion to developers and owners that this option is available.
• Support increased mode shift in current and emerging planning areas. These present opportunities for bold change, calling for a sustainable mode split of 80%. Changes to the Parking By-law will help meet that target by enhancing requirements that support sustainable modes, such as prioritizing high-quality bike parking, promoting transit usage, providing space for car share, and promoting district and unbundled parking.
WORK TO DATE Several Greenest City Scholar research projects have been produced:
• “Secure Bike Parking in Vancouver: Local & Regional Context, Best Practices, and Recommendations for an EasyPark Pilot” (2014)
• “Coming To A Stop: All Ages and Abilities Bicycle Parking in New and Existing Development” (2015)
• “Form Follows Parking: Using Shared Parking to Mitigate Negative Impacts of Excess Parking” (2015)
Research has also recently been conducted to support the 2018 Parking By-law updates, the West End Parking Plan, and the Broadway Plan. This includes surveying publicly accessible buildings, reviewing historical documents on microfiche, and conducting surveys with commuters to enhance our understanding of current off-street parking supply and occupancy. This policy update will prioritize equity, as well as high-quality walking, cycling and transit accessibility; starting and ending a trip should be comfortable and convenient for everyone. The vision for these Parking By-law updates is below.
DRAFT GOALS FOR UPDATED OFF-STREET PARKING 1. Prioritize building space and investment for transportation that align with the
hierarchy of modes—walking, cycling, transit, car share/taxis, private vehicles. 2. An intersectional approach to policy-making, that puts race forward, centres
Indigeneity, and values the lived experience of Vancouverites. 3. Where motor vehicle parking is provided, prioritize zero emissions vehicles
(ZEVs) over internal combustion engine (ICE) vehicles. 4. Simplify requirements to be more understandable. 5. Improve affordability by reducing expensive requirements for parking. 6. Reduce embodied carbon in buildings and improve groundwater management.
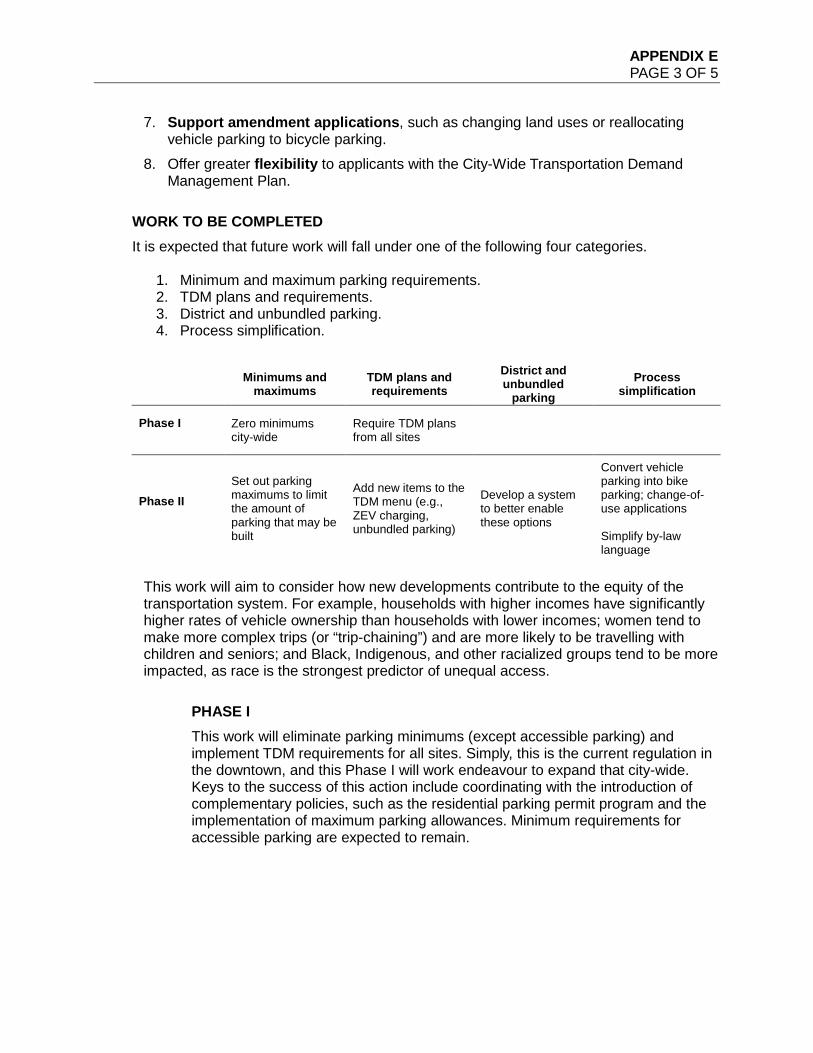
APPENDIX E PAGE 3 OF 5
7. Support amendment applications, such as changing land uses or reallocating vehicle parking to bicycle parking.
8. Offer greater flexibility to applicants with the City-Wide Transportation Demand Management Plan.
WORK TO BE COMPLETED It is expected that future work will fall under one of the following four categories.
1. Minimum and maximum parking requirements. 2. TDM plans and requirements. 3. District and unbundled parking. 4. Process simplification.
Minimums and maximums
TDM plans and requirements
District and unbundled
parking Process
simplification
Phase I
Zero minimums city-wide
Require TDM plans from all sites
Phase II
Set out parking maximums to limit the amount of parking that may be built
Add new items to the TDM menu (e.g., ZEV charging, unbundled parking)
Develop a system to better enable these options
Convert vehicle parking into bike parking; change-of-use applications Simplify by-law language
This work will aim to consider how new developments contribute to the equity of the transportation system. For example, households with higher incomes have significantly higher rates of vehicle ownership than households with lower incomes; women tend to make more complex trips (or “trip-chaining”) and are more likely to be travelling with children and seniors; and Black, Indigenous, and other racialized groups tend to be more impacted, as race is the strongest predictor of unequal access.
PHASE I This work will eliminate parking minimums (except accessible parking) and implement TDM requirements for all sites. Simply, this is the current regulation in the downtown, and this Phase I will work endeavour to expand that city-wide. Keys to the success of this action include coordinating with the introduction of complementary policies, such as the residential parking permit program and the implementation of maximum parking allowances. Minimum requirements for accessible parking are expected to remain.
APPENDIX E PAGE 4 OF 5
PHASE II TDM updates Further research will be required to better understand other innovative cities’ parking policies and their efficiency in meeting sustainability goals. The TDM model will be reviewed in the context of zero minimums and future parking maximums. New metrics may be required to better measure the performance of a new development in the context of the TDM. Some options that may be explored include:
• Quantifying embodied carbon for parking structures. • A sliding scale for variable parking maximums. • Family-friendly measures. • Improved performance tracking post-occupancy.
Parking Maximums
There is a traditional perception that housing requires parking. However, early occupancy surveys suggest that supply generally outweighs demand and that parking vacancy rates are high. Particularly in higher-end buildings, it has been observed that excess parking is built for the purpose of attracting potential buyers. The concepts of maximum parking allowances, district parking and unbundled parking will be key tools in managing the supply and demand balance. Modernizing Vancouver’s off-street parking policy means building infrastructure that prioritizes conveniences in alignment with the modal hierarchy—sustainable transportation modes will be emphasized in new developments, which may result in trade-offs for the private motor vehicle experience. This essential piece of work involves significant research and modelling and will require engaging with a third-party consultant. Process Simplification The current by-law is complicated. This work aims to simplify and modernize the by-law to align with today’s priorities. Much of this will be improved with the elimination of parking minimums and the introduction of TDM requirements throughout the city, and it will be refined through the broader updates to the TDM policy and the implementation of parking maximums. This will make it easier for potential applicants to understand the requirements, and will streamline the process for amendment applications, for example, changes of use or applications to retrofit existing motor vehicle parking into bike parking.
TIMING Phase I – Eliminate Minimum Parking Requirements Early 2021 Phase II – Recommend Maximum Parking Requirements 2021+
APPENDIX E PAGE 5 OF 5
RESOURCES REQUIRED Additional resources will be required to support the research, development and implementation of the plan. Many of the initiatives noted above were included in previous City strategic plans, but the only initiatives that have advanced to date had a more targeted approach. Dedicated resources will enable this work to advance with the intention and urgency demanded by the climate emergency. The determination of parking maximums will require working with a third-party consultant, significant staff support, and public engagement. We will undertake a research project to better understand how the implementation of maximum parking restrictions would impact developments and people’s transportation choices.
EXPECTED OUTCOMES • People feel more empowered to walk, cycle, take transit and participate in a shared-
vehicle system.
• Improved infrastructure for walking, cycling, transit and shared vehicles.
• Fewer motor vehicle parking spaces get built.
• The vehicle parking that does get built supports EV charging.
• Broad-sweeping changes that simplify the Parking By-law.
• Older buildings elect to modernize their parking structures to better support walking and cycling.
• New and innovative measures are implemented to incentivize walking, cycling, transit and car sharing in new developments.
• Improved mode-share and reduced reliance on private motor vehicle ownership in new developments.
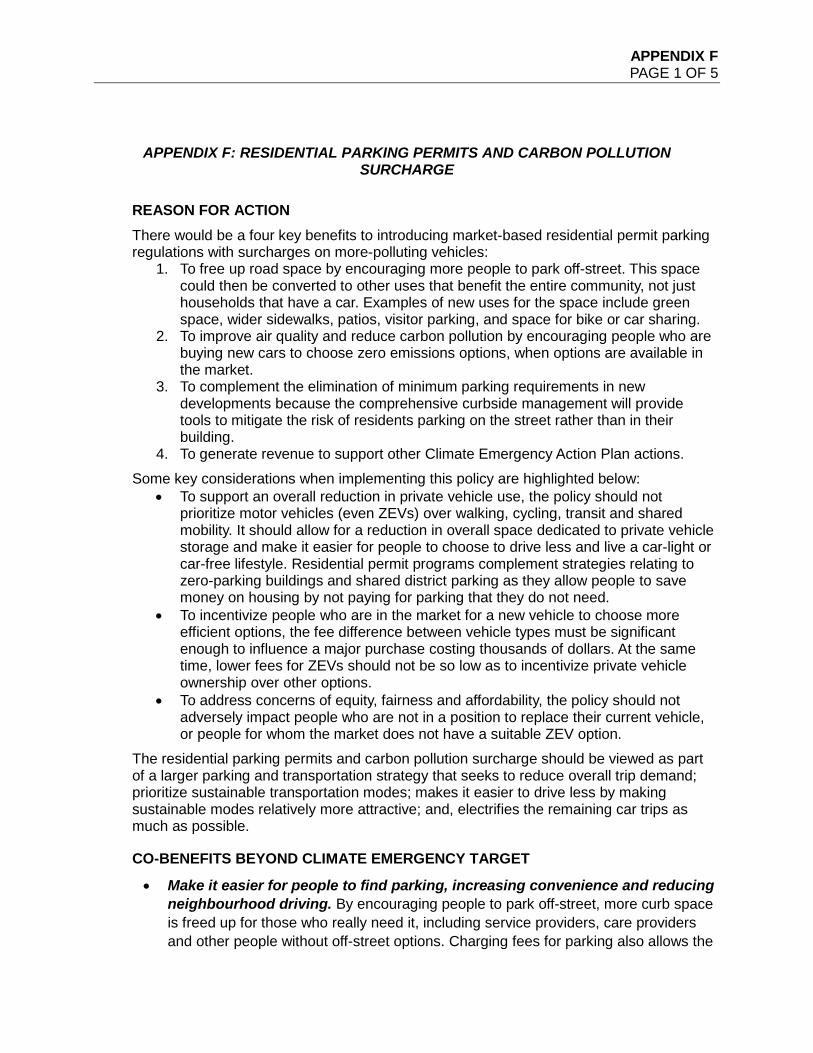
APPENDIX F PAGE 1 OF 5
APPENDIX F: RESIDENTIAL PARKING PERMITS AND CARBON POLLUTION SURCHARGE
REASON FOR ACTION There would be a four key benefits to introducing market-based residential permit parking regulations with surcharges on more-polluting vehicles:
1. To free up road space by encouraging more people to park off-street. This space could then be converted to other uses that benefit the entire community, not just households that have a car. Examples of new uses for the space include green space, wider sidewalks, patios, visitor parking, and space for bike or car sharing.
2. To improve air quality and reduce carbon pollution by encouraging people who are buying new cars to choose zero emissions options, when options are available in the market.
3. To complement the elimination of minimum parking requirements in new developments because the comprehensive curbside management will provide tools to mitigate the risk of residents parking on the street rather than in their building.
4. To generate revenue to support other Climate Emergency Action Plan actions. Some key considerations when implementing this policy are highlighted below:
• To support an overall reduction in private vehicle use, the policy should not prioritize motor vehicles (even ZEVs) over walking, cycling, transit and shared mobility. It should allow for a reduction in overall space dedicated to private vehicle storage and make it easier for people to choose to drive less and live a car-light or car-free lifestyle. Residential permit programs complement strategies relating to zero-parking buildings and shared district parking as they allow people to save money on housing by not paying for parking that they do not need.
• To incentivize people who are in the market for a new vehicle to choose more efficient options, the fee difference between vehicle types must be significant enough to influence a major purchase costing thousands of dollars. At the same time, lower fees for ZEVs should not be so low as to incentivize private vehicle ownership over other options.
• To address concerns of equity, fairness and affordability, the policy should not adversely impact people who are not in a position to replace their current vehicle, or people for whom the market does not have a suitable ZEV option.
The residential parking permits and carbon pollution surcharge should be viewed as part of a larger parking and transportation strategy that seeks to reduce overall trip demand; prioritize sustainable transportation modes; makes it easier to drive less by making sustainable modes relatively more attractive; and, electrifies the remaining car trips as much as possible.
CO-BENEFITS BEYOND CLIMATE EMERGENCY TARGET
• Make it easier for people to find parking, increasing convenience and reducing neighbourhood driving. By encouraging people to park off-street, more curb space is freed up for those who really need it, including service providers, care providers and other people without off-street options. Charging fees for parking also allows the
APPENDIX F PAGE 2 OF 5
City to better manage spaces, using pricing and other tools to ensure sufficient spaces are always available where needed—so that people do not need to “cruise” the neighbourhood in search of parking.
• Make it easier to convert on-street parking spaces to other uses that benefit the entire community. Today, nearly a third of Vancouver’s street space is dedicated to parking. This space provides little value for the more than 25% of Vancouver households that do not own a motor vehicle. By encouraging more people to park off-street, curb space is freed up for other uses that benefit the entire community and bring more distributional equity to the use of the space.
Examples of other uses include green infrastructure, mini parks or other public space, wider sidewalks, safer cycling infrastructure, outdoor seating and patios, and shared mobility (e.g., car-share spaces or bike-share stations). These other uses support other City goals and help to build safer, healthier, happier and more resilient communities.
• Encourage a reduction in private vehicle ownership. A significant amount of the City’s public space today is dedicated to the storage of privately owned automobiles. Although many people see these spaces as a “free resource,” the cost is significant when one considers other potential uses of the land, and that the costs are subsidized by many households that do not even own a car. Charging for parking makes these hidden costs more visible, encouraging people to consider other mobility options. Currently, only about 10% of residential streets in Vancouver have some form of residential permit parking regulations.
• Support increased housing affordability by enabling people to purchase or rent homes without also paying for parking they do not need. Most developments today have minimum parking requirements, with parking being a “hidden” charge that can add significantly to housing costs, such as rent or mortgage. For example, an underground parking stall can cost around $50,000 to build.
There is resistance to provide buildings with reduced parking requirements today, or to separate the cost of housing from the cost of parking when the nearby streets are unregulated. The concern is that people will simply “park on the street” for free, adding congestion and inconvenience to the neighbourhood. This concern is called “spillover” parking. By regulating curb space everywhere, the City can eliminate the risk of spillover, and allow more car-free housing options.
WORK TO DATE Modelling is currently being carried out to study the impact different parking permit rates would have on transportation behaviour (e.g., modes people choose and where people who drive park), vehicle purchasing decisions, overall ownership, and emissions. A global study of residential parking permit best practices was conducted in 2016 through the Greenest City Scholar program. Staff are following up with jurisdictions that have implemented residential parking permits and/or differential pricing for vehicles based on emissions, including Sydney (Australia) and Montreal.
APPENDIX F PAGE 3 OF 5
Innovative residential parking policies were recently implemented in Vancouver’s West End, to help address significant on-street parking challenges. Innovations include increasing residential parking permit rates to more closely reflect off-street market pricing (while providing exemptions for low-income households) to encourage more people to park off-street, and creating North America’s first “residential parking benefit district,” where the increase in revenue is used for neighbourhood improvement projects selected by the community through a participatory budgeting process. Staff are studying the effectiveness of this program and its potential application in other parts of the city.
DRAFT GOALS FOR RESIDENTIAL PARKING PERMITS 1. Prioritize walking, cycling, transit and shared mobility options over private vehicles,
and an overall reduction in private vehicle ownership. 2. Enable the continued conversion of on-street parking into other uses to support city-
planning priorities. 3. Enable the elimination of minimum parking requirements in new developments. 4. Encourage people purchasing new vehicles to choose zero emissions options. 5. Encourage people who continue to own private vehicles to park off-street, if possible. 6. Reduce “cruising for parking” by using pricing to ensure spaces are always readily
available. 7. Consider the needs of visitors, including contractors, and service and care providers. 8. Consider impacts on overall housing and transportation affordability, and low-income
households who require private vehicle ownership.
WORK TO BE COMPLETED Introducing a residential parking permit system is a significant change for Vancouver residents. Accordingly, this program will have to be implemented in an incremental, phased manner. Phase I – Initial city-wide rollout In this phase of work, a low-cost permit parking system will be implemented across all Vancouver neighbourhoods. This first step into the program will introduce the concept that on-street parking spaces have value to the general population in a manner that does not cause significant hardship relative to the overall cost of operating a vehicle. In the early stages, staff plan to finalize the details of the initial city-wide rollout, including:
• Permit zone size. • Times that permits will be required. • Permit cost (which could vary based on vehicle age, cost and/or emissions, supply
and demand of spaces, whether it is a first or second permit, household income, etc.).
• Permit eligibility (some types of household could be ineligible, depending on building type and age, building covenants, whether off-street spaces are available, etc.).
• Visitor parking considerations. • Manner in which permits will be sold.
APPENDIX F PAGE 4 OF 5
• Manner in which permits will be enforced. Stakeholder engagement will take place alongside a broader city-wide communications effort to support this work. A report will then be brought forward to Council to amend all policies and by-laws required to implement the program. Subject to Council approval, the administrative and enforcement systems will be finalized prior to the permit system going live across the city in a staggered, neighbourhood-by-neighbourhood fashion. Functionally, this phase is not expected to impact the manner in which existing permit zones in the city are administered. However, recognizing that the cost of parking permits issued today is significantly below market-value, the City will begin to raise prices at a higher than inflationary rate to mitigate the amount of change required during the next phase of this project. Additionally, outdated mechanisms, such as “Resident Parking Only” areas, may be affected. Phase II – Transition to a market-based system To properly manage parking on residential streets, the City will need to transition to a market-based system where the price of a permit fluctuates based on supply (e.g., parking spaces removed to provide more green space) and demand (e.g., a newly constructed residential building). The pricing in this system should be set in a performance-based manner that optimizes parking availability for residents. As a market-based system may require the use of higher-priced permits to affect behavioural change, the City will need to consider how to implement methods, such as discounts, that take into account income and disability concerns. This phase will also require refinements to surcharges placed on gas and diesel vehicles. Implementing a system that incorporates surcharges based on emissions requires additional considerations, including: (a) effectiveness in supporting a reduction in overall private vehicle use and ownership, (b) strength as an incentivize to discourage people who are in the market for a new vehicle from purchasing higher-polluting vehicles when ZEV options exist, and (c) concerns regarding equity, fairness, and overall affordability.
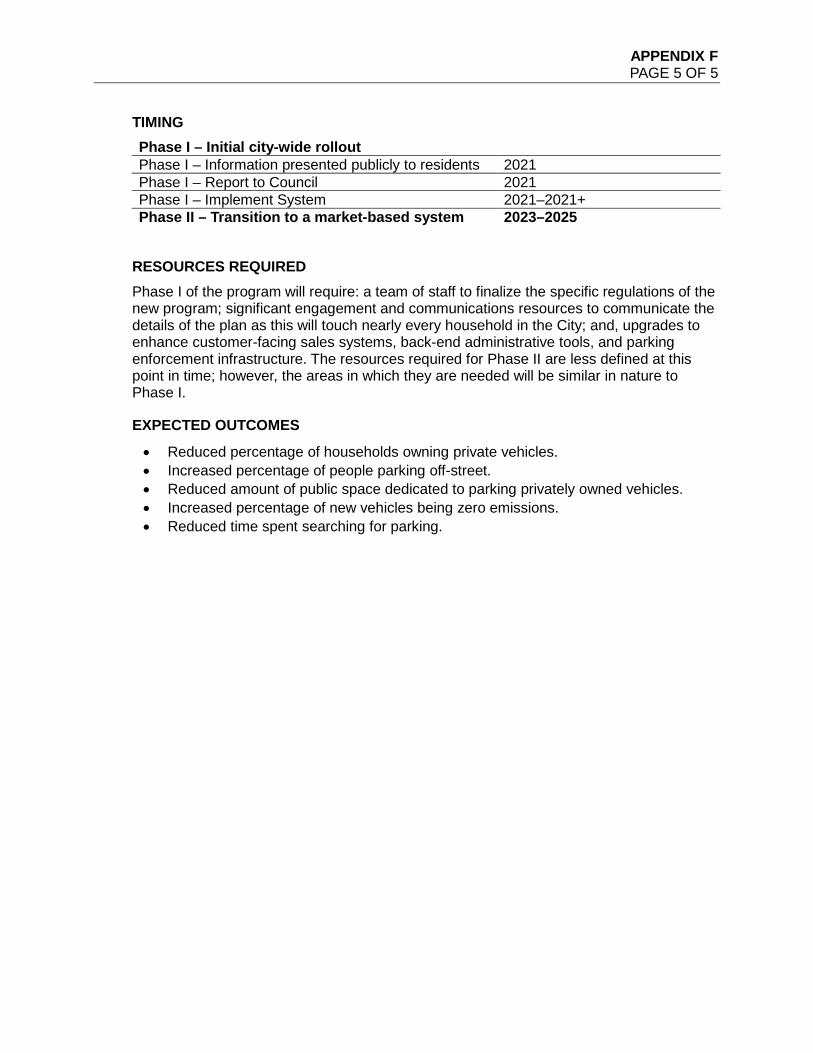
APPENDIX F PAGE 5 OF 5
TIMING Phase I – Initial city-wide rollout Phase I – Information presented publicly to residents 2021 Phase I – Report to Council 2021 Phase I – Implement System 2021–2021+ Phase II – Transition to a market-based system 2023–2025
RESOURCES REQUIRED Phase I of the program will require: a team of staff to finalize the specific regulations of the new program; significant engagement and communications resources to communicate the details of the plan as this will touch nearly every household in the City; and, upgrades to enhance customer-facing sales systems, back-end administrative tools, and parking enforcement infrastructure. The resources required for Phase II are less defined at this point in time; however, the areas in which they are needed will be similar in nature to Phase I.
EXPECTED OUTCOMES
• Reduced percentage of households owning private vehicles. • Increased percentage of people parking off-street. • Reduced amount of public space dedicated to parking privately owned vehicles. • Increased percentage of new vehicles being zero emissions. • Reduced time spent searching for parking.
APPENDIX G PAGE 1 OF 6
APPENDIX G: EXPANDING THE PUBLIC CHARGING NETWORK
OVERVIEW The City will expand the availability of public electric vehicle charging near people’s homes and destinations. Completion of this action is comprised of two components: 1. Densifying the network of charging points installed under the mandate of the 2016 EV
Ecosystem Strategy. These will add charging at complementary amenities across the city. Priority will be given to neighbourhoods with higher rates of residents renting their homes, lower amounts of existing infrastructure, and/or lower rates of electric vehicle adoption.
2. Creating a Neighbourhood Charging Strategy (NCS) that will build on the “backbone” of conventional public charging. The NCS will include various pilot projects that will allow residents to charge near their homes, with a focus on overnight charging.
Making the transition to electric vehicles equitable is essential to its success. There are positive and negative implications to equity that are considered in this action plan.
OBJECTIVES
This action plan seeks to provide a variety of charging modes that will appeal to different lifestyles, urban forms and driving patterns. More importantly, it seeks to provide charging to those who do not have foreseeable access to home charging because they rent their home, they live in multi-family buildings where they cannot add charging for one reason or another, or they lack a dedicated off-street parking stall. The required tasks are:
1. To expand the number of public charging opportunities for residents without foreseeable access to home charging.
2. To create a user experience that will encourage a shift from internal combustion to electric vehicles.
3. To determine the scale of charging required to meet 2030 ZEV objectives. 4. To ensure that all areas of the city are served equitably by public charging
infrastructure by continuing to deploy “conventional” Level 2 and DC Fast Charging infrastructure.
5. To ensure that all residents of the city are treated equitably in their ability to access charging infrastructure and to transition to electric vehicles.
PROPOSED ACTIONS/SCOPE Expanding the public charging network will be comprised of the following elements. Tasks indicated below are referenced in the subsequent Schedule. :
1. Completing pilot projects that will test novel approaches to public charging, including:
APPENDIX G PAGE 2 OF 6
a. Enabling overnight or weekend charging at under-utilized, third-party parking areas near homes. (Task 4)
b. Light-pole charging. (Task 1) 2. Publishing guidance for residents to use cord covers, allowing for extension cords
to cross sidewalks when charging. (Task 2) 3. Testing and implementing new user-fee structures, with a focus on equity and
convenience. (Tasks 1, 4, 5) 4. Conducting studies to determine the necessary scale of charging deployments that
will support 2030 EV adoption targets. (Tasks 1, 3, 4) 5. Ongoing engagement with the community and key stakeholders (Tasks 2b and 4a,
with additional engagements as deemed necessary. 6. Identifying sites and deploying DCFC and Level 2 infrastructure. (Task 3) 7. Researching the role that building code and Parking By-law updates might have in
supporting near-home charging (Task 4f). 8. Deploying curbside electrical infrastructure in high-value areas that can allow the
film, food truck, and other diesel generator-reliant industries to electrify their operations. (Task 5)
Out of Scope
• Public e-bike charging.
• Extending the 2017–2019 residential curbside charging pilot project.
RATIONALE FOR ACTION PLAN Access to convenient charging is considered a key determinant of mainstream electric vehicle (EV) adoption. In Canada, approximately 70% of charging occurs at home, but 57% of Vancouver residents lack access or the means to gain access to home charging. Moreover, the majority of Vancouverites rent their homes and/or live in multi-family dwellings, giving them less control over installation of EV charging in a home parking stall. Over the past several years, the City has built a backbone of public charging based on Level 2, and increasingly, on DC Fast Charging. This network must now be expanded further into neighbourhoods with limited access to home charging and not already well-served by public charging. The network expansion will serve the growing number of EV users and create a more resilient network. Home retrofits can also be costly in all housing forms. For some residents, providing access to some public charging may allow them to switch to an EV in the short term without having to undertake these additional costs at the same time. Providing near-home charging through the neighbourhood charging strategy will reduce congestion at charging locations at public amenities. Creating guidance for Level 1 extension cord covers will align with guidance created by the City of Seattle in 2019. By creating such guidance, the City will set reasonable safety
APPENDIX G PAGE 3 OF 6
boundaries for a low-cost support for charging, which in turn will greatly reduce the pressure on the publicly owned and operated charging network. Identifying new fee structures will allow for overnight charging and lower, more equitable pricing. Existing fee structures are intended to encourage turnover at charging stations and minimize idle time. New fees could be designed to support overnight or other off-peak charging. This, in turn, would align with any changes to BC Hydro rates that may allow residents to take advantage of lower overnight electricity rates. The light-pole charging pilot will coordinate with the City’s LED retrofit program, using our existing infrastructure to reduce on-street clutter. It will further attempt to minimize the footprint of public charging by piloting equipment that uses removable (user-carried) cables. Near-home, off-street parking pilots will include working with site owners of off-street parking lots that are under-utilized overnight or at other regular, off-peak times. Potential participants include places of worship, schools, and offices. Accessing these parking areas can provide low-power, overnight charging for nearby residents and reduce the cost of installing additional charging points. The film industry and food trucks, along with a number of other industries that operate in the public realm, are often reliant on diesel generators for a significant amount of power. This translates into elevated carbon emissions, noise and poorer air quality. Providing electrical connections to support these mobile industries will benefit the workers in those industries and the public in general.
CO-BENEFITS Expanding the public charging network has a number of co-benefits to consider as well. These include:
• Near-home charging reduces need to drive just for charging, decreasing vehicle kilometres travelled and number of driving trips.
• Expanded charging network improves resilience of charging network. o COVID-19 has shown that facility closures have significant impact on user
experience. More options that are not attached to specific City facilities are one way to mitigate this issue.
o Low-power and off-peak charging options being considered in the Neighbourhood Charging Strategy will reduce grid peaks, in turn supporting BC Hydro in managing their system and potentially reducing upward pressure on electricity rates.
• Increased charging access in the public realm reduces the cost impact to new EV adopters (avoided electrical retrofit costs). There are also equity implications by allowing more people to access the EV market (see below).
• Reduced use of internal combustion for transportation or stationary power reduces noise, and improves air quality and the public realm.
APPENDIX G PAGE 4 OF 6
EQUITY IMPLICATIONS Electric vehicles presently cost significantly more to purchase than their internal combustion engine equivalents, keeping them out of reach for many low- and middle-income households. However, vehicle prices continue to fall, and the market for used EVs exists now, and will continue to grow. Many independent studies suggest that EVs will reach cost parity with internal combustion engines at various points in the 2020s, depending on vehicle type. It is already well established that residential electricity rates represent an 80–90% reduction in fueling costs over gasoline, and EV maintenance needs are also significantly lower. Enabling those who are car-reliant and who struggle with energy costs to switch to an EV could have positive affordability benefits. This action seeks to enable, as much as possible, electric vehicle adoption for residents who previously have not had the means to switch. It also seeks to avoid locking residents without home charging into exclusively using the existing public charging network of Level 2 and DC Fast Charging at amenities and rest stops. The public charging network is necessarily more expensive to use than residential electricity, and often lacks the convenience of home charging. Creating near-home, lower-power and potentially lower-cost charging will level the playing field for many residents wishing to switch. The additional flexibility of new charging opportunities that will be introduced with this action may increase the acceptance of EVs by new market participants, allowing them to benefit from ZEV incentives offered in the Zero Emissions Parking Plan. To date, public charging in Vancouver has not effectively considered different mobility needs. Expanding the network further without this consideration could create additional disparity; conversely, a new expansion of the charging network is an opportunity to provide more accessible charging points. The option to enhance this work with other ancillary power supports may also be investigated.
WORK TO DATE • Project charter for NCS completed.
• Completed light-pole charging feasibility study.
• Engaged with technical experts and stakeholders on broad tactical considerations for NCS.
• Reviewed Seattle Guidance for Level 1 cords internally and engaged with City of Seattle.
• Initial engagement with Vancouver School Board on pilot locations for near-home charging.
• Ongoing peer learning engagement with Urban Sustainability Directors Network (USDN) participant cities with respect to curbside and near-home charging.
WORK TO BE COMPLETED • Draft Level 1 guidance.
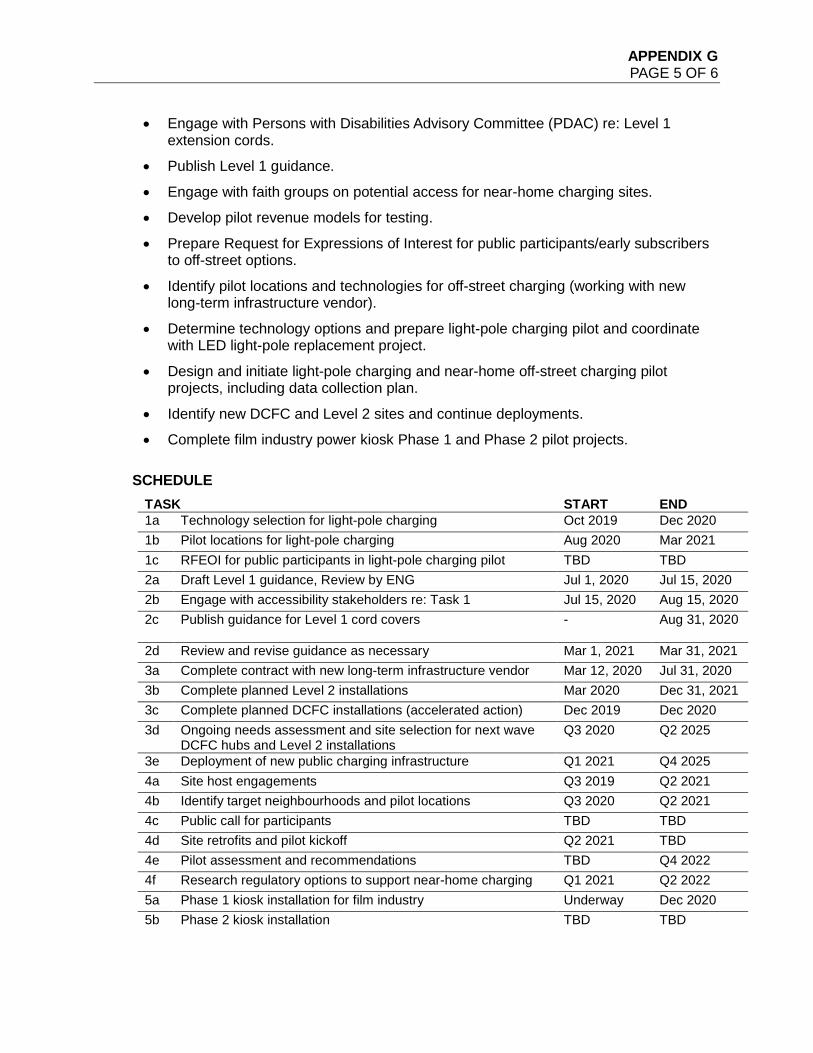
APPENDIX G PAGE 5 OF 6
• Engage with Persons with Disabilities Advisory Committee (PDAC) re: Level 1 extension cords.
• Publish Level 1 guidance.
• Engage with faith groups on potential access for near-home charging sites.
• Develop pilot revenue models for testing.
• Prepare Request for Expressions of Interest for public participants/early subscribers to off-street options.
• Identify pilot locations and technologies for off-street charging (working with new long-term infrastructure vendor).
• Determine technology options and prepare light-pole charging pilot and coordinate with LED light-pole replacement project.
• Design and initiate light-pole charging and near-home off-street charging pilot projects, including data collection plan.
• Identify new DCFC and Level 2 sites and continue deployments.
• Complete film industry power kiosk Phase 1 and Phase 2 pilot projects.
SCHEDULE TASK START END 1a Technology selection for light-pole charging Oct 2019 Dec 2020 1b Pilot locations for light-pole charging Aug 2020 Mar 2021 1c RFEOI for public participants in light-pole charging pilot TBD TBD 2a Draft Level 1 guidance, Review by ENG Jul 1, 2020 Jul 15, 2020 2b Engage with accessibility stakeholders re: Task 1 Jul 15, 2020 Aug 15, 2020 2c Publish guidance for Level 1 cord covers -
Aug 31, 2020
2d Review and revise guidance as necessary Mar 1, 2021 Mar 31, 2021 3a Complete contract with new long-term infrastructure vendor Mar 12, 2020 Jul 31, 2020 3b Complete planned Level 2 installations Mar 2020 Dec 31, 2021 3c Complete planned DCFC installations (accelerated action) Dec 2019 Dec 2020 3d Ongoing needs assessment and site selection for next wave
DCFC hubs and Level 2 installations Q3 2020 Q2 2025
3e Deployment of new public charging infrastructure Q1 2021 Q4 2025 4a Site host engagements Q3 2019 Q2 2021 4b Identify target neighbourhoods and pilot locations Q3 2020 Q2 2021 4c Public call for participants TBD TBD 4d Site retrofits and pilot kickoff Q2 2021 TBD 4e Pilot assessment and recommendations TBD Q4 2022 4f Research regulatory options to support near-home charging Q1 2021 Q2 2022 5a Phase 1 kiosk installation for film industry Underway Dec 2020 5b Phase 2 kiosk installation TBD TBD
APPENDIX G PAGE 6 OF 6
RESOURCES REQUIRED Densifying the network of charging points and creating a Neighbourhood Charging Strategy requires a number of actions as outlined above, including pilot projects, developing guidance documents, studies and other research, and public engagement. While most of the can be accomplished with current staff, additional staff will likely be needed primarily to support engagement and communications in the early parts of the plan; some additional resources for administering ongoing pilot projects may also be identified during the development of the Neighbourhood Charging Strategy. Funding would need to be provided through the Climate Emergency Action Plan.
GLOSSARY OF TERMS Level 1 Charging: Low-power charging, operates off of a standard 120 V wall outlet. Technically requires that the outlet have a dedicated circuit, but most wall outlets will allow a vehicle to charge. Provides approximately 7 km of vehicle range per connected hour. Ideal for longer duration stays, such as overnight charging. Level 2 Charging: Also known as AC Level 2, this is charging that typically delivers about 7 kW of power at 208 V/240 V, and nominally provides 30 km of vehicle range per connected hour. Ideal for medium-duration stays of 2–3 hours, although is often used in home charging (i.e., overnight) charging as well. DC Fast Charging: Charging that nominally delivers 50 kW of power, or nominally about 200–300 km of range per hour (480 V). Also known as “DCFC”. Actual charging speeds are limited by the capabilities of different vehicle models. Ideal for short-term stays (i.e., 30–60 minutes). Super-Fast Charging: Higher-powered DC Fast Charging that delivers over 100 kW, up to as high as 250 kW. This equates to providing 200–300 km in 10–30 minutes. These stations tend to be larger than others. Most EV models presently available are not capable of charging at over 80 kW. Ideal for the shortest-term stays (i.e., under 15 minutes).
APPENDIX H PAGE 1 OF 5
APPENDIX H: ELECTRIC VEHICLE CHARGING ON PRIVATE PROPERTY ACTION PLAN
OVERVIEW The ability to charge a vehicle while it is parked during other activities is a key part of the City’s “ecosystem” approach to electric vehicle charging. The City already requires that 100% of new residential parking stalls, excluding visitor stalls, be equipped with EV charging infrastructure. We also presently require that 10% of stalls in new commercial buildings have charging infrastructure. Off-street charging is also important to other transportation planning needs, by reducing curb space that includes bike-share and other micro-mobility, parklets and patios, and various loading area needs. This action seeks to expand our current requirements for new construction in non-residential buildings; encourage gas stations and parking lots to provide charging infrastructure; and, support home retrofits in rental buildings. Completion of this action is comprised of 4 components:
1) Updating the Parking By-law with new construction requirements for all types of non-residential buildings.
2) Providing support to rental buildings to install EV charging for individual tenants in rental buildings.
3) Encouraging electric vehicle charging in gas stations and parking lots. 4) Developing a retrofit plan for existing residential buildings.
OBJECTIVES This action plan has the following objectives:
• Enable more workplace and public charging in all non-residential building types.
• Encourage rental buildings to install charging infrastructure for use by their tenants.
• Increase the deployment of public charging by non-City entities.
• Increase the amount of home charging available through retrofitting existing residential buildings.
PROPOSED ACTIONS/SCOPE This action plan will include the following elements:
1. Completing a study identifying different user needs, charging configurations, and associated costs for charging infrastructure for all types of new, non-residential buildings. (Task 1a)
2. Designing a flexible compliance mechanism to apply new construction standards to all forms of non-residential buildings listed in the Parking By-law. (Task 1b)
3. Engaging the development industry. (Task 1c)
APPENDIX H PAGE 2 OF 5
4. Developing a program to support to rental buildings in installing EV charging for individual tenants. (Task 2)
5. Completing analyses and engaging industry stakeholders and experts to determine adjustments to business license classifications and fees that encourage public charging at gas stations and parking lots, how much EV charging infrastructure they would have to install, and timing of implementation. (Task 3a)
6. Updating definitions for gas stations in the Zoning and Development By-law and the License By-law, such that EV charging is allowed at gas stations. Increasing consistency of definitions in the License By-law and Zoning and Development By-law may also be in scope. (Task 3b)
7. Adjusting business license classifications to encourage the installation of public charging infrastructure at gas stations and parking lots, as determined by item 5. (Task 3c)
8. Developing a long-term retrofit strategy for EV charging in existing buildings. (Task 4)
Out of Scope The following activities will not be included in this work:
• Updates to new construction requirements for residential buildings.
• Updates to the large rezoning policy requirements for electric vehicle charging infrastructure.
• Changes to parking requirements except for EV charging infrastructure.
RATIONALE FOR ACTION PLAN The City presently requires 10% of parking stalls in commercial buildings to have Level 2 infrastructure, in addition to residential charging requirements. This action will expand the amount of electric vehicle charging available outside of the public realm. The amount of power that charging infrastructure can provide is directly linked to the “speed” of charging. However, more powerful charging can increase the size of the electrical service to a building, increasing costs of construction and impacts to the utility. It is therefore important to consider how long users’ vehicles typically remain at a building, and to consider whether a large number of low-power charging stations may be more appropriate than a smaller number of high-powered charging stations. The City’s present requirements are most conducive to the deployment of infrastructure for shorter-term parking, such as in a retail mall. However, this is not necessarily a cost-effective deployment for most users: for example, people commuting to work by EV might prefer to charge slowly over the course of a workday at their workplace. Further, present requirements only consider commercial buildings as a whole, and do not consider various differences in commercial uses, or the needs of institutional or industrial buildings. This action plan will allow for the most efficient, lowest-cost deployment of charging infrastructure in all building types.
APPENDIX H PAGE 3 OF 5
Because of the variety of non-residential buildings and potential users of these buildings, coupled with changes to a building’s use that may occur over the course of the development process, this action plan will seek to create flexible requirements that will best suit the eventual users of charging infrastructure over the life of the building. Existing buildings are challenged by higher costs to retrofit with EV charging infrastructure, compared with new construction: in some cases, retrofit costs can be up to ten times what they would be in new buildings. This situation may be further exacerbated in rental buildings where the business case for landlords to install charging infrastructure is less certain. We will develop a program that will result in the installation of more EV charging infrastructure in existing rental buildings, to provide at-home charging access for individual tenants. Encouraging electric vehicle charging at gas stations and parking lots could be an important tool to make more charging available without relying on City investments. We will implement this through business licensing, which will require collaboration with Development, Buildings and Licensing. Specifics around potential licensing structures, the timing of requirements, and the amount of EV charging required have yet to be determined. To illustrate a potential approach, there could be different classifications and rates for zero emissions vs. non-zero emissions business licenses for gas stations, with a premium charged for the non-zero emissions classification to encourage them to install a specified level of charging. The idea would be to incentivize the installation of EV infrastructure while providing a feasible non-zero emissions option in case it is not possible for the business owner to install EV charging. Engagement and analysis will help determine factors such as the prices for different business licences, when the differentiated classifications would be implemented, and how much EV charging infrastructure they would need to install. Throughout the exploration and design phases, we will ensure that this approach is simple for applicants to understand, as well as for City staff to administer. The definitions for gas stations in our by-laws do not currently allow for EV charging infrastructure. As a result, this project will include an update of those definitions to ensure that EV charging is allowed. In terms of precedents, at least Petro Canada, Shell, Superstore and Canadian Tire are already starting to move in this direction with some of their operations across Canada. Also, Germany recently announced that they would be requiring all gas stations in the country to install EV charging as part of their COVID-19 recovery efforts. To ensure that the transition to EVs is equitable, we must enable the maximum number of Vancouverites to transition to EVs that suits their needs. This, in turn, means maximizing home, and as necessary, workplace charging. In order to meet the City’s combined goals of 50% vehicle kilometres travelled in zero emissions vehicles by 2030 and 100% renewable transportation before 2050, this will require the retrofit of many existing buildings that are not equipped, or not adequately equipped, with charging infrastructure. This action commits to determining a retrofit strategy for existing buildings to be required or incentivized to install EV charging infrastructure.
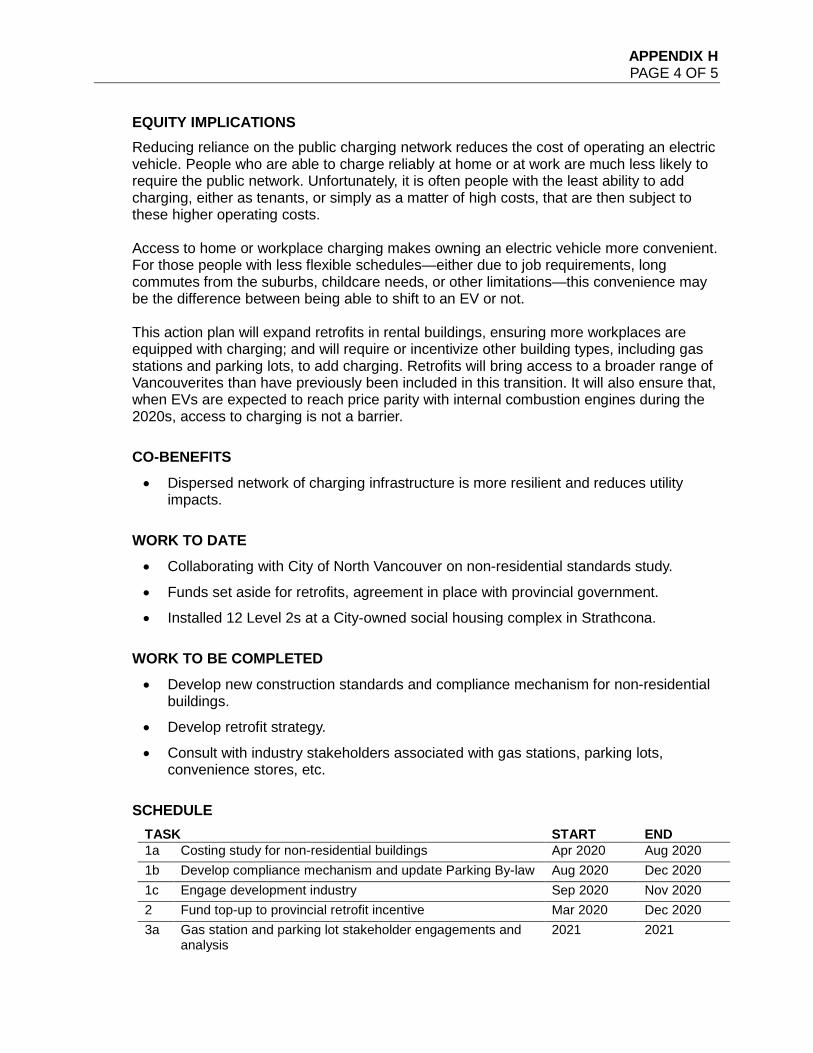
APPENDIX H PAGE 4 OF 5
EQUITY IMPLICATIONS Reducing reliance on the public charging network reduces the cost of operating an electric vehicle. People who are able to charge reliably at home or at work are much less likely to require the public network. Unfortunately, it is often people with the least ability to add charging, either as tenants, or simply as a matter of high costs, that are then subject to these higher operating costs. Access to home or workplace charging makes owning an electric vehicle more convenient. For those people with less flexible schedules—either due to job requirements, long commutes from the suburbs, childcare needs, or other limitations—this convenience may be the difference between being able to shift to an EV or not. This action plan will expand retrofits in rental buildings, ensuring more workplaces are equipped with charging; and will require or incentivize other building types, including gas stations and parking lots, to add charging. Retrofits will bring access to a broader range of Vancouverites than have previously been included in this transition. It will also ensure that, when EVs are expected to reach price parity with internal combustion engines during the 2020s, access to charging is not a barrier.
CO-BENEFITS • Dispersed network of charging infrastructure is more resilient and reduces utility
impacts.
WORK TO DATE • Collaborating with City of North Vancouver on non-residential standards study.
• Funds set aside for retrofits, agreement in place with provincial government.
• Installed 12 Level 2s at a City-owned social housing complex in Strathcona.
WORK TO BE COMPLETED • Develop new construction standards and compliance mechanism for non-residential
buildings.
• Develop retrofit strategy.
• Consult with industry stakeholders associated with gas stations, parking lots, convenience stores, etc.
SCHEDULE TASK START END 1a Costing study for non-residential buildings Apr 2020 Aug 2020 1b Develop compliance mechanism and update Parking By-law Aug 2020 Dec 2020 1c Engage development industry Sep 2020 Nov 2020 2 Fund top-up to provincial retrofit incentive Mar 2020 Dec 2020 3a Gas station and parking lot stakeholder engagements and
analysis 2021 2021
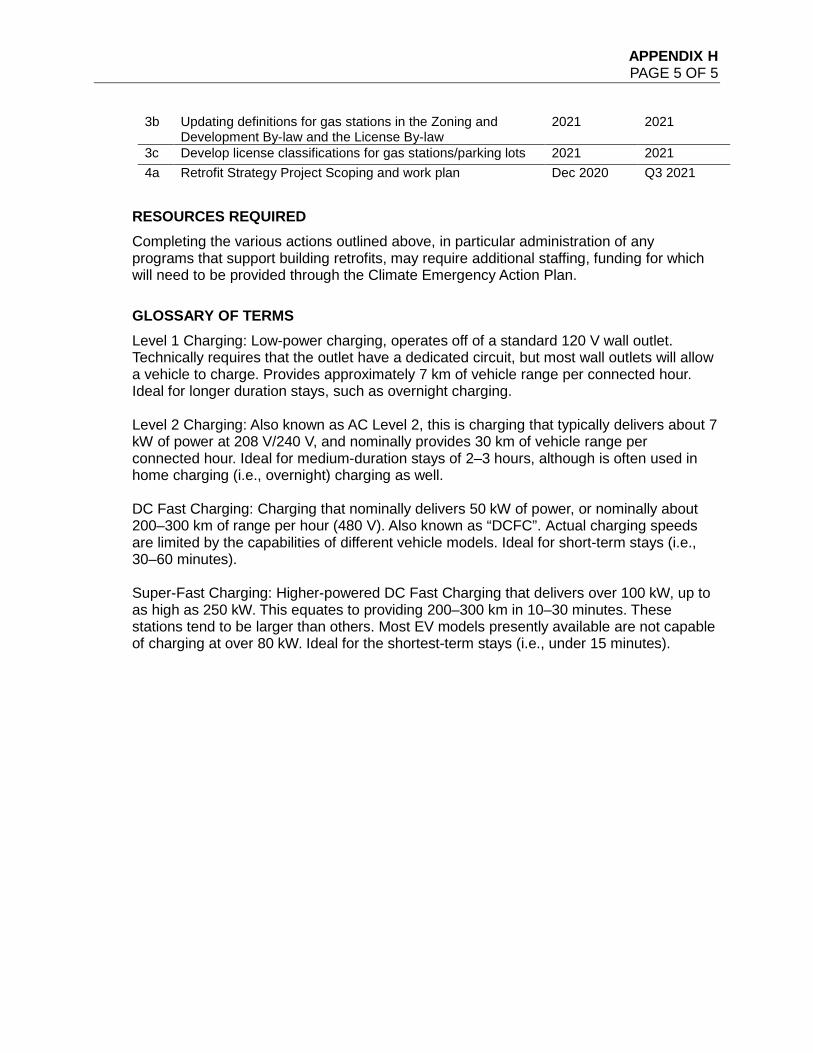
APPENDIX H PAGE 5 OF 5
3b Updating definitions for gas stations in the Zoning and Development By-law and the License By-law
2021 2021
3c Develop license classifications for gas stations/parking lots 2021 2021 4a Retrofit Strategy Project Scoping and work plan Dec 2020 Q3 2021
RESOURCES REQUIRED Completing the various actions outlined above, in particular administration of any programs that support building retrofits, may require additional staffing, funding for which will need to be provided through the Climate Emergency Action Plan.
GLOSSARY OF TERMS Level 1 Charging: Low-power charging, operates off of a standard 120 V wall outlet. Technically requires that the outlet have a dedicated circuit, but most wall outlets will allow a vehicle to charge. Provides approximately 7 km of vehicle range per connected hour. Ideal for longer duration stays, such as overnight charging. Level 2 Charging: Also known as AC Level 2, this is charging that typically delivers about 7 kW of power at 208 V/240 V, and nominally provides 30 km of vehicle range per connected hour. Ideal for medium-duration stays of 2–3 hours, although is often used in home charging (i.e., overnight) charging as well. DC Fast Charging: Charging that nominally delivers 50 kW of power, or nominally about 200–300 km of range per hour (480 V). Also known as “DCFC”. Actual charging speeds are limited by the capabilities of different vehicle models. Ideal for short-term stays (i.e., 30–60 minutes). Super-Fast Charging: Higher-powered DC Fast Charging that delivers over 100 kW, up to as high as 250 kW. This equates to providing 200–300 km in 10–30 minutes. These stations tend to be larger than others. Most EV models presently available are not capable of charging at over 80 kW. Ideal for the shortest-term stays (i.e., under 15 minutes).
APPENDIX I PAGE 1 OF 4
APPENDIX I: CHARGING INFRASTRUCTURE FOR PASSENGER FLEETS WORK PLAN
OVERVIEW Passenger fleets are comprised of taxis, limousines, car shares, and transportation network services (TNS), also known as ride hailing. This work plan will look at ways to shift the passenger fleet industry to electric vehicles as quickly as possible. Completion of this work plan will include:
1) Expanding of public charging network and refining the operation of public charging stations to better suit the passenger fleet industry.35
a. Access and rate structures for TNS, taxis, and one-way car shares. b. Deployment of infrastructure in target areas. c. Deployment of dedicated Level 2 infrastructure for two-way car-shares.
2) Expansion of private access charging points, either in the public realm or in private parking stalls.
a. Exploration of home retrofit incentives for passenger fleet drivers. b. Exploration of tie-ins with near-home pilot projects, like light-pole charging.
OBJECTIVE Significant study and engagement remain to be completed in determining all of the appropriate actions to advance this plan. However, the actions will be guided by the following objectives:
• Support the transition to EVs by passenger fleets in the most equitable way possible.
• Maximize the value of all deployed infrastructure.
• Identify funding opportunities outside of the City’s capital budget, wherever possible.
• Maximize awareness of the City’s action plan by passenger fleet companies and their drivers.
PROPOSED ACTIONS/SCOPE The work plan will include the following elements:
1. Continued involvement in the Charging Ahead with Modo pilot project. 2. Targeted engagement with passenger fleet operators, their partner organizations
(such as rental car companies), and, where possible, drivers. 3. Working with other cities to identify lessons learned.
35 Where practical, network expansion for passenger fleets will also align with the goals outlined in Appendix I.
APPENDIX I PAGE 2 OF 4
4. Analyzing the benefits of deployment of additional charging infrastructure for taxis and TNS vs. home or near-home charging programs.
5. Designing rate structures, access benefits, or other operational changes to public charging infrastructure that will align better with the needs of passenger fleet drivers.
6. Analyzing how one-way car-sharing companies can be supported with public charging infrastructure.
7. Conducting pilot projects. 8. Developing a detailed action plan and schedule. Out of Scope
• Development of vehicle incentive programs by the City.
• Deployment of “super-fast” public charging infrastructure.
• Development of strategies to support freight and private fleets beyond passenger fleets or transit.
• E-bike share programs.
RATIONALE FOR ACTION This mode of transportation, and in particular TNS, has the potential to increase congestion and carbon emissions, and decrease air quality. However, the large distances travelled by these vehicles (up to 250 km per day) means they have an outsized potential to reduce emissions if they are transitioned to ZEVs. Because of these long driving distances, use of City-owned or City-funded charging infrastructure also has the potential to generate significant numbers of Low-Carbon Fuel Standard Credits. At current and projected market rates, these credits have the potential to leverage shorter returns on the City’s investments. Early engagement with industry stakeholders indicated some general barriers to EV adoption by passenger fleets: vehicle cost, vehicle model supply, and access to infrastructure. Vehicle cost and model supply are outside of the City’s control, although we will continue to work with the provincial government to strengthen the Zero-Emission Vehicles Act that would reduce or remove price and supply barriers. Engagement with industry stakeholders and technical experts has indicated that Level 2 charging and “conventional” DC Fast Charging (i.e., 50 kW) are the best approaches to public charging for passenger fleets, and that “super-fast” charging is of little value. This conclusion also supports smaller footprints for public charging, reduced utility impacts, and reduced capital costs. With respect to car-sharing, the City has worked with Modo at a very small scale for several years. Piloting new business models for infrastructure will support two-way (return-to-base) car share companies in switching to EVs. One-way car-sharing has less certainty in terms of infrastructure needs and operating models, so it is important that the City continue to work with these companies to identify how best to support them. Vehicle
APPENDIX I PAGE 3 OF 4
kilometres travelled tend to be lower than for TNS vehicles and taxis; however, because of the dispersed nature of parking for these vehicles (as opposed to personal residences or yards), the City’s role in providing convenient charging is necessary to their transition to EVs. In all of these fleet types, vehicles remain in service for several years. In order to meet the City’s 2030 goals, the transition to EVs must occur quickly.
CO-BENEFITS Pilot projects in other cities have demonstrated that TNS vehicles are capable of improving the return-on-investment for public charging by dramatically increasing utilization and providing a bigger fixed customer base with more guaranteed revenue. This scenario means that the City would be more able to provide charging to the general public if it is accessed by TNS drivers as well.
• Increased revenue and utilization at public charging locations.
• Increased visibility and awareness of EVs, encouraging more widespread adoption.
• Opportunity to pilot concepts from other initiatives—such as near-home charging and light-pole charging—with dedicated users.
EQUITY IMPLICATIONS Electric vehicles presently cost significantly more to purchase than their internal combustion engine equivalents, keeping them out of reach for many low- and middle-income households. Most TNS vehicles are owned by the driver. The increased up-front cost of switching to an EV may create financial challenges for many; however, the reduced fuel and operating costs can be especially beneficial to long-range drivers, especially since the cost of fuel is also borne by the driver. The City can support TNS drivers and taxi drivers by helping them to avoid additional costs associated with charging infrastructure. This may be possible through home charging solutions or through reliable access to the public charging network, in ways that have minimal impact on the drivers’ ability to earn fares. For those who rely on these services, a transition to EVs in passenger fleets can increase awareness of EVs for those customers. With respect to car-sharing, an increased proportion of EVs would also have positive effects on air quality in the neighbourhoods that they are based in.
WORK TO DATE • Preliminary engagement with industry stakeholders.
• Early research into pilot projects in other jurisdictions.
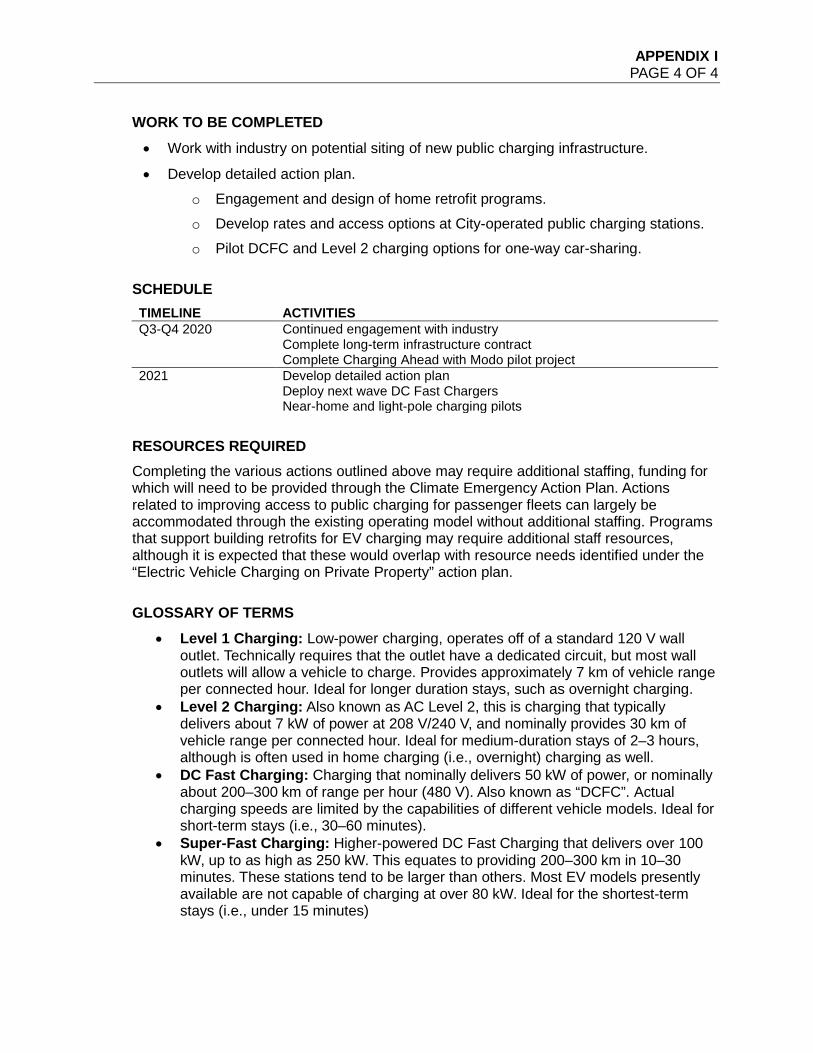
APPENDIX I PAGE 4 OF 4
WORK TO BE COMPLETED • Work with industry on potential siting of new public charging infrastructure.
• Develop detailed action plan. o Engagement and design of home retrofit programs. o Develop rates and access options at City-operated public charging stations. o Pilot DCFC and Level 2 charging options for one-way car-sharing.
SCHEDULE TIMELINE ACTIVITIES Q3-Q4 2020 Continued engagement with industry
Complete long-term infrastructure contract Complete Charging Ahead with Modo pilot project
2021 Develop detailed action plan Deploy next wave DC Fast Chargers Near-home and light-pole charging pilots
RESOURCES REQUIRED Completing the various actions outlined above may require additional staffing, funding for which will need to be provided through the Climate Emergency Action Plan. Actions related to improving access to public charging for passenger fleets can largely be accommodated through the existing operating model without additional staffing. Programs that support building retrofits for EV charging may require additional staff resources, although it is expected that these would overlap with resource needs identified under the “Electric Vehicle Charging on Private Property” action plan.
GLOSSARY OF TERMS • Level 1 Charging: Low-power charging, operates off of a standard 120 V wall
outlet. Technically requires that the outlet have a dedicated circuit, but most wall outlets will allow a vehicle to charge. Provides approximately 7 km of vehicle range per connected hour. Ideal for longer duration stays, such as overnight charging.
• Level 2 Charging: Also known as AC Level 2, this is charging that typically delivers about 7 kW of power at 208 V/240 V, and nominally provides 30 km of vehicle range per connected hour. Ideal for medium-duration stays of 2–3 hours, although is often used in home charging (i.e., overnight) charging as well.
• DC Fast Charging: Charging that nominally delivers 50 kW of power, or nominally about 200–300 km of range per hour (480 V). Also known as “DCFC”. Actual charging speeds are limited by the capabilities of different vehicle models. Ideal for short-term stays (i.e., 30–60 minutes).
• Super-Fast Charging: Higher-powered DC Fast Charging that delivers over 100 kW, up to as high as 250 kW. This equates to providing 200–300 km in 10–30 minutes. These stations tend to be larger than others. Most EV models presently available are not capable of charging at over 80 kW. Ideal for the shortest-term stays (i.e., under 15 minutes)
APPENDIX J PAGE 1 OF 79
APPENDIX J: ZERO EMISSIONS BUILDING RETROFIT STRATEGY
ABOUT THIS APPENDIX This Zero Emissions Building Retrofit Strategy is divided into the following sections:
• Section 1: Objective and Guiding Principles • Section 2: Context • Section 3: Strategy Overview • Section 4: Set Carbon Pollution Limits and Streamline Regulations • Section 5: Support Early Owner Action • Section 6: Build Industry Capacity • Section 7: Facilitate Access to Renewable Energy • Section 8: Supplemental Information
EXECUTIVE SUMMARY While the City is on a clear path to zero carbon new buildings, existing buildings present a significant challenge because of their diversity and poor design from an energy efficiency and carbon emissions perspective. This challenge requires a comprehensive set of policies, actions and support tools to transition toward zero carbon pollution. Over half of the total carbon emissions in the City of Vancouver come from buildings. Of those emissions, 95% are from the combustion of natural gas, with 80% used for space heating and hot water equipment, such as furnaces and boilers. Thus, this strategy focuses on actions to transition heating and hot water equipment to renewable electricity-based systems, such as heat pumps; to convert district energy systems to renewable energy; and to facilitate the use of renewable natural gas.
OBJECTIVE: REDUCE CARBON POLLUTION IN EXISTING BUILDINGS BY 50% BY 2030. The objective of the Zero Emissions Building Retrofit (ZEB-R) Strategy is to chart a path for how key stakeholders, the public and the City will work together to reduce carbon pollution from the operation of existing buildings by 50% by 2030, on the way to a 100% reduction before 2050. The successful implementation of the ZEB-R Strategy is the cornerstone of Vancouver’s Climate Emergency Action Plan.
To achieve the 2030 target, annual reductions will need to accelerate five-times compared to what has been achieved over the previous decade. This is a significant departure from “business as usual.” Early owner action will not be enough to get us there, and so, as in the Zero Emissions Building Plan for new construction, we must begin to regulate, signal intended future requirements and then build capacity and remove barriers to enable more significant future actions —an approach that is supported by a diverse cross-section of stakeholders, including industry groups. In addition to setting a clear regulatory signal that is equitable and allows for flexibility in how a building meets the requirements, we need partners who will lead alongside the
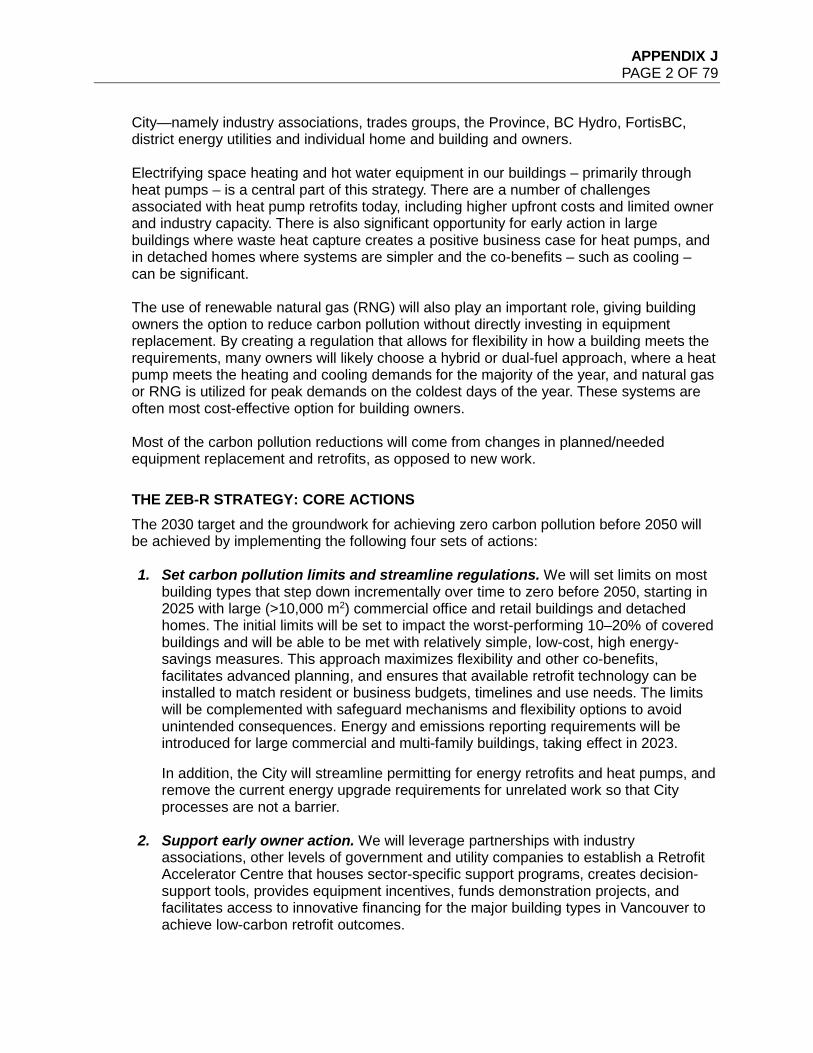
APPENDIX J PAGE 2 OF 79
City—namely industry associations, trades groups, the Province, BC Hydro, FortisBC, district energy utilities and individual home and building and owners.
Electrifying space heating and hot water equipment in our buildings – primarily through heat pumps – is a central part of this strategy. There are a number of challenges associated with heat pump retrofits today, including higher upfront costs and limited owner and industry capacity. There is also significant opportunity for early action in large buildings where waste heat capture creates a positive business case for heat pumps, and in detached homes where systems are simpler and the co-benefits – such as cooling – can be significant. The use of renewable natural gas (RNG) will also play an important role, giving building owners the option to reduce carbon pollution without directly investing in equipment replacement. By creating a regulation that allows for flexibility in how a building meets the requirements, many owners will likely choose a hybrid or dual-fuel approach, where a heat pump meets the heating and cooling demands for the majority of the year, and natural gas or RNG is utilized for peak demands on the coldest days of the year. These systems are often most cost-effective option for building owners. Most of the carbon pollution reductions will come from changes in planned/needed equipment replacement and retrofits, as opposed to new work.
THE ZEB-R STRATEGY: CORE ACTIONS The 2030 target and the groundwork for achieving zero carbon pollution before 2050 will be achieved by implementing the following four sets of actions:
1. Set carbon pollution limits and streamline regulations. We will set limits on most
building types that step down incrementally over time to zero before 2050, starting in 2025 with large (>10,000 m2) commercial office and retail buildings and detached homes. The initial limits will be set to impact the worst-performing 10–20% of covered buildings and will be able to be met with relatively simple, low-cost, high energy-savings measures. This approach maximizes flexibility and other co-benefits, facilitates advanced planning, and ensures that available retrofit technology can be installed to match resident or business budgets, timelines and use needs. The limits will be complemented with safeguard mechanisms and flexibility options to avoid unintended consequences. Energy and emissions reporting requirements will be introduced for large commercial and multi-family buildings, taking effect in 2023.
In addition, the City will streamline permitting for energy retrofits and heat pumps, and remove the current energy upgrade requirements for unrelated work so that City processes are not a barrier.
2. Support early owner action. We will leverage partnerships with industry associations, other levels of government and utility companies to establish a Retrofit Accelerator Centre that houses sector-specific support programs, creates decision-support tools, provides equipment incentives, funds demonstration projects, and facilitates access to innovative financing for the major building types in Vancouver to achieve low-carbon retrofit outcomes.
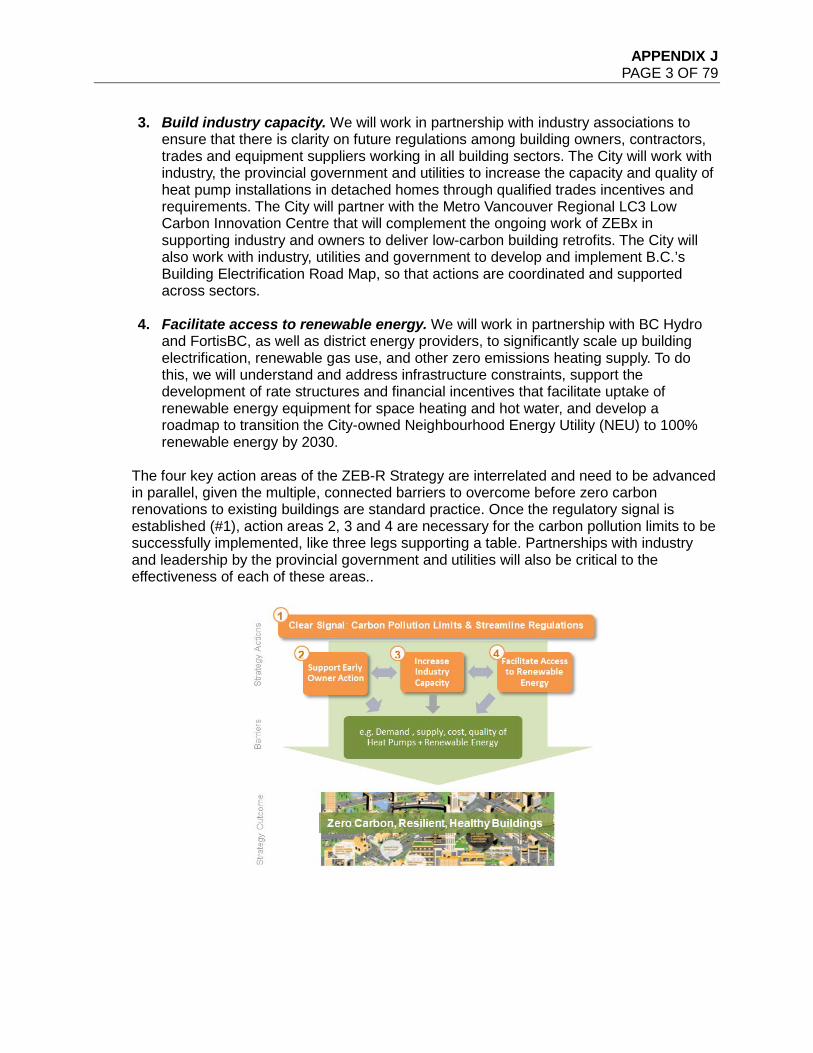
APPENDIX J PAGE 3 OF 79
3. Build industry capacity. We will work in partnership with industry associations to ensure that there is clarity on future regulations among building owners, contractors, trades and equipment suppliers working in all building sectors. The City will work with industry, the provincial government and utilities to increase the capacity and quality of heat pump installations in detached homes through qualified trades incentives and requirements. The City will partner with the Metro Vancouver Regional LC3 Low Carbon Innovation Centre that will complement the ongoing work of ZEBx in supporting industry and owners to deliver low-carbon building retrofits. The City will also work with industry, utilities and government to develop and implement B.C.’s Building Electrification Road Map, so that actions are coordinated and supported across sectors.
4. Facilitate access to renewable energy. We will work in partnership with BC Hydro and FortisBC, as well as district energy providers, to significantly scale up building electrification, renewable gas use, and other zero emissions heating supply. To do this, we will understand and address infrastructure constraints, support the development of rate structures and financial incentives that facilitate uptake of renewable energy equipment for space heating and hot water, and develop a roadmap to transition the City-owned Neighbourhood Energy Utility (NEU) to 100% renewable energy by 2030.
The four key action areas of the ZEB-R Strategy are interrelated and need to be advanced in parallel, given the multiple, connected barriers to overcome before zero carbon renovations to existing buildings are standard practice. Once the regulatory signal is established (#1), action areas 2, 3 and 4 are necessary for the carbon pollution limits to be successfully implemented, like three legs supporting a table. Partnerships with industry and leadership by the provincial government and utilities will also be critical to the effectiveness of each of these areas..
APPENDIX J PAGE 4 OF 79
CO-BENEFITS OF REDUCING CARBON POLLUTION The transition to zero emissions will not be free or easy, but when implemented through a resilient-buildings framework—where policies and programs are designed holistically to make buildings better overall and to prioritize addressing our most pressing needs, such as affordability, local economy, health and equity—the investment will have tangible co-benefits. Through the actions described in this strategy, we will capitalize on the opportunity to make this a just and prosperous transition through local job creation, improving the quality and resilience of the building stock, and making indoor spaces healthier and more comfortable for Vancouver residents and workers, while investing in the future of the planet.
APPENDIX J PAGE 5 OF 79
SECTION 1: OBJECTIVE AND GUIDING PRINCIPLES
1.1 OBJECTIVE The objective of the Zero Emissions Building Retrofit (ZEB-R) Strategy is to chart a path for how key stakeholders, the public and the City of Vancouver (“the City”) will work together to reduce carbon pollution from the operation of existing buildings by 50% by 2030 on the way to a 100% reduction before 2050—targets that were established by Council as a part of the Climate Emergency Response (2019) and Renewable City Strategy (2015).
1.2 GUIDING PRINCIPLES To inform the overall approach of ZEB-R and to screen individual actions, the following set of guiding principles were developed:
1. Recognize diversity of building types, conditions and uses. Given the diversity of building types, uses and owners and the heterogeneity of barriers and opportunities for taking action, ZEB-R does not prescribe a one-size-fits-all approach. Supporting actions and regulatory requirements will differ by building type and tenure in recognition of the different opportunities and abilities to reduce carbon pollution.
2. Provide clarity for stakeholders, owners and residents. To enable a planned transition, largely aligned with end-of-life equipment and other needed investments in property, it is critical to communicate regulatory direction looking forward to 2030 and beyond and to put in place clear regulatory requirements for the short term. Regulation is necessary in order for us to respond to the climate crisis and cut carbon pollution significantly over the next decade. The timing and requirements need to be clear and communicated via multiple channels to ensure training is developed, skills are built, supply chains evolve, and owners become aware of energy use and start planning to transition to zero through a series of steps that are best for them and the home or building.
3. Maximize co-benefits and take a resilient-buildings approach. The actions required to decarbonize buildings should result in other benefits to their occupants and the broader community; seeking to create “resilient buildings” is an effective approach for doing this. A resilient-buildings approach addresses a number of City priorities, including adapting for a changing climate, climate change mitigation, fire safety, seismic risk, accessibility, residential affordability, cultural and community services, and healthy buildings. The Resilient Vancouver and Climate Adaptation strategies recommend a framework for doing this. Actions in ZEB-R were chosen to increase comfort, indoor air quality and health, job opportunities and economic growth, seismic resilience, preserve and renew affordable housing, and protect rental tenure.
4. Allow flexibility in times of crises. One crisis does not wait for the other to resolve; they must be managed concurrently. While the climate emergency and an ongoing affordability crisis continue, the financial impairment of businesses, homeowners,
APPENDIX J PAGE 6 OF 79
renters and the City itself has been exacerbated by the COVID-19 pandemic and this cannot be ignored. In order to still achieve the 50% by 2030 emissions-reduction targets given the circumstances, the strategy will take a phased approach to ensure maximum flexibility and equitable outcomes and will seek to maximize co-benefits as described above, including local economic and job growth, and being sure to include the people who have been most hurt by the pandemic.
5. Increase equity. There are four equity-focused tenets that were used in identifying recommended actions for the ZEB-R Strategy and these will be critical to employ during implementation:
• Avoid displacement and mitigate negative outcomes. Actions were identified that mitigate negative and inequitable impacts, including initial retrofit and ongoing energy costs, disruption caused by retrofitting buildings and avoiding loss of housing or business tenure/renoviction.36
• Ensure everyone does their fair share. ZEB-R will set higher expectations through regulation for those with resources and opportunities, and will set lower expectations for those lacking resources or facing exceptional barriers.
• Prioritize support for those with the highest needs. We will ensure financial support and capacity-building is provided to those who most need it.
• Engage meaningfully with the people and businesses that will be impacted. We will engage residents, business owners and contractors in a language and format that is accessible.
36 Renoviction: eviction of a tenant by a landlord due to plans to undertake renovations.
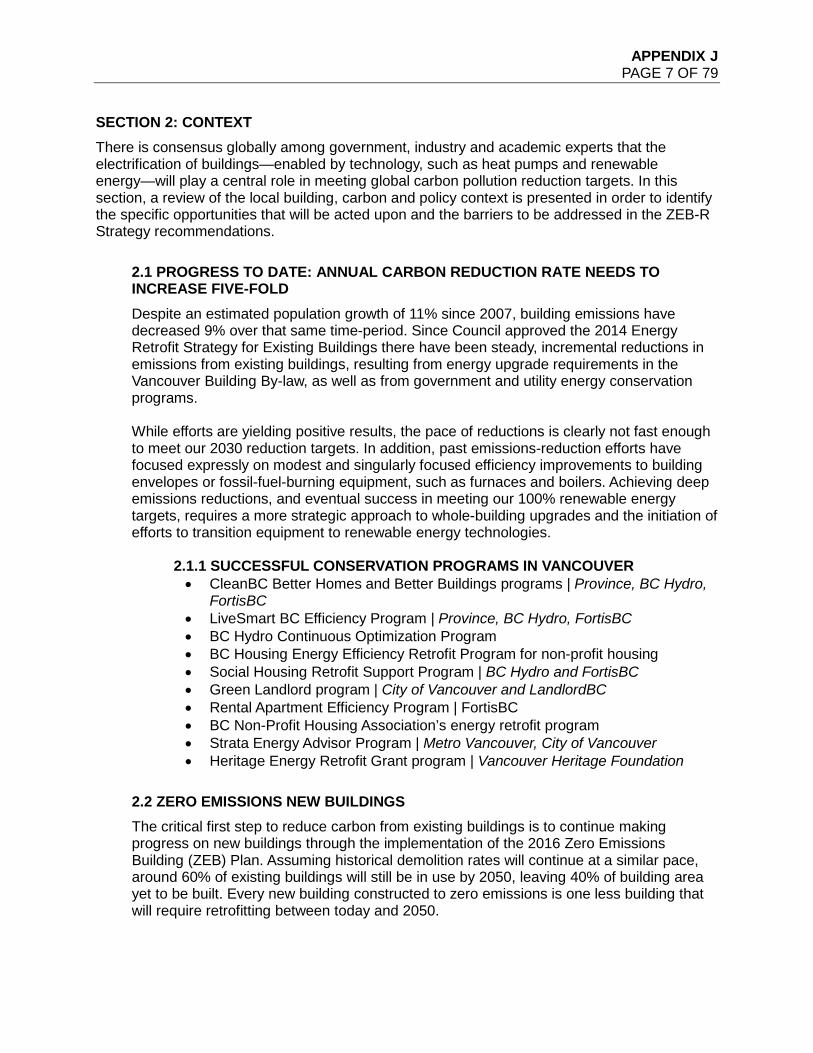
APPENDIX J PAGE 7 OF 79
SECTION 2: CONTEXT There is consensus globally among government, industry and academic experts that the electrification of buildings—enabled by technology, such as heat pumps and renewable energy—will play a central role in meeting global carbon pollution reduction targets. In this section, a review of the local building, carbon and policy context is presented in order to identify the specific opportunities that will be acted upon and the barriers to be addressed in the ZEB-R Strategy recommendations.
2.1 PROGRESS TO DATE: ANNUAL CARBON REDUCTION RATE NEEDS TO INCREASE FIVE-FOLD Despite an estimated population growth of 11% since 2007, building emissions have decreased 9% over that same time-period. Since Council approved the 2014 Energy Retrofit Strategy for Existing Buildings there have been steady, incremental reductions in emissions from existing buildings, resulting from energy upgrade requirements in the Vancouver Building By-law, as well as from government and utility energy conservation programs. While efforts are yielding positive results, the pace of reductions is clearly not fast enough to meet our 2030 reduction targets. In addition, past emissions-reduction efforts have focused expressly on modest and singularly focused efficiency improvements to building envelopes or fossil-fuel-burning equipment, such as furnaces and boilers. Achieving deep emissions reductions, and eventual success in meeting our 100% renewable energy targets, requires a more strategic approach to whole-building upgrades and the initiation of efforts to transition equipment to renewable energy technologies.
2.1.1 SUCCESSFUL CONSERVATION PROGRAMS IN VANCOUVER • CleanBC Better Homes and Better Buildings programs | Province, BC Hydro,
FortisBC • LiveSmart BC Efficiency Program | Province, BC Hydro, FortisBC • BC Hydro Continuous Optimization Program • BC Housing Energy Efficiency Retrofit Program for non-profit housing • Social Housing Retrofit Support Program | BC Hydro and FortisBC • Green Landlord program | City of Vancouver and LandlordBC • Rental Apartment Efficiency Program | FortisBC • BC Non-Profit Housing Association’s energy retrofit program • Strata Energy Advisor Program | Metro Vancouver, City of Vancouver • Heritage Energy Retrofit Grant program | Vancouver Heritage Foundation
2.2 ZERO EMISSIONS NEW BUILDINGS The critical first step to reduce carbon from existing buildings is to continue making progress on new buildings through the implementation of the 2016 Zero Emissions Building (ZEB) Plan. Assuming historical demolition rates will continue at a similar pace, around 60% of existing buildings will still be in use by 2050, leaving 40% of building area yet to be built. Every new building constructed to zero emissions is one less building that will require retrofitting between today and 2050.
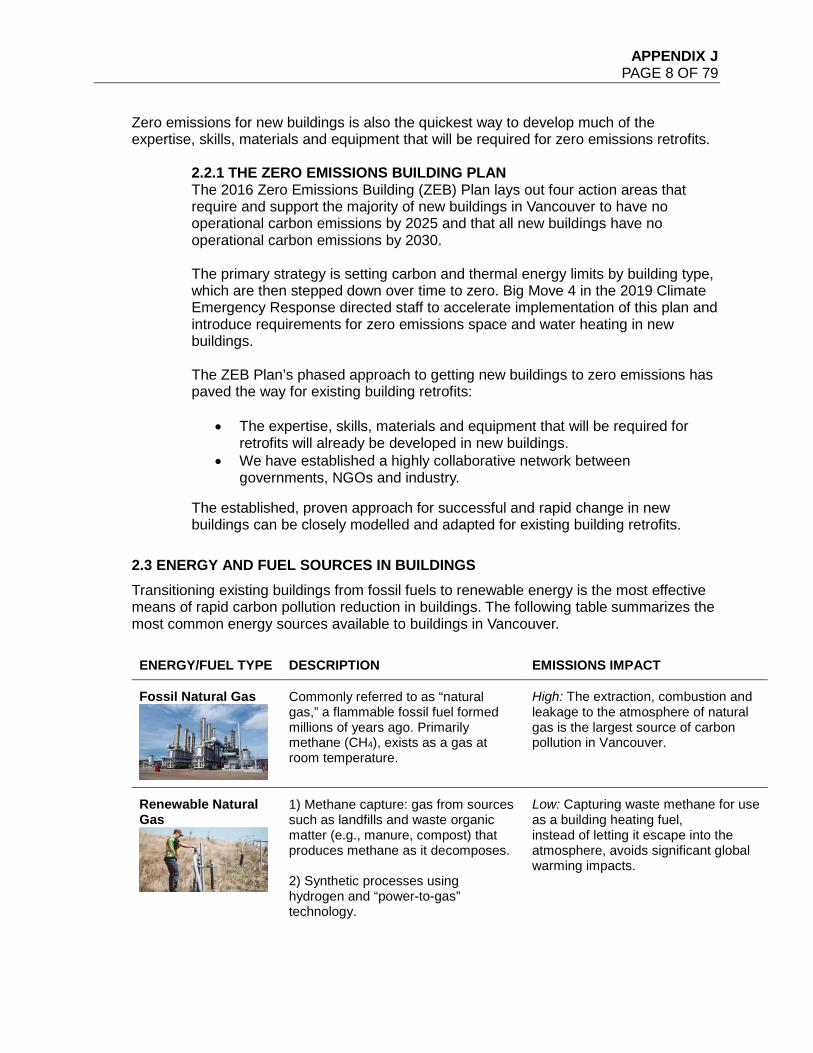
APPENDIX J PAGE 8 OF 79
Zero emissions for new buildings is also the quickest way to develop much of the expertise, skills, materials and equipment that will be required for zero emissions retrofits.
2.2.1 THE ZERO EMISSIONS BUILDING PLAN The 2016 Zero Emissions Building (ZEB) Plan lays out four action areas that require and support the majority of new buildings in Vancouver to have no operational carbon emissions by 2025 and that all new buildings have no operational carbon emissions by 2030. The primary strategy is setting carbon and thermal energy limits by building type, which are then stepped down over time to zero. Big Move 4 in the 2019 Climate Emergency Response directed staff to accelerate implementation of this plan and introduce requirements for zero emissions space and water heating in new buildings. The ZEB Plan’s phased approach to getting new buildings to zero emissions has paved the way for existing building retrofits:
• The expertise, skills, materials and equipment that will be required for retrofits will already be developed in new buildings.
• We have established a highly collaborative network between governments, NGOs and industry.
The established, proven approach for successful and rapid change in new buildings can be closely modelled and adapted for existing building retrofits.
2.3 ENERGY AND FUEL SOURCES IN BUILDINGS Transitioning existing buildings from fossil fuels to renewable energy is the most effective means of rapid carbon pollution reduction in buildings. The following table summarizes the most common energy sources available to buildings in Vancouver.
ENERGY/FUEL TYPE DESCRIPTION EMISSIONS IMPACT
Fossil Natural Gas
Commonly referred to as “natural gas,” a flammable fossil fuel formed millions of years ago. Primarily methane (CH4), exists as a gas at room temperature.
High: The extraction, combustion and leakage to the atmosphere of natural gas is the largest source of carbon pollution in Vancouver.
Renewable Natural Gas
1) Methane capture: gas from sources such as landfills and waste organic matter (e.g., manure, compost) that produces methane as it decomposes. 2) Synthetic processes using hydrogen and “power-to-gas” technology.
Low: Capturing waste methane for use as a building heating fuel, instead of letting it escape into the atmosphere, avoids significant global warming impacts.
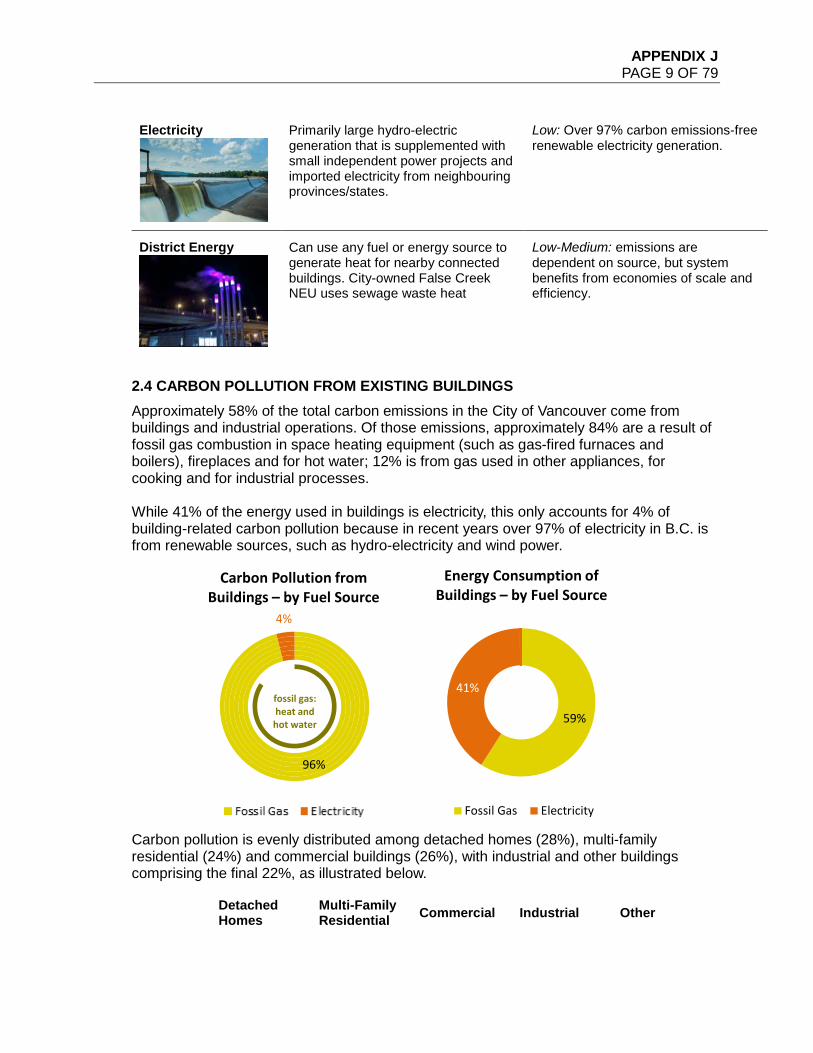
APPENDIX J PAGE 9 OF 79
Electricity
Primarily large hydro-electric generation that is supplemented with small independent power projects and imported electricity from neighbouring provinces/states.
Low: Over 97% carbon emissions-free renewable electricity generation.
District Energy
Can use any fuel or energy source to generate heat for nearby connected buildings. City-owned False Creek NEU uses sewage waste heat
Low-Medium: emissions are dependent on source, but system benefits from economies of scale and efficiency.
2.4 CARBON POLLUTION FROM EXISTING BUILDINGS Approximately 58% of the total carbon emissions in the City of Vancouver come from buildings and industrial operations. Of those emissions, approximately 84% are a result of fossil gas combustion in space heating equipment (such as gas-fired furnaces and boilers), fireplaces and for hot water; 12% is from gas used in other appliances, for cooking and for industrial processes.
While 41% of the energy used in buildings is electricity, this only accounts for 4% of building-related carbon pollution because in recent years over 97% of electricity in B.C. is from renewable sources, such as hydro-electricity and wind power.
Carbon pollution is evenly distributed among detached homes (28%), multi-family residential (24%) and commercial buildings (26%), with industrial and other buildings comprising the final 22%, as illustrated below.
96%
4%
Carbon Pollution from Buildings – by Fuel Source
fossil gas: heat and hot water 59%
41%
Energy Consumption of Buildings – by Fuel Source
Fossil Gas Electricity
Detached Homes
Multi-Family Residential Commercial Industrial Other
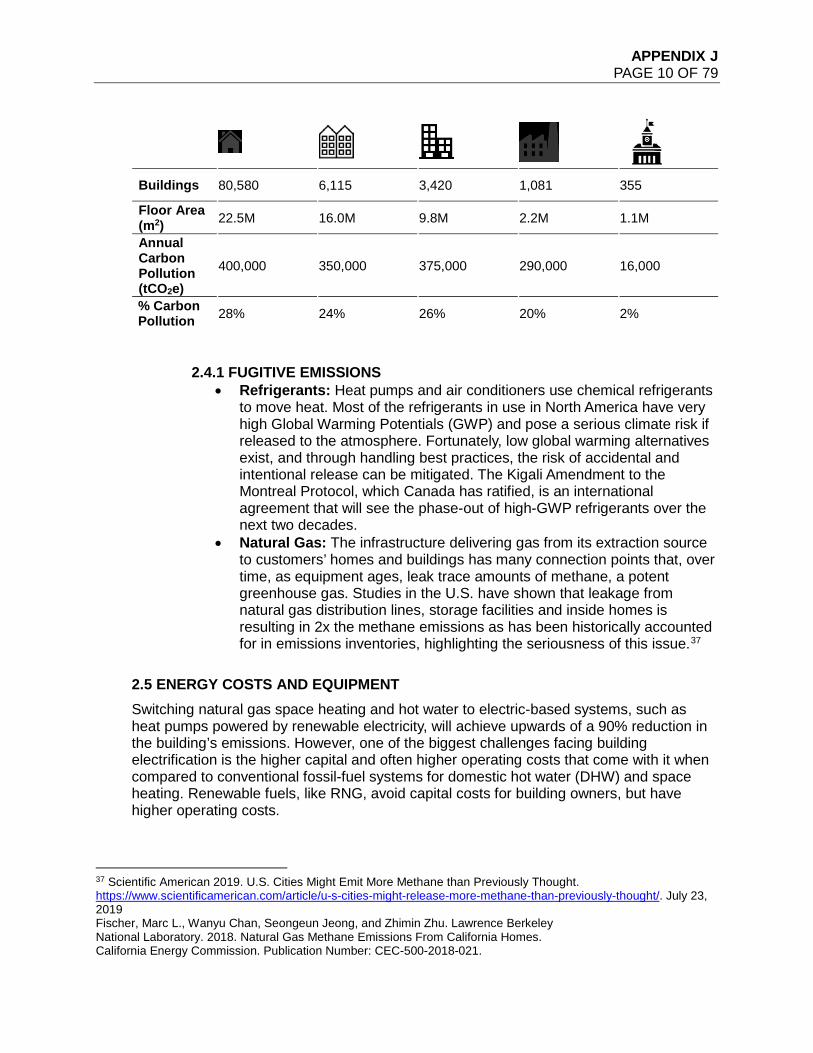
APPENDIX J PAGE 10 OF 79
2.4.1 FUGITIVE EMISSIONS • Refrigerants: Heat pumps and air conditioners use chemical refrigerants
to move heat. Most of the refrigerants in use in North America have very high Global Warming Potentials (GWP) and pose a serious climate risk if released to the atmosphere. Fortunately, low global warming alternatives exist, and through handling best practices, the risk of accidental and intentional release can be mitigated. The Kigali Amendment to the Montreal Protocol, which Canada has ratified, is an international agreement that will see the phase-out of high-GWP refrigerants over the next two decades.
• Natural Gas: The infrastructure delivering gas from its extraction source to customers’ homes and buildings has many connection points that, over time, as equipment ages, leak trace amounts of methane, a potent greenhouse gas. Studies in the U.S. have shown that leakage from natural gas distribution lines, storage facilities and inside homes is resulting in 2x the methane emissions as has been historically accounted for in emissions inventories, highlighting the seriousness of this issue.37
2.5 ENERGY COSTS AND EQUIPMENT Switching natural gas space heating and hot water to electric-based systems, such as heat pumps powered by renewable electricity, will achieve upwards of a 90% reduction in the building’s emissions. However, one of the biggest challenges facing building electrification is the higher capital and often higher operating costs that come with it when compared to conventional fossil-fuel systems for domestic hot water (DHW) and space heating. Renewable fuels, like RNG, avoid capital costs for building owners, but have higher operating costs.
37 Scientific American 2019. U.S. Cities Might Emit More Methane than Previously Thought. https://www.scientificamerican.com/article/u-s-cities-might-release-more-methane-than-previously-thought/. July 23, 2019 Fischer, Marc L., Wanyu Chan, Seongeun Jeong, and Zhimin Zhu. Lawrence Berkeley National Laboratory. 2018. Natural Gas Methane Emissions From California Homes. California Energy Commission. Publication Number: CEC-500-2018-021.
Buildings 80,580 6,115 3,420 1,081 355
Floor Area (m2) 22.5M 16.0M 9.8M 2.2M 1.1M
Annual Carbon Pollution (tCO2e)
400,000 350,000 375,000 290,000 16,000
% Carbon Pollution 28% 24% 26% 20% 2%
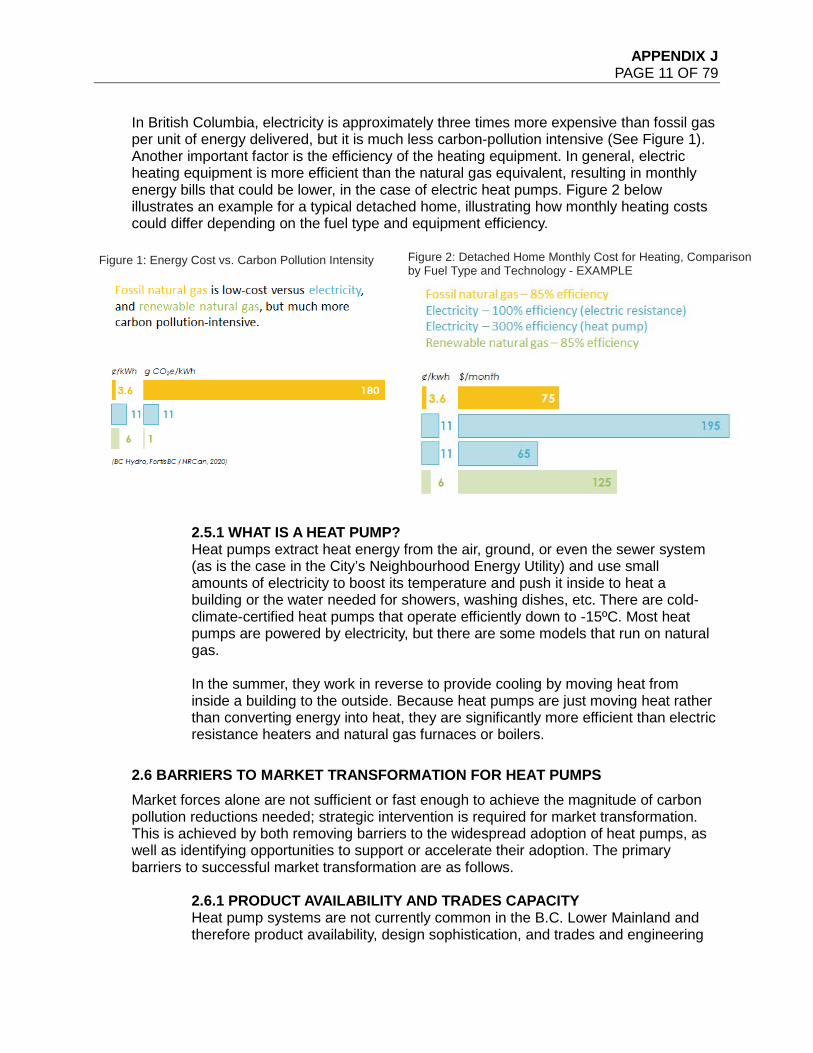
APPENDIX J PAGE 11 OF 79
In British Columbia, electricity is approximately three times more expensive than fossil gas per unit of energy delivered, but it is much less carbon-pollution intensive (See Figure 1). Another important factor is the efficiency of the heating equipment. In general, electric heating equipment is more efficient than the natural gas equivalent, resulting in monthly energy bills that could be lower, in the case of electric heat pumps. Figure 2 below illustrates an example for a typical detached home, illustrating how monthly heating costs could differ depending on the fuel type and equipment efficiency.
2.5.1 WHAT IS A HEAT PUMP? Heat pumps extract heat energy from the air, ground, or even the sewer system (as is the case in the City’s Neighbourhood Energy Utility) and use small amounts of electricity to boost its temperature and push it inside to heat a building or the water needed for showers, washing dishes, etc. There are cold-climate-certified heat pumps that operate efficiently down to -15ºC. Most heat pumps are powered by electricity, but there are some models that run on natural gas. In the summer, they work in reverse to provide cooling by moving heat from inside a building to the outside. Because heat pumps are just moving heat rather than converting energy into heat, they are significantly more efficient than electric resistance heaters and natural gas furnaces or boilers.
2.6 BARRIERS TO MARKET TRANSFORMATION FOR HEAT PUMPS Market forces alone are not sufficient or fast enough to achieve the magnitude of carbon pollution reductions needed; strategic intervention is required for market transformation. This is achieved by both removing barriers to the widespread adoption of heat pumps, as well as identifying opportunities to support or accelerate their adoption. The primary barriers to successful market transformation are as follows.
2.6.1 PRODUCT AVAILABILITY AND TRADES CAPACITY Heat pump systems are not currently common in the B.C. Lower Mainland and therefore product availability, design sophistication, and trades and engineering
Figure 1: Energy Cost vs. Carbon Pollution Intensity Figure 2: Detached Home Monthly Cost for Heating, Comparison by Fuel Type and Technology - EXAMPLE
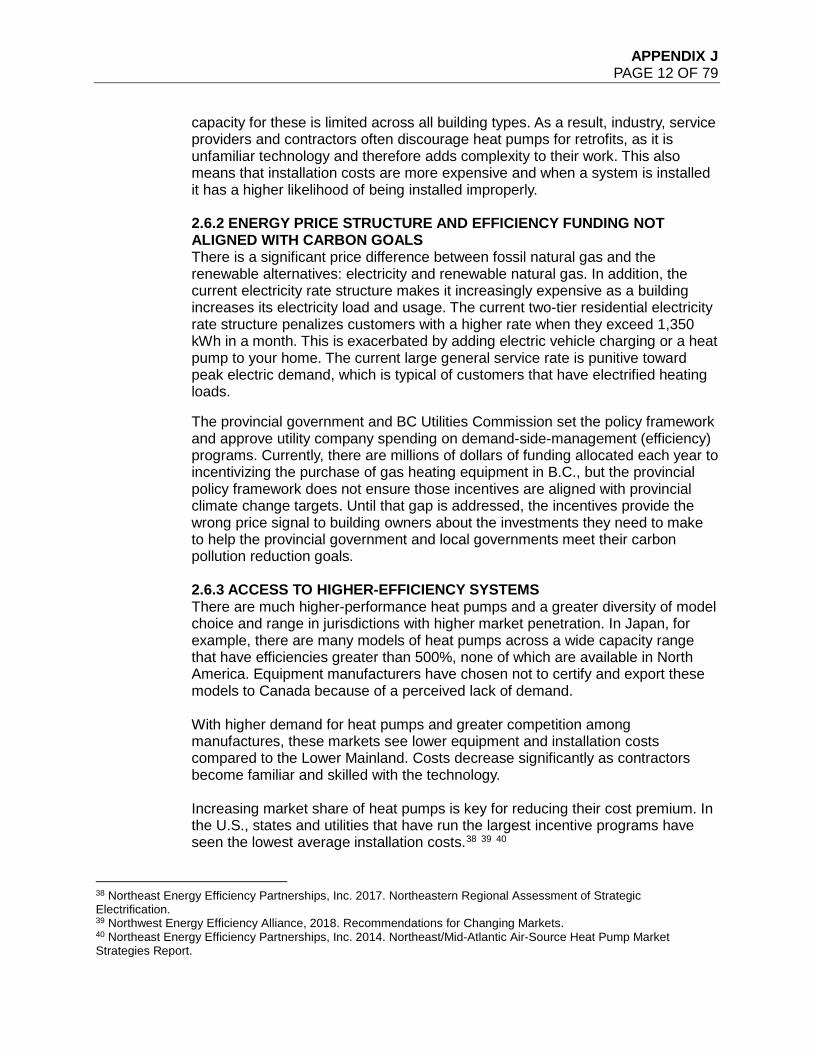
APPENDIX J PAGE 12 OF 79
capacity for these is limited across all building types. As a result, industry, service providers and contractors often discourage heat pumps for retrofits, as it is unfamiliar technology and therefore adds complexity to their work. This also means that installation costs are more expensive and when a system is installed it has a higher likelihood of being installed improperly. 2.6.2 ENERGY PRICE STRUCTURE AND EFFICIENCY FUNDING NOT ALIGNED WITH CARBON GOALS There is a significant price difference between fossil natural gas and the renewable alternatives: electricity and renewable natural gas. In addition, the current electricity rate structure makes it increasingly expensive as a building increases its electricity load and usage. The current two-tier residential electricity rate structure penalizes customers with a higher rate when they exceed 1,350 kWh in a month. This is exacerbated by adding electric vehicle charging or a heat pump to your home. The current large general service rate is punitive toward peak electric demand, which is typical of customers that have electrified heating loads.
The provincial government and BC Utilities Commission set the policy framework and approve utility company spending on demand-side-management (efficiency) programs. Currently, there are millions of dollars of funding allocated each year to incentivizing the purchase of gas heating equipment in B.C., but the provincial policy framework does not ensure those incentives are aligned with provincial climate change targets. Until that gap is addressed, the incentives provide the wrong price signal to building owners about the investments they need to make to help the provincial government and local governments meet their carbon pollution reduction goals. 2.6.3 ACCESS TO HIGHER-EFFICIENCY SYSTEMS There are much higher-performance heat pumps and a greater diversity of model choice and range in jurisdictions with higher market penetration. In Japan, for example, there are many models of heat pumps across a wide capacity range that have efficiencies greater than 500%, none of which are available in North America. Equipment manufacturers have chosen not to certify and export these models to Canada because of a perceived lack of demand. With higher demand for heat pumps and greater competition among manufactures, these markets see lower equipment and installation costs compared to the Lower Mainland. Costs decrease significantly as contractors become familiar and skilled with the technology.
Increasing market share of heat pumps is key for reducing their cost premium. In the U.S., states and utilities that have run the largest incentive programs have seen the lowest average installation costs.38 39 40
38 Northeast Energy Efficiency Partnerships, Inc. 2017. Northeastern Regional Assessment of Strategic Electrification. 39 Northwest Energy Efficiency Alliance, 2018. Recommendations for Changing Markets. 40 Northeast Energy Efficiency Partnerships, Inc. 2014. Northeast/Mid-Atlantic Air-Source Heat Pump Market Strategies Report.
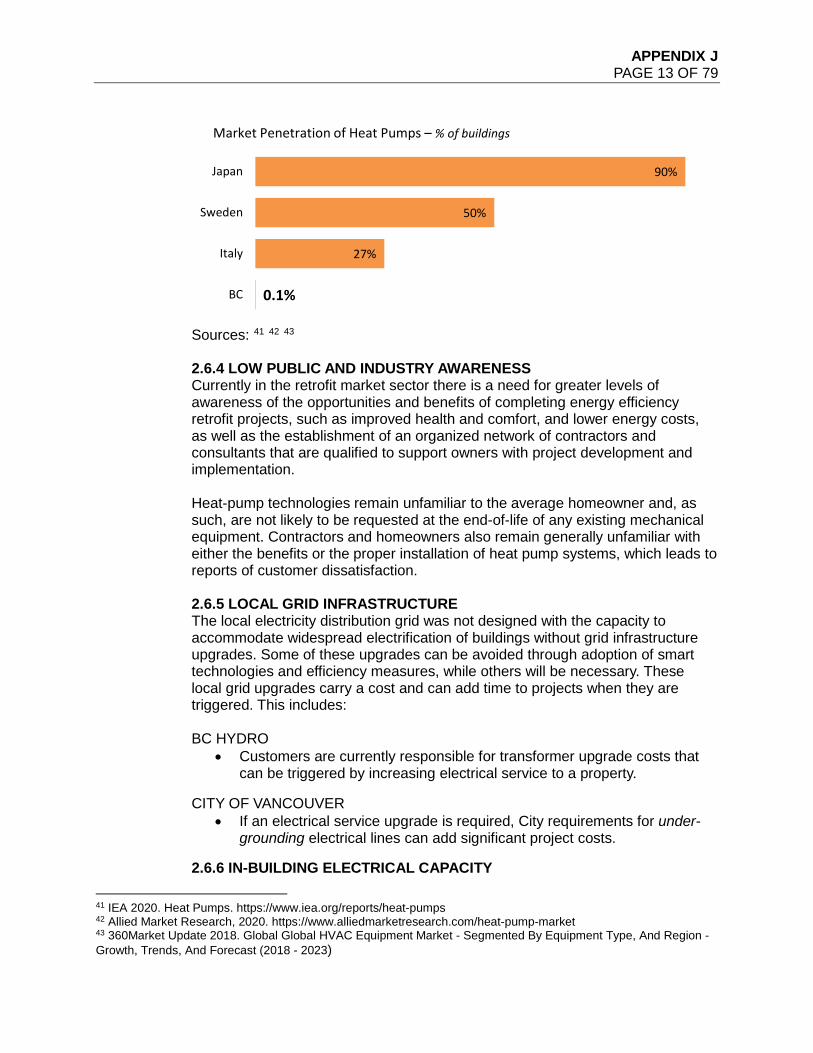
APPENDIX J PAGE 13 OF 79
Sources: 41 42 43 2.6.4 LOW PUBLIC AND INDUSTRY AWARENESS Currently in the retrofit market sector there is a need for greater levels of awareness of the opportunities and benefits of completing energy efficiency retrofit projects, such as improved health and comfort, and lower energy costs, as well as the establishment of an organized network of contractors and consultants that are qualified to support owners with project development and implementation. Heat-pump technologies remain unfamiliar to the average homeowner and, as such, are not likely to be requested at the end-of-life of any existing mechanical equipment. Contractors and homeowners also remain generally unfamiliar with either the benefits or the proper installation of heat pump systems, which leads to reports of customer dissatisfaction. 2.6.5 LOCAL GRID INFRASTRUCTURE The local electricity distribution grid was not designed with the capacity to accommodate widespread electrification of buildings without grid infrastructure upgrades. Some of these upgrades can be avoided through adoption of smart technologies and efficiency measures, while others will be necessary. These local grid upgrades carry a cost and can add time to projects when they are triggered. This includes: BC HYDRO
• Customers are currently responsible for transformer upgrade costs that can be triggered by increasing electrical service to a property.
CITY OF VANCOUVER • If an electrical service upgrade is required, City requirements for under-
grounding electrical lines can add significant project costs.
2.6.6 IN-BUILDING ELECTRICAL CAPACITY 41 IEA 2020. Heat Pumps. https://www.iea.org/reports/heat-pumps 42 Allied Market Research, 2020. https://www.alliedmarketresearch.com/heat-pump-market 43 360Market Update 2018. Global Global HVAC Equipment Market - Segmented By Equipment Type, And Region - Growth, Trends, And Forecast (2018 - 2023)
0.1%
27%
50%
90%
BC
Italy
Sweden
Japan
Market Penetration of Heat Pumps – % of buildings
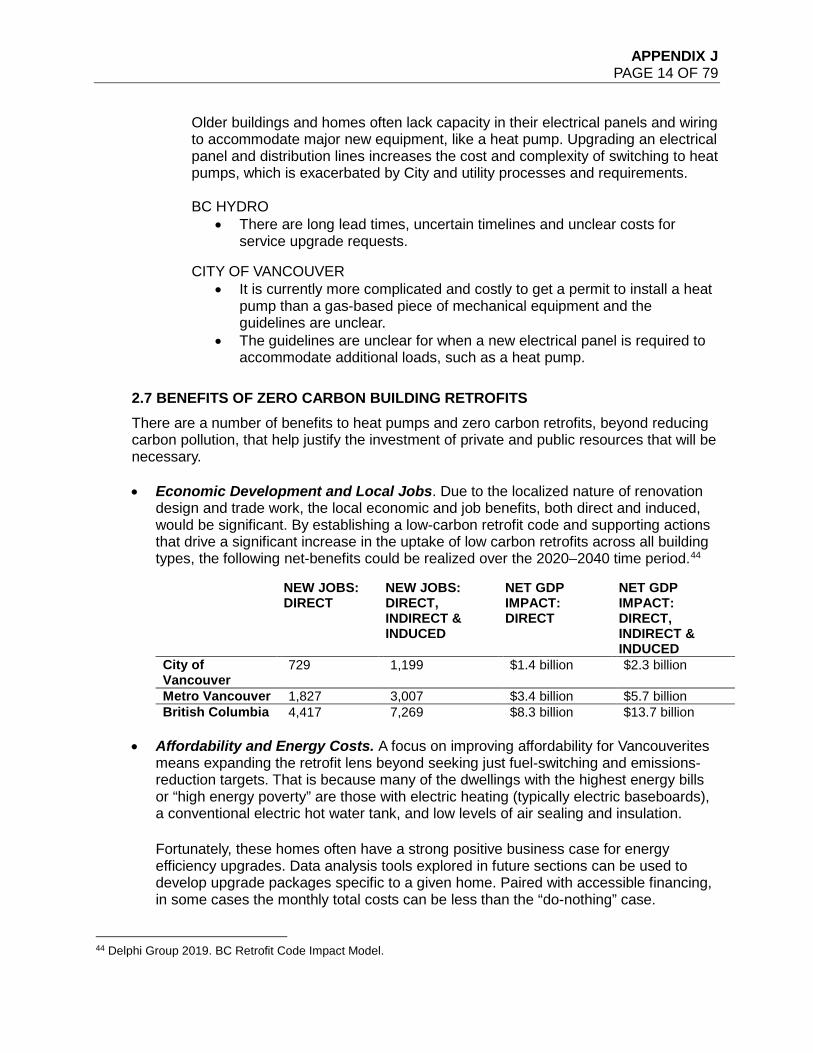
APPENDIX J PAGE 14 OF 79
Older buildings and homes often lack capacity in their electrical panels and wiring to accommodate major new equipment, like a heat pump. Upgrading an electrical panel and distribution lines increases the cost and complexity of switching to heat pumps, which is exacerbated by City and utility processes and requirements. BC HYDRO
• There are long lead times, uncertain timelines and unclear costs for service upgrade requests.
CITY OF VANCOUVER • It is currently more complicated and costly to get a permit to install a heat
pump than a gas-based piece of mechanical equipment and the guidelines are unclear.
• The guidelines are unclear for when a new electrical panel is required to accommodate additional loads, such as a heat pump.
2.7 BENEFITS OF ZERO CARBON BUILDING RETROFITS There are a number of benefits to heat pumps and zero carbon retrofits, beyond reducing carbon pollution, that help justify the investment of private and public resources that will be necessary. • Economic Development and Local Jobs. Due to the localized nature of renovation
design and trade work, the local economic and job benefits, both direct and induced, would be significant. By establishing a low-carbon retrofit code and supporting actions that drive a significant increase in the uptake of low carbon retrofits across all building types, the following net-benefits could be realized over the 2020–2040 time period.44
NEW JOBS: DIRECT
NEW JOBS: DIRECT, INDIRECT & INDUCED
NET GDP IMPACT: DIRECT
NET GDP IMPACT: DIRECT, INDIRECT & INDUCED
City of Vancouver
729 1,199 $1.4 billion $2.3 billion
Metro Vancouver 1,827 3,007 $3.4 billion $5.7 billion British Columbia 4,417 7,269 $8.3 billion $13.7 billion
• Affordability and Energy Costs. A focus on improving affordability for Vancouverites
means expanding the retrofit lens beyond seeking just fuel-switching and emissions-reduction targets. That is because many of the dwellings with the highest energy bills or “high energy poverty” are those with electric heating (typically electric baseboards), a conventional electric hot water tank, and low levels of air sealing and insulation.
• • Fortunately, these homes often have a strong positive business case for energy
efficiency upgrades. Data analysis tools explored in future sections can be used to develop upgrade packages specific to a given home. Paired with accessible financing, in some cases the monthly total costs can be less than the “do-nothing” case.
• 44 Delphi Group 2019. BC Retrofit Code Impact Model.
APPENDIX J PAGE 15 OF 79
• Seismic Resilience. Zero carbon building retrofits, including the addition of heat pumps, can generate significant opportunities for owners to undertake improvements that enhance the seismic resilience of their buildings. In some buildings, such as older low-rise wood-frame condos and apartments, envelope renewal presents an opportunity to both reduce heat loss through draft-proofing and adding insulation, and increase seismic structural performance through strengthening exterior walls. Additionally, gas piping and appliances can be damaged during earthquakes, causing gas leaks and fires, which can lead to loss of life and property. About one in four fires after an earthquake is related to gas leaks. Removing gas from a property is one way to mitigate this risk.
• Cooling and Comfort. As summer heat waves get longer and more intense, there is growing interest in and need for cooling in Vancouver buildings and homes. Heat pumps conveniently provide heat in the winter and cooling in the summer. For a small marginal cost increase over a central or ductless air conditioner, homeowners can get a heat pump, which can then be used to supplement or replace the primary heating system in the winter.
• Health and Resilience to Extreme Weather. In addition to cooling, another important design goal of a zero carbon retrofit is indoor air quality, occupant health and resilience to extreme weather. Many older buildings have poor ventilation that is inadequate for maintaining healthy indoor air quality during normal activities (e.g., venting combustion by-products from cooking and keeping CO2 at comfortable levels with high occupant density). This poor air quality can be exacerbated by extreme weather events, such as wildfire smoke and heat waves. Heat-recovery ventilators (HRVs), which have been required in new homes in Vancouver since 2016, are also beneficial in retrofits and, when combined with a heat pump, can ensure a healthy and comfortable indoor environment even during an acute summer wildfire-induced air quality event.
2.8 COLLABORATION IS ESSENTIAL TO SUCCESS Vancouver’s leadership has been proven to be critical to catalyzing ambitious new building energy codes at the provincial and federal levels. This leadership is also required for existing buildings, where it will be essential for Vancouver to work in partnership with other energy utilities, the Government of B.C. and Metro Vancouver to take a coordinated approach that will result in the scale of industry transformation necessary to address the climate crisis.
2.8.1 THE BC ENERGY STEP CODE The British Columbia Energy Step Code, modelled off of Vancouver’s Zero Emissions Building Plan, is an energy performance code that sets heat loss and energy use limits for new construction. It sets multiple performance steps for each major building type that represent progressively more efficient construction above the requirements of the BC Building Code (BCBC). The Energy Step Code has been voluntarily adopted by 60 B.C. municipalities representing 70% of building starts in B.C. Vancouver is surrounded by municipalities that have adopted the Energy Step Code, including North Vancouver, West Vancouver, Burnaby, Richmond, New Westminster and Surrey.
APPENDIX J PAGE 16 OF 79
Success of ongoing and rapid implementation of ZEB for new construction is in large part due to the widespread adoption of the Energy Step Code by other local governments in B.C. Other governments stepping up sends a clear signal to industry of what needs to change and how fast, normalizes an expectation of better performance, fosters professional and government alignment on training and greatly accelerates industry capacity-building. 2.8.2 THE B.C. BUILDING ELECTRIFICATION ROAD MAP (BERM) The building industry recognizes the importance of change and will be an important partner in planning, funding and implementing zero emissions retrofits. An early demonstration of this partnership and coordination among governments has been through the development of B.C.’s Building Electrification Road Map, which will be released in November 2020. The Roadmap will be a multi-stakeholder led identification of barriers and shared understanding of key actions and roles for making electric space and hot water heating standard practice in BC by 2030 for new construction and retrofits. 2.8.3 GOVERNMENT OF BRITISH COLUMBIA – CLEANBC In 2018, the Government of British Columbia created the CleanBC plan to provide a pathway to reducing emissions through multiple economic sectors.45 For the building sector, the plan includes a three-year, $24-million energy efficiency program that is co-funded with the federal government under the Low Carbon Economy Leadership Fund, with an emphasis on incentives for heat pumps and trades training. Heat pump incentive programs are administered in partnership with BC Hydro, FortisBC and BC Housing. 2.8.4 METRO VANCOUVER Metro Vancouver is responsible for managing and regulating air contaminants in the region, including carbon emissions, under the authority delegated by the Government of B.C. in the Environmental Management Act. Metro Vancouver’s Climate 2050 strategy sets ambitious targets to pursue a carbon-neutral, resilient region by 2050, and to reduce regional carbon emissions by 45% by 2030, from 2010 levels. A Buildings Discussion Paper has been released that includes a “big idea” to reduce emissions from existing buildings through benchmarking and performance requirements. Metro Vancouver is working with the City of Surrey to develop a detailed concept for a regionally coordinated energy and emissions benchmarking program and performance requirements for existing buildings. The results of this work will be brought to the Metro Vancouver Board in early 2021. Metro Vancouver has also been closely involved in research and stakeholder engagement for the development of the ZEB-R Strategy. 2.8.5 THE PAN-CANADIAN FRAMEWORK ON CLEAN GROWTH AND CLIMATE CHANGE The Pan-Canadian Framework on Clean Growth and Climate Change (PCF) commits the federal government to develop a model code for existing buildings by 2022, which can then be adopted by the provinces and territories. A “net-zero
45 Government of British Columbia, CleanBC (2018).
APPENDIX J PAGE 17 OF 79
energy ready” model building code is proposed to be ready for provinces and territories to adopt by 2030. Directly related to ZEB-R, the PCF also sets the goal that by 2035 all space-heating technologies for sale in Canada meet an energy performance of more than 100%. In other words, whether electric or gas, heat pumps will become the minimum equipment efficiency standard. In 2019, the federal government made further commitments for a number of energy retrofit actions including:
• Updating minimum standards for heating equipment and other key technologies to the highest level of efficiency that is economically and technically achievable.
• Providing homeowners and landlords with free energy audits. • Offering interest-free loans of up to $40,000 for energy retrofits. • Investing $100 million in skills training for workers to perform energy
audits, retrofits, and net-zero home construction.
The framework also indicates support of mandatory energy benchmarking and labelling, as well as the continuation and/or expansion of provincial and territorial efforts to retrofit existing buildings.
2.9 CHANGE MUST ADDRESS INEQUITY As policy-makers and service providers, personal and workplace biases exist in many forms that can impact customer experience and policy outcomes. Community and stakeholder outreach to business owners, tradespeople and residents from disproportionately impacted communities has not been adequate in the past and is needed going forward to ensure City objectives are met. Inequity regarding housing and building policy can be a result of several factors, including income, accessibility, age, race, housing tenure, and geographic location. • Vancouver has among the highest costs of living in North America, and one of the
highest in the world when factoring in average employment income. Approximately 7% of households are characterized as experiencing “very high energy poverty”46 and 4% are in “extreme energy poverty”.47
• The 2016 Census designated 22% of Vancouver private households as below the Low Income Measure.48
• Low-income families are more likely to live in residences that are in poor physical condition, leading to high utility bills, unsafe and unhealthy indoor environments, and high carbon pollution.
• About 52% of Vancouver’s population identify as Indigenous, Black, Chinese and other racialized groups. Vancouver has a history of race inequities centred around land use policies that instigate displacement, eviction, higher exposure to air and
46 Energy poverty is typically characterized as spending 10% or more of household income on home energy (metric: annual energy costs/annual income). 47 Canadian Urban Sustainability Practitioners (CUSP) Energy Poverty Explorer Tool, 2020. 48 The Low-income measure, after tax (LIM-AT), refers to a fixed percentage (50%) of median adjusted after-tax income of private households.
APPENDIX J PAGE 18 OF 79
noise pollution, and lower investment in infrastructure, community and cultural services.
• There are numerous small businesses, including building renovation companies, run by residents that primarily speak a language other than English. The City has historically done little to engage these businesses on policies that will have a significant impact on them.
• Renters account for the majority of Vancouver residents, but they have little control over capital investment decisions, and are vulnerable to displacement by a major renovation. When the owner pays for building improvements and the tenant pays the energy bills, the resulting split incentive can discourage energy efficiency upgrades.
Foundational changes are required to address structural inequity, including processes and requirements in the City’s Zoning and Development By-law that determines land use across the City. For example, rethinking land use and exploring novel land use policy tools will be required to effectively address aging, seismically risky and high carbon pollution rental apartment buildings in Vancouver.
2.9.1 EQUITY PEER-REVIEW AND ONGOING TRACKING Feedback and in-depth reviews were gathered from the public via our climate emergency survey, the Climate and Equity Working Group, and third-party experts.49 The feedback has been used to strengthen this strategy. The City is developing an Equity Framework and Climate Justice Charter that will help guide the implementation of this strategy going forward.
49 The Toronto Environmental Alliance (TEA) and Hua Foundation provided an in-depth review of the Climate Emergency Action Plan and related actions within.
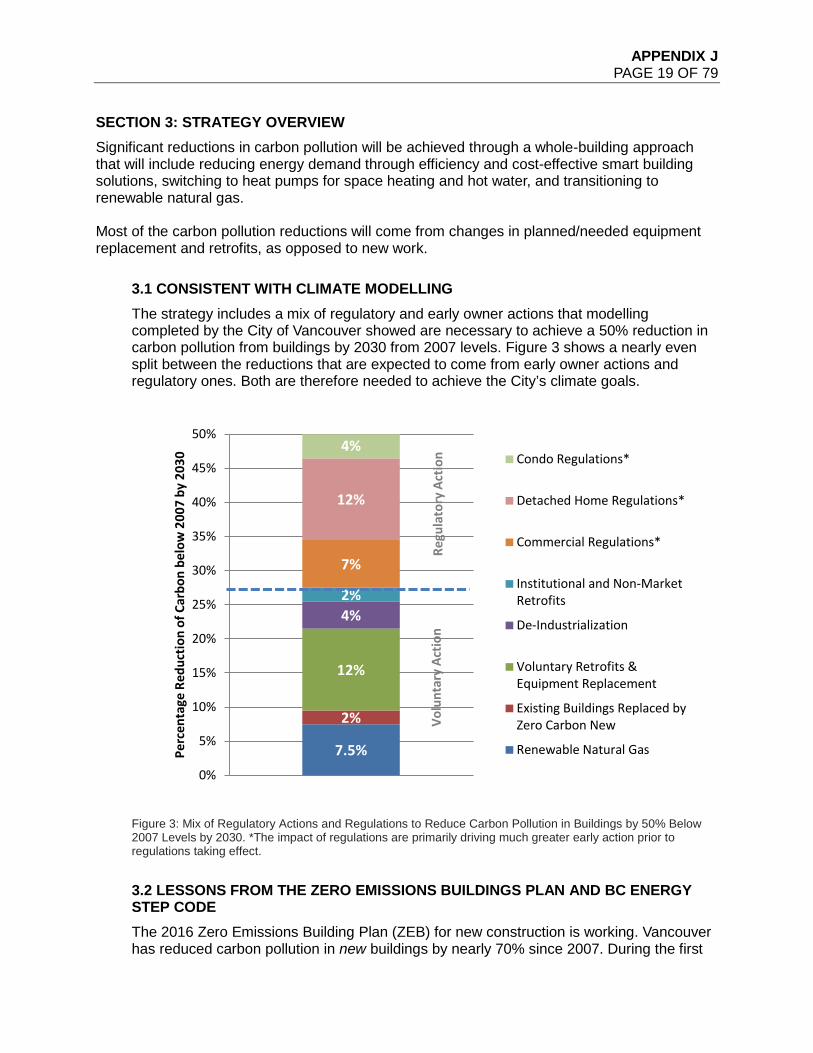
APPENDIX J PAGE 19 OF 79
SECTION 3: STRATEGY OVERVIEW Significant reductions in carbon pollution will be achieved through a whole-building approach that will include reducing energy demand through efficiency and cost-effective smart building solutions, switching to heat pumps for space heating and hot water, and transitioning to renewable natural gas. Most of the carbon pollution reductions will come from changes in planned/needed equipment replacement and retrofits, as opposed to new work.
3.1 CONSISTENT WITH CLIMATE MODELLING The strategy includes a mix of regulatory and early owner actions that modelling completed by the City of Vancouver showed are necessary to achieve a 50% reduction in carbon pollution from buildings by 2030 from 2007 levels. Figure 3 shows a nearly even split between the reductions that are expected to come from early owner actions and regulatory ones. Both are therefore needed to achieve the City’s climate goals.
Figure 3: Mix of Regulatory Actions and Regulations to Reduce Carbon Pollution in Buildings by 50% Below 2007 Levels by 2030. *The impact of regulations are primarily driving much greater early action prior to regulations taking effect.
3.2 LESSONS FROM THE ZERO EMISSIONS BUILDINGS PLAN AND BC ENERGY STEP CODE The 2016 Zero Emissions Building Plan (ZEB) for new construction is working. Vancouver has reduced carbon pollution in new buildings by nearly 70% since 2007. During the first
7.5%
2%
12%
4%2%
7%
12%
4%
0%
5%
10%
15%
20%
25%
30%
35%
40%
45%
50%
Perc
enta
ge R
educ
tion
of C
arbo
n be
low
200
7 by
203
0 Condo Regulations*
Detached Home Regulations*
Commercial Regulations*
Institutional and Non-MarketRetrofits
De-Industrialization
Voluntary Retrofits &Equipment Replacement
Existing Buildings Replaced byZero Carbon New
Renewable Natural Gas
Volu
ntar
y Ac
tion
Regu
lato
ry A
ctio
n
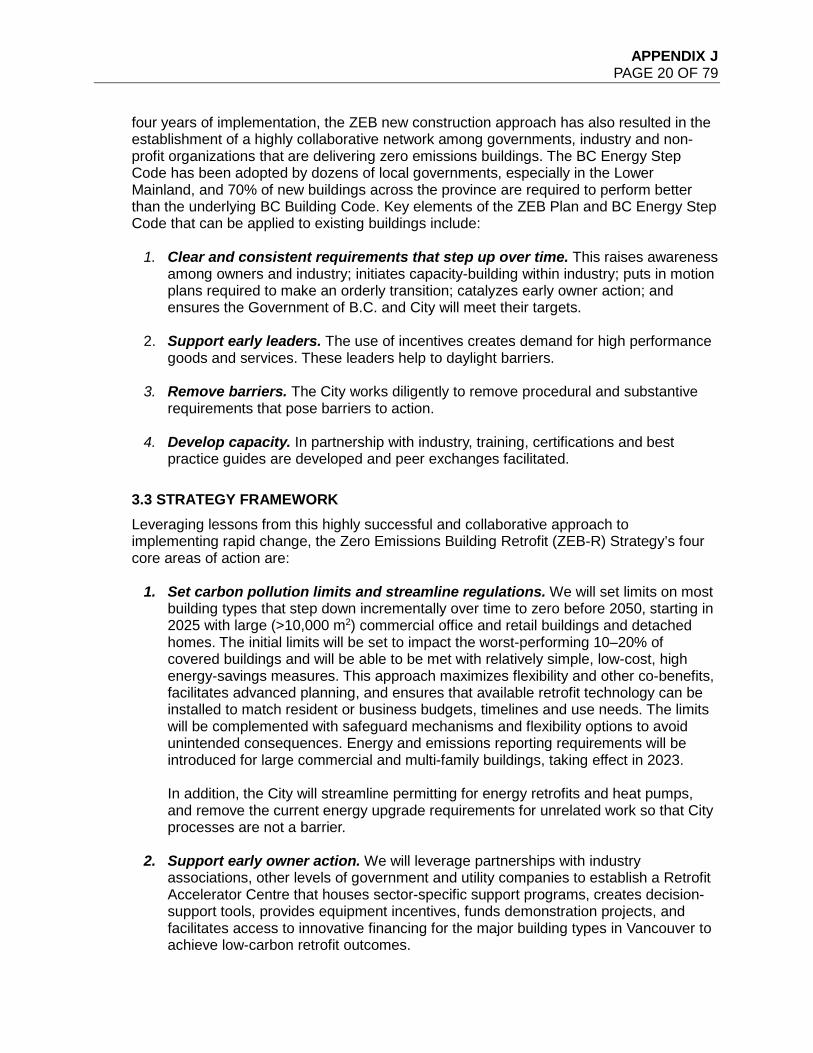
APPENDIX J PAGE 20 OF 79
four years of implementation, the ZEB new construction approach has also resulted in the establishment of a highly collaborative network among governments, industry and non-profit organizations that are delivering zero emissions buildings. The BC Energy Step Code has been adopted by dozens of local governments, especially in the Lower Mainland, and 70% of new buildings across the province are required to perform better than the underlying BC Building Code. Key elements of the ZEB Plan and BC Energy Step Code that can be applied to existing buildings include:
1. Clear and consistent requirements that step up over time. This raises awareness among owners and industry; initiates capacity-building within industry; puts in motion plans required to make an orderly transition; catalyzes early owner action; and ensures the Government of B.C. and City will meet their targets.
2. Support early leaders. The use of incentives creates demand for high performance goods and services. These leaders help to daylight barriers.
3. Remove barriers. The City works diligently to remove procedural and substantive requirements that pose barriers to action.
4. Develop capacity. In partnership with industry, training, certifications and best practice guides are developed and peer exchanges facilitated.
3.3 STRATEGY FRAMEWORK Leveraging lessons from this highly successful and collaborative approach to implementing rapid change, the Zero Emissions Building Retrofit (ZEB-R) Strategy’s four core areas of action are:
1. Set carbon pollution limits and streamline regulations. We will set limits on most building types that step down incrementally over time to zero before 2050, starting in 2025 with large (>10,000 m2) commercial office and retail buildings and detached homes. The initial limits will be set to impact the worst-performing 10–20% of covered buildings and will be able to be met with relatively simple, low-cost, high energy-savings measures. This approach maximizes flexibility and other co-benefits, facilitates advanced planning, and ensures that available retrofit technology can be installed to match resident or business budgets, timelines and use needs. The limits will be complemented with safeguard mechanisms and flexibility options to avoid unintended consequences. Energy and emissions reporting requirements will be introduced for large commercial and multi-family buildings, taking effect in 2023.
In addition, the City will streamline permitting for energy retrofits and heat pumps, and remove the current energy upgrade requirements for unrelated work so that City processes are not a barrier.
2. Support early owner action. We will leverage partnerships with industry
associations, other levels of government and utility companies to establish a Retrofit Accelerator Centre that houses sector-specific support programs, creates decision-support tools, provides equipment incentives, funds demonstration projects, and facilitates access to innovative financing for the major building types in Vancouver to achieve low-carbon retrofit outcomes.
APPENDIX J PAGE 21 OF 79
3. Build industry capacity. We will work in partnership with industry associations to
ensure that there is clarity on future regulations among building owners, contractors and the trades and equipment suppliers working in all building sectors. The City will work with industry, the provincial government and utilities to increase the capacity and quality of heat pump installations in detached homes through qualified trades incentives and requirements. The City will partner with the Metro Vancouver Regional LC3 Low Carbon Innovation Centre that will complement the ongoing work of ZEBx in supporting industry and owners to deliver low carbon buildings retrofits. The City will also work with industry, utilities and government to implement B.C.’s Building Electrification Road Map so that actions are coordinated and supported across sectors.
4. Facilitate access to renewable energy. We will work in partnership with BC Hydro
and FortisBC, as well as district energy providers, to significantly scale up building electrification, renewable gas use, and other zero emissions heating supply. To do this, we will understand and address infrastructure constraints, advocate for rate structures and financial incentives that facilitate uptake of renewable energy equipment for space heating and hot water, and develop a roadmap to transition the City-owned Neighbourhood Energy Utility (NEU) to 100% renewable energy by 2030.
The four key action areas of the ZEB-R Strategy are inter-connected and need to be advanced in parallel, given the multiple, connected barriers to overcome before zero carbon renovations to existing buildings are standard practice. Once the regulatory signal is established (#1), action areas 2, 3 and 4 are necessary for carbon pollution regulations be successfully implemented, like three legs supporting a table. Partnerships with industry and leadership by the provincial government and utilities will be critical to effectiveness of each of these areas.
APPENDIX J PAGE 22 OF 79
3.4 CO-BENEFITS OF REDUCING CARBON POLLUTION The transition to zero emissions will not be free or easy, but when implemented through a resilient-buildings framework—where policies and programs are designed holistically to make buildings better overall and to prioritize addressing our most pressing needs, such as affordability, local economy, health and equity—the investment will have tangible co-benefits. Through the actions described in this strategy, we will capitalize on the opportunity to make this a just and prosperous transition through local job creation, improving the quality and resilience of the building stock, and making indoor spaces healthier and more comfortable for Vancouver residents and workers, while investing in the future of the planet.
APPENDIX J PAGE 23 OF 79
SECTION 4: SET CARBON POLLUTION LIMITS AND STREAMLINE REGULATIONS
4.1 OVERVIEW Establishing carbon pollution limits that decline in predictable steps over time and streamlining regulations is a critical step to reducing emissions from existing buildings, as this sets a clear signal to the industry on expectations of building performance, and clarifies when those expectations will need to be met. This approach maximizes flexibility and other co-benefits, facilitates advanced planning, and ensures that available retrofit technology can be installed to match resident or business budgets, timelines and use needs. Energy and emissions reporting requirements will be introduced to help owners plan for improvements and ensure compliance with the carbon limits.
4.1.1 KEY ACTIONS 1. Remove Energy Upgrade Requirements for Non-Energy Renovation
Projects. The City will remove existing energy upgrade requirements as they are replaced with carbon pollution limits and prescriptive requirements for select heating equipment. This will reduce pressure and complexity for permit review staff, and simplify the process for applicants and small commercial tenants making investments in their buildings or retail spaces.
2. Streamline Permitting. The City will streamline the heat pump permit process for larger buildings, including central rooftop heat pumps, and placement on balconies, and pad-mounted heat pumps.
3. Require Annual Energy and Emissions Reporting. The City will also implement energy benchmarking and reporting requirements for buildings and a virtual emissions score tool for detached homes in 2023, in advance of carbon limits coming in to force, to provide owners time to determine compliance, plan improvements and implement retrofits.
4. Set Carbon Pollution Limits. The City of Vancouver will implement evidence-based, annual carbon pollution limits to maximize flexibility for owners. An annual carbon pollution limit (tonnes CO2e/year) will be applied to detached homes, while commercial buildings will be subject to carbon intensity limits (kg CO2e/m2/year). In both cases, owners will have access to multiple compliance options to maximize flexibility. Carbon pollution limits will decrease in five-year increments toward zero emissions before 2050, and will be developed to enable compliance primarily in conjunction with other planned or needed building investments. By clearly signaling future limits, owners, trades and the building industry will be able to prepare for and benefit from a predictable transition toward zero emissions buildings.
5. Create Prescriptive Requirements for Select Heating Equipment. As a supplement to the carbon pollution limits, prescription requirements for select heating equipment will be established where costs and technology availability are conducive for a broader set of commercial buildings and
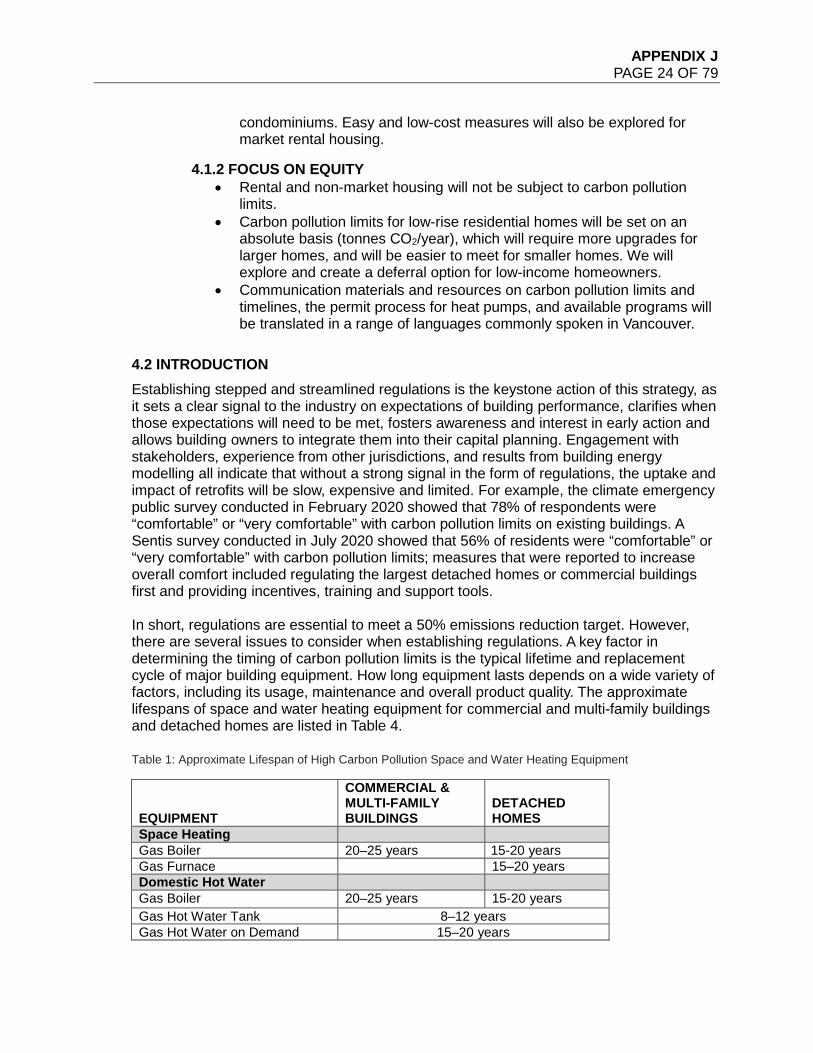
APPENDIX J PAGE 24 OF 79
condominiums. Easy and low-cost measures will also be explored for market rental housing.
4.1.2 FOCUS ON EQUITY • Rental and non-market housing will not be subject to carbon pollution
limits. • Carbon pollution limits for low-rise residential homes will be set on an
absolute basis (tonnes CO2/year), which will require more upgrades for larger homes, and will be easier to meet for smaller homes. We will explore and create a deferral option for low-income homeowners.
• Communication materials and resources on carbon pollution limits and timelines, the permit process for heat pumps, and available programs will be translated in a range of languages commonly spoken in Vancouver.
4.2 INTRODUCTION Establishing stepped and streamlined regulations is the keystone action of this strategy, as it sets a clear signal to the industry on expectations of building performance, clarifies when those expectations will need to be met, fosters awareness and interest in early action and allows building owners to integrate them into their capital planning. Engagement with stakeholders, experience from other jurisdictions, and results from building energy modelling all indicate that without a strong signal in the form of regulations, the uptake and impact of retrofits will be slow, expensive and limited. For example, the climate emergency public survey conducted in February 2020 showed that 78% of respondents were “comfortable” or “very comfortable” with carbon pollution limits on existing buildings. A Sentis survey conducted in July 2020 showed that 56% of residents were “comfortable” or “very comfortable” with carbon pollution limits; measures that were reported to increase overall comfort included regulating the largest detached homes or commercial buildings first and providing incentives, training and support tools. In short, regulations are essential to meet a 50% emissions reduction target. However, there are several issues to consider when establishing regulations. A key factor in determining the timing of carbon pollution limits is the typical lifetime and replacement cycle of major building equipment. How long equipment lasts depends on a wide variety of factors, including its usage, maintenance and overall product quality. The approximate lifespans of space and water heating equipment for commercial and multi-family buildings and detached homes are listed in Table 4.
Table 1: Approximate Lifespan of High Carbon Pollution Space and Water Heating Equipment
EQUIPMENT
COMMERCIAL & MULTI-FAMILY BUILDINGS
DETACHED HOMES
Space Heating Gas Boiler 20–25 years 15-20 years Gas Furnace 15–20 years Domestic Hot Water Gas Boiler 20–25 years 15-20 years Gas Hot Water Tank 8–12 years Gas Hot Water on Demand 15–20 years
APPENDIX J PAGE 25 OF 79
The table shows that by the 2040s, all heating and hot water equipment in buildings today will be replaced (based on these typical lifespans). By establishing clear carbon pollution limits coupled with timelines for future requirements, owners can begin choosing “no regrets” equipment that will enable them to comply with future carbon pollution regulations as the need to replace them arises. Carbon pollution limits and prescriptive equipment requirements can also serve to accelerate the early replacement rate by driving early action ahead of established targets, particularly where there is a positive business case, multiple co-benefits and owner capacity. The following sections outline the key actions that the City will take to create strong and streamlined regulations for existing buildings.
4.3 REMOVE ENERGY UPGRADE REQUIREMENTS FOR UNRELATED, PERMITTED WORK The City will remove the energy upgrade requirements in Part 11 (Existing Building Alterations) of the Vancouver Building By-law that are triggered when a building owner/tenant applies for a building permit to undertake renovations in an existing building. Removing these requirements will result in a reduction in permit application and processing times, as well as reduced costs for building owners and tenants. This will eliminate a barrier faced by commercial tenants who must coordinate renovations with both building owners/managers and the City. Removing the Part 11 energy upgrade requirements will also simplify the permitting process for owners of residential ground-oriented dwellings.
4.4 STREAMLINE PERMITTING FOR HEAT PUMPS Overly complicated and restrictive permitting requirements for standard heat pumps installations is identified as a key barrier to early owner action in the forthcoming B.C. Building Electrification Road Map. Of particular importance in the near-term will be to establish a simple, consistent and low-cost process for low-carbon retrofits, focused on simplifying the process for installing an electric heat pump. In 2020, the City took a number of steps to start to address this issue, including:
• A new page dedicated to electric heat pump permitting on the City of Vancouver website.
• A revised, simplified bulletin for low-rise housing. If an installation meets specific criteria, the project only requires an online electric permit.
• A public-friendly “Neighbourly Noise Guideline” to help owners and contractors select and install a quiet, hassle-free system.
Additional steps that will be taken over the next year include: 1) establishing a low-cost, flat fee for any heat pump permit, and 2) streamlining the heat pump permit process for pad mounted residential heat pumps, balcony-mounted mini-split heat pumps, and roof-mounted central heat pumps.
4.5 ENERGY AND EMISSIONS REPORTING In order to successfully develop and enforce a carbon pollution limit, robust energy and emissions data collection is essential. Requiring building owners to report their energy and
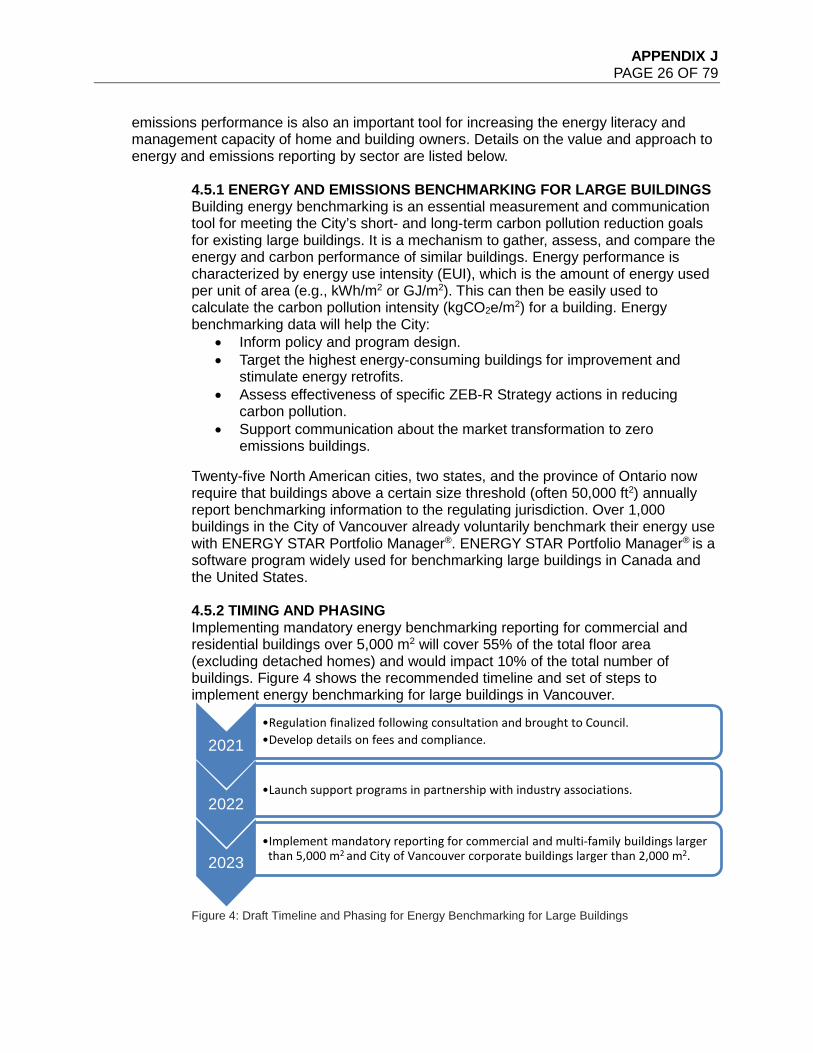
APPENDIX J PAGE 26 OF 79
emissions performance is also an important tool for increasing the energy literacy and management capacity of home and building owners. Details on the value and approach to energy and emissions reporting by sector are listed below.
4.5.1 ENERGY AND EMISSIONS BENCHMARKING FOR LARGE BUILDINGS Building energy benchmarking is an essential measurement and communication tool for meeting the City’s short- and long-term carbon pollution reduction goals for existing large buildings. It is a mechanism to gather, assess, and compare the energy and carbon performance of similar buildings. Energy performance is characterized by energy use intensity (EUI), which is the amount of energy used per unit of area (e.g., kWh/m2 or GJ/m2). This can then be easily used to calculate the carbon pollution intensity (kgCO2e/m2) for a building. Energy benchmarking data will help the City:
• Inform policy and program design. • Target the highest energy-consuming buildings for improvement and
stimulate energy retrofits. • Assess effectiveness of specific ZEB-R Strategy actions in reducing
carbon pollution. • Support communication about the market transformation to zero
emissions buildings.
Twenty-five North American cities, two states, and the province of Ontario now require that buildings above a certain size threshold (often 50,000 ft2) annually report benchmarking information to the regulating jurisdiction. Over 1,000 buildings in the City of Vancouver already voluntarily benchmark their energy use with ENERGY STAR Portfolio Manager®. ENERGY STAR Portfolio Manager® is a software program widely used for benchmarking large buildings in Canada and the United States. 4.5.2 TIMING AND PHASING Implementing mandatory energy benchmarking reporting for commercial and residential buildings over 5,000 m2 will cover 55% of the total floor area (excluding detached homes) and would impact 10% of the total number of buildings. Figure 4 shows the recommended timeline and set of steps to implement energy benchmarking for large buildings in Vancouver.
Figure 4: Draft Timeline and Phasing for Energy Benchmarking for Large Buildings
2021•Regulation finalized following consultation and brought to Council.•Develop details on fees and compliance.
2022•Launch support programs in partnership with industry associations.
2023•Implement mandatory reporting for commercial and multi-family buildings larger
than 5,000 m2 and City of Vancouver corporate buildings larger than 2,000 m2.
APPENDIX J PAGE 27 OF 79
4.5.3 HOME VIRTUAL ENERGY AND EMISSIONS RATING Energy and emissions residential databases that can be used for energy and emissions reporting for low-rise apartment buildings and detached housing are less established than they are for large buildings. To address this gap, the City is working with Natural Resources Canada (NRCan) to develop a Virtual EnerGuide Rating System (VERS) for homes. Since 2007, the City of Vancouver has required EnerGuide home energy assessments for new homes and when an owner undertakes a renovation. This has resulted in over 15,000 assessments of all ages and types of homes, which are effective in modeling annual carbon pollution for each home. The City and NRCan’s Virtual EnerGuide Rating System (VERS) will be a virtual model that estimates energy use and carbon pollution. Instead of an in-person home assessment, a software model will calculate a “virtual” rating based on the systems in the home. These virtual ratings, once tested, could serve as the initial emissions compliance metric for Vancouver homes, subject to verification by the homeowner. Owners whose home fails based on the model will have the option of providing their FortisBC gas bill data that shows actual natural gas usage to demonstrate compliance with the carbon pollution limit.
4.6 SET CARBON LIMITS FOR EXISTING BUILDINGS While carbon pollution limits will eventually be required for most buildings, some building types and residential tenures are better suited today than others. To help ensure undue burden is not placed on those building types and residents that may face greater challenges in converting to low-carbon energy systems, the following sub-sections outline the draft carbon pollution limits and the associated timeline for compliance for each major building type. Draft limits and their timelines are based on initial analysis of Vancouver’s building stock undertaken by City staff, the details of which are included in the report’s Supplemental Information section.
4.6.1 PHASING Carbon pollution limits will be signaled well in advance to provide owners with the time they need to evaluate their options and choose measures that make the most sense for their building/home. Initial carbon limits will be modest and impact the worst-performing 10–20% of buildings and homes, where the upgrades needed to comply are low-cost and provide energy savings and co-benefits. These initial limits will help people get comfortable with the compliance options and requirements, the reporting systems, and the various support tools. They will also set the stage for more significant requirements in 2030 and beyond. Future limits for 2030 to 2050 will be developed to clearly signal to owners that new investments in high-efficiency renewable energy heating and hot water equipment is necessary. This will allow owners to develop a customized plan aligned with other needed or desired building investments that will occur over time. The data collected from the City’s building energy benchmarking and Home VERS will be used to help to establish these limits.
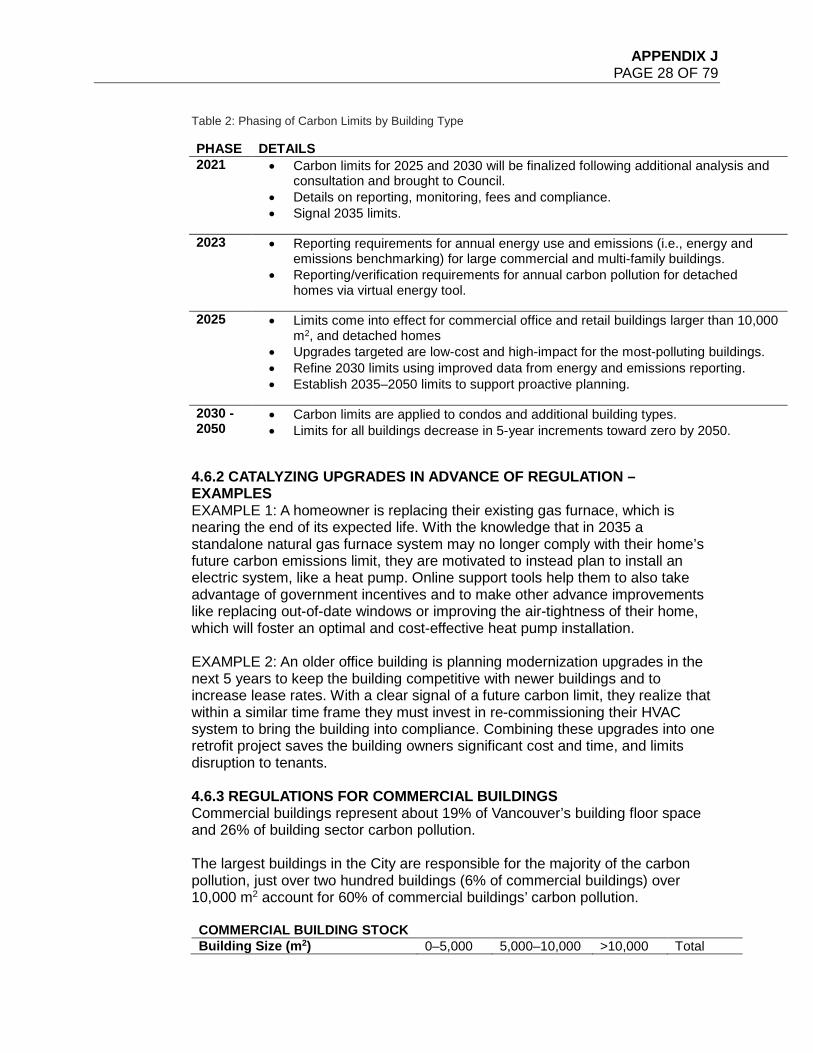
APPENDIX J PAGE 28 OF 79
Table 2: Phasing of Carbon Limits by Building Type
PHASE DETAILS 2021 • Carbon limits for 2025 and 2030 will be finalized following additional analysis and
consultation and brought to Council. • Details on reporting, monitoring, fees and compliance. • Signal 2035 limits.
2023 • Reporting requirements for annual energy use and emissions (i.e., energy and emissions benchmarking) for large commercial and multi-family buildings.
• Reporting/verification requirements for annual carbon pollution for detached homes via virtual energy tool.
2025 • Limits come into effect for commercial office and retail buildings larger than 10,000 m2, and detached homes
• Upgrades targeted are low-cost and high-impact for the most-polluting buildings. • Refine 2030 limits using improved data from energy and emissions reporting. • Establish 2035–2050 limits to support proactive planning.
2030 - 2050
• Carbon limits are applied to condos and additional building types. • Limits for all buildings decrease in 5-year increments toward zero by 2050.
4.6.2 CATALYZING UPGRADES IN ADVANCE OF REGULATION – EXAMPLES EXAMPLE 1: A homeowner is replacing their existing gas furnace, which is nearing the end of its expected life. With the knowledge that in 2035 a standalone natural gas furnace system may no longer comply with their home’s future carbon emissions limit, they are motivated to instead plan to install an electric system, like a heat pump. Online support tools help them to also take advantage of government incentives and to make other advance improvements like replacing out-of-date windows or improving the air-tightness of their home, which will foster an optimal and cost-effective heat pump installation. EXAMPLE 2: An older office building is planning modernization upgrades in the next 5 years to keep the building competitive with newer buildings and to increase lease rates. With a clear signal of a future carbon limit, they realize that within a similar time frame they must invest in re-commissioning their HVAC system to bring the building into compliance. Combining these upgrades into one retrofit project saves the building owners significant cost and time, and limits disruption to tenants. 4.6.3 REGULATIONS FOR COMMERCIAL BUILDINGS Commercial buildings represent about 19% of Vancouver’s building floor space and 26% of building sector carbon pollution. The largest buildings in the City are responsible for the majority of the carbon pollution, just over two hundred buildings (6% of commercial buildings) over 10,000 m2 account for 60% of commercial buildings’ carbon pollution.
COMMERCIAL BUILDING STOCK Building Size (m2) 0–5,000 5,000–10,000 >10,000 Total
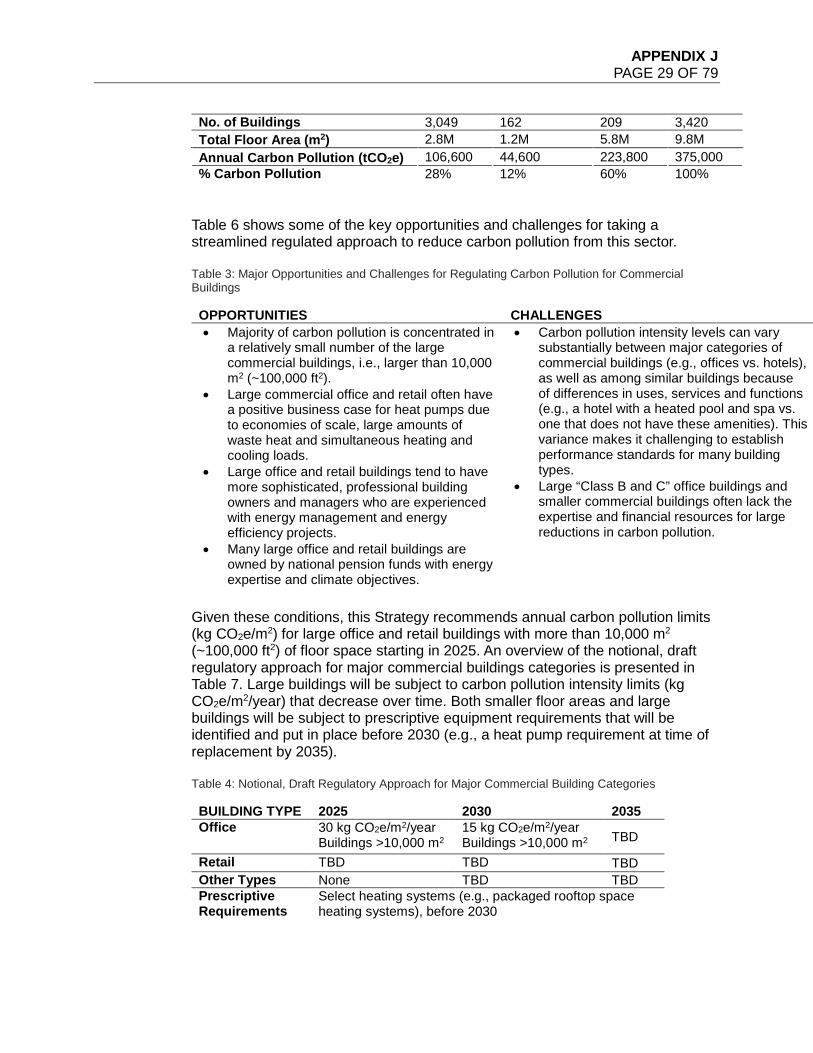
APPENDIX J PAGE 29 OF 79
No. of Buildings 3,049 162 209 3,420 Total Floor Area (m2) 2.8M 1.2M 5.8M 9.8M Annual Carbon Pollution (tCO2e) 106,600 44,600 223,800 375,000 % Carbon Pollution 28% 12% 60% 100%
Table 6 shows some of the key opportunities and challenges for taking a streamlined regulated approach to reduce carbon pollution from this sector.
Table 3: Major Opportunities and Challenges for Regulating Carbon Pollution for Commercial Buildings
OPPORTUNITIES CHALLENGES • Majority of carbon pollution is concentrated in
a relatively small number of the large commercial buildings, i.e., larger than 10,000 m2 (~100,000 ft2).
• Large commercial office and retail often have a positive business case for heat pumps due to economies of scale, large amounts of waste heat and simultaneous heating and cooling loads.
• Large office and retail buildings tend to have more sophisticated, professional building owners and managers who are experienced with energy management and energy efficiency projects.
• Many large office and retail buildings are owned by national pension funds with energy expertise and climate objectives.
• Carbon pollution intensity levels can vary substantially between major categories of commercial buildings (e.g., offices vs. hotels), as well as among similar buildings because of differences in uses, services and functions (e.g., a hotel with a heated pool and spa vs. one that does not have these amenities). This variance makes it challenging to establish performance standards for many building types.
• Large “Class B and C” office buildings and smaller commercial buildings often lack the expertise and financial resources for large reductions in carbon pollution.
Given these conditions, this Strategy recommends annual carbon pollution limits (kg CO2e/m2) for large office and retail buildings with more than 10,000 m2
(~100,000 ft2) of floor space starting in 2025. An overview of the notional, draft regulatory approach for major commercial buildings categories is presented in Table 7. Large buildings will be subject to carbon pollution intensity limits (kg CO2e/m2/year) that decrease over time. Both smaller floor areas and large buildings will be subject to prescriptive equipment requirements that will be identified and put in place before 2030 (e.g., a heat pump requirement at time of replacement by 2035). Table 4: Notional, Draft Regulatory Approach for Major Commercial Building Categories
BUILDING TYPE 2025 2030 2035 Office 30 kg CO2e/m2/year
Buildings >10,000 m2 15 kg CO2e/m2/year Buildings >10,000 m2 TBD
Retail TBD TBD TBD Other Types None TBD TBD Prescriptive Requirements
Select heating systems (e.g., packaged rooftop space heating systems), before 2030
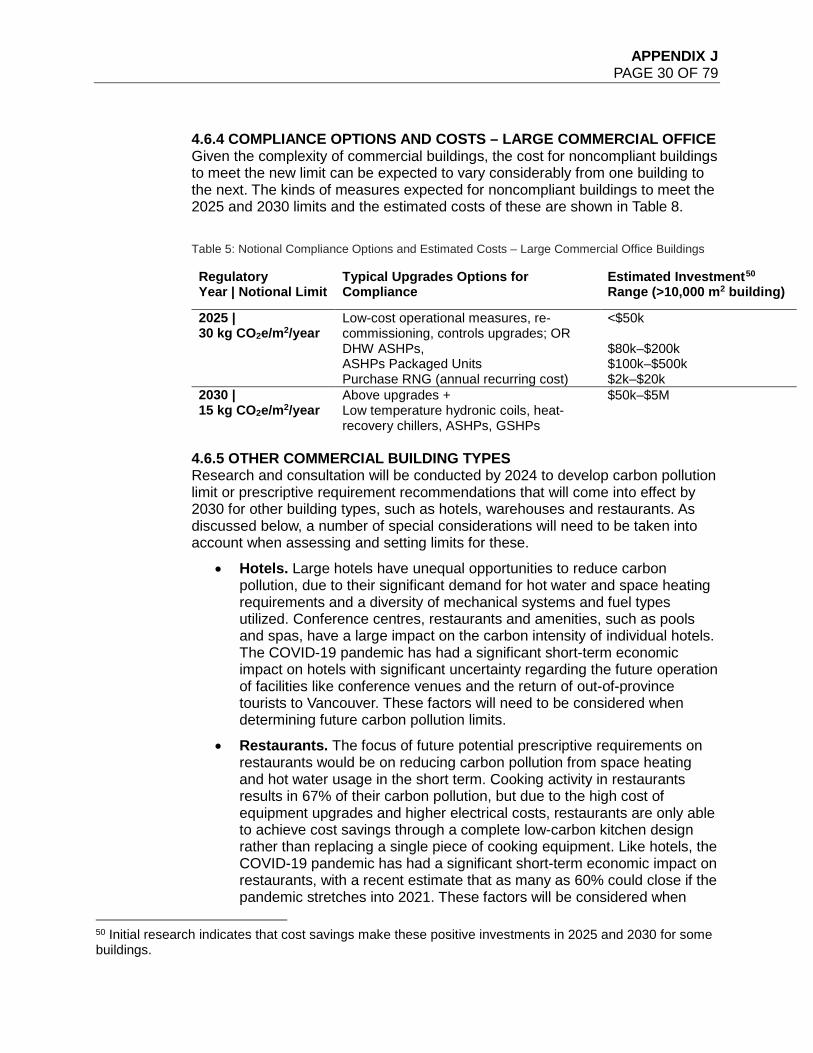
APPENDIX J PAGE 30 OF 79
4.6.4 COMPLIANCE OPTIONS AND COSTS – LARGE COMMERCIAL OFFICE Given the complexity of commercial buildings, the cost for noncompliant buildings to meet the new limit can be expected to vary considerably from one building to the next. The kinds of measures expected for noncompliant buildings to meet the 2025 and 2030 limits and the estimated costs of these are shown in Table 8.
Table 5: Notional Compliance Options and Estimated Costs – Large Commercial Office Buildings
Regulatory Year | Notional Limit
Typical Upgrades Options for Compliance
Estimated Investment50 Range (>10,000 m2 building)
2025 | 30 kg CO2e/m2/year
Low-cost operational measures, re-commissioning, controls upgrades; OR DHW ASHPs, ASHPs Packaged Units Purchase RNG (annual recurring cost)
<$50k $80k–$200k $100k–$500k $2k–$20k
2030 | 15 kg CO2e/m2/year
Above upgrades + Low temperature hydronic coils, heat-recovery chillers, ASHPs, GSHPs
$50k–$5M
4.6.5 OTHER COMMERCIAL BUILDING TYPES Research and consultation will be conducted by 2024 to develop carbon pollution limit or prescriptive requirement recommendations that will come into effect by 2030 for other building types, such as hotels, warehouses and restaurants. As discussed below, a number of special considerations will need to be taken into account when assessing and setting limits for these.
• Hotels. Large hotels have unequal opportunities to reduce carbon pollution, due to their significant demand for hot water and space heating requirements and a diversity of mechanical systems and fuel types utilized. Conference centres, restaurants and amenities, such as pools and spas, have a large impact on the carbon intensity of individual hotels. The COVID-19 pandemic has had a significant short-term economic impact on hotels with significant uncertainty regarding the future operation of facilities like conference venues and the return of out-of-province tourists to Vancouver. These factors will need to be considered when determining future carbon pollution limits.
• Restaurants. The focus of future potential prescriptive requirements on restaurants would be on reducing carbon pollution from space heating and hot water usage in the short term. Cooking activity in restaurants results in 67% of their carbon pollution, but due to the high cost of equipment upgrades and higher electrical costs, restaurants are only able to achieve cost savings through a complete low-carbon kitchen design rather than replacing a single piece of cooking equipment. Like hotels, the COVID-19 pandemic has had a significant short-term economic impact on restaurants, with a recent estimate that as many as 60% could close if the pandemic stretches into 2021. These factors will be considered when
50 Initial research indicates that cost savings make these positive investments in 2025 and 2030 for some buildings.
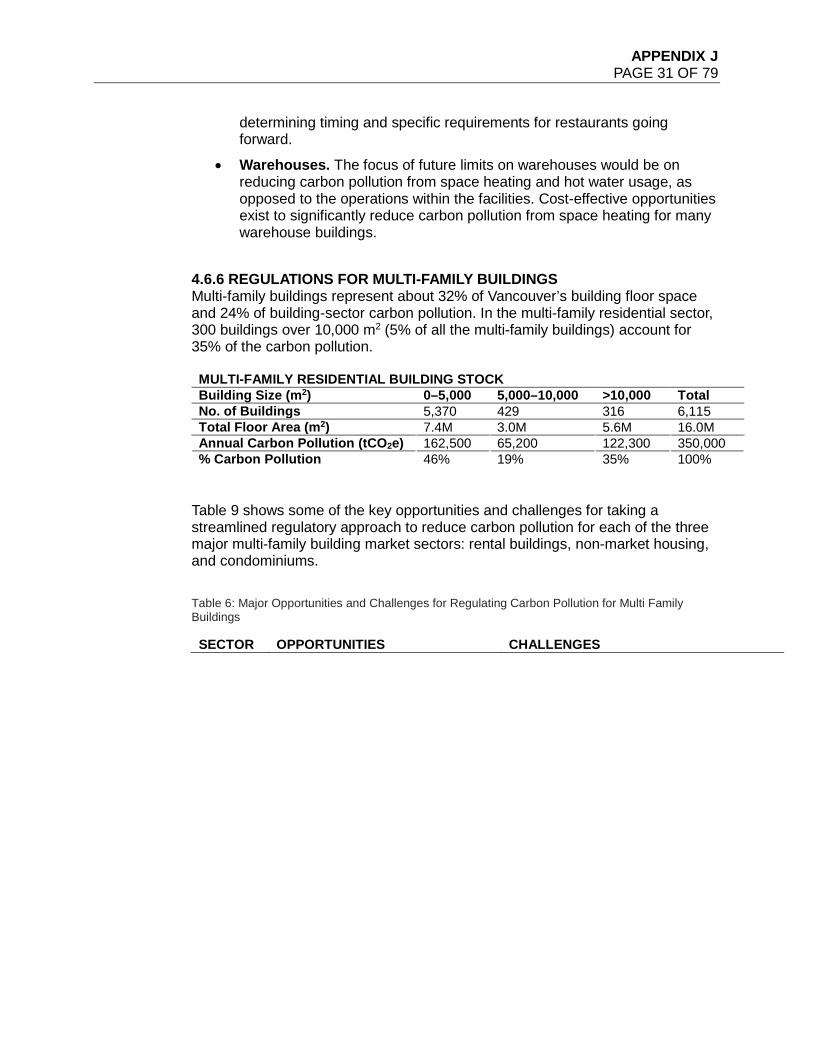
APPENDIX J PAGE 31 OF 79
determining timing and specific requirements for restaurants going forward.
• Warehouses. The focus of future limits on warehouses would be on reducing carbon pollution from space heating and hot water usage, as opposed to the operations within the facilities. Cost-effective opportunities exist to significantly reduce carbon pollution from space heating for many warehouse buildings.
4.6.6 REGULATIONS FOR MULTI-FAMILY BUILDINGS Multi-family buildings represent about 32% of Vancouver’s building floor space and 24% of building-sector carbon pollution. In the multi-family residential sector, 300 buildings over 10,000 m2 (5% of all the multi-family buildings) account for 35% of the carbon pollution.
MULTI-FAMILY RESIDENTIAL BUILDING STOCK Building Size (m2) 0–5,000 5,000–10,000 >10,000 Total No. of Buildings 5,370 429 316 6,115 Total Floor Area (m2) 7.4M 3.0M 5.6M 16.0M Annual Carbon Pollution (tCO2e) 162,500 65,200 122,300 350,000 % Carbon Pollution 46% 19% 35% 100%
Table 9 shows some of the key opportunities and challenges for taking a streamlined regulatory approach to reduce carbon pollution for each of the three major multi-family building market sectors: rental buildings, non-market housing, and condominiums.
Table 6: Major Opportunities and Challenges for Regulating Carbon Pollution for Multi Family Buildings
SECTOR OPPORTUNITIES CHALLENGES
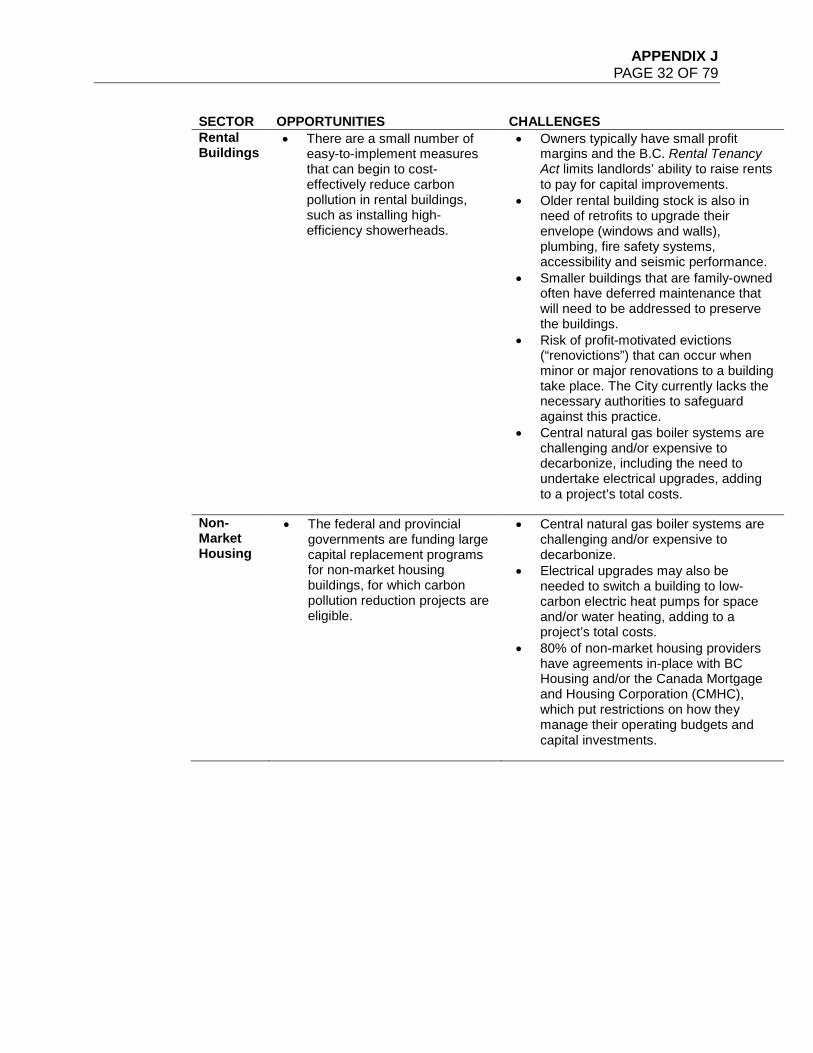
APPENDIX J PAGE 32 OF 79
SECTOR OPPORTUNITIES CHALLENGES Rental Buildings
• There are a small number of easy-to-implement measures that can begin to cost-effectively reduce carbon pollution in rental buildings, such as installing high-efficiency showerheads.
• Owners typically have small profit margins and the B.C. Rental Tenancy Act limits landlords’ ability to raise rents to pay for capital improvements.
• Older rental building stock is also in need of retrofits to upgrade their envelope (windows and walls), plumbing, fire safety systems, accessibility and seismic performance.
• Smaller buildings that are family-owned often have deferred maintenance that will need to be addressed to preserve the buildings.
• Risk of profit-motivated evictions (“renovictions”) that can occur when minor or major renovations to a building take place. The City currently lacks the necessary authorities to safeguard against this practice.
• Central natural gas boiler systems are challenging and/or expensive to decarbonize, including the need to undertake electrical upgrades, adding to a project’s total costs.
Non-Market Housing
• The federal and provincial governments are funding large capital replacement programs for non-market housing buildings, for which carbon pollution reduction projects are eligible.
• Central natural gas boiler systems are challenging and/or expensive to decarbonize.
• Electrical upgrades may also be needed to switch a building to low-carbon electric heat pumps for space and/or water heating, adding to a project’s total costs.
• 80% of non-market housing providers have agreements in-place with BC Housing and/or the Canada Mortgage and Housing Corporation (CMHC), which put restrictions on how they manage their operating budgets and capital investments.
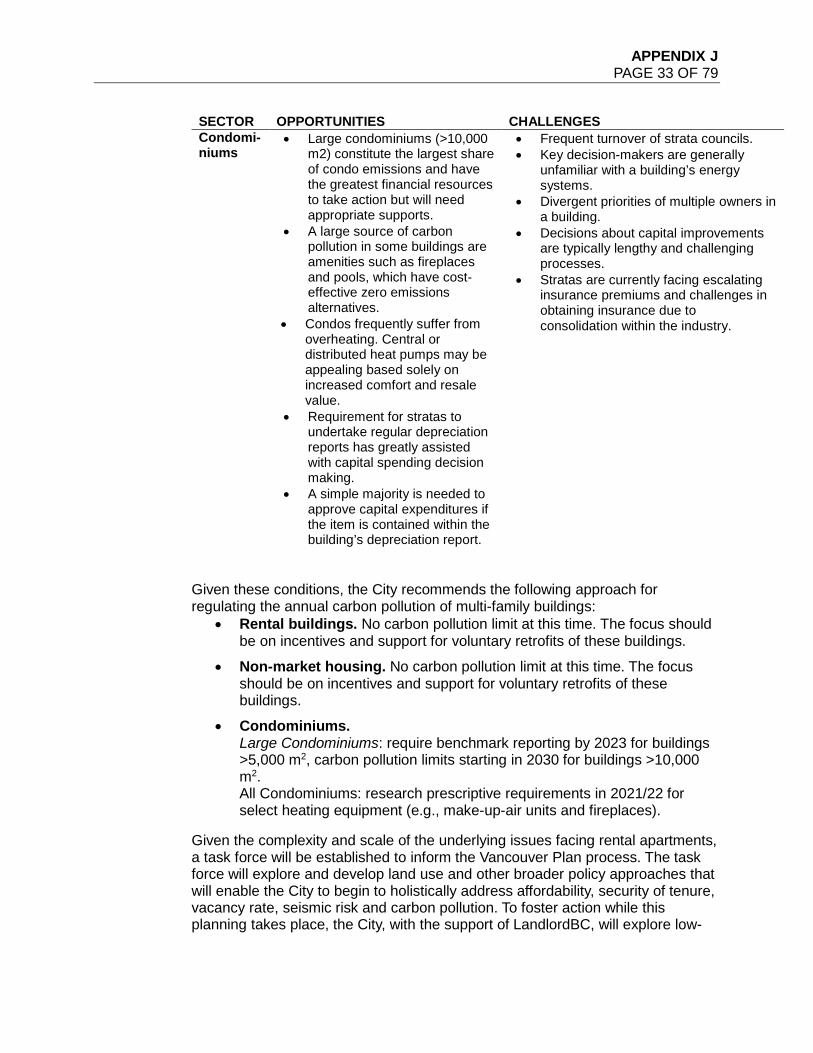
APPENDIX J PAGE 33 OF 79
SECTOR OPPORTUNITIES CHALLENGES Condomi-niums
• Large condominiums (>10,000 m2) constitute the largest share of condo emissions and have the greatest financial resources to take action but will need appropriate supports.
• A large source of carbon pollution in some buildings are amenities such as fireplaces and pools, which have cost-effective zero emissions alternatives.
• Condos frequently suffer from overheating. Central or distributed heat pumps may be appealing based solely on increased comfort and resale value.
• Requirement for stratas to undertake regular depreciation reports has greatly assisted with capital spending decision making.
• A simple majority is needed to approve capital expenditures if the item is contained within the building’s depreciation report.
• Frequent turnover of strata councils. • Key decision-makers are generally
unfamiliar with a building’s energy systems.
• Divergent priorities of multiple owners in a building.
• Decisions about capital improvements are typically lengthy and challenging processes.
• Stratas are currently facing escalating insurance premiums and challenges in obtaining insurance due to consolidation within the industry.
Given these conditions, the City recommends the following approach for regulating the annual carbon pollution of multi-family buildings:
• Rental buildings. No carbon pollution limit at this time. The focus should be on incentives and support for voluntary retrofits of these buildings.
• Non-market housing. No carbon pollution limit at this time. The focus should be on incentives and support for voluntary retrofits of these buildings.
• Condominiums. Large Condominiums: require benchmark reporting by 2023 for buildings >5,000 m2, carbon pollution limits starting in 2030 for buildings >10,000 m2. All Condominiums: research prescriptive requirements in 2021/22 for select heating equipment (e.g., make-up-air units and fireplaces).
Given the complexity and scale of the underlying issues facing rental apartments, a task force will be established to inform the Vancouver Plan process. The task force will explore and develop land use and other broader policy approaches that will enable the City to begin to holistically address affordability, security of tenure, vacancy rate, seismic risk and carbon pollution. To foster action while this planning takes place, the City, with the support of LandlordBC, will explore low-
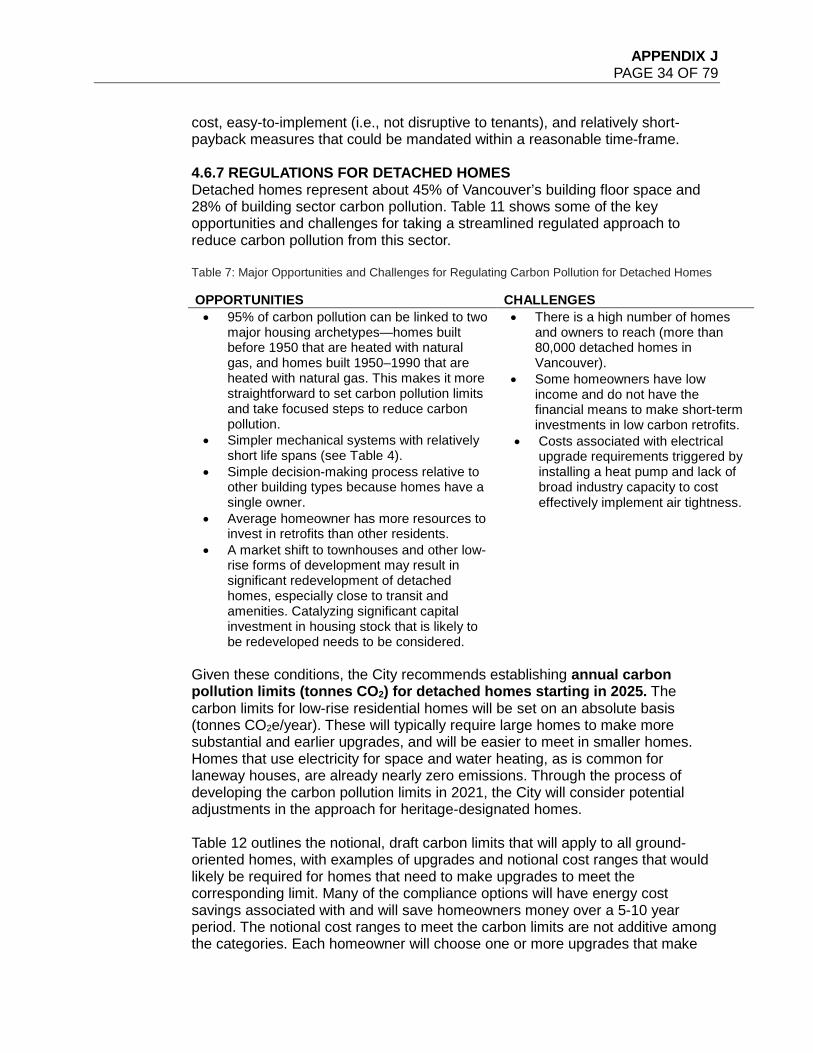
APPENDIX J PAGE 34 OF 79
cost, easy-to-implement (i.e., not disruptive to tenants), and relatively short-payback measures that could be mandated within a reasonable time-frame. 4.6.7 REGULATIONS FOR DETACHED HOMES Detached homes represent about 45% of Vancouver’s building floor space and 28% of building sector carbon pollution. Table 11 shows some of the key opportunities and challenges for taking a streamlined regulated approach to reduce carbon pollution from this sector. Table 7: Major Opportunities and Challenges for Regulating Carbon Pollution for Detached Homes
OPPORTUNITIES CHALLENGES • 95% of carbon pollution can be linked to two
major housing archetypes—homes built before 1950 that are heated with natural gas, and homes built 1950–1990 that are heated with natural gas. This makes it more straightforward to set carbon pollution limits and take focused steps to reduce carbon pollution.
• Simpler mechanical systems with relatively short life spans (see Table 4).
• Simple decision-making process relative to other building types because homes have a single owner.
• Average homeowner has more resources to invest in retrofits than other residents.
• A market shift to townhouses and other low-rise forms of development may result in significant redevelopment of detached homes, especially close to transit and amenities. Catalyzing significant capital investment in housing stock that is likely to be redeveloped needs to be considered.
• There is a high number of homes and owners to reach (more than 80,000 detached homes in Vancouver).
• Some homeowners have low income and do not have the financial means to make short-term investments in low carbon retrofits.
• Costs associated with electrical upgrade requirements triggered by installing a heat pump and lack of broad industry capacity to cost effectively implement air tightness.
Given these conditions, the City recommends establishing annual carbon pollution limits (tonnes CO2) for detached homes starting in 2025. The carbon limits for low-rise residential homes will be set on an absolute basis (tonnes CO2e/year). These will typically require large homes to make more substantial and earlier upgrades, and will be easier to meet in smaller homes. Homes that use electricity for space and water heating, as is common for laneway houses, are already nearly zero emissions. Through the process of developing the carbon pollution limits in 2021, the City will consider potential adjustments in the approach for heritage-designated homes. Table 12 outlines the notional, draft carbon limits that will apply to all ground-oriented homes, with examples of upgrades and notional cost ranges that would likely be required for homes that need to make upgrades to meet the corresponding limit. Many of the compliance options will have energy cost savings associated with and will save homeowners money over a 5-10 year period. The notional cost ranges to meet the carbon limits are not additive among the categories. Each homeowner will choose one or more upgrades that make
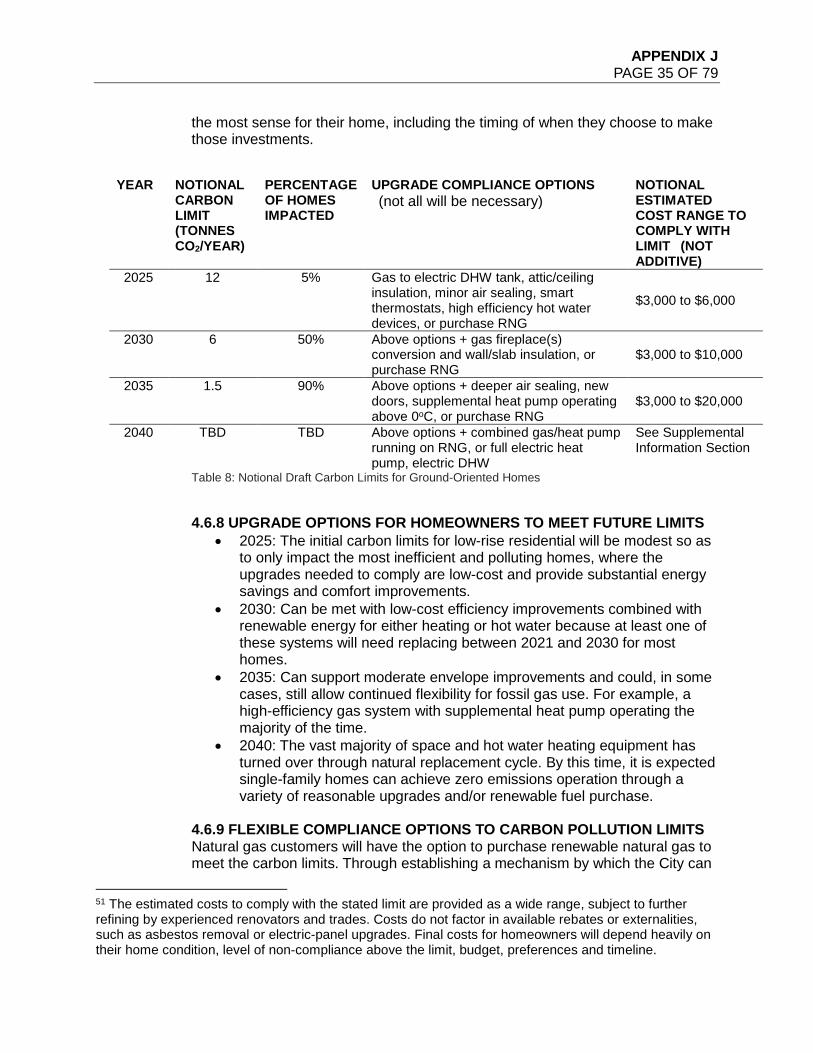
APPENDIX J PAGE 35 OF 79
the most sense for their home, including the timing of when they choose to make those investments.
Table 8: Notional Draft Carbon Limits for Ground-Oriented Homes
4.6.8 UPGRADE OPTIONS FOR HOMEOWNERS TO MEET FUTURE LIMITS
• 2025: The initial carbon limits for low-rise residential will be modest so as to only impact the most inefficient and polluting homes, where the upgrades needed to comply are low-cost and provide substantial energy savings and comfort improvements.
• 2030: Can be met with low-cost efficiency improvements combined with renewable energy for either heating or hot water because at least one of these systems will need replacing between 2021 and 2030 for most homes.
• 2035: Can support moderate envelope improvements and could, in some cases, still allow continued flexibility for fossil gas use. For example, a high-efficiency gas system with supplemental heat pump operating the majority of the time.
• 2040: The vast majority of space and hot water heating equipment has turned over through natural replacement cycle. By this time, it is expected single-family homes can achieve zero emissions operation through a variety of reasonable upgrades and/or renewable fuel purchase.
4.6.9 FLEXIBLE COMPLIANCE OPTIONS TO CARBON POLLUTION LIMITS Natural gas customers will have the option to purchase renewable natural gas to meet the carbon limits. Through establishing a mechanism by which the City can
51 The estimated costs to comply with the stated limit are provided as a wide range, subject to further refining by experienced renovators and trades. Costs do not factor in available rebates or externalities, such as asbestos removal or electric-panel upgrades. Final costs for homeowners will depend heavily on their home condition, level of non-compliance above the limit, budget, preferences and timeline.
YEAR NOTIONAL CARBON LIMIT (TONNES CO2/YEAR)
PERCENTAGE OF HOMES IMPACTED
UPGRADE COMPLIANCE OPTIONS (not all will be necessary)
NOTIONAL ESTIMATED COST RANGE TO COMPLY WITH LIMIT51(NOT ADDITIVE)
2025 12 5% Gas to electric DHW tank, attic/ceiling insulation, minor air sealing, smart thermostats, high efficiency hot water devices, or purchase RNG
$3,000 to $6,000
2030 6 50% Above options + gas fireplace(s) conversion and wall/slab insulation, or purchase RNG
$3,000 to $10,000
2035 1.5 90% Above options + deeper air sealing, new doors, supplemental heat pump operating above 0oC, or purchase RNG
$3,000 to $20,000
2040 TBD TBD Above options + combined gas/heat pump running on RNG, or full electric heat pump, electric DHW
See Supplemental Information Section
APPENDIX J PAGE 36 OF 79
verify gas use data (including the blend of renewable gas), buildings will have significant flexibility in how they meet the limits. Owners would be able to select an optimal combination of envelope improvements, mixed fuel systems, gas heat pumps, and gradual transition to RNG that makes the most sense for their building/home and individual situation. The City will also explore the creation of renewable district heating credits as a compliance option. These options will provide flexibility for buildings and homeowners to operate existing equipment until it needs to be replaced or until it coincides with a future planned renovation project. At the same time, these options will support large-scale utility action to develop renewable energy sources and contribute to the City’s climate targets. 4.6.10 FEES FOR NON-COMPLIANCE AND DEFERRAL A building that exceeds its annual carbon limit would incur a fee based on the tonnes of CO2 equivalent (tCO2e) that it exceeds the limit. The starting annual fee in 2025 will be several hundred dollars per tonne CO2e. The fee will be established through additional research and consultation, and align with the City of Vancouver’s corporate carbon pricing policy. While the fees will be available option, the preferred outcome will be for home and building owners to comply with the requirements through retrofit or purchase of renewable energy. Similar to the Empty Homes Tax model, revenue from the fees for non-compliance or deferral is expected to first be used for administration costs. As with other climate emergency revenue sources, the net revenue from fees is expected to be used to finance climate emergency investments with priorities identified and approved through standard capital and operating budget processes. Deferral options, similar to those for property taxes, will be explored for buildings where investments needed for meeting the limit may not be feasible. Reasons may include fixed-income households, preventing displacement of residents, heritage-building protection and high probability of renovation.
4.7 TARGETED PRESCRIPTIVE REQUIREMENTS Prescriptive requirements are specific actions that need to be taken in order to reduce a building’s carbon pollution and will be required to meet the 50% carbon reduction target by 2030 because they can apply to buildings where a carbon pollution limit may not be appropriate. Used widely and the basis for most energy codes, including in Canada, prescriptive requirements are broadly applicable, easy for owners to understand and can be selectively applied to types of equipment that have cost-effective zero emissions options.
Further, the federal and provincial governments have signalled 2035 as their aspirational target date to require all space and water heating equipment traded and sold in Canada to have a minimum co-efficient of performance that is greater than 1 (COP >1). In practice, this means only electric or natural gas heat pump equipment will be able to be sold if this standard is implemented. The City of Vancouver also has the authority to establish
APPENDIX J PAGE 37 OF 79
minimum performance requirements for equipment and products installed through the Vancouver Building By-law. There are several space heating or amenity applications in the commercial and multi-family building sectors that warrant research and consultation given preliminary findings that they meet the criteria above for prescriptive requirements.
4.7.1 PACKAGED ROOFTOP UNITS Small and large commercial, retail, warehouse and light-industrial buildings frequently use packaged rooftop heating and cooling units. In 2021 and 2022, the business case and grid connection constraints will be researched, and stakeholders consulted, to inform a potential time-of-replacement regulation requiring heat pumps be used for packaged rooftop systems. Modelling of B.C. buildings and field testing in the U.S.52 have shown these systems can achieve a 50–95% reduction in carbon pollution for a range of small commercial buildings when integrated with a heat-recovery ventilator, while also achieving energy-cost savings. If implemented, a requirement like this would impact 3,000 commercial and institutional buildings and 150–200 equipment replacements per year, resulting in annual reductions of 75,000–105,000 tCO2e when fully implemented. 4.7.2 SECONDARY HEATING SYSTEMS In multi-family buildings, particularly condominiums, secondary heating systems, such as make-up-air units that provide conditioned air to corridors and decorative fireplaces are responsible for a significant amount of carbon pollution. Low- and zero-carbon alternatives are commercially available and are strong candidates for equipment incentives in the short term and prescriptive replacement requirements within the next decade. Make-up-air unit heat pumps would also provide some cooling to common areas and suites, which will increase climate resilience and overall building comfort. 4.7.3 FUGITIVE EMISSIONS As described in the Context section, the fugitive emissions from refrigerants used in heat pumps and gas leakage from distribution lines and buildings are poorly understood at the regional level and could be significantly undercounted based on research from other jurisdictions. To address this knowledge gap, the City will collaborate with Metro Vancouver and the provincial government to:
• Quantify the leakage rates and carbon pollution impact of both refrigerants and natural gas and update them in future carbon inventories.
• Put in place management requirements for servicing equipment that uses refrigerants, including end-of-life disposal.
4.8 SHORT-TERM ACTIONS (2021–2025) Table 13 lists the key short-term actions that will need to be taken over the next two years to move the City’s stepped and streamlined carbon pollution regulations forward on a timeline that is consistent with the implementation dates presented in this section.
52 NEEA 2020. Very High Efficiency Dedicated Outside Air System Pilot Project Report. https://betterbricks.com/uploads/resources/VHE-DOAS_SummaryReport.pdf
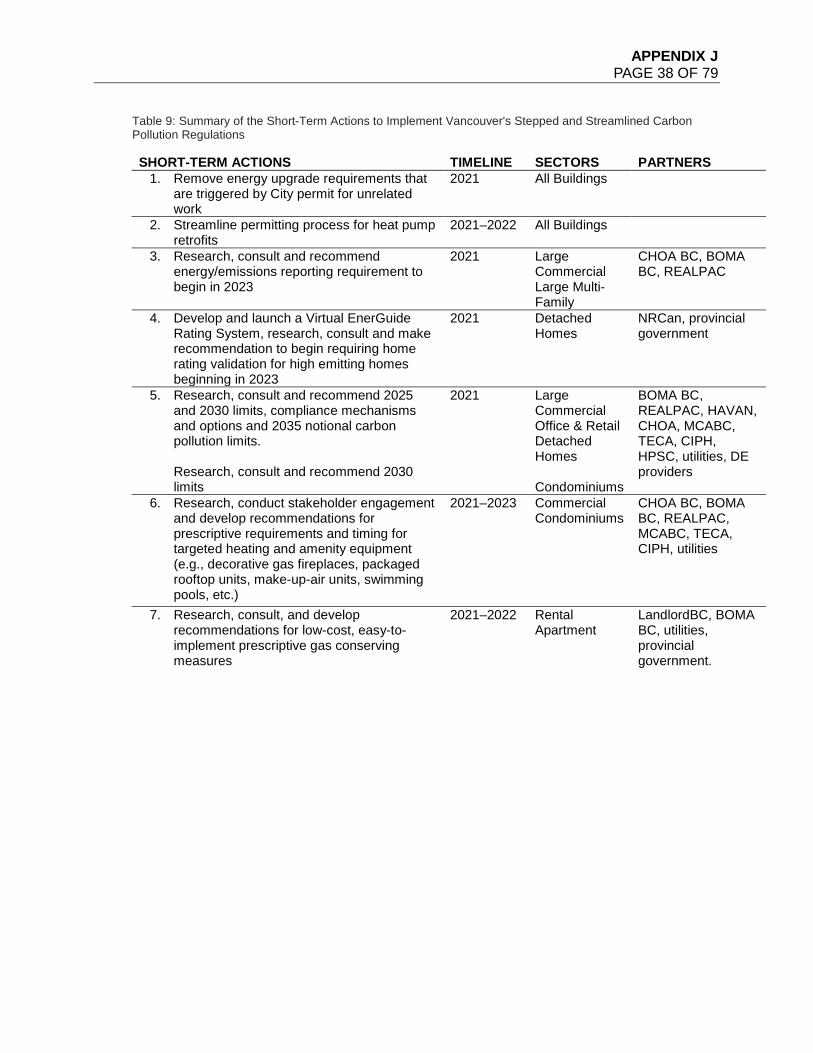
APPENDIX J PAGE 38 OF 79
Table 9: Summary of the Short-Term Actions to Implement Vancouver's Stepped and Streamlined Carbon Pollution Regulations
SHORT-TERM ACTIONS TIMELINE SECTORS PARTNERS 1. Remove energy upgrade requirements that
are triggered by City permit for unrelated work
2021 All Buildings
2. Streamline permitting process for heat pump retrofits
2021–2022 All Buildings
3. Research, consult and recommend energy/emissions reporting requirement to begin in 2023
2021 Large Commercial Large Multi-Family
CHOA BC, BOMA BC, REALPAC
4. Develop and launch a Virtual EnerGuide Rating System, research, consult and make recommendation to begin requiring home rating validation for high emitting homes beginning in 2023
2021 Detached Homes
NRCan, provincial government
5. Research, consult and recommend 2025 and 2030 limits, compliance mechanisms and options and 2035 notional carbon pollution limits.
Research, consult and recommend 2030 limits
2021 Large Commercial Office & Retail Detached Homes Condominiums
BOMA BC, REALPAC, HAVAN, CHOA, MCABC, TECA, CIPH, HPSC, utilities, DE providers
6. Research, conduct stakeholder engagement and develop recommendations for prescriptive requirements and timing for targeted heating and amenity equipment (e.g., decorative gas fireplaces, packaged rooftop units, make-up-air units, swimming pools, etc.)
2021–2023 Commercial Condominiums
CHOA BC, BOMA BC, REALPAC, MCABC, TECA, CIPH, utilities
7. Research, consult, and develop recommendations for low-cost, easy-to-implement prescriptive gas conserving measures
2021–2022 Rental Apartment
LandlordBC, BOMA BC, utilities, provincial government.
APPENDIX J PAGE 39 OF 79
SECTION 5: SUPPORT EARLY OWNER ACTION
5.1 OVERVIEW Strong government and utility support for early owner action is critical to meet our carbon reduction targets given the current low market penetration of heat pumps in the Lower Mainland. A significant market transformation initiative is necessary to mainstream technologies and practices that will be central for buildings and homes of all types to meet future carbon pollution regulatory limits. Early action is also important to test and demonstrate (locally) new technologies and practices, and to increase demand for heat pump and retrofit services, which will drive down costs and facilitate the increase in supply of higher-performance and a greater diversity of heat pump and renewable energy systems. In doing this, additional barriers will be uncovered and can then be addressed prior to regulations becoming effective.
5.1.2 KEY ACTIONS 1. Establish a Retrofit Accelerator Centre. The City of Vancouver will
partner with industry associations and the provincial government to launch a Retrofit Accelerator Centre with sector-specific programs. This will include the Commercial Buildings ZE Retrofit Accelerator Program, the Condominium ZE Retrofit Accelerator Program, and the Detached Home ZE Retrofit Accelerator Program.
2. Support Demonstration Projects and Programs. The City will partner with utilities, the provincial government, and industry associations to implement demonstration projects that can pilot innovative retrofit approaches and technologies with the objective of informing regulations, barrier removal and best practices.
3. Launch Owner Planning and Decision-Support Tools. The City will partner with industry associations and the provincial and federal governments to create virtual energy assessment, planning and decision-support tools for the detached-home, condominium and commercial building sectors. These will greatly increase the accessibility of emissions assessment and capital planning guidance for buildings, providing a high-level of building-specific customization.
4. Provide Equipment Incentives. The City will continue to top-up incentives for heat pumps that are offered by the provincial government and utilities through the CleanBC program, and work with the provincial government and energy utilities to expand these offers to include air-tightness and heat-recovery ventilation, windows for all residential buildings and secondary heating equipment such as packaged rooftop heat pumps units (described in Section 4 above).
5. Facilitate and Offer Innovative Financing. Lead the development of a Retrofit Finance Roadmap involving key public sector agencies, energy utilities, owner associations, financial institutions, and investor groups to establish financial tools for commercial and residential buildings that can be used by owners for retrofits that reduce carbon pollution and increase resilience. The City will work with the provincial government to establish
APPENDIX J PAGE 40 OF 79
property-assessed financing as one of these financing tools. The City will also partner with the Metro Vancouver Regional LC3 Low Carbon Innovation Centre to create new financial tools and incentives for low-carbon retrofits.
5.1.3 FOCUS ON EQUITY • Enhanced incentives and implementation support for rental and non-
market housing: o Rental Apartment Energy Retrofit PLUS Reinvestment Program. o Non-Market Housing Retrofit Program.
• Higher incentive levels and funding support for non-market housing through CleanBC/BC Housing and City-supported programs.
• Demonstration projects focused on non-market housing: o Deep Retrofit Pilot – Non-market housing deep emission reduction
pilot project (FortisBC, BC Housing, BCNPHA, Pendrellis Society). o Reframed Initiative – Zero Carbon, Resilience Retrofits for Non-
Market Housing (Pembina, BC Housing, BCNPHA, FCM, NRCan). • Communication and support materials delivered through the Retrofit
Accelerator Centre programs offered in multiple languages
5.2 INTRODUCTION While regulations are necessary to ensure the industry meets increasingly better carbon performance, there are many actions that can be taken in advance of established performance limits. “Early owner actions” refer to measures that building owners can take in advance of any regulatory requirement to lower their building’s carbon pollution. These actions are important to ensure that a substantial portion of the marketplace is ready to comply or already compliant with regulatory requirements before they come into effect. This will help to accelerate deep reductions in carbon pollution, ensure a smooth market transition, and minimize any measures that may need to be taken as a result of non-compliance. In this section, the following five actions are discussed in more detail:
1. Establish a Retrofit Accelerator Centre 2. Support demonstration projects and programs 3. Launch owner planning and decision-support tools 4. Provide equipment incentives 5. Facilitate and offer innovative financing
5.3 ESTABLISH A RETROFIT ACCELERATOR CENTRE To find information, ask questions and access expert advice on planning for and implementing building retrofits, owners and managers need a one-stop centre where they can turn for help. The City of Vancouver will fund the creation of the Retrofit Accelerator Centre, which will host programs tailored to each sector. Programs will be designed and implemented in partnership with industry associations that are already delivering related services to their members. The programs for detached homes, condominiums and commercial buildings will launch in 2022. The centre and programs will deliver a mix of the following services to participants:
• Energy Audits. Building energy audits and assistance with virtual audits.
APPENDIX J PAGE 41 OF 79
• Planning. Understanding retrofit/equipment options and making a plan. • Energy/Emission Reporting Support. The centre will provide technical support for
larger buildings that are subject to annual reporting requirements. • Carbon Pollution Limit Compliance. Support regulated buildings to plan for and
comply with future carbon pollution limits. • Contractors/Services. Support in finding qualified contractors and equipment
suppliers. • Incentives. Information and assistance accessing equipment and retrofit incentives. • Implementation Support. Expert advice for refining the scope, contracting and
implementing projects.
Details on the support that will be offered to each sector are provided in the sections below.
5.3.1 COMMERCIAL BUILDINGS ZE RETROFIT ACCELERATOR PROGRAM The Commercial Buildings ZE Retrofit Accelerator Program will be delivered in partnership with industry associations beginning in 2022. It will provide smaller commercial buildings and those without previous experience running energy efficiency programs with assistance in: 1) benchmarking their building’s energy use and understanding what opportunities for improvement exist, 2) recommissioning their building to realize low-cost opportunities for reducing energy expenditures and reducing carbon pollution, and 3) making decisions and planning for larger retrofits, which would ideally be done with the assistance of a decision-support tool. Industry associations will play an important role in delivering these services to commercial buildings, as in many cases they are already offering energy efficiency programs to their members.
BOMA BEST® BOMA BC, through its BOMA BEST® program, supports commercial buildings to conduct energy benchmarking and put in place energy efficiency targets. They also recently implemented a recommissioning pilot program. Expanding the reach of these programs will be necessary to ensure they are accessible to all commercial building owners/managers who can benefit from them.
5.3.2 CONDOMINIUM ZE RETROFIT ACCELERATOR PROGRAM The Condominium ZE Retrofit Accelerator Program will be delivered by a contracted third party in partnership with industry associations and other local governments beginning in 2023. The Strata Energy Advisor Pilot Program that was administered by Metro Vancouver from 2018 to 2019 (see the Strata Energy Advisory Program case study box for more information) demonstrated the significant demand for this service—the pilot was oversubscribed with a waiting list that was larger than the number of buildings that participated. An expanded strata retrofit support program is now necessary and would be welcomed by residents to help meet the City’s carbon reduction targets. The new program that will be developed by the City will have expanded capacity for more buildings to participate, and focus on helping buildings comply with benchmarking
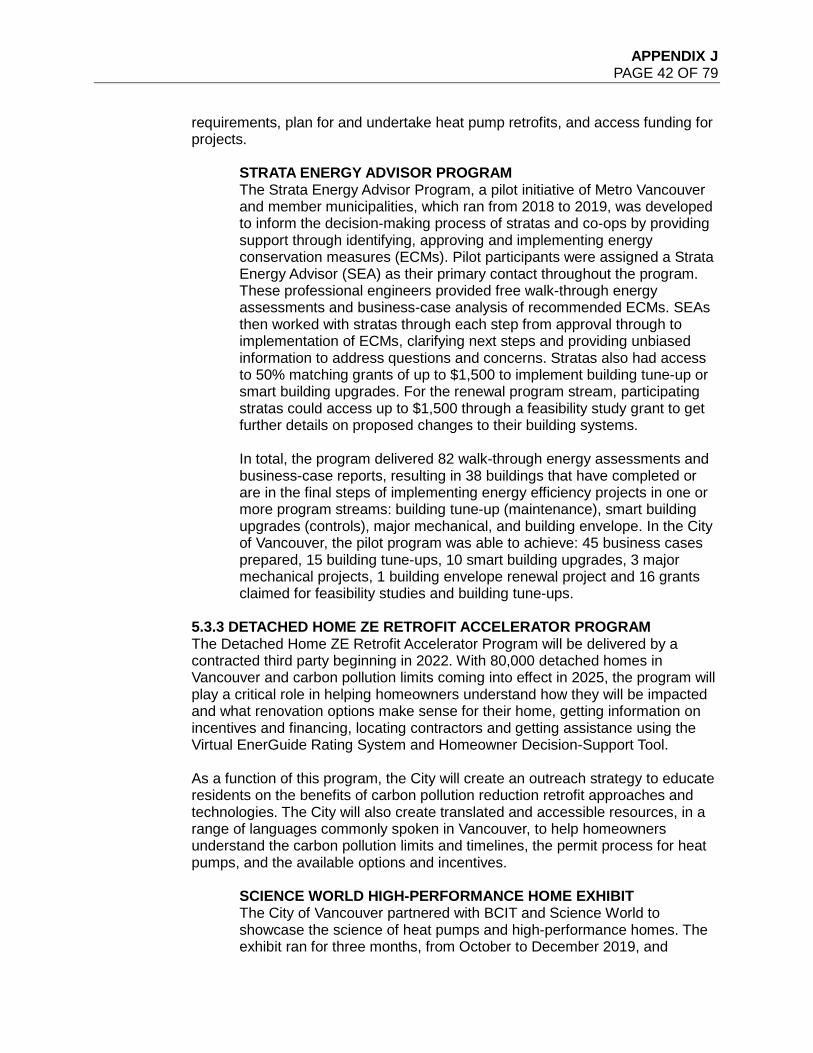
APPENDIX J PAGE 42 OF 79
requirements, plan for and undertake heat pump retrofits, and access funding for projects.
STRATA ENERGY ADVISOR PROGRAM The Strata Energy Advisor Program, a pilot initiative of Metro Vancouver and member municipalities, which ran from 2018 to 2019, was developed to inform the decision-making process of stratas and co-ops by providing support through identifying, approving and implementing energy conservation measures (ECMs). Pilot participants were assigned a Strata Energy Advisor (SEA) as their primary contact throughout the program. These professional engineers provided free walk-through energy assessments and business-case analysis of recommended ECMs. SEAs then worked with stratas through each step from approval through to implementation of ECMs, clarifying next steps and providing unbiased information to address questions and concerns. Stratas also had access to 50% matching grants of up to $1,500 to implement building tune-up or smart building upgrades. For the renewal program stream, participating stratas could access up to $1,500 through a feasibility study grant to get further details on proposed changes to their building systems. In total, the program delivered 82 walk-through energy assessments and business-case reports, resulting in 38 buildings that have completed or are in the final steps of implementing energy efficiency projects in one or more program streams: building tune-up (maintenance), smart building upgrades (controls), major mechanical, and building envelope. In the City of Vancouver, the pilot program was able to achieve: 45 business cases prepared, 15 building tune-ups, 10 smart building upgrades, 3 major mechanical projects, 1 building envelope renewal project and 16 grants claimed for feasibility studies and building tune-ups.
5.3.3 DETACHED HOME ZE RETROFIT ACCELERATOR PROGRAM The Detached Home ZE Retrofit Accelerator Program will be delivered by a contracted third party beginning in 2022. With 80,000 detached homes in Vancouver and carbon pollution limits coming into effect in 2025, the program will play a critical role in helping homeowners understand how they will be impacted and what renovation options make sense for their home, getting information on incentives and financing, locating contractors and getting assistance using the Virtual EnerGuide Rating System and Homeowner Decision-Support Tool. As a function of this program, the City will create an outreach strategy to educate residents on the benefits of carbon pollution reduction retrofit approaches and technologies. The City will also create translated and accessible resources, in a range of languages commonly spoken in Vancouver, to help homeowners understand the carbon pollution limits and timelines, the permit process for heat pumps, and the available options and incentives.
SCIENCE WORLD HIGH-PERFORMANCE HOME EXHIBIT The City of Vancouver partnered with BCIT and Science World to showcase the science of heat pumps and high-performance homes. The exhibit ran for three months, from October to December 2019, and
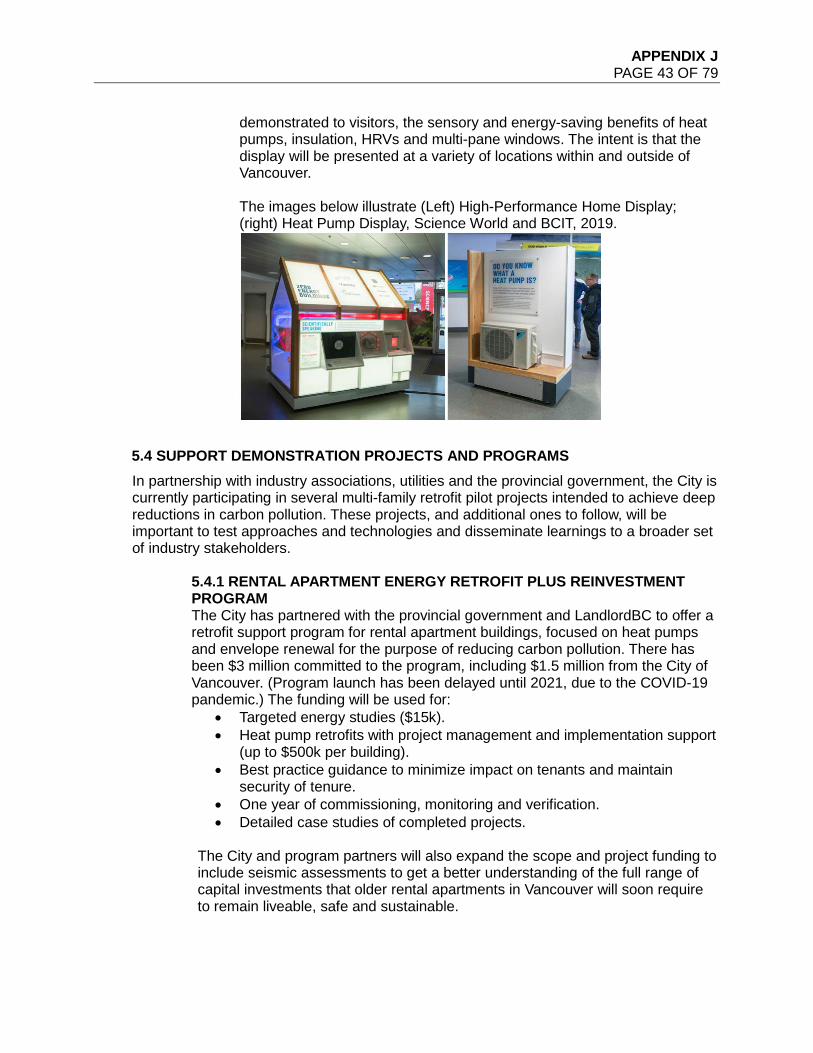
APPENDIX J PAGE 43 OF 79
demonstrated to visitors, the sensory and energy-saving benefits of heat pumps, insulation, HRVs and multi-pane windows. The intent is that the display will be presented at a variety of locations within and outside of Vancouver. The images below illustrate (Left) High-Performance Home Display; (right) Heat Pump Display, Science World and BCIT, 2019.
5.4 SUPPORT DEMONSTRATION PROJECTS AND PROGRAMS In partnership with industry associations, utilities and the provincial government, the City is currently participating in several multi-family retrofit pilot projects intended to achieve deep reductions in carbon pollution. These projects, and additional ones to follow, will be important to test approaches and technologies and disseminate learnings to a broader set of industry stakeholders.
5.4.1 RENTAL APARTMENT ENERGY RETROFIT PLUS REINVESTMENT PROGRAM The City has partnered with the provincial government and LandlordBC to offer a retrofit support program for rental apartment buildings, focused on heat pumps and envelope renewal for the purpose of reducing carbon pollution. There has been $3 million committed to the program, including $1.5 million from the City of Vancouver. (Program launch has been delayed until 2021, due to the COVID-19 pandemic.) The funding will be used for:
• Targeted energy studies ($15k). • Heat pump retrofits with project management and implementation support
(up to $500k per building). • Best practice guidance to minimize impact on tenants and maintain
security of tenure. • One year of commissioning, monitoring and verification. • Detailed case studies of completed projects.
The City and program partners will also expand the scope and project funding to include seismic assessments to get a better understanding of the full range of capital investments that older rental apartments in Vancouver will soon require to remain liveable, safe and sustainable.
APPENDIX J PAGE 44 OF 79
5.4.2 NON-MARKET HOUSING – FORTISBC DEEP RETROFIT PILOT PROJECT A partnership between FortisBC, the City of Vancouver, BC Housing, BC Non-Profit Housing Association (BCNPHA) and the Pendrellis Society that will retrofit a seniors’ non-market housing building in the West End of Vancouver. The project aims to achieve deep energy savings and up to 80% carbon pollution reduction compared to the building’s pre-retrofit condition, through replacing the windows, adding exterior insulation and replacing the conventional gas boilers with gas-absorption heat pumps that supply space heat and hot water in the building. The pilot project will be used as a case study to disseminate lessons learned and to identify the opportunities, barriers, and benefits of undertaking a whole-building, deep energy retrofit project to achieve substantial emissions reductions. This is FortisBC’s largest demand side management project to-date, with an anticipated budget of $10 million. FortisBC, the City and project partners are hopeful that the Deep Retrofit Pilot Project will lead to a new FortisBC demand-side-management funding program focused on envelope and heat pump retrofits. 5.4.3 NON-MARKET HOUSING – REFRAMED INITIATIVE Reframed is an initiative of the Pembina Institute, in partnership with the BC Non-Profit Housing Association, BC Housing and the City of Vancouver. Its primary goal is to demonstrate next-generation retrofit solutions to be delivered at scale and to meet three key social objectives: reduce carbon pollution, improve climate and seismic resiliency, and enhance occupant well-being. Finding an effective, commercially viable retrofit solution that meets our climate, well-being and equitable housing needs could unlock a sizeable market opportunity. Working together with industry, housing providers, financiers and regulators, the Reframed Initiative aims to uncover barriers and identify market solutions for how retrofits are designed, delivered, procured and financed. Up to five non-market housing buildings in Vancouver will be retrofitted through this program. 5.4.4 NON-MARKET HOUSING PROGRAM A similar level of support and incremental funding is required for operators of non-market housing and housing co-operatives as market rental buildings. The City is currently in the program design stage, in partnership with the BC Non-Profit Housing Association, BC Housing and CleanBC, to offer enhanced planning, implementation and funding support and operator training for heat pump retrofits. This program will be designed to leverage senior government funding already committed to non-market housing renewal to simultaneously achieve deep carbon reductions and improve resilience. 5.4.5 COMMERCIAL BUILDINGS – DEEP CARBON POLLUTION RETROFIT CASE STUDIES In 2018 and 2019, the City partnered with several local building owners/managers and consultants to prepare case studies of deep emissions retrofit projects undertaken on commercial buildings in the region. These case studies are helpful to kick-start a conversation among stakeholders regarding the opportunities for cost-effective deep retrofits and the different technology and regulatory approaches that could scale the results seen in the case-study buildings.
APPENDIX J PAGE 45 OF 79
The City will work with industry associations and the Zero Emission Buildings Exchange (ZEBx) to prepare additional case studies in the near term to help disseminate lessons learned and best practices to owners and industry stakeholders. 5.4.6 DETACHED HOMES – THE NEW RETROFIT EXPERIENCE The City of Vancouver is an active partner in the BC Hydro-funded Community Energy Manager (CEM) project entitled “The New Retrofit Experience.” The project recognizes the previously described complexities that homeowners experience choosing upgrades, understanding costs and finding educational resources, and finding quality, trusted contractors. In partnership with the Township of Langley, Metro Vancouver and the Regional District of East Kootenay, the program will launch three pilot projects to deliver a streamlined “one-stop shop” retrofit approach by completing low-carbon retrofits for up to 45 homes across the three jurisdictions. 5.4.7 DETACHED HOMES – EXPAND NEARZERO CASE STUDY PROGRAM TO EXISTING HOMES The NearZero program is an active program currently hosted by ZEBx. The program funds new housing projects that achieve a high-performance standard like Passive House or Net Zero. With the proposed shift in ZEBx’s mandate to expand support for existing buildings, the City is currently seeking funding from the Federation of Canadian Municipalities (FCM) to fund 10 to 15 Vancouver homes to participate in the program. Eligible homes would include older, high-emissions and low-performance homes. The funding would cover an incentive for participation (e.g., exterior painting or siding, air sealing), as well as a comprehensive case study that gathers the barriers, the lessons learned and the achieved energy and emissions reductions.
5.5 LAUNCH OWNER PLANNING AND DECISION-SUPPORT TOOLS The City of Vancouver will develop integrated virtual energy auditing tools for commercial, condominium and detached home sectors. Online decision-support tools will help building owners and managers understand their options for equipment and retrofit approaches to comply with future carbon pollution limits and prescriptive requirements. Through a data-driven virtual audit approach, almost all buildings in Vancouver could have access to a cost-effective energy auditing service. When integrated with inputs such as energy benchmarking reports (condos and commercial), depreciation reports (condos), energy use data (all buildings) and EnerGuide assessments (detached homes), these tools will be able to equip owners with tailored guidance.
5.5.1 DETACHED-HOME DECISION-SUPPORT TOOL The City, with support from the Government of B.C., will design and launch a detached-home decision-support tool that integrates with the Virtual EnerGuide Rating System (described in section 4, “Energy and Emission Reporting”) to provide owners with a powerful tool that will support them in evaluating, planning, implementing and documenting energy retrofits.
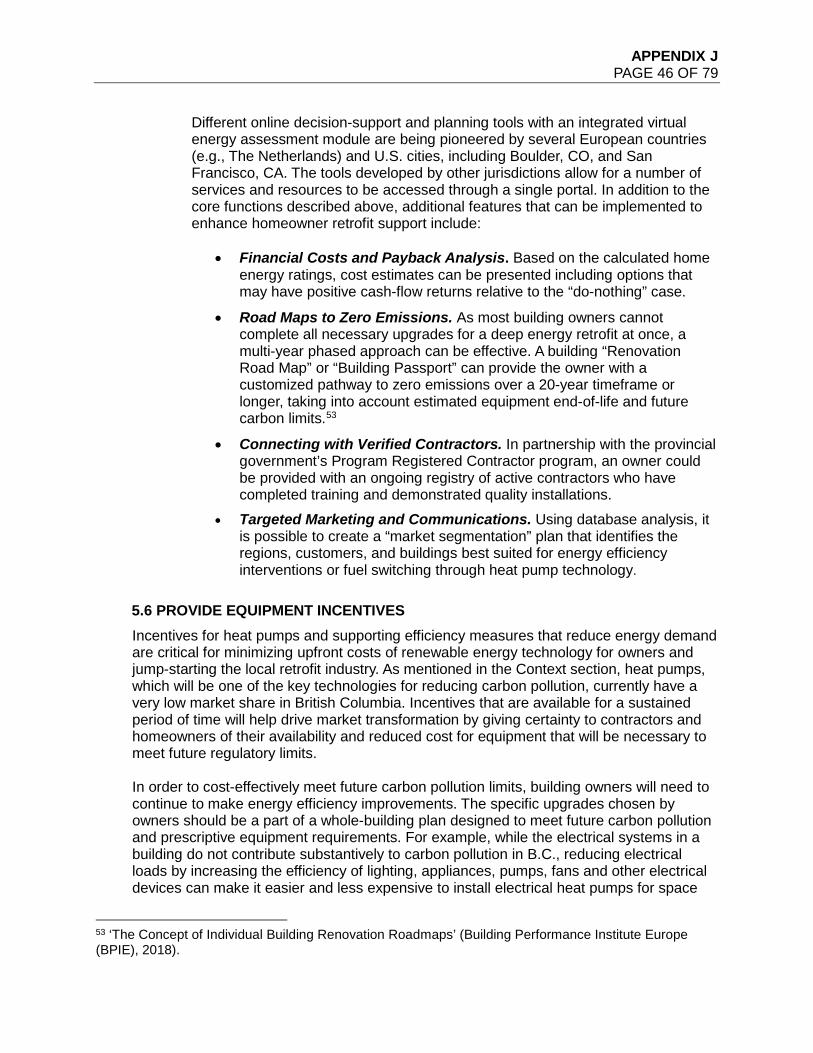
APPENDIX J PAGE 46 OF 79
Different online decision-support and planning tools with an integrated virtual energy assessment module are being pioneered by several European countries (e.g., The Netherlands) and U.S. cities, including Boulder, CO, and San Francisco, CA. The tools developed by other jurisdictions allow for a number of services and resources to be accessed through a single portal. In addition to the core functions described above, additional features that can be implemented to enhance homeowner retrofit support include:
• Financial Costs and Payback Analysis. Based on the calculated home energy ratings, cost estimates can be presented including options that may have positive cash-flow returns relative to the “do-nothing” case.
• Road Maps to Zero Emissions. As most building owners cannot complete all necessary upgrades for a deep energy retrofit at once, a multi-year phased approach can be effective. A building “Renovation Road Map” or “Building Passport” can provide the owner with a customized pathway to zero emissions over a 20-year timeframe or longer, taking into account estimated equipment end-of-life and future carbon limits.53
• Connecting with Verified Contractors. In partnership with the provincial government’s Program Registered Contractor program, an owner could be provided with an ongoing registry of active contractors who have completed training and demonstrated quality installations.
• Targeted Marketing and Communications. Using database analysis, it is possible to create a “market segmentation” plan that identifies the regions, customers, and buildings best suited for energy efficiency interventions or fuel switching through heat pump technology.
5.6 PROVIDE EQUIPMENT INCENTIVES Incentives for heat pumps and supporting efficiency measures that reduce energy demand are critical for minimizing upfront costs of renewable energy technology for owners and jump-starting the local retrofit industry. As mentioned in the Context section, heat pumps, which will be one of the key technologies for reducing carbon pollution, currently have a very low market share in British Columbia. Incentives that are available for a sustained period of time will help drive market transformation by giving certainty to contractors and homeowners of their availability and reduced cost for equipment that will be necessary to meet future regulatory limits. In order to cost-effectively meet future carbon pollution limits, building owners will need to continue to make energy efficiency improvements. The specific upgrades chosen by owners should be a part of a whole-building plan designed to meet future carbon pollution and prescriptive equipment requirements. For example, while the electrical systems in a building do not contribute substantively to carbon pollution in B.C., reducing electrical loads by increasing the efficiency of lighting, appliances, pumps, fans and other electrical devices can make it easier and less expensive to install electrical heat pumps for space
53 ‘The Concept of Individual Building Renovation Roadmaps’ (Building Performance Institute Europe (BPIE), 2018).
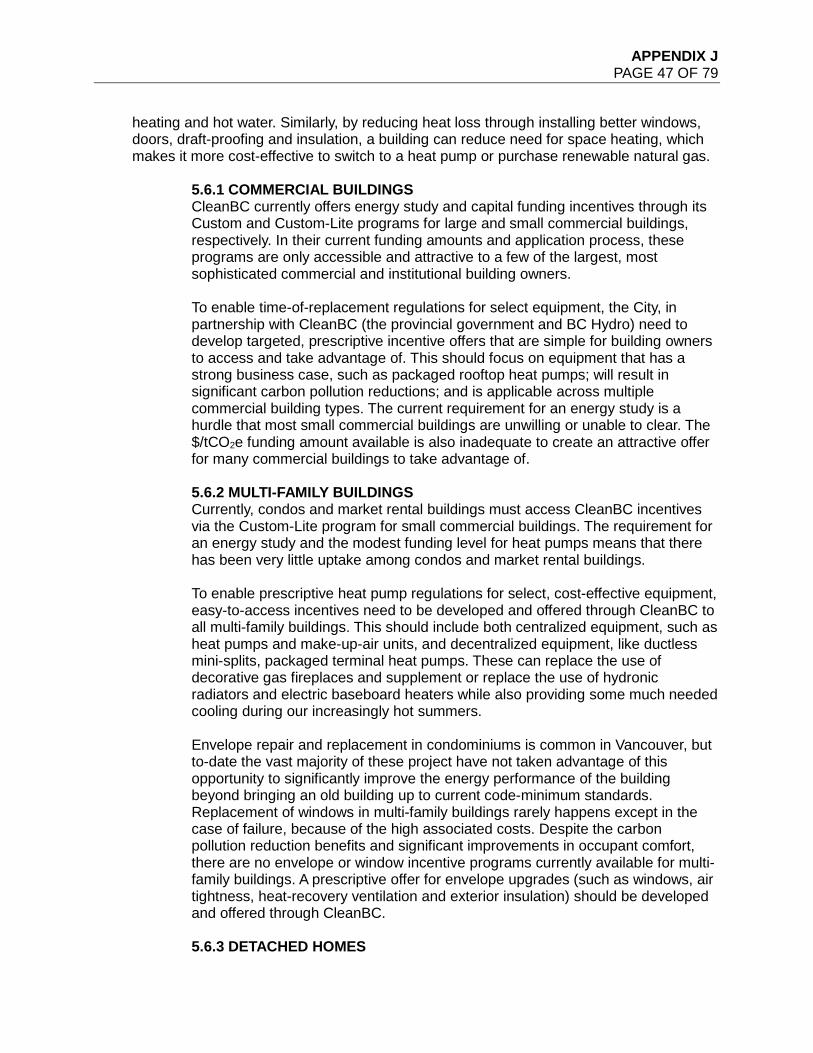
APPENDIX J PAGE 47 OF 79
heating and hot water. Similarly, by reducing heat loss through installing better windows, doors, draft-proofing and insulation, a building can reduce need for space heating, which makes it more cost-effective to switch to a heat pump or purchase renewable natural gas.
5.6.1 COMMERCIAL BUILDINGS CleanBC currently offers energy study and capital funding incentives through its Custom and Custom-Lite programs for large and small commercial buildings, respectively. In their current funding amounts and application process, these programs are only accessible and attractive to a few of the largest, most sophisticated commercial and institutional building owners. To enable time-of-replacement regulations for select equipment, the City, in partnership with CleanBC (the provincial government and BC Hydro) need to develop targeted, prescriptive incentive offers that are simple for building owners to access and take advantage of. This should focus on equipment that has a strong business case, such as packaged rooftop heat pumps; will result in significant carbon pollution reductions; and is applicable across multiple commercial building types. The current requirement for an energy study is a hurdle that most small commercial buildings are unwilling or unable to clear. The $/tCO2e funding amount available is also inadequate to create an attractive offer for many commercial buildings to take advantage of. 5.6.2 MULTI-FAMILY BUILDINGS Currently, condos and market rental buildings must access CleanBC incentives via the Custom-Lite program for small commercial buildings. The requirement for an energy study and the modest funding level for heat pumps means that there has been very little uptake among condos and market rental buildings. To enable prescriptive heat pump regulations for select, cost-effective equipment, easy-to-access incentives need to be developed and offered through CleanBC to all multi-family buildings. This should include both centralized equipment, such as heat pumps and make-up-air units, and decentralized equipment, like ductless mini-splits, packaged terminal heat pumps. These can replace the use of decorative gas fireplaces and supplement or replace the use of hydronic radiators and electric baseboard heaters while also providing some much needed cooling during our increasingly hot summers. Envelope repair and replacement in condominiums is common in Vancouver, but to-date the vast majority of these project have not taken advantage of this opportunity to significantly improve the energy performance of the building beyond bringing an old building up to current code-minimum standards. Replacement of windows in multi-family buildings rarely happens except in the case of failure, because of the high associated costs. Despite the carbon pollution reduction benefits and significant improvements in occupant comfort, there are no envelope or window incentive programs currently available for multi-family buildings. A prescriptive offer for envelope upgrades (such as windows, air tightness, heat-recovery ventilation and exterior insulation) should be developed and offered through CleanBC. 5.6.3 DETACHED HOMES
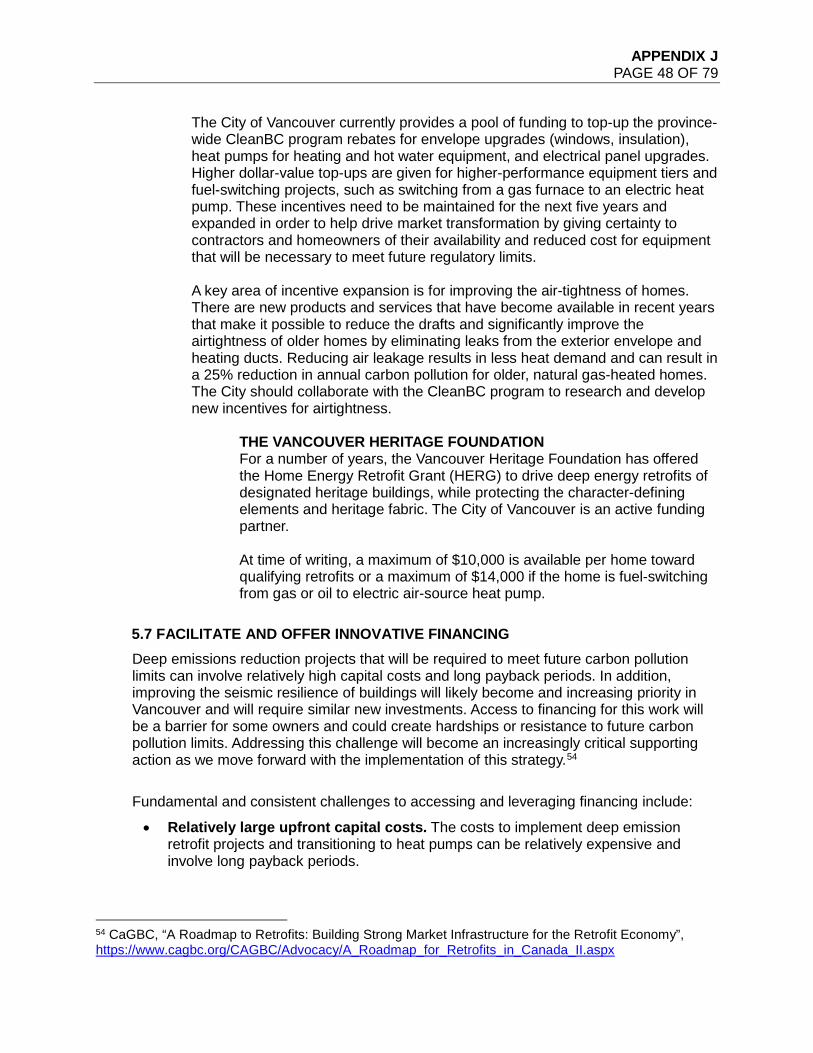
APPENDIX J PAGE 48 OF 79
The City of Vancouver currently provides a pool of funding to top-up the province-wide CleanBC program rebates for envelope upgrades (windows, insulation), heat pumps for heating and hot water equipment, and electrical panel upgrades. Higher dollar-value top-ups are given for higher-performance equipment tiers and fuel-switching projects, such as switching from a gas furnace to an electric heat pump. These incentives need to be maintained for the next five years and expanded in order to help drive market transformation by giving certainty to contractors and homeowners of their availability and reduced cost for equipment that will be necessary to meet future regulatory limits. A key area of incentive expansion is for improving the air-tightness of homes. There are new products and services that have become available in recent years that make it possible to reduce the drafts and significantly improve the airtightness of older homes by eliminating leaks from the exterior envelope and heating ducts. Reducing air leakage results in less heat demand and can result in a 25% reduction in annual carbon pollution for older, natural gas-heated homes. The City should collaborate with the CleanBC program to research and develop new incentives for airtightness.
THE VANCOUVER HERITAGE FOUNDATION For a number of years, the Vancouver Heritage Foundation has offered the Home Energy Retrofit Grant (HERG) to drive deep energy retrofits of designated heritage buildings, while protecting the character-defining elements and heritage fabric. The City of Vancouver is an active funding partner. At time of writing, a maximum of $10,000 is available per home toward qualifying retrofits or a maximum of $14,000 if the home is fuel-switching from gas or oil to electric air-source heat pump.
5.7 FACILITATE AND OFFER INNOVATIVE FINANCING Deep emissions reduction projects that will be required to meet future carbon pollution limits can involve relatively high capital costs and long payback periods. In addition, improving the seismic resilience of buildings will likely become and increasing priority in Vancouver and will require similar new investments. Access to financing for this work will be a barrier for some owners and could create hardships or resistance to future carbon pollution limits. Addressing this challenge will become an increasingly critical supporting action as we move forward with the implementation of this strategy.54 Fundamental and consistent challenges to accessing and leveraging financing include:
• Relatively large upfront capital costs. The costs to implement deep emission retrofit projects and transitioning to heat pumps can be relatively expensive and involve long payback periods.
54 CaGBC, “A Roadmap to Retrofits: Building Strong Market Infrastructure for the Retrofit Economy”, https://www.cagbc.org/CAGBC/Advocacy/A_Roadmap_for_Retrofits_in_Canada_II.aspx
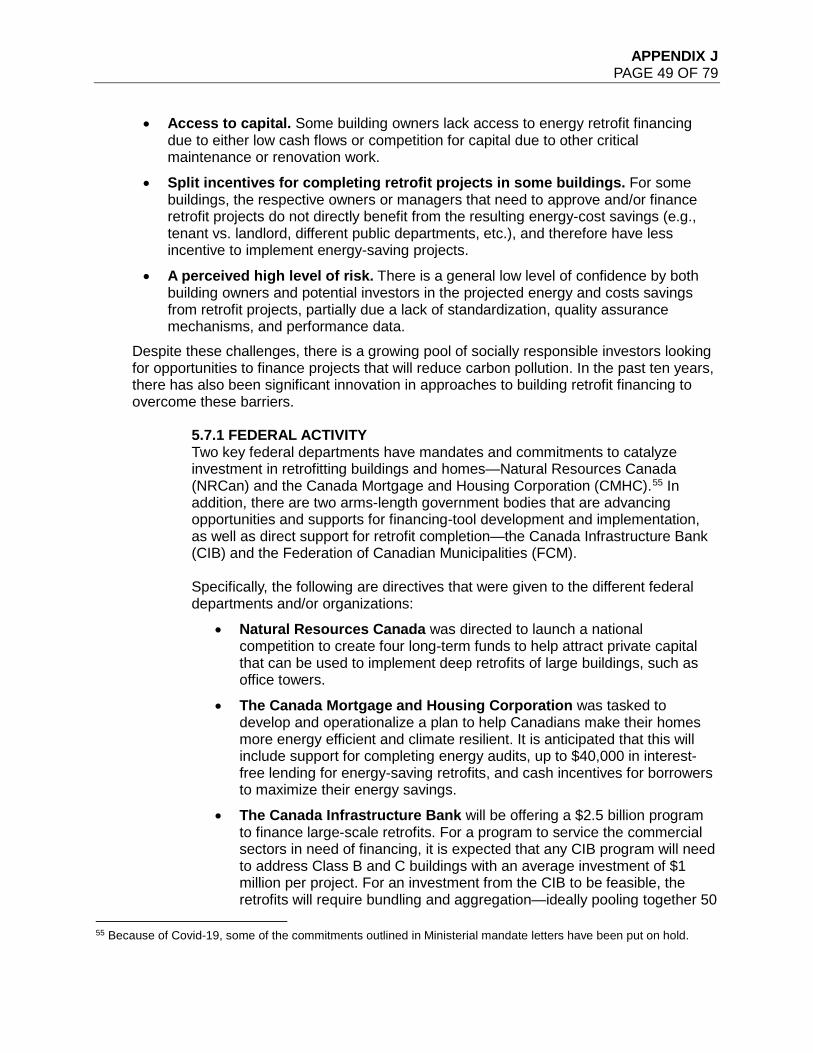
APPENDIX J PAGE 49 OF 79
• Access to capital. Some building owners lack access to energy retrofit financing due to either low cash flows or competition for capital due to other critical maintenance or renovation work.
• Split incentives for completing retrofit projects in some buildings. For some buildings, the respective owners or managers that need to approve and/or finance retrofit projects do not directly benefit from the resulting energy-cost savings (e.g., tenant vs. landlord, different public departments, etc.), and therefore have less incentive to implement energy-saving projects.
• A perceived high level of risk. There is a general low level of confidence by both building owners and potential investors in the projected energy and costs savings from retrofit projects, partially due a lack of standardization, quality assurance mechanisms, and performance data.
Despite these challenges, there is a growing pool of socially responsible investors looking for opportunities to finance projects that will reduce carbon pollution. In the past ten years, there has also been significant innovation in approaches to building retrofit financing to overcome these barriers.
5.7.1 FEDERAL ACTIVITY Two key federal departments have mandates and commitments to catalyze investment in retrofitting buildings and homes—Natural Resources Canada (NRCan) and the Canada Mortgage and Housing Corporation (CMHC).55 In addition, there are two arms-length government bodies that are advancing opportunities and supports for financing-tool development and implementation, as well as direct support for retrofit completion—the Canada Infrastructure Bank (CIB) and the Federation of Canadian Municipalities (FCM). Specifically, the following are directives that were given to the different federal departments and/or organizations:
• Natural Resources Canada was directed to launch a national competition to create four long-term funds to help attract private capital that can be used to implement deep retrofits of large buildings, such as office towers.
• The Canada Mortgage and Housing Corporation was tasked to develop and operationalize a plan to help Canadians make their homes more energy efficient and climate resilient. It is anticipated that this will include support for completing energy audits, up to $40,000 in interest-free lending for energy-saving retrofits, and cash incentives for borrowers to maximize their energy savings.
• The Canada Infrastructure Bank will be offering a $2.5 billion program to finance large-scale retrofits. For a program to service the commercial sectors in need of financing, it is expected that any CIB program will need to address Class B and C buildings with an average investment of $1 million per project. For an investment from the CIB to be feasible, the retrofits will require bundling and aggregation—ideally pooling together 50
55 Because of Covid-19, some of the commitments outlined in Ministerial mandate letters have been put on hold.
APPENDIX J PAGE 50 OF 79
to 100 retrofits at time for investment. The CIB is expected to release the first iteration of a commercial financing program in the fall of 2020.
• The Federation of Canadian Municipalities received significant public funds to build out the Green Municipal Fund’s (GMF) Sustainable Affordable Housing fund, which supports municipal, non-profit and cooperative housing providers in measurably improving the energy efficiency and affordability of existing and new affordable housing units. The program intends to increase the affordable housing sector’s capacity in sustainable projects, supporting housing providers to better plan, build, operate and maintain energy efficiency projects that achieve these benefits. In addition, FCM has developed the Community Efficiency Financing (CEF) program, a new initiative of the GMF. CEF supports municipalities with the assessment, design, development and implementation of financing programs to enable home energy upgrades and retrofits.
5.7.2 PACE FINANCING Property-assessed clean energy (PACE), enable building owners to undertake energy efficiency retrofits, install renewable energy systems and/or upgrade mechanical systems with little to no upfront cost. Typically, the municipality or a third-party investor or lender will issue a low-interest loan, or fund the retrofit and be paid back through the owner’s property tax billing. When the property is sold, the loan payment or investment revenue stream remain attached to the property via a modest increment on its annual tax bill. In some cases, the cost savings from the resulting improved energy efficiency can exceed the associated loan re-payment fees, allowing the investment to be cost-positive for the building owner. PACE loans reduce financial risk barriers to all private property owners and enable building owners to undertake worthwhile energy retrofit projects with relatively long payback periods that they otherwise would likely not consider. PACE has been shown to be an effective tool for accelerating the rate of retrofits—resulting in reduction in water and energy use, carbon emissions and hazard vulnerability, as well as co-benefits including economic development, job creation, and increased health and well-being. By creating an off-book debt that is attached to the property tax bill of the building, PACE:
• Addresses lack of upfront capital. • Solves split incentives by passing payments to tenants, creating positive
cash flow and increased property value, even with long-payback projects. • Offers a range of accounting treatments and removes competition for
limited lending capacity by moving loans off the balance sheet and attaching them to the property title.
• Makes the investment transferable between owners. • Integrates with utility, local and federal incentive programs. • Aligns private building investment criteria with government goals (such as
carbon emissions and affordability) by changing financing terms.
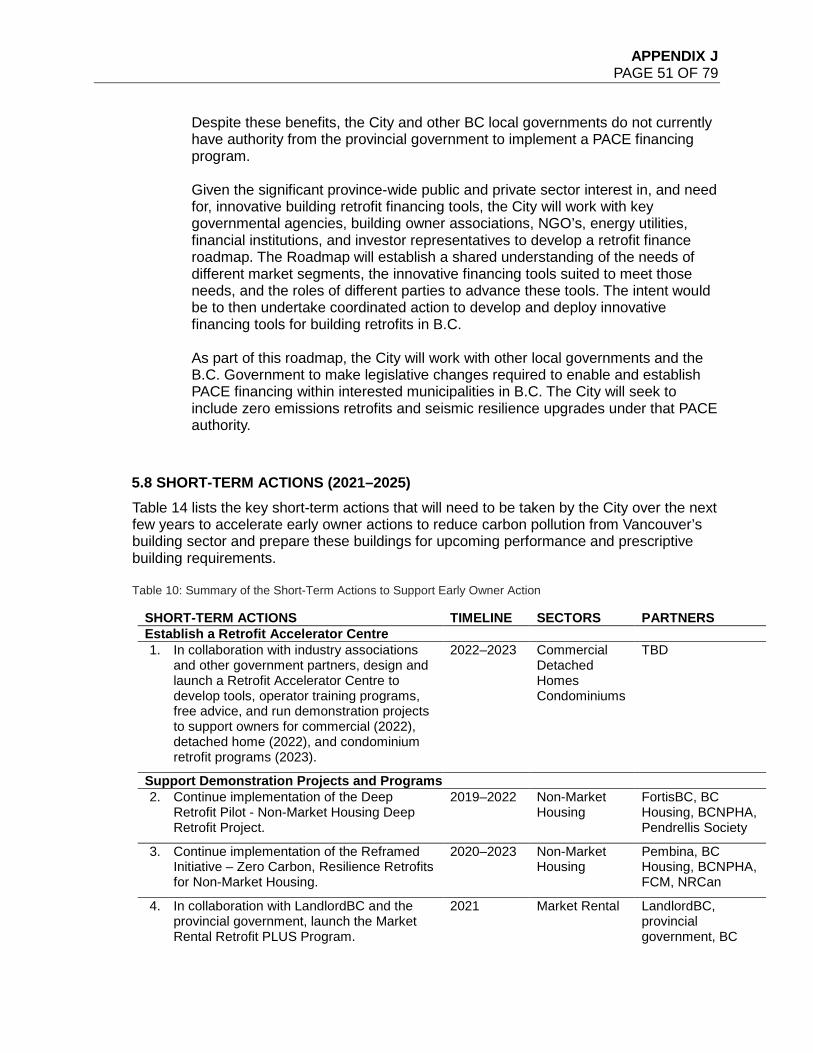
APPENDIX J PAGE 51 OF 79
Despite these benefits, the City and other BC local governments do not currently have authority from the provincial government to implement a PACE financing program. Given the significant province-wide public and private sector interest in, and need for, innovative building retrofit financing tools, the City will work with key governmental agencies, building owner associations, NGO’s, energy utilities, financial institutions, and investor representatives to develop a retrofit finance roadmap. The Roadmap will establish a shared understanding of the needs of different market segments, the innovative financing tools suited to meet those needs, and the roles of different parties to advance these tools. The intent would be to then undertake coordinated action to develop and deploy innovative financing tools for building retrofits in B.C. As part of this roadmap, the City will work with other local governments and the B.C. Government to make legislative changes required to enable and establish PACE financing within interested municipalities in B.C. The City will seek to include zero emissions retrofits and seismic resilience upgrades under that PACE authority.
5.8 SHORT-TERM ACTIONS (2021–2025) Table 14 lists the key short-term actions that will need to be taken by the City over the next few years to accelerate early owner actions to reduce carbon pollution from Vancouver’s building sector and prepare these buildings for upcoming performance and prescriptive building requirements. Table 10: Summary of the Short-Term Actions to Support Early Owner Action
SHORT-TERM ACTIONS TIMELINE SECTORS PARTNERS Establish a Retrofit Accelerator Centre 1. In collaboration with industry associations
and other government partners, design and launch a Retrofit Accelerator Centre to develop tools, operator training programs, free advice, and run demonstration projects to support owners for commercial (2022), detached home (2022), and condominium retrofit programs (2023).
2022–2023 Commercial Detached Homes Condominiums
TBD
Support Demonstration Projects and Programs 2. Continue implementation of the Deep
Retrofit Pilot - Non-Market Housing Deep Retrofit Project.
2019–2022 Non-Market Housing
FortisBC, BC Housing, BCNPHA, Pendrellis Society
3. Continue implementation of the Reframed Initiative – Zero Carbon, Resilience Retrofits for Non-Market Housing.
2020–2023 Non-Market Housing
Pembina, BC Housing, BCNPHA, FCM, NRCan
4. In collaboration with LandlordBC and the provincial government, launch the Market Rental Retrofit PLUS Program.
2021 Market Rental LandlordBC, provincial government, BC
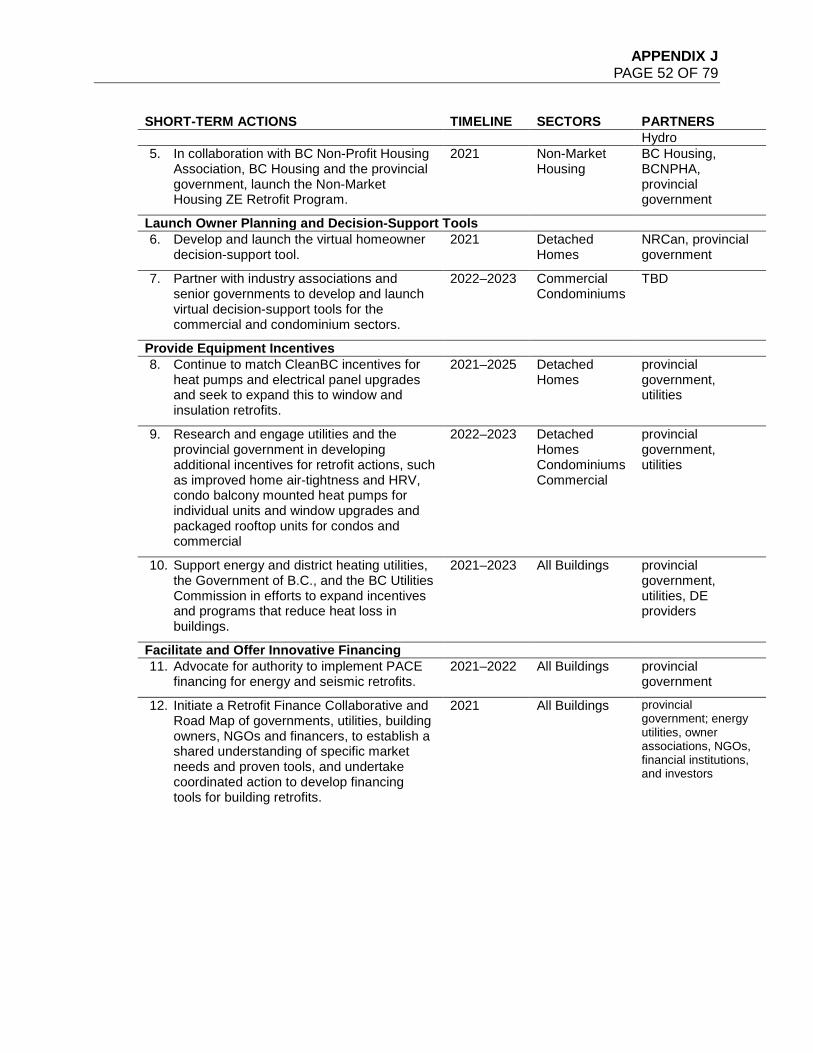
APPENDIX J PAGE 52 OF 79
SHORT-TERM ACTIONS TIMELINE SECTORS PARTNERS Hydro
5. In collaboration with BC Non-Profit Housing Association, BC Housing and the provincial government, launch the Non-Market Housing ZE Retrofit Program.
2021 Non-Market Housing
BC Housing, BCNPHA, provincial government
Launch Owner Planning and Decision-Support Tools 6. Develop and launch the virtual homeowner
decision-support tool. 2021 Detached
Homes NRCan, provincial government
7. Partner with industry associations and senior governments to develop and launch virtual decision-support tools for the commercial and condominium sectors.
2022–2023 Commercial Condominiums
TBD
Provide Equipment Incentives 8. Continue to match CleanBC incentives for
heat pumps and electrical panel upgrades and seek to expand this to window and insulation retrofits.
2021–2025 Detached Homes
provincial government, utilities
9. Research and engage utilities and the provincial government in developing additional incentives for retrofit actions, such as improved home air-tightness and HRV, condo balcony mounted heat pumps for individual units and window upgrades and packaged rooftop units for condos and commercial
2022–2023 Detached Homes Condominiums Commercial
provincial government, utilities
10. Support energy and district heating utilities, the Government of B.C., and the BC Utilities Commission in efforts to expand incentives and programs that reduce heat loss in buildings.
2021–2023 All Buildings provincial government, utilities, DE providers
Facilitate and Offer Innovative Financing 11. Advocate for authority to implement PACE
financing for energy and seismic retrofits. 2021–2022 All Buildings provincial
government
12. Initiate a Retrofit Finance Collaborative and Road Map of governments, utilities, building owners, NGOs and financers, to establish a shared understanding of specific market needs and proven tools, and undertake coordinated action to develop financing tools for building retrofits.
2021 All Buildings provincial government; energy utilities, owner associations, NGOs, financial institutions, and investors
APPENDIX J PAGE 53 OF 79
SECTION 6: BUILD INDUSTRY CAPACITY
6.1 OVERVIEW Achieving deep carbon pollution reductions and facilitating increased adoption of building-energy upgrade projects will require industry support and broader engagement with B.C.’s network of solution-providers, including contractors, energy advisors, architects, engineers and manufacturers/suppliers. The good news is that significant and adequate capacity exists today for the commercial building sector, among contractors and equipment suppliers. Additional experience and training are required for many mechanical design professionals before heat pump retrofits are always properly specified and designed. For multi-family buildings, detached homes and ground-oriented dwellings, there is less local capacity, and poor installation is a concern that requires more short-term action.
6.1.1 KEY ACTIONS 1. Clarify the Future. The City of Vancouver will work in partnership with
industry associations to ensure that there is clarity on future regulations and what types of changes we see as needed to meet those, among building owners, contractors, tradespeople and equipment suppliers working in all building sectors. We will partner with industry associations, trades groups and the Low Carbon Cities Canada (LC3) Low Carbon Innovation Centre and ZEBx to host dialogues and workshops, and to develop design guides for common and effective retrofit solutions..
2. Subsidize Trades Training and Offer Incentives for Retrofits. The City will co-develop with industry the training requirements for City heat pump permits, subsidize the training of trades accreditation and offer incentives for qualified trades for heat pump retrofits. We will advocate alongside industry associations for increased funding to trades schools to expand their capacity in support of the need to increase the number of HVAC technicians available in Vancouver
3. Establish LC3 Low Carbon Innovation Centre. The City will work with Metro Vancouver and the Federation of Canadian Municipalities to establish the LC3 Low Carbon Innovation Centre to facilitate industry best practice sharing, compilation of case studies, fostering a community of practice, and project/product tours.
4. Collaborate to develop and implement B.C.’s Building Electrification Road Map. We will collaborate with government, utility, NGO, and industry partners to develop a Building Electrification Road Map and launch a Building Electrification Coalition to monitor and coordinate collaborative action.
6.1.2 FOCUS ON EQUITY Identify appropriate communication channels and disseminate information in multiple languages on City requirements, industry training opportunities and
APPENDIX J PAGE 54 OF 79
resources to a diversity of tradespeople and general labourers that do existing building contract work in Vancouver.
6.2 INTRODUCTION Contractors, skilled trades, unions, industry associations, manufacturers, suppliers and mechanical design engineers are the key professionals who will be doing the work for home and building owners to reduce carbon pollution in Vancouver. The importance of their roles necessitates a deep level of collaboration and partnership with the City for this retrofit strategy to be successful. Heat pumps are going to play an important role in reducing carbon pollution and the Lower Mainland currently lags behind other regions of North America and the world in its knowledge and capacity to deliver quality and cost-competitive heat pump retrofits. Another issue is that in detached home and small commercial and apartment-style building sectors, most HVAC and plumbing systems are designed and installed by the same people and companies who sell them. For companies that have traditionally sold and installed mainly conventional natural gas heating equipment, the easiest path to securing a profitable and low-risk sale is to continue recommending the ongoing use of natural gas equipment to their customers. The City’s primary role in building industry capacity is to communicate clearly (set a clear signal) and support associations and their members to upskill and grow their industry to capitalize on the significant job and economic growth opportunity that a transition to renewable, low-carbon technologies presents.
6.3 CLARIFY THE FUTURE Most stakeholders have moderate awareness of provincial goals to significantly reduce carbon emissions, but seem unaware of how City goals may impact them or their businesses specifically. Clarity, urgency, and time to prepare are the three most important criteria in fostering an essential and orderly transition to zero emissions buildings. A City regulation is viewed by industry as a central part of this because it will make it clear how they will be impacted and what is required to be prepared. Manufacturers may need to certify some technologies in Canada, a process that takes time. Suppliers need to know when to prepare to stock these new technologies. Tradespeople need to know when to start planning for additional technical training. Targeted technical communications can serve to address some barriers and misconceptions and help to build a community of trade advocates. There is current uncertainty among industry stakeholders about the availability of solutions, equipment performance, electrical system capacity and the cost of new technologies. Contractors need to be convinced themselves before they sell to others. To provide clarity about the level and direction of change intended by the City, targeted messaging is needed for the HVAC industry to provide lead time for technical training and to build a community of advocates.
APPENDIX J PAGE 55 OF 79
The City will need to also partner with industry associations, trade groups and LC3 and ZEBx to host dialogues and workshops, and to develop design guides for common retrofit solutions for all building sectors.
6.3.1 SUBSIDIZE TRADES TRAINING AND OFFER INCENTIVES FOR RETROFITS
SUPPORT GROWTH IN THE HVAC TRADES SECTOR The City should advocate alongside industry associations for increased funding to trades schools to expand their capacity in support of the need to increase the number of HVAC technicians available in the city. There is a high demand for apprenticeships and waitlists for some trades programs. The Heating, Refrigeration and Air Conditioning Institute of Canada (HRAI) and the Mechanical Contractors Association of BC (MCABC) are strong advocates for HVAC trades growth, meeting with provincial government officials to discuss the problems of an aging workforce, skills adaptation and motivating new entrants. Despite this high demand, there is a shortage of skilled HVAC technicians and a need to encourage more high school students to enter the trades as the workforce ages. While the ITA is a government-funded organization that leads and coordinates British Columbia’s skilled trades system. It is in the best position to lead the outreach to high school students, the City’s green brand and ability to point at impactful and local projects indicate we could play a valuable role in supporting this outreach. The Vancouver Regional Construction Association (VRCA), the British Columbia Institute of Technology (BCIT) and Employment and Social Development Canada (ESDC) also have important voices in promoting the industry. The VRCA U40 group offers a Vancouver-specific voice that has the potential to share trades growth messaging. BCIT promotes their trades programs and is aiming to grow the appreciation for trades amongst the public. ESDC offers a Skilled Trades Awareness and Readiness Program. TECHNOLOGY TRAINING The Refrigeration and Air Conditioning Mechanic program provides a foundation in heating, ventilation, air conditioning and refrigeration system design, installation and service. However, trades program curriculum may not adequately cover emerging technologies. New technologies require specific, hands-on training in addition to the fundamentals learned in trades schools. Many of the large HVAC manufacturers offer local or online training and remote support, and there is interest from industry associations, BCIT, and suppliers to develop and host more general training in their facilities.
The City will support these efforts by working with industry to co-develop the training requirements for City heat pump permits, subsidize the training of trades accreditation, and offer incentives for qualified trades for heat pump retrofits.
APPENDIX J PAGE 56 OF 79
As a part of the City’s intent to both streamline permitting and improve the quality of installation of HVAC equipment, it will work with industry associations to co-develop new training courses for the installation of heat pumps in ground-oriented dwellings and detached homes. This will also include the creation of new accreditation requirements for contractors to obtain a permit to install heat pumps in Vancouver. The City will look to industry to shape the content and format of the training, with the objective of making it accessible for the full spectrum of HVAC contractors doing business in the region. These requirements will be designed to complement or be fulfilled by other industry heat pump training initiatives, such as CleanBC’s Program Registered Contractor training and certification initiative.
6.4 ESTABLISH LC3 LOW CARBON INNOVATION CENTRE We will work with Metro Vancouver and the Federation of Canadian Municipalities to establish the LC3 Low Carbon Innovation Centre to facilitate industry best practice sharing, compilation of case studies, fostering a community of practice, and project/product tours. Across the spectrum of commercial and multi-family buildings, there is a need to grow the body of knowledge of how to design and implement low- and zero-carbon pollution retrofits among engineers and design professionals. Modelled after the role the Zero Emissions Building Exchange (ZEBx) has been playing in the new construction sector since 2018, the LC3 Centre in partnership with ZEBx will work to jump-start and catalyze a rapid increase in capacity of mechanical designers, architects, engineers, consultants and equipment manufacturers. There is a growing number of buildings that have implemented low- or zero-carbon retrofits. The LC3 Low Carbon Innovation Centre would be the vehicle for turning these projects into a playbook that becomes standard practice in the 2025–2030 timeframe.
6.5 COLLABORATE TO DEVELOP AND IMPLEMENT B.C.’S BUILDING ELECTRIFICATION ROAD MAP The City will collaborate with government, utility, NGO and industry partners to develop a Building Electrification Road Map and launch a Building Electrification Coalition to monitor and coordinate collaborative action. While provincial and local governments in B.C. are already exploring means of electrifying the building sector, there is still a need for a clear pathway that shows the roles, responsibilities and steps that building industry members can and need to play in effecting a shift toward large-scale adoption of renewable energy technologies. The Building Electrification Road Map (Road Map) will be a tool through which the necessary set of tactical actions has been developed, including the right sequence and steps to ensure that B.C.’s building sector reaps the benefits of a clear and coordinated market transformation. The Road Map is being created with input from the project’s steering committee members, which include representatives from the City and over 150 key building stakeholders. It is being developed over a nine-month period in 2019–2020 and is scheduled to be published in late 2020. Its purpose is to assist the Government of B.C. and other key building sector stakeholders to identify the necessary steps to achieve their building sector climate goals for 2030 and
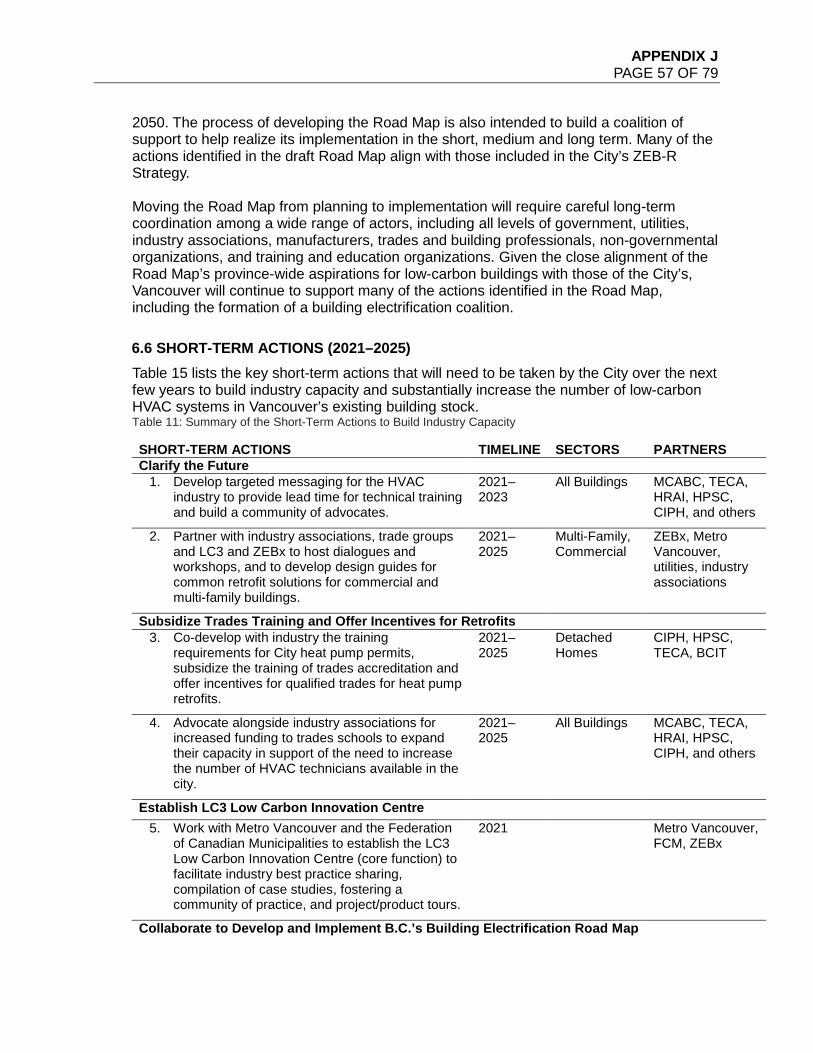
APPENDIX J PAGE 57 OF 79
2050. The process of developing the Road Map is also intended to build a coalition of support to help realize its implementation in the short, medium and long term. Many of the actions identified in the draft Road Map align with those included in the City’s ZEB-R Strategy. Moving the Road Map from planning to implementation will require careful long-term coordination among a wide range of actors, including all levels of government, utilities, industry associations, manufacturers, trades and building professionals, non-governmental organizations, and training and education organizations. Given the close alignment of the Road Map’s province-wide aspirations for low-carbon buildings with those of the City’s, Vancouver will continue to support many of the actions identified in the Road Map, including the formation of a building electrification coalition.
6.6 SHORT-TERM ACTIONS (2021–2025) Table 15 lists the key short-term actions that will need to be taken by the City over the next few years to build industry capacity and substantially increase the number of low-carbon HVAC systems in Vancouver’s existing building stock. Table 11: Summary of the Short-Term Actions to Build Industry Capacity
SHORT-TERM ACTIONS TIMELINE SECTORS PARTNERS Clarify the Future
1. Develop targeted messaging for the HVAC industry to provide lead time for technical training and build a community of advocates.
2021–2023
All Buildings MCABC, TECA, HRAI, HPSC, CIPH, and others
2. Partner with industry associations, trade groups and LC3 and ZEBx to host dialogues and workshops, and to develop design guides for common retrofit solutions for commercial and multi-family buildings.
2021–2025
Multi-Family, Commercial
ZEBx, Metro Vancouver, utilities, industry associations
Subsidize Trades Training and Offer Incentives for Retrofits 3. Co-develop with industry the training
requirements for City heat pump permits, subsidize the training of trades accreditation and offer incentives for qualified trades for heat pump retrofits.
2021–2025
Detached Homes
CIPH, HPSC, TECA, BCIT
4. Advocate alongside industry associations for increased funding to trades schools to expand their capacity in support of the need to increase the number of HVAC technicians available in the city.
2021–2025
All Buildings
MCABC, TECA, HRAI, HPSC, CIPH, and others
Establish LC3 Low Carbon Innovation Centre 5. Work with Metro Vancouver and the Federation
of Canadian Municipalities to establish the LC3 Low Carbon Innovation Centre (core function) to facilitate industry best practice sharing, compilation of case studies, fostering a community of practice, and project/product tours.
2021 Metro Vancouver, FCM, ZEBx
Collaborate to Develop and Implement B.C.’s Building Electrification Road Map

APPENDIX J PAGE 58 OF 79
6. Collaborate with government, utility, NGO and industry partners to develop a Building Electrification Road Map and launch a Building Electrification Coalition to monitor and coordinate collaborative action.
2021–2030
All Buildings provincial government, BC Hydro, utilities, industry groups
APPENDIX J PAGE 59 OF 79
SECTION 7: FACILITATE ACCESS TO RENEWABLE ENERGY
7.1 OVERVIEW Residents and businesses will need cost-effective and accessible renewable energy choices for the ZEB-R Strategy to be successful; this includes grid-supplied electricity from BC Hydro, renewable natural gas from FortisBC and low-carbon district energy from the multiple district energy providers operating in Vancouver. To maximize equity and affordability, the shift to renewable energy must be complemented and enabled by efforts to 1) conserve energy, as renewable energy has a cost premium, 2) minimize environmental impacts outside of Vancouver and 3) minimize the need to upgrade energy distribution infrastructure.
7.1.1 KEY ACTIONS 1. Partner with BC Hydro to Remove Building Electrification Barriers.
We will work with BC Hydro and the provincial government to reduce barriers to electric service upgrades, establish rates and develop equipment incentives that each help to encourage the adoption of electric heat pumps and other building electrification measures.
2. Collaborate with FortisBC to Increase the Supply of RNG. We will work with FortisBC to facilitate the use of renewable natural gas (RNG) as one of tools available to building owners to help meet the City’s carbon pollution limits, and to identify other actions to help FortisBC exceed their 15% renewable gas target for 2030.
3. Collaborate with District Energy Providers to Decarbonize. We will develop and implement systems to account for low-carbon energy provided by district heating utilities to connected buildings through the carbon pollution limit regulation. We will also review and amend City processes, and requirements that may be hindering the DE providers’ investment in and expansion of renewable energy infrastructure.
4. Decarbonize the City-Owned False Creek NEU. We will develop a roadmap to transition the City-owned NEU to 100% renewable energy for all connected buildings by 2030 and evaluate the feasibility of expansion into opportunity areas, including areas of the Central Broadway Corridor and South False Creek.
7.1.2 FOCUS ON EQUITY Work with the provincial government and BC Hydro to ensure that low-income households receive rate subsidies and enhanced incentives for electric space heating and hot water equipment.
7.2 INTRODUCTION Achieving Vancouver’s objectives of having a 50% reduction in carbon pollution by 2030 and 100% renewable energy before 2050 will require buildings to shift from using natural gas that comes from fossil fuels to renewable energy. Success will depend in part on the leadership of our energy utilities in fostering this transition, and the City can play an
APPENDIX J PAGE 60 OF 79
important role as a partner and an advocate in facilitating easy and cost-effective access to this renewable energy. B.C. has the benefits of an electricity grid that is almost entirely renewable, rates that are amongst the lowest in North America, and a surplus clean power production that is anticipated through to 2030. There are also significant opportunities transition the natural gas grid to renewable sources, including hydrogen produced from water using clean electricity during periods of surplus production and from organic wastes. In addition, there are several district heating systems, supplying heat to hundreds of large commercial and residential buildings that have unique opportunities to transition to renewable sources of energy, often from waste heat. In order to make the transition to renewable energy as equitable and cost-effective as possible, the shift must be complemented by significant efforts to conserve energy. • Renewable energy costs more than fossil fuels and, to make the transition as
affordably as possible, we must strive to reduce overall energy use.
• Increased production of renewable energy often comes with other environmental costs that are frequently borne outside of Vancouver. We must strive to minimize the need for increased renewable energy generation in order to protect other aspects of the environment, like our forests and watersheds, and to minimize the effect of our actions on other communities.
• Distributing energy throughout Vancouver and within buildings is constrained by existing infrastructure, such as transformer capacity and heat-duct sizing. Reducing overall energy demand will be an essential strategy to minimize the need to upgrade these systems and avoid the significant cost and disruptions this work would entail.
7.3 PARTNER WITH BC HYDRO TO REMOVE BUILDING ELECTRIFICATION BARRIERS Meeting the goals of this Strategy and setting Vancouver buildings on a path to only using renewable energy before 2050 will depend a rapid and significant transition to building electrification and the use of heat pumps. There are significant barriers to building electrification however, including the fact that service upgrades can be costly and time-consuming, and both residential and commercial electricity rates are not structured to encourage electrification of space heating and hot water. Overcoming these barriers will be critical to ensure that Vancouver’s residents and businesses have cost-effective and timely access to the electricity service they will need to switch to heat pumps and other electrification solutions. There are three important initiatives currently underway that involve the City, BC Hydro and other partners to making building electrification easier and more cost-effective:
1. To better understand and address these issues we are working with BC Hydro on a "Grid Infrastructure Analysis" study. The study will identify barriers and future constraints in local electric distribution infrastructure and service connection policies, and explore actions the City can take to help BC Hydro manage peak demands and/or store energy locally to minimize the need for grid upgrades and to facilitate timely and cost effective infrastructure work when it is required.
APPENDIX J PAGE 61 OF 79
2. The Government of B.C.’s Phase II review of BC Hydro is examining ways in which our electricity utility can better support the CleanBC plan to reduce carbon pollution. The interim Phase II Review report released in March 2020 identified potential actions that will begin to address some of the barriers to building electrification, including optional residential time-of-use rates, interruptible rates, and discounted rates for heat pumps, and optional rates for commercial customers that could facilitate the conversion of district energy systems from natural gas to electricity.
3. Given the critical importance of rapidly increasing the use of heat pumps to capture waste heat energy to reduce carbon pollution from buildings, not just in Vancouver but across B.C. and the rest of the world, Vancouver has been working with BC Hydro, government partners like the Government of B.C., and industry on a Building Electrification Road Map (BERM). This broad collaborative approach reinforces many of these important changes:
• Rates and connection fees that encourage building electrification • Building electrification incentives for home and building owners • A strong building electrification awareness campaign • Support for training and technology innovation initiatives • Collaboration to address barriers
Given that the City is responsible for issuing permits for electrical upgrades and shares in the regulation of electrical distribution infrastructure with BC Hydro, it will be necessary for the two organizations to work collaboratively to address barriers. In some cases, the City and BC Hydro will be able to work on these actions bilaterally. In other cases, changes will require leadership from the Government of B.C. and/or direction from the BC Utilities Commission. Specifically, the City needs to work with BC Hydro, the Government of B.C., and the BC Utilities Commission to ensure that: • Rate structures facilitate the adoption of heat pumps for residential and commercial
buildings. • Service upgrade requirements allow for the most cost-effective solutions. This should
include avoiding electrical panel and transformer upgrades entirely where analysis of load data and the implementation of efficiency measures demonstrates that additional building electrical capacity is available.
• When service upgrades trigger the need for upgraded BC Hydro-owned electrical distribution equipment, charges are not levied to individual buildings/homes and that City requirements and right-of-way management enable those upgrades to be implemented as cost-effectively and timely as possible.
• Low-income households receive a rate subsidy and enhanced incentives for electric heat and hot water and energy conservation.
• Peak electricity demand is mitigated through cost-effective measures, such as thermal/battery storage, equipment efficiency standards in provincial and City regulations, time-of-use pricing and demand response measures.
7.4 COLLABORATE WITH FORTISBC TO INCREASE THE SUPPLY OF RNG In addition to a rapid shift toward building electrification, this strategy also relies on a significant increase in the proportion of gas supply that comes from renewable sources.
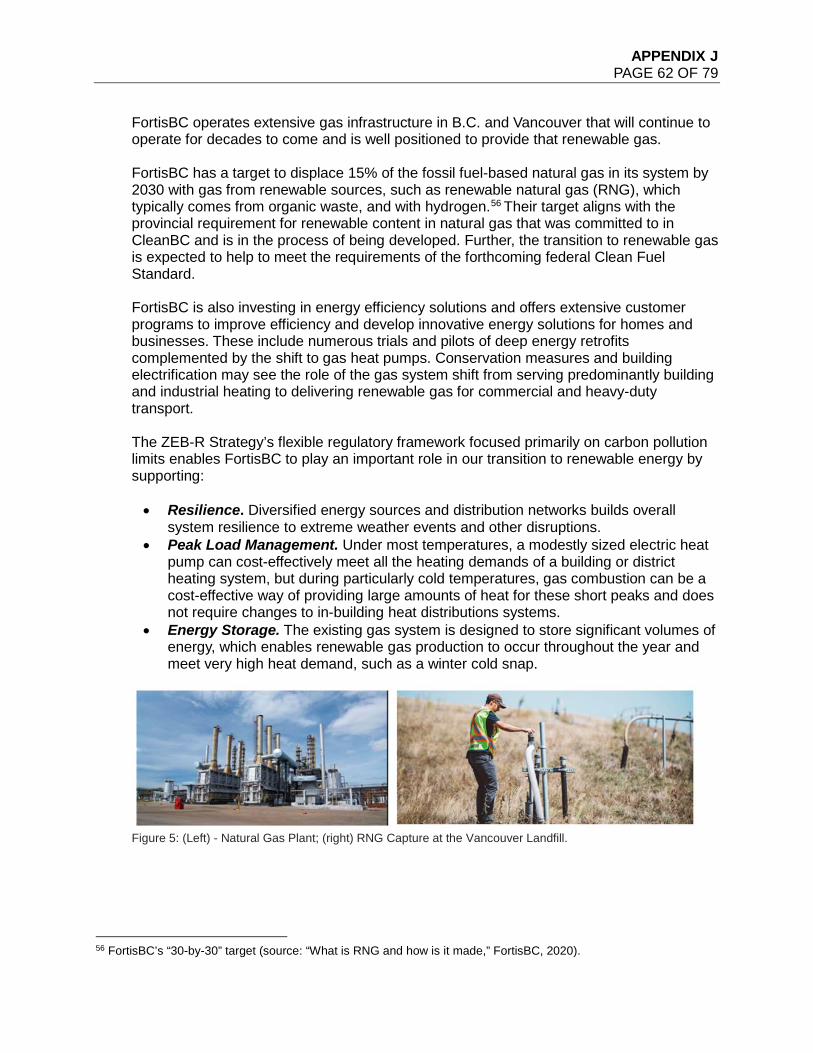
APPENDIX J PAGE 62 OF 79
FortisBC operates extensive gas infrastructure in B.C. and Vancouver that will continue to operate for decades to come and is well positioned to provide that renewable gas. FortisBC has a target to displace 15% of the fossil fuel-based natural gas in its system by 2030 with gas from renewable sources, such as renewable natural gas (RNG), which typically comes from organic waste, and with hydrogen.56 Their target aligns with the provincial requirement for renewable content in natural gas that was committed to in CleanBC and is in the process of being developed. Further, the transition to renewable gas is expected to help to meet the requirements of the forthcoming federal Clean Fuel Standard. FortisBC is also investing in energy efficiency solutions and offers extensive customer programs to improve efficiency and develop innovative energy solutions for homes and businesses. These include numerous trials and pilots of deep energy retrofits complemented by the shift to gas heat pumps. Conservation measures and building electrification may see the role of the gas system shift from serving predominantly building and industrial heating to delivering renewable gas for commercial and heavy-duty transport. The ZEB-R Strategy’s flexible regulatory framework focused primarily on carbon pollution limits enables FortisBC to play an important role in our transition to renewable energy by supporting: • Resilience. Diversified energy sources and distribution networks builds overall
system resilience to extreme weather events and other disruptions. • Peak Load Management. Under most temperatures, a modestly sized electric heat
pump can cost-effectively meet all the heating demands of a building or district heating system, but during particularly cold temperatures, gas combustion can be a cost-effective way of providing large amounts of heat for these short peaks and does not require changes to in-building heat distributions systems.
• Energy Storage. The existing gas system is designed to store significant volumes of energy, which enables renewable gas production to occur throughout the year and meet very high heat demand, such as a winter cold snap.
Figure 5: (Left) - Natural Gas Plant; (right) RNG Capture at the Vancouver Landfill.
56 FortisBC’s “30-by-30” target (source: “What is RNG and how is it made,” FortisBC, 2020).
APPENDIX J PAGE 63 OF 79
7.5 COLLABORATE WITH DISTRICT ENERGY PROVIDERS TO DECARBONIZE District energy networks are centralized systems owned and operated by a utility where thermal energy is distributed from a central location to multiple residential and/or commercial buildings in an area. These systems produce hot water or steam in a central plant and distribute the thermal energy to connected buildings through a network of insulated underground pipes. Many of Vancouver’s higher-density neighbourhoods receive their space heating and hot water from a district energy system. Examples of district heating systems in Vancouver include:
• The City-owned False Creek Neighbourhood Energy Utility provides low-carbon energy services to over 550,000 m2 of mixed-use buildings in the False Creek area.
• Over 200 buildings downtown are connected to a district energy steam system owned by Creative Energy.
• The Marine Gateway development at Marine Drive and Cambie Street is connected to a localized low-carbon central heating network owned and operated by FortisBC Alternative Energy Services Inc.
• Buildings in the River District (along SE Marine Drive) are heated by the River District Energy system.
• Both the Vancouver General Hospital and the Children and Women’s Hospital campuses receive heat from on-campus centralized district energy systems owned by the Provincial Health Services Authority.
With the exception of the False Creek Neighbourhood Energy Utility and the Marine Gateway development, the existing district energy systems in Vancouver rely predominantly on natural gas from fossil sources to generate energy. Transitioning these systems to renewable energy is an important part of the overall Strategy. District and utility-owned centralized on-site energy systems have a number of advantages in their transition to renewable energy, including:
• Lower costs. Renewable energy equipment is often more affordable at larger scales and utilities can make the upfront capital investment in these technologies and spread the costs to customers over a long period of time.
• Smaller space requirements. Centralizing equipment means less space needed overall for energy equipment used to heat and cool buildings. By centralizing the equipment, mostly offsite, it frees up space for building amenities, such as roof decks, bike parking and others.
• Reliable and efficient performance. Because “utility-grade” equipment is installed and professionally operated by the utility, these systems are maintained for optimal performance and simplify things for building operators, who may lack the resources or expertise to operate renewable energy technologies.
One of the biggest advantages of these systems is that they can access renewable energy technologies that are not practical or cost-effective at an individual building scale. For example, district energy systems in the Lower Mainland and around the world are harnessing waste heat from sewer pipes, data centres, industrial processes, central cooling plants and even subways. When these systems add renewable energy capacity, they reduce the emissions of dozens or hundreds of connected buildings and save the
APPENDIX J PAGE 64 OF 79
owners and occupants of those buildings the effort, investments and disruptions associated with deep retrofits in each individual building. The City’s key roles in facilitating access to renewable energy through both its own and private district energy systems are outlined below.
7.5.1 CITY-OWNED FALSE CREEK NEIGHBOURHOOD ENERGY UTILITY • Use the NEU investment decision framework to evaluate feasibility for
expansion of the NEU service area into areas of opportunity, including Central Broadway Corridor and South False Creek.
• Make recommendations to Council on a road map to transition the City-owned NEU to 100% renewable energy for all connected buildings by 2030 that will include: o A feasibility study to assess the most cost-effective renewable energy
sources that maximize co-benefits aligned with other City objectives. o Maximized recovery of local resources, including the expansion of
sewage heat recovery from existing sources and new locations, with a primary focus on the 8th Avenue sewage interceptor.
o The use of renewable natural gas from the Vancouver landfill gas project or other renewable energy sources, such as electric boilers and thermal storage, and demand-side management to address peak demand.
o The recovery of building waste heat from data centres or other industrial and/or institutional buildings near the service area.
o Alignment with the road map with the City-owned NEU’s established governing principles.
• Implement that road map to transition the NEU to 100% renewable energy by 2030 to achieve zero emissions in all connected buildings.
• Foster private sector investment in renewable energy production through procurement of energy for the NEU and City facilities, including the possibility of new connections to adjacent district energy systems.
• Explore policy tools to encourage generators of waste heat (e.g., data centres) to locate within the NEU service area.
7.5.2 PRIVATE UTILITY-OWNED DISTRICT ENERGY • Review the property tax treatment of renewable district heating systems
to identify opportunities to create a level playing field when compared to in-building systems and energy utilities powered by fossil fuels.
• Explore allowing district heating systems to sell credits for low-carbon energy to non-connected buildings if their carbon pollution is below the levels required by the City’s carbon pollution limits. This would create additional flexibility for building owners and accelerate the conversion of these systems to renewable energy.
• Facilitate access to City infrastructure and rights-of-way. Support district energy utilities in their negotiations with other public or private entities to enable installation of renewable energy equipment, new piping, or heat exchangers, especially when this can be aligned with other planned work.
• Support district energy utilities in the efforts to secure senior government funding to invest in renewable energy technologies.
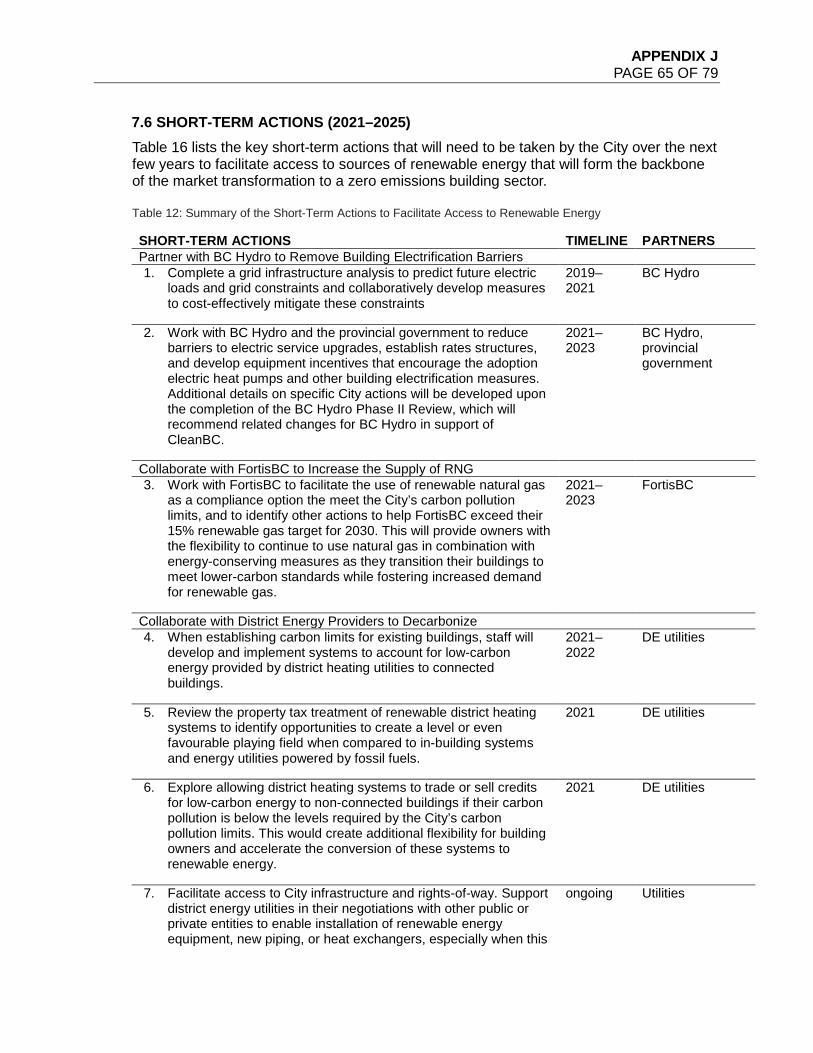
APPENDIX J PAGE 65 OF 79
7.6 SHORT-TERM ACTIONS (2021–2025) Table 16 lists the key short-term actions that will need to be taken by the City over the next few years to facilitate access to sources of renewable energy that will form the backbone of the market transformation to a zero emissions building sector. Table 12: Summary of the Short-Term Actions to Facilitate Access to Renewable Energy
SHORT-TERM ACTIONS TIMELINE PARTNERS Partner with BC Hydro to Remove Building Electrification Barriers 1. Complete a grid infrastructure analysis to predict future electric
loads and grid constraints and collaboratively develop measures to cost-effectively mitigate these constraints
2019–2021
BC Hydro
2. Work with BC Hydro and the provincial government to reduce barriers to electric service upgrades, establish rates structures, and develop equipment incentives that encourage the adoption electric heat pumps and other building electrification measures. Additional details on specific City actions will be developed upon the completion of the BC Hydro Phase II Review, which will recommend related changes for BC Hydro in support of CleanBC.
2021–2023
BC Hydro, provincial government
Collaborate with FortisBC to Increase the Supply of RNG 3. Work with FortisBC to facilitate the use of renewable natural gas
as a compliance option the meet the City’s carbon pollution limits, and to identify other actions to help FortisBC exceed their 15% renewable gas target for 2030. This will provide owners with the flexibility to continue to use natural gas in combination with energy-conserving measures as they transition their buildings to meet lower-carbon standards while fostering increased demand for renewable gas.
2021–2023
FortisBC
Collaborate with District Energy Providers to Decarbonize 4. When establishing carbon limits for existing buildings, staff will
develop and implement systems to account for low-carbon energy provided by district heating utilities to connected buildings.
2021–2022
DE utilities
5. Review the property tax treatment of renewable district heating systems to identify opportunities to create a level or even favourable playing field when compared to in-building systems and energy utilities powered by fossil fuels.
2021 DE utilities
6. Explore allowing district heating systems to trade or sell credits for low-carbon energy to non-connected buildings if their carbon pollution is below the levels required by the City’s carbon pollution limits. This would create additional flexibility for building owners and accelerate the conversion of these systems to renewable energy.
2021 DE utilities
7. Facilitate access to City infrastructure and rights-of-way. Support district energy utilities in their negotiations with other public or private entities to enable installation of renewable energy equipment, new piping, or heat exchangers, especially when this
ongoing Utilities
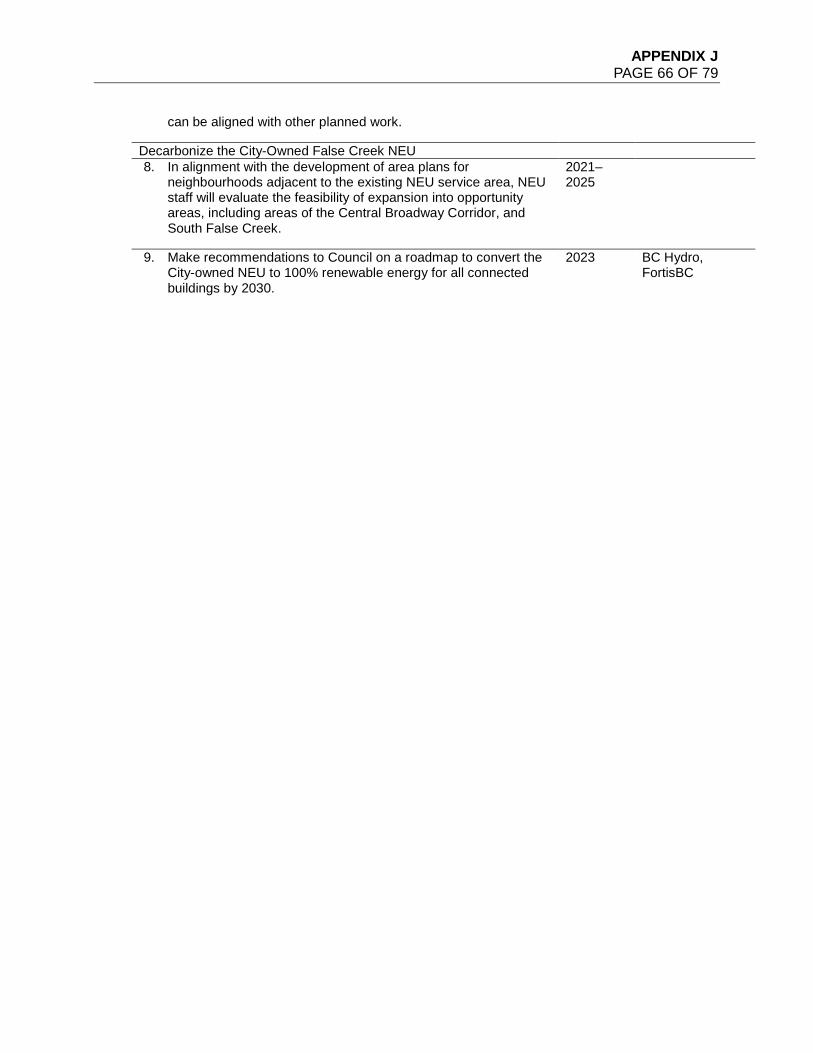
APPENDIX J PAGE 66 OF 79
can be aligned with other planned work.
Decarbonize the City-Owned False Creek NEU 8. In alignment with the development of area plans for
neighbourhoods adjacent to the existing NEU service area, NEU staff will evaluate the feasibility of expansion into opportunity areas, including areas of the Central Broadway Corridor, and South False Creek.
2021–2025
9. Make recommendations to Council on a roadmap to convert the City-owned NEU to 100% renewable energy for all connected buildings by 2030.
2023 BC Hydro, FortisBC
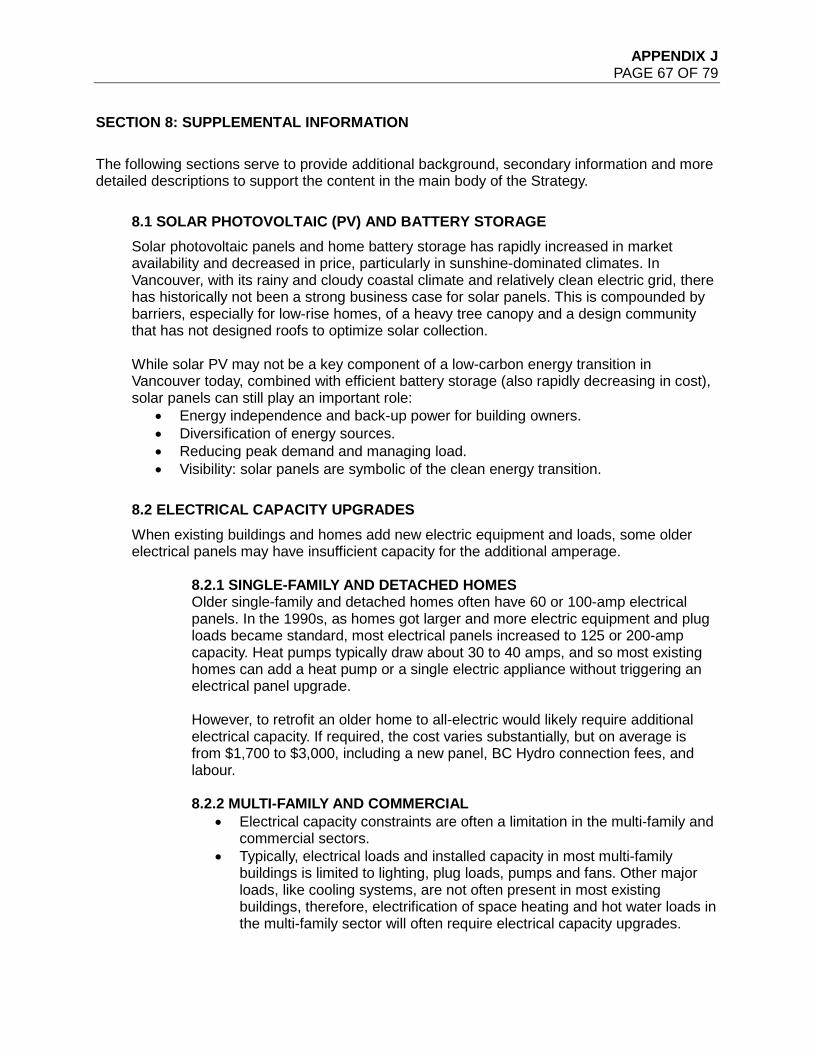
APPENDIX J PAGE 67 OF 79
SECTION 8: SUPPLEMENTAL INFORMATION The following sections serve to provide additional background, secondary information and more detailed descriptions to support the content in the main body of the Strategy.
8.1 SOLAR PHOTOVOLTAIC (PV) AND BATTERY STORAGE Solar photovoltaic panels and home battery storage has rapidly increased in market availability and decreased in price, particularly in sunshine-dominated climates. In Vancouver, with its rainy and cloudy coastal climate and relatively clean electric grid, there has historically not been a strong business case for solar panels. This is compounded by barriers, especially for low-rise homes, of a heavy tree canopy and a design community that has not designed roofs to optimize solar collection. While solar PV may not be a key component of a low-carbon energy transition in Vancouver today, combined with efficient battery storage (also rapidly decreasing in cost), solar panels can still play an important role:
• Energy independence and back-up power for building owners. • Diversification of energy sources. • Reducing peak demand and managing load. • Visibility: solar panels are symbolic of the clean energy transition.
8.2 ELECTRICAL CAPACITY UPGRADES When existing buildings and homes add new electric equipment and loads, some older electrical panels may have insufficient capacity for the additional amperage.
8.2.1 SINGLE-FAMILY AND DETACHED HOMES Older single-family and detached homes often have 60 or 100-amp electrical panels. In the 1990s, as homes got larger and more electric equipment and plug loads became standard, most electrical panels increased to 125 or 200-amp capacity. Heat pumps typically draw about 30 to 40 amps, and so most existing homes can add a heat pump or a single electric appliance without triggering an electrical panel upgrade. However, to retrofit an older home to all-electric would likely require additional electrical capacity. If required, the cost varies substantially, but on average is from $1,700 to $3,000, including a new panel, BC Hydro connection fees, and labour. 8.2.2 MULTI-FAMILY AND COMMERCIAL
• Electrical capacity constraints are often a limitation in the multi-family and commercial sectors.
• Typically, electrical loads and installed capacity in most multi-family buildings is limited to lighting, plug loads, pumps and fans. Other major loads, like cooling systems, are not often present in most existing buildings, therefore, electrification of space heating and hot water loads in the multi-family sector will often require electrical capacity upgrades.
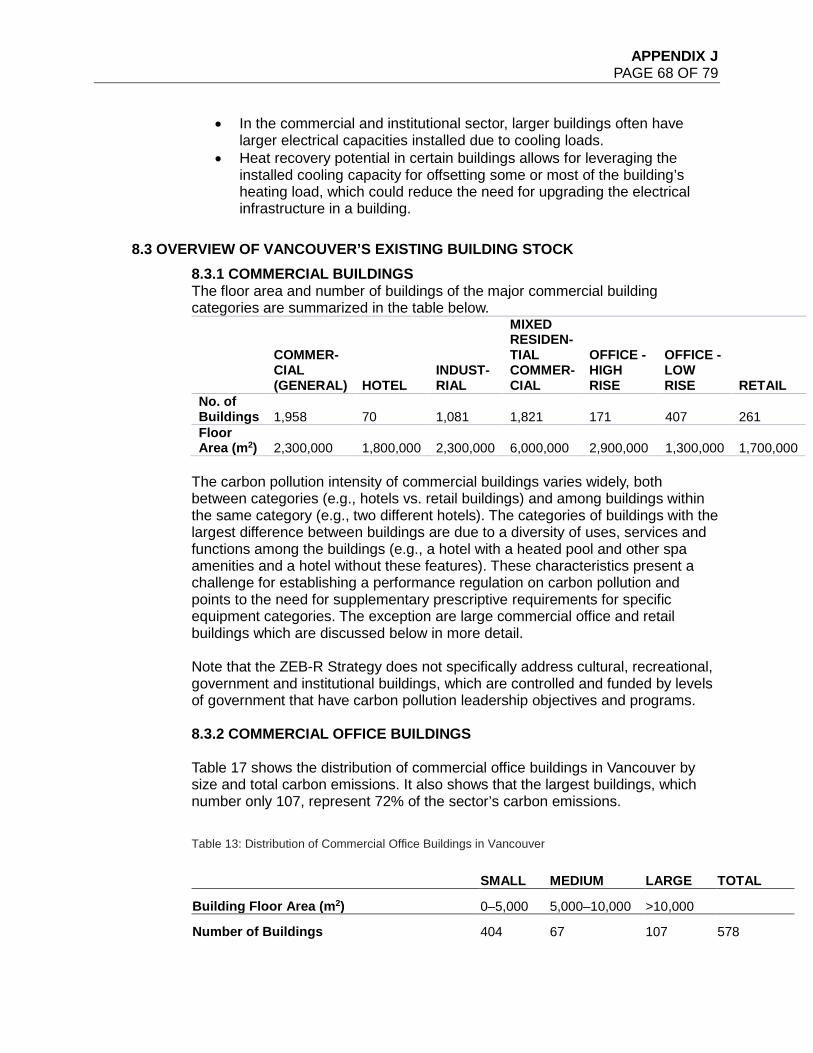
APPENDIX J PAGE 68 OF 79
• In the commercial and institutional sector, larger buildings often have larger electrical capacities installed due to cooling loads.
• Heat recovery potential in certain buildings allows for leveraging the installed cooling capacity for offsetting some or most of the building’s heating load, which could reduce the need for upgrading the electrical infrastructure in a building.
8.3 OVERVIEW OF VANCOUVER’S EXISTING BUILDING STOCK 8.3.1 COMMERCIAL BUILDINGS The floor area and number of buildings of the major commercial building categories are summarized in the table below.
COMMER-CIAL (GENERAL) HOTEL
INDUST-RIAL
MIXED RESIDEN-TIAL COMMER-CIAL
OFFICE - HIGH RISE
OFFICE - LOW RISE RETAIL
No. of Buildings 1,958 70 1,081 1,821 171 407 261 Floor Area (m2) 2,300,000 1,800,000 2,300,000 6,000,000 2,900,000 1,300,000 1,700,000
The carbon pollution intensity of commercial buildings varies widely, both between categories (e.g., hotels vs. retail buildings) and among buildings within the same category (e.g., two different hotels). The categories of buildings with the largest difference between buildings are due to a diversity of uses, services and functions among the buildings (e.g., a hotel with a heated pool and other spa amenities and a hotel without these features). These characteristics present a challenge for establishing a performance regulation on carbon pollution and points to the need for supplementary prescriptive requirements for specific equipment categories. The exception are large commercial office and retail buildings which are discussed below in more detail. Note that the ZEB-R Strategy does not specifically address cultural, recreational, government and institutional buildings, which are controlled and funded by levels of government that have carbon pollution leadership objectives and programs. 8.3.2 COMMERCIAL OFFICE BUILDINGS Table 17 shows the distribution of commercial office buildings in Vancouver by size and total carbon emissions. It also shows that the largest buildings, which number only 107, represent 72% of the sector’s carbon emissions.
Table 13: Distribution of Commercial Office Buildings in Vancouver
SMALL MEDIUM LARGE TOTAL
Building Floor Area (m2) 0–5,000 5,000–10,000 >10,000
Number of Buildings 404 67 107 578
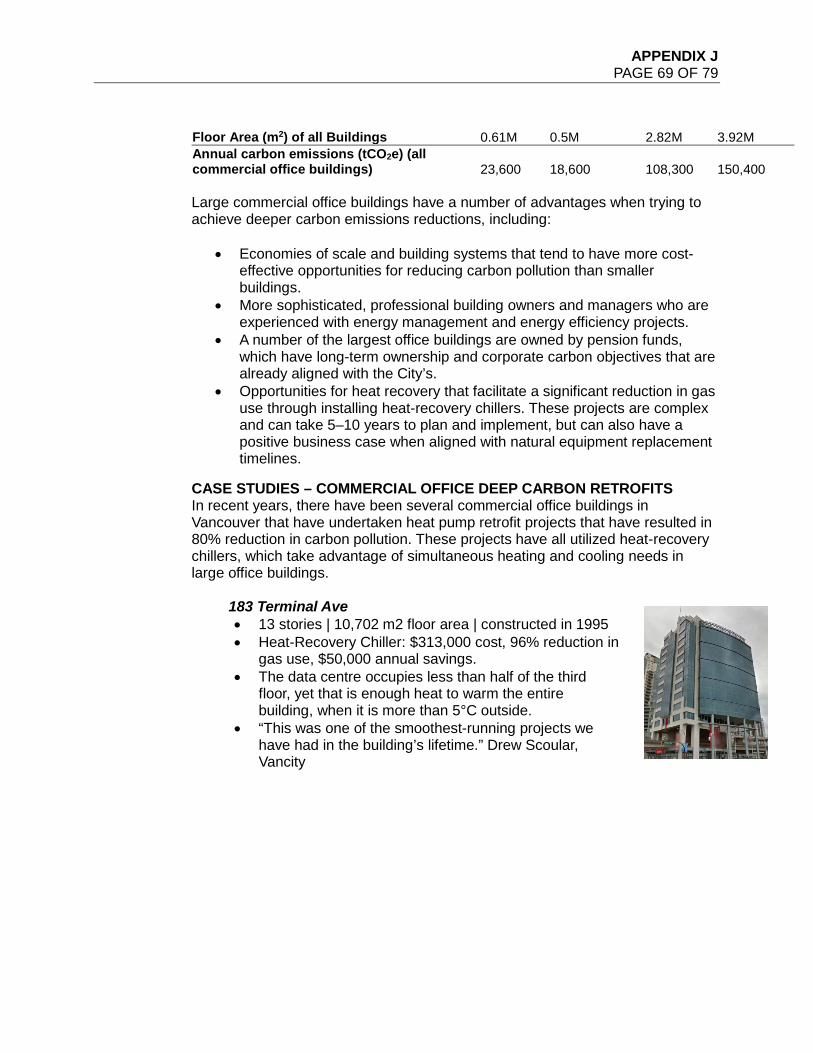
APPENDIX J PAGE 69 OF 79
Floor Area (m2) of all Buildings 0.61M 0.5M 2.82M 3.92M Annual carbon emissions (tCO2e) (all commercial office buildings) 23,600 18,600 108,300 150,400
Large commercial office buildings have a number of advantages when trying to achieve deeper carbon emissions reductions, including:
• Economies of scale and building systems that tend to have more cost-effective opportunities for reducing carbon pollution than smaller buildings.
• More sophisticated, professional building owners and managers who are experienced with energy management and energy efficiency projects.
• A number of the largest office buildings are owned by pension funds, which have long-term ownership and corporate carbon objectives that are already aligned with the City’s.
• Opportunities for heat recovery that facilitate a significant reduction in gas use through installing heat-recovery chillers. These projects are complex and can take 5–10 years to plan and implement, but can also have a positive business case when aligned with natural equipment replacement timelines.
CASE STUDIES – COMMERCIAL OFFICE DEEP CARBON RETROFITS In recent years, there have been several commercial office buildings in Vancouver that have undertaken heat pump retrofit projects that have resulted in 80% reduction in carbon pollution. These projects have all utilized heat-recovery chillers, which take advantage of simultaneous heating and cooling needs in large office buildings.
183 Terminal Ave • 13 stories | 10,702 m2 floor area | constructed in 1995 • Heat-Recovery Chiller: $313,000 cost, 96% reduction in
gas use, $50,000 annual savings. • The data centre occupies less than half of the third
floor, yet that is enough heat to warm the entire building, when it is more than 5°C outside.
• “This was one of the smoothest-running projects we have had in the building’s lifetime.” Drew Scoular, Vancity
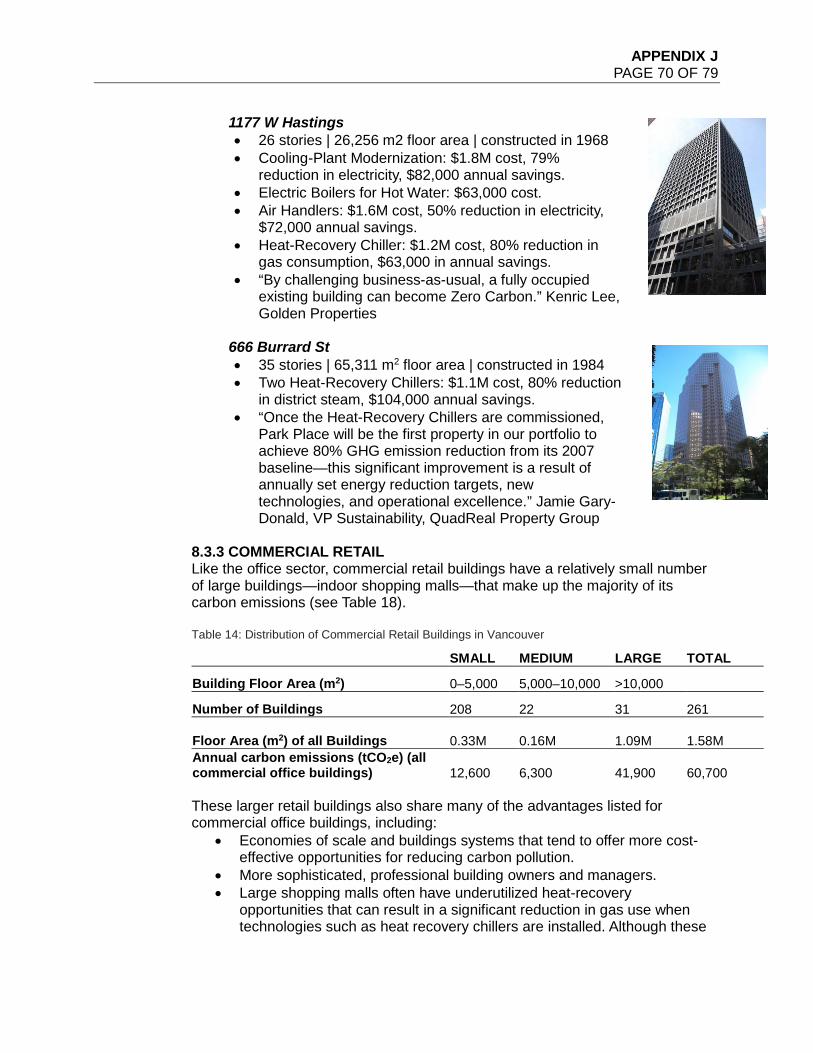
APPENDIX J PAGE 70 OF 79
1177 W Hastings • 26 stories | 26,256 m2 floor area | constructed in 1968 • Cooling-Plant Modernization: $1.8M cost, 79%
reduction in electricity, $82,000 annual savings. • Electric Boilers for Hot Water: $63,000 cost. • Air Handlers: $1.6M cost, 50% reduction in electricity,
$72,000 annual savings. • Heat-Recovery Chiller: $1.2M cost, 80% reduction in
gas consumption, $63,000 in annual savings. • “By challenging business-as-usual, a fully occupied
existing building can become Zero Carbon.” Kenric Lee, Golden Properties
666 Burrard St • 35 stories | 65,311 m2 floor area | constructed in 1984 • Two Heat-Recovery Chillers: $1.1M cost, 80% reduction
in district steam, $104,000 annual savings. • “Once the Heat-Recovery Chillers are commissioned,
Park Place will be the first property in our portfolio to achieve 80% GHG emission reduction from its 2007 baseline—this significant improvement is a result of annually set energy reduction targets, new technologies, and operational excellence.” Jamie Gary-Donald, VP Sustainability, QuadReal Property Group
8.3.3 COMMERCIAL RETAIL Like the office sector, commercial retail buildings have a relatively small number of large buildings—indoor shopping malls—that make up the majority of its carbon emissions (see Table 18). Table 14: Distribution of Commercial Retail Buildings in Vancouver
SMALL MEDIUM LARGE TOTAL
Building Floor Area (m2) 0–5,000 5,000–10,000 >10,000
Number of Buildings 208 22 31 261
Floor Area (m2) of all Buildings 0.33M 0.16M 1.09M 1.58M Annual carbon emissions (tCO2e) (all commercial office buildings) 12,600 6,300 41,900 60,700
These larger retail buildings also share many of the advantages listed for commercial office buildings, including:
• Economies of scale and buildings systems that tend to offer more cost-effective opportunities for reducing carbon pollution.
• More sophisticated, professional building owners and managers. • Large shopping malls often have underutilized heat-recovery
opportunities that can result in a significant reduction in gas use when technologies such as heat recovery chillers are installed. Although these
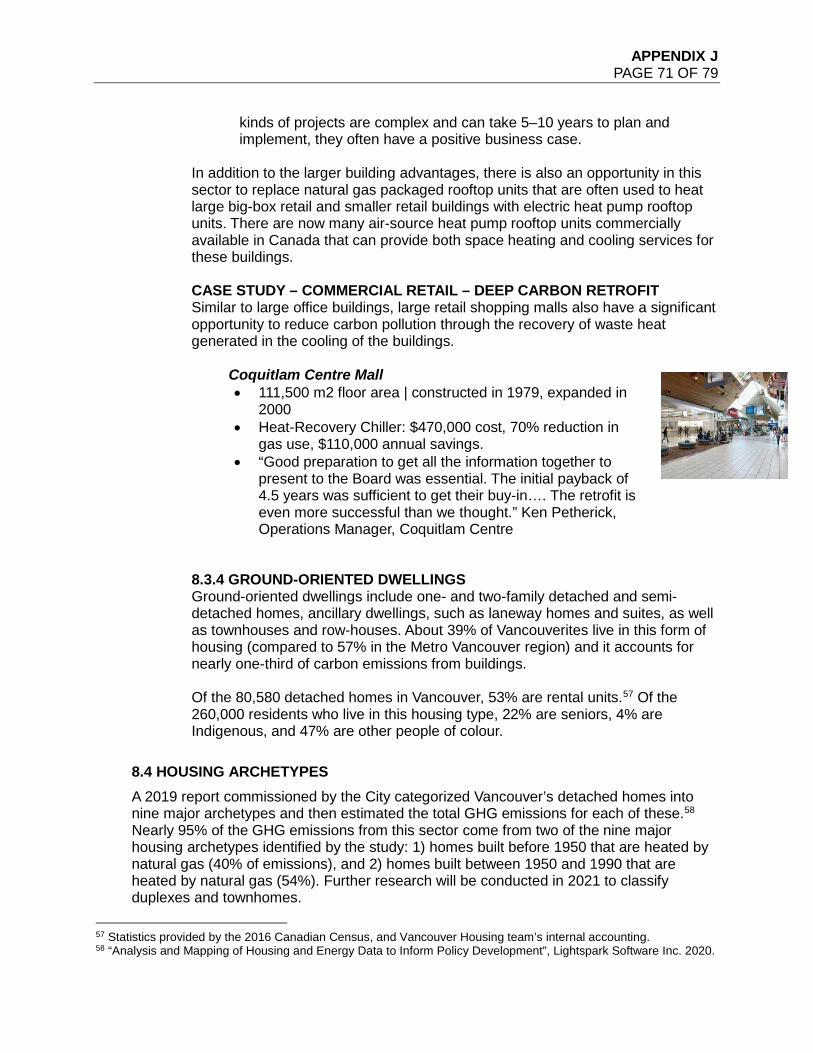
APPENDIX J PAGE 71 OF 79
kinds of projects are complex and can take 5–10 years to plan and implement, they often have a positive business case.
In addition to the larger building advantages, there is also an opportunity in this sector to replace natural gas packaged rooftop units that are often used to heat large big-box retail and smaller retail buildings with electric heat pump rooftop units. There are now many air-source heat pump rooftop units commercially available in Canada that can provide both space heating and cooling services for these buildings. CASE STUDY – COMMERCIAL RETAIL – DEEP CARBON RETROFIT Similar to large office buildings, large retail shopping malls also have a significant opportunity to reduce carbon pollution through the recovery of waste heat generated in the cooling of the buildings.
Coquitlam Centre Mall • 111,500 m2 floor area | constructed in 1979, expanded in
2000 • Heat-Recovery Chiller: $470,000 cost, 70% reduction in
gas use, $110,000 annual savings. • “Good preparation to get all the information together to
present to the Board was essential. The initial payback of 4.5 years was sufficient to get their buy-in…. The retrofit is even more successful than we thought.” Ken Petherick, Operations Manager, Coquitlam Centre
8.3.4 GROUND-ORIENTED DWELLINGS Ground-oriented dwellings include one- and two-family detached and semi-detached homes, ancillary dwellings, such as laneway homes and suites, as well as townhouses and row-houses. About 39% of Vancouverites live in this form of housing (compared to 57% in the Metro Vancouver region) and it accounts for nearly one-third of carbon emissions from buildings. Of the 80,580 detached homes in Vancouver, 53% are rental units.57 Of the 260,000 residents who live in this housing type, 22% are seniors, 4% are Indigenous, and 47% are other people of colour.
8.4 HOUSING ARCHETYPES A 2019 report commissioned by the City categorized Vancouver’s detached homes into nine major archetypes and then estimated the total GHG emissions for each of these.58 Nearly 95% of the GHG emissions from this sector come from two of the nine major housing archetypes identified by the study: 1) homes built before 1950 that are heated by natural gas (40% of emissions), and 2) homes built between 1950 and 1990 that are heated by natural gas (54%). Further research will be conducted in 2021 to classify duplexes and townhomes.
57 Statistics provided by the 2016 Canadian Census, and Vancouver Housing team’s internal accounting. 58 “Analysis and Mapping of Housing and Energy Data to Inform Policy Development”, Lightspark Software Inc. 2020.
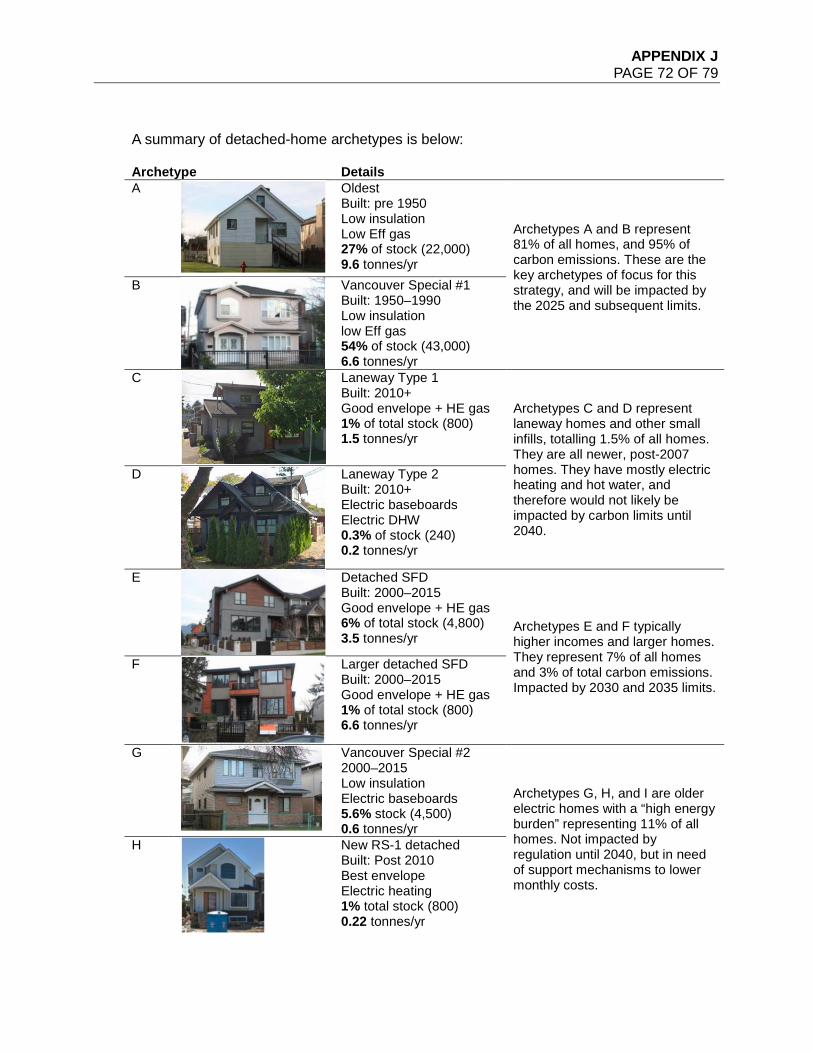
APPENDIX J PAGE 72 OF 79
A summary of detached-home archetypes is below: Archetype Details A
Oldest Built: pre 1950 Low insulation Low Eff gas 27% of stock (22,000) 9.6 tonnes/yr
Archetypes A and B represent 81% of all homes, and 95% of carbon emissions. These are the key archetypes of focus for this strategy, and will be impacted by the 2025 and subsequent limits.
B
Vancouver Special #1 Built: 1950–1990 Low insulation low Eff gas 54% of stock (43,000) 6.6 tonnes/yr
C
Laneway Type 1 Built: 2010+ Good envelope + HE gas 1% of total stock (800) 1.5 tonnes/yr
Archetypes C and D represent laneway homes and other small infills, totalling 1.5% of all homes. They are all newer, post-2007 homes. They have mostly electric heating and hot water, and therefore would not likely be impacted by carbon limits until 2040.
D
Laneway Type 2 Built: 2010+ Electric baseboards Electric DHW 0.3% of stock (240) 0.2 tonnes/yr
E
Detached SFD Built: 2000–2015 Good envelope + HE gas 6% of total stock (4,800) 3.5 tonnes/yr
Archetypes E and F typically higher incomes and larger homes. They represent 7% of all homes and 3% of total carbon emissions. Impacted by 2030 and 2035 limits.
F
Larger detached SFD Built: 2000–2015 Good envelope + HE gas 1% of total stock (800) 6.6 tonnes/yr
G
Vancouver Special #2 2000–2015 Low insulation Electric baseboards 5.6% stock (4,500) 0.6 tonnes/yr
Archetypes G, H, and I are older electric homes with a “high energy burden” representing 11% of all homes. Not impacted by regulation until 2040, but in need of support mechanisms to lower monthly costs.
H
New RS-1 detached Built: Post 2010 Best envelope Electric heating 1% total stock (800) 0.22 tonnes/yr
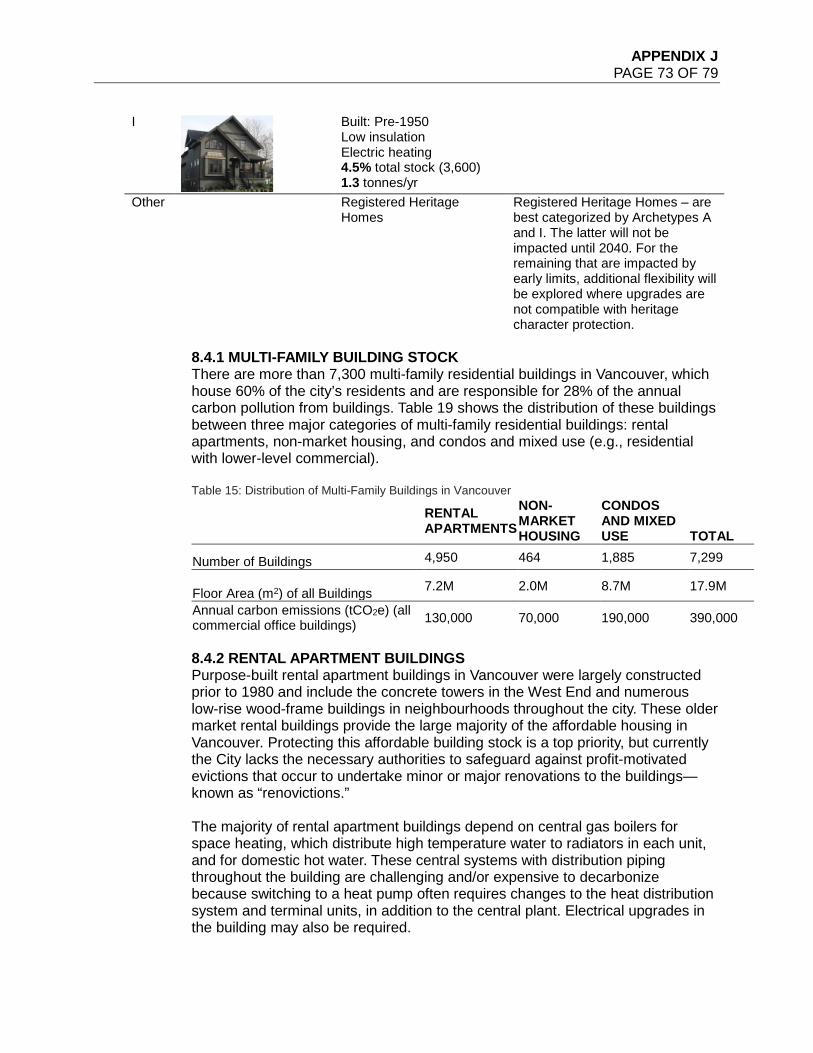
APPENDIX J PAGE 73 OF 79
I
Built: Pre-1950 Low insulation Electric heating 4.5% total stock (3,600) 1.3 tonnes/yr
Other Registered Heritage Homes
Registered Heritage Homes – are best categorized by Archetypes A and I. The latter will not be impacted until 2040. For the remaining that are impacted by early limits, additional flexibility will be explored where upgrades are not compatible with heritage character protection.
8.4.1 MULTI-FAMILY BUILDING STOCK There are more than 7,300 multi-family residential buildings in Vancouver, which house 60% of the city’s residents and are responsible for 28% of the annual carbon pollution from buildings. Table 19 shows the distribution of these buildings between three major categories of multi-family residential buildings: rental apartments, non-market housing, and condos and mixed use (e.g., residential with lower-level commercial). Table 15: Distribution of Multi-Family Buildings in Vancouver
RENTAL APARTMENTS
NON-MARKET HOUSING
CONDOS AND MIXED USE TOTAL
Number of Buildings 4,950 464 1,885 7,299
Floor Area (m2) of all Buildings 7.2M 2.0M 8.7M 17.9M
Annual carbon emissions (tCO2e) (all commercial office buildings) 130,000 70,000 190,000 390,000
8.4.2 RENTAL APARTMENT BUILDINGS Purpose-built rental apartment buildings in Vancouver were largely constructed prior to 1980 and include the concrete towers in the West End and numerous low-rise wood-frame buildings in neighbourhoods throughout the city. These older market rental buildings provide the large majority of the affordable housing in Vancouver. Protecting this affordable building stock is a top priority, but currently the City lacks the necessary authorities to safeguard against profit-motivated evictions that occur to undertake minor or major renovations to the buildings—known as “renovictions.” The majority of rental apartment buildings depend on central gas boilers for space heating, which distribute high temperature water to radiators in each unit, and for domestic hot water. These central systems with distribution piping throughout the building are challenging and/or expensive to decarbonize because switching to a heat pump often requires changes to the heat distribution system and terminal units, in addition to the central plant. Electrical upgrades in the building may also be required.
APPENDIX J PAGE 74 OF 79
Owners of market rental buildings typically have small profit margins and the B.C. Rental Tenancy Act limits landlords’ ability to raise rents to pay for capital improvements, including energy efficiency. In addition to carbon pollution, the older rental building stock is also in need of retrofits to upgrade their fire safety systems, accessibility and seismic performance. The worst-performing buildings from a seismic and carbon pollution perspective were constructed prior to 1980 and, in particular, before 1970. Future building retrofit policies and programs developed by the City need to consider seismic risk factors and whole-building costs involved. This is another reason that makes addressing carbon pollution in purpose-built rental buildings particularly complex. Many rental buildings are well maintained and have been actively replacing major buildings systems when they are in need of renewal. Many others, typically smaller buildings that are family-owned, have deferred maintenance that will need to be addressed to preserve the buildings. Any new programs or requirements for reducing carbon pollution from rental buildings should be designed holistically in coordination with other retrofit and renewal priorities for these buildings, in partnership with senior levels of government. As a result of these factors, carbon limits to reduce carbon pollution in rental apartment buildings is not viable at this time. That said, there are small and easy-to-implement measures that cost-effectively reduce emissions in rental buildings, such as installing low-flow shower heads. As described in other sections of the ZEB-R Strategy, the short-term focus will be on supporting voluntary action and shared insight into costs of making our most affordable rental housing safe and low carbon, developing a land use approach with the Vancouver Plan to make meaningful changes for these complex challenges possible, and advocacy for an improved ability to finance retrofits. 8.4.3 NON-MARKET HOUSING The City of Vancouver has approximately 26,700 non-market housing units spread over 464 housing projects, which are operated by 208 different organizations, 110 of which are independent housing co-operatives. The majority of these units were built between 1950 and 2000. Similar to the market rental housing stock, the majority of non-market housing buildings depend on central gas boilers for space heating, which distributes high-temperature water to radiators in each unit, and for domestic hot water. These central systems are challenging and/or expensive to decarbonize because switching to a heat pump often requires changes to the heat distribution system and terminal units, in addition to the central plant. Electrical upgrades in the building may also be required. The federal and provincial governments are funding large capital replacement programs for non-market housing buildings, for which carbon pollution reduction projects are eligible. Most non-market housing providers have agreements in place with BC Housing and/or the Canadian Municipal Housing Corporation
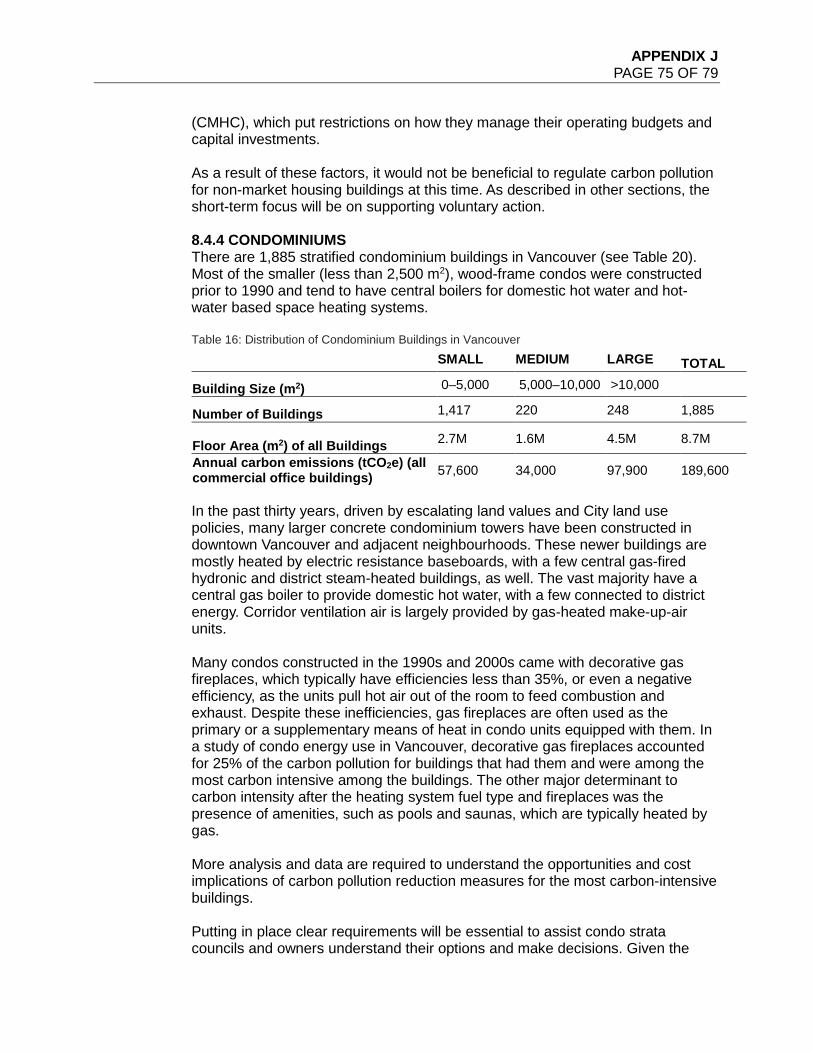
APPENDIX J PAGE 75 OF 79
(CMHC), which put restrictions on how they manage their operating budgets and capital investments. As a result of these factors, it would not be beneficial to regulate carbon pollution for non-market housing buildings at this time. As described in other sections, the short-term focus will be on supporting voluntary action. 8.4.4 CONDOMINIUMS There are 1,885 stratified condominium buildings in Vancouver (see Table 20). Most of the smaller (less than 2,500 m2), wood-frame condos were constructed prior to 1990 and tend to have central boilers for domestic hot water and hot-water based space heating systems. Table 16: Distribution of Condominium Buildings in Vancouver
SMALL MEDIUM LARGE TOTAL
Building Size (m2) 0–5,000 5,000–10,000 >10,000
Number of Buildings 1,417 220 248 1,885
Floor Area (m2) of all Buildings 2.7M 1.6M 4.5M 8.7M
Annual carbon emissions (tCO2e) (all commercial office buildings) 57,600 34,000 97,900 189,600
In the past thirty years, driven by escalating land values and City land use policies, many larger concrete condominium towers have been constructed in downtown Vancouver and adjacent neighbourhoods. These newer buildings are mostly heated by electric resistance baseboards, with a few central gas-fired hydronic and district steam-heated buildings, as well. The vast majority have a central gas boiler to provide domestic hot water, with a few connected to district energy. Corridor ventilation air is largely provided by gas-heated make-up-air units. Many condos constructed in the 1990s and 2000s came with decorative gas fireplaces, which typically have efficiencies less than 35%, or even a negative efficiency, as the units pull hot air out of the room to feed combustion and exhaust. Despite these inefficiencies, gas fireplaces are often used as the primary or a supplementary means of heat in condo units equipped with them. In a study of condo energy use in Vancouver, decorative gas fireplaces accounted for 25% of the carbon pollution for buildings that had them and were among the most carbon intensive among the buildings. The other major determinant to carbon intensity after the heating system fuel type and fireplaces was the presence of amenities, such as pools and saunas, which are typically heated by gas. More analysis and data are required to understand the opportunities and cost implications of carbon pollution reduction measures for the most carbon-intensive buildings. Putting in place clear requirements will be essential to assist condo strata councils and owners understand their options and make decisions. Given the
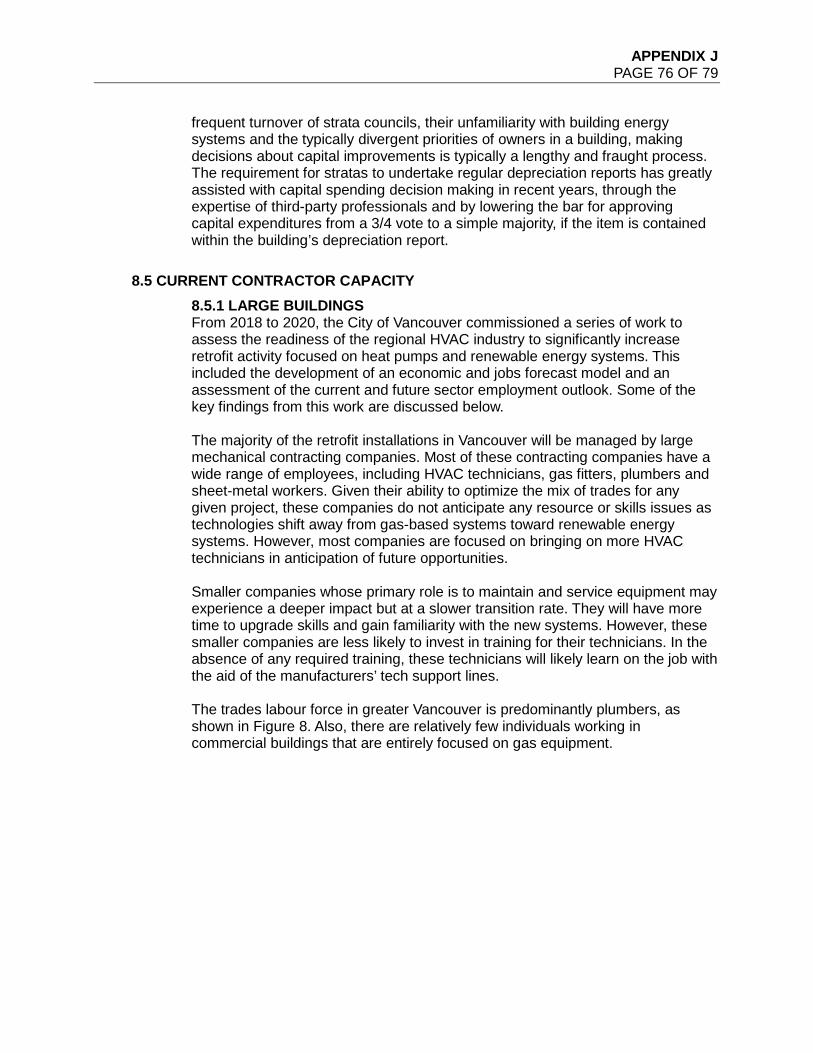
APPENDIX J PAGE 76 OF 79
frequent turnover of strata councils, their unfamiliarity with building energy systems and the typically divergent priorities of owners in a building, making decisions about capital improvements is typically a lengthy and fraught process. The requirement for stratas to undertake regular depreciation reports has greatly assisted with capital spending decision making in recent years, through the expertise of third-party professionals and by lowering the bar for approving capital expenditures from a 3/4 vote to a simple majority, if the item is contained within the building’s depreciation report.
8.5 CURRENT CONTRACTOR CAPACITY 8.5.1 LARGE BUILDINGS From 2018 to 2020, the City of Vancouver commissioned a series of work to assess the readiness of the regional HVAC industry to significantly increase retrofit activity focused on heat pumps and renewable energy systems. This included the development of an economic and jobs forecast model and an assessment of the current and future sector employment outlook. Some of the key findings from this work are discussed below. The majority of the retrofit installations in Vancouver will be managed by large mechanical contracting companies. Most of these contracting companies have a wide range of employees, including HVAC technicians, gas fitters, plumbers and sheet-metal workers. Given their ability to optimize the mix of trades for any given project, these companies do not anticipate any resource or skills issues as technologies shift away from gas-based systems toward renewable energy systems. However, most companies are focused on bringing on more HVAC technicians in anticipation of future opportunities. Smaller companies whose primary role is to maintain and service equipment may experience a deeper impact but at a slower transition rate. They will have more time to upgrade skills and gain familiarity with the new systems. However, these smaller companies are less likely to invest in training for their technicians. In the absence of any required training, these technicians will likely learn on the job with the aid of the manufacturers’ tech support lines. The trades labour force in greater Vancouver is predominantly plumbers, as shown in Figure 8. Also, there are relatively few individuals working in commercial buildings that are entirely focused on gas equipment.
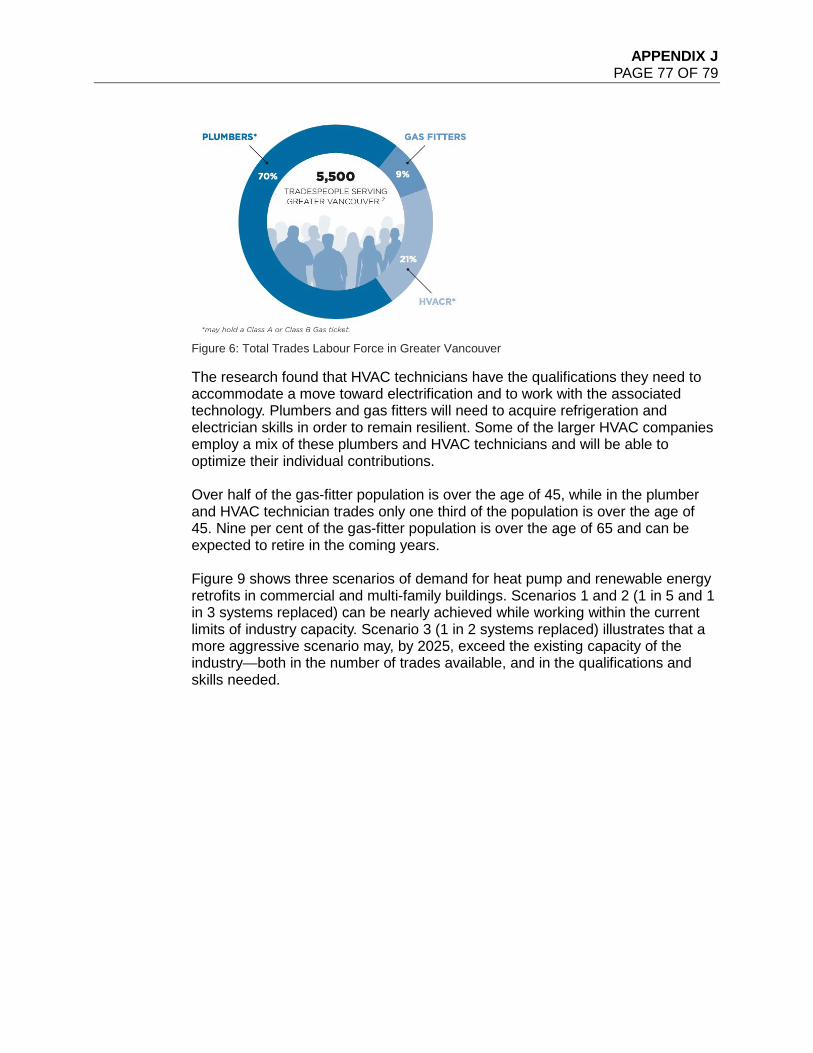
APPENDIX J PAGE 77 OF 79
Figure 6: Total Trades Labour Force in Greater Vancouver
The research found that HVAC technicians have the qualifications they need to accommodate a move toward electrification and to work with the associated technology. Plumbers and gas fitters will need to acquire refrigeration and electrician skills in order to remain resilient. Some of the larger HVAC companies employ a mix of these plumbers and HVAC technicians and will be able to optimize their individual contributions. Over half of the gas-fitter population is over the age of 45, while in the plumber and HVAC technician trades only one third of the population is over the age of 45. Nine per cent of the gas-fitter population is over the age of 65 and can be expected to retire in the coming years. Figure 9 shows three scenarios of demand for heat pump and renewable energy retrofits in commercial and multi-family buildings. Scenarios 1 and 2 (1 in 5 and 1 in 3 systems replaced) can be nearly achieved while working within the current limits of industry capacity. Scenario 3 (1 in 2 systems replaced) illustrates that a more aggressive scenario may, by 2025, exceed the existing capacity of the industry—both in the number of trades available, and in the qualifications and skills needed.
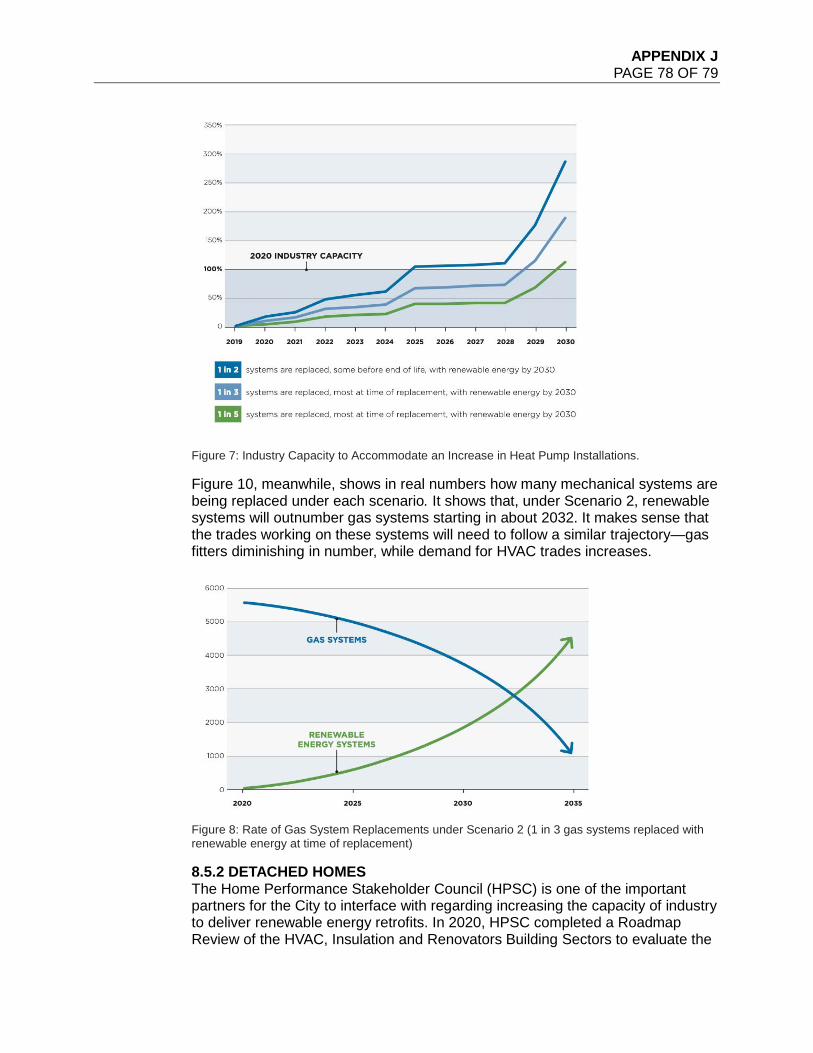
APPENDIX J PAGE 78 OF 79
Figure 7: Industry Capacity to Accommodate an Increase in Heat Pump Installations.
Figure 10, meanwhile, shows in real numbers how many mechanical systems are being replaced under each scenario. It shows that, under Scenario 2, renewable systems will outnumber gas systems starting in about 2032. It makes sense that the trades working on these systems will need to follow a similar trajectory—gas fitters diminishing in number, while demand for HVAC trades increases.
Figure 8: Rate of Gas System Replacements under Scenario 2 (1 in 3 gas systems replaced with renewable energy at time of replacement)
8.5.2 DETACHED HOMES The Home Performance Stakeholder Council (HPSC) is one of the important partners for the City to interface with regarding increasing the capacity of industry to deliver renewable energy retrofits. In 2020, HPSC completed a Roadmap Review of the HVAC, Insulation and Renovators Building Sectors to evaluate the
APPENDIX J PAGE 79 OF 79
issues, opportunities and priorities for these key sectors to succeed in a market transition to renewable energy systems.59 The Roadmap found that the heating, ventilation, and air conditioning (HVAC) industry is relatively mature in Vancouver with a sophisticated network of manufacturers, suppliers, contractors and associations supporting the industry. The renovator industry is similarly a more mature home performance sector with a sophisticated network of contractors. The insulation industry, by contrast, remains relatively immature when compared to other home performance sectors, including a less sophisticated network of manufacturers, suppliers, contractors and no independent association representing the interests of insulation contractors. The four short-term priorities that were identified by the HPSC Sector Councils as necessary for success were: 1) contractor accreditation, 2) home performance training, 3) quality assurance/inspections and 4) consumer education and awareness.
59 Summary Report on HVAC, Insulation, & Renovator Sectors Roadmap Review to Support a Skilled Jobs Transition in City of Vancouver, (HPSC 2020).
APPENDIX K PAGE 1 OF 22
APPENDIX K: EMBODIED CARBON STRATEGY
ABOUT THIS APPENDIX The Embodied Carbon Strategy is divided into the following sections:
• Section 1: Vision, Opportunity, and Goal • Section 2: The Basics and Context • Section 3: The Principles • Section 4: The Strategy • Section 5: The Impact • Section 6: Implementation
SECTION 1. THE VISION, OPPORTUNITY AND GOAL This is Vancouver’s strategy to achieve a 40% reduction in embodied carbon from construction by 2030. As part of this strategy, the City of Vancouver will use its policy and regulation, public procurement, networks and influence to create a more sustainable way of building in the city. With a concerted effort, the City can transform how buildings are built, what they are made of, and the impacts of those materials before, during, and after a building is used. Carbon pollution can be significantly reduced while also improving health, equity and waste outcomes from construction and its materials.
1.1 THE VISION AND OPPORTUNITY: A HEALTHY, EQUITABLE, CIRCULAR AND CARBON-POSITIVE CONSTRUCTION ECONOMY When nature builds structures, it builds with carbon, and with healthy, life-friendly, infinitely recyclable materials. These elements circulate endlessly through ecosystems as other species re-combine them in infinite ways to build their homes and infrastructure. By using carbon as a primary ingredient, nature locks away incredible amounts of planet-warming carbon. By using materials that are abundantly available and non-toxic, using them creatively and efficiently, and with standard elements that others can readily use later, nature eliminates waste, builds value, and minimizes costs at every step of the cycle. From forest to coral reef, nest to shell, nature thrives by building in ways that are healthy, equitable, circular and carbon positive60—and so can we.
With technology and skills locally available today, we can build new buildings that are healthy, equitable, reusable and carbon positive, while cutting waste, reducing noise and minimizing overall costs—creating a thriving and truly sustainable local construction and deconstruction economy in Vancouver. Using established standards and best practices, we can understand where materials and products are extracted and manufactured, what they are made of, and what impacts these processes have on ecosystems, communities and workers. By encouraging and making use of this transparency, we can make better choices for how we build. For example, we can choose wood from sustainably managed forests, materials extracted responsibly and
60 A carbon positive building reduces greenhouse gases in the atmosphere as a result of its lifecycle.
APPENDIX K PAGE 2 OF 22
with respect for the land and communities, products made without toxic substances, and firms that advance equity among their workers, industry and community. Natural materials like wood, bamboo, cellulose and wood-fibre insulation, engineered straw panels, and hempcrete, if sourced sustainably, can be not only low-carbon in their production, but can actually store atmospheric carbon safely for the life of the building. Using engineered wood columns and floor panels, known as mass timber, industry can now build high-rise buildings out of wood that are safe, strong, fire-resistant, and seismically resilient. If these materials and products are reused at the end of their life, they can accumulate carbon in the built environment, storing it safely away from the atmosphere. By changing the mix designs of concrete, the cement content can be significantly reduced, and with it, the carbon impact. Some local cement manufacturers are already investing heavily in using waste materials to power cement kilns, and significant reductions are possible today just by sourcing cement and concrete from those with the lowest impact. Emerging technologies, like recycled concrete aggregate, alternative cement chemistry, engineered pre-cast concrete, and carbon sequestration, may soon lead to dramatic carbon reductions or even carbon-positive concrete. Natural alternatives that use little or no cement and very little energy, such as rammed-earth and hempcrete, are now used increasingly in smaller buildings, and can also have excellent insulating properties. On construction sites, the first all-electric construction vehicles are now in use in Europe, with models coming soon to North America, including concrete trucks, excavators, dump trucks and even delivery and freight. Used together with off-site prefabrication, innovative building techniques, and electrical hookups for site needs, construction sites can now dramatically reduce emissions, dust, noise, and overall disruption to neighbourhoods and the environment, while increasing the speed of construction. As older buildings are replaced, they can be deconstructed, and their materials can be used again in new buildings that are seismically resilient and carbon positive. In some cases, whole structures can be retained, and concrete can be crushed and reused, absorbing carbon in the process. Wood can be salvaged and reused as lumber and finishes, and metals, clear glass, and many other materials can be fully recycled for use again in new buildings. To enable an even more circular economy in the future, we can build buildings today that are easy to disassemble and reuse. This will also make it much faster and cheaper to repair and re-occupy our buildings after a large earthquake strikes. We can make it easy to separate materials for recycling. And we can ensure the materials are healthy and safe to handle and reuse, or to return to nature. This also makes those materials safer and healthier to produce for workers and their communities. Through all of these opportunities, we can build a local construction economy that is stronger, more resilient, and more truly sustainable than ever before. In Metro Vancouver alone, the deconstruction economy has been valued at $340M .61 By treating our building materials as capital instead of waste, we can build a local construction/deconstruction
61 https://www.vancouvereconomic.com/research/the-business-case-for-deconstruction/
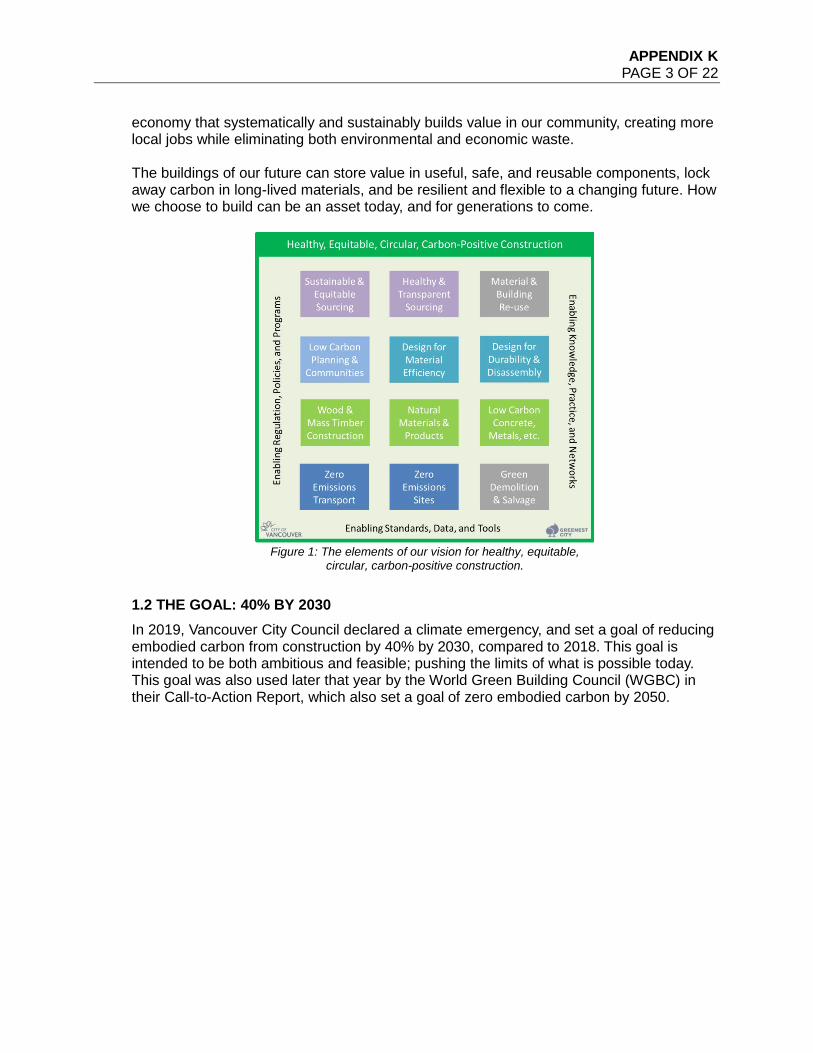
APPENDIX K PAGE 3 OF 22
economy that systematically and sustainably builds value in our community, creating more local jobs while eliminating both environmental and economic waste. The buildings of our future can store value in useful, safe, and reusable components, lock away carbon in long-lived materials, and be resilient and flexible to a changing future. How we choose to build can be an asset today, and for generations to come.
Figure 1: The elements of our vision for healthy, equitable,
circular, carbon-positive construction.
1.2 THE GOAL: 40% BY 2030 In 2019, Vancouver City Council declared a climate emergency, and set a goal of reducing embodied carbon from construction by 40% by 2030, compared to 2018. This goal is intended to be both ambitious and feasible; pushing the limits of what is possible today. This goal was also used later that year by the World Green Building Council (WGBC) in their Call-to-Action Report, which also set a goal of zero embodied carbon by 2050.
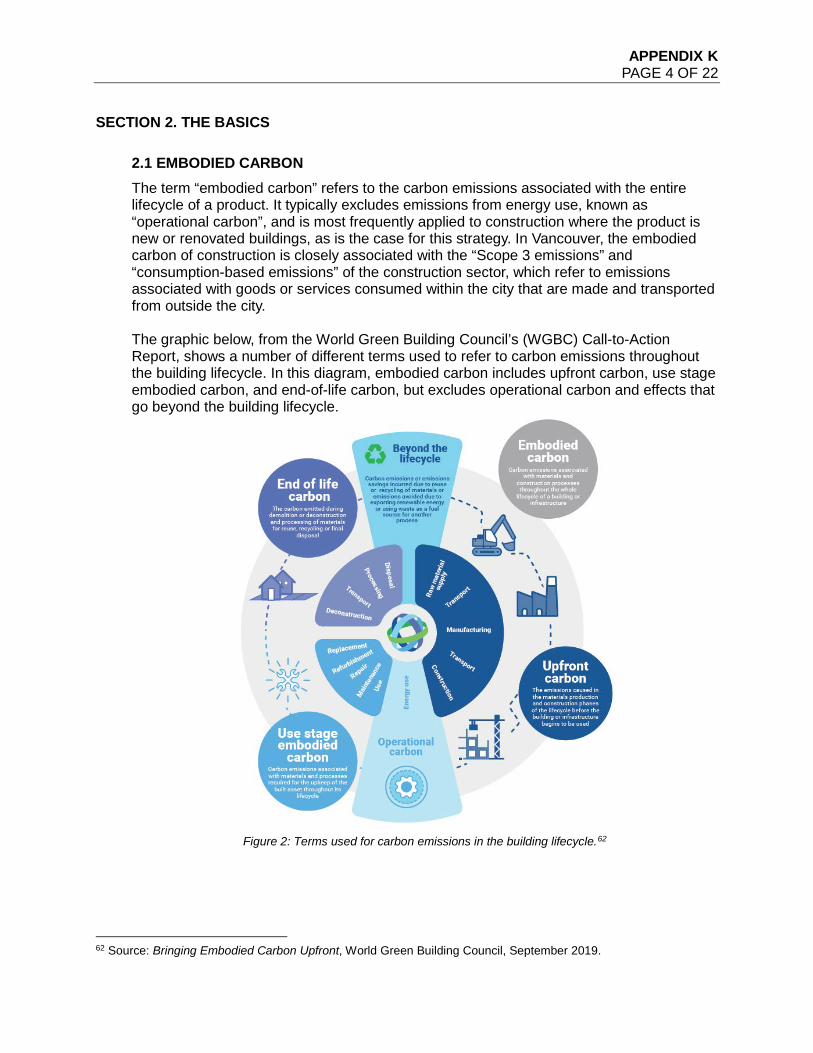
APPENDIX K PAGE 4 OF 22
SECTION 2. THE BASICS
2.1 EMBODIED CARBON The term “embodied carbon” refers to the carbon emissions associated with the entire lifecycle of a product. It typically excludes emissions from energy use, known as “operational carbon”, and is most frequently applied to construction where the product is new or renovated buildings, as is the case for this strategy. In Vancouver, the embodied carbon of construction is closely associated with the “Scope 3 emissions” and “consumption-based emissions” of the construction sector, which refer to emissions associated with goods or services consumed within the city that are made and transported from outside the city. The graphic below, from the World Green Building Council’s (WGBC) Call-to-Action Report, shows a number of different terms used to refer to carbon emissions throughout the building lifecycle. In this diagram, embodied carbon includes upfront carbon, use stage embodied carbon, and end-of-life carbon, but excludes operational carbon and effects that go beyond the building lifecycle.
Figure 2: Terms used for carbon emissions in the building lifecycle.62
62 Source: Bringing Embodied Carbon Upfront, World Green Building Council, September 2019.
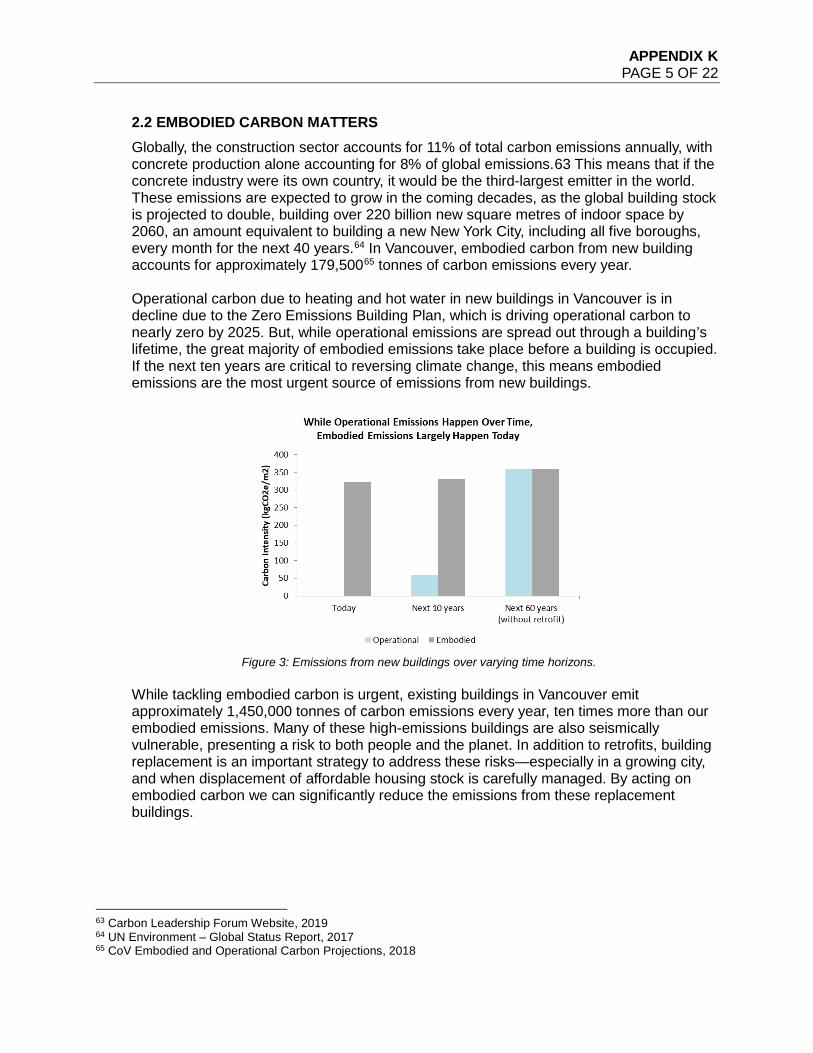
APPENDIX K PAGE 5 OF 22
2.2 EMBODIED CARBON MATTERS Globally, the construction sector accounts for 11% of total carbon emissions annually, with concrete production alone accounting for 8% of global emissions.63 This means that if the concrete industry were its own country, it would be the third-largest emitter in the world. These emissions are expected to grow in the coming decades, as the global building stock is projected to double, building over 220 billion new square metres of indoor space by 2060, an amount equivalent to building a new New York City, including all five boroughs, every month for the next 40 years.64 In Vancouver, embodied carbon from new building accounts for approximately 179,50065 tonnes of carbon emissions every year. Operational carbon due to heating and hot water in new buildings in Vancouver is in decline due to the Zero Emissions Building Plan, which is driving operational carbon to nearly zero by 2025. But, while operational emissions are spread out through a building’s lifetime, the great majority of embodied emissions take place before a building is occupied. If the next ten years are critical to reversing climate change, this means embodied emissions are the most urgent source of emissions from new buildings.
Figure 3: Emissions from new buildings over varying time horizons.
While tackling embodied carbon is urgent, existing buildings in Vancouver emit approximately 1,450,000 tonnes of carbon emissions every year, ten times more than our embodied emissions. Many of these high-emissions buildings are also seismically vulnerable, presenting a risk to both people and the planet. In addition to retrofits, building replacement is an important strategy to address these risks—especially in a growing city, and when displacement of affordable housing stock is carefully managed. By acting on embodied carbon we can significantly reduce the emissions from these replacement buildings.
63 Carbon Leadership Forum Website, 2019 64 UN Environment – Global Status Report, 2017 65 CoV Embodied and Operational Carbon Projections, 2018
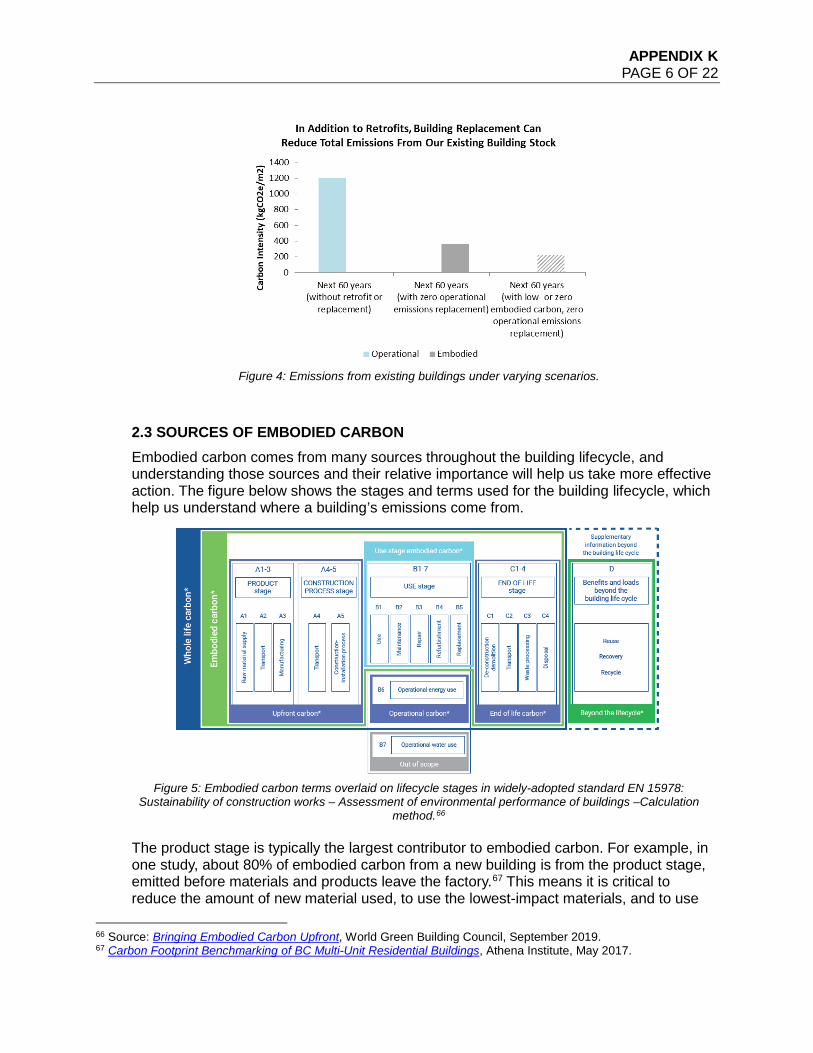
APPENDIX K PAGE 6 OF 22
Figure 4: Emissions from existing buildings under varying scenarios.
2.3 SOURCES OF EMBODIED CARBON Embodied carbon comes from many sources throughout the building lifecycle, and understanding those sources and their relative importance will help us take more effective action. The figure below shows the stages and terms used for the building lifecycle, which help us understand where a building’s emissions come from.
Figure 5: Embodied carbon terms overlaid on lifecycle stages in widely-adopted standard EN 15978:
Sustainability of construction works – Assessment of environmental performance of buildings –Calculation method.66
The product stage is typically the largest contributor to embodied carbon. For example, in one study, about 80% of embodied carbon from a new building is from the product stage, emitted before materials and products leave the factory.67 This means it is critical to reduce the amount of new material used, to use the lowest-impact materials, and to use
66 Source: Bringing Embodied Carbon Upfront, World Green Building Council, September 2019. 67 Carbon Footprint Benchmarking of BC Multi-Unit Residential Buildings, Athena Institute, May 2017.
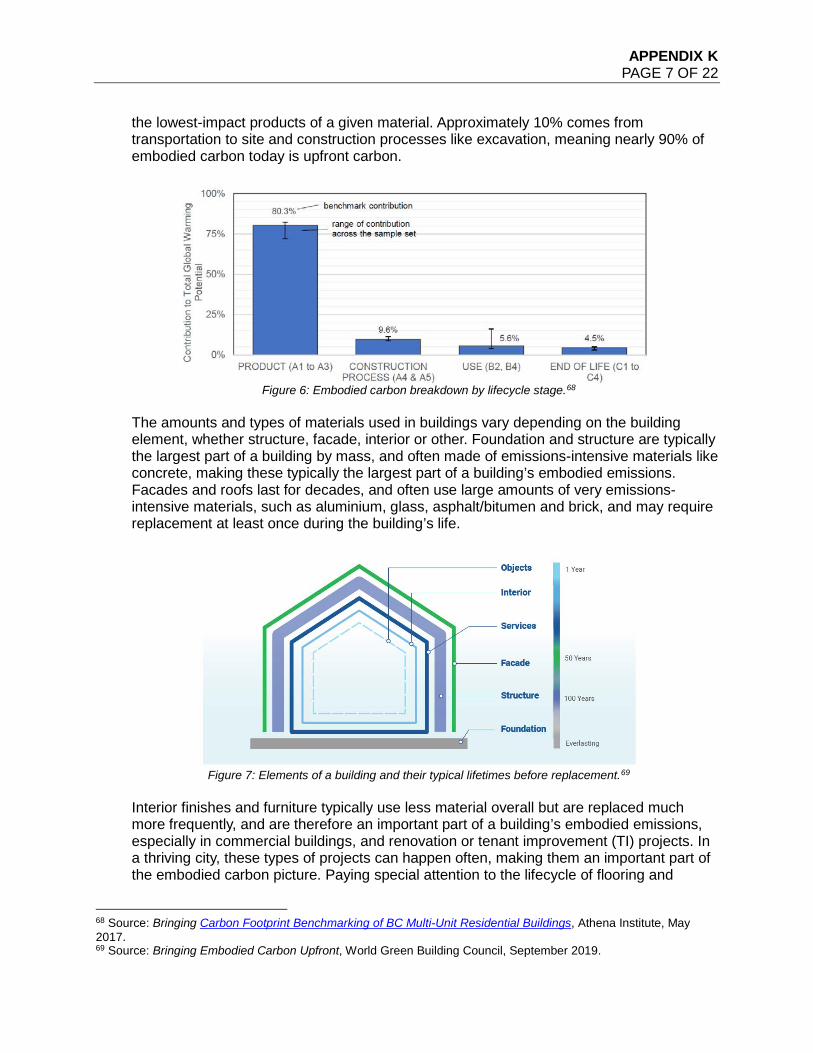
APPENDIX K PAGE 7 OF 22
the lowest-impact products of a given material. Approximately 10% comes from transportation to site and construction processes like excavation, meaning nearly 90% of embodied carbon today is upfront carbon.
Figure 6: Embodied carbon breakdown by lifecycle stage.68
The amounts and types of materials used in buildings vary depending on the building element, whether structure, facade, interior or other. Foundation and structure are typically the largest part of a building by mass, and often made of emissions-intensive materials like concrete, making these typically the largest part of a building’s embodied emissions. Facades and roofs last for decades, and often use large amounts of very emissions-intensive materials, such as aluminium, glass, asphalt/bitumen and brick, and may require replacement at least once during the building’s life.
Figure 7: Elements of a building and their typical lifetimes before replacement.69
Interior finishes and furniture typically use less material overall but are replaced much more frequently, and are therefore an important part of a building’s embodied emissions, especially in commercial buildings, and renovation or tenant improvement (TI) projects. In a thriving city, these types of projects can happen often, making them an important part of the embodied carbon picture. Paying special attention to the lifecycle of flooring and
68 Source: Bringing Carbon Footprint Benchmarking of BC Multi-Unit Residential Buildings, Athena Institute, May 2017. 69 Source: Bringing Embodied Carbon Upfront, World Green Building Council, September 2019.
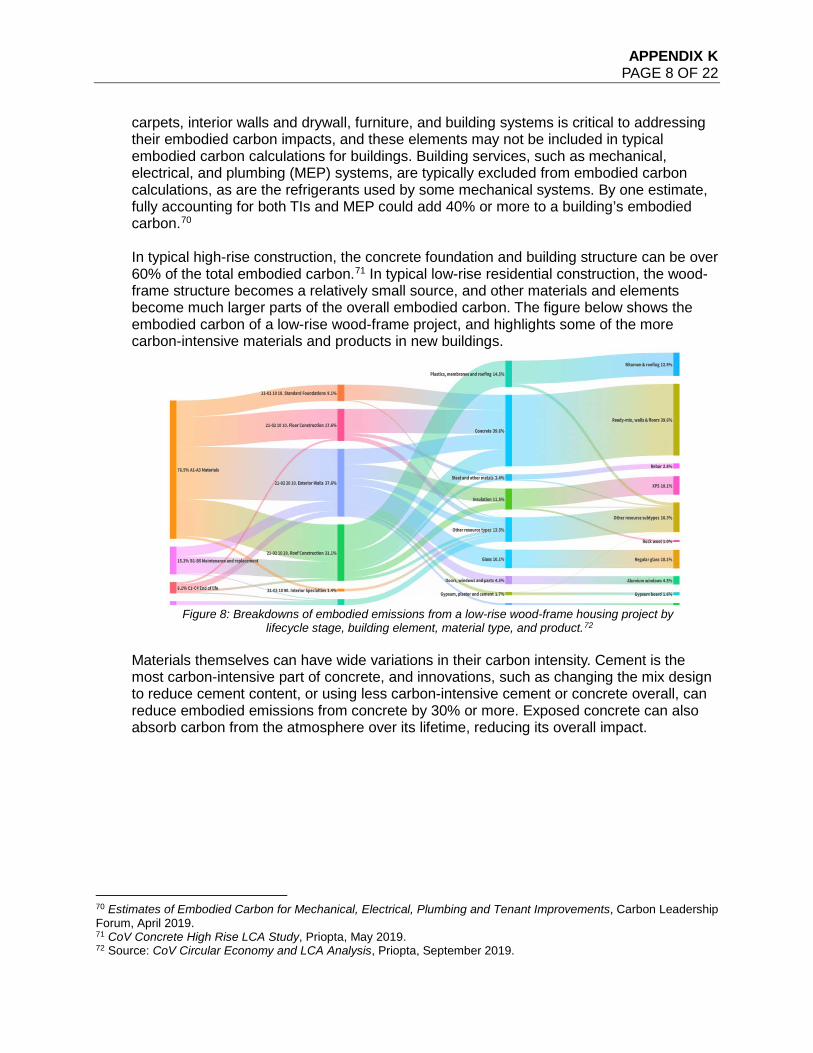
APPENDIX K PAGE 8 OF 22
carpets, interior walls and drywall, furniture, and building systems is critical to addressing their embodied carbon impacts, and these elements may not be included in typical embodied carbon calculations for buildings. Building services, such as mechanical, electrical, and plumbing (MEP) systems, are typically excluded from embodied carbon calculations, as are the refrigerants used by some mechanical systems. By one estimate, fully accounting for both TIs and MEP could add 40% or more to a building’s embodied carbon.70 In typical high-rise construction, the concrete foundation and building structure can be over 60% of the total embodied carbon.71 In typical low-rise residential construction, the wood-frame structure becomes a relatively small source, and other materials and elements become much larger parts of the overall embodied carbon. The figure below shows the embodied carbon of a low-rise wood-frame project, and highlights some of the more carbon-intensive materials and products in new buildings.
Figure 8: Breakdowns of embodied emissions from a low-rise wood-frame housing project by
lifecycle stage, building element, material type, and product.72
Materials themselves can have wide variations in their carbon intensity. Cement is the most carbon-intensive part of concrete, and innovations, such as changing the mix design to reduce cement content, or using less carbon-intensive cement or concrete overall, can reduce embodied emissions from concrete by 30% or more. Exposed concrete can also absorb carbon from the atmosphere over its lifetime, reducing its overall impact.
70 Estimates of Embodied Carbon for Mechanical, Electrical, Plumbing and Tenant Improvements, Carbon Leadership Forum, April 2019. 71 CoV Concrete High Rise LCA Study, Priopta, May 2019. 72 Source: CoV Circular Economy and LCA Analysis, Priopta, September 2019.
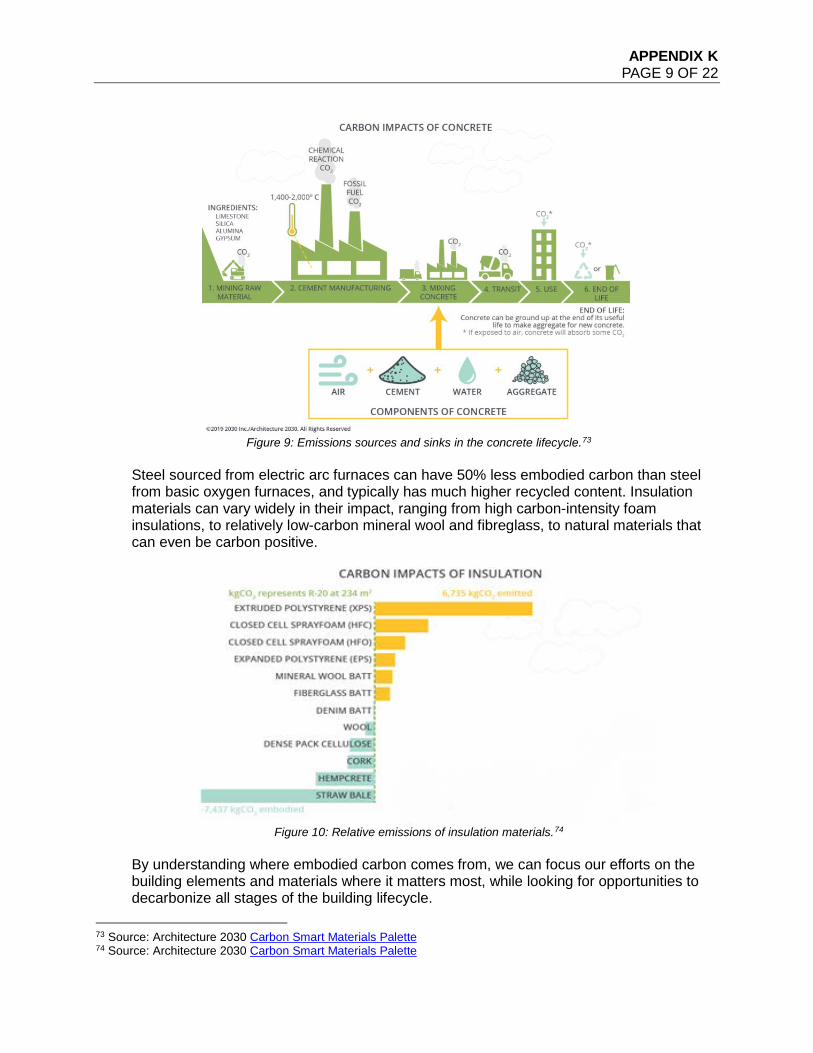
APPENDIX K PAGE 9 OF 22
Figure 9: Emissions sources and sinks in the concrete lifecycle.73
Steel sourced from electric arc furnaces can have 50% less embodied carbon than steel from basic oxygen furnaces, and typically has much higher recycled content. Insulation materials can vary widely in their impact, ranging from high carbon-intensity foam insulations, to relatively low-carbon mineral wool and fibreglass, to natural materials that can even be carbon positive.
Figure 10: Relative emissions of insulation materials.74
By understanding where embodied carbon comes from, we can focus our efforts on the building elements and materials where it matters most, while looking for opportunities to decarbonize all stages of the building lifecycle.
73 Source: Architecture 2030 Carbon Smart Materials Palette 74 Source: Architecture 2030 Carbon Smart Materials Palette
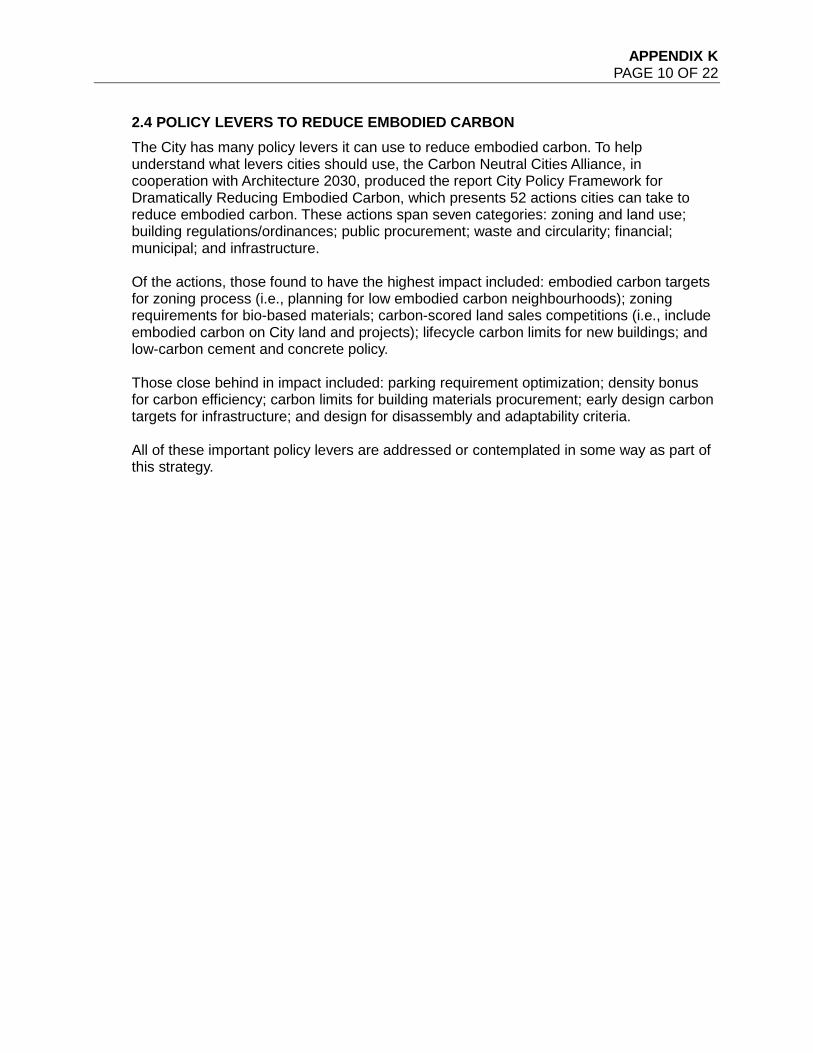
APPENDIX K PAGE 10 OF 22
2.4 POLICY LEVERS TO REDUCE EMBODIED CARBON The City has many policy levers it can use to reduce embodied carbon. To help understand what levers cities should use, the Carbon Neutral Cities Alliance, in cooperation with Architecture 2030, produced the report City Policy Framework for Dramatically Reducing Embodied Carbon, which presents 52 actions cities can take to reduce embodied carbon. These actions span seven categories: zoning and land use; building regulations/ordinances; public procurement; waste and circularity; financial; municipal; and infrastructure. Of the actions, those found to have the highest impact included: embodied carbon targets for zoning process (i.e., planning for low embodied carbon neighbourhoods); zoning requirements for bio-based materials; carbon-scored land sales competitions (i.e., include embodied carbon on City land and projects); lifecycle carbon limits for new buildings; and low-carbon cement and concrete policy. Those close behind in impact included: parking requirement optimization; density bonus for carbon efficiency; carbon limits for building materials procurement; early design carbon targets for infrastructure; and design for disassembly and adaptability criteria. All of these important policy levers are addressed or contemplated in some way as part of this strategy.
APPENDIX K PAGE 11 OF 22
SECTION 3. THE PRINCIPLES These seven principles are distilled from research and consultations into best practices in embodied carbon policy with stakeholders and industry experts over the last 18 months, and especially from feedback received in meeting with the City of Vancouver Climate and Equity Working Group.
Principles guide our choices. These principles inform and guide the actions prioritized by this strategy, and will be touchstones for how we choose what actions to take, and how we choose to structure and implement those actions. When contemplating a policy or action, we can and should ask ourselves and each other, “Is this consistent with our stated principles?” If the answer is not entirely “yes”, then we should discuss what improvements can be made, or what other choices might better align with our principles while bringing us closer to our goal.
• Urgency: We are in a climate emergency, and our actions should treat it with urgency,
reducing the carbon emissions from construction as effectively and quickly as possible.
• Neutrality of materials: To achieve our goals we need to foster innovation in reducing lifecycle emissions of all construction materials. Our actions should encourage the right materials for the right uses, with no one material or industry singled out as the only problem or the only solution.
• Healthy materials and buildings: Materials that are safe and non-toxic do not impact the health of those who handle them or live with them, and are safe to reuse at the end of their life. Our actions should promote health in construction and the built environment by encouraging a shift to natural and safe, simple and reusable materials, assemblies, and finishes.
• Circularity: The great majority of embodied emissions come from creating new building materials, and currently construction and demolition create huge amounts of waste and lost value. Our actions should reduce, reuse, and recycle building materials and create a more circular, high-value and local construction and deconstruction economy.
• Equity and responsibility: Construction materials and activities have upstream and downstream impacts for people and ecosystems, and these impacts are often concentrated within communities of Black, Indigenous, and other racialized groups, while at the same time the benefits of construction are not distributed equitably. As a growing city, we should take responsibility for our upstream and downstream impacts, and we should direct the benefits and new opportunities from our actions to those who most need it.
• Affordability: Many residents and businesses are experiencing an affordability crisis, and our actions should not add costs to those who can least afford it, or reduce our ability to deliver needed housing and infrastructure.
• Shared knowledge and vision: We can only achieve our goals by working together, and yet embodied carbon and how to reduce it are not well understood by all. Our actions should inform and educate everyone about embodied carbon, and build a shared vision that addresses all aspects of embodied carbon (parking, planning, waste, etc.) and empowers everyone to work together to reduce embodied emissions.
APPENDIX K PAGE 12 OF 22
SECTION 4. THE STRATEGY Our approach to reducing embodied carbon contains four actions, each using different policy levers and transforming different parts of our construction ecosystem. These categories can be summarized using statements that articulate what success looks like for each:
• Section 4.1 Change the Rules: Policy and Regulation “It’s only permitted to build low-carbon buildings”
• Section 4.2 Change the Market: Remove Barriers and Provide Incentives “It pays to build low-carbon buildings”
• Section 4.3 Change the Culture: Capacity Building and Industry Transformation “Our knowledge, tools, networks, and culture support low-carbon buildings”
• Section 4.4 Change the Context: Complimentary Strategies and Actions “The construction ecosystem enables and encourages low-carbon buildings”
4.1 CHANGE THE RULES: POLICY AND REGULATION
HIGHLIGHTS • We plan to set rules requiring new buildings to be built using low-carbon
materials and designs. • These requirements will apply to both private and public developments. • They will require developers to demonstrate how their materials and
construction practices are lowering carbon pollution.
DETAILED DESCRIPTION We will implement new rules that reduce the carbon pollution from the materials in new buildings. These policies and building code requirements will apply to both private and public developments. They will require developers to conduct a whole-building lifecycle assessment, and demonstrate how their materials and construction practices are lowering emissions. This action contains four components: 1. Establish standardized 2018 baselines to measure reductions for
developments and the city. We will use typical or average carbon intensities for monitoring and reporting of embodied emissions in Vancouver, and a standardized set of typical materials, assemblies, and LCA guidelines for developments to use for comparison to show their designs are meeting reduction targets.
APPENDIX K PAGE 13 OF 22
2. Require rezoning reduction targets through updates to the Green Buildings Policy for Rezonings. The Green Buildings Policy for Rezonings applies to a slight majority of the new floor area built in the city in any year, and is used to improve green building outcomes, as well as to model and test future building code changes. The goal is for the rezoning policy to lead the building code by approximately five years. This gives designers and suppliers advance time to prepare for changes, reducing costs and design challenges using the developments that are typically more sophisticated than projects that do not go through the rezoning process.
The proposed road map for these policy updates is:
• 2021/22: Introduce our first target(s) and policy to begin reducing embodied emissions in new construction.
• 2025/26: Increase reduction targets to be consistent with the 40% reduction target set by Council in Big Move 5.
• In 2030, introduce new targets and policy that go beyond 40%, taking a step toward net zero carbon construction.
• Low-carbon material requirements: These policy updates may include material-specific requirements to eliminate the highest carbon materials, such as introducing low-carbon concrete requirements or limiting high-carbon spray-foam insulations.
• Sustainable, equitable, and healthy sourcing: These policy updates may include options that encourage other best practices in sourcing building materials and products, such as: wood products from certified sustainable forestry and Indigenous-managed territory; Just, B Corp, and other labels and certifications for equitable sourcing for organizations, sourcing from workers and owners from marginalized groups, including recognition of community benefit agreements (CBAs); Declare, Red List Free, Living Product, environmental product declarations (EPDs), products created using traditional ecological knowledge, and other labels, certifications, and techniques for healthy products and their ingredients; design for durability and longevity, adaptive re-use, material efficiency, and deconstruction; use of recycled, salvaged, and local materials; and purchase of carbon offsets.
3. Require Building By-law reduction targets and low-carbon code
requirements, following the steps in the Green Buildings Policy for Rezonings. The proposed road map for these code changes is:
• 2021–23: Explore incorporating quick wins and first steps in code, such as low-carbon material requirements for concrete and insulation, and targets for certain building types, such as single-detached homes.
• 2025/26: Adopt the targets and other requirements from the 2021/22 rezoning policy, and possibly those from incentive programs for small
APPENDIX K PAGE 14 OF 22
residential buildings (refer to Action 2.2.1, NearZero program), into the code.
• 2030: Adopt the targets and other requirements from the 2025/26 rezoning policy into the code, consistent with the 40% reduction target set by Council in Big Move 5.
4. Target deep reduction in embodied emissions for City-owned buildings
and infrastructure, as part of the City’s Green Operations Plan. • Buildings: Evaluate embodied carbon impacts of new City buildings, study
reductions, and target 50% reductions by 2030.
• Infrastructure: Evaluate embodied carbon impacts of new City infrastructure projects, and study how to achieve up to 40% reductions by 2030.
EXAMPLE Marin County in California has implemented a Low-Carbon Concrete Code for all construction in the county. The code provides both a cement limit method and an embodied carbon limit method, where a maximum amount of ordinary Portland cement and a maximum embodied carbon are defined. Compliance with the cement limit is shown by concrete specifications and batch certificates, and with the embodied carbon limit, is shown by an Environmental Product Declaration created in line with specific standards.75 The code also contains provisions for higher strengths and exceptions for hardship and infeasibility.76
4.2 CHANGE THE MARKET: REMOVE BARRIERS AND PROVIDE INCENTIVES
HIGHLIGHTS • Identify and remove barriers where our existing rules make it difficult to
use low-carbon construction materials and practices in new buildings. • Create incentives to support developers interested in trying out lower-
carbon materials and construction practices.
DETAILED DESCRIPTION We are going to make it appealing to develop new buildings with lower-carbon materials. We will do this by identifying and removing barriers to these construction practices, and by introducing new incentives to support developers interested in lower-carbon materials and construction practices. 1. Remove barriers in planning and building by-laws, policies, guidelines,
and bulletins to low-carbon construction.
75 City Policy Framework for Dramatically Reducing Embodied Carbon, CNCA and Architecture 2030, 2020, page 63. Retrieved from: https://www.embodiedcarbonpolicies.com/ 76 Bay Area Low-Carbon Concrete Codes Project, retrieved from: https://www.marincounty.org/depts/cd/divisions/sustainability/low-carbon-concrete-project
APPENDIX K PAGE 15 OF 22
• Develop ways to allow more uses for mass timber within the Building By-law and Fire By-law, where supported by safety testing data, third-party professional recommendations, and the consensus of internal and external stakeholders. Possible changes include allowing up to 18-storey mass timber buildings, more building types beyond residential and commercial, greater allowance for exposed mass timber during and after construction, and other changes that make it easier and more cost-effective to build with wood.
• Implement changes to existing and upcoming zoning rules and guidelines to make it easier and more cost-effective to build wood buildings, such as minor allowances for increased height due to mass timber structure, and simplifications of building form.
2. Incentivize deep embodied carbon reductions in building design and
construction.
• Expand and enhance the City’s NearZero program, which incentivizes designers and builders to gather data and encourage the construction of high-performance homes, and work with the provincial government to expand CleanBC Better Buildings incentives for large buildings, to include deep reductions in embodied carbon (see also Action 3.1).
• Expand and enhance the City’s Zero Emissions Building Catalyst Policy, which can allow multi-family projects up to 5% increased floor area and other relaxations to build to zero emissions standards, to include deep reductions in embodied carbon.
• Develop additional planning incentives for deep reductions in embodied carbon and wood construction, such as increased floor area, increased height, simplified form and other relaxations.
Supporting early innovators will signal demand for low-carbon building products, support building design evolution, catalyze new training and education initiatives, and build broader industry confidence that low embodied carbon buildings are achievable. Ultimately, early showcase projects will reduce the costs of low-carbon buildings, and inform future regulations to ensure all buildings ultimately achieve these outcomes. For each of the incentive actions listed above, we will implement measures to direct benefits from these actions toward marginalized groups, and structure them in ways that enhance equity in the construction industry and in the city. This could be through measures such as adding equity requirements, increased incentives for marginalized groups, conducting broad and inclusive outreach and education, and tailoring actions toward rental or non-profit housing projects.
EXAMPLE The township of Douro-Dummer (Ontario, Canada) provides the first 50 applicants the opportunity to apply for a block grant for projects whose embodied carbon emissions are below a fixed target. The planned program outline is to reward builders for meeting an embodied carbon limit of 75 kgCO2e/m2,
APPENDIX K PAGE 16 OF 22
measured in accordance with defined criteria and the associated Carbon Calculator, with a grant of $10,000 (Canadian dollars) per house.77
4.3 CHANGE THE CULTURE: CAPACITY BUILDING AND INDUSTRY TRANSFORMATION
HIGHLIGHTS • Coordinate, support, advocate, and share knowledge with external
organizations and other governments to build institutional capacity and momentum and to expand our impact.
• Support the development of data, tools, guides, training, and knowledge-sharing networks that build a dynamic, inclusive, and effective embodied carbon community.
DETAILED DESCRIPTION This action includes the following components: 1. Coordinate, support, advocate, and share knowledge with external
organizations and other governments. This action includes components such as:
• Coordinate with other local governments to learn what has worked for them, and share what we have learned, to avoid mistakes and maximize our carbon impact. Build off of partnerships with Carbon Neutral Cities Alliance, International Living Future Institute, C40, National Research Council, Carbon Leadership Forum Vancouver, Zero Emissions Buildings Exchange (ZEBx), and others. For example, the City has partnered with the cities of Seattle and Portland in a group facilitated by ILFI to collaborate and solve challenges to creating embodied carbon policy.
• Advocate for regional and provincial embodied carbon frameworks that other local governments in B.C. could adopt, such as an embodied-emissions “step code,” low-carbon material requirements, or a regional embodied carbon policy.
• Share data from embodied carbon submissions provided to the City as part of policy and permit applications, such as whole-building lifecycle assessments, Environmental Product Declarations (EPD’s), and other data, to support the work of other governments, industry, and academia in understanding and reducing embodied carbon.
2. Support databases, tools, practice guides, training, and knowledge-
sharing networks. This action includes components such as:
77 City Policy Framework for Dramatically Reducing Embodied Carbon, CNCA and Architecture 2030, 2020, page 139. Retrieved from: https://www.embodiedcarbonpolicies.com/
APPENDIX K PAGE 17 OF 22
• Create an online tool that allows users to quickly see the relative impacts of big design decisions on embodied carbon, similar to the Pathfinder78 tool that helps users understand the BC Energy Step Code.
• Continue work with the National Research Council on the development of national databases and guidelines for low-carbon environmental product declarations (EPDs) and lifecycle assessments (LCAs).
• Provide financial and other support to local capacity-building organizations that deliver education and raise awareness on embodied carbon, and to those seeking training. We will explore ways to direct the benefits of this support and training toward marginalized groups and those who may not have ready access to educational opportunities in the building industry.
EXAMPLE As part of the 2016 Zero Emissions Building Plan, the City of Vancouver created the Zero Emissions Building Exchange (ZEBx), with a mission to accelerate the knowledge, capacity and passion for zero emissions buildings. The City has also provided subsidized Passive House trades training, support for local Passive House social events, and funding to create the online Pathfinder tool. These supports make it easier for industry to access training, tools, and peer networks focused on enabling zero emissions buildings. The City also worked closely with the provincial Energy Step Code Council to help create and support the province-wide Energy Step Code, expanding the impact of new approaches to energy efficiency to other jurisdictions.
4.4 CHANGE THE CONTEXT: COMPLIMENTARY STRATEGIES AND ACTIONS
HIGHLIGHTS • We plan to connect this strategy with other City strategies and plans, to
change the wider context that shapes how buildings are designed and built.
• Other City strategies and plans include green operations, the Vancouver Plan, parking plan, equity framework, green economy, zero waste, community planning, transportation, resilience, and others.
DETAILED DESCRIPTION We are going to connect this strategy with City work focused on other strategies, such as planning, transportation, zero waste, and green economy, to encourage the more efficient use of materials and low-carbon materials. This action has several components: 1. Plan for low-carbon neighbourhoods. Plan for reduced below-grade
foundations, basements, and parking. Facilitate building forms consistent with
78 http://www.buildingpathfinder.com/
APPENDIX K PAGE 18 OF 22
low-carbon designs and materials, and encourage low-carbon finishes and urban design features, such as through new community plans, zoning, policies and guidelines. Align with need for building replacement due to seismic, operational carbon, and livability needs by facilitating low-carbon building options. Initial work will include coordination and integration with the Vancouver Plan, outreach and education for planners and urban designers, and creating consistent and integrated embodied carbon policy direction across planning activities at the City.
2. Optimize parking requirements. Reduce overall material quantities needed in new developments, such as by encouraging efficient usage of existing parkades within neighbourhoods. Facilitate less overall parking space in new buildings, such as through parking maximums or embodied carbon penalties for additional parking space. Initial work will include coordinating with any parking changes that are part of Big Move 2, the Vancouver Plan and the Transportation 2040 strategy, and connecting parking minimums and maximums to embodied carbon calculations (see Action 1.1) so developments can see the embodied carbon benefits of reduced parking.
3. Support zero emissions construction sites. Support pilots of zero emissions trucking and construction sites, such as through electric construction vehicles and electrification of construction site services. Initial work will include coordination with Big Move 3, the Transportation 2040 strategy and the Urban Freight Strategy, understanding the current state of industry practice, the emissions from these activities, and how they can be included in embodied carbon calculations (see Action 1.1). Work will then include understanding what policy and incentive opportunities are possible, with a focus on supporting pilot projects, and a goal to eventually create requirements in policy and regulation once the technology and industry knowledge are readily available.
4. Support zero waste and deconstruction. Promote and encourage design for deconstruction, reusable and non-toxic materials, material transparency (such as through labelling and material passports), and buildings as long-term stores of materials, carbon, and value with the objective of eventually requiring it through the building code when the market is ready. This action would increase the value and reusability of building components and materials at the end of their service life, and increase the overall flexibility and resilience of the built environment.
In addition, work with the Zero Waste 2040 strategy and the deconstruction by-law to encourage construction waste elimination, material re-use, and a more circular construction economy. For example, staff will explore expansion of construction waste diversion requirements or the deconstruction by-law for larger buildings and apply an embodied carbon lens to prioritize the re-use of high-carbon materials, such as aluminum or glass, extending their life and avoiding the need for new material.
5. Support seismic resilience. Work with resilience planners and the Office of the Chief Building Official to integrate with the Resilient Vancouver strategy
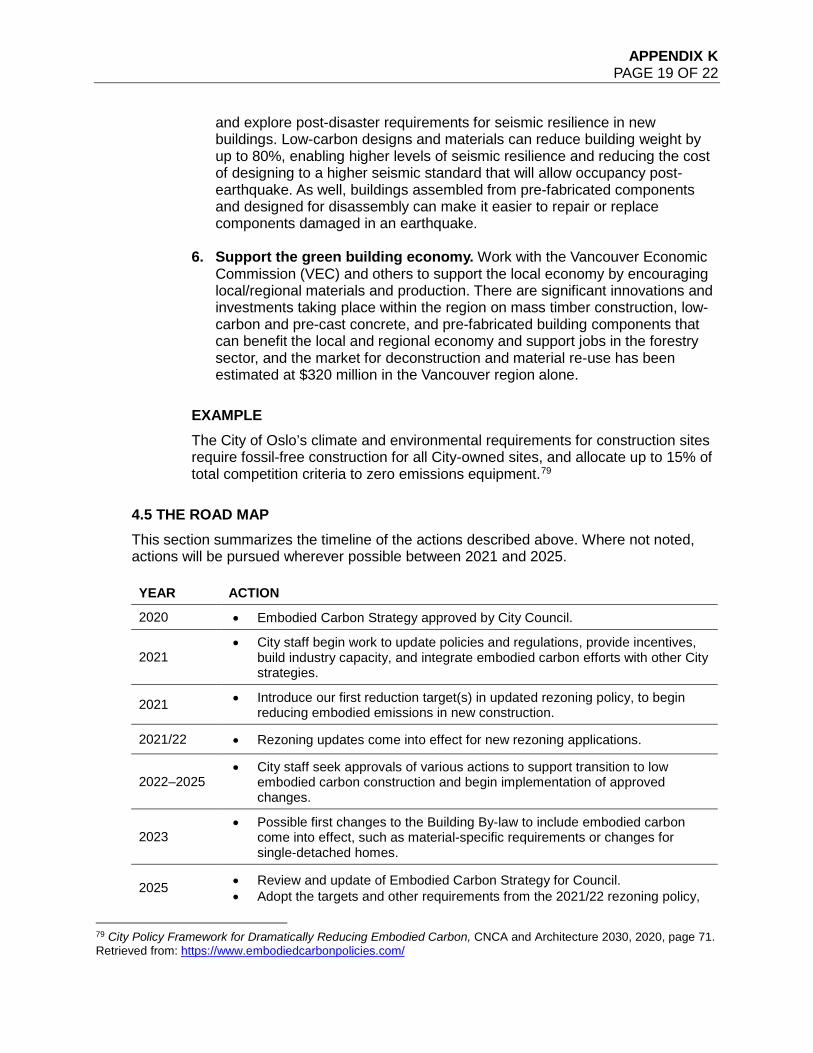
APPENDIX K PAGE 19 OF 22
and explore post-disaster requirements for seismic resilience in new buildings. Low-carbon designs and materials can reduce building weight by up to 80%, enabling higher levels of seismic resilience and reducing the cost of designing to a higher seismic standard that will allow occupancy post-earthquake. As well, buildings assembled from pre-fabricated components and designed for disassembly can make it easier to repair or replace components damaged in an earthquake.
6. Support the green building economy. Work with the Vancouver Economic Commission (VEC) and others to support the local economy by encouraging local/regional materials and production. There are significant innovations and investments taking place within the region on mass timber construction, low-carbon and pre-cast concrete, and pre-fabricated building components that can benefit the local and regional economy and support jobs in the forestry sector, and the market for deconstruction and material re-use has been estimated at $320 million in the Vancouver region alone.
EXAMPLE The City of Oslo’s climate and environmental requirements for construction sites require fossil-free construction for all City-owned sites, and allocate up to 15% of total competition criteria to zero emissions equipment.79
4.5 THE ROAD MAP This section summarizes the timeline of the actions described above. Where not noted, actions will be pursued wherever possible between 2021 and 2025. YEAR ACTION
2020 • Embodied Carbon Strategy approved by City Council.
2021 • City staff begin work to update policies and regulations, provide incentives,
build industry capacity, and integrate embodied carbon efforts with other City strategies.
2021 • Introduce our first reduction target(s) in updated rezoning policy, to begin reducing embodied emissions in new construction.
2021/22 • Rezoning updates come into effect for new rezoning applications.
2022–2025 • City staff seek approvals of various actions to support transition to low
embodied carbon construction and begin implementation of approved changes.
2023 • Possible first changes to the Building By-law to include embodied carbon
come into effect, such as material-specific requirements or changes for single-detached homes.
2025 • Review and update of Embodied Carbon Strategy for Council. • Adopt the targets and other requirements from the 2021/22 rezoning policy,
79 City Policy Framework for Dramatically Reducing Embodied Carbon, CNCA and Architecture 2030, 2020, page 71. Retrieved from: https://www.embodiedcarbonpolicies.com/
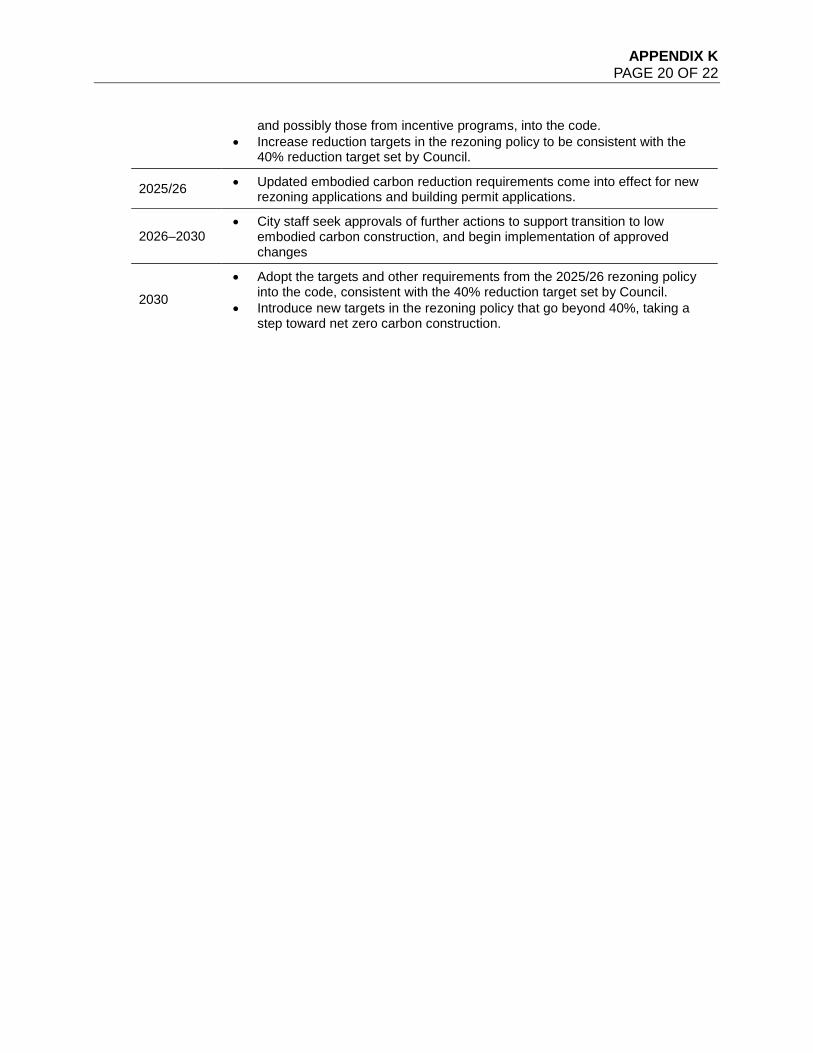
APPENDIX K PAGE 20 OF 22
and possibly those from incentive programs, into the code. • Increase reduction targets in the rezoning policy to be consistent with the
40% reduction target set by Council.
2025/26 • Updated embodied carbon reduction requirements come into effect for new rezoning applications and building permit applications.
2026–2030 • City staff seek approvals of further actions to support transition to low
embodied carbon construction, and begin implementation of approved changes
2030
• Adopt the targets and other requirements from the 2025/26 rezoning policy into the code, consistent with the 40% reduction target set by Council.
• Introduce new targets in the rezoning policy that go beyond 40%, taking a step toward net zero carbon construction.
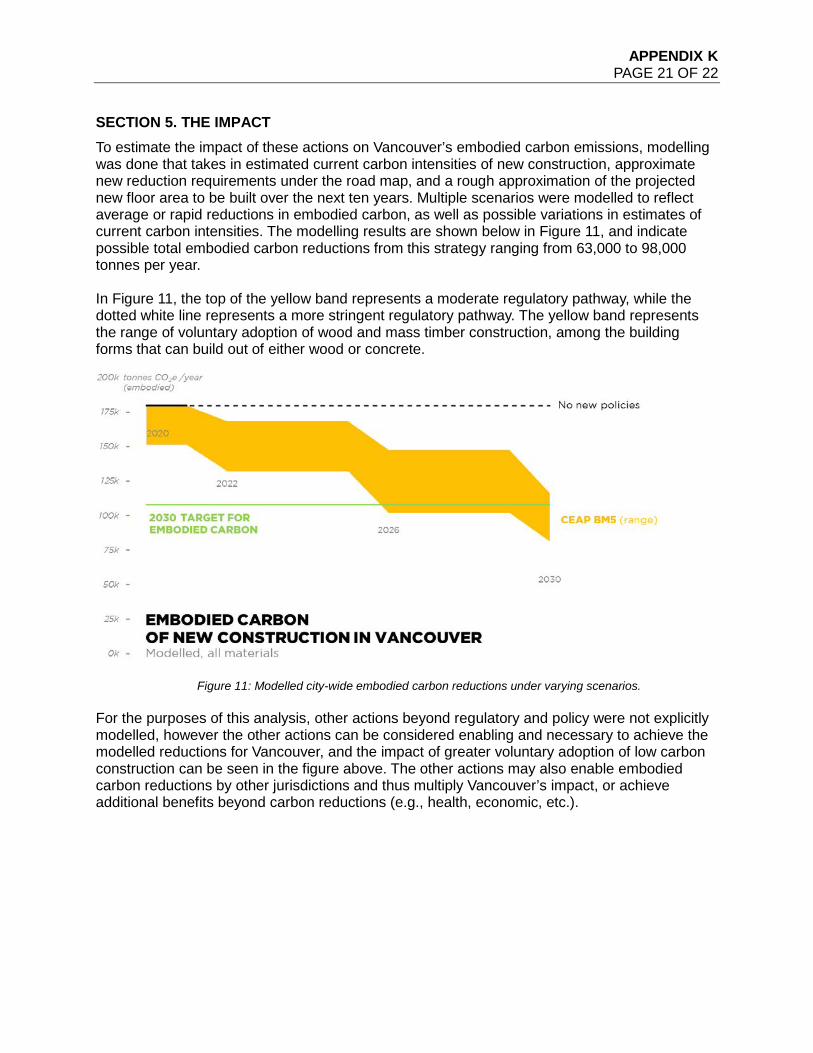
APPENDIX K PAGE 21 OF 22
SECTION 5. THE IMPACT To estimate the impact of these actions on Vancouver’s embodied carbon emissions, modelling was done that takes in estimated current carbon intensities of new construction, approximate new reduction requirements under the road map, and a rough approximation of the projected new floor area to be built over the next ten years. Multiple scenarios were modelled to reflect average or rapid reductions in embodied carbon, as well as possible variations in estimates of current carbon intensities. The modelling results are shown below in Figure 11, and indicate possible total embodied carbon reductions from this strategy ranging from 63,000 to 98,000 tonnes per year.
In Figure 11, the top of the yellow band represents a moderate regulatory pathway, while the dotted white line represents a more stringent regulatory pathway. The yellow band represents the range of voluntary adoption of wood and mass timber construction, among the building forms that can build out of either wood or concrete.
Figure 11: Modelled city-wide embodied carbon reductions under varying scenarios.
For the purposes of this analysis, other actions beyond regulatory and policy were not explicitly modelled, however the other actions can be considered enabling and necessary to achieve the modelled reductions for Vancouver, and the impact of greater voluntary adoption of low carbon construction can be seen in the figure above. The other actions may also enable embodied carbon reductions by other jurisdictions and thus multiply Vancouver’s impact, or achieve additional benefits beyond carbon reductions (e.g., health, economic, etc.).
APPENDIX K PAGE 22 OF 22
SECTION 6. IMPLEMENTATION To ensure the policies proposed in this strategy are successfully implemented, we will augment our current review and approvals processes to address embodied carbon. As specific policies and programs proposed in this strategy are developed and brought to Council for approval, we will also seek approval of the appropriate financial resources, such as funding for new incentives or subsidized embodied carbon training. As part of this strategy, we envision a dedicated staff position who will work closely with internal process owners, review staff, and applicants, to ensure smooth and successful implementation of the proposed policies and programs. We will provide resources and training to urban design and planning staff to create a common base of embodied carbon knowledge across the City, as well as process-specific training for process owners responsible for reviews and working with applicants. To accompany any new policy or regulatory requirements for embodied carbon reductions, we will issue administrative bulletins that detail what the requirements mean, and what submittals we will expect at each stage of approval. We will create new standardized reporting forms to accompany existing submittals for rezoning, development permit, and building permit applications, and clarify any additional documentation that must be submitted (e.g., Environmental Product Declarations, sustainable-forestry certifications and/or chain-of-custody certificates, concrete batch certificates, etc.). These standardized reporting forms will also be used to gather data, which we will aggregate and report on annually to City Council as part of the larger Climate Emergency Action Plan, to show our progress toward our 40% reduction goal (along with other indicators). The detailed form of this standardized project data will also allow us to share it with others, such as external organizations and other levels of government, who can use it to advance standards, tools and databases for embodied carbon. This data can also be shared with manufacturers and others in the construction industry to communicate and accelerate the market shift to low-carbon construction. By creating a robust implementation plan, complete with regular internal training and clear and user-friendly submittal and approval processes, we can avoid impacting approval timelines. And by creating standardized data collection and reporting we can create confidence that embodied carbon policies are leading to real-world outcomes, and we can hold ourselves accountable to our embodied carbon reduction goals.
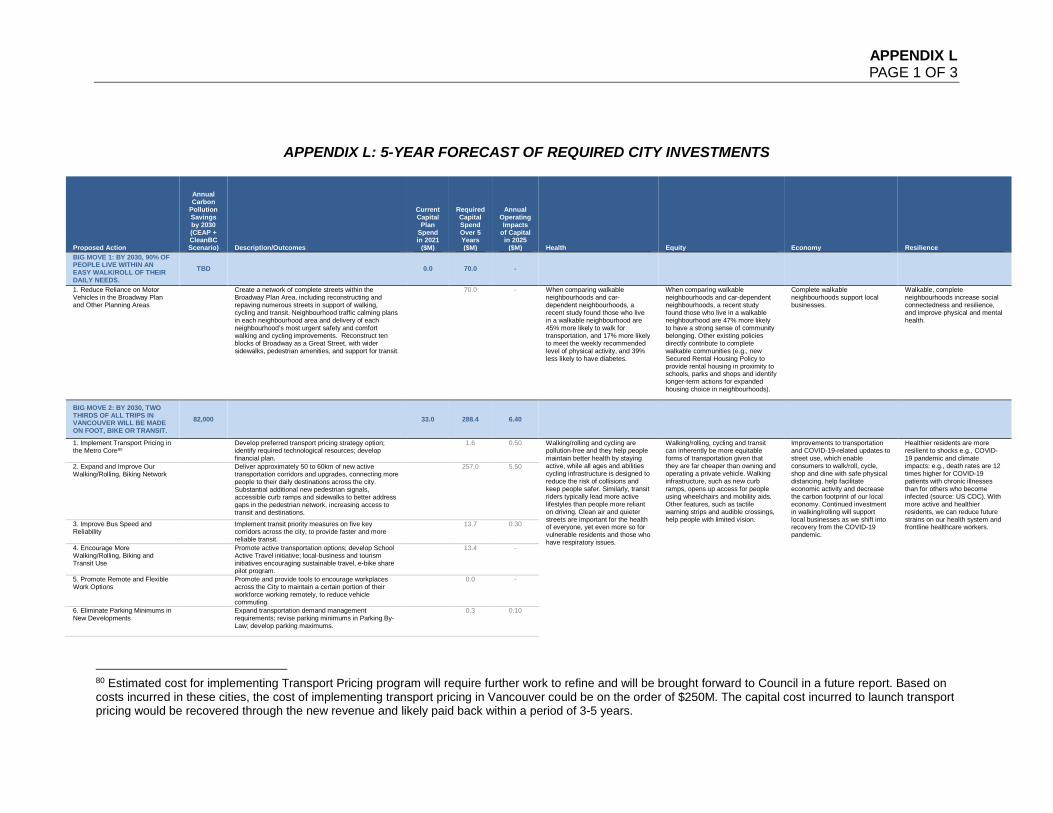
APPENDIX L PAGE 1 OF 3
APPENDIX L: 5-YEAR FORECAST OF REQUIRED CITY INVESTMENTS
Proposed Action
Annual Carbon
Pollution Savings by 2030 (CEAP + CleanBC Scenario) Description/Outcomes
Current Capital
Plan Spend in 2021
($M)
Required Capital Spend Over 5 Years ($M)
Annual Operating Impacts
of Capital in 2025
($M) Health Equity Economy Resilience BIG MOVE 1: BY 2030, 90% OF PEOPLE LIVE WITHIN AN EASY WALK/ROLL OF THEIR DAILY NEEDS.
TBD 0.0 70.0 -
1. Reduce Reliance on Motor Vehicles in the Broadway Plan and Other Planning Areas
Create a network of complete streets within the Broadway Plan Area, including reconstructing and repaving numerous streets in support of walking, cycling and transit. Neighbourhood traffic calming plans in each neighbourhood area and delivery of each neighbourhood’s most urgent safety and comfort walking and cycling improvements. Reconstruct ten blocks of Broadway as a Great Street, with wider sidewalks, pedestrian amenities, and support for transit.
70.0 - When comparing walkable neighbourhoods and car-dependent neighbourhoods, a recent study found those who live in a walkable neighbourhood are 45% more likely to walk for transportation, and 17% more likely to meet the weekly recommended level of physical activity, and 39% less likely to have diabetes.
When comparing walkable neighbourhoods and car-dependent neighbourhoods, a recent study found those who live in a walkable neighbourhood are 47% more likely to have a strong sense of community belonging. Other existing policies directly contribute to complete walkable communities (e.g., new Secured Rental Housing Policy to provide rental housing in proximity to schools, parks and shops and identify longer-term actions for expanded housing choice in neighbourhoods).
Complete walkable neighbourhoods support local businesses.
Walkable, complete neighbourhoods increase social connectedness and resilience, and improve physical and mental health.
BIG MOVE 2: BY 2030, TWO THIRDS OF ALL TRIPS IN VANCOUVER WILL BE MADE ON FOOT, BIKE OR TRANSIT.
82,000 33.0 288.4 6.40
1. Implement Transport Pricing in the Metro Core80
Develop preferred transport pricing strategy option; identify required technological resources; develop financial plan.
1.6 0.50 Walking/rolling and cycling are pollution-free and they help people maintain better health by staying active, while all ages and abilities cycling infrastructure is designed to reduce the risk of collisions and keep people safer. Similarly, transit riders typically lead more active lifestyles than people more reliant on driving. Clean air and quieter streets are important for the health of everyone, yet even more so for vulnerable residents and those who have respiratory issues.
Walking/rolling, cycling and transit can inherently be more equitable forms of transportation given that they are far cheaper than owning and operating a private vehicle. Walking infrastructure, such as new curb ramps, opens up access for people using wheelchairs and mobility aids. Other features, such as tactile warning strips and audible crossings, help people with limited vision.
Improvements to transportation and COVID-19-related updates to street use, which enable consumers to walk/roll, cycle, shop and dine with safe physical distancing, help facilitate economic activity and decrease the carbon footprint of our local economy. Continued investment in walking/rolling will support local businesses as we shift into recovery from the COVID-19 pandemic.
Healthier residents are more resilient to shocks e.g., COVID-19 pandemic and climate impacts: e.g., death rates are 12 times higher for COVID-19 patients with chronic illnesses than for others who become infected (source: US CDC). With more active and healthier residents, we can reduce future strains on our health system and frontline healthcare workers.
2. Expand and Improve Our Walking/Rolling, Biking Network
Deliver approximately 50 to 60km of new active transportation corridors and upgrades, connecting more people to their daily destinations across the city. Substantial additional new pedestrian signals, accessible curb ramps and sidewalks to better address gaps in the pedestrian network, increasing access to transit and destinations.
257.0 5.50
3. Improve Bus Speed and Reliability
Implement transit priority measures on five key corridors across the city, to provide faster and more reliable transit.
13.7 0.30
4. Encourage More Walking/Rolling, Biking and Transit Use
Promote active transportation options; develop School Active Travel initiative; local-business and tourism initiatives encouraging sustainable travel, e-bike share pilot program.
13.4 -
5. Promote Remote and Flexible Work Options
Promote and provide tools to encourage workplaces across the City to maintain a certain portion of their workforce working remotely, to reduce vehicle commuting.
0.0 -
6. Eliminate Parking Minimums in New Developments
Expand transportation demand management requirements; revise parking minimums in Parking By-Law; develop parking maximums.
0.3 0.10
80 Estimated cost for implementing Transport Pricing program will require further work to refine and will be brought forward to Council in a future report. Based on costs incurred in these cities, the cost of implementing transport pricing in Vancouver could be on the order of $250M. The capital cost incurred to launch transport pricing would be recovered through the new revenue and likely paid back within a period of 3-5 years.
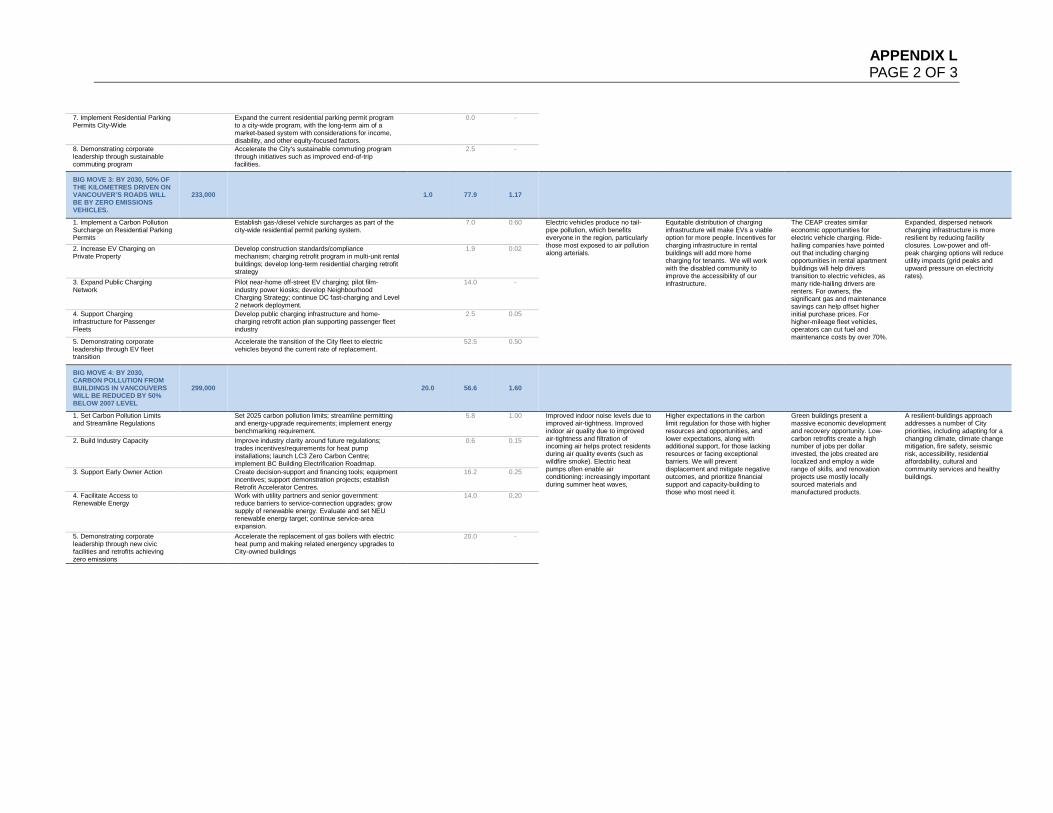
APPENDIX L PAGE 2 OF 3
7. Implement Residential Parking Permits City-Wide
Expand the current residential parking permit program to a city-wide program, with the long-term aim of a market-based system with considerations for income, disability, and other equity-focused factors.
0.0 -
8. Demonstrating corporate leadership through sustainable commuting program
Accelerate the City's sustainable commuting program through initiatives such as improved end-of-trip facilities.
2.5 -
BIG MOVE 3: BY 2030, 50% OF THE KILOMETRES DRIVEN ON VANCOUVER’S ROADS WILL BE BY ZERO EMISSIONS VEHICLES.
233,000 1.0 77.9 1.17
1. Implement a Carbon Pollution Surcharge on Residential Parking Permits
Establish gas-/diesel vehicle surcharges as part of the city-wide residential permit parking system.
7.0 0.60 Electric vehicles produce no tail-pipe pollution, which benefits everyone in the region, particularly those most exposed to air pollution along arterials.
Equitable distribution of charging infrastructure will make EVs a viable option for more people. Incentives for charging infrastructure in rental buildings will add more home charging for tenants. We will work with the disabled community to improve the accessibility of our infrastructure.
The CEAP creates similar economic opportunities for electric vehicle charging. Ride-hailing companies have pointed out that including charging opportunities in rental apartment buildings will help drivers transition to electric vehicles, as many ride-hailing drivers are renters. For owners, the significant gas and maintenance savings can help offset higher initial purchase prices. For higher-mileage fleet vehicles, operators can cut fuel and maintenance costs by over 70%.
Expanded, dispersed network charging infrastructure is more resilient by reducing facility closures. Low-power and off-peak charging options will reduce utility impacts (grid peaks and upward pressure on electricity rates).
2. Increase EV Charging on Private Property
Develop construction standards/compliance mechanism; charging retrofit program in multi-unit rental buildings; develop long-term residential charging retrofit strategy
1.9 0.02
3. Expand Public Charging Network
Pilot near-home off-street EV charging; pilot film-industry power kiosks; develop Neighbourhood Charging Strategy; continue DC fast-charging and Level 2 network deployment.
14.0 -
4. Support Charging Infrastructure for Passenger Fleets
Develop public charging infrastructure and home-charging retrofit action plan supporting passenger fleet industry
2.5 0.05
5. Demonstrating corporate leadership through EV fleet transition
Accelerate the transition of the City fleet to electric vehicles beyond the current rate of replacement.
52.5 0.50
BIG MOVE 4: BY 2030, CARBON POLLUTION FROM BUILDINGS IN VANCOUVERS WILL BE REDUCED BY 50% BELOW 2007 LEVEL
299,000 20.0 56.6 1.60
1. Set Carbon Pollution Limits and Streamline Regulations
Set 2025 carbon pollution limits; streamline permitting and energy-upgrade requirements; implement energy benchmarking requirement.
5.8 1.00 Improved indoor noise levels due to improved air-tightness. Improved indoor air quality due to improved air-tightness and filtration of incoming air helps protect residents during air quality events (such as wildfire smoke). Electric heat pumps often enable air conditioning: increasingly important during summer heat waves,
Higher expectations in the carbon limit regulation for those with higher resources and opportunities, and lower expectations, along with additional support, for those lacking resources or facing exceptional barriers. We will prevent displacement and mitigate negative outcomes, and prioritize financial support and capacity-building to those who most need it.
Green buildings present a massive economic development and recovery opportunity. Low-carbon retrofits create a high number of jobs per dollar invested, the jobs created are localized and employ a wide range of skills, and renovation projects use mostly locally sourced materials and manufactured products.
A resilient-buildings approach addresses a number of City priorities, including adapting for a changing climate, climate change mitigation, fire safety, seismic risk, accessibility, residential affordability, cultural and community services and healthy buildings.
2. Build Industry Capacity Improve industry clarity around future regulations; trades incentives/requirements for heat pump installations; launch LC3 Zero Carbon Centre; implement BC Building Electrification Roadmap.
0.6 0.15
3. Support Early Owner Action Create decision-support and financing tools; equipment incentives; support demonstration projects; establish Retrofit Accelerator Centres.
16.2 0.25
4. Facilitate Access to Renewable Energy
Work with utility partners and senior government: reduce barriers to service-connection upgrades; grow supply of renewable energy. Evaluate and set NEU renewable energy target; continue service-area expansion.
14.0 0.20
5. Demonstrating corporate leadership through new civic facilities and retrofits achieving zero emissions
Accelerate the replacement of gas boilers with electric heat pump and making related energency upgrades to City-owned buildings
20.0 -
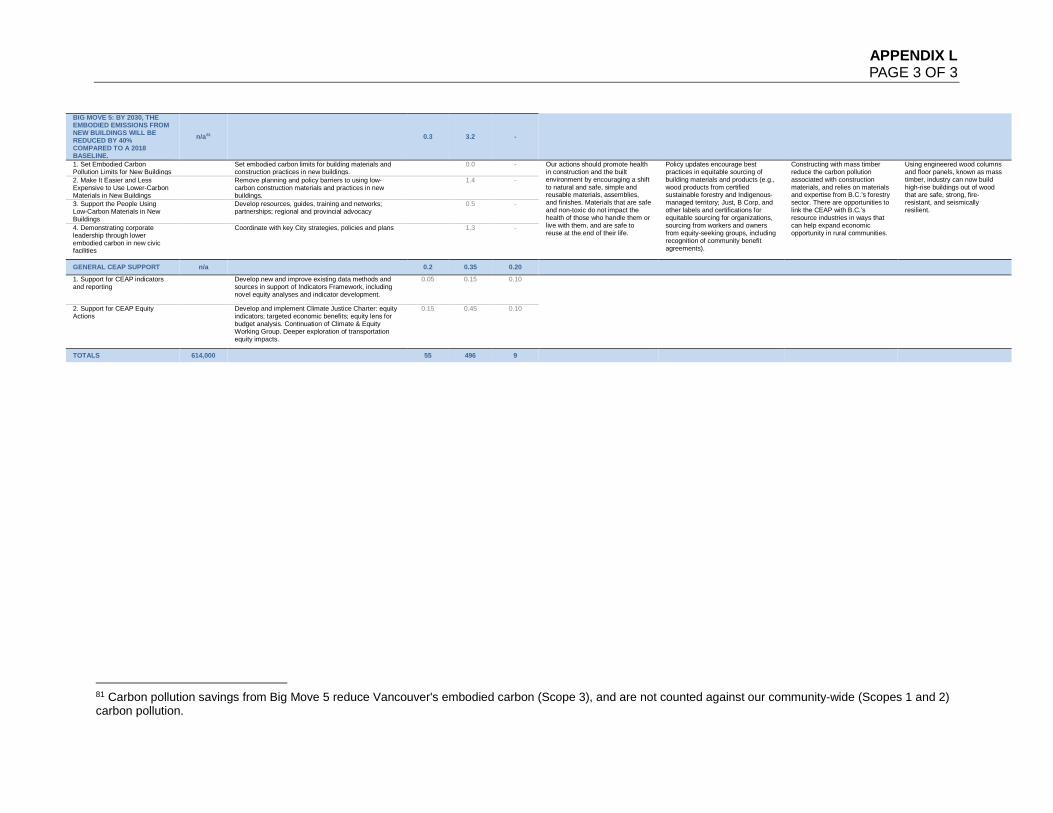
APPENDIX L PAGE 3 OF 3
BIG MOVE 5: BY 2030, THE EMBODIED EMISSIONS FROM NEW BUILDINGS WILL BE REDUCED BY 40% COMPARED TO A 2018 BASELINE.
n/a81 0.3 3.2 -
1. Set Embodied Carbon Pollution Limits for New Buildings
Set embodied carbon limits for building materials and construction practices in new buildings.
0.0 - Our actions should promote health in construction and the built environment by encouraging a shift to natural and safe, simple and reusable materials, assemblies, and finishes. Materials that are safe and non-toxic do not impact the health of those who handle them or live with them, and are safe to reuse at the end of their life.
Policy updates encourage best practices in equitable sourcing of building materials and products (e.g., wood products from certified sustainable forestry and Indigenous-managed territory; Just, B Corp, and other labels and certifications for equitable sourcing for organizations, sourcing from workers and owners from equity-seeking groups, including recognition of community benefit agreements).
Constructing with mass timber reduce the carbon pollution associated with construction materials, and relies on materials and expertise from B.C.’s forestry sector. There are opportunities to link the CEAP with B.C.’s resource industries in ways that can help expand economic opportunity in rural communities.
Using engineered wood columns and floor panels, known as mass timber, industry can now build high-rise buildings out of wood that are safe, strong, fire-resistant, and seismically resilient.
2. Make It Easier and Less Expensive to Use Lower-Carbon Materials in New Buildings
Remove planning and policy barriers to using low-carbon construction materials and practices in new buildings.
1.4 -
3. Support the People Using Low-Carbon Materials in New Buildings
Develop resources, guides, training and networks; partnerships; regional and provincial advocacy
0.5 -
4. Demonstrating corporate leadership through lower embodied carbon in new civic facilities
Coordinate with key City strategies, policies and plans 1.3 -
GENERAL CEAP SUPPORT n/a 0.2 0.35 0.20 1. Support for CEAP indicators and reporting
Develop new and improve existing data methods and sources in support of Indicators Framework, including novel equity analyses and indicator development.
0.05 0.15 0.10
2. Support for CEAP Equity Actions
Develop and implement Climate Justice Charter: equity indicators; targeted economic benefits; equity lens for budget analysis. Continuation of Climate & Equity Working Group. Deeper exploration of transportation equity impacts.
0.15 0.45 0.10
TOTALS 614,000 55 496 9
81 Carbon pollution savings from Big Move 5 reduce Vancouver's embodied carbon (Scope 3), and are not counted against our community-wide (Scopes 1 and 2) carbon pollution.
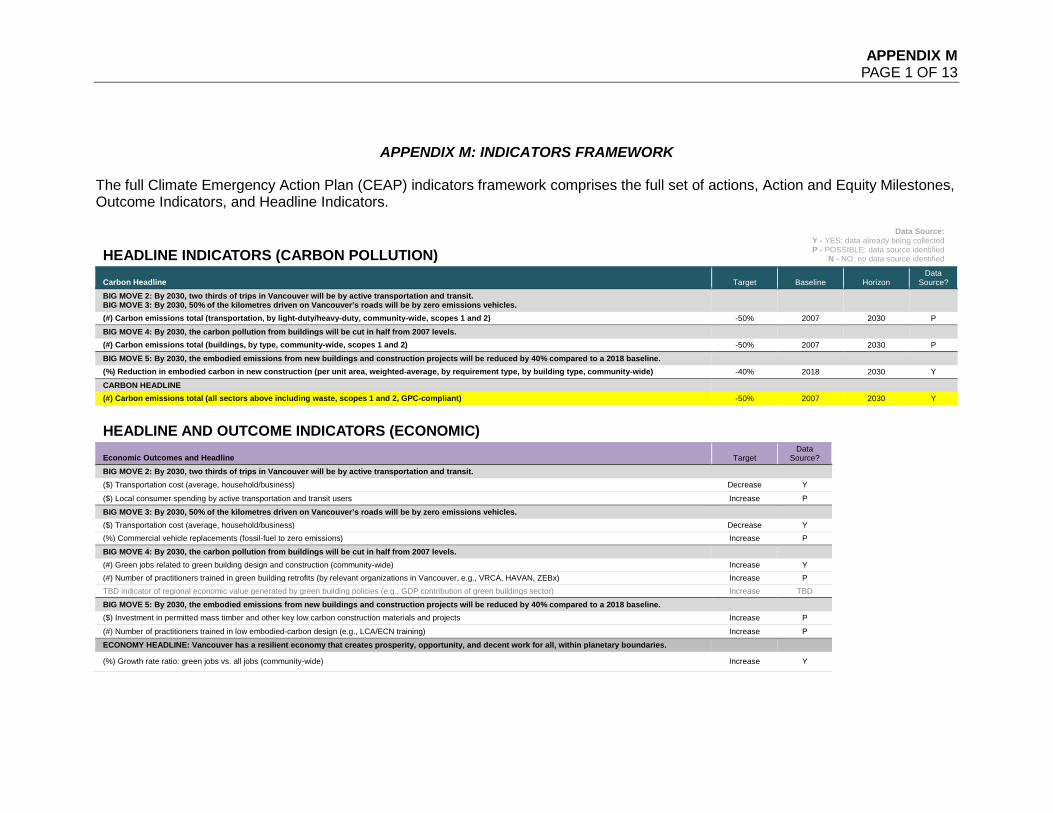
APPENDIX M PAGE 1 OF 13
APPENDIX M: INDICATORS FRAMEWORK
The full Climate Emergency Action Plan (CEAP) indicators framework comprises the full set of actions, Action and Equity Milestones, Outcome Indicators, and Headline Indicators.
HEADLINE INDICATORS (CARBON POLLUTION)
Data Source: Y - YES: data already being collected P - POSSIBLE: data source identified
N - NO: no data source identified
Carbon Headline Target Baseline Horizon Data
Source? BIG MOVE 2: By 2030, two thirds of trips in Vancouver will be by active transportation and transit. BIG MOVE 3: By 2030, 50% of the kilometres driven on Vancouver’s roads will be by zero emissions vehicles.
(#) Carbon emissions total (transportation, by light-duty/heavy-duty, community-wide, scopes 1 and 2) -50% 2007 2030 P BIG MOVE 4: By 2030, the carbon pollution from buildings will be cut in half from 2007 levels. (#) Carbon emissions total (buildings, by type, community-wide, scopes 1 and 2) -50% 2007 2030 P BIG MOVE 5: By 2030, the embodied emissions from new buildings and construction projects will be reduced by 40% compared to a 2018 baseline. (%) Reduction in embodied carbon in new construction (per unit area, weighted-average, by requirement type, by building type, community-wide) -40% 2018 2030 Y CARBON HEADLINE (#) Carbon emissions total (all sectors above including waste, scopes 1 and 2, GPC-compliant) -50% 2007 2030 Y
HEADLINE AND OUTCOME INDICATORS (ECONOMIC)
Economic Outcomes and Headline Target Data
Source? BIG MOVE 2: By 2030, two thirds of trips in Vancouver will be by active transportation and transit. ($) Transportation cost (average, household/business) Decrease Y
($) Local consumer spending by active transportation and transit users Increase P BIG MOVE 3: By 2030, 50% of the kilometres driven on Vancouver’s roads will be by zero emissions vehicles. ($) Transportation cost (average, household/business) Decrease Y (%) Commercial vehicle replacements (fossil-fuel to zero emissions) Increase P BIG MOVE 4: By 2030, the carbon pollution from buildings will be cut in half from 2007 levels. (#) Green jobs related to green building design and construction (community-wide) Increase Y (#) Number of practitioners trained in green building retrofits (by relevant organizations in Vancouver, e.g., VRCA, HAVAN, ZEBx) Increase P TBD indicator of regional economic value generated by green building policies (e.g., GDP contribution of green buildings sector) Increase TBD BIG MOVE 5: By 2030, the embodied emissions from new buildings and construction projects will be reduced by 40% compared to a 2018 baseline. ($) Investment in permitted mass timber and other key low carbon construction materials and projects Increase P
(#) Number of practitioners trained in low embodied-carbon design (e.g., LCA/ECN training) Increase P ECONOMY HEADLINE: Vancouver has a resilient economy that creates prosperity, opportunity, and decent work for all, within planetary boundaries.
(%) Growth rate ratio: green jobs vs. all jobs (community-wide) Increase Y
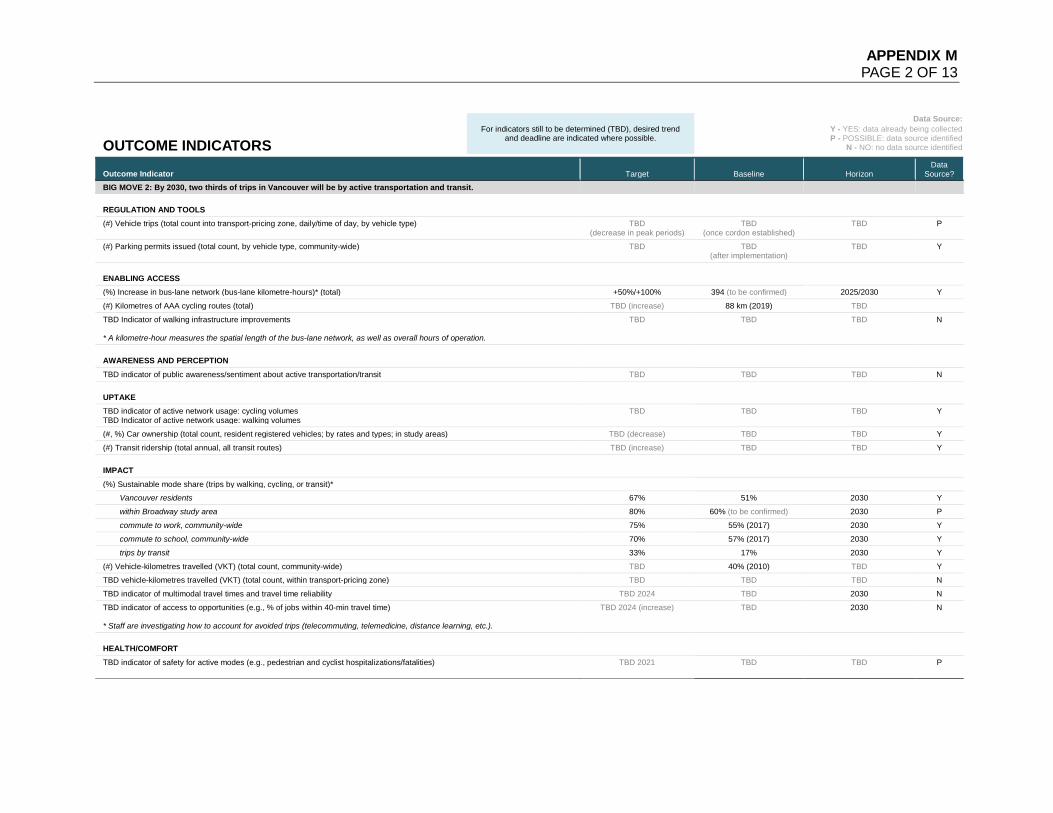
APPENDIX M PAGE 2 OF 13
OUTCOME INDICATORS For indicators still to be determined (TBD), desired trend
and deadline are indicated where possible.
Data Source: Y - YES: data already being collected P - POSSIBLE: data source identified
N - NO: no data source identified
Outcome Indicator Target Baseline Horizon Data
Source? BIG MOVE 2: By 2030, two thirds of trips in Vancouver will be by active transportation and transit. REGULATION AND TOOLS
(#) Vehicle trips (total count into transport-pricing zone, daily/time of day, by vehicle type) TBD (decrease in peak periods)
TBD (once cordon established)
TBD P
(#) Parking permits issued (total count, by vehicle type, community-wide)
TBD TBD (after implementation)
TBD Y
ENABLING ACCESS
(%) Increase in bus-lane network (bus-lane kilometre-hours)* (total) +50%/+100% 394 (to be confirmed) 2025/2030 Y
(#) Kilometres of AAA cycling routes (total) TBD (increase) 88 km (2019) TBD
TBD Indicator of walking infrastructure improvements * A kilometre-hour measures the spatial length of the bus-lane network, as well as overall hours of operation.
TBD TBD TBD N
AWARENESS AND PERCEPTION
TBD indicator of public awareness/sentiment about active transportation/transit TBD TBD TBD N UPTAKE
TBD indicator of active network usage: cycling volumes TBD Indicator of active network usage: walking volumes
TBD TBD TBD Y
(#, %) Car ownership (total count, resident registered vehicles; by rates and types; in study areas) TBD (decrease) TBD TBD Y
(#) Transit ridership (total annual, all transit routes) TBD (increase) TBD TBD Y IMPACT
(%) Sustainable mode share (trips by walking, cycling, or transit)* Vancouver residents 67% 51% 2030 Y
within Broadway study area 80% 60% (to be confirmed) 2030 P commute to work, community-wide 75% 55% (2017) 2030 Y commute to school, community-wide 70% 57% (2017) 2030 Y trips by transit 33% 17% 2030 Y
(#) Vehicle-kilometres travelled (VKT) (total count, community-wide) TBD 40% (2010) TBD Y TBD vehicle-kilometres travelled (VKT) (total count, within transport-pricing zone) TBD TBD TBD N
TBD indicator of multimodal travel times and travel time reliability TBD 2024 TBD 2030 N
TBD indicator of access to opportunities (e.g., % of jobs within 40-min travel time) * Staff are investigating how to account for avoided trips (telecommuting, telemedicine, distance learning, etc.).
TBD 2024 (increase) TBD 2030 N
HEALTH/COMFORT
TBD indicator of safety for active modes (e.g., pedestrian and cyclist hospitalizations/fatalities)
TBD 2021 TBD TBD P
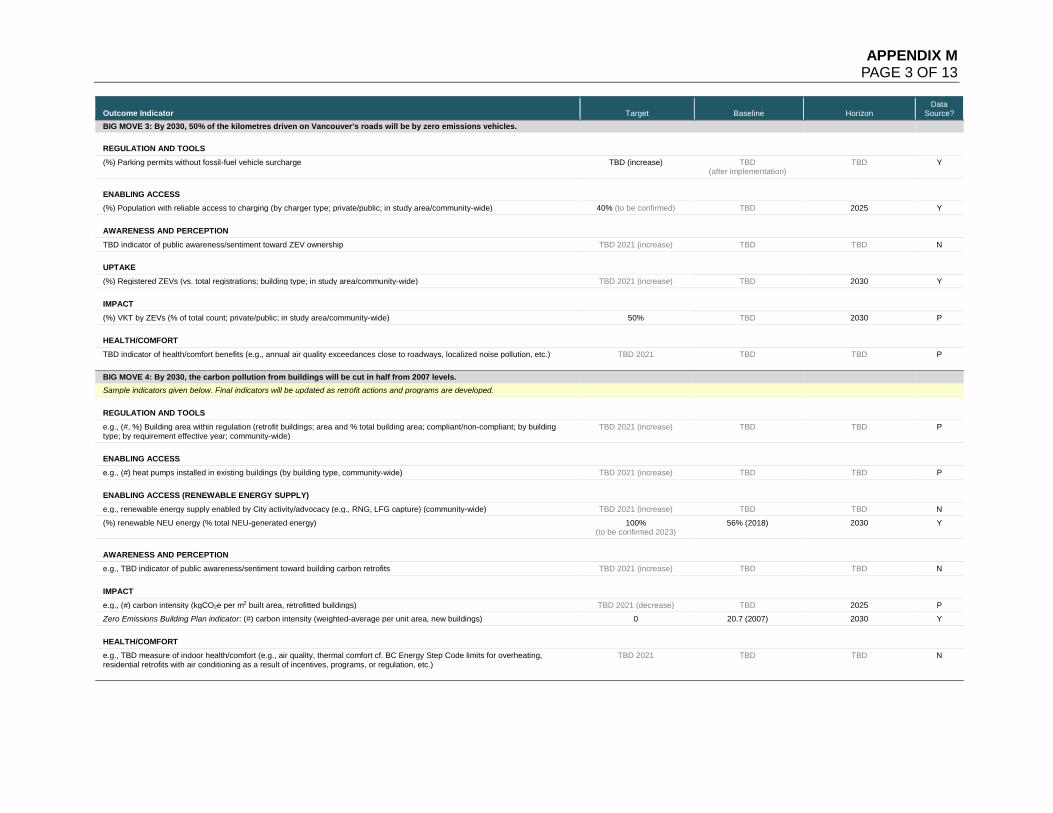
APPENDIX M PAGE 3 OF 13
Outcome Indicator Target Baseline Horizon Data
Source? BIG MOVE 3: By 2030, 50% of the kilometres driven on Vancouver’s roads will be by zero emissions vehicles. REGULATION AND TOOLS
(%) Parking permits without fossil-fuel vehicle surcharge TBD (increase) TBD (after implementation) TBD Y
ENABLING ACCESS
(%) Population with reliable access to charging (by charger type; private/public; in study area/community-wide) 40% (to be confirmed) TBD 2025 Y AWARENESS AND PERCEPTION
TBD indicator of public awareness/sentiment toward ZEV ownership TBD 2021 (increase) TBD TBD N UPTAKE
(%) Registered ZEVs (vs. total registrations; building type; in study area/community-wide) TBD 2021 (increase) TBD 2030 Y IMPACT
(%) VKT by ZEVs (% of total count; private/public; in study area/community-wide) 50% TBD 2030 P HEALTH/COMFORT
TBD indicator of health/comfort benefits (e.g., annual air quality exceedances close to roadways, localized noise pollution, etc.)
TBD 2021 TBD TBD P
BIG MOVE 4: By 2030, the carbon pollution from buildings will be cut in half from 2007 levels. Sample indicators given below. Final indicators will be updated as retrofit actions and programs are developed. REGULATION AND TOOLS
e.g., (#, %) Building area within regulation (retrofit buildings; area and % total building area; compliant/non-compliant; by building type; by requirement effective year; community-wide)
TBD 2021 (increase) TBD TBD P
ENABLING ACCESS
e.g., (#) heat pumps installed in existing buildings (by building type, community-wide) TBD 2021 (increase) TBD TBD P ENABLING ACCESS (RENEWABLE ENERGY SUPPLY)
e.g., renewable energy supply enabled by City activity/advocacy (e.g., RNG, LFG capture) (community-wide) TBD 2021 (increase) TBD TBD N
(%) renewable NEU energy (% total NEU-generated energy) 100% (to be confirmed 2023)
56% (2018) 2030 Y
AWARENESS AND PERCEPTION
e.g., TBD indicator of public awareness/sentiment toward building carbon retrofits TBD 2021 (increase) TBD TBD N IMPACT
e.g., (#) carbon intensity (kgCO2e per m2 built area, retrofitted buildings) TBD 2021 (decrease) TBD 2025 P Zero Emissions Building Plan indicator: (#) carbon intensity (weighted-average per unit area, new buildings) 0 20.7 (2007) 2030 Y HEALTH/COMFORT
e.g., TBD measure of indoor health/comfort (e.g., air quality, thermal comfort cf. BC Energy Step Code limits for overheating, residential retrofits with air conditioning as a result of incentives, programs, or regulation, etc.)
TBD 2021 TBD TBD N
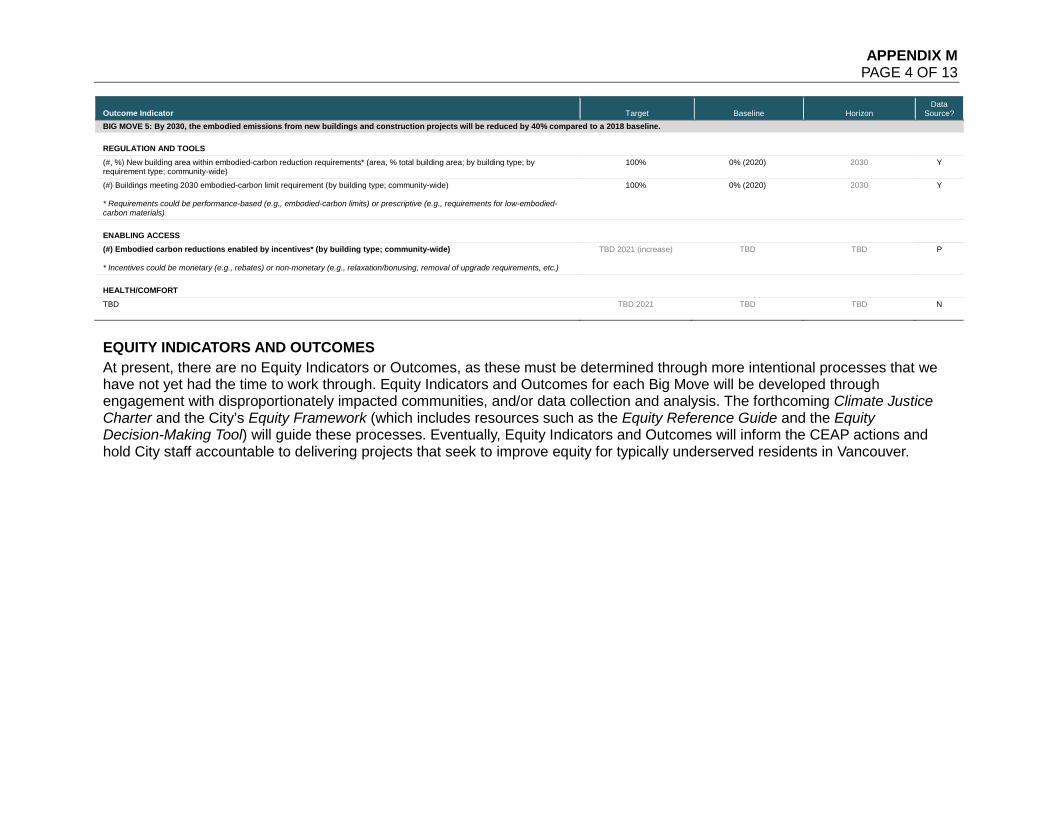
APPENDIX M PAGE 4 OF 13
Outcome Indicator Target Baseline Horizon Data
Source? BIG MOVE 5: By 2030, the embodied emissions from new buildings and construction projects will be reduced by 40% compared to a 2018 baseline. REGULATION AND TOOLS
(#, %) New building area within embodied-carbon reduction requirements* (area, % total building area; by building type; by requirement type; community-wide)
100% 0% (2020) 2030 Y
(#) Buildings meeting 2030 embodied-carbon limit requirement (by building type; community-wide) * Requirements could be performance-based (e.g., embodied-carbon limits) or prescriptive (e.g., requirements for low-embodied-carbon materials)
100% 0% (2020) 2030 Y
ENABLING ACCESS
(#) Embodied carbon reductions enabled by incentives* (by building type; community-wide) * Incentives could be monetary (e.g., rebates) or non-monetary (e.g., relaxation/bonusing, removal of upgrade requirements, etc.)
TBD 2021 (increase) TBD TBD P
HEALTH/COMFORT
TBD
TBD 2021 TBD TBD N
EQUITY INDICATORS AND OUTCOMES
At present, there are no Equity Indicators or Outcomes, as these must be determined through more intentional processes that we have not yet had the time to work through. Equity Indicators and Outcomes for each Big Move will be developed through engagement with disproportionately impacted communities, and/or data collection and analysis. The forthcoming Climate Justice Charter and the City’s Equity Framework (which includes resources such as the Equity Reference Guide and the Equity Decision-Making Tool) will guide these processes. Eventually, Equity Indicators and Outcomes will inform the CEAP actions and hold City staff accountable to delivering projects that seek to improve equity for typically underserved residents in Vancouver.
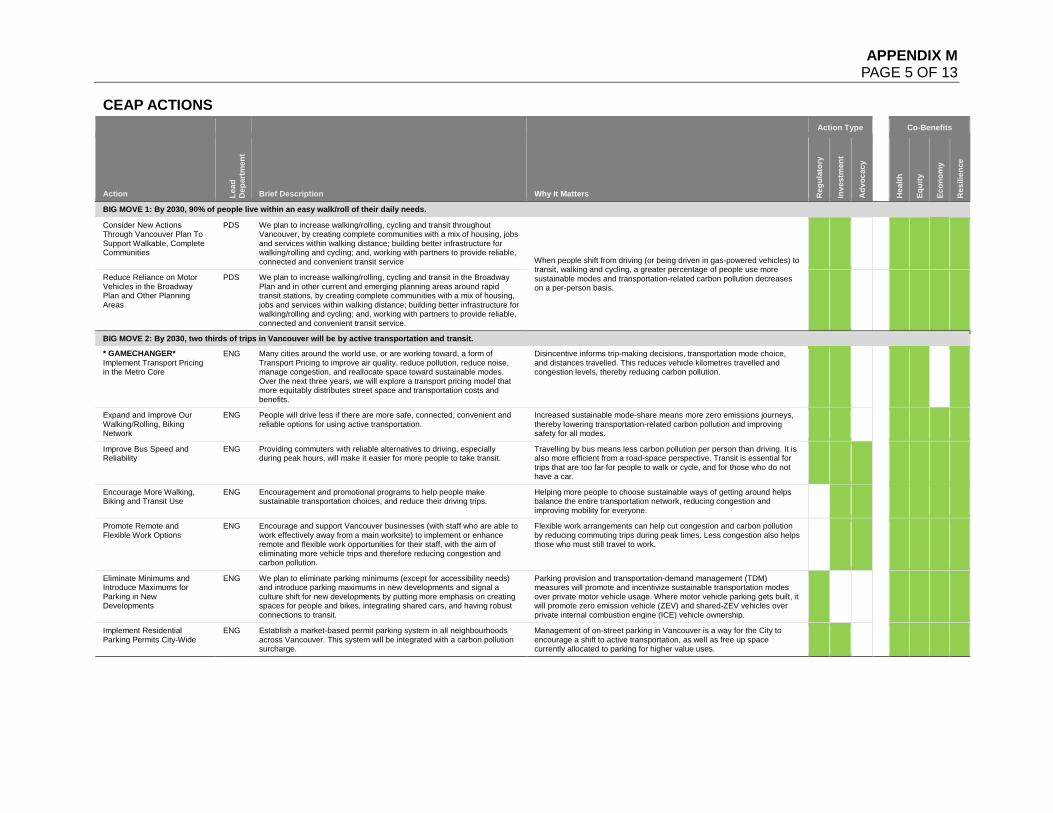
APPENDIX M PAGE 5 OF 13
CEAP ACTIONS
Action Type Co-Benefits
Action Lead
D
epar
tmen
t
Brief Description Why It Matters Reg
ulat
ory
Inve
stm
ent
Adv
ocac
y
Hea
lth
Equi
ty
Econ
omy
Res
ilien
ce
BIG MOVE 1: By 2030, 90% of people live within an easy walk/roll of their daily needs.
Consider New Actions Through Vancouver Plan To Support Walkable, Complete Communities
PDS We plan to increase walking/rolling, cycling and transit throughout Vancouver, by creating complete communities with a mix of housing, jobs and services within walking distance; building better infrastructure for walking/rolling and cycling; and, working with partners to provide reliable, connected and convenient transit service When people shift from driving (or being driven in gas-powered vehicles) to
transit, walking and cycling, a greater percentage of people use more sustainable modes and transportation-related carbon pollution decreases on a per-person basis.
Reduce Reliance on Motor Vehicles in the Broadway Plan and Other Planning Areas
PDS We plan to increase walking/rolling, cycling and transit in the Broadway Plan and in other current and emerging planning areas around rapid transit stations, by creating complete communities with a mix of housing, jobs and services within walking distance; building better infrastructure for walking/rolling and cycling; and, working with partners to provide reliable, connected and convenient transit service.
y y y
BIG MOVE 2: By 2030, two thirds of trips in Vancouver will be by active transportation and transit.
* GAMECHANGER* Implement Transport Pricing in the Metro Core
ENG Many cities around the world use, or are working toward, a form of Transport Pricing to improve air quality, reduce pollution, reduce noise, manage congestion, and reallocate space toward sustainable modes. Over the next three years, we will explore a transport pricing model that more equitably distributes street space and transportation costs and benefits.
Disincentive informs trip-making decisions, transportation mode choice, and distances travelled. This reduces vehicle kilometres travelled and congestion levels, thereby reducing carbon pollution.
y y y
Expand and Improve Our Walking/Rolling, Biking Network
ENG People will drive less if there are more safe, connected, convenient and reliable options for using active transportation.
Increased sustainable mode-share means more zero emissions journeys, thereby lowering transportation-related carbon pollution and improving safety for all modes.
y y y y
Improve Bus Speed and Reliability
ENG Providing commuters with reliable alternatives to driving, especially during peak hours, will make it easier for more people to take transit.
Travelling by bus means less carbon pollution per person than driving. It is also more efficient from a road-space perspective. Transit is essential for trips that are too far for people to walk or cycle, and for those who do not have a car.
y y Y y
Encourage More Walking, Biking and Transit Use
ENG Encouragement and promotional programs to help people make sustainable transportation choices, and reduce their driving trips.
Helping more people to choose sustainable ways of getting around helps balance the entire transportation network, reducing congestion and improving mobility for everyone.
y y Y Y
Promote Remote and Flexible Work Options
ENG Encourage and support Vancouver businesses (with staff who are able to work effectively away from a main worksite) to implement or enhance remote and flexible work opportunities for their staff, with the aim of eliminating more vehicle trips and therefore reducing congestion and carbon pollution.
Flexible work arrangements can help cut congestion and carbon pollution by reducing commuting trips during peak times. Less congestion also helps those who must still travel to work.
Eliminate Minimums and Introduce Maximums for Parking in New Developments
ENG We plan to eliminate parking minimums (except for accessibility needs) and introduce parking maximums in new developments and signal a culture shift for new developments by putting more emphasis on creating spaces for people and bikes, integrating shared cars, and having robust connections to transit.
Parking provision and transportation-demand management (TDM) measures will promote and incentivize sustainable transportation modes over private motor vehicle usage. Where motor vehicle parking gets built, it will promote zero emission vehicle (ZEV) and shared-ZEV vehicles over private internal combustion engine (ICE) vehicle ownership.
y y y y
Implement Residential Parking Permits City-Wide
ENG Establish a market-based permit parking system in all neighbourhoods across Vancouver. This system will be integrated with a carbon pollution surcharge.
Management of on-street parking in Vancouver is a way for the City to encourage a shift to active transportation, as well as free up space currently allocated to parking for higher value uses.
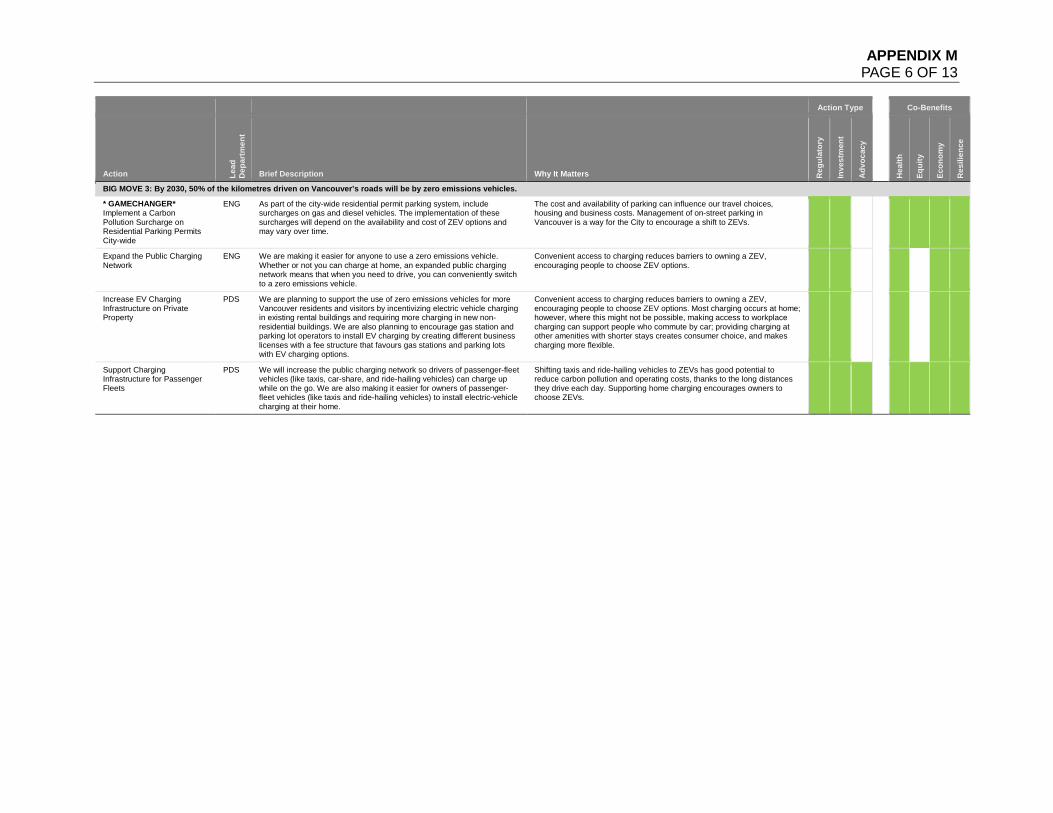
APPENDIX M PAGE 6 OF 13
Action Type Co-Benefits
Action Lead
D
epar
tmen
t
Brief Description Why It Matters Reg
ulat
ory
Inve
stm
ent
Adv
ocac
y
Hea
lth
Equi
ty
Econ
omy
Res
ilien
ce
BIG MOVE 3: By 2030, 50% of the kilometres driven on Vancouver’s roads will be by zero emissions vehicles.
* GAMECHANGER* Implement a Carbon Pollution Surcharge on Residential Parking Permits City-wide
ENG As part of the city-wide residential permit parking system, include surcharges on gas and diesel vehicles. The implementation of these surcharges will depend on the availability and cost of ZEV options and may vary over time.
The cost and availability of parking can influence our travel choices, housing and business costs. Management of on-street parking in Vancouver is a way for the City to encourage a shift to ZEVs.
y y y y
Expand the Public Charging Network
ENG We are making it easier for anyone to use a zero emissions vehicle. Whether or not you can charge at home, an expanded public charging network means that when you need to drive, you can conveniently switch to a zero emissions vehicle.
Convenient access to charging reduces barriers to owning a ZEV, encouraging people to choose ZEV options.
y y y
Increase EV Charging Infrastructure on Private Property
PDS We are planning to support the use of zero emissions vehicles for more Vancouver residents and visitors by incentivizing electric vehicle charging in existing rental buildings and requiring more charging in new non-residential buildings. We are also planning to encourage gas station and parking lot operators to install EV charging by creating different business licenses with a fee structure that favours gas stations and parking lots with EV charging options.
Convenient access to charging reduces barriers to owning a ZEV, encouraging people to choose ZEV options. Most charging occurs at home; however, where this might not be possible, making access to workplace charging can support people who commute by car; providing charging at other amenities with shorter stays creates consumer choice, and makes charging more flexible.
y y y
Support Charging Infrastructure for Passenger Fleets
PDS We will increase the public charging network so drivers of passenger-fleet vehicles (like taxis, car-share, and ride-hailing vehicles) can charge up while on the go. We are also making it easier for owners of passenger-fleet vehicles (like taxis and ride-hailing vehicles) to install electric-vehicle charging at their home.
Shifting taxis and ride-hailing vehicles to ZEVs has good potential to reduce carbon pollution and operating costs, thanks to the long distances they drive each day. Supporting home charging encourages owners to choose ZEVs.
y y
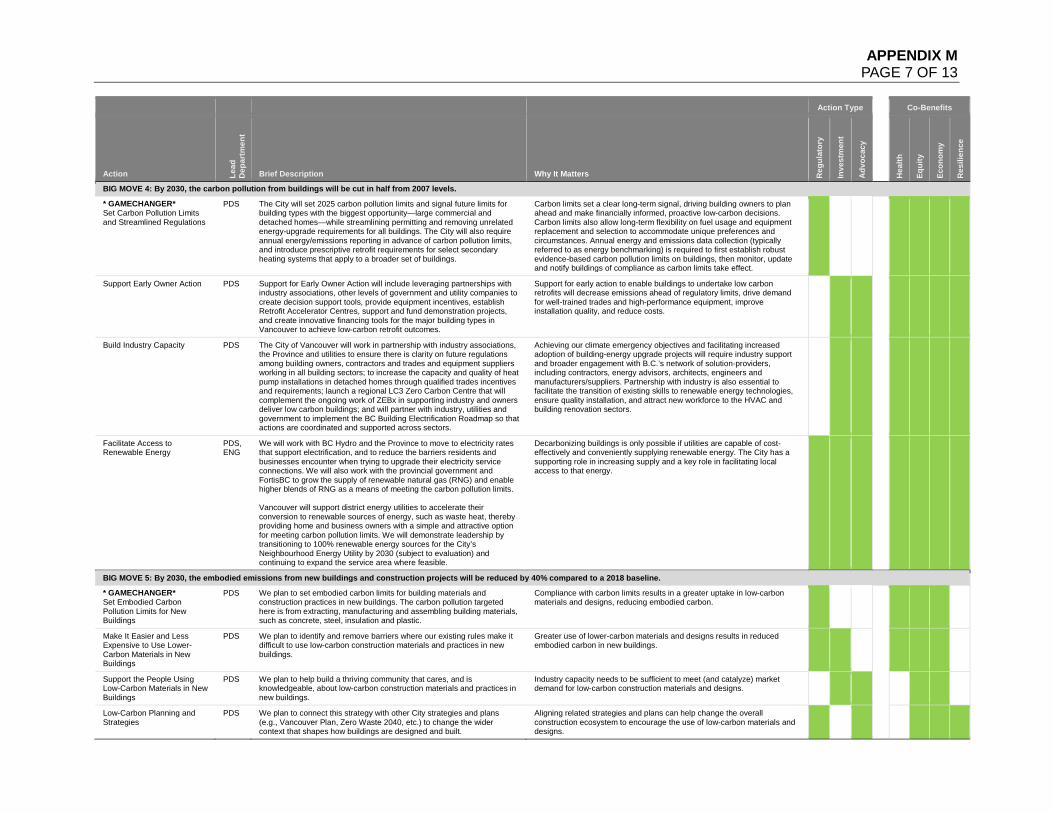
APPENDIX M PAGE 7 OF 13
Action Type Co-Benefits
Action Lead
D
epar
tmen
t
Brief Description Why It Matters Reg
ulat
ory
Inve
stm
ent
Adv
ocac
y
Hea
lth
Equi
ty
Econ
omy
Res
ilien
ce
BIG MOVE 4: By 2030, the carbon pollution from buildings will be cut in half from 2007 levels.
* GAMECHANGER* Set Carbon Pollution Limits and Streamlined Regulations
PDS The City will set 2025 carbon pollution limits and signal future limits for building types with the biggest opportunity—large commercial and detached homes—while streamlining permitting and removing unrelated energy-upgrade requirements for all buildings. The City will also require annual energy/emissions reporting in advance of carbon pollution limits, and introduce prescriptive retrofit requirements for select secondary heating systems that apply to a broader set of buildings.
Carbon limits set a clear long-term signal, driving building owners to plan ahead and make financially informed, proactive low-carbon decisions. Carbon limits also allow long-term flexibility on fuel usage and equipment replacement and selection to accommodate unique preferences and circumstances. Annual energy and emissions data collection (typically referred to as energy benchmarking) is required to first establish robust evidence-based carbon pollution limits on buildings, then monitor, update and notify buildings of compliance as carbon limits take effect.
y y y
Support Early Owner Action PDS Support for Early Owner Action will include leveraging partnerships with industry associations, other levels of government and utility companies to create decision support tools, provide equipment incentives, establish Retrofit Accelerator Centres, support and fund demonstration projects, and create innovative financing tools for the major building types in Vancouver to achieve low-carbon retrofit outcomes.
Support for early action to enable buildings to undertake low carbon retrofits will decrease emissions ahead of regulatory limits, drive demand for well-trained trades and high-performance equipment, improve installation quality, and reduce costs.
Build Industry Capacity PDS The City of Vancouver will work in partnership with industry associations, the Province and utilities to ensure there is clarity on future regulations among building owners, contractors and trades and equipment suppliers working in all building sectors; to increase the capacity and quality of heat pump installations in detached homes through qualified trades incentives and requirements; launch a regional LC3 Zero Carbon Centre that will complement the ongoing work of ZEBx in supporting industry and owners deliver low carbon buildings; and will partner with industry, utilities and government to implement the BC Building Electrification Roadmap so that actions are coordinated and supported across sectors.
Achieving our climate emergency objectives and facilitating increased adoption of building-energy upgrade projects will require industry support and broader engagement with B.C.’s network of solution-providers, including contractors, energy advisors, architects, engineers and manufacturers/suppliers. Partnership with industry is also essential to facilitate the transition of existing skills to renewable energy technologies, ensure quality installation, and attract new workforce to the HVAC and building renovation sectors.
y y
Facilitate Access to Renewable Energy
PDS, ENG
We will work with BC Hydro and the Province to move to electricity rates that support electrification, and to reduce the barriers residents and businesses encounter when trying to upgrade their electricity service connections. We will also work with the provincial government and FortisBC to grow the supply of renewable natural gas (RNG) and enable higher blends of RNG as a means of meeting the carbon pollution limits. Vancouver will support district energy utilities to accelerate their conversion to renewable sources of energy, such as waste heat, thereby providing home and business owners with a simple and attractive option for meeting carbon pollution limits. We will demonstrate leadership by transitioning to 100% renewable energy sources for the City’s Neighbourhood Energy Utility by 2030 (subject to evaluation) and continuing to expand the service area where feasible.
Decarbonizing buildings is only possible if utilities are capable of cost-effectively and conveniently supplying renewable energy. The City has a supporting role in increasing supply and a key role in facilitating local access to that energy.
y
BIG MOVE 5: By 2030, the embodied emissions from new buildings and construction projects will be reduced by 40% compared to a 2018 baseline.
* GAMECHANGER* Set Embodied Carbon Pollution Limits for New Buildings
PDS We plan to set embodied carbon limits for building materials and construction practices in new buildings. The carbon pollution targeted here is from extracting, manufacturing and assembling building materials, such as concrete, steel, insulation and plastic.
Compliance with carbon limits results in a greater uptake in low-carbon materials and designs, reducing embodied carbon.
y y
Make It Easier and Less Expensive to Use Lower-Carbon Materials in New Buildings
PDS We plan to identify and remove barriers where our existing rules make it difficult to use low-carbon construction materials and practices in new buildings.
Greater use of lower-carbon materials and designs results in reduced embodied carbon in new buildings.
y y
Support the People Using Low-Carbon Materials in New Buildings
PDS We plan to help build a thriving community that cares, and is knowledgeable, about low-carbon construction materials and practices in new buildings.
Industry capacity needs to be sufficient to meet (and catalyze) market demand for low-carbon construction materials and designs.
y y
Low-Carbon Planning and Strategies
PDS We plan to connect this strategy with other City strategies and plans (e.g., Vancouver Plan, Zero Waste 2040, etc.) to change the wider context that shapes how buildings are designed and built.
Aligning related strategies and plans can help change the overall construction ecosystem to encourage the use of low-carbon materials and designs.
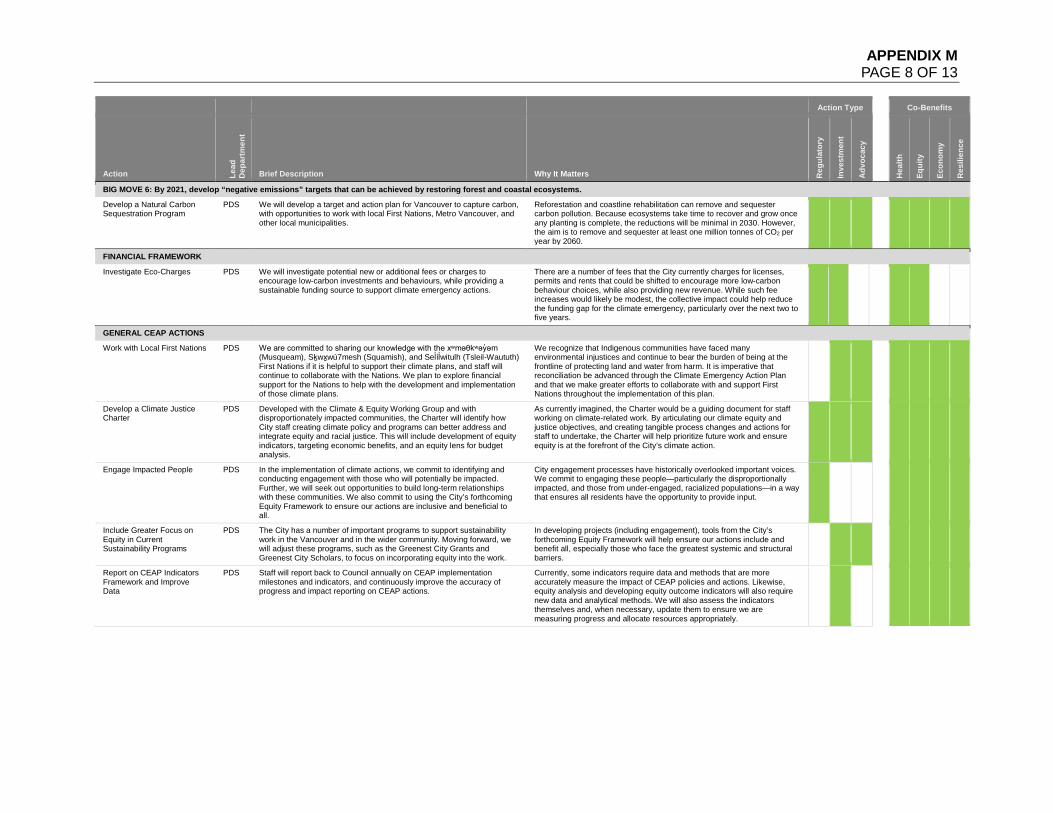
APPENDIX M PAGE 8 OF 13
Action Type Co-Benefits
Action Lead
D
epar
tmen
t
Brief Description Why It Matters Reg
ulat
ory
Inve
stm
ent
Adv
ocac
y
Hea
lth
Equi
ty
Econ
omy
Res
ilien
ce
BIG MOVE 6: By 2021, develop “negative emissions” targets that can be achieved by restoring forest and coastal ecosystems.
Develop a Natural Carbon Sequestration Program
PDS We will develop a target and action plan for Vancouver to capture carbon, with opportunities to work with local First Nations, Metro Vancouver, and other local municipalities.
Reforestation and coastline rehabilitation can remove and sequester carbon pollution. Because ecosystems take time to recover and grow once any planting is complete, the reductions will be minimal in 2030. However, the aim is to remove and sequester at least one million tonnes of CO2 per year by 2060.
y y y y y
y y
FINANCIAL FRAMEWORK
Investigate Eco-Charges PDS We will investigate potential new or additional fees or charges to encourage low-carbon investments and behaviours, while providing a sustainable funding source to support climate emergency actions.
There are a number of fees that the City currently charges for licenses, permits and rents that could be shifted to encourage more low-carbon behaviour choices, while also providing new revenue. While such fee increases would likely be modest, the collective impact could help reduce the funding gap for the climate emergency, particularly over the next two to five years.
y y y y
GENERAL CEAP ACTIONS
Work with Local First Nations PDS We are committed to sharing our knowledge with the xʷməθkʷəy̓əm (Musqueam), Sḵwx̱wú7mesh (Squamish), and Sel̓íl̓witulh (Tsleil-Waututh) First Nations if it is helpful to support their climate plans, and staff will continue to collaborate with the Nations. We plan to explore financial support for the Nations to help with the development and implementation of those climate plans.
We recognize that Indigenous communities have faced many environmental injustices and continue to bear the burden of being at the frontline of protecting land and water from harm. It is imperative that reconciliation be advanced through the Climate Emergency Action Plan and that we make greater efforts to collaborate with and support First Nations throughout the implementation of this plan.
Develop a Climate Justice Charter
PDS Developed with the Climate & Equity Working Group and with disproportionately impacted communities, the Charter will identify how City staff creating climate policy and programs can better address and integrate equity and racial justice. This will include development of equity indicators, targeting economic benefits, and an equity lens for budget analysis.
As currently imagined, the Charter would be a guiding document for staff working on climate-related work. By articulating our climate equity and justice objectives, and creating tangible process changes and actions for staff to undertake, the Charter will help prioritize future work and ensure equity is at the forefront of the City’s climate action.
Engage Impacted People PDS In the implementation of climate actions, we commit to identifying and conducting engagement with those who will potentially be impacted. Further, we will seek out opportunities to build long-term relationships with these communities. We also commit to using the City’s forthcoming Equity Framework to ensure our actions are inclusive and beneficial to all.
City engagement processes have historically overlooked important voices. We commit to engaging these people—particularly the disproportionally impacted, and those from under-engaged, racialized populations—in a way that ensures all residents have the opportunity to provide input.
Include Greater Focus on Equity in Current Sustainability Programs
PDS The City has a number of important programs to support sustainability work in the Vancouver and in the wider community. Moving forward, we will adjust these programs, such as the Greenest City Grants and Greenest City Scholars, to focus on incorporating equity into the work.
In developing projects (including engagement), tools from the City’s forthcoming Equity Framework will help ensure our actions include and benefit all, especially those who face the greatest systemic and structural barriers.
Report on CEAP Indicators Framework and Improve Data
PDS Staff will report back to Council annually on CEAP implementation milestones and indicators, and continuously improve the accuracy of progress and impact reporting on CEAP actions.
Currently, some indicators require data and methods that are more accurately measure the impact of CEAP policies and actions. Likewise, equity analysis and developing equity outcome indicators will also require new data and analytical methods. We will also assess the indicators themselves and, when necessary, update them to ensure we are measuring progress and allocate resources appropriately.
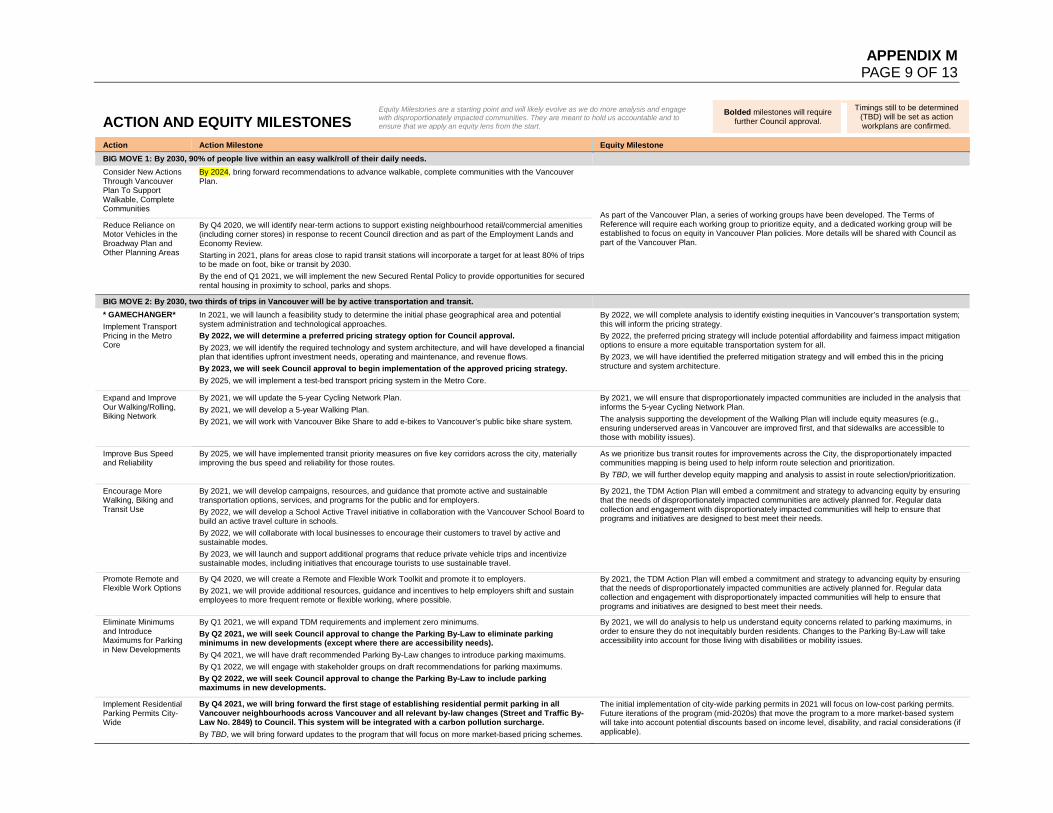
APPENDIX M PAGE 9 OF 13
ACTION AND EQUITY MILESTONES Equity Milestones are a starting point and will likely evolve as we do more analysis and engage with disproportionately impacted communities. They are meant to hold us accountable and to ensure that we apply an equity lens from the start.
Bolded milestones will require further Council approval.
Timings still to be determined (TBD) will be set as action workplans are confirmed.
Action Action Milestone Equity Milestone BIG MOVE 1: By 2030, 90% of people live within an easy walk/roll of their daily needs. Consider New Actions Through Vancouver Plan To Support Walkable, Complete Communities
By 2024, bring forward recommendations to advance walkable, complete communities with the Vancouver Plan.
As part of the Vancouver Plan, a series of working groups have been developed. The Terms of Reference will require each working group to prioritize equity, and a dedicated working group will be established to focus on equity in Vancouver Plan policies. More details will be shared with Council as part of the Vancouver Plan.
Reduce Reliance on Motor Vehicles in the Broadway Plan and Other Planning Areas
By Q4 2020, we will identify near-term actions to support existing neighbourhood retail/commercial amenities (including corner stores) in response to recent Council direction and as part of the Employment Lands and Economy Review. Starting in 2021, plans for areas close to rapid transit stations will incorporate a target for at least 80% of trips to be made on foot, bike or transit by 2030. By the end of Q1 2021, we will implement the new Secured Rental Policy to provide opportunities for secured rental housing in proximity to school, parks and shops.
BIG MOVE 2: By 2030, two thirds of trips in Vancouver will be by active transportation and transit. * GAMECHANGER* Implement Transport Pricing in the Metro Core
In 2021, we will launch a feasibility study to determine the initial phase geographical area and potential system administration and technological approaches. By 2022, we will determine a preferred pricing strategy option for Council approval. By 2023, we will identify the required technology and system architecture, and will have developed a financial plan that identifies upfront investment needs, operating and maintenance, and revenue flows. By 2023, we will seek Council approval to begin implementation of the approved pricing strategy. By 2025, we will implement a test-bed transport pricing system in the Metro Core.
By 2022, we will complete analysis to identify existing inequities in Vancouver’s transportation system; this will inform the pricing strategy. By 2022, the preferred pricing strategy will include potential affordability and fairness impact mitigation options to ensure a more equitable transportation system for all. By 2023, we will have identified the preferred mitigation strategy and will embed this in the pricing structure and system architecture.
Expand and Improve Our Walking/Rolling, Biking Network
By 2021, we will update the 5-year Cycling Network Plan. By 2021, we will develop a 5-year Walking Plan. By 2021, we will work with Vancouver Bike Share to add e-bikes to Vancouver’s public bike share system.
By 2021, we will ensure that disproportionately impacted communities are included in the analysis that informs the 5-year Cycling Network Plan. The analysis supporting the development of the Walking Plan will include equity measures (e.g., ensuring underserved areas in Vancouver are improved first, and that sidewalks are accessible to those with mobility issues).
Improve Bus Speed and Reliability
By 2025, we will have implemented transit priority measures on five key corridors across the city, materially improving the bus speed and reliability for those routes.
As we prioritize bus transit routes for improvements across the City, the disproportionately impacted communities mapping is being used to help inform route selection and prioritization. By TBD, we will further develop equity mapping and analysis to assist in route selection/prioritization.
Encourage More Walking, Biking and Transit Use
By 2021, we will develop campaigns, resources, and guidance that promote active and sustainable transportation options, services, and programs for the public and for employers. By 2022, we will develop a School Active Travel initiative in collaboration with the Vancouver School Board to build an active travel culture in schools. By 2022, we will collaborate with local businesses to encourage their customers to travel by active and sustainable modes. By 2023, we will launch and support additional programs that reduce private vehicle trips and incentivize sustainable modes, including initiatives that encourage tourists to use sustainable travel.
By 2021, the TDM Action Plan will embed a commitment and strategy to advancing equity by ensuring that the needs of disproportionately impacted communities are actively planned for. Regular data collection and engagement with disproportionately impacted communities will help to ensure that programs and initiatives are designed to best meet their needs.
Promote Remote and Flexible Work Options
By Q4 2020, we will create a Remote and Flexible Work Toolkit and promote it to employers. By 2021, we will provide additional resources, guidance and incentives to help employers shift and sustain employees to more frequent remote or flexible working, where possible.
By 2021, the TDM Action Plan will embed a commitment and strategy to advancing equity by ensuring that the needs of disproportionately impacted communities are actively planned for. Regular data collection and engagement with disproportionately impacted communities will help to ensure that programs and initiatives are designed to best meet their needs.
Eliminate Minimums and Introduce Maximums for Parking in New Developments
By Q1 2021, we will expand TDM requirements and implement zero minimums. By Q2 2021, we will seek Council approval to change the Parking By-Law to eliminate parking minimums in new developments (except where there are accessibility needs). By Q4 2021, we will have draft recommended Parking By-Law changes to introduce parking maximums. By Q1 2022, we will engage with stakeholder groups on draft recommendations for parking maximums. By Q2 2022, we will seek Council approval to change the Parking By-Law to include parking maximums in new developments.
By 2021, we will do analysis to help us understand equity concerns related to parking maximums, in order to ensure they do not inequitably burden residents. Changes to the Parking By-Law will take accessibility into account for those living with disabilities or mobility issues.
Implement Residential Parking Permits City-Wide
By Q4 2021, we will bring forward the first stage of establishing residential permit parking in all Vancouver neighbourhoods across Vancouver and all relevant by-law changes (Street and Traffic By-Law No. 2849) to Council. This system will be integrated with a carbon pollution surcharge. By TBD, we will bring forward updates to the program that will focus on more market-based pricing schemes.
The initial implementation of city-wide parking permits in 2021 will focus on low-cost parking permits. Future iterations of the program (mid-2020s) that move the program to a more market-based system will take into account potential discounts based on income level, disability, and racial considerations (if applicable).
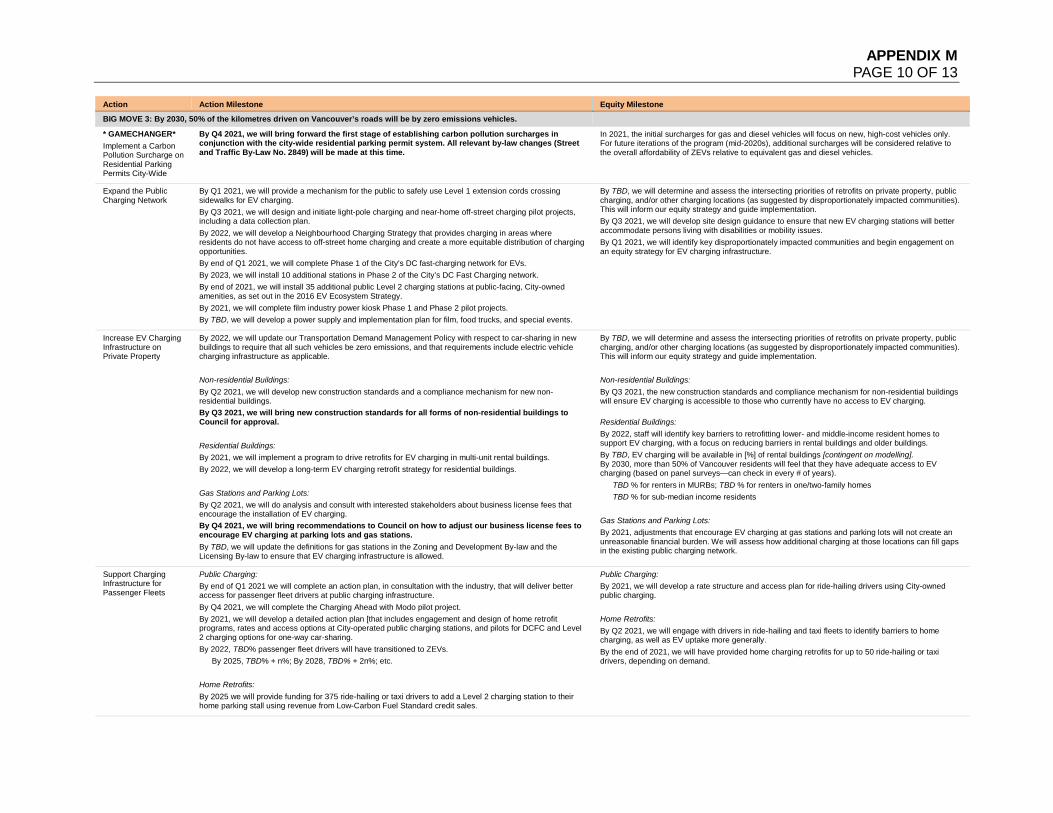
APPENDIX M PAGE 10 OF 13
Action Action Milestone Equity Milestone
BIG MOVE 3: By 2030, 50% of the kilometres driven on Vancouver’s roads will be by zero emissions vehicles. * GAMECHANGER* Implement a Carbon Pollution Surcharge on Residential Parking Permits City-Wide
By Q4 2021, we will bring forward the first stage of establishing carbon pollution surcharges in conjunction with the city-wide residential parking permit system. All relevant by-law changes (Street and Traffic By-Law No. 2849) will be made at this time.
In 2021, the initial surcharges for gas and diesel vehicles will focus on new, high-cost vehicles only. For future iterations of the program (mid-2020s), additional surcharges will be considered relative to the overall affordability of ZEVs relative to equivalent gas and diesel vehicles.
Expand the Public Charging Network
By Q1 2021, we will provide a mechanism for the public to safely use Level 1 extension cords crossing sidewalks for EV charging. By Q3 2021, we will design and initiate light-pole charging and near-home off-street charging pilot projects, including a data collection plan. By 2022, we will develop a Neighbourhood Charging Strategy that provides charging in areas where residents do not have access to off-street home charging and create a more equitable distribution of charging opportunities. By end of Q1 2021, we will complete Phase 1 of the City's DC fast-charging network for EVs. By 2023, we will install 10 additional stations in Phase 2 of the City’s DC Fast Charging network. By end of 2021, we will install 35 additional public Level 2 charging stations at public-facing, City-owned amenities, as set out in the 2016 EV Ecosystem Strategy. By 2021, we will complete film industry power kiosk Phase 1 and Phase 2 pilot projects. By TBD, we will develop a power supply and implementation plan for film, food trucks, and special events.
By TBD, we will determine and assess the intersecting priorities of retrofits on private property, public charging, and/or other charging locations (as suggested by disproportionately impacted communities). This will inform our equity strategy and guide implementation. By Q3 2021, we will develop site design guidance to ensure that new EV charging stations will better accommodate persons living with disabilities or mobility issues. By Q1 2021, we will identify key disproportionately impacted communities and begin engagement on an equity strategy for EV charging infrastructure.
Increase EV Charging Infrastructure on Private Property
By 2022, we will update our Transportation Demand Management Policy with respect to car-sharing in new buildings to require that all such vehicles be zero emissions, and that requirements include electric vehicle charging infrastructure as applicable. Non-residential Buildings: By Q2 2021, we will develop new construction standards and a compliance mechanism for new non-residential buildings. By Q3 2021, we will bring new construction standards for all forms of non-residential buildings to Council for approval. Residential Buildings: By 2021, we will implement a program to drive retrofits for EV charging in multi-unit rental buildings. By 2022, we will develop a long-term EV charging retrofit strategy for residential buildings. Gas Stations and Parking Lots: By Q2 2021, we will do analysis and consult with interested stakeholders about business license fees that encourage the installation of EV charging. By Q4 2021, we will bring recommendations to Council on how to adjust our business license fees to encourage EV charging at parking lots and gas stations. By TBD, we will update the definitions for gas stations in the Zoning and Development By-law and the Licensing By-law to ensure that EV charging infrastructure is allowed.
By TBD, we will determine and assess the intersecting priorities of retrofits on private property, public charging, and/or other charging locations (as suggested by disproportionately impacted communities). This will inform our equity strategy and guide implementation. Non-residential Buildings: By Q3 2021, the new construction standards and compliance mechanism for non-residential buildings will ensure EV charging is accessible to those who currently have no access to EV charging. Residential Buildings: By 2022, staff will identify key barriers to retrofitting lower- and middle-income resident homes to support EV charging, with a focus on reducing barriers in rental buildings and older buildings. By TBD, EV charging will be available in [%] of rental buildings [contingent on modelling]. By 2030, more than 50% of Vancouver residents will feel that they have adequate access to EV charging (based on panel surveys—can check in every # of years).
TBD % for renters in MURBs; TBD % for renters in one/two-family homes TBD % for sub-median income residents
Gas Stations and Parking Lots: By 2021, adjustments that encourage EV charging at gas stations and parking lots will not create an unreasonable financial burden. We will assess how additional charging at those locations can fill gaps in the existing public charging network.
Support Charging Infrastructure for Passenger Fleets
Public Charging: By end of Q1 2021 we will complete an action plan, in consultation with the industry, that will deliver better access for passenger fleet drivers at public charging infrastructure. By Q4 2021, we will complete the Charging Ahead with Modo pilot project. By 2021, we will develop a detailed action plan [that includes engagement and design of home retrofit programs, rates and access options at City-operated public charging stations, and pilots for DCFC and Level 2 charging options for one-way car-sharing. By 2022, TBD% passenger fleet drivers will have transitioned to ZEVs.
By 2025, TBD% + n%; By 2028, TBD% + 2n%; etc. Home Retrofits: By 2025 we will provide funding for 375 ride-hailing or taxi drivers to add a Level 2 charging station to their home parking stall using revenue from Low-Carbon Fuel Standard credit sales.
Public Charging: By 2021, we will develop a rate structure and access plan for ride-hailing drivers using City-owned public charging. Home Retrofits: By Q2 2021, we will engage with drivers in ride-hailing and taxi fleets to identify barriers to home charging, as well as EV uptake more generally. By the end of 2021, we will have provided home charging retrofits for up to 50 ride-hailing or taxi drivers, depending on demand.
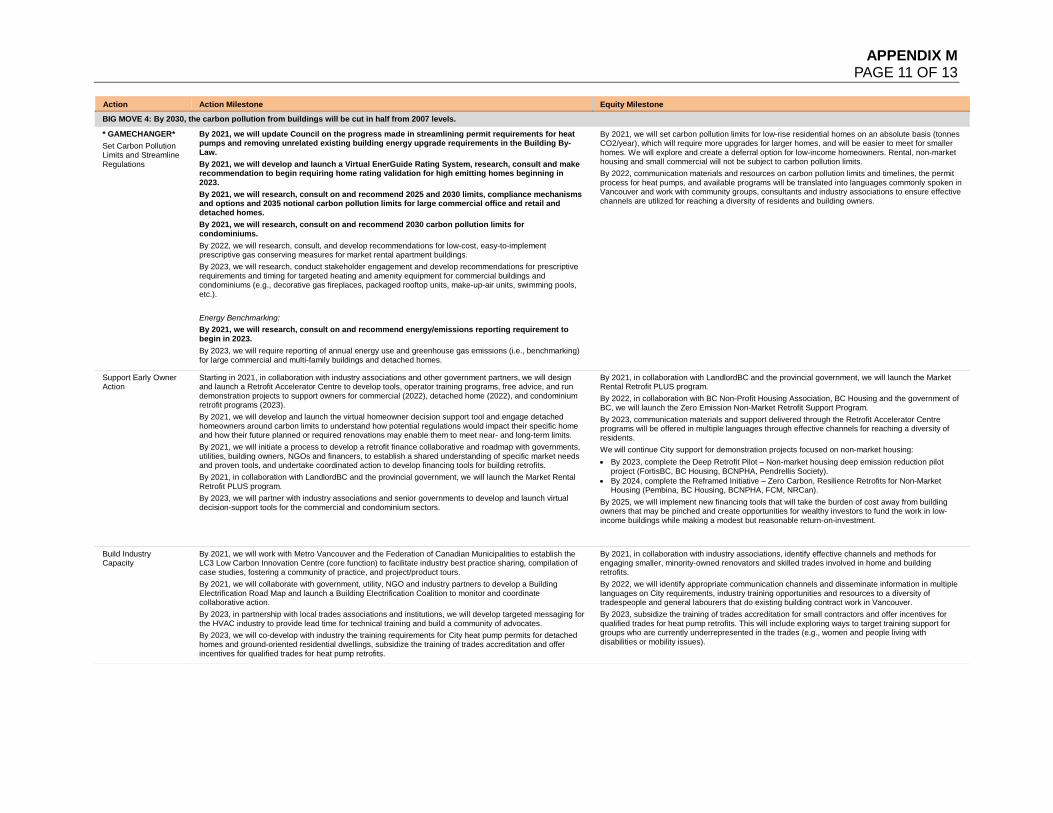
APPENDIX M PAGE 11 OF 13
Action Action Milestone Equity Milestone
BIG MOVE 4: By 2030, the carbon pollution from buildings will be cut in half from 2007 levels.
* GAMECHANGER* Set Carbon Pollution Limits and Streamline Regulations
By 2021, we will update Council on the progress made in streamlining permit requirements for heat pumps and removing unrelated existing building energy upgrade requirements in the Building By-Law. By 2021, we will develop and launch a Virtual EnerGuide Rating System, research, consult and make recommendation to begin requiring home rating validation for high emitting homes beginning in 2023. By 2021, we will research, consult on and recommend 2025 and 2030 limits, compliance mechanisms and options and 2035 notional carbon pollution limits for large commercial office and retail and detached homes. By 2021, we will research, consult on and recommend 2030 carbon pollution limits for condominiums. By 2022, we will research, consult, and develop recommendations for low-cost, easy-to-implement prescriptive gas conserving measures for market rental apartment buildings. By 2023, we will research, conduct stakeholder engagement and develop recommendations for prescriptive requirements and timing for targeted heating and amenity equipment for commercial buildings and condominiums (e.g., decorative gas fireplaces, packaged rooftop units, make-up-air units, swimming pools, etc.). Energy Benchmarking: By 2021, we will research, consult on and recommend energy/emissions reporting requirement to begin in 2023. By 2023, we will require reporting of annual energy use and greenhouse gas emissions (i.e., benchmarking) for large commercial and multi-family buildings and detached homes.
By 2021, we will set carbon pollution limits for low-rise residential homes on an absolute basis (tonnes CO2/year), which will require more upgrades for larger homes, and will be easier to meet for smaller homes. We will explore and create a deferral option for low-income homeowners. Rental, non-market housing and small commercial will not be subject to carbon pollution limits. By 2022, communication materials and resources on carbon pollution limits and timelines, the permit process for heat pumps, and available programs will be translated into languages commonly spoken in Vancouver and work with community groups, consultants and industry associations to ensure effective channels are utilized for reaching a diversity of residents and building owners.
Support Early Owner Action
Starting in 2021, in collaboration with industry associations and other government partners, we will design and launch a Retrofit Accelerator Centre to develop tools, operator training programs, free advice, and run demonstration projects to support owners for commercial (2022), detached home (2022), and condominium retrofit programs (2023). By 2021, we will develop and launch the virtual homeowner decision support tool and engage detached homeowners around carbon limits to understand how potential regulations would impact their specific home and how their future planned or required renovations may enable them to meet near- and long-term limits. By 2021, we will initiate a process to develop a retrofit finance collaborative and roadmap with governments, utilities, building owners, NGOs and financers, to establish a shared understanding of specific market needs and proven tools, and undertake coordinated action to develop financing tools for building retrofits. By 2021, in collaboration with LandlordBC and the provincial government, we will launch the Market Rental Retrofit PLUS program. By 2023, we will partner with industry associations and senior governments to develop and launch virtual decision-support tools for the commercial and condominium sectors.
By 2021, in collaboration with LandlordBC and the provincial government, we will launch the Market Rental Retrofit PLUS program. By 2022, in collaboration with BC Non-Profit Housing Association, BC Housing and the government of BC, we will launch the Zero Emission Non-Market Retrofit Support Program. By 2023, communication materials and support delivered through the Retrofit Accelerator Centre programs will be offered in multiple languages through effective channels for reaching a diversity of residents. We will continue City support for demonstration projects focused on non-market housing: • By 2023, complete the Deep Retrofit Pilot – Non-market housing deep emission reduction pilot
project (FortisBC, BC Housing, BCNPHA, Pendrellis Society). • By 2024, complete the Reframed Initiative – Zero Carbon, Resilience Retrofits for Non-Market
Housing (Pembina, BC Housing, BCNPHA, FCM, NRCan). By 2025, we will implement new financing tools that will take the burden of cost away from building owners that may be pinched and create opportunities for wealthy investors to fund the work in low-income buildings while making a modest but reasonable return-on-investment.
Build Industry Capacity
By 2021, we will work with Metro Vancouver and the Federation of Canadian Municipalities to establish the LC3 Low Carbon Innovation Centre (core function) to facilitate industry best practice sharing, compilation of case studies, fostering a community of practice, and project/product tours. By 2021, we will collaborate with government, utility, NGO and industry partners to develop a Building Electrification Road Map and launch a Building Electrification Coalition to monitor and coordinate collaborative action. By 2023, in partnership with local trades associations and institutions, we will develop targeted messaging for the HVAC industry to provide lead time for technical training and build a community of advocates. By 2023, we will co-develop with industry the training requirements for City heat pump permits for detached homes and ground-oriented residential dwellings, subsidize the training of trades accreditation and offer incentives for qualified trades for heat pump retrofits.
By 2021, in collaboration with industry associations, identify effective channels and methods for engaging smaller, minority-owned renovators and skilled trades involved in home and building retrofits. By 2022, we will identify appropriate communication channels and disseminate information in multiple languages on City requirements, industry training opportunities and resources to a diversity of tradespeople and general labourers that do existing building contract work in Vancouver. By 2023, subsidize the training of trades accreditation for small contractors and offer incentives for qualified trades for heat pump retrofits. This will include exploring ways to target training support for groups who are currently underrepresented in the trades (e.g., women and people living with disabilities or mobility issues).
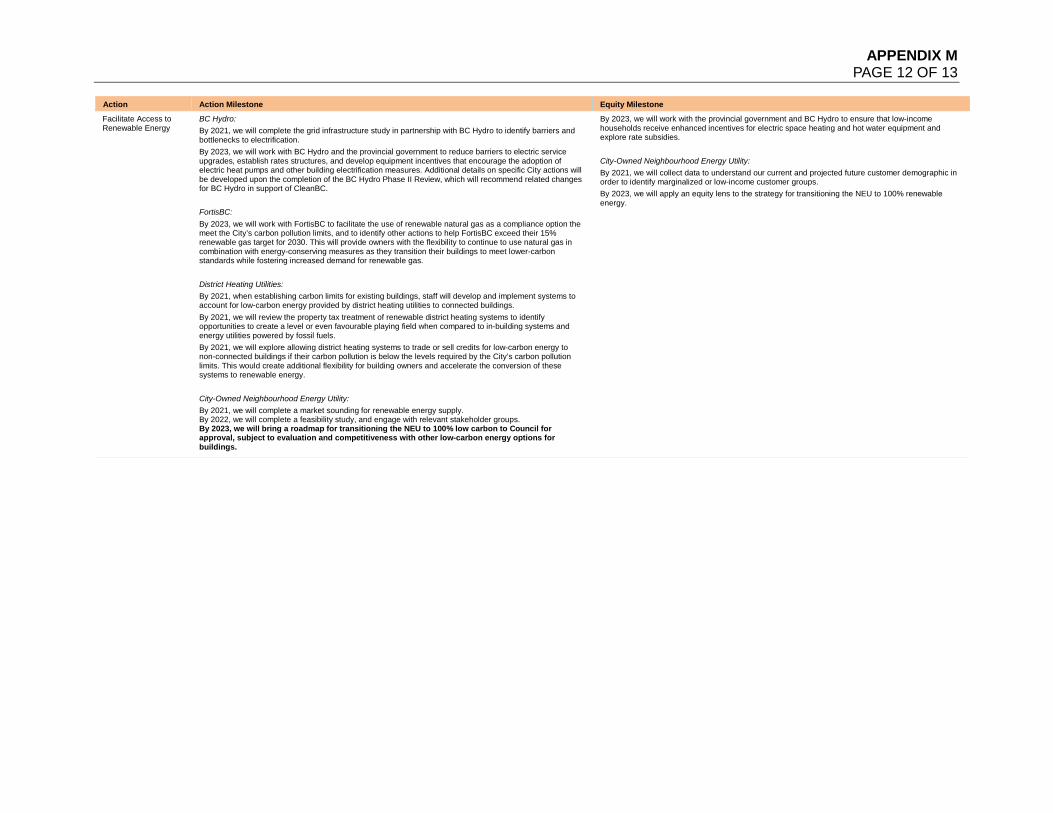
APPENDIX M PAGE 12 OF 13
Action Action Milestone Equity Milestone
Facilitate Access to Renewable Energy
BC Hydro: By 2021, we will complete the grid infrastructure study in partnership with BC Hydro to identify barriers and bottlenecks to electrification. By 2023, we will work with BC Hydro and the provincial government to reduce barriers to electric service upgrades, establish rates structures, and develop equipment incentives that encourage the adoption of electric heat pumps and other building electrification measures. Additional details on specific City actions will be developed upon the completion of the BC Hydro Phase II Review, which will recommend related changes for BC Hydro in support of CleanBC. FortisBC: By 2023, we will work with FortisBC to facilitate the use of renewable natural gas as a compliance option the meet the City’s carbon pollution limits, and to identify other actions to help FortisBC exceed their 15% renewable gas target for 2030. This will provide owners with the flexibility to continue to use natural gas in combination with energy-conserving measures as they transition their buildings to meet lower-carbon standards while fostering increased demand for renewable gas. District Heating Utilities: By 2021, when establishing carbon limits for existing buildings, staff will develop and implement systems to account for low-carbon energy provided by district heating utilities to connected buildings. By 2021, we will review the property tax treatment of renewable district heating systems to identify opportunities to create a level or even favourable playing field when compared to in-building systems and energy utilities powered by fossil fuels. By 2021, we will explore allowing district heating systems to trade or sell credits for low-carbon energy to non-connected buildings if their carbon pollution is below the levels required by the City’s carbon pollution limits. This would create additional flexibility for building owners and accelerate the conversion of these systems to renewable energy. City-Owned Neighbourhood Energy Utility: By 2021, we will complete a market sounding for renewable energy supply. By 2022, we will complete a feasibility study, and engage with relevant stakeholder groups. By 2023, we will bring a roadmap for transitioning the NEU to 100% low carbon to Council for approval, subject to evaluation and competitiveness with other low-carbon energy options for buildings.
By 2023, we will work with the provincial government and BC Hydro to ensure that low-income households receive enhanced incentives for electric space heating and hot water equipment and explore rate subsidies. City-Owned Neighbourhood Energy Utility: By 2021, we will collect data to understand our current and projected future customer demographic in order to identify marginalized or low-income customer groups. By 2023, we will apply an equity lens to the strategy for transitioning the NEU to 100% renewable energy.
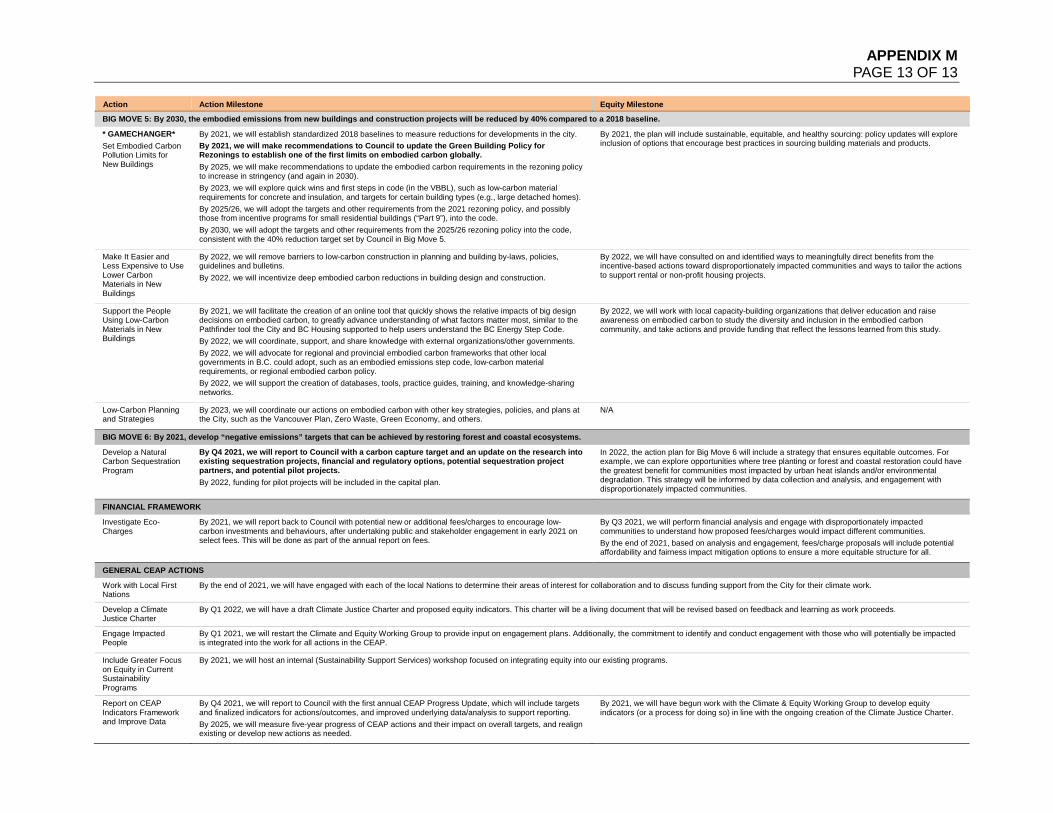
APPENDIX M PAGE 13 OF 13
Action Action Milestone Equity Milestone
BIG MOVE 5: By 2030, the embodied emissions from new buildings and construction projects will be reduced by 40% compared to a 2018 baseline.
* GAMECHANGER* Set Embodied Carbon Pollution Limits for New Buildings
By 2021, we will establish standardized 2018 baselines to measure reductions for developments in the city. By 2021, we will make recommendations to Council to update the Green Building Policy for Rezonings to establish one of the first limits on embodied carbon globally. By 2025, we will make recommendations to update the embodied carbon requirements in the rezoning policy to increase in stringency (and again in 2030). By 2023, we will explore quick wins and first steps in code (in the VBBL), such as low-carbon material requirements for concrete and insulation, and targets for certain building types (e.g., large detached homes). By 2025/26, we will adopt the targets and other requirements from the 2021 rezoning policy, and possibly those from incentive programs for small residential buildings (“Part 9”), into the code. By 2030, we will adopt the targets and other requirements from the 2025/26 rezoning policy into the code, consistent with the 40% reduction target set by Council in Big Move 5.
By 2021, the plan will include sustainable, equitable, and healthy sourcing: policy updates will explore inclusion of options that encourage best practices in sourcing building materials and products.
Make It Easier and Less Expensive to Use Lower Carbon Materials in New Buildings
By 2022, we will remove barriers to low-carbon construction in planning and building by-laws, policies, guidelines and bulletins. By 2022, we will incentivize deep embodied carbon reductions in building design and construction.
By 2022, we will have consulted on and identified ways to meaningfully direct benefits from the incentive-based actions toward disproportionately impacted communities and ways to tailor the actions to support rental or non-profit housing projects.
Support the People Using Low-Carbon Materials in New Buildings
By 2021, we will facilitate the creation of an online tool that quickly shows the relative impacts of big design decisions on embodied carbon, to greatly advance understanding of what factors matter most, similar to the Pathfinder tool the City and BC Housing supported to help users understand the BC Energy Step Code. By 2022, we will coordinate, support, and share knowledge with external organizations/other governments. By 2022, we will advocate for regional and provincial embodied carbon frameworks that other local governments in B.C. could adopt, such as an embodied emissions step code, low-carbon material requirements, or regional embodied carbon policy. By 2022, we will support the creation of databases, tools, practice guides, training, and knowledge-sharing networks.
By 2022, we will work with local capacity-building organizations that deliver education and raise awareness on embodied carbon to study the diversity and inclusion in the embodied carbon community, and take actions and provide funding that reflect the lessons learned from this study.
Low-Carbon Planning and Strategies
By 2023, we will coordinate our actions on embodied carbon with other key strategies, policies, and plans at the City, such as the Vancouver Plan, Zero Waste, Green Economy, and others.
N/A
BIG MOVE 6: By 2021, develop “negative emissions” targets that can be achieved by restoring forest and coastal ecosystems.
Develop a Natural Carbon Sequestration Program
By Q4 2021, we will report to Council with a carbon capture target and an update on the research into existing sequestration projects, financial and regulatory options, potential sequestration project partners, and potential pilot projects. By 2022, funding for pilot projects will be included in the capital plan.
In 2022, the action plan for Big Move 6 will include a strategy that ensures equitable outcomes. For example, we can explore opportunities where tree planting or forest and coastal restoration could have the greatest benefit for communities most impacted by urban heat islands and/or environmental degradation. This strategy will be informed by data collection and analysis, and engagement with disproportionately impacted communities.
FINANCIAL FRAMEWORK
Investigate Eco-Charges
By 2021, we will report back to Council with potential new or additional fees/charges to encourage low-carbon investments and behaviours, after undertaking public and stakeholder engagement in early 2021 on select fees. This will be done as part of the annual report on fees.
By Q3 2021, we will perform financial analysis and engage with disproportionately impacted communities to understand how proposed fees/charges would impact different communities. By the end of 2021, based on analysis and engagement, fees/charge proposals will include potential affordability and fairness impact mitigation options to ensure a more equitable structure for all.
GENERAL CEAP ACTIONS
Work with Local First Nations
By the end of 2021, we will have engaged with each of the local Nations to determine their areas of interest for collaboration and to discuss funding support from the City for their climate work.
Develop a Climate Justice Charter
By Q1 2022, we will have a draft Climate Justice Charter and proposed equity indicators. This charter will be a living document that will be revised based on feedback and learning as work proceeds.
Engage Impacted People
By Q1 2021, we will restart the Climate and Equity Working Group to provide input on engagement plans. Additionally, the commitment to identify and conduct engagement with those who will potentially be impacted is integrated into the work for all actions in the CEAP.
Include Greater Focus on Equity in Current Sustainability Programs
By 2021, we will host an internal (Sustainability Support Services) workshop focused on integrating equity into our existing programs.
Report on CEAP Indicators Framework and Improve Data
By Q4 2021, we will report to Council with the first annual CEAP Progress Update, which will include targets and finalized indicators for actions/outcomes, and improved underlying data/analysis to support reporting. By 2025, we will measure five-year progress of CEAP actions and their impact on overall targets, and realign existing or develop new actions as needed.
By 2021, we will have begun work with the Climate & Equity Working Group to develop equity indicators (or a process for doing so) in line with the ongoing creation of the Climate Justice Charter.
APPENDIX N PAGE 1 OF 11
APPENDIX N: CLIMATE AND EQUITY WORKING GROUP
COUNCIL DIRECTION As part of the Climate Emergency Motion, Council directed staff to:
establish a “Climate and Equity” working group to provide guidance and support for the City’s efforts to transition off of fossil fuels in ways that prioritize those most vulnerable to climate impacts and most in need of support in transitioning to renewable energy.
SELECTION OF PARTICIPANTS The City needs to incorporate reconciliation into all work and needs to have Indigenous voices shape and illuminate what that looks like. Climate Emergency Action Plan development and the opportunity to work together was shared with Musqueam, Squamish and Tsleil-Waututh Nations via Project Referral forms from the City’s Indigenous Relations Manager and through a presentation at the Intergovernmental Relations meeting between staff from Musqueam Indian Band, Squamish Nation, and Tsleil-Waututh Nations' government bodies and staff from the City of Vancouver. A mix of organizations and individuals with lived experience was sought for the Climate and Equity Working Group. Organizations were invited because of their expertise and experience working for Indigenous communities, communities of colour, low-income populations, or other disproportionately impacted communities the City typically fails to involve in policy development. No experience in climate change subject matter was required, though some participants did bring this knowledge. In some cases, individuals stepped forward to participate and were included on the Climate and Equity Working Group. These individuals had a strong interest in equity and brought a specific perspective to the group that was otherwise under-represented. The resulting participating organizations and individuals covered a rich mix of perspectives including new immigrants, people with disabilities, people with low income, urban Indigenous. The majority of participants were racialized people. It is important to note that not all voices were present. There were no participants from Musqueam, Squamish or Tsleil-Waututh Nations. Seniors were not represented. The youth perspective could have been stronger. The majority of participants were from non-profit organizations; business perspectives were not as strongly represented. Voices from the LGBTQ2+ community were not explicitly present. While the majority of participants were women, there was no voice specific to gender equity. These gaps need to be addressed in future engagement as part of implementation work and in the reformation of the Climate and Equity Working Group. The names and organizations of participants are listed on the following page. Note that participation in the Working Group does not indicate any kind of endorsement of the Climate Emergency Action Plan by the individuals or organizations listed.
APPENDIX N PAGE 2 OF 11
NAME ORGANIZATION
Rhiannon Bennett (Facilitator) Hummingbirds Rising Consulting
Eda Ertan Collingwood Neighbourhood House
Justina Loh and Cynthia Minh Disability Alliance BC
Ekaterina Ungvitskaya Downtown Eastside Women’s Centre
Amy Hennessy and Nabila Hussein Empower Me
Anthonia Ogundele Ethọ́s Lab
Dr. Love-Ese Chile Grey to Green Sustainable Solutions
Kevin Huang Hua Foundation
Saleem Spindari MOSAIC
Jolene Andrew Mount Pleasant Neighbourhood House - Indigenous Community Developer
Rita Steele Offsetters
Louise Schwarz Recycling Alternative
Adriana Laurent Seibt UBC Climate Hub
Sean Green Vancouver Aboriginal Friendship Centre Society
Nicole Montgomery Individual – built environment sustainability consultant
Jake Chakasim Individual - Indigenous Architect (intern) & SCARP PhD student
Ayaan Ismail Individual – 2019 RISE Ambassador
MEETINGS AND TOPICS COVERED The Climate and Equity Working Group met monthly for six months starting in January 2020. In April, meetings shifted to an online video conference format due to the COVID-19 pandemic. Some members had scheduling conflicts due to increased demands on their time during the pandemic, but the majority of the group did wish to and was able to finish the scheduled series of meetings online. Staff are very grateful for their commitment and flexibility in making the shift to online dialogue work. Their feedback has been invaluable in shaping the final Climate Emergency Action Plan.
SESSION DESCRIPTION
Jan 2020 Overview of climate change in Vancouver, projected impacts, carbon emissions sources, progress made so far, the Climate Emergency Response’s Six Big Moves.
Feb 2020 Presentation of proposed actions related to buildings, small-group discussions with Green Buildings staff.
Mar and Apr 2020 Presentation on proposed actions related to transportation, small-group discussions with Engineering staff.
May 2020 Joint meeting with the City’s Collaborative Leadership Advisory Group—discussion of how to amplify climate work, mapping of organizations working in this space, understanding barriers organizations face to doing more climate work.
Jun 2020
Open space for group to select topics for discussion (focused on engagement, how to specifically address racism in climate/city planning work, how to give more power to equity work). Discussion of an Environmental Justice Charter and what that might look like for the City, advice on how the City should approach developing a charter.
APPENDIX N PAGE 3 OF 11
FUTURE EQUITY WORK
CHARTER The Climate and Equity Working Group members were excited by the idea of the City developing an Environmental Justice Charter and provided their input on what this charter could do to make advances on equity and racial justice within sustainability work. Staff are proposing starting with a Climate Justice Charter that can be expanded over time into a broader Environmental Justice Charter when the City renews its broad environmental sustainability plan (Greenest City). As currently imagined, the Charter would be a guiding document for staff working on climate-related work. More work needs to be done to scope the Charter, but anticipated features/functions include: • An articulation of climate equity and justice objectives and the fundamental imperative
to make changes to meet these objectives (possibly articulate equity outcome objectives for each Climate Emergency Big Move).
• Tangible process changes and actions for staff to undertake when doing policy or program development to ensure equity is at the forefront.
• Measures for accountability and transparency (with integration into the Climate Emergency Action Plan monitoring and reporting framework).
• A methodology to analyse climate budget spending with an equity perspective to understand the portion of funding spent on policies and programs that benefit Indigenous people, racialized groups, and/or other disproportionately impacted communities. This information can then be used to inform prioritization of future work.
Staff will hire a consultant experienced in systemic racial justice and equity work to inform the scope and process. Working collaboratively with disproportionally impacted communities will be a key part of the process to develop this charter. Understanding how this work fits within the City’s Equity Framework will be important to ensure it aligns with and does not duplicate other equity initiatives across City departments.
MONITORING AND REPORTING Determining how to appropriately measure progress on equity is a challenge but one the Working Group highlighted as important. For the Climate Emergency Action Plan, staff have identified next-step Equity Milestones, but identifying a way to track progress over the many years the implementation of this plan still needs to be done. The Charter will assist with this—identifying relevant, meaningful metrics with disproportionally impacted communities.
APPENDIX N PAGE 4 OF 11
KEY TAKEAWAYS FROM WORKING GROUP MEETINGS
GREEN BUILDINGS DISCUSSION (BIG MOVES 4 & 5) Staff summary of Climate and Equity Working Group – February 2020
GENERAL COMMENTS • What opportunities are there to create employment for Indigenous
people—in design of buildings, in trades, in new supply chains?
• Important to look globally for sustainable examples and inspiration; not always looking to western Europe. Indigenous culture has been doing “sustainability” and “passive design” for centuries.
• Decolonizing and de-capitalizing housing. How to create more cohousing and communal homes? How can we talk more about shared housing and shared goods as a way of cutting carbon?
ADDITIONAL COMMENTS AND THEMES a) Retrofits of existing buildings to cut carbon emissions
Training will be important to plan thoughtfully • Which language-speakers have access to information and training?
Who benefits most from training and incentives? • The City should analyze who is typically missed during
consultation/education/training efforts and address those gaps. What partnerships can help the City address the gaps?
Affordability impacts of retrofits is a critical concern • Who bears the cost? How to allocate funds to those most in need of
support with retrofits? • How to avoid displacement, particularly of renters? • Can we create incentives for marginalized groups, so they have the
opportunity to make improvements? Cultural considerations are important in implementation • Need to ensure retrofit technology matches resident or business cultural
needs (e.g., restaurants that need woks), build in time to find appropriate solutions.
b) New building regulations to cut carbon emissions
Affordability and displacement are concerns • Market demand vs. what residents need—the City needs to prioritize
the needs of residents vs. a market targeting global investors/consumers.
• Concerns re: gentrification; what, who bears the up-front costs, operating costs?
Thinking beyond building performance and efficiency standards is important • Need to include public space design, architectural design
considerations—as we replace old buildings with new, how are we
APPENDIX N PAGE 5 OF 11
mindful of the culture/community that exists and that will use the building? Does it fit in; does it meet community needs?
Fair regulation • Why blanket-regulate all building forms with the same policy? Can we
meet our emissions targets in a way that gives affordable housing forms more time, for example?
Higher priority on ongoing maintenance • What levers does the City have to ensure buildings are maintained over
time?
c) Embodied carbon of building materials Affordability and displacement are concerns • Who bears the costs? How to lower costs?
Health matters • Can the city encourage developers to approach buildings from a health
or people-centred lens? Need to educate • City needs to improve messaging around embodied carbon—it
surrounds us but we do not understand it.
TRANSPORTATION DISCUSSIONS (BIG MOVES 1, 2 & 3) Staff summary of Climate and Equity Working Group – March and April 2020
GENERAL COMMENTS • What areas or neighbourhoods will be prioritized for the different actions?
How are these areas chosen, using what measures or indicators (population growth, density, traffic counts, existing vs. limited active transportation infrastructure)?
• How will a zero emissions parking plan be equitable to lower-income people who cannot afford to switch to a zero emissions vehicle?
• Persons with disabilities may be unable to walk, cycle, and/or take transit, so how can they be accommodated and not penalized for owning a vehicle (specifically with reference to the zero emissions parking plan)?
• Less central areas of Vancouver have less access to good transit and cycling options. There is an inequitable distribution of services in more affordable areas. Important to note that Musqueam has no transit service.
• Need improved active transit infrastructure including increasing separated bike lanes, safe bike parking areas, end-of-trip facilities at work, rest areas and benches (for those with health issues, disabilities), railings, public washrooms, and wayfinding.
• The sequencing of the implementation of these actions will greatly impact equity—need to ensure people have viable low-carbon transportation options that meet their needs before implementing costs/penalties for carbon-intensive choices. Participants emphasized the importance of developing adequate public/active transit infrastructure.
APPENDIX N PAGE 6 OF 11
• What is the role of the City to address equity and transportation in a regional/provincial context? How can this work be connected with other cities and throughout the province—especially considering that many people commute to and visit Vancouver? Where can the City exert authority to require other agencies to apply the City’s equity considerations to their transportation investments?
ADDITIONAL COMMENTS AND THEMES a) Complete communities are key [Big Move 1]
• Land use planning is the best transportation planning as transit choices are inextricably connected to housing affordability, work, proximity to daily needs, available services, safety, and income.
• Emphasis on the importance of developing complete communities through land use planning to reduce reliance on vehicles, which requires establishing partnerships with regional and provincial organizations to ensure there are adequate, reliable and safe transit options, as well as services, such as childcare and schools.
• Important to remember the needs of shift workers, and individuals working in the informal economy.
b) Regional connectivity and partnerships
• Partnerships are required with different regional and provincial bodies to implement this transformation. How can the City of Vancouver ensure equity is embedded in other organizations? How can the City ensure all neighbourhoods are serviced by good public transit?
c) Who actions apply to first
• Exemptions for certain groups; situations will be important to include when implementing new pricing mechanisms to consider those who would be disproportionately impacted by transportation or parking pricing. Do not financially penalize those who have few options or who lack the ability to comply with zero emissions goals because solutions (e.g., EVs) are expensive.
• Consideration for people accessing spaces such as hospitals and courts. These are places people access when they are experiencing trauma, and staff should consider how transportation pricing might worsen that trauma.
• Affordability is a critical consideration. For some, transit is currently not an affordable option.
• Make sure that plans always keep questions of equity in mind when rolling out, instead of always allowing those in more privileged positions to benefit first.
d) An equitable transportation system looks like:
• Affordability of transit and housing. • People are able to safely move and access services for their daily
needs: work, leisure, school, daycare, healthcare.
APPENDIX N PAGE 7 OF 11
• Road space use: decrease on-street parking for private vehicles to create more space for people, pedestrians, cyclists. Prioritize space on the roads for those who must use vehicles (while those with other options use other options).
• Regional connectivity. • Consideration for seniors, young people, and people with disabilities. • Consideration for health disparities and poverty (fixed income and
seniors). • Cycling feels welcome to all, including those going slowly (not fitness-
focused or like an elite activity requiring expensive gear). • Revenue from transportation pricing used to improve transit
infrastructure or to fund community benefits with community driving decision-making on how to invest.
• In-language programs to support education and awareness about active transportation options and public transit routes.
• Affordable public bike share with electric bike options. • Safe cycling infrastructure that is so present that you do not need to
map your route out in advance; you can always get where you want to go via separated paths.
e) Impacted groups that need to be considered
• Persons with disabilities or health issues who may not be able to walk, cycle, or take transit; families accessing childcare and schools; commuters living outside of Vancouver; low-income people not able to afford electric vehicles; people working in areas without adequate transit service.
• Consider how parking costs contribute to gentrification and displacement for those unable to afford parking permits.
f) Data the City should consider tracking for transportation and equity
• Trips beyond daily commute (shopping, weekend activity, etc.). Consider how data can capture any trips, especially in underserved communities.
• Types of transportation that newcomers engage with more to understand their travel patterns.
• Intersectional data that reflects not only modes, but also gender, income, age, race, nationality, etc.
• Percentage of people/jobs within a five-minute walk of great transit. • Percentage of people who feel that they can safely bike: (a) in their
neighbourhood, (b) for shopping and everyday destinations, (c) to work. Ask questions separately for walking and biking.
• Parking permit costs per neighbourhood against neighbourhoods with higher densities of people with lower incomes, or people living on income or disability assistance.
• Measuring a culture shift is not easy. Changing behaviours, and evaluating and monitoring for sustained change will be reflected in how communities feel respected and included.
APPENDIX N PAGE 8 OF 11
• Focus on qualitative data: use quotes, success stories, highlight things that are not working so well. Qualitative techniques can capture information from large groups. Storytelling and real human narratives can portray complex ideas.
ENVIRONMENTAL JUSTICE CHARTER DISCUSSION Staff summary of Climate and Equity Working Group – June 2020 The Working Group discussed what an Environmental Justice Charter could look like, what its function could be; noting that this work would have to be situated with the context of the Equity Framework82 being developed for the City as an organization.
a) Scope. The Charter should: • Connect to global context and climate impacts, UNDRIP, environmental
racism, encompass the interconnection of land systems and the remediation of harm done to the immediate ecosystem, how can the community most impacted by climate change be centred and central to preparedness planning.
• Enforce a framework to ensure that equity considerations are taken into account for any City planning project.
• Provide guidelines for safeguarding and caring for our environment in ways that are fair to all groups. Some environmental measures are too costly for some groups. Some may not be culturally appropriate. It is so important to consider all of these things.
• Have a clear path to address specific environmental injustices that communities have identified.
• Embolden staff to take courageous actions that benefit communities and close existing gaps.
b) Process. Suggested process to develop charter: • Co-developed with the community. Not simply engagement, but having
ownership by the community and ensuring accountability. • Include guidance on how to connect with folks from the start. • Important that this charter focus on changing the process, rather than
just being a document that no one might read. • Justice in the process, not just in the outcome. Process needs to be
different in order for the outcome to be meaningful. • Iterative. Recognize that doing something the right way will involve
mistakes. Correct and move forward. Openness to revisiting the charter because things change.
82 The City’s Equity Framework will be a central document and shared language about what equity means at the City of Vancouver. This Framework takes an Indigenous-centred, race-forward, intersectional approach and outlines what practices we want to see, and metrics to hold ourselves accountable to the goals that we set. It will include five commitments including: spaces for learning, reflecting equity in leadership, fostering relationship, adequately resourcing work. Importantly, this framework will recommend that each department develop a complementary equity document that identifies targets, desired outcomes, and required resources to carry out equity framework.
APPENDIX N PAGE 9 OF 11
c) Features. Suggested important features the Charter should include: • It must be intersectional across the board and hold clear steps for
accountability. • The First Nations perspective and voice must be overarching and
underpinning principles. • It should be inclusive—it should involve and pertain to all Vancouver
communities. • Practice of inclusion, relationship building, and participatory decision-
making. • There are important metrics that should be captured, and checklists that
promote tangible, measurable outcomes to occur, however, there should also be a focus on PROCESS—how to do things, who to engage, how people are engaged, and what to do once engaged. Recognize that every community, initiative and project is different, and there will be a different way that each initiative will elevate equity.
• The City has to be willing to change its own internal policies and by-laws that infringe on the charter being successful.
• Do things differently—different process is just as important as the outcome.
• Require regular reporting to Council, communities and the public. • There needs to be a section in the charter that gives folks the agency to
speak up. Some kind of protection for folks for speaking up (so people do not get kicked out of meetings for calling out racism).
• Firm language that recognizes that radical systemic change needs to happen and that it is a process we need to take. Name how current structures are not just.
OTHER IMPORTANT DISCUSSIONS Staff summary of Climate and Equity Working Group – June 2020
At the June meeting the Working Group selected topics that had not yet been covered and met in breakout groups to discuss.
a) Specifically addressing racism, anti-blackness and anti-indigenous racism in climate and city planning • City of Vancouver has long history (since day 1) of displacing
Indigenous, Black, Chinese people, and other POC through city planning.
• Climate and environmental movements have a short memory, forget the racist origins of environmental climate movements (e.g., creating parks to “enjoy nature” but doing it via displacing Indigenous Peoples off their land).
• When talking about transportation think about where people are displaced to, where city planning directs services, and the disconnect between those. How can we change frameworks for how the City prioritizes funding/services/planning efforts for communities?
APPENDIX N PAGE 10 OF 11
• Fundamentally need better representation from these communities among City staff—need to address the systemic problem of lack of representation at City Hall, particularly in decision-making roles.
• There should not be a limited engagement phase, people should always have an opportunity to provide input to work that has an impact on them. Particularly for marginalized groups.
• The efforts the City is making to reach people to invite them into engagement events are not reaching all communities, and communities of colour. Need to build community connections.
• Have a specific, ongoing effort to engage with Black and Indigenous communities.
b) How to name and address institutional racism. In particular, what we saw in the Houses of Commons and how do we give more power to equity work? • How ready are the people who have the power to hear this and do this
work? • A lot of people working in equity institutions have challenges re: whether
or not they can call things out (safety). • Equity work has been happening for a long time—but the policies put in
place are not effective—how do we something different that will hold the institution accountable?
• How do we implement meaningfully? Acknowledge how racism is affecting others. Do some individual work first at the management level. Create safe spaces for people to speak up.
• Who has the power and why? Ensure that advisory groups and other community groups are given the power. Institutions often call on community advocates to provide advice on different plans/policies, but their advice is not always “given” adequate value or power to make meaningful change to those policies.
c) How to engage more people in the topic of equity and climate. Including people from the newcomer communities and surrounding First Nations, and other underrepresented communities Disseminating information, lived experiences and knowings from other places • In language(s). • In places where people gather (e.g., places of worship and places of
ceremony). • In places people call home. • The role of Indigenous art is important—perhaps a piece of
commissioned art that is lasting and speaks to equity and climate. • Communication: use simple and concise information graphics, display
info where people gather. Recognize that it is not possible to translate into all languages. For example, COVID-19 messaging used simple, easy to understand, key messages, and graphics.
• Social media: be mindful of the different social media channels that communities use.
APPENDIX N PAGE 11 OF 11
• Need to target the youth, tech-savvy generations. • Before we are able to communicate impacts of climate change,
understand the barriers that make it difficult for people to get involved.
Getting community actively involved • Provide different ways to get involved in same planning process/city
initiatives, more times, more methods. • Foreground the issue of ALL cultural displacements and migration. • Community-based endorsement letters: incorporate the feedback,
ensure their voice is included in the planning and development process.
Engagement that translates into action • Awareness: let people know about the issue and why it matters. • Action: encourage people to take action, and be a part of the plan by
taking individual steps • Help people feel like this is their home and help them take care of it.
Empower people.
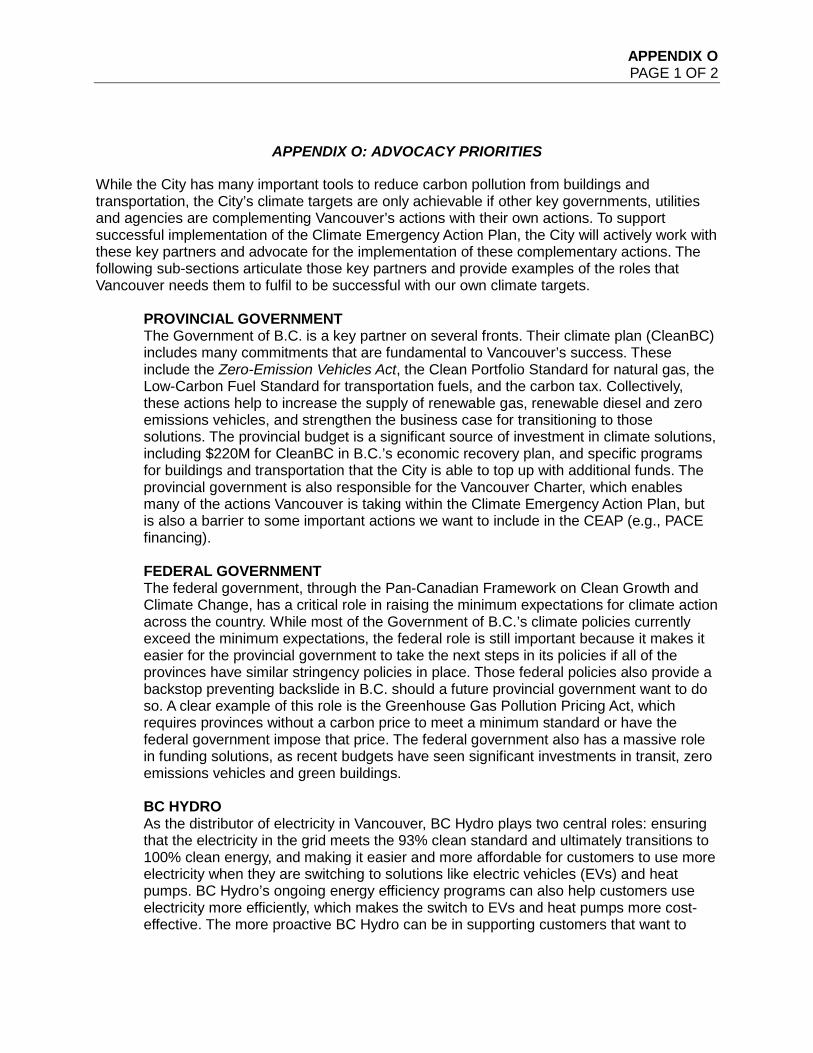
APPENDIX O PAGE 1 OF 2
APPENDIX O: ADVOCACY PRIORITIES
While the City has many important tools to reduce carbon pollution from buildings and transportation, the City’s climate targets are only achievable if other key governments, utilities and agencies are complementing Vancouver’s actions with their own actions. To support successful implementation of the Climate Emergency Action Plan, the City will actively work with these key partners and advocate for the implementation of these complementary actions. The following sub-sections articulate those key partners and provide examples of the roles that Vancouver needs them to fulfil to be successful with our own climate targets.
PROVINCIAL GOVERNMENT The Government of B.C. is a key partner on several fronts. Their climate plan (CleanBC) includes many commitments that are fundamental to Vancouver’s success. These include the Zero-Emission Vehicles Act, the Clean Portfolio Standard for natural gas, the Low-Carbon Fuel Standard for transportation fuels, and the carbon tax. Collectively, these actions help to increase the supply of renewable gas, renewable diesel and zero emissions vehicles, and strengthen the business case for transitioning to those solutions. The provincial budget is a significant source of investment in climate solutions, including $220M for CleanBC in B.C.’s economic recovery plan, and specific programs for buildings and transportation that the City is able to top up with additional funds. The provincial government is also responsible for the Vancouver Charter, which enables many of the actions Vancouver is taking within the Climate Emergency Action Plan, but is also a barrier to some important actions we want to include in the CEAP (e.g., PACE financing). FEDERAL GOVERNMENT The federal government, through the Pan-Canadian Framework on Clean Growth and Climate Change, has a critical role in raising the minimum expectations for climate action across the country. While most of the Government of B.C.’s climate policies currently exceed the minimum expectations, the federal role is still important because it makes it easier for the provincial government to take the next steps in its policies if all of the provinces have similar stringency policies in place. Those federal policies also provide a backstop preventing backslide in B.C. should a future provincial government want to do so. A clear example of this role is the Greenhouse Gas Pollution Pricing Act, which requires provinces without a carbon price to meet a minimum standard or have the federal government impose that price. The federal government also has a massive role in funding solutions, as recent budgets have seen significant investments in transit, zero emissions vehicles and green buildings. BC HYDRO As the distributor of electricity in Vancouver, BC Hydro plays two central roles: ensuring that the electricity in the grid meets the 93% clean standard and ultimately transitions to 100% clean energy, and making it easier and more affordable for customers to use more electricity when they are switching to solutions like electric vehicles (EVs) and heat pumps. BC Hydro’s ongoing energy efficiency programs can also help customers use electricity more efficiently, which makes the switch to EVs and heat pumps more cost-effective. The more proactive BC Hydro can be in supporting customers that want to
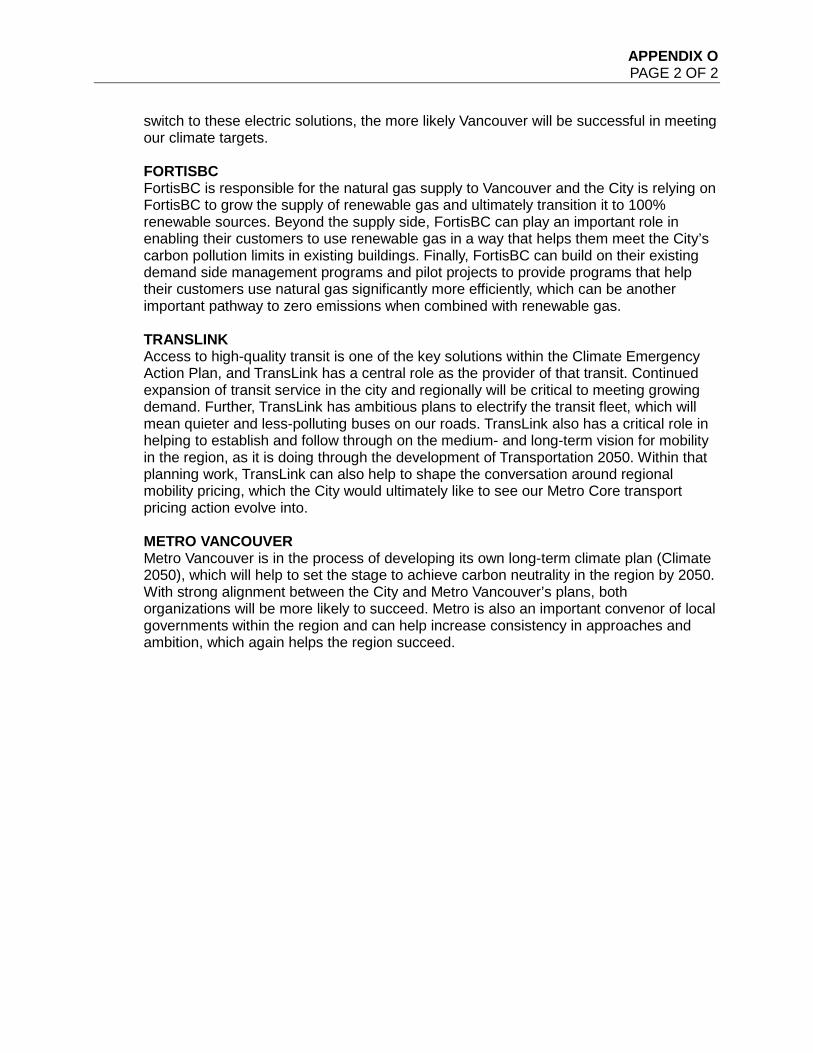
APPENDIX O PAGE 2 OF 2
switch to these electric solutions, the more likely Vancouver will be successful in meeting our climate targets. FORTISBC FortisBC is responsible for the natural gas supply to Vancouver and the City is relying on FortisBC to grow the supply of renewable gas and ultimately transition it to 100% renewable sources. Beyond the supply side, FortisBC can play an important role in enabling their customers to use renewable gas in a way that helps them meet the City’s carbon pollution limits in existing buildings. Finally, FortisBC can build on their existing demand side management programs and pilot projects to provide programs that help their customers use natural gas significantly more efficiently, which can be another important pathway to zero emissions when combined with renewable gas. TRANSLINK Access to high-quality transit is one of the key solutions within the Climate Emergency Action Plan, and TransLink has a central role as the provider of that transit. Continued expansion of transit service in the city and regionally will be critical to meeting growing demand. Further, TransLink has ambitious plans to electrify the transit fleet, which will mean quieter and less-polluting buses on our roads. TransLink also has a critical role in helping to establish and follow through on the medium- and long-term vision for mobility in the region, as it is doing through the development of Transportation 2050. Within that planning work, TransLink can also help to shape the conversation around regional mobility pricing, which the City would ultimately like to see our Metro Core transport pricing action evolve into. METRO VANCOUVER Metro Vancouver is in the process of developing its own long-term climate plan (Climate 2050), which will help to set the stage to achieve carbon neutrality in the region by 2050. With strong alignment between the City and Metro Vancouver’s plans, both organizations will be more likely to succeed. Metro is also an important convenor of local governments within the region and can help increase consistency in approaches and ambition, which again helps the region succeed.
APPENDIX P PAGE 1 OF 107
APPENDIX P: PUBLIC ENGAGEMENT REPORT
EXECUTIVE SUMMARY From February to May 2020, the City of Vancouver undertook an engagement process to get feedback on 19 draft climate actions. Unfortunately, the COVID-19 pandemic struck in the middle of our engagement process, which required a significant pivot away from in-person engagement tactics from March onwards. In the end, we collected feedback through an online survey, 25 dialogues, 10 stakeholder meetings, and three market-research surveys, as well as 94 interviews conducted in Mandarin, Cantonese, and Punjabi. Actions were reviewed by External Advisory Groups and the Climate and Equity Working Group. In total, 16,926 comments were received from 3,284 respondents, including 204 staff. During this period, we also attended or hosted an additional 31 events with 3,447 attendees. Overall, people were supportive of the actions that were proposed, with all but three actions receiving over 70% comfort. The actions that people were most comfortable with were improve bus speed and reliability, support charging infrastructure for passenger fleets, and transition the neighbourhood energy utility to 100% renewable energy. Actions that people were less comfortable with were those that required an additional charge, including transport pricing in the Metro core, the zero emissions parking plan, and regulate carbon pollution from existing buildings. An additional action, remote work, was proposed after social distancing measures put in place to curb the spread of COVID-19 demonstrated that it is possible (although not ideal in all situations) for people to work remotely. The climate actions presented to Council in the Climate Emergency Action Plan have been shaped by information collected through this process. These actions will continue to be developed and adjusted before they are implemented. This will require additional input from the public.
ABOUT THIS SUMMARY The purpose of this report is to document the engagement process that supported the development of the Climate Emergency Action Plan. It summarizes the approach used to collect feedback, what we heard, and what was done as a result of what we heard. This public engagement report is divided into the following sections:
• Section 1 provides an overview of the project context and engagement timeline. • Section 2 describes the engagement approach and principles. • Section 3 details the communication and engagement tactics used in each of the three
phases of the Climate Emergency engagement period. • Section 4 summarizes who we heard from during the engagement process. • Section 5 summarizes key themes and concerns that we heard about each of the
proposed climate actions.
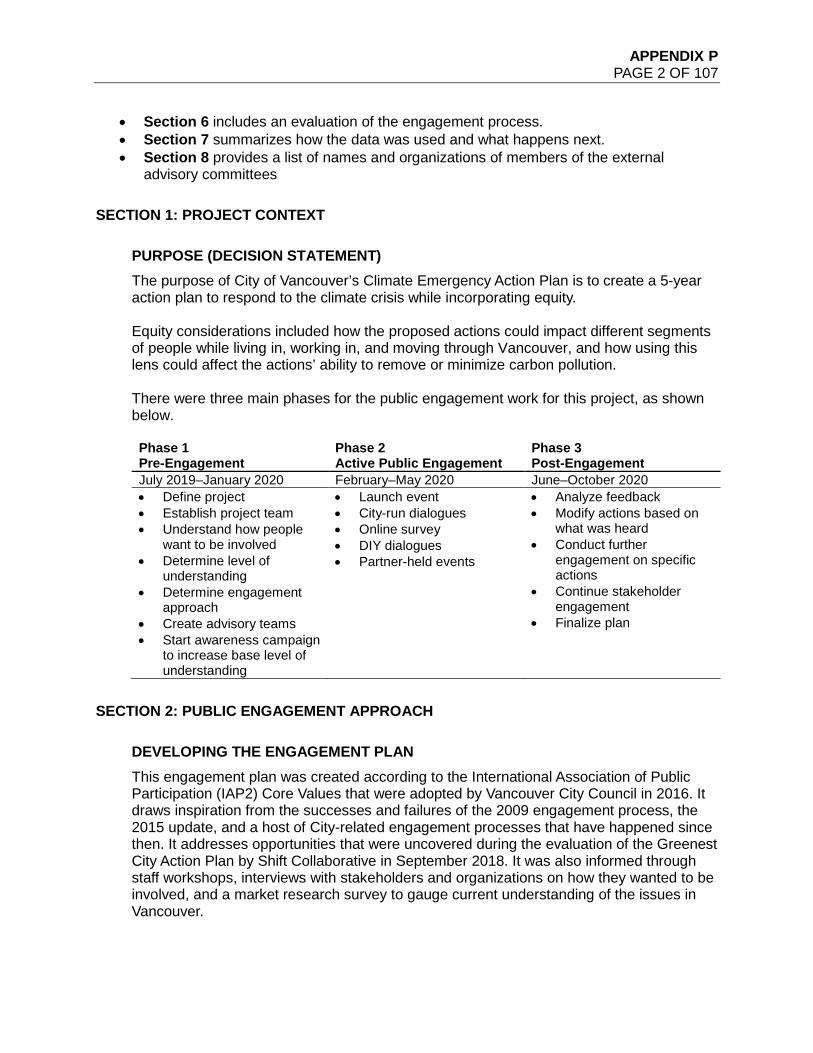
APPENDIX P PAGE 2 OF 107
• Section 6 includes an evaluation of the engagement process. • Section 7 summarizes how the data was used and what happens next. • Section 8 provides a list of names and organizations of members of the external
advisory committees
SECTION 1: PROJECT CONTEXT
PURPOSE (DECISION STATEMENT) The purpose of City of Vancouver’s Climate Emergency Action Plan is to create a 5-year action plan to respond to the climate crisis while incorporating equity. Equity considerations included how the proposed actions could impact different segments of people while living in, working in, and moving through Vancouver, and how using this lens could affect the actions’ ability to remove or minimize carbon pollution.
There were three main phases for the public engagement work for this project, as shown below.
Phase 1 Pre-Engagement
Phase 2 Active Public Engagement
Phase 3 Post-Engagement
July 2019–January 2020 February–May 2020 June–October 2020 • Define project • Establish project team • Understand how people
want to be involved • Determine level of
understanding • Determine engagement
approach • Create advisory teams • Start awareness campaign
to increase base level of understanding
• Launch event • City-run dialogues • Online survey • DIY dialogues • Partner-held events
• Analyze feedback • Modify actions based on
what was heard • Conduct further
engagement on specific actions
• Continue stakeholder engagement
• Finalize plan
SECTION 2: PUBLIC ENGAGEMENT APPROACH
DEVELOPING THE ENGAGEMENT PLAN This engagement plan was created according to the International Association of Public Participation (IAP2) Core Values that were adopted by Vancouver City Council in 2016. It draws inspiration from the successes and failures of the 2009 engagement process, the 2015 update, and a host of City-related engagement processes that have happened since then. It addresses opportunities that were uncovered during the evaluation of the Greenest City Action Plan by Shift Collaborative in September 2018. It was also informed through staff workshops, interviews with stakeholders and organizations on how they wanted to be involved, and a market research survey to gauge current understanding of the issues in Vancouver.
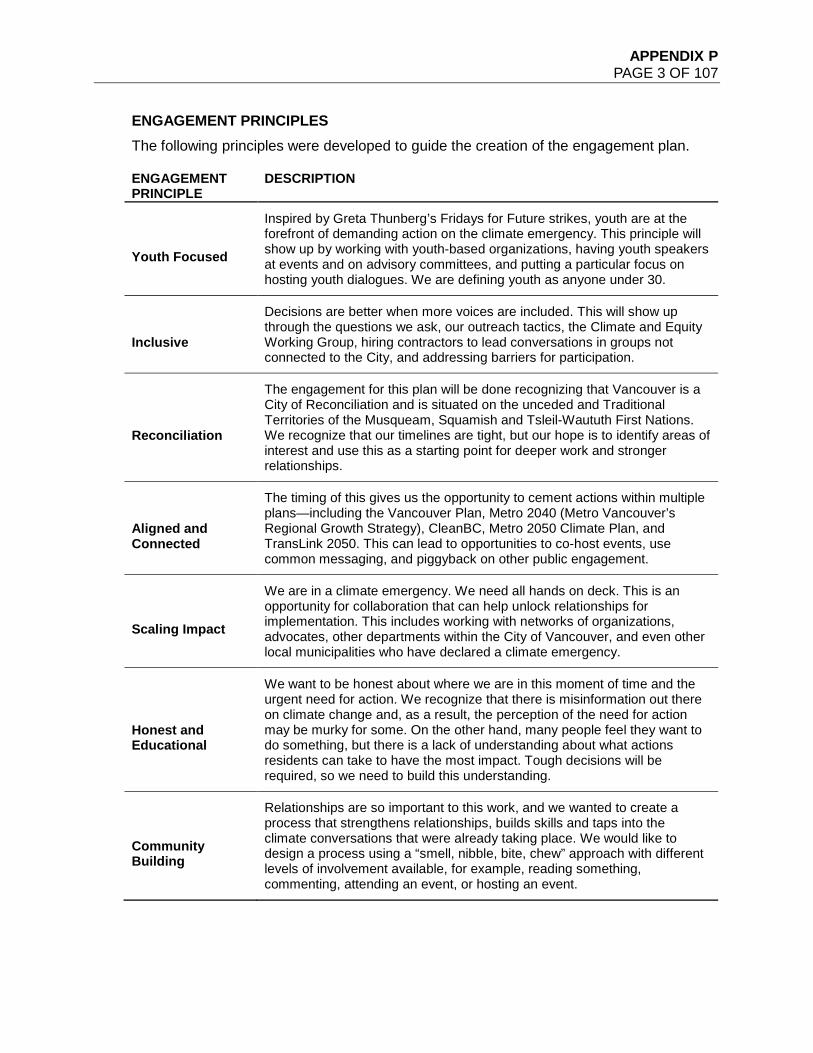
APPENDIX P PAGE 3 OF 107
ENGAGEMENT PRINCIPLES The following principles were developed to guide the creation of the engagement plan. ENGAGEMENT PRINCIPLE
DESCRIPTION
Youth Focused
Inspired by Greta Thunberg’s Fridays for Future strikes, youth are at the forefront of demanding action on the climate emergency. This principle will show up by working with youth-based organizations, having youth speakers at events and on advisory committees, and putting a particular focus on hosting youth dialogues. We are defining youth as anyone under 30.
Inclusive
Decisions are better when more voices are included. This will show up through the questions we ask, our outreach tactics, the Climate and Equity Working Group, hiring contractors to lead conversations in groups not connected to the City, and addressing barriers for participation.
Reconciliation
The engagement for this plan will be done recognizing that Vancouver is a City of Reconciliation and is situated on the unceded and Traditional Territories of the Musqueam, Squamish and Tsleil-Waututh First Nations. We recognize that our timelines are tight, but our hope is to identify areas of interest and use this as a starting point for deeper work and stronger relationships.
Aligned and Connected
The timing of this gives us the opportunity to cement actions within multiple plans—including the Vancouver Plan, Metro 2040 (Metro Vancouver’s Regional Growth Strategy), CleanBC, Metro 2050 Climate Plan, and TransLink 2050. This can lead to opportunities to co-host events, use common messaging, and piggyback on other public engagement.
Scaling Impact
We are in a climate emergency. We need all hands on deck. This is an opportunity for collaboration that can help unlock relationships for implementation. This includes working with networks of organizations, advocates, other departments within the City of Vancouver, and even other local municipalities who have declared a climate emergency.
Honest and Educational
We want to be honest about where we are in this moment of time and the urgent need for action. We recognize that there is misinformation out there on climate change and, as a result, the perception of the need for action may be murky for some. On the other hand, many people feel they want to do something, but there is a lack of understanding about what actions residents can take to have the most impact. Tough decisions will be required, so we need to build this understanding.
Community Building
Relationships are so important to this work, and we wanted to create a process that strengthens relationships, builds skills and taps into the climate conversations that were already taking place. We would like to design a process using a “smell, nibble, bite, chew” approach with different levels of involvement available, for example, reading something, commenting, attending an event, or hosting an event.
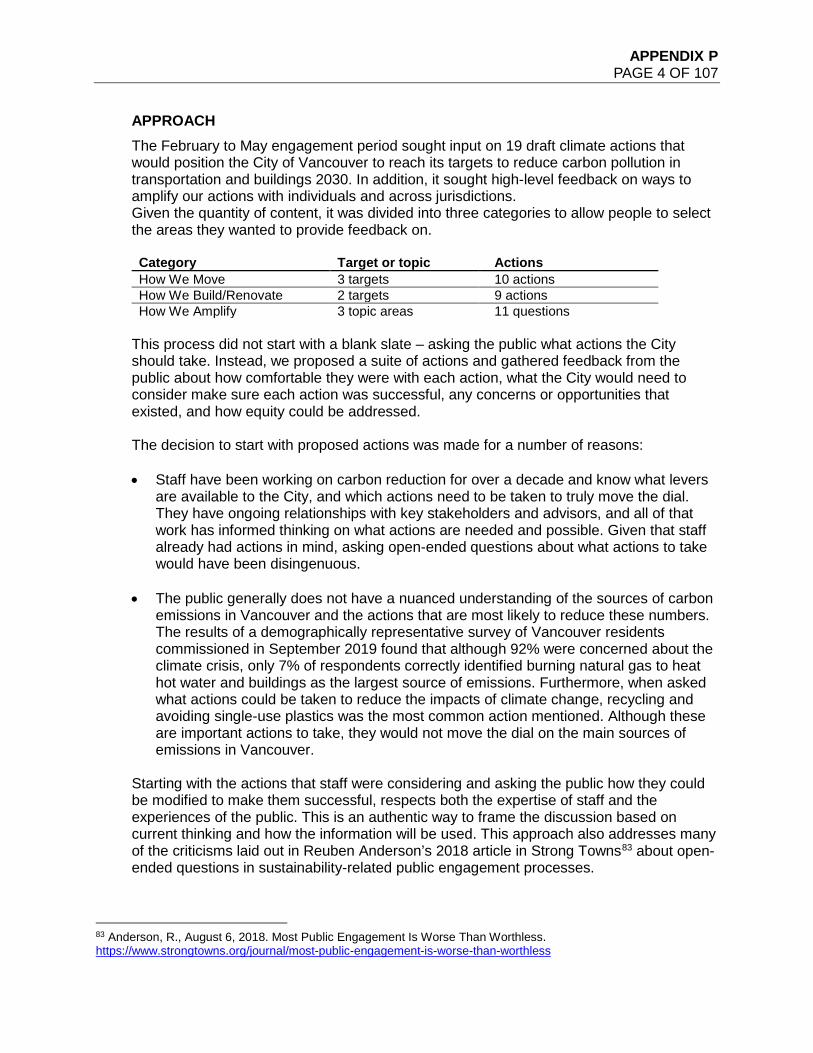
APPENDIX P PAGE 4 OF 107
APPROACH The February to May engagement period sought input on 19 draft climate actions that would position the City of Vancouver to reach its targets to reduce carbon pollution in transportation and buildings 2030. In addition, it sought high-level feedback on ways to amplify our actions with individuals and across jurisdictions. Given the quantity of content, it was divided into three categories to allow people to select the areas they wanted to provide feedback on. Category Target or topic Actions How We Move 3 targets 10 actions How We Build/Renovate 2 targets 9 actions How We Amplify 3 topic areas 11 questions
This process did not start with a blank slate – asking the public what actions the City should take. Instead, we proposed a suite of actions and gathered feedback from the public about how comfortable they were with each action, what the City would need to consider make sure each action was successful, any concerns or opportunities that existed, and how equity could be addressed. The decision to start with proposed actions was made for a number of reasons: • Staff have been working on carbon reduction for over a decade and know what levers
are available to the City, and which actions need to be taken to truly move the dial. They have ongoing relationships with key stakeholders and advisors, and all of that work has informed thinking on what actions are needed and possible. Given that staff already had actions in mind, asking open-ended questions about what actions to take would have been disingenuous.
• The public generally does not have a nuanced understanding of the sources of carbon emissions in Vancouver and the actions that are most likely to reduce these numbers. The results of a demographically representative survey of Vancouver residents commissioned in September 2019 found that although 92% were concerned about the climate crisis, only 7% of respondents correctly identified burning natural gas to heat hot water and buildings as the largest source of emissions. Furthermore, when asked what actions could be taken to reduce the impacts of climate change, recycling and avoiding single-use plastics was the most common action mentioned. Although these are important actions to take, they would not move the dial on the main sources of emissions in Vancouver.
Starting with the actions that staff were considering and asking the public how they could be modified to make them successful, respects both the expertise of staff and the experiences of the public. This is an authentic way to frame the discussion based on current thinking and how the information will be used. This approach also addresses many of the criticisms laid out in Reuben Anderson’s 2018 article in Strong Towns83 about open-ended questions in sustainability-related public engagement processes.
83 Anderson, R., August 6, 2018. Most Public Engagement Is Worse Than Worthless. https://www.strongtowns.org/journal/most-public-engagement-is-worse-than-worthless
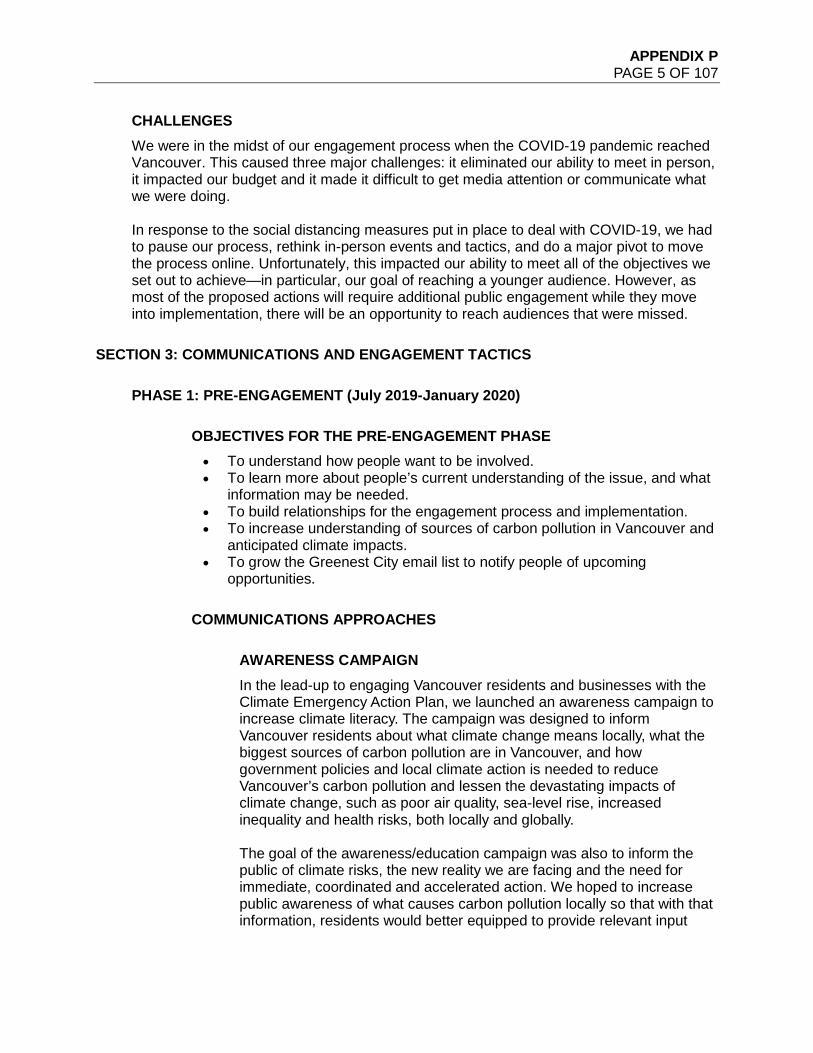
APPENDIX P PAGE 5 OF 107
CHALLENGES We were in the midst of our engagement process when the COVID-19 pandemic reached Vancouver. This caused three major challenges: it eliminated our ability to meet in person, it impacted our budget and it made it difficult to get media attention or communicate what we were doing. In response to the social distancing measures put in place to deal with COVID-19, we had to pause our process, rethink in-person events and tactics, and do a major pivot to move the process online. Unfortunately, this impacted our ability to meet all of the objectives we set out to achieve—in particular, our goal of reaching a younger audience. However, as most of the proposed actions will require additional public engagement while they move into implementation, there will be an opportunity to reach audiences that were missed.
SECTION 3: COMMUNICATIONS AND ENGAGEMENT TACTICS
PHASE 1: PRE-ENGAGEMENT (July 2019-January 2020)
OBJECTIVES FOR THE PRE-ENGAGEMENT PHASE • To understand how people want to be involved. • To learn more about people’s current understanding of the issue, and what
information may be needed. • To build relationships for the engagement process and implementation. • To increase understanding of sources of carbon pollution in Vancouver and
anticipated climate impacts. • To grow the Greenest City email list to notify people of upcoming
opportunities.
COMMUNICATIONS APPROACHES
AWARENESS CAMPAIGN In the lead-up to engaging Vancouver residents and businesses with the Climate Emergency Action Plan, we launched an awareness campaign to increase climate literacy. The campaign was designed to inform Vancouver residents about what climate change means locally, what the biggest sources of carbon pollution are in Vancouver, and how government policies and local climate action is needed to reduce Vancouver’s carbon pollution and lessen the devastating impacts of climate change, such as poor air quality, sea-level rise, increased inequality and health risks, both locally and globally. The goal of the awareness/education campaign was also to inform the public of climate risks, the new reality we are facing and the need for immediate, coordinated and accelerated action. We hoped to increase public awareness of what causes carbon pollution locally so that with that information, residents would better equipped to provide relevant input
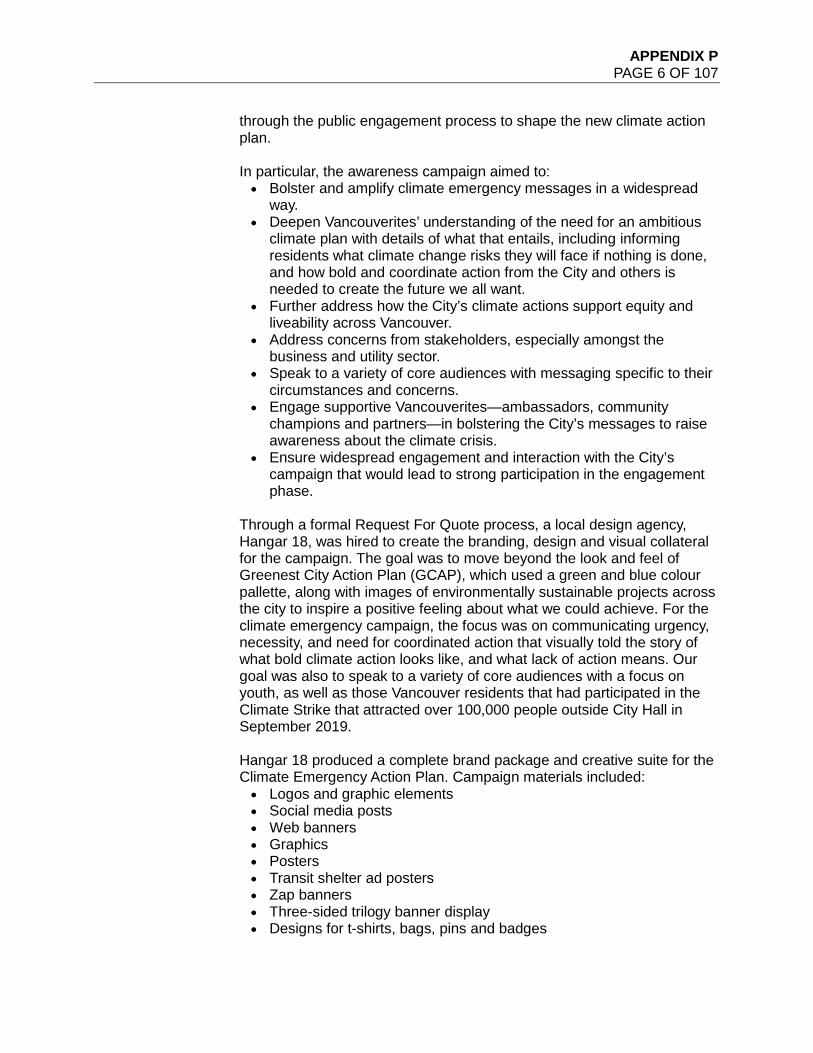
APPENDIX P PAGE 6 OF 107
through the public engagement process to shape the new climate action plan. In particular, the awareness campaign aimed to: • Bolster and amplify climate emergency messages in a widespread
way. • Deepen Vancouverites’ understanding of the need for an ambitious
climate plan with details of what that entails, including informing residents what climate change risks they will face if nothing is done, and how bold and coordinate action from the City and others is needed to create the future we all want.
• Further address how the City’s climate actions support equity and liveability across Vancouver.
• Address concerns from stakeholders, especially amongst the business and utility sector.
• Speak to a variety of core audiences with messaging specific to their circumstances and concerns.
• Engage supportive Vancouverites—ambassadors, community champions and partners—in bolstering the City’s messages to raise awareness about the climate crisis.
• Ensure widespread engagement and interaction with the City’s campaign that would lead to strong participation in the engagement phase.
Through a formal Request For Quote process, a local design agency, Hangar 18, was hired to create the branding, design and visual collateral for the campaign. The goal was to move beyond the look and feel of Greenest City Action Plan (GCAP), which used a green and blue colour pallette, along with images of environmentally sustainable projects across the city to inspire a positive feeling about what we could achieve. For the climate emergency campaign, the focus was on communicating urgency, necessity, and need for coordinated action that visually told the story of what bold climate action looks like, and what lack of action means. Our goal was also to speak to a variety of core audiences with a focus on youth, as well as those Vancouver residents that had participated in the Climate Strike that attracted over 100,000 people outside City Hall in September 2019. Hangar 18 produced a complete brand package and creative suite for the Climate Emergency Action Plan. Campaign materials included: • Logos and graphic elements • Social media posts • Web banners • Graphics • Posters • Transit shelter ad posters • Zap banners • Three-sided trilogy banner display • Designs for t-shirts, bags, pins and badges
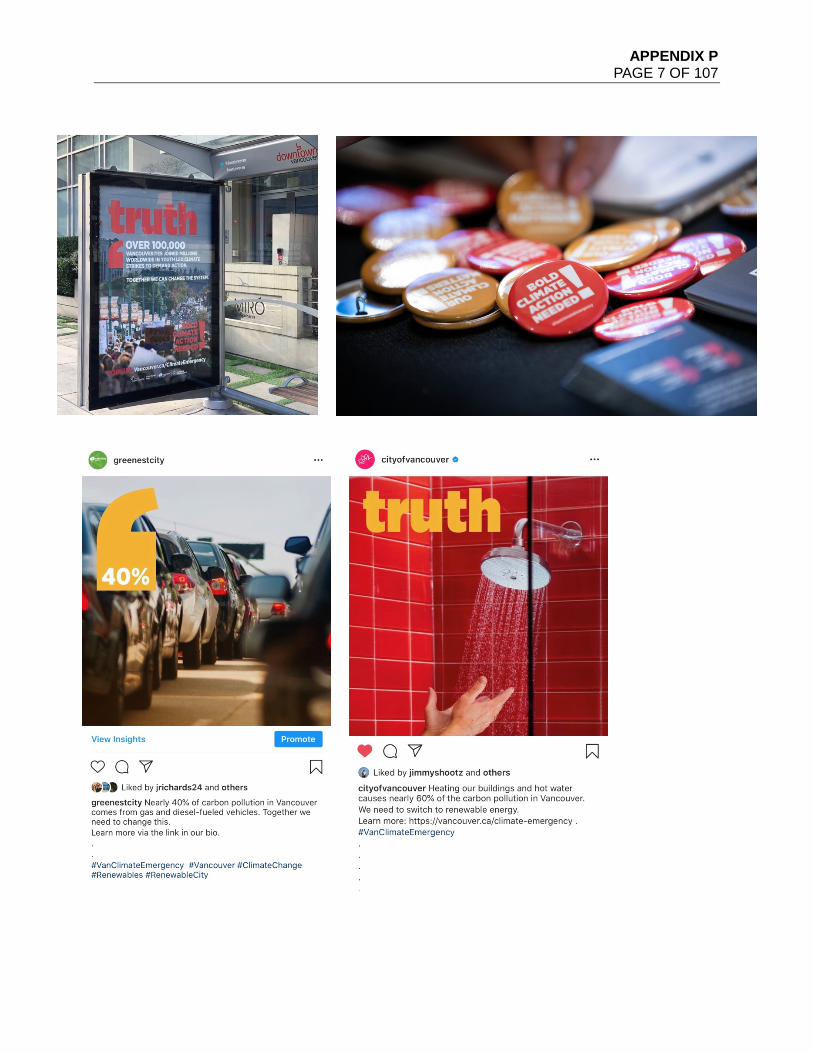
APPENDIX P PAGE 7 OF 107
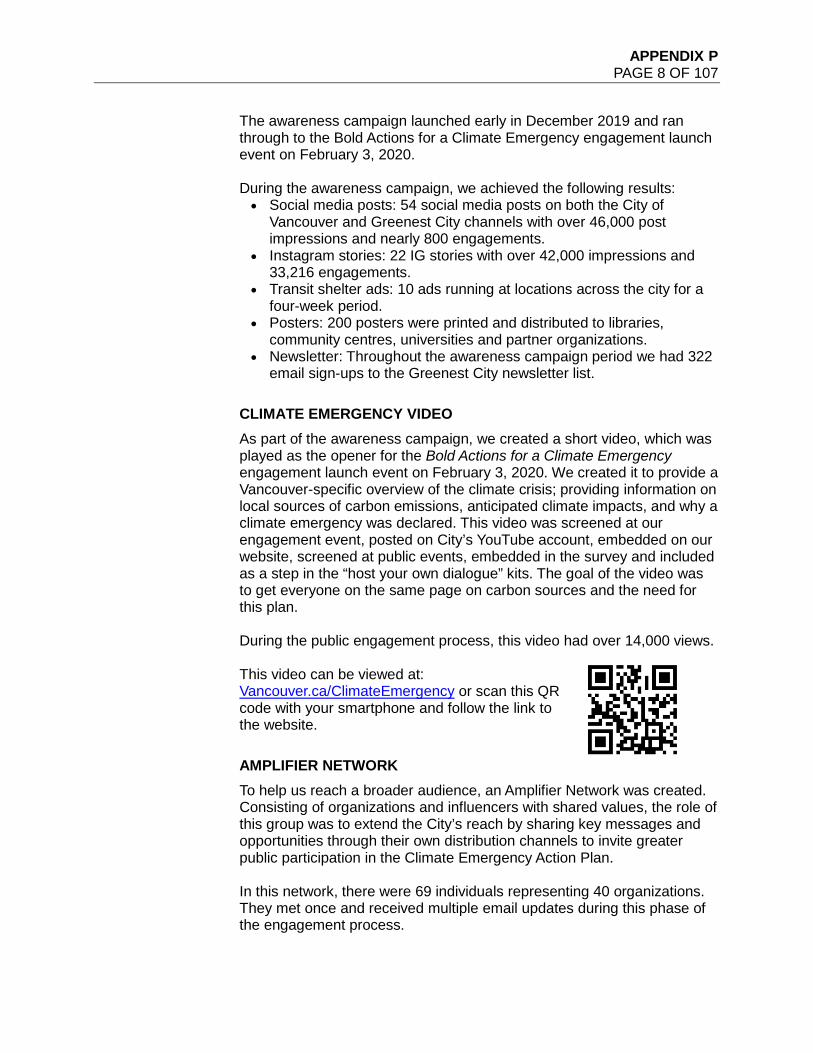
APPENDIX P PAGE 8 OF 107
The awareness campaign launched early in December 2019 and ran through to the Bold Actions for a Climate Emergency engagement launch event on February 3, 2020.
During the awareness campaign, we achieved the following results: • Social media posts: 54 social media posts on both the City of
Vancouver and Greenest City channels with over 46,000 post impressions and nearly 800 engagements.
• Instagram stories: 22 IG stories with over 42,000 impressions and 33,216 engagements.
• Transit shelter ads: 10 ads running at locations across the city for a four-week period.
• Posters: 200 posters were printed and distributed to libraries, community centres, universities and partner organizations.
• Newsletter: Throughout the awareness campaign period we had 322 email sign-ups to the Greenest City newsletter list.
CLIMATE EMERGENCY VIDEO As part of the awareness campaign, we created a short video, which was played as the opener for the Bold Actions for a Climate Emergency engagement launch event on February 3, 2020. We created it to provide a Vancouver-specific overview of the climate crisis; providing information on local sources of carbon emissions, anticipated climate impacts, and why a climate emergency was declared. This video was screened at our engagement event, posted on City’s YouTube account, embedded on our website, screened at public events, embedded in the survey and included as a step in the “host your own dialogue” kits. The goal of the video was to get everyone on the same page on carbon sources and the need for this plan.
During the public engagement process, this video had over 14,000 views.
This video can be viewed at: Vancouver.ca/ClimateEmergency or scan this QR code with your smartphone and follow the link to the website.
AMPLIFIER NETWORK To help us reach a broader audience, an Amplifier Network was created. Consisting of organizations and influencers with shared values, the role of this group was to extend the City’s reach by sharing key messages and opportunities through their own distribution channels to invite greater public participation in the Climate Emergency Action Plan.
In this network, there were 69 individuals representing 40 organizations. They met once and received multiple email updates during this phase of the engagement process.
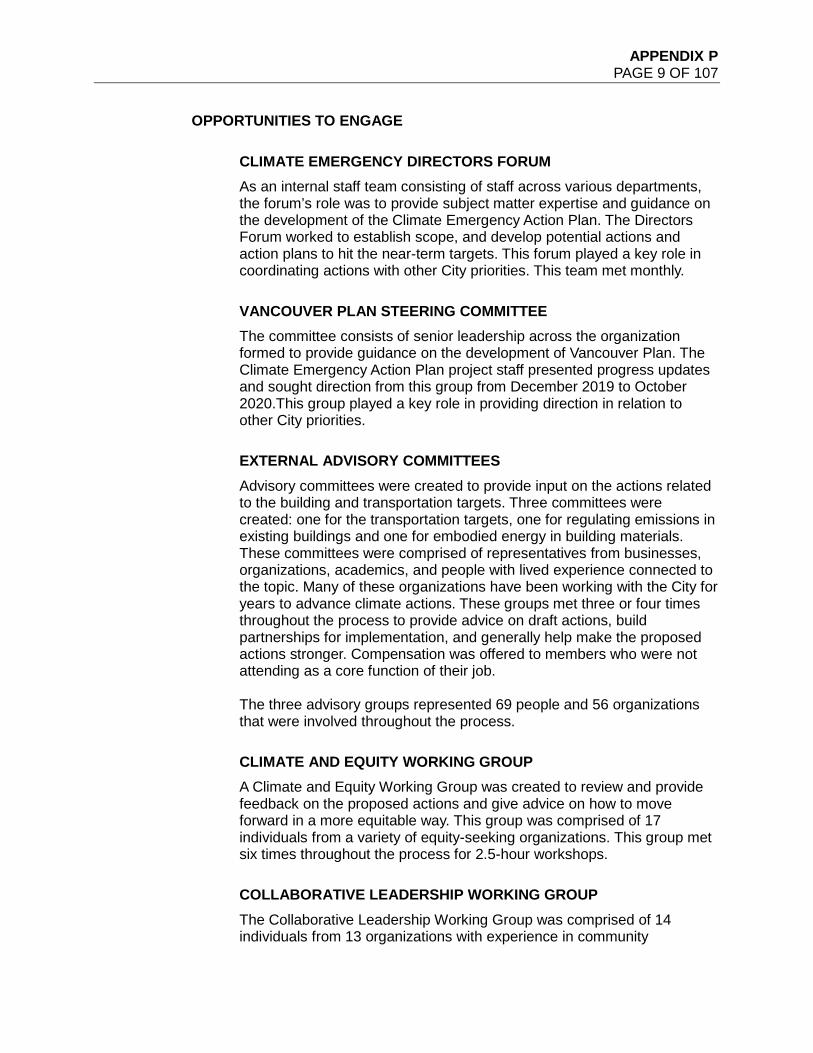
APPENDIX P PAGE 9 OF 107
OPPORTUNITIES TO ENGAGE
CLIMATE EMERGENCY DIRECTORS FORUM As an internal staff team consisting of staff across various departments, the forum’s role was to provide subject matter expertise and guidance on the development of the Climate Emergency Action Plan. The Directors Forum worked to establish scope, and develop potential actions and action plans to hit the near-term targets. This forum played a key role in coordinating actions with other City priorities. This team met monthly.
VANCOUVER PLAN STEERING COMMITTEE The committee consists of senior leadership across the organization formed to provide guidance on the development of Vancouver Plan. The Climate Emergency Action Plan project staff presented progress updates and sought direction from this group from December 2019 to October 2020.This group played a key role in providing direction in relation to other City priorities.
EXTERNAL ADVISORY COMMITTEES Advisory committees were created to provide input on the actions related to the building and transportation targets. Three committees were created: one for the transportation targets, one for regulating emissions in existing buildings and one for embodied energy in building materials. These committees were comprised of representatives from businesses, organizations, academics, and people with lived experience connected to the topic. Many of these organizations have been working with the City for years to advance climate actions. These groups met three or four times throughout the process to provide advice on draft actions, build partnerships for implementation, and generally help make the proposed actions stronger. Compensation was offered to members who were not attending as a core function of their job.
The three advisory groups represented 69 people and 56 organizations that were involved throughout the process.
CLIMATE AND EQUITY WORKING GROUP A Climate and Equity Working Group was created to review and provide feedback on the proposed actions and give advice on how to move forward in a more equitable way. This group was comprised of 17 individuals from a variety of equity-seeking organizations. This group met six times throughout the process for 2.5-hour workshops.
COLLABORATIVE LEADERSHIP WORKING GROUP The Collaborative Leadership Working Group was comprised of 14 individuals from 13 organizations with experience in community
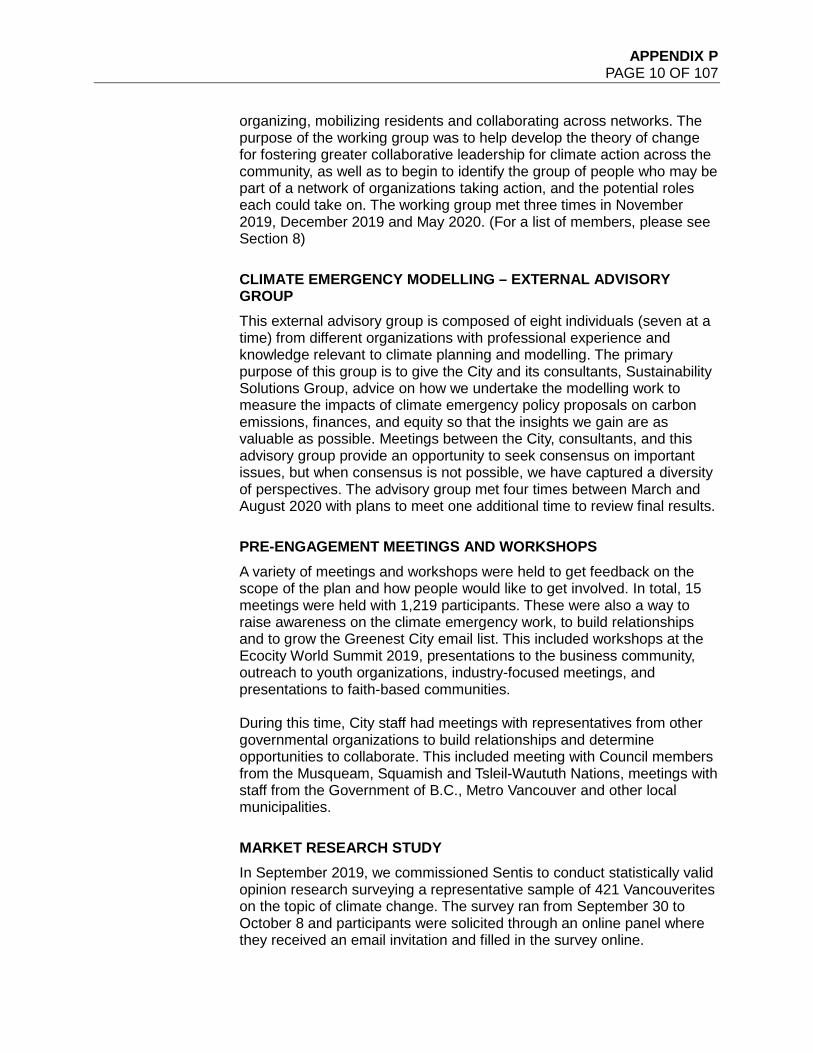
APPENDIX P PAGE 10 OF 107
organizing, mobilizing residents and collaborating across networks. The purpose of the working group was to help develop the theory of change for fostering greater collaborative leadership for climate action across the community, as well as to begin to identify the group of people who may be part of a network of organizations taking action, and the potential roles each could take on. The working group met three times in November 2019, December 2019 and May 2020. (For a list of members, please see Section 8)
CLIMATE EMERGENCY MODELLING – EXTERNAL ADVISORY GROUP This external advisory group is composed of eight individuals (seven at a time) from different organizations with professional experience and knowledge relevant to climate planning and modelling. The primary purpose of this group is to give the City and its consultants, Sustainability Solutions Group, advice on how we undertake the modelling work to measure the impacts of climate emergency policy proposals on carbon emissions, finances, and equity so that the insights we gain are as valuable as possible. Meetings between the City, consultants, and this advisory group provide an opportunity to seek consensus on important issues, but when consensus is not possible, we have captured a diversity of perspectives. The advisory group met four times between March and August 2020 with plans to meet one additional time to review final results.
PRE-ENGAGEMENT MEETINGS AND WORKSHOPS A variety of meetings and workshops were held to get feedback on the scope of the plan and how people would like to get involved. In total, 15 meetings were held with 1,219 participants. These were also a way to raise awareness on the climate emergency work, to build relationships and to grow the Greenest City email list. This included workshops at the Ecocity World Summit 2019, presentations to the business community, outreach to youth organizations, industry-focused meetings, and presentations to faith-based communities.
During this time, City staff had meetings with representatives from other governmental organizations to build relationships and determine opportunities to collaborate. This included meeting with Council members from the Musqueam, Squamish and Tsleil-Waututh Nations, meetings with staff from the Government of B.C., Metro Vancouver and other local municipalities.
MARKET RESEARCH STUDY In September 2019, we commissioned Sentis to conduct statistically valid opinion research surveying a representative sample of 421 Vancouverites on the topic of climate change. The survey ran from September 30 to October 8 and participants were solicited through an online panel where they received an email invitation and filled in the survey online.
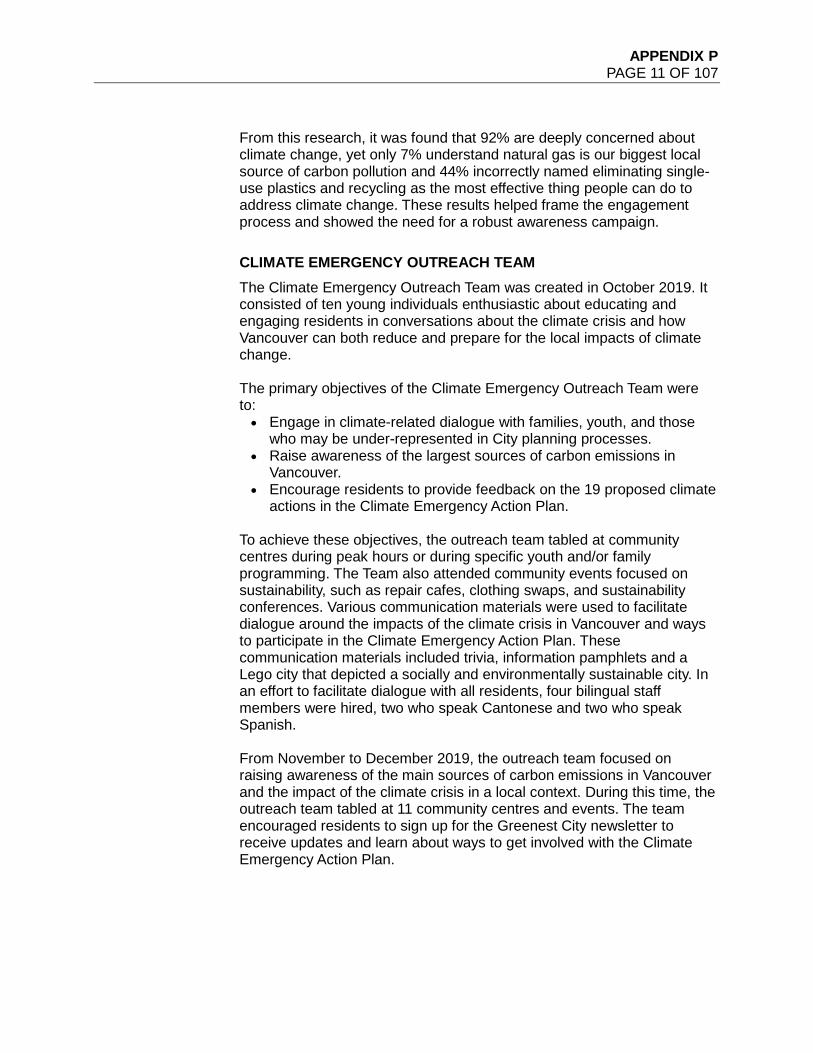
APPENDIX P PAGE 11 OF 107
From this research, it was found that 92% are deeply concerned about climate change, yet only 7% understand natural gas is our biggest local source of carbon pollution and 44% incorrectly named eliminating single-use plastics and recycling as the most effective thing people can do to address climate change. These results helped frame the engagement process and showed the need for a robust awareness campaign.
CLIMATE EMERGENCY OUTREACH TEAM The Climate Emergency Outreach Team was created in October 2019. It consisted of ten young individuals enthusiastic about educating and engaging residents in conversations about the climate crisis and how Vancouver can both reduce and prepare for the local impacts of climate change. The primary objectives of the Climate Emergency Outreach Team were to: • Engage in climate-related dialogue with families, youth, and those
who may be under-represented in City planning processes. • Raise awareness of the largest sources of carbon emissions in
Vancouver. • Encourage residents to provide feedback on the 19 proposed climate
actions in the Climate Emergency Action Plan. To achieve these objectives, the outreach team tabled at community centres during peak hours or during specific youth and/or family programming. The Team also attended community events focused on sustainability, such as repair cafes, clothing swaps, and sustainability conferences. Various communication materials were used to facilitate dialogue around the impacts of the climate crisis in Vancouver and ways to participate in the Climate Emergency Action Plan. These communication materials included trivia, information pamphlets and a Lego city that depicted a socially and environmentally sustainable city. In an effort to facilitate dialogue with all residents, four bilingual staff members were hired, two who speak Cantonese and two who speak Spanish. From November to December 2019, the outreach team focused on raising awareness of the main sources of carbon emissions in Vancouver and the impact of the climate crisis in a local context. During this time, the outreach team tabled at 11 community centres and events. The team encouraged residents to sign up for the Greenest City newsletter to receive updates and learn about ways to get involved with the Climate Emergency Action Plan.
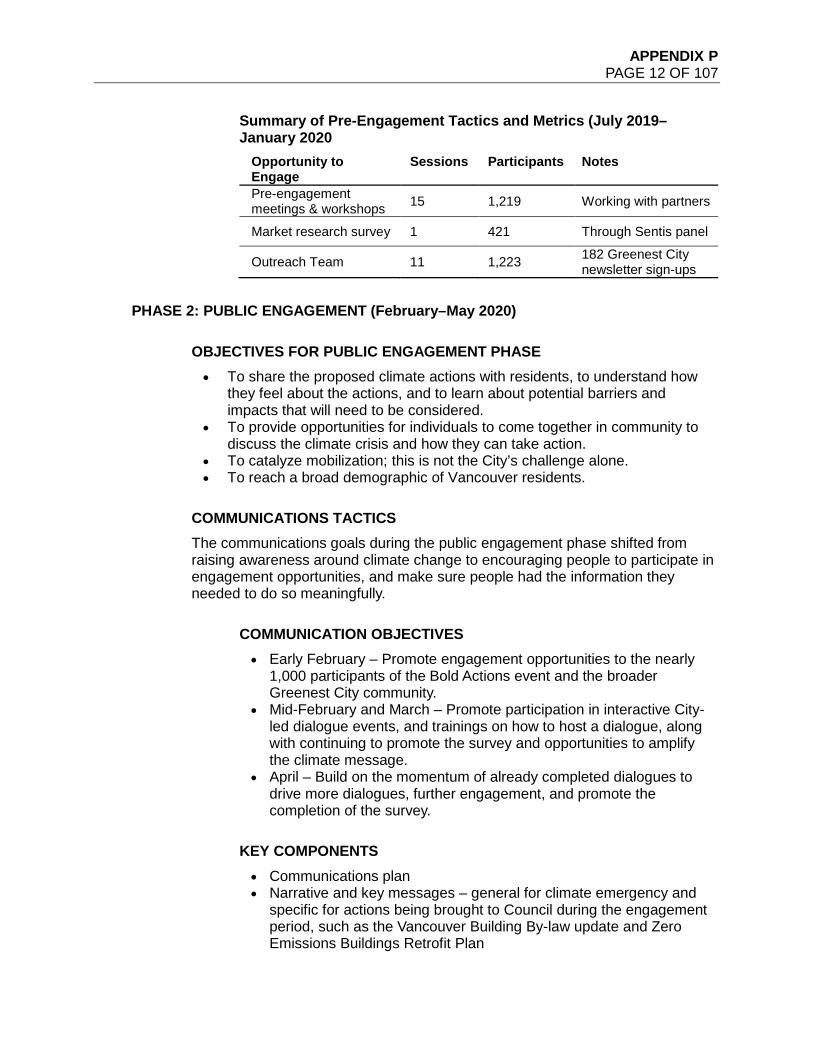
APPENDIX P PAGE 12 OF 107
Summary of Pre-Engagement Tactics and Metrics (July 2019–January 2020
Opportunity to Engage
Sessions Participants Notes
Pre-engagement meetings & workshops 15 1,219 Working with partners
Market research survey 1 421 Through Sentis panel
Outreach Team 11 1,223 182 Greenest City newsletter sign-ups
PHASE 2: PUBLIC ENGAGEMENT (February–May 2020)
OBJECTIVES FOR PUBLIC ENGAGEMENT PHASE • To share the proposed climate actions with residents, to understand how
they feel about the actions, and to learn about potential barriers and impacts that will need to be considered.
• To provide opportunities for individuals to come together in community to discuss the climate crisis and how they can take action.
• To catalyze mobilization; this is not the City’s challenge alone. • To reach a broad demographic of Vancouver residents.
COMMUNICATIONS TACTICS The communications goals during the public engagement phase shifted from raising awareness around climate change to encouraging people to participate in engagement opportunities, and make sure people had the information they needed to do so meaningfully.
COMMUNICATION OBJECTIVES • Early February – Promote engagement opportunities to the nearly
1,000 participants of the Bold Actions event and the broader Greenest City community.
• Mid-February and March – Promote participation in interactive City-led dialogue events, and trainings on how to host a dialogue, along with continuing to promote the survey and opportunities to amplify the climate message.
• April – Build on the momentum of already completed dialogues to drive more dialogues, further engagement, and promote the completion of the survey.
KEY COMPONENTS • Communications plan • Narrative and key messages – general for climate emergency and
specific for actions being brought to Council during the engagement period, such as the Vancouver Building By-law update and Zero Emissions Buildings Retrofit Plan
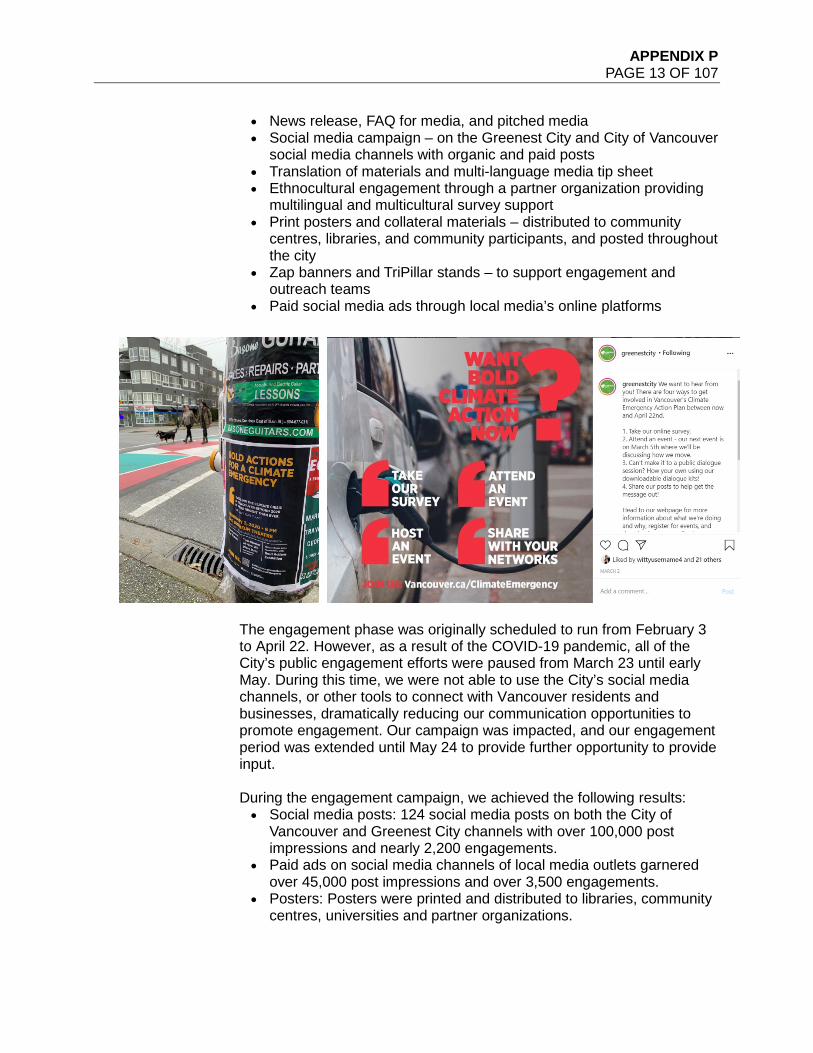
APPENDIX P PAGE 13 OF 107
• News release, FAQ for media, and pitched media • Social media campaign – on the Greenest City and City of Vancouver
social media channels with organic and paid posts • Translation of materials and multi-language media tip sheet • Ethnocultural engagement through a partner organization providing
multilingual and multicultural survey support • Print posters and collateral materials – distributed to community
centres, libraries, and community participants, and posted throughout the city
• Zap banners and TriPillar stands – to support engagement and outreach teams
• Paid social media ads through local media’s online platforms
The engagement phase was originally scheduled to run from February 3 to April 22. However, as a result of the COVID-19 pandemic, all of the City’s public engagement efforts were paused from March 23 until early May. During this time, we were not able to use the City’s social media channels, or other tools to connect with Vancouver residents and businesses, dramatically reducing our communication opportunities to promote engagement. Our campaign was impacted, and our engagement period was extended until May 24 to provide further opportunity to provide input.
During the engagement campaign, we achieved the following results: • Social media posts: 124 social media posts on both the City of
Vancouver and Greenest City channels with over 100,000 post impressions and nearly 2,200 engagements.
• Paid ads on social media channels of local media outlets garnered over 45,000 post impressions and over 3,500 engagements.
• Posters: Posters were printed and distributed to libraries, community centres, universities and partner organizations.
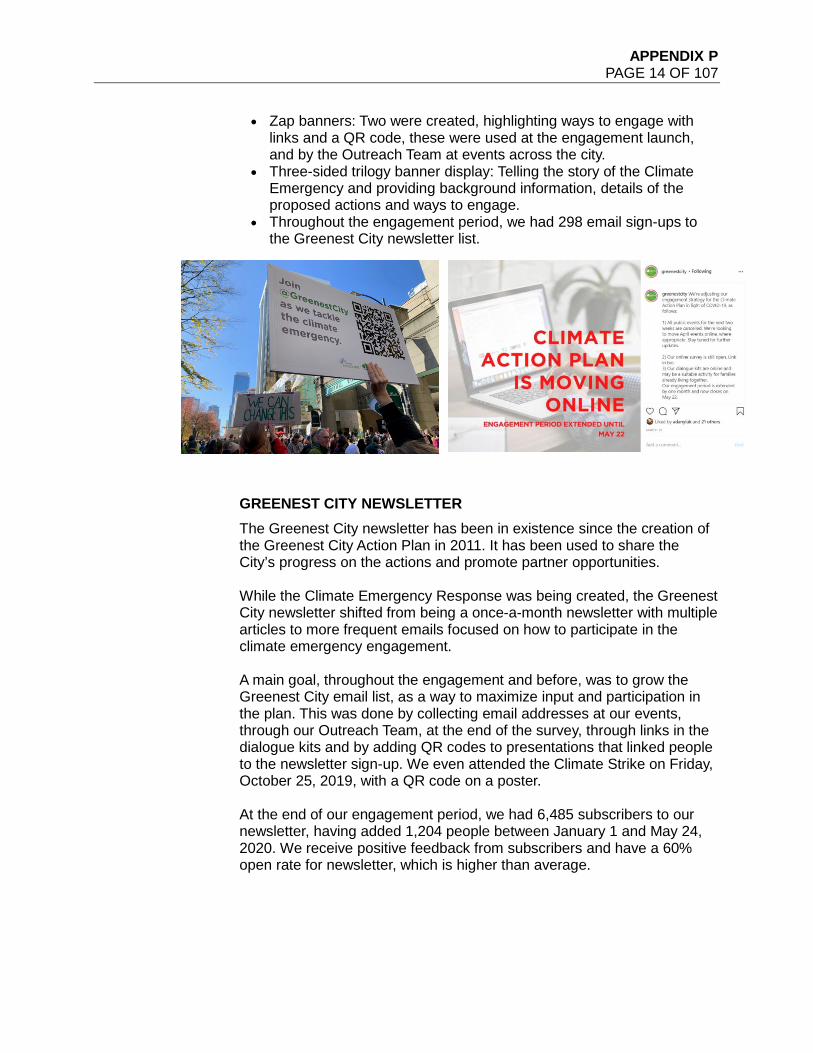
APPENDIX P PAGE 14 OF 107
• Zap banners: Two were created, highlighting ways to engage with links and a QR code, these were used at the engagement launch, and by the Outreach Team at events across the city.
• Three-sided trilogy banner display: Telling the story of the Climate Emergency and providing background information, details of the proposed actions and ways to engage.
• Throughout the engagement period, we had 298 email sign-ups to the Greenest City newsletter list.
GREENEST CITY NEWSLETTER The Greenest City newsletter has been in existence since the creation of the Greenest City Action Plan in 2011. It has been used to share the City’s progress on the actions and promote partner opportunities. While the Climate Emergency Response was being created, the Greenest City newsletter shifted from being a once-a-month newsletter with multiple articles to more frequent emails focused on how to participate in the climate emergency engagement. A main goal, throughout the engagement and before, was to grow the Greenest City email list, as a way to maximize input and participation in the plan. This was done by collecting email addresses at our events, through our Outreach Team, at the end of the survey, through links in the dialogue kits and by adding QR codes to presentations that linked people to the newsletter sign-up. We even attended the Climate Strike on Friday, October 25, 2019, with a QR code on a poster. At the end of our engagement period, we had 6,485 subscribers to our newsletter, having added 1,204 people between January 1 and May 24, 2020. We receive positive feedback from subscribers and have a 60% open rate for newsletter, which is higher than average.

APPENDIX P PAGE 15 OF 107
OPPORTUNITIES TO ENGAGE There were several opportunities for residents, partners, and stakeholders to engage in the Climate Emergency Action Plan. A list of opportunities to engagement and number of participants each opportunity reached is included at the end of this section.
LAUNCH EVENT – BOLD ACTIONS FOR A CLIMATE EMERGENCY The engagement process was launched February 3, 2020, at an event called Bold Actions for a Climate Emergency with 953 people in attendance. The event also included 15 organizations involved in program and exhibit. Held at the Orpheum, and hosted by Johanna Wagstaffe of the CBC, it was framed as a conversation on what climate emergency means for Vancouver and what we need to do to get real about it. It ended with a call-to-action to participate in our engagement process. The evening featured a climate quiz from the Sustainabiliteens (Vancouver’s youth climate justice movement), an overview of what climate change will mean for Vancouver given by UBC Professor Simon Donner, and a talk given by Squamish Nation Councillor Khelsilem about centring equity in climate action. Am Johal, Director of SFU’s Office of Community Engagement, moderated a panel conversation called “true stories from when we were bold” to draw parallels from other societal changes that were hard fought and how we could apply the lessons learned to the climate crisis. This panel included Simon Donner and Khelsilem, who were joined by Chief Medical Health Officer of Vancouver Coastal Health, Dr. Patricia Daly, who spoke about anti-smoking legislation, and Tzeporah Berman, Director of Stand.earth who shared stories of the fight to protect Clayoquot Sound. Musical guest Hey Ocean! rounded out the evening’s programming. In the lobby, attendees could sign up for the Greenest City newsletter, and learn more about the climate emergency engagement process, or get plugged into local climate action work via exhibits from 11 Vancouver-based environmental groups and non-profits working on climate action. This was promoted using many of the visual assets created for the awareness campaign. Promotion took place using the following tactics: • City news release • City of Vancouver and Greenest City’s social media channels. • Event postering was done across the city • Advertising through our Amplifier Network • Greenest City Newsletter event promotion
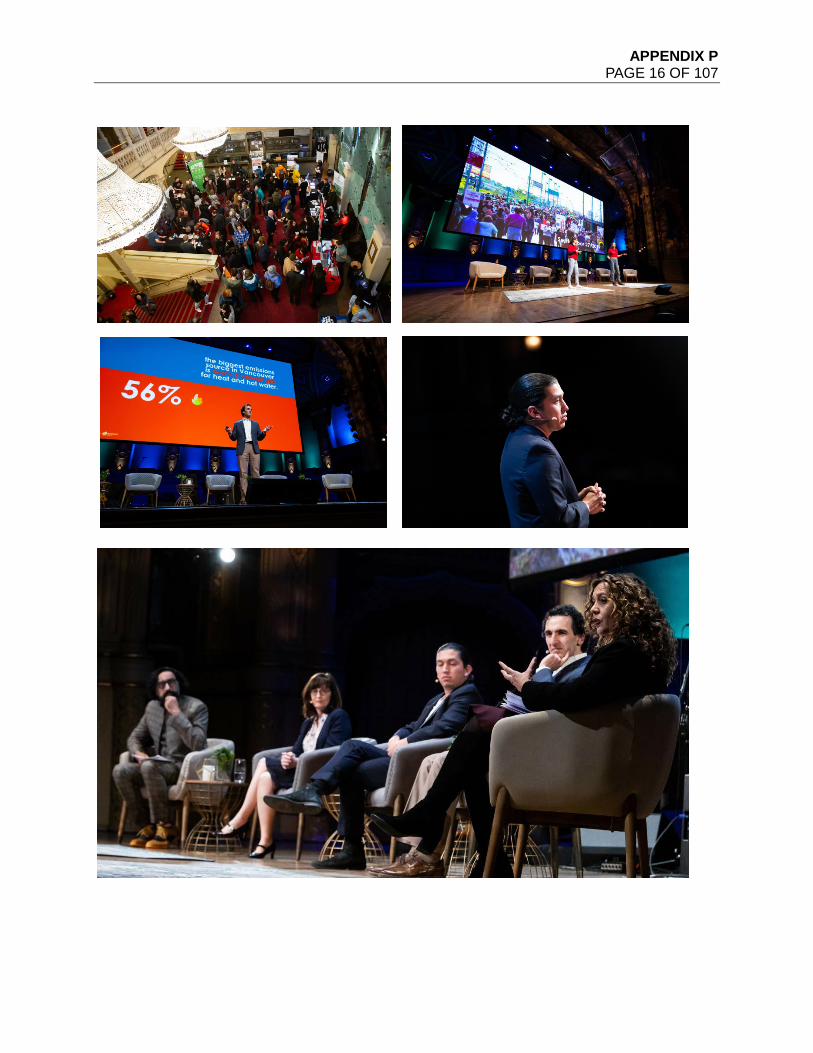
APPENDIX P PAGE 16 OF 107
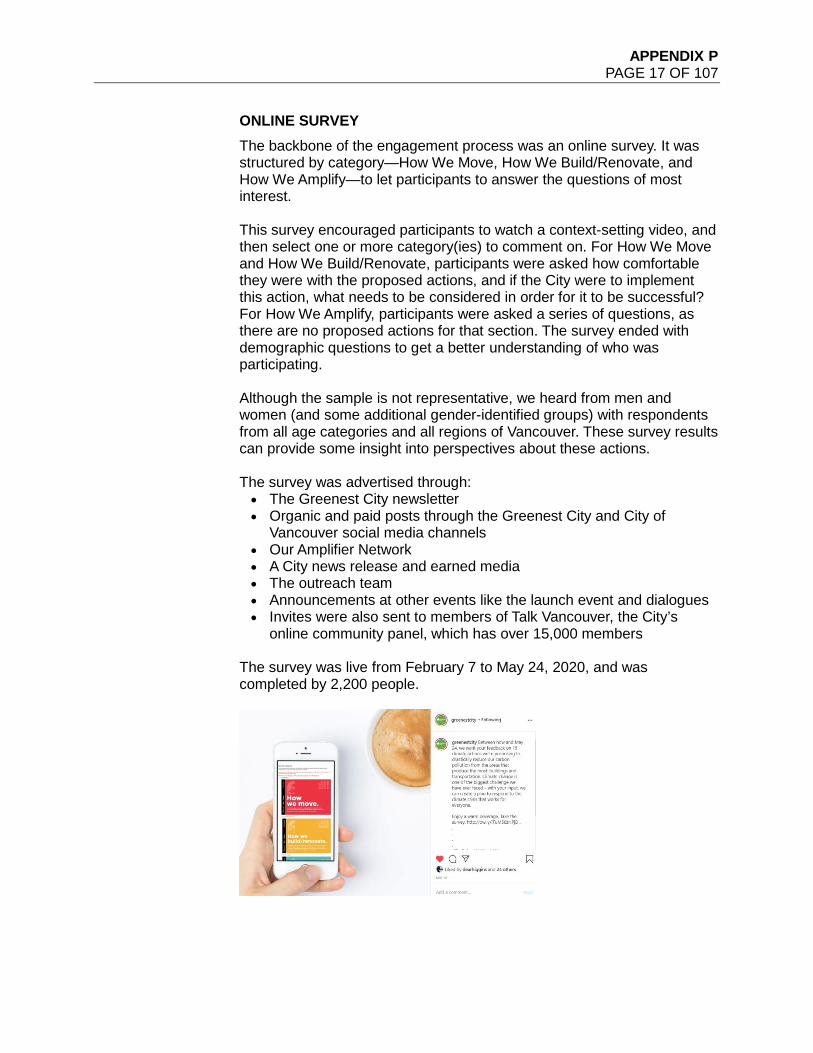
APPENDIX P PAGE 17 OF 107
ONLINE SURVEY The backbone of the engagement process was an online survey. It was structured by category—How We Move, How We Build/Renovate, and How We Amplify—to let participants to answer the questions of most interest. This survey encouraged participants to watch a context-setting video, and then select one or more category(ies) to comment on. For How We Move and How We Build/Renovate, participants were asked how comfortable they were with the proposed actions, and if the City were to implement this action, what needs to be considered in order for it to be successful? For How We Amplify, participants were asked a series of questions, as there are no proposed actions for that section. The survey ended with demographic questions to get a better understanding of who was participating. Although the sample is not representative, we heard from men and women (and some additional gender-identified groups) with respondents from all age categories and all regions of Vancouver. These survey results can provide some insight into perspectives about these actions. The survey was advertised through: • The Greenest City newsletter • Organic and paid posts through the Greenest City and City of
Vancouver social media channels • Our Amplifier Network • A City news release and earned media • The outreach team • Announcements at other events like the launch event and dialogues • Invites were also sent to members of Talk Vancouver, the City’s
online community panel, which has over 15,000 members
The survey was live from February 7 to May 24, 2020, and was completed by 2,200 people.
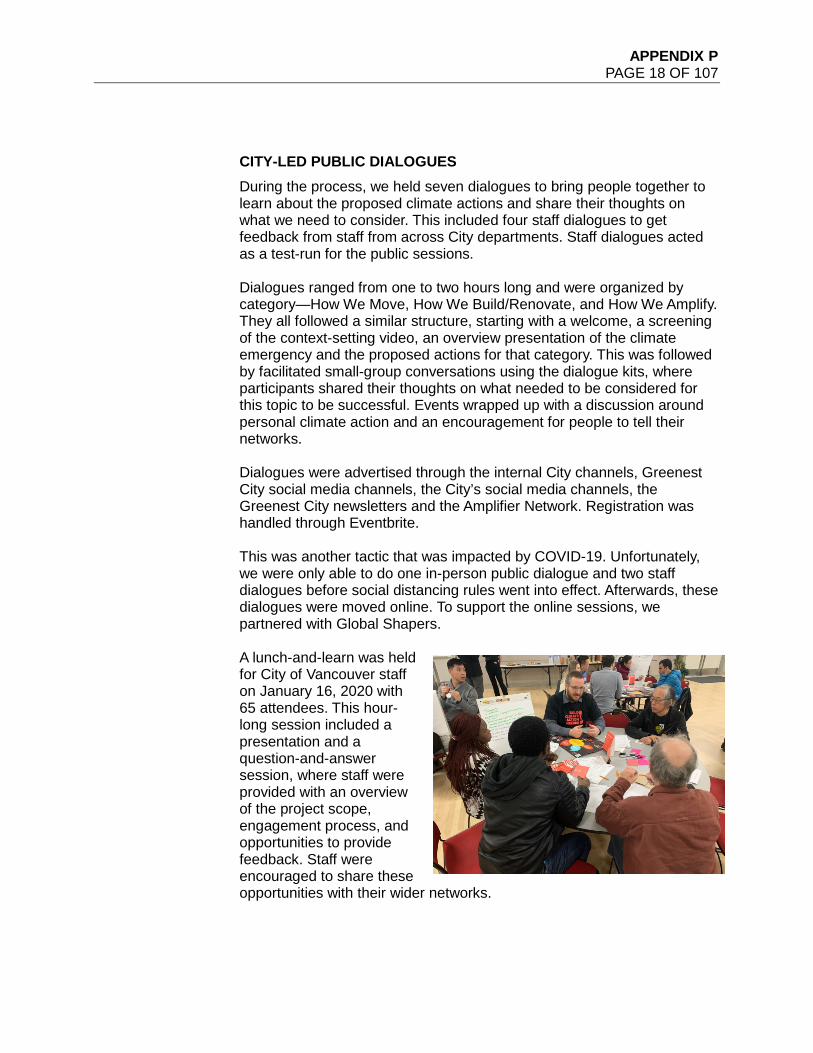
APPENDIX P PAGE 18 OF 107
CITY-LED PUBLIC DIALOGUES During the process, we held seven dialogues to bring people together to learn about the proposed climate actions and share their thoughts on what we need to consider. This included four staff dialogues to get feedback from staff from across City departments. Staff dialogues acted as a test-run for the public sessions. Dialogues ranged from one to two hours long and were organized by category—How We Move, How We Build/Renovate, and How We Amplify. They all followed a similar structure, starting with a welcome, a screening of the context-setting video, an overview presentation of the climate emergency and the proposed actions for that category. This was followed by facilitated small-group conversations using the dialogue kits, where participants shared their thoughts on what needed to be considered for this topic to be successful. Events wrapped up with a discussion around personal climate action and an encouragement for people to tell their networks. Dialogues were advertised through the internal City channels, Greenest City social media channels, the City’s social media channels, the Greenest City newsletters and the Amplifier Network. Registration was handled through Eventbrite. This was another tactic that was impacted by COVID-19. Unfortunately, we were only able to do one in-person public dialogue and two staff dialogues before social distancing rules went into effect. Afterwards, these dialogues were moved online. To support the online sessions, we partnered with Global Shapers. A lunch-and-learn was held for City of Vancouver staff on January 16, 2020 with 65 attendees. This hour-long session included a presentation and a question-and-answer session, where staff were provided with an overview of the project scope, engagement process, and opportunities to provide feedback. Staff were encouraged to share these opportunities with their wider networks.
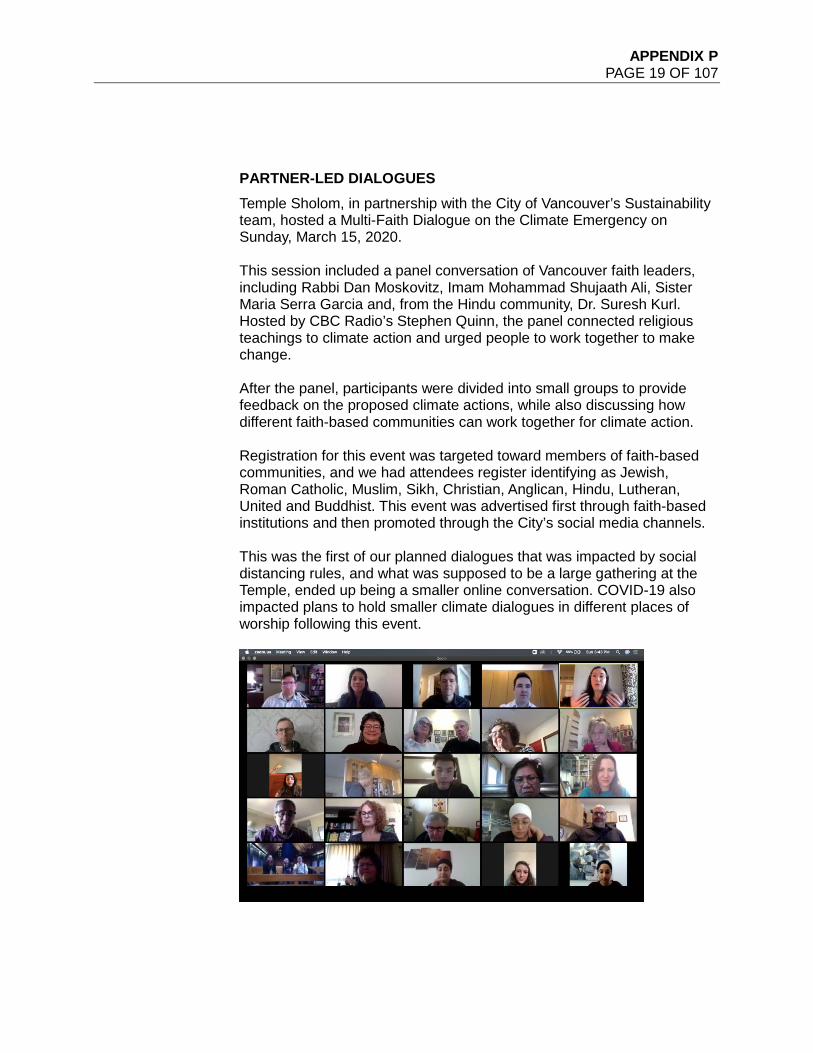
APPENDIX P PAGE 19 OF 107
PARTNER-LED DIALOGUES Temple Sholom, in partnership with the City of Vancouver’s Sustainability team, hosted a Multi-Faith Dialogue on the Climate Emergency on Sunday, March 15, 2020. This session included a panel conversation of Vancouver faith leaders, including Rabbi Dan Moskovitz, Imam Mohammad Shujaath Ali, Sister Maria Serra Garcia and, from the Hindu community, Dr. Suresh Kurl. Hosted by CBC Radio’s Stephen Quinn, the panel connected religious teachings to climate action and urged people to work together to make change. After the panel, participants were divided into small groups to provide feedback on the proposed climate actions, while also discussing how different faith-based communities can work together for climate action. Registration for this event was targeted toward members of faith-based communities, and we had attendees register identifying as Jewish, Roman Catholic, Muslim, Sikh, Christian, Anglican, Hindu, Lutheran, United and Buddhist. This event was advertised first through faith-based institutions and then promoted through the City’s social media channels. This was the first of our planned dialogues that was impacted by social distancing rules, and what was supposed to be a large gathering at the Temple, ended up being a smaller online conversation. COVID-19 also impacted plans to hold smaller climate dialogues in different places of worship following this event.
APPENDIX P PAGE 20 OF 107
PARTNER EVENTS During this time, City staff participated in a number of partner-led events, sitting on panel discussions, presenting on the project, and encouraging people to share their opinions and to sign up for our email list.
IN-LANGUAGE OUTREACH We hired Empower Me, a social enterprise that provides services to translate energy, utility and educational materials for multilingual, multicultural and vulnerable communities. Our goal was to reach Punjabi-, Cantonese- and Mandarin-speaking audiences in Vancouver. Originally, this was envisioned as six different in-language dialogues with community groups. However, this tactic shifted to individual phone interviews when social distancing rules went into effect due to COVID-19. Participants were asked a subset of questions from the online survey, including feelings toward climate change, comfort level for the game-changer actions, and what the City needs to consider to make these actions successful. Interviewers translated results and entered them in our online survey. In total, 94 interviews were conducted with 28 done in Cantonese, 45 in Mandarin and 21 in Punjabi.
DIALOGUE KITS Dialogue kits were created to support City-run dialogues and enable anyone to host their own conversation to provide feedback on draft actions. This approach was taken for a number of reasons:
• After the 100,000-person climate strike on September 27, 2019,
there were many climate action conversations being hosted in community centres, boardrooms, coffee shops, places of worship and dining rooms, as people struggled to figure out what to do next. We wanted to create a way to tap into that energy.
• There were many organizations connecting with the City to co-host events on this topic, but we have limited staff capacity to work with everyone.
• The climate crisis is a heavy topic. Our hope was that having a conversation about climate actions with peers through a structured dialogue was a way to combat climate grief and anxiety.
• The decentralized approach would also help us connect with audiences we were not connected to.
• These kits functioned like a meeting-in-a-box that could be easily plugged into existing programming.
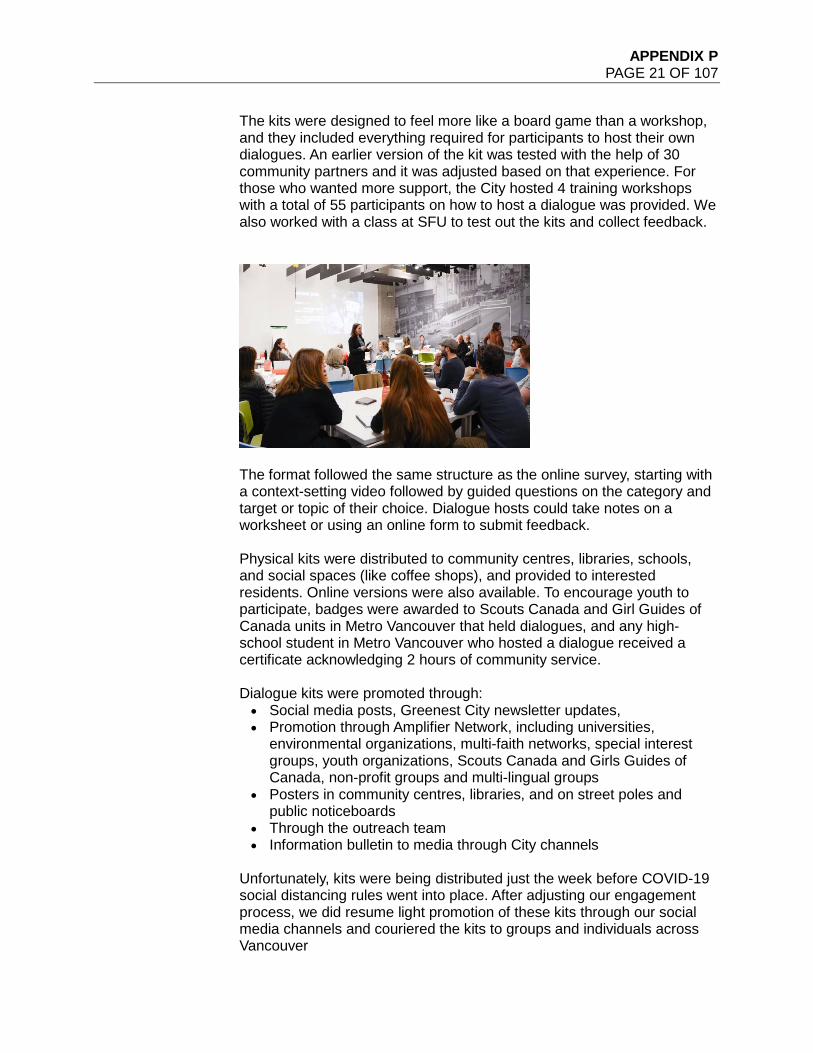
APPENDIX P PAGE 21 OF 107
The kits were designed to feel more like a board game than a workshop, and they included everything required for participants to host their own dialogues. An earlier version of the kit was tested with the help of 30 community partners and it was adjusted based on that experience. For those who wanted more support, the City hosted 4 training workshops with a total of 55 participants on how to host a dialogue was provided. We also worked with a class at SFU to test out the kits and collect feedback.
The format followed the same structure as the online survey, starting with a context-setting video followed by guided questions on the category and target or topic of their choice. Dialogue hosts could take notes on a worksheet or using an online form to submit feedback. Physical kits were distributed to community centres, libraries, schools, and social spaces (like coffee shops), and provided to interested residents. Online versions were also available. To encourage youth to participate, badges were awarded to Scouts Canada and Girl Guides of Canada units in Metro Vancouver that held dialogues, and any high-school student in Metro Vancouver who hosted a dialogue received a certificate acknowledging 2 hours of community service. Dialogue kits were promoted through: • Social media posts, Greenest City newsletter updates, • Promotion through Amplifier Network, including universities,
environmental organizations, multi-faith networks, special interest groups, youth organizations, Scouts Canada and Girls Guides of Canada, non-profit groups and multi-lingual groups
• Posters in community centres, libraries, and on street poles and public noticeboards
• Through the outreach team • Information bulletin to media through City channels
Unfortunately, kits were being distributed just the week before COVID-19 social distancing rules went into place. After adjusting our engagement process, we did resume light promotion of these kits through our social media channels and couriered the kits to groups and individuals across Vancouver
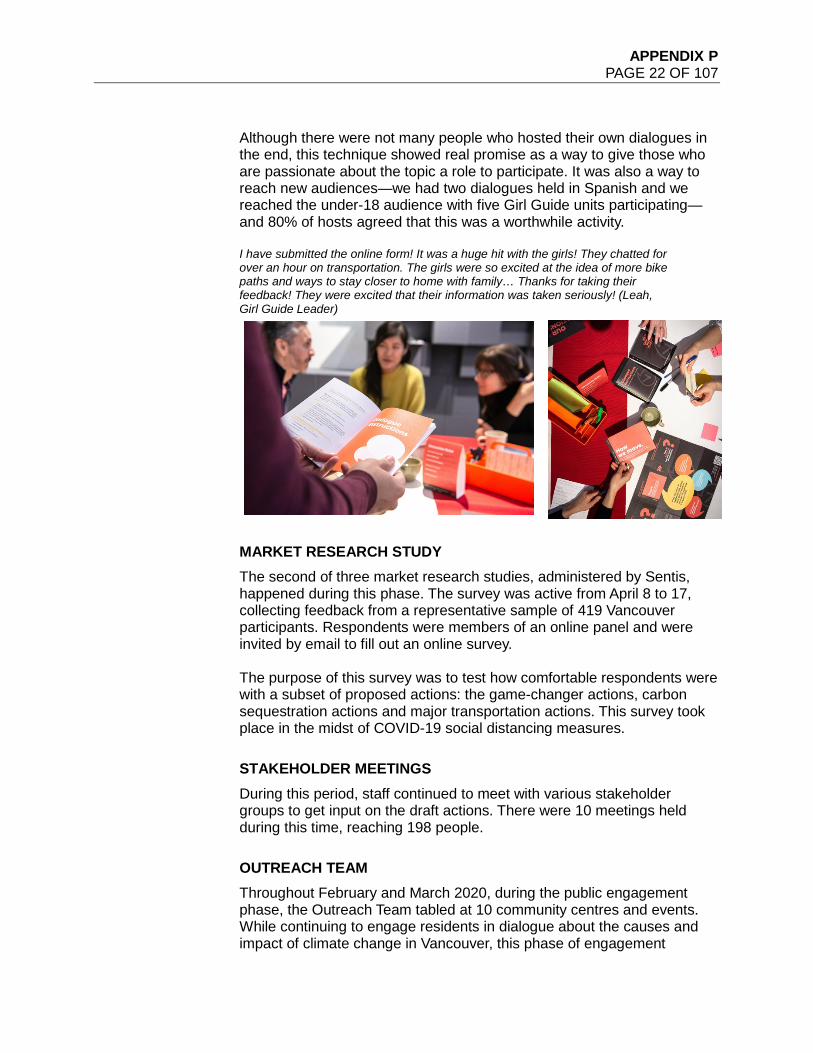
APPENDIX P PAGE 22 OF 107
Although there were not many people who hosted their own dialogues in the end, this technique showed real promise as a way to give those who are passionate about the topic a role to participate. It was also a way to reach new audiences—we had two dialogues held in Spanish and we reached the under-18 audience with five Girl Guide units participating—and 80% of hosts agreed that this was a worthwhile activity.
I have submitted the online form! It was a huge hit with the girls! They chatted for over an hour on transportation. The girls were so excited at the idea of more bike paths and ways to stay closer to home with family… Thanks for taking their feedback! They were excited that their information was taken seriously! (Leah, Girl Guide Leader)
MARKET RESEARCH STUDY The second of three market research studies, administered by Sentis, happened during this phase. The survey was active from April 8 to 17, collecting feedback from a representative sample of 419 Vancouver participants. Respondents were members of an online panel and were invited by email to fill out an online survey. The purpose of this survey was to test how comfortable respondents were with a subset of proposed actions: the game-changer actions, carbon sequestration actions and major transportation actions. This survey took place in the midst of COVID-19 social distancing measures.
STAKEHOLDER MEETINGS During this period, staff continued to meet with various stakeholder groups to get input on the draft actions. There were 10 meetings held during this time, reaching 198 people.
OUTREACH TEAM Throughout February and March 2020, during the public engagement phase, the Outreach Team tabled at 10 community centres and events. While continuing to engage residents in dialogue about the causes and impact of climate change in Vancouver, this phase of engagement
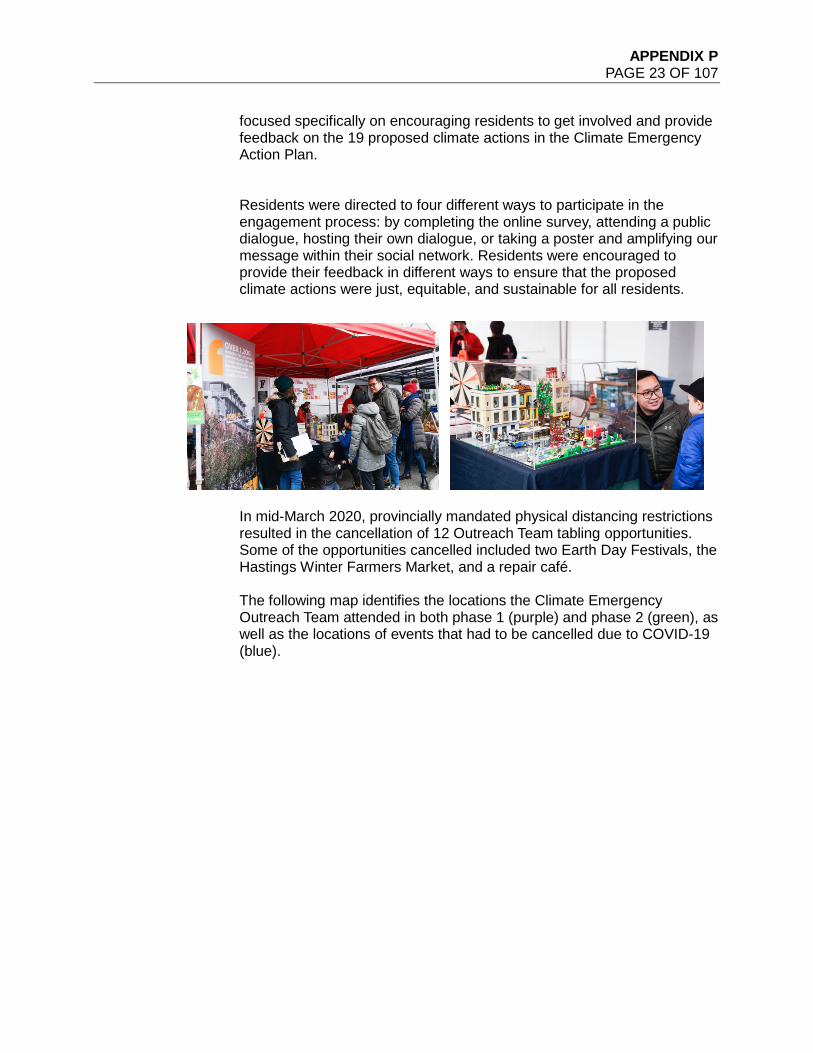
APPENDIX P PAGE 23 OF 107
focused specifically on encouraging residents to get involved and provide feedback on the 19 proposed climate actions in the Climate Emergency Action Plan. Residents were directed to four different ways to participate in the engagement process: by completing the online survey, attending a public dialogue, hosting their own dialogue, or taking a poster and amplifying our message within their social network. Residents were encouraged to provide their feedback in different ways to ensure that the proposed climate actions were just, equitable, and sustainable for all residents.
In mid-March 2020, provincially mandated physical distancing restrictions resulted in the cancellation of 12 Outreach Team tabling opportunities. Some of the opportunities cancelled included two Earth Day Festivals, the Hastings Winter Farmers Market, and a repair café. The following map identifies the locations the Climate Emergency Outreach Team attended in both phase 1 (purple) and phase 2 (green), as well as the locations of events that had to be cancelled due to COVID-19 (blue).
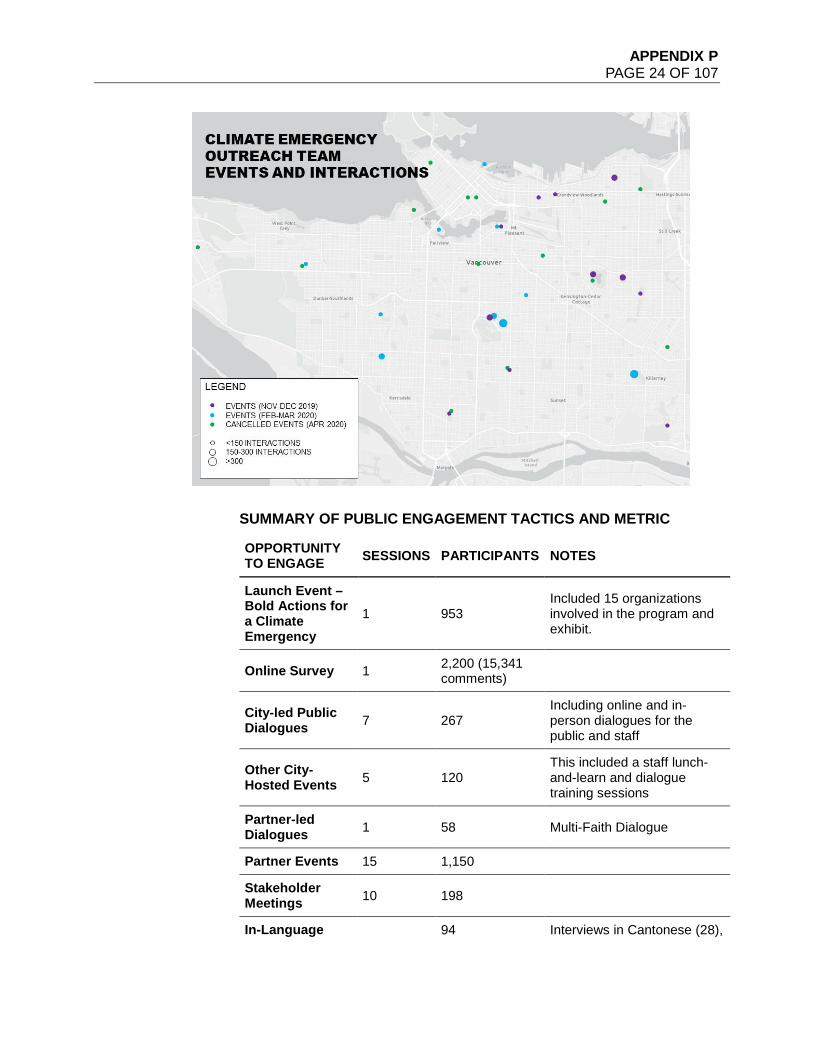
APPENDIX P PAGE 24 OF 107
SUMMARY OF PUBLIC ENGAGEMENT TACTICS AND METRIC
OPPORTUNITY TO ENGAGE SESSIONS PARTICIPANTS NOTES
Launch Event – Bold Actions for a Climate Emergency
1 953 Included 15 organizations involved in the program and exhibit.
Online Survey 1 2,200 (15,341 comments)
City-led Public Dialogues 7 267
Including online and in-person dialogues for the public and staff
Other City-Hosted Events 5 120
This included a staff lunch-and-learn and dialogue training sessions
Partner-led Dialogues 1 58 Multi-Faith Dialogue
Partner Events 15 1,150
Stakeholder Meetings 10 198
In-Language 94 Interviews in Cantonese (28),
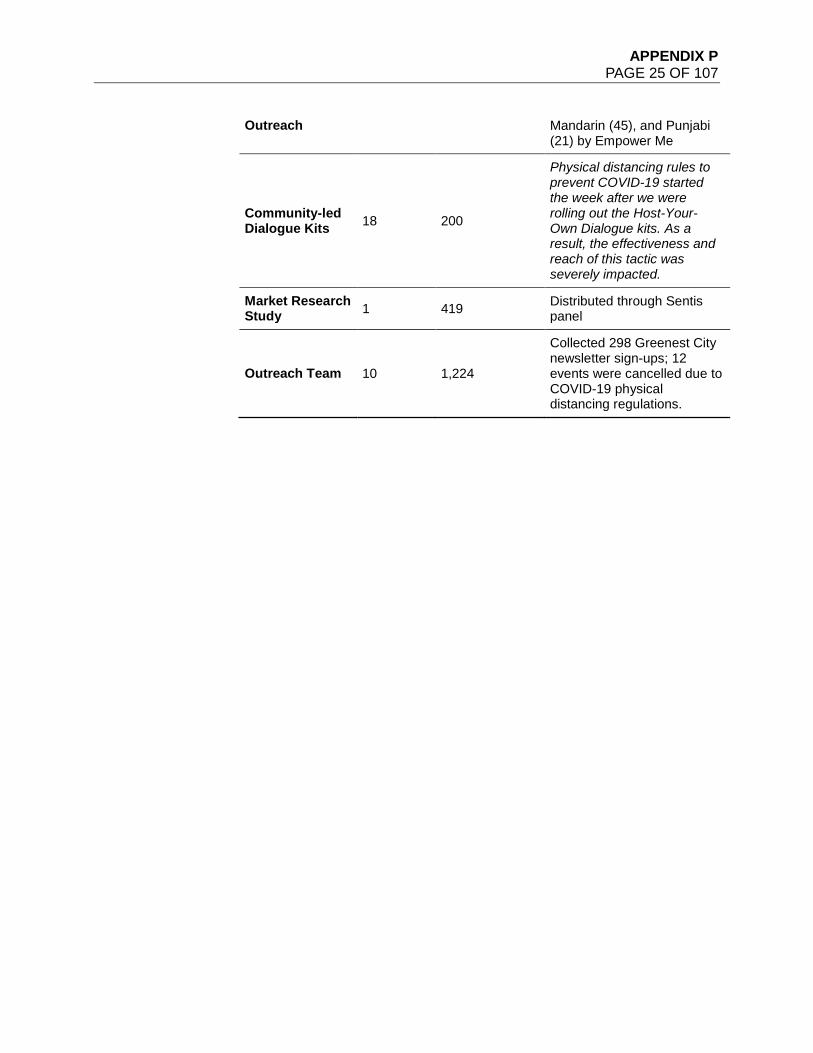
APPENDIX P PAGE 25 OF 107
Outreach Mandarin (45), and Punjabi (21) by Empower Me
Community-led Dialogue Kits 18 200
Physical distancing rules to prevent COVID-19 started the week after we were rolling out the Host-Your-Own Dialogue kits. As a result, the effectiveness and reach of this tactic was severely impacted.
Market Research Study 1 419 Distributed through Sentis
panel
Outreach Team 10 1,224
Collected 298 Greenest City newsletter sign-ups; 12 events were cancelled due to COVID-19 physical distancing regulations.
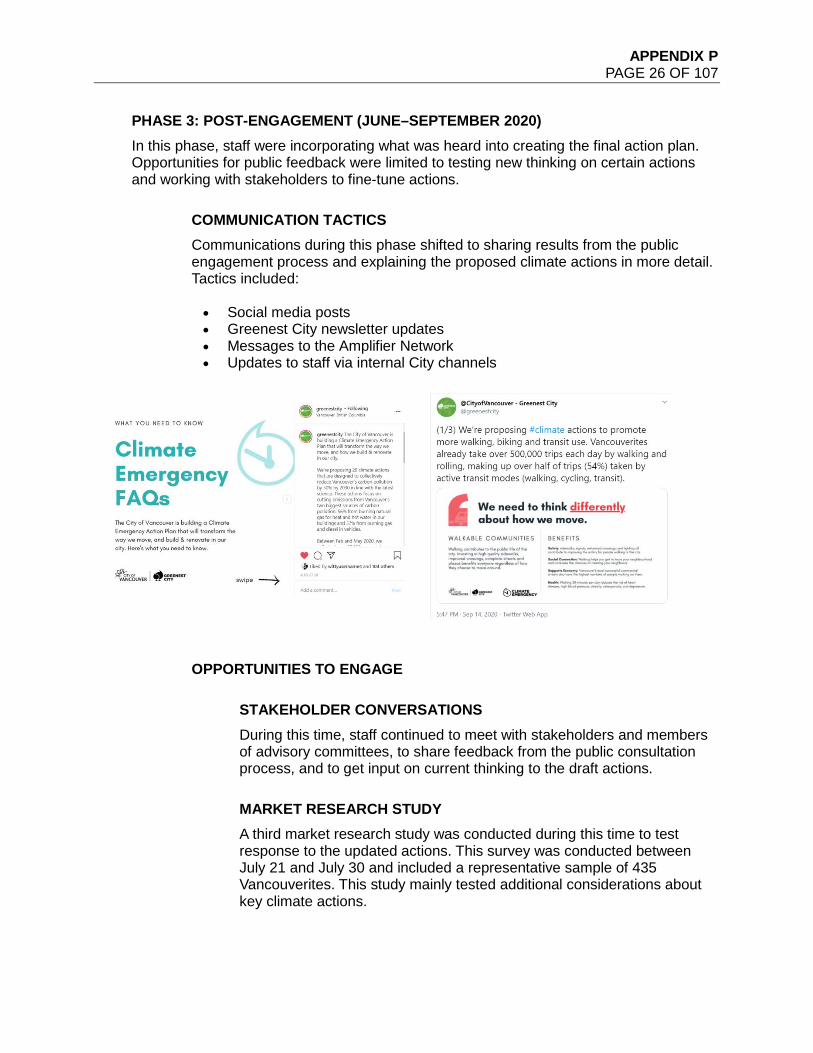
APPENDIX P PAGE 26 OF 107
PHASE 3: POST-ENGAGEMENT (JUNE–SEPTEMBER 2020) In this phase, staff were incorporating what was heard into creating the final action plan. Opportunities for public feedback were limited to testing new thinking on certain actions and working with stakeholders to fine-tune actions.
COMMUNICATION TACTICS Communications during this phase shifted to sharing results from the public engagement process and explaining the proposed climate actions in more detail. Tactics included:
• Social media posts • Greenest City newsletter updates • Messages to the Amplifier Network • Updates to staff via internal City channels
OPPORTUNITIES TO ENGAGE
STAKEHOLDER CONVERSATIONS During this time, staff continued to meet with stakeholders and members of advisory committees, to share feedback from the public consultation process, and to get input on current thinking to the draft actions.
MARKET RESEARCH STUDY A third market research study was conducted during this time to test response to the updated actions. This survey was conducted between July 21 and July 30 and included a representative sample of 435 Vancouverites. This study mainly tested additional considerations about key climate actions.
APPENDIX P PAGE 27 OF 107
ADVISORY COMMITTEES Our outreach to the City’s advisory committees to Council was impacted by COVID-19 during phase two. During this phase, we reached out to the advisory committees with an update on this plan, and to discuss equity. As most of these actions will require additional public consultation before they are finished, this meeting was also an opportunity for advisory committees to flag their interest in the actions they would like to provide input on as the implementation plan is being developed.
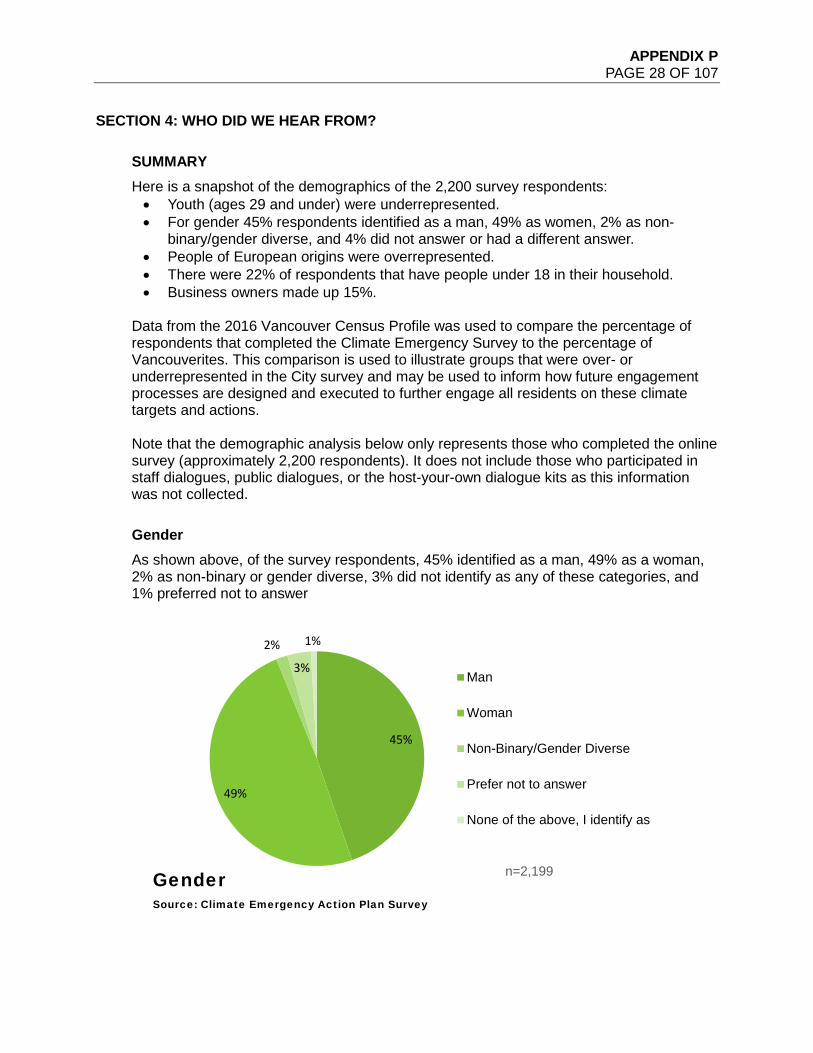
APPENDIX P PAGE 28 OF 107
SECTION 4: WHO DID WE HEAR FROM?
SUMMARY Here is a snapshot of the demographics of the 2,200 survey respondents: • Youth (ages 29 and under) were underrepresented. • For gender 45% respondents identified as a man, 49% as women, 2% as non-
binary/gender diverse, and 4% did not answer or had a different answer. • People of European origins were overrepresented. • There were 22% of respondents that have people under 18 in their household. • Business owners made up 15%.
Data from the 2016 Vancouver Census Profile was used to compare the percentage of respondents that completed the Climate Emergency Survey to the percentage of Vancouverites. This comparison is used to illustrate groups that were over- or underrepresented in the City survey and may be used to inform how future engagement processes are designed and executed to further engage all residents on these climate targets and actions. Note that the demographic analysis below only represents those who completed the online survey (approximately 2,200 respondents). It does not include those who participated in staff dialogues, public dialogues, or the host-your-own dialogue kits as this information was not collected.
Gender As shown above, of the survey respondents, 45% identified as a man, 49% as a woman, 2% as non-binary or gender diverse, 3% did not identify as any of these categories, and 1% preferred not to answer
45%
49%
2%
3%
1%
GenderSource: Climate Emergency Action Plan Survey
Man
Woman
Non-Binary/Gender Diverse
Prefer not to answer
None of the above, I identify as
n=2,199
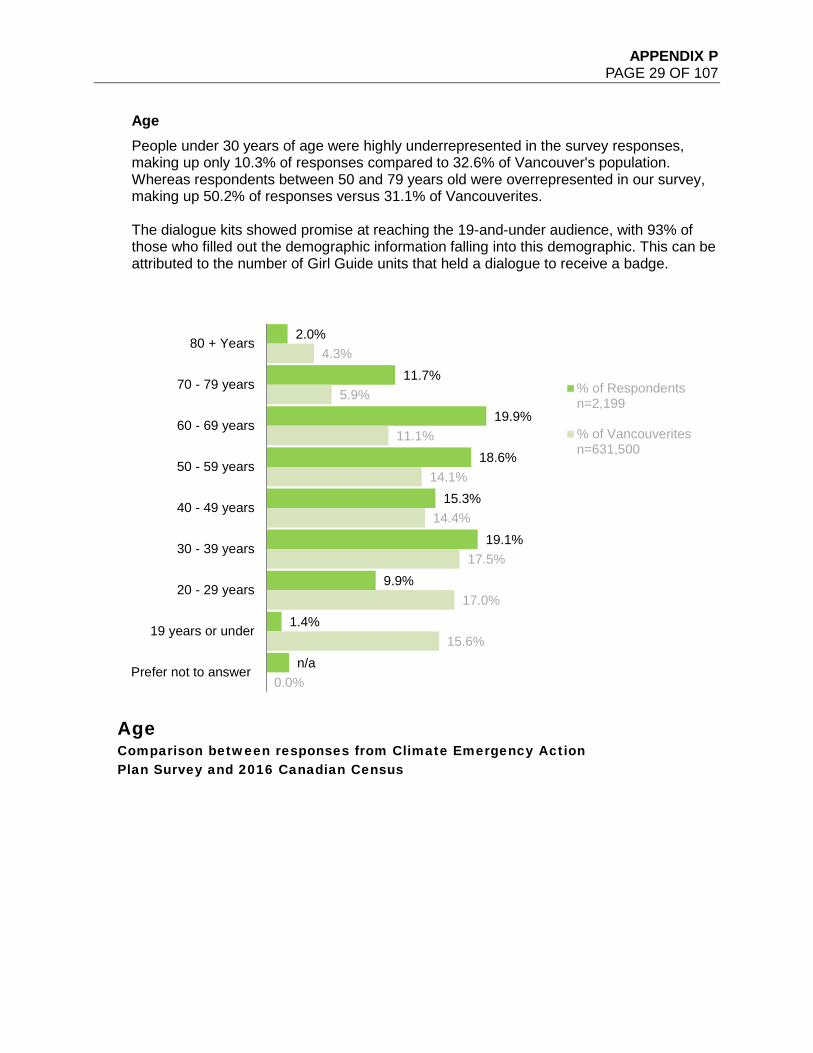
APPENDIX P PAGE 29 OF 107
Age People under 30 years of age were highly underrepresented in the survey responses, making up only 10.3% of responses compared to 32.6% of Vancouver's population. Whereas respondents between 50 and 79 years old were overrepresented in our survey, making up 50.2% of responses versus 31.1% of Vancouverites. The dialogue kits showed promise at reaching the 19-and-under audience, with 93% of those who filled out the demographic information falling into this demographic. This can be attributed to the number of Girl Guide units that held a dialogue to receive a badge.
2.0%
11.7%
19.9%
18.6%
15.3%
19.1%
9.9%
1.4%
n/a
4.3%
5.9%
11.1%
14.1%
14.4%
17.5%
17.0%
15.6%
0.0%
80 + Years
70 - 79 years
60 - 69 years
50 - 59 years
40 - 49 years
30 - 39 years
20 - 29 years
19 years or under
Prefer not to answer
AgeComparison between responses from Climate Emergency Action Plan Survey and 2016 Canadian Census
% of Respondentsn=2,199
% of Vancouveritesn=631,500
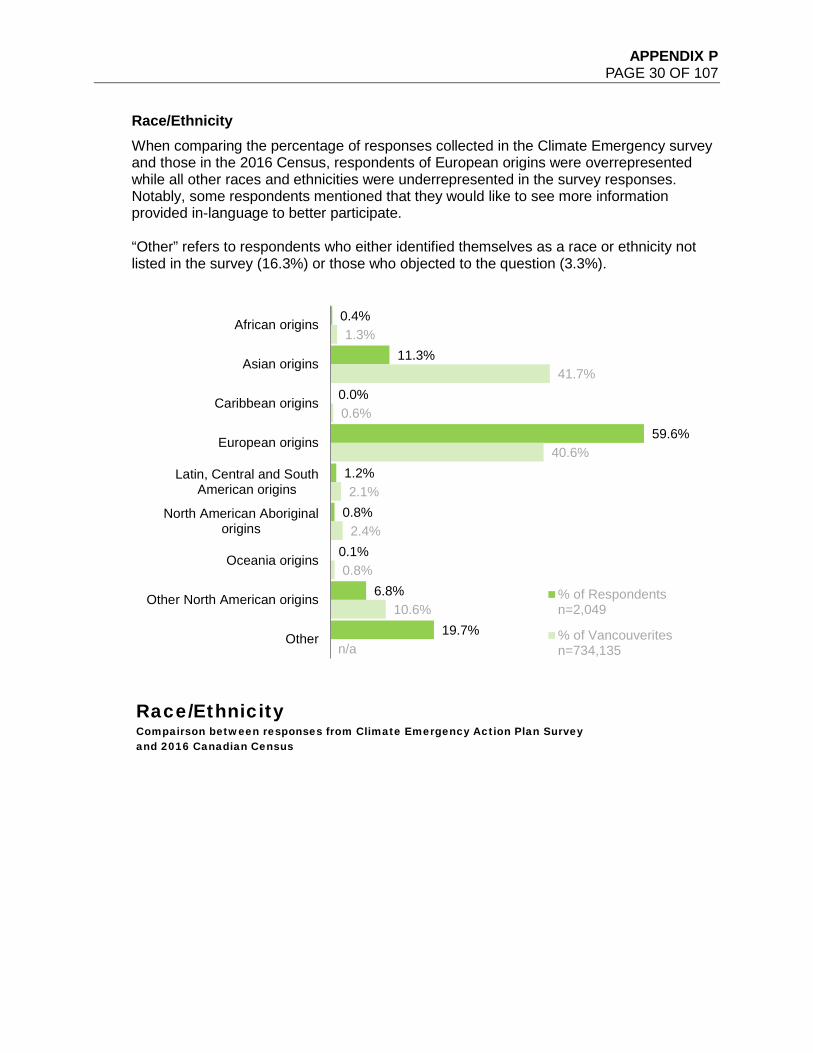
APPENDIX P PAGE 30 OF 107
Race/Ethnicity When comparing the percentage of responses collected in the Climate Emergency survey and those in the 2016 Census, respondents of European origins were overrepresented while all other races and ethnicities were underrepresented in the survey responses. Notably, some respondents mentioned that they would like to see more information provided in-language to better participate. “Other” refers to respondents who either identified themselves as a race or ethnicity not listed in the survey (16.3%) or those who objected to the question (3.3%).
0.4%
11.3%
0.0%
59.6%
1.2%
0.8%
0.1%
6.8%
19.7%
1.3%
41.7%
0.6%
40.6%
2.1%
2.4%
0.8%
10.6%
n/a
African origins
Asian origins
Caribbean origins
European origins
Latin, Central and SouthAmerican origins
North American Aboriginalorigins
Oceania origins
Other North American origins
Other
Race/EthnicityCompairson between responses from Climate Emergency Action Plan Survey and 2016 Canadian Census
% of Respondentsn=2,049
% of Vancouveritesn=734,135
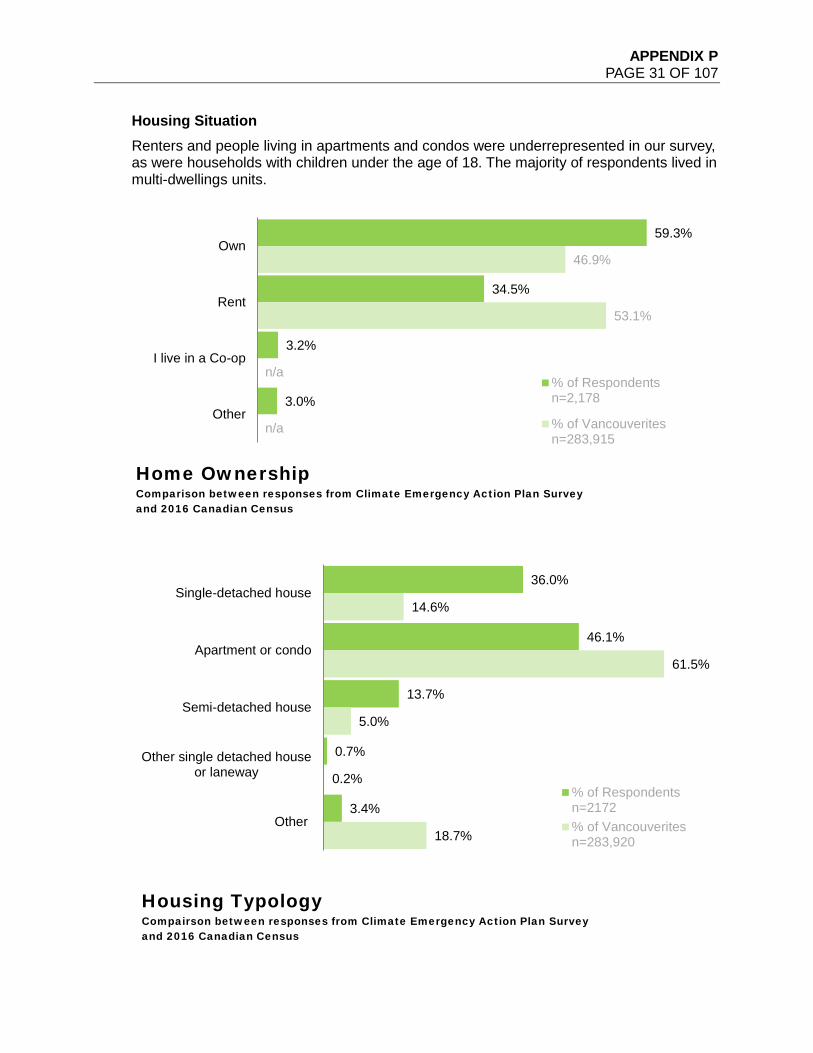
APPENDIX P PAGE 31 OF 107
Housing Situation Renters and people living in apartments and condos were underrepresented in our survey, as were households with children under the age of 18. The majority of respondents lived in multi-dwellings units.
59.3%
34.5%
3.2%
3.0%
46.9%
53.1%
n/a
n/a
Own
Rent
I live in a Co-op
Other
Home OwnershipComparison between responses from Climate Emergency Action Plan Survey and 2016 Canadian Census
% of Respondentsn=2,178
% of Vancouveritesn=283,915
36.0%
46.1%
13.7%
0.7%
3.4%
14.6%
61.5%
5.0%
0.2%
18.7%
Single-detached house
Apartment or condo
Semi-detached house
Other single detached houseor laneway
Other
Housing TypologyCompairson between responses from Climate Emergency Action Plan Survey and 2016 Canadian Census
% of Respondentsn=2172% of Vancouveritesn=283,920
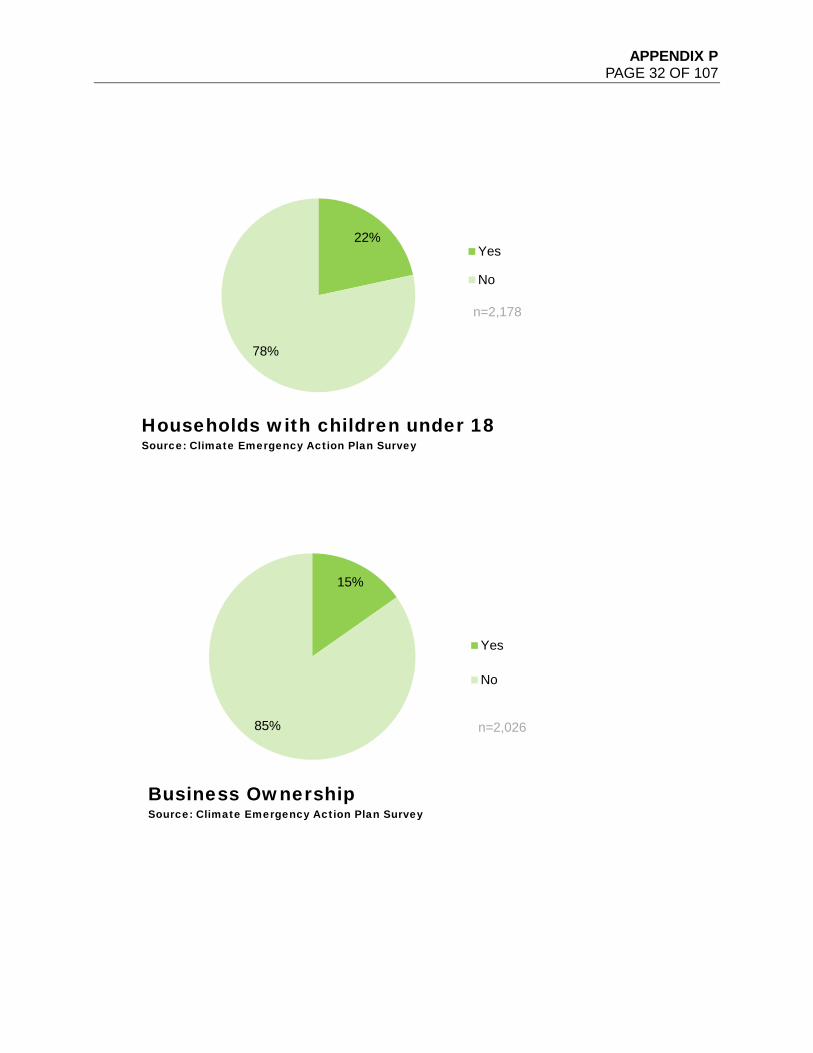
APPENDIX P PAGE 32 OF 107
22%
78%
Households with children under 18Source: Climate Emergency Action Plan Survey
Yes
No
15%
85%
Business OwnershipSource: Climate Emergency Action Plan Survey
Yes
No
n=2,026
n=2,178
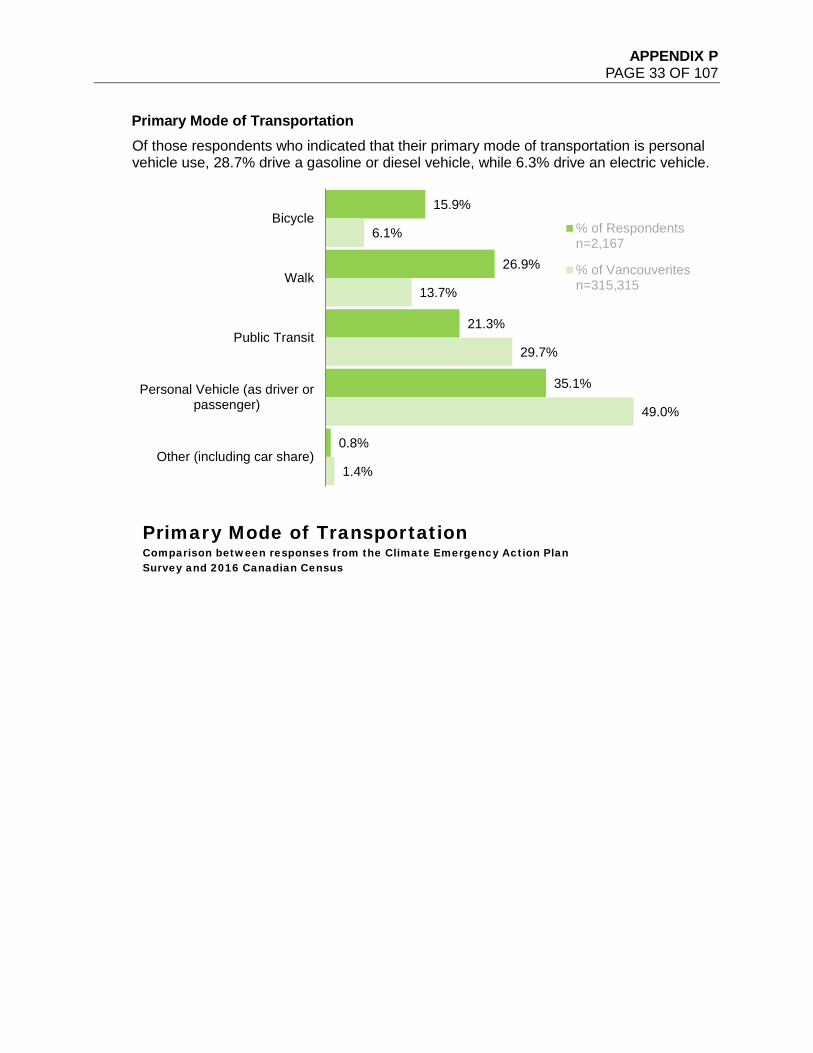
APPENDIX P PAGE 33 OF 107
Primary Mode of Transportation Of those respondents who indicated that their primary mode of transportation is personal vehicle use, 28.7% drive a gasoline or diesel vehicle, while 6.3% drive an electric vehicle.
15.9%
26.9%
21.3%
35.1%
0.8%
6.1%
13.7%
29.7%
49.0%
1.4%
Bicycle
Walk
Public Transit
Personal Vehicle (as driver orpassenger)
Other (including car share)
Primary Mode of TransportationComparison between responses from the Climate Emergency Action Plan Survey and 2016 Canadian Census
% of Respondentsn=2,167
% of Vancouveritesn=315,315
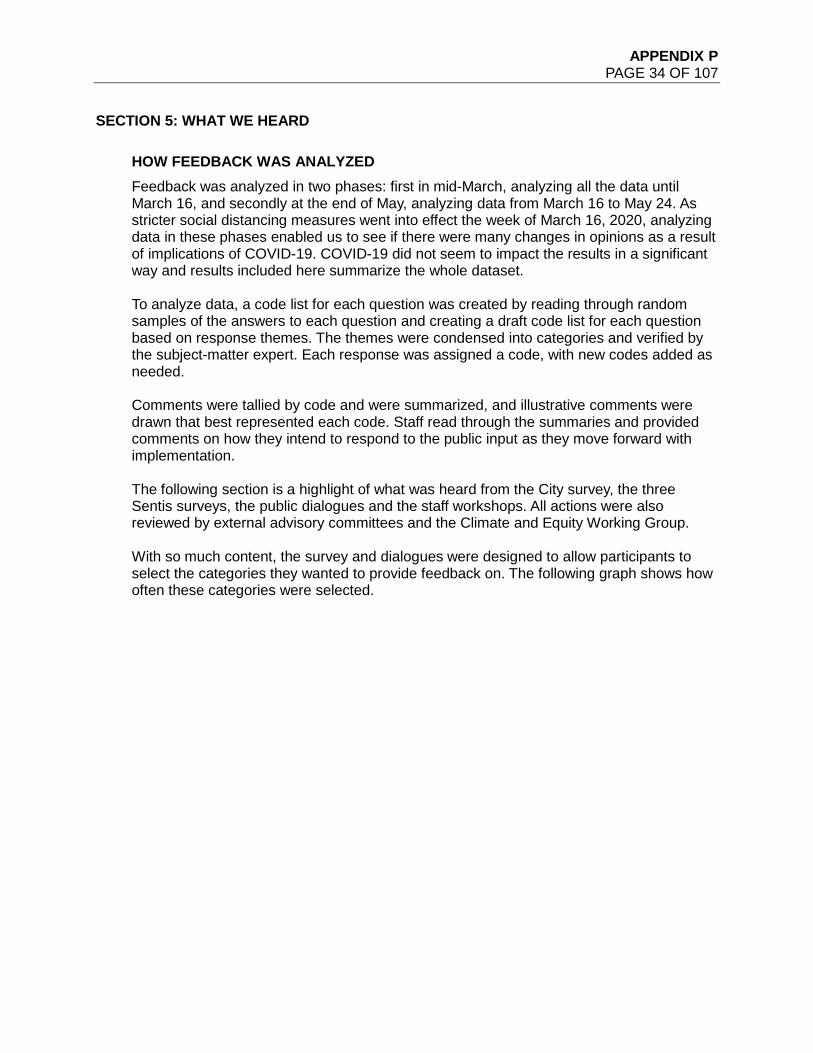
APPENDIX P PAGE 34 OF 107
SECTION 5: WHAT WE HEARD
HOW FEEDBACK WAS ANALYZED Feedback was analyzed in two phases: first in mid-March, analyzing all the data until March 16, and secondly at the end of May, analyzing data from March 16 to May 24. As stricter social distancing measures went into effect the week of March 16, 2020, analyzing data in these phases enabled us to see if there were many changes in opinions as a result of implications of COVID-19. COVID-19 did not seem to impact the results in a significant way and results included here summarize the whole dataset. To analyze data, a code list for each question was created by reading through random samples of the answers to each question and creating a draft code list for each question based on response themes. The themes were condensed into categories and verified by the subject-matter expert. Each response was assigned a code, with new codes added as needed. Comments were tallied by code and were summarized, and illustrative comments were drawn that best represented each code. Staff read through the summaries and provided comments on how they intend to respond to the public input as they move forward with implementation. The following section is a highlight of what was heard from the City survey, the three Sentis surveys, the public dialogues and the staff workshops. All actions were also reviewed by external advisory committees and the Climate and Equity Working Group. With so much content, the survey and dialogues were designed to allow participants to select the categories they wanted to provide feedback on. The following graph shows how often these categories were selected.
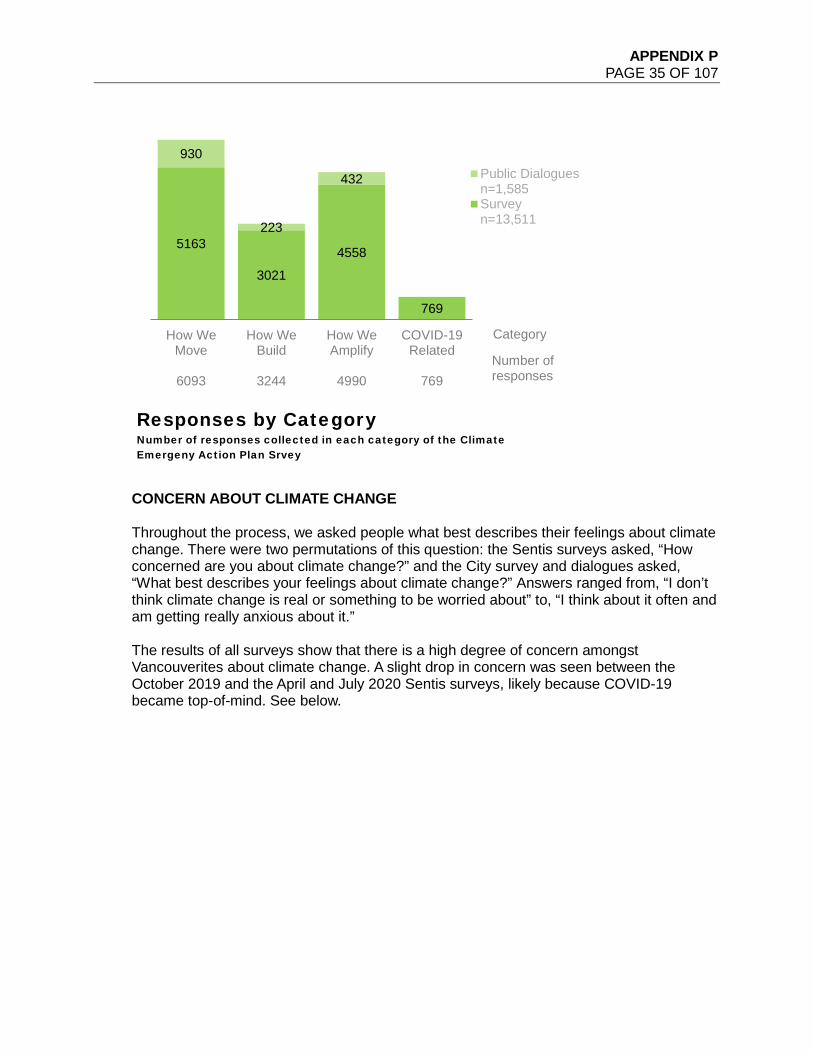
APPENDIX P PAGE 35 OF 107
CONCERN ABOUT CLIMATE CHANGE Throughout the process, we asked people what best describes their feelings about climate change. There were two permutations of this question: the Sentis surveys asked, “How concerned are you about climate change?” and the City survey and dialogues asked, “What best describes your feelings about climate change?” Answers ranged from, “I don’t think climate change is real or something to be worried about” to, “I think about it often and am getting really anxious about it.” The results of all surveys show that there is a high degree of concern amongst Vancouverites about climate change. A slight drop in concern was seen between the October 2019 and the April and July 2020 Sentis surveys, likely because COVID-19 became top-of-mind. See below.
5163
3021
4558
769
930
223
432
How WeMove
6093
How WeBuild
3244
How WeAmplify
4990
COVID-19Related
769
Responses by CategoryNumber of responses collected in each category of the Climate Emergeny Action Plan Srvey
Public Dialoguesn=1,585Surveyn=13,511
Category
Number of responses
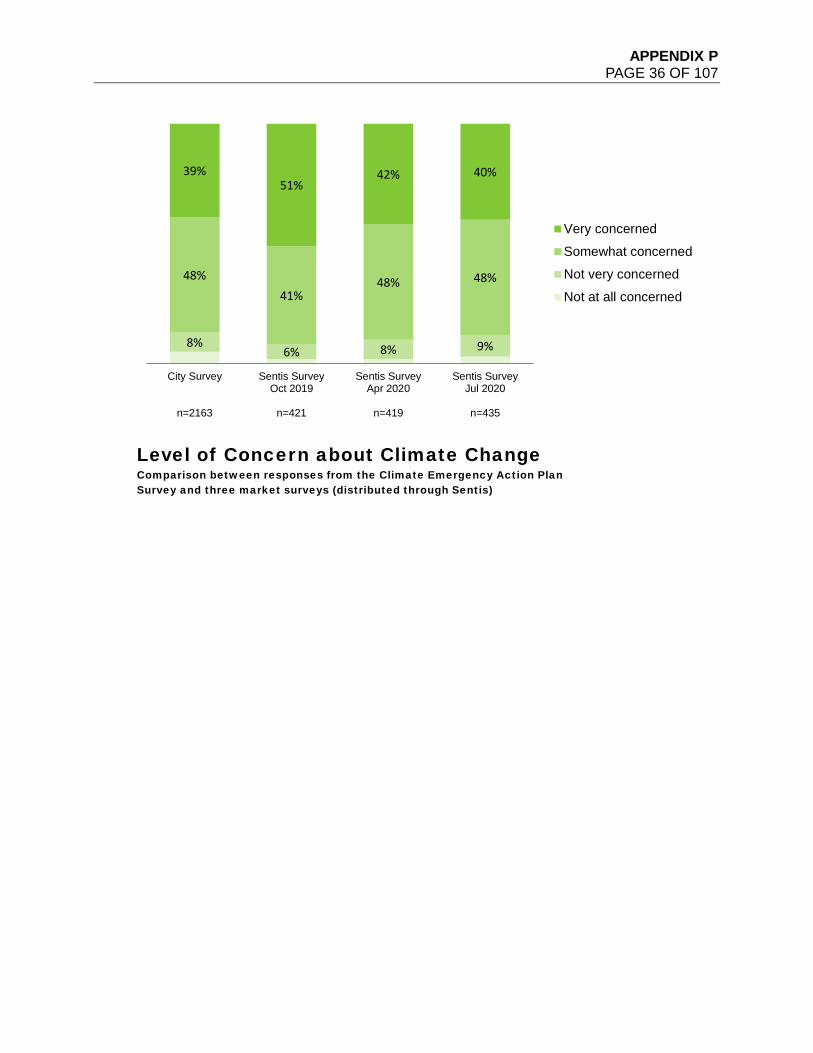
APPENDIX P PAGE 36 OF 107
8%6% 8% 9%
48%41%
48% 48%
39%51%
42% 40%
City Survey
n=2163
Sentis SurveyOct 2019
n=421
Sentis SurveyApr 2020
n=419
Sentis SurveyJul 2020
n=435
Level of Concern about Climate ChangeComparison between responses from the Climate Emergency Action Plan Survey and three market surveys (distributed through Sentis)
Very concerned
Somewhat concerned
Not very concerned
Not at all concerned
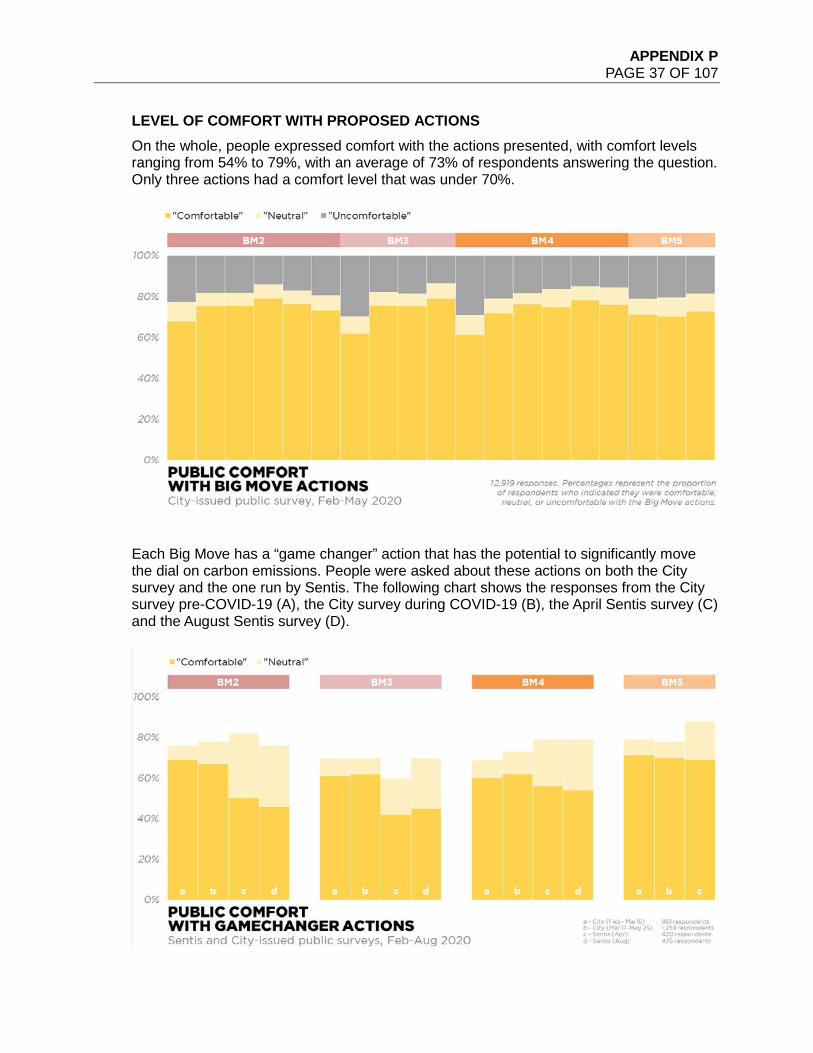
APPENDIX P PAGE 37 OF 107
LEVEL OF COMFORT WITH PROPOSED ACTIONS On the whole, people expressed comfort with the actions presented, with comfort levels ranging from 54% to 79%, with an average of 73% of respondents answering the question. Only three actions had a comfort level that was under 70%.
Each Big Move has a “game changer” action that has the potential to significantly move the dial on carbon emissions. People were asked about these actions on both the City survey and the one run by Sentis. The following chart shows the responses from the City survey pre-COVID-19 (A), the City survey during COVID-19 (B), the April Sentis survey (C) and the August Sentis survey (D).
APPENDIX P PAGE 38 OF 107
Note: for the City surveys, not all of the respondents answered all of the questions, including the questions polling comfort with game changer actions. The game changer action for BM5 was not asked about in the Sentis wave 3 (August) survey. Although there is not much change between the pre-COVID-19 and during COVID-19 City surveys, people on the Sentis survey were less comfortable with the transportation-related game changer actions. There were also more people in the Sentis survey who were neutral about these changes than what was seen in the City survey. Across all actions, certain themes emerged from comments in the survey and the dialogues:
• Affordability – Vancouver is an expensive city and people are feeling that pressure. It needs to be recognized that, as the City moves forward, actions should not make the affordability crisis even worse. People wanted the City to find practical sources of funding and offer incentives. There were specific concerns that any upgrades required on buildings could impact renters, and finding affordable rentals is very difficult.
• Equity – Any changes that are implemented should be equitable. Any additional costs should be scaled to start with those who are best positioned to take on these costs.
• Process – Make any changes as easy as possible. Provide plenty of lead time in advance about the changes that are coming and what is expected so people will have time to make plans. Be transparent about the reasons why these changes are being made, and where the money is going if costs are involved.
• Education – Share why actions are being implemented and what the options are, and give people information to make informed choices.
• Urgency – Although there were comments about being clear about what the changes are and providing lead time for actions, there were also many comments urging the City to take action, to move quickly, to be bold. Perhaps not surprising given 87% of respondents indicated that they are worried or increasingly anxious about climate change.
• Partner – Throughout the comments there were calls to work with other organizations, the region, Indigenous communities, different governments, industry, and others to take action.
The following sections describe the top concerns and themes gathered from the Climate Emergency Action Plan survey.
APPENDIX P PAGE 39 OF 107
There are three targets and ten actions under this category: Target 1: By 2030, 90% of people live within an easy walk and roll of their daily needs.
• No proposed actions Target 2: By 2030, 2/3 of trips in Vancouver will be by active transportation and transit
• Action 1: Implement Transport Pricing in the Metro Core • Action 2: Expand and Improve Our Walking/Rolling and Biking Network • Action 3: Reduce Reliance on Motor Vehicles in the Broadway Plan Area and the Jericho
Lands • Action 4: Improve Bus Speed and Reliability • Action 5: Encourage More Walking, Biking and Transit Use • Action 6: Support Sustainable Transportation Options Through New Development
Target 3: By 2030, 50% of vehicle kilometres travelled on our roads will be by zero emissions vehicles.
• Action 1: Zero Emissions Parking Plan • Action 2: Expand the Public Charging Network • Action 3: Increase Electric Vehicle Charging in Buildings • Action 4: Support Charging Infrastructure for Passenger Fleets
In addition to city-wide engagement, the 10 actions under How We Move were reviewed by a stakeholder committee comprised of organizations and individuals who specialize in, have an interest in, or bring an equity lens to these transportation areas. These actions were also reviewed with the Climate and Equity Working Group and the City’s Transportation Advisory Committee. The following summarizes what we heard through this process: Distribute infrastructure and services across the city
• Many participants observed that services and infrastructure are directed to the Metro Core, leaving lower-density areas, especially in South and East Vancouver, with fewer mobility options.
Reinvest into lower-income communities
• This is particularly relevant for Transport Pricing and the Zero Emissions Parking Plan, which are based on pricing and regulations. There were many questions about how the revenue will be used from these pricing schemes and a strong desire to use this revenue to improve active transportation and transit, especially for lower-income communities.
Review transportation system comprehensively
APPENDIX P PAGE 40 OF 107
• Poverty advocates have suggested that if we are truly centring equity in this work, the transportation system should be reviewed comprehensively and across jurisdictions. For actions outside of the City’s jurisdiction, like transit policing, ticketing and fare price, the City can play a stronger advocacy role. Poverty advocates have expressed frustration with limited engagement that focuses on specific areas within the system, rather than taking a comprehensive review, or an audit approach similar to cities like Portland and Seattle.
Efficient and affordable alternatives
• Many participants suggested that for Transport Pricing and the Zero Emissions Parking Plan to be equitable, there need to be reliable, efficient and affordable alternatives. Some people were concerned about people with mobility issues who may rely on private vehicles to access medical and other social services in the Metro Core.
Visible and accessible
• Some participants perceived cycling in Vancouver as an elitist or specialized activity. Ideas for normalizing cycling included having images of people of all body sizes, genders and ethnic backgrounds in images, and have cycling routes more visible and leading directly to shops and services, so riding is more intuitive and does not require planning out routes on bike lanes that are largely hidden.
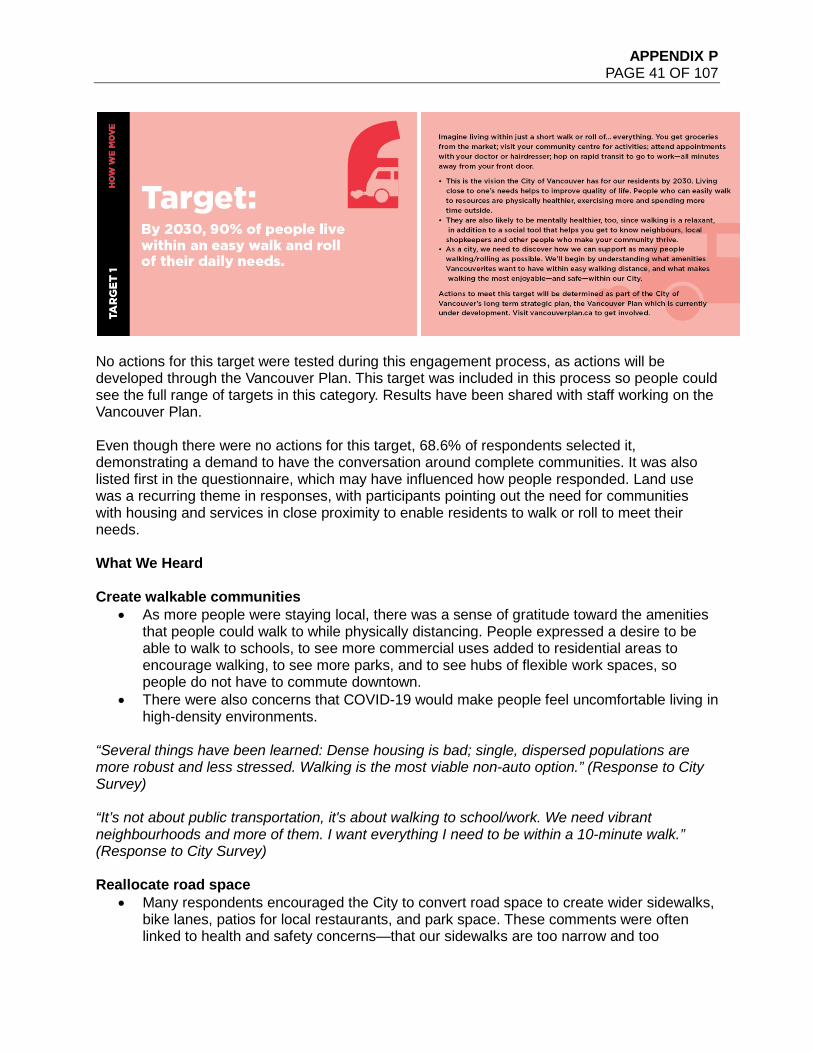
APPENDIX P PAGE 41 OF 107
No actions for this target were tested during this engagement process, as actions will be developed through the Vancouver Plan. This target was included in this process so people could see the full range of targets in this category. Results have been shared with staff working on the Vancouver Plan. Even though there were no actions for this target, 68.6% of respondents selected it, demonstrating a demand to have the conversation around complete communities. It was also listed first in the questionnaire, which may have influenced how people responded. Land use was a recurring theme in responses, with participants pointing out the need for communities with housing and services in close proximity to enable residents to walk or roll to meet their needs. What We Heard Create walkable communities
• As more people were staying local, there was a sense of gratitude toward the amenities that people could walk to while physically distancing. People expressed a desire to be able to walk to schools, to see more commercial uses added to residential areas to encourage walking, to see more parks, and to see hubs of flexible work spaces, so people do not have to commute downtown.
• There were also concerns that COVID-19 would make people feel uncomfortable living in high-density environments.
“Several things have been learned: Dense housing is bad; single, dispersed populations are more robust and less stressed. Walking is the most viable non-auto option.” (Response to City Survey) “It’s not about public transportation, it's about walking to school/work. We need vibrant neighbourhoods and more of them. I want everything I need to be within a 10-minute walk.” (Response to City Survey) Reallocate road space
• Many respondents encouraged the City to convert road space to create wider sidewalks, bike lanes, patios for local restaurants, and park space. These comments were often linked to health and safety concerns—that our sidewalks are too narrow and too
APPENDIX P PAGE 42 OF 107
crowded to pass people safely, and also with the viewpoint that with so many people working from home, car volumes have been reduced, enabling the change.
“I feel like in my community (Mount Pleasant) I am more aware than ever that cars have been prioritized in the community. I find that it's not always easy for me to comfortably take my small children out for a walk in our neighbourhood while socially distancing yet cars/driving hasn't been impacted at all. I like seeing the city slowing traffic on some streets to allow for more biking and walking and I would like this to continue.” (Response to City Survey) Urban agriculture/food security
• There were concerns about potential disruption to our food systems and a desire to see more food grown, both within the city (front lawns, in green spaces, on rooftops) and within the region.
“Expand farmers' markets opportunities by increasing urban farms and supporting urban agriculture, convert some of the COV growing capacity to shift to food rather than decorative flowers and plants, sell or give vegetables to low-income families, grow seedlings that can be planted in backyards and balcony gardens, consider pollinator avenues, any efforts to reduce the distance our food travels.” (Response to City Survey)
Stewardship/green space
• The importance of green space was highlighted through this pandemic, along with a desire to continue to invest in parks and expand the system. This should include development that increases biodiversity, restores wetlands and creates space for wildlife.
“More park space as it's very limited in the whole city and roadways need to be permeable with a stronger emphasis for rainwater retention and infiltration and less roadway pavement for more street trees. Many city streets still contain no room for street trees in an area that's a rainforest.” (Response to City Survey)
Housing
• People expressed a desire for more affordable housing that is closer to their work to reduce their commute.
• There was a concern that essential workers cannot afford to live here, and how that impacts the resiliency of our city.
• There was a desire to see zoning changes to allow apartments in single-family neighbourhoods.
“Re-designing housing in the city so that people of all levels of income can live in each of the neighbourhoods. The fact that almost all service people (fire, hospital, police, homecare aids) who work on the north shore must cross the bridges from other neighbourhoods increases transport cost and pollution. It is also vulnerable to bridge outage.” (Response to City Survey)
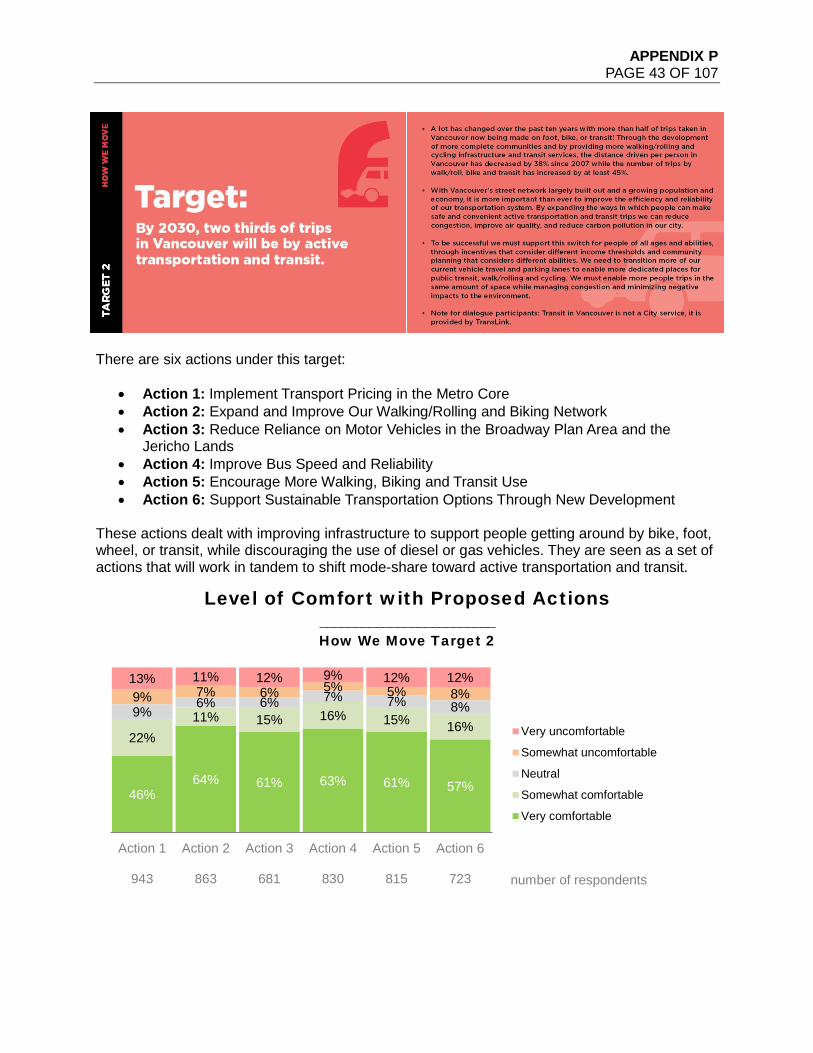
APPENDIX P PAGE 43 OF 107
There are six actions under this target:
• Action 1: Implement Transport Pricing in the Metro Core • Action 2: Expand and Improve Our Walking/Rolling and Biking Network • Action 3: Reduce Reliance on Motor Vehicles in the Broadway Plan Area and the
Jericho Lands • Action 4: Improve Bus Speed and Reliability • Action 5: Encourage More Walking, Biking and Transit Use • Action 6: Support Sustainable Transportation Options Through New Development
These actions dealt with improving infrastructure to support people getting around by bike, foot, wheel, or transit, while discouraging the use of diesel or gas vehicles. They are seen as a set of actions that will work in tandem to shift mode-share toward active transportation and transit.
46%64% 61% 63% 61% 57%
22%11% 15% 16% 15% 16%
9%6% 6% 7% 7% 8%
9% 7% 6% 5% 5% 8%13% 11% 12% 9% 12% 12%
Action 1
943
Action 2
863
Action 3
681
Action 4
830
Action 5
815
Action 6
723
Level of Comfort with Proposed Actions_________________________How We Move Target 2
Very uncomfortable
Somewhat uncomfortable
Neutral
Somewhat comfortable
Very comfortable
number of respondents
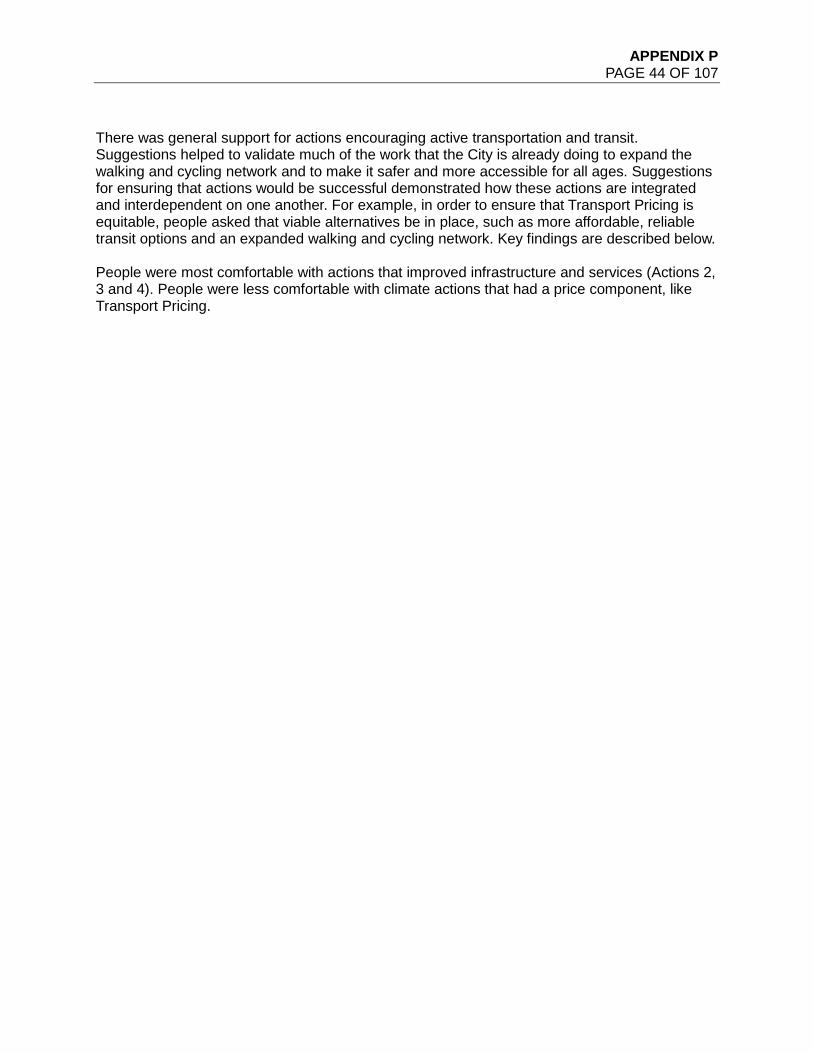
APPENDIX P PAGE 44 OF 107
There was general support for actions encouraging active transportation and transit. Suggestions helped to validate much of the work that the City is already doing to expand the walking and cycling network and to make it safer and more accessible for all ages. Suggestions for ensuring that actions would be successful demonstrated how these actions are integrated and interdependent on one another. For example, in order to ensure that Transport Pricing is equitable, people asked that viable alternatives be in place, such as more affordable, reliable transit options and an expanded walking and cycling network. Key findings are described below. People were most comfortable with actions that improved infrastructure and services (Actions 2, 3 and 4). People were less comfortable with climate actions that had a price component, like Transport Pricing.
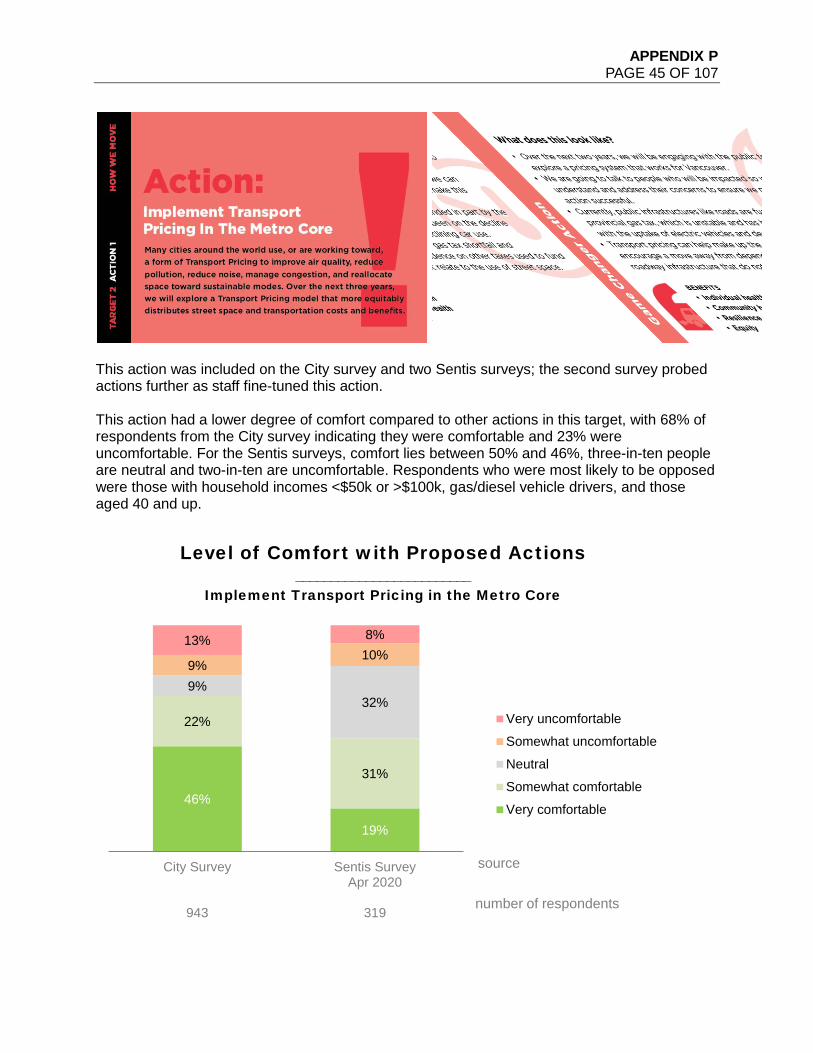
APPENDIX P PAGE 45 OF 107
This action was included on the City survey and two Sentis surveys; the second survey probed actions further as staff fine-tuned this action. This action had a lower degree of comfort compared to other actions in this target, with 68% of respondents from the City survey indicating they were comfortable and 23% were uncomfortable. For the Sentis surveys, comfort lies between 50% and 46%, three-in-ten people are neutral and two-in-ten are uncomfortable. Respondents who were most likely to be opposed were those with household incomes <$50k or >$100k, gas/diesel vehicle drivers, and those aged 40 and up.
46%
19%
22%
31%
9%32%
9%10%
13% 8%
City Survey
943
Sentis SurveyApr 2020
319
Level of Comfort with Proposed Actions_________________________
Implement Transport Pricing in the Metro Core
Very uncomfortable
Somewhat uncomfortable
Neutral
Somewhat comfortable
Very comfortable
number of respondents
source
APPENDIX P PAGE 46 OF 107
What We Heard
• That people were broadly in support, provided that the process and fees were implemented properly.
• This will encourage behaviour change. • Concern that this may negatively impact groups differently. • Concern that this will increase congestion in other areas. • Need for reliable alternatives. • Desire to know how revenue will be used (e.g., transit investment). • Concern for people with mobility challenges—like people who need to use a car to
access services. • People want the City to work with regional partners. • If the revenue supported actions to address the climate emergency, people were more
comfortable with transport pricing. “People need to feel they have alternatives to driving, or else they'll resent paying a price for it. Any reasons they're uncomfortable using other forms of transportation need to be addressed.” (Response to City Survey)
“Consider what alternatives to travel by cars from suburbs are in place and their capacity. Insufficient transit alternatives could impose undue hardship on commuters forced to pay extra taxes.” (Response to Apr 2020 Sentis Survey) “Consider the wide variety of accessibility and mobility needs for people with disabilities, seniors, and people living in poverty or homelessness. Work with neighbourhood houses to tap into their vast community development knowledge for diverse populations.” (Response to City Survey)
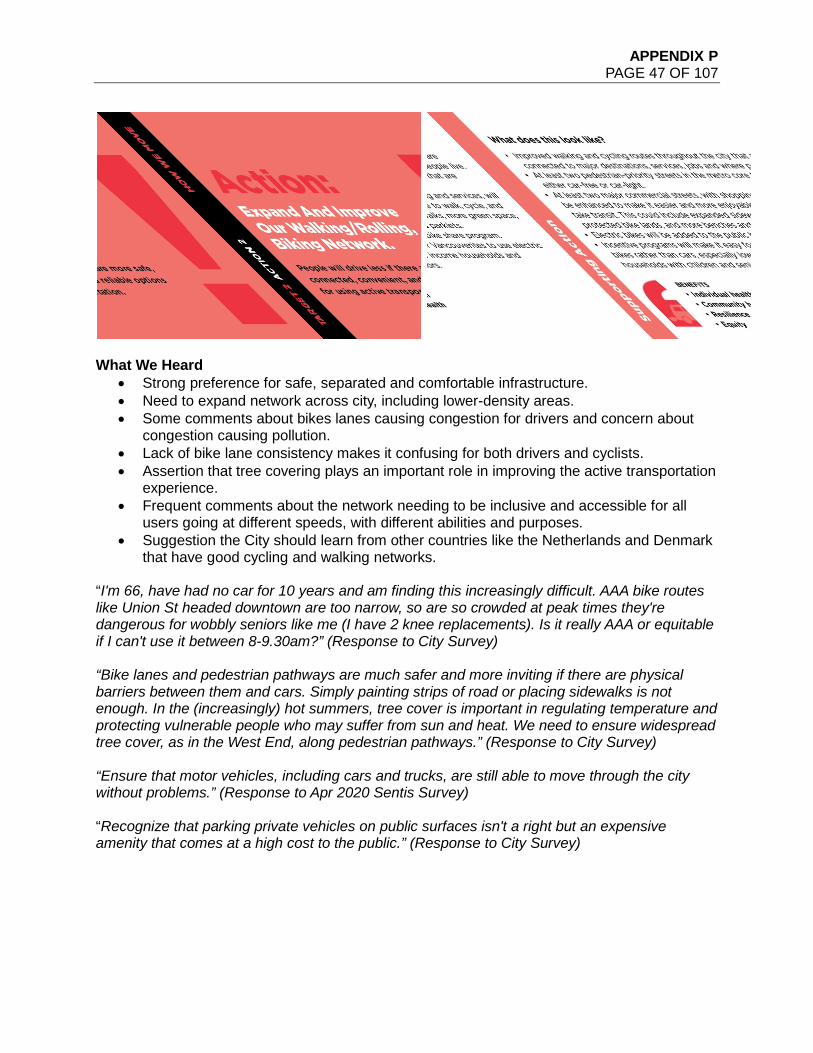
APPENDIX P PAGE 47 OF 107
What We Heard
• Strong preference for safe, separated and comfortable infrastructure. • Need to expand network across city, including lower-density areas. • Some comments about bikes lanes causing congestion for drivers and concern about
congestion causing pollution. • Lack of bike lane consistency makes it confusing for both drivers and cyclists. • Assertion that tree covering plays an important role in improving the active transportation
experience. • Frequent comments about the network needing to be inclusive and accessible for all
users going at different speeds, with different abilities and purposes. • Suggestion the City should learn from other countries like the Netherlands and Denmark
that have good cycling and walking networks. “I'm 66, have had no car for 10 years and am finding this increasingly difficult. AAA bike routes like Union St headed downtown are too narrow, so are so crowded at peak times they're dangerous for wobbly seniors like me (I have 2 knee replacements). Is it really AAA or equitable if I can't use it between 8-9.30am?” (Response to City Survey)
“Bike lanes and pedestrian pathways are much safer and more inviting if there are physical barriers between them and cars. Simply painting strips of road or placing sidewalks is not enough. In the (increasingly) hot summers, tree cover is important in regulating temperature and protecting vulnerable people who may suffer from sun and heat. We need to ensure widespread tree cover, as in the West End, along pedestrian pathways.” (Response to City Survey)
“Ensure that motor vehicles, including cars and trucks, are still able to move through the city without problems.” (Response to Apr 2020 Sentis Survey)
“Recognize that parking private vehicles on public surfaces isn't a right but an expensive amenity that comes at a high cost to the public.” (Response to City Survey)
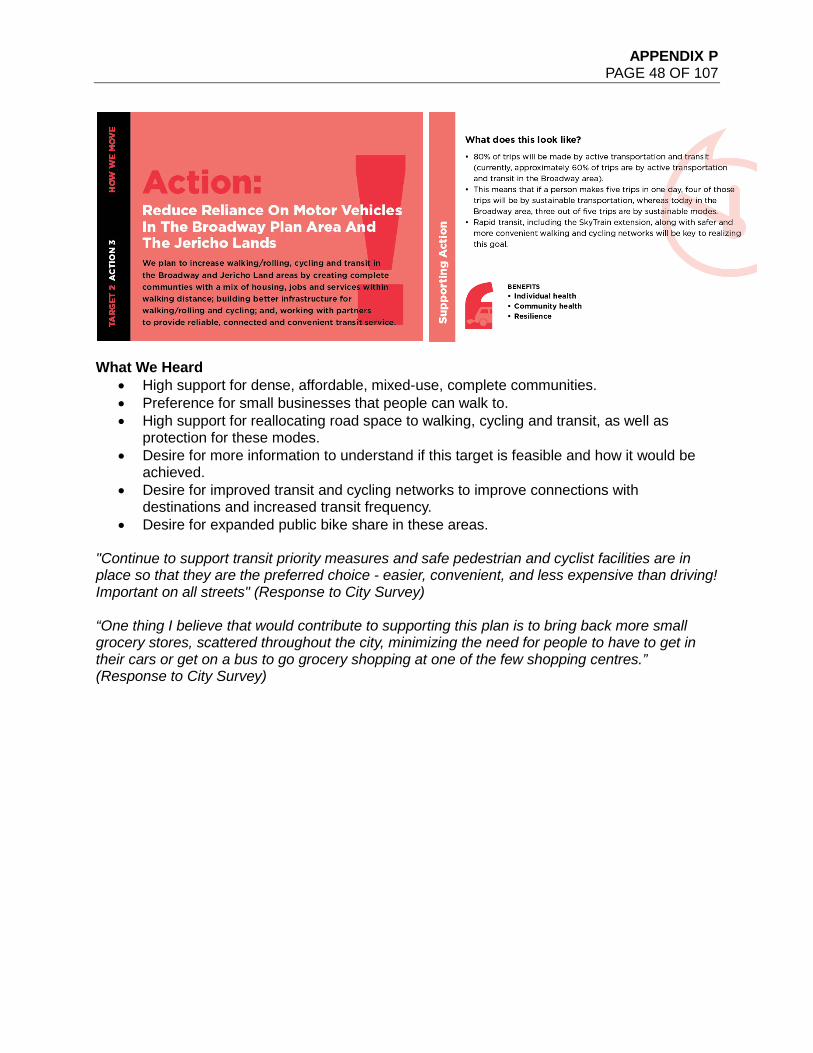
APPENDIX P PAGE 48 OF 107
What We Heard
• High support for dense, affordable, mixed-use, complete communities. • Preference for small businesses that people can walk to. • High support for reallocating road space to walking, cycling and transit, as well as
protection for these modes. • Desire for more information to understand if this target is feasible and how it would be
achieved. • Desire for improved transit and cycling networks to improve connections with
destinations and increased transit frequency. • Desire for expanded public bike share in these areas.
"Continue to support transit priority measures and safe pedestrian and cyclist facilities are in place so that they are the preferred choice - easier, convenient, and less expensive than driving! Important on all streets" (Response to City Survey)
“One thing I believe that would contribute to supporting this plan is to bring back more small grocery stores, scattered throughout the city, minimizing the need for people to have to get in their cars or get on a bus to go grocery shopping at one of the few shopping centres.” (Response to City Survey)
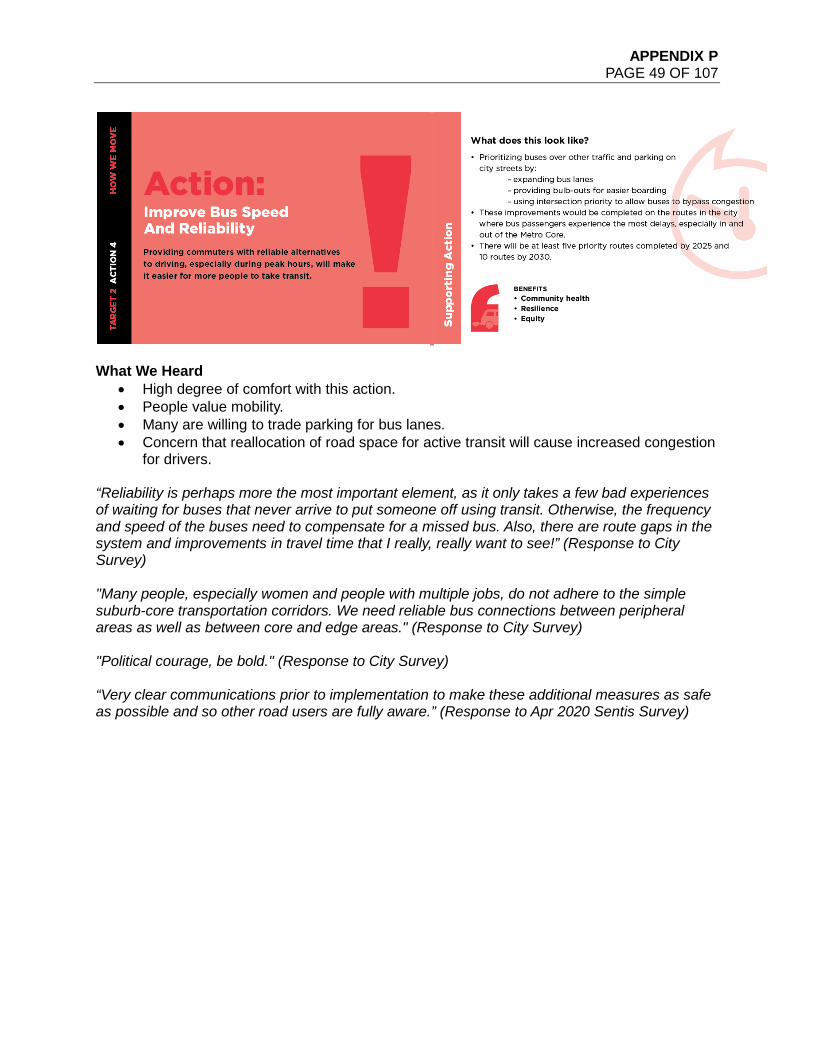
APPENDIX P PAGE 49 OF 107
What We Heard
• High degree of comfort with this action. • People value mobility. • Many are willing to trade parking for bus lanes. • Concern that reallocation of road space for active transit will cause increased congestion
for drivers. “Reliability is perhaps more the most important element, as it only takes a few bad experiences of waiting for buses that never arrive to put someone off using transit. Otherwise, the frequency and speed of the buses need to compensate for a missed bus. Also, there are route gaps in the system and improvements in travel time that I really, really want to see!” (Response to City Survey)
"Many people, especially women and people with multiple jobs, do not adhere to the simple suburb-core transportation corridors. We need reliable bus connections between peripheral areas as well as between core and edge areas." (Response to City Survey)
"Political courage, be bold." (Response to City Survey)
“Very clear communications prior to implementation to make these additional measures as safe as possible and so other road users are fully aware.” (Response to Apr 2020 Sentis Survey)
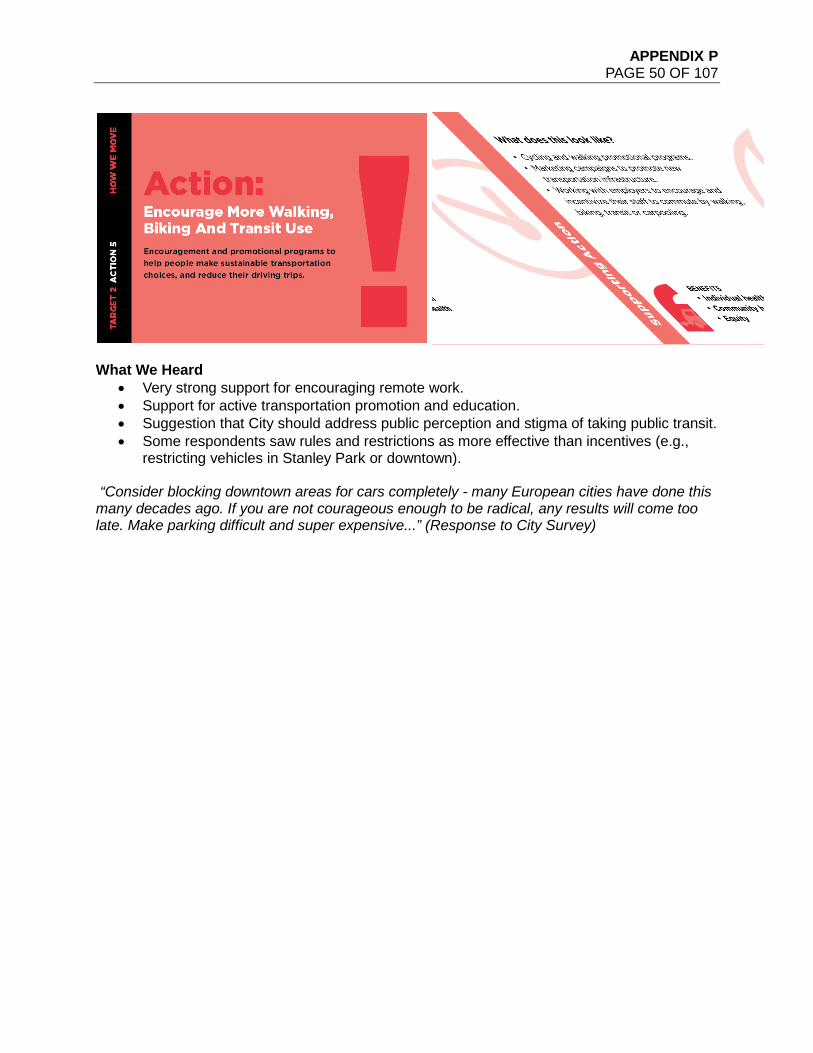
APPENDIX P PAGE 50 OF 107
What We Heard
• Very strong support for encouraging remote work. • Support for active transportation promotion and education. • Suggestion that City should address public perception and stigma of taking public transit. • Some respondents saw rules and restrictions as more effective than incentives (e.g.,
restricting vehicles in Stanley Park or downtown). “Consider blocking downtown areas for cars completely - many European cities have done this many decades ago. If you are not courageous enough to be radical, any results will come too late. Make parking difficult and super expensive...” (Response to City Survey)
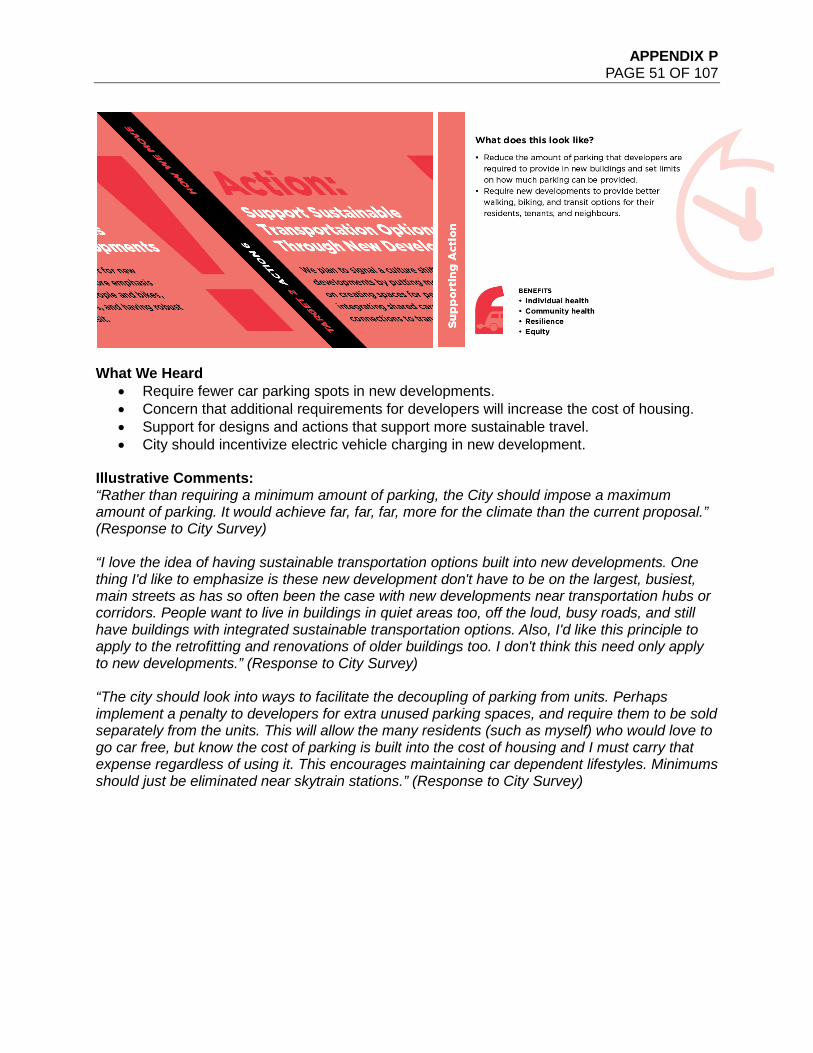
APPENDIX P PAGE 51 OF 107
What We Heard
• Require fewer car parking spots in new developments. • Concern that additional requirements for developers will increase the cost of housing. • Support for designs and actions that support more sustainable travel. • City should incentivize electric vehicle charging in new development.
Illustrative Comments: “Rather than requiring a minimum amount of parking, the City should impose a maximum amount of parking. It would achieve far, far, far, more for the climate than the current proposal.” (Response to City Survey) “I love the idea of having sustainable transportation options built into new developments. One thing I'd like to emphasize is these new development don't have to be on the largest, busiest, main streets as has so often been the case with new developments near transportation hubs or corridors. People want to live in buildings in quiet areas too, off the loud, busy roads, and still have buildings with integrated sustainable transportation options. Also, I'd like this principle to apply to the retrofitting and renovations of older buildings too. I don't think this need only apply to new developments.” (Response to City Survey) “The city should look into ways to facilitate the decoupling of parking from units. Perhaps implement a penalty to developers for extra unused parking spaces, and require them to be sold separately from the units. This will allow the many residents (such as myself) who would love to go car free, but know the cost of parking is built into the cost of housing and I must carry that expense regardless of using it. This encourages maintaining car dependent lifestyles. Minimums should just be eliminated near skytrain stations.” (Response to City Survey)
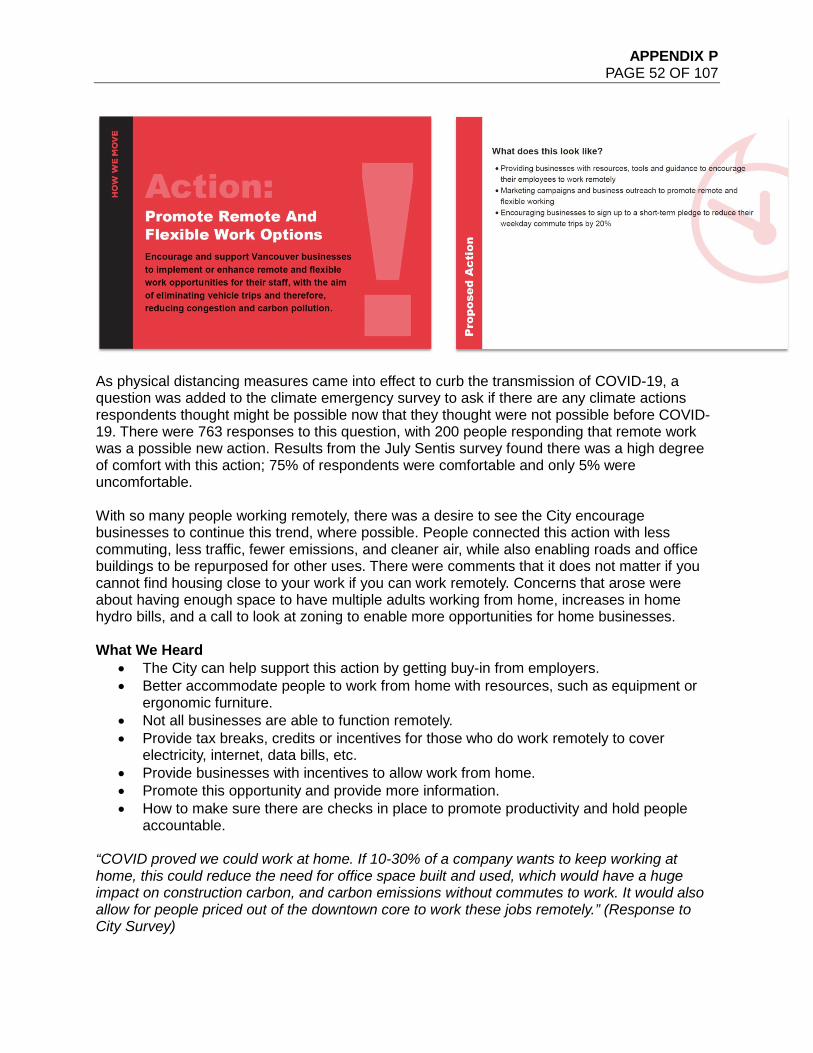
APPENDIX P PAGE 52 OF 107
As physical distancing measures came into effect to curb the transmission of COVID-19, a question was added to the climate emergency survey to ask if there are any climate actions respondents thought might be possible now that they thought were not possible before COVID-19. There were 763 responses to this question, with 200 people responding that remote work was a possible new action. Results from the July Sentis survey found there was a high degree of comfort with this action; 75% of respondents were comfortable and only 5% were uncomfortable. With so many people working remotely, there was a desire to see the City encourage businesses to continue this trend, where possible. People connected this action with less commuting, less traffic, fewer emissions, and cleaner air, while also enabling roads and office buildings to be repurposed for other uses. There were comments that it does not matter if you cannot find housing close to your work if you can work remotely. Concerns that arose were about having enough space to have multiple adults working from home, increases in home hydro bills, and a call to look at zoning to enable more opportunities for home businesses. What We Heard
• The City can help support this action by getting buy-in from employers. • Better accommodate people to work from home with resources, such as equipment or
ergonomic furniture. • Not all businesses are able to function remotely. • Provide tax breaks, credits or incentives for those who do work remotely to cover
electricity, internet, data bills, etc. • Provide businesses with incentives to allow work from home. • Promote this opportunity and provide more information. • How to make sure there are checks in place to promote productivity and hold people
accountable. “COVID proved we could work at home. If 10-30% of a company wants to keep working at home, this could reduce the need for office space built and used, which would have a huge impact on construction carbon, and carbon emissions without commutes to work. It would also allow for people priced out of the downtown core to work these jobs remotely.” (Response to City Survey)
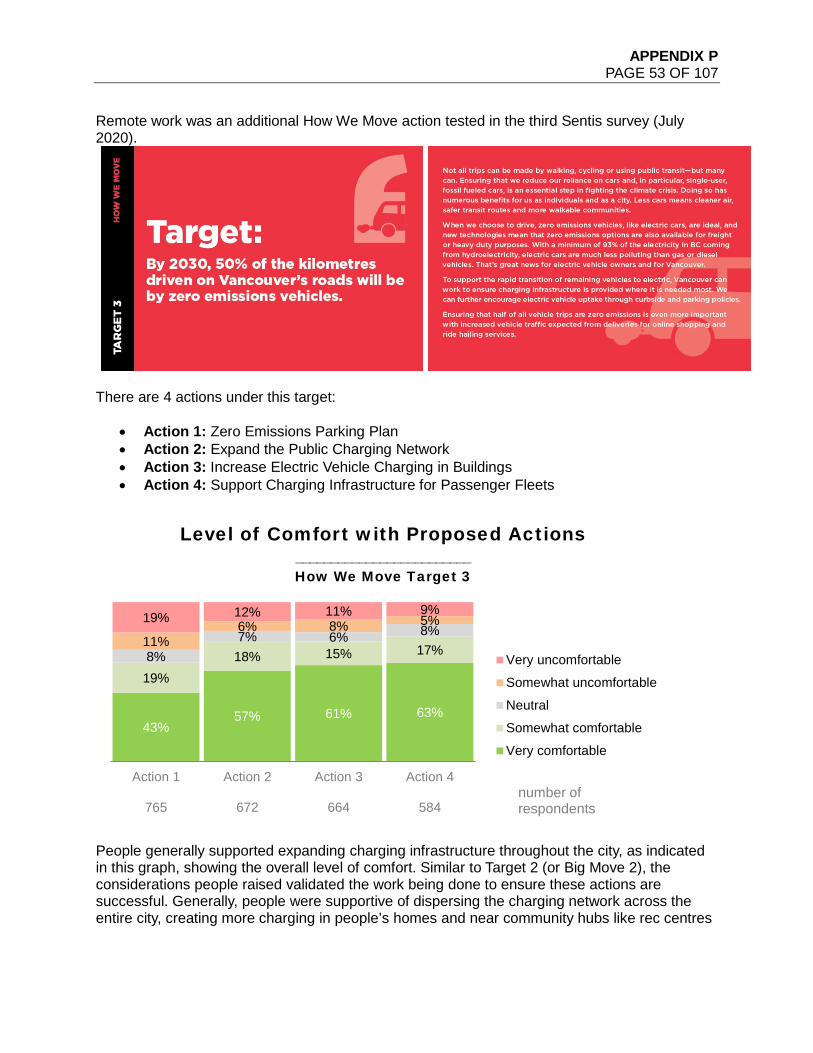
APPENDIX P PAGE 53 OF 107
Remote work was an additional How We Move action tested in the third Sentis survey (July 2020).
There are 4 actions under this target:
• Action 1: Zero Emissions Parking Plan • Action 2: Expand the Public Charging Network • Action 3: Increase Electric Vehicle Charging in Buildings • Action 4: Support Charging Infrastructure for Passenger Fleets
People generally supported expanding charging infrastructure throughout the city, as indicated in this graph, showing the overall level of comfort. Similar to Target 2 (or Big Move 2), the considerations people raised validated the work being done to ensure these actions are successful. Generally, people were supportive of dispersing the charging network across the entire city, creating more charging in people’s homes and near community hubs like rec centres
43%57% 61% 63%
19%18% 15% 17%8%7% 6% 8%
11%6% 8% 5%19% 12% 11% 9%
Action 1
765
Action 2
672
Action 3
664
Action 4
584
Level of Comfort with Proposed Actions_________________________How We Move Target 3
Very uncomfortable
Somewhat uncomfortable
Neutral
Somewhat comfortable
Very comfortable
number of respondents
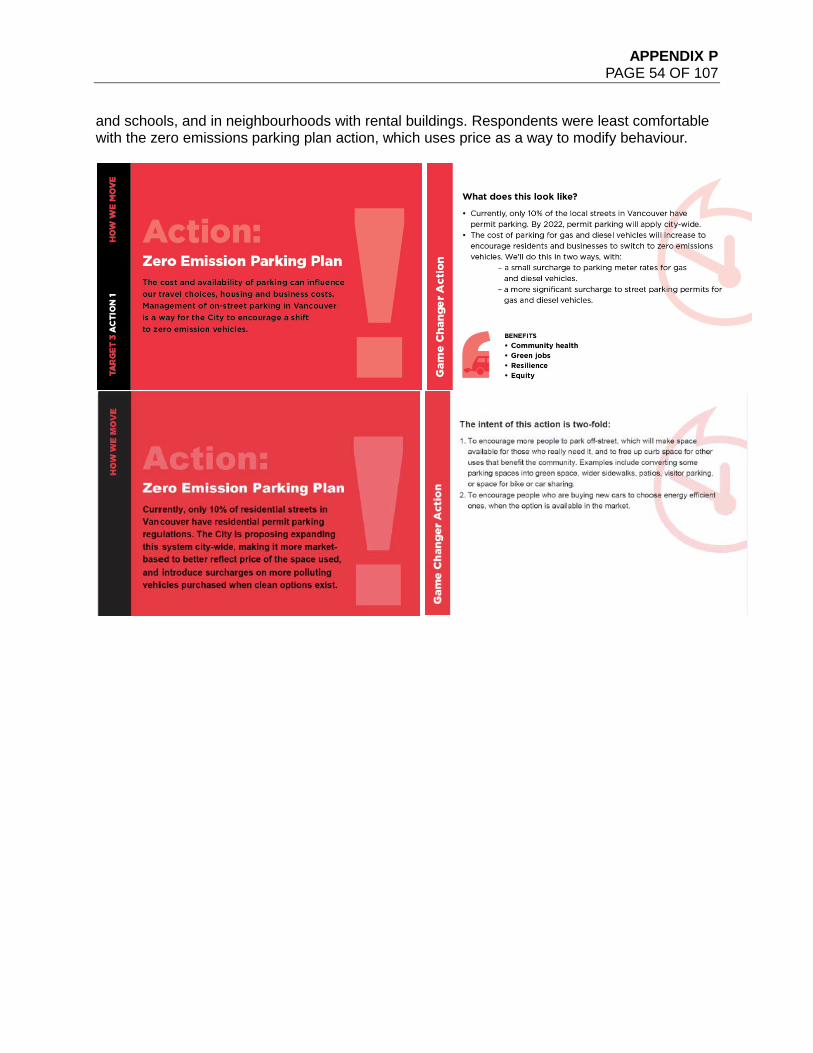
APPENDIX P PAGE 54 OF 107
and schools, and in neighbourhoods with rental buildings. Respondents were least comfortable with the zero emissions parking plan action, which uses price as a way to modify behaviour.
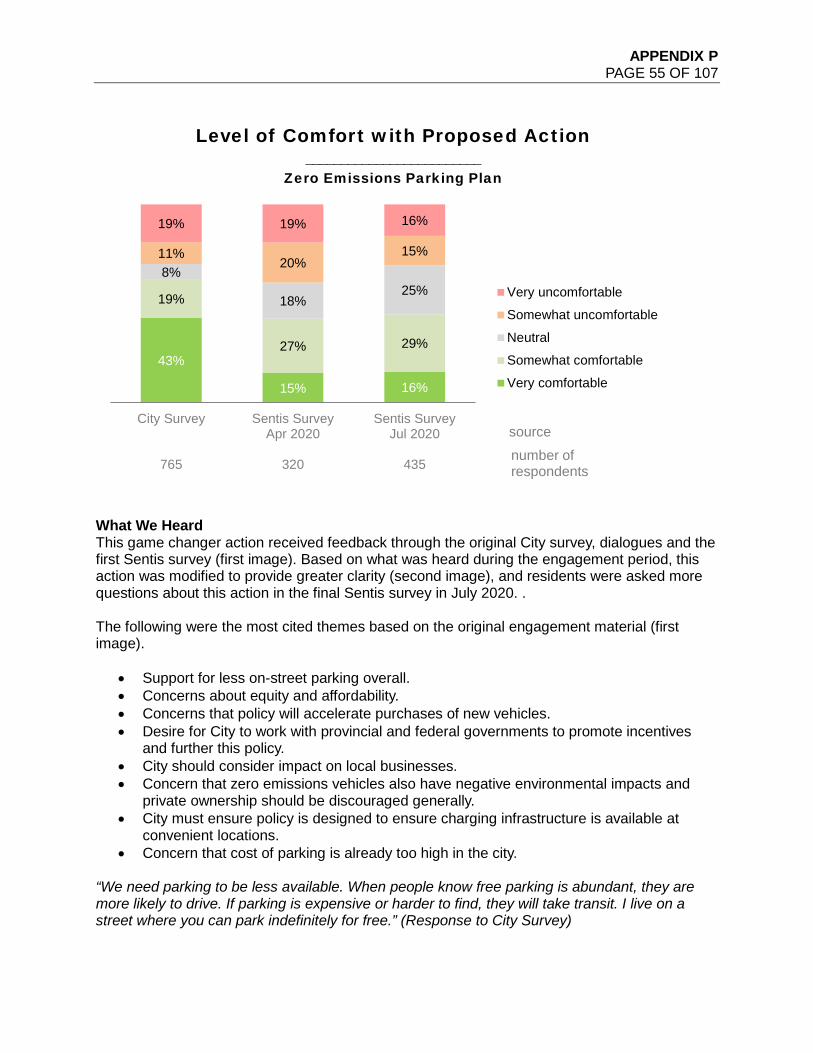
APPENDIX P PAGE 55 OF 107
What We Heard This game changer action received feedback through the original City survey, dialogues and the first Sentis survey (first image). Based on what was heard during the engagement period, this action was modified to provide greater clarity (second image), and residents were asked more questions about this action in the final Sentis survey in July 2020. . The following were the most cited themes based on the original engagement material (first image).
• Support for less on-street parking overall. • Concerns about equity and affordability. • Concerns that policy will accelerate purchases of new vehicles. • Desire for City to work with provincial and federal governments to promote incentives
and further this policy. • City should consider impact on local businesses. • Concern that zero emissions vehicles also have negative environmental impacts and
private ownership should be discouraged generally. • City must ensure policy is designed to ensure charging infrastructure is available at
convenient locations. • Concern that cost of parking is already too high in the city.
“We need parking to be less available. When people know free parking is abundant, they are more likely to drive. If parking is expensive or harder to find, they will take transit. I live on a street where you can park indefinitely for free.” (Response to City Survey)
43%
15% 16%
19%
27% 29%
8%
18%25%
11%20%
15%
19% 19% 16%
City Survey
765
Sentis SurveyApr 2020
320
Sentis SurveyJul 2020
435
Level of Comfort with Proposed Action_________________________
Zero Emissions Parking Plan
Very uncomfortable
Somewhat uncomfortable
Neutral
Somewhat comfortable
Very comfortable
number of respondents
source
APPENDIX P PAGE 56 OF 107
“It is very difficult & frustrating to find parking currently in many areas of the city. Parking is already costly and meters are in effect for longer hours - any increase would negatively impact some businesses & areas.” (Response to Apr 2020 Sentis Survey) The City survey results showed that 62% of residents were comfortable with this action. Sentis results found slightly lower levels of comfort with the action, with 42-45% expressing comfort with this action. Those most likely to be opposed were people over 40, those who drive gas or diesel vehicles, and those with household incomes >$100k. Below is a description of the key findings based on the modified action (second image).
• Residents are more receptive to this action when equity and affordability are taken into consideration. The Sentis survey found four-in-ten residents feel more comfortable with it after learning that low-income households would not be subject to higher rates or that surcharges would only apply to new polluting vehicles.
• Residents are more comfortable with this action if the zero emissions vehicles got a discount (67% comfort), rather than including a surcharge on gas and diesel vehicles (only 34% were comfortable).
• The City should offer affordable rates or discounts on parking. • There should be a way to make zero emissions vehicles more affordable. • There should be more charging stations.
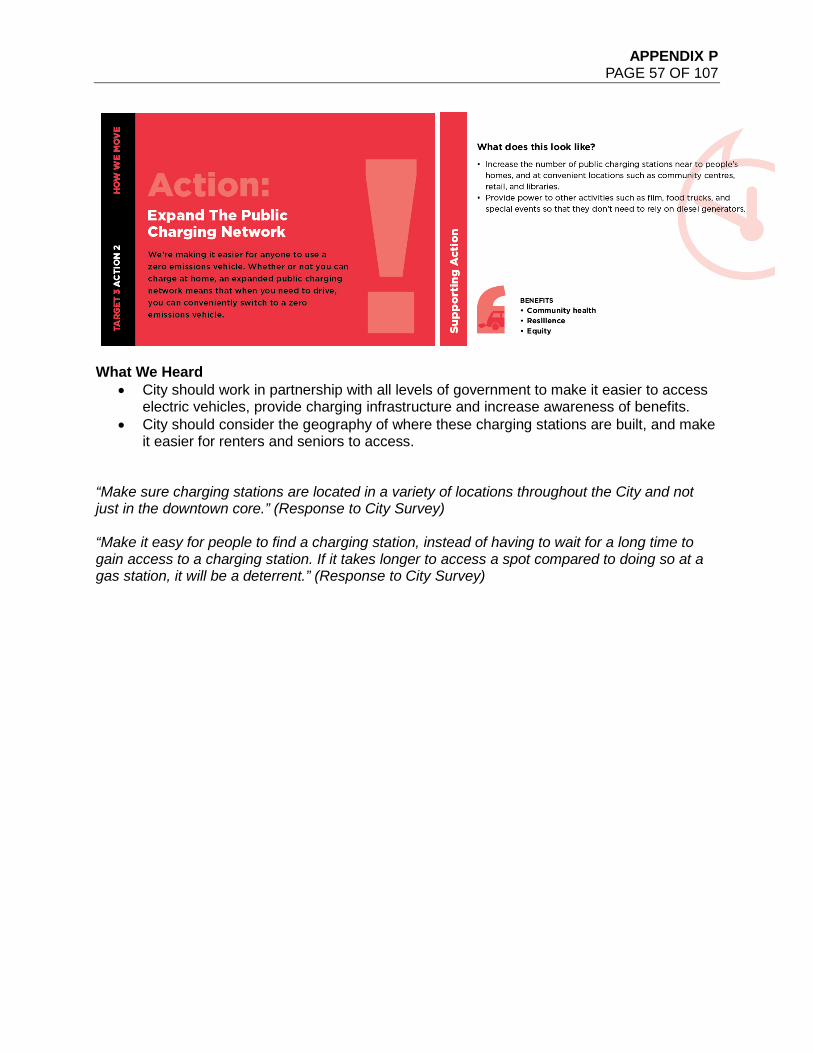
APPENDIX P PAGE 57 OF 107
What We Heard
• City should work in partnership with all levels of government to make it easier to access electric vehicles, provide charging infrastructure and increase awareness of benefits.
• City should consider the geography of where these charging stations are built, and make it easier for renters and seniors to access.
“Make sure charging stations are located in a variety of locations throughout the City and not just in the downtown core.” (Response to City Survey) “Make it easy for people to find a charging station, instead of having to wait for a long time to gain access to a charging station. If it takes longer to access a spot compared to doing so at a gas station, it will be a deterrent.” (Response to City Survey)
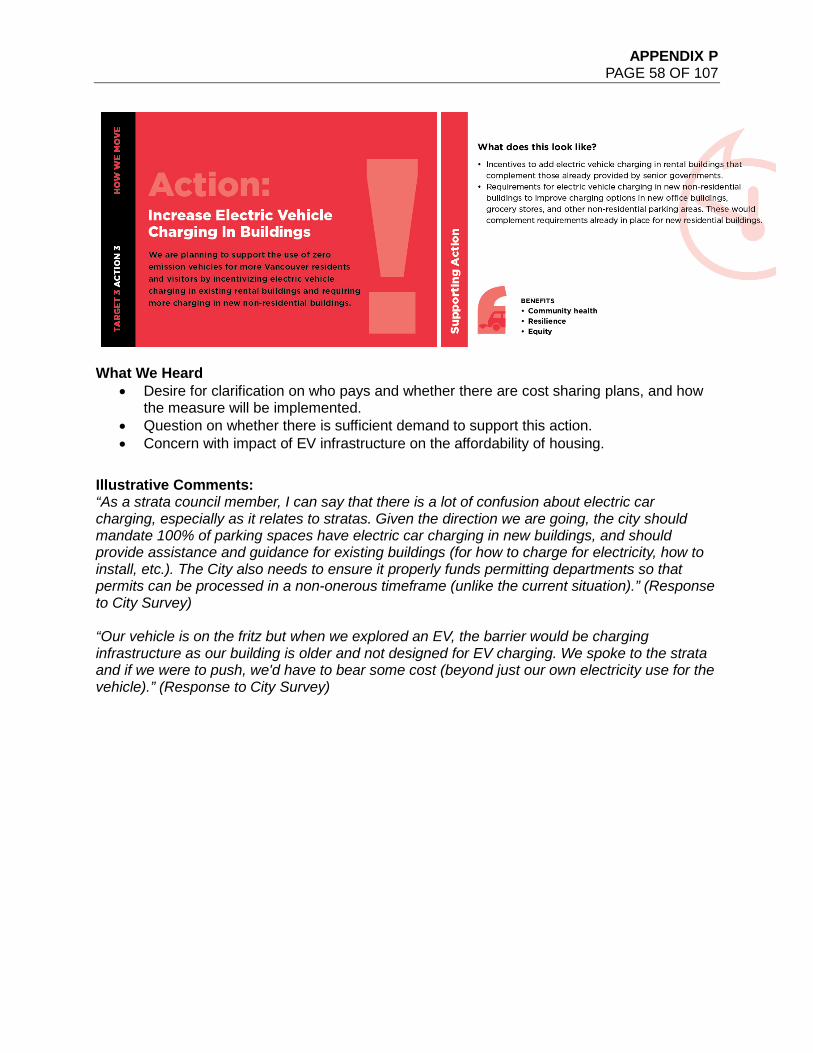
APPENDIX P PAGE 58 OF 107
What We Heard
• Desire for clarification on who pays and whether there are cost sharing plans, and how the measure will be implemented.
• Question on whether there is sufficient demand to support this action. • Concern with impact of EV infrastructure on the affordability of housing.
Illustrative Comments: “As a strata council member, I can say that there is a lot of confusion about electric car charging, especially as it relates to stratas. Given the direction we are going, the city should mandate 100% of parking spaces have electric car charging in new buildings, and should provide assistance and guidance for existing buildings (for how to charge for electricity, how to install, etc.). The City also needs to ensure it properly funds permitting departments so that permits can be processed in a non-onerous timeframe (unlike the current situation).” (Response to City Survey) “Our vehicle is on the fritz but when we explored an EV, the barrier would be charging infrastructure as our building is older and not designed for EV charging. We spoke to the strata and if we were to push, we'd have to bear some cost (beyond just our own electricity use for the vehicle).” (Response to City Survey)
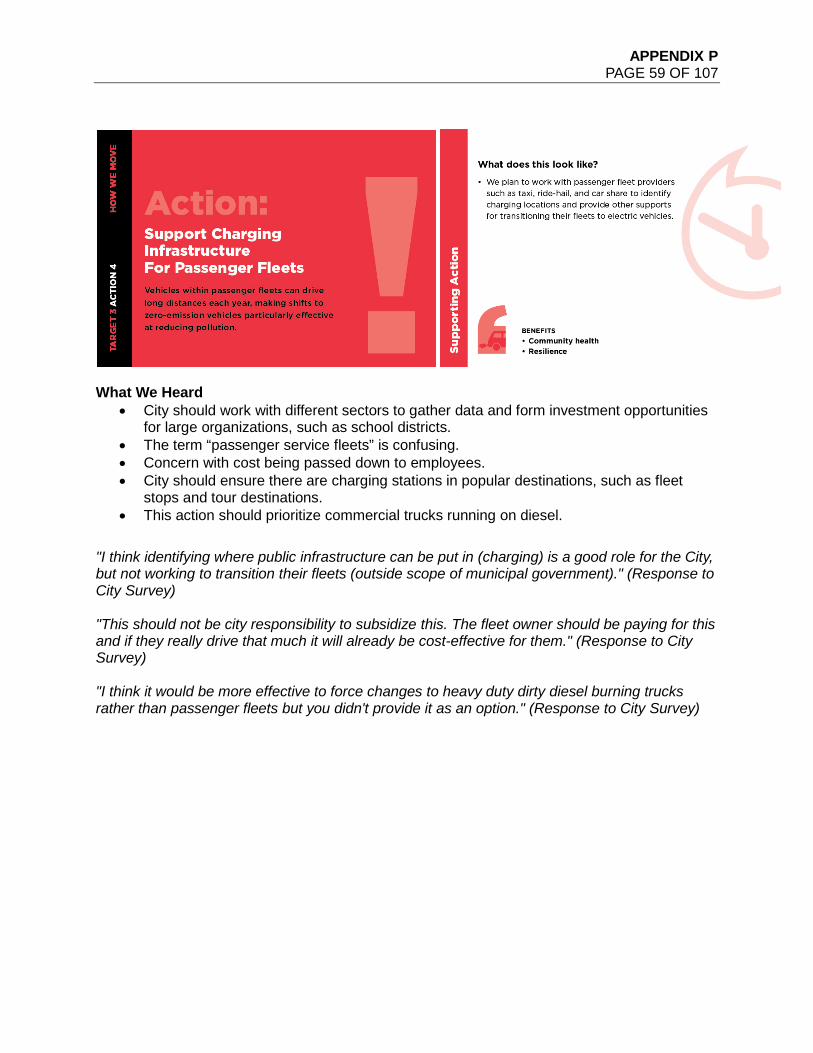
APPENDIX P PAGE 59 OF 107
What We Heard
• City should work with different sectors to gather data and form investment opportunities for large organizations, such as school districts.
• The term “passenger service fleets” is confusing. • Concern with cost being passed down to employees. • City should ensure there are charging stations in popular destinations, such as fleet
stops and tour destinations. • This action should prioritize commercial trucks running on diesel.
"I think identifying where public infrastructure can be put in (charging) is a good role for the City, but not working to transition their fleets (outside scope of municipal government)." (Response to City Survey) "This should not be city responsibility to subsidize this. The fleet owner should be paying for this and if they really drive that much it will already be cost-effective for them." (Response to City Survey) "I think it would be more effective to force changes to heavy duty dirty diesel burning trucks rather than passenger fleets but you didn't provide it as an option." (Response to City Survey)
APPENDIX P PAGE 60 OF 107
There are two targets and nine actions under this category: Target 1: By 2025, all new and replacement heating and hot water systems will be zero emissions
• Action1: Regulate Carbon Pollution from Existing Buildings • Action 2: Provide Training for Zero Emissions Retrofits • Action 3: Make Zero Emissions Retrofits Easier and Less Expensive • Action 4: Collaborate with Utilities on Zero Emissions Energy • Action 5: Transition the Neighbourhood Energy Utility to 100% Renewable Energy
Action 6: Expand Service Area for Vancouver’s Neighbourhood Energy Utility Supply Target 2: By 2030, the embodied emissions from new buildings and construction projects will be reduced by 40% compared to a 2018 baseline
• Action1: Require New Buildings to Use Low Carbon Materials • Action 2: Make it Easier and Less Expensive to Use Lower Carbon Materials in New
Buildings • Action 3: Support the People Using Low-Carbon Materials in New Buildings
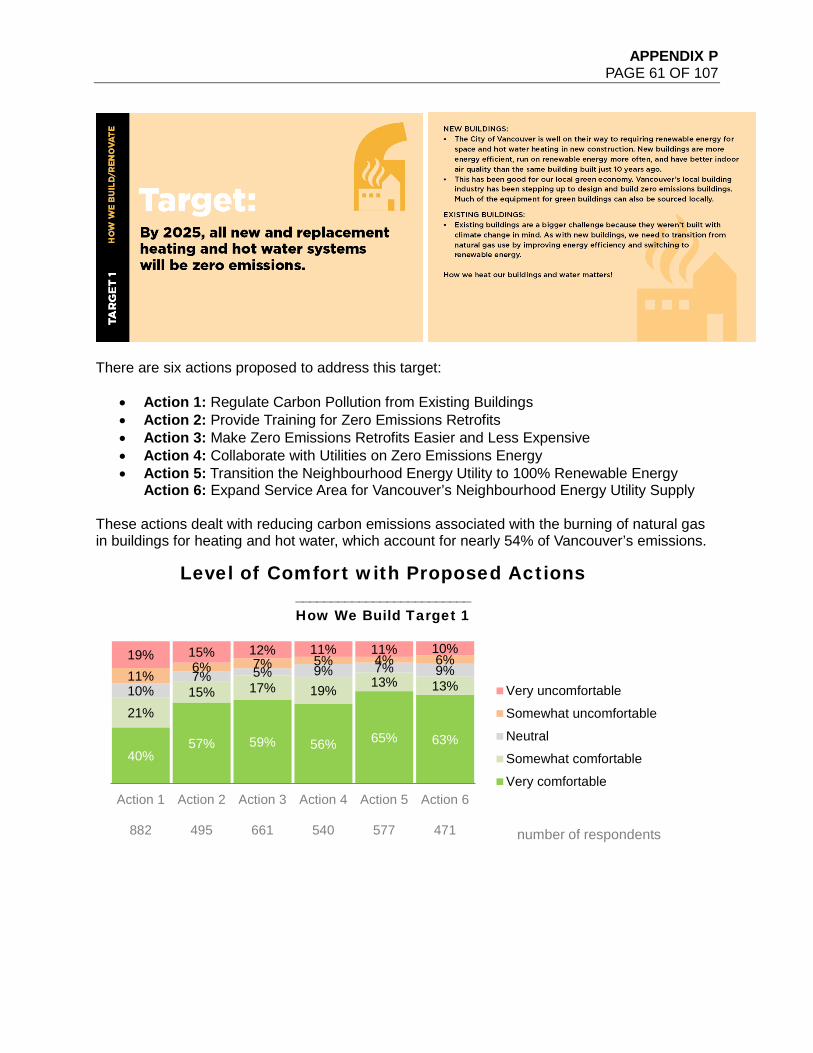
APPENDIX P PAGE 61 OF 107
There are six actions proposed to address this target:
• Action 1: Regulate Carbon Pollution from Existing Buildings • Action 2: Provide Training for Zero Emissions Retrofits • Action 3: Make Zero Emissions Retrofits Easier and Less Expensive • Action 4: Collaborate with Utilities on Zero Emissions Energy • Action 5: Transition the Neighbourhood Energy Utility to 100% Renewable Energy
Action 6: Expand Service Area for Vancouver’s Neighbourhood Energy Utility Supply These actions dealt with reducing carbon emissions associated with the burning of natural gas in buildings for heating and hot water, which account for nearly 54% of Vancouver’s emissions.
40%57% 59% 56% 65% 63%
21%15% 17% 19% 13% 13%10%7% 5% 9% 7% 9%11% 6% 7% 5% 4% 6%19% 15% 12% 11% 11% 10%
Action 1
882
Action 2
495
Action 3
661
Action 4
540
Action 5
577
Action 6
471
Level of Comfort with Proposed Actions_________________________How We Build Target 1
Very uncomfortable
Somewhat uncomfortable
Neutral
Somewhat comfortable
Very comfortable
number of respondents
APPENDIX P PAGE 62 OF 107
Overall, the level of comfort for the bundle of actions for target 1 is high, averaging around 70%. The action with the lowest comfort level is action 1, sitting at a comfort level of 61%, with the largest amount of discomfort expressed at 30%. The following graph of the City survey results shows the level of comfort with each of the actions in target 1. Key themes are described below. Affordability
• When asked what needs to be considered in order for this action to be successful, affordability was the number one comment for each of these actions. Vancouver housing is precarious, and people are concerned with any changes that would require additional costs. Some creative approaches to fund changes were provided, including a carbon tax, parking fees, creating bulk-buying programs or paying for retrofits through the creation of a carbon-offset program.
Incentives
• There was a desire to see incentives to make these changes, especially for lower-income people.
Equity
• Equity came up as a theme—looking to create a varied policy to not unfairly impact those who cannot afford to pay, and to have different considerations for older buildings, which often mean more expensive retrofits.
Education
• People want the City to provide education on why these changes are needed and how they operate and to work with students and the industry to grow the skills to do this work.
Energy sources
• Energy sources were raised, with people asking about other alternative energy sources. There were many questions about renewable natural gas and district energy, highlighting that these are not well-understood terms.
Process
• Whatever changes are made, people wanted a clear process with plenty of lead time, so they can plan accordingly. There was a desire for the City to move quickly on actions like district energy systems, with a desire for larger institutions to take the lead.
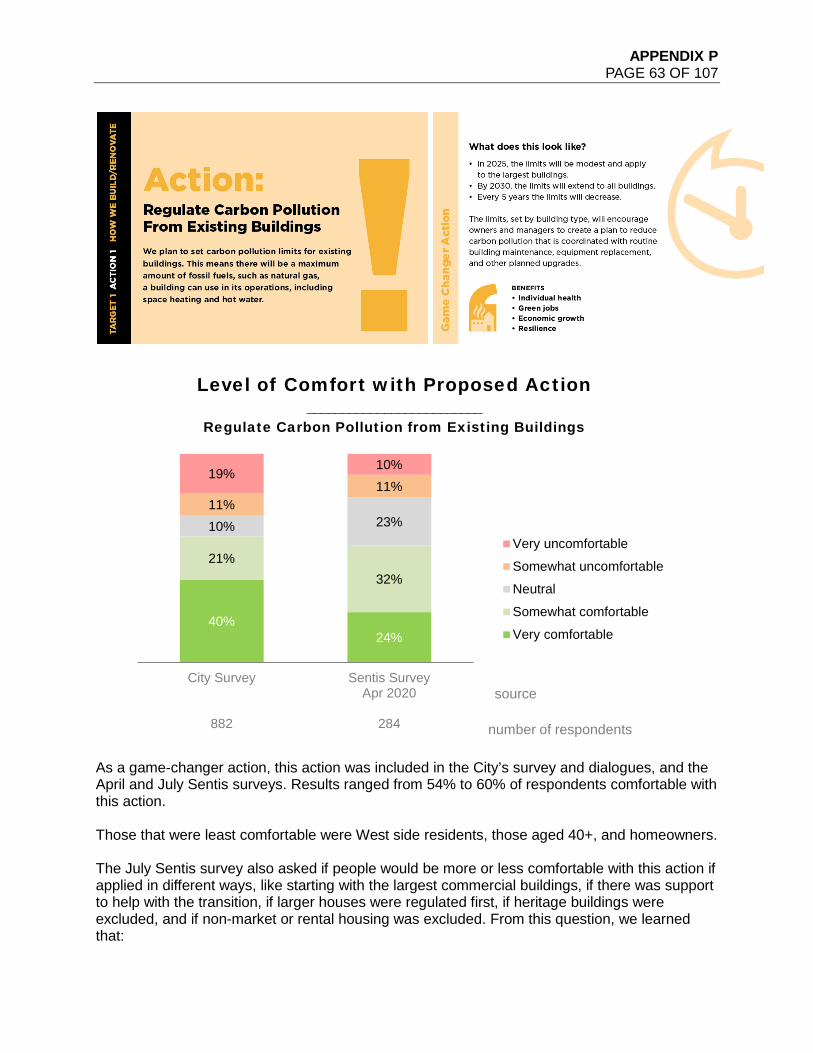
APPENDIX P PAGE 63 OF 107
As a game-changer action, this action was included in the City’s survey and dialogues, and the April and July Sentis surveys. Results ranged from 54% to 60% of respondents comfortable with this action. Those that were least comfortable were West side residents, those aged 40+, and homeowners. The July Sentis survey also asked if people would be more or less comfortable with this action if applied in different ways, like starting with the largest commercial buildings, if there was support to help with the transition, if larger houses were regulated first, if heritage buildings were excluded, and if non-market or rental housing was excluded. From this question, we learned that:
40%24%
21%32%
10% 23%11%
11%19%
10%
City Survey
882
Sentis SurveyApr 2020
284
Level of Comfort with Proposed Action_________________________
Regulate Carbon Pollution from Existing Buildings
Very uncomfortable
Somewhat uncomfortable
Neutral
Somewhat comfortable
Very comfortable
number of respondents
source
APPENDIX P PAGE 64 OF 107
• People were more comfortable with this action if it started with the largest commercial buildings, and if support like training and incentives were available to make the transition easier.
• If the largest houses were regulated first, 46% of respondents were more comfortable. • Excluding heritage buildings and rental apartments made people less comfortable with
this action. What We Heard
• People were concerned about the cost of upgrading heating and hot water systems and the additional cost of electricity. At the core is the concern that housing is already very expensive in Vancouver.
• Concern that costs may be passed onto renters. • There were questions around how enforcement for non-compliance, reporting and
monitoring of energy usage, including required benchmarking, would work. • Regulations should come in with enough time for property owners to plan to do these
upgrades to minimize the financial impact on owners and tenants. • The City should educate building owners/managers, stratas, and the general public
about the benefits of these systems to get them on board. Having more trained professionals could reduce the cost of retrofits and installations.
• Policy should be designed such that low-income households, small businesses, the elderly, those living in older buildings, and renters are not penalized. One respondent noted that it is inequitable to base the carbon limit on size, as single-family homes house fewer people than multi-family buildings. A suggestion was to charge based on income rather than building size.
• The City should provide incentives and subsidies to support the transition to zero emissions.
“Ensuring equity. People living in older buildings (either owners or renters) likely have lower average income than people living in newer buildings, and the cost burden should be distributed equitably.” (Response to City Survey) “I am concerned that the cost of this will be passed onto tenants of residential buildings and most of us cannot afford any additional increase in cost to live where we do.” (Response to Apr 2020 Sentis Survey) “Support for lower income residents to ensure transition is equitable. Higher income levels (esp class A-AAA commercial Real estate) should be charged more (i.e. via Climate Emergency Community Amenity Costs - CECACs) to make shifts more equitable. Work with financial institutions and other intermediaries to provide additional financial support options (i.e. green bonds, micro loans, better insurance premiums for strata's that complete mitigation + adaptation retrofits, etc).” (Response to City Survey) “Natural gas may be a non-renewable fossil fuel, but it is still cheaper than electricity. In this pandemic, it will take several years before taxpayers can recover from the financial problems created and the City of Vancouver is just piling on taxes on taxes. This is just another tax. It isn't about climate change.” (Response to City Survey)
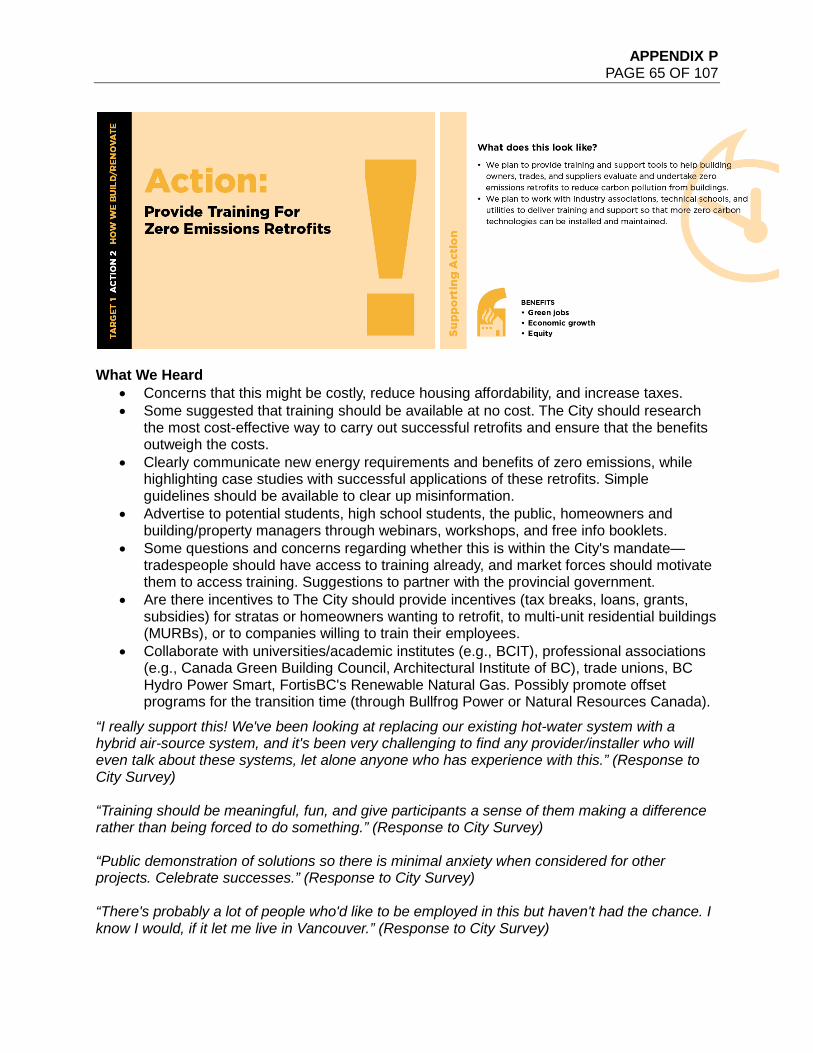
APPENDIX P PAGE 65 OF 107
What We Heard
• Concerns that this might be costly, reduce housing affordability, and increase taxes. • Some suggested that training should be available at no cost. The City should research
the most cost-effective way to carry out successful retrofits and ensure that the benefits outweigh the costs.
• Clearly communicate new energy requirements and benefits of zero emissions, while highlighting case studies with successful applications of these retrofits. Simple guidelines should be available to clear up misinformation.
• Advertise to potential students, high school students, the public, homeowners and building/property managers through webinars, workshops, and free info booklets.
• Some questions and concerns regarding whether this is within the City's mandate—tradespeople should have access to training already, and market forces should motivate them to access training. Suggestions to partner with the provincial government.
• Are there incentives to The City should provide incentives (tax breaks, loans, grants, subsidies) for stratas or homeowners wanting to retrofit, to multi-unit residential buildings (MURBs), or to companies willing to train their employees.
• Collaborate with universities/academic institutes (e.g., BCIT), professional associations (e.g., Canada Green Building Council, Architectural Institute of BC), trade unions, BC Hydro Power Smart, FortisBC's Renewable Natural Gas. Possibly promote offset programs for the transition time (through Bullfrog Power or Natural Resources Canada).
“I really support this! We've been looking at replacing our existing hot-water system with a hybrid air-source system, and it's been very challenging to find any provider/installer who will even talk about these systems, let alone anyone who has experience with this.” (Response to City Survey) “Training should be meaningful, fun, and give participants a sense of them making a difference rather than being forced to do something.” (Response to City Survey) “Public demonstration of solutions so there is minimal anxiety when considered for other projects. Celebrate successes.” (Response to City Survey) “There's probably a lot of people who'd like to be employed in this but haven't had the chance. I know I would, if it let me live in Vancouver.” (Response to City Survey)

APPENDIX P PAGE 66 OF 107
“Consider branding/messaging this as alternative work to fossil fuel extraction work, where applicable. We need louder stories about how workers can transition out of oil and gas -- many of them don't want to be there but don't feel they have good alternatives!” (Response to City Survey)
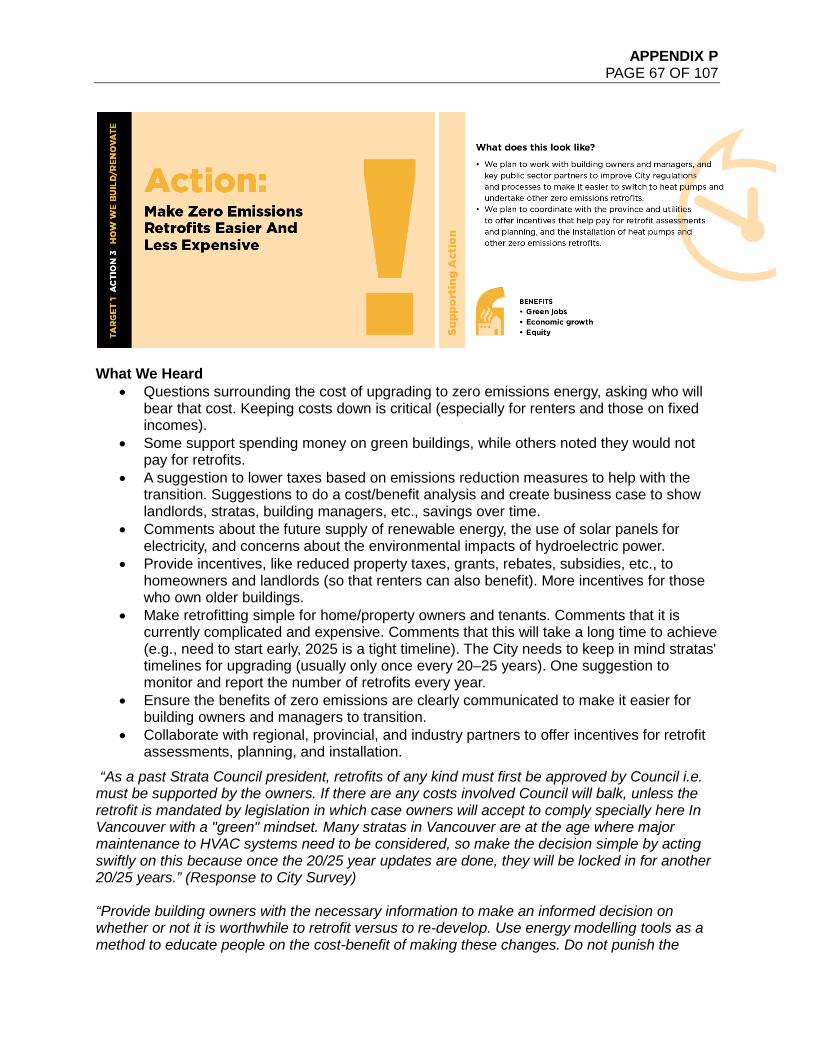
APPENDIX P PAGE 67 OF 107
What We Heard
• Questions surrounding the cost of upgrading to zero emissions energy, asking who will bear that cost. Keeping costs down is critical (especially for renters and those on fixed incomes).
• Some support spending money on green buildings, while others noted they would not pay for retrofits.
• A suggestion to lower taxes based on emissions reduction measures to help with the transition. Suggestions to do a cost/benefit analysis and create business case to show landlords, stratas, building managers, etc., savings over time.
• Comments about the future supply of renewable energy, the use of solar panels for electricity, and concerns about the environmental impacts of hydroelectric power.
• Provide incentives, like reduced property taxes, grants, rebates, subsidies, etc., to homeowners and landlords (so that renters can also benefit). More incentives for those who own older buildings.
• Make retrofitting simple for home/property owners and tenants. Comments that it is currently complicated and expensive. Comments that this will take a long time to achieve (e.g., need to start early, 2025 is a tight timeline). The City needs to keep in mind stratas' timelines for upgrading (usually only once every 20–25 years). One suggestion to monitor and report the number of retrofits every year.
• Ensure the benefits of zero emissions are clearly communicated to make it easier for building owners and managers to transition.
• Collaborate with regional, provincial, and industry partners to offer incentives for retrofit assessments, planning, and installation.
“As a past Strata Council president, retrofits of any kind must first be approved by Council i.e. must be supported by the owners. If there are any costs involved Council will balk, unless the retrofit is mandated by legislation in which case owners will accept to comply specially here In Vancouver with a "green" mindset. Many stratas in Vancouver are at the age where major maintenance to HVAC systems need to be considered, so make the decision simple by acting swiftly on this because once the 20/25 year updates are done, they will be locked in for another 20/25 years.” (Response to City Survey) “Provide building owners with the necessary information to make an informed decision on whether or not it is worthwhile to retrofit versus to re-develop. Use energy modelling tools as a method to educate people on the cost-benefit of making these changes. Do not punish the

APPENDIX P PAGE 68 OF 107
renter for the expenses of retrofits. A new heat pump may be nice but if the upfront cost is high and the building's original materials are inadequate or degrading (most likely poor insulation) then there may not be a case for a retrofit, rather, a rezoning or redevelopment would be better.” (Response to City Survey) “Have you explored ‘additionality’ of retrofit upgrades so that verified investments could be resold as part of voluntary carbon offsets? I offset my flights at a minimum, but these are often far-flung or dubious projects; I'd be willing to put money into local upgrades to pay for my carbon sins.” (Response to City Survey)
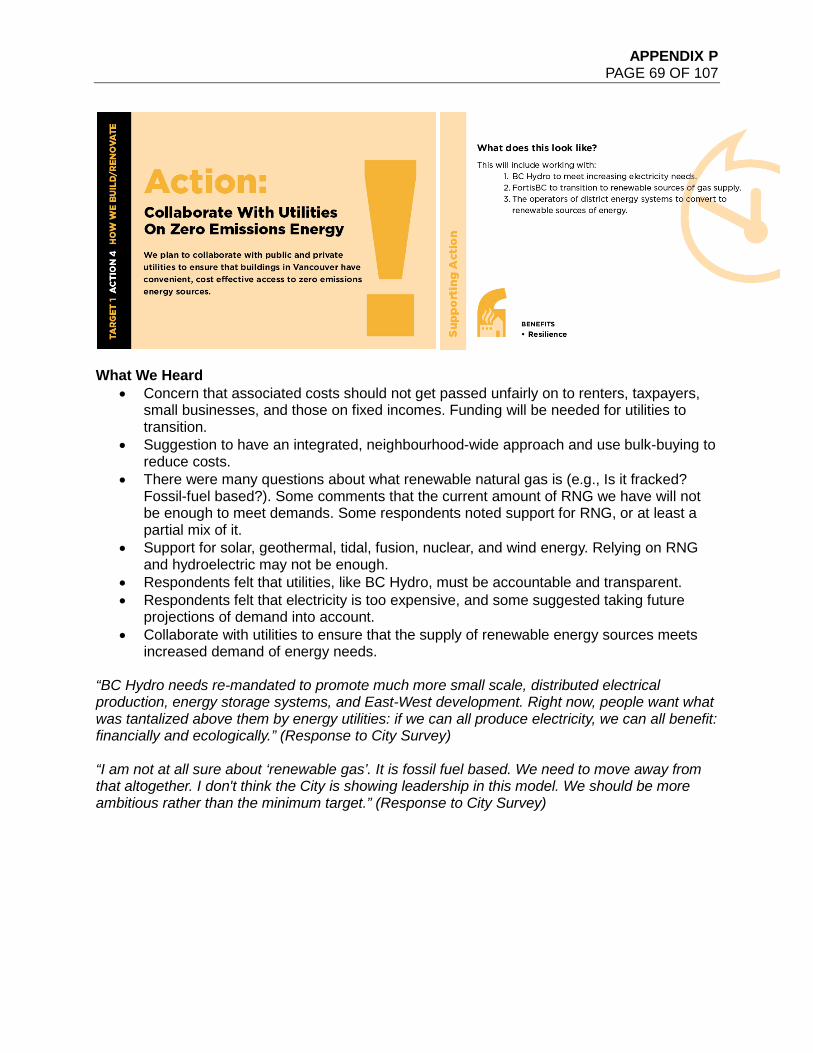
APPENDIX P PAGE 69 OF 107
What We Heard
• Concern that associated costs should not get passed unfairly on to renters, taxpayers, small businesses, and those on fixed incomes. Funding will be needed for utilities to transition.
• Suggestion to have an integrated, neighbourhood-wide approach and use bulk-buying to reduce costs.
• There were many questions about what renewable natural gas is (e.g., Is it fracked? Fossil-fuel based?). Some comments that the current amount of RNG we have will not be enough to meet demands. Some respondents noted support for RNG, or at least a partial mix of it.
• Support for solar, geothermal, tidal, fusion, nuclear, and wind energy. Relying on RNG and hydroelectric may not be enough.
• Respondents felt that utilities, like BC Hydro, must be accountable and transparent. • Respondents felt that electricity is too expensive, and some suggested taking future
projections of demand into account. • Collaborate with utilities to ensure that the supply of renewable energy sources meets
increased demand of energy needs.
“BC Hydro needs re-mandated to promote much more small scale, distributed electrical production, energy storage systems, and East-West development. Right now, people want what was tantalized above them by energy utilities: if we can all produce electricity, we can all benefit: financially and ecologically.” (Response to City Survey)
“I am not at all sure about ‘renewable gas’. It is fossil fuel based. We need to move away from that altogether. I don't think the City is showing leadership in this model. We should be more ambitious rather than the minimum target.” (Response to City Survey)
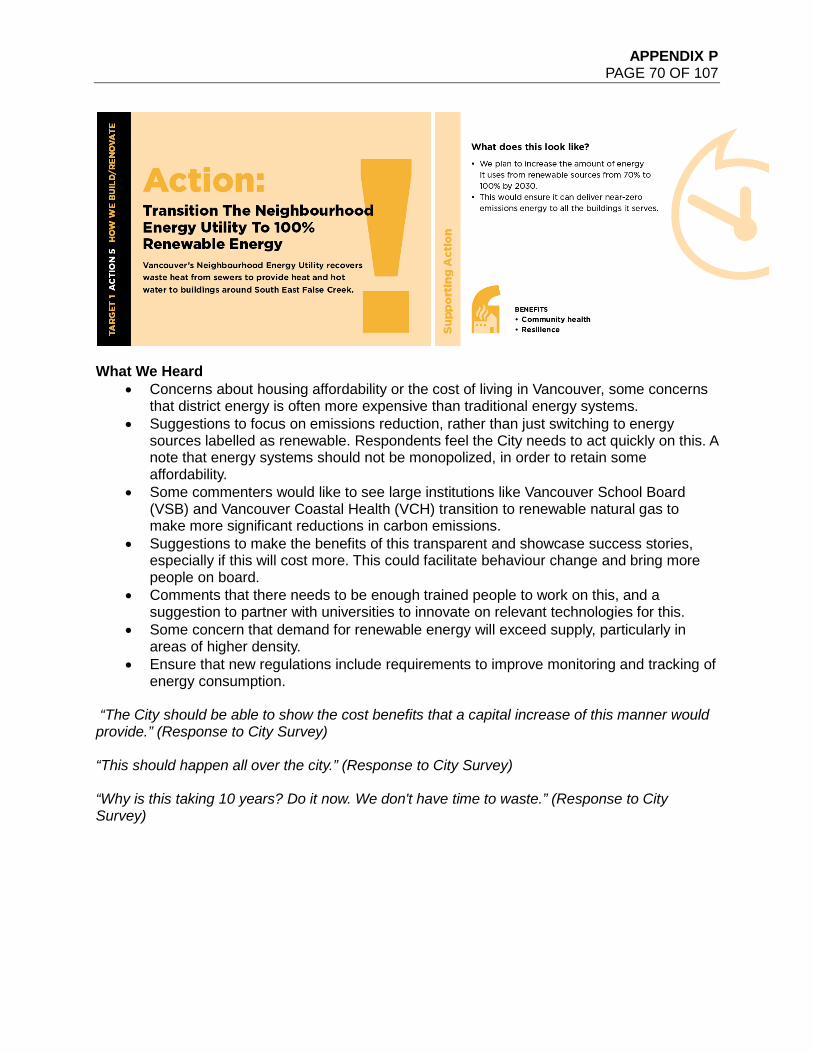
APPENDIX P PAGE 70 OF 107
What We Heard
• Concerns about housing affordability or the cost of living in Vancouver, some concerns that district energy is often more expensive than traditional energy systems.
• Suggestions to focus on emissions reduction, rather than just switching to energy sources labelled as renewable. Respondents feel the City needs to act quickly on this. A note that energy systems should not be monopolized, in order to retain some affordability.
• Some commenters would like to see large institutions like Vancouver School Board (VSB) and Vancouver Coastal Health (VCH) transition to renewable natural gas to make more significant reductions in carbon emissions.
• Suggestions to make the benefits of this transparent and showcase success stories, especially if this will cost more. This could facilitate behaviour change and bring more people on board.
• Comments that there needs to be enough trained people to work on this, and a suggestion to partner with universities to innovate on relevant technologies for this.
• Some concern that demand for renewable energy will exceed supply, particularly in areas of higher density.
• Ensure that new regulations include requirements to improve monitoring and tracking of energy consumption.
“The City should be able to show the cost benefits that a capital increase of this manner would provide.” (Response to City Survey)
“This should happen all over the city.” (Response to City Survey)
“Why is this taking 10 years? Do it now. We don't have time to waste.” (Response to City Survey)
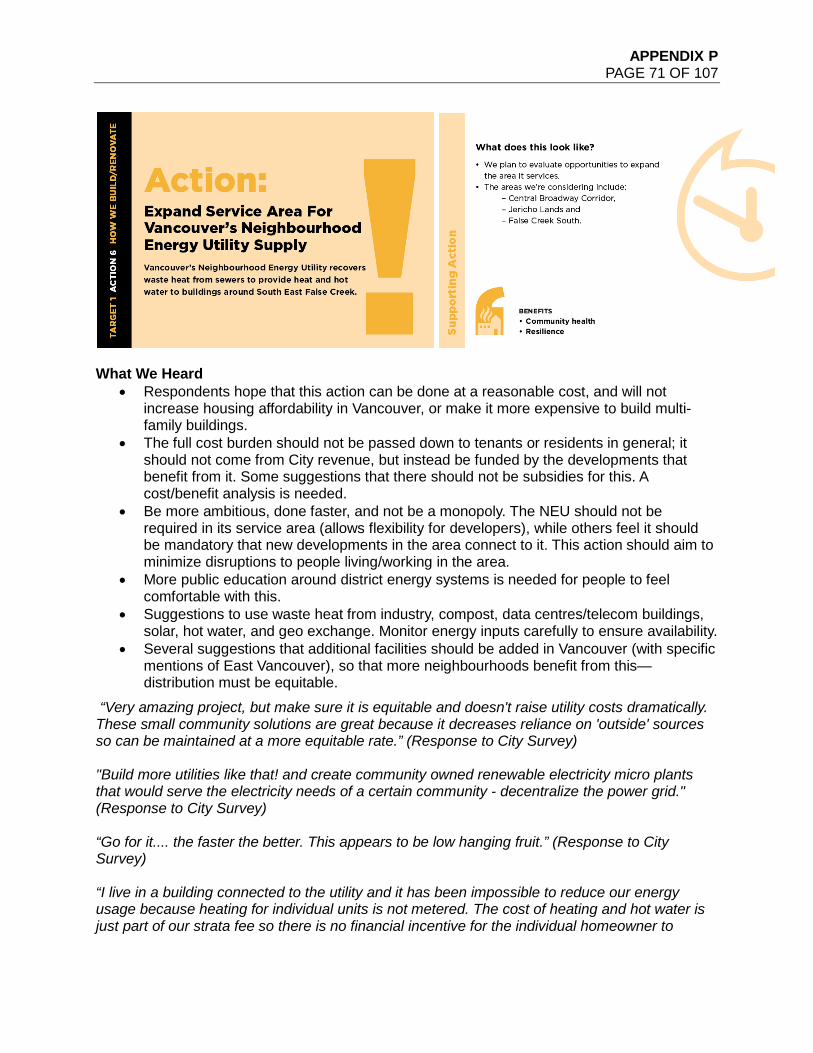
APPENDIX P PAGE 71 OF 107
What We Heard
• Respondents hope that this action can be done at a reasonable cost, and will not increase housing affordability in Vancouver, or make it more expensive to build multi-family buildings.
• The full cost burden should not be passed down to tenants or residents in general; it should not come from City revenue, but instead be funded by the developments that benefit from it. Some suggestions that there should not be subsidies for this. A cost/benefit analysis is needed.
• Be more ambitious, done faster, and not be a monopoly. The NEU should not be required in its service area (allows flexibility for developers), while others feel it should be mandatory that new developments in the area connect to it. This action should aim to minimize disruptions to people living/working in the area.
• More public education around district energy systems is needed for people to feel comfortable with this.
• Suggestions to use waste heat from industry, compost, data centres/telecom buildings, solar, hot water, and geo exchange. Monitor energy inputs carefully to ensure availability.
• Several suggestions that additional facilities should be added in Vancouver (with specific mentions of East Vancouver), so that more neighbourhoods benefit from this—distribution must be equitable.
“Very amazing project, but make sure it is equitable and doesn't raise utility costs dramatically. These small community solutions are great because it decreases reliance on 'outside' sources so can be maintained at a more equitable rate.” (Response to City Survey) "Build more utilities like that! and create community owned renewable electricity micro plants that would serve the electricity needs of a certain community - decentralize the power grid." (Response to City Survey)
“Go for it.... the faster the better. This appears to be low hanging fruit.” (Response to City Survey) “I live in a building connected to the utility and it has been impossible to reduce our energy usage because heating for individual units is not metered. The cost of heating and hot water is just part of our strata fee so there is no financial incentive for the individual homeowner to
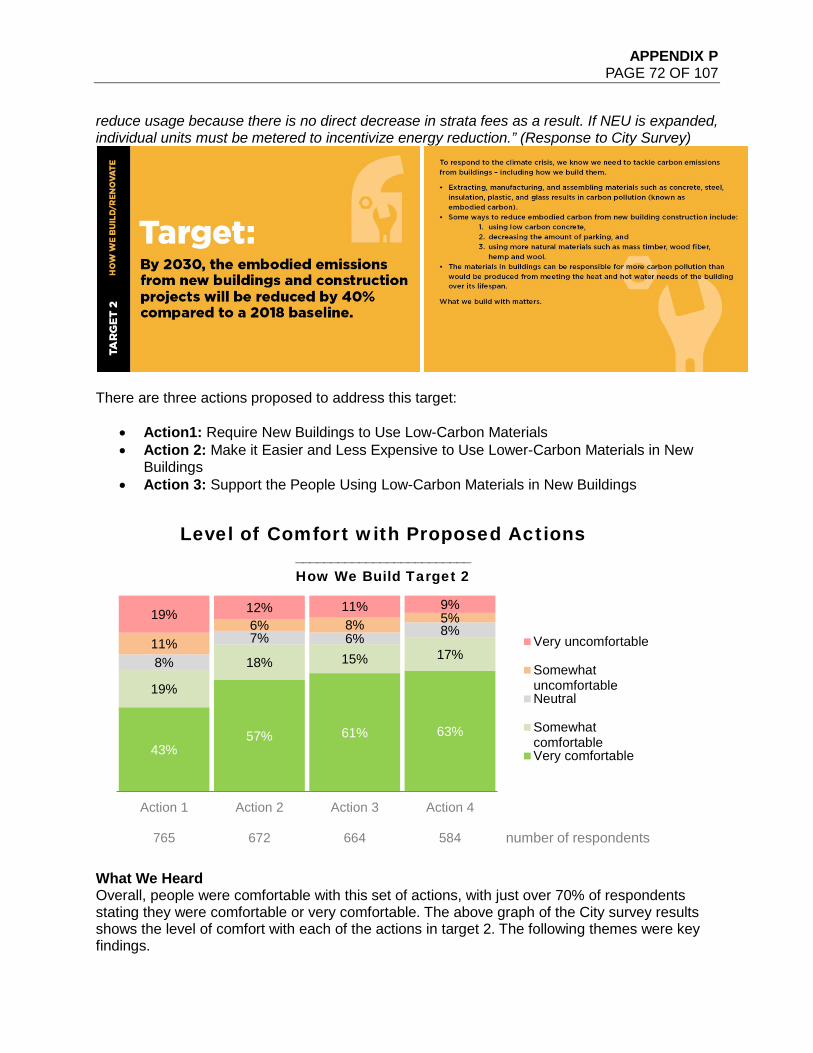
APPENDIX P PAGE 72 OF 107
reduce usage because there is no direct decrease in strata fees as a result. If NEU is expanded, individual units must be metered to incentivize energy reduction.” (Response to City Survey)
There are three actions proposed to address this target:
• Action1: Require New Buildings to Use Low-Carbon Materials • Action 2: Make it Easier and Less Expensive to Use Lower-Carbon Materials in New
Buildings • Action 3: Support the People Using Low-Carbon Materials in New Buildings
What We Heard Overall, people were comfortable with this set of actions, with just over 70% of respondents stating they were comfortable or very comfortable. The above graph of the City survey results shows the level of comfort with each of the actions in target 2. The following themes were key findings.
43%57% 61% 63%
19%
18% 15% 17%8%
7% 6% 8%11%
6% 8% 5%19% 12% 11% 9%
Action 1
765
Action 2
672
Action 3
664
Action 4
584
Level of Comfort with Proposed Actions_________________________How We Build Target 2
Very uncomfortable
SomewhatuncomfortableNeutral
SomewhatcomfortableVery comfortable
number of respondents

APPENDIX P PAGE 73 OF 107
Affordability/cost
• Concerns that this action would increase the cost of housing, which is already very high. Lifecycle emissions
• People wanted to see the lifecycle emissions of building materials considered, as there is concern about the rate of building demolition in Vancouver with construction material being sent to the landfill.
• People wanted to see durability of materials. Regulation and enforcement
• Comments about how to monitor to make sure that materials are low carbon. Education and awareness
• There were calls for better education/awareness, so people know why this is being done and what materials should be considered.
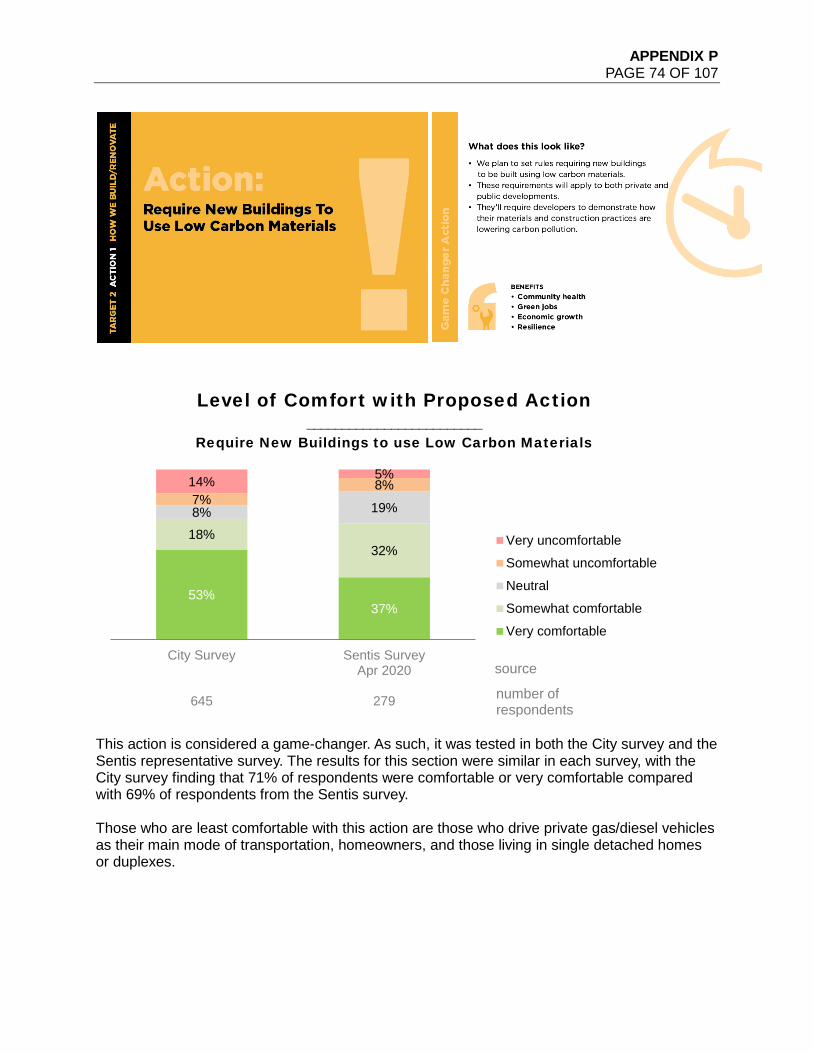
APPENDIX P PAGE 74 OF 107
This action is considered a game-changer. As such, it was tested in both the City survey and the Sentis representative survey. The results for this section were similar in each survey, with the City survey finding that 71% of respondents were comfortable or very comfortable compared with 69% of respondents from the Sentis survey. Those who are least comfortable with this action are those who drive private gas/diesel vehicles as their main mode of transportation, homeowners, and those living in single detached homes or duplexes.
53%37%
18%32%
8% 19%7%8%14% 5%
City Survey
645
Sentis SurveyApr 2020
279
Level of Comfort with Proposed Action_________________________
Require New Buildings to use Low Carbon Materials
Very uncomfortable
Somewhat uncomfortable
Neutral
Somewhat comfortable
Very comfortable
number of respondents
source
APPENDIX P PAGE 75 OF 107
What We Heard
• Worries that this would increase the already high cost of housing in Vancouver that could add to inequity.
• There was a desire to make sure the materials are affordable and to keep in mind low-income residents, renters, those without homes and people on fixed incomes.
• There is a concern about the rate of demolition in Vancouver and associated emissions; need to consider the entire lifecycle of the building. Look to use recycled materials in construction along with materials locally produced.
• Need to carefully monitor to ensure building materials are low carbon/sustainable. What would the penalties be for non-compliance?
• Feedback from staff emphasized the importance of considering how new requirements may affect application and permitting time in rezoning and development applications.
• Recommendations that the City provide guidance on which materials are low carbon. Durability, availability and cost should all be considered.
• Participants would like to see improved awareness that highlights successful low-carbon developments and builders, as well as the benefits and costs of low-carbon materials and recognition of community leaders in this industry to better support faster adoption of low-carbon development.
• Participants would also like to see reporting and monitoring of lower-carbon materials to better understand how and where these materials are most commonly used and identify gaps for further improvements.
“Housing affordability is already a huge issue in Vancouver with much of the cause being costs imposed or caused by the City. Any changes to building codes should be done in such a way as to not increase building costs as they will make the affordability crisis worst, not better.” (Response to City Survey)
“It sounds like more red tape and cost that will be added to construction. I thought the city wanted to lower the cost of housing in Vancouver.” (Response to City Survey)
“Great plan, but what about the large, useless, cheaply built but extravagantly opulent new homes going up? What about the environmental cost of tearing down 10 year old homes and putting up McMansions full of marble countertops, European kitchens, massive appliances, multiple bathrooms? What about the waste? What about the brief lifespan of these tacky new houses? By all means let's have healthy green new homes, but let's stop allowing junk to be built right now.” (Response to City Survey)
“I can’t comment without knowing what is meant by ‘low-carbon materials’ and what unintended consequences that involves. For instance, a lot of buildings now use concrete flooring to get a better LEED rating. This ignores many the fact that once installed, concrete is difficult to renovate or adapt to changing needs. If a concrete stair or ramp needs to be changed, that may mean it is replaced, broken up and taken to landfill. Also, concrete flooring is hard on the human bodies that must stand or walk on it in the workplace or home, so extra expense is required for remediation.” (Response to City Survey)
APPENDIX P PAGE 76 OF 107
What We Heard
• If this costs too much, change will be difficult. Materials need to be available in a competitive price range.
• Concerns about "trying" this out and who will pay for this if it does not work. If this does increase the cost of housing, more funding will be needed to provide affordable housing.
• There were mixed views of incentives; some felt these changes should be mandated, not incentivized. Or if there are incentives, they should help homeowners, suppliers, architects and builders, and not just developers. There were suggestions to offer tax incentives for LEED buildings, or to offer rewards to buildings with low-carbon materials.
• A suggestion to consider clean production, transportation, deconstruction and end-of-life, in addition to material types. Several suggestions to use recycled materials. Concern over wasteful construction practices.
• Materials should be durable to ensure the longevity of buildings. • Some support for mass timber; a few concerns about how noise travels in wood-frame
buildings (especially with increases in density). • A suggestion to use straw, low-temp asphalts, recycled cement, hempcrete, and to move
away from concrete altogether. • Suggestions that the City should properly research and test new materials before they
are used. • To avoid greenwashing with a certification given for truly low-carbon materials. • Consider building-in green infrastructure, to challenge status-quo “cookie-cutter” building
practices (mentions of glass boxes), ensure multi-unit residential buildings are more soundproof, ensure the longevity of new builds, and think of the building process more holistically (envelope and energy).
“What would the provided incentives be? Would not want them to be increased height and reduced landscaping. Why not level the playing field and mandate green building materials rather than incentivise?” (Response to City Survey)
“The city should use technical experts to estimate the value of each offset, and provide property tax credits based on the offsets used relative to the market leader. There should not be subsidies paid to builders using the market standard just because it is more efficient than some arbitrary baseline.” (Response to City Survey)
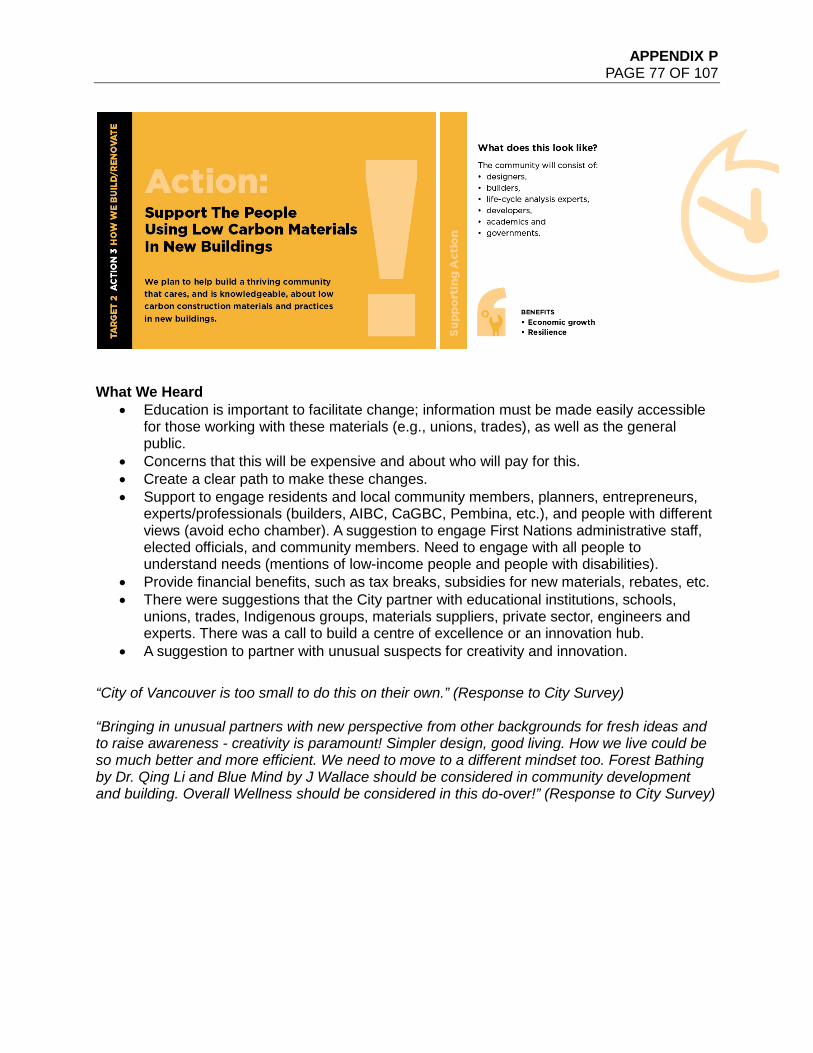
APPENDIX P PAGE 77 OF 107
What We Heard
• Education is important to facilitate change; information must be made easily accessible for those working with these materials (e.g., unions, trades), as well as the general public.
• Concerns that this will be expensive and about who will pay for this. • Create a clear path to make these changes. • Support to engage residents and local community members, planners, entrepreneurs,
experts/professionals (builders, AIBC, CaGBC, Pembina, etc.), and people with different views (avoid echo chamber). A suggestion to engage First Nations administrative staff, elected officials, and community members. Need to engage with all people to understand needs (mentions of low-income people and people with disabilities).
• Provide financial benefits, such as tax breaks, subsidies for new materials, rebates, etc. • There were suggestions that the City partner with educational institutions, schools,
unions, trades, Indigenous groups, materials suppliers, private sector, engineers and experts. There was a call to build a centre of excellence or an innovation hub.
• A suggestion to partner with unusual suspects for creativity and innovation. “City of Vancouver is too small to do this on their own.” (Response to City Survey)
“Bringing in unusual partners with new perspective from other backgrounds for fresh ideas and to raise awareness - creativity is paramount! Simpler design, good living. How we live could be so much better and more efficient. We need to move to a different mindset too. Forest Bathing by Dr. Qing Li and Blue Mind by J Wallace should be considered in community development and building. Overall Wellness should be considered in this do-over!” (Response to City Survey)
APPENDIX P PAGE 78 OF 107
Impact of COVID-19 Halfway through our engagement period we added a question to the survey related to COVID-19. The specific question was, “Are there any climate actions that might be possible now that weren’t before COVID?” There were 769 responses to this question. For completion, this section includes themes that were already discussed in How We Move Target 1 and 2 sections. What We Heard Remote work
• With so many people working remotely, there was a desire to see the City encourage businesses to continue this trend, where possible. People connected this action with less commuting, less traffic, fewer emissions, and cleaner air, while also enabling roads and office buildings to be repurposed for other uses. There were comments that it does not matter if you cannot find housing close to your work if you can work remotely. Concerns that arose were about having enough space to have multiple adults working from home, increases in home hydro bills, and a call to look at zoning to enable more opportunities for home businesses.
“COVID proved we could work at home. If 10-30% of a company wants to keep working at home, this could reduce the need for office space built and used, which would have a huge impact on construction carbon, and carbon emissions without commutes to work. It would also allow for people priced out of the downtown core to work these jobs remotely.” (Response to City Survey) Reallocate road space
• Many respondents encouraged the City to convert road space to create wider sidewalks, bike lanes, patios for local restaurants, and park space. These comments were often linked to health and safety concerns—that our sidewalks are too narrow and too crowded to pass people safely, and also with the viewpoint that with so many people working from home, car volumes have been reduced, enabling the change.
“I feel like in my community (Mount Pleasant) I am more aware than ever that cars have been prioritized in the community. I find that it's not always easy for me to comfortably take my small children out for a walk in our neighbourhood while socially distancing yet cars/driving hasn't been impacted at all. I like seeing the city slowing traffic on some streets to allow for more biking and walking and I would like this to continue.” (Response to City Survey) Limit car use
• These comments were connected with ways to limit car use—by bundling trips, having delivery, or finding alternatives to the car. There were calls for car-free streets—if not permanently, then as a weekly or monthly event. Many people spoke about the improved air quality and the quiet environment that came with lighter car use during this time and wanted to have that continue.
“Shutting down the Vancouver downtown core to all vehicles except ride sharing & transit.” (Response to City Survey) Increase active transportation
APPENDIX P PAGE 79 OF 107
• More people are walking and biking around the city and there was a desire to see more of this.
“Way more bike racks. Improved separation of cyclists and walkers. Promote cycling safety, rules and etiquette. Put in barriers so cyclists need to dismount when crossing pedestrian walkways or slow down.” (Response to City Survey) Create walkable communities
• As more people were staying local, there was a sense of gratitude toward the amenities that people could walk to while physically distancing. People expressed a desire to be able to walk to schools, to see more commercial uses added to residential areas to encourage walking, to see more parks, and to see hubs of flexible work spaces, so people do not have to commute downtown.
• There were also concerns that COVID-19 would make people feel uncomfortable living in high-density environments.
“Several things have been learned: Dense housing is bad; single, dispersed populations are more robust and less stressed. Walking is the most viable non-auto option.” (Response to City Survey) “It’s not about public transportation, it's about walking to school/work. We need vibrant neighbourhoods and more of them. I want everything I need to be within a 10-minute walk.” (Response to City Survey) Urban agriculture/food security
• There were concerns about potential disruption to our food systems and a desire to see more food grown, both within the city (front lawns, in green spaces, on rooftops) and within the region.
“Expand farmers' markets opportunities by increasing urban farms and supporting urban agriculture, convert some of the COV growing capacity to shift to food rather than decorative flowers and plants, sell or give vegetables to low-income families, grow seedlings that can be planted in backyards and balcony gardens, consider pollinator avenues, any efforts to reduce the distance our food travels.” (Response to City Survey)
Stewardship/green space
• The importance of green space was highlighted through this pandemic, along with a desire to continue to invest in parks and expand the system. This should include development that increases biodiversity, restores wetlands and creates space for wildlife.
“More park space as it's very limited in the whole city and roadways need to be permeable with a stronger emphasis for rainwater retention and infiltration and less roadway pavement for more street trees. Many city streets still contain no room for street trees in an area that's a rainforest.” (Response to City Survey)
Housing
• People expressed a desire for more affordable housing that is closer to their work to reduce their commute.
APPENDIX P PAGE 80 OF 107
• There was a concern that essential workers cannot afford to live here, and how that impacts the resiliency of our city.
• There was a desire to see zoning changes to allow apartments in single-family neighbourhoods.
“Re-designing housing in the city so that people of all levels of income can live in each of the neighbourhoods. The fact that almost all service people (fire, hospital, police, homecare aids) who work on the north shore must cross the bridges from other neighbourhoods increases transport cost and pollution. It is also vulnerable to bridge outage.” (Response to City Survey) Health/safety
• People expressed concern about catching COVID-19 in public spaces, on transit, and in higher-density areas, and wanted to see more cleaning and room for physical distancing. A particular concern we heard from older, Asian women, was around not feeling safe on public transit because of anti-Asian violence.
“We need more security in public places to protect minorities from abuse.” (Response to City Survey) Economic Opportunities
• Suggestions not to build back the economy as it was, but to advance the green economy with recovery and to support a green new deal. Several comments about looking at adopting the "donut model" being promoted in Amsterdam that situates an economic model within ecological boundaries.
“We have all learned to change and focus on our priorities. I think a lot is possible now that didn't seem possible before. We have to rebuild our industries and connections in different ways - we can focus on projects and industries that also achieve the climate emergency response goals so that make the best use of our efforts and time. We need to address inequalities and the social determinants for public health and a robust climate response.” (Response to City Survey)
APPENDIX P PAGE 81 OF 107
In addition to the 19 actions presented in How We Move and How We Build/Renovate, three additional topics that extend the reach of what the City alone can do, were explored under the category How We Amplify. Each of these topics had exploratory questions as opposed to responding to sets of actions like the other two categories. Topic 1: Carbon Sequestration - Capturing carbon pollution from our atmosphere. In April 2019, City Council directed staff to undertake the work necessary to establish a target for capturing carbon pollution. By protecting natural areas in our city and beyond, we can keep more carbon where it needs to be—in the ground and trees—to reduce its effects in the atmosphere. Staff are in the early stages of putting together a carbon sequestration plan. Right now, understanding around carbon sequestration is in its infancy, but we know that there is not enough space in Vancouver to sequester the amount of carbon required. Larger tracts of land will be required to make this move possible. To get early feedback on this move, three questions were asked through this process. The public dialogues for this topic were impacted due to COVID-19, so most of the results are from the survey respondents. In total, 599 people responded to the questions on carbon sequestration in the survey. One question was also included in the Sentis survey.
• Question 1: What opportunities for carbon sequestration projects (like improving stream areas, wetlands, forests and agriculture) do you see within the City?
• Question 2: If the City were to protect lands outside Vancouver for carbon sequestration, what do you think we need to consider in order for it to be successful?
Topic 2: Personal Consumption - Reducing our global carbon footprint through what we eat and buy. The City has a long history of taking action on the carbon pollution generated in our city. We have much less experience reducing carbon pollution from manufacturing, production, and transportation of food and goods imported into Vancouver from all around the world. The City of Vancouver does not have a target set for reducing carbon pollution from personal consumption. This category has questions around food choice and waste production. Just over 600 people answered the questions for this section of the survey
• Question 1: You likely already eat some meals that have no meat or dairy. What leads you to sometimes have meals like this?
• Question 2: What would need to happen for you to reduce how often you eat meat and dairy? (e.g. at home, on the road, and at restaurants)

APPENDIX P PAGE 82 OF 107
• Question 3: what kinds of things lead to wasted food in your house? • Question 4a: Are there items that you have had difficulty finding second-hand or
through sharing or borrowing programs? • Question 4b: What items have you wanted to repair but found it difficult? • Question 5: If you do not currently get items repaired or get items second-hand or
through sharing programs, why don’t you do this? Topic 3: Collaborative Leadership - Growing the collaborative leadership strength in our community to meet the climate crisis. Our vision is for a city with a strong network of collaborative leaders who are working together to scale, grow and amplify each other’s work. Collaborative leadership recognizes that results cannot be achieved without working together on shared challenges. It is about making it easier for participants to learn about and from each other, appreciate individual strengths and limitations, and look for chances to work together on a common goal. This could even mean changing our existing systems and behaviours. To get this feedback, we asked questions in the survey, in public dialogues, and at staff dialogues. A Collaborative Leadership Advisory Group was convened to discuss these issues. We gathered over 400 responses to this section of the survey.
• Question 1: What does leadership look like (behave, reside) in this space of climate action? Who do you look to as leaders in this space?
• Question 2: In what ways do you see yourself as a potential leader in this space? • Question 3: Are you actively engaged in a community based network, and if so, what is
it and what does it do? • Question 4: What would collaborative leadership look like for you or your community-
based network? What barriers exist now that you need help with in order to create that?
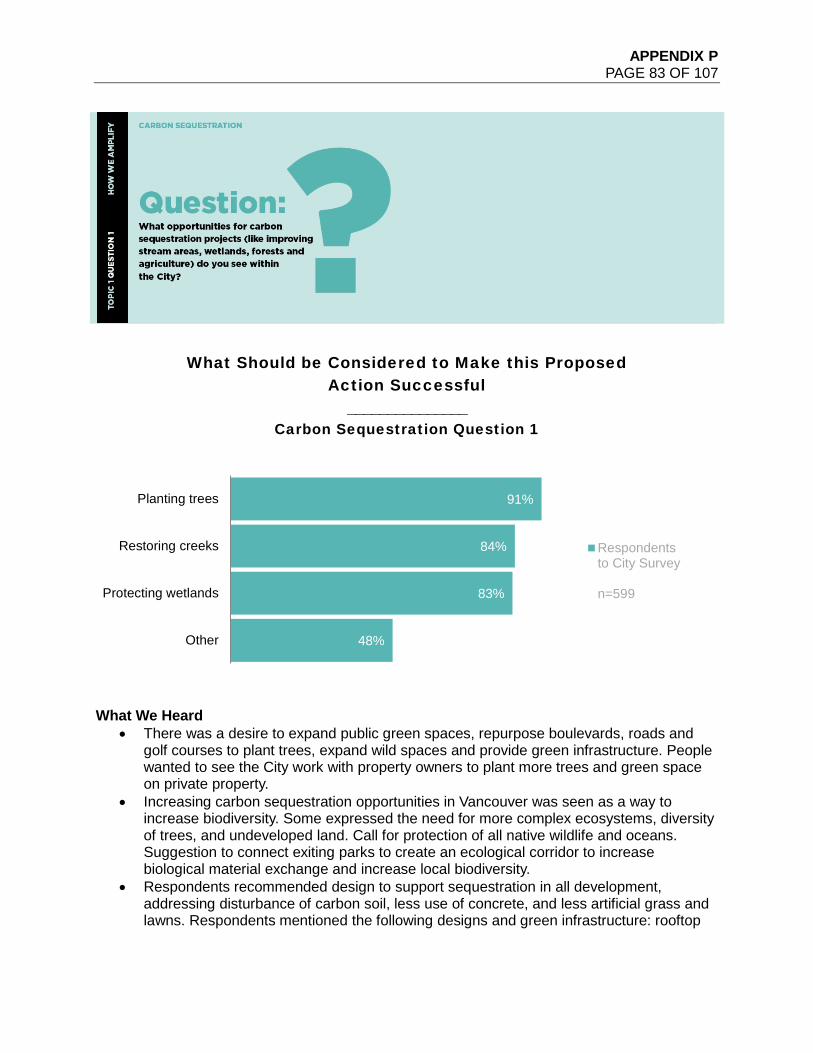
APPENDIX P PAGE 83 OF 107
What We Heard
• There was a desire to expand public green spaces, repurpose boulevards, roads and golf courses to plant trees, expand wild spaces and provide green infrastructure. People wanted to see the City work with property owners to plant more trees and green space on private property.
• Increasing carbon sequestration opportunities in Vancouver was seen as a way to increase biodiversity. Some expressed the need for more complex ecosystems, diversity of trees, and undeveloped land. Call for protection of all native wildlife and oceans. Suggestion to connect exiting parks to create an ecological corridor to increase biological material exchange and increase local biodiversity.
• Respondents recommended design to support sequestration in all development, addressing disturbance of carbon soil, less use of concrete, and less artificial grass and lawns. Respondents mentioned the following designs and green infrastructure: rooftop
48%
83%
84%
91%
Other
Protecting wetlands
Restoring creeks
Planting trees
What Should be Considered to Make this Proposed Action Successful
_______________Carbon Sequestration Question 1
Respondentsto City Survey
n=599
APPENDIX P PAGE 84 OF 107
gardens, urban farming, natural green space, vertical gardens on buildings, and green roofs.
Shoreline and ocean ecosystem health - seaweed and kelp beds, phytoplankton are important for carbon sequestration, so the city should do everything it can do protect the Pacific Ocean" (Response to City Survey)
"This will be a drop in the bucket globally. In fact, probably less than a drop. A feel good, pointless exercise if you look at the global situation. We need massive reforestation of thousands of sq kilometres not a few more trees in Mount Pleasant." (Response to City Survey) "More complex wild/garden-type ecosystems that have proven effectiveness on managing storm surge water/flood drainage etc. (e.g, expansion of programs like green streets)" (Response to City Survey)
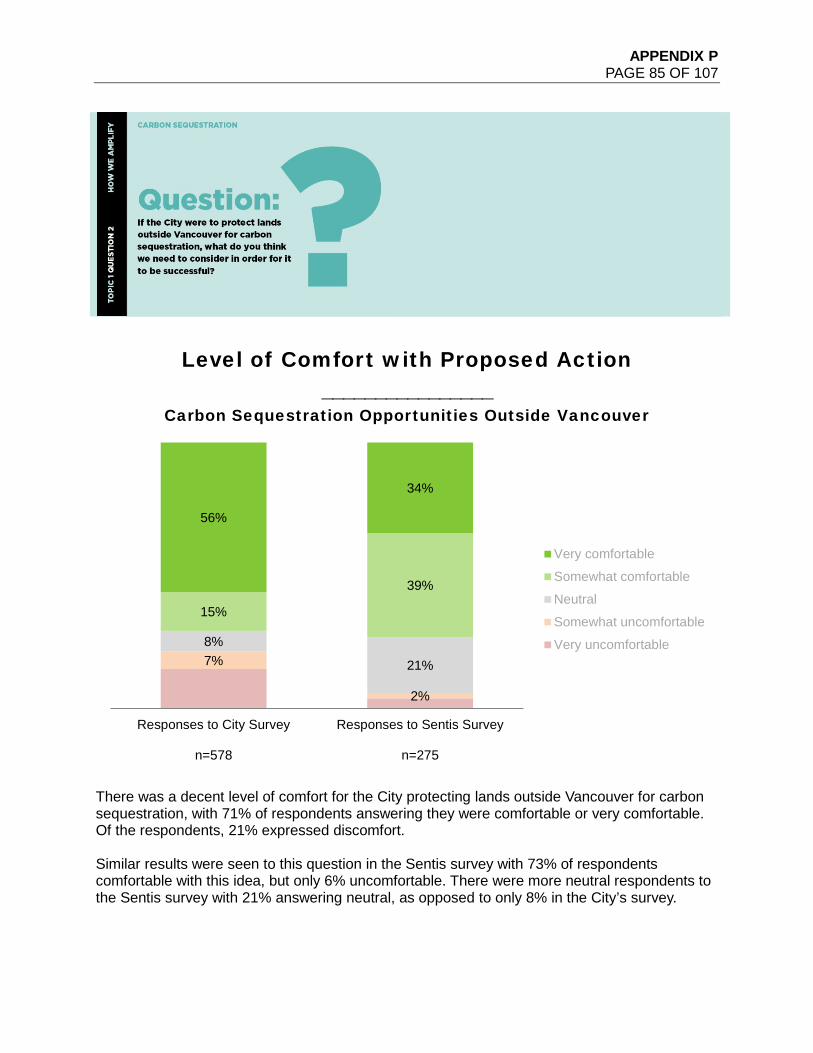
APPENDIX P PAGE 85 OF 107
There was a decent level of comfort for the City protecting lands outside Vancouver for carbon sequestration, with 71% of respondents answering they were comfortable or very comfortable. Of the respondents, 21% expressed discomfort. Similar results were seen to this question in the Sentis survey with 73% of respondents comfortable with this idea, but only 6% uncomfortable. There were more neutral respondents to the Sentis survey with 21% answering neutral, as opposed to only 8% in the City’s survey.
7%
2%
8%
21%
15%
39%
56%
34%
Responses to City Survey
n=578
Responses to Sentis Survey
n=275
Level of Comfort with Proposed Action________________
Carbon Sequestration Opportunities Outside Vancouver
Very comfortable
Somewhat comfortable
Neutral
Somewhat uncomfortable
Very uncomfortable
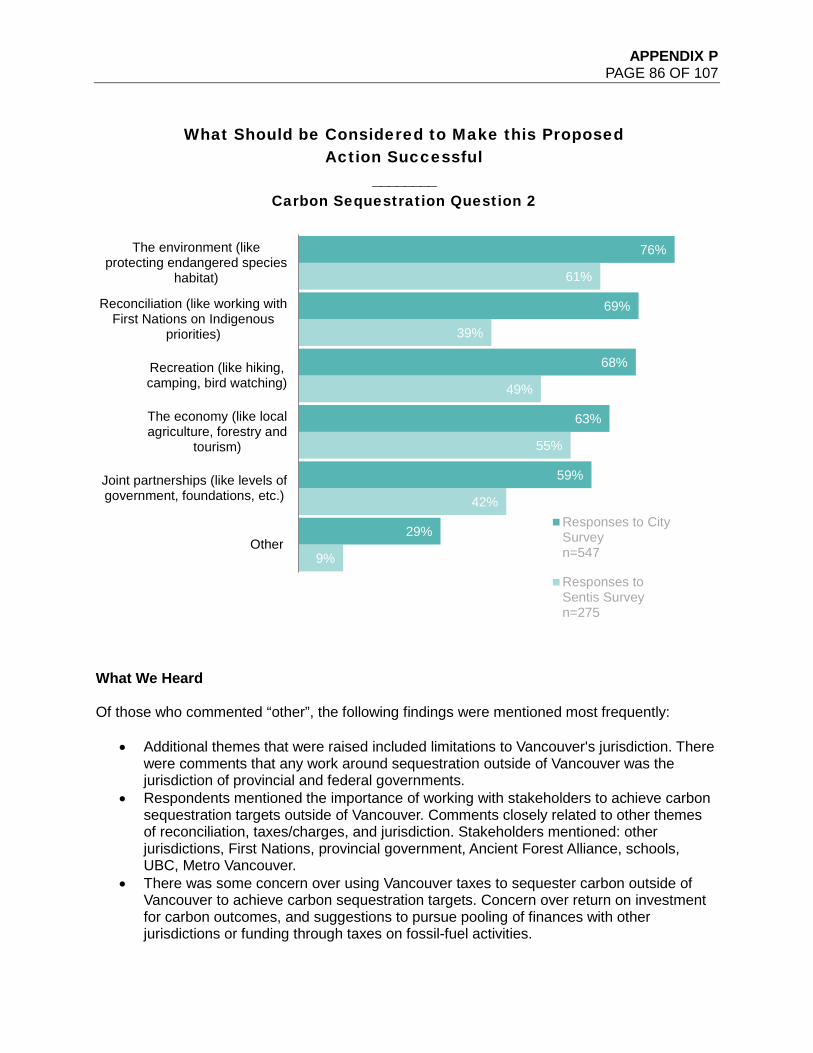
APPENDIX P PAGE 86 OF 107
What We Heard Of those who commented “other”, the following findings were mentioned most frequently:
• Additional themes that were raised included limitations to Vancouver's jurisdiction. There were comments that any work around sequestration outside of Vancouver was the jurisdiction of provincial and federal governments.
• Respondents mentioned the importance of working with stakeholders to achieve carbon sequestration targets outside of Vancouver. Comments closely related to other themes of reconciliation, taxes/charges, and jurisdiction. Stakeholders mentioned: other jurisdictions, First Nations, provincial government, Ancient Forest Alliance, schools, UBC, Metro Vancouver.
• There was some concern over using Vancouver taxes to sequester carbon outside of Vancouver to achieve carbon sequestration targets. Concern over return on investment for carbon outcomes, and suggestions to pursue pooling of finances with other jurisdictions or funding through taxes on fossil-fuel activities.
9%
42%
55%
49%
39%
61%
29%
59%
63%
68%
69%
76%
Other
Joint partnerships (like levels ofgovernment, foundations, etc.)
The economy (like localagriculture, forestry and
tourism)
Recreation (like hiking,camping, bird watching)
Reconciliation (like working withFirst Nations on Indigenous
priorities)
The environment (likeprotecting endangered species
habitat)
What Should be Considered to Make this Proposed Action Successful
________Carbon Sequestration Question 2
Responses to CitySurveyn=547
Responses toSentis Surveyn=275
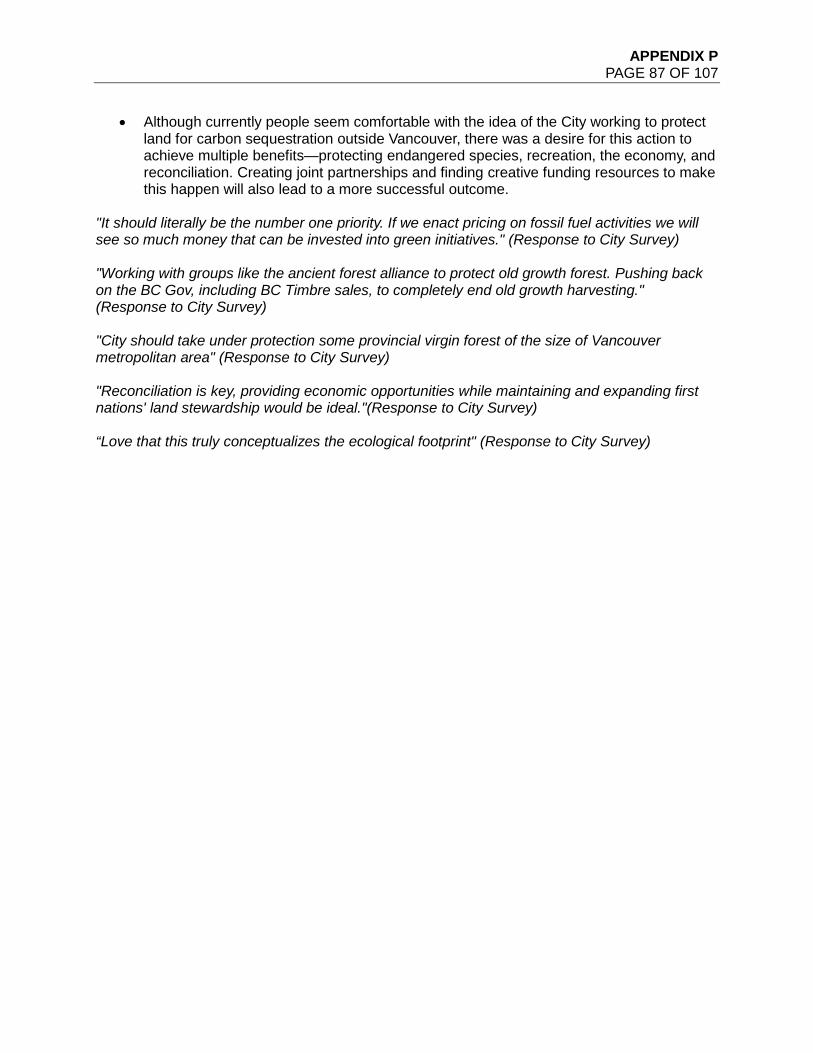
APPENDIX P PAGE 87 OF 107
• Although currently people seem comfortable with the idea of the City working to protect land for carbon sequestration outside Vancouver, there was a desire for this action to achieve multiple benefits—protecting endangered species, recreation, the economy, and reconciliation. Creating joint partnerships and finding creative funding resources to make this happen will also lead to a more successful outcome.
"It should literally be the number one priority. If we enact pricing on fossil fuel activities we will see so much money that can be invested into green initiatives." (Response to City Survey)
"Working with groups like the ancient forest alliance to protect old growth forest. Pushing back on the BC Gov, including BC Timbre sales, to completely end old growth harvesting." (Response to City Survey)
"City should take under protection some provincial virgin forest of the size of Vancouver metropolitan area" (Response to City Survey)
"Reconciliation is key, providing economic opportunities while maintaining and expanding first nations' land stewardship would be ideal."(Response to City Survey)
“Love that this truly conceptualizes the ecological footprint" (Response to City Survey)
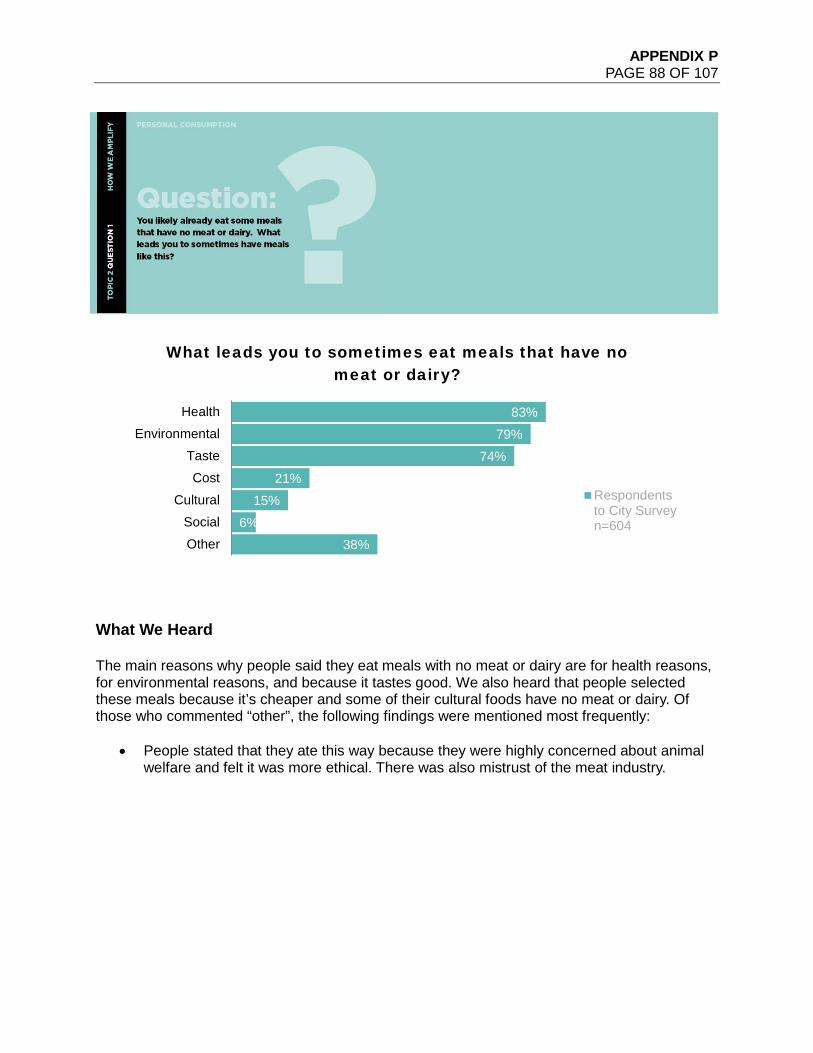
APPENDIX P PAGE 88 OF 107
What We Heard The main reasons why people said they eat meals with no meat or dairy are for health reasons, for environmental reasons, and because it tastes good. We also heard that people selected these meals because it’s cheaper and some of their cultural foods have no meat or dairy. Of those who commented “other”, the following findings were mentioned most frequently:
• People stated that they ate this way because they were highly concerned about animal welfare and felt it was more ethical. There was also mistrust of the meat industry.
38%6%
15%21%
74%79%
83%
OtherSocial
CulturalCost
TasteEnvironmental
Health
What leads you to sometimes eat meals that have no meat or dairy?
Respondentsto City Surveyn=604
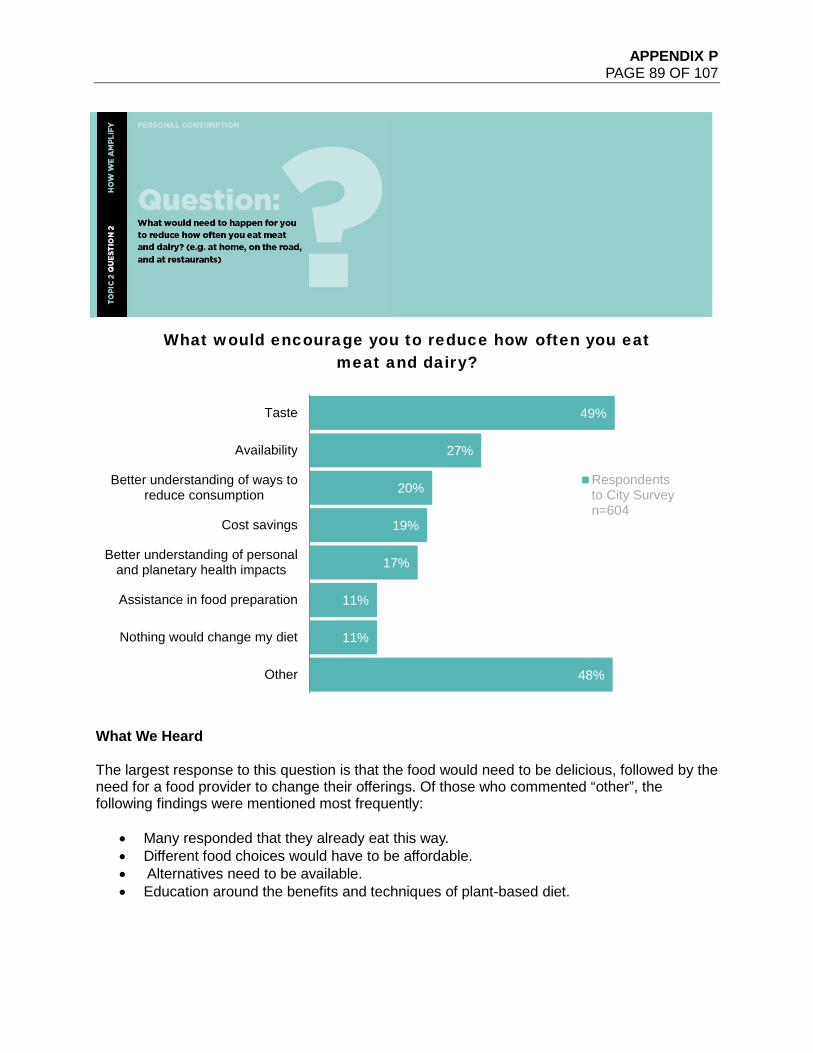
APPENDIX P PAGE 89 OF 107
What We Heard The largest response to this question is that the food would need to be delicious, followed by the need for a food provider to change their offerings. Of those who commented “other”, the following findings were mentioned most frequently:
• Many responded that they already eat this way. • Different food choices would have to be affordable. • Alternatives need to be available. • Education around the benefits and techniques of plant-based diet.
48%
11%
11%
17%
19%
20%
27%
49%
Other
Nothing would change my diet
Assistance in food preparation
Better understanding of personaland planetary health impacts
Cost savings
Better understanding of ways toreduce consumption
Availability
Taste
What would encourage you to reduce how often you eat meat and dairy?
Respondentsto City Surveyn=604
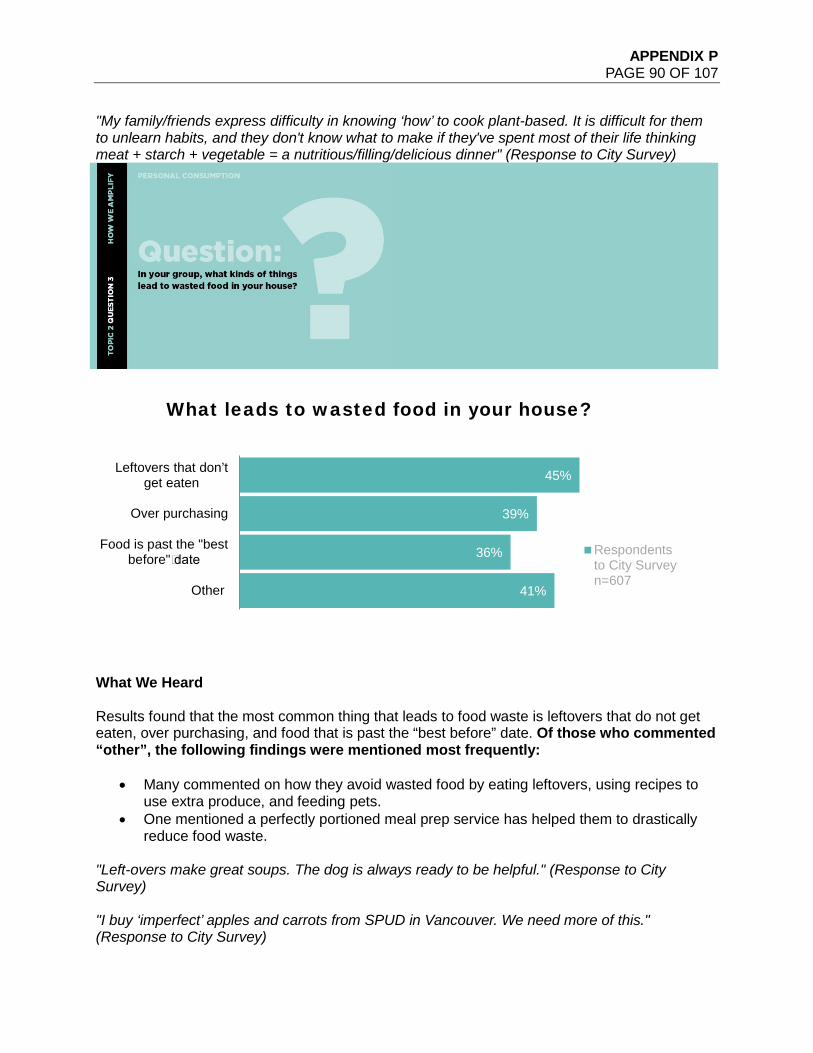
APPENDIX P PAGE 90 OF 107
"My family/friends express difficulty in knowing ‘how’ to cook plant-based. It is difficult for them to unlearn habits, and they don't know what to make if they've spent most of their life thinking meat + starch + vegetable = a nutritious/filling/delicious dinner" (Response to City Survey)
What We Heard Results found that the most common thing that leads to food waste is leftovers that do not get eaten, over purchasing, and food that is past the “best before” date. Of those who commented “other”, the following findings were mentioned most frequently:
• Many commented on how they avoid wasted food by eating leftovers, using recipes to use extra produce, and feeding pets.
• One mentioned a perfectly portioned meal prep service has helped them to drastically reduce food waste.
"Left-overs make great soups. The dog is always ready to be helpful." (Response to City Survey)
"I buy ‘imperfect’ apples and carrots from SPUD in Vancouver. We need more of this." (Response to City Survey)
41%
36%
39%
45%
Other
Food is past the "bestbefore"� date
Over purchasing
Leftovers that don’t get eaten
What leads to wasted food in your house?
Respondentsto City Surveyn=607

APPENDIX P PAGE 91 OF 107
What We Heard Items that are difficult to find second-hand or through sharing or borrowing programs:
• Tools – like ladders and drills. Some were aware of the Tool Library but did not have a car, which limited access to larger equipment.
• Clothing – for all body types, occasion wear or for children. • Household items – like toys, board games, craft supplies and baby items. • Recreational items – like canoes, snowshoes, bikes, sports equipment. • Books/media – with titles available in different languages, there was awareness of the
VPL but a desire for more variety in different languages. • Outdoor equipment – like lawnmowers.
“One big thing for me is tools. I would love to see more tool libraries and workshop space to allow people to make their own projects instead of buying things.” (Response to City Survey) Items difficult to get repaired:
• Electronics – cell phones, computers, laptops, printers, stereo, headphones, electric toothbrush, projector, tablets, camera.
• Small appliances – kettle, serger, coffee grinder, vacuum, humidifier, fan, battery powered items, waffle iron, microwave, blow dryer, toasters, blenders, breast pump.
• Shoes – boots, sports shoes. • Clothing – comments about repairs being more expensive than buying something new.
Items mentioned: children’s clothing, zippers, rain gear, outdoor gear, leather. • Large appliances – stove, dishwasher, water heaters, fridge. • Household items – umbrellas, mattress, backpacks, lamps, shower head. • Furniture – rugs, sofas, outdoor furniture, tables and chairs.
“It's hard for me to get used furniture, as so much furniture produced these days is particleboard and wears out too quickly to be sold second-hand. I am also hesitant to buy anything electric second-hand without a chance to test it before purchase - Value Village lets us see if it turns on, but that doesn't mean they do what they mean to (ie actually cook something, integrate with a computer, etc)” (Response to City Survey)

APPENDIX P PAGE 92 OF 107
“Encourage businesses that sell large reusable items like furniture accept their merchandise back for for secondhand resale. I think a more organized, centralized secondhand market would be easier to manage than the current facebook marketplace and craigslist individual resale.” (Response to City Survey)
APPENDIX P PAGE 93 OF 107
What We Heard Knowledge, cost, accessibility and convenience were the most cited barriers to participating in share/reuse/repair.
• Residents did not know about share and repair events or services that exist and had a lack of knowledge on how to repair their own items.
• Several respondents stated that the cost of repair is often higher than cost of purchasing a new item and that the cost of renting an item is also more than the cost of buying. Items mentioned for high cost of repair: clothing, furniture. Items mentioned for high cost to rent: tools, vehicles to transport second-hand items.
• Many people cited that purchasing new was more convenient, as it takes less time than finding something second-hand or getting something repaired.
• Transporting items to be donated and repaired was also mentioned as an inconvenience.
• Respondents were both supportive and concerned/skeptical of the City increasing its role to expand share/reuse/repair.
• Those supportive felt that the City's role could be expanded to facilitate share/reuse/repair and suggestions ranged from convening the conversation to running services. Suggestions included: supporting businesses, providing incentives, implementing tax disincentives of new-item purchases, reducing property taxes for reuse/repair businesses, providing more education and awareness of existing services, providing free workshops and drop-off or exchange events in different communities (e.g., at community centres, libraries, schools), offering pick-up and delivery services for used items, running repair facilities, providing space and tools/equipment (City-owned or mandate repair rooms in multi-family buildings), increase environmental taxes on different products, explore the right to repair regulations. Zoning of areas to prevent gentrification and maintain repair shops (especially around False Creek), better infrastructure for textile up/recycling, and City run second hand and repair shops (including furniture and appliances).
• Those concerned felt that expanding share/reuse/repair initiatives is beyond the purview of the City's mandate and it is a better role for other levels of government, non-profits or the market, or left to individuals.
• Quality was also mentioned as a reason why people do not obtain items through share/reuse/repair as the quality of the used item is not consistent or reliable.
• Several people commented on how certain items are designed so they cannot be repaired and have to be replaced.
APPENDIX P PAGE 94 OF 107
• Health and safety were also mentioned, particularly around the concern of second-hand items that may contain bed bugs.
"Some items I have that break are manufactured in a way that doesn't allow them to be repaired easily. I am pretty handy, but phones in particular are made with planned obsolescence. I think planned obsolescence should be illegal." (Response to City Survey)
“Laundry machine and fridge broke but couldn't find replacement parts so I had to buy new ones” (Response to City Survey) “I am not aware of borrowing or sharing programs. We recently bought a power washer and it would have been better to use a shared one.” (Response to City Survey) In addition to respondents commenting on items that are difficult to repair, donate, or find secondhand, many included recommendations on how the City can better support the expansion of reuse, share, and repair in Vancouver. These recommendations are summarized below.
• Respondents expressed support for more businesses that offer share/reuse/repair services.
• That the City could support the expansion of share/reuse/repair initiatives, including community-based initiatives like swaps, workshops, sharing libraries and online exchanges.
• The City could partner with community centres, libraries, and the VSB to expand share/reuse/repair initiatives and programs.
• The City could launch an educational campaign to increase awareness of share/reuse/repair services, events, skill-building workshops and services available to residents.
• That Canada should create a “Right to Repair Act”. "Make this room mandatory in stratas, give them tools and people will try to repair. Anybody who has house does that. You need to teach kids in schools to use hands as well!" (Response to City Survey) "Vancouver should push BC and Canada to have right to repair legislation." (Response to City Survey) “Support schools to teach repair skills; perhaps include those skills in Parks/Rec programming” (Response to City Survey) “Maybe the Library could offer a Tool rental program. Drills, saws, sanders etc. Also the city could use some public-use tool shops where we can rent a time slot to use machine shop tools for various projects.” (Response to City Survey) “More thrift stores and opportunities for Students (UBC in my case) to donate their school supplies and homewards for other students” (Response to City Survey)
APPENDIX P PAGE 95 OF 107
What We Heard
• Many people indicated that leadership looks like making bold moves, leading by example, and having a clear vision and priorities. Many people also mentioned that leadership should be inclusive and equitable.
• People said community-based networks are where they look for leadership but also suggested that businesses and the private sector needed to show leadership.
• About 3% of respondents (24/492) felt that climate action was not necessary. "In order to change inequality we need female leaders, we need indigenous leaders, we need young leaders, we need activists, we need two spirit, queer folx, differently abled, People of colour. Climate change goes hand in hand with all inequities!" (Response to City Survey)
"Climate action is an opportunity to create more socially cohesive communities, improve people's physical and mental health and wellbeing, and to strengthen links between neighbours and friends to make us all more resilient to the impacts of climate change - now and into the future. We need integrated, broad, and substantial investment in strengthening local community fabrics so each sub-community (in Vancouver and BC) can lead the way for themselves, based on their own needs and context. This makes us more self-sufficient, taking some of the burden off our municipal, provincial, and federal governments in times of crisis (like COVID-19)." (Response to City Survey)
APPENDIX P PAGE 96 OF 107
What We Heard
• Many people felt that they could be leaders by leading by example, others also suggested that by helping to educate and create awareness in their circles, they could lead.
• Some respondents mentioned that they show leadership through community connections, networking, mentorship, and bringing different organizations together for collaboration; championing other leaders in the community, businesses, etc.
• About 3% of respondents (10/377) did not see themselves as leaders or felt that their leadership was not important, instead leadership at the national or global level was more important.
"Create more engaging spaces for discussion with clear objectives, provide spaces where people can come together and resolve how to get engaged. Also creating channels whereby citizens can communicate with government to shape policies" (Response to City Survey)
"Empowering people means listening to all voices and seeking out voices from those who don't seek the limelight, eg don't always go to usual suspects for comment, get out in neighbourhoods" (Response to City Survey)
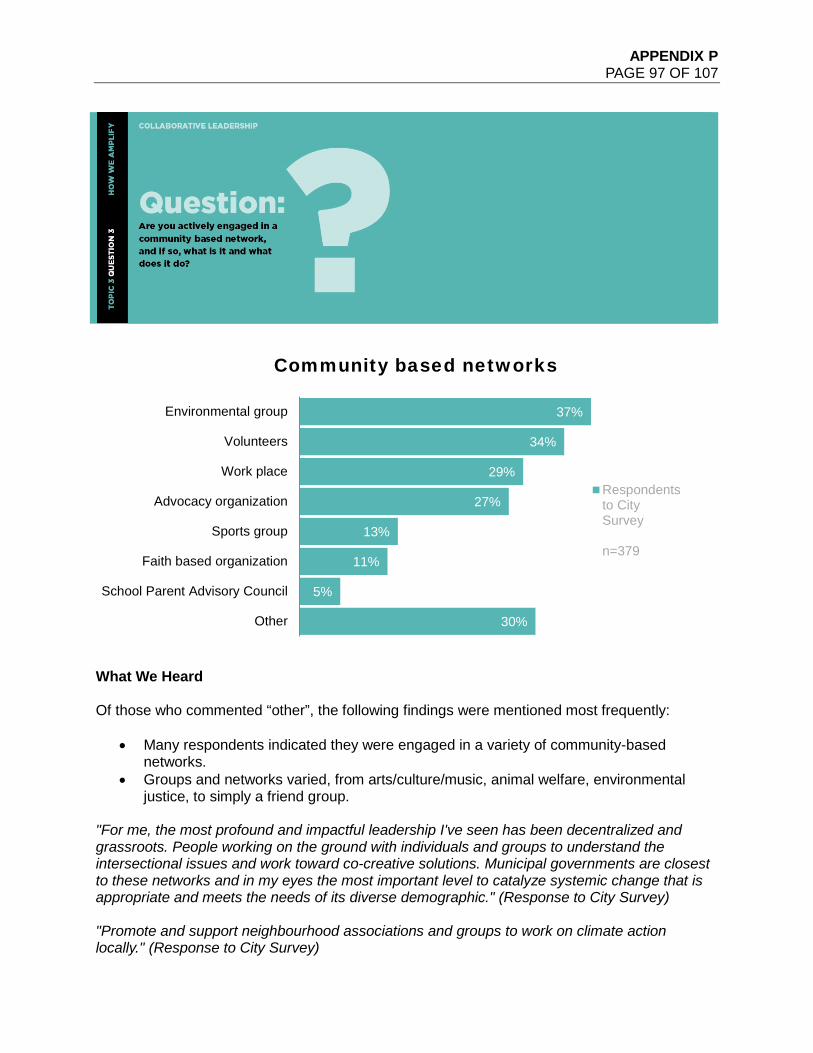
APPENDIX P PAGE 97 OF 107
What We Heard Of those who commented “other”, the following findings were mentioned most frequently:
• Many respondents indicated they were engaged in a variety of community-based networks.
• Groups and networks varied, from arts/culture/music, animal welfare, environmental justice, to simply a friend group.
"For me, the most profound and impactful leadership I've seen has been decentralized and grassroots. People working on the ground with individuals and groups to understand the intersectional issues and work toward co-creative solutions. Municipal governments are closest to these networks and in my eyes the most important level to catalyze systemic change that is appropriate and meets the needs of its diverse demographic." (Response to City Survey) "Promote and support neighbourhood associations and groups to work on climate action locally." (Response to City Survey)
30%
5%
11%
13%
27%
29%
34%
37%
Other
School Parent Advisory Council
Faith based organization
Sports group
Advocacy organization
Work place
Volunteers
Environmental group
Community based networks
Respondentsto CitySurvey
n=379
APPENDIX P PAGE 98 OF 107
What We Heard
• Many people felt that more education, training, and other resources that provide knowledge and expertise to different people and organizations are key to taking climate action. People felt that more clear, concise communication is important to sparking climate action, for example, increase awareness around what climate actions are the most impactful, target those who are unaware or apathetic, and share best practices and successes. Respondents would like the City to support and amplify different climate actions, highlighting best practices, experiences, stories, practices and successes of diverse communities.
• Partnerships and collaboration were also very important, however a specific barrier was awareness around work that is going on in other networks and community capacities.
• Affordability and financial barriers were cited as another major barrier. The range of financial barriers mentioned included high cost of land and rentals, profit-first mentality, rent-seeking economics, lack of funding opportunities for non-profits and climate or sustainability programs, fair compensation for volunteers and advocates, cost of purchasing sustainable alternatives.
• Respondents believe community building, relationship building, and collaborative leadership to be interconnected as it encourages collective action and relationships. Respondents also mentioned that people are more likely to take action when they see those that resemble them in the movement. Respondents suggested empowering climate action through effective, representative, and diverse community engagement and climate policy. However, it was also noted that many communities may be struggling with meeting fundamental needs and feeling emotionally safe. Climate action therefore needs to be centred around equity and meeting people where they are, first.
• Through some of the public dialogues that were held, respondents mentioned that there is a lack of political leadership to inspire change. Some mentioned that regulatory requirements that mandate climate action are one of the most effective ways of changing behaviour and encouraging climate action.
• Through the staff dialogues in particular, the need to move beyond silos was mentioned as a barrier.
• Approximately 4% of respondents were unsure about what community and climate action networks exist or are unsure how to get involved or do not understand what actions can be taken because climate policy is jargon. Some also mentioned that there is a lack of tangible connection between personal choices and broader climate policy.
APPENDIX P PAGE 99 OF 107
• Some 4% of respondents do not believe the City has a role in facilitating collaborative leadership and want less political involvement in general with a focus on core municipal functions.
"We need help to create a space that is appealing to a more diverse range of people. The groups I am in are predominantly white, and this is concerning. We would be very receptive to receiving training on inclusivity!" (Response to City Survey) "More opportunities to partner, access to materials and information, small amounts of resource." (Response to City Survey)
"I am disabled and many events and organizations are inaccessible to me." (Response to City Survey)
"Barriers are definitely of financial nature. This begins with materials to get the word out there to involve and engage more people. I believe smaller neighborhood groups are a great way to begin collaboration. Working on a common goal with the city in support, open to implementing various possibilities in neighbourhoods is key.” (Response to City Survey)
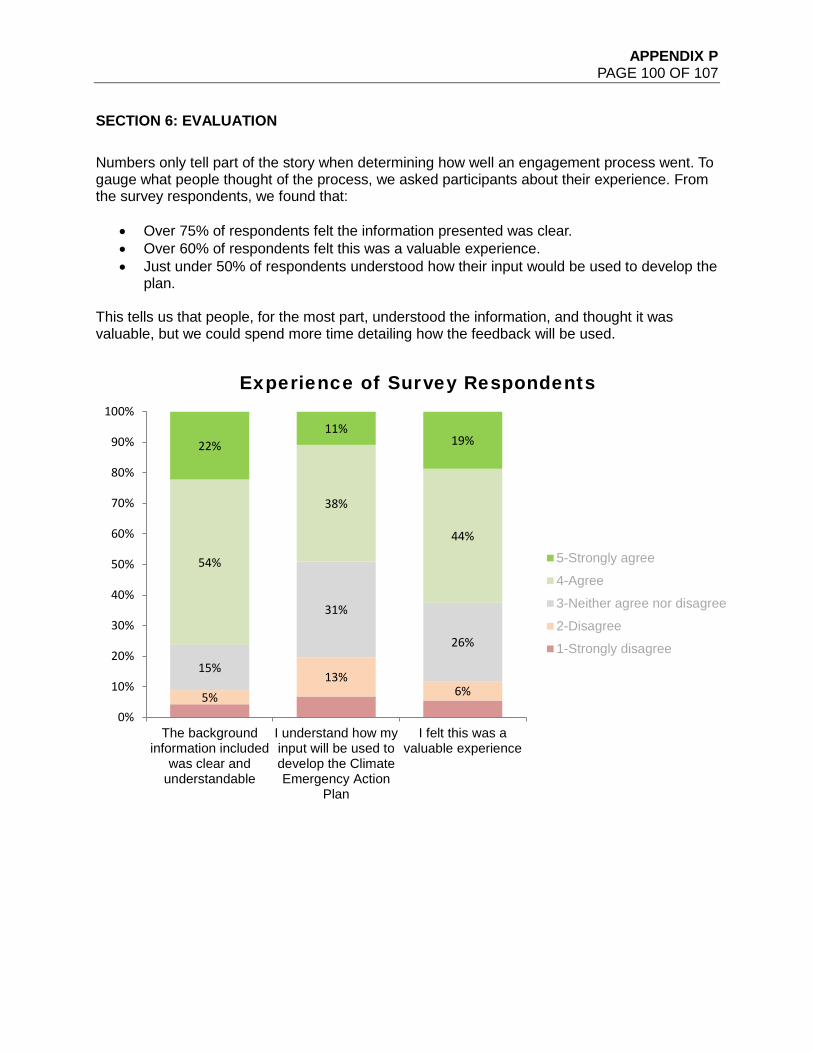
APPENDIX P PAGE 100 OF 107
SECTION 6: EVALUATION Numbers only tell part of the story when determining how well an engagement process went. To gauge what people thought of the process, we asked participants about their experience. From the survey respondents, we found that:
• Over 75% of respondents felt the information presented was clear. • Over 60% of respondents felt this was a valuable experience. • Just under 50% of respondents understood how their input would be used to develop the
plan.
This tells us that people, for the most part, understood the information, and thought it was valuable, but we could spend more time detailing how the feedback will be used.
5%13%
6%
15%
31%
26%
54%
38%
44%
22%11%
19%
0%
10%
20%
30%
40%
50%
60%
70%
80%
90%
100%
The backgroundinformation included
was clear andunderstandable
I understand how myinput will be used todevelop the ClimateEmergency Action
Plan
I felt this was avaluable experience
Experience of Survey Respondents
5-Strongly agree
4-Agree
3-Neither agree nor disagree
2-Disagree
1-Strongly disagree
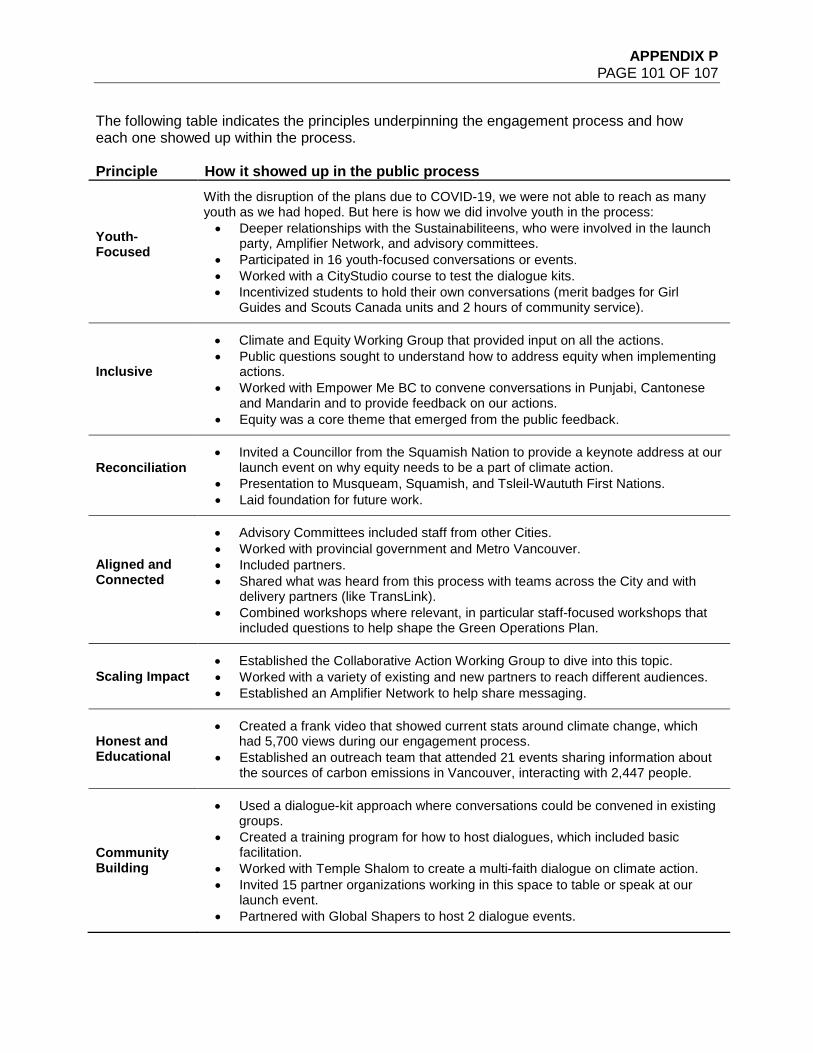
APPENDIX P PAGE 101 OF 107
The following table indicates the principles underpinning the engagement process and how each one showed up within the process. Principle How it showed up in the public process
Youth-Focused
With the disruption of the plans due to COVID-19, we were not able to reach as many youth as we had hoped. But here is how we did involve youth in the process: • Deeper relationships with the Sustainabiliteens, who were involved in the launch
party, Amplifier Network, and advisory committees. • Participated in 16 youth-focused conversations or events. • Worked with a CityStudio course to test the dialogue kits. • Incentivized students to hold their own conversations (merit badges for Girl
Guides and Scouts Canada units and 2 hours of community service).
Inclusive
• Climate and Equity Working Group that provided input on all the actions. • Public questions sought to understand how to address equity when implementing
actions. • Worked with Empower Me BC to convene conversations in Punjabi, Cantonese
and Mandarin and to provide feedback on our actions. • Equity was a core theme that emerged from the public feedback.
Reconciliation
• Invited a Councillor from the Squamish Nation to provide a keynote address at our launch event on why equity needs to be a part of climate action.
• Presentation to Musqueam, Squamish, and Tsleil-Waututh First Nations. • Laid foundation for future work.
Aligned and Connected
• Advisory Committees included staff from other Cities. • Worked with provincial government and Metro Vancouver. • Included partners. • Shared what was heard from this process with teams across the City and with
delivery partners (like TransLink). • Combined workshops where relevant, in particular staff-focused workshops that
included questions to help shape the Green Operations Plan.
Scaling Impact • Established the Collaborative Action Working Group to dive into this topic. • Worked with a variety of existing and new partners to reach different audiences. • Established an Amplifier Network to help share messaging.
Honest and Educational
• Created a frank video that showed current stats around climate change, which had 5,700 views during our engagement process.
• Established an outreach team that attended 21 events sharing information about the sources of carbon emissions in Vancouver, interacting with 2,447 people.
Community Building
• Used a dialogue-kit approach where conversations could be convened in existing groups.
• Created a training program for how to host dialogues, which included basic facilitation.
• Worked with Temple Shalom to create a multi-faith dialogue on climate action. • Invited 15 partner organizations working in this space to table or speak at our
launch event. • Partnered with Global Shapers to host 2 dialogue events.
APPENDIX P PAGE 102 OF 107
SECTION 7: WHAT WE WILL DO – NEXT STEPS The feedback collected through this consultation process was shared with staff, and actions were adjusted based on what was heard. These actions can be seen in full in the Council Report. The work on the climate actions does not end with the Council Report. If passed, many of these actions will require further refinement before they are implemented. And further refinement means further engagement. The feedback collected during this process will help frame the conversations in the future. As we move forward, we will continue to work with stakeholders, advisory committees, the Amplifier Network and the public. This journey taught us many things and will serve as a guidepost as we move forward to plan those engagement processes. In particular, we will continue to develop our relationships with individuals and organizations committed to climate action so we can work collaboratively. We will lean into lessons on equity by centering the voices of those most impacted, and work more intentionally with Black, Indigenous and other racialized groups to ensure their voices are included. And without a doubt, the lessons learned on holding online dialogues will continue to be of use.
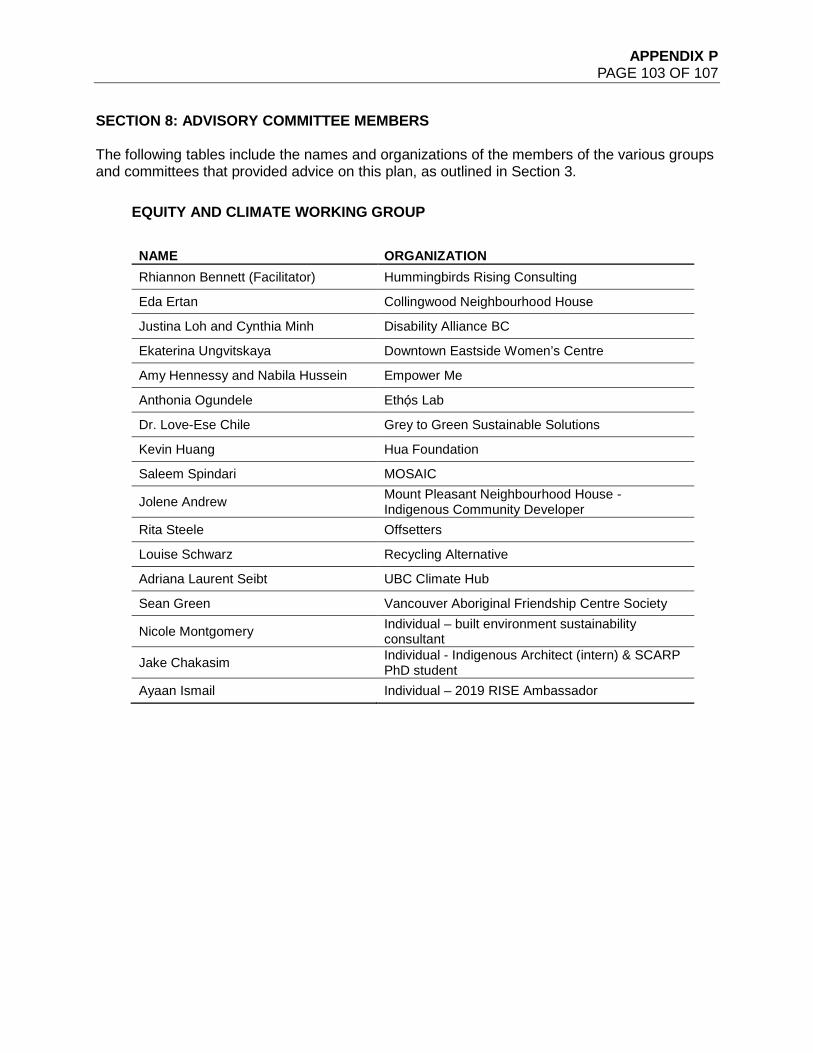
APPENDIX P PAGE 103 OF 107
SECTION 8: ADVISORY COMMITTEE MEMBERS The following tables include the names and organizations of the members of the various groups and committees that provided advice on this plan, as outlined in Section 3.
EQUITY AND CLIMATE WORKING GROUP
NAME ORGANIZATION Rhiannon Bennett (Facilitator) Hummingbirds Rising Consulting
Eda Ertan Collingwood Neighbourhood House
Justina Loh and Cynthia Minh Disability Alliance BC
Ekaterina Ungvitskaya Downtown Eastside Women’s Centre
Amy Hennessy and Nabila Hussein Empower Me
Anthonia Ogundele Ethọ́s Lab
Dr. Love-Ese Chile Grey to Green Sustainable Solutions
Kevin Huang Hua Foundation
Saleem Spindari MOSAIC
Jolene Andrew Mount Pleasant Neighbourhood House - Indigenous Community Developer
Rita Steele Offsetters
Louise Schwarz Recycling Alternative
Adriana Laurent Seibt UBC Climate Hub
Sean Green Vancouver Aboriginal Friendship Centre Society
Nicole Montgomery Individual – built environment sustainability consultant
Jake Chakasim Individual - Indigenous Architect (intern) & SCARP PhD student
Ayaan Ismail Individual – 2019 RISE Ambassador
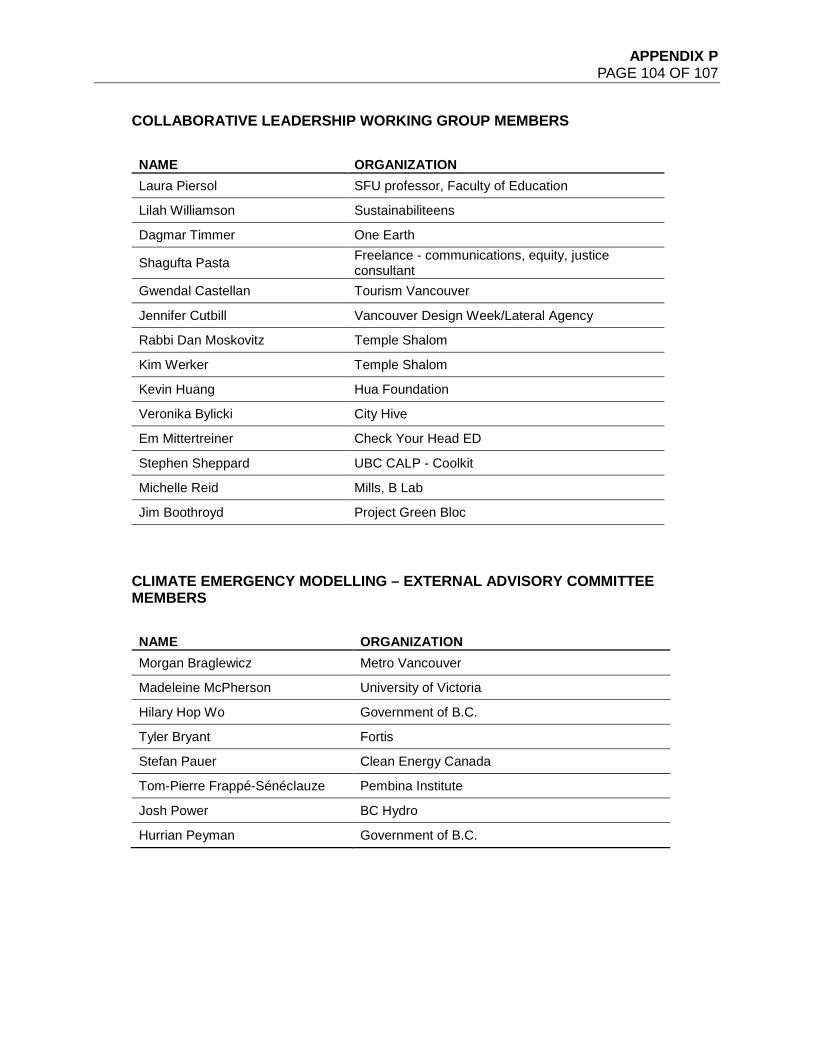
APPENDIX P PAGE 104 OF 107
COLLABORATIVE LEADERSHIP WORKING GROUP MEMBERS
NAME ORGANIZATION Laura Piersol SFU professor, Faculty of Education
Lilah Williamson Sustainabiliteens
Dagmar Timmer One Earth
Shagufta Pasta Freelance - communications, equity, justice consultant
Gwendal Castellan Tourism Vancouver
Jennifer Cutbill Vancouver Design Week/Lateral Agency
Rabbi Dan Moskovitz Temple Shalom
Kim Werker Temple Shalom
Kevin Huang Hua Foundation
Veronika Bylicki City Hive
Em Mittertreiner Check Your Head ED
Stephen Sheppard UBC CALP - Coolkit
Michelle Reid Mills, B Lab
Jim Boothroyd Project Green Bloc
CLIMATE EMERGENCY MODELLING – EXTERNAL ADVISORY COMMITTEE MEMBERS
NAME ORGANIZATION Morgan Braglewicz Metro Vancouver
Madeleine McPherson University of Victoria
Hilary Hop Wo Government of B.C.
Tyler Bryant Fortis
Stefan Pauer Clean Energy Canada
Tom-Pierre Frappé-Sénéclauze Pembina Institute
Josh Power BC Hydro
Hurrian Peyman Government of B.C.
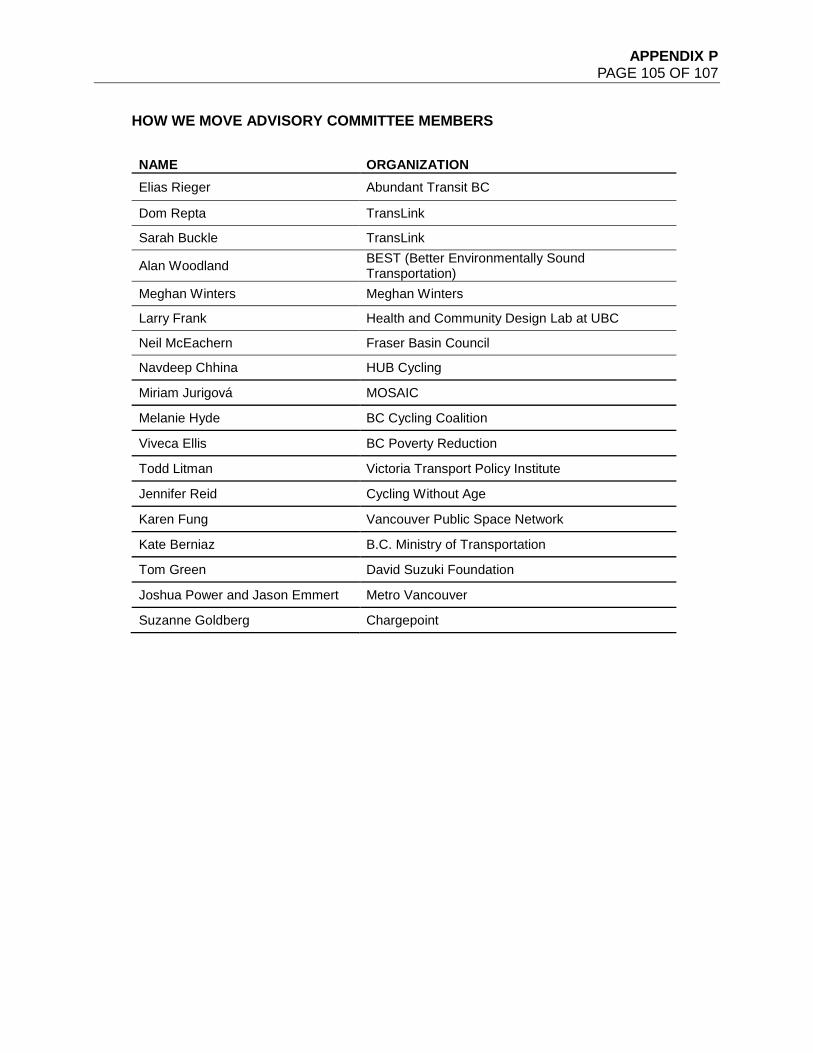
APPENDIX P PAGE 105 OF 107
HOW WE MOVE ADVISORY COMMITTEE MEMBERS
NAME ORGANIZATION Elias Rieger Abundant Transit BC
Dom Repta TransLink
Sarah Buckle TransLink
Alan Woodland BEST (Better Environmentally Sound Transportation)
Meghan Winters Meghan Winters
Larry Frank Health and Community Design Lab at UBC
Neil McEachern Fraser Basin Council
Navdeep Chhina HUB Cycling
Miriam Jurigová MOSAIC
Melanie Hyde BC Cycling Coalition
Viveca Ellis BC Poverty Reduction
Todd Litman Victoria Transport Policy Institute
Jennifer Reid Cycling Without Age
Karen Fung Vancouver Public Space Network
Kate Berniaz B.C. Ministry of Transportation
Tom Green David Suzuki Foundation
Joshua Power and Jason Emmert Metro Vancouver
Suzanne Goldberg Chargepoint
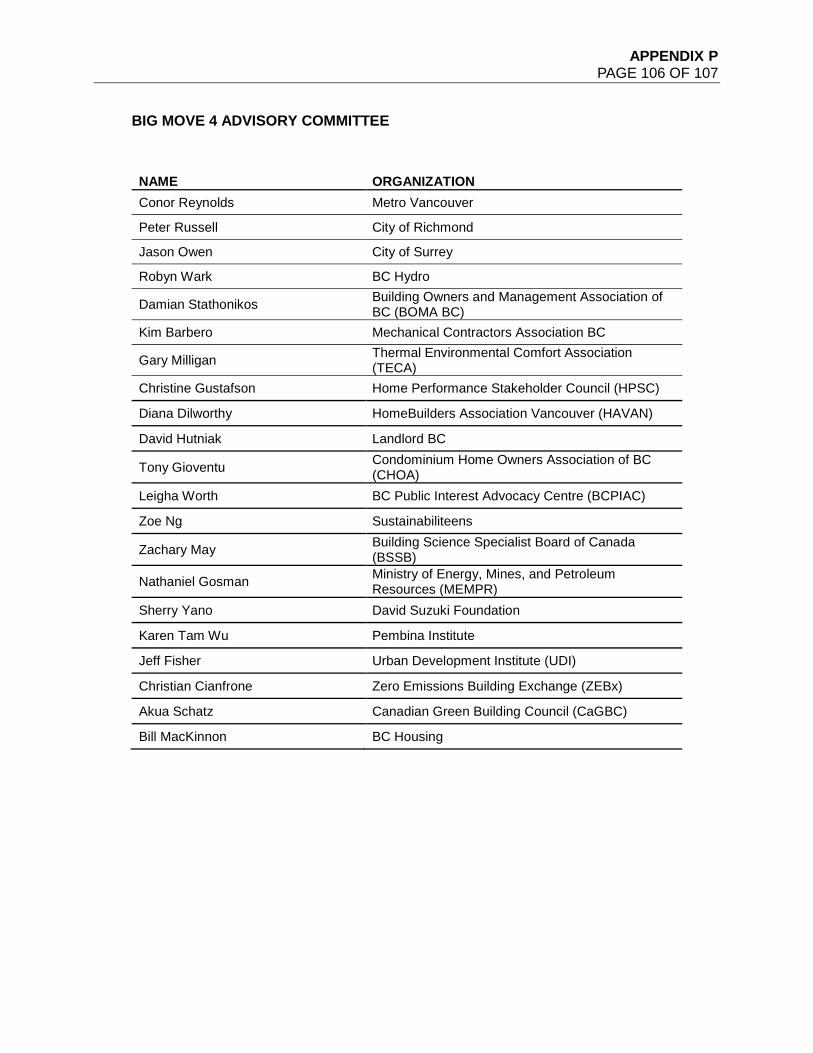
APPENDIX P PAGE 106 OF 107
BIG MOVE 4 ADVISORY COMMITTEE
NAME ORGANIZATION Conor Reynolds Metro Vancouver
Peter Russell City of Richmond
Jason Owen City of Surrey
Robyn Wark BC Hydro
Damian Stathonikos Building Owners and Management Association of BC (BOMA BC)
Kim Barbero Mechanical Contractors Association BC
Gary Milligan Thermal Environmental Comfort Association (TECA)
Christine Gustafson Home Performance Stakeholder Council (HPSC)
Diana Dilworthy HomeBuilders Association Vancouver (HAVAN)
David Hutniak Landlord BC
Tony Gioventu Condominium Home Owners Association of BC (CHOA)
Leigha Worth BC Public Interest Advocacy Centre (BCPIAC)
Zoe Ng Sustainabiliteens
Zachary May Building Science Specialist Board of Canada (BSSB)
Nathaniel Gosman Ministry of Energy, Mines, and Petroleum Resources (MEMPR)
Sherry Yano David Suzuki Foundation
Karen Tam Wu Pembina Institute
Jeff Fisher Urban Development Institute (UDI)
Christian Cianfrone Zero Emissions Building Exchange (ZEBx)
Akua Schatz Canadian Green Building Council (CaGBC)
Bill MacKinnon BC Housing
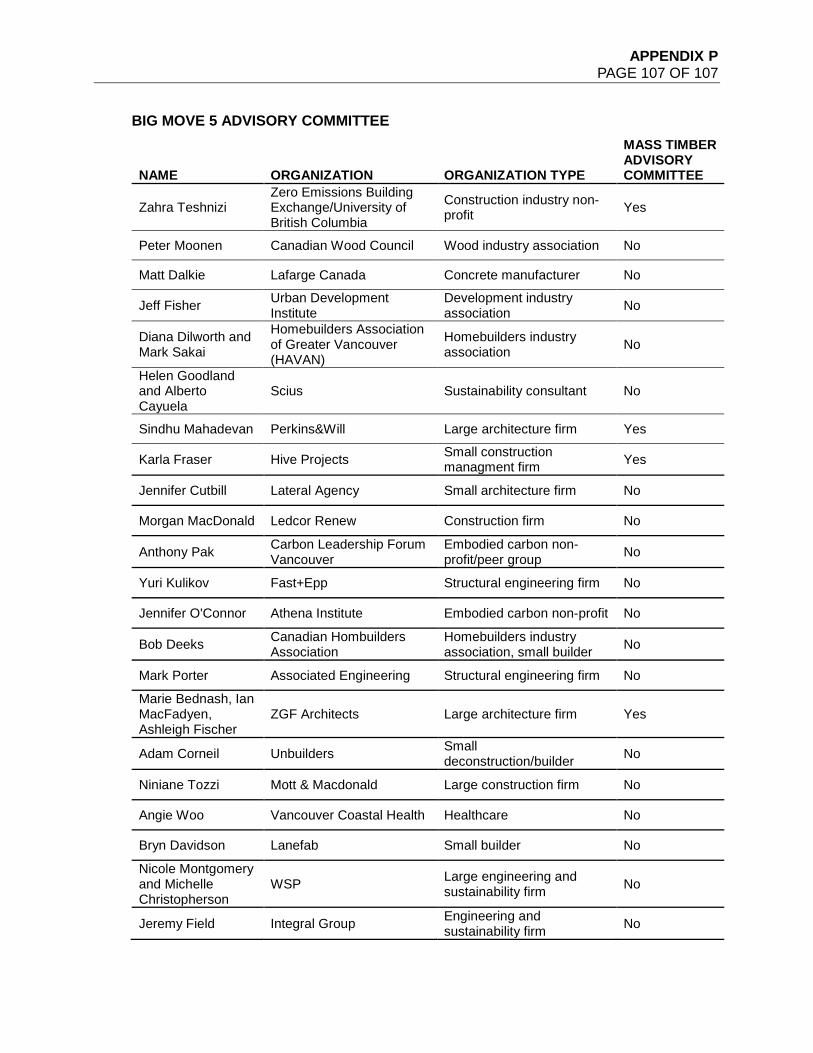
APPENDIX P PAGE 107 OF 107
BIG MOVE 5 ADVISORY COMMITTEE
NAME ORGANIZATION ORGANIZATION TYPE
MASS TIMBER ADVISORY COMMITTEE
Zahra Teshnizi Zero Emissions Building Exchange/University of British Columbia
Construction industry non-profit Yes
Peter Moonen Canadian Wood Council Wood industry association No
Matt Dalkie Lafarge Canada Concrete manufacturer No
Jeff Fisher Urban Development Institute
Development industry association No
Diana Dilworth and Mark Sakai
Homebuilders Association of Greater Vancouver (HAVAN)
Homebuilders industry association No
Helen Goodland and Alberto Cayuela
Scius Sustainability consultant No
Sindhu Mahadevan Perkins&Will Large architecture firm Yes
Karla Fraser Hive Projects Small construction managment firm Yes
Jennifer Cutbill Lateral Agency Small architecture firm No
Morgan MacDonald Ledcor Renew Construction firm No
Anthony Pak Carbon Leadership Forum Vancouver
Embodied carbon non-profit/peer group No
Yuri Kulikov Fast+Epp Structural engineering firm No
Jennifer O'Connor Athena Institute Embodied carbon non-profit No
Bob Deeks Canadian Hombuilders Association
Homebuilders industry association, small builder No
Mark Porter Associated Engineering Structural engineering firm No
Marie Bednash, Ian MacFadyen, Ashleigh Fischer
ZGF Architects Large architecture firm Yes
Adam Corneil Unbuilders Small deconstruction/builder No
Niniane Tozzi Mott & Macdonald Large construction firm No
Angie Woo Vancouver Coastal Health Healthcare No
Bryn Davidson Lanefab Small builder No
Nicole Montgomery and Michelle Christopherson
WSP Large engineering and sustainability firm No
Jeremy Field Integral Group Engineering and sustainability firm No
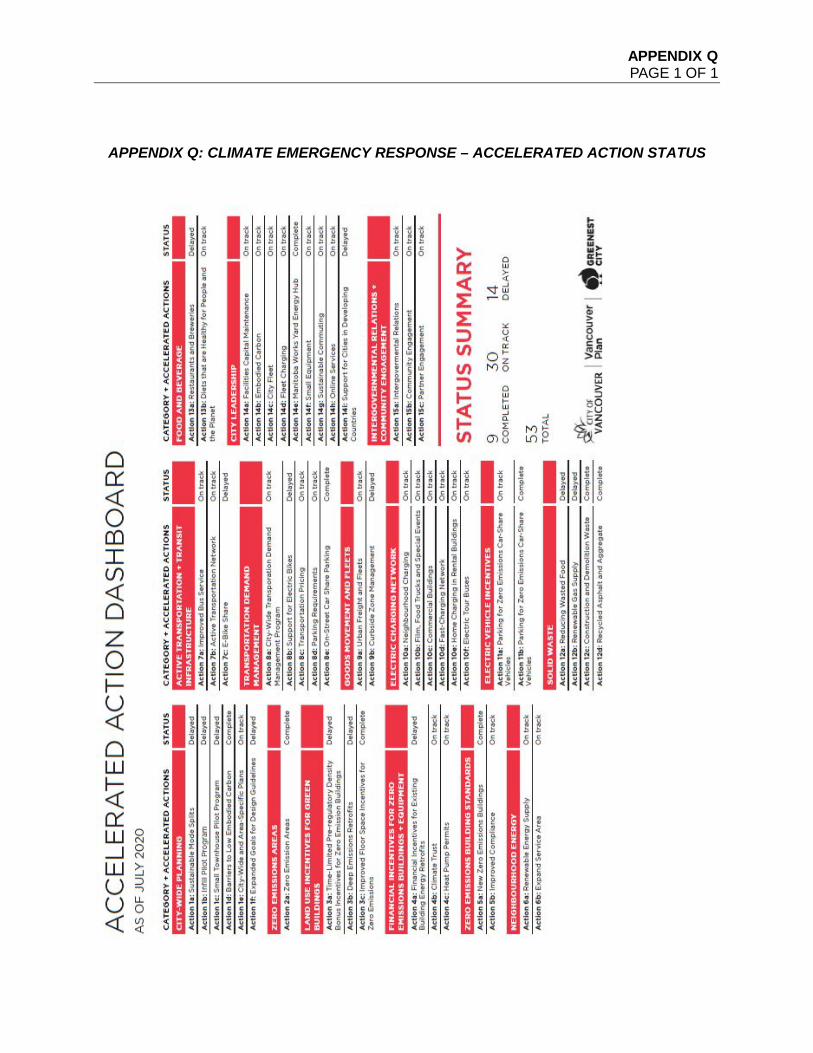
APPENDIX Q PAGE 1 OF 1
APPENDIX Q: CLIMATE EMERGENCY RESPONSE – ACCELERATED ACTION STATUS
Related Documents


