TEXAS WATER DEVELOPMENT BC>ARD Report 173 --. - r. Ii ,,' i \: .t L 1'j 1 .1.,1-'::-1 l,.}:.. j I D r. I\·"r F)[' ·'I",./f f K r Jr. K"£ I ..... ",," ,II, t...> 11'-'\)1..... !Le.. /4 ::;j'yLl':"{f ,I ,j -. .. '- h .,7/7)-' 1 J ", _. J'. - .. '-- I ;! ',' .. , 2J 'I 1 .:,,::.c8.l: I ,1 I i GROUND-WATER RES()URCES OF KLEBERG, KENED'y, AND SOUTHERN JIM VVELLS COUNTIES, TEXAS July 1973

Welcome message from author
This document is posted to help you gain knowledge. Please leave a comment to let me know what you think about it! Share it to your friends and learn new things together.
Transcript
TEXASWATERDEVELOPMENTBC>ARD
Report 173
--. - D::rm~,(w ~~t r. ~r~;y= Ii,,' i \: .t ~.JI L~j1'j 1 .1.,1-'::-1 l,.}:.. j
I
Dr. I\·"r F)[' ·'I",./f f Kr Jr. K"£ f~rJR' ~. f)'V'~lr", ~I··S IVi~_;r \",~I)V ..... ",," ,II, t...> 11'-'\)1..... !Le..
/4 ::;j'yLl':"{f ,I,j ~','.:~.-=-. -. -~.. '- -'-~-:~n~-~h.,7/7)-' ~1 J ", _. J'. - .. '-- '1[~-'--' I;! ',' ..,_'.'~.?3 ~ 2J 'I
1 .:,,::.c8.l: ,~ I,1 ---~--- IL_~_=::~~~-~:l='f~(L,~-f_. ~~=== i
GROUND-WATER RES()URCES OFKLEBERG, KENED'y, AND
SOUTHERN JIM VVELLSCOUNTIES, TEXAS
July 1973
TEXAS 'NATER DEVELOPMENT BOARD
REPORT 173
GROUND-WATER RESOURCES OF KLEBERG, KENEDY, AND
SOUTHERN JIM WELLS COUNTIES, TEXAS
By
G. H. Shafer and E. T. Baker, Jr.United States Geological Survey
This report was prepared by the U.S. Geological Surveyunder cooperative agreement with the
Texas Water Development Board
July 1973
TEXAS WATER DEVELOPMENT BOARD
John H. McCoy, ChairmanRobert B. GilmoreMilton T. Potts
Marvin Shurbet, Vice ChairmanW. E. TinsleyCarl Illig
Harry P. Bur1leigh, Executive Director
Authorization for use or n~production of any original material contained inthis publication, i.e., not obtained from other sources, is freely granted. The Boardwould appreciate acknowledgement.
Published and distributedby the
Texas Water Development BoardPost Office Box 13087Austin, Texas 78711
ii
TABLE OF CONTENTS
Page
ABSTRACT " " .. " "" "."" .. " .. " .. " " .. """" " .. ""." " ..
INTRODUCTION .. " " " " .. " .. "" "" .. "." " " .. "" ".""" 3
Location and Extent of the Area" . , , , , , , . , , , . , . , , . , .. , .. , , , , .. , , .. , .. , , . , . 3
Purpose and Scope of the Investigation" .. , . , , , , .. , , , , .. , , . 3
Pre"ious Investigations ." ""." .. "."" .. "" .. "."."" .. " .. """""." .. """."" .. " .. "" .. ". 3
Economic Development """ "." " "."" .. "."" "" "." " .. """." 4
Topography and Drainage .. , , .. , , , . , , , , , , , , , , , , , , , . 4
Clin1ate , , , , , , , . , , . , , .. , .. , .. , . , , , .. , . , , .. , , , , . , , , . 5
Well-Numbering System " " "."""""" ".""" .. "." .. "" """. 5
Acknowledgments , .. , , , , . , , . , , , , . , .. , , . , , , . , , . , . , . , . , .. , . , . , . . 5
GEOLOGY AS RELATED TO THE OCCURRENCE OF GROUND WATER . , , . , , . , . , , , , , , . , , , . 10
General Stratigraphy and Structure .. , .... , , , .. , . , .... , .. , .. , ... , .. , ... , .. , , . , , . . . . 10
Physical Characteristics and Water-Bearing Properties of the Geologic Formations .. , , . , , ... , . . 10
Oakville Sandstone " " " " .. "" ""." " "...... 10
Lagarto Clay " .. " .. " "."." "".""." " " .. ""." .. """." " " 12
Goliad Sand" " .. " " "" .. """." " ".""................... 12
Beaumont Clay and Lissie Formation, Undifferentiated " , , , .. , , . . . . . 17
Barrier Island and Beach Deposits "" , , . , . , , , .. , , .. , , , , , . , . . 17
South Texas Eolian Plain Deposits .. , , , . , .. , , . , , , , , , , . . . 17
Barrier Island Deposits , , , , , . , , , , , . 18
Alluvium" , .. , . , " , , , .. , , . , , , . , , , , , . . 18
GROUND-WATER HyDROLOGy" .. " '" "." " " ", .. " " .. " "" "." .,," '"'' 18
Source and Occurrence of Ground Water "" "" " .. "." ""." .. " .. "".... 18
Movement of Ground Water ""." " .. " .. " " .. " .. """ " " " .. ".... 18
Aquifer Tests "." "" " " .. " " "".""" 19
iii
TABLE OF CONTENTS (Cont'd.)
Page
GROUND-WATER DEVELOPMENT """""." " " " " "" .. " .. " ".. 19
Public Supply .".""""."" """ "" .. " , , . . . . . . . . . . . . . . . . . . . . . . . . . . . . . . . 19
Irrigation" , . , .. , .. , , , , , , , , , .. , , . , , .. , , , .. , , , , . , . . . . . . . . . 20
Industrial Use ." " "." .. , , .. " , , , , , .. , .. , , , . . . 22
Rural-Domestic and Livestock Use ."" , , , , , , , , , . . . . . . . . . . . . . . 22
CHANGES IN WATER LEVELS .. , . , , , , .. " " " , , . . . . . .. . . . . . . . 22
CONSTRUCTION OF WELLS" , , , , , , , , .. , , , , , , . . . . . . . . . . 28
QUALITY OF GROUND WATER , , , , , , , . , , , .. , .. , , 31
Suitability of Water for Use " "" " .. " " " ".............. 31
Public Supply " .. "" .. "." " .. """ ""." " "... 31
Irrigation ." .. , , . , . , , , .. , , , , , . , . , , , , , 36
Industrial Use ."."."."" " .. "" " "" .. ".............................. 37
Pesticide Content of Water " , , , , , , .. , , , . . . . . . . . . . . . . . . . . . . . . . . . 38
Relation of Fresh Ground Water to Saline Ground Water , . , , .. , . . . . . . . . . . . . . . . . . 38
Salt-Water Disposal .. , , , , , , , , .. , .. , , .. , , . . . . . . . . . . . . . . . . . . . 39
Improperly Cased Wells , , , , .. , , . . . . . . . . . . . . . . . . . . . . . . . . . . . . . . 39
AVAILABILITY OF GROUND WATER .. """ " "...... 39
Distribution and Quantity of Water in Storage' , , .. , , , , . . . . . . . . . . . . . . . . 41
Fresh Water .. , , .. , , , , , . , , , , , .. , . . . . . . . . . . . . . 41
Slightly Saline Water .""" , .. , , .. , , , . , , , , , , . 41
Quantity of Ground Water Available for Development , . . . . . . . . . . . . . . . . . . . . . 41
Possibilities of Artificial Recharge .... , .. , , .... , .. , .. , . , . . . . . . . . . . . . . . . . . . . . . . . . . . . . . . . . 42
Areas Most Favorable for Future Development of Ground-Water Supplies ..... , . . . . . . . . . . . . . . . . 51
NEEDS FOR FUTURE STUDIES , , , , , , , , . . . . . . . . . . . . . 51
DEFINITIONS OF TERMS .. , , , , , , " .. , , .. , , , , ", , " , . . . .. . . 51
REFERENCES CITED , , , , , , , , , , , . , . . . 57
TABLES
1. Well Numbers Used in This Report and Corresponding Numbers Previously Used inKleberg County by Livingston and Bridges ('1936), in Kenedy County by Turner andCumley (1940), in Jim Wells County by Turner, Lynch, and Cumley (1940), and inMemoranda and Areal Reports .. , .. , , , , , ~ . . . . . . . . . . . . . . . . . . . . . . . . . 7
iv
TABLE OF CONTENTS (Cont'd.)
Page
2. Geologic Formations and Their Water-Bearing Properties. . . . . . . . . . . . . . . . . . . . . . . . . . . . . . . . . . . 11
3. Summary of Aquifer Tests in Kleberg and Southern Jim Wells Counties. . . . . . . . . . . . . . . . . . . . . . . . 20
4. Use of Ground Water, 1955-68 , , . . . . . . . . . . . . . . . . . . . . . . . . . . . . . . . . . . . . . . . . 27
5. Source and Significance of Dissolved-Mineral Constituents and Properties of Water. . . . . . . . . . . . . . . 32
6. Methods of Disposal and Amount of Salt Water Disposed in 1967 40
7. Records of Wells , " , . . . . . . . . . . . . . . . . . . . . . . . . . 59
8. Water Levels in Wells . . . . . . . . . . . . . . . . . . . . . . . . . . . . . . . . . . . . . . . . . . . . . . . . . . . . . . . . . . . . . . . 119
9. Drillers' Logs of Wells . . . . . . . . . . . . . . . . . . . . . . . . . . . . . . . . . . . . . . . . . . . . . . . . . . . . . . . . . . . . . . 137
10. Chemical Analyses of Water From Wells" .. , . . . . . . . . . . . . . . . . . . . . . . . . . . . . . . . . . . . . . . . . . . . . 154
FIGURES
1. Index Map Showing Location of Kleberg, Kenedy, andSouthern Jim Wells Counties
3
2. Graphs Showing Average Monthly Precipitation and Temperature at Kingsville andAverage Monthly Gross Lake-Surface Evaporation in Kleberg County , . . . . . . . . . . . . 5
3. Diagram Showing Well-Numbering System6
4. Map Showing Geology of Kleberg, Kenedy, and SouthernJim Wells Counties and Adjacent Areas 13
5. Map Showing Approximate Altitude of the Top of the Goliad Sand. . . . . . . . . . . . . . . . . . . . . . . . . . . 15
6. Graph Showing Relation of Drawdown to Time and Distance as a Result ofPumping Under Artesian Conditions
21
7. Graph Showing Average Daily Pumpage of Ground Water forPublic Supply by the City of Kingsville, 1940-68 . . . . . . . . . . . . . . . . . . . . . . . . . . . . . . . . . . . . . . . 21
8. Map Showing Approximate Altitude of Water Levels inWells in the Goliad Sand, 1968-69
23
9. Map Showing Approximate Decline of Water Levels inWells in the Goliad Sand, 1932-33 to 1968-69 , , . . . . . . . 25
10. Hydrographs of Water Levels in Wells Tapping the Goliad Sand 29
11. Map Showing Chemical Quality of Water anelDepth of Screened Intervals of Selected Wells ..... . . . . . . . . . . . . . . . . . . . . . . . . . . . . . . . . . 33
12. Diagram Showing the Classification of I rrigation Waters. . . . . . . . . . . . . . . . . . . . . . . . . . . . . . . . . . . . 37
13" Map Showing Approximate Altitude of the Base of Fresh Water 43
14. Map Showing Approximate Thickness of Sand ContainingFresh Water in the Goliad Sand "............................................ 45
v
TABLE OF CONTENTS (Cont'd.)
Page
15. Map Showing Approximate Altitude of the Base of
Slightly Saline Water. . . . . . . . . . . . . . . . . . . . . . . . . . . . . . . . . . . . . . . . . . . . . . . . . . . . . . . . . . . 47
16. Map Showing Approximate Thickness of Sand Containing
Slightly Saline Water in the Goliad Sand. . . . . . . . . . . . . . . . . . . . . . . . . . . . . . . . . . . . . . . . . . . . 49
17. Map Showing Areas Most Favorable for Future Development of
Ground Water From the Goliad Sand . . . . . . . . . . . . . . . . . . . . . . . . . . . . . . . . . . . . . . . . . . . . . . 53
18. Map Showing Locations of Wells . . . . . . . . . . . . . . . . . . . . . . . . . . . . . . . . . . . . . . . . . . . . . . . . . . . . 163
19.
20.
Chart Showing Correlation of Geologic Units Along
Line A-A', Kleberg and Southern Jim Wells Counties
Chart Showing Correlation of Geologic Units Along Line B-B', Kenedy County
165
167
21. Chart Showing Correlation of Geologic Units Along
Line C-C', Kleberg and Kenedy Counties. . . . . . . . . . . . . . . . . . . . . . . . . . . . . . . . . . . . . . . . . . . . 169
vi
GROUND-WATER RESOURCES OF KLEBERG, KENEDY, AND
SOUTHERN JIM WELLS COUNTIES, TEXAS
By
G. H. Shafer and E. T. Baker, Jr.United States Geological Survey
ABSTRACT
Kleberg, Kenedy, and southern Jim Wells Countiesare in south Texas on the West Gulf Coastal Plain. Theycover an area of about 2,540 square miles. Kingsville,county seat of Kleberg County, is the largest city in thearea; it is about 35 miles southwest of Corpus Christi.The entire area is dependent upon its ground-waterresources. All water used for irrigation, industrial andpubIic supply, and most of the water used for domesticand stock supply is withdrawn from wells.
The geologic formations that underlie the reportarea and that are significant to the occurrence of fresh orslightly saline water are, in order of decreasing age, theOakville Sandstone, Lagarto Clay, Goliad Sand,Beaumont Clay and Lissie Formation, undifferentiated(including barrier island and beach deposits), southTexas eolian plain deposits, barrier island deposits, andalluvium..AII of these units are exposed in the reportarea except the Goliad Sand, Lagarto Clay, and OakvilleSandstone, which crop out in counties west ot the reportarea.
The Goliad Sand, which is tapped by wellsthroughout the report area, is the principal aquifer. Thewater is under artesian pressure and is yielded to flowingand nonflowing wells. The Goliad supplies all the groundwater for public supplies and irrigation, about 98percent of the water used by industry, and about 95percent of the water for rural-domestic and livestockneeds. During 1968, about 18,000 acre-feet of groundwater was withdrawn for all purposes.
Water levels in wells in the Goliad Sand declinedsignificant'ly from 1932-33 to 1968-69. The largestdeclines were in wells in the vicinity of Kingsville and insouthern Jim Wells County, principally as a result oflarge-scale withdrawals for public supplies and industrialuse. During the period, the decline was as much as 200feet in the Kingsville area.
In the report area, the quality of water from wellsin the Gol iad Sand deteriorates at depths greater than
1,000 feet, and the salinity of the water increaseseastward. Generally, water from wells in the Goliad Sandin southern Jim Wells County and about the westernone-half of Kleberg County meets the quality standardsof the U.S. Public Health Service.
Moderately saline to very saline water-bearingsands overlie the fresh and slightly saline water-bearingsands of the Goliad Sand at most places throughout thereport area, and have caused one of the major problemsrelative to maintaining a suitable water supply. Specialcare is needed in well construction to insure againstcontamination of the fresh water as a result ofimproperly cased wells.
Only about 7 mgd (million gallons per day) offresh to slightly saline water can be consideredcontinually available as recharge to the Goliad Sand inKleberg and southern Jim Wells Counties. The 13.8 mgdof ground water that was used in 1968 in Kleberg andsouthern Jim Wells Counties exceeds the availablerecharge. This rate of ground-water usage cannot bema intained indefinitely. However, the continuedavailability of even 7 mgd of water depends upon nonew large-scale ground-water developments in the GoliadSand in the areas adjacent to Kleberg and southern JimWells Counties.
About 14 mgd of fresh to slightly saline water isstill continually available for development in KenedyCounty from the Goliad Sand. Because only 2.8 mgd ofground water was used in Kenedy County in 1968,almost entirely from the Goliad Sand, ground-waterproduction could be greatly increased.
The area most favorable for the development ofadditional ground-water supplies from the Goliad Sand isin west-central Kenedy County, where the sands arethickest and where the present rate of development isrelatively small.
GROUND-WATER RESOURCES OF KLEBERG, KENEDY, AND
SOUTHERN JIM WELLS COUNTIES, TEXAS
INTRODUCTION
location and Extent of the Area
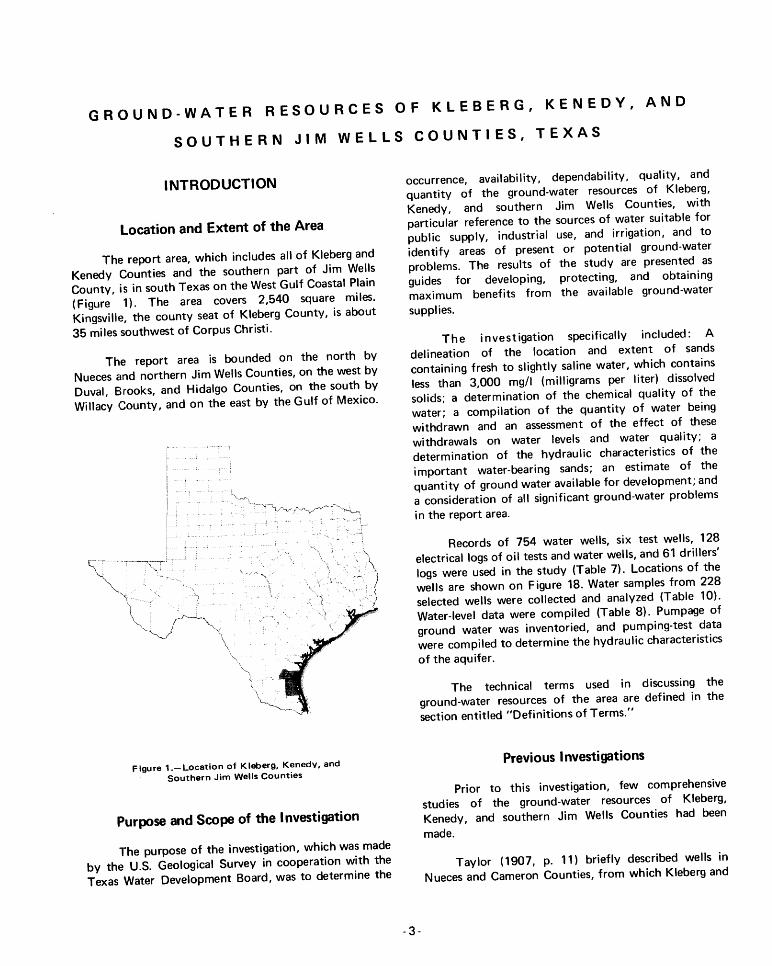
The report area, which includes all of Kleberg and
Kenedy Counties and the southern part of Jim Wells
County, is in south Texas on the West Gulf Coastal Plain
(Figure 1). The area covers 2,540 square miles.
Kingsville, the county seat of Kleberg County, is about
35 miles southwest of Corpus Christi.
The report area is bounded on the north by
Nueces and northern Jim Wells Counties, on the west by
Duval, Brooks, and Hidalgo Counties, on the south by
Willacy County, and on the east by the Gulf of Mexico.
Figure 1.-Location of Kleberg, Kenedy, and
Southern Jim Wells Counties
Purpose and Scope of the Investigation
The purpose of the investigation, which was made
by the U.S. Geological Survey in cooperation with the
Texas Water Development Board, was to determine the
-3-
occurrence, availability, dependability, quality, and
quantity of the ground-water resources of Kleberg,
Kenedy, and southern Jim Wells Counties, with
particular reference to the sources of water suitable for
public supply, industrial use, and irrigation, and to
identify areas of present or potential ground-water
problems. The results of the study are presented as
guides for developing, protecting, and obtaining
maximum benefits from the available ground-water
supplies.
The investigation specifically included: A
delineation of the location and extent of sands
containing fresh to slightly saline water, which contains
less than 3,000 mg/I (milligrams per liter) dissolved
solids; a determination of the chemical quality of the
water; a compilation of the quantity of water being
withdrawn and an assessment of the effect of these
withdrawals on water levels and water quality; a
determination of the hydraulic characteristics of the
important water-bearing sands; an estimate of the
quantity of ground water available for development; and
a consideration of all significant ground-water problems
in the report area.
Records of 754 water wells, six test wells, 128
electrical logs of oil tests and water wells, and 61 drillers'
logs were used in the study (Table 7). Locations of the
wells are shown on Figure 18. Water samples from 228
selected wells were collected and analyzed (Table 10).
Water-level data were compiled (Table 8). Pumpage of
ground water was inventoried, and pumping-test data
were compiled to determine the hydraulic characteristics
of the aquifer.
The technical terms used in discussing the
ground-water resources of the area are defined in the
section entitled "Definitions of Terms."
Previous Investigations
Prior to this investigation, few comprehensive
studies of the ground-water resources of Kleberg,
Kenedy, and southern Jim Wells Counties had been
made.
Tay lor (1907, p. 11) briefly described welis in
Nueces and Cameron Counties, from which Kleberg and
Kenedy Counties were later created. Brief investigationsof ground water in the area were made by Deussen(1914). In 1932-33, a study of the ground-waterresources of Kleberg County was made by Livingstonand Bridges (1936). An exploration of salt-water leaks inwells on the King Ranch was made by Livingston andBroadhurst (1942). George and Cromack (1943)described the ground-water conditions in the vicinity ofKingsville. An inventory of wells in Kenedy County wasmade in the spring of 1933 by Turner and Cumley(1940), and during the summer and fall of that year aninventory of wells in Jim Wells County was made byTurner, Lynch, and Cumley (1940). In a study ofground-water conditions in the Premont-La Gloria-Falfurrias District in Jim Wells and BrrooksCounties, Cromack (1944) described, in general, thesource and quality of the ground water and the effectsof pumping on water levels in wells.
The public-water supplies of Kingsville andPremont were described briefly by Broadhurst,Sundstrom, and Rowley (1950, p. 75 and 80). Areconnaissance of the ground-water resources of the GulfCoast region, which includes Kleberg, Kenedy, and JimWells Counties, was made by Wood, Gabrysch, andMarvin (1963). In 1968, ground-water personnel fromt h e T e x a s W a t e r D e v e l o p m e n t B o a r d made a ninvestigation of alleged contamination of some of theCity of Kingsville water wells.
Detailed reports have been published on theground-water resources of several counties adjacent tothe report area, including Duval County, Sayre (1937);Brooks County, Myers and Dale (1967); and Nueces andSan Patricio Counties, Shafer (1968). Mason (1963)reported on the availability of ground water from theGoliad Sand in the Alice area of Jim Wells County.
Water levels in observation wells in Kleberg andsouthern Jim Wells Counties were measured occasionallyduring the period 1932-43. Since 1942, water levels havebeen measured periodically as part of a state-wideobservation-well program undertaken jointly by theTexas Water Development Board, formerly Texas Boardof Water Engineers, and the U.S. Geological Survey.Sorne of the water-level measurements have beenpublished in annual water-level reports of the GeologicalSurvey, and many are included in Table 8.
Economic Development
The economy of Kleberg, Kenedy, and southernJim Wells Counties depends mainly on oil and gasproduction, large-scale ranching, petrochemicalindustries, farming, and dairying.
The King Ranch, Texas A&l University, a U.S.Naval air station. a large petrochemical plant, and a largetourist trade contribute a great deal to the economy ofKleberg County. During 1968, the county produced
more than 24 million barrels of oil. Grain sorghum and avariety of vegetables are grown locally. Terminals for theintercoastal waterway, international oceanictransportation, and commercial air service are availablein nearby Corpus Christi. The Kingsville area is alsoserved by air, rail, and bus lines; paved State andFederal highways; and secondary roads. Kingsville, thelargest city in the county, had a population of about27,800 in 1970.
The economy of Kenedy County is based mainlyon 16 ranches, which average over 33,000 acres. Two ofthese ranches occupy most of the county. Sarita, thecounty seat, with a population of about 200 in 1970, isa cattle shipping center. Oil was discovered in the countyin 1947; during 1968 about 2,460,000 barrels of oil wasproduced. The few farms in the county produced anincome of about $877,000 during 1968. The county isserved by the Missouri Pacific Railroad, U.S. Highway77, and many miles of hard-surfaced roads.
The economy of southern Jim Wells Countydepends mainly upon the industries related to oil and gasproduction, large-scale ranching, and farming. Oil wasdiscovered in the southern part of Jim Wells County in1937. During 1968, more than 11 million barrels of oilwere produced in the county-a large part being fromthe Premont-La Gloria District. In 1968, there wereabout 30 irrigation wells in the area. Irrigated cropsinclude grain sorghum, pastures, citrus orchards, and avariety of vegetables. Premont, in southern Jim WellsCounty, had a population of about 3,100 in 1970. Thesurrounding area is served by a large number ofhard-surfaced roads and highways; rail transportation isalso available.
Topography and Drainage
The area studied is bordered by the Gulf ofMexico on the east. Generally, the land surface slopes tothe east or southeast. The altitude ranges from sea levelalong the coast to about 250 feet above sea level nearthe west boundary line of Jim Wells County about 10miles northwest of Premont.
Several small, intermittent, low-gradient streamsand their tributaries drain the area; these include SanFernando Creek, Tranquitas Creek, Santa GertrudisCreek, Escondido Creek, Jaboncillos Creek, and LosOlmos Creek, which is the boundary between Klebergand Kenedy Counties. Most of the larger streams draininto the shallow bays; some of the smaller ones emptyinto Los Olmos Creek, which in turn drains into BaffinBay. Generally, the stream valleys are wide and nearlyflat.
The southern part of the area, which includes allof Kenedy County, is almost completely covered by asand sheet, which has a maximum thickness of morethan 60 feet. Drainage in this part of the area is
-4-
JAN
50
60
z
~ 5l---+--t---j---f/~
~~ 4
Climate
Dense thickets of oak and "underbrush" arepresent where the terrain is sandy. Some of the "flats"are covered with sacahuista and other wild grasses.Generally, the uplands support a variety of vegetationconsisting of mesquite, huisache, cenizo, cactus, andcatclaw. The larger trees grow along the main streams. Alarge area in the eastern part of Kleberg County isgrass-covered prairie.
practically non-existent. Sand dunes are well developed 9Or-----r--~----,---.--,----,--~___,r-_,-,__~-_,
at many places; some dunes are fairly well anchored by avegetative cover, others are migrating. Rounded oroval-shaped depressions are fairly common and some ofthe larger ones contain water during rainy seasons.
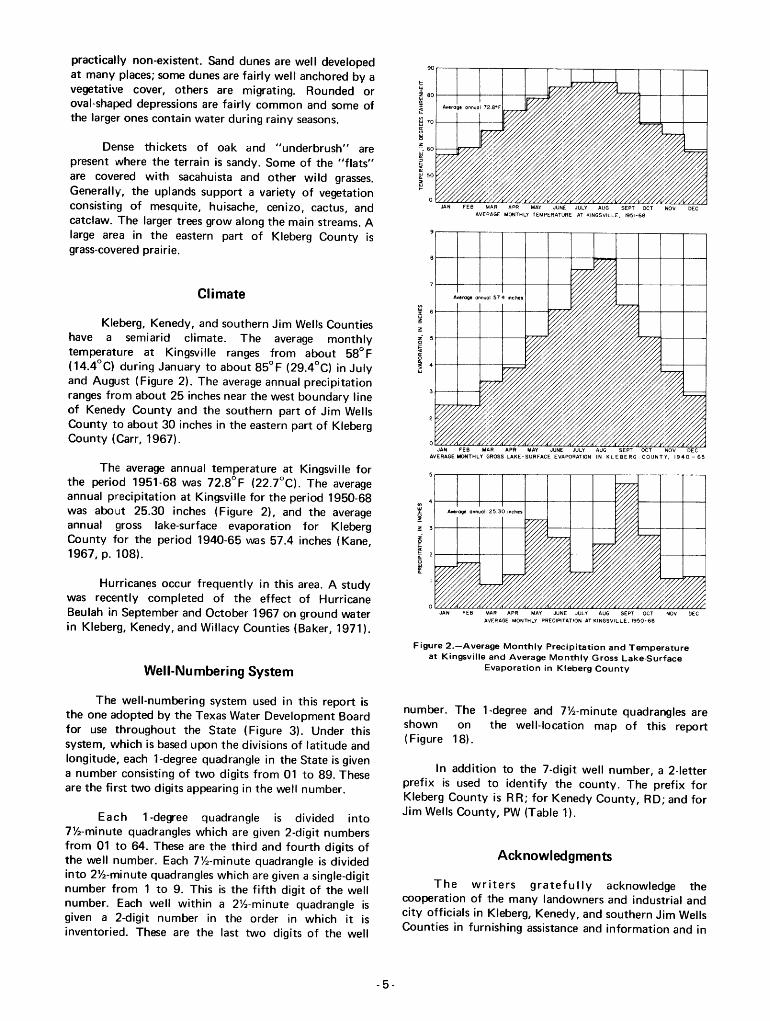
Kleberg, Kenedy, and southern Jim Wells Countieshave a semiarid climate. The avera!)e monthlytemperature at Kingsville ranges from about 58° F(14.4°C) during January to about 85° F (29.4°C) in Julyand August (Figure 2). The average annual precipitationranges from about 25 inches near the west boundary lineof Kenedy County and the southern part of Jim WellsCounty to about 30 inches in the eastern part of KlebergCounty (Carr, 1967).
The average annual temperature at Kingsville forthe period 1951-68 was 72.8°F (22.7°C). The averageannual precipitation at Kingsville for the period 1950-68was about 25.30 inches (Figure 2), and the averageannual gross lake-surface evaporation for KlebergCounty for the period 1940-65 was 57.4 inches (Kane,1967,p.l08).
Hurrican~s occur frequently in this area. A studywas recently completed of the effect of HurricaneBeulah in September and October 1967 on ground waterin Kleberg, Kenedy, and Willacy Counties (Baker, 1971).
i!O 3 ~-j----+---+-----t::
Well-Numbering System
Figure 2.-Average Monthly Precipitation and Temperatureat Kingsville and Average Monthly Gross Lake-Surface
Evaporation in Kleberg County
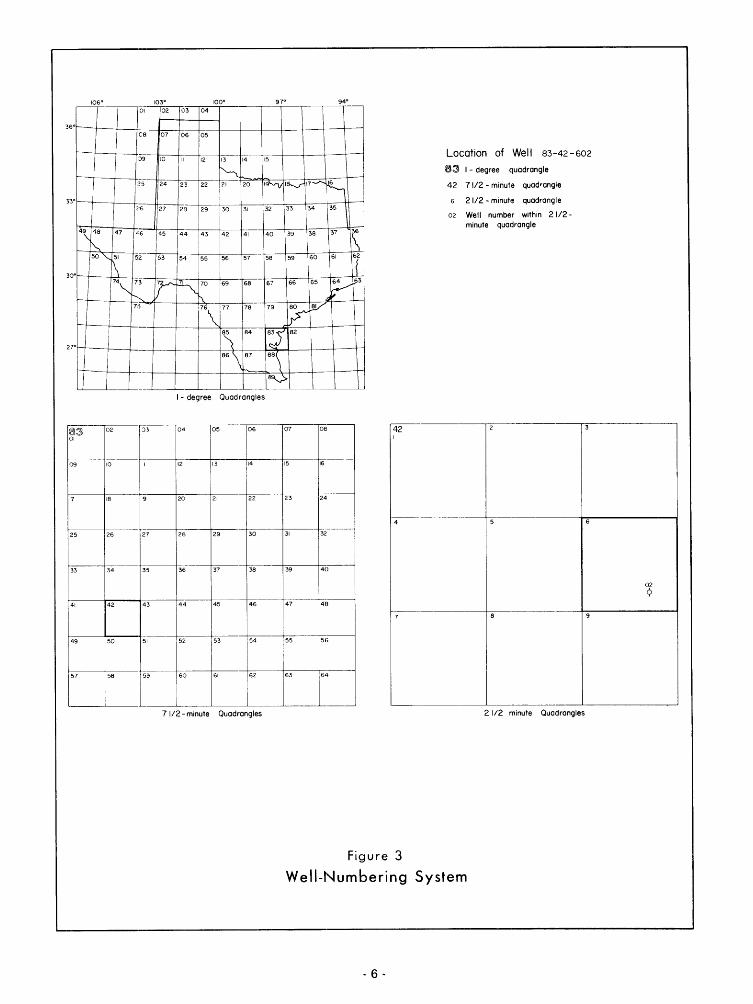
The well-numbering system used in this report isthe one adopted by the Texas Water Development Boardfor use throughout the State (Figure 3). Under thissystem, which is based upon the divisions of latitude andlongitude, each l-degree quadrangle in the State is givena number consisting of two digits from 01 to 89. Theseare the first two digits appearing in the well number.
Each 1-degree quadrangle is divided into7%-minute quadrangles which are given 2-digit numbersfrom 01 to 64. These are the third and fourth digits ofthe well number. Each 7%-minute quadrangle is dividedinto 2%-minute quadrangles which are given .a single-digitnumber from 1 to 9. This is the fifth digit of the wellnumber. Each well within a 2%-minute quadrangle isgiven a 2-digit number in the order in which it isinventoriE~d. These are the last two digits of the well
number. The l-degree and 7%-minute quadrangles areshown on the well-location map of this report(Figure 18).
In addition to the 7-digit well number, a 2-letterprefix is used to identify the county. The prefix forKleberg County is RR; for Kenedy County, RD; and forJim Wells County, PW (Table 1).
Acknowledgments
The writers gratefully acknowledge thecooperation of the many landowners and industrial andcity officials in Kleberg, Kenedy, and southern Jim WellsCounties in furnishing assistance and information and in
- 5-
106' 103' 100' 97' 94'
3:\
30
27
01 02 03 04
08 07 06 05
39 10 II 12 13 14 15
I"l. i
;~5 24 23 22 21 20 19~ 18'--.J"17~ ~21I
'i~I--
26 27 28 31 32 33 34 35
4\ 48 47 '-6 45 44 43 --142 41 40 39 38 '3"7
~"'-..50"- 51 52 53 54 55 56 57 58 59 60 61
l\I----
74" 73 V ~70 69 68 67 66 65~
63
~ 1'\ .. ~ I
75176\ 77 78 79 VW
I!~
84 r:Y 82
86\87
88\
h --1-- ......-1B'0
----'-------'---
1- degree Quadrangles
Location of Well 83-42-602
3~ 1- degree quadrangle
42 7 1/2 - minute quad'angle
21/2 - minute quadrangle
02 Well number within 2 1/2minute quadrangle
~~~ 02
01
09 10
17 18
;~5 26
33 34
41 42
49 50
57 58
--c--06 --ro:r-- 083 04 05
-- f-----1----I 12 13 14 15 16
20 21 22 23 24
7 28 29 30 31 32
5 36 37 38 39 40
I
44 45 46--1-=----I---__~I
3 47 4El !
I
I 52 53 54 55 56
-~t9 60 61 64
~-7 1/2 - minute Quadrangles
~-
2 342I
4 5 6
02¢
7 8 9
2 1/2 minute Quadrangles
Figure 3
Well-Numbering System
- 6 -
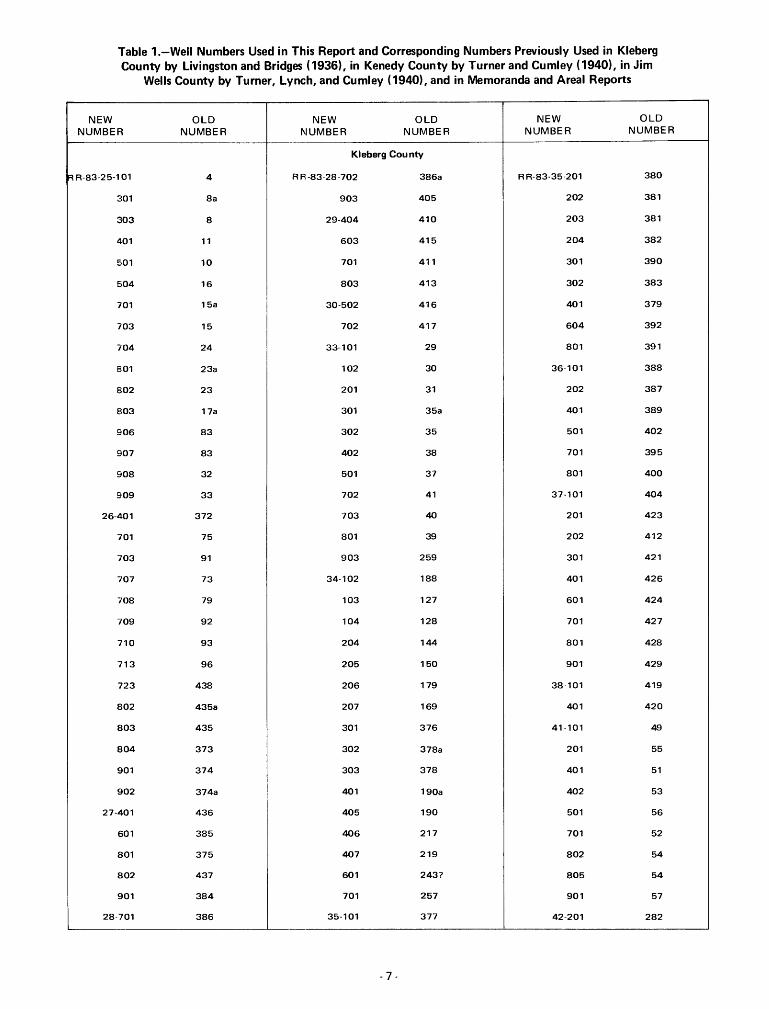
Table 1.-Well Numbers Used in This Report and Corresponding Numbers Previously Used in KlebergCounty by Livingston and Bridges (1936), in Kenedy County by Turner and Cumley (1940), in Jim
Wells County by Turner, Lynch, and Cumley (1940), and in Memoranda and Areal Reports
NEW OLD NEW OLD NEW OLDNUMBER NUMBER NUMBER NUMBER NUMBER NUMBER
Kleberg County
~ R-83-25-1 01 4 RR:-83-28-702 386a R R·83-35-201 380
301 8a 903 405 202 381
303 8 29-404 410 203 381
401 11 603 415 204 382
501 10 701 411 301 390
504 16 803 413 302 383
701 15a 30-502 416 401 379
703 15 702 417 604 392
704 24 33-101 29 801 391
B01 23a 102 30 36-101 388
802 23 201 31 202 387
803 17a 301 35a 401 389
906 83 302 35 501 402
907 83 402 38 701 395
908 32 501 37 801 400
909 33 702 41 37-101 404
26-401 372 703 40 201 423
701 75 801 39 202 412
703 91 903 259 301 421
707 73 34-102 188 401 426
708 79 103 127 601 424
709 92 104 128 701 427
710 93 204 144 801 428
713 96 205 150 901 429
723 438 206 179 38-101 419
802 435a 207 169 401 420
803 435 301 376 41-101 49
804 373 302 378a 201 55
901 374 303 378 401 51
902 374a 401 190a 402 53
27-401 436 405 190 501 56
601 385 406 217 701 52
801 375 407 219 802 54
802 437 601 243? 805 54
901 384 701 257 901 57
28·701 386 35-101 377 42-201 282
-7 -
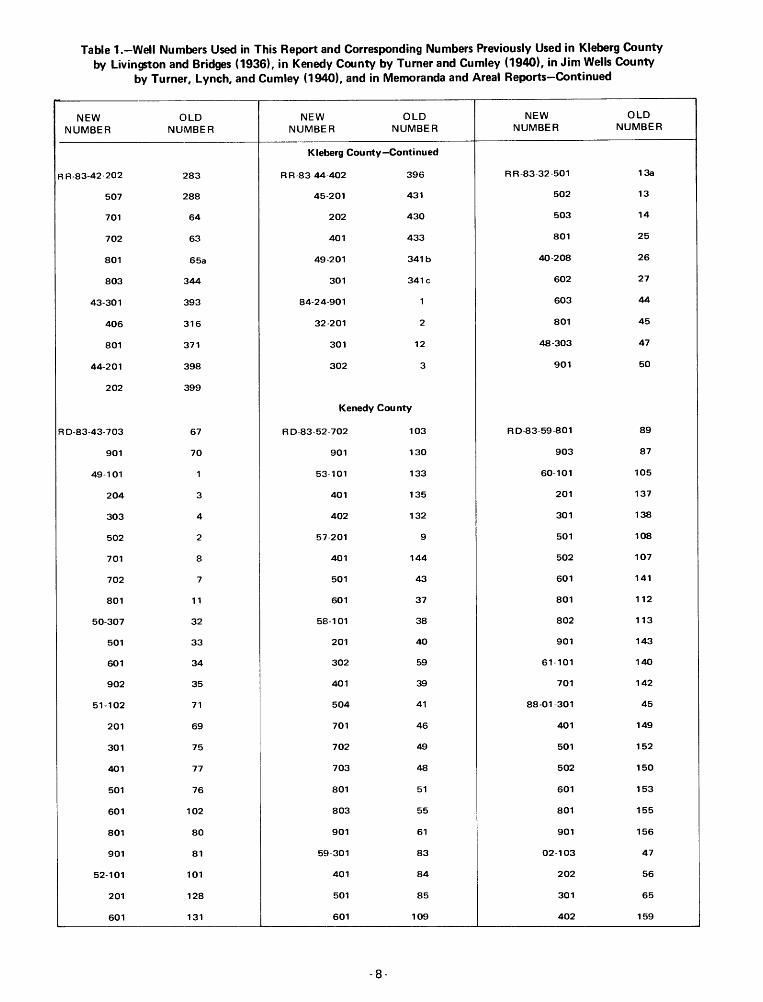
Table 1.-Well Numbers Used in This Report and Corresponding Numbers Previously Used in Kleberg Countyby Livingston and Bridges (1936), in Kenedy County by Turner and Cumley (1940), in Jim Wells County
by Turner, lynch. and Cumley (1940). and in Memoranda and Areal Reports-Continued
NEW OLD NEW OLD NEW OLDNUMBER NUMBER NUMBER NUMBER NUMBER NUMBER
Kleberg County-Continued
R R-83-42-202 283 R R-83-44-402 396 RR-83-32-501 13a
507 288 45-201 431 502 13
701 64 202 430 503 14
702 63 401 433 801 25
801 65a 49-201 341b 40-208 26
803 344 301 341c 602 27
43-301 393 84-24-901 1 603 44
406 316 32-201 2 801 45
801 371 301 12 48-303 47
44-201 398 302 3 901 50
202 399
Kenedy County
R 0-83-43-703 67 RO-83-52-702 103 RO-83-59-801 89
901 70 901 130 903 87
49-101 1 53-101 133 60-101 105
204 3 401 135 201 137
303 4 402 132 301 138
502 2 57-201 9 501 108
701 8 401 144 502 107
702 7 501 43 601 141
801 11 601 37 801 112
50-307 32 58:-101 38 802 113
501 33 201 40 901 143
601 34 302 59 61-101 140
902 35 401 39 701 142
51-102 71 504 41 88-01-301 45
201 69 701 46 401 149
301 75 702 49 501 152
401 77 703 48 502 150
501 76 801 51 601 153
601 102 803 55 801 155
801 80 901 61 901 156
901 81 5!:1-301 83 02-103 47
52-101 101 401 84 202 56
201 128 501 85 301 65
601 131 601 109 402 159
-8-
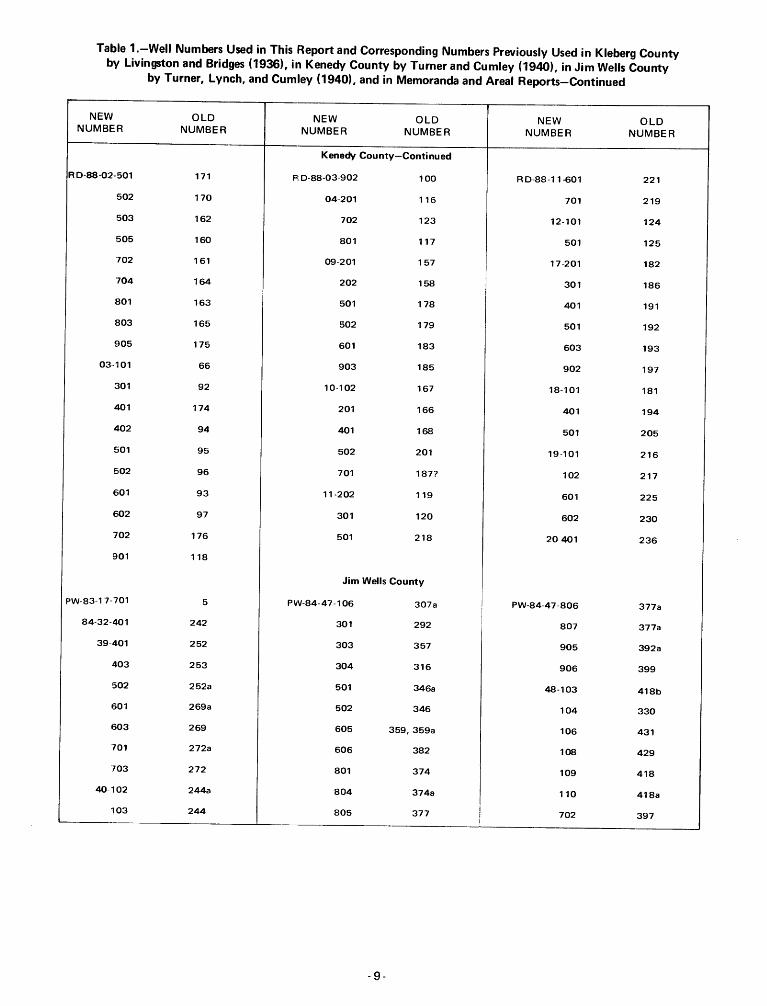
Table 1.-Well Numbers Used in This !Report and Corresponding Numbers Previously Used in Kleberg Countyby Livingston and Bridges (1936), in Kenedy County by Turner and Cumley (1940), in Jim Wells County
by Turner, Lynch, and Cumley (1940), and in Memoranda and Areal Reports-Continued
NEW OLD NEW OLD NEW OLDNUMBER NUMBER NUMBER NUMBER NUMBER NUMBER
Kenedy County-Continued
RD-88-02-501 171 FI: 0-88-03-902 100 RO-88-11-601 221
502 170 04-201 116 701 219
503 162 702 123 12-101 124
505 160 801 117 501 125
702 161 09-201 157 17-201 182
704 164 202 158 301 186
801 163 501 178 401 191
803 165 502 179 501 192
905 175 601 183 603 193
03··101 66 903 185 902 197
301 92 10-102 167 18-101 181
401 174 201 166 401 194
402 94 401 168 501 205
501 95 502 201 19-101 216
502 96 701 187? 102 217
601 93 11-202 119 601 225
602 97 301 120 602 230
702 176 501 218 20-401 236
901 118
Jim Wells County
PW-83-17-701 5 PW-84-47-106 307a PW-84-47-806 377a
84-32-401 242 301 292 807 377a
39-401 252 303 357 905 392a
403 253 304 316 906 399
502 252a 501 346a 48-103 418b
601 269a 502 346 104 330
603 269 605 359,359a 106 431
701 272a 606 382 108 429
703 272 801 374 109 418
40·102 244a 804 374a 110 418a
103 244 805 377 I 702 397I
- 9-
permitting access to wells. Water-well drillers in the areacontributed drillers' logs and well-completion data. Thefollowing individuals gave special assistance: Mr. RichardM. Kleberg, Jr. and Mr. Cy Yeary, King Ranch, Inc.,Kin!lSville, Texas, Dr. Frank H. Dotterweich, Texas A&IUniversity, Kingsville, Texas; Mr. and Mrs. Tom EastLinn, Texas; Mr. Lynwood Weiss, Sarita, Texas; Mr. CarlB. Peters, Humble Oil and Refining Company, Kingsville,Texas; Major Thomas R. Armstrong and Mr. TobinArmstrong, Armstrong, Texas.
GEOLOGY AS RELATED TO THEOCCURRENCE OF GROUND WATER
General Stratigraphy and Structure
The geologic formations that contain fresh toslightly saline wc:ter are, in order of decreasing age, theOakville Sandstone and the Lagarto Clay of Miocene age,the Goliad Sand of Pliocene age, and the LissieFormation and Beaumont Clay (including barrier islandand beach deposits) of Pleistocene age, the south Texaseolian plain deposits of Pleistocene(?) and Holocene age,and the barrier island deposits and alluvium of Holoceneage. All of these units are exposed in the report areaexcept the Goliad Sand, Lagarto Clay, and OakvilleSandstone, which crop out in counties west of the mportarea (Figure 4).
The geologic formations, except the alluvium andsouth Texas eolian plain deposits, crop out in belts thatare nearly parallel to the Gulf Coast. Youngerformations generally crop out close to the coast andsuccessively older ones farther inland. Because of thedifferent ages of the formations, the outcrops arepro~lressively eroded and dissected inland. For example,the outcrop of the Beaumont Clay and Lissie Formation,undifferentiated, which covers most of Kleberg County,is comparatively uneroded in contrast to the uneven anddissected outcrop of the Goliad Sand farther inland. Thealluvium and south Texas eolian plain deposits transgressthe other geologic formations and are elongated mostlynormal to the Gulf Coast.
The lithology, dip, and thickness of many of thegeologic formations change in the direction of the dip;and the lithology and thickness commonly changelaterally along the strike. Sand beds may grade latE!rallyinto clay or silt within short distances. These sand bedsand other beds containing water are interconnected withsimilar beds on a different level, so that a seril~s ofwater-bearing beds within a formation, or even within agroup of formations, function as a single aquifer. Bothdips and thicknesses of the formations increase gulfward,and the clastic sediments composing the geologicformations grade from fluviatile and deltaic sand,. silt,and clay in inland areas to predominantly finersediments that interfinger with brackish and marinesediments near the Gulf Coast and offshore.
- 10-
Geologic structure of the area is relatively simple.The water-bearing formations underlying the report areaform a monocline that dips gently toward the coast(Figures 19, 20, and 21). Although faults are fairlycommon in many of the deeply buried formations, noneof the geologic formations discussed in this report areknown to be displaced by significant faults.
The age, thickness, lithology, and water-bearingproperties of the geologic formations are summarized inTable 2.
Physical Characteristics and Water-BearingProperties of the Geologic Formations
Oakville Sandstone
The Oakville Sandstone of Miocene age, the oldestand deepest aquifer that yields slightly saline water inthe report area, overlies tuffaceous clay, sandstone, andconglomerate of the Catahoula Tuff and underlies theLagarto Clay and Goliad Sand. From the middle ofDuval County southward to the Rio Grande, theOakville is completely overlapped by the Goliad.Northward from the middle of Duval County, theOakville is exposed in an irregular belt from 1 to 10miles wide (Figure 4).
The Oakville consists chiefly of very fine to coarse,brown to gray sand and sandstone interbedded with siltand a considerable amount of clay. Sayre (1937, p. 43)described an exposure of the formation in northernDuval County-the nearest outcrop area of theOakville-as dirty-brown fairly coarse sandstone, in partpoorly and in part firmly cemented. Electrical logs showthat about one-third of the Oakville in southern JimWells County is sand or sandstone, the remainder beingmainly finer sediments.
In the subsurface, in southern Jim Wells County,the Oakville reaches a maximum thickness of about 600feet and dips eastward at a rate of about 45 feet per mile(F igure 19). Depth to the top of the formation is about1,600 feet near the Duval County line.
The Oakville Sandstone yields small to moderatequantities of slightly saline water to a few industrial andstock wells in southern Jim Wells County. In thePremont area, three industrial wells (PW-84-40-703,PW-84-40-709, and PW-84-40-711) produce water fromdepths of about 2,300 to 2,500 feet. Well PW-84-40-703pumped a reported 282 gpm (gallons per minute) ofwater containing 2,320 mg/I (milligrams per liter)dissolved solids when sampled in 1968. Near thesouthern boundary of Jim Wells County, a stock well,PW-84-47-810, which taps the Oakville, flowed anestimated 10-15 gpm of water containing 1,890 mg/Idissolved sol ids.
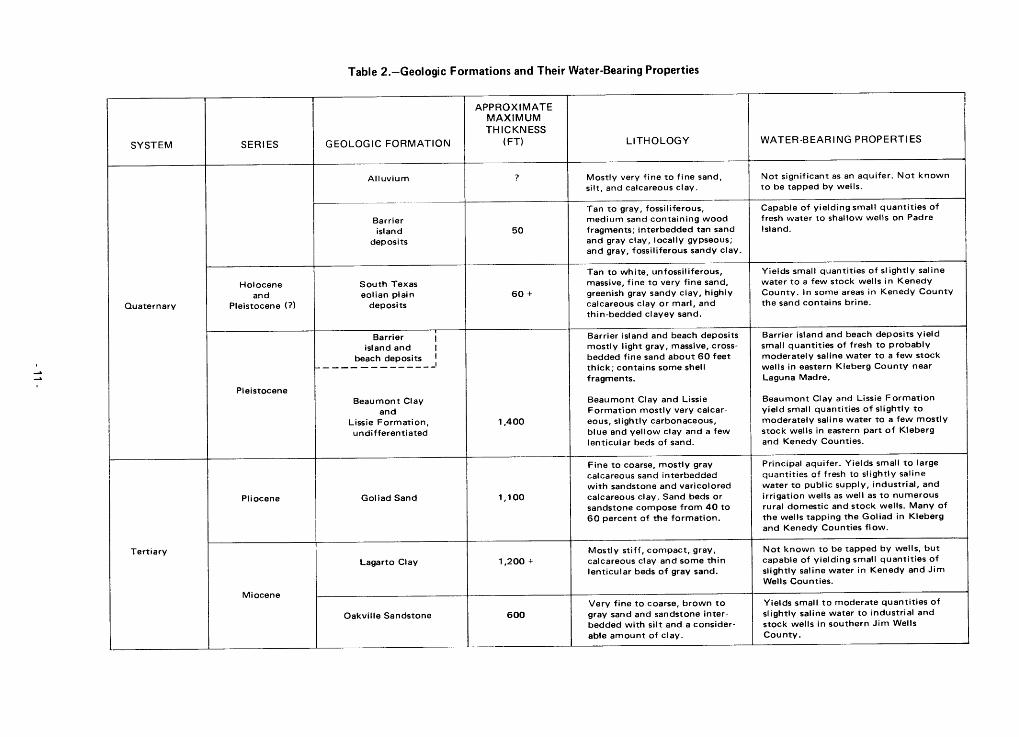
Table 2.-Geologic Formations and Their Water-Bearing Properties
......
SYSTEM
Quaternary
Tertiary
SERIES
Holoceneand
Pleistocene (?)
Pleistocene
Pliocene
Miocene
GEOLOGIC FORMATION
Alluvium
Barrierisland
deposits
South Texaseolian plain
deposits
Barrier Iisland and I
beach deposits I1-- 1
Beaumont Clayand
Lissie Formation,undifferentiated
Goliad Sand
Lagarto Clay
Oakville Sandstone
APPROXIMATEMAXIMUMTHICKNESS
(FTl
?
50
60 +
1,400
1,100
1,200 +
600
LITHOLOGY
Mostly very fine to fine sand,silt, and calcareous clay.
Tan to gray, fossiliferous,medium sand containing woodfragments; interbedded tan sandand gray clay, locally gypseous;and gray, fossiliferous sandy clay.
Tan to wh ite, unfossil iferous,massive, fine to very fine sand,greenish gray sandy clay, highlycalcareous clay or marl, andthin-bedded clayey sand.
Barrier island and beach depositsmostly light gray, massive, crossbedded fine sand about 60 feetthick; contains some shellfragments.
Beaumont Clay and LissieFormation mostly very calcareous, slightly carbonaceous,blue and yellow clay and a fewlenticular beds of sand.
Fine to coarse, mostly graycalcareous sand interbeddedwith sandstone and varicoloredcalcareous clay. Sand beds orsandstone compose from 40 to60 percent of the formation.
Mostly stiff, compact, gray,calcareous clay and some thinlenticular beds of gray sand.
Very fine to coarse, brown togray sand and sandstone interbedded with silt and a considerable amount of clay.
WATER-BEARING PROPERTIES
Not significant as an aquifer. Not knownto be tapped by wells.
Capable of yielding small quantities offresh water to shallow wells on PadreIsland.
Yields small quantities of sl ightly salinewater to a few stock wells in KenedyCounty. in sofne areas in Kenedy Countythe sand contains brine.
Barrier island and beach deposits yieldsmall quantities of fresh to probablymoderately saline water to a few stockwells in eastern Kleberg County nearLaguna Madre.
Beaumont Clay and Lissie Formationyield small quantities of slightly tomoderately saline water to a few mostlystock wells in eastern part of Klebergand Kenedy Counties.
Principal aquifer. Yields small to largequantities of fresh to slightly salinewater to public supply, industrial, andirrigation wells as well as to numerousrural domestic and stock wells. Many ofthe wells tapping the Goliad in Klebergand Kenedy Counties flow.
Not known to be tapped by wells, butcapable of yielding small quantities ofslightly saline water in Kenedy and JimWells Counties.
Yields small to moderate quantities ofsl ightly saline water to industrial andstock wells in southern Jim WellsCounty.
Development of the Oakville Sandstone as anaquifer within the report area has been restricted almostentirely to southern Jim Wells County where sandscontaining slightly saline water pinch out. Because theOakville is about 1,000 feet below the Goliad Sand,which is a more productive aquifer, economics haverestricted its development in areas where the Goliad ispresent.
Lagarto Clay
The Lagarto Clay of Miocene age overlies theOakville Sandstone and underlies the Goliad Sand. Likethe Oakville Sandstone, the Lagarto Clay is fullyoverlapped by the Goliad Sand from Duval County tothe Rio Grande. The outcrop of the Lagarto Clay nearestto the report area is in extreme northeastern DuvalCounty and northwestern Jim Wells County wherestream erosion has exposed a reentrant of Lagarto Clayfar into the western margin of the Goliad outcrop (seeFigure 4).
The Lagarto Clay is chiefly stiff, compact, gray, calcareous clay and thin lenticular beds of gray sand.Electrical logs indicate that the Lagarto generallyconsists of 75 to 85 percent clay or predominantlyclayey sediment. Accumulative thickness of sand beds iscommonly 15-25 percent of the total thickness. Rarelyis a sand bed more than 30 feet thick.
In southern Jim Wells County, the Lagarto isabout 1,000 feet thick and is from about 700 to 1,000feet below the land surface. In much of Kenedy andKleberg Counties, where the formation contains mostlymoderately to very saline water, the thickness exceeds1,200 feet. Depth to the top of the Lagarto increaseseastward.
The Lagarto Clay is not known to be tapped bywells in the report area. In southwestern Kenedy andsouthern Jim Wells Counties some sand beds in theLagarto are capable of yielding small quantities ofslightly saline water.
Goliad Sand
The Goliad Sand of Pliocene age, which occursonly in the subsurface in the report area, crops outmainly to the west of the report area in a vast regionthat includes parts of northern Jim Wells, Duval, Webb,Zapata, Brooks, Jim Hogg, Starr, and Hidalgo Counties.Maximum width of the outcrop is west of Falfurriaswhere the Goliad Sand extends for nearly 50 miles at thesurface and completely overlaps the underlying L.agartoClay and Oakville Sandstone and nearly overlaps theCatahoula Tuff (Figure 4).
The Goliad consists of fine to coarse, mostly graycalcareous sand interbedded with sandstone a n d
varicolored calcareous clay. Sayre (1937, p. 51-52)described a 17-foot section of outcrop in northeasternDuval County as light gray to buff or grayish brownsand, sandstone, and gravel with some buff to green clay.In this section the sand and sandstone are fine tocoarse-grained, crossbedded, and contain numerouscaliche fragments. Nearly everywhere on the outcrop,caliche is present either at the surface or under acomparatively thin mantle of soil. Electrical logs in thereport area show that the Goliad consists of 40 to 60percent sand or sandstone, the remainder being mainlyfiner sediments.
In the subsurface, the Goliad Sand reaches amaximum thickness of about 1,100 feet and dipseastward at rates ranging from 20 to about 40 feet permile (Figures 19, 20, and 21). In places alongsouthwestern Jim Wells County, the Goliad is probablyless than 100 feet below land surface, but because of theformation’s eastward dip, its top lies at a depth ofaround 1,400 feet in the vicinity of Padre Island(Figure 5). In the K ingsville area, the Goliad is about500 feet below land surface.
The Goliad Sand is the principal aquifer in therepot-t area. It supplies small to large quantities of freshto slightly saline water to public supply, industrial,irrigation, rural-domestic, and stock wells. The mostconcentrated development of the Goliad is at Kingsvillewhere the city pumps water for public supply from 14wells. One of these wells, RR-83-26-721, was testpumped at 980 gpm when drilled in 1967. All of the citywells are from 700 to 900 feet deep and most of themyield water having 1,000 to 1,200 mg/l dissolved solids.West of Riviera, irrigation well RR-83-41-803 pumps ameasured 616 gpm of water containing 772 mg/ldissolved solids from a depth of 512 to 638 feet. Insouthern Jim Wells and western Kleberg Counties, theGoliad Sand yields moderate to large quantities of freshwater to industrial and public-supply wells.
Fresh water can be obtained from the Goliadanywhere in southern Jim Wells County and generally inthe western half of Kenedy and Kleberg Counties.Because mineralization increases eastward, most of thewater in the Goliad in the eastern half of Kenedy andKleberg Counties is slightly, moderately, or very saline.
In far eastern Kleberg County and in most areas ofrelatively low elevations in Kenedy County, artesianpressure is still sufficiently high to cause many of theGoliad wells to flow. For example, in the Armstrongarea in Kenedy County, well RD-88-03-802 flows 30gpm of water that is probably slightly saline from adepth of 1,120 feet; and in Kleberg County on PadreIsland, well RR-83-46-201 originally drilled as an oil testbut plugged back, flows a measured 10 gpm ofmoderately saline water from a depth of 1,530 to 1,560feet. At least 56 wells tapping the Goliad Sand inKenedy and Kleberg Counties were still flowing in 1968and 1969; almost all of these wells are ranch wells usedfor stock purposes, and most are in Kenedy County.
-12-
Beaumont Clay and LissieFormation, Undifferentiated
The Beaumont Clay and Lissie Formation ofPleistocene age overlie the Goliad Sand and alre discussedas a unit.
The Beaumont Clay and Lissie Formation consistmostly of very calcareous, slightly carbonaceous, blueand yellow clay, and a few lenticular beds of sand. Manyof the sand beds, especially those near the surface, arefine to very fine grained. Calcareous nodules anddisseminated caliche are common in the shallow part ofthe section.
The Beaumont Clay and Lissie Formation in thesubsurface dip eastward at about 25 feet per mile. Thethickness of the unit ranges from less than 100 feet inparts of southwestern Ji m Wells County where the baseof the unit is nearest land surface to approximately1,400 feet in far eastern Kleberg and Kenedy Counties.
The Beaumont Clay and Lissie Formation yieldsmall quantities of slightly to moderately saline water toa few shallow wells used mostly for stock needs ineastern Kleberg and Kenedy Counties. On Padre Island,well R R-83-38-301, tapping the Beaumont and Lissie,yielded water containing 6,950 mg/I dissolved solidsfrom a depth of 336 to 347 feet; this water is used forindustrial purposes. Chemical-analyses of water from testwells RR-83-42-402, RR-83-42-403, and RH-83-42-404,drilled for observation purposes 1% milles west ofRiviera, show that in this area the shallow sands of theBeaumont and Lissie usually contain very saline water.
In eastern Kleberg County just west of LagunaMadre, a small shallow supply of slightly saline water inthe Beaumont and Lissie unit occurs directlly below theoutcrop of the Pleistocene barrier island and beachdeposits; well RR-83-30-702, which taps the unit,yielded water having 2,460 mg/I dissolved solids from adepth of 146 feet. The occurrence of this supply is dueto the ability of the sandy overlying barrier island andbeach deposits to readily absorb and store rainfall. In thesoutheastern corner of Kenedy County, just west ofLaguna Madre, electrical logs indicate that fresh toslightly saline water extends from near land surface to adepth of as much as 350 feet. No wells are known to tapthis supply of water, which may extend considerablynorthward. Because of the highly mineralized waterassociated with the Beaumont and Lissie in most placesin the report area, the casings of many wells arecemented through these formations.
Barrier Island and Beach Deposits
The barrier island and beach deposits ofPleistocene age crop out in an area from 4 to 8 mileswide bordering the landward side of Laguna Madre inKleberg County (Figure 4). These deposits, which are
- 17-
analogous in ongln to the present-day barrier islanddeposits forming Padre Island, are part of a chain ofPleistocene barrier island and beach deposits traceablefrom Baffin Bay northeastward into Louisiana. InKleberg County, the deposits form a sl ightly elevatedhummocky area of swales and elongated sand dunes thatare in most places subdued by vegetation. The exact agerelationship of these deposits to the Beaumont Clay isnot clear although both were formed at about the sametime during the late Pleistocene. Price (1933, p. 925),who first recognized the genesis of the barrier deposits,states that they seem to overlie the Beaumont Clay.
The presence of the Pleistocene barrier island andbeach deposits in Kenedy County is not certain becauseof the extensive cover of the south Texas eolian plaindeposits. However, the occurrence of shallow, fresh toslightly saline water in the Beaumont-Lissie unit insoutheastern Kenedy County indicates that the unitpossibly is overlain by very permeable deposits of sandsuch as the barrier island and beach deposits.
The barrier island and beach deposits consistmostly of light gray, massive, crossbedded, fine sandabout 60 feet thick. Some shell fragments are associatedwith the deposit. The assigned thickness of 60 feet isbased on nu merous borings by Johnson (1940) at the"Live Oak" barrier island and beach deposits in AransasCounty, 30 miles northeast of Kleberg County.
The barriE~r island and beach deposits yield smallquantities of fresh to probably moderately saline waterto a few stock wells in the outcrop in eastern KlebergCounty. Well RR-83-38-101, near the western shore ofLaguna Madre, yielded fresh water containing 978 mg/Idissolved solids from a depth of about 40 feet. Althoughthese deposits have a limited distribution, theiroccurrences are important locally in an area where theprincipal aquifer, the Goliad Sand, contains only highlymineralized water.
South Texas Eolian Plain Deposits
In an area of about 2,800 square miles in Kenedy,Brooks, Jim Hogg, Willacy, and Hidalgo Counties, thebedrock surface is almost completely covered bywindblown sediments referred to in this report as thesouth Texas eolian plain deposit. As shown in Figure 4,the deposits lie mostly south of Baffin Bay, Los OlmosCreek, and Falfurrias, and south and southeast ofHebbronville; the southern boundary is a few milesnorth of Raymondville in Willacy County. Part of thesurface of this area is nearly flat, but a large part ischaracterized by sand dunes rising to heights of 50 feetor more above the surrounding plain. The dunes, someof which are migrating and some stabilized byvegetation, are elongated parallel to the direction of theprevailing southeasterly winds.
In Kenedy County the deposits lie mainly on theerosional surface of the Beaumont Clay, although theexact age of the eolian deposits is questionable. Fisk(1959, p. 120) assigns the age as Holocene, and Price(1958, p. 49-50) assigns the age as Holocene to possiblyPleistocene.
The south Texas eolian plain deposits consist oftan to white, unfossiliferous, massive, fine to very finesand, greenish·gray sandy clay, highly calcareous clay,caliche marl, and thin-bedded clayey sand. Maximumthickness of the deposits is not known but is in excess of60 feet in some places.
The eolian deposits yield small quantities ofslightly saline water to a few stock wells in KenedyCounty. Well R0-88-1 0-303 in central Kenedy Countyyielded water having a chloride content of 1,410 mg/Ifrom a depth of 40 feet. Shallow test wells from 19 to24 feet deep which were drilled for observation purposesnear Armstrong, reveal that in this area the eoliandeposits contain brine with chloride concentrations ashigh as 28,000 mg/1. Fresh water is not known to bepresent anywhere in the deposits.
Barrier Island Deposits
The barrier island deposits of Holocene age formPadre Island and include the associated lagoonalsediments. These deposits directly overlie the PleistoceneBeaumont Clay in some places, but in other places,beneath Padre Island and Laguna Madre, overl ie thesouth Texas eolian-plain deposits (Fisk, 1959,p.120-122).
The barrier island deposits consist of tan to gray,fossiliferous, medium sand containing wood fragments,interbedded tan sand, and gray clay that is locallygypseous, and gray fossiliferous sandy clay. Thickness ofthe deposits varies considerably, but the maximumthickness probably does not exceed 50 feet.
Because of the sandy surface of Padre Island,rainfall rapidly infiltrates the aquifer. Thin lenses offresh water accumulate over saline water in the aquifer,particularly in the sand dunes. Consequently, anyfresh-water well that taps the aqu ifer is shallow,penetrates only a few feet of fresh-water sand, and iscapable of yielding only a few gallons of fresh water perminute.
The only wells known to tap the barrier islanddeposits on Padre Island are a few shallow sand-pointwells driven into the dunes.
Alluvium
The alluvium of Holocene age consists mostly ofvery fine to fine sand, silt, and calcareous clay of
-18·
fluviatile and deltaic ongln. Although not everywhereshown on Figure 4, the alluvium usually occurs along thechannels of some of the larger streams in Kleberg andsouthern Jim Wells Counties. A small reentrant ofalluvium occurs in southern Kenedy County (Darton andothers, 1937). The age of part of the alluvial depositsmay be Pleistocene, but for the purpose of this reportthe deposits are considered to be Holocene.
The alluvium is relatively unimportant as anaquifer because in most places where it is exposed, it isthin and not extensive. It is not known to be tapped bywells, but probably is capable of yielding smallquantities of slightly saline water.
GROUND-WATER HYDROLOGY
Source and Occurrence of Ground Water
The source of ground water in Kleberg, Kenedy,and southern Jim Wells Counties is precipitation on theoutcrops of the aquifers in these counties and inadjacent counties to the west and northwest. A largepart of the precipitation either runs off, is dissipated byevapotranspiration, or is stored in the soil untilevaporated or transpired. A small part of the watermigrates downward by gravity to the water table tobecome a part of the ground water in storage.
Generally, water-table conditions (unconfined)prevail at shallow dE~pths in the outcrop areas of theaquifers, and artesian conditions (confin~) prevaildowndip from the outcrop where the aquifers areoverlain by less permeable sediments. Water underartesian pressure will rise in wells above the top of theaquifer. Where the elevation of the land surface at a wellis considerably below the general level of the area ofoutcrop, the pressure may be sufficient to cause thewater to rise above the land surface, and the well willthen flow. Most of the flowing wells in the area coveredby this report are in Kenedy County. The Goliad Sand isthe principal artesian aquifer, whereas water containedin eolain and barrier island deposits is under water-tableconditions.
Movement of Ground Water
The ground water underlying Kleberg, Kenedy,and southern Jim Wells Counties is moving constantly.Normally, the direction of movement is from the areasof recharge in the west or northwest to the areas ofdischarge in the east or southeast; this sequence,however, has been interrupted in some vicinities becauseof large-scale pumping. In the vicinity of Kingsville, andat a few other places where pumping has caused cones ofdepression in the water surface, the water moves towardthe centers of the cones from all directions. Pumpingalso has increased the hydraulic gradient and therefore
the rate of movement of the water, which normallyranges from tens to hundreds of feet per year in thereport area. When not affected by pumping, themovement of ground water is directly responsive to theamount of water reaching the water table. For example,after periods of above-normal precipitation, the watertable or piezometric surface rises in areas of recharge andthe hydraulic gradient steepens; consequently, the rateof movement increases. Figure 8, which shows theapproximate altitude of water levels in wells tapping theGoliad Sand in 1968-69, shows in a general way thedirection of movement of the water. The water moves atright angles to the contours and in the direction ofdecreasing altitude.
Aquifer Tests
Aquifer tests in six wells tapping the Goliad Sandand in one well tapping the Oakville Sandstone weremade to determine the capacity of the sands to transmitand store water. The results of the tests are shown inTable 3. Five of the wells were in Kleberg County andtwo were in southern Jim Wells County. No tests weremade in Kenedy County because suitable wells were notavailable; however, a test was made in wellRR-83-41-803 near the north boundary line of thecounty. All the test data were analyzed by the Theisnonequilibrium method (Theis, 1935) and the Theisrecovery method (Wenzel, 1942, p. 95).
Only about five wells in the report area are knownto produce from the Oakville Sandstone. The Oakville,at a well tested in southern Jim Wells County(PW-84-40-703), had a coefficient of transmissibility of6,000 gpd (gallons per day) per foot. In the Alice area,Mason (1963, p. 22) reports a drawdown test on a wellin the Oakville; this test indicated a coefficient oftransmissibility of 7,100 gpd per foot. These testsindicate that the characteristics of the Oakvil leSandstone probably are fairly constant over aconsiderable area.
In 1947, aquifer tests were made in four City ofKingsville wells tapping the Goliad Sand. Thecoefficients of transmissibility ranged frorn 24,100 to30,500 gpd per foot and the storage coefficientdetermined from each test was 0.0002. The aquiferthickness averages about 150 feet in these wells; thespecific capacities ranged from 9.37 to 14.2 gpm (gallonsper minute) per foot (Myers, 1969, p. 326).
In 1968 an aquifer test was made in wellRR-83-41-803, an irrigation well producing from theGoliad Sand. The coefficient of transmissibilitydetermined from the recovery of the well after pumpingfor 3 hours was 28,600 gpd per foot. The coefficient oftransmissibility determined during the drawdown was34,400. The specific capacity of the well was 17.8 gpmper foot.
The specific capacity, an expression of the yield ofa well in gallons per minute per foot of drawdown, isuseful in estimating the yield of a well at variousdrawdowns. The specific capacities of wells penetratingthe same aquifer may vary widely, depending upon thethickness of sand screened, the degree of welldevelopment, and the rate and duration of pumping.
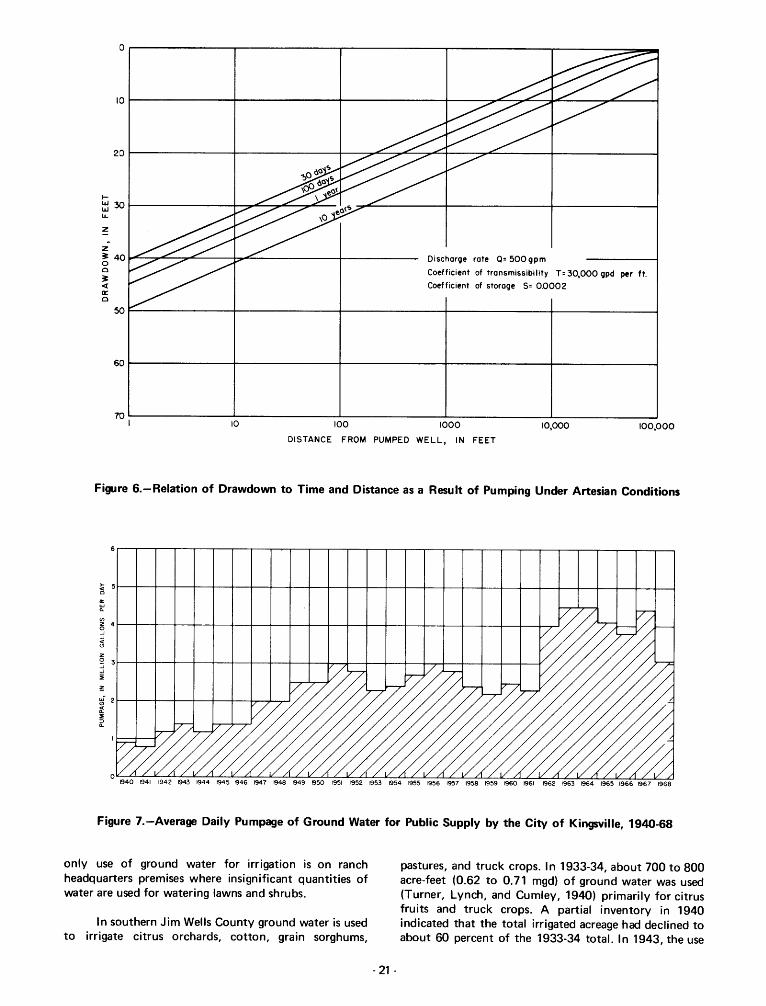
The coefficients of transmissibility and storagedetermined from aquifer tests may be used to predictthe drawdown of water levels caused by pumping a wellor by a general increase of pumping in an area. Figure 6shows the theoretical relation between drawdown ofwater levels, time, and distance from a well pumpingunder artesian conditions. The calculations of drawdownare based on a withdrawal of 500 gpm continuously forvarious periods of time from an infinite aquifer having acoefficient of storage of 0.0002 and a coefficient oftransmissibility of 30,000 gpd per foot. The graphs showthat the drawdown of water level after 1 year ofpumping would be about 18.5 feet at a distance of 1,000feet from the pumped well and about 10 feet at adistance of 10,000 feet.
Most of the drawdown in the well will take placein the first few days of pumping. The water level willcontinue to decline indefinitely but at a decreasing rate.Because drawdown is directly proportional to thepumping rate, the drawdowns for rates other than 500gpm can be determined by multiplying the values inFigure 6 by the proper multiple or fraction of 500. Adifferent set of curves would be required for differentaquifer coefficients.
GROUND-WATER DEVELOPMENT
The well inventory in Kleberg, Kenedy, andsouthern Jim Wells Counties included all the municipal,industrial, and irrigation wells and a large number ofdomestic and livestock wells. The records of 754 wellsare given in Table 7. Nearly all the ground water used inthese counties is withdrawn from wells in the GoliadSand. It supplies all of the water for public supply andirrigation, about 98 percent of the water for industrialuse, and about 95 percent of the water for ruraldomestic and livestock use. Table 4 gives the quantitiesof ground water pumped for different uses from 1955 to1968. During 1968, about 18,000 acre-feet of groundwater was withdrawn for all purposes in the report area.The principal use of ground water in Kleberg County hasgenerally been for public supply; the principal use inKenedy County is for rural-domestic and stock use; andin southern Jim Wells County the principal use is forindustrial supply.
Public Supply
The city of Kingsville in Kleberg County is theprincipal user of ground water for public supply in the
-19
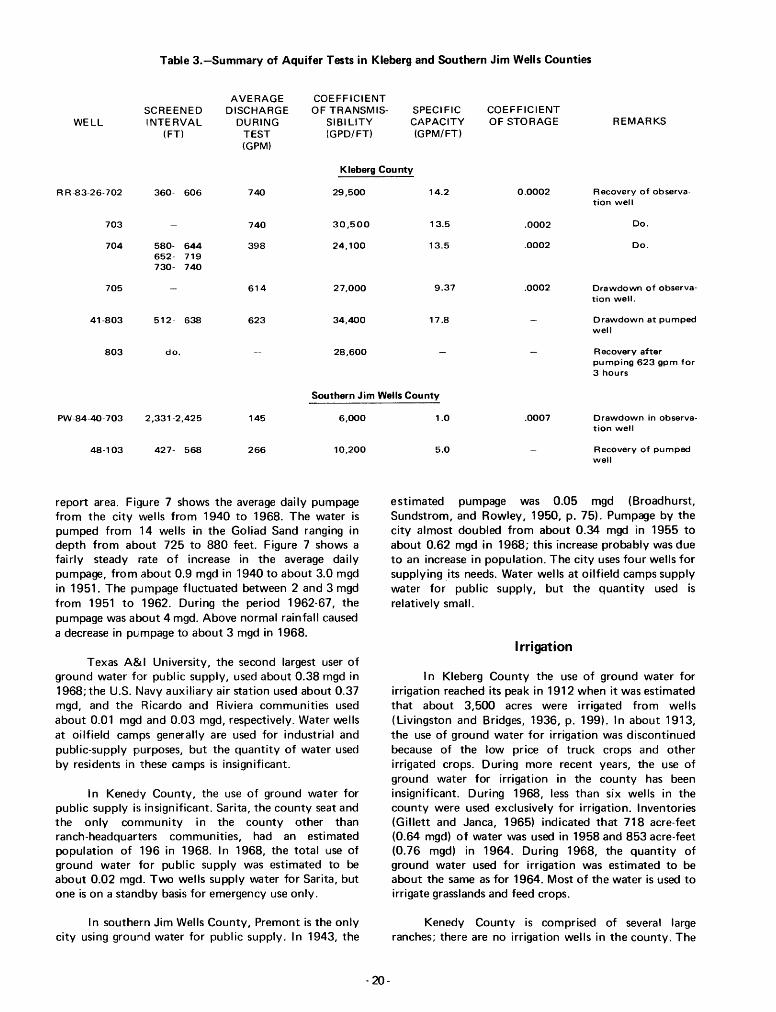
Table 3.-Summary of Aquifer Tests in Kleberg and Southern Jim Wells Counties
AVERAGE COEFFICIENTSCREENED DISCHARGE OF TRANSMIS- SPECIFIC COEFFICIENT
WELL INTERVAL DURING SIBILITY CAPACITY OF STORAGE REMARKS(FT) TEST (GPD/FT) (GPM/FT)
(GPM)
K leberg County
A R-83-26-702 360- 606 740 29,500 14.2 0.0002 Recovery of observa-tion well
703 740 30,500 13.5 .0002 Do.
704 580- 644 398 24,100 13.5 .0002 Do.652- 719730- 740
705 614 27,000 9.37 .0002 Drawdown of observa-tion well.
41-803 512- 638 623 34,400 17.8 Drawdown at pumpedwell
803 do. 28,600 Recovery afterpumping 623 gpm for3 hours
Southern Jim Wells County
PW-84-4O-703 2,331-2,425 145 6,000 1.0 .0007 Drawdown in observa-tion well
48-103 427- 568 266 10,200 5.0 Recovery of pumpedwell
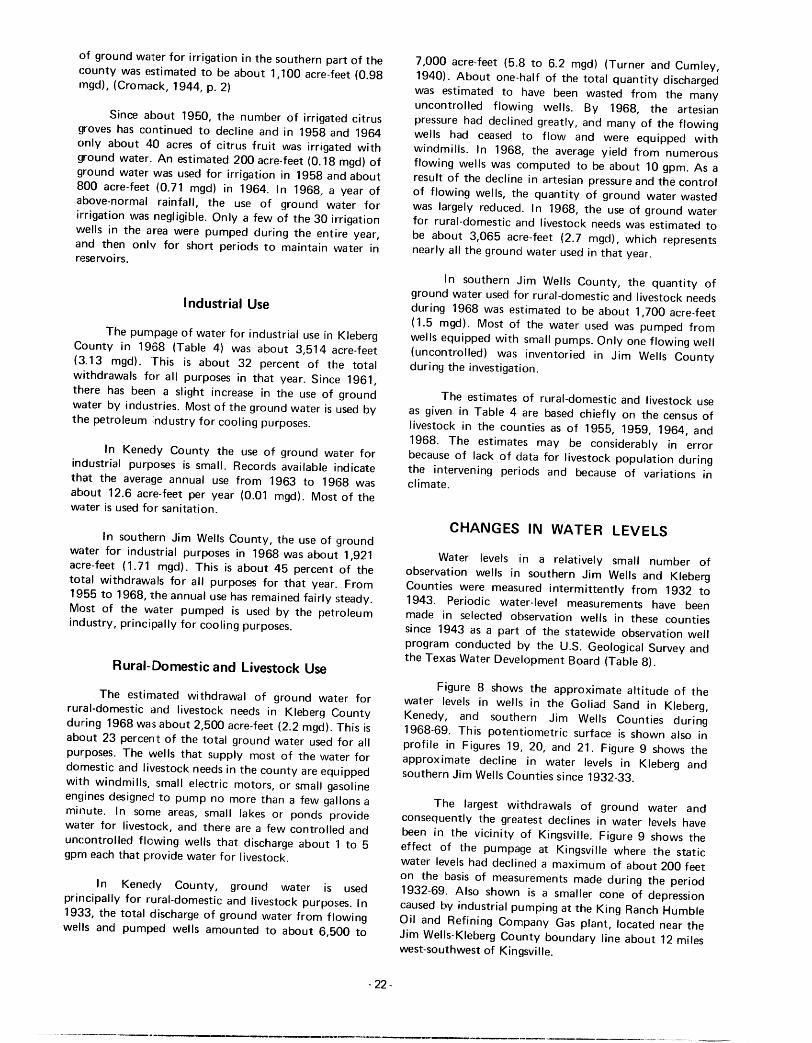
report area. Figure 7 shows the average daily pumpagefrom the city wells from 1940 to 1968. The water ispumped from 14 wells in the Goliad Sand ranging indepth from about 725 to 880 feet. Figure 7 shows afairly steady rate of increase in the average dailypumpage, from about 0.9 mgd in 1940 to about 3.0 mgdin 1951. The pumpage fluctuated between 2 and 3 mgdfrom 1951 to 1962. During the period 1962-67, thepumpage was about 4 mgd. Above normal rainfall causeda decrease in pumpage to about 3 mgd in 1968.
Texas A&I University, the second largest user ofground water for publ ic supply, used about 0.38 rngd in1968; the U.S. Navy auxiliary air station used about 0.37mgd, and the Ricardo and Riviera communities usedabout 0.01 mgd and 0.03 mgd, respectively. Water wellsat oilfield camps generally are used for industrial andpubl ie-supply purposes, but the quantity of water usedby residents in these camps is insignificant.
In Kenedy County, the use of ground water forpublic supply is insignificant. Sarita, the county seat andthe only community in the county other thanranch-headquarters communities, had an estimatedpopulation of 196 in 1968. In 1968, the total use ofground water for public supply was estimated to beabout 0.02 mgd. Two wells supply water for Sarita, butone is on a standby basis for emergency use only.
In southern Jim Wells County, Premont is the onlycity using ground water for publ ic supply. In 1943, the
-20-
estimated pumpage was 0.05 mgd (Broadhurst,Sundstrom, and Rowley, 1950, p. 75). Pumpage by thecity almost doubled from about 0.34 mgd in 1955 toabout 0.62 mgd in 1968; this increase probably was dueto an increase in population. The city uses four wells forsupplying its needs. Water wells at oilfield camps supplywater for public supply, but the quantity used isrelatively small.
Irrigation
In Kleberg County the use of ground water forirrigation reached its peak in 1912 when it was estimatedthat about 3,500 acres were irrigated from wells(Livingston and Bridges, 1936, p. 199). In about 1913,the use of ground water for irrigation was discontinuedbecause of the low price of truck crops and otherirrigated crops. During more recent years, the use ofground water for irrigation in the county has beeninsignificant. During 1968, less than six wells in thecounty were used exclusively for irrigation. Inventories(Gillett and Janca, 1965) indicated that 718 acre-feet(0.64 mgd) of water was used in 1958 and 853 acre-feet(0.76 mgd) in 1964. During 1968, the quantity ofground water used for irrigation was estimated to beabout the same as for 1964. Most of the water is used toirrigate grasslands and feed crops.
Kenedy County is comprised of several largeranches; there are no irrigation wells in the county. The
Or---------,-------,---------,--------r------==~..
Discharge rate Q= 500 gpm
Coefficient of transmissibility T= 30,000 gpd per ft.
Coefficient of storage S= 0.0002
~
z~ 40 .....,:::........,~::......-~::::::....------16__=----------f-----~oo~<ta:o
f~ 30 ~--------lf___::::'II"""____:::~-,.."----
lL.
10 1--------4-------+----------i-----::~~~~:*"~----:~~-____t
20 1--------4--------+--~O::::::""~O::::::""---:7'~--~..::::.----_+------__1
50 ~-------+----------+-------+__------_t_------___i
60 1----------1I-----------4---------+--------+--------i
10 100 1000
DISTANCE FROM PUMPED WELL, IN FEET
10,000 100,000
Figure 6.-Relation of Drawdown to Time and Distance as a Result of Pumping Under Artesian Conditions
~ 51--+-----1---+--+-+--+-+---+-----1I--+--+-+--+-+---+----1I---+-----+-+--+-+--+-I--+-----1-+--+-+---Ioa::
'"n.
~ 41---1----4---+--+--1----+.-l---I---l---+--+--1--+-l---I---l--+----4-+--+--+-4-...,....Jj~
zoji
tl 2 ~_+_--1-_+_--+-+_--+--I_t_....,L-.....--
~
~
Figure 7.-Average Daily Pumpage of Ground Water for Public Supply by the City of Kingsville, 1940-68
only use of ground water for irrigation is on ranchheadquarters premises where insignificant quantities ofwater are used for watering lawns and shrubs.
In southern Jim Wells County ground water is usedto irrigate citrus orchards, cotton, grain sorghums,
pastures, and truck crops. In 1933-34, about 700 to 800acre-feet (0.62 to 0.71 mgd) of ground water was used(Turner, Lynch, and Cumley, 1940) primarily for citrusfruits and truck crops. A partial inventory in 1940indicated that the total irrigated acreage had declined toabout 60 percent of the 1933-34 total. In 1943, the use
- 21 -
of ground water for irrigation in the southern part of thecounty was estimated to be about 1,100 acre-fE~et (0.98mgd), (Cromack, 1944, p. 2)
Since about 1950, the number of irrigatE~d citrusgroves has continued to decline and in 1958 and 1964only about 40 acres of citrus fruit was irrigated withground water. An estimated 200 acre-feet (0.18 mgd) ofground water was used for irrigation in 1958 and about800 acre-feet (0.71 mgd) in 1964. In 1968, a year ofabove-normal rainfall, the use of ground water forirrigation was negligible. Only a few of the 30 irrigationwells in the area were pumped during the entire year,and then only for short periods to maintain water inreservoirs.
Industrial Use
The pumpage of water for industrial use in KlebergCounty in 1968 (Table 4) was about 3,514 acre-feet(3.13 mgd). This is about 32 percent of the totalwithdrawals for all purposes in that year. Since 1961,there has been a slight increase in the use of groundwater by industries. Most of the ground water is used bythe petroleum industry for cooling purposes.
In Kenedy County the use of ground water forindustrial purposes is small. Records available indicatethat the average annual use from 1963 to 1968 wasabout 12.6 acre-feet per year (0.01 mgd). Most of thewater is used for sanitation.
In southern Jim Wells County, the use of groundwater for industrial purposes in 1968 was about 1,921acre-feet (1.71 mgd). This is about 45 percent of thetotal withdrawals for all purposes for that year. From1955 to 1968, the annual use has remained fairly steady.Most of the water pumped is used by the petroleumindustry, principally for cooling purposes.
Rural-Domestic and Livestock Use
The estimated withdrawal of ground water forrural-domestic and livestock needs in Kleberg Countyduring 1968 was about 2,500 acre-feet (2.2 mgd). This isabout 23 percent of the total ground water used for allpurposes. The wells that supply most of the water fordomestic and livestock needs in the county are equippedwith windmills, small electric motors, or small gasolineen~lines designed to pump no more than a few gallons aminute. In some areas, small lakes or ponds providewater for livestock, and there are a few controlled anduncontrolled flowing wells that discharge about '1 to 5gpm each that provide water for livestock.
In Kenedy County, ground water is usedprincipally for rural-domestic and livestock purposes. In1933, the total discharge of ground water from flowingwells and pumped wells amounted to about 6,500 to
- 22-
7,000 acre-feet (5.8 to 6.2 mgd) (Turner and Cumley,1940). About one-half of the total quantity dischargedwas estimated to have been wasted from the manyuncontrolled flowing wells. By 1968, the artesianpressure had declined greatly, and many of the flowingwells had ceased to flow and were equipped withwindmills. In 1968, the average yield from numerousflowing wells was computed to be about 10 gpm. As aresult of the decline in artesian pressure and the controlof flowing wells, the quantity of ground water wastedwas largely reduced. In 1968, the use of ground waterfor rural-domestic and livestock needs was estimated tobe about 3,065 acre-feet (2.7 mgd), which representsnearly all the ground water used in that year.
In southern Jim Wells County, the quantity ofground water used for rural-domestic and livestock needsduring 1968 was estimated to be about 1,700 acre-feet(1.5 mgd). Most of the water used was pumped fromwells equipped with small pumps. Only one flowing well(uncontrolled) was inventoried in Jim Wells Countyduring the investigation.
The estimates of rural-domestic and livestock useas given in Table 4 are based chiefly on the census oflivestock in the counties as of 1955, 1959, 1964, and1968. The estimates may be considerably in errorbecause of lack of data for Iivestock population duringthe intervening periods and because of variations inclimate.
CHANGES IN WATER LEVELS
Water levels in a relatively small number ofobservation wells in southern Jim Wells and KlebergCounties were measured intermittently from 1932 to1943. Periodic water-level measurements have beenmade in selected observation wells in these countiessince 1943 as a part of the statewide observation wellprogram conducted by the U.S. Geological Survey andthe Texas Water Development Board (Table 8).
Figure 8 shows the approximate altitude of thewater levels in wells in the Goliad Sand in Kleberg,Kenedy, and southern Jim Wells Counties during1968-69. Th is potentiometric surface is shown also inprofile in Figures 19, 20, and 21. Figure 9 shows theapproximate decline in water levels in Kleberg andsouthern Jim Wells Counties since 1932-33.
The largest withdrawals of ground water andconsequently the greatest declines in water levels havebeen in the vicinity of Kingsville. Figure 9 shows theeffect of the pumpage at Kingsville where the staticwater levels had declined a maximum of about 200 feeton the basis of measurements made during the period1932-69. Also shown is a smaller cone of depressioncaused by industrial pumping at the King Ranch HumbleOil and Refining Company Gas plant, located near theJim Wells-Kleberg County boundary line about 12 mileswest-southwest of Kingsville.
- -.,_.._----------------------_..._----------"'--------_.-,---.•_---~_._-_. __..._-
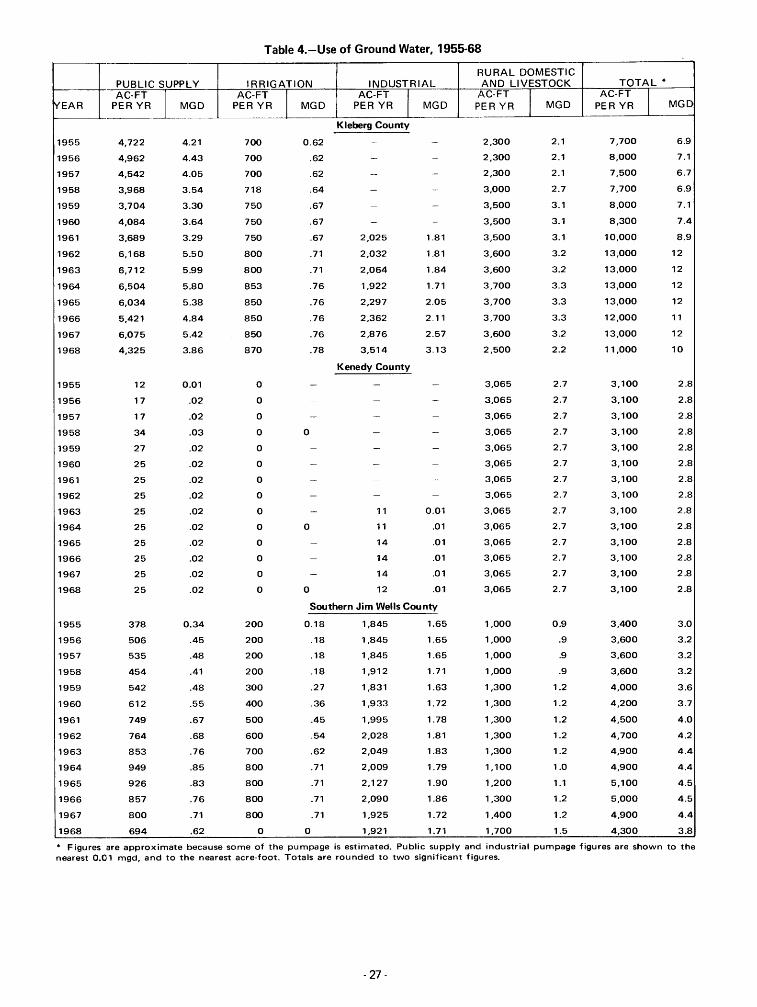
Table 4.-Use of Ground Water, 1955-68
I~URAL DOMESTIC
- PUBLIC SUPPLY IRRIGATION INDUSTRIAL AND LIVESTOCK TOTAL *AC-FT
IAC-FT~ AC-FT
IAC-FT
IAC-FT
I~EAR PER YR MGD PER YR MGD PER YR MGD PER YR MGD PER YR MGD-- --'--
Kleberg County
1955 4,722 4.21 700 0.62 - - 2,300 2.1 7,700 6.9
1956 4,962 4.43 700 .62 - - 2,300 2.1 8,000 7.1
1957 4,542 4.05 700 .62 - - 2,300 2.1 7,500 6.7
1958 3,968 3.54 718 .64 - - 3,000 2.7 7,700 6.9
1959 3,704 3.30 750 .67 - - 3,500 3.1 8,000 7.1
1960 4,084 3.64 750 .67 - - 3,500 3.1 8,300 7.4
1961 3,689 3.29 750 .67 2,025 1.81 3,500 3.1 10,000 8.9
1962 6,168 5.50 800 .71 2,032 1.81 3,600 3.2 13,000 12
1963 6,712 5.99 800 .71 2,064 1.84 3,600 3.2 13,000 12
1964 6,504 5.80 853 .76 1,922 1.71 3,700 3.3 13,000 12
1965 6,034 5.38 850 .76 2,297 2.05 3,700 3.3 13,000 12
1966 5,421 4.84 850 .76 2,362 2.11 3,700 3.3 12,000 11
1967 6,075 5.42 850 .76 2,876 2.57 3,600 3.2 13,000 12
1968 4,325 3.86 870 .78 3,514 3.13 2,500 2.2 11,000 10
Kenedy County
1955 12 0.01 0 - _. - 3,065 2.7 3,100 2.8
1956 17 .02 0 - _. - 3,065 2.7 3,100 2.8
1957 17 .02 0 - _. _. 3,065 2.7 3,100 2.8
1958 34 .03 0 0 - - 3,065 2.7 3,100 2.8
1959 27 .02 0 - _. - 3,065 2.7 3,100 2.8
1960 25 .02 0 - - - 3,065 2.7 3,100 2.8
1961 25 .02 0 - _. - 3,065 2.7 3,100 2.8
1962 25 .02 0 - - _. 3,065 2.7 3,100 2.8
1963 25 .02 0 - 11 0.01 3,065 2.7 3,100 2.8
1964 25 .02 0 0 11 .01 3,065 2.7 3,100 2.8
1965 25 .02 0 - 14 .01 3,065 2.7 3,100 2.8
1966 25 .02 0 - 14 .01 3,065 2.7 3,100 2.8
1967 25 .02 0 - 14 .01 3,065 2.7 3,100 2.8
1968 25 .02 0 0 12 .01 3,065 2.7 3,100 2.8
Southern Jim Wells County
1955 378 0.34 200 0.18 1,845 1.65 1,000 0.9 3,400 3.0
1956 506 .45 200 .18 1,845 1.65 1,000 .9 3,600 3.2
1957 535 .48 200 .18 1,845 1.65 1,000 .9 3,600 3.2
1958 454 .41 200 .18 1,912 1.71 1,000 .9 3,600 3.2
1959 542 .48 300 .27 1,831 1.63 1,300 1.2 4,000 3.6
1960 612 .55 400 .36 1,933 1.72 1,300 1.2 4,200 3.7
1961 749 .67 500 .45 1,995 1.78 1,300 1.2 4,500 4.0
1962 764 .68 600 .54 2,028 1.81 1,300 1.2 4,700 4.2
1963 853 .76 700 .62 2,049 1.83 1,300 1.2 4,900 4.4
1964 949 .85 800 .71 2,009 1.79 1,100 1.0 4,900 4.4
1965 926 .83 800 .71 2,127 1.90 1,200 1.1 5,100 4.5
1966 857 .76 800 .71 2,090 1.86 1,300 1.2 5,000 4.5
1967 800 .71 800 .71 1,925 1.72 1,400 1.2 4,900 4.4
1968 694 .62 0 0 1,921 1.71 1,700 1.5 4,300 3.8
* Figures are approximate because some of the pumpage is estimated. Public supply and industrial pumpage figures are shown to thenearest 0.01 mgd, and to the nearest acre-foot. Totals are rounded to two significant figures.
- 27-
In an area in southern Jim Wells County where theMobil Oil Corp. La Gloria plant uses water for industrialpurposes, the water levels in wells in the Goliad Sandhave declined at least 123 feet. Part of the decline maybe related to pumpage by the city of Falfurrias inBrooks County. Figure 9 shows a fairly well definedtrough-like pattern in central southern Jim Wells Countythat extends northward through Premont. This area ofwater-level decline shows the effect of industrial andmunicipal pumpage in the vicinity of Premont.
Figure 10 shows the fluctuations in water levels insix wells in the Goliad Sand during the 1932-69 period.Well PW-84-47-;G01 is in southern Jim Wells County; therest are in various parts of Kleberg County. All areobservation wells that were measured intermittentlyfrom 1932 or 1933 to 1943, and periodically after 1943.The hydrographs show that water levels declined slowlyduring the 1930's and more rapidly thereafter.
Historical records of water levels in wells in theGoliad Sand in Kenedy County are not available. Waterlevels in many nonflowing wells and the artesian pressurein a few flowing wells were measured. Some of the wellswill probably be used as observation wells in the future.
Many wells in Kenedy County that formerlyflowed had ceased to flow prior to 1968; most of themare now equipped with windmills. Water levels in thewells ranged from 0.0 to about 50 feet below the landsurface in 1968-69. It is evident from the decreasedyields of most flowing wells and the depths to water innumerous wells that formerly flowed that the waterlevels of wells that tap the Goliad Sand have declinedsubstantially.
Water-level records of wells that tap the OakvilleSandstone in the report area are not available; however,Mason (1963, p. 33) states that the water level in anOakville well used by the Magnolia Petroleum Co. (MobilOil Corp.) in southern Jim Wells County declined about405 feet betwee n 1947 and 1960.
Records for a few shallow wells that tap the southTexas eolian plain deposits indicate that the changes inwater levels in these wells were insignificant from 1933to 1969. The changes ranged from a decline of 0.9 footin well RD-88-19-602 to a rise of 1.7 feet in wellRD-88-Q3-501.
CONSTRUCTION OF WELLS
The methods of well construction used in Kleberg,Kenedy, and southern Jim Wells Counties have beenchanged significantly since about 1930. According toLivingston and 8,ridges (1936, p. 216), some of the wellsin existence in Kleberg County during 1932-33 were"defective wells" largely as a result of improperconstruction. Some of these wells were completed withiron casing placed in direct contact with shallow saline
-28-
water which is hi~lhly corrosive. The shallow saline watercorroded the casirlg, entered the wells, and contaminatedthe usable water. Furthermore, many of the well casingshad slots that WNe too large;. thus perm itting sand toenter the wells. This resulted in unnecessary wear on thepumps and also rE,duced the well yields. Many such wellsare now abandon:!d, unused, or have been replaced bynew wells.
New wells are being drilled or "worked over" at afairly steady rate in Kleberg, Kenedy, and southern JimWells Counties; and proper well construction isbecoming increasingly important because the life of awell depends almost entirely upon the manner in whichit is constructed. Generally, the intended use of a welldetermines to a large extent how it is to be constructed.
In Kleberg, Kenedy, and southern Jim WellsCounties, some of the large-capacity wells used formunicipal and industrial supplies are equipped with asingle string of large-diameter (12- to 24-inch) surfacecasing cemented through the Beaumont Clay and LissieFormation which contain saline water. The well bore isunderreamed throughout the Goliad Sand section, fromthe base of the surface casing to the total depth, and aperforated liner 6 to 12 inches in diameter is installedand gravel-packed. Gravel-packing increases the effectivediameter of the well, aids in preventing sand fromentering the well, and protects the casing from caving ofthe surrounding formations.
The irriga1 ion wells, some of which areunderreamed and gravel-packed, are generally designedto pump large quantities of water. In many wells,large-diameter casing (12-24 inches) is set in the upperparts of the wells, and 6- or 8-inch casing is set in thelower parts. In most irrigation wells, slotted casing isinstalled opposite the water-bearing sands, but a fewwells are equipped with screens. Little effort usually ismade to correlate the width of the slots with thediameter of the sand particles. If the slots are too large,sand enters freely, resulting in wear of the pumps andcasing. If the slots are too small, or too few, excessivelosses in head may result, and the specific capacities ofthe wells will be excessively low. .
Most of the modern rural-domestic and livestockwells are completed with about 20 to 40 feet ofsmall-diameter (4- ':0 6-inch) torch-slotted or mill-slottedcasing with some having stainless steel screen near thebottom. Some are straight-walled wells cased from topto bottom; other:; are cased and cemented throughsalt-water-bearing sands to the top of the Goliad Sand.Relatively few are underreamed and gravel-packed. Thecasings used in domestic and livestock wells are made ofplastic, wrought iron, cast iron, or galvanized iron. Tofurther resist corrosion, a heavier metal casing issometimes used.
Some oil or ~Ias test wells that have been properlyplugged are later converted into water wells for various
QUALITY OF GROUND WATER
Suitability of Water for Use
uses. The well construction is based on an examinationof the well logs. The most productive water-bearingsands are selected and the well casing is "shot" orgun-perforated opposite these sands, allowing the waterto enter the well.
The dissolved solids or "total salts" content is amajor limitation on the use of water for many purposes.The classification of water based on the dissolved-solidscontent in mg/I as used in this report is as follows(Winslow and Kister, 1956, p. 5):
CONCENTRATIONSUBSTANCE MG/L
Chloride (CI) 250
Fluoride (F) .8 •
Ir.on (Fe) .3
Manganese (Mn) .05
Nitrate (N03) 45
Sulfate (504) 250
Dissolved solids 500
• The permissible concentration of fluoride is based upon theannual average of maximum daily temperature of 84.7 of (29°C)measured at Kingsville over a 12-year period. The minimumdesirable concentration is 0.6 mg/1.
Public Supply
The U.S. Public Health Service has established andperiodically revises the standards for drinking water usedon common carriers engaged in interstate commerce.The standards are designed to protect the public and areused to evaluate public water supplies. According to thestandards, chemical substances should not be present ina water supply in excess of the Iisted concentrationswhenever more suitable supplies are available or can bemade available at reasonable cost. The principalchemical standards adopted by the U.S. Public HealthService (1962, p. 7-8) are as follows:
All the ground water presently used for publicsupplies in the report area is obtained from wells in theGoliad Sand. Normally, most of the water from thesepublic-supply wells meets the standards set by the U.S.Public Health Service, but some of the water has becomecontaminated by saline water from sands that overlie theGoliad Sand. Corrosion of casings by the saline water hascaused leaks; as a result, a fairly large number of wellshave been plugged and abandoned, or replaced.Generally, the older public-supply wells have given themost trouble. If these wells are not pumped for severaldays, saline inflow causes increases in the concentrationsof chlorides and dissolved solids in the water. However,after the contaminated water is pumped from the wells,the concentrations of chloride and dissolved solidsapproach the ranges that were present beforecontamination. Thus, maintaining the chloride anddissolved-solids contents of the water within suitableranges is one of the major water-supply problems.
Water used for public supply should not containexcessive amounts of harmful chemical substances;should be free of turbidity, odor, and color to the extentthat it is not objectionable to the user; and must not beexcessively corrosive to the water-supply system.
Less than 1,000
3,000 to 10,000
1,000 to 3,000
10,000 to 35,000
DISSOLVED-SOLIDSCONTENT (MG/U
Very saline
DESCRIPTION
Fresh
Moderately saline
Slightly saline
The suitability of a water supply depends upon thechemical quality of the water and the limitationsassociated with the contemplated use of the water.Various requirements have been established for mostcategories of water quality-including bacterial content;physical characteristics such as turbidity, color, odor,and temperature; chemical substances; and radioactivity.Usually, the problems of bacteria and physicalcharacteristics can be remedied economically, but theremoval or neutralization of undesirable chemicalconstituents may be difficult and expensive.
The chemical constituents in the ground water inKleberg, Kenedy, and southern Jim Wells Counties arederived principally from the materials in the soil androcks through which the water has moved. Thedifferences in the chemical quality of the water reflect,in a general way, the types of soil and rocks that havebeen in contact with the water and the length of time incontact. Usually, as the water moves deeper, its chemicalcontent increases. The source and significance of thedis solved-mineral constituents of the water aresummarized in Table 5, which is modified from Doll andothers (1963, p. 39-43). The chemical analyses of waterfrom 228 selected wells in Kleberg, Kenedy, andsouthern .Jim Wells Counties are given in Table 10. Thewells from which samples were taken are identified inFigure 18 by bars over the well numbers. Figure 11shows the variation in chemical content of the waterthroughout the report area.
Brine More than 35,000 The chloride content of 234 water samples fromwells in the Goliad Sand in the report area ranged from
- 31 -
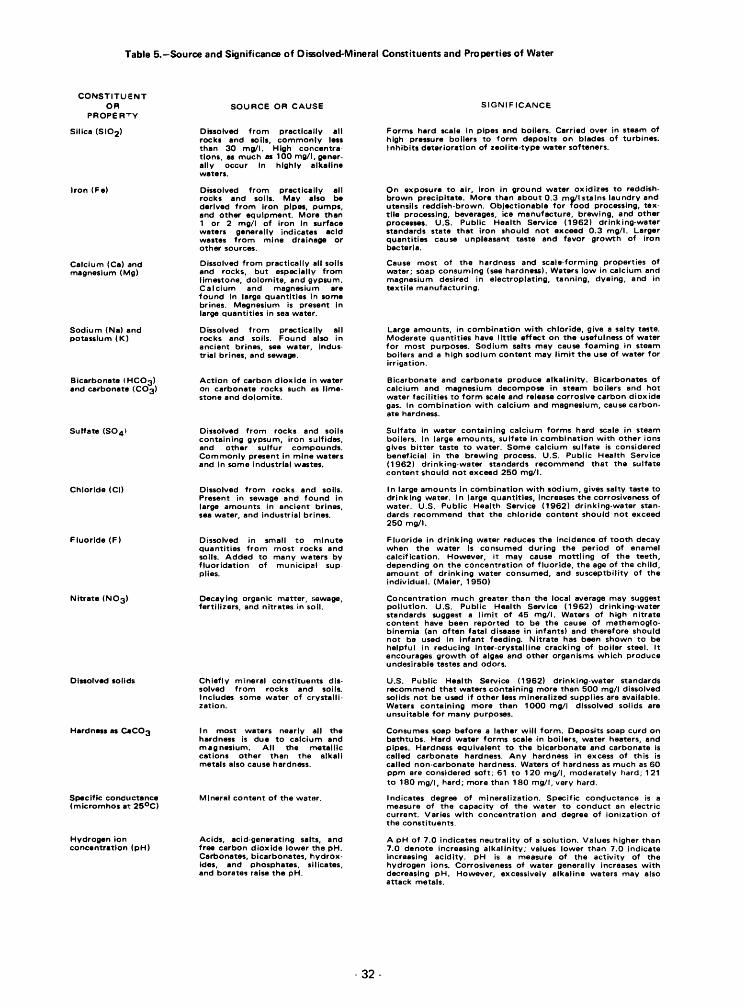
Table 5.-Source and Significance of Dissolved-Mineral Constituents and Properties of Water
CONSTITUENTOR
PROPE R'TY
Silica (SI02)
Iron (Fe)
Calcium (Ca) andmagnesium (Mg)
Sodium (Na) andpotassium (K)
Bicarbonate (HC03)and carbonate (C03)
Su Ifate (SO 41
Chloride (CIl
Fluoride (F)
Dissolved solids
Hardness as Cac03
Specific conductance(micromhos at 250 C)
Hydrogen ionconcentration (pH)
SOURCE OR CAUSE
Dissolved from practically allrocks and solis, commonly lessthan 30 mgtl. High concentrations, as much as 100 mgtl, generally occur In highly alkalinewaters.
Dissolved from practically allrocks and solis. May also bederived from Iron pipes, pumps,and other equipment. More than1 or 2 mg/I of Iron In surfacewaters generally indicates acidwastes from mine drainage orother sources.
Dissolved from practically ,all solisand rocks, but especially fromlimestone, dolomite, and gypsum.Calcium and magnesium arefound in large quantities In somebrines. Magnesium is present inlarge quantities in sea water.
Dissolved from practically allrocks and soils. Found also inancient brines, sea water, industrial brines, and sewage.
Action of carbon dioxide in wateron carbonate rocks such as limestone and dolomite.
Dissolved from rocks and soilscontaining gypsum, iron sulfides,and other sulfur compounds.Commonly present in mine watersand in some industrial wastes.
Dissolved from rocks and solis.Present in sewage and found Inlarge amounts in ancient brines,sea water, and industrial brines.
Dissolved in small to minutequantities from most rocks andsoils. Added to many waters byfluoridation of municipal supplies.
Decaying organic matter, sewage,fertilizers, and nitrates in soli.
Chiefly mineral constituents dissolved from rocks and solis.Includes some water of crystallization.
In most waters nearly all thehardness is due to calcium andmagnesium. All the metalliccations other than the alkalimetals also cause hardness.
Minerai content of the water.
Acids, acid-generating salts, andfree carbOn dioxide lower the pH.Carbonates, bicarbonates, hydroxides, and phosphates, silicates,and borates raise the pH.
- 32-
SIGNIF ICANCE
Forms hard scale In pipes and boilers. Carried over in steam ofhigh pressure boilers to form deposits on blades of turbines.Inhibits deterioration of zeolite-type water softeners.
On exposure to air, Iron in ground water oxidizes to reddishbrown precipitate. More than about 0.3 mwl stains laundry andutensils reddish-brown. Objectionable for food processing, textile processing, beverages, ice manufacture, brewing, and otherprocesses. U.S. Public Health Service (1962) drinking-waterstandards state that iron should not exceed 0.3 mg/I. Largerquantities cause unpleasant taste and favor growth of ironbacteria.
Cause most of the hardness and scale-forming properties ofwater; soap consuming (see hardnessl. Waters low in calcium andmagnesium desired in electroplating, tanning, dyeing, and intextile manufacturing.
Large amounts, in combination with chloride, give a salty taste.Moderate quantities have little effect on the usefulness of waterfor most purposes. Sodium salts may cause foaming in steamboilers and a high sodium content may limit the use of water forirrigation.
Bicarbonate and carbonate produce alkalinity. Bicarbonates ofcalcium and magnesium decompose in steam boilers and hotwater facilities to form scale and release corrosive carbon dioxidegas. In combination with calcium and magnesium, cause carbonate hardness.
Sulfate in water containing calcium forms hard scale in steamboilers. In large amounts, sulfate In combination with other ionsgives bitter taste to water. Some calcium sulfate is consideredbeneficial in the brewing process. U.S. Public Health Service(1962) drinking-water standards recommend that the sulfatecontent should not exceed 250 mgtl.
In large amounts in combination with sodium, gives salty taste todrinking water. In large quantities, Increases the corrosiveness ofwater. U.S. Public Health Service (1962) drinking-water standards recommend that the chloride content should not exceed250 mgtl.
Fluoride in drinking water reduces the incidence of tooth decaywhen the water Is consumed during the period of enamelcalcification. However, it may cause mottling of the teeth,depending on the concentration of fluoride, the age of the child,amount of drinking water consumed, and susceptbility of theindividual. (Maier, 1950)
Concentration much greater than the local average may suggestpollution. U.S. Public Health Service (1962) drinking-waterstandards suggest a limit of 45 mgtl. Waters of high nitratecontent have been reported to be the cause of methemoglobinemia (an often fatal disease in infants) and therefore shouldnot be used In infant feeding. Nitrate has been shown to behelpful in reducing inter-crystalline cracking of boiler steel. Itencourages growth of algae and other organisms which produceundesirable tastes and odors.
U.S. Public Health Service (1962) drinking-water standardsrecommend that waters containing more than 500 mg/I dissolvedsolids not be used if other less mineralized supplies are available.Waters containing more than 1000 mgtl dissolved solids areunsuitable for many purposes.
Consumes soap before a lather will form. Deposits soap curd onbathtubs. Hard water forms scale in boilers, water heaters, andpipes. Hardness equivalent to the bicarbonate and carbonate iscalled carbonate hardness. Any hardness in excess of this iscalled non-carbonate hardness. Waters of hardness as much as 60ppm are considered soft; 61 to 120 mg/I, moderately hard; 121to 180 mg/I, hard; more than 180 mgtl, very hard.
Indicates degree of mineralization. Specific conc;luctance is ameasure of the capacity of the water to conduct an electriccurrent. Varies with concentration and degree of ionization ofthe constituents.
A pH of 7.0 indicates neutrality of a solution. Values higher than7.0 denote increasing alkalinity; values lower than 7.0 indicateincreasing acidity. pH is a measure of the activity of thehydrogen ions. Corrosiveness of water generally increases withdecreasing pH. However, excessively alkaline waters may alsoattack metals.
94 to P 100 mg/I, exceed ing 2bO mg/I in 149 sam pies.Figure 11 shows no distinct pattern of distribution ofthe chloride content in wells that tap the Goliad Sand;however, the lower concentrations genelally are in waterfrom the shallower wells. The higher chloride contentsare in water from deeper wells in the eastern part of thereport area. The unusually high chloride content of someof the water in the Goliad Sand possiblV was derivedfrom ovt~rlying saline water bV the way of leaky casings.The chloride concentration in water from wells informations or units younger than the Goliad Sandranged from 185 mg/I to 27,500 mg/1. Water thatcontained the highest chloride concentration was fromwells that tapped the south Texas eolian plain deposits.Samples from three wells tapping the Oakvi lie Sandstonehad chloride concentrations ranging from 370 mg/I to560 mg;'l.
Fluoride in drinking water reduces the incidenceof toot 1-1 decay when the water is used by childrenduring the period of enamel calcification. Dependingupon the age of the child, the amount of drinking waterconsumed, and the susceptibility of the individual,excessive concentrations of fluoride may cause mottlingof the teeth (Maier, 1950, p.1120-1132). The optimumfluoride level for a given area depends upon climaticconditions because the amount of drinking waterconsumed is influenced by the air temperature. Based onthe annual average of the maximum dailv temperature atKingsville of 94.7°F (29°C) over a 12-year period, theoptimum fluoride content recommended for drinkingwater in the report area is 0.7 mg/I; the maximumrecomml~nded limit is 0.8 mg/1. Concentrations greaterthan 1.4 mg/I (twice the opti mum) constitute groundsfor rejection of a public water supply by the PublicHealth Service. The fluoride content of 174 watersamples ranged from 0.1 to 5.0 mg/I, exceeding 0.8 mg/Iin 58 samples. In 32 samples (26 of which were from theGol iad Sand), the concentration exceeded '1.4 mg/1. Themaximum fluoride concentration measured was 5.0 inthe water from well PW-84-40-l03, which produces fromthe Oakville Sandstone. The fluoride content of 166samples from the Goliad Sand ranged from 0.1 mg/I to4.6 mg/I. In 17 percent of the samples the fluoridecontent was below the desirable concentration of 0.6mg/1.
Iron in excess of about 0.3 mg/I gives water anobjectionable taste. Water containing iron in excess of0.3 mg/I and manganese in excess of 0.05 mg/I maycause reddish-brown or dark-gray stair:s on laundry,utensils, and plumbing fixtures. The total iron content inwater from 90 samples in the Goliad Sand ranged from.01 to 2.6 mg/I, exceeding 0.3 I11g/1 in 42 samples. Twosamples from wells that tap the Beaumont Clay andLissie Formations, undifferentiated, contained 666 mg/Iand 214 mg/I of iron. The water was also very saline andhad a low pH. The low pH and the high ironconcentrations probably resulted from corrosion of thecasings. The concentration of manganese in the groundwater in the report area is generally ne~lligible and wasless than 0.05 mg/I in the wells tested.
-35-
Water having a nitrate content in excess of 45 mg/Iis potentially dangerous to infants because it has beenrelated to infant cyanosis or "blue baby" disease(Maxcy, 1950, p. 271), and the presence of nitrate mayindicate contamination by sewage (Lohr and Love,1954, p. 10), decaying organic matter, fertilizers, ornitrates in the soil. In no samples from the report areawere the concentrations of nitrate in excess of 45 mg/1.Water from wells RR-83-25-203 and RR-84-32-503tapping the Goliad Sand had the maximum of 26 mg/Ieach.
Water containing more than 250 mg/I of sulfatemay produce a laxative effect. The sulfate content of217 water samples from the Goliad Sand ranged from 26to 4,630 mg/1.
In southern Jim Wells County, the sulfate contentexceeded 250 mg/I in only one of the 37 Goliad samplestested (water from well PW-84-39-803 contained 269mg/I). The two Goliad samples from public supply wellshad sulfate contents less than 250 mg/1. When sampledin 1968, two wells producing from the OakvilleSandstone, we IIs PW-84-40-703 and PW-84-47-810, hadsulfate contents of 742 mg/I and 732 mg/I respectively.The sample from well PW-84-48-116, which producesfrom the Beaumont Clay and Lissie Formation,undifferentiated, had a sulfate content of 630 mg/1. Thewell yields moderately saline water from a depth of 273feet.
In Kleberg County, the sulfate content of waterfrom wells in the Goliad Sand is more of a problem,especially in the deeper wells in the eastern part of thecounty. Thirty-three of 99 samples tested had sulfatecontents that exceeded 250 mg/1. Five of the samplesfrom wells with depths ranging from about 800 to 1,500feet had sulfate contents in excess of 1,000 mg/1. Waterfrom five city of Kingsville wells have had at one time oranother, sulfate contents more than 250 mg/1. Figure 11indicates an increase in the sulfate content in water fromwells eastward toward the Gulf.
The sulfate content in water from five wells in theBeaumont Clay and Lissie Formation, undifferentiated,in Kleberg County, ranged from 78 mg/I in wellRR-83-30-702 to 1,290 mg/I in well RR-84-40-503.Three test wells in the Beaumont Clay-Lissie Formation,with depths ranging from 31 to 52 feet, had sulfatecontents ranging from 412 mg/I in May 1968 to 4,540mg/I in June 1969; the water was slightly to very saline.Water from wells RR-83-38-101 and RR-83-38-401,which tap the barrier island and beach deposits, hadsulfate contents of 53 mg/I and 72 mg/I, respectively.
In KenedI{ County, about one-half of the watersamples from wells in the Goliad Sand had sulfatecontents in excess of 250 mg/1. No distinct pattern ofdistribution of the sulfate is evident from Figure 11, butgenerally, water from the wells in the 1,000 to 1,500foot depth range had the highest sulfate content. WellRD-88-18-502, drilled as an oil test and completed as a
water vvell, produces from the Oakville Sandstone at adepth of about 2,150 feet. A water sample from thisvvell contained 6,020 mg/I of sulfate.
A few shallow wells tap the south Texaseolian-plain deposits in Kenedy County; the depositssupply water for livestock, but at some places the wateris salty. The sulfate content of water from three shallowtest wells tapping the south Texas eolian plain depositsat depths of 19 to 24 feet ranged from 4,720 to 9,560rng/1. Well RD-88-20-407, which supplies water forlivestock, had a sulfate content of 156 mg/1.
Water having a dissolved-sol ids content in excess of500 mg/I is not recommended for public supply if otherless mineralized supplies are available or can be madeavailable at reasonable cost. Water having less than 500mg/I dissolved solids is not always available, and it isrecognized that supplies having a dissolved-solids contentin excess of the recommended limits are used in manyplaces without any obvious adverse effects. Usually,water containing more than 1,000 mg/I dissolved solidsis unsuitable for many purposes. In the report area thedissolved-solids contents of 213 water samples testedranged from 601 to 49,900 mg/1. The dissolved solidsexceeded 1,000 mg/I in 143 samples and 3,000 mg/I in19 samples. Generally, water having the best quality formost purposes occurs in the northwestern and centralparts of the report area at depths less than 1,000 feet,however, some of the fresh-water-bearing sands in theseareas are overlain by sands that contain highly salinewater.
The hardness of water caused principally bycalcium and magnesium is important in a public watersupply because excessive hardness increases soapconsumption and causes formation of scale in hot waterheaters and water pipes. No limits for hardness havebeen established by the U.S. Public Health Service, andwater used for ordinary household purposes does notbecome particularly objectionable until it reaches thelevel of 100 mg/I or so (Hem, 1959, p. 147). Acommonly accepted classification of water hardness isgiven in Table 5.
The hardness of 281 water samples ranged from 18to 10,300 mg/l, exceeding 60 mg/I in 228 samples. In101 samples, the hardness was more than 180 mg/I (veryhard). At most places in the report area, the shallowsands contain the hardest water; whereas the deepersands contain the softest water. Two water samples fromvvell PW-84-40-703, producing from the OakvilleSandstone at a depth of from 2,331 to 2,425 feet had ahardness of on IV 18mg/1 and 38mg/1 (soft), respectively.
In summary, ground water that meets most of thequality standards of the U.S. Public Health Service isavailable from wells less than 1,000 feet deep in theGoliad Sand, principally in southern Jim Wells County,the western one-half of Kleberg County, and in a fewother relatively small areas throughout the report area.
- 36-
Shallow, moderately saline to very saline water overliesthe fresh to slightly saline water at most places.
Irrigation
The suitability of water for irrigation dependsupon the chemical quality of the water and other factorssuch as soil texture and composition, types of crops,irrigation practices, and climate. The most importantchemical characteristics of water used for irrigation arethe sodium concentration, the concentration of solublesalts, the residual sodium carbonate, and theconcentration of boron. Sodium is significant inevaluating the quality of irrigation water because of itspotential deleterious effect on the soi I. A highpercentage of sodium in water tends to make the soilplastic, thus restricting the movement of water andgiving rise to problems of drainage and cultivation.
A system of classification commonly used forjudging the quality of water for irrigation was proposedby the U.S. Salinity Laboratory staff (1954, p. 69-82).The classification is based on the salinity hazard asmeasured by the electrical conductivity of the water andthe sodium or alkali hazard as measured by the SAR(sodium adsorption ratio). Wilcox (1955, p. 15) statedthat this system of classification " ... is not directlyapplicable to supplemental waters used in areas ofrelatively high rainfall," and that with respect to salinityand sodium hazards, water generally may be used safelyfor supplemental irrigation if its conductivity is less than2,250 micromhos per centimeter at 25°C, and its SAR isless than 14. The U.S. Salinity Laboratory staff'sclassification of irrigation water is diagrammed inFigure 12, and results of analyses of water from 44representative wells in the Goliad Sand are plotted onthe diagram.
The diagram indicates that all 44 of the watersamples have a high to very high salinity hazard, and thatabout 70 percent have a' high to very high sodiumhazard. Although some of the water is being used forirrigation, it should be used with restraint, principally asa supplement to rainfall.
An excessive concentration of boron renders waterunsuitable for irrigation. Scofield (1936, p. 286)indicated that boron concentrations of as much as 1mg/I are permissible for irrigating most boron sensitivecrops, and that concentrations of as much as 3 mg/I arepermissible for the more boron-tolerant crops. TheGoliad Sand supplies all the water for large-scaleirrigation in the report area. The boron concentration inwater samples from wells RR-83-41-803 andRD-83-50-203 in the Goliad Sand was 0.73 and 0.98mg/I, respectively. Water from well PW-84-40-703,producing from the Oakville Sandstone, and used forindustrial purposes, had a boron concentration of 13mg/I, which is far in excess of the recommended limitfor irrigation water supplies.
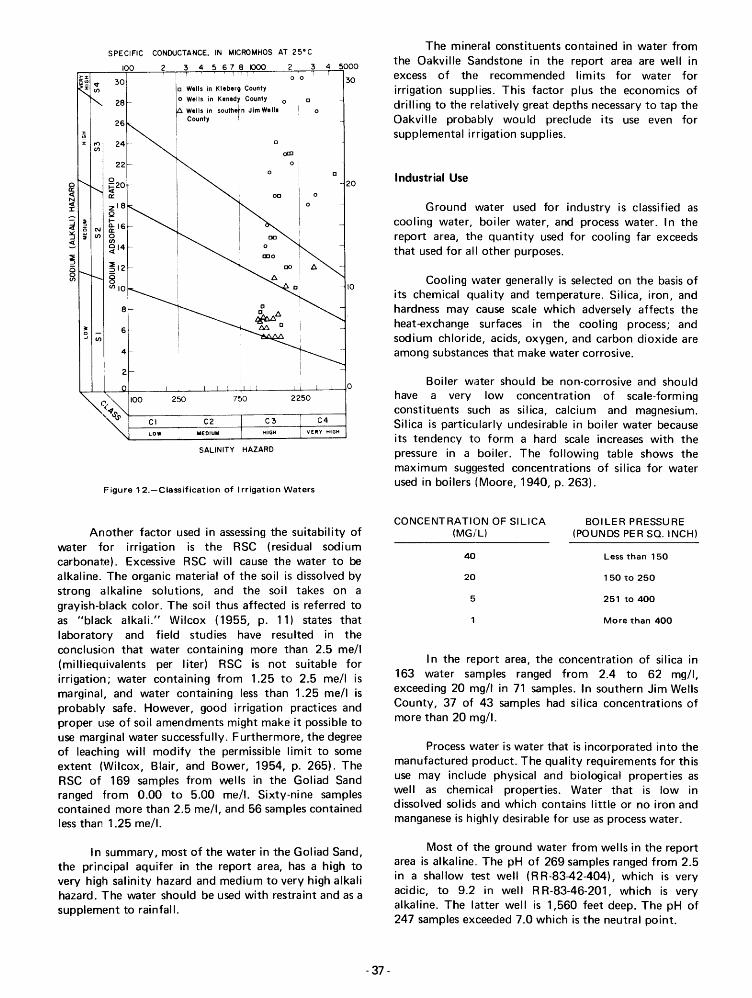
Industrial Use
Boiler water should be non-corrosive and shouldhave a very low concentration of scale-formingconstituents such as silica, calcium and magnesium.Silica is particularly undesirable in boiler water becauseits tendency to form a hard scale increases with thepressure in a boiler. The following table shows themaximum suggested concentrations of silica for waterused in boilers (Moore, 1940, p. 263).
Cooling water generally is selected on the basis ofits chemical quality and temperature. Silica, iron, andhardness may cause scale which adversely affects theheat-exchange surfaces in the cooling process; andsodium chloride, acids, oxygen, and carbon dioxide areamong substances that make water corrosive.
Ground water used for industry is classified ascooling water, boiler water, and process water. In thereport area, the quantity used for cooling far exceedsthat used for all other purposes.
The mineral constituents contained in water fromthe Oakville Sandstone in the report area are well inexcess of the recommended limits for water forirrigation supplies. This factor plus the economics ofdrilling to the relatively great depths necessary to tap theOakville probably would preclude its use even forsupplemental irrigation supplies.
SPECIFIC
100 2 5000
ffi~ v 30Q 0 30
% lJl ~ ••11. ;, ".bo<. Coo""o Wells in Kenedy County 0 028
Wells in southern Jim Well, I 0
26I County ,
% I'"% r<li 24 a
lJl,
220 0
00 ~20 20a:« a: 0
~ zl8:I:Q
~ ~ t-
~ N &: 16~ ::I lJl 0~
lJl
~14
~~12§ 8lJllO
8
6
Figure 12.-Classification of Irrigation Waters
SALINITY HAZARD
In the report area, the concentration of silica in163 water samples ranged from 2.4 to 62 mgll,exceeding 20 mgll in 71 samples. In southern Jim WellsCounty, 37 of 43 samples had silica concentrations ofmore than 20 mg/l.
Process water is water that is incorporated into themanufactured product. The quality requirements for thisuse may include physical and biological properties aswell as chemical properties. Water that is low indissolved solids and which contains little or no iron andmanganese is highly desirable for use as process water.
Another factor used in assessing the suitability ofwater for irrigation is the RSC (residual sodiumcarbonate). Excessive RSC will cause the water to bealkaline. The organic material of the soil is dissolved bystrong alkaline solutions, and the soil takes on agrayish-black color. The soil thus affected is referred toas "black alkali." Wilcox (1955, p. 11) states thatlaboratory and field studies have resulted in theconclusion that water containing more than 2.5 mell(milliequivalents per liter) RSC is not suitable forirrigation; water containing from 1.25 to 2.5 mell ismarginal, and water containing less than 1.25 mell isprobably safe. However, good irrigation practices andproper use of soil amendments might make it possible touse marginal water successfully. Furthermore, the degreeof leaching will modify the permissible limit to someextent (Wilcox, Blair, and Bovver, 1954, p. 265). TheRSC of 169 samples from wells in the Goliad Sandranged from 0.00 to 5.00 mell. Sixty-nine samplescontained more than 2.5 mell, and 56 samples containedless than 1.25 melI.
CONCENTRATION OF SILICA(MG/Ll
40
20
5
BOILER PRESSURE(POUNDS PER SQ. INCH)
Less than 150
150 to 250
251 to 400
More than 400
In summary, most of the water in the Goliad Sand,the principal aquifer in the report area, has a high tovery high salinity hazard and medium to VE!ry high alkalihazard. The water should be used with restraint and as asupplement to rainfall.
Most of the ground water from wells in the reportarea is alkaline. The pH of 269 samples ranged from 2.5in a shallow test well (RR-83-42-404), which is veryacidic, to 9.2 in well RR-83-46-201, which is veryalkaline. The latter well is 1,560 feet deep. The pH of247 samples exceeded 7.0 which is the neutral point.
-37-
The odor of hydrogen sulfide gas (H2S) wasnoticeable from many wells during the time they werebeing pumped. Although H2S is an objectionableconstituent, it can be removed by aeration.
The mineral constituents or properties, iron,manganese, dissolved solids, and hardness also should beconsidered in determining the suitability of water forindustrial use--they were discussed in the section onsuitability for public supply.
Pesticide Content of Water
To provide information on the presence ofpE~sticidal contamination, eight samples of ground waterfrom yvells in the report area were ana1yzed for theinsecticides and herbicides recommended bV theSubcommittee on Pesticide Monitoring of the FederalCommittee on Pest Control (Green and Love, 1967,p. '13-16). The wells sampled, depths of wells, and elate ofsample collection are as.follows: September 17, 1968,from test wells RR-83-42-404 and R0-88-02-903 havingdepths of 38 and 20 feet, respectively; April 3, 1969,from wells PW-84-39-404 and R0-88-1 0-303, depths 235and 40 feet, respectively; April 24, 1969, from wellsR R-83-33-601 and RR-83-43-404, depths 640 and 833feet, respectively; and May 8, 1969, from wellsR R-83-30-702, and R R-83-37 -501, depths 146 and 136feet, respective'v (Figure 18). No pesticides were foundin the water samples from wells R R-83-4:2-404,RR-83-33-601, RR-83-43-404, RR-83-30-702,RD-88-10-303, and PW-84-39-404. Water from wellRD-88-02-903 had 0.03 microgram per liter of DDT,and water from well RH-83-37-501 had 0.Q5 microgramper liter of DDT. The following table shows theseconcentrations are less than the limits permissible forpublic water supplies.
Concentrations of Pesticides Permissible inPublic Water Supplies
(Adapted from National Technical Advisory Committeeto the Secretary of the Interior, 1968.)
INSECTICIDE HERBICIDE(MICROGRAMS (MICROGRAMS
PER LITER) PER LITER)
Aldrin 27 2,4-0
DOT 42 2,4,5-T 100
Dieldrin 17 Silvex
Endrin
Heptachlor 18
Heptachlorepoxide 18
Lindane 56
-38-
Relation of Fresh GroundWater to Saline Ground Water
Some of the sediments composing the geologicformations in the report area were deposited in the Gulfof Mexico and therefore contained salt water at the timeof deposition, or were deposited in fresh water and laterfilled with salt water at a time of higher sea level. Atsome time after deposition, the sea receded and theprocesses of flushing, recharge, and discharge began.Fresh water, originating as precipitation on the outcrop,forced the salt water downdip until the pressure exertedby the fresh water equaled the pressure exerted by thesalt water. Discharge of the salt water may have beenaccomplished in several ways, but Winslow and others(1957, p. 387-388) concluded that in the Houston area,the discharge took place through the overlying clays.The discharge in the report area was probablyaccomplished in a similar manner. Before largewithdrawals by wells were begun, the hydrologic systemwas probably in dynamic equilibrium-that is, the freshwater-salt water interface was almost stationary. Thepressure head of the fresh water was balanced by thestatic head of the salt water.
The extent to which the salt water was flushedfrom the aquifers depends, at least in part, on thepermeability of the individual aquifers. The Goliad Sand,the principal aquife~, is by far the most permeable in thereport. area. Therefore, the salt water was flushed morecompletely from that aquifer. This has resulted in thepresent situation wherein the Goliad Sand in much ofthe report area is overlain and underlain by aquiferscontaining more saline water. The extent to which theGoliad Sand was flushed is shown on Figures 14 and 16by the lines indicating the approximate limits of freshand slightly saline water.
Large-scale withdrawals of ground water for publicsupply in the vicinity of Kingsville have graduallylowered the water levels. Before these withdrawals hadbeg un, the salt-water fresh-water interface waspractically stationary. The system was in equilibriumbecause the hydrostatic pressure on the fresh-water sideof the interface balanced the pressure on the salt-waterside. The piezometric surface sloped gently toward theGulf of Mexico, indicating that the fresh water wasmoving in that direction. All the water levels were abovesea level in 1932-33. By 1968-69, large-scale withdrawalshad created a deep cone of depression; and all waterlevels in the vicinity of Kingsville were below sea level.Water is moving toward the center of the cone from alldirections. Lowering of water levels in the Goliad Sandhas disturbed the dynamic equilibrium at the fresh-waterinterface so that salt water is free to move toward theareas of pumping.
In addition to the lateral movement of saline waterin the Goliad Sand, moderately to very saline water ismoving vertically from the overlying Beaumont Clay andLissie Formation, undifferentiated. Fortunately, the
vertical permeability of this unit is very small, so thatthe movement of saline water into the Goliad Sand isvery slow and diffuse.
Resampling of selected wells for chemical analyseshas revealed no significant increases in mineralization asa result of lateral or vertical movement of salt watertoward the areas of pumping.
Salt-Water Disposal
According to a salt-water disposal inventory madeby the Texas Water Development Board and the TexasRailroad Commission for 1967 5,565,679 barrels (about717 acre-feet) of salt water was produced in conjunctionwith the production of oil in Kleberg, Kenedy, andsouthern Jim Wells Counties in 1967. The methods ofdisposal and the quantity disposed are shown in Table 6.
Of the total amount disposed, 3,593,604 barrels(65 percent) was placed in unlined surface pits; 165,050barrels 13 percent) was injected into wells; 461,346barrels (about 8 percentl was dumped into surface-watercourses; 935,849 barrels (17 percent) was disposed of bythe use of disposal wells; and the means of disposing ofthe remaining 409,830 barrels (7 percEmt) was byunknown methods.
The disposal of salt water into open-surface pits isthe most hazardous method with respect tocontamination of shallow fresh water. A no-pit order bythe Railroad Commission went into effect throughoutTexas or January 1, 1969. The salt water in the pit seepsinto the ground and eventually may contaminate thewater in a shallow aquifer. The time required for the saltwater to affect the quality of water in nearby wells mayvary from a few months to several years depending uponthe permeability of the soil and the consequent rate ofmovement of the salt water. Generally, contamination ofthe fresh water is indicated by a significant increase inthe salinity of the water, principally in the chloridecontent without an accompanying increase in the sulfatecontent. Once a source of contamination is eliminated,flushing and dilution of the contamination may require aconsiderably longer time than the period of originalcontamiration. In most oil fields throughout the state,surface pits for storing salt water are not lined withimpervious materials that would prevent se.~page of saltwater into the fresh-water-bearing sands. The locationsof the oilfields in the report area are shown in Figure 11.
In 1967, 461,346 barrels of salt water wasdischarged directly into surface-water courses. Thismethod is widely used in oilfields situated near naturalbodies of salt water where there is little or 110 danger ofcontamination of ground water.
The safest and best method of disposal of saltwater is through the use of injection and disposal wells,whereby the salt water is pumped into subsurface sands
-39-
that lie below the base of slightly saline water-bearingsands. In 1967, about 20 percent of the salt waterproduced in the report area was disposed of by thesemethods. The proper construction and operation of theinjection and disposal wells are important in assuringadequate protection of the fresh or slightly saline water.
No conclusive evidence of salt-watercontamination was found in the water from wellssampled during this investigation. This should not,however, be construed to mean that contamination isnot occurring.
Improperly Cased Wells
At most places in Kleberg, Kenedy, and southernJim Wells Counties, moderately saline to very salinewater overlies "fresh to slightly saline water. If the casingis not cemented opposite the saline water-bearing sands,the saline water may corrode the casing and enter thewell. Special care should be taken in casing andcementing opposite the saline water.
The aquifers underlying the three-county area maybe contaminated also by the invasion of salt waterthrough improperly cased oil or gas wells. In recentyears, the Texas Water Development Board has maderecommendations to the oil operators concerning thedepths to which water-bearing formations are to beprotected by cemented casing; however, the Oil and GasDivision of the Railroad Commission of Texas isresponsible for protection of the water-bearingformations. The Commission issues rules governing thedepth of cemented surface casing required to protectsuch strata for many oilfields throughout the State.
An examination of the published field rules of theRailroad Commission of Texas indicates that thesurface-casing requirements are inadequate in some ofthe oil and gas fields in the report area. In southern JimWells County, under the present rules, a maximum ofabout 600 feet of sediments containing fresh to slightlysaline water is unprotected in a part of the Seeligsonfield; about 250 feet is unprotected in the Premont, Eastfield; about 810 feet is unprotected in the La Gloriafield; and about 525 feet is unprotected in theHaldeman, South field.
In Kleberg County, about 500 feet of sedimentscontaining fresh to slightly saline water is unprotected inthe Kingsville field. In Kenedy County, the presentsurface-casing requirements are indicated to be adequatein the oil and gas fields having field rules.
AVAILABILITY OF GROUND WATER
The Goliad Sand is the principal source of groundwater for future development in Kleberg, Kenedy, andsouthern Jim Wells Counties and is the source of
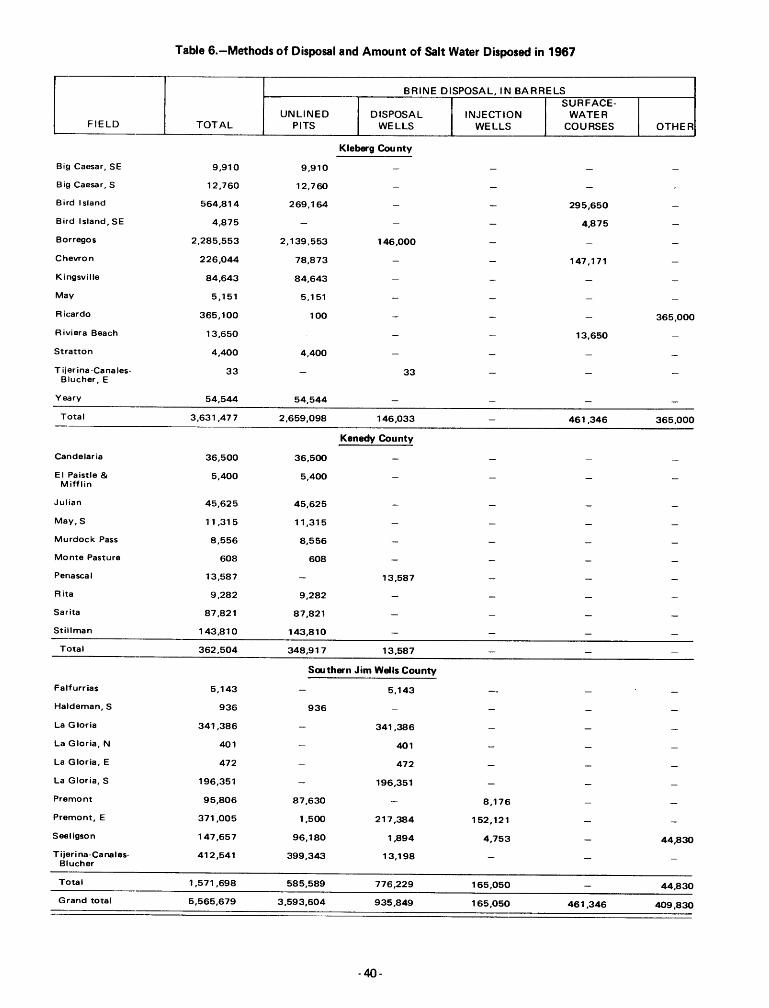
Table 6.-Methods of Disposal and Amount of Salt Water Disposed in 1967
BRINE DISPOSAL, IN BARRELSSURFACE-
UNLINED DISPOSAL INJECTION WATERFIELD TOTAL PITS WELLS WELLS COURSES OTHER
Kleberg Cou nty
Big Caesar, SE 9,910 9,910
Big Caesar, S 12,760 12,760
Bird Island 564,814 269,164 295,650
Bird Island, SE 4,875 4,875
Borregos 2,285,553 2,139,553 146,000
Chevron 226,044 78,873 147,171
Kingsville 84,643 84,643
May 5,151 5,151
Ricardo 365,100 100 365,000
Riviera Beach 13,650 13,650
Stratton 4,400 4,400
T ijer ina -Ca na les- 33 33Blucher, E
Yeary 54,544 54,544
Total 3,631,477 2,659,098 146,033 461,346 365,000
Kenedy County
Candelaria 36,500 36,500
EI Paistle & 5,400 5,400Mifflin
Julian 45,625 45,625
May,S 11,315 11,315
Murdock Pass 8,556 8,556
Monte Pasture 608 608
Penascal 13,587 13,587
Rita 9,282 9,282
Sarita 87,821 87,821
Stillman 143,810 143,810
Total 362,504 348,917 13,587
Southern Jim Wells County
Falfurrias 5,143 5,143
Haldeman, S 936 936
La Gloria 341,386 341,386
La Gloria, N 401 401
La Gloria, E 472 472
La Gloria, S 196,351 196,351
Premont 95,806 87,630 8,176
Premont, E 371,005 1,500 217,384 152,121
Seeligson 147,657 96,180 1,894 4,753 44,830
Tijerina-Canales- 412,541 399,343 13,198Blucher
Total 1,571,698 585,589 776,229 165,050 44,830
Grand total 5,565,679 3,593,604 935,849 165,050 461,346 409,830
- 40-
practically all of the ground water presently being
pumped. Other sources of ground water - Oakville
Sandstone, Lagarto Clay, Beaumont Clay and Lissie
Formation, undifferentiated, Pleistocene barrier island
and beach deposits, south Texas eolian plain deposits,
and Holocene barrier island deposits . are relatively
insignificant except locally.
Distribution and Quantity ofVVater in Storage
Fresh Water
Fresh ground water is available in most places in
roughly the western half of Kenedy and Kleberg
Counties and is available almost everywhere in southern
Jim Wells County. Just west of Laguna Madre, in eastern
Kleberg County, shallow fresh water occurs in small
quantities in the form of lenses in the Pleistocene barrier
island and beach deposits overlying more mineralized
water. Small quantities of fresh water are probably
available in shallow lenses in the sand dunes on Padre
Island.
Excluding these shallow occurrences of fresh
ground water on Padre Island and near Laguna Madre,
the base of fresh water ranges in depth below sea level
from about 200 feet in the western part of southern Jim
Wells County to slightly more than 2,000 feet in the
southwestern corner of Kenedy County (Figure 13).
With the exception of the Oakville Sandstone, which
contains fresh water in southwestern Kenedy County,
the vast majority of the available fresh water is in the
Goliad Sand.
160 square miles along the far eastern side of Kleberg
County and in the northeastern tip of Kenedy County.
In this area bordering Laguna Madre and including a part
of Padre Island, slightly saline water is scarce and where
found, usually at very shallow depths and in formations
younger than Goliad Sand, is available only in small
quantities.
With the exception of these shallow occurrences of
slightly saline water, which extend to depths of less than
150 feet below sea level, the base of slightly saline water
ranges in depth below sea level from about 500 feet in
an area about 10 miles west of Kingsville to almost
2,700 feet near the southwest corner of Jim Wells
County (Figure 15). Excluding the Oakville Sandstone
and Lagarto Clav, which contain slightly saline water in
southern Jim Wells and southwestern Kleberg and
Kenedy Counties and the shallow occurrences previously
mentioned, the base of the slightly saline water in most
of the report area is confined to the Goliad Sand.
About 100 million acre-feet of slightly saline
ground water is stored in the Goliad Sand in the report
area-24, 72, and 4 millions of acre-feet in Kleberg,
Kenedy, and southern Jim Wells Counties, respectively.
This is determined from the volume of sand in the
Goliad containing slightly saline water and from the
porosity of the sand, estimated at 30 percent. Less than
half of the slightly saline water in storage, however, is
recoverable by wells. The greatest thickness of sand is in
central Kenedy County where more than 400 feet of
sand is present (F igure 16).
Quantity of Ground VVaterAvailable for Development
T transmissibility in gallons per day per
foot;
The quantity of water that can be withdrawn on a
long-term basis without depleting the existing supply can
be determined from the amount of recharge or
replenishment that the Goliad Sand receives. Studies to
determine precisely the amount of recharge were not a
part of the prElsent investigation, but estimates can be
made by determining the amount of water that
originally moved through the Goliad Sand. The estimate
of recharge can be computed by using the equation
The fresh water in the Goliad is both overlain and
underlain by slightly saline water and moderately to very
saline water. This relationship is shown in Figu res 19, 20,
and 21.
About 25 million acre-feet of fresh water is stored
in the Goliad Sand in the report area-6, 13, and 6
millions of acre-feet in Kleberg, Kenedy, and southern
Jim Wells Counties, respectively. These estimates are
based on the volume of sand containing fresh water in
the Goliad and on the porosity of the sand, estimated at
30 percent. Probably considerably less than half of the
total fresh water in storage, however, is recoverable by
wells. The greatest thickness of sand is in the central part
of western Kenedy County where more than 200 feet of
sand is present (Figu re 14). The th ickness of sand
diminishes eastward.
Slightly Saline Water
Slightly saline ground water is available
everywhere in the Goliad Sand in Kleberg, Kenedy, and
southern Jim Wells Counties except in an area of about
- 41 -
where Q
L
Q=T I L,
quantity of water in gallons per day
moving through the Goliad Sand;
original hydraulic gradient of the
piezometric surface in feet per mile; and
length of the Goliad Sand, in miles,
through which the water moves.
The original hydraulic gradient of the piezometricsurface of the Goliad Sand can be approximated byusing water levels measured in Kleberg, Kenedy,southern Jim Wells, and Brooks Counties in 1932 and1933, before pumping had begun to greatly affect thewater levels regionally. In this way, the approximateoriginal hydraulic gradient was determined to be about 5feet per mile.
The avera!)e transmissibility of the fresh to slightlysaline water section of the Goliad Sand in westernKenedy County is about 86,000 gpd per foot. This wasderived from an average sand thickness of 400 feet nearthe north-south boundary of Kenedy and BrooksCounties and from an average permeability of 215 gpdper square foot.
Based on a transmissibility of 86,000 gpd per footand an original hydraulic gradient of 5 feet per mile, thequantity of ground water as recharge that originallymoved eastward from the recharge areas mainly in JimHogg and Brooks Counties across the 45-mi Ie length ofGoliad Sand into Kenedy County was 19 mgd.
Not all of the 19 mgd of fresh to slightly salinewater that originally moved eastward through the GoliadSand into Kenedy County is presently available fordevelopment. During 1964, 3.5 mgd of ground waterwas pumped from the Goliad in Brooks County (Myersand Dale, 1967, p. 22-23), and about 1.5 mgd waspumped from the Goliad in Jim Hogg County (TexasWater Development Board, 1967a, b; Gillett and Janca,1965). It is not unreasonable to assu me that at leastthese amounts were pumped in 1968. Thus, about 14mgd of fresh to slightly saline water is perhaps stillcontinually available for development in Kenedy Countyfrom the Goliad Sand. Because a total of only 2.8 mgdof ground water was used in 1968 in Kenedy County,almost entirely from the Goliad Sand, ground-waterproduction from that aquifer in Kenedy County couldbe increased five times.
The average transmissibility of the fresh to slightlysaline water section of the Goliad Sand in southern JimWells and western Kleberg Counties is about 44,000 gpdper foot. This was derived from an average sandthickness of 275 feet near the north-south boundary ofsouthern Jim Wells and Kleberg Counties and from anaverage permeability of 160 gpd per square foot.
Based on a transmissibility of 44,000 gpd per foot,and an original hydraulic gradient of 5 feet per mile, thequantity of ground water that originally moved from therecharge area, mainly in Duval County, eastward throughthe Goliad Sand across the 26-mile length of southernJim Wells County into Kleberg County was about 6 mgd.
As the regional pattern of ground-water flow inthe Goliad Sand has changed since large-scale pumpingbegan in the Kingsville area, and since large-scalepumping currently is taking place mostly in Duval andNueces Counties, the 6 mgd of ground water thatoriginally moved into southern Jim Wells and KlebergCounties as recharge is not now the total quantity ofavailable ground water for that area.
Because ground water moves toward the lowestaltitude in the piezometric surface and at right angles to
-42-
the contours (Figure 8), a significant part (one-third orabout 5 mgd) of the 14 mgd of fresh to slightly salineground water that enters Kenedy County as recharge isbeing diverted northward and northeastward toward theKingsville area in Kleberg County. Similarly, anadditional quantity of fresh to slightly saline groundwater that originally moved mostly from Duval Countyeast-southeastward through northern Jim Wells Countyinto Nueces County as recharge for those areas is beingdiverted toward thE! southeast and south throughsouthwestern Nueces County toward the Kingsville area.The amount of this water being diverted from northernJim Wells County is probably somewhat less than the 3mgd of natural recharge determ ined by Mason (1963,p. 50) to be flowing through the Goliad Sand into theAlice area.
Even though ground water is still moving into theKingsville area from Nueces and northern Jim WellsCounties, it should not be considered to be continuallyavailable, as at least 3 mgd, or all of the natural recharge,is probably being pumped in southwestern NuecesCounty (Shafer, 1968, p. 19-25). Pumping of water fromthe Goliad Sand in Duval County is also removing someof the ground water that would otherwise be available toKleberg and southern Jim Wells Counties. In 1968, atleast 4 mgd was pumped from the Goliad in DuvalCounty (oral communication, D. E. White, 1970).
Thus, perhaps only as much as 7 mgd of fresh toslightly saline water can be considered recharge that iscontinually available for development in Kleberg andsouthern Jim Wells Counties from the Goliad Sand. The13.8 mgd of ground water that was used in 1968 almostentirely from the Goliad Sand for all purposes in Klebergand southern Jim Wells Counties exceeds the maximumavailable recharge. Therefore, this rate of ground-waterusage cannot be maintained indefinitely. Even thecontinual availability of as much as 7 mgd of waterdepends upon no new large-scale ground-waterdevelopments from the Goliad Sand in the regionadjacent to Kleberg and southern Jim Wells Counties.
Also, the full development of 14 mgd available inKenedy County would alter the regional pattern ofground-water flow, would intercept the estimated 5 mgdof ground water being diverted into the heavily pumpedKingsville area, and would substantially lower the waterlevels not on Iy in Kenedy County but in KlebergCounty as well.
Possibilities of Artificial Recharge
The King Ranch, lnc., conducted a rechargeproject from 1952 to 1961 (Kleberg and Kleberg, 1962).Well No. RR-83-25-502, just below Tranquitas Reservoir(Figure 18) was used for this experiment. A large coneof depression had developed in the Goliad Sand in thisarea. Water levels had been drawn down from the landsurface to as much as 200 feet below the surface. Thepurpose of the recharge was to reduce pumping lifts andto combat salt-water intrusion.
Tranquitas Lake was used as the source of rechargewater. A floating intake and strainer were used. The
water was chlorinated and passed through sand and
gravel filter beds. It was then passed through three
diatomaceous-earth vertical-pressure-type filters. The
water was recirculated through the filters and a storage
tank until it met the requirements for recharge, at which
time it was diverted to the well. The lake water normally
had a suspended sediment concentration of 180 to 400
mg/1. Water with a concentration of 5 to 10 mg/I was
considered satisfactory for recharge.
To avoid air entrainment the rechargE! water was
conveyed through the pump column to below the static
water level. Recharge was done at a rate of from 300 to
450 gpm. After recharging 2.8 acre-feet, the water level
in an observation well 300 feet away rose 16 feet.
During the three-month period from May 1 to July 31,
1961, 24 acre-feet of water were recharged. During the
winter the ducks and geese made the shallow lake water
too muddy to filter.
The project was terminated because not enough
water was available from the lake. The King Ranch
officials recognized that the water must be highly
purified of sediment before being recharged into the
underground reservoir. Their foresight was rewarded in
that no trouble due to clogging of the aquifer occurred.
The cost of the recharge, including filtE!r materials,
chlorine, and labor, was $78 per acre-foot.
This cost is probably too high to be justified where
the water is to be used for agriculture only. It would
probably be reasonable if the recharged water were for
municipal or industrial uses. However, in most years
there is a shortage of surface water available in the area
for recharge. Importation of water from outside the area
would be necessary to provide sufficient recharge water.
Areas Most Favorable for FutureDevelopment of Ground-Water Supplies
Areas in Kleberg, Kenedy, and southern Jim Wells
Counties that have the greatest potential and are the
most favorable for future development of fresh to
slightly saline ground-water supplies from the Goliad
Sand may be determined from Figure 17. The figure is a
map showing the thickness of sand containing fresh to
slightly saline water in the Goliad and the amount of
water-level declines caused by withdrawals of water from
the Goliad during a 37-year period from 1931-32 to
1968-69. The map was based on an analysis of more
than 100 electrical logs of oil tests and water wells to
determine the sand thickness, which is a principal factor
affecting the relative availability of ground-water
supplies, and on long-term water-level records of 65
water wells in Kleberg and southern Jim Wells Counties
(Figure 9).
The 11 areas showing relative degrees of
favorability of potential for future development of fresh
to slightly saline ground-water supplies are based on
- 51 -
increments of 100 feet of sand thickness and of 50 to
100 feet of water-level decline. Values of the increments
are arbitrary, but serve to establ ish areas of relative
favorability.
The area least favorable for development of
ground-water supplies is in far eastern Kleberg and
Kenedy Counties where sand thickness is less than 100
feet. To the east of this area lies a 160-square-mile area
mostly in Kleberg County that includes a large part of
Laguna Madre and all of Padre Island, where the Goliad
Sand contains no fresh to slightly saline water. In the
Kingsville area, favorability for future development of
ground water is decreased, even though sand thickness
ranges from 100 to 200 feet, due to the fact that heavy
ground-water pumpage has caused large water-level
declines.
The most favorable area is in west central Kenedy
County from the Brooks County line to a few miles east
of Armstrong. This area of 400 to less than 500 feet of
sand can most easily support the development of large
additional supplies of fresh to slightly saline ground
water.
NEEDS FOR FUTURE STUDIES
The collection of basic data such as an inventory
of pumpage, observation of water levels, and collection
of water samples should be continued periodically in
Kleberg, Kenedy, and southern Jim Wells Counties.
Collection of water samples from selected wells for
chemical analysis will provide up-to-date information on
the status of possible salt-water encroachment.
Sampling should be principally in the eastern part
of Kleberg County on the eastern flank of the regional
cone of depression where salt-water encroachment is to
be expected. The interpretation of all these basic data
will aid ultimately in monitoring future changes in
ground-water conditions.
A network of wells for observation of water levels
has already been established in some areas of Kleberg
and southern Jim Wells Counties and water levels in
these wells are measured and recorded periodically by
the Texas Water Development Board.
DEFINITIONS OF TERMS
Acre-foot.-The volume of water required to cover
one acre to a depth of 1 foot (43,560 cubic feet), or
325,829 gallons.
Acre-foot per year.-One acre-foot per year equals
892.13 gallons per day.
Alluvial deposits.-Sediments deposited by
streams; includes flood-plain deposits and stream-terrace
deposits.
Aquifer.--A formation, group of formations, orpart of a formation that is water-bearing.
Aquifer test, pumping test.-The test consists ofthe measurement at specific intervals of the dischargeand water level of the well being pumped and the waterlevels in nearby observation wells. Formulas have beendeveloped to show the relationships of the yield of avvell, the shape and extent of the cone of depressions,and the properties of the aquifer such as the specificyield, porosity, and coefficients of perme'ability,transmissibility, and storage.
A rtesian aquifer, confined aquifer.-Artesian(confined) water occurs where an aquifer is overlain byrock of lower permeability (e.g., clay) that confines thewater under pressure greater than atmospheric. Thewater level in an artesian well will rise above the top ofthe aquifer. The well mayor may not flow.
Artesian well.-One in which the water level risesabove the top of the aquifer, whether or not the waterflows at the land surface.
Brine.-Water containing more than 35,000 mg/ldissolved solids (Winslow and Kister, 1956, p. 5).
Cone of depression .-Depression of the water tableor piezometric surface surrounding a discharging well orgroup of wells more or less the shape of an invertedcone.
Dip of rocks, altitude of beds.-The angle oramount of slope at which a bed is inclined from thehorizontal; direction is also expressed (e.g., 1 degreesoutheast; or 90 feet per mi Ie southeast) .
Drawdown.-The lowering of the watelc table orpiezometric surface caused by pumping (or artesianflow). In most instances, it is the difference, in feet,between the static level and the pumping level.
Electric log.-A graph log showing the relation ofthe electrical properties of the rocks and their fluidcontents penetrated in a well. The electrical propertiesare natural potentials and resistivities to inducedelectrical currents, some of which are modified by thepresence of the drilling mud.
Evapotranspiration. - Wate r withdrawn byevaporation from a land area, a water surface, moist soil,or the water table, and the water consumed bytranspi ration of plants.
Fresh water.-Water containing less than 1,000mg/I (milligrams per liter) dissolved solids (Winslow andKister, 1956, p. 5).
Ground water.-Water in the ground that is in thezone of saturation from which wells, springs, and seepsare supplied.
-52-
Head, or hydrostatic pressure.-Artesian pressuremeasured at the land surface, reported in pounds persquare inch or feet of water.
Hydraulic gradient.-The slope of the water tableor piezometric surface, usually given in feet per mile.
Moderately saline water.-Water containing 3,000to 10,000 mg/I dissolved solids (Winslow and Kister,1956, p. 5).
Permeability, coefficient of.-The rate of flow ofwater in gallons per day through a cross sectional area of1 square foot under a unit hydraulic gradient.
Piezometric surface.-An imaginary surface thateverywhere coincides with the static level of the water inan aquifer. The surface to which the water from a givenaquifer will rise under its full head.
Resistivity.-That property of a material thatcharacterizes its opposition to the flow of electricity.The resistivity of a water-saturated material is a functionof both the texture of the material and the containedfluid and is recorded in ohms per square meter per meter(ohms m2m) in electric logs of wells.
Slightly saline water.-Water containing 1,000 to3,000 mg/I dissolved solids (Winslow and Kister, 1956,p.5).
Specific capacity.-The discharge of a wellexpressed as the rate of yield per unit of drawdown,generally in gallons per minute per foot of drawdown.
Storage coefficient.-The volume of water anaquifer releases from or takes into storage per unit ofsurface area of the aquifer per unit change in thecomponent of head normal to that surface.
Transmission capacity.-The quantity of waterthat can be transmitted through a given width of anaquifer at a given hydraulic gradient.
Transmissibility, coefficient of.-The number ofgallons of water which will move in one day through avertical strip of the aquifer one foot wide extendingthrough the thickness of the aquifer under a hydraulicgradient of 1 foot per foot at the prevailing temperatureof the water. The coefficient of transmissibility is equalto the field coefficient of permeability times thesaturated thickness of the aquifer.
Very saline water.-Water containing 10,000 to35,000 mg/I dissolved solids (Winslow and Kister, 1956,p.5).
Water level; static level; or hydrostatic level.-In anunconfined aquifer, the distance from the land surfaceto the water table. In a confined (artesian) aquifer, thelevel to which the water will rise either above or below
land surface. It may also be expressed as height above orbelow sea level.
Water table.-The upper surface of a saturatedzone except where that surface is formed byimpermeable material.
Water-table aquifer (unconfined aquifer) .-Anaquifer in which the water in unconfined; the uppersurface of the zone of saturation is under atmospheric
- 55-
pressure only and the water is free to rise or fall inresponse to the changes in the volume of water instorage. A well penetrating an aquifer under water-tableconditions becomes filled with water to the level of thewater table.
Yield.-The rate of dishcarge, commonly expressedas gallons per minute, gallons per day, or gallons perhour. In this rE!port, yields are classified as small, lessthan 50 gpm (gallons per minute); moderate, 50 to 500gpm; and large, more than 500 gpm.
REFERENCES CITED
Baker, E. T., Jr., 1971, Relation of ponded water fromHurricane Beulah to ground water in Kleberg, Kenedy,and Willacy Counties, Texas: Texas Water Devel.Board Rept. 138, 33 p.
Broadhurst, W. L., Sundstrom, R. W., and Rowley, J. H.,1950, Public water supplies in southern Texas: U.S.Geol. Survey Water-Supply Paper 1070, 114 p., 1 pI.
Kane, John W., 1967, Monthly reservoir evaporation ratesfor Texas, 1940 through 1965: Texas Water Devel.Board Rept. 134, 111 p., 7 pis.
Kleberg, R. J., Jr., and Kleberg, R. M., Jr., 1962,Conserving a!1d conditioning lake water forrepressuring and storage: Unpublished report, KingRanch, Inc., Kingsville, Texas 78363.
Carr, J. T., 1967, The climate and physiography ofTexas: Texas Water Development Board Rept. 53,27 p.
Livingston, Penn, and Bridges, T. W., 1936,Ground-water resources of Kleberg County, Texas:U.S. Geol. Survey Water-Supply Paper 773-0, 232 p.
Maier, F. J., 1950, Fluoridation of public water supplies:Am. Water Works Assoc. Jour., v. 42, pt. 1, p.1120-1132.
Mason, C. C., 1963, Availability of ground water fromthe Goliad Sand in the Alice area, Texas: Texas WaterComm. Bull. 6301, 107 p.
Moore, E. W., 1940, Progress report of the committee onquality tolerances of water for industrial uses: NewEngland Water Works Assoc. Jour., v. 54, p. 263.
Lohr, E. W., and Love, S. K., 1954, The industrialutility of public water supplies in the United States,1952, pt. 2, States west of the Mississippi River: U.S.Geol. Survey Water-Supply Paper 1300,462 p.
Broadhurst, W. L., 1942,wells on the King Ranch,
U.S. Geol. Survey open-file
Livingston, Penn, andExploration of saltyKleberg County, Texas:rept., 10 p.
Maxcy, K. F., 1950, Report on the relation of nitrateconcentrations in well waters to the occurrence ofmethemoglobinemia in infants: Nat!. ResearchCouncil Buill. Sanitary Eng. and Environment, p.265-271, App. D.
Fisk, H. N., 1959, Padre Island and the Laguna Madreflats, coastal south Texas, in second geographyconference held on April 6-9, 1959, at CoastalStudies Institute, Louisiana State University: Officeof Naval Research and National Academy of Sciences,Wash., D. C., p. 103-151.
Doll, W. L., and others, 1963, Water resources of WestVirginia: West Virginia Dept. of Natural Resources,Div. of Water Resources, 134. p.
Deussen, A., 1914, Geology and underground waters ofthe southeastern part of the Texas Coastal Plain: U.S.Geo!. Survey Water-Supply Paper 335.
Darton, N. H., Stephenson, L. W., and Gardner, Julia,1937, compilers, Geologic map of Texas: U.S. Geo!.Survey map.
George, W.O., and Cromack, G. H., 1943, Recentobservations of ground-water conditions in thevicinity of Kingsville, Texas: U.S. Geol. Surveyopen-file rept., 10 p.
Cromack, G. H., 1944, Ground-water conditions in thePremont-La Gloria-Falfurrias district, Texas: U.S.Geo!. Survey open-file rept., 13 p.
Gillett, P. T., and Janca, I. G., 1965, Inventory of Texasirrigation, 1958 and 1964: Texas Water Comm. Bull.6515, 317p.
Myers, B. N., 1969, Compilation of results of aquifertests in Texas: Texas Water Devel. Board Rept. 98,532 p.
Green, R. S., and Love, S. K., 1967, Network to monitorhydrologic environment covers major drainage rivers:Pestic:des Monitoring Journal, v. 1, no. 1, p. 13-16.
Myers, B. N., and Dale, O. C., 1967, Ground-waterresources of Brooks County, Texas: Texas WaterDevel. Board Rept. 61, 87 p.
Hem, J. D., 1959, Study and interpretation of thechemical characteristics of natural water: U.S. Geol.Survey Water-Supply Paper 1473, 269 p., 40 figs., 2pis.
National Technical Advisory Committee to the Secretaryof the Interior, 1968, Water quality criteria: Fed.Water Pollut. Control Admin., Wash., D. C., p. 20-83.
Johnson, C. E., 1940, Records of wells, drillers' logs,water analyses, cross sections, and map showinglocations of wells in Aransas County, Texas: TexasBoard Water Engineers dupl. rept., 45 p.
Price, W. A., 1933, Role of diastrophism in topographyof Corpus Christi area, south Texas: Am. Assoc.Petroleum Geologists Bul!., v. 17, no. 8, p. 907-962.
- 57-
Price, W. A., 1958, Sedimentology and Quaternarygeomorphology of south Texas: Gulf Coast Assoc.Geol. Soc. Trans., v. 8, p. 41-75.
Sayre, A. N., 1937, Geology and ground-water resourcesof Duval County, Texas: U.S. Geo/. SurveyWater-Supply Paper 776.
Scofield, C. S., 1936, The salinity of irrigation water:Smithsonian Inst., Ann. Rept., 1934-35, p. 286.
Shafer, G. H., 1968, Ground-water resources of Nuecesand San Patricio Counties, Texas: Texas Water Devel.Board Rept. 73, 129 p.
Taylor, T. U., 1907, Underground waters of the CoastalPlain of Texas: U.S. Geol. Survey Water-Supply Paper190,73 p.
Texas Water Development Board, 1967a, Industr ialground-water use for calendar years 1955-66, HarrisCounty-Lynn County: Texas Water Devel. Boardopen-file rept.
___1967b, Municipal ground-water use for calendaryears 1955-66, Harris County-Lynn County: TexasWater Devel. Board open-fi Ie rept.
Theis, C. V., 1935, The relation between the lowering ofthe piezometric surface and the rate and duration ofdischarge of a well using ground-water storage: Am.Goophys. Union Trans., pt. 2, p. 519-524.
Turner, S. F., and Cumley, J. C., 1940, Records of wells,drillers' logs, water analyses, and map showinglocation of wells in Kenedy County, Texas: TexasBoard of Water Engineers dupl. rept., 56 p.
- 58-
Turner, S. F., Lynch, W. A., and Cumley, J. C., 1940,Records of wells and springs in Jim Wells County,Texas: Texas Board of Water Engineers dupl. rept.,55 p.
U.S. Public Health Service, 1962, Drinking waterstandards: Public Health Service Pub. 956, 61 p., 1fig.
U.S. Salinity Laboratory Staff, 1954, p. 69-82, Diagnosisand improvement of saline and alkali soils: U.S. Dept.Agriculture Handb. 60, 160 p.
Wenzel, L. K., 1942, Methods for determiningpermeability of water-bearing materials with specialreference to discharging-well methods: U.S. Geol.Survey Water-Supp Iy Paper 887, 192 p.
Wilcox, L. V., 1955, Classification and use of irrigationwaters: U.S. Dept. Agriculture Circ. 969,19 p., 4 figs.
Wilcox, L. V., Blair, G. Y., and Bower, C. A., 1954,Effect of bicarbonate on suitability of water forirrigation: Soil Science, v. 77, no. 4, p. 259-266.
Winslow, A. G., and Kister, L. R., 1956, The saline waterresources of Texas: U.S. Gool. Survey Water-SupplyPaper 1365, 105 p.
Winslow, A. G., and others, 1957, Salt water and itsrelation to fresh ground water in Harris County,Texas: U.S. Geol. Survey Water-Supply Paper 1360-F,p.375-407.
Wood, L. A., Gabrysch, R. K., and Marvin, Richard,1963, Reconnaissance investigation of theground-water resources of the Gulf Coast Region,Texas: Texas Water Comm. Bull. 6305, 123 p., 18figs., 15 pis.
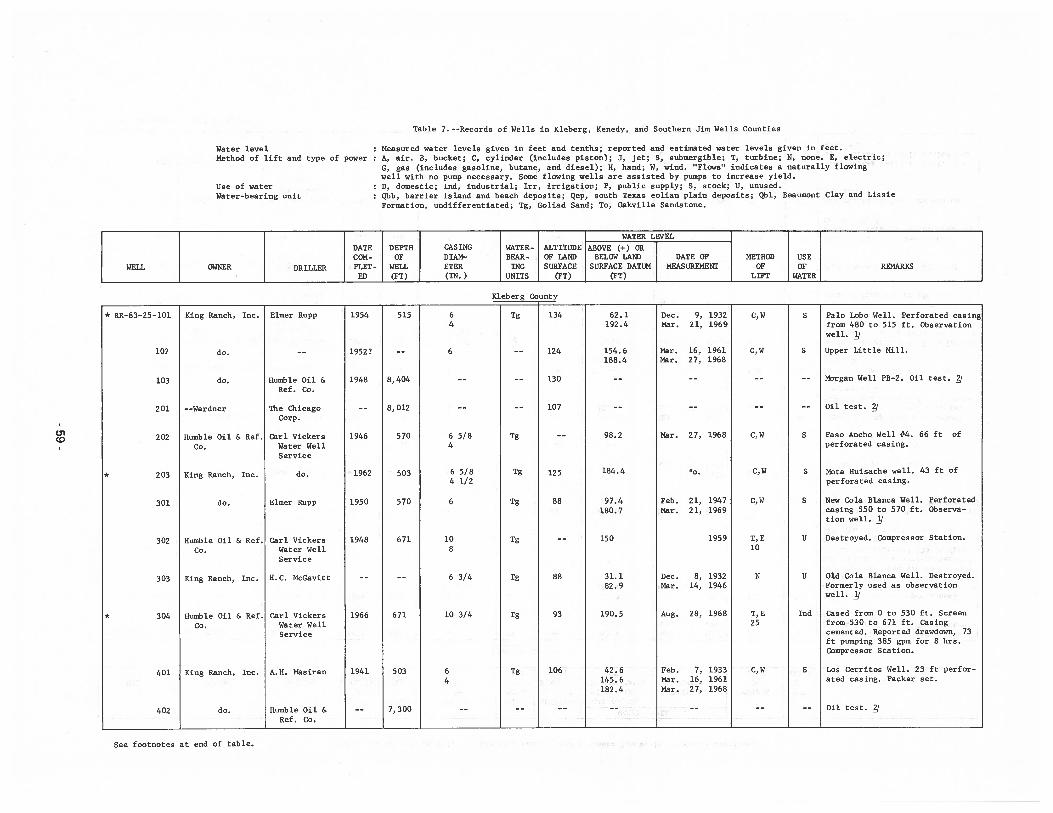
Table 7. --Recorda of Wella in Kleberg, Kenedy, and southern Jim Wella Countiea
01CD
Water levelMethod of lift and
Uae of waterWater-bearing unit
type of powerMeaaured water levela given in feet and tentha; reported and eatimated water levela given in feet.A, ait. g, bucket; C, cylinder (includes piaton); J, jet; 5, aubmergible; T, turbine; N, none. E, electric;
C, gaa (includes gasoline, butane, and dieael); H, hand; W, wind. Flows indicates a naturally flowingwell with no pump neceaaary. Some flowing wella are aaaiated by pumps to increase yield.D, dumeatic; Ind, induatrial; Irr, irrigation; P, public aupply; 5, atock; U, unuaed.Qbb, barrier ialand and beach depoaita; Qep, aouth Texas eulian plain depoaita; Qbl, Beaumont Clay and LissieFormation, undifferentiated; Tg, Goliad Sand; To, Oakville Sandatone.
WATER LEVEL
DATE DEPTH CASING WATER- ALTITUDE ABOVE (-f-) ORCON- OF DIAN- BEAR- OF LAND BELOW LAND DATE OF METNOD USE
WELL OWNER DRILLER PLET- WELL ETER 1MG SURFACE SURFACE DATUM MEASUREMENT OF OF REMARKSED (Fl) (IN.) UNITS (FT) (FT) LIFT WATER
Rleberg County
* RR-83-25-lOl Ring Ranch, Inc. Elmer Rupp 1954 515 6 Tg 134 62.1 Dec. 9, 1932 C,W S Palo Lobo Well. Petforated casing4 192.4 Mar. 21, 1969 from 480 to 515 ft. Observation
well.
102 do. -- 1952? -- 6 —— 124 154.6 Mar. 16, 1961 C,W S Upper Little Mill.188.4 Mar. 27, 1968
103 do. Numble Oil & 1948 8,404 -- -- 130 -- -- -- -- Morgan Well P8-2. Oil teat.
Ref. Co.
201 --Wardner The Chicago -- 8,012 -— —- 107 -- -— -— -— Oil test.
Corp.
202 Humble Oil & Ref. Carl Vickers 1946 570 6 5/8 Tg —- 98.2 Mar. 27, 1968 C,W S Paso Ancho Well #4. 66 ft of
Co. Water Well 4 perforated casing.
Service
* 203 Ring Ranch, Inc. do. 1962 503 6 5/8 Tg 125 184.4 o. C,W S Mota Huisache well. 43 ft of
4 1/2 perforated casing.
301 do. Elmer Rupp 1950 570 6 Tg 88 97.4 Feb. 21, 1947 C,W S New Cola Blanca Well. Perforated180.7 Mar. 21, 1969 casing 550 to 570 ft. Observa
tion well.
302 Humble Oil & Ref. Carl Vickers 1948 671 10 Tg -- 150 1959 T,E U Destroyed. Compressor Station.
Co. Water Well 8 10
Service
303 King Ranch, Inc. H.C. NcGavitt -- -- 6 3/4 Tg 88 31.1 Dec. 8, 1932 N U Old Cola Blanca Well. Deatroyed.82.9 Mar. 14, 1946 Formerly used as observation
well.
* 304 Humble Oil & Ref. Cat-I Vickers 1966 671 10 3/4 Tg 93 190.5 Aug. 28, 1968 T,E md Cased from 0 to 530 ft. Screen
Co. Water Well 25 from 530 to 671 ft. Casing
Service cemented. Reported drawduwn, 73ft pumping 385 gpm for 8 hrs.Compressor Station.
401 King Ranch, Inc. A.H. Masiran 1941 503 6 Tg 106 42.6 Feb. 7, 1933 C,W S Los Cerritos Well. 23 ft perfor
4 145.6 Mar. 16, 1961 ated casing. Packer set.182.4 Mar. 27, 1968
402 do. Humble Oil & -- 7,300 -- -- -- -- -- -- -- Oil test.
Ref. Co.
See footnotes at end of table.
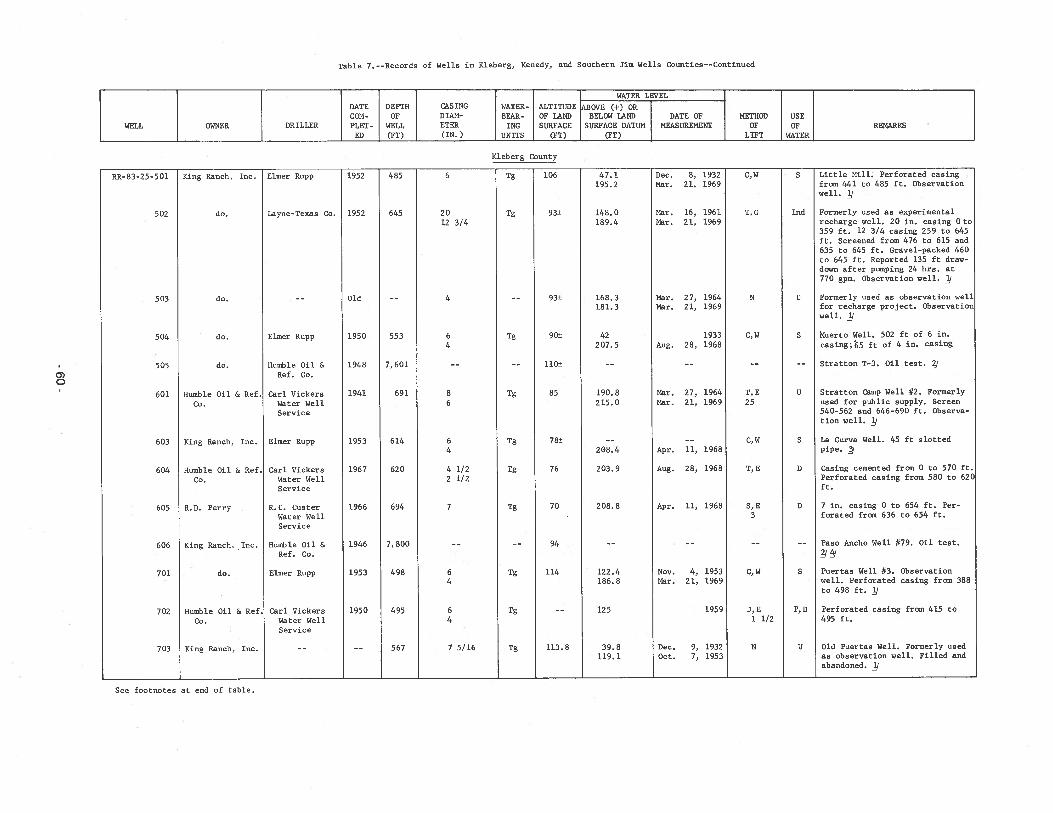
Table 7. --Records of Wells in Rleberg, Renedy, and Southern Jim Wells Counties--Continued
Humble Oil & Ref.Co.
Humble Oil & Ref.Co.
R.D. Perry
Ring Ranch, Inc.
Humble Oil & Ref.Co.
Elmer Rupp
Humble Oil &Ref. Co.
Carl VickersWater WellService
Carl VickersWater WellService
R.C. CusterWater WellService
Humble Oil &Ref. Co.
Elmer Rupp
Carl VickersWater WellService
47.1195.2
148.0189.4
168.3181.3
42207.5
190.8215.0
122.4186.8
125
Dec. 8, 1932Mar. 21, 1969
Mar. 16, 1961Mar. 21, 1969
Mar. 27, 1964Mar. 21, 1969
1933Aug. 28, 1968
Nov. 4, 1953Mar. 21, 1969
Dec. 9, 1932Oct. 7, 1953
Little Mill; Perforated casingfrom 441 to 485 ft. Observationwell.
Formerly used as experimentalrecharge well. 20 in. casing 0 to359 ft. 12 3/4 casing 259 to 645ft. Screened from 476 to 615 and635 to 645 ft. Gravel-packed 460to 645 ft. Reported 135 ft draw-down after pumping 24 hrs. at770 gpm. Observation well.
Formerly used as observation wellfor recharge project. Observationwell.
bluerto Well. 502 ft of 6 in.
casing;’65 ft of 4 in. casing
Stratton T-3. Oil test. /
Stratton Camp Well #2. Formerlyused for public supply. Screen540-562 and 646-690 ft. Observation well. ]J
La Curva Well. 45 ft slottedpipe. /
Casing cemented frcss D to 570 ft.Perforated casing from 580 to 62Cft.
7 in. casing 0 to 654 ft. Perforated fras 636 to 654 ft.
Paso Ancho Well #79. Oil test.
Puertas Well #3. Observationwell. Perforated casing from 388to 498 ft. II
Perforated casing from 415 to495 ft.
Old Puertas Well. Formerly usedas observation well. Filled andabandoned. ]/
WATER LEVEL
DATE DEPTH CASTMG WATER- ALTITUDE ABOVE (+) DRCOM- OP DIAM- BEAR- OF LAND BELOW LAND DATE OF METHOD USE
WELL OWNER DRILLER FLET - WELL ETER 1MG SURFACE SURFACE DATUM MEASUREMENT OF OF REMARKSED (PT) (TM.) UMITS (FT) (PT) LIFT WATER
Rleberg County
Ring Ranch. Inc. Elmer Rupp
do. Layne-Texas Co.
do.
do.
do.0)C
RR-B3-25-5Dl
502
503
504
505
601
603
604
605
606
701
702
703
1952
1952
Old
1950
1948
1941
1953
1967
1966
1946
1953
1950
Ring Ranch, Inc. Elmer Rupp
465
645
553
7, 601
691
614
620
694
7, BOO
498
495
567
6
2012 3/4
4
64
B6
64
4 1/22 1/2
7
64
64
7 5/16
Tg
Tg
Tg
Tg
Tg
Tg
Tg
Tg
Tg
Tg
106
93±
93±
90±
110±
85
7B±
76
70
94
114
113. B
S
md
U
S
U
S
D
D
S
P, D
C, W
T, 0
M
C, W
T, E25
C,W
T, B
5, E3
C, W
J, E1 1/2
M
Mar. 27, 1964Mar. 21, 1969
Apr. 11, 1968
Aug. 28, 1966
Apr. 11, 1966
2DB.4
203.9
208.6
do.
Ring Ranch, Inc.
1959
39.6119. 1
See footnotes at end of table.
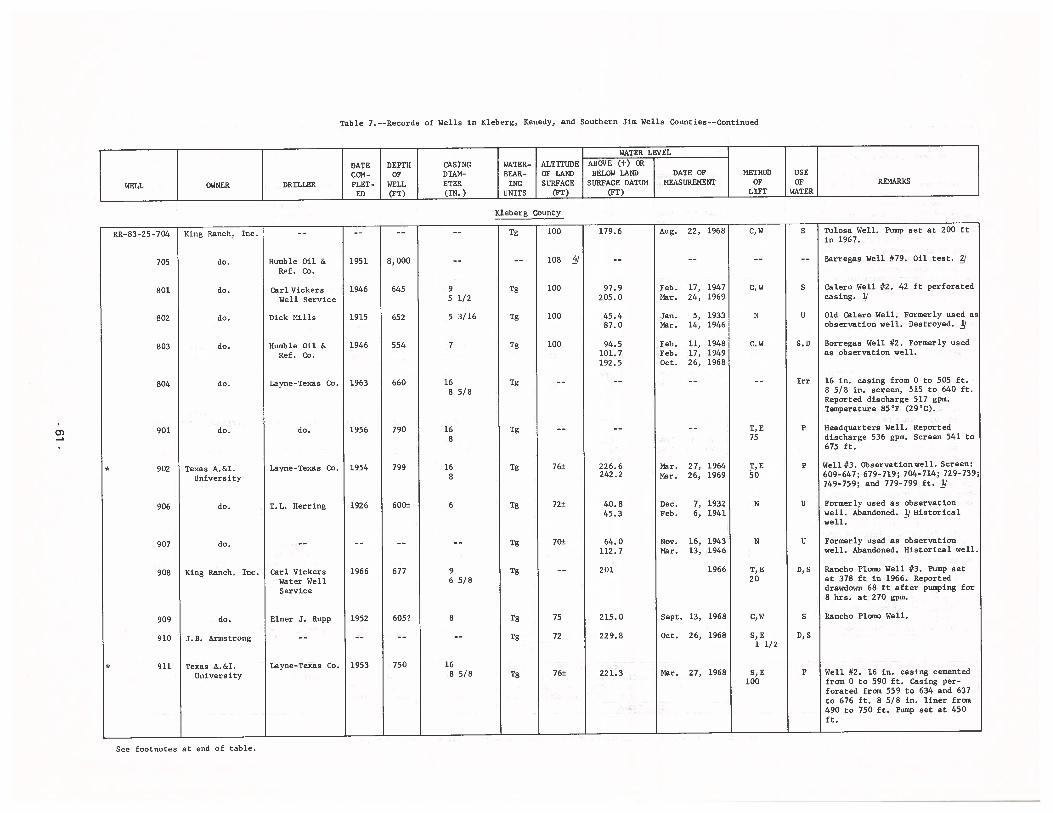
Table 7. --Records of Wells in Kleberg, Kenedy, and Southern Jim Wells Counties--Continued
Humble Oil &Ref. Co.
Layne-Texas Co.
Carl VickersWater WellService
97.9205.0
45.487.0
94.5101.7192.5
76± 226.6242.2
40.845.3
64.0112.7
201
Feb. 17, 1947Mar. 24, 1969
Jan. 5, 1933Mar. 14, 1946
Feb. 11, 1948Feb. 17, 1949Oct. 26, 1968
Dec. 7, 1932Feb. 6, 1941
Nov. 16, 1943Mar. 13, 1946
1966
27, 1968 S,E100
Tulosa Well. Pump set at 200 ftin 1967.
Barregas Well #79. Oil test. gj
Calero Well #2. 42 ft perforatedcasing.
Old Calero Well. Formerly used asobservation well. Destroyed.
Borregas Well #2. Formerly usedas observation well.
16 in. casing from 0 to 505 ft.8 5/8 in. screen, 515 to 640 ft.Reported discharge 517 gpm.Temperature 85’F (29’C).
Headquarters Well. Reporteddischarge 536 gpm. Screen 541 to675 ft.
Well #3. Observation well. Screen:609—647; 679-719; 704—714; 729-739;749-759; and 779—799 ft. j
Formerly used as observationwell. Abandoned. Historicalwell.
Formerly used as observationwell. Abandoned. Historical well.
Rancho Ploax, Well #3. Pump setat 378 ft in 1966. Reporteddrawdown 68 ft after pumping for8 hrs. at 270 gpm.
Rancho Plomo Well.
Well #2. 16 in. casing cementedfrom 0 to 590 ft. Casing perforated from 559 to 634 and 637to 676 ft. 8 5/8 in. liner from490 to 750 ft. Pump set at 450ft.
WATER LEVEL
DATE DEPTH CASING WATER- ALTITUDE ABOVE (+) OR
COM- OF DIAN- BEAR- OF LAND BELOW LAND DATE OF METHOD USE
WELL OWNER DRILLER PLET- WELL ETER 1MG SURFACE SURFACE DATUM MEASUREMENT OF OF REMARKS
ED (FT) (TN.) UNITS (PT) (FT) LIFT WATER
Kleberg County
Humble Oil &Ref. Co.
Carl VickersWell Service
Dick Mills
179.6 Aug. 22, 1968100
108 I
100
100
100
0)
RR-83-25-704
705
801
802
803
804
901
* 902
906
907
908
909
910
911
King Ranch, Inc.
do.
do.
do.
do.
do.
do.
Texas A.&I.University
do.
do.
King Ranch, Inc.
do.
J.B. Armstrong
Texas A.&I.University
do.
Layne-Texas Co.
T.L. Herring
1951
1946
1915
1946
1963
1956
1954
1926
1966
1952
1953
8,000
645
652
554
660
790
799
600±
677
605?
750
Tg
Tg
Tg
Tg
Tg
Tg
Tg
Tg
Tg
Tg
Tg
Tg
Tg
95 1/2
5 3/16
7
168 5/8
168
168
6
96 5/8
8
168 5/8
C, W
C,W
N
C,W
I, E75
T, E50
N
N
T, E20
C, W
5, E1 1/2
Mar. 27, 1964Mar. 26, 1969
S
S
U
5, D
Irr
P
P
U
U
D, S
S
D, S
P
Elmer J. Rupp
Layne-Texas Co.
72±
70±
75
72
76±
215.0
229.8
221.3
Sept. 13, 1968
Oct. 26, 1968
Mar.
See footnotes at end of table.
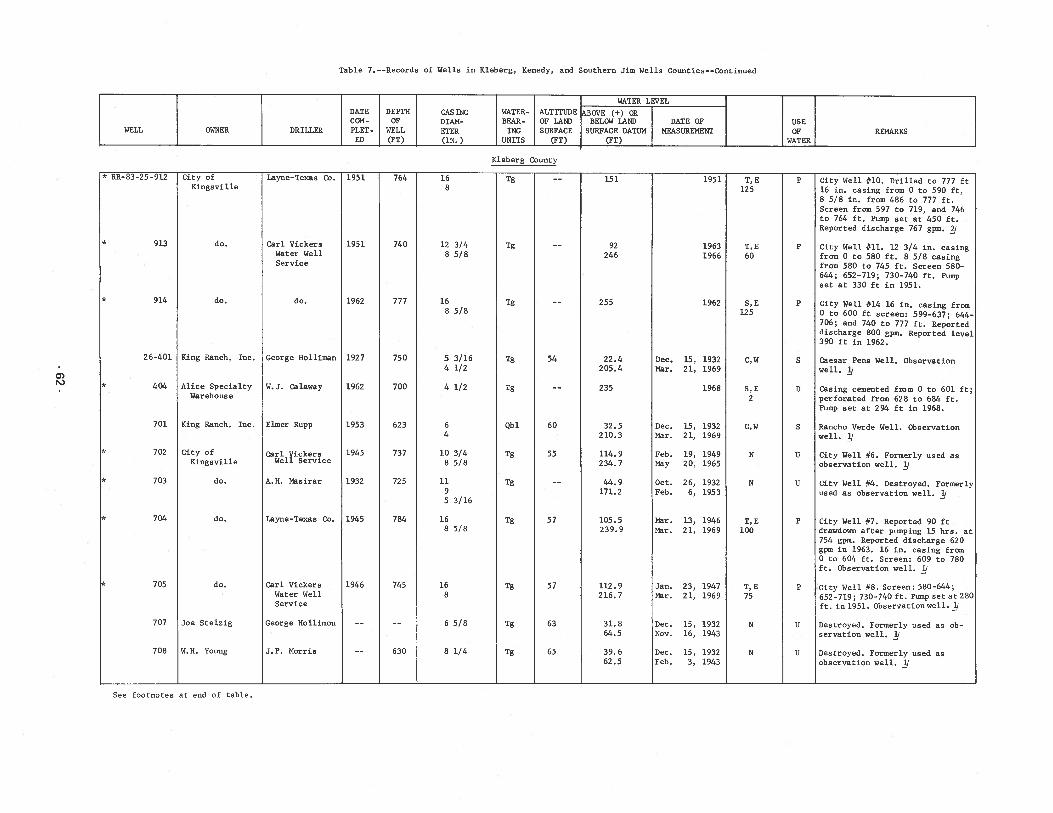
Table 7. --Records of Wells in Rleberg, Renedy, and Southern Jim Wells Counties--Continued
Alice SpecialtyWarehouse
City ofRingsville
do.
Carl VickersWster WellService
4
10 3/48 5/8
1195 3/16
168 5/8
112.9216.7
31.864.5
39. 662.5
Dec. 15, 1932Mar. 21, 1969
1968
Dec. 15, 1932Mar. 21, 1969
Feb. 19, 1949May 20, 1965
Oct. 26, 1932Feb. 6, 1953
Jan. 23, 1947Mar. 21, 1969
Dec. 15, 1932Mov. 16, 1943
Dec. 15, 1932Feb. 3, 1943
City Well #10. Drilled to 777 ft16 in. casing from 0 to 590 ft,8 5/8 in. from 486 to 777 ft.Screen from 597 to 719, and 746to 764 ft. Pump set at 450 ft.Reported discharge 767 gpm. /
City Well #11. 12 3/4 in. casingfrom 0 to 580 ft. 8 5/8 casingfrom 580 to 745 ft. Screen 580-644; 652-719; 730-740 ft. Pumpset at 330 ft in 1951.
City Well #14 16 in. casing from0 to 600 ft screen: 599-637; 644—706; and 740 to 777 ft. Reporteddischarge 800 gpm. Reported level390 ft in 1962.
Caesar Pens Well. Observationwell.
Casing cemented from 0 to 601 ft;perforated from 628 to 684 ft.Pump set at 294 ft in 1968.
Rancho Verde Well. Observationwell. /
City Well #6. Formerly used asobservation well. J
City Well #4. Destroyed. Formerlyused ss observation well. ]/
City Well #7. Reported 90 ftdrawdown sfter pumping 15 hrs. at754 gpm. Reported discharge 620gpm in 1963. 16 in. casing fromO to 604 ft. Screen: 609 to 780ft. Observation well.
City Well #8. Screen: 580-644;652-719; 730-740 ft. Pump set at 280
ft. in 1951. Dbservationwell.j/
Destroyed. Formerly used as observation well.
Destroyed. Formerly used asobservation well.
Layne-Texas Co.
WATER LEVELDATE DEPTM CASIMG WATER- ALTITUDE \BOVE (+) ORCOM- OF DIAM- BEAR- OF LAND BELOW LAMD DATE OF USE
WELL OWNER DRILLER PLET- WELL ETER 1MG SURFACE SURFACE DATUM MEASUREMENT OF REMARKSED (FT) (TM.) UNITS (FT) (FT) WATER
Rleberg County
City ofRingsville
do.
do.
1951
1951
1962
0)N)
16B
12 3/48 5/8
16B 5/8
5 3/164 1/2
4 1/2
do.
26-401 King Ranch, Inc. George Mollimsn 1927
W.J. Calaway
1951
19631966
1962
*fl_83-25-9l2
* 913
* 914
* 404
701
* 702
* 703
* 704
705
707
708
King Ranch, Inc. Elmer Rupp
151
92246
255
22.4205.4
235
32.5210.3
114.9234.7
44.9171.2
105.5239.9
764
740
777
750
700
623
737
725
784
745
630
Tg
Tg
Tg
Tg
Tg
Qbl
Tg
Tg
Tg
Tg
Tg
Tg
1962
1953
1945
1932
1945
1946
T, K125
T, E60
5, E125
C, W
5, K2
C, W
N
N
T, K100
T,]75
M
K
P
F
P
S
0
S
U
U
P
P
U
U
Carl VickeraWell Service
A.M. Masirar
Layne-Texas Co.
Carl VickersWater WellService
George Mollimon
J.F. Morris
do.
do.
Joe Stelzig
W.M. Young
54
60
55
57
57
63
65
Mar. 13, 1946Mar. 21, 1969
168
6 5/8
B 1/4
See footnotes at end of table.
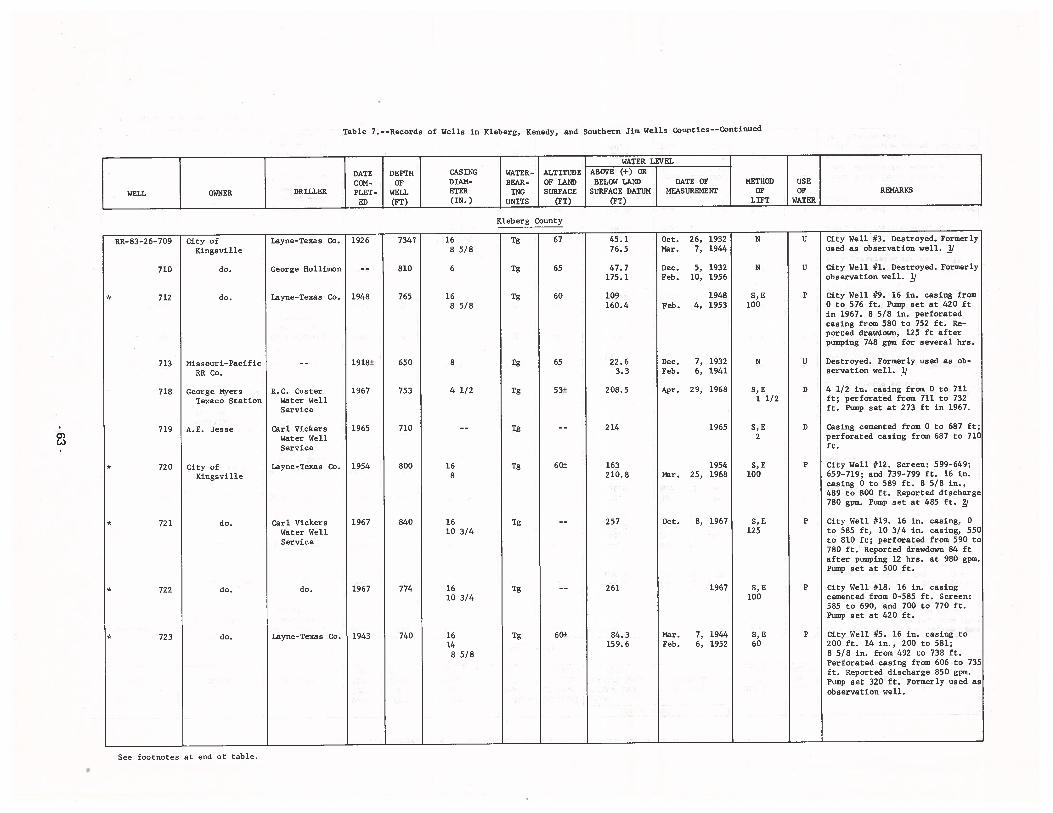
000
•0’)
0>
54)
.4
4-l
0010
-4.4
4)In
4)
44.b
.940—
.4401fl
40.
.o
$‘o
094
‘0
01
4,0
0,-4
Cn’0
r—O
4-,-)
‘.0
-.0’
04
44-4
.00.04
00
0.0
P.0
--C’
‘04
4‘0
0ci
•000
0104
000
09
44.1
4400
0000-3
4.)
44.4
0)‘-)
It
I5
0-.-
40
44
00
0.0
004
40
O--l-4
00
40
.9-4
4)
4)0
00—
0’.-)
-444-4-..4
-.)$09
-.4
00
0—
4‘00
-.4444)044
44-10
00
.0
’00t
oo
oO
01/O
r—.
-.4
0.0
.009>
9.—
4•
044044
0‘0
.44-4
40
40-•-.
10-4).j4
41444
00.
0)00
0’0
00-4
‘01
‘004)9
-44>
00—
44-))flO
0.
004400
0.
00.
4400
00
44
0-4
94
00
.-‘4J
oS
-.4-,
0-3
--o
‘o
oo
oo
14.1414.
44
01
00
04)0
.4-,
00
0044
••-o14
•.9
44-4
4.4
00
00
4)
00
.00
.0.4
0-
04)4
40
0’
444
40
00
00
0•
4-4
44
444
4440
44
1O
o1-4
44
>9444)0
.04-4
009.04)
..-4-.-4
34
44
44
•‘4090.
00
14
400
4-4
04.4
-44•O
.-4
0.
4400.
444
40
.4.1
0,
C0.0
4-1
0004-4
-44
00
-4.0
14
.0
-4
0•
0.0
4-4
04441
44c-j
9400
04
94
04
4‘0
-3-4
444
0.4
0-0
.94
c-JO
)0
00
04.1
0.-
)0
.5-4
-0
009-40
00
00.0
‘-‘---O’0
c’J
—44
‘040
o•.-4
040
0-.4
-1
00
04
)4).
04
‘0-440
.05
00
.940
4.4
00
’0
O-.1
--4
4-4
44
.4.-)
140
04
0.0
.14
0.
44
.-)-.4
’OO
00
.0.0
.•
•4444
0•
01
-4-$
0’094
0.4
4.1
4.
—.Jfl
000
-4
00
4-’4
01-4
0.4
40
.0.0
0440040
004)04
.0
1014
44404)3
01
000
“
0.a-442
.-4
di
°g
0.0
04400004
.440
5-0
04
40
0.
..—0o,c
04-4
00
-t
‘0
440
.0.-
40
.-4-,-4
.-444440--.
‘0
0.0
00
‘-40
—444440.4
)—
409
—4—
4.0
44
‘4.4
‘-443
,-4%
0•9
-4’O
00
09-10.
04
4‘-4--O
oZ
•—
494
44
034
‘--o0.4
-4
—4
04404444
00
00
00.0
.00
>9.44
,44
4$
00
0’
4)0
.0-0
00
00
.44
00,00
144)0.%
000’0O
044
00
0044
‘-40000
10
044
04
.400
44440
01
444
0.0
0-44
440
1-4
0,0
.0
00
.044
00
00
—4
94
44
04-4
940.0
0.
44>
s’t
14
,0>
.0.4
’4440.
4.4
>-.
-49
-4>
91.-
I14.4
0-0
.0
0,
>9
00.
14.-9
-1
0.0
440
4.4
04444
04
44
)044
.-4.-.
04
4.
4405
00.0
4.40
3.1
4)
4.4
4)4
0-4
)4
-4
04
0-44
.4)0
—40
—.0
-.40000
00
4.1
44
04
.1—
40
.00
.0.
-.-
4000
.4-40
-44
00.0
-440
0440,0
00
00
00-4400.0,
00
44
-1
94
00.4
-4
00.
04
0.
044440.0
0.
00040.
00
40.0
.9-4
0.0
04:
0’0’
0.
0’
00
0.
0.
0.
0.
.440.0
.1-,
0-0041
0410-0
0101
01‘0
HO
0.
z-o
z.
-1-4
01
fl0
-0
ocoO
0000
10
0c0
o4
00
00
00
0‘-4
—‘
‘-40—
8(‘4
41410
‘0(0
9(‘3
.0.
10-40
.0--
0.
40
14
0.4
0.1
0-
4115
0.4
400
09cC
0.
‘0
410-
0909
0905
0909
0509
090
’0909
0’
090
90
9
-t0
.0.
1100
-t
P.’0
09
0900
0.1
00
1C
s)-1
(‘41-4
:::::-z
h—.
0H
-4:-4
:HI
II
±1.4
0414.
14,0--
10-0
1/4110
II
H0.
3.)‘0
10‘0
‘004
‘0
-
804
0.’
0000
44
10
.OH
44H
0.Z
H0
0000
0000
0000
0000
0000
00-0
:04
-4
0.
.0H
HH
HH
HH
HH
H00
0’
004
0400
‘40
.1.-.
0.
CO(‘4
44
00.4
0.0
..—
——
I0
00-4
11410.
1/409
—4
4110
0.
00
Oool’-
‘00.
00‘00.
004
‘00.
‘00
‘00
‘04
00
0‘0
---
22
22
g2
20
0.9
4.-O
H0-.
‘00.
‘00.
0.
0.
0.
0.
1-—0
0-10010.
94:0
3--
P.
th
00.
ICO
P.
094
P.
P.
0.
11:;1
I0
P0
0>
>0
>4
>0>
000
04.1
44
4.1
44
044
44
0
044
0.00
.-4
4)0
04
00
014-,
014.
00
04400
14.4
44
)0.
14.0
0.-0
0‘0
0.
00
-440
44
-440
0t
o0
.0
••
0•
••
-440
04
14.0
-,-40
00
14‘0
‘0-.4
•0.0
014
‘0‘0
‘0‘4
940
440
04)
‘4)0
00
00
00
0.0
0-40
00
00
OC
X0
‘014.44
00
.440
•>
9.440
410.
o0
.O
H01
0.
0
00.
00
090
190.
0009
04
Cc)(00
0
0.4
-.4-.4
—4
40-4
0-40’)
ON
P.
P.
P.
P.
P.
P.
P.
P.
P.
P.
I0
0.
-‘-4
000
944)
9494
94
-63
-
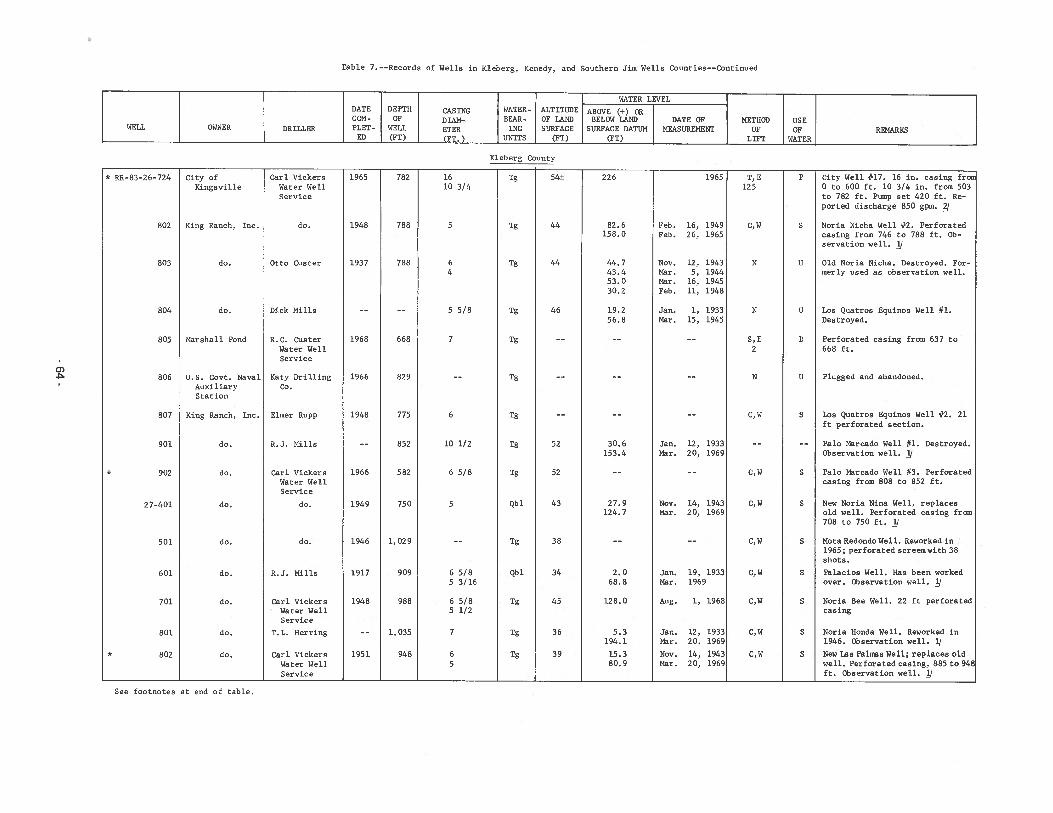
Table 7. --Recorda of Wella in Kleberg, Kenedy, and Southern Jim Wella Countiea--Continued
Carl Vickera City Well #17. 16 in. casing frotWater Well 0 to 600 ft. 10 3/4 in. from 503Service to 782 ft. Pump set 420 ft. Re
ported discharge 850 gpm. l
82.6 Feb. 16, 1949 Noria Nicha Well #2. Perforated158.0 Feb. 26, 1965 casing from 746 to 788 ft. Ob
servation well.
44.7 Nov. 12, 1943 Old Mona Nicha. Destroyed. For-43.4 War. 5, 1944 merly used as observation well.53.0 Mar. 16, 194530.2 Feb. 11, 1948
19.2 Jan. 1, 1933 Los Quatros Equinos Well #1.56.8 Mar. 15, 1945 Destroyed.
R.C. Custer Perforated casing from 637 toWater Well 668 ft.Service
Raty Drilling Plugged and abandoned.Co.
Los Quatros Equinos Well #2. 21ft perforated section.
Jan. 12, 1933 Palo Marcado Well #1. Destroyed.Mar. 20, 1969 Observation well.
Carl Vickers -- Palo Marcado Well #3. PerforatedWater Well casing from 808 to 852 ft.Service
do. Nov. 14, 1943 New Mona Nina Well, replacesMar. 20, 1969 old well. Perforated casing from
708 to 750 ft. ]/
Mota Redondo Well. Reworked in1965; perforated screemwith 38shots.
R.J. Mills 2.0 Jan. 19, 1933 Palacios Well. Nas been worked68.8 Mar. 1969 over. Observation well.
Carl Vickers 128.0 Aug. 1, 1968 Mona Bee Well. 22 ft perforatedWater Well casingService
T.L. Nerring 5.3 Jan. 12, 1933 Mona Nonda Well. Reworked in194.1 Mar. 20, 1969 1946. Observation well. /
Carl Vickers 15.3 Nov. 14, 1943 NewLas Palsias Well; replaces oldWater Well 80.9 Mar. 20, 1969 well. Perforated casing, 885 to 94€Service ft. Observation well. J
WATER LEVELDATE DEPTH CASING WATER- ALTITUDE ABOVE (+) DRCOW- OF DIAN- BRAR- OF LAND BELOW LAND DATE OF METHOD USE
WELL OWNER DRILLER PLET - WELL ETER INC SURFACE SURFACE DATUM MEASUREMENT OF OP REMARKS
_____________
RD (FT) (Ft.) UNITS (FT) (FT) LIFT WATER
Rleberg County
226
do.
Otto Custer
Dick Mills
1965
a)
* 211-83-26-724
802
803
804
805
806
807
901
* 902
27-401
501
601
701
801
* 802
City ofRingaville
Ring Ranch, Inc.
do.
do.
Marshall Pond
U.S. Govt. NavalAuxiliaryStation
Ring Ranch, Inc.
do.
do.
do.
do.
do.
do.
do.
do.
Elmer Rupp
R.J. Mills
1965
1948
1937
1968
1966
1948
1966
1949
1946
1917
1948
1951
782
788
788
668
829
775
852
582
750
1, 029
909
988
1,035
948
1610 3/4
5
64
5 5/8
6
10 1/2
6 5/8
5
6 5/B5 3/16
6 5/85 1/2
7
65
Tg
Tg
Tg
Tg
Tg
Tg
Tg
Tg
Tg
Qb 1
Tg
Qbl
Tg
Tg
Tg
54±
44
44
46
52
52
43
38
34
45
36
39
T, E125
C, W
N
N
5, E2
N
C,W
C,W
C,W
C, W
C, W
C,W
C, W
C,W
P
S
U
U
D
U
S
S
S
S
S
S
S
S
do.
30.6153.4
27.9124.7
See footnotes at end of table.
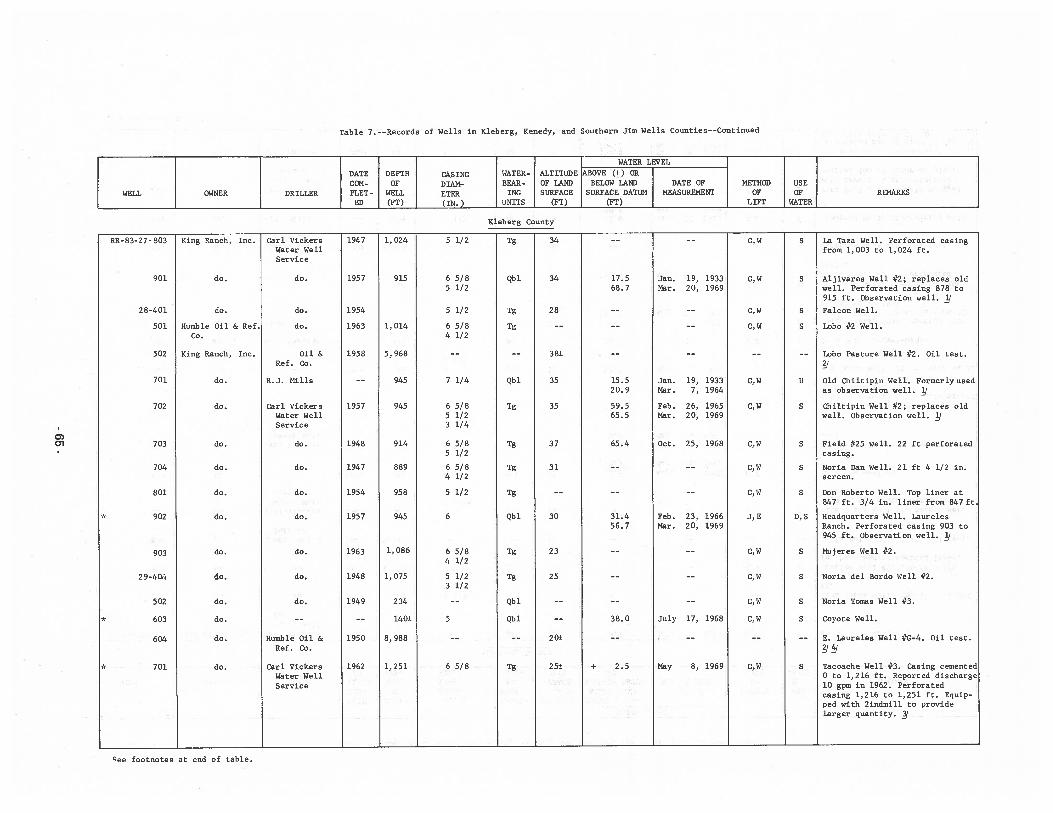
Table 7. --Records of Wells in Kleberg, Kenedy, and Southern Jim Wells Counties--Continued
Carl Vickers La Tszs Well. Perforated casingWater Well from 1,003 to 1,024 ft.Service
do. Jan. 19, 1933 Aljivares Well #2; replaces oldMar. 20, 1969 well. Perforated casing 878 to
915 ft. Observation well. jFalcon Well.
Humble Lobo #2 Well.Co.
King Ranch, Tnc. & 5,968 Lobo Pasture Well #2. Oil test.
7 1/4 15.5 Jan. 19, 1933 old Chiltipin Well. Formerly used20.9 Mar. 7, 1984 as observatfon well. /
Carl Vickers 6 5/8 59.5 Feb. 26, 1965 Chiltipin Well #2; replaces oldWater Well 5 1/2 65.5 Mar. 20, 1969 well. Observation well. 1/Service 3 1/4
do. 6 5/8 Field #25 well. 22 ft perforated5 1/2 casing.
6 5/8 Mona Dan Well. 21 ft 4 1/2 in.4 1/2 screen.
5 1/2 -- Don Roberto Well. Top liner at847 ft. 3/4 in. liner from 847 ft
Feb. 23, 1966 Headquarters Well. LaurelesMar. 20, 1969 Ranch. Perforated casing 903 to
945 ft. Observation well. /
6 5/8 Mujeres Well #2.4 1/2
5 1/2 Mona del Bordo Well #2.3 1/2
do. -- -- Mona Tomas Well #3.
-- July 17, 1968 Coyote Well.
Humble Oil & —- E. Laureles Well #0-4. Oil test.Ref. Co.
Carl Vickers Tacoache Well #3. Casing cementedWater Well 0 to 1,216 ft. Reported dischargeService 10 gpm in 1962. Perforated
casing 1,216 to 1,251 ft. Equipped with 2indmill to providelarger quantity. 4
WATER LEVEL
DATE DEPTH CASTHG WATER- ALTITUDE ABOVE c-i-) ORCOM- OF DTAM- BEAR- OF MMD BELOW MMD DATE OF METHOD USE
WELL OWNER DRTLLER PLET - WELL ETER INC SURFACE SURFACE DATUM MEASUREMENT OF OF REMARKSED (FT) (TN.) UNITS (FT) (FT) LIFT WATER
Kleberg County
King Ranch, Inc.
do.
do.
Oil & Ref.
1,024
915
1,014
5 1/2
6 5/B5 1/2
5 1/2
6 5/84 1/2
do.
do.
OilRef. Co.
R.J. Mills
17.568.7
C)Cii
RR-B3-27- 803
901
2 8-401
501
502
701
702
703
704
801
* 902
903
29 -4D4
502
* 603
604
* 701
1947
1957
1954
1963
1958
1957
1948
1947
1954
1957
1963
1948
1949
195 D
1962
do.
do.
do.
do.
do.
do.
do.
do.
do.
do.
do.
do.
Tg
Qbl
Tg
Tg
Qbl
Tg
Tg
Tg
Tg
Qbl
Tg
Tg
Qbl
Qbl
Tg
34
34
28
38±
35
35
37
31
30
23
25
20±
25±
do.
do.
do.
do.
do.
Oct. 25, 1968
945
945
914
889
958
945
1,086
1,075
234
140±
B, 988
1,251
6
C,W
C,W
C,W
C,W
C,W
C,W
C, W
C, W
C,W
J, E
C, W
C, W
C, W
C, W
C,W
S
S
S
S
U
S
S
S
S
D, S
S
S
S
S
S
65.4
31.456.7
38.0
2.5
5
6 5/B + May B, 1969
ee footnotes at end of tsble.
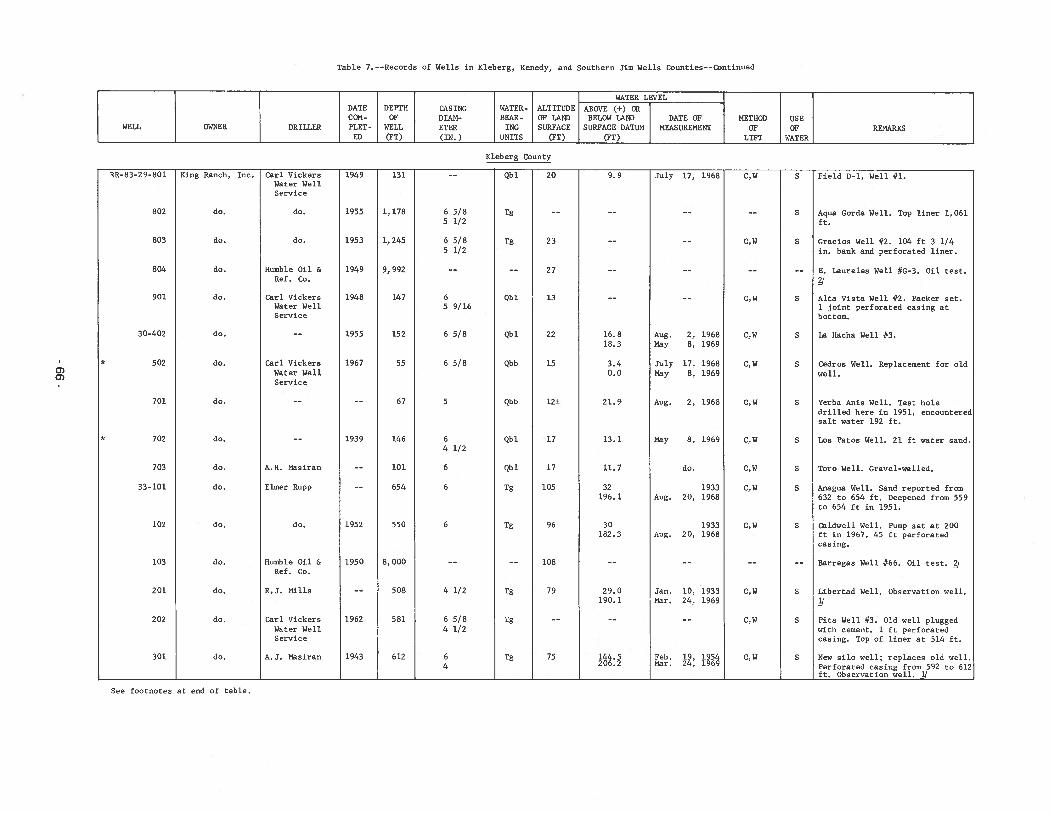
Table 7. --Records of Wells in Rleberg, Renedy, and Soothern Jim Wells Counties--Continued
WATER LEVELDATE DEPTH CASING WATER- ALTITUDE ABDVE (+) DRCDM- DF DIAN- BEAR- DF LAND BELOW LAND DATE DP METHOD USE
WELL OWNER DRILLER PLET- WELL ETER ING SURFACE SURFACE DATUM MEASUREMENT DF DF REMARKSED (FT) (TN.) UNITS (FT) (Fl) LIFT WATER
Rleberg County
RR-83-29-BDl Ring Ranch, Inc. Carl Vickers 1949 131 Qbl 2D 9.9 July 17, 1968 C,W S Field D-l, Well #1.Water WellService
BD2 do. do. 1955 1,178 6 5/B Tg -- -- S Aqua Cords Well. Top liner 1,0615 1/2 ft.
803 do. do. 1953 1,245 6 5/8 Tg 23 C,W S Gracios Well #2. 104 ft 3 1/45 1/2 in. bank and perforated liner.
804 do. Humble Oil & 1949 9,992 -- -- 27 -- —- E. Laureles Well #G-3. Dii test.Ref. Co.
901 do. Carl Vickers 1948 147 6 Qbl 13 C,W S Alts Vists Well #2. Packer set.Water Well 5 9/16 1 joint perforated casing atService bottom.
30-402 do. -- 1955 152 6 5/8 Qbl 22 16.8 Aug. 2, 1968 C,W S La Macha Well #3.18.3 May 8, 1969
* 502 do. Carl Vickers 1967 55 6 5/8 Qbb 15 3.4 July 17, 1968 C,W S Cedros Well. Replacement for oldWater Well 0.0 May 8, 1969 well.Service
701 do. -- 67 5 Qbb 12± 21.9 Aug. 2, 1968 C,W S Yerba Anis Well. Teat holedrilled here in 1951, encounteredsalt water 192 ft.
* 702 do. -- 1939 146 6 Qbl 17 13.1 May 8, 1969 C,W S Los Patos Well. 21 ft water sand.4 1/2
703 do. A.H. Masiran -- 101 6 Qbl 17 11.7 do. C,W S Toro Well. Gravel-walled.
33-101 do. Elmer Rupp —- 654 6 Tg 105 32 1933 C,W S Anagua Well. Sand reported from196.1 Aug. 20, 1968 632 to 654 ft. Deepened from 559
to 654 ft in 1951.
102 do. do. 1952 550 6 Tg 96 30 1933 C,W S Caidwell Well. Pump set at 200182.3 Aug. 20, 1968 ft in 1967. 45 ft perforated
casing.
103 do. Mumble Dii & 1950 8,000 -- -- 108 -— —- -- -- Barregas Well #66. Dii test. /Ref. Co.
201 do. R.J. Mills —- 508 4 1/2 Tg 79 29.0 Jan. 10, 1933 C,W S Libertad Well. Observation well.190.1 Mar. 24, 1969
202 do. Carl Vickera 1962 581 6 5/8 Tg -- -- —- C,W S Pita Well #3. DId well pluggedWater Well 4 1/2 with cement. 1 ft perforatedService casing. Top of liner at 514 ft.
301 do. A.J. Maciran 1943 612 6 Tg 75 144.5 Feb. 19, 1954 C,W S New silo well; replaces old well.4 206.2 Mar. 24, 1969 Perforated casing from 592 to 612
________ __________
ft. Observation well. J/
See footnotes at end of table.
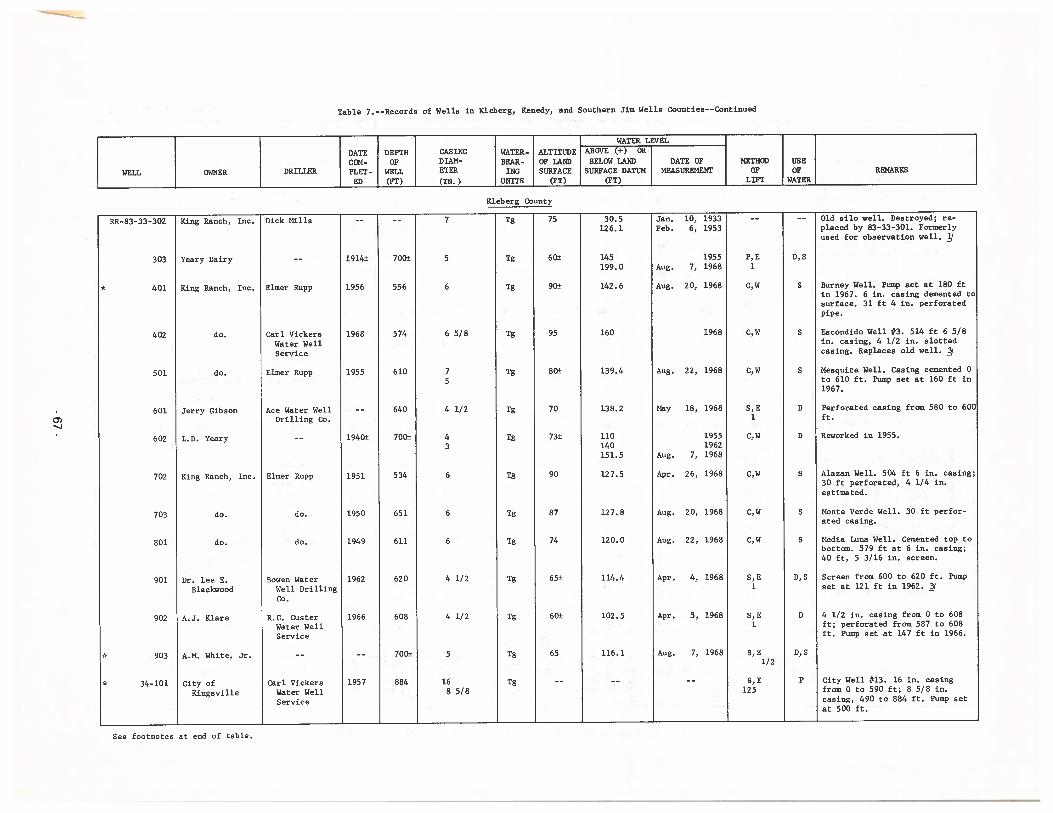
Table 7. --Records of Wells in Rleberg, Renedy, and Southern Jim Wells Counties--Continued
0)
WATER LEVEL
DATE DEPTH CASING WATER- ALTITUDE ABOVE (+) OR
CON- OF DTAN- BEAR- OF LAND BELOW LAND DATE OF METHOD USE
WELL OWNER DRTLLER PLET - WELL ETER INC SURFACE SURFACE DATUM MEASUREMENT OF OF REMARKS
ED (FT) (IN.) UNITS (PT) (FT) LIFT WATER
Kleberg County
RR-83-33-302 Ring Ranch, Tnc. Dick Mills -- -- 7 Tg 75 30.5 Jan. 10, 1933 -- -- Old silo well. Destroyed; re126.1 Feb. 6, 1953 placed by 83-33-301. Formerly
used for observation well.
303 Yeary Dairy -- 1914± 700± 5 Tg 60± 145 1955 P,E D,S199.0 Aug. 7, 1968 1
* 401 Ring Ranch, Inc. Elmer Rupp 1956 556 6 Tg 90± 142.6 Aug. 20, 1968 C,W S Burney Well. Pump set at 180 ftin 1967. 6 in. casing demented tosurface. 31 ft 4 in. perforatedpipe.
402 do. Carl Vickers 1968 574 6 5/8 Tg 95 160 1968 C,W S Escondido Well #3. 514 ft 6 5/8
Water Well in. casing, 4 1/2 in. slotted
Service casing. Replaces old well. /
501 do. Elmer Rupp 1955 610 7 Tg 80± 139.4 Aug. 22, 1968 C,W S Mesquite Well. Casing cemented 0
5 to 610 ft. Pump set at 160 ft in1967.
601 Jerry Gibson Ace Water Well -- 640 4 1/2 Tg 70 138.2 May 18, 1968 S,E D Perforated casing from 580 to 600
Drilling Co. 1 ft.
602 L.D. Yesry -- 1940± 700± 4 Tg 73± 110 1955 C,W D Reworked in 1955.
3 140 1962151.5 Aug. 7, 1968
702 King Ranch, Inc. Elmer Rupp 1951 534 6 Tg 90 127.5 Apr. 26, 1968 C,W S Alazan Well. 504 ft 6 in. casing;30 ft perforated, 4 1/4 in.estimated.
703 do. do. 1950 651 6 Tg 87 127.8 Aug. 20, 1968 C,W S Monte Verde Well. 30 ft perforated casing.
801 do. do. 1949 611 6 Tg 74 120.0 Aug. 22, 1968 C,W S Media Luna Well. Cemented top tobottom. 579 ft at 6 in. casing;40 ft, 5 3/16 in. screen.
901 Dr. Lee E. Bowen Water 1962 620 4 1/2 Tg 65± 114.4 Apr. 4, 1968 S,E D,S Screen from 600 to 620 ft. Pump
Blackwood Well Drilling 1 set at 121 ft in 1962. /
Co.
902 A.J. Klare R.C. Custer 1966 608 4 1/2 Tg 60± 102.5 Apr. 5, 1968 S,E D 4 1/2 in. casing from 0 to 60
Water Well 1 ft; perforated from 587 to 608
Service ft. Pump set at 147 ft in 1966.
903 A.M. White, Jr. -- -- 700± 5 Tg 65 116.1 Aug. 7, 1968 S,E D,S1/2
* 34-101 City of Carl Vickers 1957 884 16 Tg -- -- -— S,E P City Well #13. 16 in. casing
Ringsville Water Well 8 5/8 125 from 0 to 590 ft; 8 5/8 in.
Service casing, 490 to 884 ft. Pump setat 500 ft.
See footnotes st end of table.
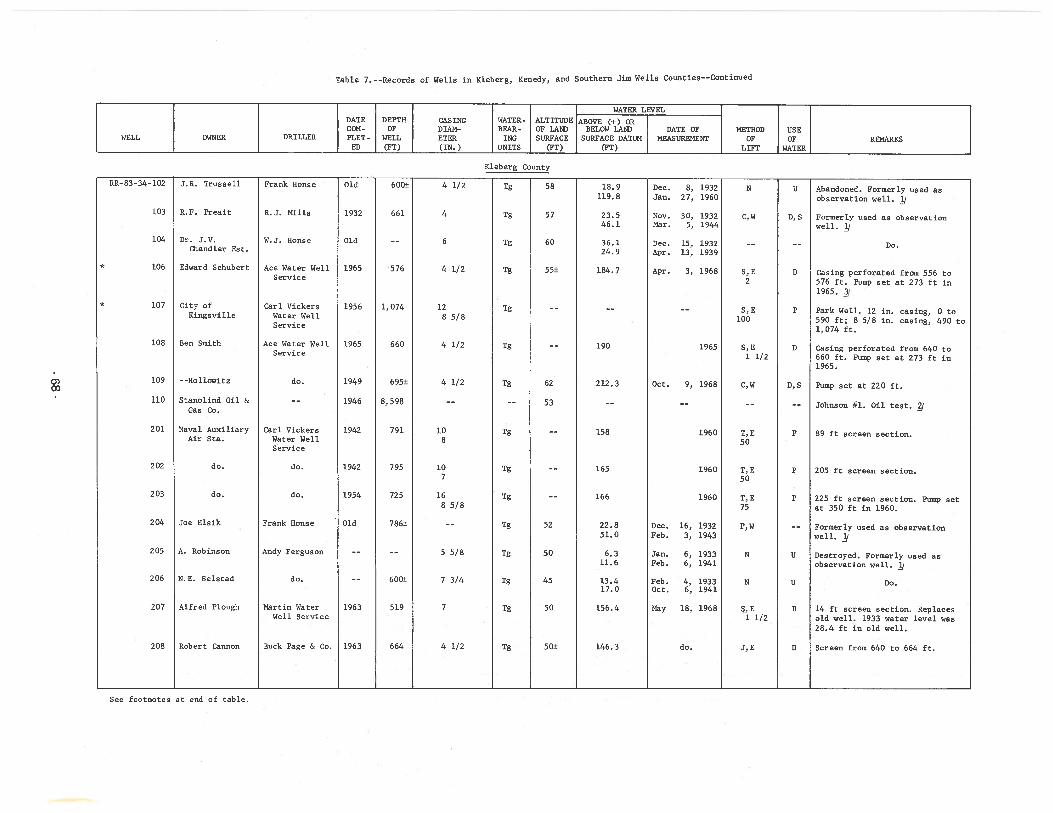
Table 7. --Records of Wells in Kleberg, Kenedy, and Southern Jim Wells Counties--Continued
WATER LEVELDATE DEPTH CASING WATER- ALTITUDE ABOVE (-f-) ORCOM- OF DIAM- BEAR- OF LAND BELOW LAND DATE OF METHOD USE
WELL OWNER DRILLER PLET- WELL ETER ING SURFACE SURFACE DATUM MEASUREMENT OF OF REMARKSED (PT) (IN.) UNITS (FT) (PT) LIFT WATER
Kleberg County
0)Co
RR-83-34-l02
103
104
* 106
* 107
108
109
110
201
202
203
204
205
206
207
208
J.R. Trussell
R.F. Preait
Dr. J.V.Chandler Est.
Edward Schubert
City ofKingsvi lie
Ben Smith
- -Hollowitz
Stanolind Oil &Gas Co.
Naval AuxiliaryAir Sta.
do.
do.
Joe Elsik
A. Robinson
N.E. Selstad
Alfred Plough
Robert Cannon
Frank Honse
R.J. Mills
W.J. Honse
Ace Water WellService
Carl VickersWater WellService
Ace Water WellService
do.
Carl VickersWater WellService
do.
do.
Frank Honse
Andy Ferguson
do.
Martin WaterWell Service
Buck Page & Co.
Old
1932
Old
1965
1956
1965
1949
1946
1942
1942
1954
Old
1963
1963
600± 4 1/2 Tg
661 4 Tg
-- 6 Tg
576 4 1/2 Tg
1,074 12 Tg8 5/8
660 4 1/2 Tg
695± 4 1/2 Tg
8,598 -- --
791 10 Tg
795 10 Tg
725 16 Tg8 5/8
786± —— Tg
-- 55/8 Tg
600± 7 3/4 Tg
519 7 Tg
664 4 1/2 Tg
58
57
60
55±
62
53
52
50
45
50
50±
18. 9119.8
23.546.1
36. 124.9
184.7
190
212. 3
158
165
166
22.851.0
6.311.6
13.417.0
156.4
146.3
Dec. 8, 1932Jan. 27, 1960
Nov. 30, 1932Mar. 5, 1944
Dec. 15, 1932Apr. 13, 1939
Apr. 3, 1968
1965
Oct. 9, 1968
1960
1960
1960
Dec. 16, 1932Feb. 3, 1943
Jan. 6, 1933Feb. 6, 1941
Feb. 4, 1933Oct. 6, 1941
May 18, 1968
do.
U
0, S
0
P
0
0, 5
P
P
P
U
U
D
N
C,W
5, E2
5, E100
5, E1 1/2
C, W
T, E50
T, E50
T, E75
P,W
N
N
S,E1 1/2
J, E
Abandoned. Formerly used asobservation well. /
Formerly used as observationwell.
Do.
Casing perforated from 556 to576 ft. Pump set at 273 ft in1965. /
Park Well. 12 in. casing, 0 to590 ft; 8 5/8 in. casing, 490 to1,074 ft.
Casing perforated from 640 to660 ft. Pump set at 273 ft in1965.
Pump set at 220 ft.
Johnson #1. Oil test. /
89 ft screen section.
205 ft screen section.
225 ft screen section. Pump setat 350 ft in 1960.
Formerly used as observationwell. /
Destroyed. Formerly used asobservation well.
Do.
14 ft screen section. Replacesold well. 1933 water level was28.4 ft in old well.
Screen from 640 to 664 ft.
See footnotes at end of table.
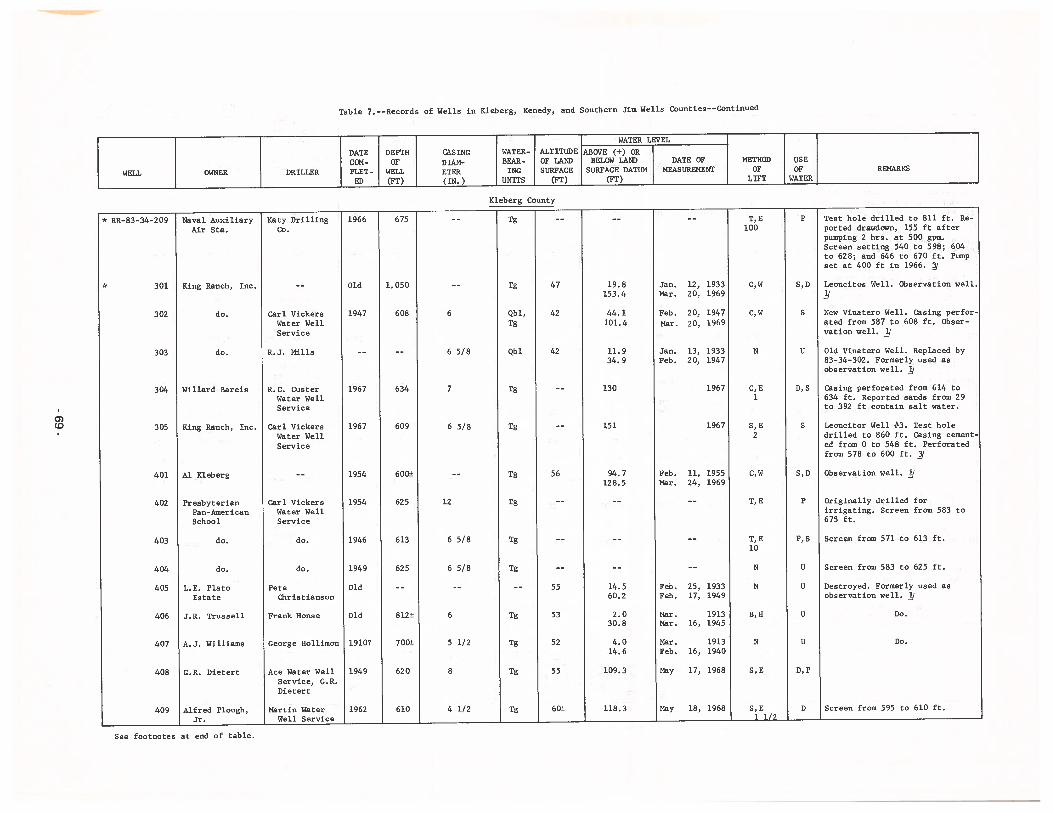
H ax:
H
U)
U)
OU
)
IU
)
xU
)z
ta)CCCC-,a)CCa)U,
C5.)a)0a),
-CCca-Ca)C‘a)5.)a)
-oa)Ca):3C5.)0a)0±a)
-na)H
CCC0‘a5.)a)-oa)
0a))U
)‘a
o‘a’—
’
‘aHx
)-
P.
C.-1
HU
)OP
a:3
U)
5H
’aU
)fl
flop.
-cStCCC00
-69-
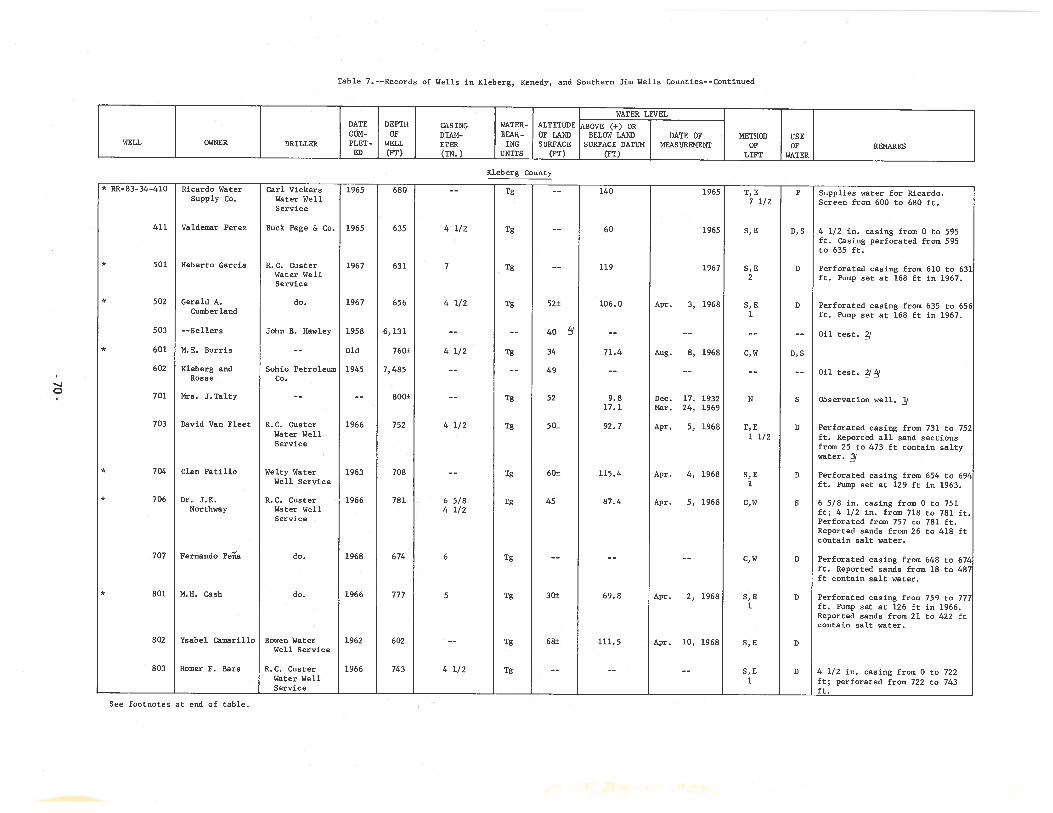
Table 7. --Records of Wells io Rleberg, Renedy, sod Southern Jim Wells Counties--Continued
Carl Vickers T,E Supplies water for Ricardo.Water Well 7 1/2 Screen from 600 to 680 ft.Service
Buck Page & Co. 4 1/2 io. casing from 0 to 595ft. Casing perforated from 595to 635 ft.
E.G. Custer Perforated casing from 610 to 631Water Well ft. Pump set at 168 ft in 1967.Service
do. Perforated casing from 635 to 656ft. Pump set at 168 ft in 1967.
Oil test.
Oil teat.
Oec. 17, 1932 Observation well. jMar. 24, 1969
R.C. Custer Apr. 5, 1968 Perforated casing from 731 to 752Water Well ft. Reported all sand sectionsService from 25 to 473 ft contain salty
water. f
Welty Water Apr. 4, 1968 Perforated casing from 654 to 694Well Service ft. Pump set at 129 ft in 1963.
R.C. Custer Apr. 5, 1968 6 5/8 in. casing from 0 to 751Water Well ft; 4 1/2 in. from 718 to 781 ft.Service Perforated from 757 to 781 ft.
Reported sands from 26 to 418 ftcontain salt water.
Fernando Pea Perforated casing from 648 to 674ft. Reported sands from 18 to 487ft contain salt water.
Perforated casing from 759 to 777ft. Pump set at 126 ft in 1966.Reported sands from 21 to 422 ftcontain salt water.
Bowen WaterWell Service
R.C. Custer 4 1/2 in. casing from 0 to 722Water Well ft; perforated from 722 to 743Service ft.
. WATER LEVELDATE DEPTH CASING WATER- ALTITUOE ABOVE (+) ORCON- OF DIAM- BEAR- OF LAND BELOW LAND DATE OF METHOD USE
WELL OWNER DRILLER PLET- WELL RTER 1MG SURFACE SURFACE DATUM MEASUREMENT OF OF REMARKSED (PT) (IN.) UNITS (PT) (PT) LIFT WATER
Rleberg County
-J0
Ricardo WaterSupply Co.
Valdemar Perez
Heberto Garcia
Gerald A.Cumberland
--Sellers
M.E. Burns
Eleberg andRoss e
Mrs. J.Tslty
David Van Fleet
Olan Patillo
Dr. J.R.Northway
John B. Hawley
Sohio PetroleumCo.
1965
1965
1967
Apr. 3, 1968
Aug. 8, 1968
* ER-83-34-410
411
* 501
* 502
503
* 601
602
701
703
* 704
* 706
707
* 801
802
803
1965
1965
1967
1967
1958
Old
1945
1966
1963
1966
1968
1966
1962
1966
680
635
631
656
6, 131
760±
7,465
600±
752
708
781
674
777
602
743
Tg
Ig
Tg
Tg
Tg
Tg
Tg
Tg
Tg
Tg
Tg
Tg
Tg
4 1/2
7
4 1/2
4 1/2
4 1/2
6 5/84 1/2
6
5
4 1/2
140
60
119
106.0
71.4
9.817.1
92. 7
115.4
87.4
69.8
111.5
52±
40
34
49
52
50±
60±
45
30±
68±
1/2
P
D, S
D
D
D,S
S
D
0
S
0
D
D
D
5, E
5, E2
5, E1
C, W
N
I, E1
5, E1
C,W
C,W
5, K1
5, E
S,E1
do.
do.M.H. Cash
Ysabel Camarillo
Homer F. Bars
Apr. 2, 1968
Apr. 10, 1968
See footnotes at end of table.
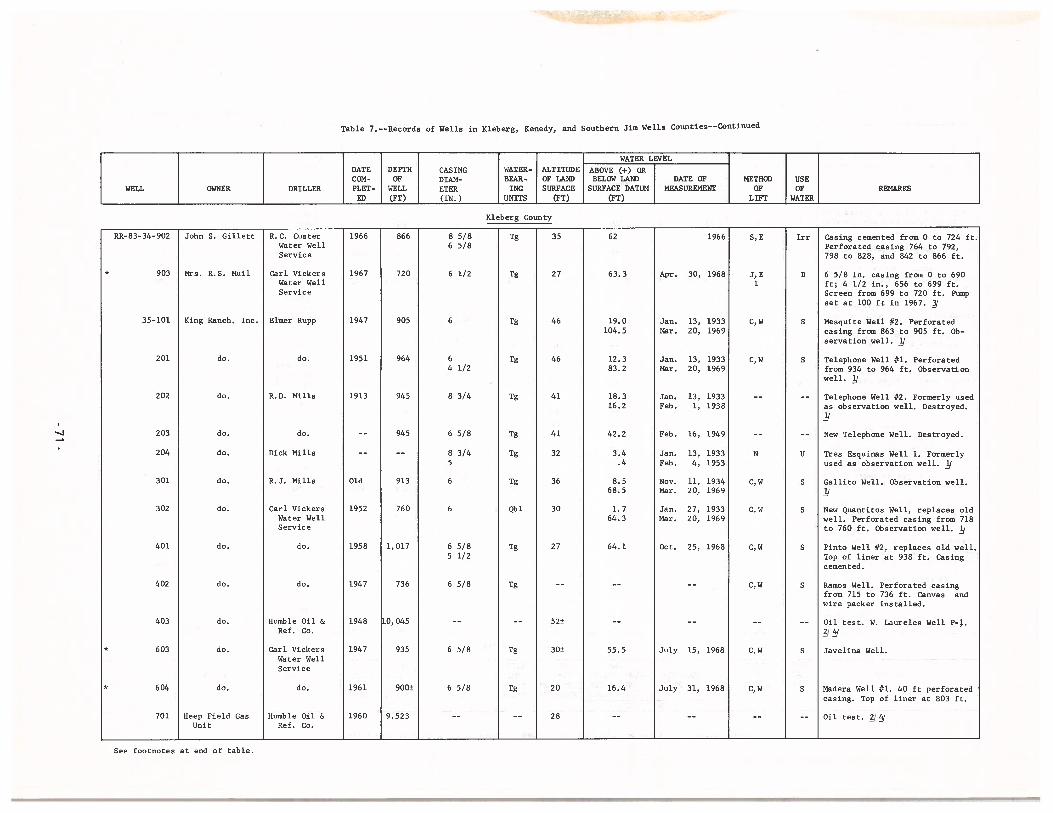
Table 7. --Records of Wells in Kleberg, Kenedy, snd Southern Jim Wells Counties-Continued
R.C. CusterWster WellService
Carl VickersWster WellService
King Ranch, Inc. Elmer Rupp
Carl VickersWater WellService
do.
Humble Oil &Ref. Co.
Carl VickersWater WellService
do.
[0, 045
6 1/2
6 5/85 1/2
6 5/8
6 5/8
Jan. 13, 1933Mar. 20, 1969
Jan. 13, 1933Mar. 20, 1969
Jan. 13, 1933Feb. 1, 1938
July 15, 1968
Casing cemented from 0 to 724 ft.Perforated casing 764 to 792,798 to 828, and 842 to 866 ft.
6 5/8 in. casing from 0 to 690ft; 4 1/2 in., 656 to 699 ft.Screen from 699 to 720 ft. Pumpset at 100 ft in 1967. /
Mesquite Well #2. Perforatedcasing from 863 to 905 ft. Observation well. /
Telephone Well #1. Perforatedfrom 934 to 964 ft. Observationwell.
Telephone Well #2. Formerly usedas observation well. Destroyed.
New Telephone Well. Destroyed.
Tres Esquinas Well 1. Formerlyused as observation well. /
Gallito Well. Observation well.
New Quantitos Well, replaces oldwell. Perforated casing from 718to 760 ft. Observation well. /
Pinto Well #2, replaces old well.Top of liner at 938 ft. Casingcemented.
Ramos Well. Perforated casingfrom 715 to 736 ft. Canvas andwire packer installed.
Oil test. W. Laureles Well P-J..
Javelins Well.
Madera Well #1. 40 ft perforatedcasing. Top of liner at 803 ft.
Oil test. //
John S. Gillett
Mrs. R.S. Muil
WATER LEVELDATE DEPTH CASING WATER- ALTITUDE ABOVE (+) ORCOM- OF DIAM- BEAR- OF LAND BELOW LAND DATE OF METHOD USE
WELL OWNER DRILLER PLET- WELL ETER 1MG SURFACE SURFACE DATUM MEASUREMENT OF OF REMARKSED (FT) (IN.) UNITS (FT) (FT) LIFT WATER
Kleberg County
8 5/86 5/8
1966
Apr. 30, 1968
do.
R.D. Mills
do.
Dick Mills
R.J. Mills
866
720
905
964
945
945
913
760
1, 017
736
RR-83-34-902
* 903
35—101
201
202
203
204
301
302
401
402
403
* 603
* 604
701
6
64 1/2
8 3/4
6 5/8
8 3/45
6
6
1966
1967
1947
1951
1913
Old
1952
1958
1947
1948
1947
1961
1960
Tg
Tg
Tg
Tg
Tg
Tg
Tg
Tg
Qb 1
Tg
Tg
Tg
Tg
do.
do.
do.
do.
do.
do.
do.
do.
do.
do.
do.
Heep Field GasUnit
Irr
0
S
S
U
S
S
S
S
35
27
46
46
41
41
32
36
30
27
52±
30±
20
28
62
63.3
19.0104.5
12.383.2
18.316.2
42.2
3.4.4
8.568.5
1.764.3
64.1
55.5
16.4
do.
Feb. 16, 1949
Jan. 13, 1933Feb. 4, 1953
Nov. 11, 1934Mar. 20, 1969
Jan. 27, 1933Mar. 20, 1969
Oct. 25, 1968
S, E
J, E1
C, W
C, W
N
C, W
C, W
C,W
C,W
C, W
C, W
6 5/8935
900±
9,523Humble Oil &Ref. Co.
July 31, 1968
See footnotes at end of table.
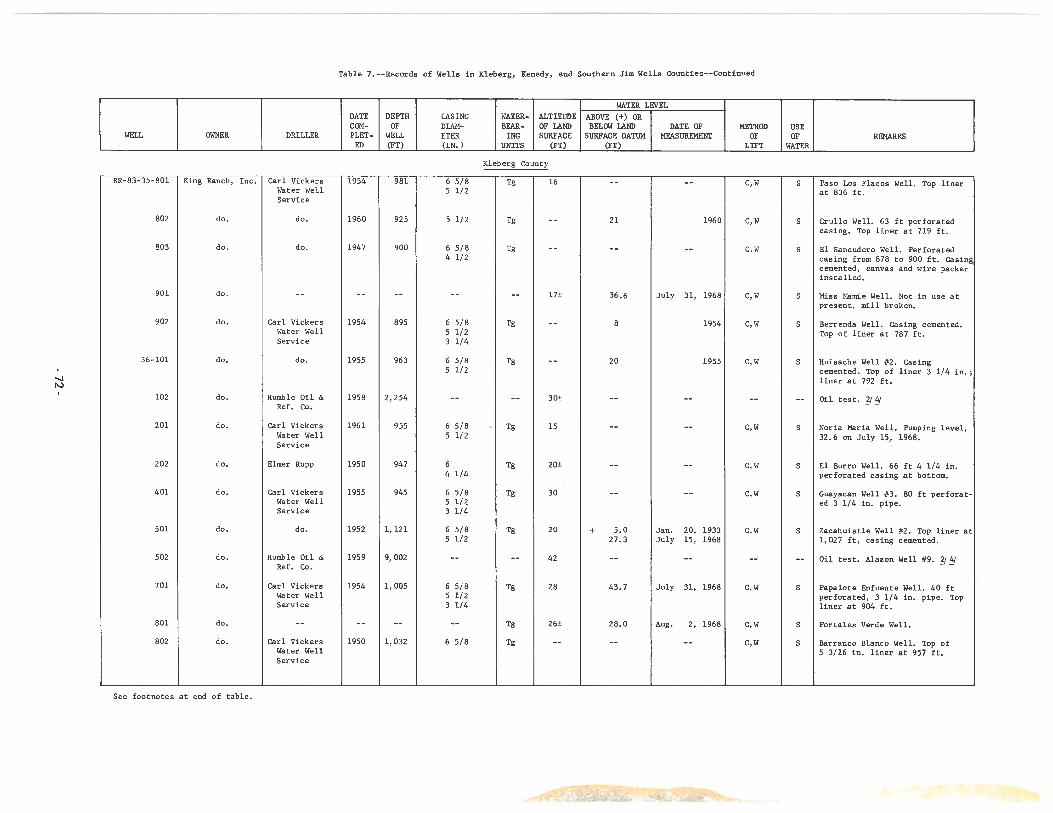
Table 7. --Recorda of Wella in Kleberg, Renedy, and Southern Jim Wella Countiea--Continued
.%Jri
WATER LEVEL
DATE DEPTH CASING WATER- ALTITUDE ABDVE (+) DRCDN- OF DIAN- BEAR- OF LAND BELOW LAND DATE OF METHOD USE
WELL OWNER DRILLER PLET - WELL ETER 1MG SURFACE SURFACE DATUM MEASUREMENT OP OF REMARKSED (Fl) (TM.) UMTTS (Fl) (PT) LIFT WATER
Rleberg County
RR-83-35-BOl Ring Ranch, Inc. Carl Vickera 1954 981 6 5/B Tg 16 -- —- C,W S Paso Los Flacoa Well. Top linerWater Well 5 1/2 at 636 ft.Service
602 do. do. 1960 925 5 1/2 Tg -- 21 1960 C,W S Grullo Well. G3 ft perforatedcasing. Top liner at 719 ft.
803 do. do. 1947 900 6 5/8 Tg -- -- -- C,W S El Sancudero Well. Perforated4 1/2 casing from 878 to 900 ft. Casing
cemented, canvas and wire packerinstalled.
901 do. -- -- -- —--— 17± 36.6 July 31, 1968 C,W S Miss Mamie Well. Not in use ar
present, mill broken.
902 do. Carl Vickers 1954 895 6 5/8 Tg -- 8 1954 C,W S Berrenda Well. Casing cemented.Water Well 5 1/2 Top of liner at 787 ft.Service 3 1/4
36-101 do. do. 1955 963 6 5/8 Tg -— 20 1955 C,W S Muisache Well #2. Casing5 1/2 cemented. Top of liner 3 1/4 in.
liner at 792 ft.
102 do. Mumble Oil & 1958 2,254 -- -- 30± -- -- -- -- Oil test.Ref. Co.
201 do. Carl Vickers 1961 955 6 5/8 - Tg 15 -- -- C,W S Mona Maria Well. Pumping level,Water Well 5 1/2 32.6 on July 15, 1968.Service
202 do. Elmer Rupp 1950 947 6 Tg 20± —- -- C,W S El Burro Well. 66 ft 4 1/4 in.4 1/4 perforated casing at bottom.
401 do. Carl Vickers 1955 945 6 5/8 Tg 3D -- -— C,W S Guayacan Well #3. 80 ft perfonatWater Well 5 1/2 ed 3 1/4 in. pipe.Service 3 1/4
501 do. do. 1952 1,121 6 5/8 Tg 20 + 5.0 Jan. 20, 1933 C,W S Zacahuistle Well #2. Top liner at5 1/2 27.3 July 15, 1968 1,027 ft, casing cemented.
502 do. Mumble Oil & 1959 9,002 -- -- 42 -- -- -- -- Oil test. Alazon Well #9. //Ref. Co.
701 do. Carl Vickers 1954 1,005 6 5/8 Tg 28 43.7 July 31, 1968 C,W S Papalote Enfuente Well. 40 ftWater Well 5 1/2 perforated, 3 1/4 in. pipe. TopService 3 1/4 liner at 904 ft.
801 do. -- -- -- -- Tg 26± 28.0 Aug. 2, 1968 C,W S Portales Verde Well.
802 do. Carl Vickers 1950 1,032 6 5/8 Tg -- -- -- C,W S Barranco Blanco Well. Top ofWater Well 5 3/16 in. liner at 957 ft.Service
See footnotes at end of table.
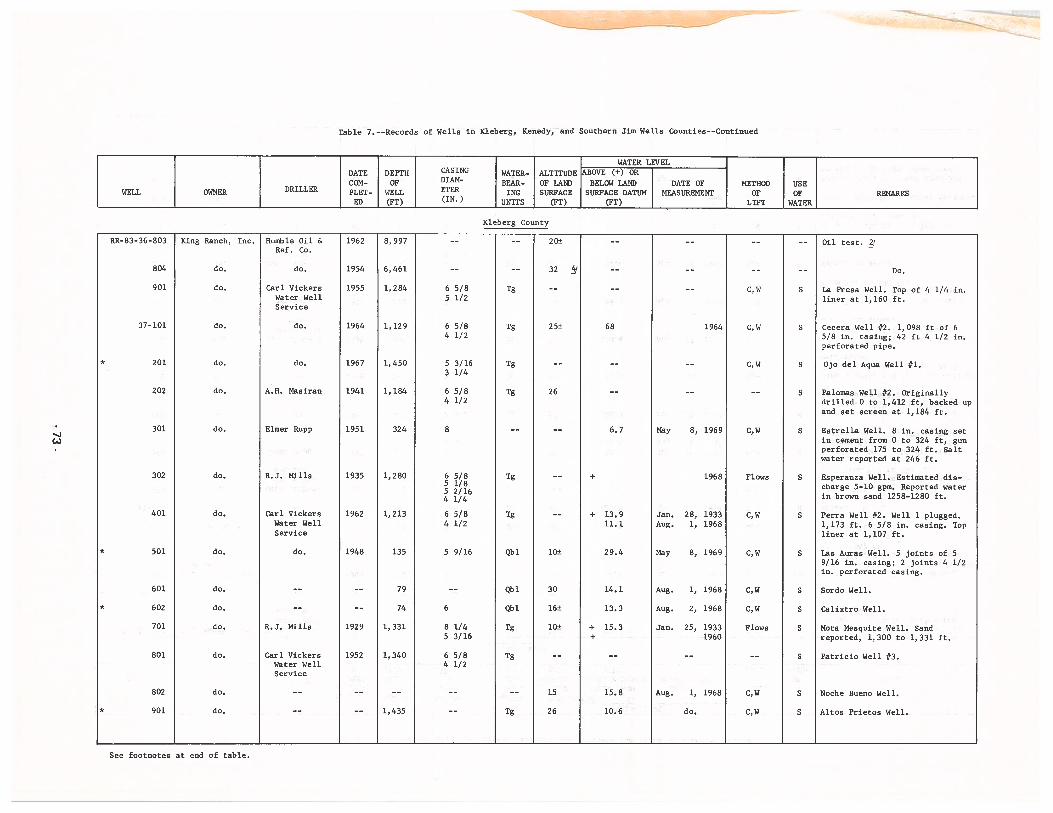
Table 7.--Records of Wells in Kleberg, Kenedy, and Southern Jim Wells Counties--Continued
WATER LEVELDATE DEPTH CASING WATER- ALTITUDE ABDVE (+) ORCOM- OF DIAL- BEAR- OF LAND BELOW LAND DATE OF METHOD USE
WELL OWNER DRILLER PLET- WELL ETER INC SURFACE SURFACE DATUM MEASUREMENT OF OF REMARKSED (Fl) (IN.) UNITS (PT) (PT) LIFT WATER
Rleberg County
RR-83-36-NO3 Kiog Ranch, Inc. Mumble Oil & 1962 8,997 -- -— 20± -- -- -- -- Oil test. /Ref. Co.
804 do. do. 1954 6, 461 -- -- 32 4W -- —- -- -- Do.
901 do. Carl Vickers 1955 1,284 6 5/8 Tg -— -— —- C,W S La Press Well. Top of 4 1/4 in.Water Well 5 1/2 liner at 1,160 ft.Service
37-101 do. do. 1964 1,129 6 5/8 Tg 25± 68 1964 C,W S Cecera Well #2. 1,098 ft of 64 1/2 5/8 in. casing; 42 ft 4 1/2 in.
perforated pipe.
* 201 do. do. 1967 1,450 5 3/16 Tg -- -- -- C,W S Ojo del Aqua Well #1.3 1/4
202 do. A.M. Masirsn 1941 1,184 6 5/8 Tg 26 -- -— -— S Palomas Well #2. Originally4 1/2 drilled 0 to 1,412 ft, backed up
and set screen at 1,184 ft.
301 do. Elmer Rupp 1951 324 8 —— -— 6.7 May 8, 1969 C,W S Estrella Well. 8 in. casing setin cement from 0 to 324 ft, gunperforated 175 to 324 ft. Saltwater reported at 246 ft.
302 do. R.J. Mills 1935 1,280 6 5/8 Tg -- + 1968 Plows S Esperansa Well. Estimated dis—5 1/8 charge 5-10 gpm. Reported water5 2/16 in brown sand 1258-12 80 ft.
401 do. Carl Vickers 1962 1,213 6 5/8 Tg -- + 13.9 Jan. 28, 1933 C,W S Perra Well #2. Well 1 plugged.Water Well 4 1/2 11.1 Aug. 1, 1968 1,173 ft. 6 5/8 in. casing. TopService liner at 1,107 ft.
501 do. do. 1948 135 5 9/16 Qbl 10± 29.4 May 8, 1969 C,W S Las Auras Well. 5 joints of 59/16 in. casing; 2 joints 4 1/2in. perforated casing.
601 do. -- —- 79 -— Qbl 30 14.1 Aug. 1, 1968 C,W S Sordo Well.
* 602 do. —— —— 74 6 Qbl 16± 13.3 Aug. 2, 1968 C,W S Calixtro Well.
701 do. R.J. Mills 1929 1,331 8 1/4 Tg 10± + 15.3 Jan. 25, 1933 Flows S Mota Mesquite Well. Sand5 3/16 + 1960 reported, 1,300 to 1,331 ft.
801 do. Carl Vickers 1952 1,340 6 5/8 Tg —- —- —- -- S Patricio Well #3.Water Well 4 1/2Service
802 do. —— —— —- -— -- 15 15.8 Aug. 1, 1968 C,W S Noche Bueno Well.
* 901 do. -- -- 1,435 -— Tg 26 10.6 do. C,W S Altos Prietos Well.
See footnotes at end of table.
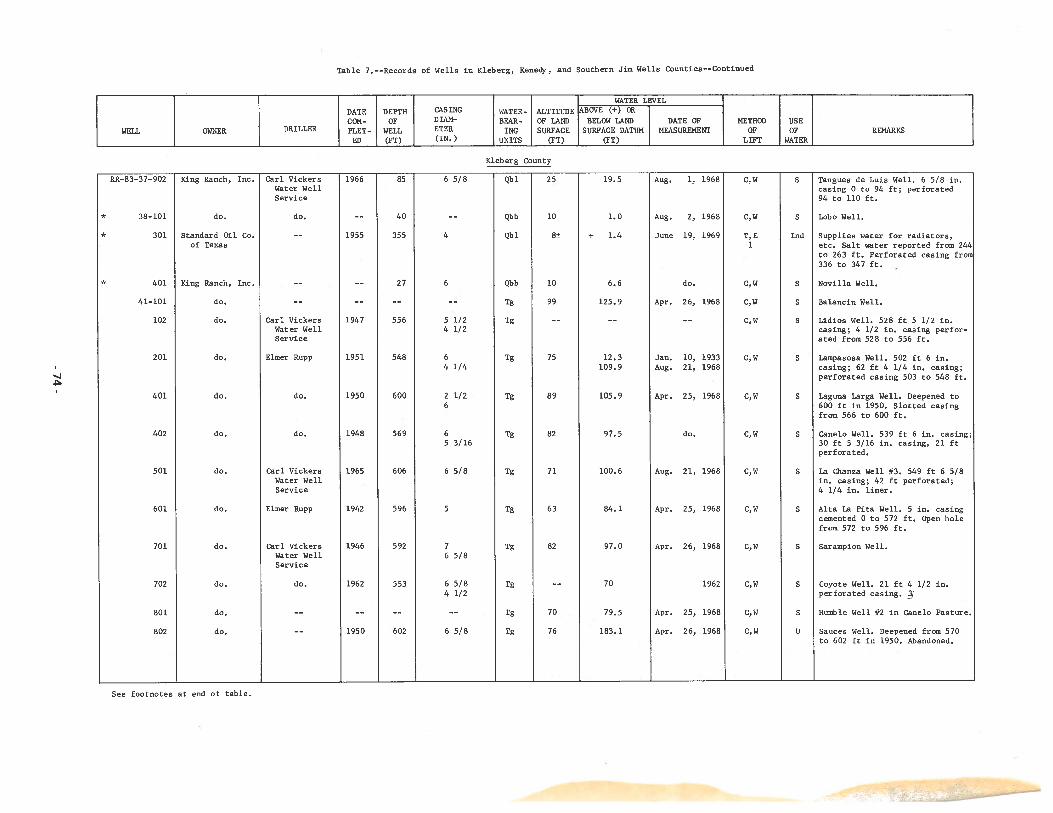
Table 7.--Records of Wells in Kleberg, Kenedy, and Southern Jim Wells Counties--Continued
WATER LEVEL
DATE DEPTH CASING WATER- ALTITUDE ABOVE (+) OR
CON- OF DIAM- BEAR- OF LAND BELOW LAND DATE OF METHOD USEWELL OWNER DRILLER PLET - WELL ETER 1MG SURFACE SURFACE DATUM MEASUREMENT OF OP REMARKS
ED (PT) (IN.) UNITS (PT) CFT) LIFT WATER
Rleberg County
RR-B3-37-902 King Ranch, Inc. Carl Vickers 1966 B5 6 5/B Qbl 25 19.5 Aug. 1, 1968 C,W S Tangues de Luis Well. 6 5/8 in.Water Well casing 0 to 94 ft; perforatedService 94 to 110 ft.
* 38-101 do. do. -— 40 -- Qbb 10 1.0 Aug. 2, l96B C,W S Lobo Well.
301 Standard Oil Co. -- 1955 355 4 Qbl B± + 1.4 June 19, 1969 T,E md Supplies water for radiators,of Texas 1 etc. Salt water reported from 244
to 263 ft. Perforated casing fror336 to 347 ft.
401 King Ranch, Inc. -- -- 27 6 Qbb 10 6.6 do. C,W S Novilla Well.
41-101 do. -- -- —— -- Tg 99 125.9 Apr. 26, 1968 C,W S Balancin Well.
102 do. Carl Vickers 1947 556 5 1/2 Tg -— —- —- C,W S Lidios Well. 528 ft 5 1/2 in.Water Well 4 1/2 casing; 4 1/2 in. casing perforService ated from 528 to 556 ft.
201 do. Elmer Rupp 1951 548 6 Tg 75 12.3 Jan. 10, 1933 C,W S Lsmpasosa Well. 502 ft 6 in.4 1/4 109.9 Aug. 21, 1968 casing; 62 ft 4 1/4 in. casing;
perforated casing 503 to 54B ft.
401 do. do. 1950 600 2 1/2 Tg B9 105.9 Apr. 25, 1968 C,W S Laguna Larga Well. Deepened to6 600 ft in 1950. Slotted casing
from 566 to 600 ft.
402 do. do. 1948 569 6 Tg 82 97.5 do. C,W S Canelo Well. 539 ft 6 in. casing;5 3/16 30 ft 5 3/16 in. casing, 21 ft
perforated.
501 do. Carl Vickers 1965 606 6 5/B Tg 71 100.6 Aug. 21, 1966 C,W S LA Chanza Well #3. 549 ft 6 5/8Water Well in. casing; 42 ft perforated;Service 4 1/4 in. liner.
601 do. Elmer Rupp 1942 596 5 Tg 63 84.1 Apr. 25, 1968 C,W S Alta LA Pita Well. 5 in. casingcemented 0 to 572 ft. Open holefrom 572 to 596 ft.
701 do. Carl Vickers 1946 592 7 Tg 82 97.0 Apr. 26, 1968 C,W S Sarampion Well.Water Well 6 5/8Service
702 do. do. 1962 553 6 5/8 Tg -— 70 1962 C,W S Coyote Well. 21 ft 4 1/2 in.4 1/2 perforated casing. /
801 do. -— —— —- —— Tg 70 79.5 Apr. 25, 1968 C,W S Humble Well #2 in Canelo Pasture.
802 do. —- 1950 602 6 5/8 Tg 76 183.1 Apr. 26, 1968 C,W U Sauces Well. Deepened from 570to 602 ft in 1950. Abandoned.
See footnotes at end of table.
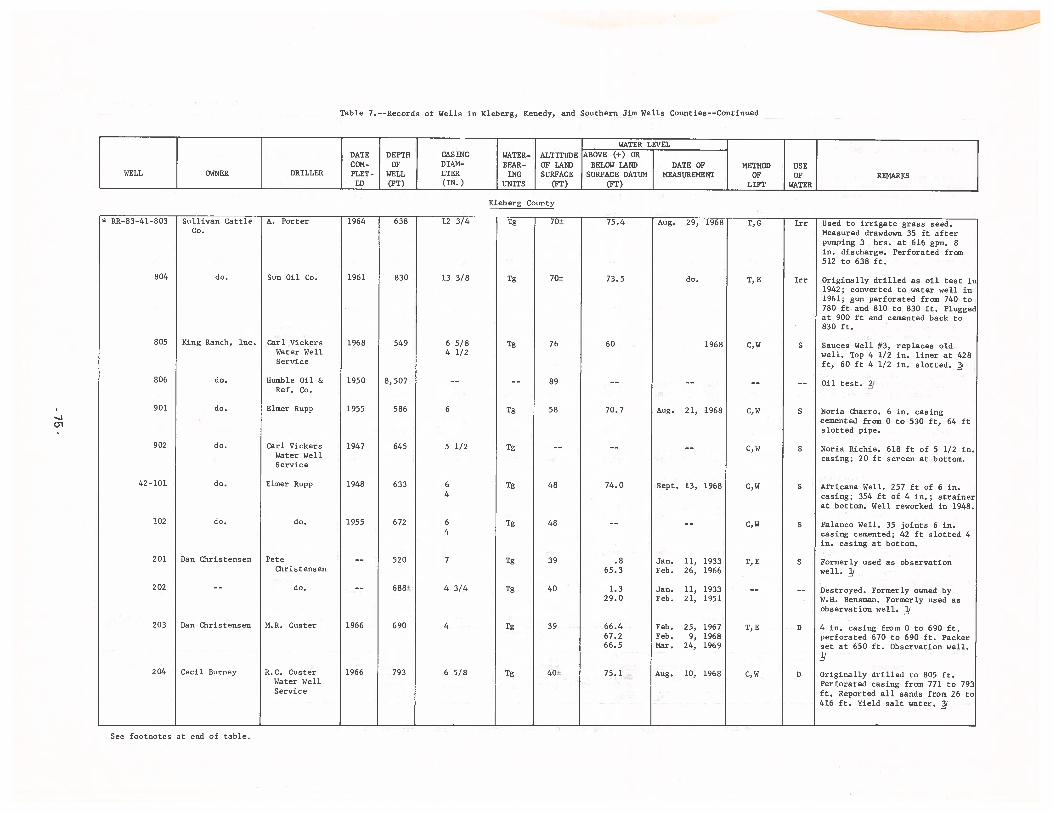
—4(71
Table 7. --Records of Wells in Rleberg, Renedy, and Southern Jim Wells Counties--Continued
WATER LEVELDATE DEPTH CASING WATER- ALTITUDE ABOVE (-i-) ORCON- OP OTAN- BEAR- OP LAND BELOW LAND DATE OP METHOD USE
WELL OWNER DRILLER PLET - WELL ETER ING SURFACE SURFACE DATUM MEASUREMENT OP OP REMARKSED (PT) (IN.) UNITS (PT) (PT) LIFT WATER
Rleberg County
* RR-83-41-803 Sullivan Cattle A. Porter - 1964 638 12 3/4 Tg 70± 75.4 Aug. 29, 1968 T,G Irr Used to irrigate grass seed.Co. Measured drawdown 35 ft after
pumping 3 hrs. at 616 gpm. 8in. discharge. Perforated from512 to 638 ft.
804 do. Sun Oil Co. 1961 830 13 3/8 Tg 70± 73.5 do. T,E Irr Originally drilled as oil test ir1942; converted to water well in1961; gun perforated from 740 to
. 780 ft and 810 to 830 ft. Pluggedat 900 ft and cemented back to830 ft.
805 King Ranch, Inc. Carl Vickers 1968 549 6 5/8 Tg 76 60 1968 C,W S Sauces Well #3, replaces oldWater Well 4 1/2 well. Top 4 1/2 in. liner at 428Service ft, 60 ft 4 1/2 in. slotted. /
806 do. Humble Oil & 1950 8,507 -- -- 89 —- -— -— —— Oil test.Ref. Co.
901 do. Elmer Rupp 1955 586 6 Tg 58 70.7 Aug. 21, 1968 C,W S Mona Charro. 6 in. casingcemented from 0 to 530 ft, 64 ftslotted pipe.
902 do. Carl Vickers 1947 645 5 1/2 Tg -— -- —— C,W S Mona Richie. 618 ft of 5 1/2 in.Water Well casing; 20 ft screen at bottom.Service
42-101 do. Elmer Rupp 1948 633 6 Tg 48 74.0 Sept. 13, 1968 C,W S Africans Well. 257 ft of 6 in.4 casing; 354 ft of 4 in.; strainer
at bottom. Well reworked in 1948.
102 do. do. 1955 672 6 Tg 48 -— -- C,W S Palanco Well. 35 joints 6 in.4 casing cemented; 42 ft slotted 4
in. casing at bottom.
201 Dan Christensen Pete -- 520 7 Tg 39 .8 Jan. 11, 1933 T,E S Formerly used as observationChristensen 65.3 Feb. 26, 1966 well.
202 -- do. -- 688± 4 3/4 Tg 40 1.3 Jan. 11, 1933 -- -- Destroyed. Formerly owned by29.0 Feb. 21, 1951 W.N. Bensman. Formerly used as
observation well. ]/203 Dan Christensen M.R. Custer 1966 690 4 Tg 39 66.4 Feb. 25, 1967 T,E 0 4 in. casing from 0 to 690 ft,
67.2 Feb. 9, 1968 perforated 670 to 690 ft. Packer66.5 Mar. 24, 1969 set at 650 ft. Observation well.
2/204 Cecil Burney R.G. Custer 1966 793 6 5/8 Tg 40± 75.1 Aug. 10, 1968 C,W o originally drilled to 805 ft.
Water Well Perforated casing from 771 to 793Service ft. Reported all sands from 26 to
416 ft. Yield salt water.
See footnotes at end of table.
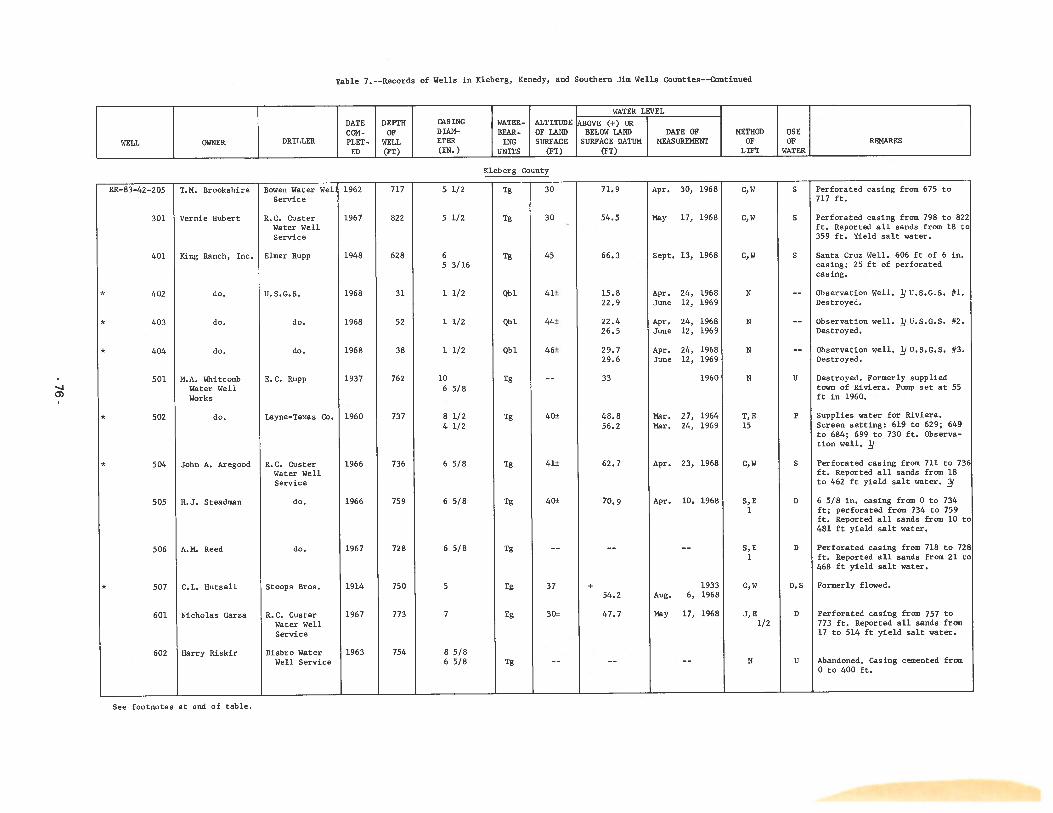
Table 7. --Records of Wells in Kleberg, Kenedy, and Southern Jim Wells Counties--Continued
P01-83-42-205
King Ranch, Inc.
M.A. WhitcoabWater WellWorks
John A. Aregood
Harry Riskir
Bowen WaterService
R.C. CusterWater WellService
Elmer Rupp
Layne-Texas Co.
R.C. CusterWater WellService
do.
R.C. CusterWater WellService
Disbro WaterWell Service
Apr. 30, 1968
May 17, 1968
1933Aug. 6, 1968
Nay 17, 1968
Perforated casing from 675 to717 ft.
Perforated casing from 798 to 822ft. Reported all sands from 18 to359 ft. Yield salt water.
Santa Cruz Well. 606 ft of 6 in.casing; 25 ft of perforatedcasing.
Observation Well. J U.S.G.S. #1.Destroyed.
Observation well. liU.S.G.S. #2.Destroyed.
Observation well. J U.S.G.S. #3.Destroyed.
Destroyed. Formerly suppliedtown of Riviera. Pump set at 55ft in 1960.
Supplies water for Riviera.Screen setting: 619 to 629; 649to 684; 699 to 730 ft. Observation well. 21
Perforated casing from 711 to 736ft. Reported all sands from 18to 462 ft yield salt water. /
6 5/8 in. casing from 0 to 734ft; perforated from 734 to 759ft. Reported all sands from 10 to481 ft yield salt water.
Perforated casing from 718 to 728ft. Reported all sands from 21 to468 ft yield salt water.
Formerly flowed.
Perforated casing from 757 to773 ft. Reported all sands from17 to 514 ft yield salt water.
Abandoned. Casing cemented from0 to 400 ft.
T.M. Brookshire
Veroie Hubert
WATER LEVEL
DATE DEPTH CASING WATER- ALTITUDE ABOVE (+) ORCOM- OP DIAM- BEAR- OP LAND BELOW LAND DATE OF METHOD USE
WELL OWNER DRILLER PLET- WELL ETER 1MG SURFACE SURFACE DATUM MEASUREMENT OF OP REMARKS
ED (FT) (IN.) UNITS (FT) (FT) LIFT WATER
Kleberg County
do.
do.
do.
—I0)
U.S.G.S.
do.
do.
E.C. Rupp
Sept. 13, 1966
301
401
* 402
* 403
* 404
501
* 502
* 504
505
506
* 507
601
602
do.
Apr.June
Apr.June
Apr.June
Wel 1962
1967
1948
1968
196B
196B
1937
1960
1966
1966
1967
1914
1967
1963
24, 196812, 1969
24, 196812, 1969
24, 196612, 1969
1960
717
822
628
31
52
38
762
737
736
759
726
750
773
754
3D
30
45
41±
44±
46±
40±
41±
40±
37
30±
5 1/2
5 1/2
65 3/16
1 1/2
1 1/2
1 1/2
106 5/B
8 1/24 1/2
6 5/B
6 5/B
6 5/B
5
7
B 5/B6 5/B
Tg
Tg
Tg
Qbl
Qbl
Qbl
Tg
Tg
Tg
Tg
Tg
Tg
Tg
Tg
71.9
54.5
66.3
15. B22.9
22.426.5
29.729.6
33
4B.B56.2
62.7
70.9
54.2
47.7
N.J. Steadmao
A.M. Reed
C.L. Hutsell
Nicholas Garra
C, W
C, W
C, W
N
N
N
N
T, E15
C, W
5, E1
5, E1
C,W
J, E1/2
N
S
S
S
U
P
S
D
0
0,5
D
U
Mar. 27, 1964Mar. 24, 1969
Apr. 23, 1966
Apr. lO 1968
do.
Stoops Bros.
See footnotes at end of table.
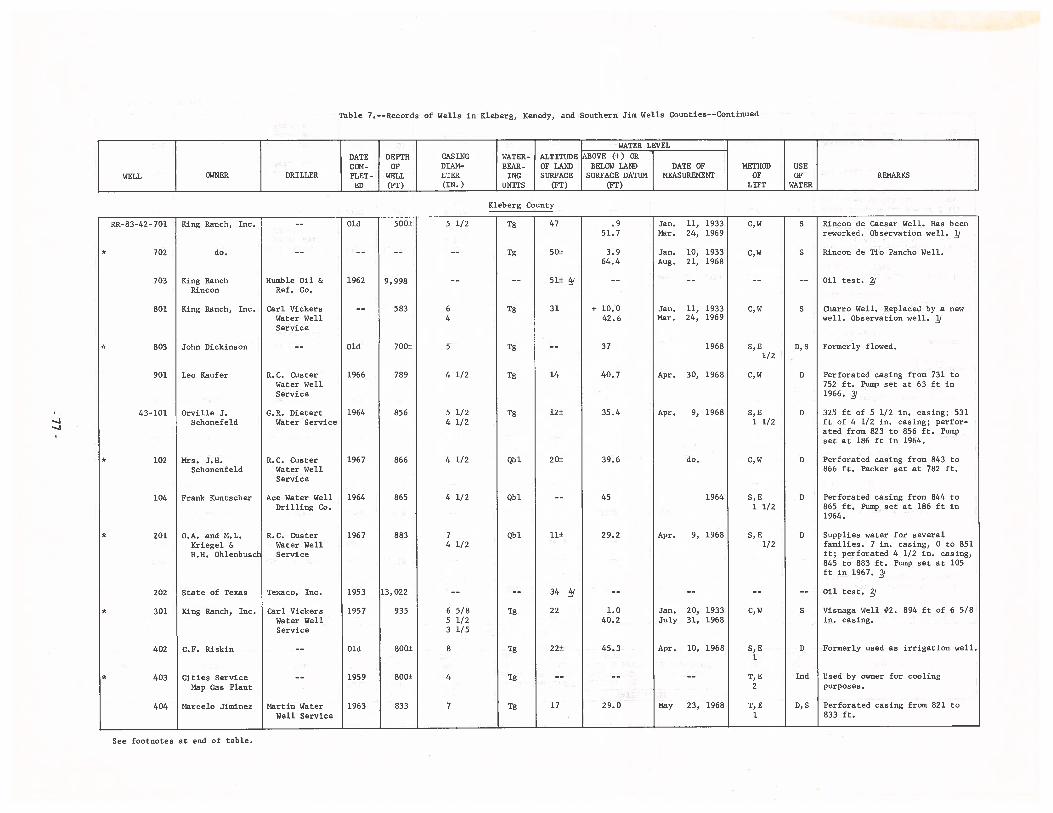
Table 7. --Records of Wells io Kleberg, Reoedy, and Southern Jim Wells counties--Continued
RR-83-42-701 King Ranch, Inc.
King RanchRincon
Ring Ranch, Inc.
State of Texas
King Ranch, Inc.
Cities ServiceNap Gas Plant
Marcelo Jimines
Humble Oil &Ref. Co.
Carl VickersWater WellService
R.C. CusterWater WellService
G.K. OietertWater Service
R.C. CusterWater WellService
Ace Water WellDrilling Co.
Texaco, Inc.
Carl VickersWater WellService
Martin WaterWell Service
.951.7
3.964.4
+ 10.042.6
Jan. 11, 1933Mar. 24, 1969
Jan. 10, 1933Aug. 21, 1968
Jan. 11, 1933Mar. 24, 1969
1968
Apr. 9, 1968
Jan. 20, 1933July 31, 1968
Apr. 10, 1968
Rincon de Caesar Well. Has beenreworked, observation well. ]/
Rincon de Tio Pancho Well.
Oil test.
Charro Well. Replaced by a newwell. Observation well. 4
Formerly flowed.
Perforated casing from 731 to752 ft. Pump set at 63 ft in1966. /
325 ft of 5 1/2 in. casing; 531ft of 4 1/2 in. casing; perforated from 823 to 856 ft. Pumpset at 186 ft in 1964.
Perforated casing from 843 to866 ft. Packer set at 782 ft.
Perforated casing from 844 to865 ft. Pump set at 186 ft in1964.
Supplies water for severalfamilies. 7 in. casing, 0 to 851ft; perforated 4 1/2 in. casing,845 to 883 ft. Pump set at 105ft in 1967. /
Oil test. 4
Visnaga Well #2. 894 ft of 6 5/8in. casing.
Formerly used as irrigation well.
Used by owner for coolingpurposes.
Perforated casing from 821 to833 ft.
do.
WATER LEVEL
DATE DEPTH CASING WATER- ALTITUDE IBOVE (+) ORCON- OF DIAL- SEAR- OF LAND BELOW LAND DATE OF METHOD USE
WELL OWNER DRILLER FLET- WELL ETER 1MG SURFACE SURFACE DATUM MEASUREMENT OF OF REMARKSED (FT) (IN.) UNITS (PT) (PT) LIFT WATER
Kleberg County
John Dickinson
Leo Kaufer
Orville J.Schonefeld
Mrs. J.N.Schonenfeld
Frank Kuntacher
* 702
703
801
* 803
901
43-101
* 102
104
* 201
202
* 301
402
* 403
404
Apr. 30, 1968
Old
1962
Old
1966
1964
1967
1964
1967
1953
1957
Old
1959
1963
iOO±
9,998
583
700±
789
856
866
865
883
13,022
935
800±
800±
833
5 1/2
64
5
4 1/2
5 1/24 1/2
4 1/2
4 1/2
74 1/2
6 5/85 1/23 1/5
8
4
7
Tg
Tg
Tg
Tg
Tg
Tg
Qbl
Qbl
Qbl
Tg
Tg
Tg
Tg
47
50±
51± 4
31
14
12±
20±
11±
34 4
22
22±
17
O.A. and N.L. R.C. CusterKriegel & Water WellM.M. Ohlenbuech Service
C,W
C, W
C, W
5, K1/2
C,W
5, E1 1/2
C,W
5, K1 1/2
5, K1/2
C, W
5, E1
I, E2
T, K1
S
S
S
D, S
D
D
D
S
S
S
S
Ind
0, 5
do.
1964
Apr. 9, 1968
37
40.7
35.4
39.6
45
29.2
1.040.2
45.3
29.0
C.F. Riskin
May 23, 1968
See footnotes st end of table.
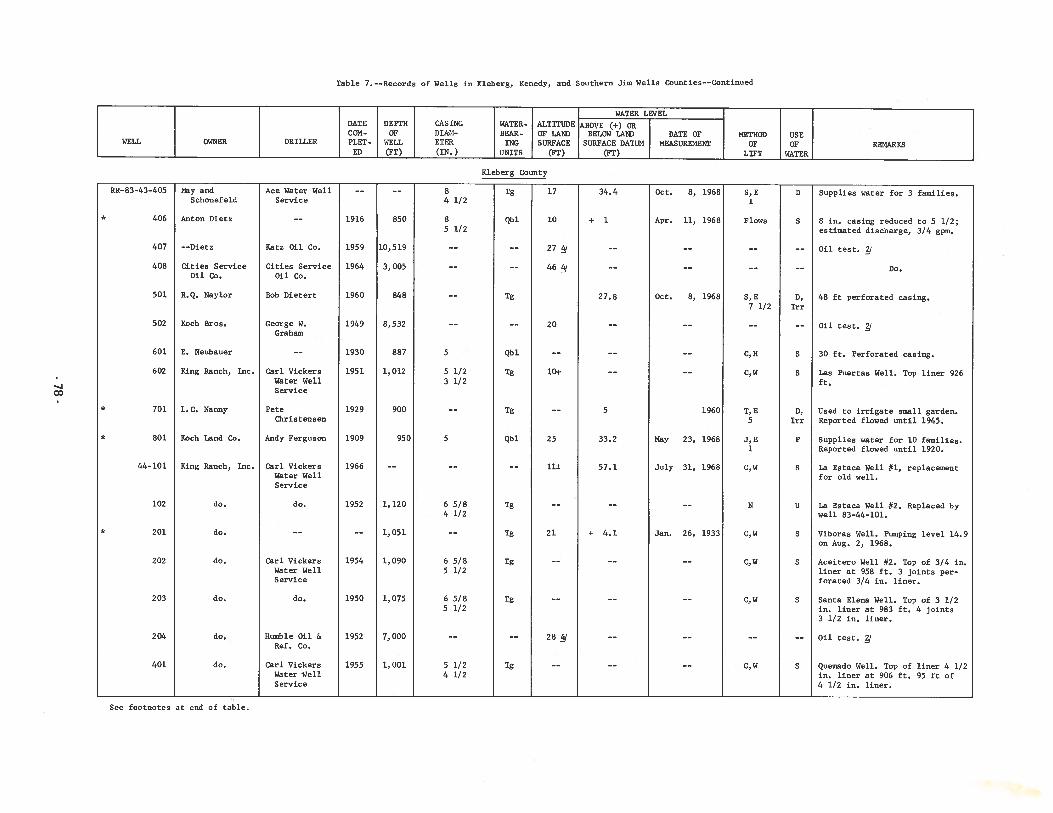
Table 7. --Records of Wells in Kleberg, Kenedy, and Southern Jim Wells counties--Continued
WATER LEVELDATE DEPTH CASING WATER- ALTITUDE ABDVE (+) ORCOM- OF 01kM- BEAR- OF LAND BELOW LAND DATE OP METHOD USE
WELL OWNER DRILLER PLET- WELL ETER 1MG SURFACE SURFACE DATUM MEASUREMENT OP OP REMARKSED (PT) (IN.) UNITS (PT) (PT) LIFT WATER
Rleberg County
.%JGD
Oct. 8, 1968
Apr. 11, 1968
Oct. B, 1968
RE- B3-43-405
* 406
407
4DB
501
502
601
602
* 701
* 801
44-101
102
* 201
202
203
204
401
May andSchonefeld
Anton Dietz
--Dietz
Cities ServiceOil Co.
R.Q. Naylor
Koch Bros.
E. Neubauer
King Ranch, Inc.
L.C. Nanny
Koch Land Co.
King Ranch, Inc.
do.
do.
do.
do.
do.
do.
Ace Water WellService
Katz Oil Co.
Cities ServiceOil Co.
Bob Dietert
George K.Graham
Carl VickersWater WellService
PeteChristensen
Andy Ferguson
Carl VickersWater WellService
do.
Carl VickersWater WellService
do.
Mumble Oil &Ref. Co.
Carl VickersWater WellService
1916
1959
1964
1960
1949
1930
1951
1929
1909
1966
1952
1954
1950
1952
1955
34.4
+1
27.8
5
33.2
57,1
+ 4.1
850
10,519
3, 005
848
8,532
887
1, 012
900
950
1, 120
1,051
1,090
1,075
7, DOD
1, 001
B4 1/2
B5 1/2
5
5 1/23 1/2
5
6 5/B4 1/2
6 5/B5 1/2
6 5/B5 1/2
5 1/24 1/2
Tg
Qbl
Tg
Qbl
Tg
Tg
Qbl
Tg
Tg
Tg
Tg
Tg
17
10
274
464
20
lOi
25
11±
21
2B4
S,E1
Plows
5, E7 1/2
C, B
C, W
T, E5
3, E1
C, W
N
C, W
C, W
C, W
C,W
D
S
D,Irr
S
S
D,Irr
P
S
U
S
S
S
S
1960
196B
1968
1933
Supplies water for 3 families.
B in. casing reduced to 5 1/2;estimated discharge, 3/4 gpm.
Oil test. /
Do.
48 ft perforated casing.
Oil test. g/
30 ft. Perforated casing.
Las Puertas Well. Top liner 926ft.
Used to irrigate small garden.Reported flowed until 1945.
Supplies water for 10 families.Reported flowed until 1920.
La Estaca Well #1, replacementfor old well.
La Estaca Well #2. Replaced bywell 83—44-101.
Viboras Well. Pumping level 14.9on Aug. 2, 196B.
Aceitero Well #2. Top of 3/4 in.liner at 958 ft. 3 joints perforated 3/4 in. liner.
Santa Elena Well. Top of 3 1/2in. liner at 9B3 ft. 4 joints3 1/2 in. liner.
Oil test. J
Quemado Well. Top of liner 4 1/2in. liner at 906 ft. 95 ft of4 1/2 in. liner.
Nay 23,
July 31,
Jan. 26,
See footnotes st end of table.
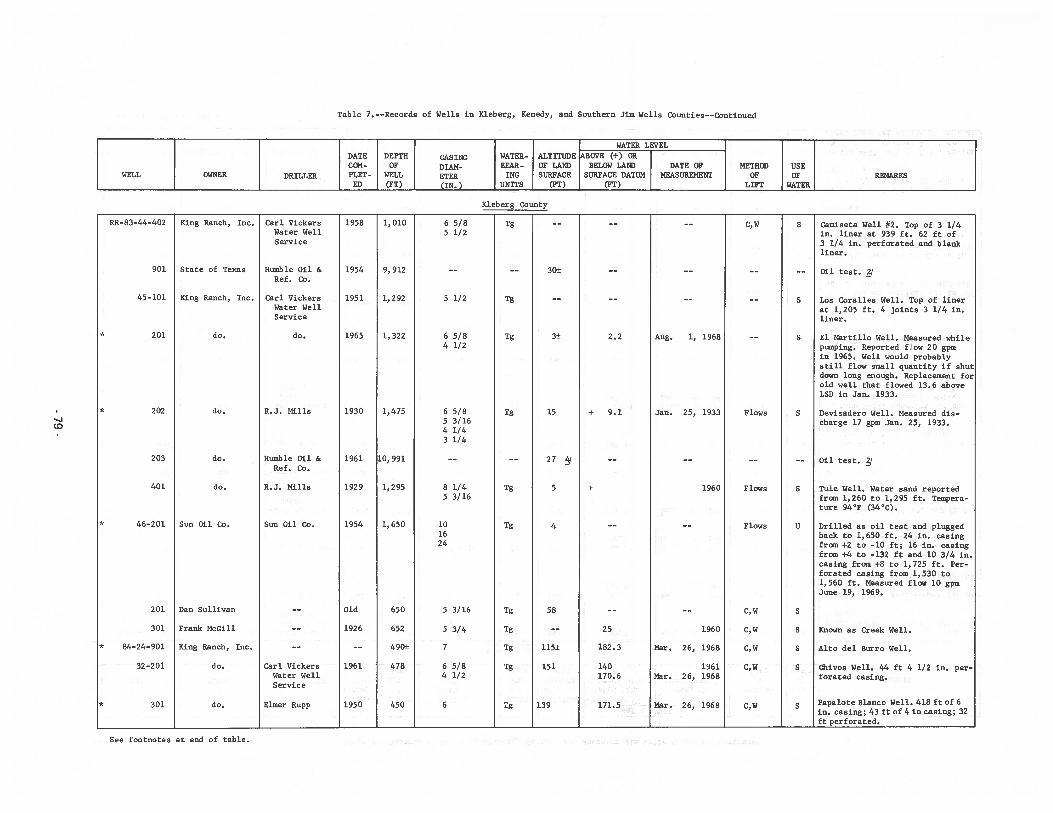
Table 7. --Records of Wells in Kleberg, Kenedy, and Southern Jim Wells Counties--Continued
WATER LEVELDATE DEPTH CASING WATER.- ALTITUDE tBDVE (+) ORCON- OF DIAM- BEAR- OF LAND BELOW LAND DATE OF NETNOD USE
WELL OWNER DRILLER FLET - WELL ETER ING SURFACE SURFACE DATUN NEASURENENT OF OF REMARKSED (FT) (IN.) UNITS (FT) (PT) LIFT WATER
KleberN County
RR-83-44-402 King Ranch, Inc. Carl Vickers 1958 1,010 6 5/8 Tg C,W S Camiseta Well #2. Top of 3 1/4Water Well 5 1/2 in. liner at 939 ft. 62 ft ofService 3 1/4 in. perforated and blank
liner.
901 State of Texas Mumble Oil & 1954 9,912 30± Oil test.Ref. Co.
45-101 King Ranch, Inc. Carl Vickers 1951 1,292 5 1/2 Tg S Los Coralles Well. Top of linerWater Well at 1,205 ft. 4 joints 3 1/4 in.Service liner.
* 201 do. do. 1965 1,322 6 5/8 Tg 3± 2.2 Aug. 1, 1968 5 El Martillo Well. Measured while4 1/2 pumping. Reported flow 20 gpm
in 1965. Well would probablystill flow small quantity if shutdown long enough. Replacement forold well that flowed 13.6 aboveLSD in Jan. 1933.
* 202 do. R.J. Mills 1930 1,475 6 5/8 Tg 15 + 9.1 Jan. 25, 1933 Plows S Devisadero Well. Measured dis5 3/16 charge 17 gpm Jan. 25, 1933.41/431/4
203 do. Mumble Oil & 1961 10,991 27 / Oil test. /Ref. Co.
401 do. R.J. Mills 1929 1,295 8 1/4 Tg 5 + 1960 Plows S Tule Well. Water sand reported5 3/16 from 1,260 to 1,295 ft. Tempera
ture 94P (34CC).
* 46-201 Sun Oil Co. Sun Oil Co. 1954 1,650 10 Tg 4 Plows U Drilled as oil test and plugged16 back to 1,650 ft. 24 in. casing24 from +2 to -10 ft; 16 in. casing
from +4 to -132 ft and 10 3/4 in.casing from +8 to 1,725 ft. Perforated casing from 1,530 to1,560 ft. Measured flow 10 gpmJune 19, 1969.
201 Dan Sullivan Old 650 5 3/16 Tg 58 -- C,W S
301 Prank McGill 1926 652 5 3/4 Tg -- 25 1960 C,W S Known as Creek Well.
* 84-24-901 King Ranch, Inc. —- -- 490± 7 Tg 115± 182.3 Mar. 26, 1968 C,W S Alto del Burro Well.
32—201 do. Carl Vickers 1961 478 6 5/8 Tg 151 140 1961 C,W S Ohivos Well. 44 ft 4 1/2 in. per—Water Well 4 1/2 170.6 Mar. 26, 1968 forated casing.Service
* 301 do. Elmer Rupp 1950 450 6 Tg 139 171.5 Mar. 26, 1968 C,W Papalote Blanco Well. 418 ft of 6in. casing; 43 ft of 4 in casing; 32ft perforated.
See footnotes at end of table.
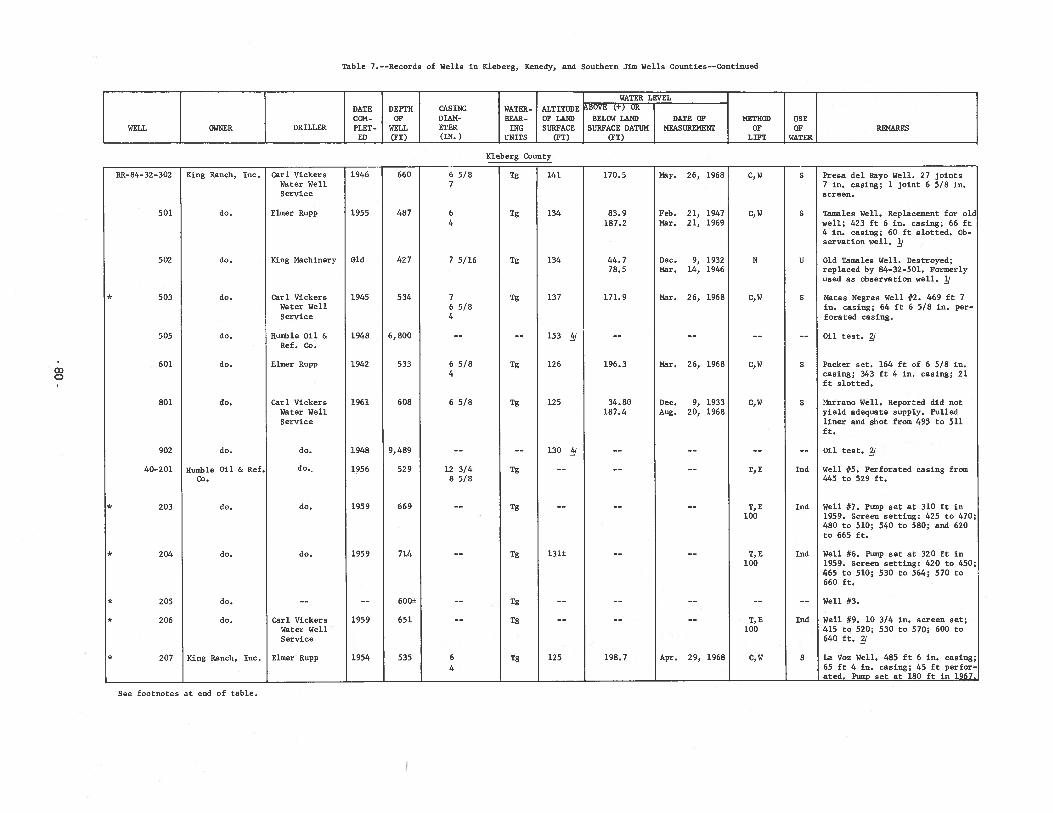
Table 7. --Records of Wells in Kleberg, Kenedy, and Southern Jim Wella Countiea——Continued
Carl VickersWater WellService
Elmer Rupp
King Machinery
Carl VickeraWater WellService
Humble Oil &Ref. Co.
Elmer Rupp
Carl VickeraWater WellService
Carl VickeraWater WellService
Feb. 21, 1947Mar. 21, 1969
Dec. 9, 1932Mar. 14, 1946
Dec. 9, 1933Aug. 20, 1968
Preaa del Rayo Well. 27 joints7 in. casing; 1 joint 6 5/8 in.screen.
Tamales Well. Replacement for oldwell; 423 ft 6 in. casing; 66 ft4 in. casing; 60 ft slotted. Observation well.
Old Tamales Well. Destroyed;replaced by 84-32-501. Formerlyused as observation well. f
Matas Hegras Well #2. 469 ft 7in. casing; 64 ft 6 5/8 in. perforated casing.
Oil test. J
Packer set. 164 ft of 6 5/8 in.casing; 343 ft 4 in. casing; 21ft slotted.
Marrano Well. Reported did notyield adequate supply. Pulledliner and shot from 495 to 511ft.
Oil test. gj
Well #5. Perforated casing from445 to 529 ft.
Well #7. Pump set at 310 ft in1959. Screen setting: 425 to 470;480 to 510; 540 to 580; and 620to 665 ft.
Well #6. Pump set at 320 ft in1959. Screen setting: 420 to 450;465 to 510; 530 to 564; 570 to660 ft.
Well #3.
Well #9. 10 3/4 in. screan set;415 to 520; 530 to 570; 600 to640 ft. /
La Voz Well. 485 ft 6 in. casing;65 ft 4 in. casing; 45 ft perforated. Pumn set at 180 ft in 1967.
WATER LEVEL
DATE DEPTH CASING WATER.- ALTITUDE £BDVE (+) OR
CON- OF DIAN- BEAR- OF LAND BELOW LAND DATE OF METHOD USEWELL OWNER DRILLER PLET- WELL ETER INC SURFACE SURFACE DATUM MEASUREMENT OF OF REMARKS
ED (FT) (IN.) UNITS (FT) (FT) LIFT WATER
Kleberg County
May. 26, 1968
OD0
King Ranch, Inc.
do.
do.
do.
do.
do.
do.
do.
Mumble Oil & Ref.Co.
do.
do.
do.
do.
RR-84—32—302
501
502
* 503
505
601
801
902
40-201
* 203
* 204
* 205
* 206
* 207
Mar. 26, 1968
Mar. 26, 1968
1946
1955
Old
1945
1948
1942
1961
1948
1956
1959
1959
1959
1954
660
487
427
534
6, 800
533
608
9,489
529
669
714
600±
651
535
6 5/87
64
7 5/16
76 5/84
6 5/84
6 5/8
12 3/48 5/B
6
4
Tg
Tg
Tg
Tg
Tg
Tg
Tg
Tg
Tg
Tg
Ig
Ig
141
134
134
137
153 /
126
125
130
131±
125
170.5
83.9187.2
44.778.5
171.9
196.3
34.80187.4
198.7
do.
do.
do.
do.
C, W
C, W
N
C, W
C, W
C, W
I, K
T, E100
I, E100
I, E100
C, W
S
S
U
S
S
S
Ind
Ind
Ind
Ind
SRing Ranch, Tnc. Elmer Rupp
See footnotes at end of table.
Apr. 29, 1968
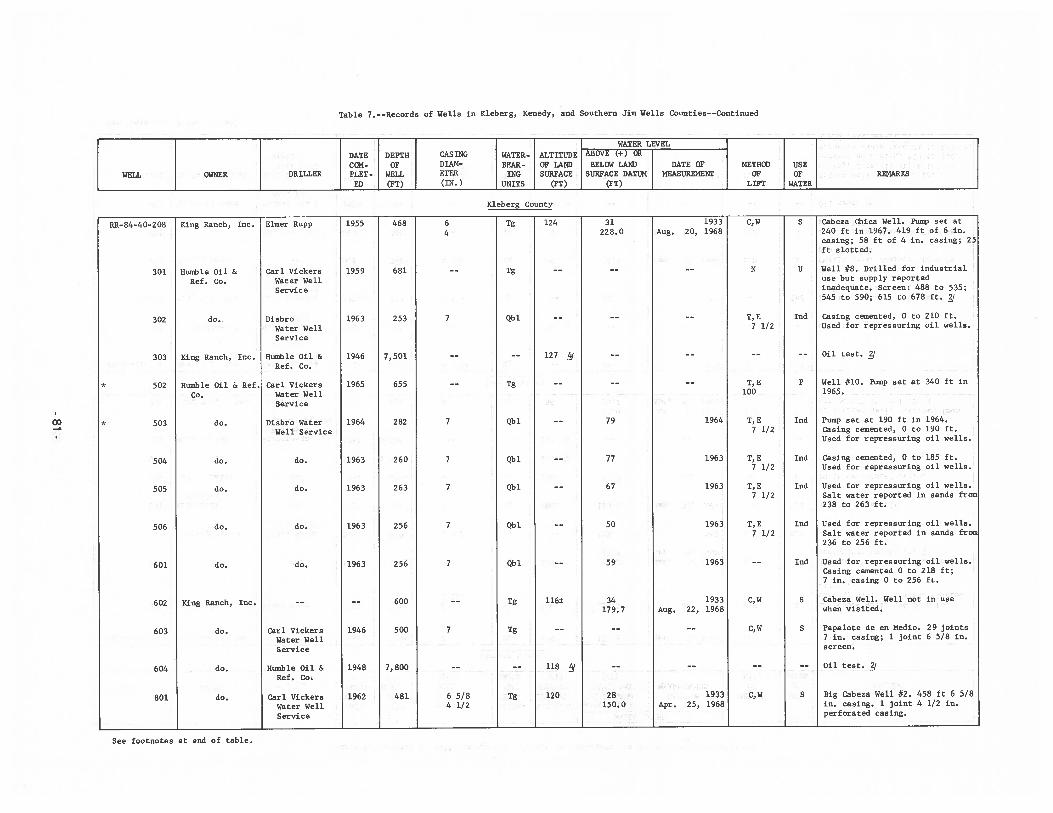
Table 7. --Records of Wells in Kleberg, Kenedy, and Southern Jim Wells Counties--Continued
WATER LEVEL
DATE DEPTH CASINC WATER- ALTITUDE ABOVE (+) OR
COW- OF 0MM- BEAR- OF LAND BELOW LAND DATE OF METHOD USEWELL OWNER DRILLER FLET- WELL ETER 1MG SURFACE SURFACE DATUM MEASUREMENT OF OF REMARKS
ED (FT) (IN.) UNITS (FT) (FT) LIFT WATER
Kleberg County
*
*OD
RR-84-40-208
301
302
303
502
503
504
505
506
601
602
603
604
801
King Ranch, Inc.
Humble Oil &Ref. Co.
do.
King Ranch, Inc.
Humble Oil & Ref.Co.
do.
do.
do.
do.
do.
King Ranch, Inc.
do.
do.
do.
Elmer Rupp
Carl VickersWater WellService
DisbroWater WellService
Humble Oil &Ref. Co.
Carl VickersWater WellService
Disbro WaterWell Service
do.
do.
do.
do.
Carl VickersWater WellService
Humble Oil &Ref. Co.
Carl VickersWater WellService
1955
1959
1963
1946
1965
1964
1963
1963
1963
1963
1946
1948
1962
468
681
253
7,501
655
282
260
263
256
256
600
500
7,800
481
64
7
7
7
7
7
7
7
6 5/84 1/2
Tg
Tg
Qbl
Tg
Qbl
Qbl
Qbl
Qbl
Qbl
Tg
Tg
Tg
124
127
116±
118 3q
120
31228,0
79
77
67
50
59
34179.7
28150.0
1933Aug. 20, 1968
1964
1963
1963
1963
1963
1933Aug. 22, 1968
1933Apr. 25, 1968
C, W
N
I, E7 1/2
T, K100
I, K7 1/2
T, K7 1/2
T, K7 1/2
T, K7 1/2
C, W
C, W
C, W
S
U
Ind
P
md
md
Ind
md
Ind
S
S
S
Cabeza cjhica Well. Fump set at240 ft in 1967. 419 ft of 6 in.casing; 58 ft of 4 in. casing; 25ft slotted.
Well #8. Drilled for industrialuse but supply reportedinadequate. Screen: 488 to 535;545 to 590; 615 to 678 ft. J
Casing cemented, 0 to 210 ft.Used for repressuring oil wells.
Oil test. 4J
Well #10. Pump set at 340 ft in1965.
Pump set at 190 ft in 1964.Casing cemented, 0 to 190 ft.Used for repressuring oil wells.
Casing cemented, 0 to 185 ft.Used for repressuring oil wells.
Used for repressuring oil wells.Salt water reported in sands from238 to 263 ft.
Used for repressuring oil wells.Salt water reported in sands frcs236 to 256 ft.
Used for repressuring oil wells.Casing cemented 0 to 218 ft;7 in. casing 0 to 256 ft.
Cabeza Well. Well not in usewhen visited.
Papalote de en Medio. 29 joints7 in. casing; 1 joint 6 5/8 in.screen.
Oil test.
Big Cabeza Well #2. 458 ft 6 5/8in. casing. 1 joint 4 1/2 in.perforated casing.
See footnotes at end of table.
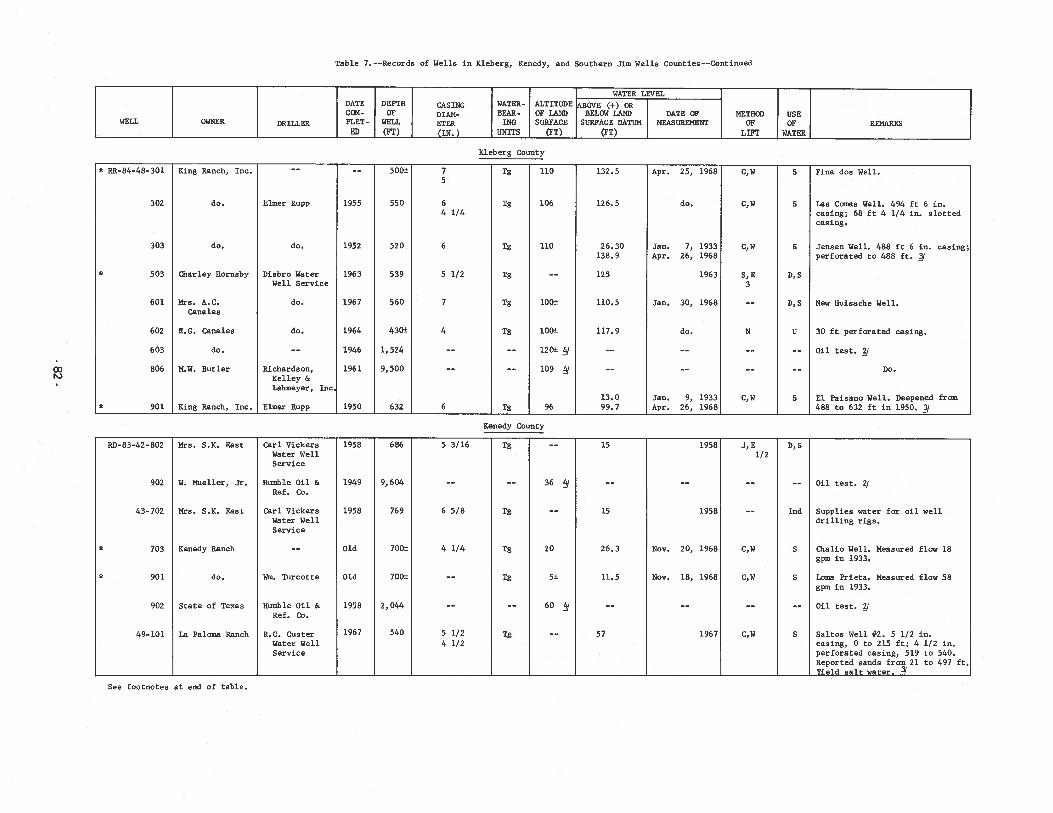
Table 7. --Records of Wells in Kleberg, Kenedy, and Southern Jim Wells Counties-—Continued
r%)
WATER LEVELDATE DEPTH CASING WATER- ALTITUDE EOVE (+) ORCOM- OF DIAN- BEAR- OF LAND BELOW LAND DATE OF METHOD USE
WELL OWNER DRILLER PLET- WELL ETER 1MG SURFACE SURFACE DATUM MEASUREMENT OF OF REMARKS._________ ED (FT) (IN.) UNITS (FT) (FT) LIFT WATER
Kleberg County
* RR-84-48-301 King Ranch, Inc. -- -- 500± 7 Tg 110 132.5 Apr. 25, 1968 C,W S Fina dos Well.5
302 do. Elmer Rupp 1955 550 6 Tg 106 126.5 do. C,W S Las Comas Well. 494 ft 6 in.4 1/4 casing; 68 ft 4 1/4 in. slotted
casing.
303 do. do. 1952 520 6 Tg 110 26.30 Jan. 7, 1933 C,W S Jensen Well. 488 ft 6 in. casing;138.9 Apr. 26, 1968 perforated to 488 ft. J
* 503 Gharley Hornsby Disbro Water 1963 539 5 1/2 Tg —— 125 1963 S,E D,SWell Service 3
601 Mrs. A.C. do. 1967 560 7 Tg 100± 110.5 Jan. 30, 1968 -- D,S New Huisache Well.Canales
602 E.G. Canales do. 1964 430± 4 Tg 100± 117.9 do. N U 30 ft perforated casing.
603 do. -— 1946 1,524 —- —— 120± -— —- —- —— Oil test. j
806 M.W. Butler Richardson, 1961 9,500 -- -- 109 / -- -- ---- Do.
Kelley &Lahmeyer, Inc
13.0 Jan. 9, 1933 C,W S El Paisano Well. Deepened from* 901 King Ranch, Inc. Elmer Rupp 1950 632 6 Tg 96 99.7 Apr. 26, 1968 488 to 632 ft in 1950. j
Kenedy County
RD—83-42—802 Mrs. S.K. East Carl Vickers 1958 686 5 3/16 Tg —— 15 1958 J,E D,SWater Well 1/2Service
902 W. Mueller, Jr. Humble Oil & 1949 9,604 -- —- 36 / —- -- —-—— Oil test. /
Ref. Co.
43—702 Mrs. S.K. East Carl Vickers 1958 769 6 5/8 Tg —— 15 1958 -— Ind Supplies water for oil wellWater Well drilling rigs.Service
* 703 Kenedy Ranch -- Old 700± 4 1/4 Tg 20 26.3 Nov. 20, 1968 C,W S Chalio Well. Measured flow 18gpm in 1933.
* 901 do. Wm. Turcotte Old 700± -- Tg 5± 11.5 Nov. 18, 1968 C,W S Loma Prieta. Measured flow 58gpm in 1933.
902 State of Texas Humble Oil & 1958 2,044 —— —- 60 —— —— —— —— Oil test. /Ref. Co.
49-101 La Paloma Ranch R.C. Custer 1967 540 5 1/2 Tg —— 57 1967 C,W S Saltos Well #2. 5 1/2 in.Water Well 4 1/2 casing, 0 to 215 ft; 4 1/2 in.Service perforated casing, 519 to 540.
Reported sands from 21 to 497 ft.Yield_salt_water.
See footnotes at end of table.
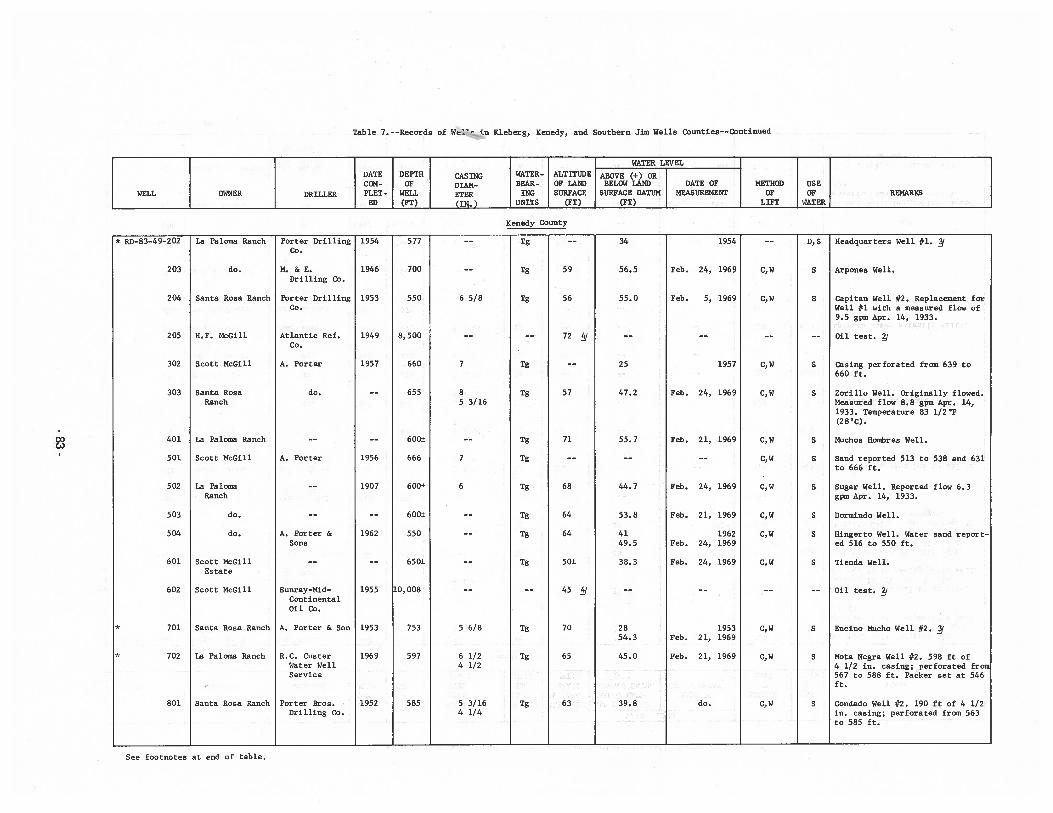
Table 7. --Records of WeI’&n Kleberg, Kenedy, and Southern Jim Wells Counties-—Continued
WATER LEVEL
DATE DEPTH CASING WATER.- ALTITUDE ABOVE (+) ORCOM- OF DIAN- BEAR- OF LAND BELOW LANI) DATE OF METHOD USE
WELL OWNER DRILLER PLET- WELL ETER ING SURFACE SURFACE DATUM MEASUREMENT OF OF REMARKSED (FT) (‘N.) UNITS (FT) (FT) LIFT WATER
Kenedy County
* RD-83-49—2O2 La Paloma Ranch Porter Drilling 1954 577 Tg -- 34 1954 -- D,S Headquarters Well #1. /Co.
203 do. M. & E. 1946 700 -- Tg 59 56.5 Feb. 24, 1969 C,W S Arpones Well.Drilling Co.
204 Santa Rosa Ranch Porter Drilling 1953 550 6 5/8 Tg 56 55.0 Feb. 5, 1969 C,W S Capitan Well #2. Replacement forCo. Well #1 with a measured flow of
9.5 gpm Apr. 14, 1933.
205 H.F. McGill Atlantic Ref. 1949 8,500 —- 72 —— —— —— Oil test.Co.
302 Scott McGill A. Porter 1957 660 7 Tg —— 25 1957 C,W S Casing perforated from 639 to660 ft.
303 Santa Rosa do. 655 8 Tg 57 47.2 Feb. 24, 1969 C,W S Zorillo Well. Originally flowed.Ranch 5 3/16 Measured flow 8.8 gpm Apr. 14,
1933. Temperature 83 l/2’F(28CC).
401 La Paloma Ranch -- —- 600± Tg 71 55.7 Feb. 21, 1969 C,W S Muchos Hombres Well.(A)
501 Scott McGill A. Porter 1956 666 7 Tg -- -- -- C,W S Sand reported 513 to 538 and 631to 666 ft.
502 La Paloma 1907 600± 6 Tg 68 44.7 Feb. 24, 1969 C,W S Sugar Well. Reported flow 6.3Ranch gpm Apr. 14, 1933.
503 do. -- —- 600± Tg 64 53.8 Feb. 21, 1969 C,W S Dormindo Well.
504 do. A. Porter & 1962 550 Tg 64 41 1962 C,W S Hingerto Well. Water sand report-Sons 49.5 Feb. 24, 1969 ed 516 to 550 ft.
601 Scott McGill —— —— 650± Tg 50± 38.3 Feb. 24, 1969 C,W S Tienda Well.Estate
602 Scott McGill Sunray-Mid- 1955 10,008 —— 45 —— -— -— —— Oil test. /ContinentalOil Co.
* 701 Santa Rosa Ranch A. Porter & Son 1953 753 5 6/8 Tg 70 28 1953 C,W S Encino Mucho Well #2. /54.3 Feb. 21, 1969
* 702 La Paloma Ranch R.C. Custer 1969 597 6 1/2 Tg 65 45.0 Feb. 21, 1969 C,W S Mota Negra Well #2. 598 ft ofWater Well 4 1/2 4 1/2 in. casing; perforated fromService 567 to 588 ft. Packer set at 546
ft.
801 Santa Rosa Ranch Porter Bros. 1952 585 5 3/16 Tg 63 39.8 do. C,W S Condado Well #2. 190 ft of 4 1/2Drilling Co. 4 1/4 in. casing; perforated from 563
to 585 ft.
See footnotes at end of table.
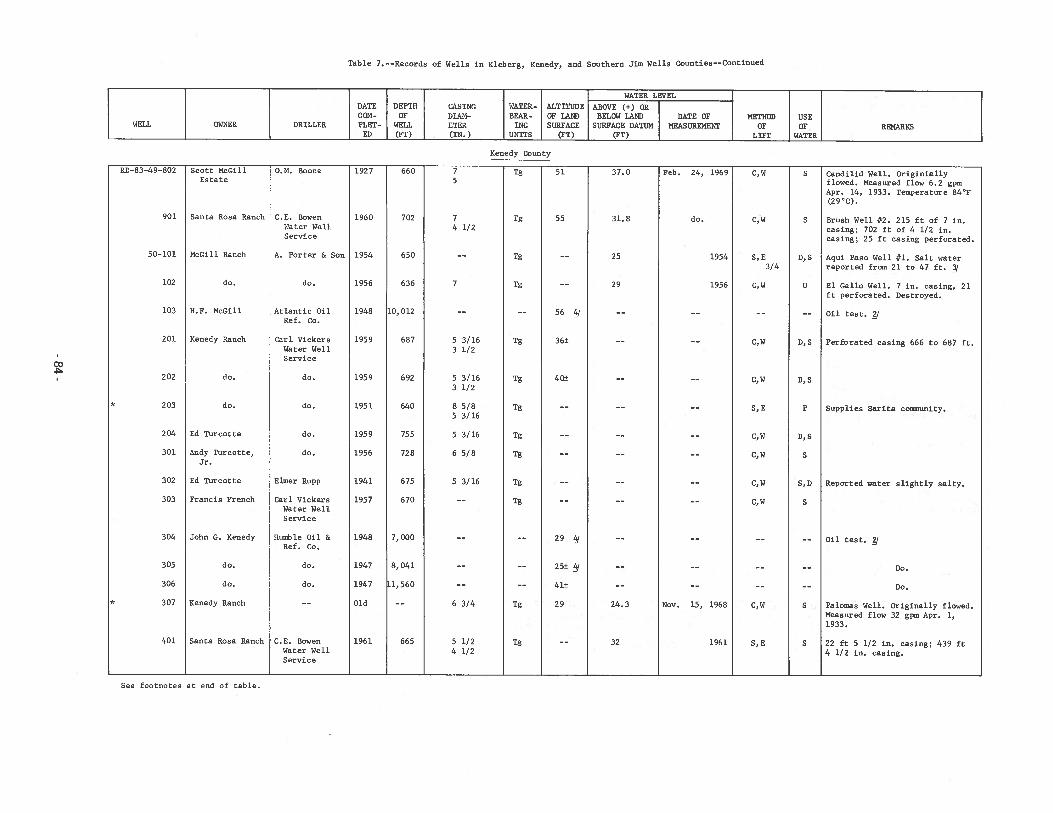
Table 7. --Records of Wells in Kleberg, Kenedy, and Southern Jim Wells Counties--Continued
K. BowenWater WellService
A. Porter &
Atlantic OilRef. Co.
Carl VickersWater WellService
do.
C.E. BowenWater WellService
5, E3/4
C, W
Candilid Well. Originiallyflowed. Measured flow 6.2 gpmApr. 14, 1933. Temperature 84F(29C).
Brush Well #2. 215 ft of 7 in.casing; 702 ft of 4 1/2 in.casing; 25 ft casing perforated.
Aqui Paso Well #1. Salt waterreported from 21 to 47 ft. /
El Gallo Well. 7 in. casing, 21ft perforated. Destroyed.
Oil test. /
Perforated casing 666 to 687 ft.
Do.
Do.
Palomas Well. Originally flowed.Measured flow 32 gpm Apr. 1,1933.
22 ft 5 1/2 in. casing; 439 ft4 1/2 in. casing.
0.M. Boone
WATER LEVEL
DATE DEPTH CASING WATER.- ALTITUDE ABOVE (+) ORCOM- OF DIAM- BEAR- OF LAND BELOW LAND DATE OF METHOD USE
WELL OWNER DRILLER PLET- WELL ETER ING SURFACE SURFACE DATUM MEASUREMEME OF OF REMARKSED (PT) . (IN.) UNITS (PT) (PT) LIFT WATER
Kenedy County
do.
C,W
C, W
RD-83-49-8O2
901
50-101
102
103
201
202
* 203
204
301
302
303
304
305
306
* 307
401
Scott McGillEstate
Santa Rosa Ranch C.
McGill Ranch
do.
H.F. McGill
Kenedy Ranch
do.
do.
Ed Turcotte
Andy Turcotte,Jr.
Ed Turcotte
Francis French
John C. Kenedy
do.
do.
Kenedy Ranch
Santa Rosa Ranch
1927
1960
Son 1954
1956
1948
1959
1959
1951
1959
1956
1941
1957
1948
1947
1947
Old
1961
660
702
650
636
10,012
687
692
640
755
728
675
670
7, 000
8, 041
.1,560
665
75
74 1/2
7
5 3/163 1/2
5 3/163 1/2
8 5/B5 3/16
5 3/16
6 5/8
5 3/16
6 3/4
5 1/24 1/2
51
55
56 /
36±
40±
29
25± /
41±
29
Tg
Tg
Tg
Tg
Tg
Tg
Tg
Tg
Tg
Tg
Tg
Tg
Tg
Feb.
Nov.
37.0
31.8
25
29
24.3
32
do.
do.
do.
Elmer Rupp
Carl VickersWater WellService
Humble Oil &Ref. Co.
do.
do.
24, 1969
do.
1954
1956
15, 1968
1961
S
S
0, 5
U
0,5
D, S
P
D, S
S
5, D
S
S
C, W
C, W
5, E
C, W
C, W
C, W
C, W
C, W
5, E
Supplies Santa community.
Reported water slightly salty.
Oil test. /
See footnotes at end of table.
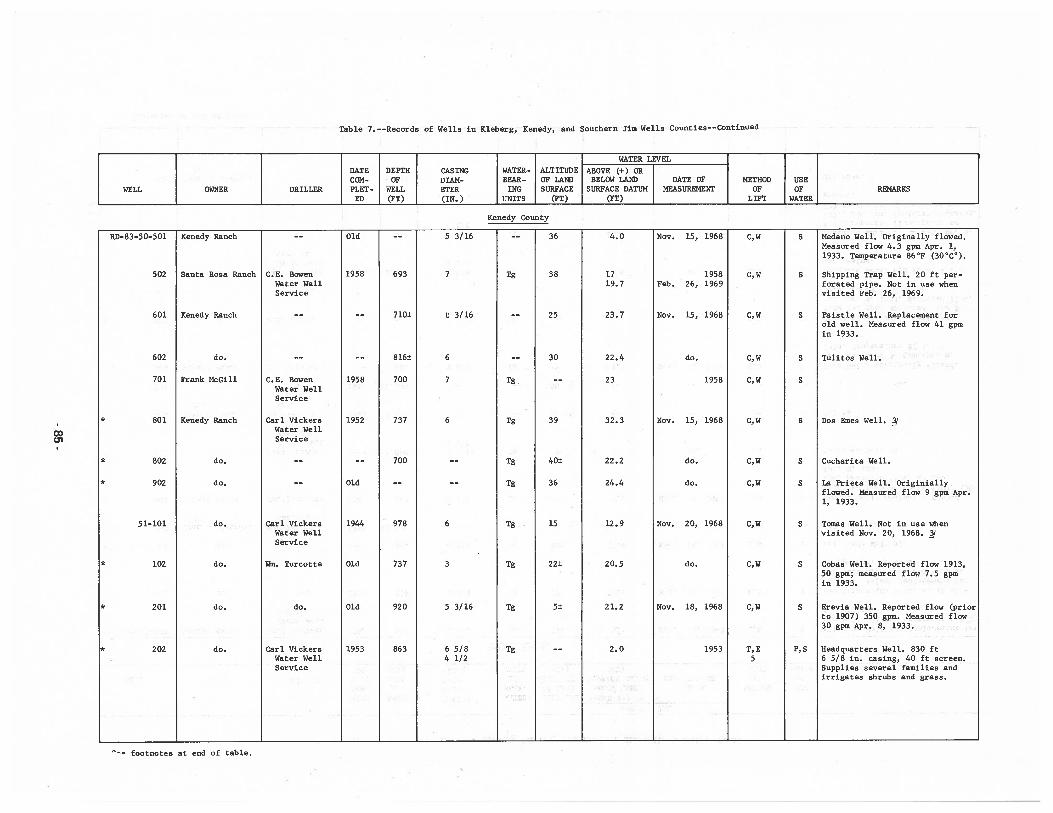
Table 7. --Records of Wells in Kleberg, Kenedy, and Southern Jim Wells Counties--Continued
RD—83—50-50l Kenedy Ranch
Santa Rosa Ranch G.E. BowenWater WellService
Kenedy Ranch
G.E. BowenWater WellService
Carl VickersWater WellService
Carl VickersWater WellService
Wm. Turcotte
Carl VickersWater WellService
5 3/16
t 3/16
5 3/16
1719.7
1958Feb. 26, 1969
Medano Well. Originally flowed.Measured flow 4.3 gpm Apr. 1,1933. Temperature 86’F (30’C).
Shipping Trap Well. 20 ft perforated pipe. Not in use whenvisited Feb. 26, 1969.
Paistle Well. Replacement forold well. Measured flow 41 gpmin 1933.
Tulitos Well.
Dos Emes Well. J
Cucharita Well.
La Prieta Well. Originiallyflowed. Measured flow 9 gpm Apr.1, 1933.
Tomas Well. Not in use whenvisited Nov. 20, 1968. J
Cobas Well. Reported flow 1913,50 gpm; measured flow 7.5 gpmin 1933.
Erevia Well. Reported flow (priorto 1907) 350 gpm. Measured flow30 gpm Apr. 8, 1933.
Headquarters Well. 830 ft6 5/8 in. casing, 40 ft screen.Supplies several families andirrigates shrubs and grass.
WATER LEVEL
DATE DEPTH CASING WATER- ALTITUDE ABOVE (+) ORCOM- OF DIAM- BEAR- OF LAND BELOW LAND DATE OF METHOD USE
WELL OWNER DRILLER PLET- WELL ETER 1MG SURFACE SURFACE DATUM MEASUREMENT OF OF REMARKSED (FT) (IN.) UNITS (PT) (PT) LIFT WATER
Kenedy County
7
4.0 Nov. 15, 1968
a,
Old
1958
1958
1952
Old
1944
Old
Old
1953
502
601
602
701
* 801
* 802
* 902
51-101
* 102
* 201
* 202
do.
Frank McGill
Kenedy Ranch
do.
do.
do.
do.
do.
do.
36
38
25
30
39
40±
36
15
22±
5±
693
710±
816±
700
737
700
978
737
920
863
6
7
6
6
3
Tg
Tg
Tg
Tg
Tg
Tg
Tg
Tg
Tg
23.7
22.4
23
32.3
22.2
24.4
12. 9
20.5
21.2
2.0
C, W
C,W
C, W
C, W
C,W
C, W
C, W
C, W
C,W
C, W
C,W
T, E5
S
S
S
S
S
S
S
S
S
S
S
F, S
Nov. 15, 1968
do.
1958
Nov. 15, 1968
do.
do.
Nov. 20, 1968
do.
Nov. 18, 1968
1953
do.
6 5/84 1/2
footnotes at end of tsble.
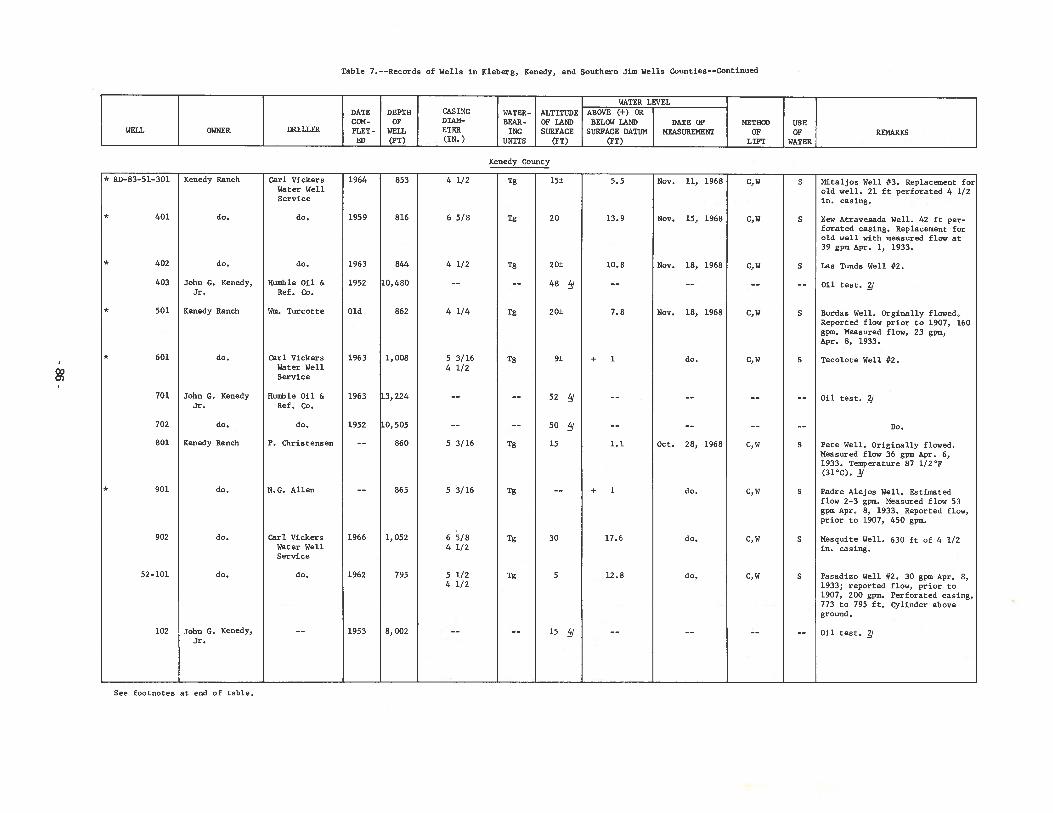
Table 7. --Records of Wells in Kleberg, Kenedy, and Southern Jim Wells Counties--Continued
WATER LEVELDATE DEPTH CASING WATER- ALTITUDE ABOVE (+) ORCON- OF DIAM- BEAR- OF LAND BELOW LAND DATE OF METHOD USE
WELL OWNER DRILLER PLET- WELL ETER ING SURFACE SURFACE DATUM MEASUREMENT OF OF REMARKSED (FT) (IN.) UNITS (FT) (FT) LIFT WATER
Kenedy County
* RD-83-51—301 Kenedy Ranch Carl Vickers 1964 853 4 1/2 Tg 15± 5.5 Nov. 11, 1968 C,W S Mitaijos Well #3. Replacement forWater Well old well, 21 ft perforated 4 1/2Service in. casing.
* 401 do. do. 1959 816 6 5/8 Tg 20 13.9 Nov. 15, 1968 C,W S New Atravesada Well. 42 ft perforated casing. Replacement forold well with measured flow at39 gpm Apr. 1, 1933.
* 402 do. do. 1963 844 4 1/2 Tg 20± 10.8 Nov. 18, 1968 C,W S Las Tunds Well #2.
403 John G. Kenedy, Humble Oil & 1952 10,480 -- -- 48 -- -- -- -- Oil test. JJr. Ref. Co.
* 501 Kenedy Ranch Wa. Turcotte Old 862 4 1/4 Tg 20± 7.8 Nov. 18, 1968 C,W S Bordas Well. Orginally flowed,Reported flow prior to 1907, 160gpm. Measured flow, 23 gpm,Apr. 8, 1933.
* 601 do. Carl Vickers 1963 1,008 5 3/16 Tg 9± + I do. C,W S Tecolote Well #2.Water Well 4 1/2Service
701 John G. Kenedy Humble Oil & 1963 13,224 52 Oil test.Jr. Ref. Co.
702 do. do. 1952 10,505 —— —— 50 —— —— —— —— Do.
801 Kenedy Ranch P. Christensen —- 860 5 3/16 Tg 15 1.1 Oct. 28, 1968 C,W S Pete Well. Originally flowed.Measured flow 36 gpm Apr. 6,1933. Temperature 87 l/2’F(31’C). /
* 901 do. N.G. Allen 865 5 3/16 Tg + 1 do. C,W S Padre Alejos Well. Estimatedflow 2-3 gpm. Measured flow 53gpm Apr, 8, 1933. Reported flow,prior to 1907, 450 gpm.
902 do. Carl Vickers 1966 1,052 6 5/8 Tg 30 17.6 do. C,W S Mesquite Well. 630 ft of 4 1/2Water Well 4 1/2 in. casing.Service
52-101 do. do. 1962 795 5 1/2 Tg 5 12.8 do. C,W S Pasadizo Well #2. 30 gpm Apr. 8,4 1/2 1933; reported flow, prior to
1907, 200 gpm. Perforated casing,773 to 795 ft. Cylinder aboveground.
102 John G. Kenedy, 1953 8,002 15 J Oil test. /Jr.
See footnotes at end of table.
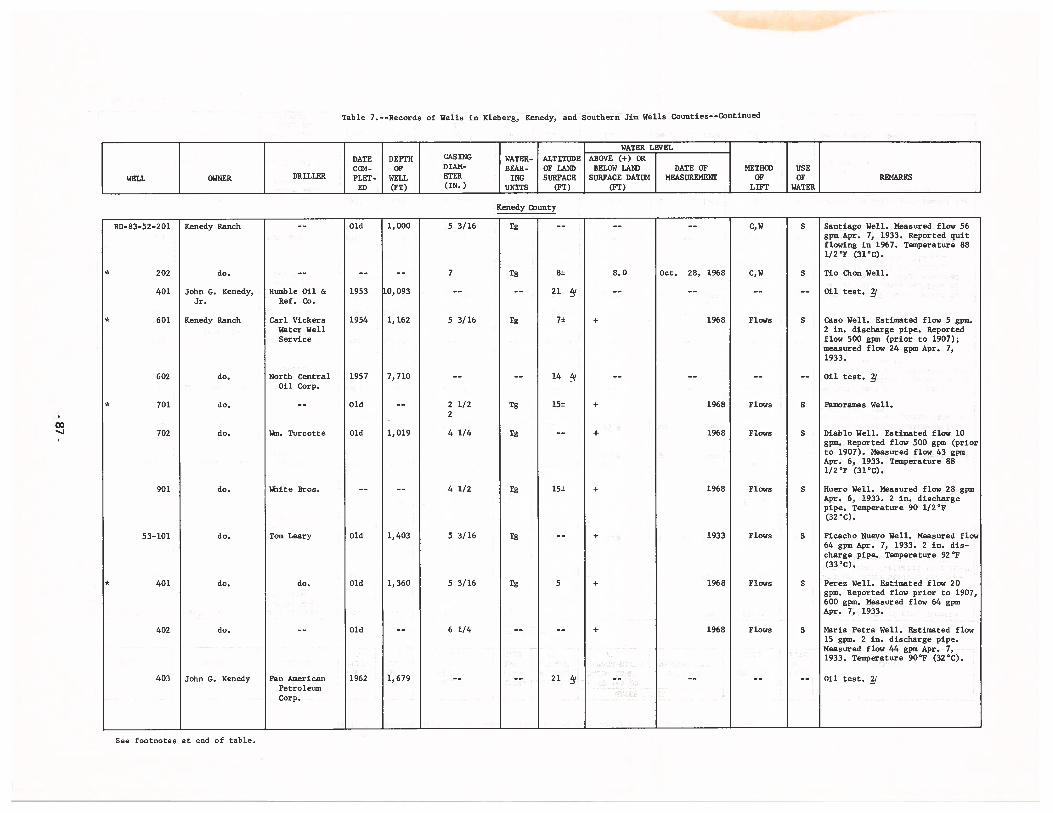
Table 7. --Records of Wells in Kleberg, Kenedy, and Southern Jim Wells Counties--Continued
WATER LEVEL
DATE DEPTH CASING WATER- ALTITUDE ABOVE (+) ORCOM- OF DIAM- BEAR- OF LAND BELOW LAND DATE OF METHOD USE
WELL OWNER DRILLER PLET - WELL ETER INC SURFACE SURFACE DATUM MEASUREMENT OF OF REMARKSED (PT) (IN.) UNITS (FT) (FT) LIFT WATER
Kenedy County
RD-83-52-2Ol Kenedy Ranch -- Old 1,000 5 3/16 Tg -- -- -- C,W S Santiago Well. Measured flow 56gpm Apr. 7, 1933. Reported quitflowing in 1967. Temperature 88l/2F (3lC).
* 202 do. -- -- -- 7 Tg 8± 8.0 Oct. 28, 1968 C,W S Tio Chon Well.
401 John C. Kenedy, Humble Oil & 1953 10,093 -- -- 21 / -- -- ---- Oil test. /
Jr. Ref. Co.
* 601 Kenedy Ranch Carl Vickers 1954 1,162 5 3/16 Tg 7± + 1968 Flows S Caso Well. Estimated flow 5 gpm.Water Well 2 in. discharge pipe. ReportedService flow 500 gpm (prior to 1907);
measured flow 24 gpm Apr. 7,1933.
602 do. North Central 1957 7,710 —— —- 14 / —— —— -——— Oil test. /
Oil Corp.
* 701 do. -- Old -- 2 1/2 Tg 15± + 1968 Flows S Pamoramas Well.
702 do. Wm. Turcotte Old 1,019 4 1/4 Tg -- ÷ 1968 Flows S Diablo Well. Estimated flow 10gpm. Reported flow 500 gpm (priorto 1907). Measured flow 43 gpmApr. 6, 1933. Temperature 88l/2F (3lC).
901 do. White Bros. -- -- 4 1/2 Tg 15± + 1968 Flows S Huero Well. Measured flow 28 gpmApr. 6, 1933. 2 in. dischargepipe. Temperature 90 l/2*F
(32CC).
53-101 do. Tom Leery Old 1,403 5 3/16 Tg -- + 1933 Flows S Picacho Nuevo Well. Measured flow64 gpm Apr. 7, 1933. 2 in. discharge pipe. Temperature 92’F(33CC).
* 401 do. do. Old 1,360 5 3/16 Tg 5 + 1968 Flows S Perez Well. Estimated flow 20gpm. Reported flow prior to 1907,600 gpm. Measured flow 64 gpmApr. 7, 1933.
402 do. -- Old -- 6 1/4 -- —- + 1968 Flows S Maria Petra Well. Estimated flow15 gpm. 2 in. discharge pipe.Measured flow 44 gpm Apr. 7,1933. Tempature 90F (32CC).
403 John C. Kenedy Pan American 1962 1,679 -- -- 21 / -- -- ---- Oil test.
PetroleumCorp.
See footnotes at end of table.
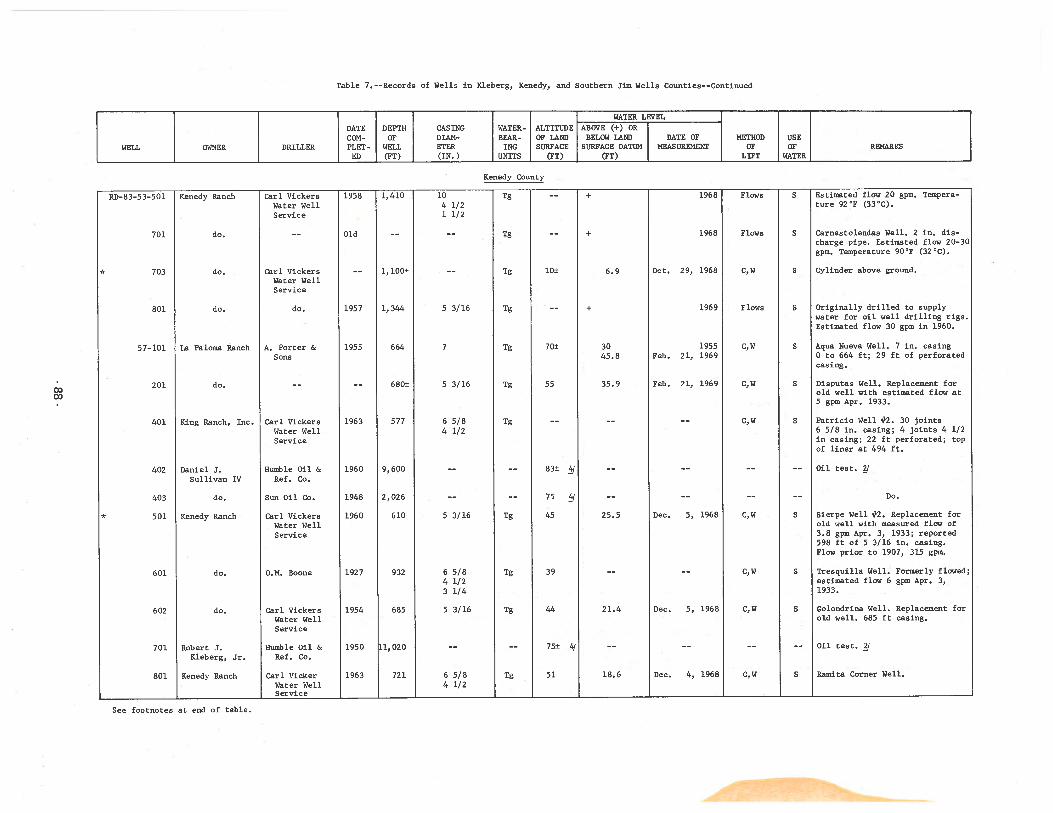
Table 7. --Records of Wells in Kleberg, Kenedy, and southern Jim Wells Counties-—Continued
ODOD
WATER LEVEL
DATE DEFTM CASING WATER- ALTITUDE ABOVE (+) ORCON- OF DIAM- BEAR- OF LAND BELOW LAND DATE OF METHOD USE
WELL OWNER DRTLLER PLET - WELL ETER INC SURFACE SURFACE DATUM MEASUREMENT OF OF REMARKSED (FT) (IN.) UNITS (FT) (FT) LIFT WATER
Kenedy County
RD-83-53-501 Kenedy Ranch Carl Vickers 1958 1,410 10 TE -- + 1968 Flows S Estimated flow 20 gpm. Tempera-
Water Well 4 1/2 ture 92’F (33CC).
Service 1 1/2
701 do. —— Old -- —— Tg —— + 1968 Flows S Carnestolendas Well. 2 in. discharge pipe. Estimated flow 20-3Dgpm. Temperature 9DF (32CC).
* 703 do. Carl Vickers -- 1,100± -- Tg 10± 6.9 Oct. 29, 1968 C,W S Cylinder above ground.Water WellService
801 do. do. 1957 1,344 5 3/16 Tg —— + 1969 Flows S Originally drilled to supplywater for oil well drilling rigs.Estimated flow 3D gpm in 1960.
57-101 La Faloma Ranch A. Forter & 1955 664 7 Tg 70± 3D 1955 C,W S Aqua Muevm Well. 7 in. casing
Sons 45.8 Feb. 21, 1969 0 to 664 ft; 29 ft of perforatedcasing.
201 do. -- -— 680± 5 3/16 Tg 55 35.9 Feb. 21, 1969 C,W S Disputms Well. Replacement forold well with estimated flow at5 gpm Apr. 1933.
401 King Ranch, Inc. Carl Vickers 1963 577 6 5/8 Tg —— -— -— C,W S Patricio Well #2. 30 joints
Water Well 4 1/2 6 5/8 in. casing; 4 joints 4 1/2
Service in casing; 22 ft perforated; topof liner at 494 ft.
402 Daniel J. Humble Oil & 1960 9,600 —— —— 83± -— —- -- —- Oil test.
Sullivan IV Ref. Co.
403 do. Sun Oil Co. 1948 2,026 -- -- 75 /q -- -- -- -- Do.
* 501 Kenedy Ranch Carl Vickers 1960 610 5 3/16 Tg 45 25.5 Dec. 5, 1968 C,W S Sierpe Well #2. Replacement for
Water Well old well with measured flow of
Service 3.8 gpm Apr. 3, 1933; reported598 ft of 5 3/16 in. casing.
.Flow prior to 1907, 315 gpm.
601 do. O.M. Boone 1927 932 6 5/8 Tg 39 -- —- C,W S Tresquillm Well. Formerly flowed;
4 1/2 estimated flow 6 gpm Apr. 3,
3 1/4 1933.
602 do. Carl Vickers 1954 685 5 3/16 Tg 44 21.4 Dec. 5, 1968 C,W S Colondrina Well. Replacement for
Water Well old well. 685 ft casing.
Service
701 Robert J. Humble Oil & 1950 11,020 -- -- 75± 4 -- -- ---- Oil test. /
Kleberg, Jr. Ref. Co.
801 Kenedy Ranch Carl Vicker 1963 721 6 5/8 Tg 51 18.6 Dec. 4, 1968 C,W S Rsmita Corner Well.
Water Well 4 1/2Service
See fnotnotes at end of table.
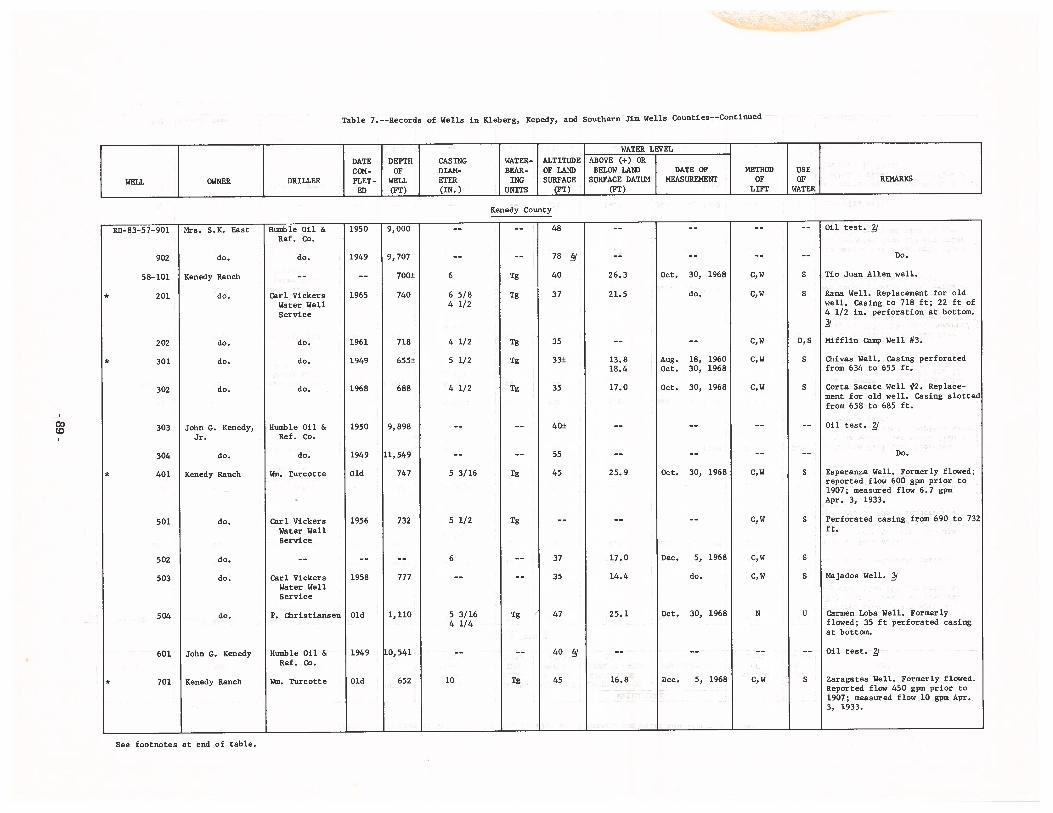
Table 7. --Records of Wells in Kleberg, Kenedy, and Southern Jim Wells Counties-—Continued
John G. Kenedy,Jr.
Humble Oil &Ref. Co.
do.
Carl VickersWater WellService
Carl VickersWater WellService
Carl VickersWater WellService
P. Christiansen
Humble Oil &Ref. Co.
Wm. Turcotte
5 3/164 1/4
Tio Juan Allen well.
Rana Well. Replacement for oldwell. Casing to 718 ft; 22 ft of4 1/2 in. perforation at bottom.
Mifflin Camp Well #3.
Chivas Well. Casing perforatedfrom 634 to 655 ft.
Corta Sacate Well #2. Replacement for old well. Casing slottedfrom 658 to 685 ft.
Oil test.
Do.
Esperanza Well. Formerly flowed;reported flow 600 gpm prior to1907; measured flow 6.7 gpmApr. 3, 1933.
Perforated casing from 690 to 732ft.
Majados Well. /
Carmen Loba Well. Formerlyflowed; 35 ft perforated casingat bottom.
Oil test.
Zaragates Well. Formerly flowed.Reported flow 450 gpm prior to1907; measured flow 10 gpm Apr.3, 1933.
J WATER LEVEL
DATE DEPTH CASING WATER- ALTITUDE ABOVE (+) OR
CON. OF DIAN- BEAR- OF LAND BELOW LAND DATE OF METHOD USE
WELL OWNER DRILLER PLET- WELL ETER ING SURFACE SURFACE DATUM MEASUREMENT OF OF REMARKS
ED (PT) (IN.) UNITS (PT) (PT) LIFT WATER
Kenedy County
Mrs. S.K. East
do.
Kenedy Ranch
do.
do.
do.
do.
03CD
Oil test.
do.
do.
do.
Humble Oil &Ref. Co.
do.
Win. Turcotte
Do.
RD—83-57-9Ol
902
58—101
* 201
202
* 301
302
303
304
* 401
501
502
503
504
601
* 701
6
6 5/84 1/2
4 1/2
5 1/2
4 1/2
5 3/16
5 1/2
6
9,000
9,707
700±
740
718
655±
688
9, 898
11,549
747
732
777
1,110
.0,541
652
1950
1949
1965
1961
1949
1968
1950
1949
Old
1956
1958
Old
1949
Old
48
78
40
37
35
33±
35
40±
55
45
37
35
47
40 /
45
Tg
Tg
Tg
Tg
Tg
Tg
Tg
Tg
Tg
do.
Kenedy Ranch
do.
do.
do.
do.
John C. Kenedy
Kenedy Ranch
26.3
21.5
13.818.4
17.0
25.9
17.0
14.4
25.1
16.8
Oct. 30, 1968
do.
Aug. 18, 1960Oct. 30, 1968
Oct. 30, 1968
Oct. 30, 1968
Dec. 5, 1968
do.
Oct. 30, 1968
Dec. 5, 1968
S
S
D, S
S
S
S
S
S
S
U
C, W
C, W
C, W
C,W
C,W
C,W
C, W
C, W
C,W
N
C, W10
See footnotes at end of table.
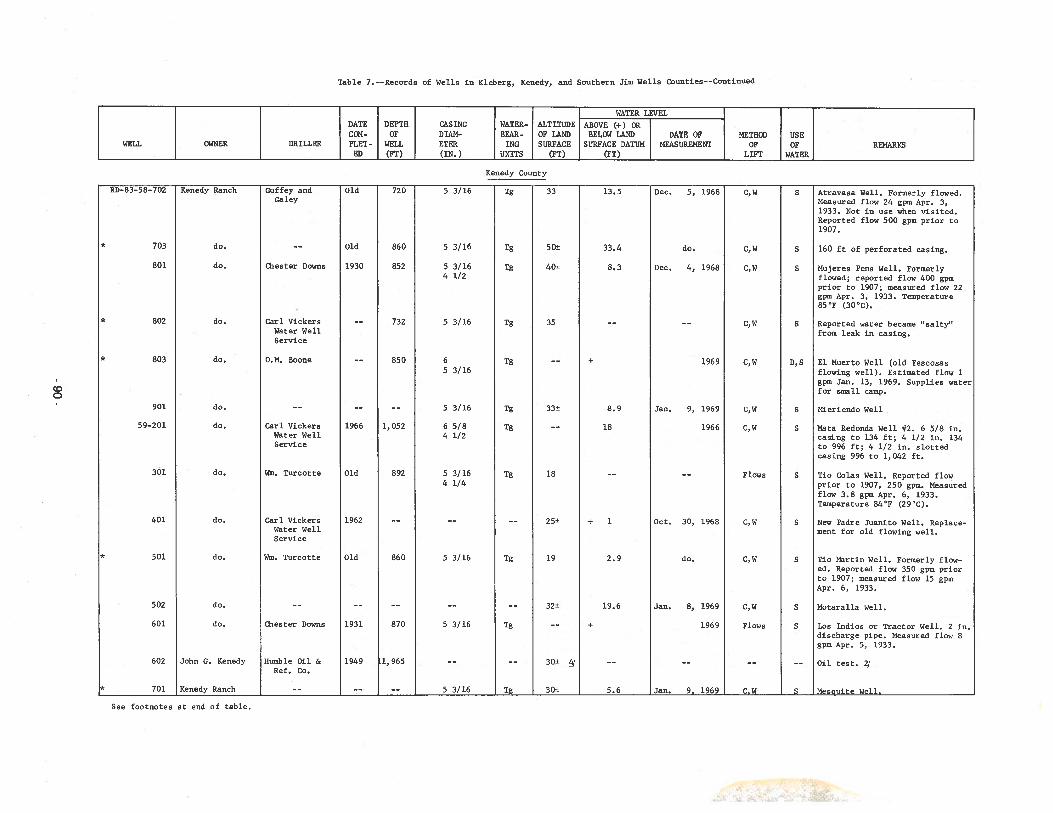
Table 7.--Records of Wells in Kleberg, Kenedy, and Southern Jim Wells Counties--Continued
WATER LEVELDATE DEPTH CASING WATER- ALTITUDE ABOVE (+) ORCOM- OF DIAN- BEAR- OF LAND BELOW LAND DATE OF METHOD USE
WELL OWNER DRILLER PLET- WELL ETER ING SURFACE SURFACE DATUM MEASUREMENT OF OF REMARKSED (FT) (IN.) UNITS (FT) (FT) LIFT WATER
Kenedy County
RD-83-58-702 Kenedy Ranch Guf fey and Old 720 5 3/16 Tg 33 13.5 Dec. 5, 1968 C,W S Atravasa Well. Formerly flowed.Galey Measured flow 24 gpm Apr. 3,
1933. Not in use when visited.Reported flow 500 gpm prior to1907.
* 703 do. —— Old 860 5 3/16 Tg 50± 33.4 do. C,W S 160 ft of perforated casing.
801 do. Chester Downs 1930 852 5 3/16 Tg 40± 8.3 Dec. 4, 1968 C,W S Mujeres Pens Well. Formerly4 1/2 flowed; reported flow 400 gpm
prior to 1907; measured flow 22gpm Apr. 3, 1933. Temperature85F (3OC).
* 802 do. Carl Vickers 732 5 3/16 Tg 35 C,W S Reported water became ‘salty’Water Well from leak in casing.Service
* 803 do. O.M. Boone 850 6 Tg + 1969 C,W D,S El Muerto Well (old Yescosas5 3/16 flowing well). Estimated flow 1
gpm Jan. 13, 1969. Supplies waterfor small camp.
0901 do. —- —— —— 5 3/16 Tg 33± 8.9 Jan. 9, 1969 C,W S Mieriendo Well
59-201 do. Carl Vickers 1966 1,052 6 5/8 Tg —— 18 1966 C,W S Mata Redonda Well #2. 6 5/8 in.Water Well 4 1/2 casing to 134 ft; 4 1/2 in. 134Service to 996 ft; 4 1/2 in. slotted
casing 996 to 1,042 ft.
301 do. Wm. Turcotte Old 892 5 3/16 Tg 18 Flows S Tio Colas Well. Reported flow4 1/4 prior to 1907, 250 gpm. Measured
flow 3.8 gpm Apr. 6, 1933.Temperature 84F (29’C).
401 do. Carl Vickers 1962 25± + 1 Oct. 30, 1968 C,W S New Padre Juanito Well. Replace—Water Well ment for old flowing well.Service
* 501 do. Wm. Turcotte Old 860 5 3/16 Tg 19 2.9 do. C,W S Tio Martin Well. Formerly f lowed. Reported flow 350 gpm priorto 1907; measured flow 15 gpmApr. 6, 1933.
502 do. -— —— -- 32± 19.6 Jan. 8, 1969 C,W S Motaralla Well.
601 do. Chester Downs 1931 870 5 3/16 Tg —— + 1969 Flows S Los Indios or Tractor Well. 2 in.discharge pipe. Measured flow 8gpm Apr. 5, 1933.
602 John C. Kenedy Humble Oil & 1949 1,965 30± -- Oil test. JRef. Co.
* 701 Kenedy Ranch 5 3/16 Tg 30± 5.6 Jan. 9. 1969 C.W S Mesnuite Well.
See footnotes at end of table.
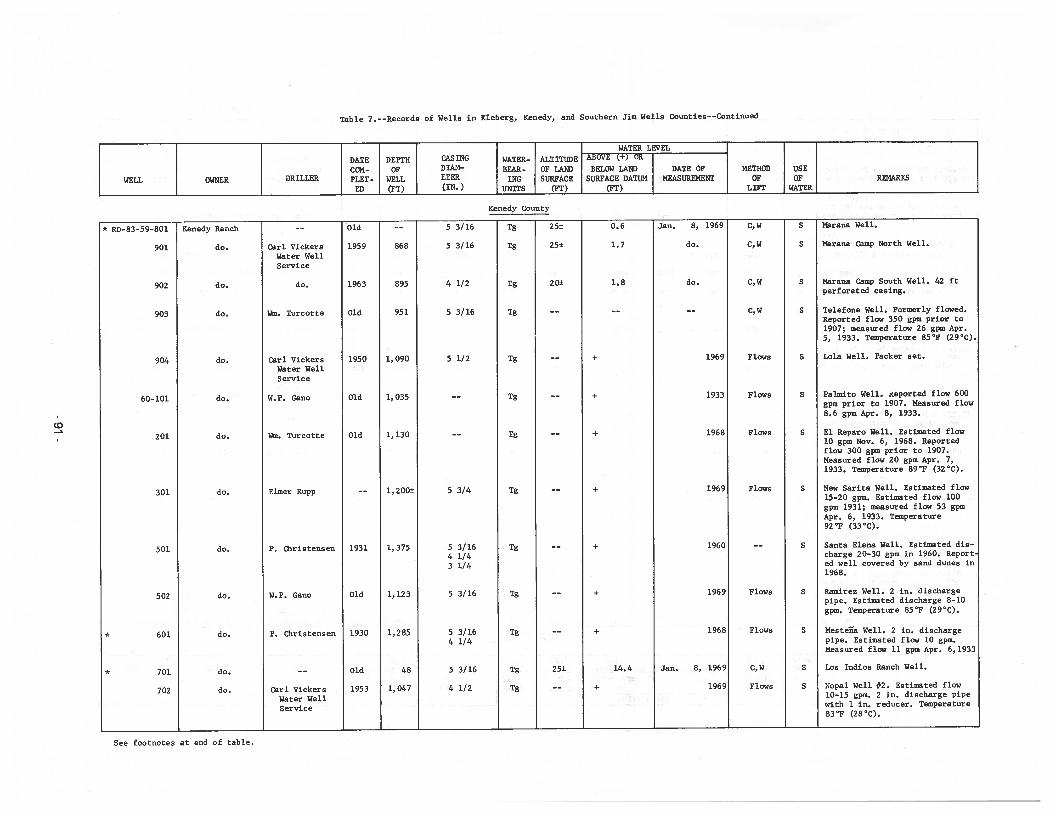
Table 7. --Records of Wells in Kleberg, Kenedy, and Southern Jim Wells Counties--Continued
WATER LEVEL
DATE DEPTH CASING WATER.- ALTITUDE ABOVE (+) OR
COM- OF DIAN- BEAR- OF LAND BELOW LAND DATE OF METHOD USE
WELL OWNER DRILLER PLET- WELL ETER ING SURFACE SURFACE DATUM MEASUREMENI OF OF REMARKSED (PT) (IN.) UNITS (FT) (FT) LIFT WATER
Kenedy County
* RD-83-59-8O1 Kenedy Ranch -- Old -- 5 3/16 Tg 25± 0.6 Jan. 8, 1969 C,W S Marana Well.
901 do. Carl Vickers 1959 868 5 3/16 Tg 25± 1.7 do. C,W S Narana Camp North Well.
Water WellService
902 do. do. 1963 895 4 1/2 Tg 20± 1.8 do. C,W S Marana Camp South Well. 42 ftperforated casing.
903 do. Wm. Turcotte Old 951 5 3/16 Tg C,W S Telefone Well. Formerly flowed.Reported flow 350 gpm prior to1907; measured flow 26 gpm Apr.5, 1933. Temperature 85’F (29’C).
904 do. Carl Vickers 1950 1,090 5 1/2 Tg + 1969 Flows S Lola Well. Packer set.
Water WellService
60-101 do. W.P. Gano Old 1,035 Tg + 1933 Flows S Palmito Well. Reported flow 600gpm prior to 1907. Measured flow8.6 gpm Apr. 8, 1933.
CD201 do. Wm. Turcotte Old 1,130 Tg + 1968 Flows S El Reparo Well. Estimated flow
10 gpm Nov. 6, 1968. Reportedflow 300 gpm prior to 1907.Measured flow 20 gpm Apr. 7,1933. Temperature 89’F (32’C).
301 do. Elmer Rupp 1, 200± 5 3/4 Tg + 1969 Flows S New Santa Well. Estimated flow15—20 gpm. Estimated flow 100gpm 1931; measured flow 53 gpmApr. 6, 1933. Temperature92F (33CC).
501 do. P. christensen 1931 1,375 5 3/16 Tg + 1960 5 Santa Elena Well. Estimated dis—
4 1/4 charge 20-30 gpm in 1960. Report
3 1/4 ed well covered by sand dunes in1968.
502 do. W.P. Gano Old 1,123 5 3/16 Tg + 1969 Flows S Ramirez Well. 2 in. dischargepipe. Estimated discharge 8-10gpm. Temperature 85’F (29CC).
601 do. P. Christensen 1930 1,285 5 3/16 Tg + 1968 Flows S Mestea Well. 2 in. discharge
4 1/4 pipe. Estimated flow 10 gpm.Measured flow 11 gpm Apr. 6,1933
* 701 do. -- Old 48 5 3/16 Tg 25± 14.4 Jan. 8, 1969 C,W S Los Indios Ranch Well.
702 do. Carl Vickers 1953 1,047 4 1/2 Tg —— + 1969 Flows S Nopal Well #2. Estimated flow
Water Well 10-15 gpm. 2 in. discharge pipe
Service with 1 in. reducer. Temperature83’F (28’C).
See footnotes at end of table.
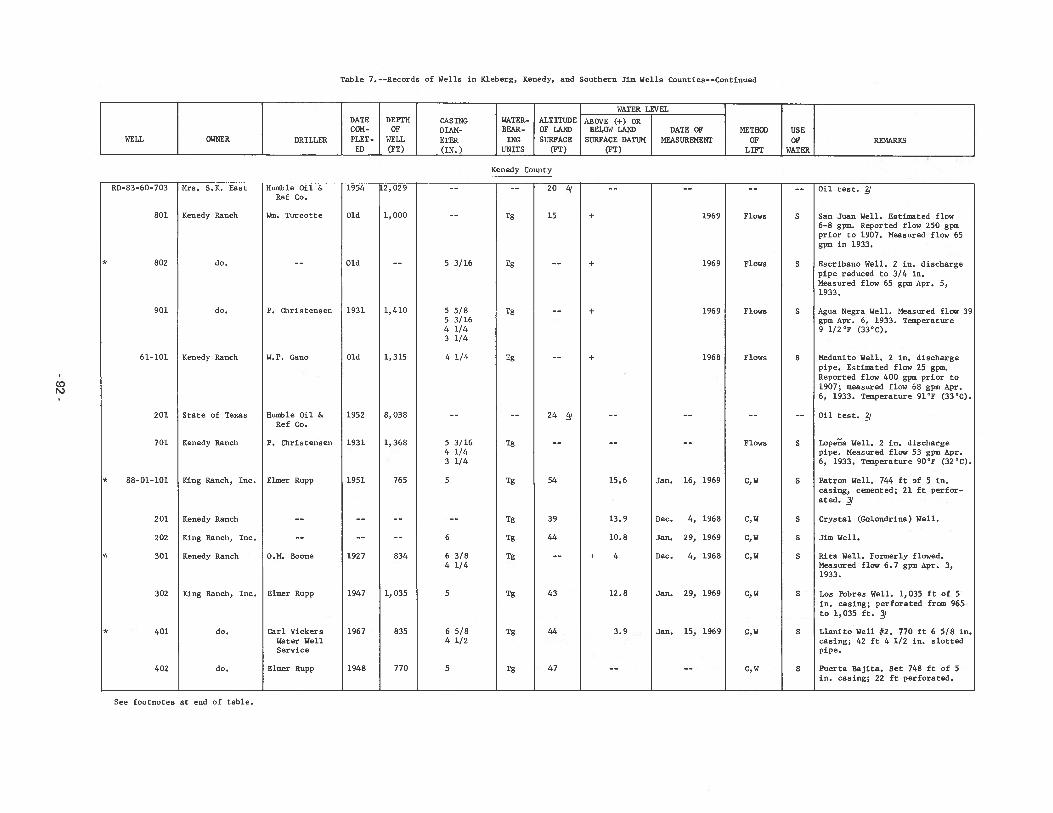
Table 7. --Records of Wells in Kleberg, Kenedy, and Southern Jim Wella Counties--Continued
]J WATER LEVEL
DATE DEPTH CASING WATER- ALTITUDE ABOVE (+) ORCOM- OF 0MM- BEAR- OF LAW) BELOW LAND DATE OF METHOD USE
WELL OWNER DRILLER PLET- WELL ETER INC SURFACE SURFACE DATUM MEASUREMENT OF OF REMARKSED (FT) (IN.) UNITS (FT) (FT) LIFT WATER
Kenedy County
RD-B3-60-703 Mrs. S.K. East Humble Oil & 1954 2,029 -— 20 / Oil test.Ref Co.
801 Kenedy Ranch Win. Turcotte Old 1,000 Tg 15 + 1969 Flows S San Juan Well. Estimated flow6-B gpm. Reported flow 250 gpmprior to 1907. Measured flow 65gpm in 1933.
* BO2 do. Old 5 3/16 Tg + 1969 Flows S Escribano Well. 2 in. dischargepipe reduced to 3/4 in.Measured flow 65 gpm Apr. 5,1933.
901 do. P. Christensen 1931 1,410 5 5/8 Tg + 1969 Flows S Agua Negra Well. Measured flow 395 3/16 gpm Apr. 6, 1933. Temperature4 1/4 9 1/2’P (33CC).3 1/4
61-101 Renedy Ranch W.P. Cano Old 1,315 4 1/4 Tg + 1968 Flows S Medanito Well. 2 in. dischargepipe. Eatimated flow 25 gpm.
• Reported flow 400 gpm prior to1907; measured flow 68 gpm Apr.
• 6, 1933. Tempersture 91SF (33’C).
201 State of Texas Humble Oil & 1952 8,038 24 Oil test. gjRef Co.
701 Kenedy Ranch P. Christensen 1931 1,368 5 3/16 Tg Flows S Lopea Well. 2 in. discharge4 1/4 pipe. Measured flow 53 gpm Apr.3 1/4 6, 1933. Temperature 9OF (32CC).
* 88-01-101 King Ranch, Inc. Elmer Rupp 1951 765 5 Tg 54 15.6 Jan. 16, 1969 C,W S Patron Well. 744 ft of 5 in.casing, cemented; 21 ft perforated. /
201 Kenedy Ranch Tg 39 13.9 Dec. 4, 1968 C,W S Crystal (Golondrina) Well.
202 King Ranch, Inc. -- -- 6 Tg 44 10.8 Jan. 29, 1969 C,W S Jim Well.
* 301 Kenedy Ranch O.M. Boone 1927 834 6 3/8 Tg -- + 4 Dec. 4, 1968 C,W S Rita Well. Formerly flowed.4 1/4 Measured flow 6.7 gpm Apr. 3,
1933.
302 King Ranch, Inc. Elmer Rupp 1947 1,035 5 Tg 43 12.8 Jan. 29, 1969 C,W S Los Pobres Well. 1,035 ft of 5in. casing; perforated from 965to 1,035 ft. l
* 401 do. Carl Vickers 1967 835 6 5/B Tg 44 3.9 Jan. 15, 1969 C,W S Llanito Well #2. 770 ft 6 5/8 in.Water Well 4 1/2 casing; 42 ft 4 1/2 in. slottedService pipe.
402 do. Elmer Rupp 1948 770 5 Tg 47 C,W S Puerta Bajita. Set 748 ft of 5in. casing; 22 ft perforated.
See footnotes at end of table.
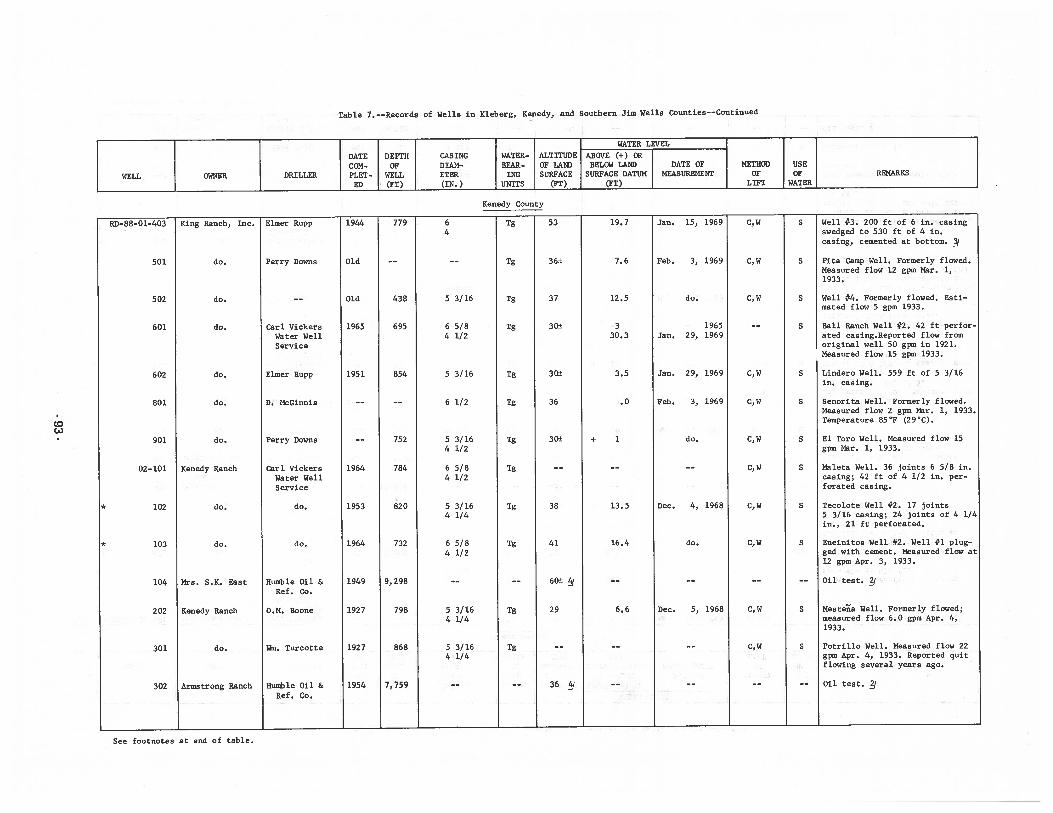
Table 7. --Records of Wells in Rleberg, Renedy, and Southern Jim Wells Counties--Continued
CDCt)
WATER LEVEL
DATE DEPTH CASING WATER- ALTITUDE ABOVE (÷) ORCOM- OF DIAN- BEAR- OF LAND BELOW LAND DATE OF METHOD USE
WELL OWNER DRILLER FLET - WELL ETER ING SURFACE SURFACE DATUM MEASUREMENT OF OF REMARKS
ED (FT) (TN.) UNTTS (FT) (FT) LIFT WATER
Renedy County
RD—88-Ol—4O3 Ring Ranch, Inc. Elmer Rupp 1944 779 6 Tg 53 19.7 Jan. 15, 1969 C,W S Well #3. 200 ft of 6 in. casing4 swedged to 530 ft of 4 in.
casing, cemented at bottom. f
501 do. Perry Downs Old -- -- Tg 36± 7.6 Feb. 3, 1969 C,W S Pita Camp Well. Formerly flowed.Measured flow 12 gpm Mar. 1,1933.
502 do. -- Old 438 5 3/16 Tg 37 12.5 do. C,W S Well #4. Formerly flowed. Estimated flow 5 gpm 1933.
601 do. Carl Vickers 1965 695 6 5/8 Tg 30± 3 1965 -— S Ball Ranch Well #2. 42 ft perfor—
Water Well 4 1/2 30.3 Jan. 29, 1969 ated casing.Reported flow fromService original well 50 gpm in 1921.
Measured flow 15 gpm 1933.
602 do. Elmer Rupp 1951 B54 5 3/16 Tg 30± 3.5 Jan. 29, 1969 C,W S Lindero Well. 559 ft of 5 3/16in. casing.
801 do. 0. McGinnis -- -- 6 1/2 Tg 36 .0 Feb. 3, 1969 C,W S Senorita Well. Formerly flowed.Measured flow 2 gpm Mar. 1, 1933.Temperature 85’F (29’C).
901 do. Perry Downs -- 752 5 3/16 Tg 30± + 1 do. C,W S El Torn Well. Measured flow 154 1/2 gpm Mar. 1, 1933.
02-101 Renedy Ranch Carl Vickers 1964 784 6 5/8 Tg -- -- -- C,W S Naleta Well. 36 joints 6 5/8 in.
Water Well 4 1/2 casing; 42 ft of 4 1/2 in. per-
Service f orated caaing.
* 102 do. do. 1953 820 5 3/16 Tg 38 13.5 Dec. 4, 1968 C,W S Tecolote Well #2. 17 joints4 1/4 5 3/16 casing; 24 joints of 4 1/4
in., 21 ft perforated.
103 do. do. 1964 732 6 5/8 Tg 41 16.4 do. C,W S Eneinitos Well #2. Well #1 plug-
4 1/2 ged with cement. Measured flow at12 gpm Apr. 3, 1933.
104 Mrs. S.R. East Humble Oil & 1949 9,298 -— -— 60± 4 —— —- ———— Oil test.
Ref. Co.
202 Renedy Ranch 0.M. Boone 1927 798 5 3/16 Tg 29 6.6 Dec. 5, 1968 C,W S Meste?a Well. Formerly flowed;
4 1/4 measured flow 6.0 gpm Apr. 4,1933.
301 do. Wm. Turcntte 1927 868 5 3/16 Tg —— —— -— C,W S Potrillo Well. Measured flow 22
4 1/4 gpm Apr. 4, 1933. Reported quitflowing several years ago.
302 Armstrong Ranch Humble Oil & 1954 7,759 -- -- 36 4 -- -- ---- Oil test. 14/
Ref. Co.
See footnotes st end of tsble.
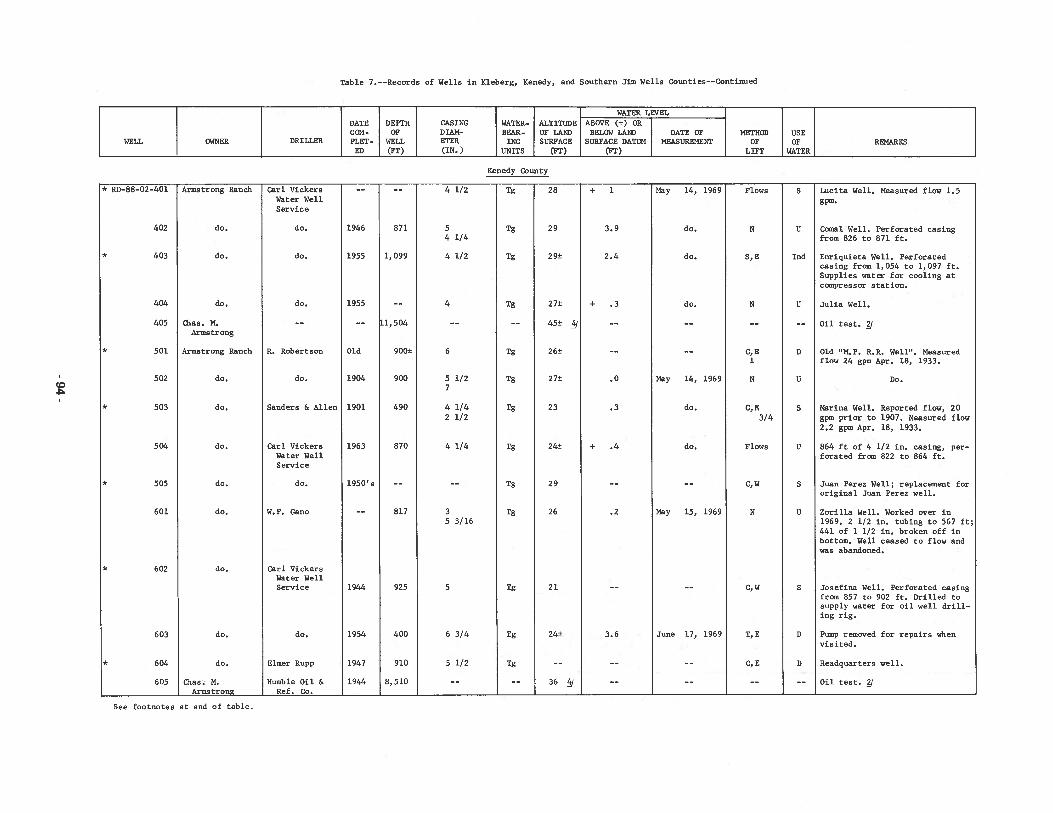
Table 7. --Records of Wells in Rleberg, Renedy, and Southern Jim Wells Counties-—Continued
do.
thas. M.Arias trong
Armstrong Ranch
Carl VickersWater WellService
do.
Carl VickersWater WellService
do.
Carl VickersWater WellService
Nay 14, 1969
May 15, 1969
Lucita Well. Measured flow 1.5gpm.
Comal Well. Perforated casingfrom 826 to 871 ft.
Enriquieta Well. Perforatedcasing from 1,054 to 1,097 ft.Supplies water for cooling atcompressor station.
Julia Well.
Oil test. J
Old M.P. R.R. Well’. Measuredflow 24 Rpm Apr. 18, 1933.
Do.
Marina Well. Reported flow, 20Rpm prior to 1907. Measured flow2.2 Rpm Apr. 18, 1933.
864 ft of 4 1/2 in. casing, perforated from 822 to 864 ft.
Juan Perez Well; replacement fororiginal Juan Perez well.
Zorilla Well. Worked over in1969. 2 1/2 in. tubing to 567 ft;441 of 1 1/2 in. broken off inbottom. Well ceased to flow andwas abandoned.
Josefina Well. Perforated casingfrom 857 to 902 ft. Drilled tosupply water for oil well drilling rig.
Pump removed for repairs whenvisited.
Meadquarters well.
Oil test.
WATER LEVELDATE DEPTM CASINC WATER- ALTITUDE ABOVE (+) ORCON- OF DIAM- BEAR- OF LAND BELOW LAND DATE OF NETNOD USE
WELL OWNER DRILLER PLET- WELL ETER INC SURFACE SURFACE DATUM MEASUREMENT OF OF REMARKSED (FT) (IN.) UNITS (FT) (FT) LIFT WATER
Renedy County
Armstrong Ranch
do.
do.
CD.
May 14, 1969
do.
do.
do.
4
* RD-88-02-40l
402
* 403
404
405
* 501
502
* 503
504
* 505
601
* 602
603
* 604
605
1946
do. 1955
do. 1955
R. Robertson Old
do. 1904
Sanders & Allen 1901
1963
1950’s
1944
1954
1947
1944
4 1/2
54 1/4
4 1/2
4
6
5 1/27
4 1/42 1/2
4 1/4
35 3/16
5
6 3/4
5 1/2
871
1,099
11,504
900±
900
490
870
817
925
400
910
8,510
Tg
Tg
Tg
Tg
Tg
Tg
Tg
Tg
Tg
Tg
Tg
Tg
Tg
+ 1
3.9
2.4
+ .3
.0
.3
÷ .4
.2
3.6
28
29
29±
27±
45±
26±
27±
23
24±
29
26
21
24±
36 4
W.P. Cano
do.
do,
do.
do.
do.
do.
do.
do.
has. M.Arms trone
do.
do.
Flows
N
5, E
N
C, E1
N
C,E3/4
Flows
C, W
N
C, W
I, E
C, E
S
U
Ind
U
D
U
S
U
S
U
S
D
D
do.
Elmer Rupp
Mumble Oil &Ref. Co.
June 17, 1969
See footnotes at end of table.
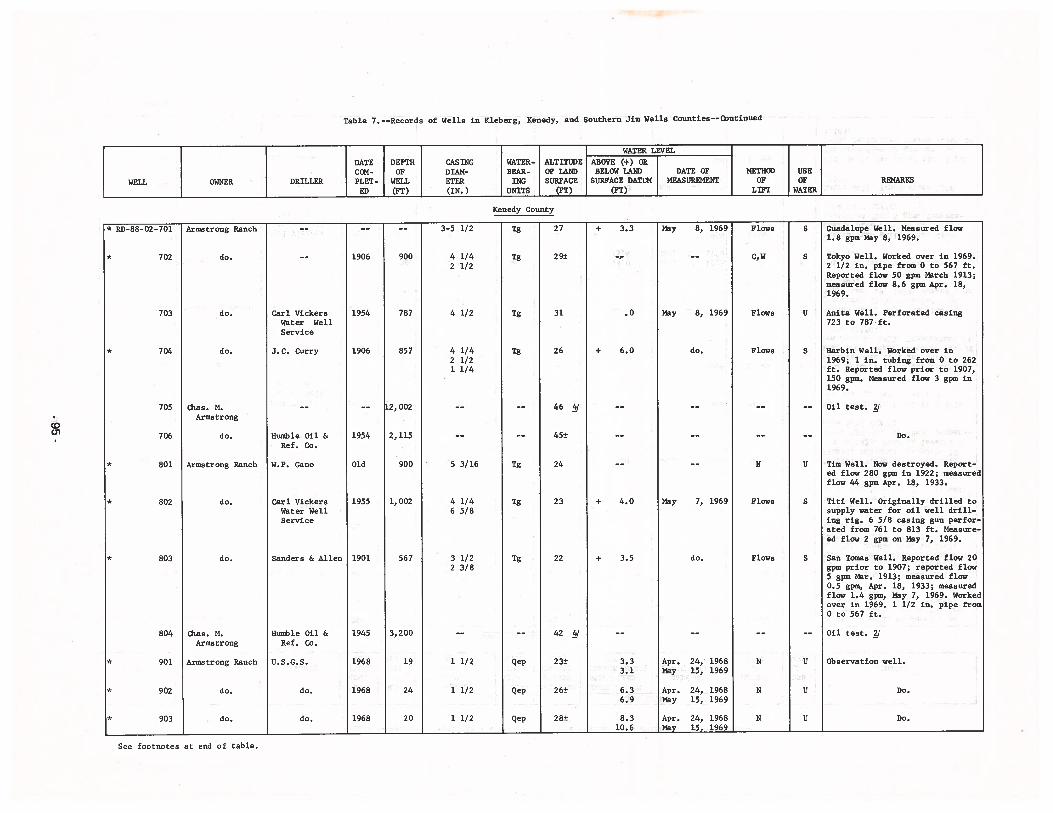
Table 7. --Records of Wells in Kleberg, Kenedy, and Southern Jim Wells Counties--Continued
Chas. H.Armstrong
do.
Armstrong Ranch
Carl VickersWater WellService
J.C. Curry
Humble Oil &Ref. Co.
W.P. Gano
Carl VickersWater WellService
3.33.1
6.36.9
8.310.6
May 8, 1969
May 8, 1969
May 7, 1969
Apr. 24, 1968Nay 15, 1969
Apr. 24, 1968May 15, 1969
Apr. 24, 1968Maw 15. 1969
Guadalupe Well. Measured flow1.8 gpm May 8, 1969.
Tokyo Well. Worked over in 1969.2 1/2 in. pipe from 0 to 567 ft.Reported flow 50 gpm March 1913;measured flow 8.6 gpm Apr. 18,1969.
Anita Well. Perforated casing723 to 787ft.
Harbin Well. Worked over in1969; 1 in. tubing from 0 to 262ft. Reported flow prior to 1907,150 gpm. Measured flow 3 gpm in1969.
Oil test. /
Tim Well. Now destroyed. Reported flow 280 gpni in 1922; measuredflow 44 gpm Apr. 18, 1933.
Titi Well. Originally drilled tosupply water for oil well drilling rig. 6 5/8 casing gun perforated from 761 to 813 ft. Measureed flow 2 gpm on May 7, 1969.
San Tomas Well. Reported flow 20gpm prior to 1907; reported flow5 gpm Mar. 1913; measured flow0.5 gpm, Apr. 18, 1933; measuredflow 1.4 gpin, May 7, 1969. Workedover in 1969. 1 1/2 in. pipe fromO to 567 ft.
Oil test. J
Observation well.
WATER LEVEL
DATE DEPTH CASING WATER. ALTITUDE ABOVE (+) ORCOM- OF DIAM- BEAR- OF LANI) BELOW LAND DATE OF METHOD USE
WELL OWNER DRILLER PLET- WELL ETER ING SURFACE SURFACE DATUM MEASUREMENT OF OF REMARKS
_____________
ED (FT) (IN.) UNITS (PT) (PT) LIFT WATER
Kenedy County
Armstrong Ranch
do.
do.
do.
Co01
* RD—88-O2-7O1
* 702
703
* 704
705
706
* 801
* 802
* 803
804
* 901
* 902
* 903
do.
÷ 3.3
.0
+ 6.0
+ 4.0
+ 3.5
1906
1954
1906
1954
Old
1955
Sanders & Allen 1901
Humble Oil & 1945Ref. Co.
U.S.G.S. 1968
do. 1968
do. 1968
900
787
857
12, 002
2,115
900
1, 002
567
3,200
19
24
20
3-5 1/2
4 1/42 1/2
4 1/2
4 1/42 1/21 1/4
5 3/16
4 1/46 5/8
3 1/22 3/8
1 1/2
1 1/2
1 1/2
Tg
Tg
Tg
Tg
Tg
Tg
Tg
Qep
Qep
Qep
27
29±
31
26
46
45±
24
23
22
42
23±
26±
28±
Do.
do.
do.
Chas. H.Armstrong
Armstrong Ranch
do.
do.
Flows
C, W
Flows
Flows
N
Flows
Flows
N
N
N
S
S
U
S
U
S
S
U
U
U
do.
Do.
Do.
See footnotes at end of table.
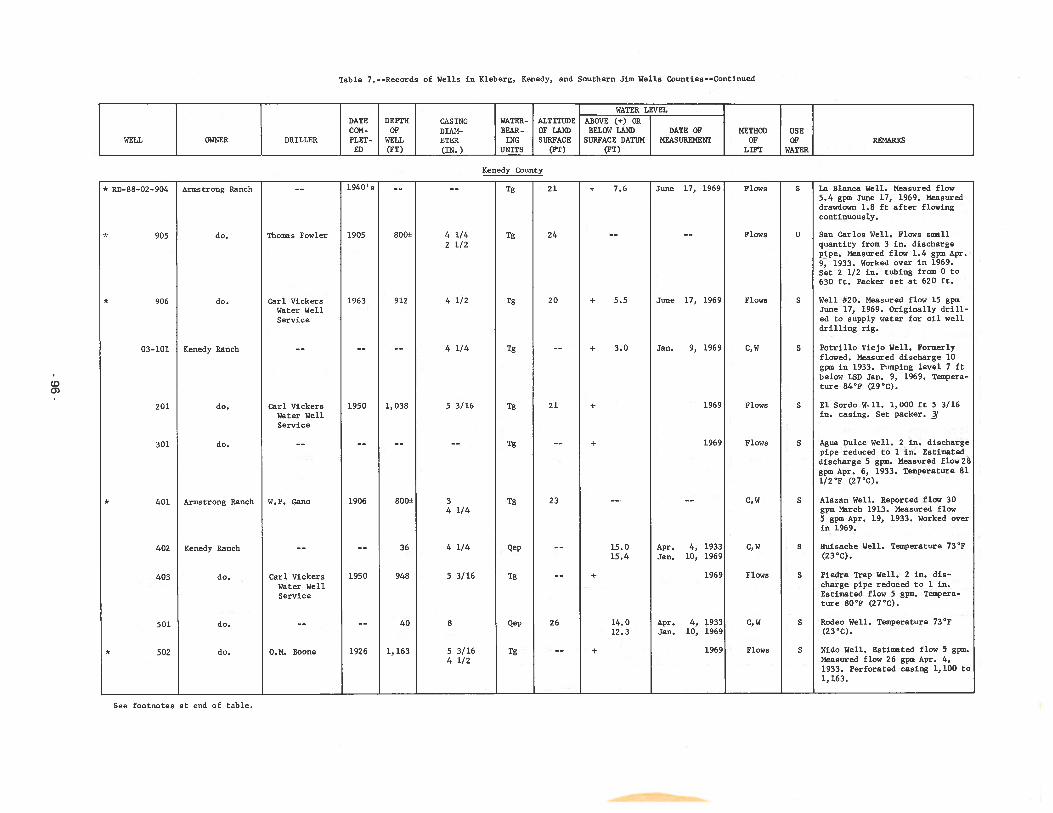
Table 7. --Records of Wells in Rleberg, Kenedy, and Southern Jim Wells Counties-—Continued
r WATER LEVELDATE DEPTH CASING WATER- ALTITUDE ABOVE (+) ORCON- OP DIAM- BEAR- OP LAND BELOW LAND DATE OP METHOD USE
WELL OWNER DRILLER PLET - WELL ETER 1MG SURFACE SURFACE DATUM MEASUREMENT OP OP REMARKSED (PT) (IN.) UNITS (PT) (PT) LIFT WATER
Renedy County
* RD-BB-02-904 Armstrong Ranch 1940’s Tg 21 + 7.6 June 17, 1969 Plows S La Blanca Well. Measured flow5.4 gpm June 17, 1969. Measureddrawdown 1.8 ft after flowingcontinuously.
* 905 do. Thomas Powler 1905 800± 4 1/4 Tg 24 Plows U San Carlos Well. Plows small2 1/2 quantity from 3 in. discharge
pipe. Measured flow 1.4 gpm Apr.9, 1933. Worked over in 1969.Set 2 1/2 in. tubing from 0 to630 ft. Packer set at 620 ft.
* 906 do. Carl Vickers 1963 912 4 1/2 Tg 20 + 5.5 June 17, 1969 Plows S Well #20. Measured flow 15 gpmWater Well June 17, 1969. Originally drill-
Service ed to supply water for oil welldrilling rig.
03-101 Renedy Ranch 4 1/4 Tg + 3.0 Jan. 9, 1969 C,W S Potrillo Viejo Well. Pormerlyflowed. Measured discharge 10gpm in 1933. Pumping level 7 ftbelow LSD Jan. 9, 1969. Temperature B4P (29CC).
201 do. Carl Vickers 1950 1,038 5 3/16 Tg 21 + 1969 Plows S El Sordo Wjll. 1,000 ft 5 3/16Water Well in. casing. Set packer. 2/Service
301 do. Tg + 1969 Plows S Agua Dulce Well. 2 in. dischargepipe reduced to 1 in. Estimateddischarge 5 gpm. Measured flow2Bgpm Apr. 6, 1933. Temperature Bil/2’P (27CC).
* 401 Armstrong Ranch W.P. Gano 1906 600± 3 Tg 23 C,W S Alazan Well. Reported flow 304 1/4 gpm March 1913. Measured flow
5 gpm Apr. 19, 1933. Worked overin 1969.
402 Renedy Ranch 36 4 1/4 Qep 15.0 Apr. 4, 1933 C,W S Muisache Well. Temperature 73P15.4 Jan. 10, 1969 (23’C).
403 do. Carl Vickere 1950 948 5 3/16 Tg + 1969 Plows S Piedra Trap Well. 2 in. die-
Water Well charge pipe reduced to 1 in.
Service Estimated flow 5 gpm. Temperature B0”P (27CC).
501 do. 40 B Qep 26 14.0 Apr. 4, 933 C,W S Rodeo Well. Temperature 73P12.3 Jan. 10, 1969 (23CC).
* 502 do. O.M. Boone 1926 1,163 5 3/16 Tg + 1969 Plows S Mido Well. Estimated flow 5 gpm.
4 1/2 Measured flow 26 gpm Apr. 4,1933. Perforated casing 1,100 to1,163.
See footnotes at end of table.
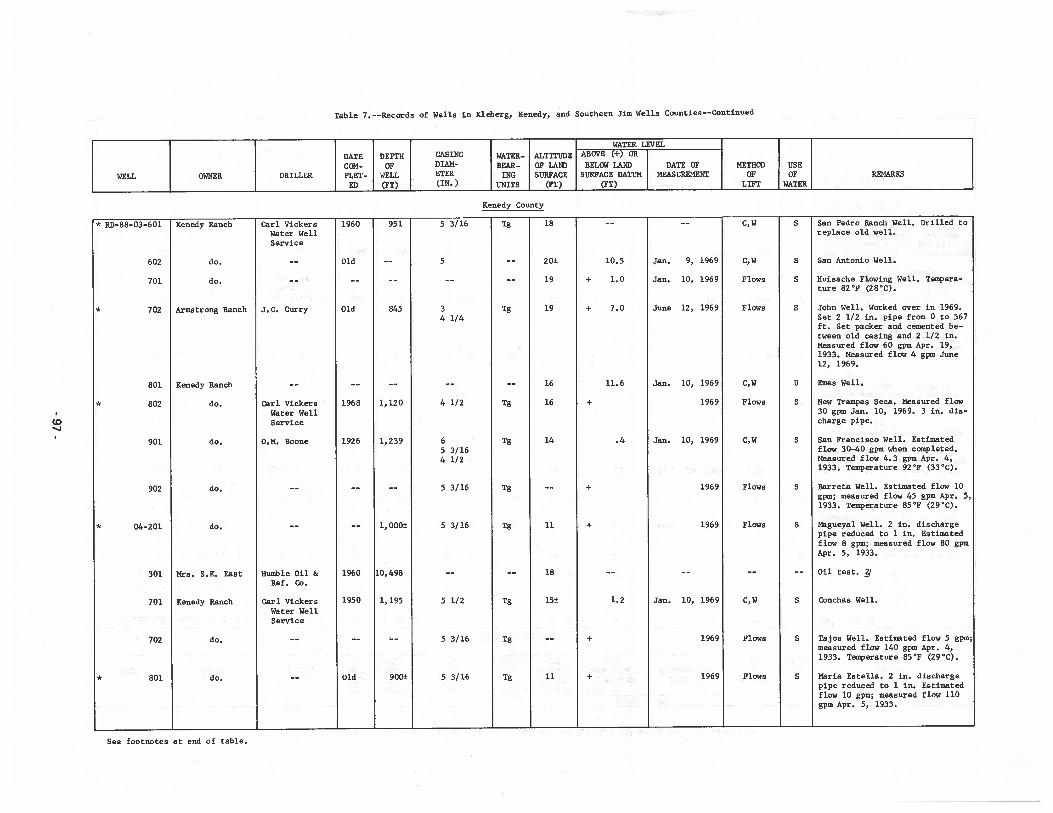
Table 7. --Records of Wells in Kleberg, Kenedy, and Southern Jim Wells Counties--Continued
Co
WATER LEVEL
DATE DEPTH CASING WATER- ALTITUDE ABOVE (+) OR
CON- OF DIAN- BEAR- OF LAND BELOW LAND DATE OF METHOD USE
WELL OWNER DRILLER PLET- WELL ETER ING SURFACE SURFACE DATUM MEASUREMENT OF OF REMARKS
ED (FT) (IN.) UNITS (FT) (FT) LIFT WATER
Kenedy County
* RD-88-O3-60l Kenedy Ranch Carl Vickers 1960 951. 5 3/16 Tg 18 -- -- C,W S San Pedro Ranch Well. Drilled to
Water Well replace old well.Service
602 do. -- Old -- 5 -- 20± 10.5 Jan. 9, 1969 C,W S San Antonio Well.
701 do. -- -- -- -- -- 19 + 1.0 Jan. 10, 1969 Flows S Huisache Flowing Well. Temperature 82’F (28’C).
* 702 Armstrong Ranch J.C. Curry Old 845 3 Tg 19 + 7.0 June 12, 1969 Flows S John Well. Worked over in 1969.
4 1/4 Set 2 1/2 in. pipe from 0 to 567ft. Set packer and cemented between old casing and 2 1/2 in.Measured flow 60 gpm Apr. 19,1933. Measured flow 4 gpui June12, 1969.
801 Kenedy Ranch -- -- -- -- -- 16 11.6 Jan. 10, 1969 C,W U Emes Well.
* 802 do. Carl Vickers 1968 1,120 4 1/2 Tg 16 + 1969 Flows S New Trampas Seca. Measured flow
Water Well 30 gpm Jan. 10, 1969. 3 in. dis
Service charge pipe.
901 do. O.M. Boone 1926 1,239 6 Tg 14 .4 Jan. 10, 1969 C,W S San Francisco Well. Estimated
5 3/16 flow 30—40 gpm when completed.
4 1/2 Measured flow 4.3 gpm Apr. 4,1933. Temperature 92F (33CC).
902 do. —— —— —— 5 3/16 Tg —— + 1969 Flows S Barreta Well. Estimated flow 10gpm; measured flow 45 gpm Apr. 5,1933. Temperature 85F (29’C).
* 04-201 do. —- -- 1, 000± 5 3/16 Tg 11 + 1969 Flows S Magueyal Well. 2 in. dischargepipe reduced to I in. Estimatedflow 8 gpm; measured flow 80 gpmApr. 5, 1933.
301 Mrs. S.K. East Humble Oil & 1960 10,498 -— —— 18 —— —- -— —— Oil test. JRef. Co.
701 Kenedy Ranch Carl Vickers 1950 1,195 5 1/2 Tg 15± 1.2 Jan. 10, 1969 C,W S Conches Well.
Water WellService
702 do. -- -- -- 5 3/16 Tg -- + 1969 Flows S Tajos Well. Estimated flow 5 gpm;measured flow 140 gpm Apr. 4,1933. Temperature 85’F (29’C).
* 801 do. -- Old 900± 5 3/16 Tg 11 ÷ 1969 Flows S Maria Estella. 2 in. dischargepipe reduced to 1 in. Estimatedflow 10 gpiu; measured flow 110gpm Apr. 5, 1933.
See footnotes at end of table.
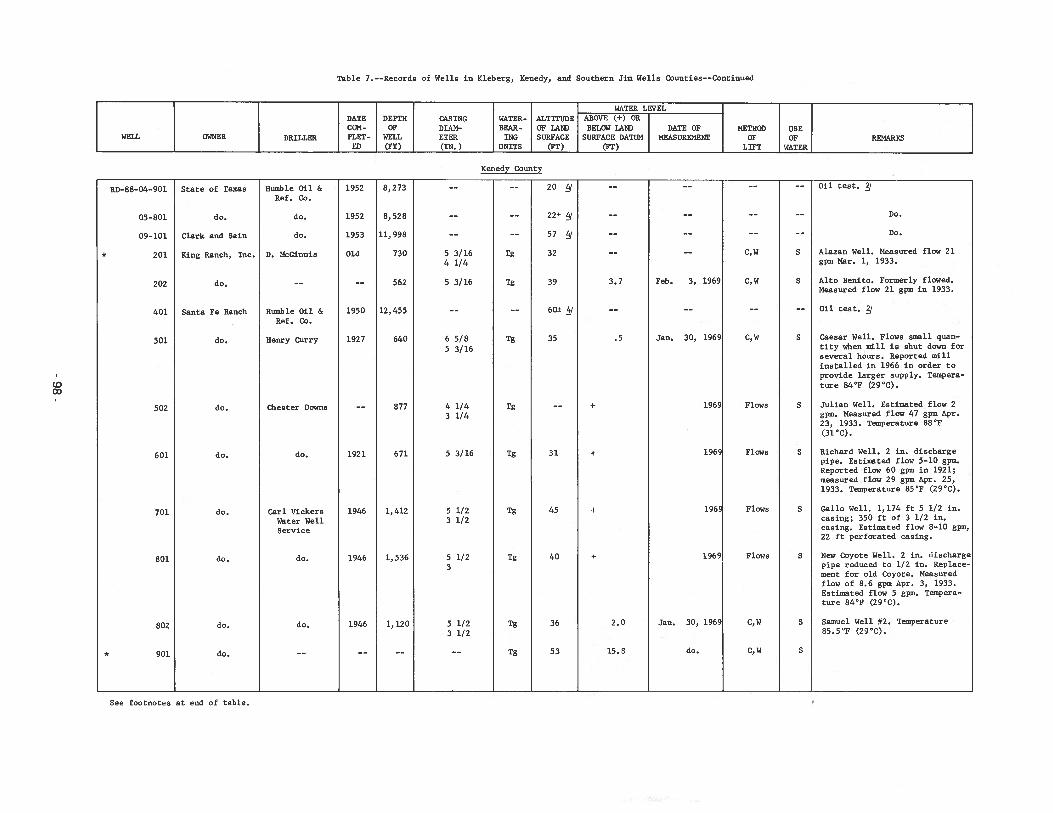
Table 7. --Records of Wells in Kleberg, Kenedy, and Southern Jim Wells Counties-—Continued
WATER LEVELDATE DEPTH CASING WATER- ALTITUDE ABOVE (+) ORCON- OF DIAM- BEAR- OF LAND BELOW LAND DATE OF METHOD USE
WELL OWNER DRILLER PLET- WELL ETER TNG SURFACE SURFACE DATUM MEASUREMENT OF OF REMARKSED (FT) (IN.) UNTTS (FT) (FT) LIFT WATER
Kenedy County
RD-B8-04—9O1 State of Texas Humble Oil & 1952 8,273 -— 20 3/ —— Oil test. /Ref. Co.
05-801 do. do. 1952 8,528 22± 4 Do.
09-101 Clark and Sam do. 1953 11,998 -- -- 57 4 ---- Do.
* 201 King Ranch, Inc. D. McGinnis Old 730 5 3/16 Tg 32 C,W S Alazan Well. Measured flow 21
4 1/4 gpm Mar. 1, 1933.
202 do. 562 5 3/16 Tg 39 3.7 Feb. 3, 1969 C,W S Alto Benito. Formerly flowed.Measured flow 21 gpm in 1933.
401 Santa Fe Ranch Rumble Oil & 1950 12,455 60± 4 Oil test. giRef. Co.
501 do. Nenry Curry 1927 640 6 5/8 Tg 35 .5 Jan. 30, 1969 C,W S Caesar Well. Flows small quan—
5 3/16 tity when mill is shut down forseveral hours. Reported millinstalled in 1966 in order toprovide larger supply. Temperature 84’F (29’C).
502 do. Chester Downs B77 4 1/4 Tg + 1969 Flows S Julian Well. Estimated flow 2
3 1/4 gpm. Measured flow 47 gpm Apr.23, 1933. Temperature BB’F(31’C).
601 do. do. 1921 671 5 3/16 Tg 31 + 1969 Flows S Richard Well. 2 in. dischargepipe. Estimated flow 5-10 gpm.Reported flow 60 gpm in 1921;measured flow 29 gpm Apr. 25,1933. Temperature 85’F (29’C).
701 do. Carl Vickers 1946 1,412 5 1/2 Tg 45 + 196 Flows S Gallo Well. 1,174 ft 5 1/2 in.
Water Well 3 1/2 casing; 350 ft of 3 1/2 in.
Service casing. Estimated flow 8-10 gpm,22 ft perforated casing.
801 do. do. 1946 1,536 5 1/2 Tg 40 + 1969 Flows S New Coyote Well. 2 in. discharge
3 pipe reduced to 1/2 in. Replacement for old Coyote. Measuredflow of B.6 gpm Apr. 3, 1933.Estimated flow 5 gpa. Temperature B4’F (29CC).
802 do. do. 1946 1,120 5 1/2 Tg 36 2.0 Jan. 30, 1969 C,W S Samuel Well #2. Temperature
3 1/2 85.5’F (29’C).
* 901 do. -- Tg 53 15.8 do. C,W S
See footnotes st end of table.
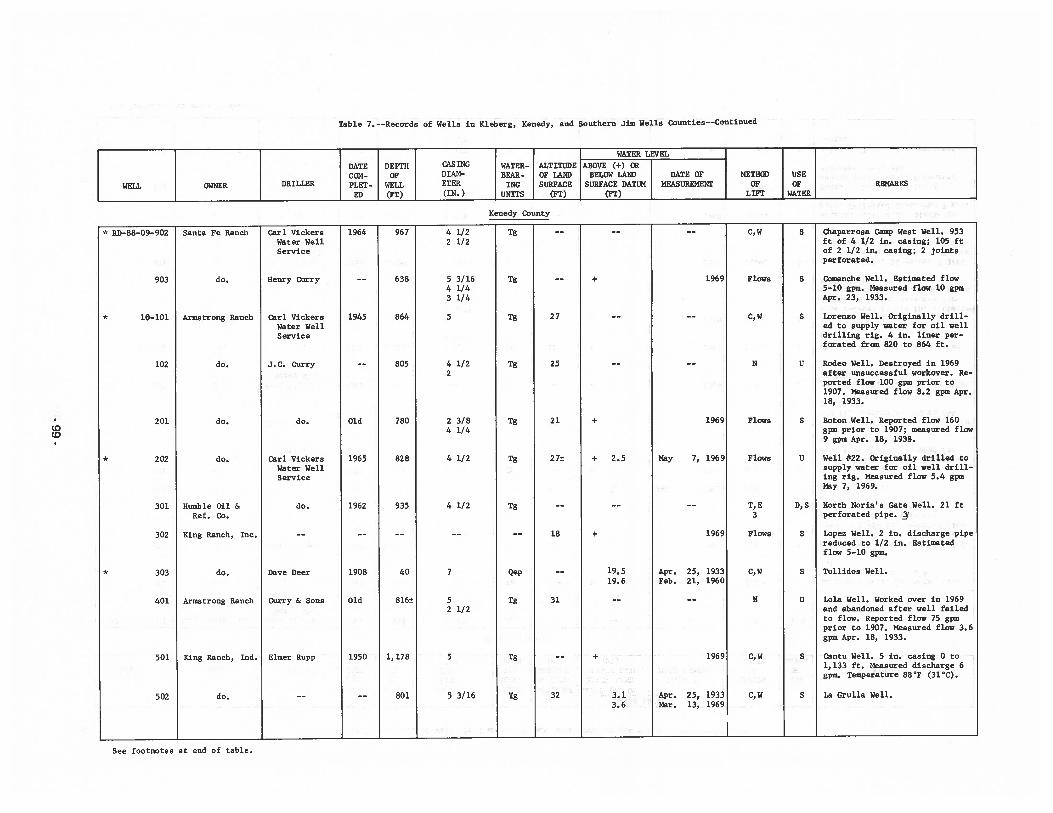
Table 7. --Records of Wells in Kleberg, Kenedy, and Southern Jim Wells Counties--Continued
* RD-88-09-902
Humble Oil &Ref. Co.
King Ranch, I.nc.
Carl VickersWater WellService
Henry Curry
Carl VickersWater WellService
J.C. Curry
Carl VickersWater WellService
4 1/22 1/2
5 3/164 1/43 1/4
5
4 1/22
2 3/84 1/4
4 1/2
52 1/2
Apr. 25, 1933Feb. 21, 1960
1969
Apr. 25, 1933Mar. 13, 1969
Chaparrosa Camp West Well. 953ft of 4 1/2 in. casing; 105 ftof 2 1/2 in. casing; 2 jointsperforated.
Comanche Well. Estimated flow5-10 gpm. Measured flow 10 gpmApr. 23, 1933.
Lorenzo Well. Originally drilled to supply water for oil welldrilling rig. 4 in. liner perforated from 820 to 864 ft.
Rodeo Well. Destroyed in 1969after unsuccessful workover. Reported flow 100 gpm prior to1907. Measured flow 8.2 gpm Apr.18, 1933.
Boton Well. Reported flow 160gpm prior to 1907; measured flow9 gpm Apr. 18, 1933.
Well #22. Originally drilled tosupply water for oil well drilling rig. Measured flow 5.4 gpmNay 7, 1969.
North Noria’s Gate Well. 21 ftperforated pipe. J
Lopez Well. 2 in. discharge pipereduced to 1/2 in. Estimatedflow 5—10 gpm.
Tullidos Well.
Lola Well. Worked over in 1969and abandoned after well failedto flow. Reported flow 75 gpmprior to 1907. Measured flow 3.6gpm Apr. 18, 1933.
Cantu Well. 5 in. casing 0 to1,133 ft. Measured discharge 6gpm. Temperature 88F (3lC).
La Grulla Well.
WATER LEVEL
DATE DEPTH CASING WATER.- ALTITUDE ABOVE (+) ORCON- OF DIAN- BEAR- OF LAND BELOW LAND DATE OF METHOD USE
WELL OWNER DRILLER PLET- WELL ETER ING SURFACE SURFACE DATUM MEASUREMENT OF OF REMARKSED (PT) (IN.) UNITS (PT) (PT) LIFT WATER
Kenedy County
Santa Fe Ranch
do.
Armstrong Ranch
do.
do.
do.
Co(0
do.
903
* 10-101
102
201
* 202
301
302
* 303
401
501
502
1964
1945
Old
1965
1962
1908
Old
1950
4 1/2
1969
1969
May 7, 1969
1969
967
638
864
805
780
828
935
40
816±
1, 178
801
Tg
Tg
Tg
Tg
Tg
Tg
Tg
Qep
Tg
Tg
Tg
+
+
+ 2.5
+
l9519.6
+
3.13.6
27
25
21
27±
18
31
32
C, W
Flows
C, W
N
Flows
Flows
T, E3
Flows
C, W
N
C, W
C, W
do.
Dave Deer
Curry & Sons
Elmer Rupp
S
S
S
U
S
U
D, S
S
S
U
S
S
7do.
Armstrong Ranch
King Ranch, md.
do.
5
5 3/16
See footnotes at end of table.
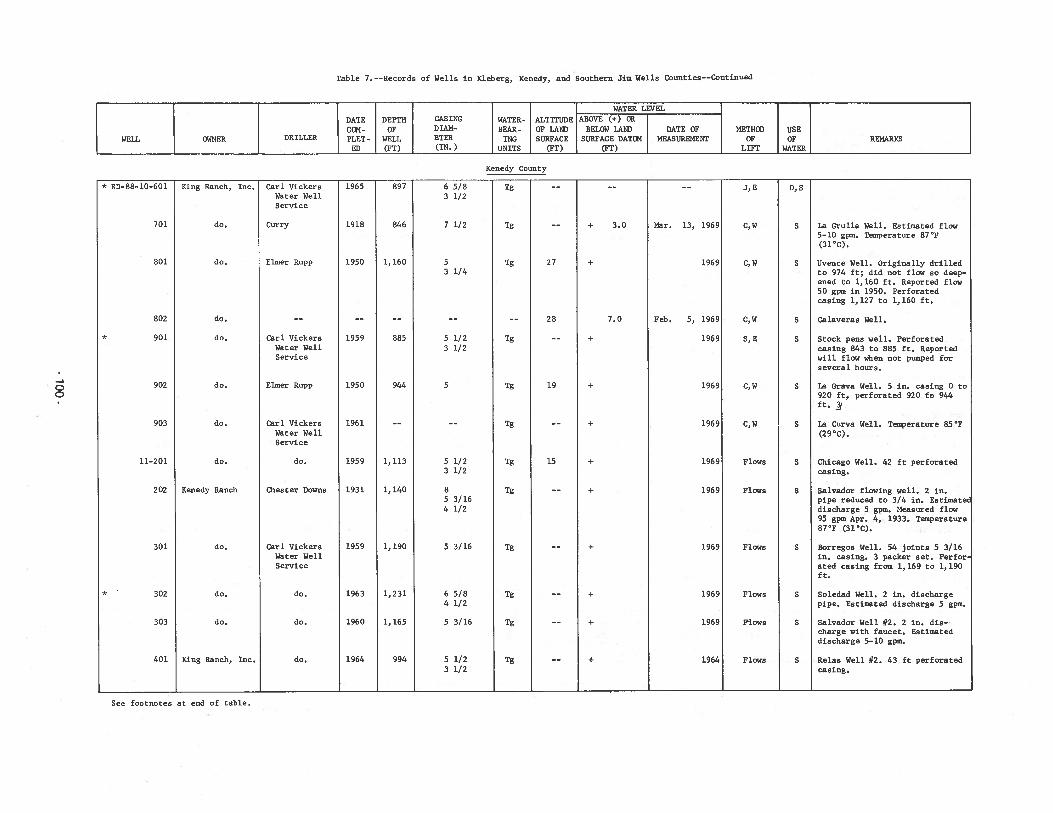
Table 7. --Records of Wells in Kleberg, Kenedy, and Southern Jim Wells Counties——Continued
WATER LEVEL
DATE DEPTH CASING WATER- ALTITUDE ABOVE (+) OROF DIAN- BEAR- OF LAND BELOW LAND DATE OF METHOD USE
WELL OWNER DRILLER PLET - WELL ETER 1MG SURFACE SURFACE DATUM MEASUREMENT OF OF REMARKSED (Fr) (IN.) UNITS (FT) (FT) LIFT WATER
Kenedy County
* RU-8B-lO-60l King Ranch, Inc. Carl Vickers 1965 B97 6 5/B Tg J,E D,SWater Well 3 1/2Service
701 do. Curry 191B B46 7 1/2 Tg + 3.0 Mar. 13, 1969 C,W S La Grulla Well. Estimated flow5-10 gpm. Temperature B7F(3l’C).
601 do. Elmer Rupp 1950 1,160 5 Tg 27 + 1969 C,W S Uvence Well. Originally drilled3 1/4 to 974 ft; did not flow so deep
ened to 1,160 ft. Reported flow50 gpm in 1950. Perforatedcasing 1,127 to 1,160 ft.
602 do. -- -- -- -- 2B 7.0 Feb. 5, 1969 C,W S Calaveras Well.
* 901 do. Carl Vickers 1959 BBS 5 1/2 Tg —— + 1969 S,E S Stock pens well. PerforatedWater Well 3 1/2 casing B43 to BBS ft. ReportedService will flow when not pumped for
several hours.
902 do. Elmer Rupp 1950 944 S Tg 19 + 1969 C,W S La Grava Well. S in. casing 0 too 920 ft, perforated 920 to 944
ft.’
903 do. Carl Vickers 1961 Tg + 1969 C,W S La Curva Well. Temperature BSFWater Well (29’C).Service
11-201 do. do. 19S9 1,113 5 1/2 Tg 15 ÷ 1969 Flows S Chicago Well. 42 ft perforated3 1/2 casing.
202 Renedy Ranch Chester Downs 1931 1,140 B Tg + 1969 Flows S Salvador flowing well. 2 in.S 3/16 pipe reduced to 3/4 in. Estimate4 1/2 discharge S gpm. Measured flow
95 gpm Apr. 4, 1933. TemperatureB7’F (3lC).
301 do. Carl Vickers 1959 1,190 S 3/16 Tg + 1969 Flows S Borregos Well. 54 joints S 3/16Water Well in. casing. 3 packer set. PerforService ated casing from 1,169 to 1,190
ft.
* 302 do. do. 1963 1,231 6 5/8 Tg + 1969 Flows S Soledad Well. 2 in. discharge4 1/2 pipe. Estianted discharge S gpm.
303 do. do. 1960 1,165 S 3/16 Tg ÷ 1969 Flows S Salvador Well #2. 2 in. dis_charge with faucet. Estimateddischarge 5-10 gpm.
401 King Ranch, Inc. do. 1964 994 S 1/2 Tg + 1964 Flows S Relas Well #2. 43 ft perforated3 1/2 casing.
See footnotes at end of table.
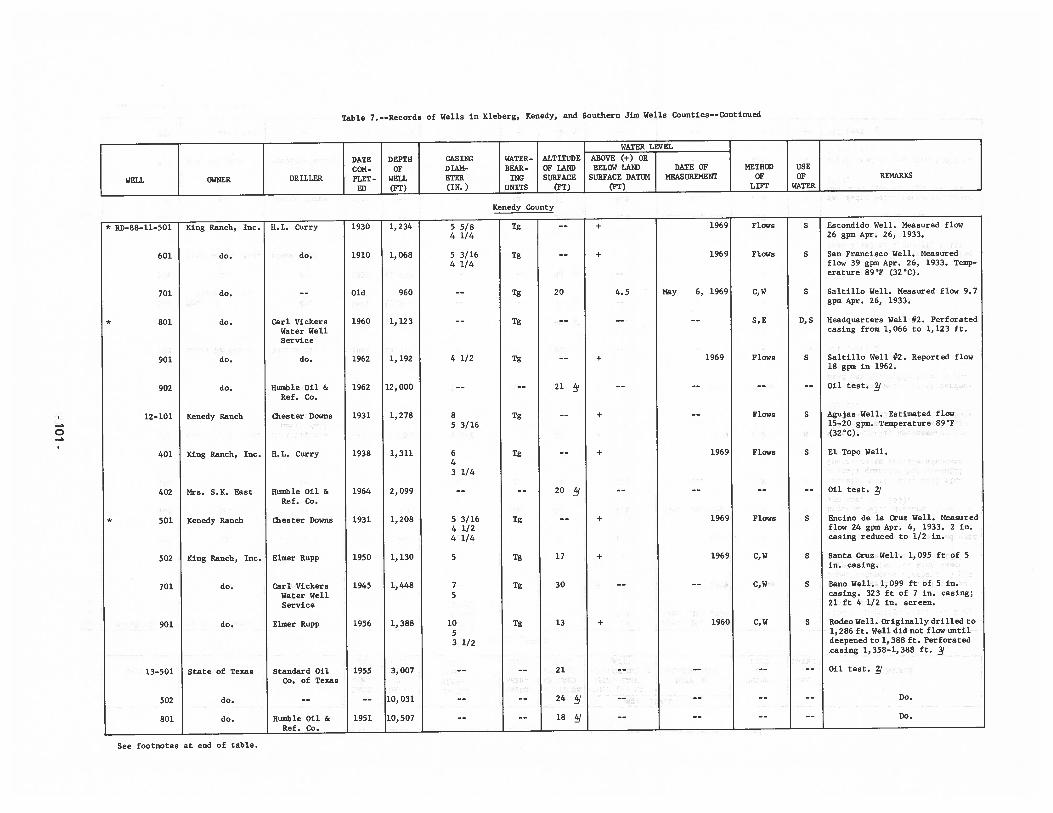
Table 7. -—Records of Wells in Kleberg, Kenedy, and Southern Jim Wells Counties--Continued
King Ranch, Inc. H.L. Curry
Carl VickersWater WellService
do.
Humble Oil &Ref. Co.
Chester Downs
King Ranch, Inc. H.L. Curry
Humble Oil &Ref. Co.
Chester Downs
Carl VickersWater WellService
Elmer Rupp
Standard OilCo. of Texas
Humble Oil &Ref. Co.
5 5/84 1/4
5 3/164 1/4
5 3/164 1/24 1/4
5
1053 1/2
C, W
Escondido Well. Measured flow26 gpin Apr. 26, 1933.
San Francisco Well. Measuredflow 39 gpm Apr. 26, 1933. Temperature 89F (32CC).
Saltillo Well. Measured flow 9.7gpm Apr. 26, 1933.
Headquarters Well #2. Perforatedcasing from 1,066 to 1,123 ft.
Ssltillo Well #2. Reported flow18 gpm in 1962.
Oil test. J
Agujas Well. Estimated flow15-20 gpm. Temperature 89’F(32’C).
El Topo Well.
Encino de 1.5 ruz Well. Measuredflow 24 gpm Apr. 4, 1933. 2 in.casing reduced to 1/2 in.
Santa Cruz Well. 1,095 ft of 5in. casing.
Bano Well. 1,099 ft of 5 in.casing. 323 ft of 7 in. casing;21 ft 4 1/2 in. screen.
Rodeo Well. Originally drilled to1,286 ft. Well did not flow untildeepened to 1,388 ft. Perforatedcasing 1,358-1,388 ft. /
Oil test. J
WATER LEVEL
DATE DEPTH CASING WATER- ALTITUDE ABOVE (+) OR
COM- OF DRAM- BEAR- OF LAND BELOW LAND DATE OF METHOD USE
WELL OWNER DRILLER PLET- WELL ETER ING SURFACE SURFACE DATUM MEASUREMENT OF OF REMARKS
ED (PT) (IN.) UNITS (PT) (PT) LIFT WATER
Kenedy County
do.do.
do.
do.
do.
do.
Kenedy Ranch
0
4.5
* RD-88-ll-5O1
601
701
* 801
901
902
12—101
401
402
* 501
502
701
901
13—501
502
801
4 1/2
85 3/16
643 1/4
Tg
Tg
Tg
Tg
Tg
Tg
Tg
Tg
Tg
Tg
Tg
Mrs. S.K. East
Kenedy Ranch
1930
1910
Old
1960
1962
1962
1931
1938
1964
1931
1950
1945
1956
1955
1951
1,234
1,068
960
1,123
1, 192
12,000
1,278
1,311
2,099
1,208
1, 130
1,448
1,388
3,007
10,031
10,507
+
+
+
+
+
+
+
+
Flows
Flows
C, W
S, E
Flows
Flows
Flows
Flows
C, W
1969
1969
May 6, 1969
1969
1969
1969
1969
1960
King Ranch, Inc. Elmer Rupp
S
S
S
D, S
S
S
S
S
S
S
S
20
21 /
20 /
17
30
13
21
24
18
75
Oil test. J
do.
do.
State of Texas
do.
do.
C, W
Do.
Do.
See footnotes at end of table.
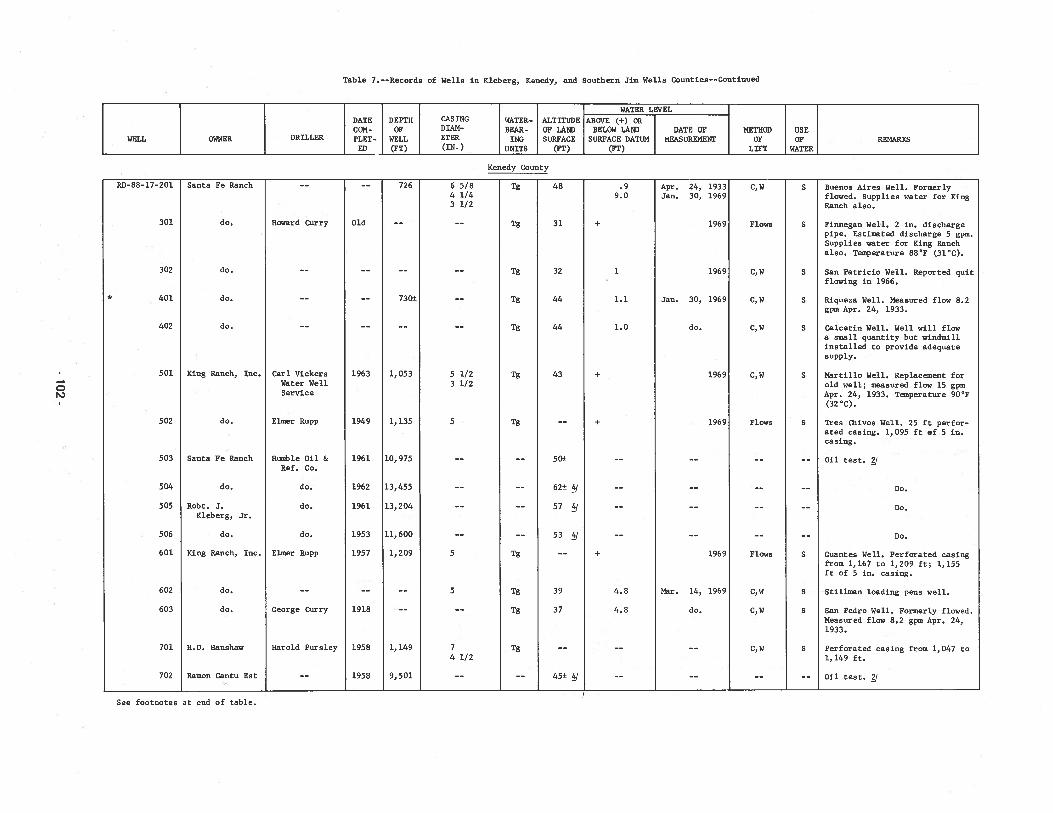
Table 7. --Records of Wells in Kleberg, Kenedy, and Southern Jim Wells Counties--Continued
King Ranch, Inc.
Howard Curry
Carl VickersWater WellService
George Curry
Harold Pursley
Apr. 24, 1933Jan. 30, 1969
Buenos Aires Well. Formerlyflowed. Supplies water for KingRanch also.
Finnegan Well. 2 in. dischargepipe. Estimated discharge 5 gpm.Supplies water for King Ranchalso. Temperature 88F (3lC).
San Patricio Well. Reported quitflowing in 1966.
Riqueza Well. Measured flow 8.2gpm Apr. 24, 1933.
Calcetin Well. Well will flowa small quantity but windmillinstalled to provide adequatesupply.
Nartillo Well. Replacement forold well; measured flow 15 gpmApr. 24, 1933. Temperature 90F(32’C).
Tres Jhivos Well. 25 ft perforated casing. 1,095 ft ef 5 in.casing.
Oil test. J
Do.
Do.
Do.
Guantes Well. Perforated casingfrom 1,167 to 1,209 ft; 1,155ft of 5 in. casing.
Stillman loading pens well.
San Pedro Well. Formerly flowed.Measured flow 8.2 gpm Apr. 24,1933.
Perforated casing from 1,047 to1,149 ft.
Oil test. J
WATER LEVELDATE DEPTH CASING WATER.- ALTITUDE ABOVE (+) ORCON- OF DIAM- BEAR- OF LAND BELOW LAND DATE OF METHOD USE
WELL OWNER DRILLER PLET- WELL ETER ING SURFACE SURFACE DATUM MEASUREMENT OF OP REMARKSg (yp) (IN.) UNITS (PT) (PT) LIFT WATER
Kenedy County
Santa Fe Ranch
do.
do.
do.
do.
+
0r%)
RD-88—17-20l
301
302
* 401
402
501
502
503
504
505
506
601
602
603
701
702
726
730±
1, 053
1, 135
10,975
13,455
13,204
11,600
1,209
1, 149
9,501
Old
1963
1949
1961
1962
1961
1953
1957
1918
1958
1958
6 5/84 1/43 1/2
5 1/23 1/2
5
5
5
74 1/2
Tg
Tg
Tg
Tg
Tg
Tg
Tg
Tg
Tg
Tg
Tg
.99.0
1
1.1
1.0
4.8
4.8
48
31
32
44
44
43
50±
62± /
57 &
53
39
37
45± /
1969
1969
Jan. 30, 1969
do.
1969
1969
1969
Mar. 14, 1969
do.
S
S
S
S
S
S
S
S
S
S
C, W
Flows
C,W
C,W
C,W
C, W
Flows
Flows
C, W
C, W
C, W
do. Elmer Rupp
Santa Fe Ranch Humble Oil &Ref. Co.
do. do.
Robt. J. do.Kleberg, Jr.
do. do.
King Ranch, Inc. Elmer Rupp
do.
do.
H.D. Hanshaw
Ramon Cantu Est
See footnotes at end of table.
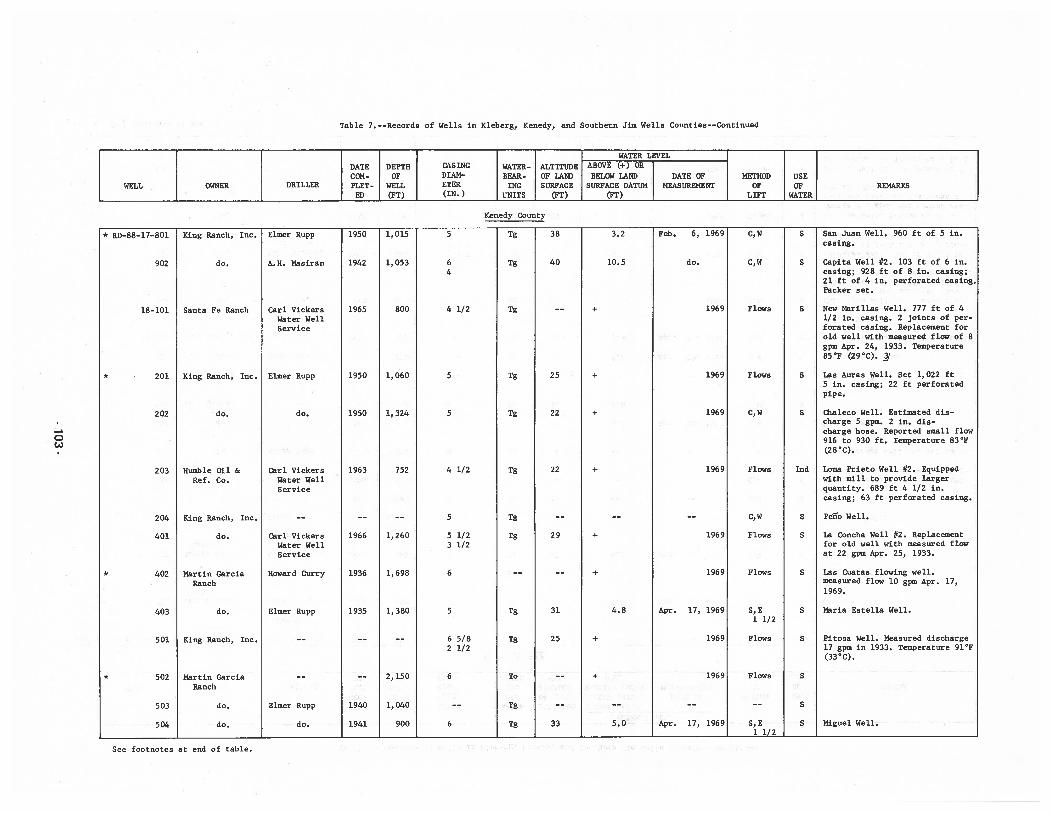
Table 7. --Recorda of Wells in Kleberg, Kenedy, and Southern Jim Wells Counties-—Continued
0(A)
WATER LEVEL
DATE DEPTH CASING WATER- ALTITUDE ABDVE (+) DR
COM- DF DIAN- BEAR- OF LAND BELOW LAND DATE DP METHOD USEWELL OWNER DRILLER PLET - WELL ETER IHC SURFACE SURFACE DATUM MEASUREMENT OP OF REMARKS
ED (PT) (IH.) UNITS (PT) (FT) LIFT WATER
Renedy County
* RD-BB-17-801 King Ranch, Inc. Elmer Rupp 1950 1,015 5 TE 38 3.2 Peb. 6, 1969 C,W S San Juan Well. 960 ft of 5 in.casing.
902 do. A.H. Nasiran 1942 1,053 6 Tg 40 10.5 do. C,W S Capita Well #2. 103 ft of 6 in.
4 casing; 92B ft of B in. casing;21 ft of 4 in. perforated casing.Packer set.
18-101 Santa Fe Ranch Carl Vickers 1965 800 4 1/2 Tg —- + 1969 Flows S New Narillas Well. 777 ft of 4
Water Well 1/2 in. casing. 2 joints of per-
Service forated casing. Replacement forold well with measured flow of 8gpm Apr. 24, 1933. Temperature85AF (29AC). f
201 King Ranch, Inc. Elmer Rupp 1950 1,060 5 Tg 25 + 1969 Flows S las Auras Well. Set 1,022 ft5 in. casing; 22 ft perforated
.pipe.
202 do. do. 1950 1,324 5 Tg 22 + 1969 C,W S Chaleco Well. Estimated discharge 5 gpm. 2 in. discharge hose. Reported small flow
,916 to 930 ft. Temperature 83AF
(28 AC).
203 Mumble Oil & Carl Vickers 1963 752 4 1/2 Tg 22 + 1969 Flows Ind Loma Prieto Well #2. Equipped
Ref. Co. Water Well with mill to provide larger
Service quantity. 689 ft 4 1/2 in.casing; 63 ft perforated casing.
204 King Ranch, Inc. -- -- -- 5 Tg -- -- -- C,W S Pelo Well.
401 do. Carl Vickers 1966 1,260 5 1/2 Tg 29 + 1969 Flows S La Concha Well #2. Replacement
Water Well 3 1/2 for old well with measured flow
Service at 22 gpm Apr. 25, 1933.
* 402 Martin Garcia Howard Curry 1936 1,698 6 -- -- + 1969 Flows S Las Cuatas flowing well.
Ranch measured flow 10 gpm Apr. 17,1969.
403 do. Elmer Rupp 1935 1,380 5 Tg 31 4.8 Apr. 17, 1969 S,E S Maria Estella Well.1 1/2
501 King Ranch, Inc. -- -- -- 6 5/B Tg 25 + 1969 Flows S Fitosa Well. Measured discharge2 1/2 17 gpm in 1933. Temperature 9FF
(33 AC)
502 Martin Garcia -- -- 2,150 6 To —- + 1969 Flows S
Ranch
503 do. Elmer Rupp 1940 1,040 -- Tg -- -- -- -- S
504 do. do. 1941 900 6 Tg 33 5.0 Apr. 17, 1969 S,E S Miguel Well.1 1/2
See footnotes at end of tsble.
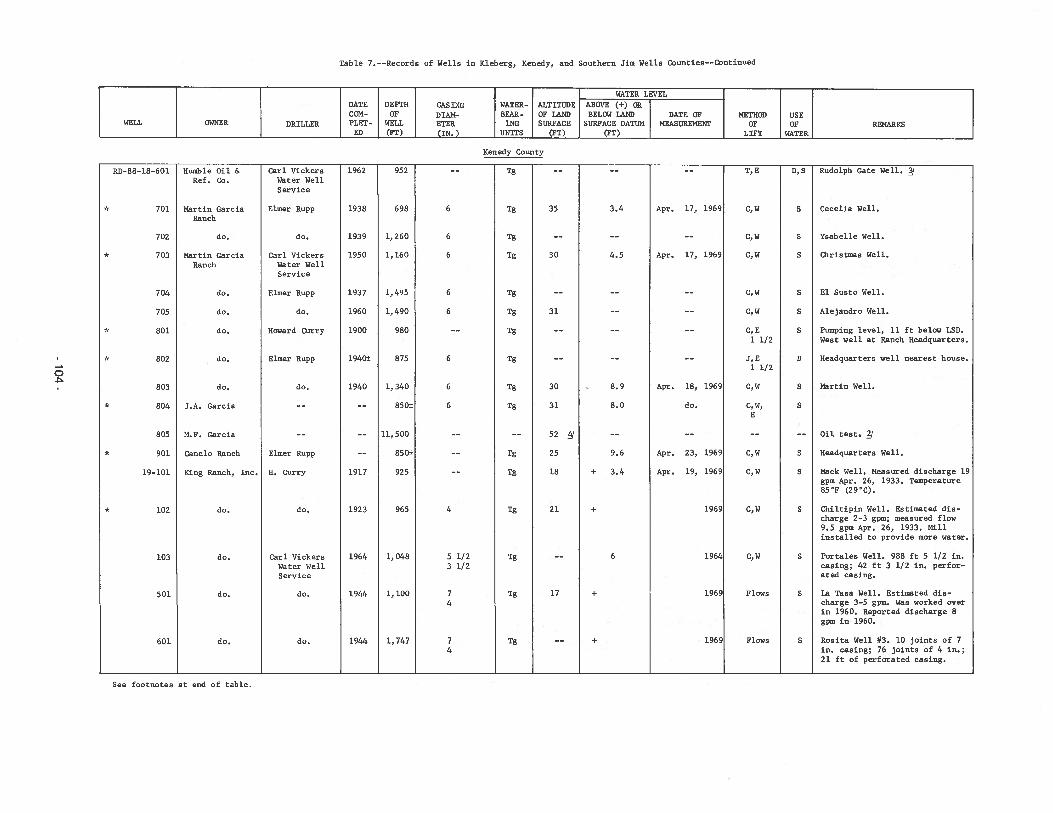
Table 7. --Records of Wells in Rleberg, Renedy, and Southern Jim Wells Counties--Continued
Humble Oil &Ref. Co.
Carl VickersWater WellService
Elmer Rupp
Carl VickersWater WellService
do.
Oil test. /
Headquarters Well.
Rack Well. Measured discharge 19gpm Apr. 26, 1933. Temperature85’F (29CC).
Chiltipin Well. Estimated discharge 2-3 gpm; measured flow9.5 gpm Apr. 26, 1933. Millinstalled to provide more water.
Portales Well. 988 ft 5 1/2 in.casing; 42 ft 3 1/2 in. perforated casing.
La Tasa Well. Estimated discharge 3-5 gpm. Was worked overin 1960. Reported discharge 8gpm in 1960.
Rosita Well #3. 10 joints of 7in. casing; 76 joints of 4 in.;21 ft of perforated casing.
WATER LEVELDATE DEPTH CASTHG WATER- ALTITUDE ABOVE (+) ORCOM- OF DIAM- BEAR- OP LAUD BELOW LAHD DATE OP METHOD USE
WELL OWNER DRILLER PLET - WELL ETER 1MG SURFACE SURFACE DATUM MEASUREMENT OP OP REMARKSED (PT) (IH.) UNITS (FT) (PT) LIFT WATER
Renedy County
0
RD—88- 18-601
701
702
* 703
704
705
* 801
* 802
803
* 804
805
* 901
19—101
* 102
103
501
601
do.
Carl VickersWater WellService
Elmer Rupp
do.
Howard Curry
Elmer Rupp
do.
Elmer Rupp
H. Curry
do.
Martin GarciaRanch
do.
Martin GarciaRanch
do.
do.
do.
do.
do.
J.A. Garcia
M.F. Garcia
Canelo Ranch
King Ranch, Inc.
do.
do.
do.
do.
1962
1938
1939
1950
1937
1960
1900
1940±
1940
1917
1923
1964
1944
1944
Rudolph Gate Well. /
Cecelia Well.
Ysabelle Well.
Christmas Well.
El Susto Well.
Alejandro Well.
Pumping level, 11 ft below LSD.West well at Ranch Headquarters.
Headquarters well nearest house.
Martin Well.
952
698
1,260
1,160
1,495
1,490
980
875
1, 340
850±
11,500
850±
925
965
1,048
1, 100
1, 747
Tg
Tg
Tg
Tg
Tg
Tg
Tg
Tg
Tg
Tg
Tg
Tg
Tg
Tg
Tg
Tg
35
3D
31
3D
31
52
25
18
21
17
6
6
6
6
6
6
6
6
4
5 1/23 1/2
74
74
3.4
4.5
8.9
8.0
9.6
+ 3.4
+
6
÷
+
T, K
C, W
C,W
C,W
C, W
C, W
C, E1 1/2
J, E1 1/2
C, W
C, W,E
C, W
C, W
C,W
C, W
Flows
Plows
Apr. 17, 1969
Apr. 17, 1969
Apr. 18, 1969
do.
Apr. 23, 1969
Apr. 19, 1969
1969
1964
1969
1969
0,5
S
S
S
S
S
S
D
S
S
S
S
S
S
S
Sdo.
See footnotes at end of table.
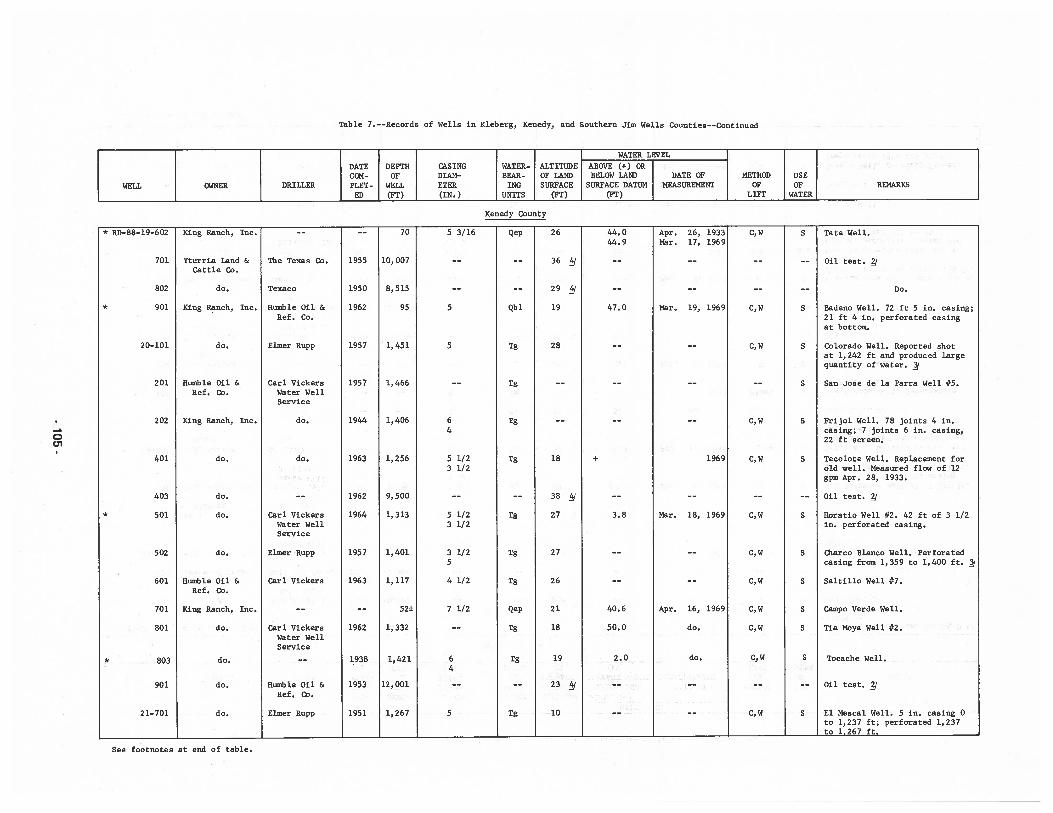
Table 7. --Records of Wells in Kleberg, Kenedy, and Southern Jim Wells Counties--Continued
0C;,
WATER LEVEL
DATE DEPTH CASTNC WATER- ALTTTUDE ABOVE (+) ORCON- OF OIAN- BEAR- OF LAND BELOW LAND DATE OF METHOD USE
WELL OWNER DRILLER PLET - WELL ETER INC SURFACE SURFACE DATUM MEASUREMENT OF OF REMARKSED (PT) (TN.) UNITS (PT) (PT) LIFT WATER
Renedy County
* RD-88—l9-602 King Ranch, Tnc. —— —— 70 5 3/16 Qep 26 44.0 Apr. 26, 1933 C,W S Tate Well.44.9 Mar. 17, 1969
701 Yturria Land & The Texas Co. 1955 10,007 -- -- 36 / -- -- -- -- Oil test. /Cattle Co.
• 802 do. Texaco 1950 8,515 -- -- 29 q -- -- -- -— Do.
901 King Ranch, Inc. Numble Oil & 1962 95 5 Qbl 19 47.0 Mar, 19, 1969 C,W S Badeno Well. 72 ft 5 in. casing;Ref. Co. 21 ft 4 in. perforated casing
at bottom.
20-101 do. Elmer Rupp 1957 1,451 5 Tg 28 -- -- C,W S Colorado Well. Reported ahotat 1,242 ft and produced largequantity of water. /
201 Humble Oil & Carl Vickers 1957 1,466 -- Tg -- -- -- -- S San Jose de la Parra Well #5.Ref. Co. Water Well
Service
202 King Ranch, Inc. do. 1944 1,406 6 Tg —— —- —- C,W S Frijol Well. 78 joints 4 in.4 casing; 7 joints 6 in. casing,
22 ft screen.
401 do. do. 1963 1,256 5 1/2 Tg 18 + 1969 C,W S Tecolote Well. Replacement for3 1/2 old well. Measured flow of 12
gpm Apr. 28, 1933.
403 do. —— 1962 9,500 —- —- 38 / -— —- —— -- Oil test. /
* 501 do. Carl Vickers 1964 1,313 5 1/2 Tg 27 3.8 Mar. 18, 1969 C,W S Horatio Well #2. 42 ft of 3 1/2Water Well 3 1/2 in. perforated casing.Service
502 do. Elmer Rupp 1957 1,401 3 1/2 Tg 27 -- —- C,W S Jharco Blanco Well. Perforated5 casing from 1,359 to 1,400 ft. /
601 Mumble Oil & Carl Vickera 1963 1,117 4 1/2 Tg 26 —- —- C,W S Saltillo Well #7.Ref. Co.
701 King Ranch, Inc. -- -- 52± 7 1/2 Qep 21 40,6 Apr. 16, 1969 C,W S Campo Verde Well.
801 do. Carl Vickera 1962 1,332 —— Tg 18 50.0 do. C,W S Tia Moya Well #2.Water WellService
* 803 do. -- 1938 1,421 6 Tg 19 2.0 do. C,W S Tocache Well.‘. 4
901 do. Humble Oil & 1953 12,001 —— —— 23 —— —— —— —- Oil teat. /Ref. Co.
21-701 do. Elmer Rupp 1951 1,267 5 Tg 10 -— -- C,W S El Mescal Well. 5 in. casing 0to 1,237 ft; perforated 1,237to_1,267_ft.
See footnotes at end of table.
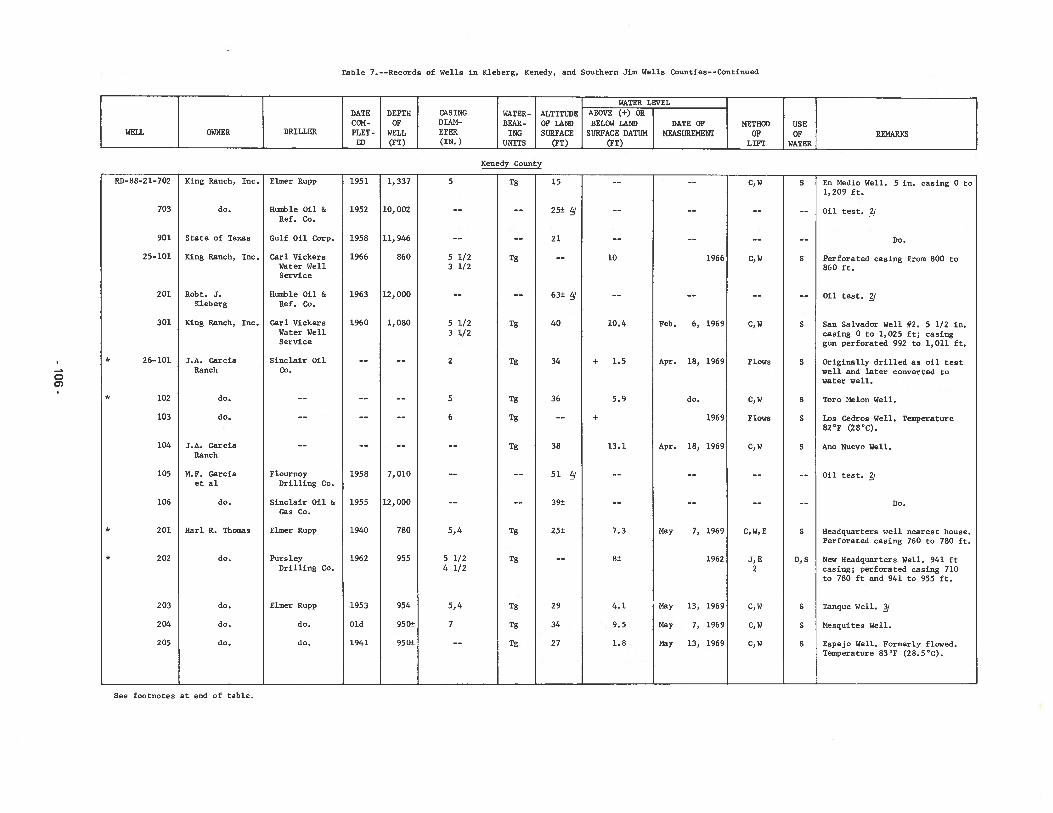
Table 7. --Records of Wells in Kleberg, Kenedy, and Southern Jim Wells Counties--Continued
Robt. J.Kleberg
King Ranch, Inc.
Humble Oil &Ref. Co.
Gulf Oil Corp.
Carl VickersWater WellService
Humble Oil &Ref. Co.
Carl VickersWater WellService
Sinclair OilCo.
En Medio Well. 5 in. casing 0 to1,209 ft.
Oil test. /
Do.
Perforated casing from 800 to860 ft.
Oil test. J
San Salvador Well #2. 5 1/2 in.casing 0 to 1,025 ft; casinggun perforated 992 to 1,011 ft.
Originally drilled as oil testwell and later converted towater well.
Toro Melon Well.
Los Cedros Well. Temperature82F (28CC).
Ano Nuevo Well.
Oil test.
Headquarters well nearest house.Perforated casing 760 to 780 ft.
New Headquarters Well. 941 ftcasing; perforated casing 710to 780 ft and 941 to 955 ft.
King Ranch, Inc. Elmer Rupp
WATER LEVELDATE DEPTH CASING WATER- ALTITUDE ABOVE (+) ORCOM- OF DIAM- BEAR- OF LAND BELOW LAND DATE OF METHOD USE
WELL OWNER DRILLER PLET- WELL ETER ING SURFACE SURFACE DATUM MEASUREMENT OF OF REMARKSED (FT) (IN.) UNITS (Fl) (FT) LIFT WATER
Kenedy County
do.
State of Texas
King Ranch, Inc.
C0)
RD-88—2 1-702
703
901
25—101
201
301
* 26—101
* 102
103
104
105
106
* 201
* 202
203
204
205
1951
1952
1958
1966
1963
1960
1958
1955
1940
1962
1953
Old
1941
1,337
10,002
11, 946
860
12,000
1,080
7,010
12,000
780
955
954
950±
950±
5
5 1/23 1/2
5 1/23 1/2
2
5
6
5,4
5 1/24 1/2
5,4
7
Tg
Tg
Tg
Tg
Tg
Tg
Tg
Tg
Tg
Tg
Tg
Tg
15
25± /
21
63±
40
34
36
38
51
39±
25±
29
34
27
J.A. CarciaRanch
do.
do.
J.A. GarciaRanch
M.F. Garciaet al
do.
Marl K. Thomas
do.
do.
do.
do.
10
10.4
+ 1.5
5.9
÷
13.1
7.3
8±
4.1
9.5
1.8
C,W
C, W
C, W
Flows
C, W
Flows
C,W
C,W, E
J, H2
C, W
C,W
C,W
S
S
S
S
S
S
S
S
0, S
S
S
1966
Feb. 6, 1969
Apr. 18, 1969
do.
1969
Apr. 18, 1969
May 7, 1969
1962
May 13, 1969
Nay 7, 1969
May 13, 1969
FlournoyDrilling Co.
Sinclair Oil &Gas Co.
Elmer Rupp
Purs leyDrilling Co.
Elmer Rupp
do.
do.
Do.
Tanque Well. J
Mesquites Well.
Espejo Well. Formerly flowed.Temperature 83SF (285’C).
See footnotes at end of tsble.
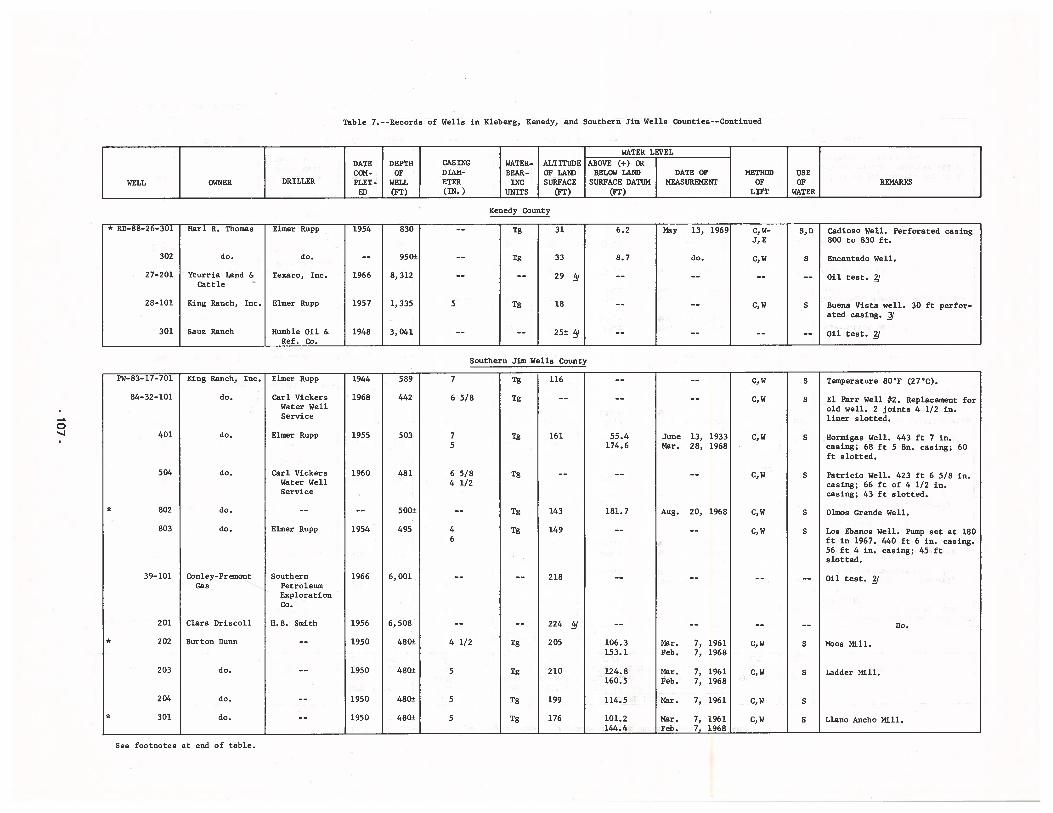
Table 7. --Records of Wells in Rleberg, Kenedy, and Southern Jim Wells Counties--Continued
0
WATER LEVEL
DATE DEPTH CASING WATER- ALTITUDE ABOVE (-I-) ORCON- OP DIAII- BEAR- OP LAND BELOW LAND DATE OF METHOD USE
WELL OWNER DRILLER PLET- WELL ETER INC SURFACE SURFACE DATUM MEASUREMENT OF OF REMARKSED (PT) (IN.) UNITS (PT) (PT) LIFT WATER
Renedy County
* RD-88-26-301 Marl R. Thomas Elmer Rupp 1954 830 -— Tg 31 6.2 May 13, 1969 C,W- S,D Cadioso Well. Perforated casingJ,E 800 to 830 ft.
302 do. do. -- 950± -- Tg 33 8.7 do. C,W S Encantado Well.
27-201 Yturria Land & Texaco, Inc. 1966 8,312 -- -- 29 4 -- -- -- -- Oil test.Cattle —
28-101 King Ranch, Inc. Elmer Rupp 1957 1,335 5 Tg 18 -- —- C,W S Buena Vista well. 30 ft perforated casing. 4
301 Sauz Ranch Mumble Dii & 1948 3,041 —- -— 25± 4 -— —— —— —— Oil test. /Ref._Co.
Southern Jim W us County
PW-83-17-701 King Ranch, Inc. Elmer Rupp 1944 589 7 Tg 116 -- -- C,W S Temperature 8DF (27CC).
84-32-101 do. Carl Vickers 1968 442 6 5/8 Tg -- -- -- C,W S El Parr Well #2. Replacement forWater Well old well. 2 joints 4 1/2 in.Service liner slotted.
401 do. Elmer Rupp 1955 503 7 Tg 161 55.4 June 13, 1933 C,W S Normigas Well. 443 ft 7 in.5 174.6 Mar. 28, 1968 casing; 68 ft 5 8n. casing; 60
ft slotted.
504 do. Carl Vickers 1960 481 6 5/8 Tg -— —- —— C,W S Patricio Well. 423 ft 6 5/8 in.Water Well 4 1/2 casing; 66 ft of 4 1/2 in.Service casing; 43 ft slotted.
802 do. -- -- 500± -- Tg 143 181.7 Aug. 20, 1968 C,W S Olmoa Grande Well.
803 do. Elmer Rupp 1954 495 4 Tg 149 -- -- C,W S Los Ebanos Well. Pump set at 1806 ft in 1967. 440 ft 6 in. casing.
56 ft 4 in. casing; 45 ft.
slotted.
39-101 Conley—Premont Southern 1966 6,001 -- —— 218 -— —— ———- Oil test. J
Gas PetroleumExplorationCo.
201 Clara Driscoll M.B. Smith 1956 6,508 -- -- 224 4 -- -- -- -- Do.
* 202 Burton Dunn -- 1950 480± 4 1/2 Tg 205 106.3 Mar. 7, 1961 C,W S ?tos Mill.153.1 Feb. 7, 1968
203 do. -- 1950 480± 5 Tg 210 124.8 Mar. 7, 1961 C,W S Ladder Mill.160.5 Eeb. 7, 1968
204 do. -- 1950 480± 5 Tg 199 114.5 Mar. 7, 1961 C,W S
301 do. -- 1950 480± 5 Tg 176 101.2 Mar. 7, 1961 C,W S Liano Ancho Mill.144.4 Feb. 7, 1968
See footnotes at end of table.
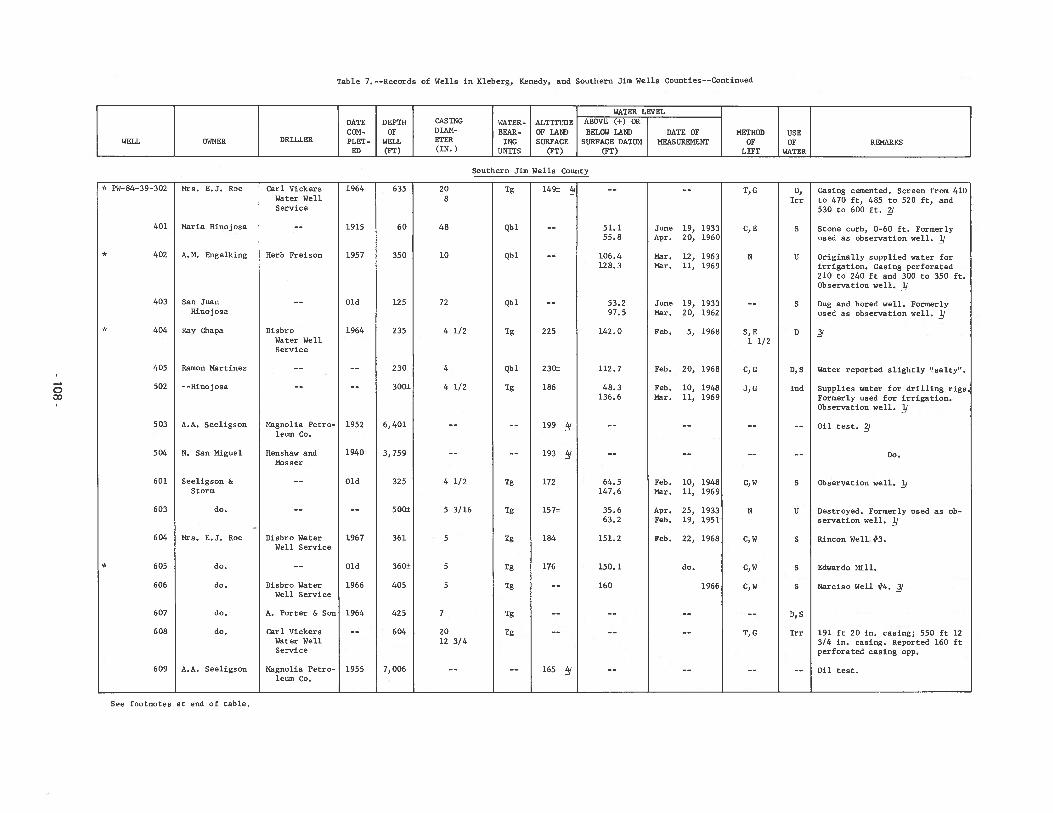
Table 7. --Records of Wells in Kleberg, Kenedy, and Southern Jim Wells Counties--Continued
Seeligson &Storm
do.
Carl VickersWater WellService
DisbroWater WellService
Magnolis Petroleum Co.
Henshaw andMosser
Disbro WaterWell Service
Disbro WaterWell Service
A. Porter & Son
Carl VickersWater WellService
Msgnolis Petroleum Co.
51.155.8
106.4128. 3
53,297.5
142.0
June 19, 1933Apr. 20, 1960
Mar. 12, 1963Mar. 11, 1969
June 19, 1933Mar. 20, 1962
Feb. 5, 1968
Casing cemented. Screen from 410to 470 ft, 485 to 520 ft, and530 to 600 ft. /
Stone curb, 0-60 ft. Formerlyused as observation well. ]/
Originally supplied water forirrigation. Casing perforated210 to 240 ft and 300 to 350 ft.Observation well. ]J
Dug and bored well. Formerlyused as observation well. ]/
Water reported slightly ‘!salty.
Supplies water for drilling rigs.Formerly used for irrigation.Observation well. /
Oil test.
Destroyed. Formerly used as observation well. 4
Rincon Well #3.
191 ft 20 in. casing; 550 ft 123/4 in. cmsing. Reported 160 ftperforated casing opp.
Oil test.
WATER LEVEL
DATE DEPTH CASING WATER- ALTITUDE ABOVE (+) ORCON- OF DTAM- BEAR- OF LAND BELOW LAN)) DATE OF METHOD USE
WELL OWNER DRILLER FLET - WELL ETER 1MG SUEPACE SURPACE DATUM I MEASUREMENT OF OF REMARKSED (FT) (TM.) UNITS (FT) (FT) J LIFT WATER
Southern Jim Wells_County
Herb Freison
Mrs. E.J. Roe
Maria Ninojosm
A.M. Engelking
San JuanMinojosm
Ray Chmpm
Rsmon Martinez
--Minojoss
A.A. Seeligson
N. San Miguel
003
* FW-84-39-302
401
* 402
403
* 404
405
502
503
504
601
603
604
* 605
606
607
606
609
1964
1915
1957
Old
1964
1952
1940
Old
1967
Old
1966
1964
1955
635
60
350
125
235
230
300±
6,401
3,759
325
500±
361
360±
405
425
604
7,006
20B
48
10
72
4 1/2
4
4 1/2
4 1/2
5 3/16
5
5
5
7
2012 3/4
Tg
Qbl
Qbl
Qbl
Tg
Qbl
Tg
Tg
Tg
Tg
Tg
Tg
Tg
Tg
149± 9
225
230±
186
199 4
193 9
172
157±
184
176
165 4
T, G
C, E
N
5, E1 1/2
C, G
J, G
C, W
N
C, W
C, W
C, W
T, C
D,Irr
S
U
S
D
0,5
Ind
S
U
S
S
S
0,5
Irr
112.7
48.3136.6
64,5147,6
35.663.2
151.2
150.1
160
Feb. 20, 1968
Peb. 10, 1948Mar. 11, 1969
Feb. 10, 1948Mar, 11, 1969
Apr, 25, 1933Feb. 19, 1951
Feb. 22, 1968
do.
1966
Mrs. N.J. Roe
do.
do.
do.
do.
A.A. Seeligson
Do.
Observation well. 1/
Edwmrdo Mill.
Nsrciso Well #4. i
See footnotes at end of table.
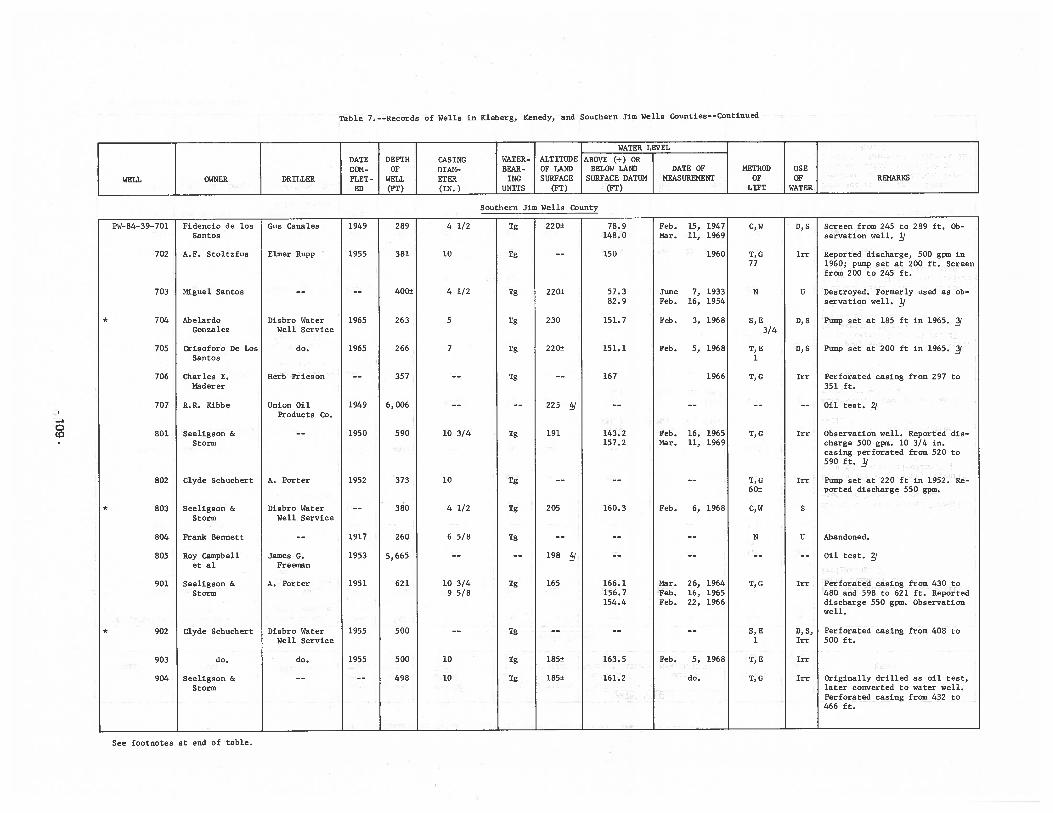
0U)I
II
I3U
).0
U)
U)U
)3U
..0
-IU
0E
ii‘)i1
0-d
0‘0
QU
O0
0.-b
0(4
44V
UU
U-,4
UU
)—1
44
Eon
U).
..
CU
UU
)•
0.
U)n
IC)
C-
V.0
C’)
00.’)
00U
00.
0‘0
04U
)Or-4
fl.
‘0w
>0
—4
CC
)44
UV
040.
C’)
U-d
1fl
04U
)-t’0U
4-.4
0.4
09-I
U)—
I—
IU
.-4Q
.U)
0)4
040
U)U)
O$
U)
00U
).U
)U)
U00
1(5
00
33
00
.—0
3O
U.0
0U
)’)C
-0
-4-d
UU
)CC
)U-.-4
0U
4-4
OU
U)O
U-C
’).
>4
‘01U
1(544
4444
0U)
U.d
UU
0U
4fl
-4.
V0
Ufl
00U
4-1
U1
4444
00•—
4V
440U
)C’)U
)00
01440
0U
tU)
U)0
-4U)
U)0.o
C.
0—
40
IC
).
U)1
(5U
).IC
)0
-d.-
.U0
00
-444
-.44
.’)
.OU
-.2-
U—
400
0U)
U)U
)U)
C’4
UU
)0U)
-dU
)U)
C-.-
1)U
)C-1
04
—4
C-)
U)1’
UC
-lU)
U)U
0U)
UU
U)
U)
0U
Ufl
‘0
2U
(4V
)-I(1
0V
0.U
U)U)
VO
OU
U)U
).
VO
SV
>S
>V
U0
U)V
OU)
.-d
0U
)-U
V•
U)IC
)U)
U)-4
3U
)4-4
0V
00
U)0
UU
UU
U4(4
04
UV
U)U
U08
U.-
IQ
U94
U)0
0>
5-4
U)U)
U).
U)U)
.U)
CU)
U)V
UU
).
U)4
)U)
CU
UC
-C
UU)
U)U
UU)
>U
)’0U
U)V
0U)
U0
U)
UU
CU
UU
)U)
U--
U’)
014-
UU
0U
)04-4
U)V
U0U
).0
.0
4-1
.1U
09
-4
U)>
00
U)
U>
0.
0.
444U
)U—
40.U
04
(4.-I
4-4O
0U
)4-4
UU
0.o0
U)U
U)U)
U—
—4
U)U
)U)0
EU
U)-
U0U
).-
IU
0-U
U’0
VU
)U
)0’U
U)U
)0
U)1
fl-.-I
.0.0
U)04
00
.0-.4
U)®
-.-IU)
U)0
UU
)U
)0
112U)
‘0.—
4IU
flU
)0.
04lU
n0
00
04
(5
44
.0.
—4
0P
-4$V
>O
nfi
0.-
44
4.4
042U
CI)CI)
UI
UU
IU
C/lU
UU
C-H
U0
-U
IU
UCI)
0I
UU
UU
0H
00
HH
HH
OH
HH
(U)‘0
(0I
0(0
+1
I0
‘0‘0
0
6’‘0
-‘
0-I_‘0,
6’-4
0—
C-C
.0
‘04
0000
‘04
fl04
024
1fl4
0‘0
o4.0
10C
-SIC
)‘0
‘0‘0
‘0.0
‘C‘0
’0
’0
‘CI
05
04
05
3435
34
05
04
0404
04
35
04
34
04
s-44(5
.-IC
--ICC
C)
flI
40.-I
IIC
II
0’O
C-4
Ifl
CI
-I.-.)I
II
C-.-IC
’)I
V
O80
44
44
44
44
4C
SU
)U)
0U
)U)
U)U
)’)U)
U)U
)U)
U)F
OX
C)C
-C
-1’)
‘0011’.
2
-_440
04
0‘0
04
C-
.-4c-
CC).-
IC
-$
IC)
C’)
322o
C-cC
;.-
—I
4nr-
10
:1
1CC
C-4o
1(5401(5
1fl
IC44(5
.0ID
lfllfl
‘C
’0
-C
U)
0-.0
00000
U
8042
V000’)
8U)+1
II
+1I
II
+1+1
0I
00
0I
IC)
IIC
)I
(0IC)
IIC
)fl
-H
C-
C’)
CCIC
’)C
-)04
004
‘0I
‘0‘0
!.2
C-4C
-C
’)4
C-I00
40
00
——
——
——
—
U)‘01
--
—4
.—I
II
C’S
.-4IC
)I
CC
ILfl
I•
II
II
24
C.2
Z4
0$
US
C-
00
410
004
00
U)4
4—
IF-))-)
—4.-4
.—4
.-4.-I
.-4:3
002’-’
4-40VI
U‘0
04—
40
CC
)‘0
C-
00
CC
)0
0IC
).4
00
(00
4-4-2--s
00‘0
0‘0
‘0IC
)0
04C
-‘0
‘0‘0
C’)
00
054)
0401.-S
C-
C-
‘04
C-
C-
CC
)0
IC)
CC)C
C)
C’)
‘0
‘0IC
)IC)
$U)
‘00441’.
--
0‘0’-
‘0IC)
C-
1’)IC
-04
4(5U
S1(5
05
0C
-C
-C-S
IC)
IC)
U)H
’00’S
O4
IC)I
‘040
I4
IC)
IC)I
-44(5
flIC
)IC
)—
44
0-2
gO
sI
0404
I04
0’
04I
0404
0404
04‘0
0004
_-4_
I-4
-4_4
-4-4
-4
U).
U)U)
(40
0)1)
U-..)
C0
U—
IU)
U)>
0U
)>U
)>U)
0.
UU
U)U)
UU
UU
_I
C.
U)U
).
U).-
IU
UU
)U)
CU
U)U
)U)
0I
3on
C--I
.-IC)
IU)
‘0I
.U)
U)on
0I
C‘0
IV
U00
IU
I(0
U)
UV
IU)
0—
4C
IIV
U0
.-IU)
U0
.-Io
UU
--IC
CC
U—
IU
)U)
CU
—’
U)E
-2-
.2C
-_0
U0
4.04
0-4
.U)
3.
.4U)
•._I
002
0‘0
40
24
0
U)C
UU
CU)
.1U
UU)
.—4
0U)
U)U
U)—
U)N
4U)
‘0U)
‘0‘U)
VU
CN
.U)
00
U)0
.U
—I
U)U)
002U
.0C
.00
0.0
C‘0
0C
CU
)0
CI)0—
IU
U)
U).0
CC)
0U)
0.
0C)
VC
4-I-40
UV
U)
00
U)U
-#U
)U)
(12U
)U)
00U
).-)U
)U)
CI)U
)U)
0V
UCI)
.-4U
N4-lU
U)U
)02
IOU
IOU
U)U
)IO
UIO
U0
0U)
U)0
CC
.-IV-.4
0U)
.40
.‘)-.4
0U)
--ICV
U)U
)•
0.-
IQ
U)U
)U
U)
•4
UV
.—IU
CU
.-IU
V.-
IU
CV
o2
(408
U)0
-402
U)’0
‘0U
)OD
2s
U)C
42U)
>-.U
)U
)CI2
0-.U
)Cn
U)94
•-
‘0.
U).-I
U)C
U).-I
U)1-
4‘0
40
(0‘0
tI)0
CI)CI.
‘0Cl)
0CI)
U)
.-IC
-C
C)
4IC)
ICC
--
C-
CC
)4
4(5.—
IC
-CC)
404
00
00
00
00
00
00
00
00
UC
-C
-C
-C
-C
-C
-C
-00
00‘0
0)
CO04
050
’05
0
05U
U)
73
44-4
‘0:3U)
04CI)
-41IC
IC
-109-
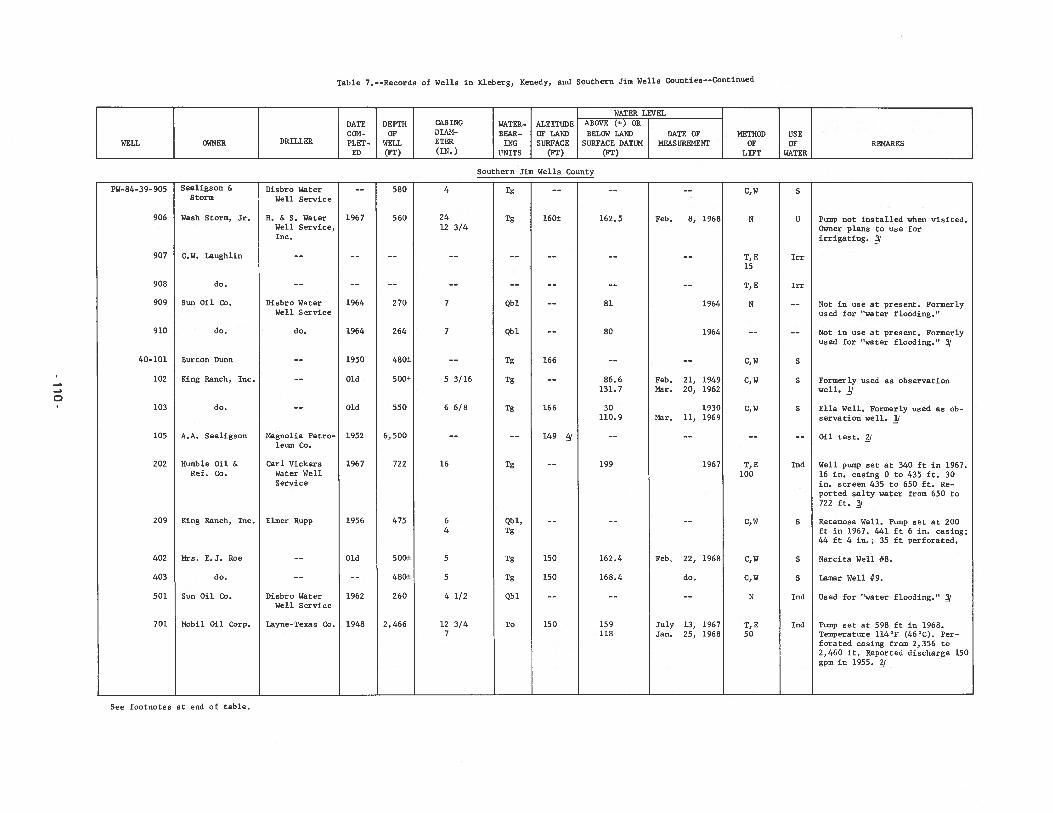
Table 7. --Records of Wells in Kleberg, Kenedy, and Southern Jim Wells counties--continued
Seeligson &Storm
Wash Storm, Jr.
C.W. Laughlin
Disbro WaterWell Service
H. & S. WaterWell Service,Inc.
Disbro WaterWell Service
do.
Hagnolia Petroleum Co.
carl VickersWater WellService
Elmer Rupp
Disbro WaterWell Service
Layne-Texas Co.
86.6131. 7
30110.9
Feb. 21,Mar. 20,
Mar. 11,
Pump not installed when visited.Owner plans to use forirrigating. /
Hot in use at present. Formerlyused for “water flooding.”
Hot in use at present. Formerlyused for “water flooding.” /
Formerly used as observationwell. II
Ella Well. Formerly used as observation well. J
Oil teat. /
Well pump set at 340 ft in 1967.16 in. casing 0 to 435 ft. 30in. screen 435 to 650 ft. Reported salty water from 650 to722 ft. j
Retamosa Well. Pump set at 200ft in 1967. 441 ft 6 in. casing;44 ft 4 in.; 35 ft perforated.
Narcita Well #8.
Lamar Well #9.
Used for “water flooding.” /
Pump set at 598 ft in 1968.Temperature l14’F (46Cc). Perforated casing from 2,356 to2,460 ft. Reported discharge 150gpm in 1955. /
WATER LEVEL
DATE DEPTH BIHG WATER- ALTITUDE ABOVE (+) ORCON- OF DIAW BEAR- OF LAND BELOW LAND DATE OP METHOD USE
WELL OWNER DRILLER PLET - WELL ETER TNG SURFACE SURFACE DATUM MEASUREMENT OF OF REMARKSED (pqJ) (IN.) UNITS (FT) (PT) LIFT WATER
Southern Jim Wells county
PW-84-39- 905
906
907
908
909
910
40-101
102
103
105
0
162.5
81
80
580
560
270
264
480±
500±
550
6,500
722
475
500±
480±
260
2,466
1967
1964
1964
1950
Old
Old
1952
1967
1956
Old
1962
1948
do.
Sun Oil Co.
do.
Burton Dunn
King Ranch, Inc.
do.
A.A. Seeligson
Oil &Co.
King Ranch, Inc.
Mrs. E.J. Roe
do.
Sun Oil Co.
Mobil Oil Corp.
202 HumbleRef.
4
2412 3/4
7
7
5 3/16
6 6/8
16
64
5
5
4 1/2
12 3/47
Tg
Tg
Qb 1
Qbl
Tg
Tg
Tg
Tg
Qbl,Tg
Tg
Tg
Qbl
To
160±
166
166
149
150
150
150
C, W
N
T, E15
T, E
N
C, W
C,W
C, W
T, E100
C,W
C, W
C,W
N
I, E50
Feb. 8, 1968
1964
1964
19491962
19301969
1967
Feb, 22, 1968
do,
July 13, 1967Jan. 25, 1968
S
U
Irr
Irr
S
S
S
Ind
S
S
S
md
Ind
209
402
403
501
701
199
162.4
168.4
159118
See footnotes at end of table.
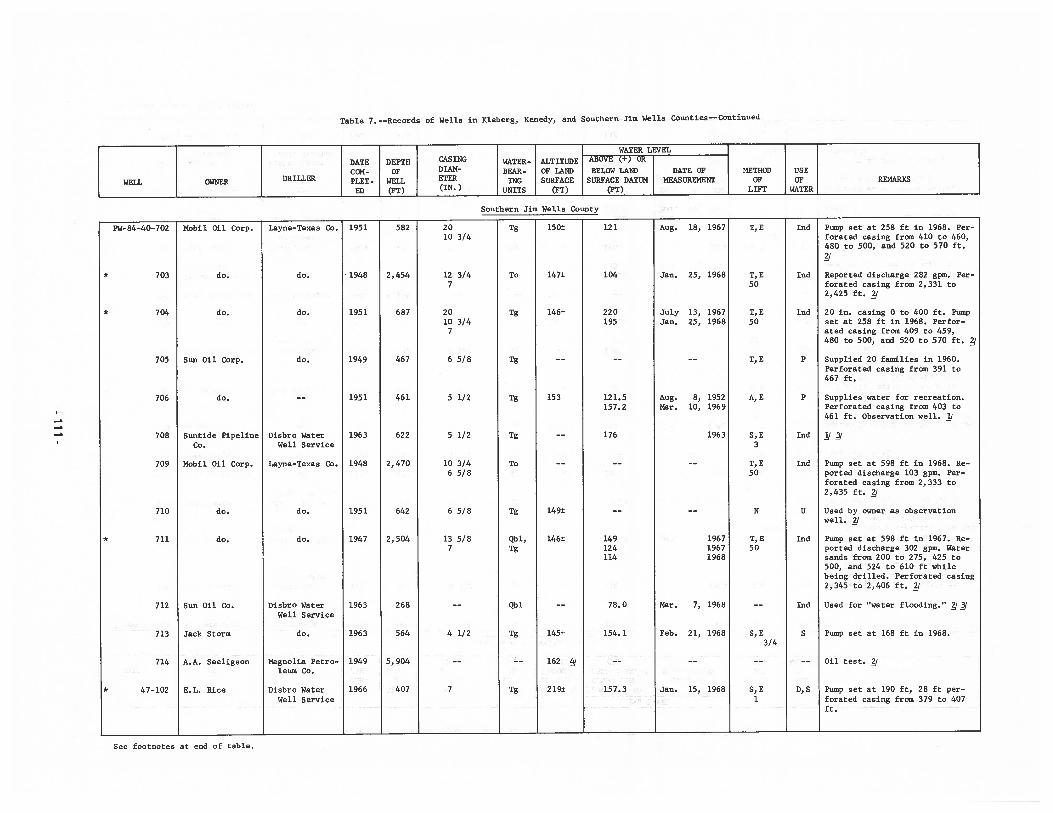
Table 7. --Records of Wells in Rleberg, Renedy, and Southern Jim Wells counties--Continued
Sun Oil Corp.
Suntide PipelineCo.
Mobil Oil Corp.
A.A. Seeligson
Layne-Texas Co.
Disbro WaterWell Service
Layne-Texas Co.
Disbro WaterWell Service
do.
Magnolia Petroleuts Co.
Disbro WaterWell Service
Jan. 25, 1968
Aug. 8, 1952Mar. 10, 1969
Mar. 7, 1968
5, E3
T, E50
Pump set at 258 ft in 1968. Perforated casing from 410 to 460,480 to 500, and 520 to 570 ft.
Reported discharge 282 gpm. Perforated casing from 2,331 to2,425 ft. /
20 in. casing 0 to 400 ft. Pumpset at 258 ft in 1968. Perforated casing from 409 to 459,480 to 500, and 520 to 570 ft. /
Supplied 20 fsmilies in 1960.Perforated casing from 391 to467 ft.
Supplies water for recreation.Perforated casing from 403 to461 ft. Observation well. ],/
Pump set at 598 ft in 1968. Reported discharge 103 gpm. Perforated casing from 2,333 to2,435 ft. j
Used by owner as observationwell. /
Pump set at 598 ft in 1967. Reported discharge 302 gpm. Watersands from 200 to 275, 425 to500, and 524 to 610 ft whilebeing drilled. Perforated casing2,345 to 2,406 ft. i
Used for “water flooding.” //
Pump set at 168 ft in 1968.
Oil test. /
Pump set at 190 ft, 28 ft perforated casing from 379 to 407ft.
WATER LEVEL
DATE DEPTH CASING WATER- ALTITUDE ABOVE (4) OR
COM- OF DIAM- BEAR- OF LAW) BELOW LAW) DATE OF METHOD USE
WELL OWMER DRILLER PLET - WELL ETER 1MG SURFACE SURFACE DATUM MEASUREMENT OP OF REMARKS
ED (FT) (IM.) UMITS (FT) (FT) LIFT WATER
Southern Jim Wells_County
Mobil Oil Corp.
do.
do.
do.
do.
do.
Aug. 18, 1967
do.
PW-84-4D-702
* 703
* 704
705
706
708
709
710
* 711
712
713
714
* 47-102
July 13, 1967Jan. 25, 1968
I, E
T, E50
I, E50
T, E
A, E
md
md
md
P
P
1951
1948
1951
1949
1951
1963
1948
1951
1947
1963
1963
1949
1966
582
2,454
687
467
461
622
2,470
642
2,504
268
564
5,904
407
2010 3/4
12 3/47
2010 3/4
7
6 5/8
5 1/2
5 1/2
10 3/46 5/8
6 5/8
13 5/87
4 1/2
7
Tg
To
Tg
Tg
Tg
Tg
To
Tg
Qbl,Tg
Qbl
Tg
Tg
150±
147±
146±
153
149±
146±
145±
162 j
219±
do.
do.
121
104
220195
121.5157.2
176
149124114
78.0
154.1
157.3
do.
do.
Sun Oil Co.
Jack Storm
mod1963
196719671968
E.L. Rice
md
U
md
mod
S
D, S
B
I, ESO
5, E3/4
5, E1
Feb. 21, 1968
Jan. 15, 1968
See footnotes st end of tsble.
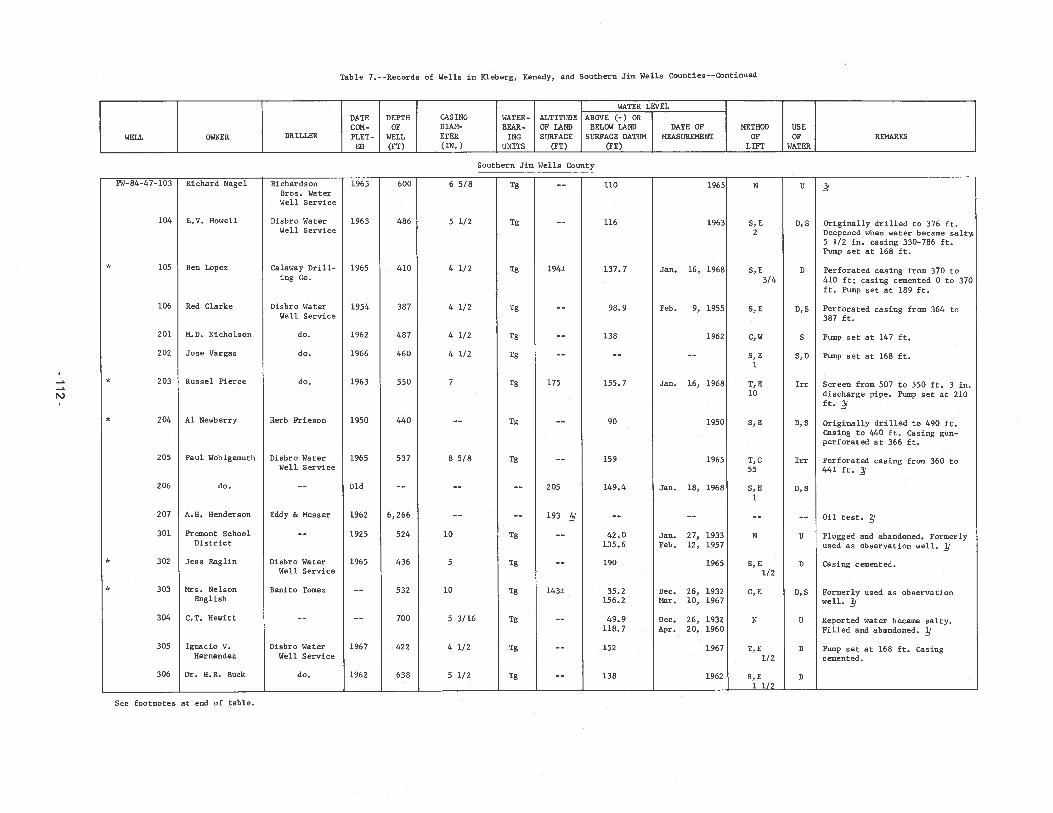
Table 7. --Records of Wells in Kleberg, Renedy, and Southern Jim Wells counties--Continued
WATER LEVEL
DATE DEPTH CASTBC WATER- ALTTTUDE ABOVE (+) ORCOB- OF 0MB- BEAR- OF LABE BELOW LABE DATE OF BETHOD USE
WELL OWBER DRTLLER PLET- WELL ETER TBC SURFACE SURFACE DATUN BEASUREBENT OF OF REBARWSED (PT) (lB.) UBITS (PT) (PT) LIFT WATER
Southern Jim Wells County
PW-84-47-103 Richard Bagel Richardson 1965 600 6 5/B Tg 110 1965 B UBros. WaterWell Service
104 E.V. Howell Disbro Water 1963 486 5 1/2 Tg 116 1963 S,E D,S Originally drilled to 376 ft.Well Service 2 Deepened when water became aalty.
5 1/2 in. casing 330-786 ft.Pump set at 168 ft.
* 105 Ben Lopez Calaway Drill- 1965 410 4 1/2 Tg 194± 137.7 Jan. 16, 1968 S,E 0 Perforated casing from 370 toing Co. 3/4 410 ft; casing cemented 0 to 370
ft. Pump set at 189 ft.
106 Red Clarke Disbro Water 1954 387 4 1/2 Tg 98.9 Feb. 9, 1955 S,E D,S Perforated casing from 364 toWell Service 387 ft.
201 B.D. Bicholson do. 1962 487 4 1/2 Tg —- 138 1962 C,W S Pump set at 147 ft.
202 Jose Vargas do. 1966 460 4 1/2 Tg -- -- -- S,E S,D Pump set at 168 ft.
* 203 Russel Pierce do. 1963 550 7 Tg 175 155.7 Jan. 16, 1968 T,E Irr Screen from 507 to 550 ft 3 in.10 discharge pipe. Pump aet at 210N)
ft./
* 204 Al Bewberry Herb Prieson 1950 440 Tg 90 1950 S,E 0,5 Originally drilled to 490 ft.Casing to 440 ft. Casing gun-perforated at 366 ft.
205 Paul Wohigemuth Diabro Water 1965 537 8 5/8 Tg -— 159 1965 T,G Irr Perforated casing from 360 toWell Service 55 441 ft. 41
206 do. —- Old —- —- -— 205 149.4 Jan. 18, 1968 S,E D,S
207 A.H. Henderson Eddy & Besser 1962 6,266 -- 193 -- -- -- -- Oil teat.
301 Premont School -- 1925 524 10 Tg -— 42.0 Jan. 27, 1933 B U Plugged and abandoned. FormerlyDistrict 135.6 Feb. 12, 1957 used as observation well.
* 302 Jeas Raglin Disbro Water 1965 436 5 Tg -— 190 1965 S,E 0 Casing cemented.Well Service 1/2
* 303 Bra. Belson Benito Tomez —— 532 10 Tg 143± 35.2 Dec. 26, 1932 C,E D,S Formerly used as observationEnglish 156.2 Bar. 10, 1967 well. ]/
304 C.T. Hewitt —— —- 700 5 3/16 Tg —— 49.9 Dec. 26, 1932 B U Reported water became aalty.118.7 Apr. 20, 1960 Filled and abandoned. /
305 Ignacio V. Disbro Water 1967 422 4 1/2 Tg 152 1967 T,E 0 Pump set at 168 ft. CasingEernandez Well Service 1/2 cemented.
306 Dr. H.R. Buck do. 1962 638 5 1/2 Tg 138 1962 S,E 01 1/2
See footnotes at end of table.
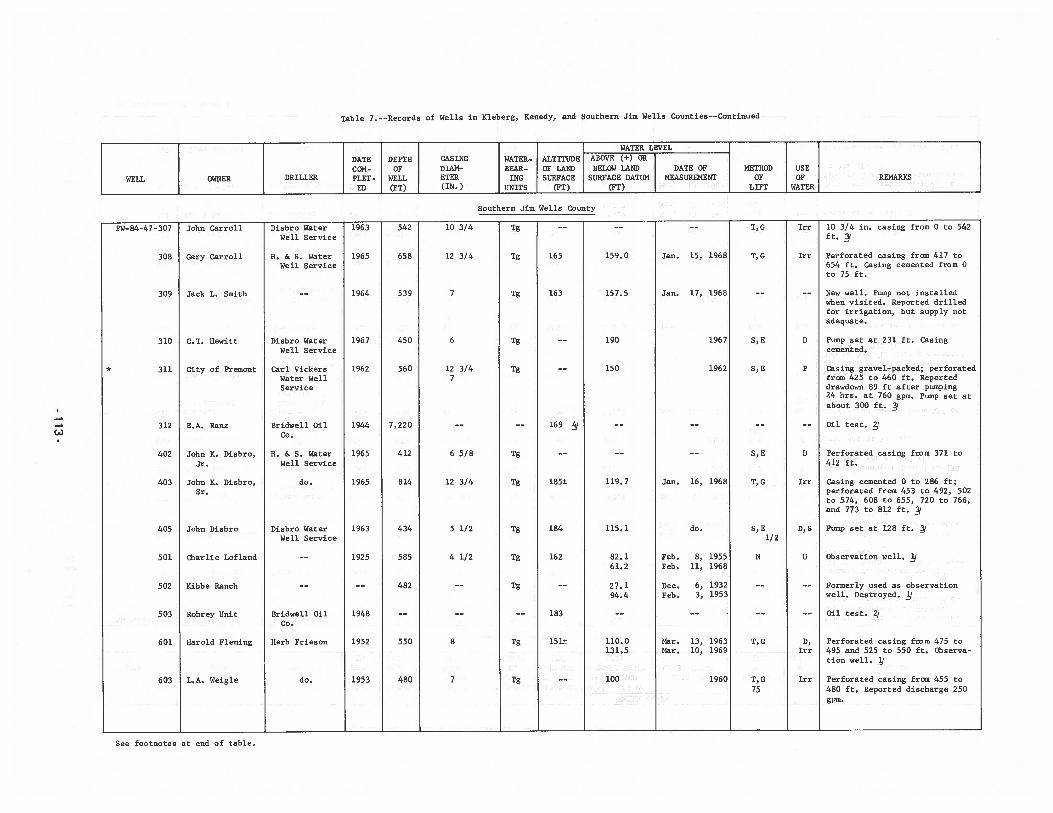
Table 7. --Records of Wells in Kleberg, Kenedy, and Southern Jim Wells Counties--Continued
Gary Carroll
Jack L. Smith
John K. Disbro,Jr.
John K. Disbro,Sr.
Rohrey Unit
Harold Fleming
L.A. Weigle
Disbro WaterWell Service
H. & S. WaterWell Service
Disbro WaterWell Service
Carl VickersWater WellService
Disbro WaterWell Service
Bridwell OilCo.
Herb Frieson
82. 161.2
27.194.4
110.0131.5
100
T, G
Jan. 15, 1968 T,G
Jan. 17, 1968
1967 S,E
Feb. 8, 1955Feb. 11, 1968
Dec. 6, 1932Feb. 3, 1953
Mar. 13, 1963Mar. 10, 1969
10 3/4 in. casing from 0 to 542ft.
Perforated casing from 417 to654 ft. Casing cemented from 0to 75 ft.
New well. Pump not installedwhen visited. Reported drilledfor irrigation, but supply notadequate.
Pump set at 231 ft. Casingcemented.
Casing gravel-packed; perforatedfrom 425 to 460 ft. Reporteddrawdowi 89 ft after pumping24 hrs. at 760 gpa. Pump set atabout 300 ft. /
Oil test. j
Perforated casing from 371 to412 ft.
Casing cemented 0 to 286 ft;perforated from 453 to 492, 502to 574, 608 to 655, 720 to 766,and 773 to 812 ft. J
Pump set at 128 ft. /
Observation well. :‘
Formerly used as observationwell. Destroyed. /
Oil test.
Perforated casing from 475 to495 and 525 to 550 ft. Observation well. /
Perforated casing from 455 to480 ft. Reported discharge 250gpm.
John Carroll
WATER LEVEL
DATE DEPTH CASING WATER- ALTITUDE ABOVE (+) OR
COM- OF DIAM- BEAR- OF LAND BELOW LAND DATE OF METHOD USE
WELL OWNER DRILLER PLET- WELL ETER 1MG SURFACE SURFACE DATUM MEASUREMENT OF OF REMARKSED (FT) (IN.) UNITS (PT) (FT) LIFT WATER
Southern Jim Wells County
C.T. Hewitt
City of Premont
E.A. Hans
PW-84-47-307
308
309
310
* 311
312
402
403
405
501
502
503
601
603
Bridwell OilCo.
H. & S. WaterWell Service
do.
1963
1965
1964
1967
1962
1944
1965
1965
1963
1925
1948
1952
1953
159.0
157.5
190
150
119.7
115.1
542
658
539
450
560
7,220
412
814
434
585
482
550
480
10 3/4
12 3/4
6
12 3/47
6 5/8
12 3/4
5 1/2
4 1/2
8
7
Tg
Tg
Tg
Tg
Tg
Tg
Tg
Tg
Tg
Tg
Tg
Tg
165
163
169 /
185±
184
162
183
151±
John Disbro
Charlie Lof land
Kibbe Ranch
1962
Jan. 16, 1968
do.
Irr
Irr
D
P
D
Irr
D, S
U
D,Irr
Irr
S, E
5, E
T, G
5, E1/2
N
T,
T,G75
do. 1960
See footnotes at end of table.
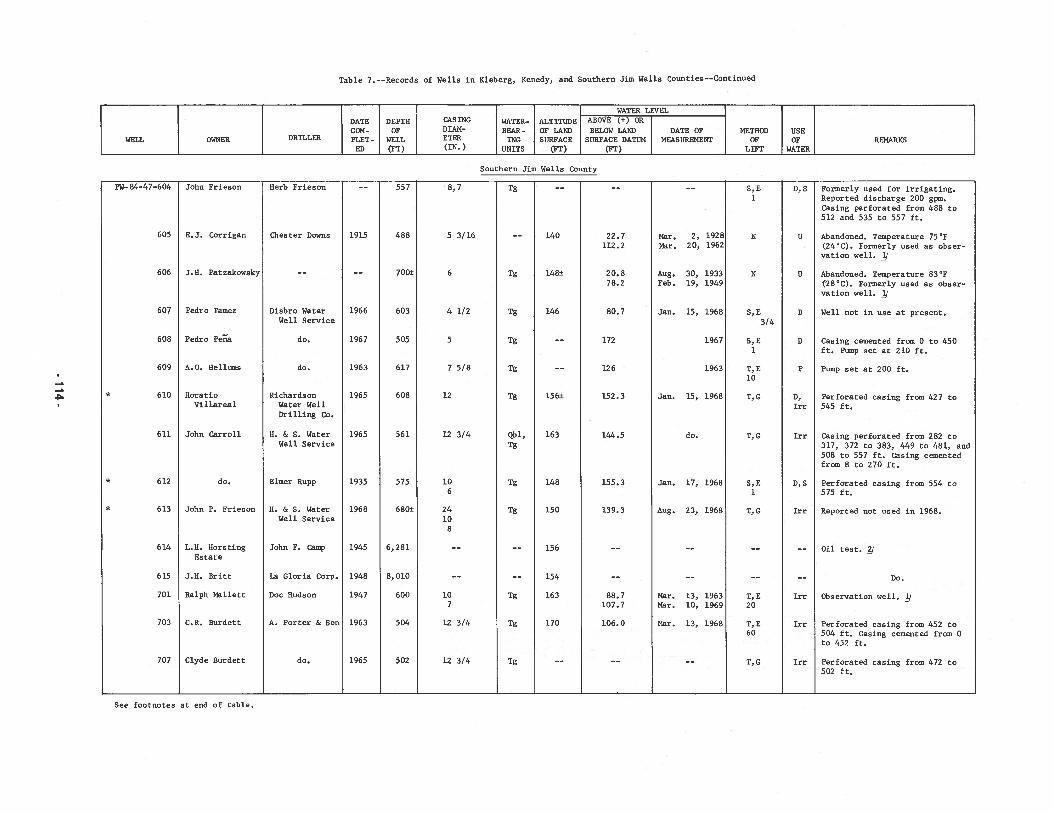
CO
0-4
0
COHCIa
CO3)
Ca)0
1-4C
OO
-ICO0011)
CO0000
CO
CO
C)
C)
011)-
CO4141
41
3)1
-I10)0
0041
0CO‘1
E-IC
OC
OO
O3
)C
O0C
)P
‘0a)0000C)0)0C)a)
COa)-a0I_Ia).000a)
‘0a)0440a-.a)
COa)a)CO0‘0C.)a)a)
•0COH
a)00C)a)
COa)
-aa)
.0a)0
‘0I
a)I_I
I_Ia)’O
0.
004
0)0
00
040
00
004.4
a)CO
U.)
4.34.4
..4-4
4.44.4
44
4_Ia).
1344.0144.0
-at—
40
0-.4
a)CO
00
4.4F-.
a_4CO
a)-at
.4.4
1_Ia_I
4.401
COCO
COa)
0a_a
CO-
a)U
.)CO
CO444
a_..a)
00-at
1—CO
COa)
a)4_I
-ata_I
0)U
.)CO
-at-at
00CO
a)a)
.0
(1
044‘0
--4044.
a)a)
a)0
4-4
44444.4
44a)a
)44
1.1
004.4
444’041
‘440
000
00
4.4
000104-4
0a)
00)
0144
1_I41044a)
1-.0
00
4144.4
41a)
4-4a)
00
.41
44.04
-4444-4
-444-4
a)41
a)1—
a)0
a)0
410’—
4_I-.a
ta)
4441440’04a_C
4141
a)44-41-4
44.400
-0a).
00‘0
0.
4400)440
0410)3
4.)
a)>
,a)>
,a)
a)..Q
44
a)a)
0-4
a)C
)a)
44440
4.401’—
’0,.-)
a)‘0
4.40
-444_I
CC.)44.4
-a)
,.441
.44.0
a)0
a)01
44aI1
04O
Ja)
004
a)CO
.a)
a)a)
a)0
0a)
‘0
00
4-4
a)0
4a)a
)0
3_IC_-4
CO1_IC
O4-40
a)14
CO
Oa)
a)a)0
Ha).
Ha).
a)4
.4C4
044.4a_..
C.)4.4
0-,-)
C.)a)
-44.4
444441
‘—4
1-.‘—
4a)
a)4.4
‘4-40
110
a)a)
a)‘CO
C_IC
O.
0—
4.
0—
4-.4
44a)
a)‘CO
411-_IC
C-.
‘0a)
0-0
CO.
-COU
.)‘0
14,0
4‘0
14,a
)a)
a)a)
00
a).
-a)C
)4.4
a)>
,‘001
a)14
a)14
4.40
014-4
4.40.
a_-I,
4.44.4
‘04.4
4.44-4
44.44_I
4a)
‘0a)
0.
0a)
a.)a).
F-.a).
0)a)
a)a).
a).
4_I4
1440a)
0’-a)
0--a)
04
40
0CO
0.44-4O
Da_
CO
CO
4141
4_Ia)
>44-4
14
.44.)
a)4_Ia)
CO-C
OC
)0
‘0C
)0
a)0
.04-4
a)4.3
041
414.4
4_I0
41
44
404-4
440
--4a)
-.4a)
-441
-0.
‘•
a)44
004
‘44-at
444I_I
0.0
Cr.)
CO
-0t4
-4a)C
O4_I
—C
CO.
a)04a_C
a)C
-.CO
00
3))
04—
4a)
1_I-at4441-4
0a)
CO,—
C.0
a_Ia)
.0a_-a
COa)
a)4_I
a)a)
-ata)
—40
41a)
1—a)
-.4.0
a)0
0a)
0IU
4C
OC
)CO
—>
-C
IS
->
COC
)44-444.1
44444)C
)a_4444444.4
P44(44CO
00
PIU
.)41
04
14
.)
CO4-4
41CO
4_II
I4.4
414_I
-0
010
01P_I
‘.1-441
41I
I41
4141
010
14
141
014-4
4141
4.4
-at
CO
a-)CO
COCO
C)
C)
COC
)I
ICO
COC
)--4
CO00
41‘.0
....
II
0‘.0
COCO
CO4-4
,-IH
HCO
HH
a_
IH
CO
H
CO_I
CO044
CO1-.
COCO
COCO
CC.)0.
CO
C_-’d’
14.)4a_
Cr-
-?a_
’d’a_
I(4
CO41
41‘0
41a__I
II
-441
I
44
44
4
CC.a__I
CO
a__IF
--CO
COa_C
COF--
F--0
c;a
_;
a_ICO
a_I-at
U.)
044I
IC
O0
10
0I
44
41
C_-ICC-CO
r—a_I
CO
-atCO
COC
OQ
O
I+4
II
+4I
I0
COCO
II
COCO
CO0
CO-at
CO0
I-at
-at-at
COCO
-atCO
COCO
COCC.
00I
00340
0000
00.0
00
0000
0000
00H
HH
HH
HC
YE
-CH
HH
HH
COa_I
CO-at
-atat
CC-CO
COCO
II
COCO
COCO
CO-at
COF—
a_-iC_-I
0CO
-040
CO0
F-.a_I
a_I.
-441
41
a_I41
.-441
41
CC-.CO
CO
CO
CC.CO
41
CO
41
00
-atC.I
COCO
00
041
0CO
CC-CO
CO41
00
0CO
-atr-
CO
COCO
COCO
COCO
a_I0
COCO
CO
COCO
ICO
COF
-.CO
COCO
COCO
COCO
CC-CO
COI
41I
COCO
COCO
COCO
CO.at
-at-at
COCO
044I
044044
0.
0.
0.
0440
’0.
0’
044044
044
.a)
04.
a)a)
0-
0a)
C)
01.3
04
10
C_ICO
00
4_I.4
.—4C
)0)--)
a)-.-
010
0a)>
‘-44
_I>
4_I>
a)C
)40
a)0
4_I4100)00
a)4_I
0.
401_Ia)
a)a)
01a)Q
4.
.O
CO
a)0104
0.
CO
a)a)
04_I
-.4I
CO
CO
00
CU-.4
COa)
CO-.4
COa)
041
41I
‘0‘0
‘0
0—
’.
CO.
.41
‘04-4
‘041
0)04
..a),—
4C
O.—
)0041
410
0444
;CO
>0
.00a)
040
a)14
a)00
4.441
a)a)
0a)
—4
0)a)
4.44.4
4_I0
40.0)
Fla)
.41,—
I-.4
-.40)
41a)
CO.4
COa)
400
CU0
.1_I
4.44.4
.—4
a)‘0
a)41
4444
0—
4a)
1..0
41CU
44.4
‘041
-‘441
4.1a)
0)—
44-.
41‘0
0a)
-‘4a)
4_Ia)
410
a)H
01a)
Ca)
10•
04-4
1-400
000
41C
)01
00--4
’--.01
CO
a)CO
00
;-atCO
COF-.
CO0.
0-
F-ICO
-atCO
41CO
F--0
00
00
041
.4141
-I41
-410
00
COCO
COCO
COCO
COC
OCO
COCO
COF--
F--F--
-at
-at
a)-IC
-4C
.000a)0004CO
-11
4-
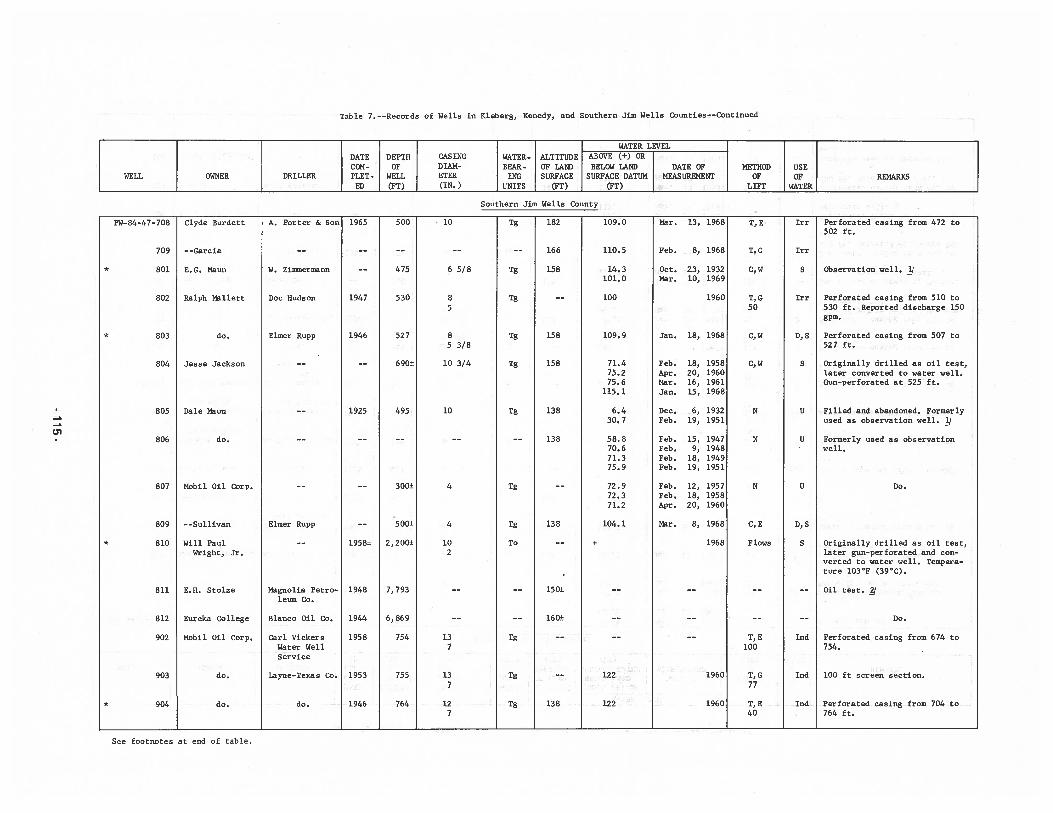
Table 7. --Records of Wells in Kleberg, Kenedy, and Southern Jim Wells Counties--Continued
71.475.275.6
115.1
6.430. 7
58.870.671.375.9
72. 972.371.2
104.1
Feb. 18, 1958Apr. 20, 1960Mar. 16, 1961ian. 15, 1968
Dec. 6, 1932Feb. 19, 1951
Feb. 15, 1947Feb. 9, 1948Feb. 18, 1949Feb. 19, 1951
Feb. 12, 1957Feb. 18, 1958Apr. 20, 1960
Mar. 8, 1968
1968
Perforated casing from 472 to502 ft.
Observation well. /
Perforated casing from 510 to530 ft. Reported discharge 150gpm.
Perforated casing from 507 to527 ft.
Originally drilled as oil test,later converted to water well.Gun-perforated at 525 ft.
Filled and abandoned. Formerlyused as observation well. /
Formerly used as observationwell.
Do.
Perforated casing from 674 to754. V
Perforated casing from 704 to764 ft.
WATER LEVEL
DATE DEPTH CASING WATER.- ALTITUDE ABOVE (+) OR
COH- OF DIAM- BEAR- OF LAND BELOW LAND DATE OF METHOD USEWELL OWNER DRILLER PLET- WELL ETER ING SURFACE SURFACE DATUM MEASUREMENT OF OF REMARKS
ED (PT) (IN.) UNITS (FT) (FT) LIFT WATER
Southern Jim Wells_County
109.0
110.5
14.3101.0
100
109.9
(F’
Mar. 13, 1968
Feb. 8, 1968
Oct. 23, 1932Mar. 10, 1969
1960
Jan. 18, 1968
PW-84-47- 708
709
801
802
* 803
804
805
806
807
809
* 810
811
812
902
903
* 904
Clyde Burdett
--Garcia
E.G. Maun
Ralph Mallett
do.
Jesse Jackson
Dale Maun
do.
Mobil Oil Corp.
--Sullivan
Will PaulWright, Jr.
E.H. Stolze
Eureka College
Mobil Oil Corp.
do.
do.
A. Porter & Son 1965
W. Zimmermann --
Doc Hudson 1947
Elmer Rupp 1946
—— 1925
Elmer Rupp --
—- 1958±
Magnolia Petro- 1948leum Co.
Blanco Oil Co. 1944
Carl Vickers 1958Water WellService
Layne-Texas Co. 1953
do. 1946
500
475
530
527
690±
495
300±
500±
2,200±
7,793
6,869
754
755
764
10
6 5/8
85
85 3/8
10 3/4
10
4
4
102
137
137
127
182
166
158
158
158
138
138
138
150±
160±
138
Tg
Tg
Tg
Tg
Tg
Tg
Tg
Tg
To
Tg
Tg
Tg
T, E
T, G
C,W
T, G50
C, W
C,W
N
N
N
C, E
Flows
T, E100
T, G77
T, E40
Irr
Irr
S
Irr
D, S
S
U
U
U
D, S
S
md
md
md
Do.
Originally drilled as oil test,later gun-perforated and converted to water well. Temperature lO3F (39CC).
Oil test. /
122
122
1960
1960
100 ft screen section.
See footnotes at end of table.
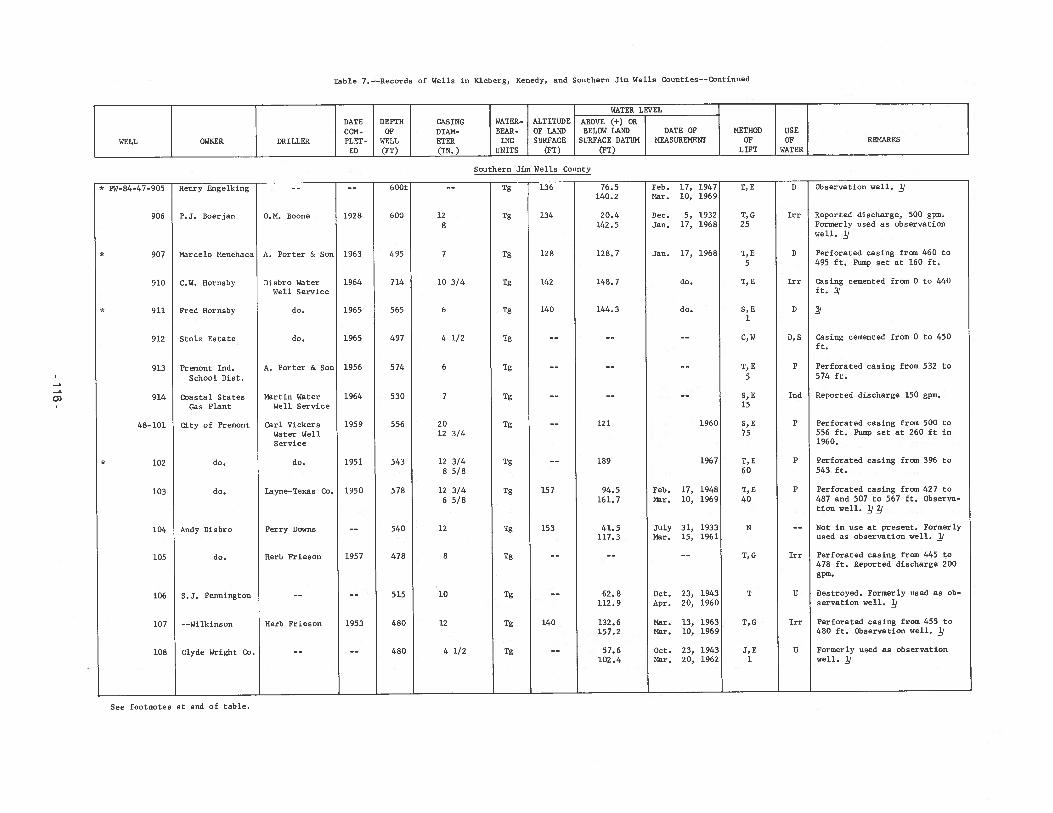
Table 7.-C-Records of Wells in ICeberg, Kenedy, and Southern Jim Wella Countiea--Continued
[ WATER LEVEL
DATE DEPTH CASTNC WATER- ALTITUDE ABOVE (+) ORCON- OP DLAM- BEAR- OP LAND BELOW LAND DATE OP METHOD USE
WELL OWNER DRILLER PLET- WELL ETER INC SURFACE SURFACE DATUM MEASUREMENT OP OF REMARKS
LED (PT) (IN.) UNITS (PT) (PT) LIFT WATER
Southern Jim Wells County
0)
* PW-B4-47-905
906
* 907
910
* 911
912
913
914
46- 101
* 102
103
104
105
106
107
108
Nenry Engelking
P.J. Boerjan
Marcelo Menchaca
C.W. Mornsby
Fred Mornsby
Stolz Eatate
Ptemont Ind.School Dist.
Coastal StatesCas Plant
City of Premont
do -
do.
Andy Disbro
do -
S.J. Pennington
--Wilkinson
Clyde Wright Co.
0.M. Boone
A. Porter & Son
Diabro WaterWell Service
do.
do.
A. Porter & Son
Martin WaterWell Service
Carl VickersWater WellService
do.
Layne-Texas Co.
Perry Downs
Herb Prieson
Herb Prieson
192 B
1963
1964
1965
1965
1956
1964
1959
1951
1950
1957
1953
600±
600
495
714
565
497
574
530
556
543
578
540
478
515
480
460
136
134
12 B
142
140
157
153
140
Tg
Tg
Tg
Tg
Tg
Tg
Tg
Tg
Tg
Tg
Tg
Tg
Tg
Tg
Tg
Tg
12B
7
10 3/4
6
4 1/2
6
7
2012 3/4
12 3/4B 5/B
12 3/46 5/B
12
B
10
12
4 1/2
76.5140.2
20.4142.5
128.7
148.7
144.3
121
189
94.5161.7
41.5117.3
62. B112.9
132.6157.2
57.6102.4
Feb. 17, 1947 I,EMar. 10, 1969
Dec. 5, 1932 T,CJan. 17, 1968 25
Jan. 17, 1968 T,E5
do. T,E
do. S,E
-- C,W
-- T,E5
-- S,E15
1960 S,E75
1967 T,E60
Feb. 17, 1948 T,EMar. 10, 1969 40
July 31, 1933 NMar. 15, 1961
-- T,C
Oct. 23, 1943 TApr. 20, 1960
Mar. 13, 1963 T,CMar. 10, 1969
Oct. 23, 1943 J,EMar. 20, 1962 1
U
Irr
D
Irr
U
D, S
P
Ind
P
P
P
Irr
U
Irr
U
Observation well. II
Reported discharge, 500 gpm.Formerly used as observationwell.
Perforated casing frau 460 to495 ft. Pump set at 160 ft.
Casing cemented from 0 to 440ft. /
Casing cemented from 0 to 450ft.
Perforated casing from 532 to574 ft.
Reported discharge 150 gpm.
Perforated casing from 500 to556 ft. Pump set at 260 ft in1960.
Perforated casing from 396 to543 ft.
Perforated casing from 427 to487 and 507 to 567 ft. Observation well. //
Not in use at present. Formerlyused as observation well. j/
Perforated casing from 445 to47B ft. Reported discharge 200gpm.
Destroyed. Formerly used as observation well. /
Perforated casing from 455 to480 ft. Observation well. J
Formerly used as observationwell.
See footnotes at end of table.
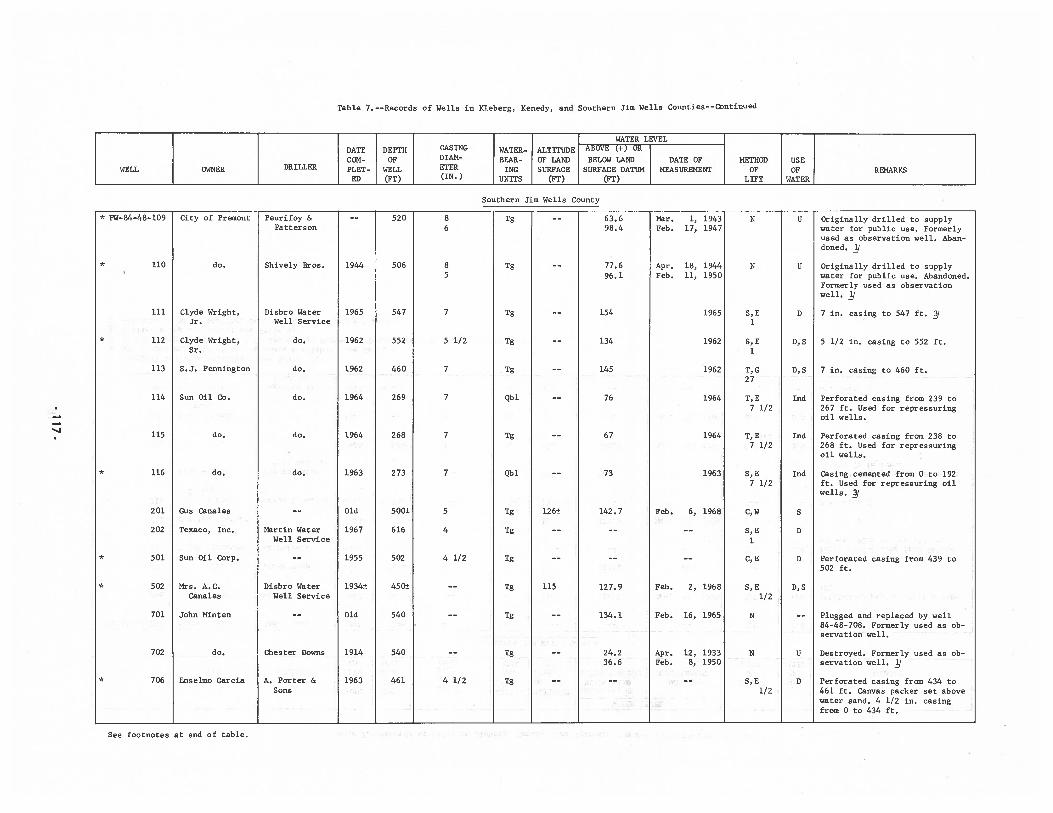
Table 7. --Records of Wells in Kieberg, Kenedy, and Southern Jim Wells Counties--Continued
501 Sun Oil Corp.
Mrs. A.C.Canales
John Minten
Peurifoy &Patterson
Shively Bros.
Disbro WaterWell Service
do.
Martin WaterWell Service
Disbro WaterWell Service
A. Porter &Sons
5 1/2
7
7
4 1/2
4 1/2
63. 698.4
77.696. 1
73
24.236.6
Mar. 1, 1943 NFeb. 17, 1947
Apr. 18, 1944Feb. 11, 1950
Feb. 16, 1965
Apr. 12, 1933Feb. 8, 1950
5, E1
5, EI
T, C27
T, E7 1/2
Originally drilled to supplywater for public use. Formerlyused as observation well. Abandoned.
Originally drilled to supplywater for public use. Abandoned.Formerly used as observationwell.
7 in. casing to 547 ft.
5 1/2 in. casing to 552 ft.
7 in. casing to 460 ft.
Perforated casing from 239 to267 ft. Used for repressuringoil wells.
Perforated casing from 238 to268 ft. Used for repressuringoil wells.
Casing cemented from 0 to 192ft. Used for repressuring oilwells. /
Perforated casing from 439 to502 ft.
Plugged and replaced by well84-48-708. Formerly used as observation well.
Destroyed. Formerly used as observation well. J
Perforated casing from 434 to461 ft. Canvas packer set abovewater sand. 4 1/2 in. casingfrom 0 to 434 ft.
WATER LEVELDATE DEPTH CASING WATER- ALTITUDE ABOVE (+) OR V
CON- OF DIAN- BEAR- OF LAND BELOW LAND DATE OF METHOD USEWELL OWNER DRILLER PLET- WELL ETER ING SURFACE SURFACE DATUM MEASUREMENT OF OF REMARKS
ED (p’r) (IN.) UNITE (PT) (PT) LIFT WATER
Southern Jim Wells County
86
85
City of Premont
do.
Clyde Wright,Jr.
Clyde Wright,Sr.
S.J. Pennington
Sun Oil Co.
do.
do.
Gus Canales
Texaco, Inc.
N
* PW-84-48-1O9
* 110
111
* 112
113
114
115
* 116
201
202
*
*
*
do.
do.
do.
do.
154
134
145
76
67
520
506
547
552
460
269
268
273
500±
616
502
450±
540
540
461
1944
1965
1962
1962
1964
1964
1963
Old
1967
1955
1934±
Old
1914
1963
Tg
Tg
Tg
Tg
Tg
Qbl
Tg
Qbl
Tg
Tg
Tg
Tg
Tg
Tg
Tg
7
7
5
4
1965
1962
1962
1964
1964
1963
Feb. 6, 1968
Feb. 2, 1968
U
U
D
D, S
D, S
Ind
Ind
Ind
S
0
0
D,S
U
502
701
702
706
126±
115
142. 7
127.9
134.1
do.
Enselmo Garcia
Chester Downs
T, E7 1/2
5, E7 1/2
C, W
5, E1
C, E
5, E1/2
N
N
5, E1/2
See footnotes at end of table.
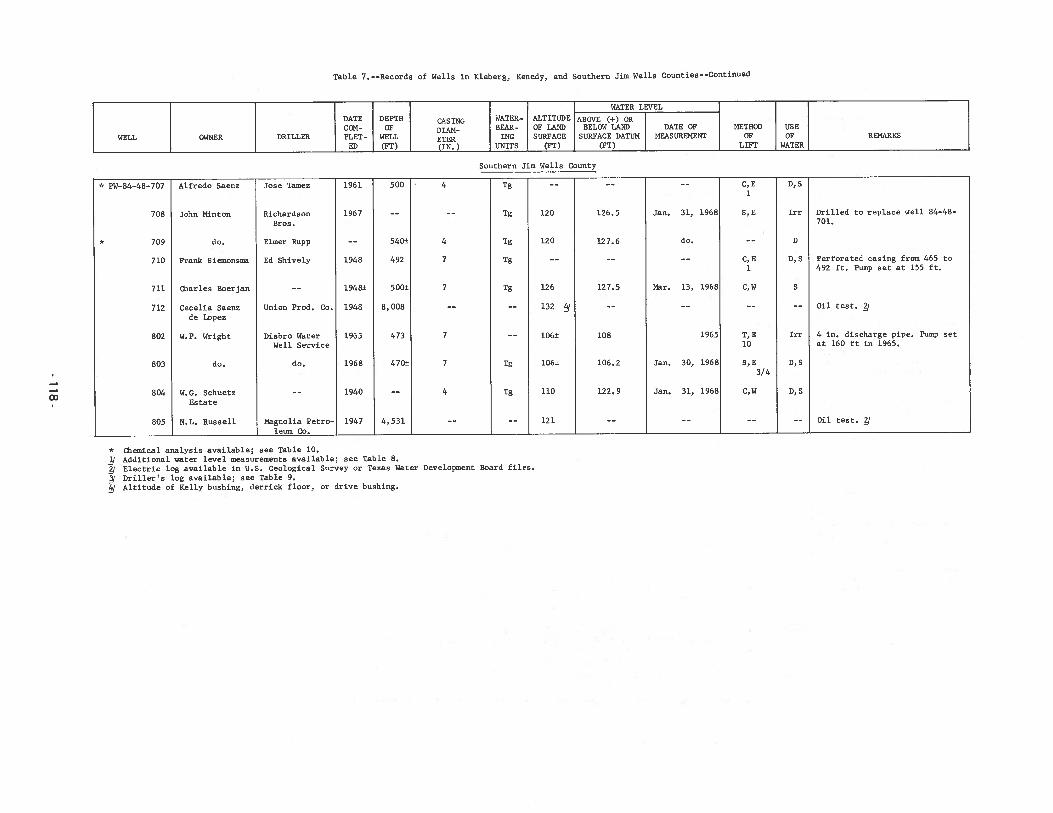
Table 7. --Records of Wells in Kleberg, Kenedy, and Southern Jim Wells Counties..Cont1nued
WATER LEVEL
DATE DEPTH CASING WATER- ALTITUDE ABOVE (+) ORCOM- OF DIAN- BEAR- OF LAND BELOW LAND DATE OF METHOD USE
WELL OWNER DRILLER PLET- WELL ETER ING SURFACE SURFACE DATUM MEASUREMENT OF OF REMARKS
ED (FT) (IN.) UNITS (FT) (FT) LIFT WATER
Southern Jim Wells County
* PW-84-48-707 Alfredo Saenz Jose Tamez 1961 500 4 Tg -- -- -- C,E D,S
708 John Hinton Richardson 1967 -— -— Tg 120 126.5 Jan. 31, 1968 S,E Irr Drilled to replace well 84—48-
Bros. 701.
* 709 do. Elmer Rupp -- 540± 4 Tg 120 127.6 do. -- D
710 Frank Siemonsma Ed Shively 1948 492 7 Tg -- -- -- C,E D,S Perforated casing from 465 to1 492 ft. Pump set at 155 ft.
711 Charles Boerjan -- 1948± 500± 7 Tg 126 127.5 Mar. 13, 1968 C,W S
712 Cecelia Saenz Union Prod. Co. 1948 8,008 -— -- 132 / —— -— —-—— Oil test.
de Lopez
802 W.P. Wright Disbro Water 1963 473 7 -- 106± 108 1965 T,E Irr 4 in. discharge pipe. Pump set
Well Service 10 at 160 ft in 1965.
803 do. do. 1968 470± 7 Tg 106± 106.2 Jan. 30, 1968 S,E D,S3/4
804 W.G. Schuetz -- 1940 —- 4 Tg 110 122.9 Jan. 31, 1968 C,W D,S
Estate
805 N.L. Russell Magnolia Petro- 1947 4,531 —- —- 121 -- -- —- —- Oil testleuxs_Co.
* Chemical analysis available; see Table 10.Additional water level measurements available; see Table 8.Electric log available in U.S. Geological Survey or Texas Water Development Board files.
Driller’s log available; see Table 9.Altitude of Kelly bushing, derrick floor, or drive bushing.
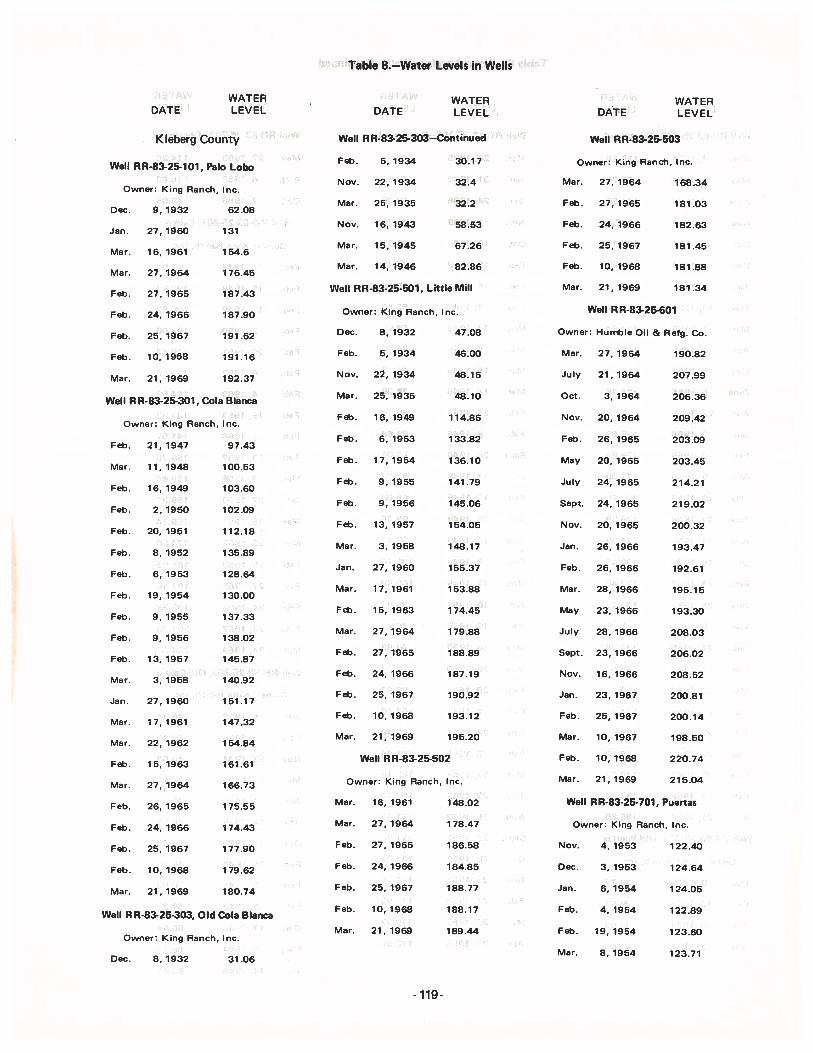
Table 8.—Water Levels in Wells
WATERDATE LEVEL
Kleberg County
Well RR-83-25-1O1, Palo Lobo
Owner: King Ranch, Inc.
Dec. 9, 1932 62.08
Jan. 27, 1q60 131
Mar. 16, 1961 154.6
Mar. 27, 1964 176.45
Feb. 27, 1965 187.43
Feb. 24, 1966 187.90
Feb. 25, 1967 191.62
Feb. 10,1968 191.16
Mar. 21, 1969 192.37
Well RR-83-25-301, Cola Blanca
Owner: King Ranch, Inc.
Feb. 21, 1947 97.43
Mar. 11, 1948 100.53
Feb. 16, 1949 103.60
Feb. 2, 1950 102.09
Feb. 20, 1951 112.18
Feb. 8, 1952 135.89
Feb. 6, 1953 128.64
Feb. 19, 1954 130.00
Feb. 9, 1955 137.33
Feb. 9, 1956 138.02
Feb. 13, 1957 145.87
Mar. 3, 1958 140.92
Jan. 27,1960 151.17
Mar. 17, 1961 147.32
Mar. 22, 1962 154.84
Feb. 15, 1963 161.61
Mar. 27, 1964 166.73
Feb. 26, 1965 175.55
Feb. 24, 1966 174.43
Feb. 25, 1967 177.90
Feb. 10, 1968 179.62
Mar. 21, 1969 180.74
Well RR-83-25-303, Old Cola Blanca
Owner: King Ranch, Inc.
Dec. 8, 1932 31.06
WATERDATE LEVEL
Well RR.83-25-303—Continued
Feb. 5, 1934 30.17
Nov. 22, 1934 32.4
Mar. 25, 1935 32.2
Nov. 16, 1943 58.53
Mar. 15, 1945 67.26
Mar. 14, 1946 82.86
Well RR-83-25-501, Little Mill
Owner: King Ranch, Inc.
Dec. 8, 1932 47.08
Feb. 5, 1934 46.00
Nov. 22, 1934 48.15
Mar. 25. 1935 48.10
Feb. 16, 1949 114.86
Feb. 6, 1953 133.82
Feb. 17,1954 136.10
Feb. 9, 1955 141.79
Feb. 9, 1956 145.06
Feb. 13, 1957 154.05
Mar. 3, 1958 148.17
Jan. 27, 1960 155.37
Mar. 17, 1961 153.88
Feb. 15, 1963 174.45
Mar. 27,1964 179.88
Feb. 27, 1965 188.89
Feb. 24. 1966 187.19
Feb. 25, 1967 190.92
Feb. 10,1968 193.12
Mar. 21, 1969 195.20
Well RR.83-25-502
Owner: King Ranch, Inc.
Mar. 16, 1961 148.02
Mar. 27, 1964 178.47
Feb. 27, 1965 186.58
Feb. 24, 1966 184.85
Feb. 25, 1967 188.77
Feb. 10,1968 188.17
Mar. 21,1969 189.44
WATERDATE LEVEL
Well RR-83-25-503
Owner: King Ranch, Inc.
Mar. 27, 1964 168.34
Feb. 27,1965 181.03
Feb. 24, 1966 182.63
Feb. 25, 1967 181.45
Feb. 10, 1968 181.88
Mar. 21,1969 181.34
Well RR83-25-6O1
Owner: Humble Oil & Refg. Co.
Mar. 27, 1964 190.82
July 21,1964 207.99
Oct. 3, 1964 206.36
Nov. 20, 1964 209.42
Feb. 26, 1965 203.09
May 20, 1965 203.45
July 24, 1965 214.21
Sept. 24, 1965 219.02
Nov. 20, 1965 200.32
Jan. 26. 1966 193.47
Feb. 26, 1966 192.61
Mar. 28, 1966 195.15
May 23, 1966 193.30
July 28, 1966 208.03
Sept. 23, 1966 206.02
Nov. 16, 1966 208.52
Jan. 23, 1967 200.81
Feb. 25, 1967 200.14
Mar. 10, 1967 198.50
Feb. 10, 1968 220.74
Mar. 21,1969 215.04
Well RR-83-25-7O1, Puertas
Owner: King Ranch, Inc.
Nov. 4, 1953 122.40
Dec. 3, 1953 124.64
Jan. 6, 1954 124.05
Feb. 4, 1954 122.89
Feb. 19,1954 123.60
Mar. 8, 1954 123.71
-119-
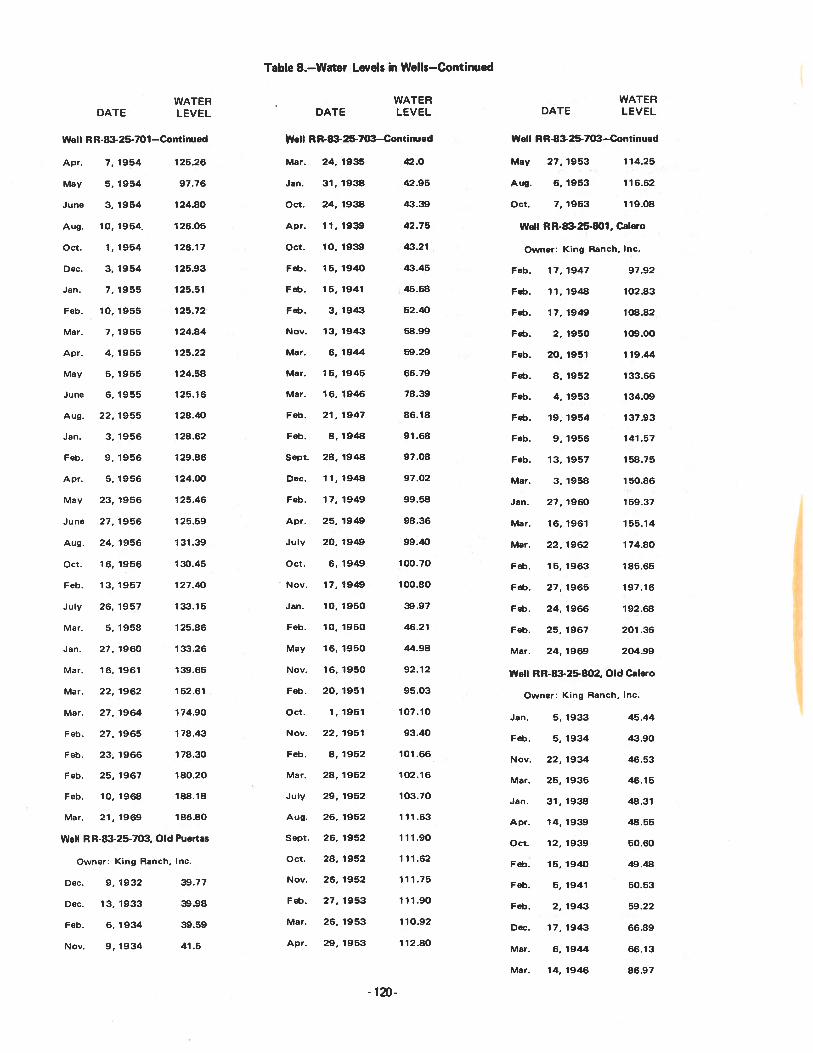
Table 8.—Water Levels in Wells—Continued
WATERDATE LEVEL
Well RR-83-25.701—Continued
Apr. 7, 1954 125.26
May 5, 1954 97.76
June 3, 1954 124.80
Aug. 10, 1954. 126.05
Oct. 1, 1954 126.17
Dec. 3, 1954 125.93
Jan. 7, 1955 125.51
Feb. 10. 1955 125.72
Mar. 7, 1955 124.84
Apr. 4, 1955 125.22
May 5, 1955 124.58
June 6, 1955 125.16
Aug. 22, 1955 128.40
Jan. 3, 1956 128.62
Feb. 9, 1956 129.86
Apr. 5, 1956 124.00
May 23, 1956 125.46
June 27, 1956 125.59
Aug. 24, 1956 131.39
Oct. 16, 1956 130.45
Feb. 13, 1957 127.40
July 26, 1957 133.15
Mar. 5, 1958 125.86
Jan. 27, 1960 133.26
Mar. 16, 1961 139.65
Mar. 22, 1962 152.61
Mar. 27, 1964 174.90
Feb. 27, 1965 178.43
Feb. 23, 1966 178.30
Feb. 25, 1967 180.20
Feb. 10, 1968 188.18
Mar. 21, 1969 186.80
Well RR-83-25-703, Old Puertas
WATERDATE LEVEL
Well RR.8325-703—Continued
Mar. 24, 1935 42.0
Jan. 31, 1938 42.95
Oct. 24, 1938 43.39
Apr. 11, 1939 42.75
Oct. 10, 1939 43.21
Feb. 15, 1940 43.45
Feb. 15, 1941 45.58
Feb. 3, 1943 52.40
Nov. 13, 1943 58.99
Mar. 6, 1944 59.29
Mar. 15,1945 66.79
Mar. 16. 1946 78.39
Feb. 21, 1947 86.18
Feb. 8, 1948 91.68
Sept. 28, 1948 97.08
Dec. 11,1948 97.02
Feb. 17, 1949 99.58
Apr. 25. 1949 98.36
July 20, 1949 99.40
Oct. 6, 1949 100.70
Nov. 17, 1949 100.80
Jan. 10, 1950 39.97
Feb. 10, 1950 46.21
May 16, 1950 44.98
Nov. 16, 1950 92.12
Feb. 20, 1951 95.03
Oct. 1, 1951 107.10
Nov. 22, 1951 93.40
Feb. 8, 1952 101.66
Mar. 28,1952 102.16
July 29, 1952 103.70
Aug. 26,1952 111.63
Sept. 26, 1952 111.90
Oct. 28,1952 111.62
Nov. 26, 1952 111.75
Feb. 27, 1953 111.90
Mar. 26, 1953 110.92
Apr. 29, 1953 112.80
WATERDATE LEVEL
Well RR-83-25-703—Continued
May 27,1953 114.25
Aug. 6, 1953 116.62
Oct. 7, 1953 119.08
Well RR-83-25-8O1, Calero
Owner: King Ranch, Inc.
Feb. 17, 1947 97.92
Feb. 11,1948 102.83
Feb. 17, 1949 108.82
Feb. 2, 1950 109.00
Feb, 20,1951 119.44
Feb. 8, 1952 133.66
Feb. 4, 1953 134.09
Feb. 19, 1954 137.93
Feb. 9, 1956 141.57
Feb. 13, 1957 158.75
Mar. 3, 1958 150.86
Jan. 27, 1960 159.37
Mar. 16, 1961 155.14
Mar. 22, 1962 174.80
Feb. 15, 1963 185.65
Feb. 27, 1965 197.16
Feb. 24, 1966 192.68
Feb. 25, 1967 201.36
Mar. 24, 1969 204.99
Well RR-83-25-802, Old Calero
Owner: King Ranch, Inc.
Jan. 5, 1933 45.44
Feb. 5, 1934 43.90
Nov. 22, 1934 46.53
Mar. 25, 1935 46.15
Jan. 31, 1938 48.31
Apr. 14, 1939 48.55
Oct. 12, 1939 50.60
Feb. 15.1940 49.48
Feb. 5, 1941 50.53
Feb. 2, 1943 59.22
Dec. 17,1943 66.89
Mar. 6, 1944 66.13
Mar. 14. 1946 86.97
Owner: King Ranch,
Dec. 9, 1932
Dec. 13, 1933
Feb. 6. 1934
Nov. 9, 1934
Inc.
39.77
39.98
39.59
41.5
-120-
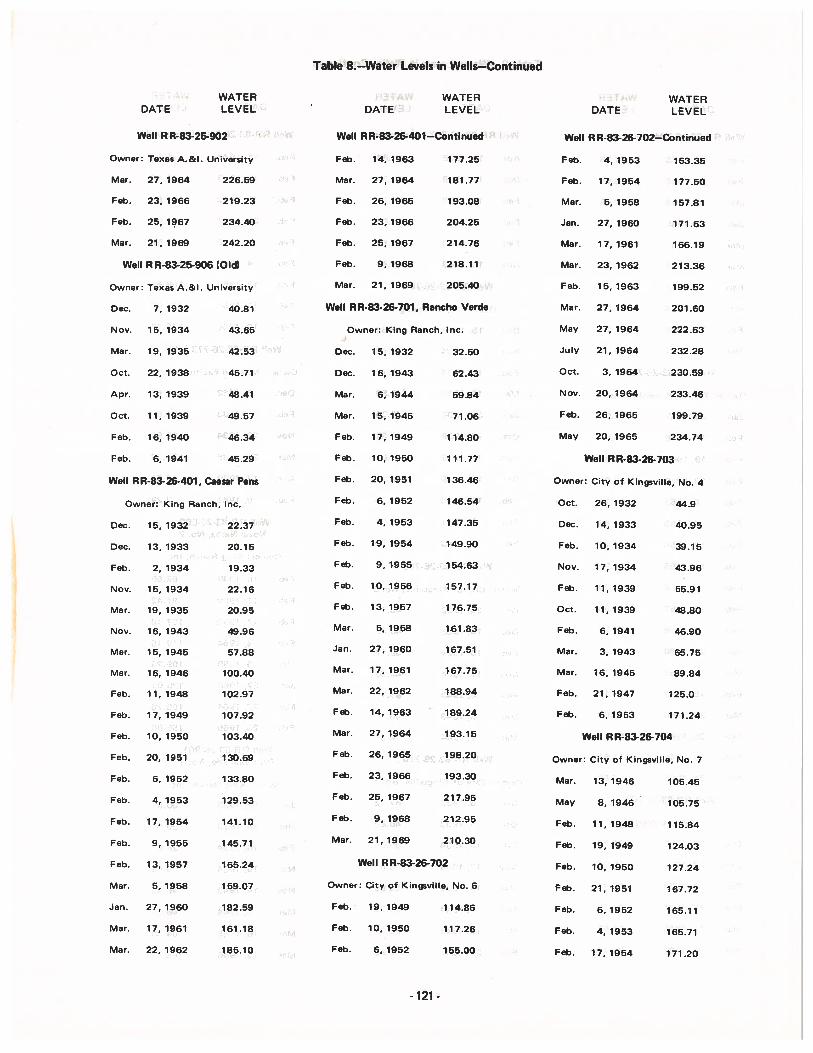
Table 8.—Water Levels in Wells—Continued
Owner: Texas A.&I. University
Dec. 7, 1932 40.81
Nov. 15, 1934 43.65
Mar. 19, 1935 42.53
Oct. 22, 1938 45.71
Apr. 13, 1939 48.41
Oct. 11, 1939 49.57
Feb. 16, 1940 46.34
Feb. 6, 1941 45.29
Well RR-83-26-401, Caesar Pens
Owner: King Ranch, Inc.
Dec. 15, 1932 22.37
Dec. 13, 1933 20.15
Feb. 2, 1934 19.33
Nov. 15, 1934 22.16
Mar. 19, 1935 20.95
Nov. 16, 1943 49.96
Mar. 15, 1945 57.88
Mar. 16, 1946 100.40
Feb. 11, 1948 102.97
Feb. 17, 1949 107.92
Feb. 10, 1950 103.40
Feb. 20, 1951 130.69
Feb. 6, 1952 133.80
Feb. 4, 1953 129.53
Feb. 17, 1954 141.10
Feb. 9, 1955 145.71
Feb. 13, 1957 165.24
Mar. 5, 1958 159.07
Jan. 27, 1960 182.59
Mar. 17, 1961 161.18
Mar. 22, 1962 185.10
WATERDATE LEVEL
Well RR-83-26-401--Continued
Feb. 14, 1963 177.25
Mar. 27, 1964 181.77
Feb. 26, 1965 193.08
Feb. 23, 1966 204.25
Feb. 25, 1967 214.76
Feb. 9,1968 218.11
Mar. 21, 1969 205.40
Well RR-83-26-701, Rancho Verde
Owner: King Ranch, Inc.
Dec. 15, 1932 32.50
Dec. 16,1943 62.43
Mar. 6, 1944 59.84
Mar. 15, 1945 71.06
Feb. 17,1949 114.80
Feb. 10, 1950 111.77
Feb. 20, 1951 136.46
Feb. 6, 1952 146.54
Feb. 4, 1953 147.35
Feb. 19, 1954 149.90
Feb. 9, 1955 154.63
Feb. 10, 1956 157.17
Feb. 13, 1957 176.75
Mar. 5, 1958 161.83
Jan. 27, 1960 167.51
Mar. 17, 1961 167.75
Mar. 22, 1962 188.94
Feb. 14, 1963 189.24
Mar. 27, 1964 193.15
Feb. 26, 1965 198.20
Feb. 23, 1966 193.30
Feb. 25, 1967 217.95
Feb. 9, 1968 212.95
Mar. 21,1969 210.30
Well RR-83-26-702
Owner: City of Kingsville, No. 6
Feb. 19,1949 114.86
Feb. 10, 1950 117.26
Feb. 6,1952 155.00
WATERDATE LEVEL
Well RR-83-26-702—Continued
Feb. 4, 1953 153.35
Feb. 17, 1954 177.50
Mar. 5, 1958 157.81
Jan. 27, 1960 171.63
Mar. 17, 1961 166.19
Mar. 23, 1962 213.36
Feb. 15. 1963 199.52
Mar. 27, 1964 201.60
May 27, 1964 222.63
July 21, 1964 232.28
Oct. 3, 1964 230.59
Nov. 20, 1964 233.46
Feb. 26, 1965 199.79
May 20, 1965 234.74
Well RR-83-26-703
Owner: City of Kingsville, No. 4
Oct. 26, 1932 44.9
Dec. 14, 1933 40.95
Feb. 10,1934 39.15
Nov. 17, 1934 43.96
Feb. 11, 1939 55.91
Oct. 11, 1939 48.80
Feb. 6, 1941 46.90
Mar. 3, 1943 65.75
Mar. 16, 1945 89.84
Feb. 21, 1947 125.0
Feb. 6, 1953 171.24
Well RR-83-26-704
Feb. 11, 1948 115.84
Feb. 19, 1949 124.03
Feb. 10, 1950 127.24
Feb. 21, 1951 167.72
Feb. 6, 1952 165.11
Feb. 4, 1953 165.71
Feb. 17.1954 171.20
WATERDATE LEVEL
Well R R-83-25-902
Owner: Texas A.&l. University
Mar. 27, 1964 226.59
Feb. 23, 1966 219.23
Feb. 25, 1967 234.40
Mar. 21, 1969 242.20
Well RR-83-25-906 (Old)
Owner:
Mar.
May
City of Kingsville, No. 7
13, 1946 105.45
8, 1946 105.75
- 121 -
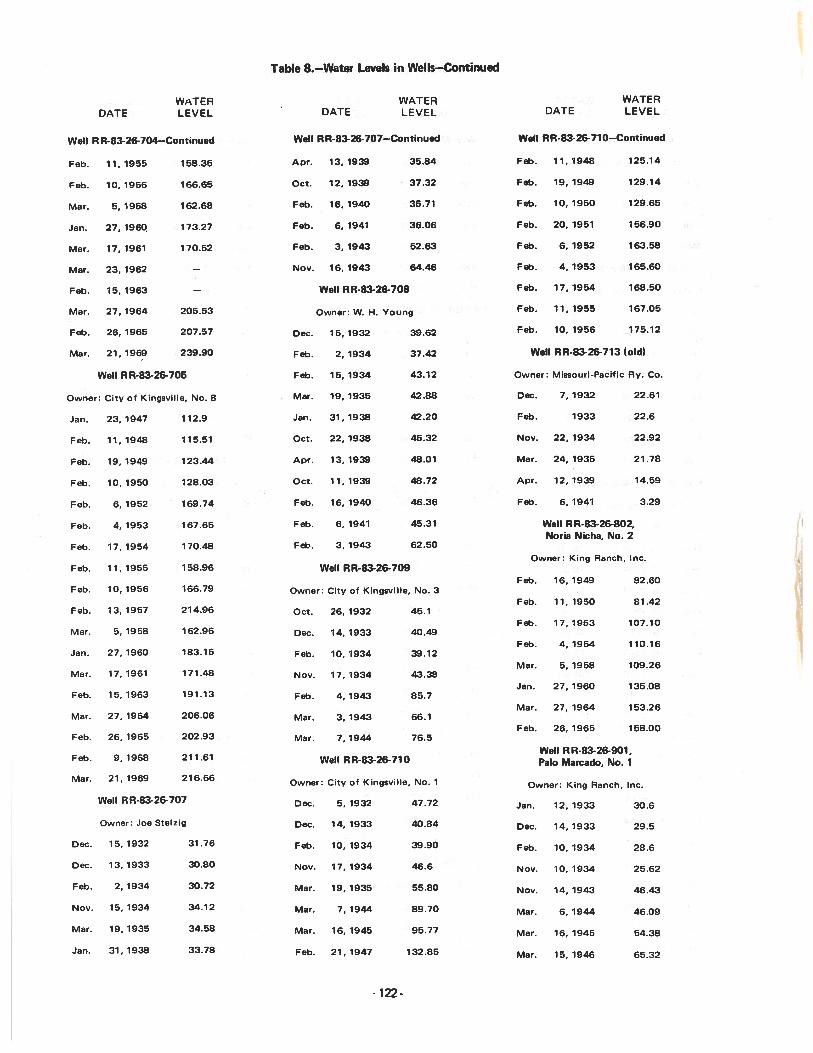
Table 8.—Water Levels in Wells—Continued
DATEWATERLEVEL DATE
WATERLEVEL DATE
WATERLEVEL
Well RR-83-26-704—Continued Well RR-83-26-707—Continued Well RR-83-26-710—Continued
Feb. 11, 1955 158.35 Apr. 13, 1939 35.84 Feb. 11, 1948 125.14
Feb. 10.1956 166.65 Oct. 12,1939 37.32 Feb. 19,1949 129.14
Mar. 5, 1958 162.68 Feb. 16, 1940 35.71 Feb. 10, 1950 129.65
Jan. 27, 196Q 173.27 Feb. 6, 1941 36.06 Feb. 20, 1951 156.90
Mar. 17, 1961 170.52 Feb. 3, 1943 52.63 Feb. 6, 1952 163.58
Mar. 23, 1962 — Nov. 16, 1943 64.46 Feb. 4, 1953 165.60
Feb. 15. 1963 — Well RR-83-26-708 Feb. 17, 1954 168.50
Mar. 27, 1964 205.53 Owner: W. H. Young Feb. 11, 1955 167.05
Feb. 26, 1965 207.57 Dec. 15, 1932 39.62 Feb. 10, 1956 175.12
Mar. 21, 1969 239.90 Feb. 2, 1934 37.42 Well RR-83-26-713 (old)
Well RR-83-26-705 Feb. 15, 1934 43.12 Owner: Missouri-Pacific Ry. Co.
Owner: City of Kingsville, No. 8 Mar. 19, 1935 42.88 Dec. 7, 1932 22.61
Jan. 23, 1947 112.9 Jan. 31, 1938 42.20 Feb. 1933 22.6
Feb. 11, 1948 115.51 Oct. 22, 1938 45.32 Nov. 22, 1934 22.92
Feb. 19, 1949 123.44 Apr. 13, 1939 48.01 Mar. 24, 1935 21.78
Feb. 10, 1950 128.03 Oct. 11. 1939 48.72 Apr. 12, 1939 14.59
Feb. 6, 1952 169.74 Feb. 16, 1940 46.36 Feb. 6, 1941 3.29
Feb. 4, 1953 167.65 Feb. 6. 1941 45.31 Well RR-8326-802,Noria Nicha, No. 2
Feb. 17, 1954 170.48 Feb. 3, 1943 62.50
Owner: King Ranch, Inc.Feb. 1 1, 1955 158.96 Well RR-83-26-709
Feb. 16,1949 82.60Feb. 10, 1956 166.79 Owner: City of Kingsville, No. 3
Feb. 11, 1950 81.42Feb. 13, 1957 214.96 Oct. 26, 1932 45.1
Feb. 17,1953 107.10Mar. 5, 1958 162.96 Dec. 14, 1933 40.49
Feb. 4, 1954 110.16Jan. 27,1960 183.15 Feb. 10,1934 39.12
Mar. 5, 1958 109.26Mar. 17, 1961 171.48 Nov. 17, 1934 43.38
Jan. 27, 1960 135.08Feb. 15,1963 191.13 Feb. 4,1943 85.7
Mar. 27. 1964 153.26Mar. 27, 1964 206.06 Mar. 3, 1943 66.1
Feb. 26, 1965 158.00Feb. 26, 1965 202.93 Mar. 7, 1944 76.5
Well RR-83-26-901,Feb. 9, 1968 211.61 Well RR8326710 Palo Marcado, No.1
Mar. 21,1969 216.66 Owner: City of Kingsville, No. 1 Owner: King Ranch, Inc.
Well RR.83-26-707 Dec. 5, 1932 47.72 Jan. 12, 1933 30.6
Owner: Joe Stelzig Dec. 14, 1933 40.84 Dec. 14, 1933 29.5
Dec. 15, 1932 31.76 Feb. 10, 1934 39.90 Feb. 10, 1934 28.6
Dec. 13, 1933 30.80 Nov. 17, 1934 46.6 Nov. 10. 1934 25.62
Feb. 2, 1934 30.72 Mar. 19, 1935 55.80 Nov. 14, 1943 46.43
Nov. 15, 1934 34.12 Mar. 7, 1944 89.70 Mar. 6, 1944 46.09
Mar. 19, 1935 34.58 Mar. 16, 1945 95.77 Mar. 16, 1945 54.38
Jan. 31, 1938 33.78 Feb. 21, 1947 132.85 Mar. 15, 1946 65.32
-122-
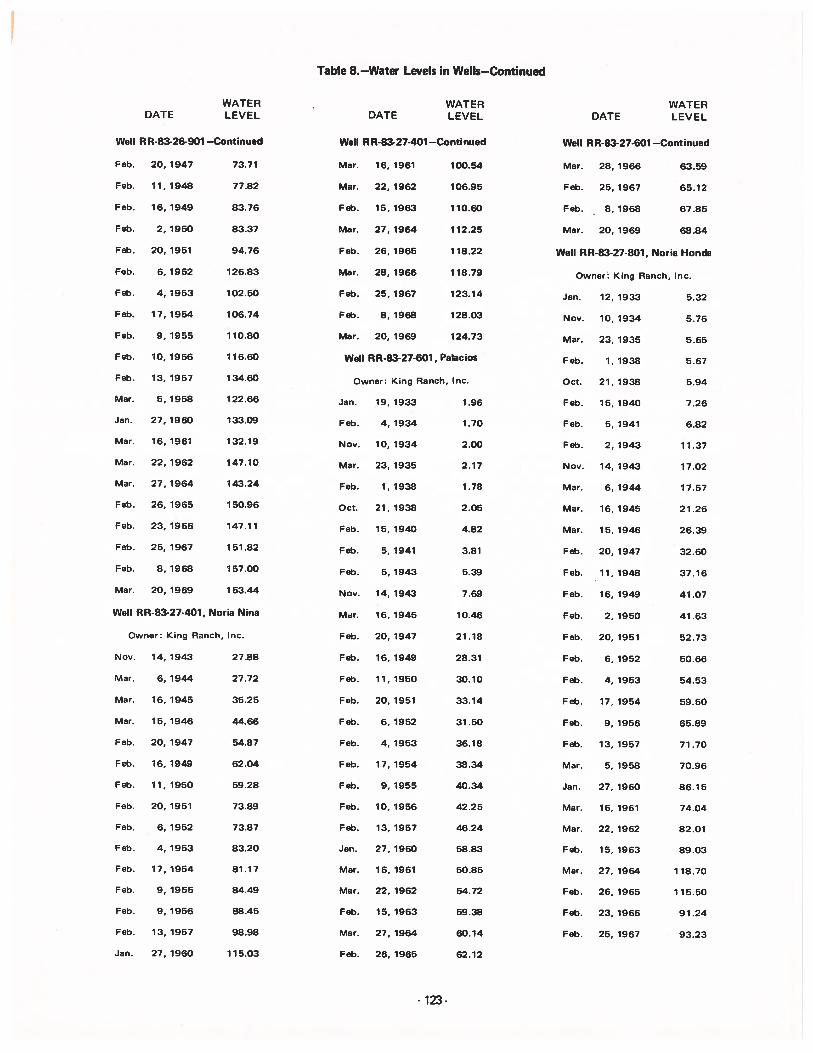
Table 8.—Wat Levels in Wells—Continued
WATERDATE LEVEL
Well RR-83-26-901 —Continued
Feb. 20, 1947 73.71
Feb. 11,1948 77.82
Feb. 16, 1949 83.76
Feb. 2, 1950 83.37
Feb. 20, 1951 94.76
Feb. 6, 1952 126.83
Feb. 4, 1953 102.50
Feb. 17,1954 106.74
Feb. 9, 1955 110.80
Feb. 10, 1956 116.60
Feb. 13, 1957 134.60
Mar. 5,1958 122.66
Jan. 27,1960 133.09
Mar. 16, 1961 132.19
Mar. 22,1962 147.10
Mar. 27, 1964 143.24
Feb. 26, 1965 150.96
Feb. 23,1966 147.11
Feb. 25, 1967 151.82
Feb. 8, 1968 157.00
Mar. 20, 1969 1 53.44
Well RR-83-27-401, Noria Nina
Owner: King Ranch, Inc.
Nov. 14, 1943 27.88
Mar. 6, 1944 27.72
Mar. 16, 1945 35.25
Mar. 15, 1946 44.66
Feb. 20, 1947 54.87
Feb. 16,1949 62.04
Feb. 11, 1950 59.28
Feb. 20, 1951 73.89
Feb. 6, 1952 73.87
Feb. 4, 1953 83.20
Feb. 17, 1954 81.17
Feb. 9, 1955 84.49
Feb. 9, 1956 88.45
Feb. 13, 1957 98.98
Jan. 27, 1960 115.03
WATERDATE LEVEL
Well RR.83-27-401—Continued
Mar. 16, 1961 100.54
Mar. 22, 1962 106.95
Feb. 15, 1963 110.60
Mar. 27, 1964 112.25
Feb. 26,1965 118.22
Mar. 28, 1966 118.79
Feb. 25, 1967 123.14
Feb. 8, 1968 128.03
Mar. 20, 1969 124.73
Well RR-83-27.601, Palacios
Owner: King Ranch, Inc.
Jan. 19, 1933 1.96
Feb. 4, 1934 1.70
Nov. 10, 1934 2.00
Mar. 23, 1935 2.17
Feb. 1, 1938 1.78
Oct. 21, 1938 2.05
Feb. 15, 1940 4.82
Feb. 5, 1941 3.81
Feb. 5, 1943 5.39
Nov. 14, 1943 7.69
Mar. 16, 1945 10.46
Feb. 20, 1947 21.18
Feb. 16, 1949 28.31
Feb. 11, 1950 30.10
Feb. 20, 1951 33.14
Feb. 6, 1952 31.50
Feb. 4, 1953 36.18
Feb. 17,1954 38.34
Feb. 9, 1955 40.34
Feb. 10, 1956 42.25
Feb. 13, 1957 46.24
Jan. 27, 1960 58.83
Mar. 16, 1961 50.85
Mar. 22, 1962 54.72
Feb. 15, 1963 59.38
Mar. 27, 1964 60.14
Feb. 26, 1965 62.12
WATERDATE LEVEL
Well RR-83.27.601 —Continued
Mar. 28, 1966 63.59
Feb. 25, 1967 65.12
Feb. - 8, 1968 67.85
Mar. 20, 1969 68.84
Well RR-83-27-801, Noria Honda
Owner King Ranch, Inc.
Jan. 12, 1933 5.32
Nov. 10. 1934 5.76
Mar. 23, 1935 5.65
Feb. 1, 1938 5.67
Oct. 21, 1938 5.94
Feb. 15, 1940 7.26
Feb. 5, 1941 6.82
Feb. 2,1943 11.37
Nov. 14, 1943 17.02
Mar. 6, 1944 17.57
Mar. 16, 1945 21.26
Mar. 15, 1946 26.39
Feb. 20, 1947 32.60
Feb. 11,1948 37.16
Feb. 16, 1949 41.07
Feb. 2, 1950 41.63
Feb. 20, 1951 52.73
Feb. 6, 1952 50.66
Feb. 4, 1953 54.53
Feb. 17, 1954 59.50
Feb. 9, 1956 65.89
Feb. 13, 1957 71.70
Mar. 5, 1958 70.96
Jan. 27, 1960 86.15
Mar. 16, 1961 74.04
Mar. 22, 1962 82.01
Feb. 15, 1963 89.03
Mar. 27, 1964 118.70
Feb. 26,1965 115.50
Feb. 23,1966 91.24
Feb. 25, 1967 93.23
-123-

bth1i. ) -2fr’! •!1 .-;incct :rW 1
.; t(.Vt •.‘
C’
.9.,.
‘‘
7... . . .. •1.’•
VP S V
4.,
.“.. ‘,
‘S.
“a
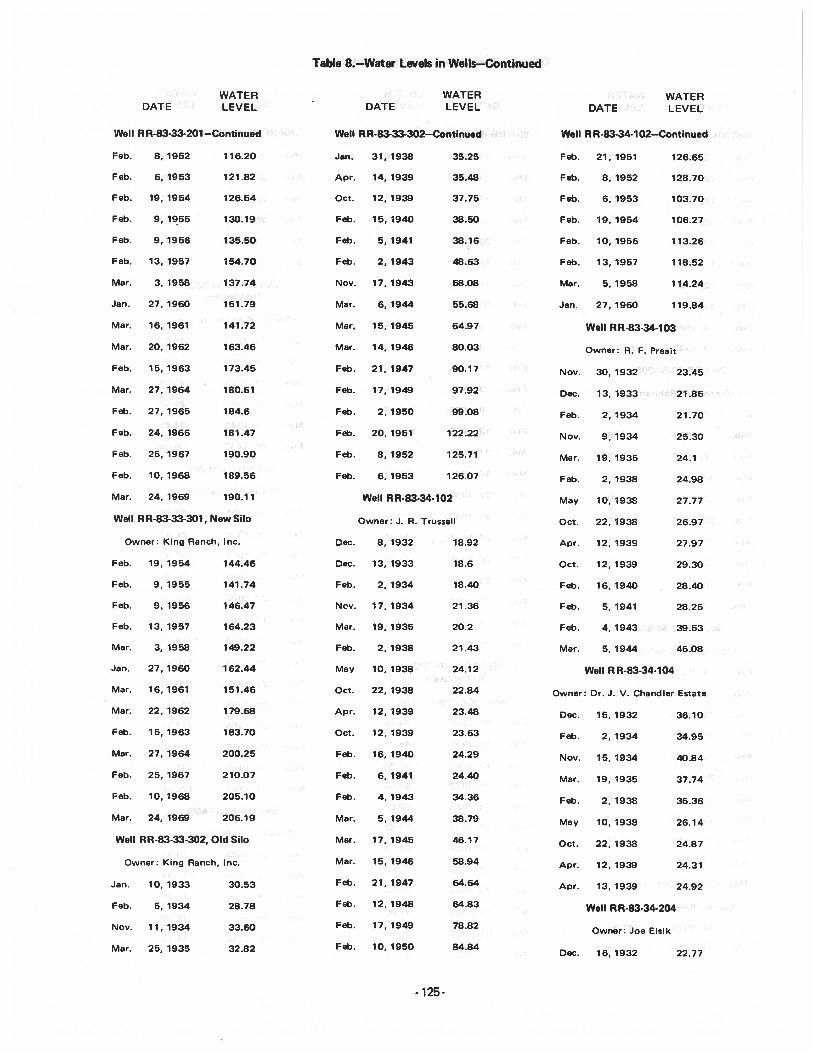
Table 8.—Water Levels in Wells—Continued
WATERDATE LEVEL
Well RR-83-33-201—Continued
Feb. 8, 1952 116.20
Feb. 6, 1953 121.82
Feb. 19, 1954 126.54
Feb. 9, 1955 130.19
Feb. 9, 1956 135.50
Feb. 13, 1957 154.70
Mar 3, 1958 137.74
Jan. 27, 1960 151.79
Mar. 16, 1961 141.72
Mar. 20, 1962 163.46
Feb. 15, 1963 173.45
Mar. 27, 1964 180.61
Feb. 27, 1965 184.6
Feb. 24, 1966 181.47
Feb. 25, 1967 190.90
Feb. 10, 1968 189.56
Mar. 24, 1969 190.11
Well RR-83-33.301, New Silo
Owner: King Ranch, Inc.
Feb. 19, 1954 144.46
Feb. 9, 1955 141.74
Feb. 9, 1956 146.47
Feb. 13, 1957 164.23
Mar. 3, 1958 149.22
Jan. 27, 1960 162.44
Mar. 16, 1961 151.46
Mar. 22, 1962 179.68
Feb. 15, 1963 183.70
Mar. 27, 1964 200.25
Feb. 25, 1967 210.07
Feb. 10, 1968 205.10
Mar. 24, 1969 206.19
Well RR.83.33.302, Old Silo
Owner: King Ranch, Inc.
Jan. 10, 1933 30.53
Feb. 5, 1934 28.78
Nov. 11, 1934 33.60
Mar. 25, 1935 32.82
WATERDATE LEVEL
Well RR-83-33-302—Continued
Jan. 31, 1938 35.25
Apr. 14, 1939 35.48
Oct. 12, 1939 37.75
Feb. 15,1940 38.50
Feb. 5, 1941 38.16
Feb. 2, 1943 48.63
Nov. 17, 1943 58.08
Mar. 6, 1944 55.68
Mar, 15, 1945 64.97
Mar. 14, 1946 80.03
Feb. 21, 1947 90.17
Feb. 17, 1949 97.92
Feb. 2. 1950 99.08
Feb. 20, 1951 122.22
Feb. 8, 1952 125.71
Feb. 6, 1953 126.07
Well RR-83-34-102
Owner: J. R. Trussell
Dec. 8, 1932 18.92
Dec. 13, 1933 18.6
Feb. 2. 1934 18.40
Nov. 17,1934 21.36
Mar. 19, 1935 20.2
Feb. 2, 1938 21.43
May 10, 1938 24.12
Oct. 22, 1938 22.84
Apr. 12, 1939 23.48
Oct. 12, 1939 23.63
Feb. 16, 1940 24.29
Feb. 6, 1941 24.40
Feb. 4, 1943 34.36
Mar. 5, 1944 38.79
Mar. 17, 1945 46.17
Mar. 15, 1946 58.94
Feb. 21,1947 64.64
Feb. 12, 1948 64.83
Feb. 17, 1949 78.82
Feb. 10,1950 84.84
WATERDATE LEVEL
R R-83.34-102—Continued
21, 1951 126.65
8, 1952 128.70
6, 1953 103.70
19, 1954 106.27
10, 1956 113.26
13, 1957 118.52
5, 1958 114.24
27, 1960 119.84
Well RR-83-34-103
Owner: Joe Elsik
Dec. 16, 1932 22.77
Well
Feb.
Feb.
Feb.
Feb.
Feb.
Feb.
Mar.
Jan.
Nov.
Dec.
Feb.
N ov.
Mar.
Feb.
May
Oct.
Apr.
Oct.
Feb.
F eb.
Feb.
Mar.
Owner: R. F. Preait
30, 1932
13, 1933
2, 1934
9, 1934
19, 1935
2, 1938
10, 1938
22, 1938
12, 1939
12, 1939
16,1940
5, 1941
4, 1943
5, 1944
Well RR-83-34-104
23.45
21.85
21.70
25.30
24.1
24.98
27.77
26.97
27.97
29.30
28.40
28.25
39.53
46.08
Estate
36.10
34.95
40.84
37.74
36.36
26.14
24.87
24.31
24.92
Owner: Dr. J. V. Chandler
Dec. 15, 1932
Feb. 2, 1934
Nov. 15, 1934
Mar. 19, 1935
Feb. 2, 1938
May 10, 1938
Oct. 22, 1938
Apr. 12. 1939
Apr. 13, 1939
Well RR-83-34-204
125-
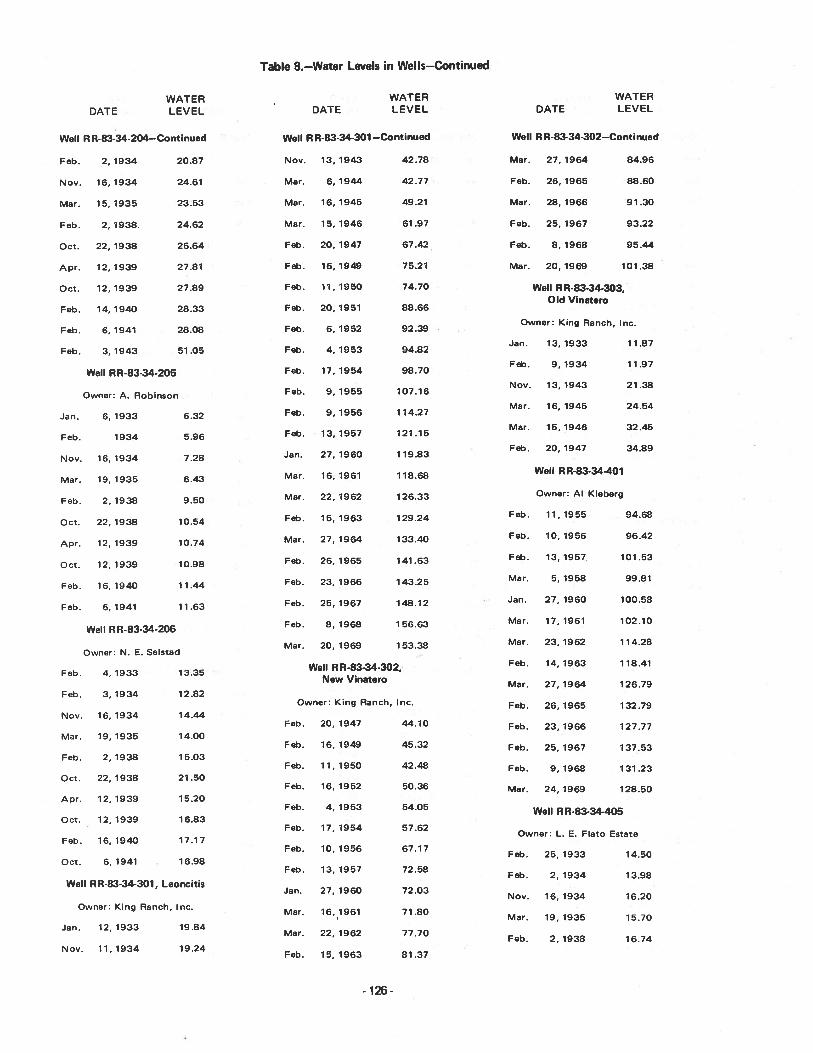
Table 8.—Water Levels in Wells—Continued
WATERDATE LEVEL
WATERDATE LEVEL
WATERDATE LEVEL
Well RR-83-34-204—Continued
Feb. 2, 1934 20.87
Nov. 16, 1934 24.61
Mar. 15, 1935 23.53
Feb. 2, 1938. 24.62
Oct. 22, 1938 26.64
Apr. 12, 1939 27.81
Oct. 12,1939 27.89
Feb. 14, 1940 28.33
Feb. 6, 1941 28.08
Feb. 3,1943 51.05
Well RR-83-34-205
Owner: A. Robinson
Jan. 6, 1933 6.32
Feb. 1934 5.96
Nov. 16,1934 7.28
Mar. 19, 1935 6.43
Feb. 2, 1938 9.50
Oct. 22, 1938 10.54
Apr. 12, 1939 10.74
Oct. 12,1939 10.98
Feb. 16,1940 11.44
Feb. 6, 1941 11.63
Well RR-83-34-206
Owner: N. E. Seistad
Feb. 4, 1933 13.35
Feb. 3, 1934 12.82
Nov. 16,1934 14.44
Mar. 19, 1935 14.00
Feb. 2, 1938 15.03
Oct. 22,1938 21.50
Apr. 12,1939 15.20
Oct. 12, 1939 16.83
Feb. 16, 1940 17.17
Oct. 6, 1941 16.98
Well RR-83-34-301, Leoncitis
Owner: King Ranch, Inc.
Jan. 12, 1933 19.84
Nov. 11,1934 19.24
Well RR-83-34-301 —Continued
Nov. 13,1943 42.78
Mar. 6, 1944 42.77
Mar. 16, 1945 49.21
Mar. 15, 1946 61.97
Feb. 20,1947 67.42
Feb. 16, 1949 75.21
Feb. 11,1950 74.70
Feb. 20, 1951 88.66
Feb. 6. 1952 92.39
Feb. 4, 1953 94.82
Feb. 17, 1954 98.70
Feb. 9, 1955 107.16
Feb. 9, 1956 114.27
Feb. 13,1957 121.15
Jan. 27,1960 119.83
Mar. 16, 1961 118.68
Mar. 22, 1962 126.33
Feb. 15, 1963 129.24
Mar. 27,1964 133.40
Feb. 26, 1965 141.63
Feb. 23, 1966 143.25
Feb. 25, 1967 148.12
Feb. 8, 1968 156.63
Mar. 20, 1969 153.38
Well RR-83-34-302,New Vinatero
Owner: King Ranch, Inc.
Feb. 20, 1947 44.10
Feb. 16,1949 45.32
Feb. 11,1950 42.48
Feb. 16, 1952 50.36
Feb. 4, 1953 54.05
Feb. 17, 1954 57.62
Feb. 10,1956 67.17
Feb. 13,1957 72.58
Jan. 27, 1960 72.03
Mar. 16,1961 71.80
Mar. 22, 1962 77.70
Feb. 15, 1963 81.37
Well RR-83-34-302—Continued
Mar. 27, 1964 84.96
Feb. 26, 1965 88.60
Mar. 28,1966 91.30
Feb. 25, 1967 93.22
Feb. 8, 1968 95.44
Mar. 20,1969 101.38
Well RR-83-34-303,Old Vinatero
Owner: King Ranch, Inc.
Jan. 13,1933 11.87
Feb. 9, 1934 11.97
Nov. 13,1943 21.38
Mar. 16, 1945 24.54
Mar. 15, 1946 32.45
Feb. 20, 1947 34.89
Well RR-83-34-401
Owner: Al Kleberg
Feb. 11,1955 94.68
Feb. 10,1956 96.42
Feb. 13,1957. 101.53
Mar. 5, 1958 99.81
Jan. 27, 1960 100.58
Mar. 17, 1961 102.10
Mar. 23,1962 114.28
Feb. 14,1963 118.41
Mar. 27, 1964 126.79
Feb. 26,1965 132.79
Feb. 23,1966 127.77
Feb. 25, 1967 137.53
Feb. 9, 1968 131.23
Mar. 24, 1969 128.50
Well RR-83-34-405
Owner: L. E. Flato Estate
Feb. 25, 1933 14.50
Feb. 2, 1934 13.98
Nov. 16,1934 16.20
Mar. 19, 1935 15.70
Feb. 2, 1938 16.74
-126-
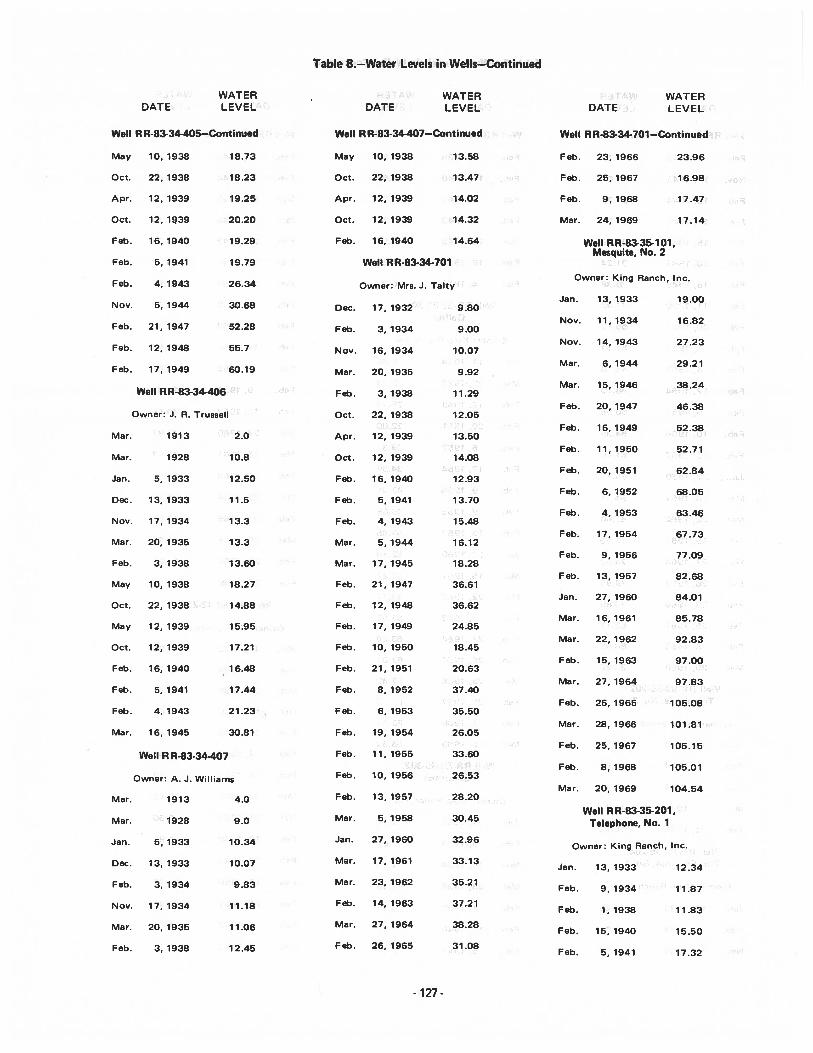
Table 8.—Water Levels in Wells—Continued
WATERDATE LEVEL
Well RR-83-34405—Continued
May 10, 1938 18.73
Oct. 22, 1938 18.23
Apr. 12, 1939 19.25
Oct. 12, 1939 20.20
Feb. 16, 1940 19.29
Feb. 5, 1941 19.79
Feb. 4, 1943 26.34
Nov. 5, 1944 30.68
Feb. 21, 1947 52.28
Feb. 12, 1948 55.7
Feb. 17, 1949 60.19
Well RR-83-34-406
Owner: J. R. Trussell
Mar. 1913 2.0
Mar. 1928 10.8
Jan. 5, 1933 12.50
Dec. 13,1933 11.5
Nov. 17, 1934 13.3
Mar. 20, 1935 13.3
Feb. 3, 1938 13.60
May 10, 1938 18.27
Oct. 22, 1938 14.88
May 12, 1939 15.95
Oct. 12, 1939 17.21
Feb. 16, 1940 16.48
Feb. 5, 1941 17.44
Feb. 4, 1943 21.23
Mar. 16, 1945 30.81
Well R R-83-34-407
Owner: A. J. Williams
Mar. 1913 4.0
Mar. 1928 9.0
Jan. 5, 1933 10.34
Dec. 13, 1933 10.07
Feb. 3, 1934 9.83
Nov. 17,1934 11.18
Mar. 20, 1935 11.06
Feb. 3, 1938 12.45
WATERDATE LEVEL
Well RR-83-34-407—Continued
May 10, 1938 13.58
Oct. 22, 1938 13.47
Apr. 12, 1939 14.02
Oct. 12, 1939 14.32
Feb. 16, 1940 14.64
Well RR-83-34-701
Owner: Mrs. J. Talty
Dec. 17, 1932 9.80
Feb. 3, 1934 9.00
Nov. 16, 1934 10.07
Mar. 20, 1935 9.92
Feb. 3, 1938 11.29
Oct. 22, 1938 12.05
Apr. 12, 1939 13.50
Oct. 12, 1939 14.08
Feb. 16,1940 12.93
Feb. 5, 1941 13.70
Feb. 4, 1943 15.48
Mar. 5, 1944 16.12
Mar. 17, 1945 18.28
Feb. 21, 1947 36.61
Feb. 12, 1948 36.62
Feb. 17, 1949 24.85
Feb. 10, 1950 18.45
Feb. 21,1951 20.63
Feb. 8, 1952 37.40
Feb. 6, 1953 35.50
Feb. 19, 1954 26.05
Feb. 11, 1955 33.60
Feb. 10, 1956 26.53
Feb. 13, 1957 28.20
Mar. 5, 1958 30.45
Jan. 27, 1960 32.96
Mar. 17,1961 33.13
Mar. 23, 1962 35.21
Feb. 14, 1963 37.21
Mar. 27, 1964 38.28
Feb. 26, 1965 31.08
WATERDATE LEVEL
R R-83-34-7O1—Continued
23, 1966 23.96
25, 1967 16.98
9, 1968 17.47
24, 1969 17.14
Well RR.83-35-lOl,Mesquite, No. 2
Owner: King Ranch, Inc.
Jan. 13, 1933 19.00
Nov. 11,1934 16.82
Nov. 14, 1943 27.23
Mar. 6, 1944 29.21
Mar. 15, 1946 38.24
Feb. 20, 1947 46.38
Feb. 16, 1949 52.38
Feb. 11,1950 52.71
Feb. 20, 1951 62.84
Feb. 6, 1952 68.05
Feb. 4, 1953 63.46
Feb. 17, 1954 67.73
Feb. 9, 1956 77.09
Feb. 13, 1957 82.68
Jan. 27, 1960 84.01
Mar. 16, 1961 85.78
Mar. 22, 1962 92.83
Feb. 15, 1963 97.00
Mar. 27, 1964 97.83
Feb. 26, 1965 105.08
Mar. 28, 1966 101.81
Feb. 25, 1967 105.15
Feb. 8, 1968 105.01
Mar. 20, 1969 104.54
Well RR.83.35-201,Telephone, No. 1
Owner: King Ranch, Inc.
Jan. 13, 1933 12.34
Feb. 9, 1934 11.87
Feb. 1, 1938 11.83
Feb. 15, 1940 15.50
Feb. 5, 1941 17.32
Well
Feb.
Feb.
Feb.
Mar.
-127-
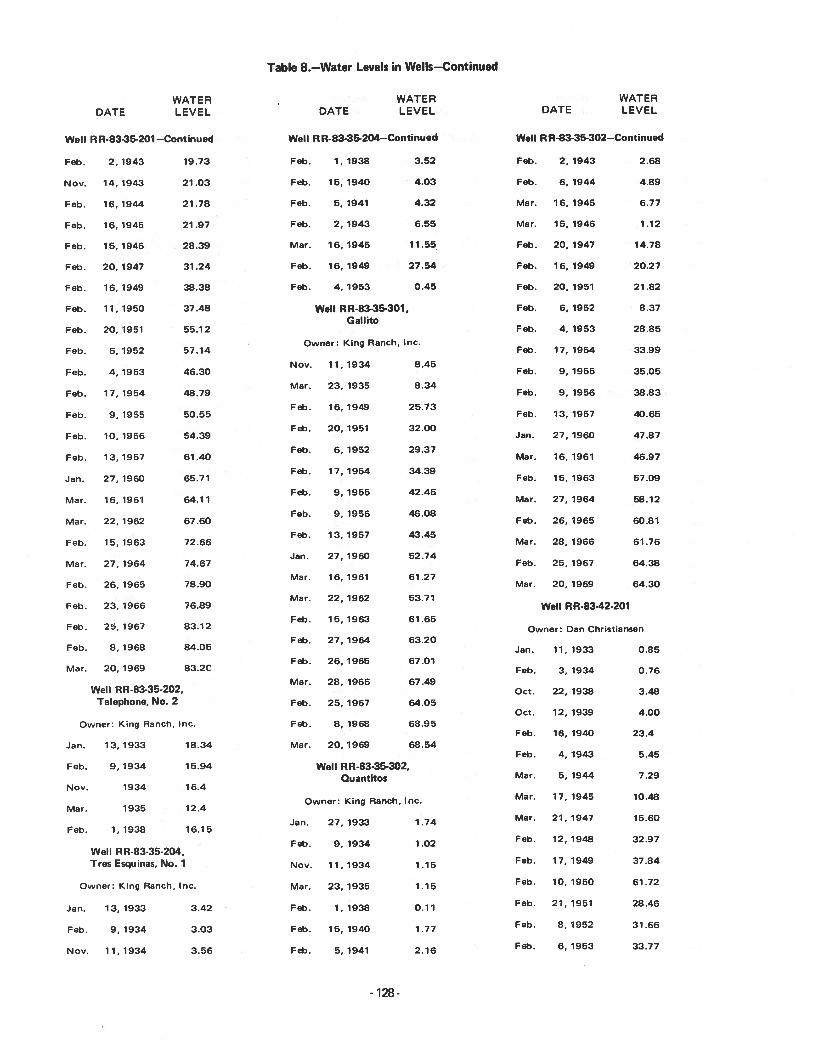
Table 8.—Water Levels in Wells—Continued
WATERDATE LEVEL
Well RR-83-35-201 —Continue4
Feb. 2, 1943 19.73
Nov. 14,1943 21.03
Feb. 16,1944 21.78
Feb. 16,1945 21.97
Feb. 15,1946 28.39
Feb. 20,1947 31.24
Feb. 16,1949 38.38
Feb. 11,1950 37.48
Feb. 20, 1951 55.12
Feb. 6, 1952 57.14
Feb. 4, 1953 46.30
Feb. 17, 1954 48.79
Feb. 9, 1955 50.55
Feb. 10, 1956 54.39
Feb. 13,1957 61.40
Jan. 27, 1960 65.71
Mar. 16,1961 64.11
Mar. 22, 1962 67.60
Feb. 15,1963 72.66
Mar. 27, 1964 74.67
Feb. 26, 1965 78.90
Feb. 23, 1966 76.89
Feb. 25,1967 83.12
Feb. 8, 1968 84.05
Mar. 20, 1969 83.2C
Well RR-83-35-202,Telephone, No. 2
Owner: King Ranch, Inc.
Jan. 13,1933 18.34
Feb. 9, 1934 15.94
Nov. 1934 16.4
Mar. 1935 12.4
Feb. 1, 1938 16.15
Well RR-83-35-204,Tres Esquinas, No. 1
Owner: King Ranch, Inc.
Jan. 13, 1933 3.42
Feb. 9, 1934 3.03
Nov. 11,1934 3.56
WATERDATE LEVEL
Well RR-83-35-204—Continued
Feb. 1, 1938 3.52
Feb. 15, 1940 4.03
Feb. 5, 1941 4.32
Feb. 2, 1943 6.55
Mar. 16,1945 11.55
Feb. 16, 1949 27.54
Feb. 4, 1953 0.45
Well RR-83-35-301,Gallito
Owner: King Ranch, Inc.
Nov. 11,1934 8.45
Mar. 23, 1935 8.34
Feb. 16, 1949 25.73
Feb. 20, 1951 32.00
Feb. 6, 1952 29.37
Feb. 17,1954 34.39
Feb. 9, 1955 42.45
Feb. 9, 1956 46.08
Feb. 13,1957 43.45
Jan. 27, 1960 52.74
Mar. 16, 1961 61.27
Mar. 22, 1962 53.71
Feb. 15,1963 61.65
Feb. 27, 1964 63.20
Feb. 26, 1965 67.01
Mar. 28, 1966 67.49
Feb. 25, 1967 64.05
Feb. 8, 1968 68.95
Mar. 20, 1969 68.54
Well RR.83-35.302,Quantitos
Owner: King Ranch, Inc.
Jan. 27, 1933 1.74
Feb. 9, 1934 1.02
Nov. 11,1934 1.15
Mar. 23,1935 1.15
Feb. 1, 1938 0.11
Feb. 15, 1940 1.77
Feb. 5, 1941 2.16
WATERDATE LEVEL
Well RR-83-35-302—Continued
Feb. 2, 1943 2.68
Feb. 6, 1944 4.89
Mar. 16, 1945 6.77
Mar. 15, 1946 1.12
Feb. 20, 1947 14.78
Feb. 16, 1949 20.27
Feb. 20, 1951 21.82
Feb. 6, 1952 8.37
Feb. 4, 1953 28.85
Feb. 17, 1954 33.99
Feb. 9, 1955 35.05
Feb. 9, 1956 38.83
Feb. 13, 1957 40.65
Jan. 27, 1960 47.87
Mar. 16, 1961 46.97
Feb. 15, 1963 57.09
Mar. 27, 1964 58.12
Feb. 26, 1965 60.81
Mar. 28, 1966 61.76
Feb. 25, 1967 64.38
Mar. 20, 1969 64.30
Well RR-83-42-201
Owner: Dan Christiansen
Jan. 11, 1933 0.85
Feb. 3, 1934 0.76
Oct. 22, 1938 3.48
Oct. 12, 1939 4.00
Feb. 16, 1940 23.4
Feb. 4, 1943 5.45
Mar. 5, 1944 7.29
Mar. 17, 1945 10.48
Mar. 21, 1947 15.60
Feb. 12, 1948 32.97
Feb. 17, 1949 37.84
Feb. 10, 1950 61.72
Feb. 21,1951 28.46
Feb. 8, 1952 31.66
Feb. 6, 1953 33.77
-128-
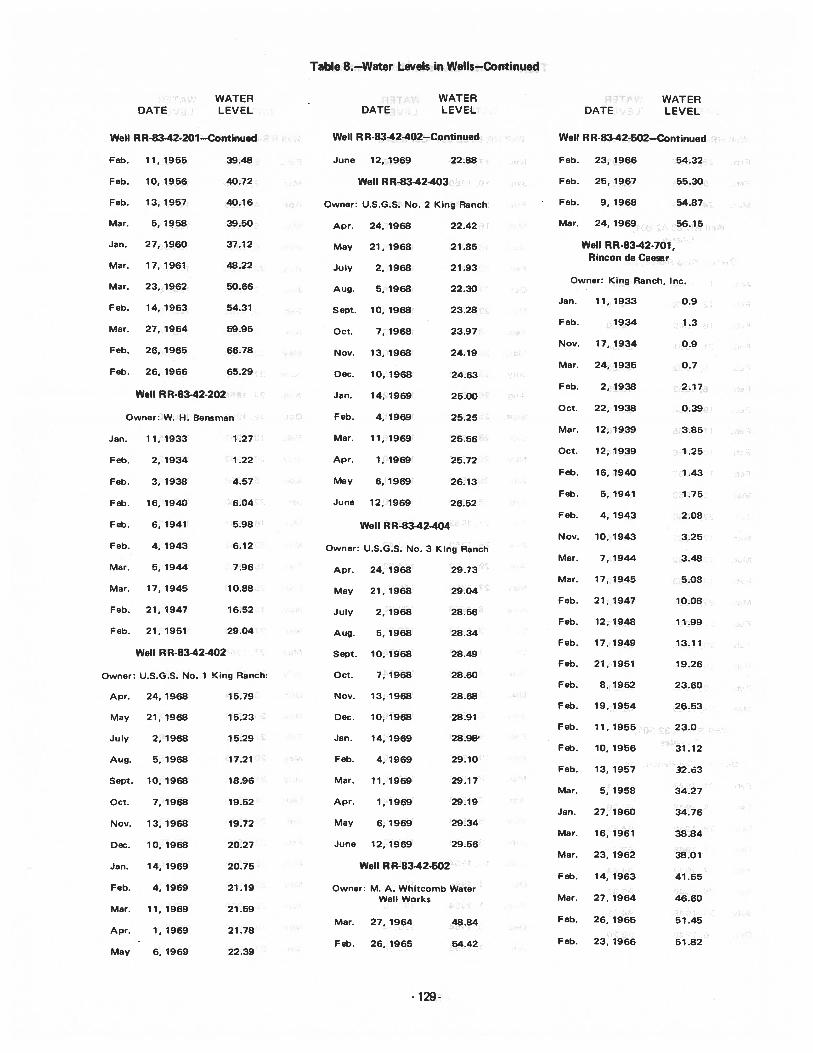
Table 8.—Water Levels in Wells—Continued
DATEWATERLEVEL DATE
WATER WATERLEVEL DATE LEVEL
Well RR-83-42-201—Continued Well RR-83-42402—Continued Well RR-83-42.502—Contjnued
Feb. 11, 1955 39.48 June 12. 1969 22.88 Feb. 23, 1966 54.32
Feb. 10, 1956 40.72 Well RR.8342403 Feb. 25, 1967 55.30
Feb. 13, 1957 40.16 Owner: U.S.G.S. No. 2 King Ranch, Feb. 9, 1968 54.87
Mar. 5, 1958 39.50 Apr. 24, 1968 22.42 Mar. 24, 1969 56.15
Jan. 27, 1960 37.12 May 21, 1968 21.85 Well RR-8342-701,Rincon de Caesar
Mar. 17, 1961 48.22 July 2, 1968 21.93
Owner: King Ranch, Inc.Mar. 23, 1962 50.66 Aug. 5, 1968 22.30
Jan. 11 1933 0.9Feb. 14, 1963 54.31 Sept. 10, 1968 23.28
Feb. 1934 1.3Mar. 27, 1964 59.95 Oct. 7, 1968 23.97
Nov. 17 1934 0.9Feb. 26, 1965 66.78 Nov. 13, 1968 24.19
Mar. 24 1935 0.7Feb. 26, 1966 65.29 Dec. 10, 1968 24.63
Feb. 2, 1938 2.17Well RR-83-42-202 Jan. 14, 1969 25.00
Oct. 22, 1938 0.39Owner: W. H. Bensman Feb. 4, 1969 25.25
Mar. 12, 1939 3.85Jan. 11, 1933 1.27 Mar. 11, 1969 25.56
Oct. 12,1939 1.25Feb. 2, 1934 1.22 Apr. 1, 1969 25.72
Feb. 16, 1940 1.43Feb. 3, 1938 4.57 May 6, 1969 26.13
Feb. 5, 1941 1.75Feb. 16, 1940 6.04 June 12, 1969 26.52
Feb. 4, 1943 2.08Feb. 6. 1941 5.98 Well RR.8342-404
Nov. 10. 1943 3.25Feb. 4, 1943 6.12 Owner: U.S.G.S. No. 3 King Ranch
Mar. 7, 1944 3.48Mar. 5, 1944 7.96 Apr. 24, 1968 29.73
Mar. 17, 1945 5.08Mar. 17, 1945 10.88 May 21, 1968 29.04
Feb. 21,1947 10.08Feb. 21, 1947 16.52 July 2, 1968 28.56
Feb. 12,1948 11.99Feb. 21, 1951 29.04 Aug. 5, 1968 28.34
Feb. 17,1949 13.11Well RR-83-42-402 Sept. 10, 1968 28.49
Feb. 21,1951 19.26Owner: U.S.G.S. No. 1 King Ranch: Oct. 7, 1968 28.60
Feb. 8, 1952 23.60Apr. 24, 1968 15.79 Nov. 13, 1968 28.68
Feb. 19.1954 26.53May 21, 1968 15.23 Dec. 10, 1968 28.91
Feb. 11, 1955 23.0July 2, 1968 15.29 Jan. 14, 1969 28.98’
Feb. 10,1956 31.12Aug. 5, 1968 17.21 Feb. 4, 1969 29.10
Feb. 13, 1957 32.63Sept. 10,1968 18.96 Mar. 11,1969 29.17
Mar. 5, 1958 34.27Oct. 7,1968 19.52 Apr. 1,1969 29.19
Jan. 27, 1960 34.76Nov. 13, 1968 19.72 May 6, 1969 29.34
Mar. 16, 1961 38.84Dec. 10, 1968 20.27 June 12, 1969 29.56
Mar. 23, 1962 38.01Jan. 14, 1969 20.75 Well RR.83-42-502
Feb. 14, 1963 41.65Feb. 4, 1969 21.19 Owner: M. A. Whitcomb Water
Well Works Mar. 27, 1964 46.60Mar. 11, 1969 21.59
Mar. 27, 1964 48.84 Feb. 26, 1965 51.45Apr. 1, 1969 21.78
. Feb. 26, 1965 54.42 Feb. 23, 1966 51.82May 6. 1969 22.39
-129-
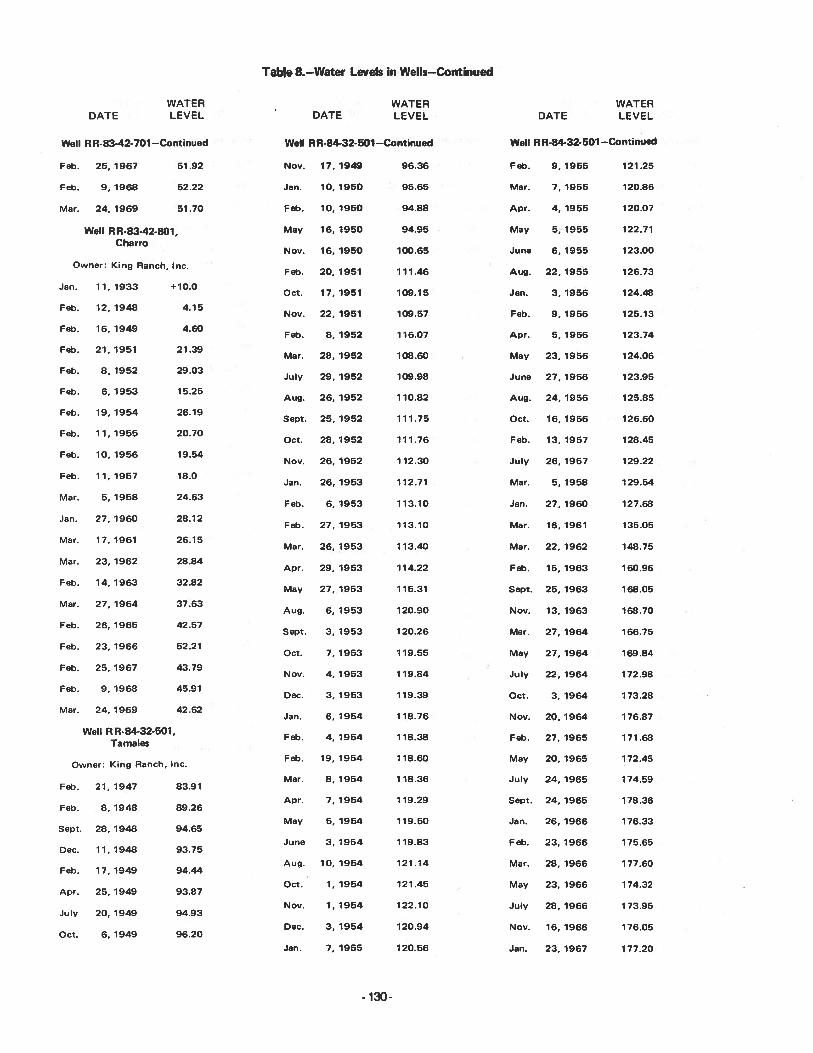
T8bIe 8.—Water Levels in Wells—Continued
Jan.
Feb.
Feb.
Feb.
Feb.
Feb.
Feb.
Feb.
Feb.
Feb -
Mar.
Jan.
Mar.
Mar.
Feb.
Mar.
Feb.
Feb.
Feb.
Feb.
Mar.
Well
Nov.
Jan.
Feb.
May
Nov.
Feb.
Oct.
Nov.
Feb.
Mar.
July
Aug.
Sept.
Oct.
Nov.
Jan.
Feb.
Feb.
Mar.
Apr.
May
Aug.
Sept.
Oct.
Nov.
Dec.
Jan.
Feb.
Feb.
Mar.
Apr.
May
June
Aug.
WATERDATE LEVEL
RR.84-32-501—Continued
17, 1949 96.36
10, 1950 95.65
10, 1950 94.88
16, 1950 94.95
16, 1950 100.65
20,1951 111.46
17, 1951 109.15
22, 1951 109.57
8, 1952 116.07
28, 1952 108.60
29, 1952 109.98
26, 1952 110.82
25, 1952 111.75
28, 1952 111.76
26, 1952 112.30
26, 1953 112.71
6, 1953 113.10
27, 1953 113.10
26, 1953 113.40
29, 1953 114.22
27, 1953 115.31
6, 1953 120.90
3, 1953 120.26
7, 1953 119.55
4, 1953 119.84
3, 1953 119.39
6, 1954 118.76
4, 1954 118.38
19, 1954 118.60
8, 1954 118.36
7, 1954 119.29
5, 1954 119.50
3, 1954 119.83
10. 1954 121.14
WATERDATE LEVEL
Well RR-84-32.501 —Continued
Feb. 9, 1955 121.25
Mar. 7, 1955 120.86
Apr. 4, 1955 120.07
May 5, 1955 122.71
June 6, 1955 123.00
Aug. 22, 1955 126.73
Jan. 3, 1956 124.48
Feb. 9, 1956 125.13
Apr. 5, 1956 123.74
May 23, 1956 124.06
June 27, 1956 123.95
Aug. 24, 1956 125.85
Oct. 16, 1956 126.60
Feb. 13, 1957 128.45
July 26, 1957 129.22
Mar. 5, 1958 129.54
Jan. 27, 1960 127.68
Mar. 16, 1961 135.05
Mar. 22, 1962 148.75
Feb. 15, 1963 160.96
Sept. 25, 1963 168.05
Nov. 13, 1963 168.70
Mar. 27, 1964 166.75
May 27, 1964 169.84
July 22, 1964 172.98
Oct. 3, 1964 173.28
Nov. 20, 1964 176.87
Feb. 27, 1965 171.68
May 20, 1965 172.45
July 24, 1965 174.59
Sept. 24, 1965 178.36
Jan. 26, 1966 176.33
Feb. 23, 1966 175.65
Mar. 28, 1966 177.60
May 23, 1966 174.32
July 28, 1966 173.95
Nov. 16, 1966 176.05
Jan. 23, 1967 177.20
DATE
WATERLEVEL
Feb.
Feb.
Mar.
25, 1967
9, 1968
24, 1969
Well RR-83-42-801,Charro
Well RR-83.42-701—Continued
51.92
52.22
51.70
Owner: King Ranch, Inc.
11, 1933 +10.0
12,1948 4.15
16, 1949 4.60
21, 1951 21.39
8, 1952 29.03
6, 1953 15.25
19, 1954 26.19
11, 1955 20.70
10, 1956 19.54
11, 1957 18.0
5, 1958 24.63
27, 1960 28.12
17, 1961 26.15
23, 1962 28.84
14, 1963 32.82
27, 1964 37.63
26, 1965 42.57
23, 1966 52.21
25, 1967 43.79
9, 1968 45.91
24, 1969 42.62
Well R R-84-32-501,Ta males
Owner: King Ranch, Inc.
Feb.
Feb.
Sept.
Dec.
Feb.
Apr.
July
Oct.
21, 1947
8, 1948
28, 1948
11, 1948
17, 1949
25, 1949
20, 1949
6, 1949
83.91
89.26
94.65
93.75
94.44
93.87
94.93
96.20
Oct. 1, 1954 121.45
Nov. 1,1954 122.10
Dec. 3, 1954 120.94
Jan. 7, 1955 120.56
.130-
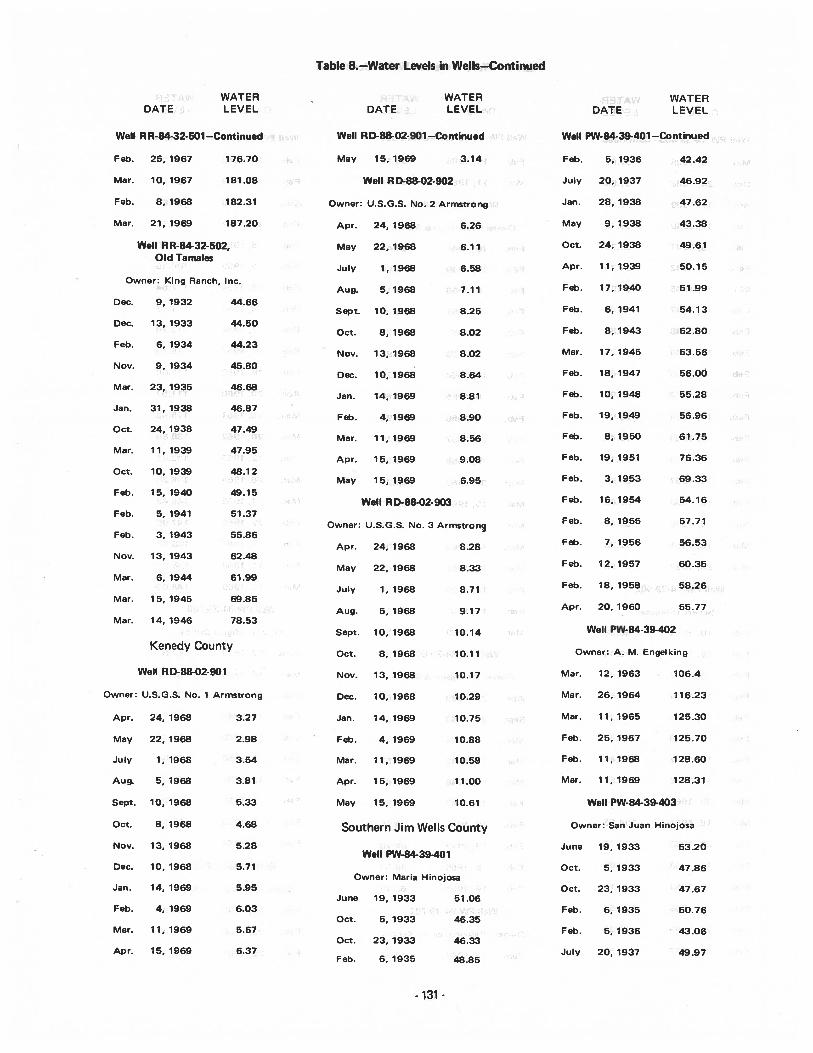
Table 8.—Water Levels in Wells—Continued
WATERDATE LEVEL
Well RR-84-32-501—Continued
Feb. 25. 1967 176.70
Mar. 10, 1967 181.08
Feb. 8, 1968 182.31
Mar. 21, 1969 187.20
Well RR-84-32-502,Old Tamales
WATERDATE LEVEL
Well RO-88-02-901 —Continued
May 15, 1969 3.14
Well RD-88-02-902
Owner: U.S.G.S. No. 2 Armstrong
Apr. 24, 1968 6.26
May 22,1968 6.11
July 1, 1968 6.58
Aug. 5, 1968 7.11
Sept. 10, 1968 8.25
Oct. 8, 1968 8.02
Nov. 13, 1968 8.02
Dec. 10,1968 8.64
Jan. 14, 1969 8.81
Feb. 4, 1969 8.90
Mar. 11, 1969 8.56
Apr. 15, 1969 9.08
May 15, 1969 6.95
Well RD-88-02-903
Owner: U.S.G.S. No. 3 Armstron9
Apr. 24, 1968 8.28
May 22, 1968 8.33
July 1, 1968 8.71
Aug. 5, 1968 9.17
Sept. 10, 1968 10.14
Oct. 8, 1968 10.11
Nov. 13, 1968 10.17
Dec. 10, 1968 10.29
Jan. 14, 1969 10.75
Feb. 4, 1969 10.88
Mar. 11, 1969 10.58
Apr. 15, 1969 11.00
May 15, 1969 10.61
Southern Jim Wells County
Well PW-84-39-401
Owner: Maria Hinojosa
June 19,1933 51.06
Oct. 5, 1933 46.35
Oct. 23, 1933 46.33
Feb. 6, 1935 48.85
WATERDATE LEVEL
Well PW-84-39-401 —Continued
Feb. 5, 1936 42.42
July 20, 1937 46.92
Jan. 28, 1938 47.62
May 9, 1938 43.38
Oct. 24, 1938 49.61
Apr. 11,1939 50.15
Feb. 17,1940 51.99
Feb. 6, 1941 54.13
Feb. 8, 1943 52.80
Mar. 17, 1945 53.56
Feb. 18, 1947 56.00
Feb. 10, 1948 55.28
Feb. 19, 1949 56.96
Feb. 8, 1950 61.75
Feb. 19, 1951 76.36
Feb. 3, 1953 69.33
Feb. 16,1954 54.16
Feb. 8, 1955 57.71
Feb. 7, 1956 56.53
Feb. 12, 1957 60.35
Feb. 18, 1958 58.26
Apr. 20, 1960 55.77
Well PW-84-39-402
Owner: A. M. Engelking
Mar. 12, 1963 106.4
Mar. 26,1964 116.23
Mar. 11, 1965 125.30
Feb. 25, 1967 125.70
Feb. 11,1968 128.60
Mar. 11,1969 128.31
Well PW-84-39-403
Owner: King Ranch, Inc.
Dec. 9, 1932 44.66
Dec. 13, 1933 44.50
Feb. 6, 1934 44.23
Nov. 9, 1934 45.80
Mar. 23, 1935 46.68
Jan. 31, 1938 46.87
Oct. 24, 1938 47.49
Mar. 11, 1939 47.95
Oct. 10, 1939 48.12
Feb. 15, 1940 49.15
Feb. 5, 1941 51.37
Feb. 3, 1943 55.86
Nov. 13, 1943 62.48
Mar. 6, 1944 61.99
Mar. 15, 1945 69.85
Mar. 14, 1946 78.53
Kenedy County
Owner:
Apr.
May
July
Aug.
Sept.
Oct.
Nov.
Dec.
Jan.
Feb.
Mar.
Apr.
Well RD-8B-02.901
U.S.G.S. No. 1 Armstrong
24, 1968 3.27
22, 1968 2.98
1, 1968 3.54
5, 1968 3.81
10, 1968 5.33
8, 1968 4.68
13, 1968 5.28
10, 1968 5.71
14, 1969 5.95
4, 1969 6.03
11, 1969 5.67
15, 1969 6.37
Owner: San Juan
June 19, 1933
Oct. 5, 1933
Oct. 23, 1933
Feb. 6, 1935
Feb. 5, 1936
July 20, 1937
Hinojosa
53.20
47.86
47.67
50.76
43.06
49.97
- 131 -
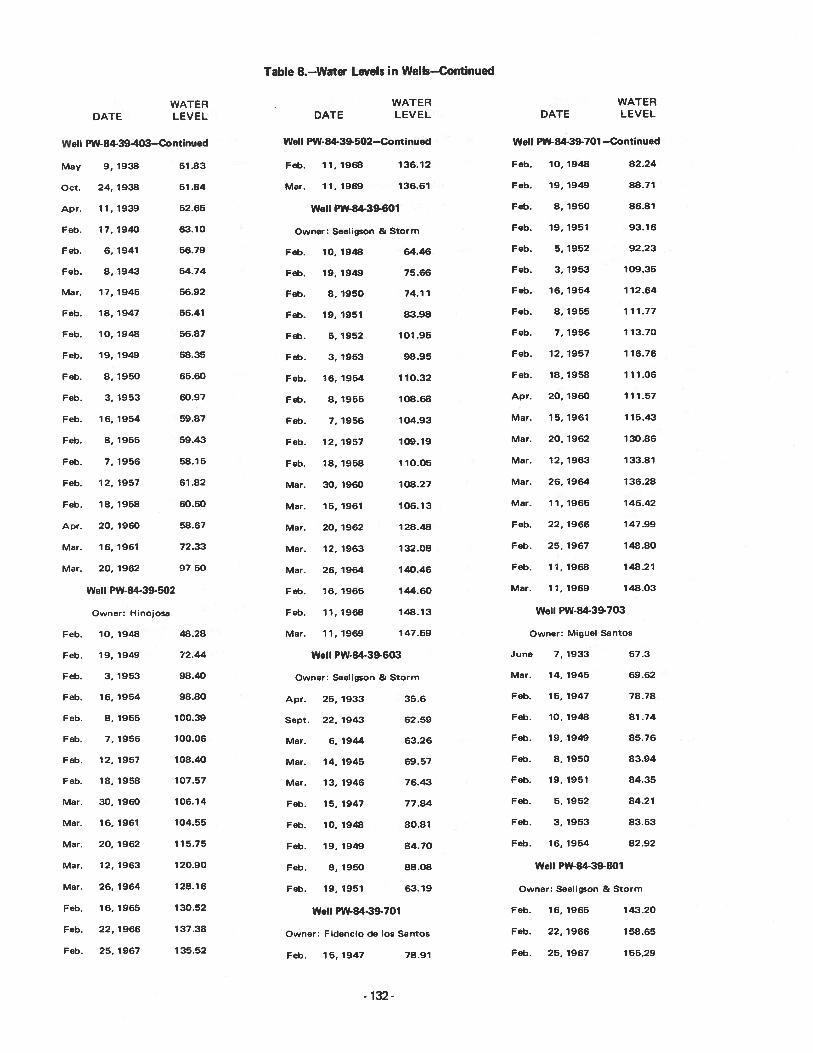
Table 8.—Water Levels in Wells—Continued
DATEWATERLEVEL DATE
WATERLEVEL
Well PW-84-39-502—Continued
DATE
Feb. 11,1968
Mar. 11,1969
WATERLEVEL
136.12
136.61
Well PW-84-39-403—Continued Well PW.84-39-701 —Continued
May 9, 1938 51.83 Feb. 10, 1948 82.24
Oct. 24, 1938 51.84 Feb. 19, 1949 88.71
Apr. 11, 1939 52.65 Well PW-84-39-601 Feb. 8, 1950 86.81
Feb. 17, 1940 63.10 Owner: Seeligson & Storm Feb. 19, 1951 93.16
Feb. 6, 1941 56.79 Feb. 10, 1948 64.46 Feb. 5, 1952 92.23
Feb. 8, 1943 54.74 Feb. 19, 1949 75.66 Feb. 3, 1953 109.35
Mar. 17,1945 56.92 Feb. 8,1950 74.11 Feb. 16,1954 112.64
Feb. 18, 1947 56.41 Feb. 19, 1951 83.98 Feb. 8, 1955 111.77
Feb. 10,1948 56.87 Feb. 5, 1952 101.95 Feb. 7, 1956 113.70
Feb. 19, 1949 Feb. 3, 1953 98.95 Feb. 12, 1957 116.76
Feb. 8,1950 65.60 Feb. 16,1954 110.32 Feb. 18,1958 111.06
Feb. 3, 1953 60.97 Feb. 8, 1955 108.68 Apr. 20, 1960 111.57
Feb. 16, 1954 59.87 Feb. 7, 1956 104.93 Mar. 15, 1961 115.43
Feb. 8. 1955 59.43 Feb. 12, 1957 109.19 Mar. 20, 1962 130.86
Feb. 7, 1956 58.15 Feb. 18,1958 110.05 Mar. 12,1963 133.81
Feb. 12, 1957 61.82 Mar. 30, 1960 108.27 Mar. 26, 1964 136.28
Feb. 18, 1958 60.60 Mar. 15, 1961 106.13 Mar. 11, 1965 146.42
Apr. 20, 1960 58.67 Mar. 20, 1962 128.48 Feb. 22, 1966 147.99
Mar. 16, 1961 72.33 Mar. 12, 1963 132.08 Feb. 25, 1967 148.80
Mar. 20, 1962 97 50 Mar. 26. 1964 140.46 Feb. 11, 1968 148.21
Well PW-84-39-502 Feb. 16, 1965 144.60 Mar. 11, 1969 148.03
Owner: Hinojosa Feb. 11, 1968 148.13 Well PW-84-39703
Feb. 10, 1948 48.28 Mar. 11, 1969 147.59 Owner: Miguel Santos
Feb. 19, 1949 72.44 Well PW-84-39-603 June 7, 1933 57.3
Feb. 3, 1953 98.40 Owner: Seeligson & Storm Mar. 14, 1945 69.62
Feb. 16, 1954 98.80 Apr. 25, 1933 35.6 Feb. 15, 1947 78.78
Feb. 8.1955 100.39 Sept. 22,1943 62.59 Feb. 10,1948 81.74
Feb. 7, 1956 100.06 Mar. 6, 1944 63.26 Feb. 19, 1949 85.76
Feb. 12, 1957 108.40 Mar. 14, 1945 69.57 Feb. 8, 1950 83.94
Feb. 18, 1958 107.57 Mar. 13, 1946 76.43 Feb. 19, 1951 84.35
Mar. 30, 1960 106.14 Feb. 15, 1947 77.84 Feb. 5, 1952 84.21
Mar. 16, 1961 104.55 Feb. 10, 1948 80.81 Feb. 3, 1953 83.53
Mar. 20. 1962 115.75 Feb. 19, 1949 84.70 Feb. 16, 1954 82.92
Mar. 12, 1963 120.90 Feb. 8, 1950 88.08 Well PW-84-39-B01
Mar. 26, 1964 128.16 Feb. 19, 1951 63.19 Owner: Seeligson & Storm
Feb. 16, 1965 130.52 Well PW.84-39.701 Feb. 16, 1965 143.20
Feb. 22, 1966 137.38 Owner: Fidencio de los Santos Feb. 22, 1966 158.65
Feb. 25. 1967 135.52 Feb. 15, 1947 78.91 Feb. 25, 1967 155.29
.132-
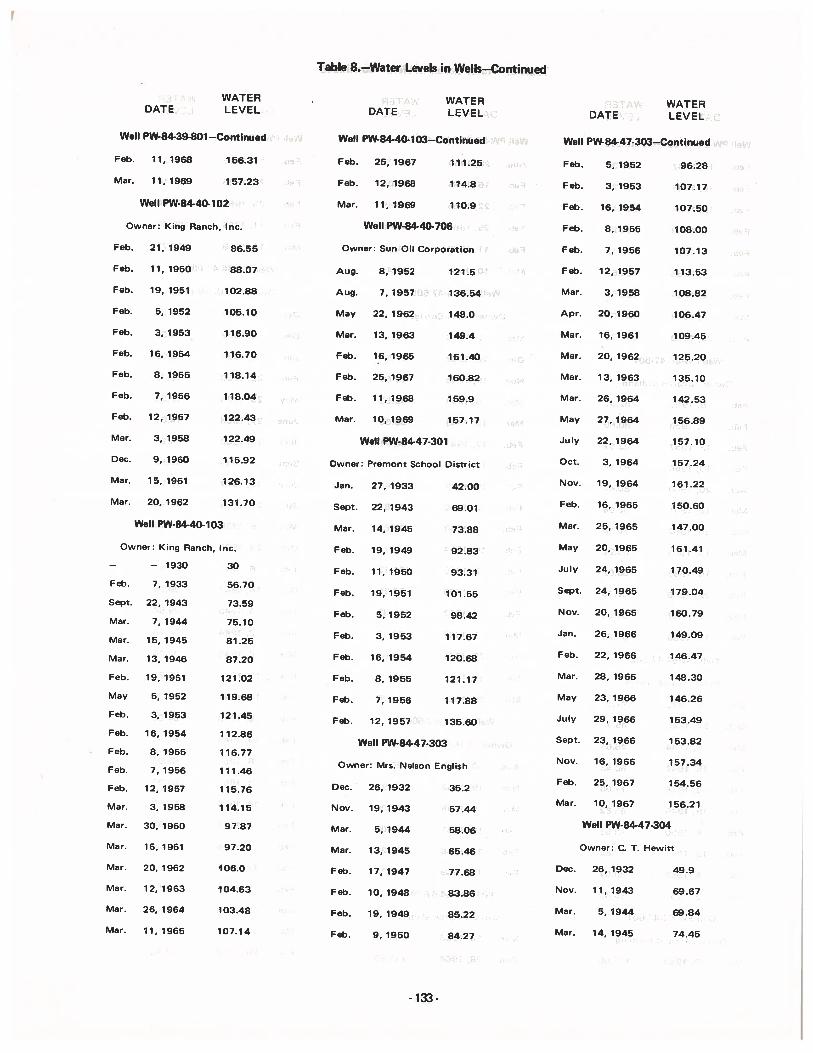
Table 8.—Water Levels in Wells—Continued
WATERDATE LEVEL
Well PW-84-39-801 —Continued
Feb. 11, 1968 156.31
Mar. 11, 1969 157.23
Well PW-84-40-102
Owner: King Ranch, Inc.
Feb. 21, 1949 86.55
Feb. 11, 1950 88.07
Feb. 19, 1951 102.88
Feb. 5, 1952 105.10
Feb. 3, 1953 116.90
Feb. 16, 1954 116.70
Feb. 8. 1955 118.14
Feb. 7, 1956 118.04
Feb. 12, 1957 122.43
Mar. 3, 1958 122.49
Dec. 9, 1960 115.92
Mar. 15, 1961 126.13
Mar. 20, 1962 131.70
Well PW.84-40.103
Owner: King Ranch, Inc.
—— 1930 30
Feb. 7, 1933 56.70
Sept. 22, 1943 73.59
Mar. 7, 1944 75.10
Mar. 15, 1945 81.25
Mar. 13. 1946 87.20
Feb. 19, 1951 121.02
May 5, 1952 119.68
Feb. 3, 1953 121.45
Feb. 16,1954 112.86
Feb. 8, 1955 116.77
Feb. 7, 1956 111.46
Feb. 12, 1957 115.76
Mar. 3, 1958 114.15
Mar. 30. 1960 97.87
Mar. 16, 1961 97.20
Mar. 20, 1962 106.0
Mar. 12, 1963 104.63
Mar. 26, 1964 103.48
Mar. 11, 1965 107.14
WATERDATE LEVEL
Well PW-84-40-103—Continued
Feb. 25,1967 111.25
Feb. 12, 1968 114.8
Mar. 11,1969 110.9
Well PW-84-40-706
Owner: Sun Oil Corporation
Aug. 8, 1952 121.5
Aug. 7, 1957 136.54
May 22, 1962 148.0
Mar. 13, 1963 149.4
Feb. 16, 1965 161.40
Feb. 25, 1967 160.82
Feb. 11,1968 159.9
Mar. 10, 1969 157.17
Well PW-84-473O1
Owner: Premont School District
Jan. 27, 1933 42.00
Sept. 22, 1943 69.01
Mar. 14, 1945 73.88
Feb. 19, 1949 92.83
Feb. 11, 1950 93.31
Feb. 19, 1951 101.55
Feb. 5, 1952 98.42
Feb. 3, 1953 117.67
Feb. 16, 1954 120.68
Feb. 8,1955 121.17
Feb. 7, 1956 117.88
Feb. 12,1957 135.60
Well PW-84.47-303
Owner: Mrs. Nelson English
Dec. 26, 1932 35.2
Nov. 19, 1943 57.44
Mar. 5, 1944 58.06
Mar. 13, 1945 65.46
Feb. 17, 1947 77.68
Feb. 10, 1948 83.86
Feb. 19, 1949 85.22
Feb. 9, 1950 84.27
WATERDATE LEVEL
Well PW.84-47-303--Continued
Feb. 5, 1952 96.28
Feb. 3, 1953 107.17
Feb. 16, 1954 107.50
Feb. 8, 1955 108.00
Feb. 7, 1956 107.13
Feb. 12,1957 113.53
Mar. 3, 1958 108.82
Apr. 20, 1960 106.47
Mar. 16, 1961 109.45
Mar. 20, 1962 125.20
Mar. 13, 1963 135.10
Mar. 26, 1964 142.53
May 27, 1964 156.89
July 22,1964 157.10
Oct. 3, 1964 157.24
Nov. 19,1964 161.22
Feb. 16, 1965 150.60
Mar. 25, 1965 147.00
May 20, 1965 161.41
July 24, 1965 170.49
Sept. 24,1965 179.04
Nov. 20, 1965 160.79
Jan. 26, 1966 149.09
Feb. 22, 1966 146.47
Mar. 28, 1966 148.30
May 23, 1966 146.26
July 29, 1966 153.49
Sept. 23,1966 153.82
Nov. 16, 1966 157.34
Feb. 25, 1967 154.56
Mar. 10. 1967 156.21
Well PW-84-47-304
Owner: C. T. Hewitt
Dec. 26, 1932 49.9
Nov. 11,1943 69.67
Mar. 5, 1944 69.84
Mar. 14, 1945 74.45
133-
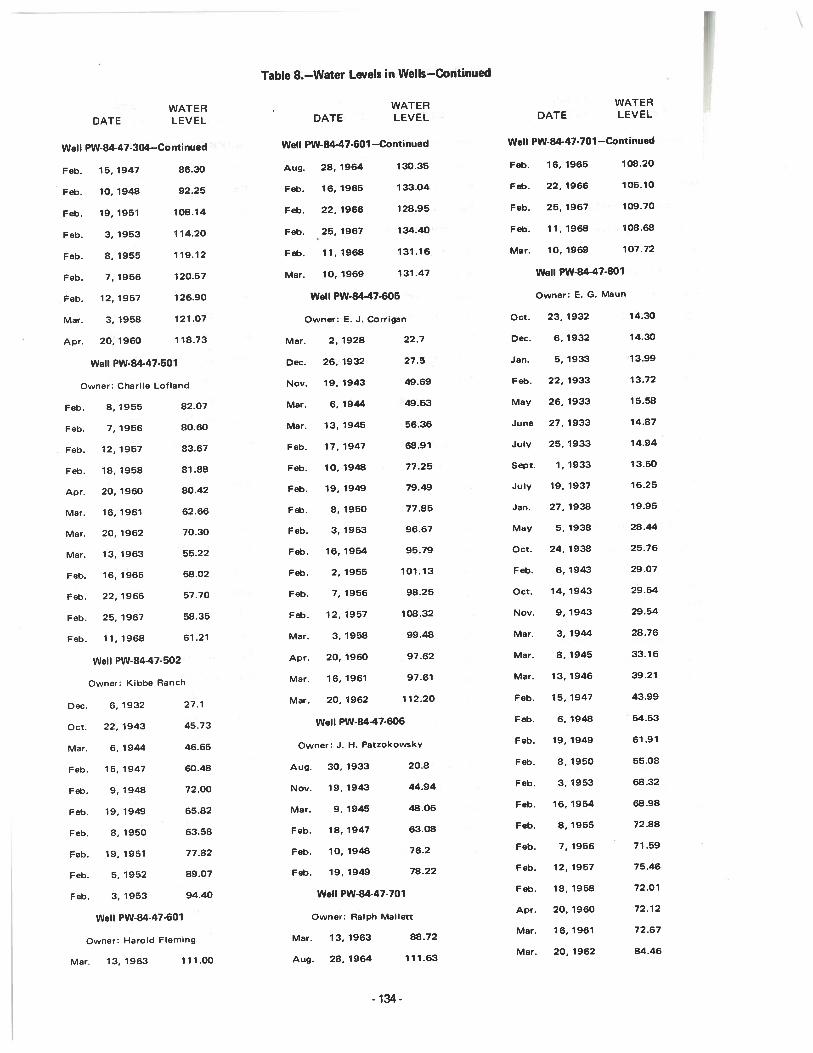
Table 8.—Water Levels in Wells—Continued
DATE
IDATE
WATER WATER
LEVEL DATE LEVEL
WATERLEVEL
Aug.
Feb.
Feb.
Feb.
28, 1964
16, 1965
22, 1966
25, 1967
130.35
133.04
128.95
134.40
Well PW-84-47-304—Continued Well PW-84-47-601 —Continued Well PW-84-47-701 —Continued
Feb. 15, 1947 86.30 Feb. 16, 1965 108.20
Feb. 10, 1948 92.25 Feb. 22, 1966 105.10
Feb. 19, 1951 108.14 Feb. 25, 1967 109.70
Feb. 3,1953 114.20 Feb. 11,1968 108.68
Feb. 8, 1955 119.12 Feb. 11, 1968 131.16 Mar. 10, 1969 107.72
Feb. 7, 1956 120.57 Mar. 10, 1969 131.47 Well PW-84-47-801
Feb. 12, 1957 126.90 Well PW-84-47-605 Owner: E. G. Maun
Mar. 3, 1958 121.07 Owner: E. J. Corrigan Oct. 23, 1932 14.30
Apr. 20, 1960 1 18.73 Mar. 2, 1928 22.7 Dec. 6, 1932 14.30
Well PW-84-47-501 Dec. 26, 1932 27.5 Jan. 5, 1933 13.99
Owner: Charlie Lofland Nov. 19, 1943 49.69 Feb. 22, 1933 13.72
Feb. 8, 1955 82.07 Mar. 6, 1944 49.53 May 26, 1933 15.58
Feb. 7, 1956 80.60 Mar. 13, 1945 56.36 June 27, 1933 14.87
Feb. 12, 1957 83.67 Feb. 17, 1947 68.91 July 25, 1933 14.94
Feb. 18, 1958 81.88 Feb. 10, 1948 77.25 Sept. 1, 1933 13.50
Apr. 20, 1960 80.42 Feb. 19, 1949 79.49 July 19, 1937 16.25
Mar. 16, 1961 62.66 Feb. 8, 1950 77.85 Jan. 27, 1938 19.95
Mar. 20, 1962 70.30 Feb. 3, 1953 96.67 May 5, 1938 28.44
Mar. 13, 1963 55.22 Feb. 16, 1954 95.79 Oct. 24, 1938 25.76
Feb. 16, 1965 58.02 Feb. 2, 1955 101.13 Feb. 6, 1943 29.07
Feb. 22, 1966 57.70 Feb. 7, 1956 98.25 Oct. 14, 1943 29.54
Feb. 25, 1967 58.35 Feb. 12, 1957 108.32 Nov. 9, 1943 29.54
Feb. 11, 1968 61.21 Mar. 3, 1958 99.48 Mar. 3,1944 28.76
Well PW-84-47-502 Apr. 20, 1960 97.62 Mar. 8, 1945 33.16
Owner: Kibbe Ranch Mar. 16, 1961 97.61 Mar. 13, 1946 39.21
Dec. 6, 1932 27.1 Mar. 20, 1962 112.20 Feb. 15, 1947 43.99
Oct. 22, 1943 45.73 Well PW-84-47.606 Feb. 6, 1948 54.53
Mar. 6, 1944 46.65 Owner: J. H. Patzokowsky Feb. 19, 1949 61.91
Feb. 15, 1947 60.48 Aug. 30. 1933 20.8 Feb. 8, 1950 55.08
Feb. 9, 1948 72.00 Nov. 19, 1943 44.94 Feb. 3, 1953 68.32
Feb. 19, 1949 65.82 Mar. 9, 1945 48.06 Feb. 16, 1954 68.98
Feb. 8, 1950 63.58 Feb. 18, 1947 63.08 Feb. 8, 1955 72.88
Feb. 19, 1951 77.82 Feb. 10, 1948 76.2 Feb. 7, 1956 71.59
Feb. 5, 1952 89.07 Feb. 19, 1949 78.22 Feb. 12, 1957 75.46
Feb. 3, 1953 94.40 Well PW.84-47-701 Feb. 18, 1958 72.01
Well PW-84-47-601 Owner: Ralph MallettApr. 20, 1960 72.12
Owner: Harold Fleming Mar. 13, 1963 88.72Mar. 16, 1961 72.67
Mar. 13, 1963 111.00 Aug. 28, 1964 111.63Mar. 20, 1962 84.46
-134.
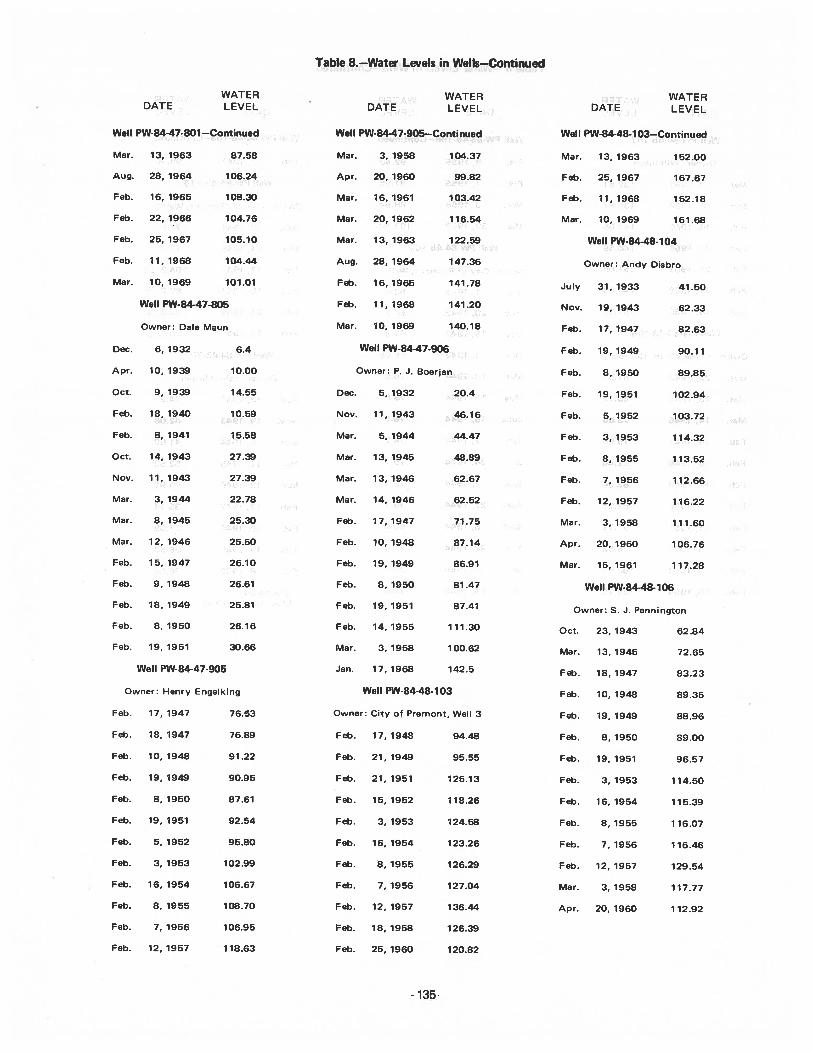
Table 8.—Water Levels in Wells—Continued
WATERDATE LEVEL
Well PW-84-47-801 —Continued
Mar. 13, 1963 87.58
Aug. 28, 1964 106.24
Feb. 16, 1965 108.30
Feb. 22, 1966 104.76
Feb. 25, 1967 105.10
Feb. 11, 1968 104.44
Mar. 10, 1969 101.01
Well PW-84-47-805
Owner: Dale Maun
Dec. 6, 1932 6.4
Apr. 10, 1939 10.00
Oct. 9, 1939 14.55
Feb. 18, 1940 10.59
Feb. 8, 1941 15.58
Oct. 14, 1943 27.39
Nov. 11, 1943 27.39
Mar. 3, 1944 22.78
Mar. 8, 1945 25.30
Mar. 12, 1946 25.60
Feb. 15. 1947 26.10
Feb. 9, 1948 26.61
Feb. 18, 1949 25.81
Feb. 8, 1950 26.16
Feb. 19, 1951 30.66
Well PW-84-47-905
WATERDATE LEVEL
Well PW-84-47-905—Continued
Mar. 3, 1958 104.37
Apr. 20, 1960 99.82
Mar. 16, 1961 103.42
Mar. 20,1962 116.54
Mar. 13, 1963 122.59
Aug. 28, 1964 147.36
Feb. 16, 1965 141.78
Feb. 11, 1968 141.20
Mar. 10, 1969 140.18
Well PW-84-47-906
Owner: P. J. Boerjan
Dec. 5, 1932 20.4
Nov. 11, 1943 46.16
Mar. 5, 1944 44.47
Mar. 13, 1945 48.89
Mar. 13, 1946 62.67
Mar. 14, 1946 62.52
Feb. 17, 1947 71.75
Feb. 10, 1948 87.14
Feb. 19, 1949 86.91
Feb. 8, 1950 81.47
Feb. 19, 1951 87.41
Feb. 14,1955 111.30
Mar. 3, 1958 100.62
Jan. 17, 1968 142.5
Well PW-84-48-1 03
Owner: City of Premont, Well 3
Feb. 17,1948 94.48
Feb. 21, 1949 95.55
Feb. 21, 1951 125.13
Feb. 15,1952 118.26
Feb. 3, 1953 124.58
Feb. 16, 1954 123.26
Feb. 8, 1955 126.29
Feb. 7, 1956 127.04
Feb. 12, 1957 136.44
Feb. 18,1958 126.39
Feb. 25, 1960 120.82
WATERDATE LEVEL
Well PW-84-48.1 03—Continued
Mar. 13, 1963 152.00
Feb. 25, 1967 167.67
Feb. 11,1968 152.18
Mar. 10,1969 161.68
Well PW-84-48-104
Owner: Andy Disbro
July 31, 1933 41.50
Nov. 19, 1943 62.33
Feb. 17, 1947 82.63
Feb. 19, 1949 90.11
Feb. 8, 1950 89.85
Feb. 19, 1951 102.94
Feb. 5, 1952 103.72
Feb. 3, 1953 114.32
Feb. 8, 1955 113.52
Feb. 7, 1956 112.66
Feb. 12, 1957 116.22
Mar. 3, 1958 111.60
Apr. 20, 1960 106.76
Mar. 15, 1961 117.28
Well PW-84-48-106
Owner: S. J. Pennington
Oct. 23, 1943 62.84
Mar. 13, 1945 72.65
Feb. 18, 1947 83.23
Feb. 10, 1948 89.35
Feb. 19, 1949 88.96
Feb. 8, 1950 89.00
Feb. 19, 1951 96.57
Feb. 3,1953 114.50
Feb. 16, 1954 115.39
Feb. 8, 1955 116.07
Feb. 7, 1956 116.46
Feb. 12, 1957 129.54
Mar. 3, 1958 117.77
Apr. 20,1960 112.92
Owner: Henry
Feb. 17, 1947
Feb. 18, 1947
Feb. 10, 1948
Feb. 19, 1949
Feb. 8, 1950
Feb. 19. 1951
Feb. 5, 1952
Feb. 3, 1953
Feb. 16, 1954
Feb. 8, 1955
Feb. 7, 1956
Feb. 12, 1957
Engelking
76.53
76.89
91.22
90.95
87.61
92.54
95.80
102.99
106.67
108.70
106.95
118.63
- 135
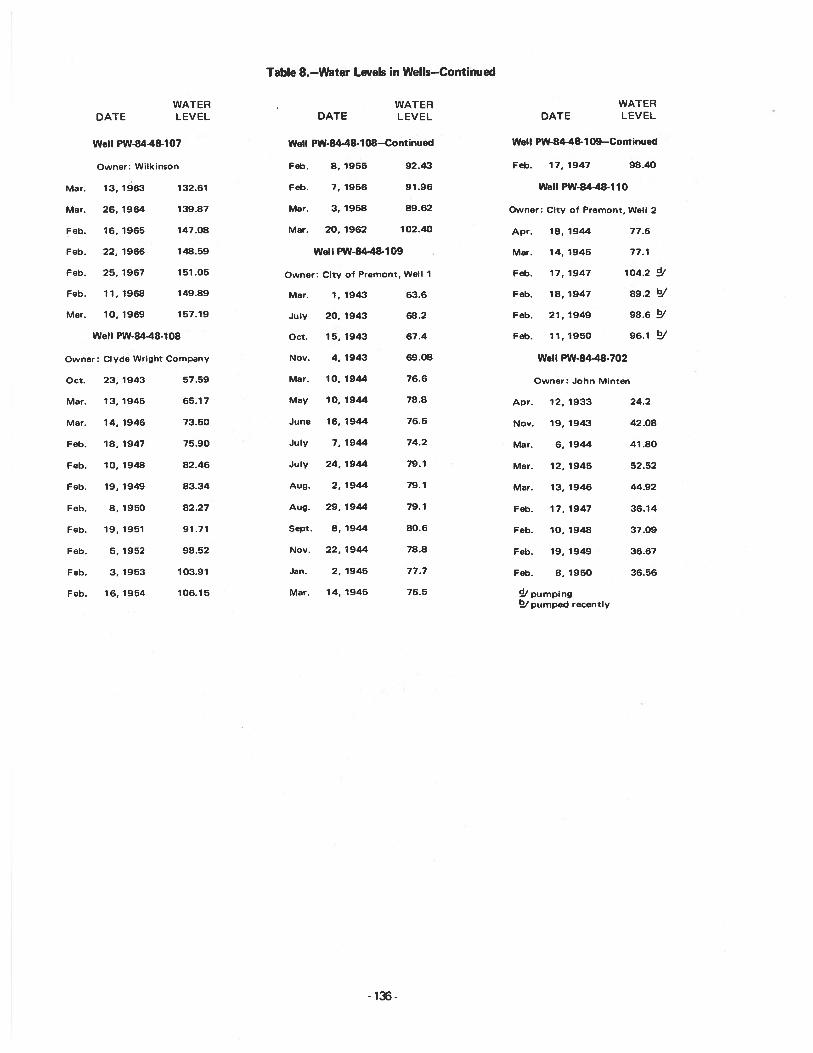
Table 8.—Water Levels in Wells—Continued
Well PW-84-48-107
Owner: Wilkinson
13, 1963 132.61
26, 1964 139.87
16, 1965 147.08
22. 1966 148.59
25, 1967 151.05
11, 1968 149.89
10, 1969 157.19
Well PW-8448-108
Clyde Wright Company
23, 1943 57.59
13,1945 65.17
14,1946 73.50
18, 1947 75.90
10, 1948 82.46
19, 1949 8334
8, 1950 82.27
19, 1951 91.71
5, 1952 98.52
3. 1953 103.91
16, 1954 106.15
Well PW-84-48-108—Continued
Feb. 8, 1955 92.43
Feb. 7, 1956 91.96
Mar. 3, 1958 89.62
Mar. 20. 1962 102.40
Well PW-84-48-109
Owner: City of Premont, Well 1
Mar. 1, 1943 63.6
July 20, 1943 68.2
Oct. 15, 1943 67.4
Nov. 4, 1943 69.08
Mar. 10, 1944 76.6
May 10, 1944 78.8
June 16, 1944 76.5
July 7, 1944 74.2
July 24, 1944 79.1
Aug. 2, 1944 79.1
Aug. 29, 1944 79.1
Sept. 8, 1944 80.6
Nov. 22, 1944 78.8
Jan. 2, 1945 77.7
Mar. 14, 1945 76.5
Well PW-84-48-109—Continued
Feb. 17, 1947 98.40
Well PW-84-48-1 10
Owner: City of Premont, Well 2
Apr. 18, 1944 77.6
Mar. 14, 1945 77.1
Feb. 17, 1947 104.2 /
Feb. 18, 1947 89.2 W
Feb. 21, 1949 98.6 /
Feb. 11, 1950 96.1 /
Well PW-84-48.702
Owner: John Minten
Apr. 12, 1933 24.2
Nov. 19, 1943 42.08
Mar. 6, 1944 41.80
Mar. 12, 1945 52.52
Mar. 13, 1946 44.92
Feb. 17, 1947 36.14
Feb. 10, 1948 37.09
Feb. 19, 1949 36.67
Feb. 8, 1950 36.56
/ pumpingb/pumped recently
DATEWATERLEVEL DATE
WATER WATER
LEVEL DATE LEVEL
Mar.
Mar.
Feb.
Feb.
Feb.
Feb.
Mar.
Owner:
Oct.
Mar.
Mar.
Feb.
Feb.
Feb.
Feb.
Feb.
Feb.
Feb.
Feb.
-136-
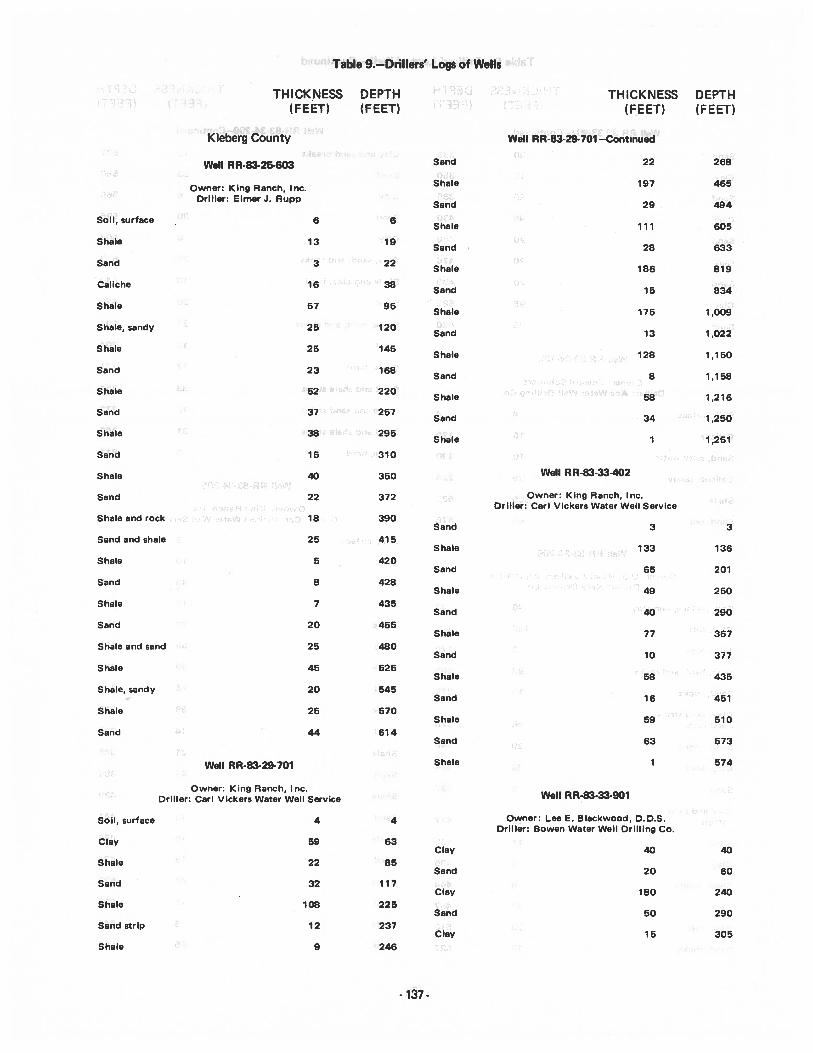
Table 9.—Drillers’ Logs of Wells
THICKNESS DEPTH THICKNESS DEPTH(FEET) (FEET) (FEET) (FEET)
Kleberg County Well RR-83-29-701 —Continued
Sand 22 268Well RR-83-25-603
Shale 197 465Owner: King Ranch, Inc.Driller: Elmer J. Rupp
Sand 29 494
Soil, surface 6 6Shale 111 605
Shale 13 19Sand 28 633
Sand 3 22Shale 186 819
Caliche 16 38Sand 15 834
Shale 57Shale 175 1,009
Shale, sandy 25 120Sand 13 1,022
Shale 25 145Shale 128 1,150
Sand 23 168Sand 8 1,158
Shale 52 220Shale 58 1,216
Sand 37 257Sand 34 1,250
Shale 38 295Shale 1 1,251
Sand 15 310
Well RR-83-33-402Shale 40 350
Owner: King Ranch, Inc.Sand 22 372Driller: Carl Vickers Water Well Service
Shale and rock 18 390Sand 3 3
Sand and shale 25 415Shale 133 136
Shale 5 420Sand 65 201
Sand 8 428Shale 49 250
Shale 7 435Sand 40 290
Sand 20 455Shale 77 367
Shale and sand 25 480Sand 10 377
Shale 45 525Shale 58 435
Shale, sandy 20 545Sand 16 451
Shale 25 570Shale 59 510
Sand 44 614Sand 63 573
Shale 1 574Well RR-83-29-701
Owner: King Ranch, Inc.Well RR.83-33.901Driller: Carl Vickers Water Well Service
Owner: Lee E. Blackwood, D.D.S.Soil, surface 4Driller: Bowen Water Well Drilling Co.
Clay 59 63Clay 40 40
Shale 22 85Sand 20 60
Sand 32 117Clay 180 240
Shale 108 225Sand 50 290
Sand strip 12 237Clay 15 305
Shale 9 246
- 137-
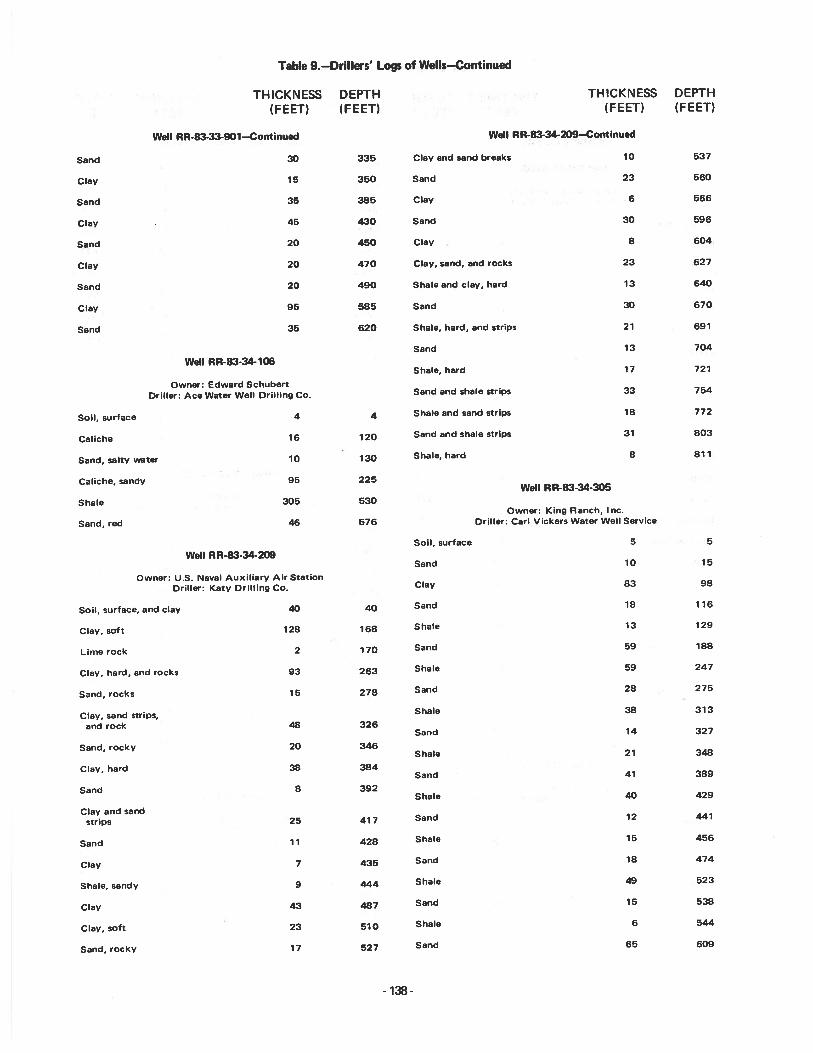
Table 9.—Drillers’ Logs of Wells—Continued
THICKNESS DEPTH THICKNESS DEPTH(FEET) (FEET) (FEET) (FEET)
Well RR-83-33-901—Continued Wdl RR-83-34209—Continued
Sand 30 335 Clay and sand breaks 10 537
Clay 15 350 Sand 23 560
Sand 35 385 Clay 6 566
Clay 45 430 Sand 30 596
Sand 20 450 Clay 8 604
Clay 20 470 Clay, sand, and rocks 23 627
Sand 20 490 Shale and clay, hard 13 640
Clay 95 585 Sand 30 670
Sand 35 620 Shale, hard, and strips 21 691
Sand 13 704
Well RR-83-34-106Shale, hard 17 721
Owner: Edward SchubertDriller: Ace Water Well Drilling Co. Sand and shale strips 33 754
Soil, surface 4 4 Shale and sand strips 18 772
Caliche 16 120 Sand and shale strips 31 803
Sand, salty water 10 130 Shale, hard 8 811
Caliche, sandy 95 225Well RR-83-34-305
Shale 305 530Owner: King Ranch, Inc.
Sand, red 46 576 Driller: Carl Vickers Water Well Service
Soil, surface 5 5
Well RR-83-34-209Sand 10 15
Owner: U.S. Naval Auxiliary Air StationDriller: Katy Drilling Co. Clay 83 98
Soil, surface, and clay 40 40 Sand 18 116
Clay, soft 128 168 Shale 13 129
Lime rock 2 170 Sand 59 188
Clay, hard, and rocks 93 263 Shale 59 247
Sand, rocks 15 278 Sand 28 275
Clay, sand strips, Shale 38 313
and rock 48 326Sand 14 327
Sand, rocky 20 346Shale 21 348
Clay, hard 38 384Sand 41 389
Sand 8 392Shale 40 429
Clay and sandstrips 25 417 Sand 12 441
Sand 11 428 Shale 15 456
Clay 7 Sand 18 474
Shale, sandy 9 444 Shale 49 523
Clay 43 487 Sand 15 538
Clay, soft 23 510 Shale 6 544
Sand, rocky 17 527 Sand 65 609
-138.
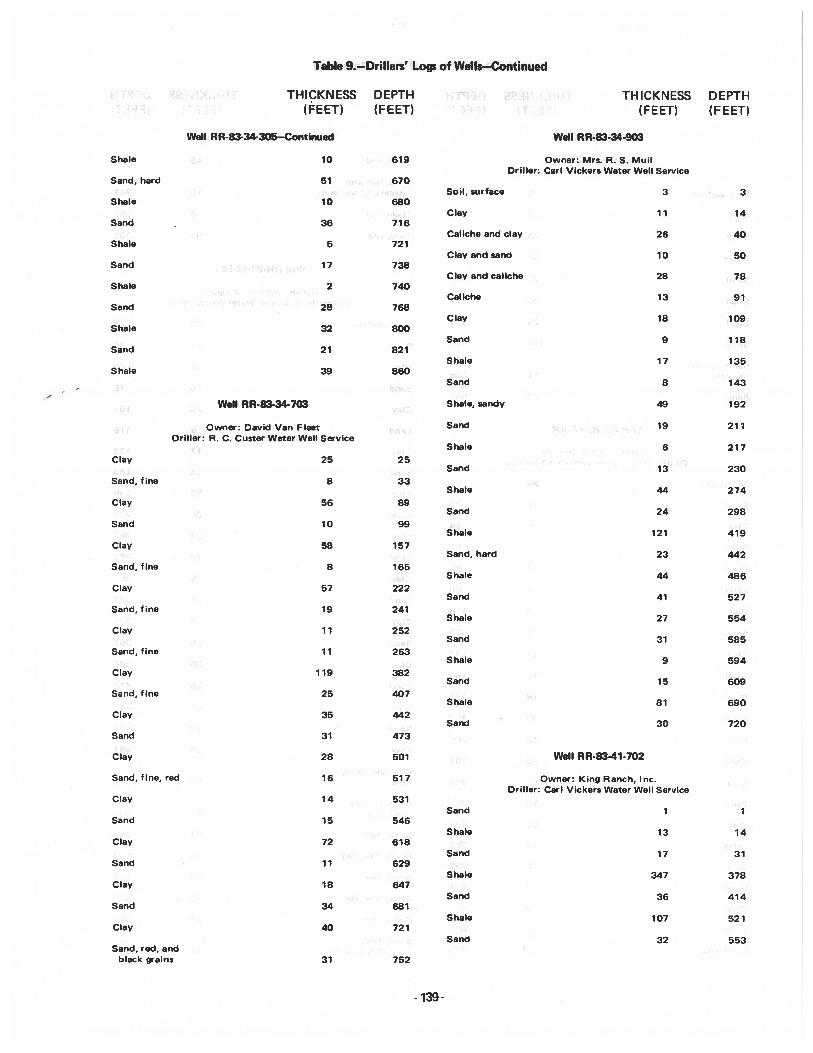
Table 9.—Drillers’ Logs of Wells—Continued
THICKNESS DEPTH THICKNESS DEPTH(FEET) (FEET) (FEET) (FEET)
Well RR-83-34-305—Continued Well RR-83-34-903
Shale 10 619 Owner: Mrs. R. S. MuilDriller: Carl Vickers Water Well Service
Sand, hard 51 670Soil, surface 3 3
Shale 10 680Clay 11 14
Sand 36 716Caliche and clay 26 40
Shale 5 721Clay and sand 10 50
Sand 17 738Clay and caliche 28 78
Shale 2 740Caliche 13 91
Sand 28 768Clay 18 109
Shale 32 800Sand 9 118
Sand 21 821Shale 17 135
Shale 39 860Sand 8 143
Well RR-83.34-703 Shale, sandy 49 192
Owner: David Van Fleet Sand 19 211Driller: A. C. Custer Water Well Service
Shale 6 217Clay 25 25
Sand 13 230Sand, fine 8 33
Shale 44 274Clay 56 89
Sand 24 298Sand 10 99
Shale 121 419Clay 58 157
Sand, hard 23 442Sand, fine 8 165
Shale 44 486Clay 57 222
Sand 41 527Sand, fine 19 241
Shale 27 554Clay 11 252
Sand 31 585Sand, fine 11 263
Shale 9 594Clay 119 382
Sand 15 609Sand,fine 25 407
Shale 81 690Clay 35 442
Sand 30 720Sand 31 473
Clay 28 501 Well RR.83-41.702
Sand, fine, red 16 517 Owner: King Ranch, Inc.Driller: Carl Vickers Water Well Service
Clay 14 531Sand 1 1
Sand 15 546Shale 13 14
Clay 72 618Sand 17 31
Sand 11 629Shale 347 378
Clay 18 647Sand 36 414
Sand 34 681Shale 107 521
Clay 40 721Sand 32 553
Sand, red, andblack grains 31 752
-139-
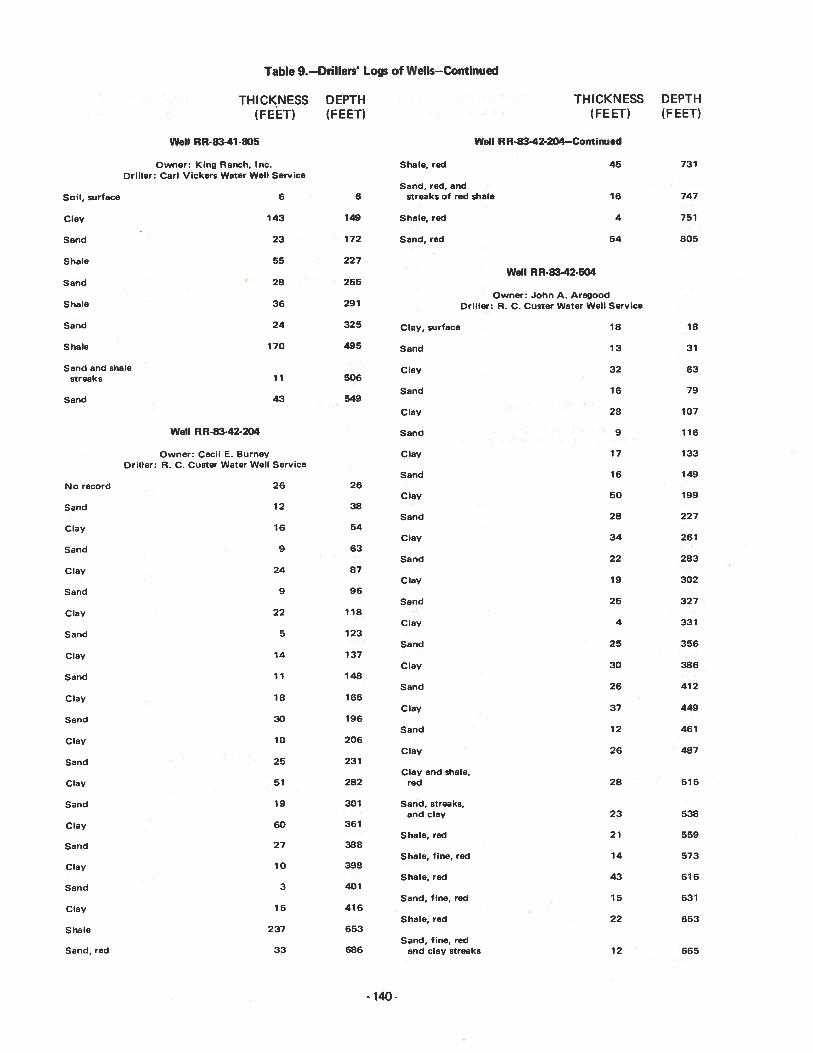
Table 9.—Drillers’ Logs of Wells—Continued
THICKNESS DEPTH THICKNESS DEPTH(FEET) (FEET) (FEET) (FEET)
Well RR-83-41-805 Well RR-83-42-204--Continued
Owner: King Ranch, Inc. Shale, red 45 731Driller: Carl Vickers Water Well Service
Sand, red, andSoil, surface 6 6 streaks of red shale 16 747
Clay 143 149 Shale, red 4 751
Sand 23 172 Sand, red 54 805
Shale 55 227Well RR-83.42.504
Sand 28 255
Owner: John A. AregoodShale 36 291 Driller: R. C. Custer Water Well Service
Sand 24 325 Clay, surface 18 18
Shale 170 495 Sand 13 31
Sand and shale Clay 32 63streaks 11 506
Sand 16 79Sand 43 549
Clay 28 107
Well RR8342204 Sand 9 116
Owner: Cecil E. Burney Clay 17 133Driller: R. C. Custer Water Well Service
Sand 16 149No record 26 26
Clay 50 199Sand 12 38
Sand 28 227Clay 16 54
Clay 34 261
Sand 9 63Sand 22 283
Clay 24 87Clay 19 302
Sand 9 96Sand 25 327
Clay 22 118Clay 4 331
Sand 5 123Sand 25 356
Clay 14 137Clay 30 386
Sand 11 148Sand 26 412
Clay 18 166Clay 37 449
Sand 30 196Sand 12 461
Clay 10 206Clay 26 487
Sand 25 231Clay and shale,
Clay 51 282 red 28 515
Sand 19 301 Sand, streaks,and clay 23 538
Clay 60 361Shale, red 21 559
Sand 27 388Shale, fine, red 14 573
Clay 10 398Shale, red 43 616
Sand 3 401Sand, fine, red 15 631
Clay 15 416Shale, red 22 653
Shale 237 653Sand, fine, red
Sand, red 33 686 and clay streaks 12 665
-140-
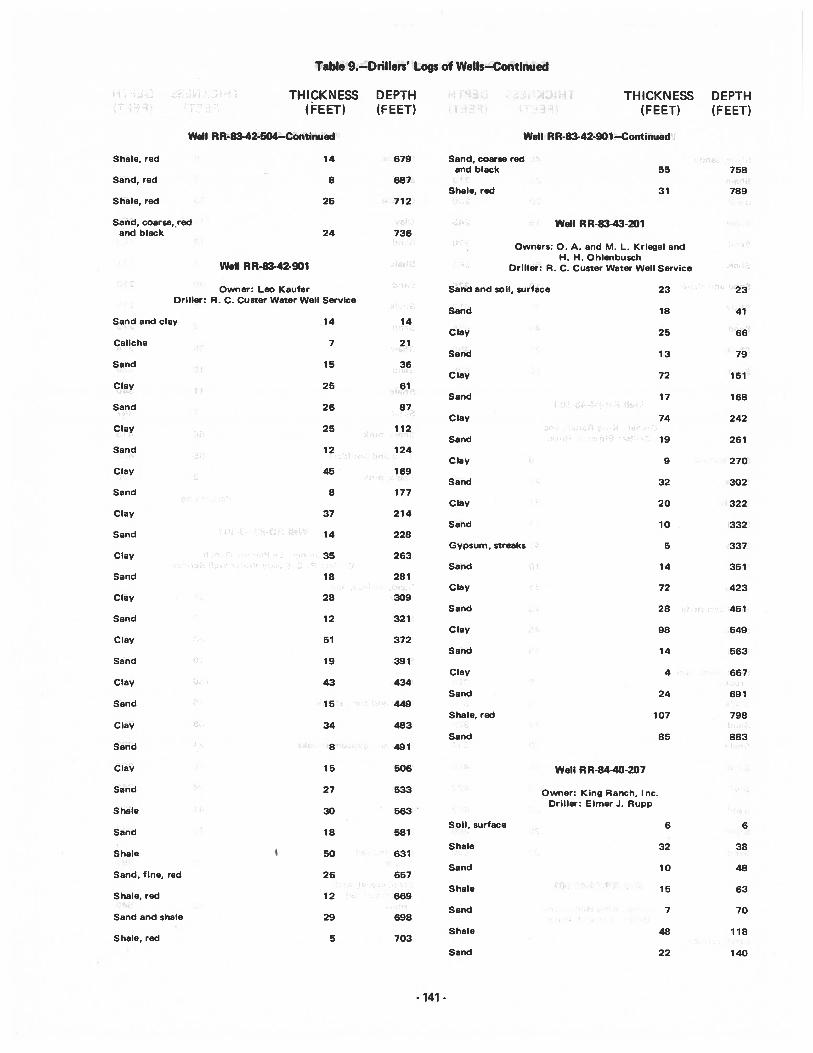
Table 9.—Drillers’ Logs of Wells—Continued
THICKNESS DEPTH THICKNESS DEPTH(FEET) (FEET) (FEET) (FEET)
Well RR-83-42-504—Contmued Well RR-83-42-901 -Continued
Shale, red 14 679 Sand, coarse redand black 55 758
Sand, red 8 687Shale, red 31 789
Shale, red 25 712
Sand, coarse, red Well RR-83-43-201and black 24 736
Owners: 0. A. and M. L. Kriegel andH. H. Ohlenbusch
Well RR-83-42-901 Driller: R. C. Custer Water Well Service
Owner: Leo Kaufer Sand and soil, surface 23 23Driller: R. C. Custer Water Well Service
Sand 18 41Sand and clay 14 14
Clay 25 66Caliche 7 21
Sand 13 79Sand 15 36
Clay 72 151Clay 25 61
Sand 17 168Sand 26 87
Clay 74 242Clay 25 112
Sand 19 261Sand 12 124
Clay 9 270Clay 45 169
Sand 32 302Sand 8 177
Clay 20 322Clay 37 214
Sand 10 332Sand 14 228
Gypsum, streaks 5 337Clay 35 263
Sand 14 351Sand 18 281
Clay 72 423Clay 28 309
Sand 28 451Sand 12 321
Clay 98 549Clay 51 372
Sand 14 563Sand 19 391
Clay 4 667Clay 43 434
Sand 24 691Sand 15 449
Shale, red 107 798Clay 34 483
Sand 85 883Sand 8 491
Clay 15 506 Well RR-84-40-207
Sand 27 533 Owner: KingRanch, Inc.Driller: Elmer J. Rupp
Shale 30 563
Soil, surface 6 6Sand 18 581
Shale 32 38Shale 50 631
Sand 10 48Sand, fine, red 26 657
Shale 15 63Shale, red 12 669
Sand 7 70Sand and shale 29 698
Shale 48 118Shale, red 5 703
Sand 22 140
141-
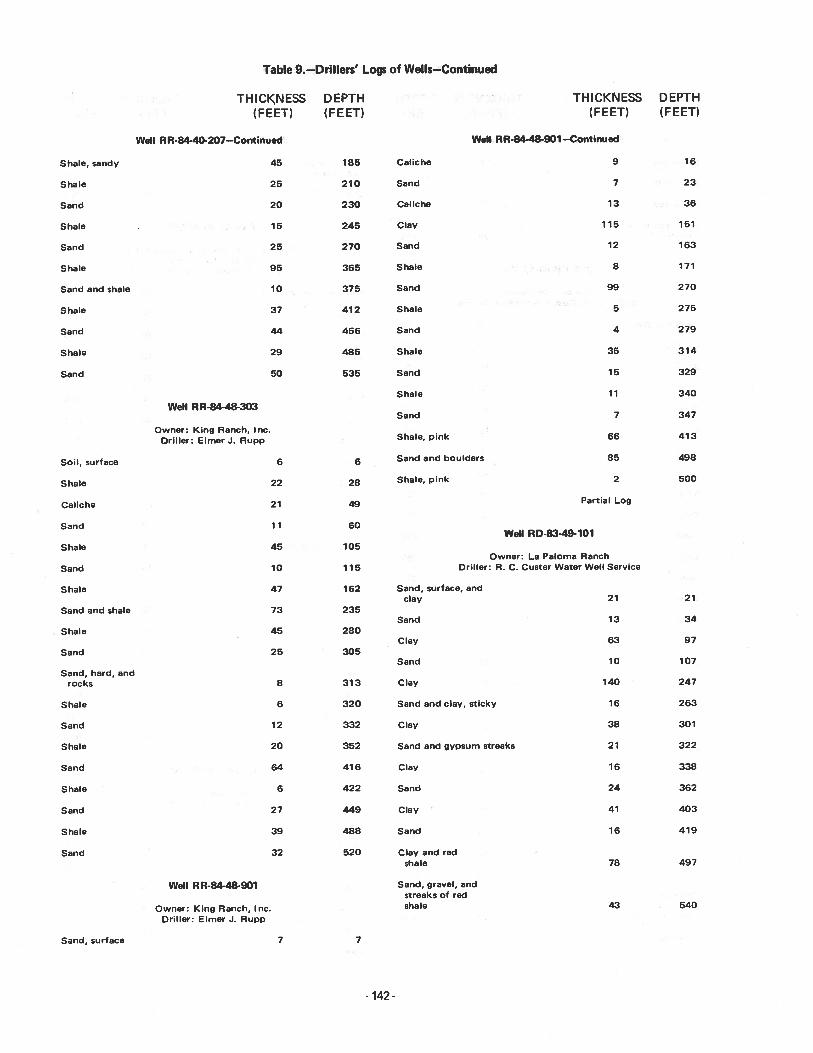
Table 9.—Drillers’ Logs of Wells—Continued
THICKNESS DEPTH THICKNESS DEPTH(FEET) (FEET) (FEET) (FEET)
Well RR-84-40-207—Continued Well RR-8448-901—Continued
Shale, sandy 45 185 Caliche 9 16
Shale 25 210 Sand 7 23
Sand 20 230 Caliche 13 36
Shale 15 245 Clay 115 151
Sand 25 270 Sand 12 163
Shale 95 365 Shale 8 171
Sand and shale 10 375 Sand 99 270
Shale 37 412 Shale 5 275
Sand 44 456 Sand 4 279
Shale 29 485 Shale 35 314
Sand 50 535 Sand 15 329
Shale 11 340
Well RR-84-48-303Sand 7 347
Owner: King Ranch, Inc.Driller: Elmer J. Rupp Shale, pink 66 413
Soil, surface 6 6 Sand and boulders 85 498
Shale 22 28 Shale, pink 2 500
Caliche 21 49 Partial Log
Sand 11 60Well RD-83-49-1O1
Shale 45 105Owner: La Paloma Ranch
Sand 10 115 Driller: R. C. Custer Water Well Service
Shale 47 162 Sand, surface, andclay 21 21
Sand and shale 73 235Sand 13 34
Shale 45 280Clay 63 97
Sand 25 305Sand 10 107
Sand, hard, androcks 8 313 Clay 140 247
Shale 6 320 Sand and clay, sticky 16 263
Sand 12 332 Clay 38 301
Shale 20 352 Sand and gypsum streaks 21 322
Sand 64 416 Clay 16 338
Shale 6 422 Sand 24 362
Sand 27 449 Clay 41 403
Shale 39 488 Sand 16 419
Sand 32 520 Clay and redshale 78 497
Well RR-84-48-901 Sand, gravel, andstreaks of red
Owner: King Ranch, Inc. shale 43 540
Driller: Elmer J. Rupp
Sand, surface 7 7
-142-
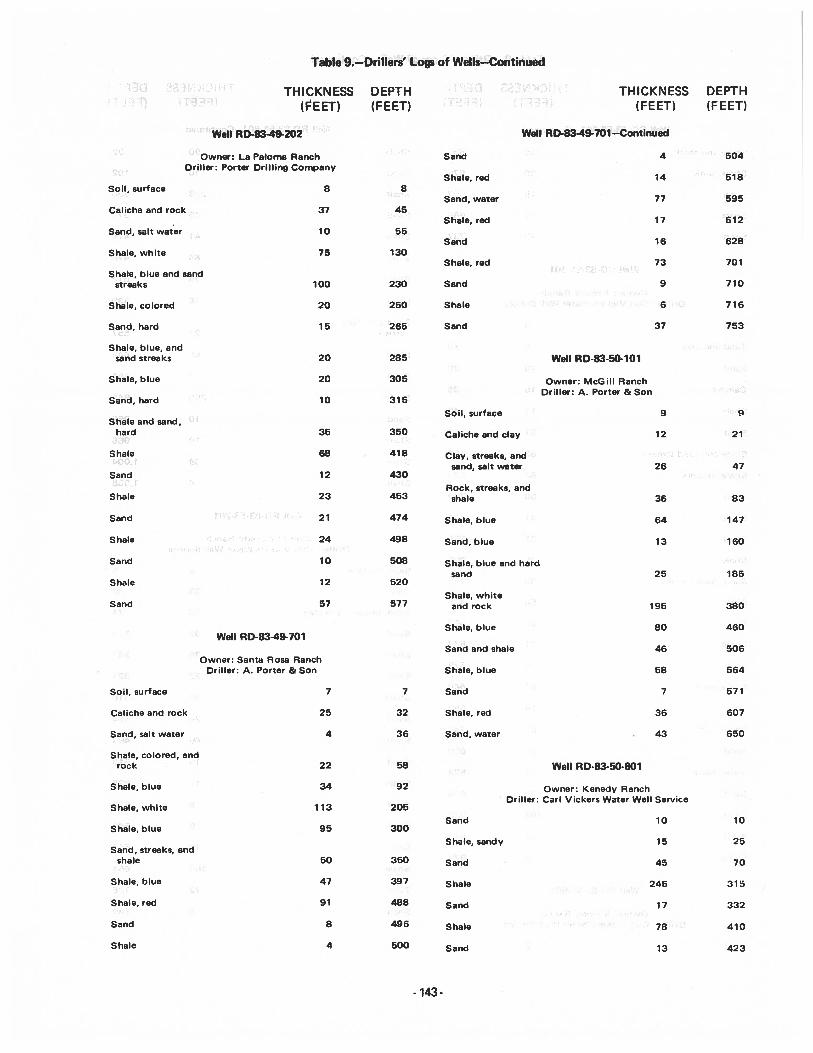
Table 9.—Drillers’ Logs of Wells—Continued
THICKNESS DEPTH THICKNESS DEPTH(FEET) (FEET) (FEET) (FEET)
Well RD83-49-202 Well RD-83-49-701—Continued
Owner: La Paloma Ranch Sand 4 504Driller: Porter Drilling Company
Shale, red 14 518Soil, surface 8 8
Sand, water 77 595Caliche and rock 37 45
Shale, red 17 612Sand, salt water 10 55
Sand 16 628Shale, white 75 130
Shale, red 73 701Shale, blue and sand
streaks 100 230 Sand 9 710
Shale, colored 20 250 Shale 6 716
Sand, hard 15 265 Sand 37 753
Shale, blue, andsand streaks 20 285 Well RD-83-50-1O1
Shale, blue 20 305 Owner: McGill RanchDriller: A. Porter & Son
Sand, hard 10 315
Soil, surface 9 9S hale and sand,
hard 35 350 Caliche and clay 12 21
Shale 68 418 Clay, streaks, andsand, salt water 26 47
Sand 12 430
Rock, streaks, andShale 23 453 shale 36 83
Sand 21 474 Shale, blue 64 147
Shale 24 498 Sand, blue 13 160
Sand 10 508 Shale, blue and hardsand 25 185
Shale 12 520
Shale, whiteSand 57 and rock 195 380
Shale, blue 80 460Well RD.83-49-701
Sand and shale 46 506Owner: Santa Rosa Ranch
Driller: A. Porter & Son Shale, blue 58 564
Soil, surface 7 7 Sand 7 571
Caliche and rock 25 32 Shale, red 36 607
Sand, salt water 4 36 Sand, water 43 650
Shale, colored, androck 22 58 Well RD-83-50-801
Shale, blue 34 92 Owner: Kenedy RanchDriller: Carl Vickers Water Well Service
Shale, white 113 205
Sand 10 10Shale, blue 95 300
Shale, sandy 15 25Sand, streaks, and
shale 50 350 Sand 45 70
Shale, blue 47 397 Shale 245 315
Shale, red 91 488 Sand 17 332
Sand 8 496 Shale 78 410
Shale 4 500 Sand 13 423
143-
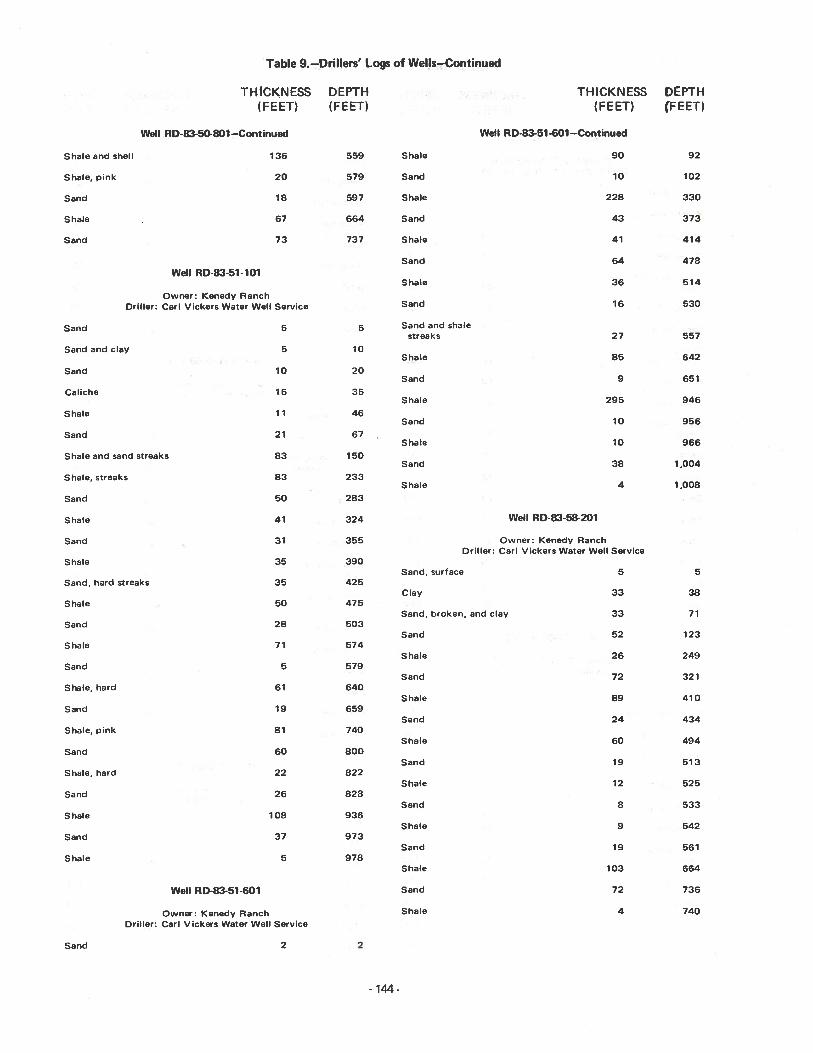
Table 9.—Drillers’ Logs of Wells—Continued
THICKNESS DEPTH THICKNESS DEPTH(FEET) (FEET) (FEET) (FEET)
Well RD-83-50.801—Continued Well RD-83-51-60l—Continued
Shale and shell 136 559 Shale 90 92
Shale, pink 20 579 Sand 10 102
Sand 18 597 Shale 228 330
Shale 67 664 Sand 43 373
Sand 73 737 Shale 41 414
Sand 64 478Well RD-83-51-1O1
Shale 36 514
Owner: Kenedy RanchDriller: Carl Vickers Water Well Service Sand 16 530
Sand 5 Sand and shalestreaks 27 557
Sand and clay 5 10Shale 85 642
Sand 10 20Sand 9 651
Caliche 15 35Shale 295 946
Shale 11 46Sand 10 956
Sand 21 67Shale 10 966
Shale and sand streaks 83 150Sand 38 1,004
Shale, streaks 83 233Shale 4 1,008
Sand 50 283
Shale 41 324 Well RD-83-58-201
Sand 31 355 Owner: Kenedy RanchDriller: Carl Vickers Water Well Service
Shale 35 390Sand, surface 5 5
Sand, hard streaks 35 425Clay 33 38
Shale 50 475Sand, broken, and clay 33 71
Sand 28 503Sand 52 123
Shale 71 574Shale 26 249
Sand 5 579Sand 72 321
Shale, hard 61 640Shale 89 410
Sand 19 659Sand 24 434
Shale, pink 81 740Shale 60 494
Sand 60 800Sand 19 513
Shale, hard 22 822Shale 12 525
Sand 26 828Sand 8 533
Shale 108 936Shale 9 542
Sand 37 973Sand 19 561
Shale 5 978Shale 103 664
Well RO-83-51-601 Sand 72 736
Owner: Kenedy Ranch Shale 4 740
Driller: Carl Vickers Water Well Service
Sand 2 2
-144-
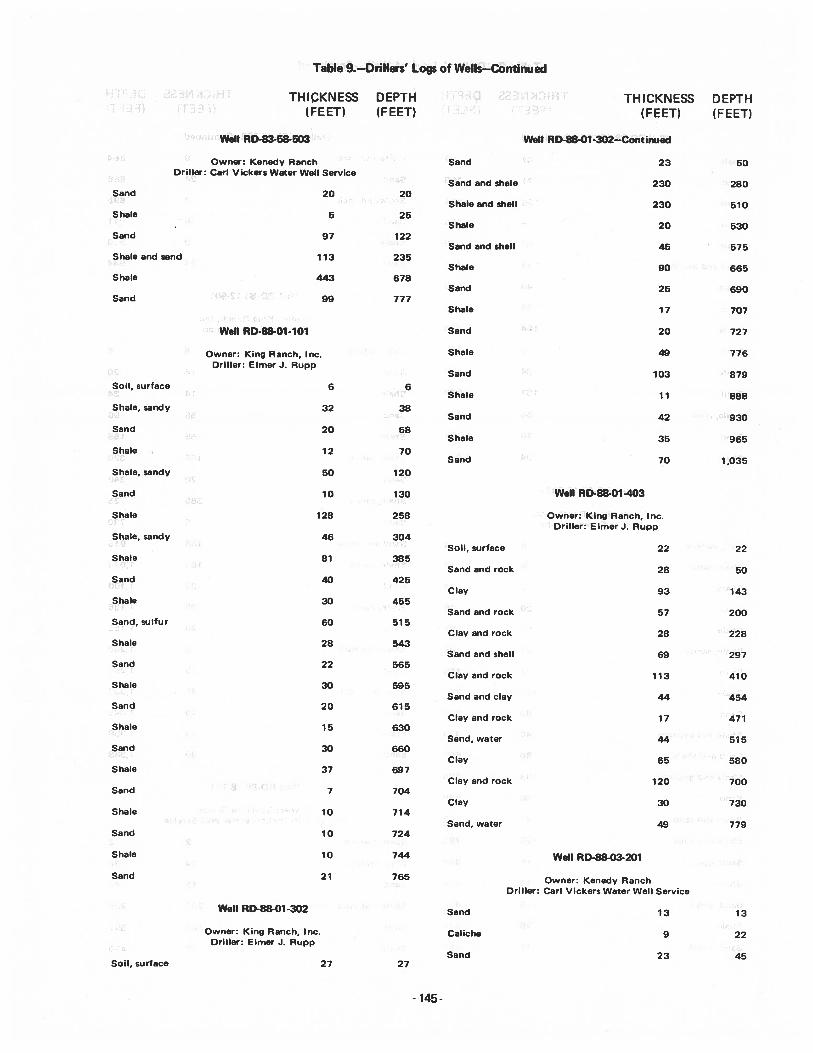
Table 9.—Drillers’ Logs of Wells—Continued
THIcKNESS DEPTH THICKNESS DEPTH(FEET) (FEET) (FEET) (FEET)
Well RD83-58-503 Well RD-88-O1-302—Continued
Owner: Kenedy Ranch Sand 23 50Driller: Carl Vickers Water Well Service
Sand and shale 230 280Sand 20 20
Shale and shell 230 510Shale 5 25
Shale 20 530Sand 97 122
Sand and shell 45 575Shale and sand 113 235
Shale 90 665Shale 443 678
Sand 25 690Sand 99 777
Shale 17 707
Well RD-88-O1-1O1 Sand 20 727
Owner: King Ranch, Inc. Shale 49 776Driller: Elmer J. Rupp
Sand 103 879Soil, surface 6 6
Shale 11 888Shale, sandy 32 38
Sand 42 930Sand 20 58
Shale 35 965Shale 12 70
Sand 70 1,035Shale, sandy 50 120
Sand 10 130 Well RD-88-O1-403
Shale 128 258 Owner: King Ranch, Inc.Driller: Elmer J. Rupp
Shale, sandy 46 304Soil, surface 22 22
Shale 81 385Sand and rock 28 50
Sand 40 425Clay 93 143
Shale 30 455Sand and rock 57 200
Sand, sulfur 60 515Clay and rock 28 228
Shale 28 543Sand and shell 69 297
Sand 22 565Clayandrock 113 410
Shale 30 595Sand and clay 44 454
Sand 20 615Clay and rock 17 471
Shale 15 630Sand, water 44 515
Sand 30 660Clay 65 580
Shale 37 697Clay and rock 120 700
Sand 7 704Clay 30 730
Shale 10 714Sand, water 49 779
Sand 10 724
Shale 10 744 Well RD-88-03-201
Sand 21 765 Owner: Kenedy RanchDriller: Carl Vickers Water Well Service
Well RD-88-O1-302 Sand 13 13
Owner: King Ranch, Inc. Caliche 9 22Driller: Elmer J. Rupp
Sand 23 45Soil, surface 27 27
145-
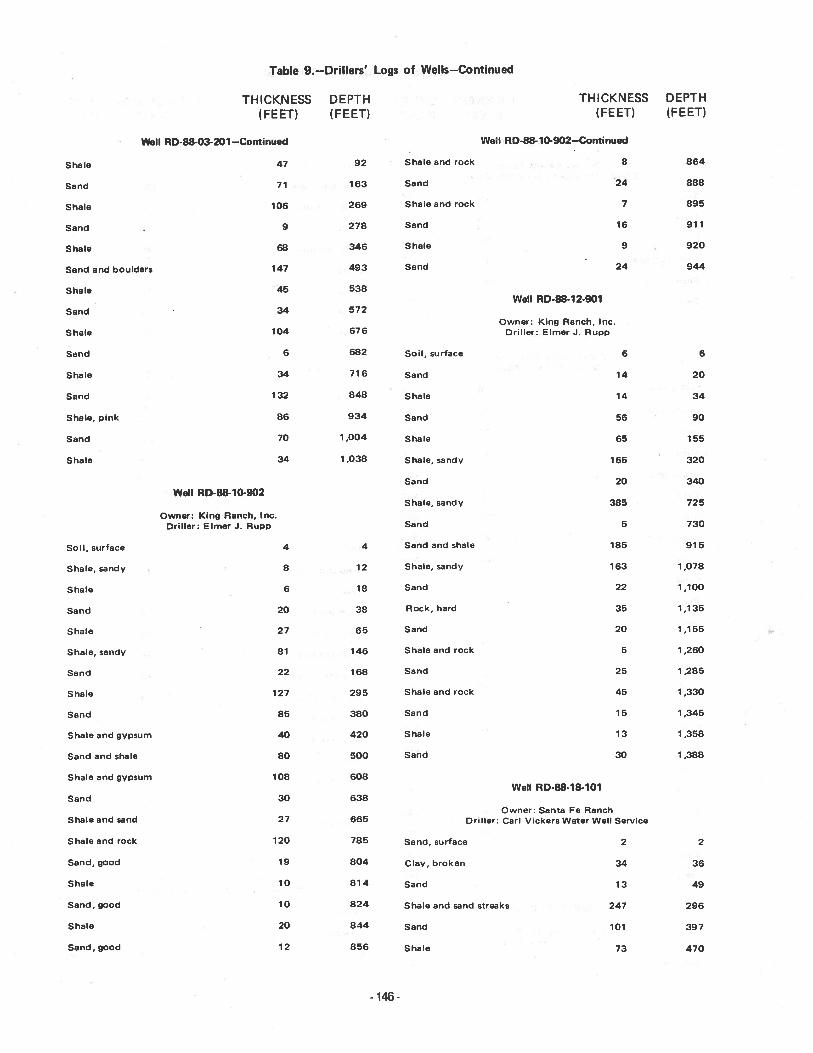
Table 9.—Drillers’ Logs of Wells—Continued
THICKNESS DEPTH THICKNESS DEPTH(FEET) (FEET) (FEET) (FEET)
Well RD-88-03-201 —Continued Well RD-88-1O-902—Continued
Shale 47 92 Shale and rock 8 864
Sand 71 163 Sand 24 888
Shale 106 269 Shale and rock 7 895
Sand 9 278 Sand 16 911
Shale 68 346 Shale 9 920
Sand and boulders 147 493 Sand 24 944
Shale 45 538Well RD-88-12-901
Sand 34 572Owner: King Ranch, Inc.
Shale 104 676 Driller: Elmer J. Rupp
Sand 6 682 Soil, surface 6 6
Shale 34 716 Sand 14 20
Sand 132 848 Shale 14 34
Shale, pink 86 934 Sand 56 90
Sand 70 1,004 Shale 65 155
Shale 34 1,038 Shale, sandy 165 320
Sand 20 340Well RD-88-1O-902
Shale, sandy 385 725
Owner: King Ranch, Inc.Driller: Elmer J. Rupp Sand 5 730
Soil, surface 4 4 Sand and shale 185 915
Shale, sandy 8 12 Shale, sandy 163 1,078
Shale 6 18 Sand 22 1,100
Sand 20 38 Rock, hard 35 1,135
Shale 27 65 Sand 20 1,155
Shale, sandy 81 146 Shale and rock 5 1,260
Sand 22 168 Sand 25 1,285
Shale 127 295 Shaleand rock 45 1,330
Sand 85 380 Sand 15 1,345
Shaleandgypsum 40 420 Shale 13 1,358
Sand and shale 80 500 Sand 30 1,388
Shaleandgypsum 108 608Well RD-88-18.1O1
Sand 30 638Owner: Santa Fe Ranch
Shale and sand 27 665 Driller: Carl Vickers Water Well Service
Shale and rock 120 785 Sand, surface 2 2
Sand, good 19 804 Clay, broken 34 36
Shale 10 814 Sand 13 49
Sand, good 10 824 Shale and sand streaks 247 296
Shale 20 844 Sand 101 397
Sand,good 12 856 Shale 73 470
-146-
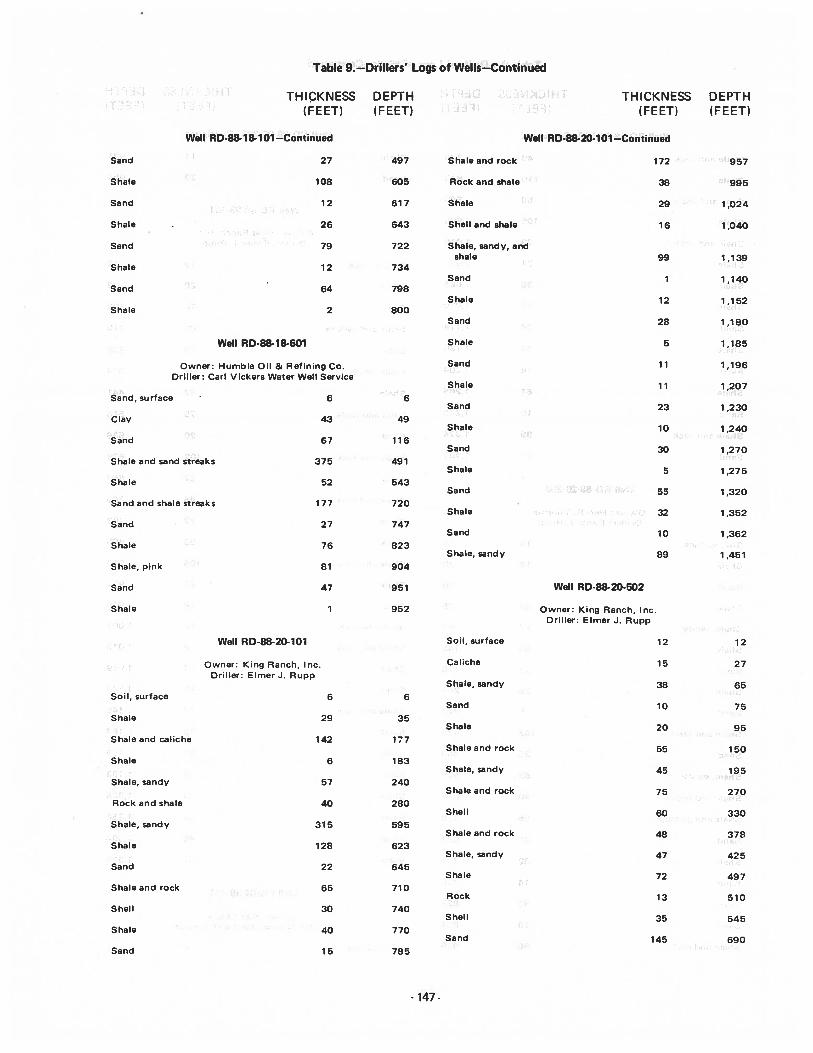
Table 9.—Drillers’ Logs of Wells—Continued
THIcKNESS DEPTH THICKNESS DEPTH(FEET) (FEET) (FEET) (FEET)
Well RD-88-18-1O1 —Continued Well RD-88-20-1O1 —Continued
Sand 27 497 Shaleand rock 172 957
Shale 108 605 Rock and shale 38 995
Sand 12 617 Shale 29 1,024
Shale 26 643 Shell and shale 16 1,040
Sand 79 722 Shale, sandy, andshale 99 1,139
Shale 12 734Sand 1 1,140
Sand 64 798Shale 12 1,152
Shale 2 800Sand 28 1,180
Well RD-88-18-601 Shale 5 1 .185
Owner: Humble Oil & Refining Co. Sand 11 1,196Driller: Carl Vickers Water Well Service
Shale 11 1,207Sand, surface 6 6
Sand 23 1,230Clay 43 49
Shale 10 1,240Sand 67 116
Sand 30 1,270Shale and sand streaks 375 491
Shale 5 1,275Shale 52 543
Sand 55 1,320Sand and shale streaks 177 720
Shale 32 1,352Sand 27 747
Sand 10 1,362Shale 76 823
Shale,sandy 89 1,451Shale, pink 81 904
Sand 47 951 Well RD-88-20-502
Shale 1 952 Owner: King Ranch, Inc.Driller: Elmer J. Rupp
Well RD-88-20-1O1 Soil, surface 12 12
Owner: King Ranch, Inc. Caliche 15 27Driller: Elmer J. Rupp
Shale, sandy 38 65Soil, surface 6 6
Sand 10 75Shale 29 35
Shale 20 95Shale and caliche 142 177
Shale and rock 55 150Shale 6 183
Shale, sandy 45 195Shale, sandy 57 240
Shale and rock 75 270Rock and shale 40 280
Shell 60 330Shale, sandy 315 595
Shaleandrock 48 378Shale 128 623
Shale, sandy 47 425Sand 22 645
Shale 72 497Shale and rock 65 710
Rock 13 510Shell 30 740
Shell 35 545Shale 40 770
Sand 145 690Sand 15 785
-147-
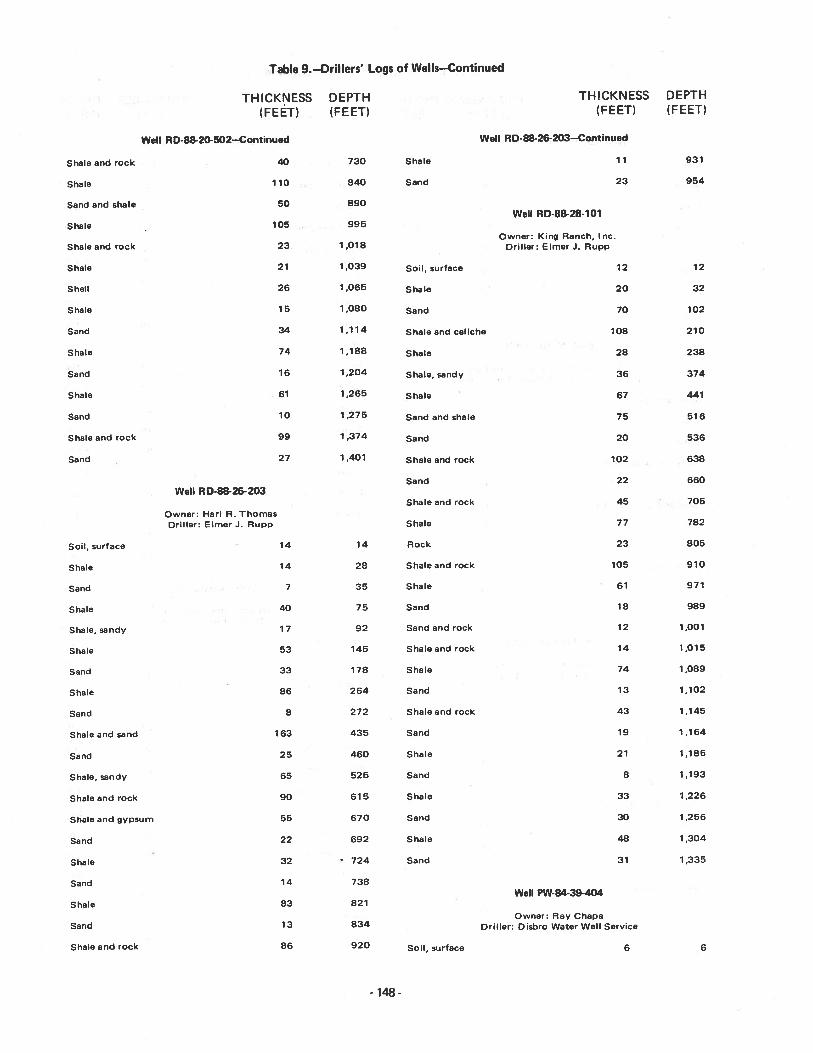
Table 9.—Drillers’ Logs of Wells—Continued
THICKNESS DEPTH THICKNESS DEPTH
(FEET) (FEET) (FEET) (FEET)
Well RD-88-20-502—Continued Well RD-88-26-203—Continued
Shale and rock 40 730 Shale 11 931
Shale 110 840 Sand 23 954
Sand and shale 50 890Well RD-88-2B-1O1
Shale 105 995Owner: King Ranch, Inc.
Shale and rock 23 1,018 Driller: Elmer J. Rupp
Shale 21 1,039 Soil, surface 12 12
Shell 26 1,065 Shale 20 32
Shale 15 1,080 Sand 70 102
Sand 34 1,114 Shale and caliche 108 210
Shale 74 1,188 Shale 28 238
Sand 16 1,204 Shale, sandy 36 374
Shale 61 1,265 Shale 67 441
Sand 10 1,275 Sandandshale 75 516
Shaleand rock 99 1,374 Sand 20 536
Sand 27 1,401 Shaleand rock 102 638
Sand 22 660Well RD-88-26-203
Shale and rock 45 705
Owner: Harl A. ThomasDriller: Elmer J. Rupp Shale 77 782
Soil, surface 14 14 Rock 23 805
Shale 14 28 Shale and rock 105 910
Sand 7 35 Shale 61 971
Shale 40 75 Sand 18 989
Shale,sandy 17 92 Sandandrock 12 1,001
Shale 53 145 Shale and rock 14 1,015
Sand 33 178 Shale 74 1,089
Shale 86 264 Sand 13 1,102
Sand 8 272 Shaleand rock 43 1,145
Shaleand sand 163 435 Sand 19 1,164
Sand 25 460 Shale 21 1,185
Shale, sandy 65 525 Sand 8 1,193
Shale and rock 90 615 Shale 33 1,226
Shale and gypsum 55 670 Sand 30 1 .256
Sand 22 692 Shale 48 1,304
Shale 32 724 Sand 31 1,335
Sand 14 738Well PW-84-39-404
Shale 83 821
Owner: Ray ChapaSand 13 834 Driller: Disbro Water Well Service
Shale and rock 86 920 Soil, surface 6 6
-148-
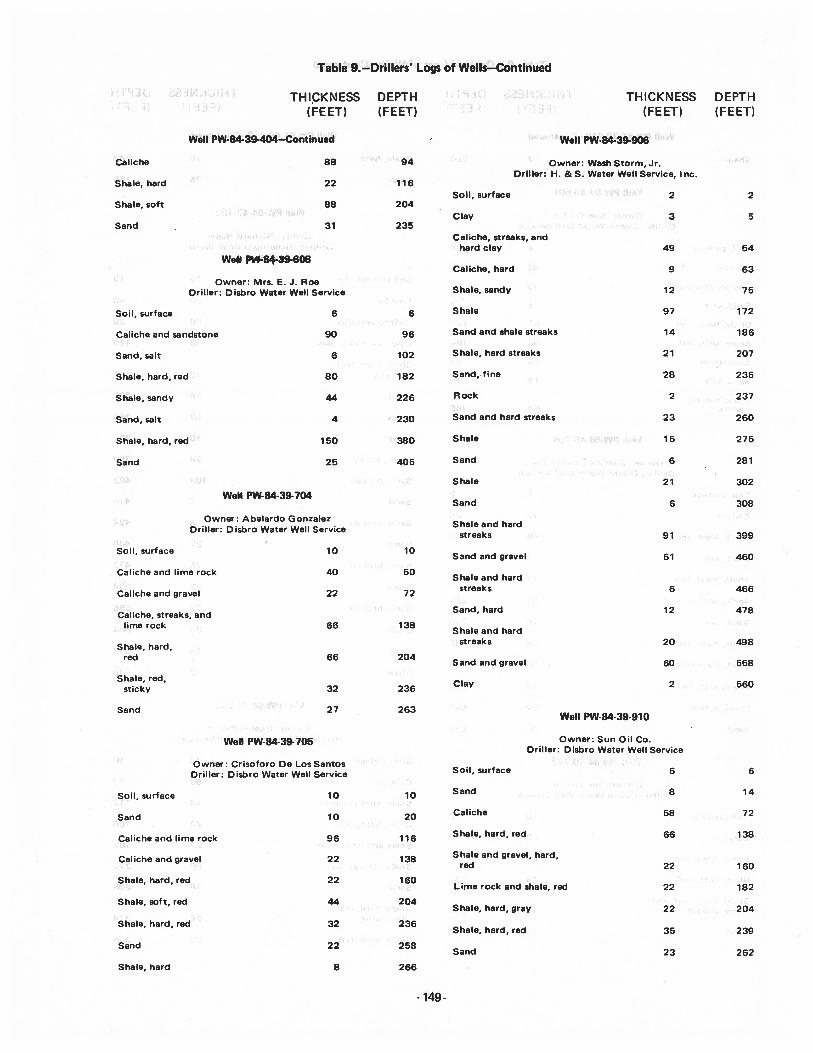
Table 9.—Drillers’ Logs of Wells—Continued
THICKNESS DEPTH THICKNESS DEPTH(FEET) (FEET) (FEET) (FEET)
Well PW-84-39-404—Continued - Well PW-84-39-906
Caliche 88 94 Owner: Wash Storm, Jr.Driller: H. & S. Water Well Service, Inc.
Shale, hard 22 116Soil, surface 2 2
Shale, soft 88 204Clay 3 5
Sand 31 235Caliche, streaks, and
hard clay 49 54Well PW-84-39-606
Cal iche, hard 9 63
Owner: Mrs. E. J. RoeDriller: Disbro Water Well Service Shale, sandy 12 75
Soil, surface 6 6 Shale 97 172
Caliche and sandstone 90 96 Sand and shale streaks 14 186
Sand, salt 6 102 Shale, hard streaks 21 207
Shale, hard, red 80 182 Sandfine 28 235
Shale, sandy 44 226 Rock 2 237
Sand, salt 4 230 Sand and hard streaks 23 260
Shale, hard, red 150 380 Shale 15 275
Sand 25 405 Sand 6 281
Shale 21 302
Well PW-84-39-704Sand 6 308
Owner: Abelardo GonzalezDriller: Disbro Water Well Service
Shale and hardstreaks 91 399
Soil, surface 10 10Sand and gravel 61 460
Caliche and lime rock 40 50Shale and hard
Caliche and gravel 22 72streaks 6 466
Caliche, streaks, andSand, hard 12 478
lime rock 66 138Shale and hard
Shale, hard,streaks 20 498
red 66 204Sand and gravel 60 558
Shale, red,sticky 32 236 Clay 2 560
Sand 27 263Well PW-84-39-910
Well PW-84-39-705 Owner: Sun Oil Co.Driller: Disbro Water Well Service
Owner: Crisoforo De Los SantosDriller: Disbro Water Well Service Soil, surface 6 6
Soil, surface 10 10 Sand 8 14
Sand 10 20 Caliche 58 72
Caliche and lime rock 96 116 Shale, hard, red 66 138
Caliche and gravel 22 138 Shale and gravel, hard,red 22 160
Shale, hard, red 22 160Lime rock and shale, red 22 182
Shale, soft, red 44 204Shale, hard, gray 22 204
Shale, hard, red 32 236Shale, hard, red 35 239
Sand 22 258Sand 23 262
Shale, hard 8 266
-149-
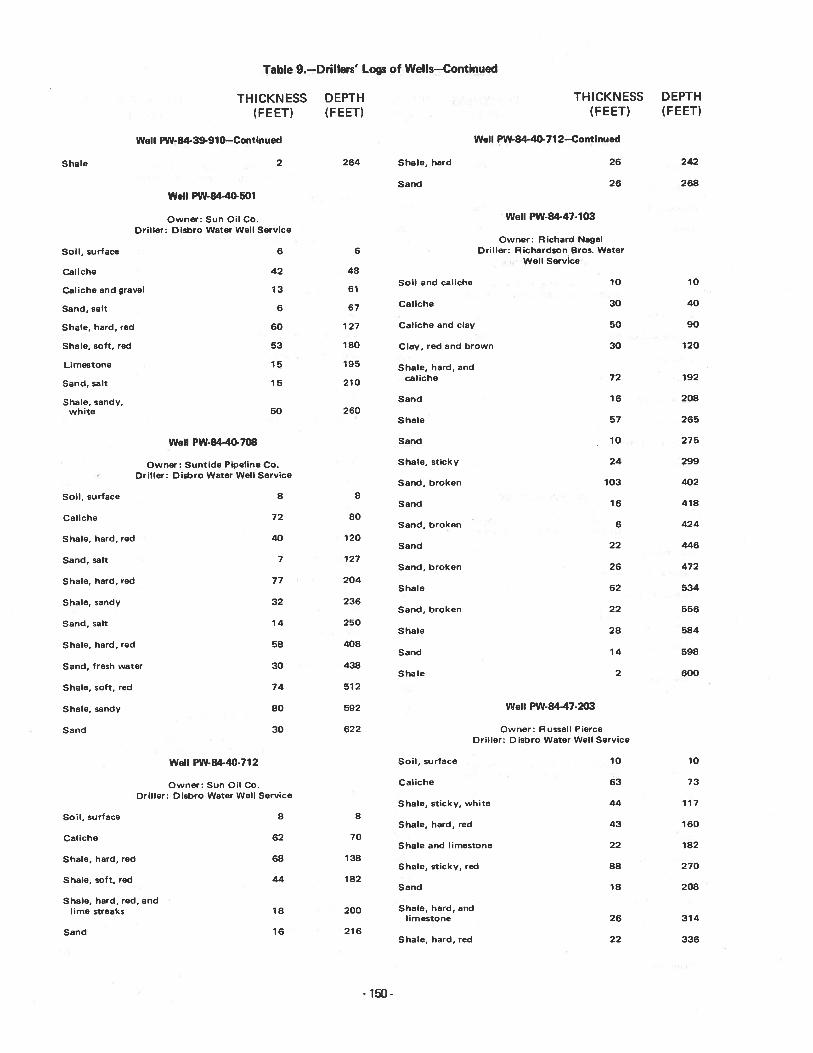
Table 9.—Drillers’ Logs of Wells—Continued
THICKNESS DEPTH THICKNESS DEPTH(FEET) (FEET) (FEET) (FEET)
Well PW-84-39-910—Continued Well PW-84-40-712—Continued
Shale 2 264 Shale, hard 26 242
Sand 26 268
Well PW-84-40-501
Owner: Sun Oil Co. Well PW-84-47.103
Driller: Disbro Water Well ServiceOwner: Richard Nagel
Soil, surface 6 6 Driller: Richardson Bros. WaterWell Service
Caliche 42 48Soil and caliche 10 10
Caitche and gravel 13 61
Sand, salt 6 67 Caliche 30 40
Shale, hard, red 60 127 Caliche and clay 50 90
Shale, soft, red 53 180 Clay, red and brown 30 120
Limestone 15 195 Shale, hard, and
Sand,salt 15 210 caliche 72 192
Shale, sandy, Sand 16 208
white 50 260Shale 57 265
Well PW-84-40-708 Sand 10 275
Owner: Suntide Pipeline Co. Shale, sticky 24 299
- Driller: Disbro Water Well ServiceSand, broken 103 402
Soil, surface 8 8Sand 16 418
Caliche 72 80Sand, broken 6 424
Shale, hard, red 40 120Sand 22 446
Sand, salt 7 127Sand, broken 26 472
Shale, hard, red 77 204Shale 62 534
Shale, sandy 32 236Sand, broken 22 556
Sand, salt 14 250Shale 28 584
Shale, hard, red 58 408Sand 14 598
Sand, fresh water 30 438Shale 2 600
Shale, soft, red 74 512
Shale, sandy 80 592 Well PW-84-47-203
Sand 30 622 Owner: Russell PierceDriller: Disbro Water Well Service
Well PW-84.40-712 Soil, surface 10 10
Owner: Sun Oil Co. Caliche 63 73
Driller: Disbro Water Well ServiceShale, sticky, white 44 117
Soil, surface 8 8Shale, hard, red 43 160
Caliche 62 70Shale and limestone 22 182
Shale, hard, red 68 138Shale, sticky, red 88 270
Shale, soft, red 44 182Sand 18 208
Shale, hard, red, andlime streaks 18 200 Shale, hard, and
limestone 26 314
Sand 16 216Shale, hard, red 22 336
-150-
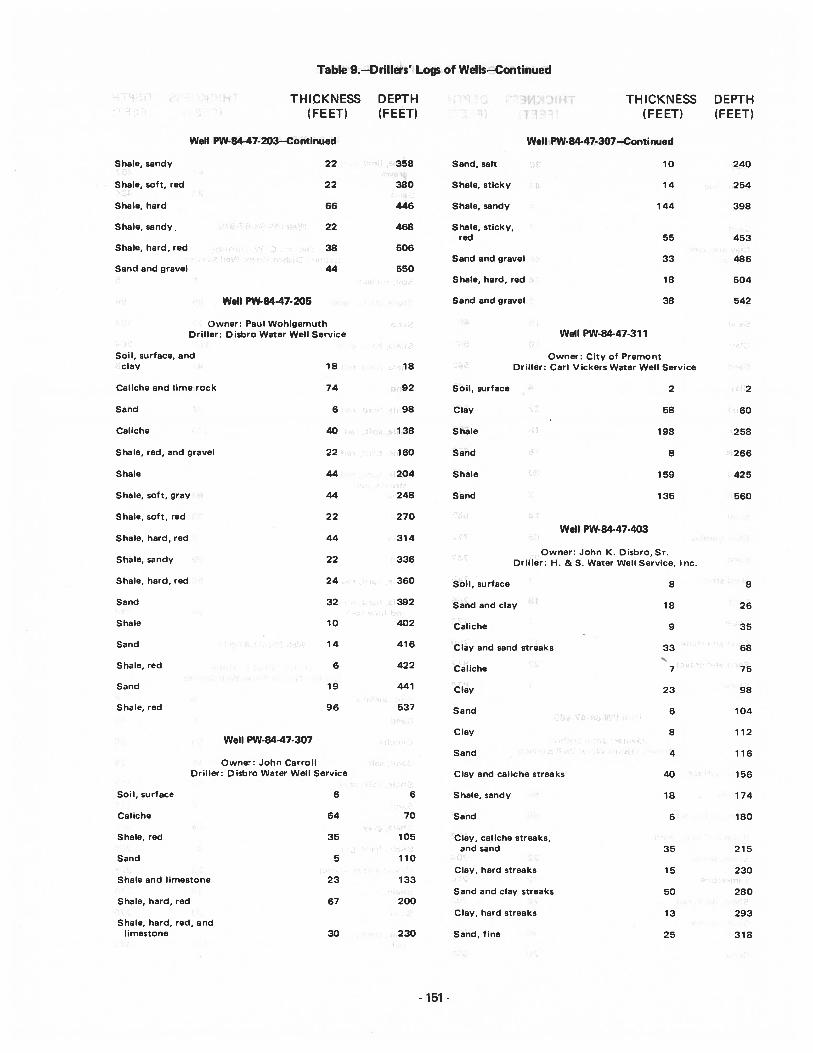
Table 9.—Drillers’ Logs of Wells—CoC
THICKNESS DEPTH , 3$494; THICKNESS DEPTH(FEET) (FEET) ) (FEET) (FEET)
Well PW-84-47-203—Continued Well PW-84-47-307—Continued
Shale, sandy 22 358 Sand, salt 10 240
Shale, soft, red 22 380 Shale, sticky 14 254
Shale, hard 66 446 Shale, sandy 144 398
Shale, sandy. 22 468 Shale, sticky,red 55 453
Shale, hard, red 38 506Sand and gravel 33 486
Sand and gravel 44 550Shale, hard, red 18 504
Well P84.47-205 Sand and gravel 38 542
Owner: Paul WohlgemuthDriller: Disbro Water Well Service Well PW-84-47-311
Soil, surface, and Owner: City of Premontclay 18 18 Driller: Carl Vickers Water Well Service
Caliche and lime rock 74 92 Soil, surface 2 2
Sand 6 98 Clay 58 60
Caliche 40 138 Shale 198 258
Shale, red, and gravel 22 160 Sand 8 266
Shale 44 204 Shale 159 425
Shale, soft, gray 44 248 Sand 135 560
Shale, soft, red 22 270
Well PW-84-47-403Shale, hard, red 44 314
Owner: John K. Disbro, Sr.Shale, sandy 22 336 Driller: H. & S. Water Well Service, Inc.
Shale, hard, red 24 360 Soil, surface 8 8
Sand 32 392 Sand and clay 18 26
Shale 10 402 Caliche 9 35
Sand 14 416 Clay and sand streaks 33 68
Shale, red 6 422 Caliche 7 75
Sand 19 441 Clay 23 98
Shale, red 96 537 Sand 6 104
Clay 8 112Well PW-84-47-307
Sand 4 116Owne: John Carroll
Driller: Disbro Water Well Service Clay and caliche streaks 40 156
Soil, surface 6 6 Shale, sandy 18 174
Caliche 64 70 Sand 6 180
Shale, red 35 105 Clay, caliche streaks,and sand 35 215
Sand 5 110Clay, hard streaks 15 230
Shale and limestone 23 133Sand and clay streaks 50 280
Shale, hard, red 67 200Clay, hard streaks 13 293
Shale, hard, red, andlimestone 30 230 Sand, fine 25 318
- 151 -
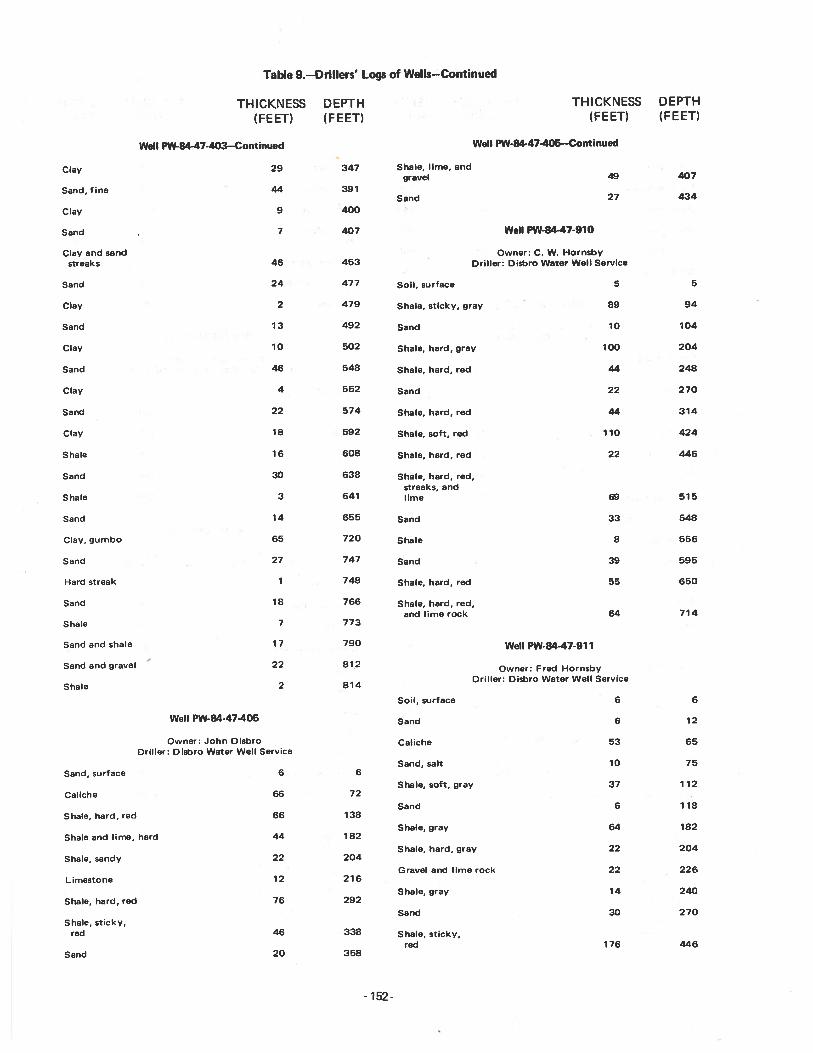
Table 9.—Drillers’ Logs of Wells—Continued
THICKNESS DEPTH THICKNESS DEPTH
(FEET) (FEET) (FEET) (FEET)
Well PW-84-47-403—Continued Well PW-84-47-405—Continued
Clay 29 347 Shale, lime, andgravel 49 407
Sand fine 44 391Sand 27 434
Clay 9 400
Sand 7 407 Well PW-84.47-910
Clay and sand Owner: C. W. Hornsbystreaks 46 453 Driller: Disbro Water Well Service
Sand 24 477 Soil, surface 5 5
Clay 2 479 Shale, sticky, gray 89 94
Sand 13 492 Sand 10 104
Clay 10 502 Shale, hard, gray 100 204
Sand 46 548 Shale, hard, red 44 248
Clay 4 552 Sand 22 270
Sand 22 574 Shale, hard, red 44 314
Clay 18 592 Shale, soft, red 110 424
Shale 16 608 Shale, hard, red 22 446
Sand 30 638 Shale, hard, red,streaks, and
Shale 3 641 lime 69 515
Sand 14 655 Sand 33 548
Clay, gumbo 65 720 Shale 8 556
Sand 27 747 Sand 39 595
Hard streak 1 748 Shale, hard, red 55 650
Sand 18 766 Shale, hard, red,andlimerock 64 714
Shale 7 773
Sand and shale 17 790 Well PW-84-47-911
Sand and gravel 22 812 Owner: Fred HornsbyDriller: Disbro Water Well Service
Shale 2 814
Soil, surface 6 6
Well PW8447405 Sand 6 12
Owner: John Disbro Caliche 53 65Driller: Disbro Water Well Service
Sand, salt 10 75Sand, surface 6 6
Shale, soft, gray 37 112Caliche 66 72
Sand 6 118Shale, hard, red 66 138
Shale, gray 64 182Shale and lime, hard 44 182
Shale, hard, gray 22 204Shale, sandy 22 204
Gravel and lime rock 22 226Limestone 12 216
Shale, gray 14 240Shale, hard, red 76 292
Sand 30 270Shale, sticky,
red 46 338 Shale, sticky,red 176 446
Sand 20 358
- 152-
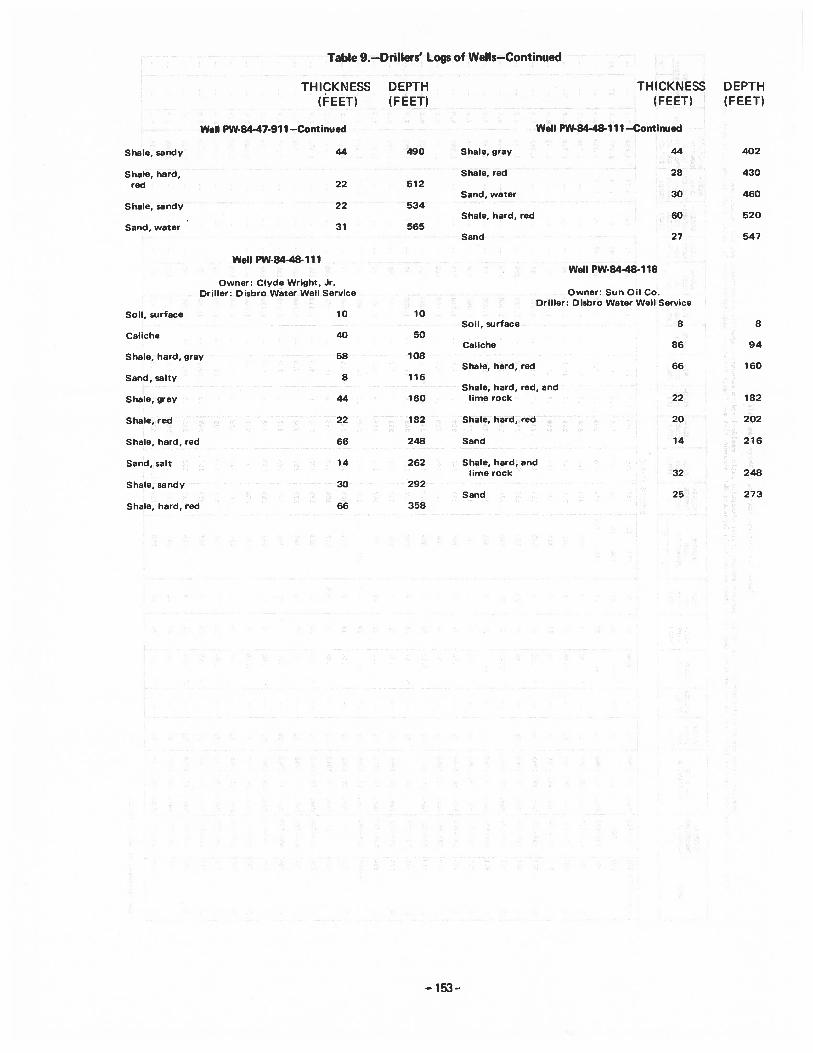
Table 9.—Drillers’ Logs of Wells—Continued
THICKNESS DEPTH THICKNESS DEPTH(FEET) (FEET) (FEET) (FEET)
Well PW-84-47-91 1—Continued Well PW-84-48-1 11—Continued
Shale, sandy 44 490 Shale, gray 44 402
Shale, hard, Shale, red 28 430red 22 512
Sand, water 30 460Shale, sandy 22 534
Shale, hard, red 60 520Sand, water 31 565
Sand 27 547
Well PW-84-48-1 11Well PW-8448.1 16
Owner: Clyde Wright, Jr.Driller: Disbro Water Well Service Owner: Sun Oil Co.
Driller: Disbro Water Well ServiceSoil, surface 10 10
Soil, surface 8 8Caliche 40 50
Caliche 86 94Shale, hard, gray 58 108
Shale, hard, red 66 160Sand, salty 8 116
Shale, hard, red, andShale, gray 44 160 lime rock 22 182
Shale, red 22 182 Shale, hard, red 20 202
Shale, hard, red 66 248 Sand 14 216
Sand, salt 14 262 Shale, hard, andlime rock 32 248
Shale, sandy 30 292Sand 25 273
Shale, hard, red 66 358
153-
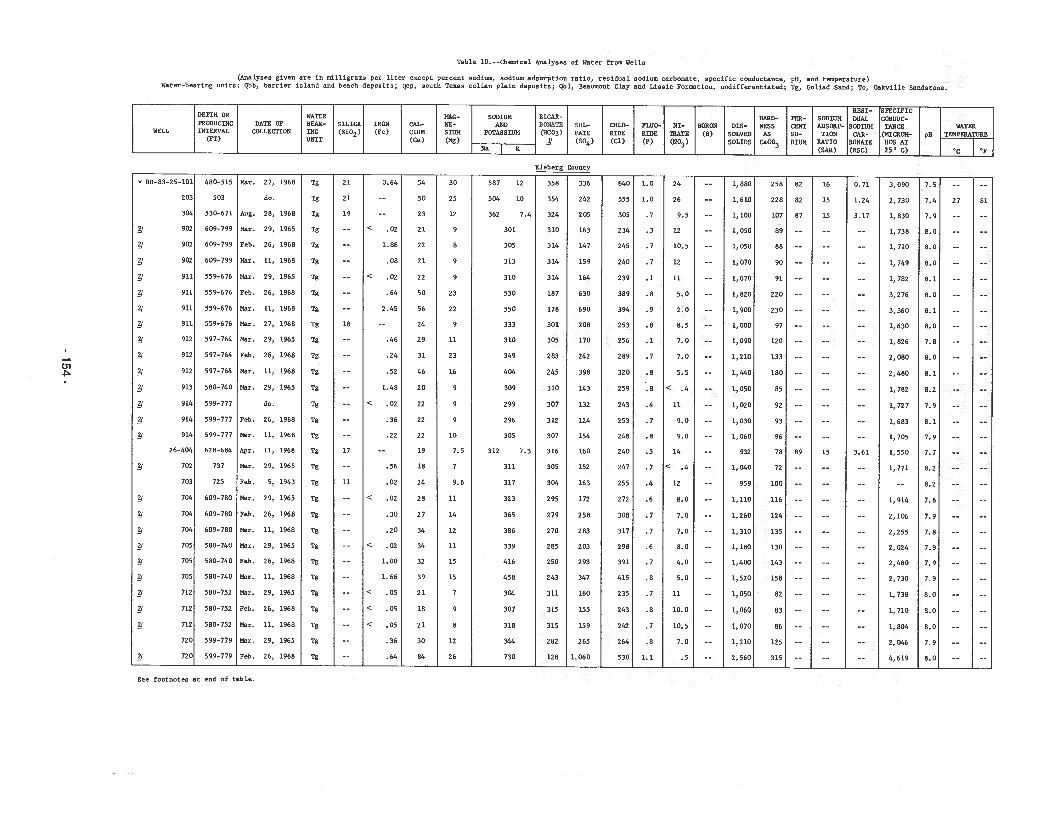
Table 10. --Chemical Analyses of Water from Wells
C,,
(Analyses given are in milligrams per liter excePt percent sodium, sodium adsorption ratio, residual sodium carbonate, specific conductance, pH, and temperature)Water-bearing units: Qbb, ha trier island and beach deposits; Qep, south Texas eolian plain deposits; Qbl, Beaumont Clay and Lissie Formation, undifferentiated; Tg, Goliad Sand; To, Oakville Sandstone.
RESI— SPECIFICDEPTH OR WATER WAG- SODIUM BICAR HARD- PER- SODIUM DUAL CONDUCPRODUCING DATE OF BEAR- SILICA IRON CAL- NE- All]) BONATE SUL- CHLO- FLUO- NI- BORON DIS- NESS CENT ADSORP- SODIUM lANCE WATER
WELL INTERVAL COLLECTION ING (Si02) (Fe) CIUM SlUM POTASSIUM (HCO3) FATE RIDE RIDE IRATE (B) SOLVED AS SO- TION CAR- (MICRON- pit TEMPERATURE(PT) UNIT (Ca) (Mg) (so4) (Cl) (F) (NO3) SOLIDS CaCO3 0117W RATIO BONATE IIOS AT
Na IC— (SAlt) (SIC) 25’ C) — ‘c ‘F
ltleberg County
* RR-83-25-1Ol 480-515 Mar. 27, 1968 Tg 21 0.64 54 30 587 12 358 336 640 1.0 24 -- 1,880 258 82 16 0.71 3,090 7.5 -- --
203 503 do. Tg 21 -— 50 25 504 10 354 242 555 1.0 26 —— 1,610 228 82 15 1.24 2,730 7.4 27 81
304 530-671 Aug. 28, 1968 Tg 19 —— 23 12 362 7.4 324 205 305 .7 9.5 —— 1,100 107 87 15 3.17 1,830 7.9 —— ——
/ 902 609—799 Mar. 29, 1965 Tg -- < .02 21 9 301 310 163 234 .3 12 —- 1,050 89 —— —— —- 1,738 8.0 —— ——
j 902 609—799 Feb. 26, 1968 Tg —— 1.86 22 8 305 314 147 245 .7 10.5 —— 1,050 88 —— -— —- 1,710 8.0 —— ——
/ 902 609-799 Mar. 11, 1968 Tg -— .08 21 9 313 314 159 240 .7 12 —— 1,070 90 -— -- —- 1,749 8.0 -— ——
j 911 559—676 Mar. 29, 1965 Tg —- < .02 22 9 310 314 164 239 .1 11 —— 1,070 91 —- -- —- 1,782 8.1 —- ——
f 911 559-676 Feb. 26, 1968 Tg —— .64 50 23 530 187 630 389 .8 5.0 —— 1, 820 220 —— —- —- 3, 276 8.0 —— ——
/ 911 559-676 Mar. 11, 1968 Tg -- 2.45 56 22 550 178 690 394 .9 2.0 -- 1,900 230 -- -- -- 3,360 8.1 -- —-
/ 911 559—676 Mar. 27, 1968 Tg 18 -— 24 9 333 301 208 253 .8 8.5 —— 1,000 97 —— -- —- 1,630 8.0 —— ——
f 912 597-764 Mar. 29, 1965 Tg —— .46 29 11 310 305 170 256 .1 7.0 —— 1, 090 120 —— -- —— 1, 826 7.8 —— —-
/ 912 597-764 Feb. 26, 1968 Tg -- .24 31 23 349 283 242 289 .7 7.0 —— 1,210 133 —— —- —— 2,080 8.0 —— ——
j 912 597-764 Mar. 11, 1968 Tg -— .52 46 16 404 245 398 320 .8 5.5 -— 1,440 180 -— —— -- 2,480 8.1 —— ——
J 913 580-740 Mar. 29, 1965 Tg —— 1.48 20 9 309 310 143 259 .8 < .4 ——; 1,050 85 —— —— —— 1,782 8.2 -- ——
j 914 599-777 do. Tg —— < .02 22 9 299 307 132 243 .4 11 -- 1,020 92 -- —— —— 1,727 7.9 -— —-
/ 914 599-777 Feb. 26, 1968 Tg -— .36 22 9 296 312 124 253 .7 9.0 —— 1,030 93 -— —- —— 1,683 8.1 —— ——
] 914 599-777 Mar. 11, 1968 Tg -- .22 22 10 305 307 154 248 .8 9.0 -- 1,060 96 -- -- -- 1,705 7.9 —- --
26—404 628-684 Apr. 11, 1968 Tg 17 —— 19 7.5 312 7.3 316 160 240 .5 14 —— 932 78 89 15 3.61 1,550 7.7 —— ——
j 702 737 Mar. 29, 1965 Tg —— .56 18 7 311 305 152 247 .7 < .4 —— 1,040 72 —— —— —— 1,771 8.2 —— ——
703 725 Feb. 5, 1943 Tg 11 .02 24 9.6 317 304 163 255 .4 12 —— 959 100 —— -— —— —- 8.2 —— ——
/ 704 609-780 Mar. 29, 1965 Tg —— < .02 28 11 323 295 172 272 .6 8.0 —— 1,110 116 —— —— —— 1,914 7.8 —— ——
j 704 609-780 Feb. 26, 1968 Tg —— .30 27 14 365 279 258 308 .7 7.0 —- 1,260 124 —— —— —— 2,106 7.9 —— ——
j 704 609-780 Mar. 11, 1968 Tg —— .20 34 12 386 270 283 317 .7 7.0 -— 1,310 135 —— —— —— 2,255 7.8 —— ——
j 705 580-740 Mar. 29, 1965 Tg -— < .02 34 11 339 285 203 298 .6 8.0 -- 1,180 130 -- -- 2,024 7.9 —- --
/ 705 580-740 Feb. 26, 1968 Tg -- 1.00 32 15 416 250 293 391 .7 4.0 -— 1,400 143 -- —- -- 2,480 7.9 -- --
/ 705 580-740 Mar. 11, 1968 Tg —- 1.66 39 15 458 243 347 415 .8 5.0 —— 1,520 158 —— —— -— 2,730 7.9 —- ——
j 712 580—752 Mar. 29, 1965 Tg -— < .05 21 7 304 311 160 235 .7 11 —— 1,050 82 —— —— -— 1,738 8.0 —— ——
j 712 580-752 Feb. 26, 1968 Tg -- < .05 18 9 307 315 155 243 .8 10.0 -- 1,060 83 —- -- —- 1,710 8.0 -— --
/ 712 580-752 Mar. 11, 1968 Tg —— .05 21 8 318 315 159 242 .7 10.5 —— 1, 070 86 —— —- —— 1, 804 8.0 —— ——
720 599—779 Mar. 29, 1965 Tg —— .36 30 12 344 282 265 264 .8 7.0 —— 1,210 125 —— —— —- 2, 046 7.9 —- ——
j 720 599—779 Feb. 26, 1968 Tg —— .64 84 26 730 128 1, 060 530 1.1 .5 —— 2, 560 315 —— —— —- 4, 619 8.0 —— --
See footnotes at end of table.
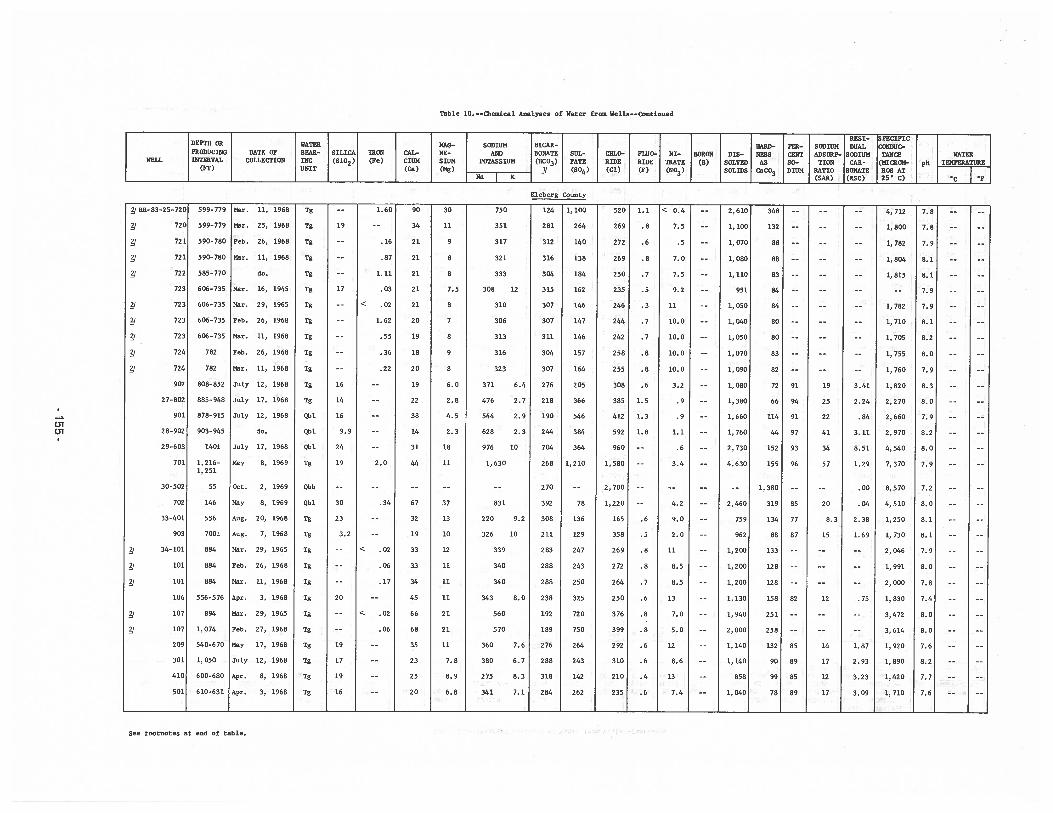
Table 10. --Diemjcal Analyses of Water from Wells--Continued
RESI- SPECIFICDEPTH OP. WATER HAG- SODIUM BICAR- HARD- PER- SODIUM DUAL CONDUCPRODUCING DATE OF BEAR- SILICA IRON CAL- NE- AND BORATE SUL- CHLO- FLUO- NI- BORON DIS- NESS CENT ADSORP- SODIUM TANCE WATER
WELL INTERVAL COLLECTION ING (SiC2) (Fe) CIUM SlUM POTASSIUM (HCO3) FATE RIDE RIDE ThATE (B) SOLVED AS SO— TION CAR- (MICOM- pH TEMPERATURE(FT) UNIT (Ca) (Mg) j (so4) (Cl) (F) (NO3) SOLIDS CaCO3 DIUM RATIO BORATE HOE AT
K (SAP.) (RSC) 25CC)— c F
Kleberg County
01(3,
J RR—83—25—720
720
721
721
722
723
723
723
723
724
724
902
27—802
901
28—902
29-603
701
30-502
702
33-401
903
/ 34-101
101
101
106
107
107
209
301
410
501
599-779
599-779
590-780
590-780
585-770
606-735
606-735
606—735
606-735
782
782
808-852
885- 948
878-915
903-945
140±
1,216-1,251
55
146
556
700±
884
884
884
556—576
894
1,074
540-670
1,050
600-680
610—631
1.60
16
.87
1.11
.03
< .02
1.62
.55
.36
.22
2.0
.34
< .02
.06
.17
< .02
.06
Mar. 11, 1968
Mar. 25, 1968
Feb. 26, 1968
Mar. 11, 1968
Mar. 16, 1945
Mar. 29, 1965
Feb. 26, 1968
Mar. 11, 1968
Feb. 26, 1968
Mar. 11, 1968
July 12, 1968
July 17, 1968
July 12, 1968
July 17, 1968
May 8, 1969
Oct. 2, 1969
May 8, 1969
Aug. 20, 1968
Aug. 7, 1968
Mar. 29, 1965
Feb. 26, 1968
Mar. 11, 1968
Apr. 3, 1968
Mar. 29, 1965
Feb. 27, 1968
May 17, 1968
July 12, 1968
Apr. 8, 1968
Apr. 3, 1968
Tg
Tg
Tg
Tg
Tg
Tg
Tg
Tg
Tg
Tg
Tg
Tg
Tg
Qbl
Qbl
Qbl
Tg
Qbb
Qbl
Tg
Tg
Tg
Tg
Tg
Tg
Tg
Tg
Tg
Tg
Tg
Tg
19
17
16
14
16
9.9
24
19
30
23
3.2
20
19
17
19
16
90
34
21
21
21
21
21
20
19
18
20
19
22
38
14
31
44
67
32
19
33
33
34
45
66
68
35
23
25
20
30
11
9
8
8
7.5
8
7
8
9
B
6.0
2.8
4.5
2.3
18
11
37
13
10
12
11
11
11
21
21
11
7.8
8.9
6.8
750 124 1, 100
351 281 264
317 312 140
321 316 138
333 304 184
308 12 315 162
310 307 146
306 307 147
313 311 146
316 304 157
323 307 164
371 6.4 276 205
476 2.7 218 366
544 2.9 190 546
628 2.3 244 384
976 10 704 364
1,630 268 1,210
-- 270 --
831 392 78
220 9.2 308 136
326 10 211 129
339 283 247
340 288 243
340 288 250
343 8.0 238 325
560 192 720
570 189 750
360 7.6 276 264
380 6.7 288 243
275 8.3 318 142
341 7.1 284 262
520 1.1 < 0.4 --
269 .8 7.5
272 .6 .5
269 .8 7.0
250 .7 7.5
235 .5 9.2
246 .3 11
244 .7 10.0
242 .7 10.0
258 .8 10.0
255 .8 10.0
308 .6 3.2
385 1.5 .9
412 1.3 .9
592 1.8 1.1
960 -- .6
1,580 -- 3.4
2,700 -- --
1,220 -— 4.2
165 .6 9.0
358 .5 2.0
269 .8 11
272 .8 8.5
264 .7 8.5
250 .6 13
376 .8 7.0
399 .8 5.0
292 .6 12
310 .6 8.6
210 .4 13
235 .6 7.4
2,610 348
1, 100 132
1, 070 88
1,080 88
1,110 83
951 84
1,050 84
1, 040 80
1,050 80
1,070 83
1,090 82
1,080 72
1,380 66
1,660 114
1,760 44
2,730 152
4,630 155
-— 1,380
2,460 319
759 134
962 88
1,200 133
1,200 128
1,200 128
1,130 158
1,940 251
2,000 258
1, 140 132
1,140 90
858 99
1,040 78
91
94
91
97
93
96
85
77
87
82
85
89
85
89
19
25
22
41
34
57
20
8.3
15
12
14
17
12
17
3.41
2.24
.84
3.11
8.51
1.29
.00
.04
2.38
1.69
75
1.87
2.93
3.23
3.09
4, 712
1, 800
1, 782
1, 804
1, 815
1, 782
1, 710
1, 705
1, 755
1,760
1,820
2,270
2,660
2,970
4,540
7,370
8,570
4,510
1,250
1, 730
2,046
1, 991
2,000
1,830
3,472
3,614
1, 920
1,890
1,420
1, 710
7.8
7.8
7.9
8.1
8.1
7.9
7.9
8.1
8.2
8.0
7.9
8.3
8.0
7.9
8.2
8.0
7.9
7.2
8.0
8.1
8.1
7.9
8.0
7.8
7.4
8.0
8.0
7.6
8.2
7.7
7.6
See footnotes at end of table.
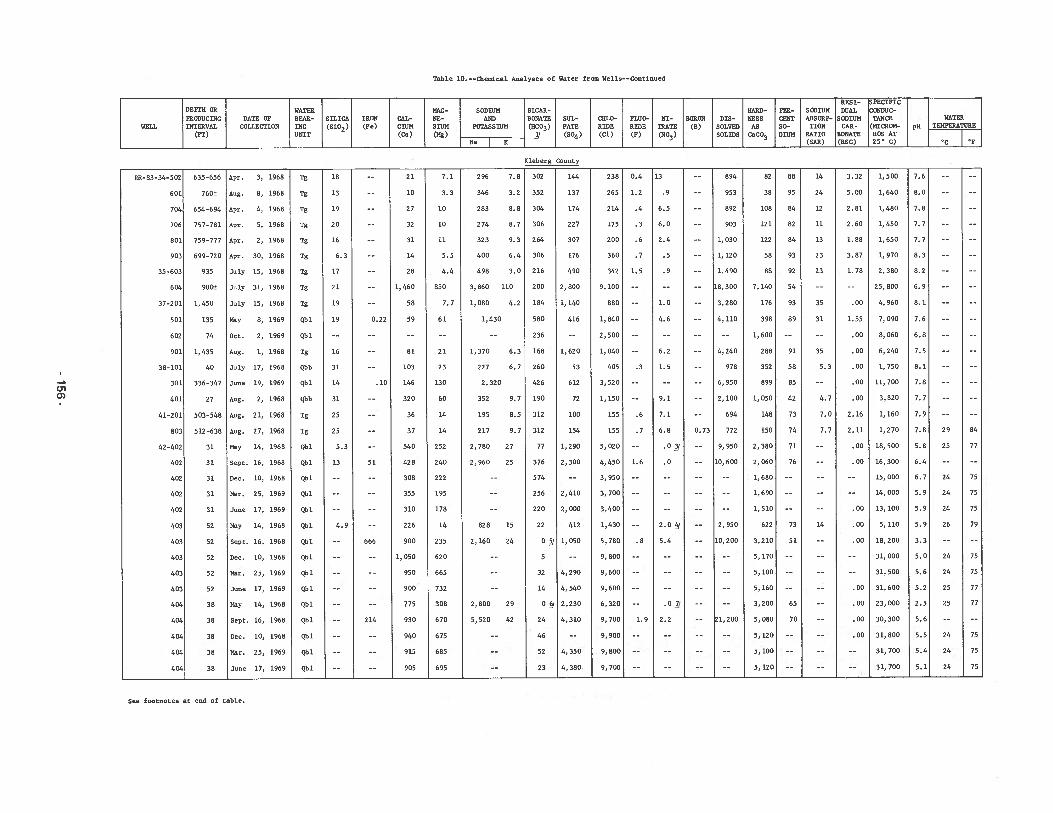
Table 10. --C1,emical Analyses of Water fran Wells--Continued
RESI- SPECIFICDEPTH OR WATER MAG- SODIUM BICAR- HARD- PER- SODIUM DUAL CONDUCPRODUCING DATE OF BEAR- SILICA IRON CAL- NE- AND BONATE SUL- CR1.0- FLUO- NI- BORON DIS- NESS CENT ADSORP- SODIUM TANCE WATER
WELL INTERVAL COLLECTION INC (SiO2) (Fe) dUN SlUM POTASSIUM (HCO3) FATE RIDE RIDE TRATE (B) SOLVED AS SO- TION CAR- (MICROM- pH TEMPERATURE
(FT) UNIT (Ca) (Mg) Jj (SO) (Cl) (F) (NO3) SOLIDS CaCO3 01DM RATIO BORATE HON ATNa K (RAE) (RSC) 25 C) ‘C ‘F
Kleberg County
296 7.8 302 238 0.4 13
(3103
ER—83—34—502
601
704
706
801
903
35—603
604
37—201
501
602
901
38-101
301
401
41-201
803
42-402
402
402
402
402
403
403
403
403
403
404
404
404
404
404
635—656
760±
654-694
757-781
759-777
699-720
935
900±
1,450
135
74
1,435
40
336-347
27
503-548
512-638
31
31
31
31
31
52
52
52
52
52
38
38
38
38
38
Apr. 3, 1968
Aug. 8, 1968
Apr. 4, 1968
Apr. 5, 1968
Apr. 2, 1968
Apr. 30, 1968
July 15, 1968
July 31, 1968
July 15, 1968
May 8, 1969
Oct. 2, 1969
Aug. 1, 1968
July 17, 1968
June 19, 1969
Aug. 2, 1968
Aug. 21, 1968
Aug. 27, 1968
May 14, 1968
Sept. 16, 1968
Dec. 10, 1968
Mar. 25, 1969
June 17, 1969
Nay 14, 1968
Sept. 16, 1968
Dec. 10, 1968
Mar. 25, 1969
June 17, 1969
May 14, 1968
Sept. 16, 1968
Dec. 10, 1968
Mar. 25, 1969
June 17, 1969
18
13
19
20
16
6.3
17
21
19
19
16
31
14
31
25
25
5.3
13
4.9
Tg
Tg
Tg
Tg
Tg
Tg
Tg
Tg
Tg
Qbl
Qb 1
Tg
Qbb
Qbl
Qbb
Tg
Tg
Qbl
Qbl
Qbl
Qbl
Qbl
Qbl
Qbl
Qbl
Qb 1
Qbl
Qbl
Qbl
Qbl
Qb 1
Qbl
0.22
.10
51
666
214
21
10
27
32
31
14
28
1,460
58
59
81
103
146
320
36
37
540
428
308
355
310
226
900
1,050
950
900
775
930
940
915
905
7.1
3.3
10
10
11
5.5
4.4
850
7.7
61
21
23
130
60
14
14
252
240
222
195
178
14
235
620
665
732
308
670
675
685
695
346 3.2
283 8.8
274 8.7
323 9.3
400 6.4
498 3.0
3,860 110
1,080 4.2
1,430
1,370 6.3
227 6.7
2,320
352 9.7
195 8.5
217 9.7
2,780 27
2,960 25
828 15
2,160 24
2,800 29
5,520 42
352
304
306
264
306
216
200
184
580
236
168
260
426
190
312
312
77
376
574
256
220
22
0l
5
32
14
O
24
46
52
144
137
174
227
307
176
490
2,800
1, 140
416
1,620
53
612
72
100
154
1,290
2,300
2,410
2,000
412
1,050
4,290
4,540
2,230
4,310
4,350
265
214
175
200
360
342
9, 100
880
1,840
2,500
1,040
405
3,520
1,150
155
155
5,020
4,450
3,950
3,700
3,400
1,430
5,780
9, 800
9,600
9,600
6,320
9,700
9,900
9,800
1.2
.4
.3
.6
.7
1.5
.3
.6
.7
1.6
.8
1.9
.9
6.5
6.0
2.4
.5
.9
1.0
4.6
6.2
1.5
9.1
7.1
6.8
.0
.0
2.0 q
5.4
.0
2.2
0.73
894
953
892
903
1,030
1,120
1,490
18, 300
3,280
4, 110
4,240
978
6,950
2,100
694
772
9, 950
10, 600
2,950
10,200
1, 200
14
24
12
11
13
23
23
35
31
35
5.3
4.7
7.0
7.7
14
82
38
108
121
122
58
88
7,140
176
398
1,600
288
352
899
1,050
148
150
2,380
2,060
1,680
1,690
1,510
622
3,210
5,170
5,100
5,160
3,200
5,080
5,120
5,100
5,120
3.32
5.00
2.81
2.60
1.88
3.87
1.78
.00
1.55
.00
.00
.00
.00
.00
2.16
2.11
.00
00
.00
.00
.00
.00
.00
.00
00
88
95
84
82
84
93
92
54
93
89
91
58
85
42
73
74
71
76
73
51
65
70
1,500
1,640
1,480
1,450
1,650
1,970
2,380
25, 800
4,960
7, 090
8,060
6,240
1, 750
11,700
3,820
1,160
1,270
18, 500
16, 300
15, 000
14, 000
13, 100
5,110
18, 200
31, 000
31, 500
31, 600
23, 000
30, 300
31, 800
7.6
8.0
7.8
7.7
7.7
8.3
8.2
6.9
8.1
7.6
6.8
7.5
8.1
7.8
7.7
7.9
7.8
5.8
6.4
6.7
5.9
5.9
5.9
3.3
5.0
5.6
5.2
2.5
5.6
5.5
29
25
24
24
24
26
24
24
25
25
24
24
24
84
77
75
75
75
79
75
75
77
77
75
75
7523 4,380 9,700 --
---- 31,700 5.4
---- 31,700 5.1
See footnotes at end of table.
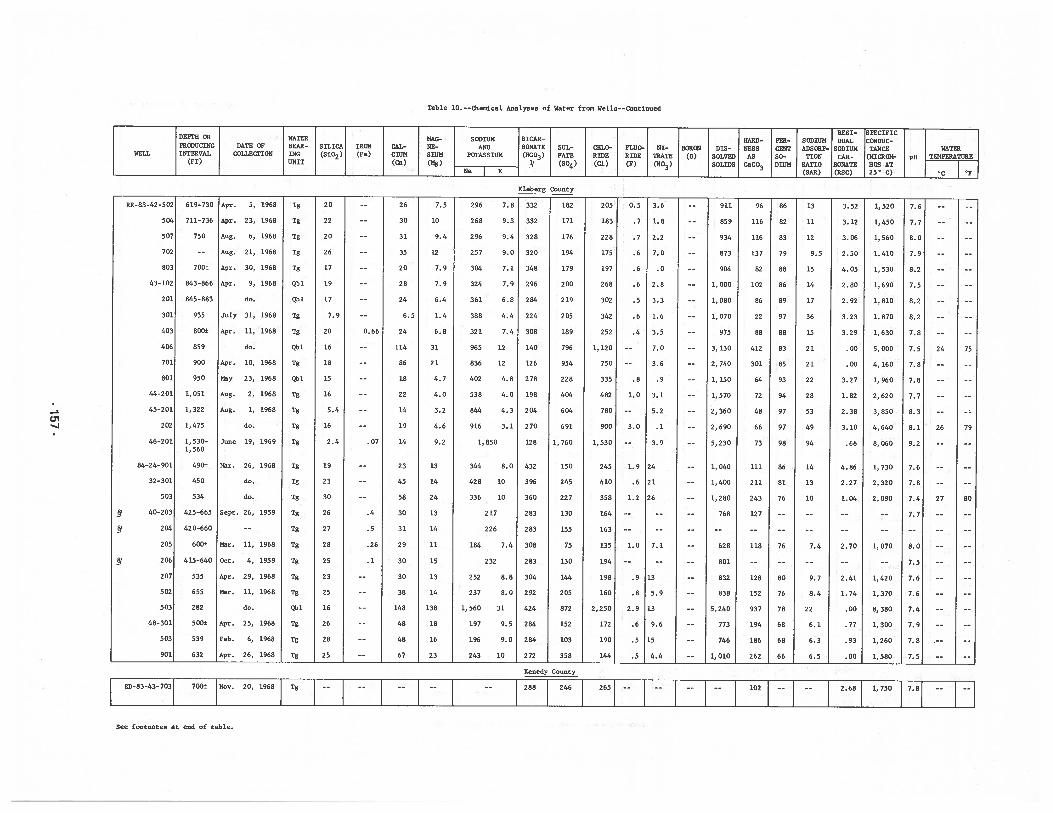
Table 10. --cLemical Analyses of Water from Wells--Continued
T itsi- sPEcIPIcDES°IN OR WATER MAC- SODIUM BICAR- NARD- PER- SODIUM DUAL CONDUCPRODUCING DATE OF BEAR- SILICA IRON CAL- NE- AND BONATE SUL- CNLO- FLUO- NI- BORON DIS- NESS CENT ADSORP- SODIUM TANCE WATER
WELL INTERVAL COLLECTION ING (SiO2) (Fe) CIUM SlUM POTASSIUM (NCO3) FATE RIDE RIDE TRATE (B) SOLVED AS SO- HON CAR- (MICROM- pH TEMPERATURE(FT) UNIT (Ca) (Hg) )J (SO4) (Cl) (F) (NO ) SOLIDS CaCO3 DIUN RATIO BORATE HOS AT
Na K (SAL) (RSC) 25 C) — ‘C ‘F
Kleberg County
96 86
(31
RR-83-42 -502
504
507
702
803
43-102
201
301
403
406
701
801
44-201
45-201
202
46-201
84-24-901
32-301
503
/ 40-203
204
205
206
207
502
503
48-301
503
901
0.66
.07
.4
.5
.26
.1
619—730
711—736
750
700±
843-866
845-883
935
800±
859
900
950
1,051
1,322
1,475
1,530-1,560
490±
450
534
425—665
420-660
600±
415-640
535
655
282
500±
539
632
Apr. 5, 1968
Apr. 23, 1968
Aug. 6, 1968
Aug. 21, 1968
Apr. 30, 1968
Apr. 9, 1968
July 31, 1968
Apr. 11, 1968
Apr. 10, 1968
May 23, 1968
Aug. 2, 1968
Aug. 1, 1968
June 19, 1969
Mar. 26, 1968
Sept. 26, 1959
Mar. 11, 1968
Oct. 4, 1959
Apr. 29, 1968
Mar. 11, 1968
Apr. 25, 1968
Feb. 6, 1968
Apr. 26, 1968
Tg
Tg
Tg
Tg
Tg
Qb 1
Qbl
Tg
Tg
Qbl
Tg
Qbl
Tg
Tg
Tg
Tg
Tg
Tg
Tg
Tg
Tg
Tg
Tg
Tg
Tg
Qb 1
Tg
Tg
Tg
20
22
20
26
17
19
17
7.9
20
16
18
15
16
5.4
16
2.4
19
23
30
26
27
28
25
23
25
16
26
28
25
26
30
31
35
20
28
24
6.5
24
114
86
18
22
14
19
14
23
45
58
30
31
29
30
30
38
148
48
48
67
7.5 296 7.8
10 268 9.3
9.4 296 9.4
12 257 9.0
7.9 304 7.1
7.9 324 7.9
6.4 361 6.8
1.4 388 4.4
6.8 321 7.4
31 965 12
21 836 12
4.7 402 4.8
4.0 538 4.0
3.2 844 4.3
4.6 916 3.1
9.2 1,850
13 344 8.0
14 428 10
24 336 10
13 217
14 226
11 184 7.4
15 232
13 252 8.8
14 237 8.0
138 1,560 31
18 197 9.5
16 196 9.0
23 243 10
332 182 205 0.5
332 171 183 .7
328 176 228 .7
320 194 175 .6
348 179 197 .6
296 200 268 .6
284 219 302 .5
224 205 342 .6
308 189 252 .4
140 796 1,120 ——
126 954 750 ——
278 228 335 .8
198 404 482 1.0
204 604 780 --
270 691 900 3.0
128 1, 760 1, 530 —-
432 150 245 1.9
396 245 410 .6
360 227 358 1.2
283 130 164 --
283 155 163 ——
308 75 135 1.0
283 130 194 --
304 144 198 .9
292 205 160 .8
424 872 2,250 2.9
284 152 172 .6
284 103 190 .5
272 358 144 .5
3.6
1.8
2.2
7.0
.0
2.8
3.3
1.6
3.5
7.0
3.6
.9
3.1
5.2
.1
3.9
24
21
26
7.1
13
5.9
13
9.6
15
4.4
911
859
934
873
904
1,000
1,080
1,070
975
3, 130
2,740
1, 150
1,570
2,360
2,690
5,230
1,040
1,400
1,280
768
628
801
832
838
5,240
773
746
1,010
116
116
137
82
102
86
22
88
412
301
64
72
48
66
73
111
211
243
127
118
128
152
937
194
186
82
83
79
88
86
89
97
88
83
85
93
94
97
97
98
86
81
76
76
80
76
78
68
68
13
11
12
9.5
15
14
17
36
15
21
21
22
28
53
49
94
14
13
10
7.4
9.7
8.4
22
6.1
6.3
6.5
3.52
3.12
3.06
2.50
4.05
2.80
2.92
3.23
3.29
.00
.00
3.27
1.82
2.38
3.10
.66
4.86
2.27
1.04
2.70
2.41
1.74
.00
.77
.93
.00
1,520
1,450
1,560
1,410
1,530
1,690
1,810
1, 870
1,630
5,000
4,160
1,960
2,620
3,850
4,640
8,060
1, 730
2,320
2,090
1,070
1,420
1,370
8,380
1,300
1,260
1,580
7.6
7.7
8.0
7.9
8.2
7.5
8.2
8.2
7.8
7.5
7.8
7.8
7.7
8.3
8.1
9.2
7.6
7.8
7.4
7.7
8.0
7.5
7.6
7.6
7.4
7.9
7.8
7.5
24
26
27
75
79
80
Kenedy County
BD-83-43—7O3 700± Nov. 20, 1968 Tg —— —— —— —— —— 288 246 265 —— -— -— —— 102 —— —— 2.68 1,750 7.8 —— ——
262 66
See footnotes at end of table.
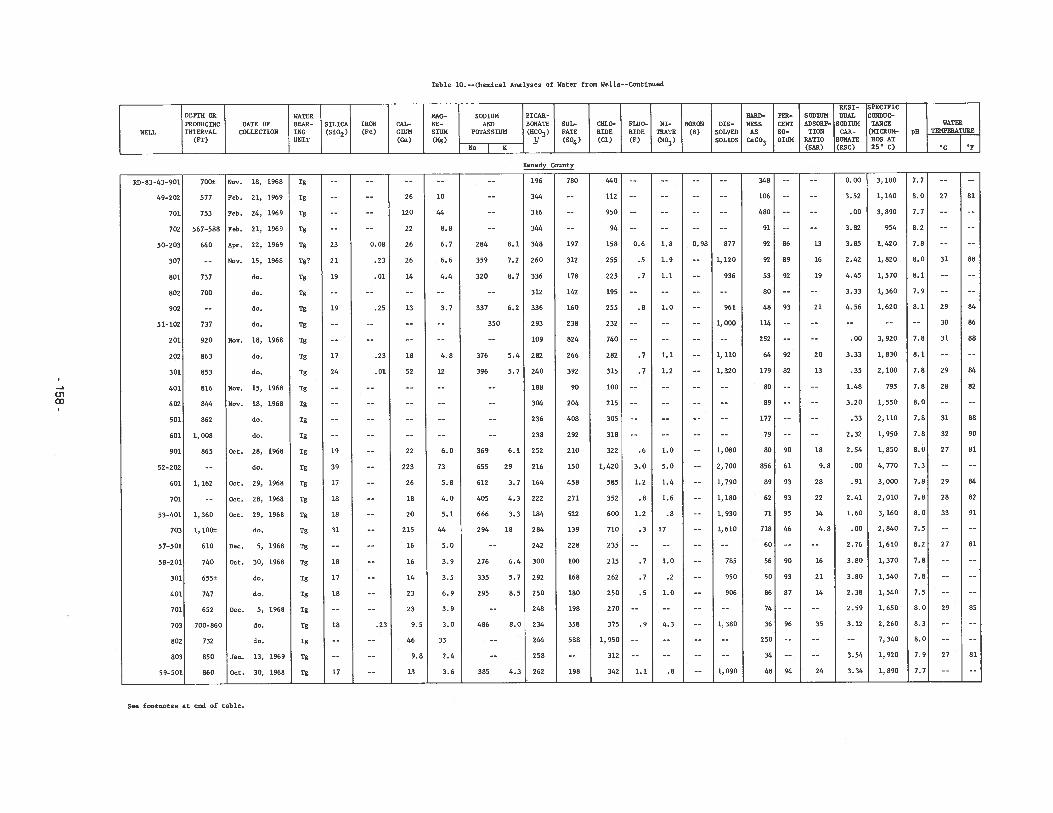
Table 10. --chemical Analyses of Water from Wells--Continued
T si- spcipicDEPTH OR WATER MAG- SODIUM BICAR- HARD- PER- SODIUM DUAL CONDUCPRODUCING DATE OF BEAR- SILICA IRON CAL- ME- AND BONATE SUL- CICLO- FLUO- NI- BORON DIS- NESS CENT ADSORP- SODIUM lANCE WATER
WELL INTERVAL COLLECTION 1MG (Si02) (Fe) CIUM SLUM POTASSIUM (HCO3) FATE RIDE RIDE mATE (B) SOLVED AS SO- TION CAR- (NICROM- pH TEMPERATURE
(FT) UNIT (Ca) (Mg) 1/ (SO4) (Cl) (F) (NO3) SOLIDS CaCO3 01DM RATIO BONATE IOOS ATNa K (SAR)(RSC)25’C) — ‘C ‘F
Kenedy County
RD-83-43-90l 700± Nov. 18, 1968 Tg -- -- -- -- -- 196 780 440 -— —- -— -- 348 -- -- 0.00 3,100 7.7 -- --
49—202 577 Feb. 21, 1969 Tg -— —— 26 10 -— 344 —- 112 —— -- —— —— 106 —— —- 3.52 1,140 8.0 27 81
701 753 Feb. 24, 1969 Tg -— —— 120 44 —- 316 —— 950 —— —— —- —— 480 -— —- .00 3,890 7.7 —— -—
702 567—588 Feb. 21, 1969 Tg —— —— 22 8.8 -— 344 —- 94 -— —- —- -— 91 —— —- 3.82 954 8.2 —— -—
50—203 640 Apr. 22, 1969 Tg 23 0.08 26 6.7 284 8.1 348 197 158 0.6 1.8 0.98 877 92 86 13 3.85 1,420 7.8 -— ——
307 —— Nov. 15, 1968 Tgl 21 .23 26 6.6 359 7.2 260 312 255 .5 1.9 —— 1,120 92 89 16 2.42 1,820 8.0 31 88
801 737 do. Tg 19 .01 14 4.4 320 8.7 336 178 225 .7 1.1 —— 936 53 92 19 4.45 1,570 8.1 —- --
802 700 do. Tg -- -- -- -- 312 142 195 -— -- —- -— 80 —— -- 3.33 1,360 7.9 -- --
902 -— do. Tg 19 .25 13 3.7 337 6.2 336 160 255 .8 1.0 —— 961 48 93 21 4.56 1,620 8.1 29 84
51-102 737 do. Tg -- -- -- 350 293 238 232 -- -- -- 1,000 114 -- -- -- -- —- 30 86
201 920 Nov. 18, 1968 Tg -- —- -- —— 109 824 740 -- -- -- -- 252 -- -- .00 3,920 7.8 31 88
202 863 do. Tg 17 .23 18 4.8 376 5.4 282 266 282 .7 1.1 -- 1,110 64 92 20 3.33 1,830 8.1 -- --
301 853 do. Tg 24 .01 52 12 396 5.7 240 392 315 .7 1.2 -- 1,320 179 82 13 .35 2,100 7.8 29 84
401 816 Nov. 15, 1968 Tg -- -- -- —- 188 90 100 -- -- -- -- 80 -- 1.48 795 7.8 28 82
402 844 Nov. 18, 1968 Tg -- -- —— -- 304 204 215 -— -- -- -— 89 -- -- 3.20 1,550 8.0 -- --
501 862 do. Tg -- -- -— —- 236 408 305 -- -— -- -- 177 -- -- .33 2,110 7.8 31 88
601 1,008 do. Tg -- -- -- —- 238 292 318 -- —- -- —- 79 -- -- 2.32 1,950 7.8 32 90
901 865 Oct. 28, 1968 Tg 19 22 6.0 369 6.1 252 210 322 .6 1.0 —— 1,080 80 90 18 2.54 1,850 8.0 27 81
52—202 —— do. Tg 39 223 73 655 29 216 150 1,420 3.0 5.0 —- 2,700 856 61 9.8 .00 4,770 7.3 —— —-
601 1,162 Oct. 29, 1968 Tg 17 26 5.8 612 3.7 164 458 585 1.2 1.4 —— 1,790 89 93 28 .91 3,000 7.8 29 84
701 -- Oct. 28, 1968 Tg 18 18 4.0 405 4.3 222 271 352 .8 1.6 —- 1,180 62 93 22 2.41 2,010 7.8 28 82
53-401 1,360 Oct. 29, 1968 Tg 18 20 5.1 666 3.3 184 522 600 1.2 .8 —- 1,930 71 95 34 1.60 3,160 8.0 33 91
703 1,100± do. Tg 31 215 44 294 18 284 139 710 .3 17 —— 1,610 718 46 4.8 .00 2,840 7.5 —— ——
57—501 610 Dec. 5, 1968 Tg —— 16 5.0 —— 242 228 235 —— —— —— —— 60 —— -— 2.76 1,610 8.2 27 81
58—201 740 Oct. 30, 1968 Tg 18 16 3.9 276 6.4 300 100 215 .7 1.0 —— 785 56 90 16 3.80 1,370 7.8 -— —-
301 655± do. Tg 17 14 3.5 335 5.7 292 168 262 .7 .2 —— 950 50 93 21 3.80 1,540 7.8 —— —-
401 747 do. Tg 18 23 6.9 295 8.5 250 180 250 .5 1.0 -- 906 86 87 14 2.38 1,540 7.5 -- --
701 652 Dec. 5, 1968 Tg -- 23 3.9 —— 248 198 270 —— —— —— —— 74 —— —- 2.59 1,650 8.0 29 85
703 700-860 do. Tg 18 .23 9.5 3.0 486 8.0 234 358 375 .9 4.3 -- 1,380 36 96 35 3.12 2,260 8.3 -- --
802 732 do. Tg -- 46 33 -- 244 588 1,950 -- -- -- -- 250 -- -- -- 7,340 8.0 -- --
803 850 Jan. 13, 1969 Tg -- 9.8 2.4 -- 258 —- 312 -- —- -- -- 34 -- —- 3.54 1,920 7.9 27 81
59—501 860 Oct. 30, 1968 Tg 17 13 3.6 385 4.3 262 198 342 1.1 .8 —— 1,090 48 94 24 3.34 1,890 7.7 —- --
See footnotes at end of table.
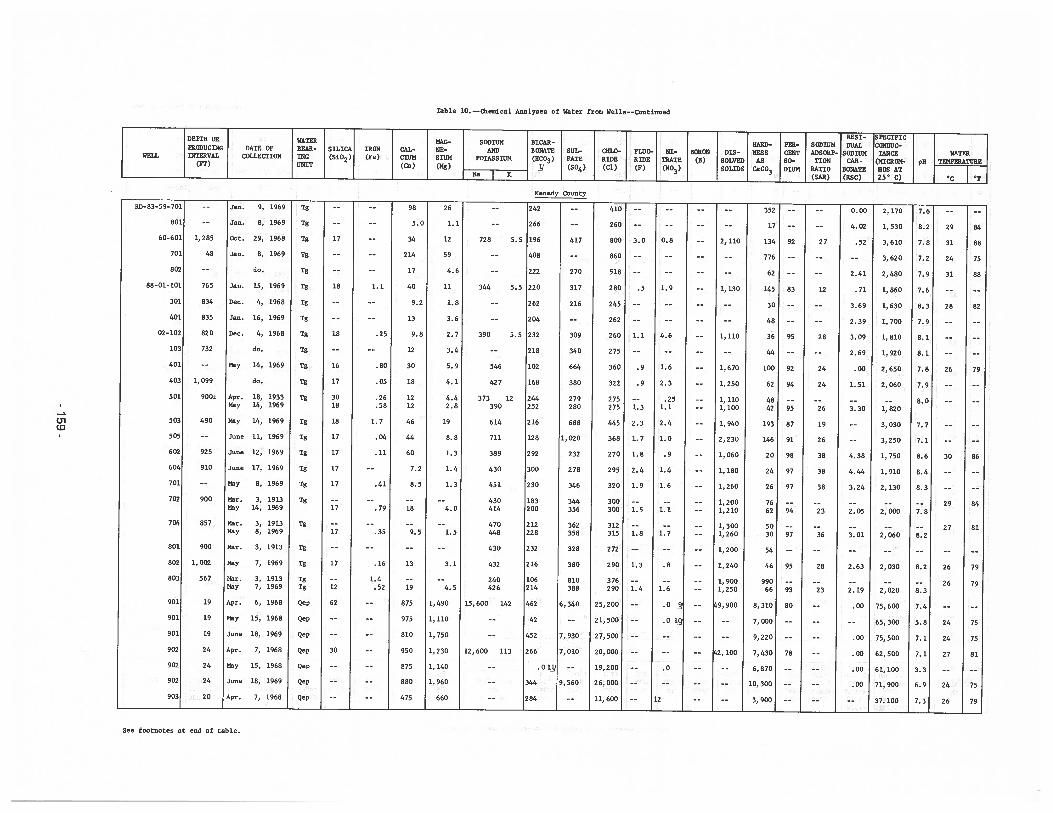
Table 10. --øsemical Analyses of Water from Wells--Continued
RESI— SPECIFICDEPTH OR WATER NAG- SODIUM BICAR- HARD- PER- SODIUM DUAL CONDUCPRODUCING DATE OF BEAR- SILICA IRON CAL- NE- AND BORATE SUL- CR10- FLUO- NI- BORON DIS- NESS CENT ADSORP- SODIUM TANCE WATERWELL INTERVAL COLLECCION 1592 (SiOz) (Fe) ClUbS SlUM POTASSIUM (HCO3) FATE RIDE RIDE ThATE (B) SOLVED AS SO- TION CAR- (MICROM- pH TEMPERATURE(PT) UNIT (Ca) (Mg) / (SO) (ci) (F) (NO3) SOLIDS CaCO3 DIUN RATIO BONATE ISOS ATNa K (BAR) (RSC) 25’C) — C ‘F
Kenedy County
RD—83-59—70l —— Jan. 9, 1969 Tg -— —— 98 26 —— 242 —— 410 —— —— —— —— 352 —— —— 0.00 2,170 7.6 —— ——
801 —- Jan. 8, 1969 Tg —— —— 5.0 1.1 —— 266 —- 260 —— —— —— —— 17 -— —— 4.02 1,530 8.2 29 84
60-601 1,285 Oct. 29, 1968 Tg 17 —— 34 12 728 5.5 196 417 800 3.0 0.8 -— 2,110 134 92 27 .52 3,610 7.8 31 88
701 48 Jan. 8, 1969 Tg —- —— 214 59 —— 408 —— B60 —- —— —— —- 776 —— -- —- 3,620 7.2 24 75
802 -- do. Tg -- -- 17 4.6 -— 222 270 518 -- -- —- -— 62 -- —- 2.41 2,480 7.9 31 88
88—01-101 765 Jan. 15, 1969 Tg 18 1.1 40 11 344 5.5 220 317 280 .5 1.9 —— 1,130 145 83 12 .71 1,860 7.6 —— -—301 834 Dec. 4, 1968 Tg -- -— 9.2 1.8 —— 262 216 245 -— -- -— -- 30 3.69 1,630 8.3 28 82
401 835 Jan. 16, 1969 Tg —- —— 13 3.6 —— 204 —— 262 —— —— —— -- 48 —— —- 2.39 1,700 7.9 -— --
02—102 820 Dec. 4, 1968 Tg 18 .25 9.8 2.7 390 5.5 232 309 260 1.1 4.6 —— 1,110 36 95 28 3.09 1,810 8.1 —— ——
103 732 do. Tg -- 12 3.4 -— 218 340 275 -- -- -- —- 44 -- -- 2.69 1,920 8.1 -- --
401 -- Nay 14, 1969 Tg 16 .80 30 5.9 546 102 664 360 .9 1.6 —- 1,670 100 92 24 .00 2,650 7.8 26 79
403 1,099 do. Tg 17 .05 18 4.1 427 168 380 322 .9 2.3 -— 1,250 62 94 24 1.51 2,060 7.9 -- --
501 900± Apr. 18, 1933 Tg 30 .26 12 4.4 373 12 244 279 275 -- .25 —- 1,110 48 -- -- -- -- 8.0 -- --Nay 14, 1969 18 .58 12 2.8 390 252 280 275 1.3 1.1 —— 1,100 42 95 26 3.30 1,820
503 490 May 14, 1969 Tg 18 1.7 46 19 614 216 688 445 2.3 2.4 —— 1,940 193 87 19 —— 3,030 7.7 —— ——CD505 —- June 11, 1969 Tg 17 .04 44 8.8 711 128 1,020 368 1.7 1.0 —— 2,230 146 91 26 —- 3,250 7.1 —— —-602 925 June 12, 1969 Tg 17 .11 60 1.3 389 292 232 270 1.8 .9 —— 1,060 20 98 38 4.38 1,750 8.6 30 86
604 910 June 17, 1969 Tg 17 7.2 1.4 430 300 278 295 2.4 1.4 -- 1,180 24 97 38 4.44 1,910 8.4 -- --
701 —— May 8, 1969 Tg 17 .41 8.5 1.3 451 230 346 320 1.9 1.6 -— 1,260 26 97 38 3.24 2,130 8.3 —— ——
702 900 Mar. 3, 1913 Tg -- -- —- 430 183 344 300 -- -- -- 1,200 76 -- -- -- -- -- 29 84May 14, 1969 17 .79 18 4.0 414 200 356 300 1.5 1.1 -- 1,210 62 94 23 2.05 2,000 7.8
704 857 Mar. 3, 1913 Tg -- -- -- 470 212 362 312 -- -- -- 1,300 50 -- -- -- -- -- 27 81May 8, 1969 17 .35 9.5 1.5 448 228 358 315 1.8 1.7 1,260 30 97 36 3.01 2,060 8.2
801 900 Mar. 3, 1913 Tg —— -- -- 430 232 328 272 -- —- -- 1,200 54 -— -- -- --802 1,002 May 7, 1969 Tg 17 .16 13 3.1 432 216 380 290 1.3 .8 -- 1,240 46 95 28 2.63 2,030 8.2 26 79
803 567 Mar. 3, 1913 Tg —- 1.4 -- -- 240 106 810 376 —- -- -- 1,900 990 -- -- -- -- -- 26 79Nay 7, 1969 Tg 12 .52 19 4.5 426 214 388 290 1.4 1.6 —— 1,250 66 93 23 2.19 2,020 8.3
901 19 Apr. 6, 1968 Qep 62 875 1,490 15,600 142 462 6,340 25,200 -- .0 -— 9,900 8,310 80 —— .00 75,600 7.4 -- --901 19 May 15, 1968 Qep -- 975 1,110 -— 42 -- 21,500 -- .0 1( -- —- 7,000 -- -- -- 65,300 5.8 24 75
901 19 June 18, 1969 Qep -- 810 1,750 —- 452 7,930 27,500 —- —— -- -- 9,220 -- -- .00 75,500 7.1 24 75
902 24 Apr. 7, 1968 Qep 30 950 1,230 12,600 113 266 7,010 20,000 -- -- -- 2,100 7,430 78 -- .00 62,500 7.1 27 81
902 24 May 15, 1968 Qep -- 875 1,140 —- .0 1j -- 19,200 —- .0 -- -- 6,870 -— -— .00 61, 100 3.3 -- --902 24 June 18, 1969 Qep -- 880 1,960 -- 344 9,560 26, 000 -- —- —- -— 10, 300 -— -— .00 71, 900 6.9 24 75
903 20 Apr. 7, 1968 Qep 475 660 284 11,600 -— 12 -- 3,900 -- —- -- 37,100 7.3 26 79
See footnotes at end of table.
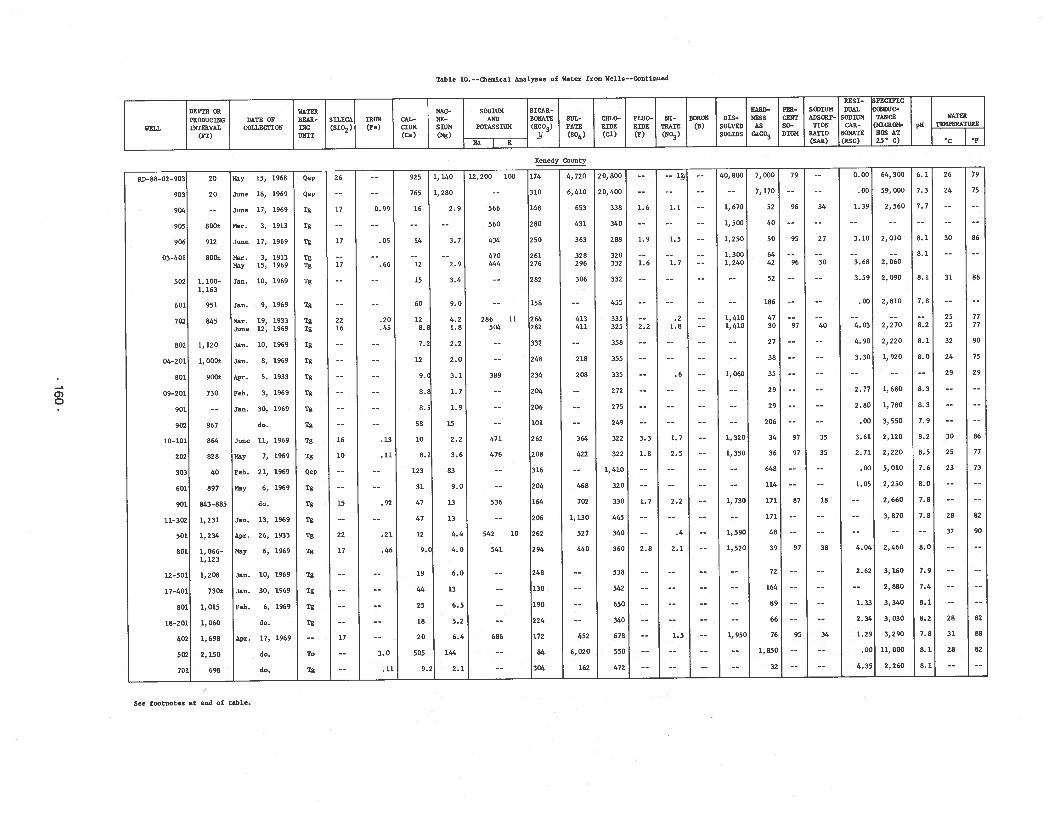
Table 10. --C3iemical Analyses of Water from Wells--Continued
RESI- SPECIFIC
DEPTh OR WATER WAG- SODIUM BICAR- HARD- PER- SODIUM DUAL CONDUC
PRODUCING DATE OF BEAR- SILICA IRON CAL- NE- AND BONATE SUL- CR10- FLUO- NI- BORON DIS- NESS CENT ADSORP- SODIUM lANCE WATER
WELL INTERVAL COLLECTION 1MG (siO2) (Fe) CIUM SlUM POTASSIUM (HCO3) FATE RIDE RIDE TRATE (B) SOLVED AS SO- lION CAR- (MICRON- pH TEMPERATURE
(FT) UNIT (Ca) (Mg) JJ (SO) (Cl) (F) (NO3) SOLIDS CaCO3 DIUM RATIO BONATE DOS AT
Na K (SAR)(R.SC)25’C)— ‘C ‘F
Kenedy County
4,720 20,800 --
6,410 20,400 --
40,000 7,000 79
7,170 ——
0)0
6.1
7.3
7.7
8.1
8.1
26
24
30
RD-88-O2-903
903
904
905
906
03-401
502
601
702
802
04-201
801
09-201
901
902
10-101
202
303
601
901
11-302
501
801
12-501
17-401
801
18—201
402
502
701
20
20
800±
912
800±
1, 100-1, 163
951
845
1,120
1,000±
900±
730
967
864
828
40
897
843-885
1,231
1,234
1,066—1, 123
1,208
730±
1,015
1,060
1,698
2, 150
698
May 15, 1968 Qep 26
June 18, 1969 Qep --
June 17, 1969 Tg 17
Mar. 3, 1913 Tg --
June 17, 1969 Tg 17
Mar. 3, 1913 Tg --
May 15, 1969 Tg 17
Jan. 10, 1969 Tg --
Jan. 9, 1969 Tg --
Mar. 19, 1933 Tg 22June 12, 1969 Tg 16
Jan. 10, 1969 Tg --
Jan. 8, 1969 Tg --
Apr. 5, 1933 Tg -—
Feb. 3, 1969 Tg ——
Jan. 30, 1969 Tg --
do. Tg --
June 11, 1969 Tg 16
May 7, 1969 Tg 10
Feb. 21, 1969 Qep --
May 6, 1969 Tg --
do. Tg 15
Jan. 13, 1969 Tg --
Apr. 26, 1933 Tg 22
May 6, 1969 Tg 17
Jan. 10, 1969 Tg —-
Jan. 30, 1969 Tg --
Feb. 6, 1969 Tg --
do. Tg --
Apr. 17, 1969 —— 17
do. To --
do. Tg --
8.1 31
0.99
.05
.66
.20
.45
.13
.11
.92
.21
.46
3.0
.11
925 1,140 12,200 100
765 1,280
16 2.9 566
---- 560
14 3.7 434
---- 470
12 2.9 444
15 3.4 --
60 9.0 ——
12 4.2 286 118.; 1.8 504
7.2 2.2 ——
12 2.0 ——
9. 3.1 389
8. 1.7 ——
8.5 1.9 ——
58 15 --
10 2.2 471
8.2 3.6 476
123 83 --
31 9.0 —-
47 13 536
47 13 --
12 4.4 542 10
9.0 4.0 541
19 6.0 --
44 13 -—
25 6.5 ——
18 5.2 ——
20 6.4 686
505 144 --
9.2 2.1 ——
1.6
1.9
1.6
2.2
3.3
1.8
1. 7
2.8
174
310
148
280
250
261276
282
158
264282
332
248
234
204
206
101
262
208
316
204
164
206
262
294
248
130
190
224
172
84
304
-- 1/
1.1
1.5
1.7
.21.8
.6
1.7
2.5
2.2
.4
2.1
1.5
653
431
363
328296
306
413411
218
208
364
422
468
702
1,130
527
440
452
6,020
162
338
340
288
320332
332
455
335325
358
355
335
272
275
249
322
322
1,410
320
330
465
340
360
538
542
650
340
678
550
472
1,670
1,500
1,250
1,3001,240
1,4101,410
1,060
1,320
1,350
1, 730
1,590
1,520
1,950
34
27
30
40
35
35
18
38
34
52 96
40 --
50 95
64 --
42 96
52 --
186 -—
47 --
30 97
27 ——
38 --
35 --
29 --
29 --
206 --
34 97
36 97
648 --
114 --
171 87
171 —-
48 --
39 97
72 -—
164 ——
89 —-
66 --
76 95
1,850 ——
32 ——
0.00
.00
1.39
3.10
3.68
3.59
.00
4.03
4.90
3.30
2.77
2.80
.00
3.61
2.71
.00
1.05
4.04
2.62
1.33
2.34
1.29
.00
4.35
64, 300
59, 000
2,560
2,010
2,060
2,090
2,810
2,270
2,220
1,920
1,680
1, 780
3,550
2, 120
2,220
5,010
2,250
2,660
3,870
2,460
3, 160
2,880
3,340
3,030
3,290
11,000
2,260
79
75
86
88
7777
90
75
29
86
77
73
82
90
82
88
82
7.8
8.2
8.1
8.0
8.3
8.3
7.9
8.2
8.5
7.6
8.0
7.8
7.8
8.0
7.9
7.4
8.1
8.2
7.8
8.1
8.1
2525
32
24
29
30
25
23
28
32
28
31
28
See footnotes at end of table.
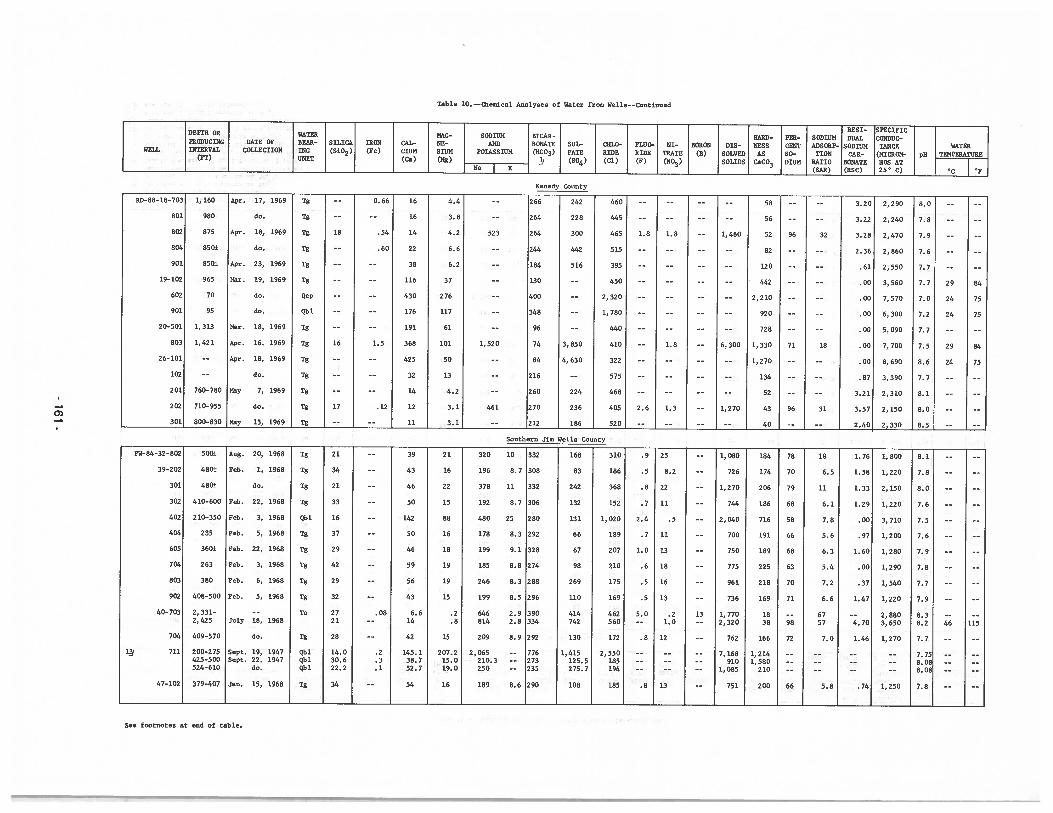
Table 10. --t2,emical Analyses of Water frost Wells--Continued
0)
J RESI- SPECIFICDEPTH OR WATER Mac- SODIUM BICAR- HARD- PER- SODIUM DUAL CONDUCPRODUCING DATE OF BEAR- SILICA IRON CAL- NE- AID BONATE SUL- CHLO- FLUO- NI- BORON DIS- NESS CENT ADSORP- SODIUM TARCE WATERWELL INTERVAL COLLECTION HAG (Sic)2) (Fe) CItJM SflJM pO’ASI’jM (Rca3) FATE RIDE RIDE TEATS (B) SOLVED AS SO- TION CAR- (MICROM- pH TEMPERATURE(FT)____
Na K(S04) (9 (NO SOLIDS CaCO3 D RATIO BORATE
‘F
Kenedy County
RD—88—18—703 1, 160 Apr. 17, 1969 Tg —— 0.66 16 4.4 —— 266 242 460 -— —— ———— 58 —— —— 3.20 2, 290 8.0 -- ——
801 980 do. Tg -- -- 16 3.8 -- 264 228 445 -— -- —- -- 56 —--- 3.22 2,240 7.8 -- --
802 875 Apr. 18, 1969 Tg 18 .54 14 4.2 523 264 300 465 1.8 1.8 -— 1,460 52 96 32 3.28 2,470 7.9 -— --
804 850± do. Tg —- .60 22 6.6 -- 244 442 515 -- -- -- -- 82 --—- 2.36 2,860 7.6 -— --
901 850± Apr. 23, 1969 Tg ---- 38 6.2 —— 184 516 395 -- -- —-
-— 120 ---- .61 2,550 7.7 -- --
19-102 965 Mar. 19, 1969 Tg -- -— 116 37 -- 130-- 450 -— -— -—
-- 442 -— -- .00 3,560 7.7 29 84
602 70 do. Qep -- -- 430 276 -- 400 -- 2,320 -- -- --—— 2,210 -- -- .00 7,570 7.0 24 75
901 95 do. Qbl -— -- 176 117-- 348 -- 1,780 -— -- -- —- 920 -- -- .00 6,300 7.2 24 75
20—501 1, 313 Mar. 18, 1969 Tg —— -— 191 61 —- 96—— 440 —— -— —— —— 728 -— -— .00 5, 090 7.7 —— —-
803 1,421 Apr. 16, 1969 Tg 16 1.5 368 101 1,520 74 3,850 410 -- 1.8 —- 6,300 1,330 71 18 .00 7,700 7.5 29 84
26-101 -- Apr. 18, 1969 Tg -- -- 425 50-- 84 4,630 322 -— —— -—
-- 1,270 -- -- .00 8,690 8.6 24 75
102-- do. Tg --
-- 32 13-- 216 —— 575 -- —— -- —— 134 -- —— .87 3,390 7.7 -— --
201 760-780 May 7, 1969 Tg -- -- 14 4.2 —- 260 224 468 -— -- -- -- 52 ---- 3.21 2,310 8.1 -— —-
202 710-955 do. Tg 17 .12 12 3.1 461 270 236 405 2.6 1.3 -- 1,270 43 96 31 3.57 2,150 8.0 -- -—
301 800-830 May 13, 1969 Tg -- —- 11 3.1 -- 212 186 520 -— —- ---- 40 --
-- 2.40 2,330 8.5 -- -—
Southern Jim Wells County
PW-84-32-802 500± Aug. 20, 1968 Tg 21-- 39 21 320 10 332 168 310 .9 25 -— 1,080 184 78 10 1.76 1,800 8.1 -- --
39-202 480± Feb. 1, 1968 Tg 34-- 43 16 196 8.7 308 83 186 .5 8.2 -- 726 174 70 6.5 1.58 1,220 7.8 -- --
301 480± do. Tg 21 -- 46 22 378 11 332 242 368 .8 22 -- 1,270 206 79 11 1.33 2,150 8.0 -— --
302 410—600 Feb. 22, 1968 Tg 33 -- 50 15 192 8.7 306 132 152 .7 11-— 744 186 68 6.1 1.29 1,220 7.6 -- --
402 210-350 Feb. 3, 1968 Qbl 16 -- 142 88 480 25 280 131 1,020 2.4 .5 -- 2,040 716 58 7.8 .00 3,710 7.5 -- --
404 235 Feb. 5, 1968 Tg 37 -- 50 16 178 8.3 292 66 189 .7 11 -— 700 191 66 5.6 .97 1,200 7.6 -- --
605 360± Feb. 22, 1968 Ig 29 -— 46 18 199 9.1 328 67 207 1.0 13 -- 750 189 68 6.3 1.60 1,280 7.9 —— --
704 263 Feb. 3, 1968 Tg 42 —- 59 19 185 8.8 274 98 210 .6 18-- 775 225 63 5.4 .00 1,290 7.8 -- —-
803 380 Feb. 6, 1968 Tg 29 -— 56 19 246 8.3 288 269 175 .5 16 —— 961 218 70 7.2 .37 1,540 7.7 —- ——
902 408—500 Feb. 5, 1968 Tg 32 —— 43 15 199 8.5 296 110 169 .5 13 —— 736 169 71 6.6 1.47 1,220 7.9 —— ——
40-703 2,331--- To 27 .08 6.6 .2 646 2.9 390 414 462 5.0 .2 13 1,770 18 -- 67 -- 2,880 8.3 -- --
2,425 July 18, 1968 21-- 14 .8 814 2.8 334 742 560 -- 1.0
—- 2,320 38 98 57 4.70 3,650 8.2 46 115
704 409-570 do. Tg 28 -- 42 15 209 8.9 292 130 172 .8 12 -- 762 166 72 7.0 1.46 1,270 7.7 -- ——
l/ 711 200—275 Sept. 19, 1947 Qbl 14.0 .2 145.1 207.2 2,065 —— 776 1,415 2,550 —— —— —— 7,168 1,214 —— —— ———— 7.75 —— ——
425-500 Sept. 22, 1947 Qbl 30.6 .3 38.7 15.0 210.3 -— 273 125.5 185 -- -—-- 910 1,580 -- -- --
-— 8.08 -- --
524-610 do. Qbl 22.2 .1 52.7 19.0 250 -- 235 275.7 194 —- -— —— 1,085 210 -- -- -- —- 8.08 -- -—
47-102 379-407 Jan. 15, 1968 Tg 34 -— 54 16 189 8.6 290 108 185 .8 13 —- 751 200 66 5.8 .74 1,250 7.8 -- --
See footnotes at end of table.
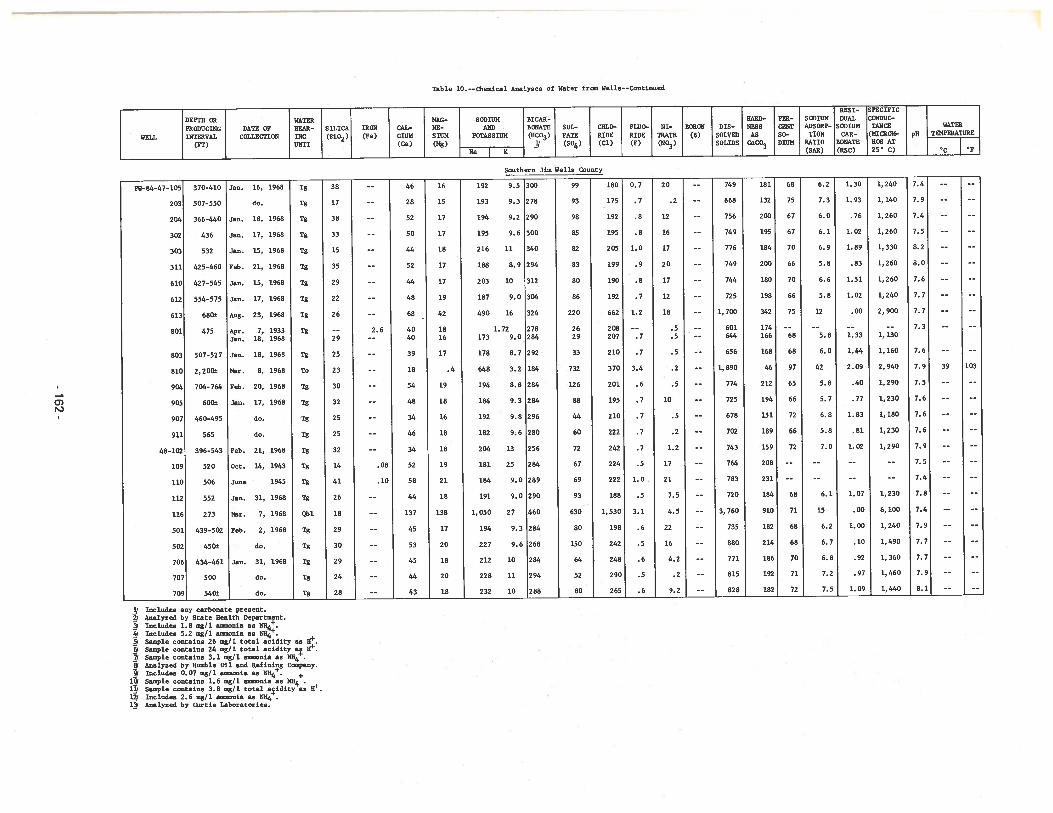
Table 10. --3,einical Analyses of Water from Wells--Continued
RESI- SPECIFIC
DEPTH OR WATER NRC- SODIUM BICAR- HARD- PER- SODIUM DUAL CONDUC
PRODUCING DATE OF BEAR- SILICA IRON CAL- NE- AND BONATE SUL- CHLO- FUJO- HI- BORON 015- NESS CENT ADSORP- sOoiuM WATER
WELL INTERVAL COLLECTION ING (5i02) (Fe) dUN SlUM POTASSIUM (HCO3) FATE RIDE RIDE TEATE (B) SOLVED AS SO- TION CAR- (MICROM- pH TEMPERATURE
(PT) UNIT (Ca) (Mg) JJ (SO4) (Cl) (F) (NO3) SOLIDS CaCO3 DIUM RATIO BONATE lOS AT
Na K (SAR)(RSC)25’C) — ‘C ‘P
Southern Jim Wells County
P11-84-47-105 370-410 Jan. 16, 1968 Tg 38 -- 46 16 192 9.5 300 99 180 0.7 20 -- 749 181 68 6.2 1.30 1,240 7.4 —- --
203 507-550 do. Tg 17 -- 28 15 193 9.3 278 93 175 .7 .2 -- 668 132 75 7.3 1.93 1,140 7.9 -— --
204 366-440 Jan. 18, 1968 Tg 38 —- 52 17 194 9.2 290 98 192 .8 12 -- 756 200 67 6.0 .76 1,260 7.4 -- --
302 436 Jan. 17, 1968 Tg 33 -- 50 17 195 9.6 300 85 195 .8 16 -— 749 195 67 6.1 1.02 1,260 7.5 -- --
303 532 Jan. 15, 1968 Tg 15 -— 44 18 216 11 340 82 205 1.0 17 -- 776 184 70 6.9 1.89 1,330 8.2 -— --
311 425—460 Feb. 21, 1968 Tg 35 —— 52 17 188 8.9 294 83 199 .9 20 -- 749 200 66 5.8 .83 1,260 8.0 -— --
610 427-545 Jan. 15, 1968 Tg 29 —- 44 17 203 10 312 80 190 .8 17 —— 744 180 70 6.6 1.51 1,260 7.6 -- --
612 554-575 Jan. 17, 1968 Tg 22 -— 48 19 187 9.0 304 86 192 .7 12 —- 725 198 66 5.8 1.02 1,240 7.7 —- -—
613 680± Aug. 23, 1968 Tg 26 -— 68 42 490 16 324 220 662 1.2 18 -— 1,700 342 75 12 .00 2,900 7.7 -— ——
801 475 Apr. 7, 1933 Tg -- 2.6 40 18 1.72 278 26 208 —- .5 —- 601 174 -- -- -- -— 7.3 —- -—
Jan. 18, 1968 29 —- 40 16 173 9.0 284 29 207 .7 .5 —- 644 166 68 5.8 1.33 1,130
803 507-527 Jan. 18, 1968 Tg 25 -- 39 17 178 8.7 292 33 210 .7 .5 -- 656 168 68 6.0 1.44 1, 160 7.6 -- --
810 2,200± Mar. 8, 1968 To 23 -- 18 .4 648 3.2 184 732 370 3.4 .2 -- 1,890 46 97 42 2.09 2,940 7.9 39 103
904 704-764 Feb. 20, 1968 Tg 30 -— 54 19 194 8.8 284 126 201 .6 .5 -— 774 212 65 5.8 .40 1,290 7.5 -- --
905 600± Jan. 17, 1968 Tg 32 -- 48 18 184 9.3 284 88 195 .7 10 -- 725 194 66 5.7 .77 1,230 7.6 -- --
907 460-495 do. Tg 25 -- 34 16 192 9.8 296 44 210 .7 .5 —- 678 151 72 6.8 1.83 1,180 7.6 -- --
911 565 do. Tg 25 -— 46 18 182 9.6 280 60 222 .7 .2 -- 702 189 66 5.8 .81 1,230 7.6 —— --
48-102 396-543 Feb. 21, 1968 Tg 32 -- 34 18 204 13 256 72 242 .7 1.2 —- 743 159 72 7.0 1.02 1,290 7.9 -- --
109 520 Oct. 14, 1943 Tg 14 .08 52 19 181 25 284 67 224 .5 17 -- 764 208 -- -- —- -- 7.5 -- --
110 506 June 1945 Tg 41 .10 58 21 184 9.0 289 69 222 1.0 21 -- 783 231 -— -- -- -- 7.4 -- --
112 552 Jan. 31, 1968 Tg 26 —- 44 18 191 9.0 290 93 188 .5 7.5 -- 720 184 68 6.1 1.07 1,230 7.8 -- ——
116 273 Mar. 7, 1968 Qbl 18 —— 137 138 1,050 27 460 630 1,530 3.1 4.5 -- 3,760 910 71 15 .00 6,100 7.4 -- --
501 439-502 Feb. 2, 1968 Tg 29 —- 45 17 194 9.3 284 80 198 .6 22 -— 735 182 68 6.2 1.00 1,240 7.9 —- --
502 450± do. Tg 30 -— 53 20 227 9.6 268 150 242 .5 16 —- 880 214 68 6.7 .10 1,490 7.7 -- --
706 434-461 Jan. 31, 1968 Tg 29 -— 45 18 212 10 284 64 248 .6 4.2 -- 771 186 70 6.8 .92 1,360 7.7 -- --
707 500 do. Tg 24 -— 44 20 228 11 294 52 290 .5 .2 -- 815 192 71 7.2 .97 1,460 7.9 -- --
709 540± do. Tg 28 -- 43 18 232 10 288 80 265 .6 9.2 -- 828 182 72 7.5 1.09 1,440 8.1 -- --
Includes any carbonate present.Analyzed by State Health Department.Includes 1.8 mg/l anmonia as 111+
I Includes 5.2 mg/l ainia as NH.
/ Sample contains 26 mg/l total acidity as 1i.Sample contains 24 mg/i total acidity as H.
1/ Sample contains 3.1 mg/i ammonia as N114+.
Analyzed by Humble Oil and Refinig Company.Includes 0.07 mg/l ammonia as NH4
. +l Sample contains 1.6 mg/l ammonia as NH4ljj Sample contains 3.8 mg/l total aidity as H.l/ Includes 2.6 mg/l ammonia as 11114l/ Analyzed by Curtis Laboratories.
Related Documents