Replicative Senescence of Mesenchymal Stem Cells: A Continuous and Organized Process Wolfgang Wagner 1,2 *, Patrick Horn 1 , Mirco Castoldi 4 , Anke Diehlmann 1 , Simone Bork 1,5 , Rainer Saffrich 1 , Vladimir Benes 3 , Jonathon Blake 3 , Stefan Pfister 4 , Volker Eckstein 1 , Anthony D. Ho 1 1 Department of Medicine V, University of Heidelberg, Heidelberg, Germany, 2 Department of Physiology and Pathophysiology, University of Heidelberg, Heidelberg, Germany, 3 Genomics Core Facility, European Molecular Biology Laboratory, Heidelberg, Germany, 4 Department of Pediatric Oncology, Hematology and Immunology, University of Heidelberg, Heidelberg, Germany, 5 Heidelberg Academy of Sciences and Humanities, Heidelberg, Germany Abstract Mesenchymal stem cells (MSC) comprise a promising tool for cellular therapy. These cells are usually culture expanded prior to their application. However, a precise molecular definition of MSC and the sequel of long-term in vitro culture are yet unknown. In this study, we have addressed the impact of replicative senescence on human MSC preparations. Within 43 to 77 days of cultivation (7 to 12 passages), MSC demonstrated morphological abnormalities, enlargement, attenuated expression of specific surface markers, and ultimately proliferation arrest. Adipogenic differentiation potential decreased whereas the propensity for osteogenic differentiation increased. mRNA expression profiling revealed a consistent pattern of alterations in the global gene expression signature of MSC at different passages. These changes are not restricted to later passages, but are continuously acquired with increasing passages. Genes involved in cell cycle, DNA replication and DNA repair are significantly down-regulated in late passages. Genes from chromosome 4q21 were over-represented among differentially regulated transcripts. Differential expression of 10 genes has been verified in independent donor samples as well as in MSC that were isolated under different culture conditions. Furthermore, miRNA expression profiling revealed an up-regulation of hsa-mir-371, hsa-mir-369-5P, hsa-mir-29c, hsa-mir-499 and hsa-let-7f upon in vitro propagation. Our studies indicate that replicative senescence of MSC preparations is a continuous process starting from the first passage onwards. This process includes far reaching alterations in phenotype, differentiation potential, global gene expression patterns, and miRNA profiles that need to be considered for therapeutic application of MSC preparations. Citation: Wagner W, Horn P, Castoldi M, Diehlmann A, Bork S, et al. (2008) Replicative Senescence of Mesenchymal Stem Cells: A Continuous and Organized Process. PLoS ONE 3(5): e2213. doi:10.1371/journal.pone.0002213 Editor: Thomas Zwaka, Baylor College of Medicine, United States of America Received January 22, 2008; Accepted April 11, 2008; Published May 21, 2008 Copyright: ß 2008 Wagner et al. This is an open-access article distributed under the terms of the Creative Commons Attribution License, which permits unrestricted use, distribution, and reproduction in any medium, provided the original author and source are credited. Funding: This work was supported by the German Ministry of Education and Research (BMBF) within the National Genome Research Network NGFN-2 (EP- S19T01) and within the supporting program ‘‘cell based regenerative medicine’’ (START-MSC), the German Research Foundation DFG (HO 914/7-1), the Joachim Siebeneicher-Stiftung, Germany and the Academy of Sciences and Humanities, Heidelberg (WIN-Kolleg). Competing Interests: The authors have declared that no competing interests exist. * E-mail: [email protected] Introduction Mesenchymal stem cells (MSC) represent a multipotent adult stem cell population that, given the appropriate culture conditions, is able to differentiate into different mesodermal cell lineages including osteocytes, chondrocytes, and adipocytes. Albeit contro- versial, there is evidence that MSC can also differentiate into myocytes and cardiomyocytes and even into cells of non- mesodermal origin including hepatocytes and neurons [1–4]. Reliable markers for the definition of the multipotent fraction have not yet been defined and hence these cells have alternatively been named mesenchymal stromal cells [5]. Due to the lack of reliable molecular markers, MSC are concurrently defined by: a) plastic adherent growth, b) immunophenotype and c) their in vitro differentiation potential [6,7]. Nevertheless, human MSC raise high hopes in various therapeutic applications and their use is concurrently tested in various clinical trials [7]. MSC have a limited lifespan in vitro as any normal, somatic cell. After a certain number of cell divisions, MSC enter senescence, which is morphologically characterized by enlarged and irregular cell shapes and ultimately a stop of proliferation. This phenom- enon was first described in the 1960s by Leonard Hayflick [8]. Since then, it is debated if the so-called ‘‘Hayflick limit’’ might reflect the aging process of the whole organism. If cellular senescence triggers aging, this would be of utmost importance for all adult stem cells. The tissues of any organism are continuously renewed by adult stem cells and impairment of their function would inevitably result in aging [9]. Recent studies have indicated that murine and human MSC exhibit reduced differentiation potential upon prolonged in vitro culture [10–13]. Furthermore, senescence of MSC might limit their therapeutic applications. Thus, analysis of in vitro senescence in MSC is crucial for basic research as well as for quality control in cellular therapy. The molecular mechanisms that underlie senescence are still poorly understood. Two fundamental ways have been hypothe- sized how this process may be governed: replicative senescence might either be the result of a purposeful program driven by genes or rather be evoked by stochastic or random, accidental events [14]. Most likely, it is an interplay of both mechanisms that promotes aging at various levels. Progressive shortening of the telomeres or modified telomeric structure has been associated with replicative senescence although this mechanism is unlikely to be the only cause of this phenomenon [15,16]. There is also evidence that senescence involves DNA damage, accumulation of the PLoS ONE | www.plosone.org 1 May 2008 | Volume 3 | Issue 5 | e2213

Welcome message from author
This document is posted to help you gain knowledge. Please leave a comment to let me know what you think about it! Share it to your friends and learn new things together.
Transcript
Replicative Senescence of Mesenchymal Stem Cells: AContinuous and Organized ProcessWolfgang Wagner1,2*, Patrick Horn1, Mirco Castoldi4, Anke Diehlmann1, Simone Bork1,5, Rainer
Saffrich1, Vladimir Benes3, Jonathon Blake3, Stefan Pfister4, Volker Eckstein1, Anthony D. Ho1
1 Department of Medicine V, University of Heidelberg, Heidelberg, Germany, 2 Department of Physiology and Pathophysiology, University of Heidelberg, Heidelberg,
Germany, 3 Genomics Core Facility, European Molecular Biology Laboratory, Heidelberg, Germany, 4 Department of Pediatric Oncology, Hematology and Immunology,
University of Heidelberg, Heidelberg, Germany, 5 Heidelberg Academy of Sciences and Humanities, Heidelberg, Germany
Abstract
Mesenchymal stem cells (MSC) comprise a promising tool for cellular therapy. These cells are usually culture expanded priorto their application. However, a precise molecular definition of MSC and the sequel of long-term in vitro culture are yetunknown. In this study, we have addressed the impact of replicative senescence on human MSC preparations. Within 43 to77 days of cultivation (7 to 12 passages), MSC demonstrated morphological abnormalities, enlargement, attenuatedexpression of specific surface markers, and ultimately proliferation arrest. Adipogenic differentiation potential decreasedwhereas the propensity for osteogenic differentiation increased. mRNA expression profiling revealed a consistent pattern ofalterations in the global gene expression signature of MSC at different passages. These changes are not restricted to laterpassages, but are continuously acquired with increasing passages. Genes involved in cell cycle, DNA replication and DNArepair are significantly down-regulated in late passages. Genes from chromosome 4q21 were over-represented amongdifferentially regulated transcripts. Differential expression of 10 genes has been verified in independent donor samples aswell as in MSC that were isolated under different culture conditions. Furthermore, miRNA expression profiling revealed anup-regulation of hsa-mir-371, hsa-mir-369-5P, hsa-mir-29c, hsa-mir-499 and hsa-let-7f upon in vitro propagation. Our studiesindicate that replicative senescence of MSC preparations is a continuous process starting from the first passage onwards.This process includes far reaching alterations in phenotype, differentiation potential, global gene expression patterns, andmiRNA profiles that need to be considered for therapeutic application of MSC preparations.
Citation: Wagner W, Horn P, Castoldi M, Diehlmann A, Bork S, et al. (2008) Replicative Senescence of Mesenchymal Stem Cells: A Continuous and OrganizedProcess. PLoS ONE 3(5): e2213. doi:10.1371/journal.pone.0002213
Editor: Thomas Zwaka, Baylor College of Medicine, United States of America
Received January 22, 2008; Accepted April 11, 2008; Published May 21, 2008
Copyright: � 2008 Wagner et al. This is an open-access article distributed under the terms of the Creative Commons Attribution License, which permitsunrestricted use, distribution, and reproduction in any medium, provided the original author and source are credited.
Funding: This work was supported by the German Ministry of Education and Research (BMBF) within the National Genome Research Network NGFN-2 (EP-S19T01) and within the supporting program ‘‘cell based regenerative medicine’’ (START-MSC), the German Research Foundation DFG (HO 914/7-1), the JoachimSiebeneicher-Stiftung, Germany and the Academy of Sciences and Humanities, Heidelberg (WIN-Kolleg).
Competing Interests: The authors have declared that no competing interests exist.
* E-mail: [email protected]
Introduction
Mesenchymal stem cells (MSC) represent a multipotent adult
stem cell population that, given the appropriate culture conditions,
is able to differentiate into different mesodermal cell lineages
including osteocytes, chondrocytes, and adipocytes. Albeit contro-
versial, there is evidence that MSC can also differentiate into
myocytes and cardiomyocytes and even into cells of non-
mesodermal origin including hepatocytes and neurons [1–4].
Reliable markers for the definition of the multipotent fraction have
not yet been defined and hence these cells have alternatively been
named mesenchymal stromal cells [5]. Due to the lack of reliable
molecular markers, MSC are concurrently defined by: a) plastic
adherent growth, b) immunophenotype and c) their in vitro
differentiation potential [6,7]. Nevertheless, human MSC raise
high hopes in various therapeutic applications and their use is
concurrently tested in various clinical trials [7].
MSC have a limited lifespan in vitro as any normal, somatic cell.
After a certain number of cell divisions, MSC enter senescence,
which is morphologically characterized by enlarged and irregular
cell shapes and ultimately a stop of proliferation. This phenom-
enon was first described in the 1960s by Leonard Hayflick [8].
Since then, it is debated if the so-called ‘‘Hayflick limit’’ might
reflect the aging process of the whole organism. If cellular
senescence triggers aging, this would be of utmost importance for
all adult stem cells. The tissues of any organism are continuously
renewed by adult stem cells and impairment of their function
would inevitably result in aging [9]. Recent studies have indicated
that murine and human MSC exhibit reduced differentiation
potential upon prolonged in vitro culture [10–13]. Furthermore,
senescence of MSC might limit their therapeutic applications.
Thus, analysis of in vitro senescence in MSC is crucial for basic
research as well as for quality control in cellular therapy.
The molecular mechanisms that underlie senescence are still
poorly understood. Two fundamental ways have been hypothe-
sized how this process may be governed: replicative senescence
might either be the result of a purposeful program driven by genes
or rather be evoked by stochastic or random, accidental events
[14]. Most likely, it is an interplay of both mechanisms that
promotes aging at various levels. Progressive shortening of the
telomeres or modified telomeric structure has been associated with
replicative senescence although this mechanism is unlikely to be
the only cause of this phenomenon [15,16]. There is also evidence
that senescence involves DNA damage, accumulation of the
PLoS ONE | www.plosone.org 1 May 2008 | Volume 3 | Issue 5 | e2213
cyclin-dependent kinase inhibitor p16INK4a and oxidative stress
[9,17,18]. Clearly, cellular senescence is a complex process and the
sequence of its molecular events is thus far unknown. Additionally,
it is not known how senescence influences the overall expression of
coding genes and micro RNAs in MSC.
With this in mind, we devised a study to analyze how
morphology, immunophenotype and differentiation capacity of
MSC is affected by in vitro expansion. In parallel, we analyzed how
mRNA and miRNA expression profiles change upon culturing
and in vitro propagation. We intended to gain insight into the
molecular effects of replicative senescence even at early passages
that would have impact for the quality control of MSC
preparations used for therapeutic application.
Results
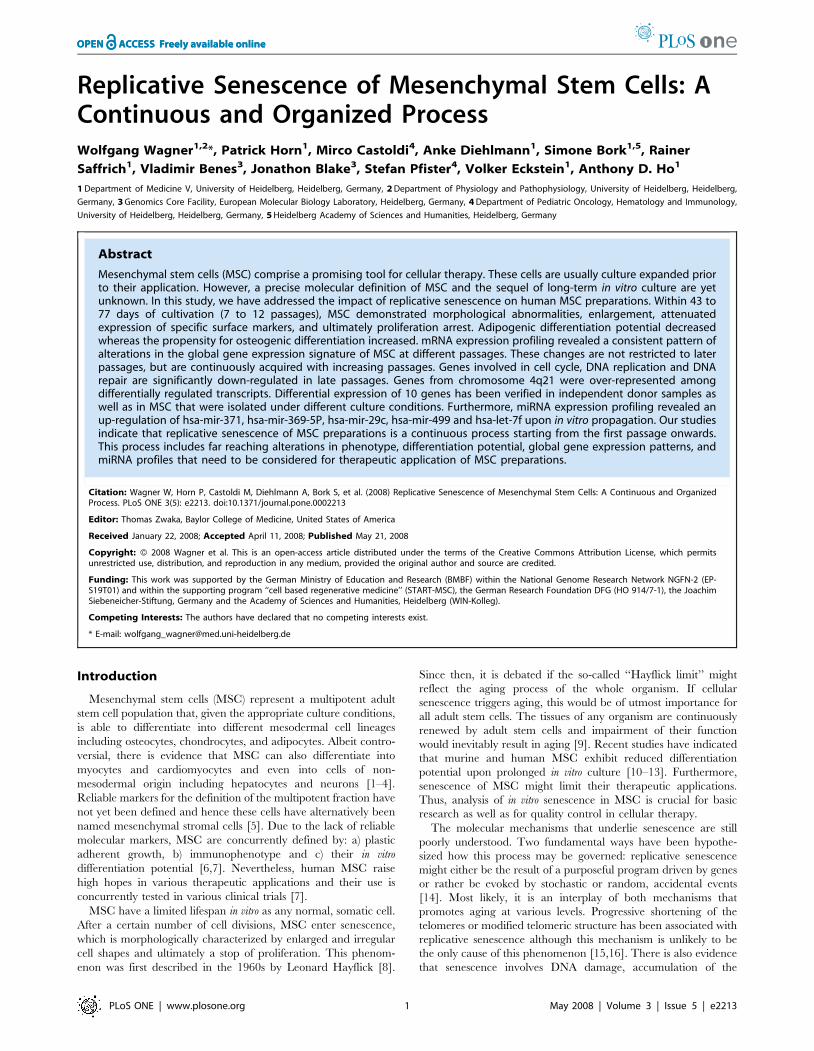
Long-term growth kinetics and morphology of MSCPlastic-adherent fibroblast-like colonies were observed in all
donor samples within the first days of cultivation. Proliferation
gradually decreased in all samples in the course of long-term
cultivation until the cells finally stopped to proliferate. Under
culture conditions with low serum content and supplemented
growth factors (MSCM1) cells proliferated relatively fast for 43 to
77 days, whereas MSC cultured in the commercial cambrex
medium with 10% serum (MSCM2) resulted in prolongated growth
for 74 to 104 days. Long-term growth curves differed considerably
between the eight donor samples and the proliferation rate varied
over the time course although the cells were always passaged at the
same density of about 70% confluence (figure 1). The cumulative
number of population doublings varied between 6 and 16 plus an
estimated 7 to 9 population doublings during the initial colony
formation. Overall, this would result in a maximal cell number of
3.66108 to 7.161011 for MSCM1 and 1.16108 to 1.76108 for
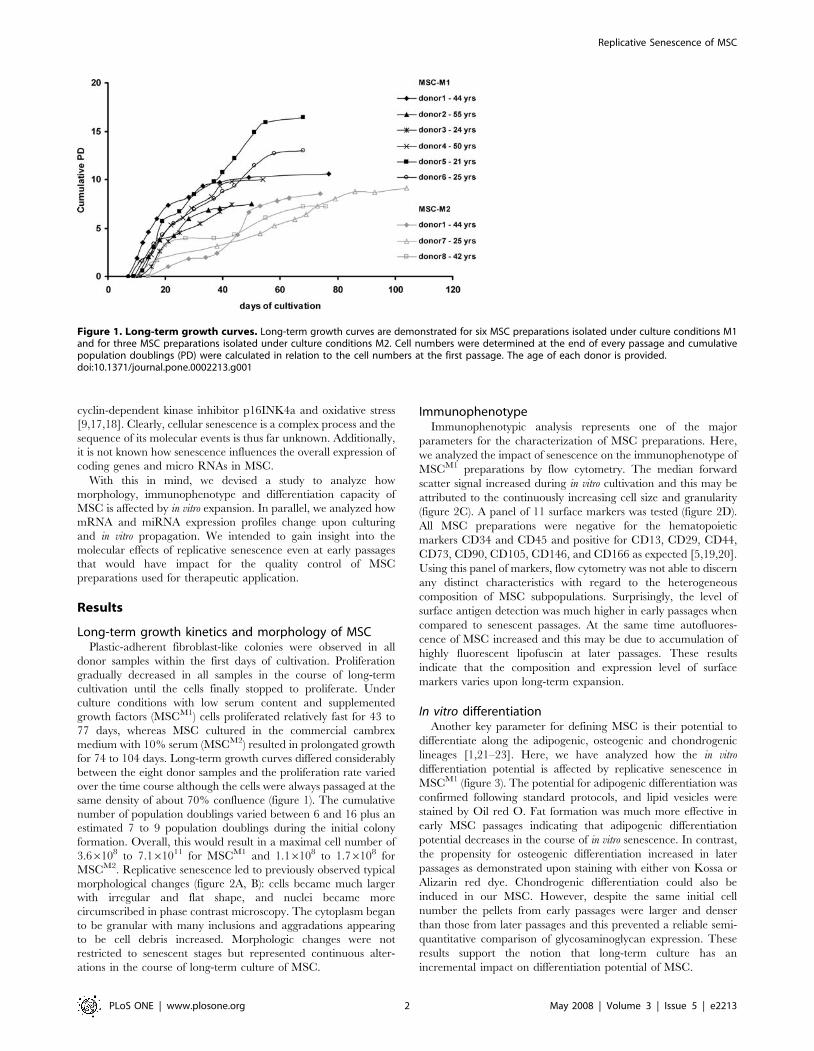
MSCM2. Replicative senescence led to previously observed typical
morphological changes (figure 2A, B): cells became much larger
with irregular and flat shape, and nuclei became more
circumscribed in phase contrast microscopy. The cytoplasm began
to be granular with many inclusions and aggradations appearing
to be cell debris increased. Morphologic changes were not
restricted to senescent stages but represented continuous alter-
ations in the course of long-term culture of MSC.
ImmunophenotypeImmunophenotypic analysis represents one of the major
parameters for the characterization of MSC preparations. Here,
we analyzed the impact of senescence on the immunophenotype of
MSCM1 preparations by flow cytometry. The median forward
scatter signal increased during in vitro cultivation and this may be
attributed to the continuously increasing cell size and granularity
(figure 2C). A panel of 11 surface markers was tested (figure 2D).
All MSC preparations were negative for the hematopoietic
markers CD34 and CD45 and positive for CD13, CD29, CD44,
CD73, CD90, CD105, CD146, and CD166 as expected [5,19,20].
Using this panel of markers, flow cytometry was not able to discern
any distinct characteristics with regard to the heterogeneous
composition of MSC subpopulations. Surprisingly, the level of
surface antigen detection was much higher in early passages when
compared to senescent passages. At the same time autofluores-
cence of MSC increased and this may be due to accumulation of
highly fluorescent lipofuscin at later passages. These results
indicate that the composition and expression level of surface
markers varies upon long-term expansion.
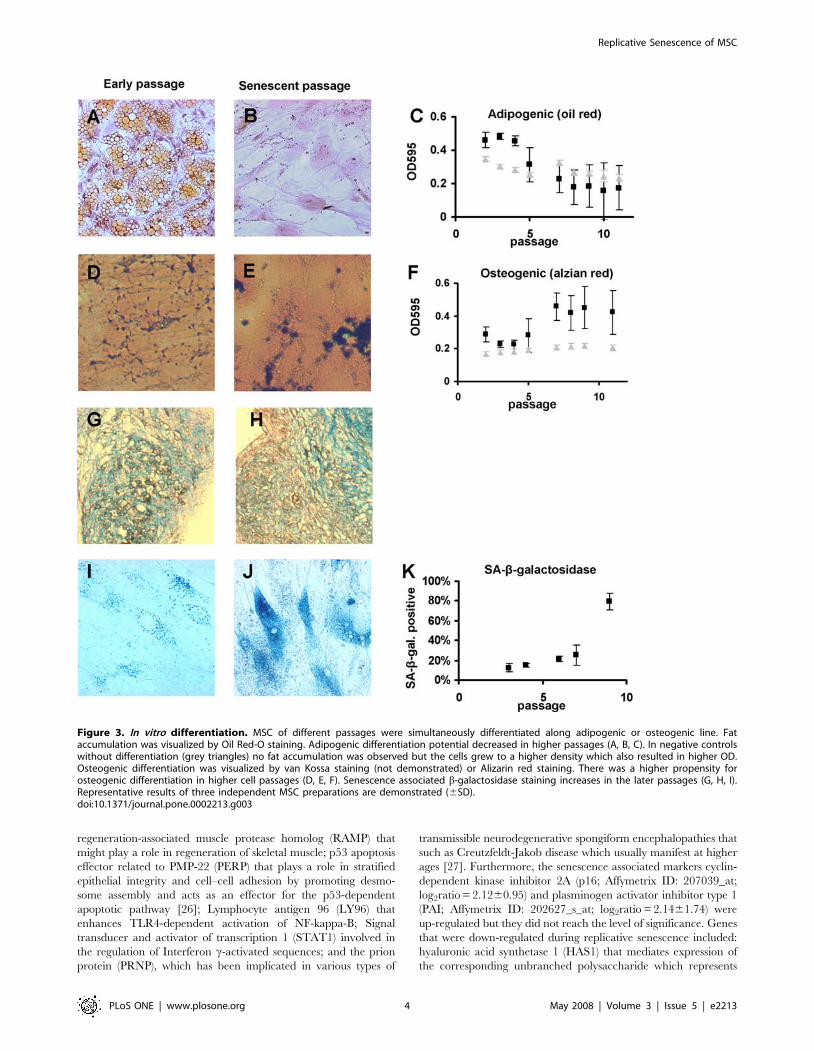
In vitro differentiationAnother key parameter for defining MSC is their potential to
differentiate along the adipogenic, osteogenic and chondrogenic
lineages [1,21–23]. Here, we have analyzed how the in vitro
differentiation potential is affected by replicative senescence in
MSCM1 (figure 3). The potential for adipogenic differentiation was
confirmed following standard protocols, and lipid vesicles were
stained by Oil red O. Fat formation was much more effective in
early MSC passages indicating that adipogenic differentiation
potential decreases in the course of in vitro senescence. In contrast,
the propensity for osteogenic differentiation increased in later
passages as demonstrated upon staining with either von Kossa or
Alizarin red dye. Chondrogenic differentiation could also be
induced in our MSC. However, despite the same initial cell
number the pellets from early passages were larger and denser
than those from later passages and this prevented a reliable semi-
quantitative comparison of glycosaminoglycan expression. These
results support the notion that long-term culture has an
incremental impact on differentiation potential of MSC.
Figure 1. Long-term growth curves. Long-term growth curves are demonstrated for six MSC preparations isolated under culture conditions M1and for three MSC preparations isolated under culture conditions M2. Cell numbers were determined at the end of every passage and cumulativepopulation doublings (PD) were calculated in relation to the cell numbers at the first passage. The age of each donor is provided.doi:10.1371/journal.pone.0002213.g001
Replicative Senescence of MSC
PLoS ONE | www.plosone.org 2 May 2008 | Volume 3 | Issue 5 | e2213
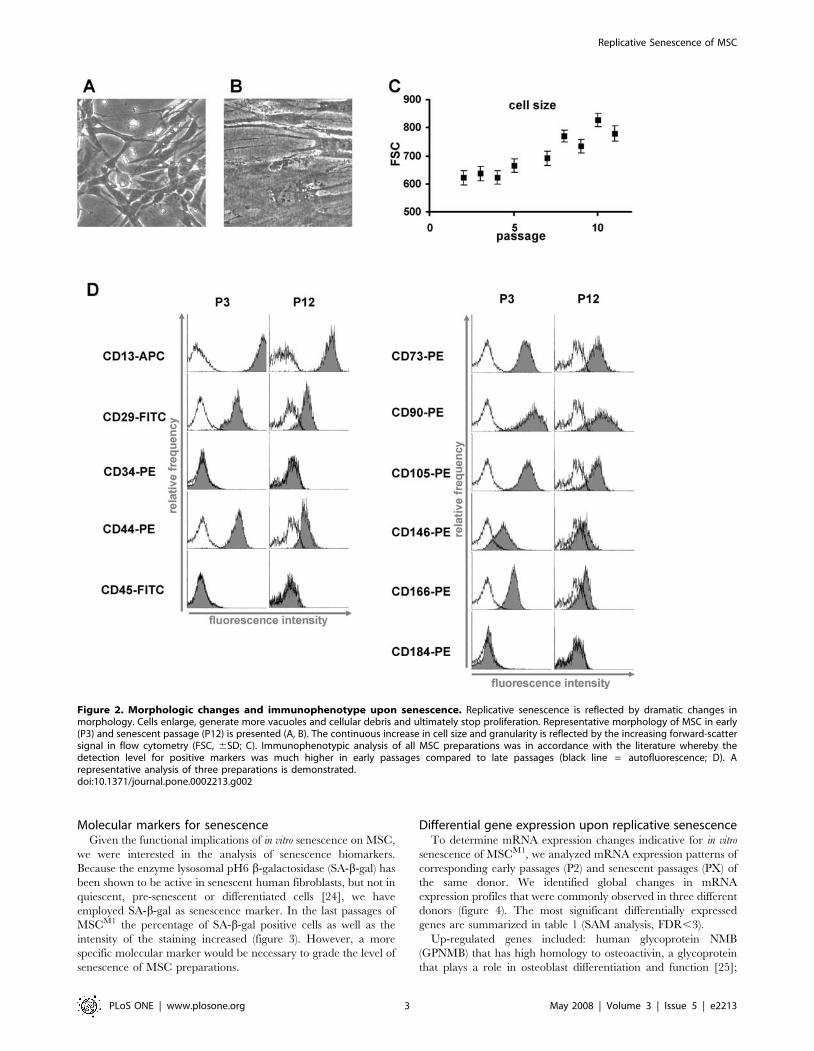
Molecular markers for senescenceGiven the functional implications of in vitro senescence on MSC,
we were interested in the analysis of senescence biomarkers.
Because the enzyme lysosomal pH6 b-galactosidase (SA-b-gal) has
been shown to be active in senescent human fibroblasts, but not in
quiescent, pre-senescent or differentiated cells [24], we have
employed SA-b-gal as senescence marker. In the last passages of
MSCM1 the percentage of SA-b-gal positive cells as well as the
intensity of the staining increased (figure 3). However, a more
specific molecular marker would be necessary to grade the level of
senescence of MSC preparations.
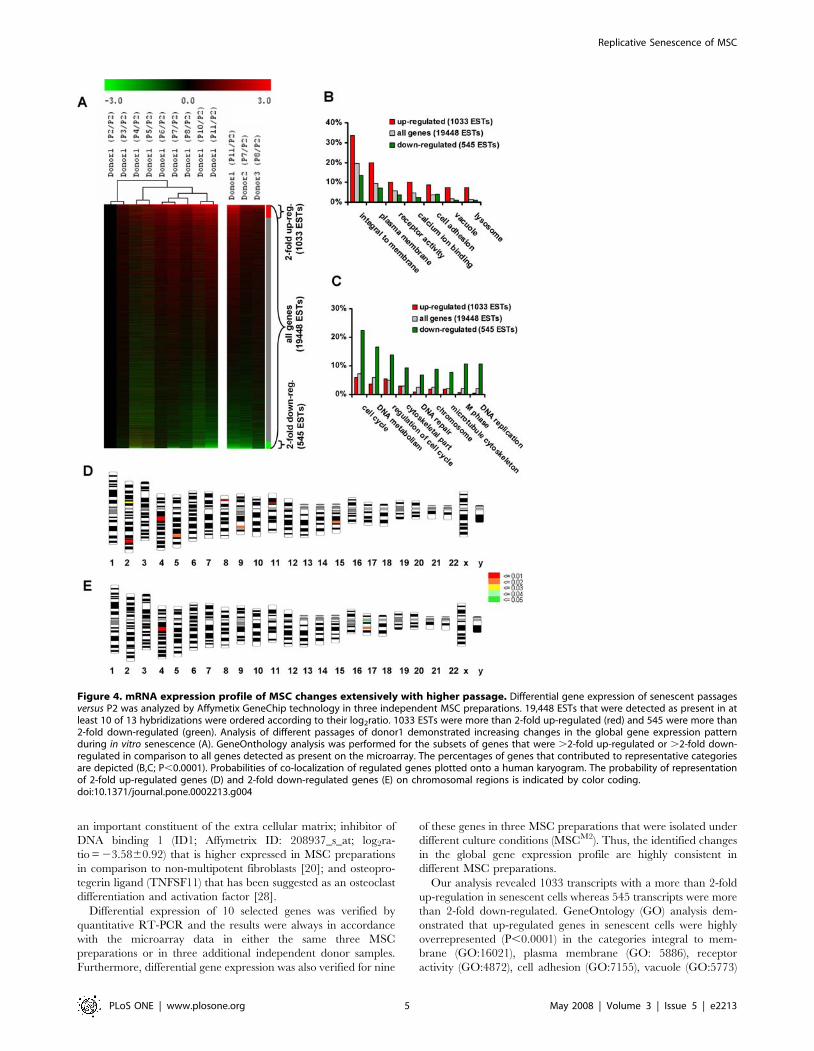
Differential gene expression upon replicative senescenceTo determine mRNA expression changes indicative for in vitro
senescence of MSCM1, we analyzed mRNA expression patterns of
corresponding early passages (P2) and senescent passages (PX) of
the same donor. We identified global changes in mRNA
expression profiles that were commonly observed in three different
donors (figure 4). The most significant differentially expressed
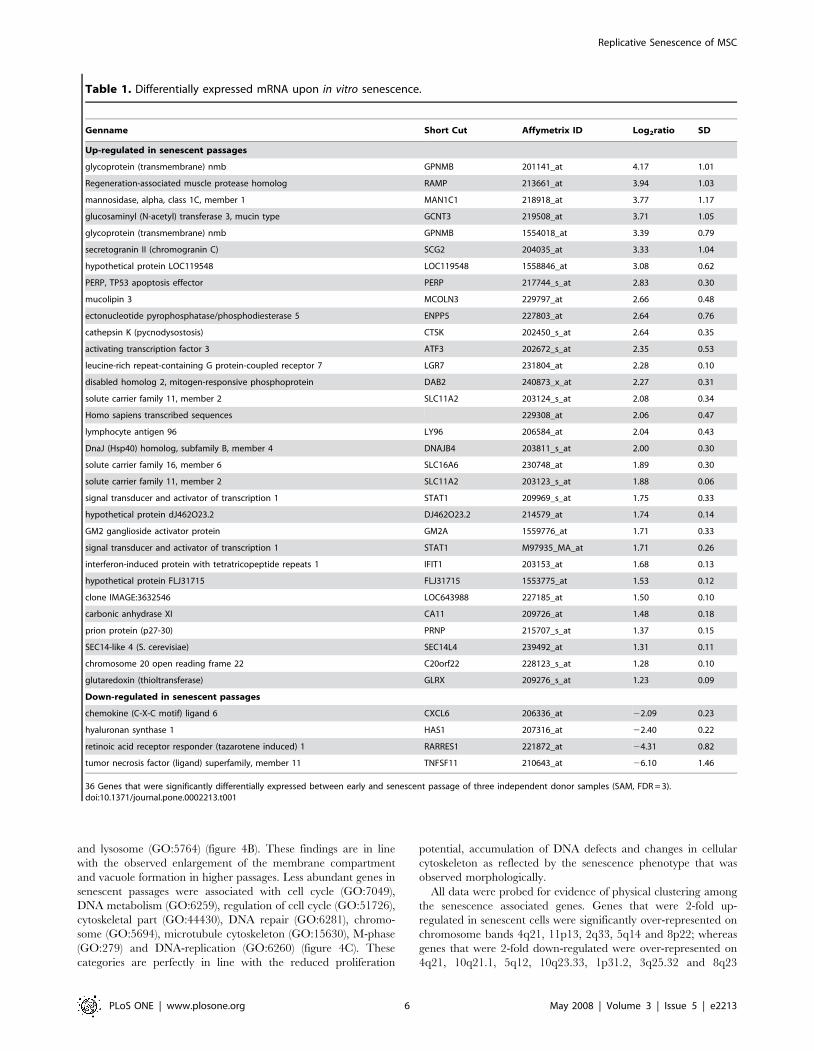
genes are summarized in table 1 (SAM analysis, FDR,3).
Up-regulated genes included: human glycoprotein NMB
(GPNMB) that has high homology to osteoactivin, a glycoprotein
that plays a role in osteoblast differentiation and function [25];
Figure 2. Morphologic changes and immunophenotype upon senescence. Replicative senescence is reflected by dramatic changes inmorphology. Cells enlarge, generate more vacuoles and cellular debris and ultimately stop proliferation. Representative morphology of MSC in early(P3) and senescent passage (P12) is presented (A, B). The continuous increase in cell size and granularity is reflected by the increasing forward-scattersignal in flow cytometry (FSC, 6SD; C). Immunophenotypic analysis of all MSC preparations was in accordance with the literature whereby thedetection level for positive markers was much higher in early passages compared to late passages (black line = autofluorescence; D). Arepresentative analysis of three preparations is demonstrated.doi:10.1371/journal.pone.0002213.g002
Replicative Senescence of MSC
PLoS ONE | www.plosone.org 3 May 2008 | Volume 3 | Issue 5 | e2213
regeneration-associated muscle protease homolog (RAMP) that
might play a role in regeneration of skeletal muscle; p53 apoptosis
effector related to PMP-22 (PERP) that plays a role in stratified
epithelial integrity and cell–cell adhesion by promoting desmo-
some assembly and acts as an effector for the p53-dependent
apoptotic pathway [26]; Lymphocyte antigen 96 (LY96) that
enhances TLR4-dependent activation of NF-kappa-B; Signal
transducer and activator of transcription 1 (STAT1) involved in
the regulation of Interferon c-activated sequences; and the prion
protein (PRNP), which has been implicated in various types of
transmissible neurodegenerative spongiform encephalopathies that
such as Creutzfeldt-Jakob disease which usually manifest at higher
ages [27]. Furthermore, the senescence associated markers cyclin-
dependent kinase inhibitor 2A (p16; Affymetrix ID: 207039_at;
log2ratio = 2.1260.95) and plasminogen activator inhibitor type 1
(PAI; Affymetrix ID: 202627_s_at; log2ratio = 2.1461.74) were
up-regulated but they did not reach the level of significance. Genes
that were down-regulated during replicative senescence included:
hyaluronic acid synthetase 1 (HAS1) that mediates expression of
the corresponding unbranched polysaccharide which represents
Figure 3. In vitro differentiation. MSC of different passages were simultaneously differentiated along adipogenic or osteogenic line. Fataccumulation was visualized by Oil Red-O staining. Adipogenic differentiation potential decreased in higher passages (A, B, C). In negative controlswithout differentiation (grey triangles) no fat accumulation was observed but the cells grew to a higher density which also resulted in higher OD.Osteogenic differentiation was visualized by van Kossa staining (not demonstrated) or Alizarin red staining. There was a higher propensity forosteogenic differentiation in higher cell passages (D, E, F). Senescence associated b-galactosidase staining increases in the later passages (G, H, I).Representative results of three independent MSC preparations are demonstrated (6SD).doi:10.1371/journal.pone.0002213.g003
Replicative Senescence of MSC
PLoS ONE | www.plosone.org 4 May 2008 | Volume 3 | Issue 5 | e2213
an important constituent of the extra cellular matrix; inhibitor of
DNA binding 1 (ID1; Affymetrix ID: 208937_s_at; log2ra-
tio = 23.5860.92) that is higher expressed in MSC preparations
in comparison to non-multipotent fibroblasts [20]; and osteopro-
tegerin ligand (TNFSF11) that has been suggested as an osteoclast
differentiation and activation factor [28].
Differential expression of 10 selected genes was verified by
quantitative RT-PCR and the results were always in accordance
with the microarray data in either the same three MSC
preparations or in three additional independent donor samples.
Furthermore, differential gene expression was also verified for nine
of these genes in three MSC preparations that were isolated under
different culture conditions (MSCM2). Thus, the identified changes
in the global gene expression profile are highly consistent in
different MSC preparations.
Our analysis revealed 1033 transcripts with a more than 2-fold
up-regulation in senescent cells whereas 545 transcripts were more
than 2-fold down-regulated. GeneOntology (GO) analysis dem-
onstrated that up-regulated genes in senescent cells were highly
overrepresented (P,0.0001) in the categories integral to mem-
brane (GO:16021), plasma membrane (GO: 5886), receptor
activity (GO:4872), cell adhesion (GO:7155), vacuole (GO:5773)
Figure 4. mRNA expression profile of MSC changes extensively with higher passage. Differential gene expression of senescent passagesversus P2 was analyzed by Affymetix GeneChip technology in three independent MSC preparations. 19,448 ESTs that were detected as present in atleast 10 of 13 hybridizations were ordered according to their log2ratio. 1033 ESTs were more than 2-fold up-regulated (red) and 545 were more than2-fold down-regulated (green). Analysis of different passages of donor1 demonstrated increasing changes in the global gene expression patternduring in vitro senescence (A). GeneOnthology analysis was performed for the subsets of genes that were .2-fold up-regulated or .2-fold down-regulated in comparison to all genes detected as present on the microarray. The percentages of genes that contributed to representative categoriesare depicted (B,C; P,0.0001). Probabilities of co-localization of regulated genes plotted onto a human karyogram. The probability of representationof 2-fold up-regulated genes (D) and 2-fold down-regulated genes (E) on chromosomal regions is indicated by color coding.doi:10.1371/journal.pone.0002213.g004
Replicative Senescence of MSC
PLoS ONE | www.plosone.org 5 May 2008 | Volume 3 | Issue 5 | e2213
and lysosome (GO:5764) (figure 4B). These findings are in line
with the observed enlargement of the membrane compartment
and vacuole formation in higher passages. Less abundant genes in
senescent passages were associated with cell cycle (GO:7049),
DNA metabolism (GO:6259), regulation of cell cycle (GO:51726),
cytoskeletal part (GO:44430), DNA repair (GO:6281), chromo-
some (GO:5694), microtubule cytoskeleton (GO:15630), M-phase
(GO:279) and DNA-replication (GO:6260) (figure 4C). These
categories are perfectly in line with the reduced proliferation
potential, accumulation of DNA defects and changes in cellular
cytoskeleton as reflected by the senescence phenotype that was
observed morphologically.
All data were probed for evidence of physical clustering among
the senescence associated genes. Genes that were 2-fold up-
regulated in senescent cells were significantly over-represented on
chromosome bands 4q21, 11p13, 2q33, 5q14 and 8p22; whereas
genes that were 2-fold down-regulated were over-represented on
4q21, 10q21.1, 5q12, 10q23.33, 1p31.2, 3q25.32 and 8q23
Table 1. Differentially expressed mRNA upon in vitro senescence.
Genname Short Cut Affymetrix ID Log2ratio SD
Up-regulated in senescent passages
glycoprotein (transmembrane) nmb GPNMB 201141_at 4.17 1.01
Regeneration-associated muscle protease homolog RAMP 213661_at 3.94 1.03
mannosidase, alpha, class 1C, member 1 MAN1C1 218918_at 3.77 1.17
glucosaminyl (N-acetyl) transferase 3, mucin type GCNT3 219508_at 3.71 1.05
glycoprotein (transmembrane) nmb GPNMB 1554018_at 3.39 0.79
secretogranin II (chromogranin C) SCG2 204035_at 3.33 1.04
hypothetical protein LOC119548 LOC119548 1558846_at 3.08 0.62
PERP, TP53 apoptosis effector PERP 217744_s_at 2.83 0.30
mucolipin 3 MCOLN3 229797_at 2.66 0.48
ectonucleotide pyrophosphatase/phosphodiesterase 5 ENPP5 227803_at 2.64 0.76
cathepsin K (pycnodysostosis) CTSK 202450_s_at 2.64 0.35
activating transcription factor 3 ATF3 202672_s_at 2.35 0.53
leucine-rich repeat-containing G protein-coupled receptor 7 LGR7 231804_at 2.28 0.10
disabled homolog 2, mitogen-responsive phosphoprotein DAB2 240873_x_at 2.27 0.31
solute carrier family 11, member 2 SLC11A2 203124_s_at 2.08 0.34
Homo sapiens transcribed sequences 229308_at 2.06 0.47
lymphocyte antigen 96 LY96 206584_at 2.04 0.43
DnaJ (Hsp40) homolog, subfamily B, member 4 DNAJB4 203811_s_at 2.00 0.30
solute carrier family 16, member 6 SLC16A6 230748_at 1.89 0.30
solute carrier family 11, member 2 SLC11A2 203123_s_at 1.88 0.06
signal transducer and activator of transcription 1 STAT1 209969_s_at 1.75 0.33
hypothetical protein dJ462O23.2 DJ462O23.2 214579_at 1.74 0.14
GM2 ganglioside activator protein GM2A 1559776_at 1.71 0.33
signal transducer and activator of transcription 1 STAT1 M97935_MA_at 1.71 0.26
interferon-induced protein with tetratricopeptide repeats 1 IFIT1 203153_at 1.68 0.13
hypothetical protein FLJ31715 FLJ31715 1553775_at 1.53 0.12
clone IMAGE:3632546 LOC643988 227185_at 1.50 0.10
carbonic anhydrase XI CA11 209726_at 1.48 0.18
prion protein (p27-30) PRNP 215707_s_at 1.37 0.15
SEC14-like 4 (S. cerevisiae) SEC14L4 239492_at 1.31 0.11
chromosome 20 open reading frame 22 C20orf22 228123_s_at 1.28 0.10
glutaredoxin (thioltransferase) GLRX 209276_s_at 1.23 0.09
Down-regulated in senescent passages
chemokine (C-X-C motif) ligand 6 CXCL6 206336_at 22.09 0.23
hyaluronan synthase 1 HAS1 207316_at 22.40 0.22
retinoic acid receptor responder (tazarotene induced) 1 RARRES1 221872_at 24.31 0.82
tumor necrosis factor (ligand) superfamily, member 11 TNFSF11 210643_at 26.10 1.46
36 Genes that were significantly differentially expressed between early and senescent passage of three independent donor samples (SAM, FDR = 3).doi:10.1371/journal.pone.0002213.t001
Replicative Senescence of MSC
PLoS ONE | www.plosone.org 6 May 2008 | Volume 3 | Issue 5 | e2213
(P,0.01). Interestingly, the most significant over-representation
(P,0.0005) for up- and down-regulated genes are co-localized at
the same hot-spot on chromosome 4q21 (figure 4D, E).
The question remained, if these changes in mRNA expression
are restricted to senescent passages, or if they represent
incremental modifications in the course of cellular aging. Thus,
we analyzed different cell passages of the same MSC preparation
by microarray analysis. We observed continuous changes in global
gene expression patterns as reflected by unsupervised hierarchical
cluster analysis. Variation in the gene expression profile was
already observed in very early passages, when morphological
differences were not obvious. This could also be confirmed by
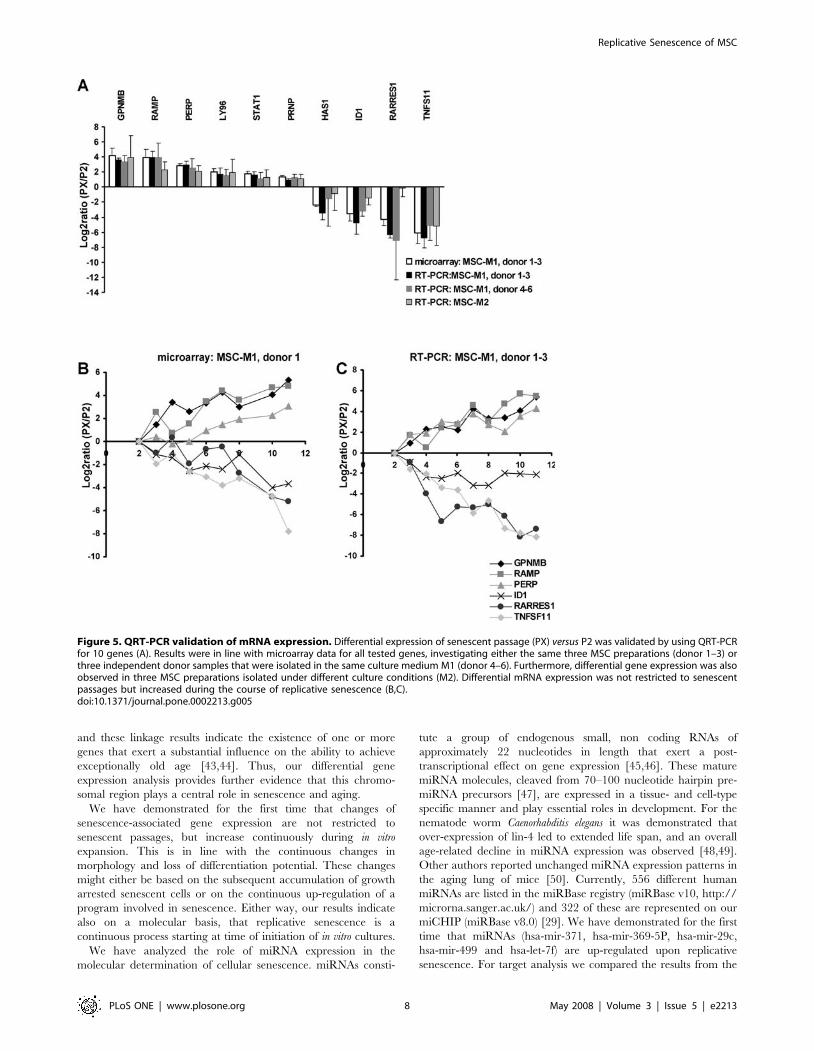
QRT-PCR in samples from additional donors (figure 5). Thus,
many changes in gene expression patterns of MSC preparations
are not restricted to senescent passages, but are increasingly
acquired upon in vitro expansion.
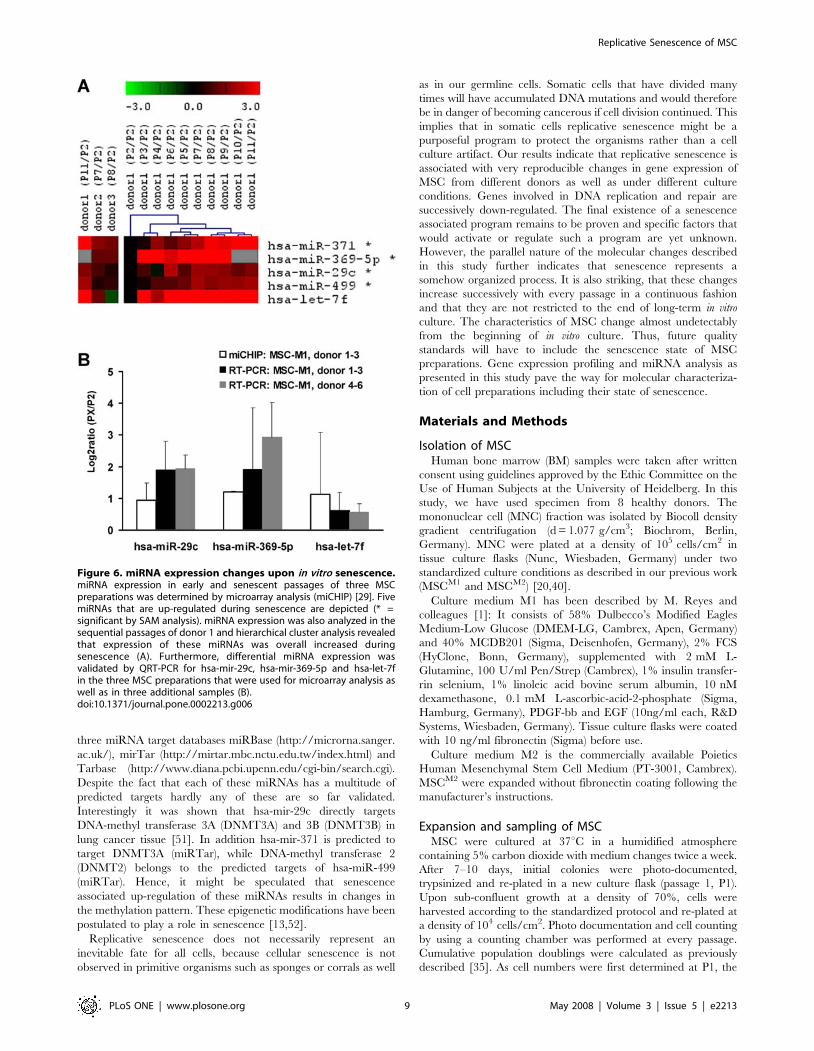
Differential microRNA expression upon replicativesenescence
Senescence might be associated with the differential expression
of miRNAs. We have compared miRNA profiles of early versus
senescent MSCM1 passages using a microarray platform based on
locked nucleic acids (miCHIP) [29]. Data analysis, normalization
and statistical methods were performed described for the mRNA
expression analysis. SAM analysis identified a group of five
significantly up-regulated miRNAs, (FDR,1): hsa-mir-371, hsa-
mir-369-5P, hsa-mir-29c, hsa-mir-499 and hsa-mir-217 (signal
intensity of hsa-mir-217 was very low and thus not considered for
subsequent analysis). In addition, miRNA expression was analyzed
in the different passages of donor 1 and hierarchical cluster
analysis indicated that expression of these miRNAs increases in the
course of replicative senescence. Differential expression of three
miRNAs (hsa-mir-369-5P, hsa-mir-29c and let-7f) was validated by
using quantitative RT-PCR in all three donor samples as well as in
three independent donor samples (figure 6). QRT-PCR results
were in line with miCHIP analysis indicating that the expression of
these miRNAs is up-regulated in the course of replicative
senescence of MSC.
Discussion
MSC have paved their way towards therapeutic application
although there is little knowledge about specific molecular markers
for this population and the impact of culture expansion methods.
In this study, we demonstrate that replicative senescence of MSC
has functional implications on surface marker expression and
differentiation potential and that it evokes consistent changes in
the global gene expression and miRNA expression profiles of
MSCs from different donors. These senescence-associated effects
were not restricted to senescent passages, but are continuously
acquired from the onset of in vitro culture.
Many studies have reported that MSC undergo the typical
Hayflick phenomenon of cellular senescence with decreasing
proliferation and changes in cell morphology. We have found that
senescence occurred after a cumulative number of population
doublings ranging from 6 to 16 population doublings. In addition,
an estimated 7 to 9 population doublings took place during the
initial colony formation. Thus, the total number of population
doublings would be between 13 and 25 and this is compatible with
expansion rates of 104-fold to 108-fold. This is in line with
observations of other groups [10,30]. The pace of senescence
might be affected by the culture conditions. Colter et al. reported
that single cell derived MSC clones could be expanded up to 50
population doublings in about 10 weeks if cultured by repeated
passage at low density whereas cells stopped growing after 15
passages if passed at high cell density [31]. Other authors
suggested that lower oxygen concentrations could enhance the
maximal number of population doublings [32]. MSC isolated from
different tissues have different functional properties including
different long-term growth kinetics [30,33]. Furthermore, there is
evidence for a negative correlation between donor age and the
proliferative capacity of MSC although this is still under debate
[10,34–36]. Data of this study might demonstrate a tendency for
higher cumulative population doublings in MSC form younger
donors but more probes would be necessary to verify this effect.
In this study, we demonstrated that in vitro expansion has a
major impact on a) the morphology of plastic adherent growth, b)
the level of surface marker expression and c) adipogenic and
osteogenic differentiation potential and thus on all parameters that
are concurrently used for the definition of MSC [6]. Other authors
did not find differences in surface marker expression of senescent
MSC [10,36]. This might be due to the fact that in these studies,
the level of surface marker expression was not determined
simultaneously. Furthermore, our results indicate that adipogenic
differentiation potential decreases upon replicative senescence
whereas the propensity for osteogenic differentiation increased in
higher passages. These observations are based on either fat droplet
formation or calcium phosphate deposition and they would be
further strengthened by analysis of adipocyte or osteocyte specific
gene expression. Our results are in line with similar studies from
other groups that demonstrate functional implications on differ-
entiation potential [10,11,34,37]. Thus, in vitro expansion atten-
uates the parameters that are commonly used to define MSC.
To gain insight into the molecular characteristics of replicative
senescence, we analyzed changes in mRNA expression profiles of
MSC. So far, comparison of expression patterns in early and late
passages has only been investigated in other cell types [38,39].
Differential expression of 10 selected genes was highly consistent in
six donor samples as well as in MSC that were isolated under
different culture conditions. We have previously demonstrated that
variation between these culture conditions has a tremendous
impact on gene expression and protein expression profiles [20,40].
The consistence of senescence associated differential gene
expression in different donor samples and under different culture
conditions indicates that senescence of MSC preparations follows a
common molecular program.
Ontogenetically, it was striking to see, that genes involved in cell
cycle, DNA replication and mitosis were significantly less
expressed in senescent cells. This further strengthens the
hypothesis that senescence follows a fixed program where genes
involved in the proliferation machinery are down-regulated. The
causal factors that might mediate this process are yet unknown but
they might include successive changes in the epigenetic state [13].
On the other hand, these findings do not rule out the possibility
that the accumulation of cellular defects (e.g. oxidative stress,
telomere loss or DNA damage) activates a specific program for
senescence.
Surprisingly, the most significant over-representation of up-
regulated and down-regulated genes was at the same locus on
chromosome 4q21. Other authors have previously indicated that
cell senescence-related genes are localized on human chromosome
4 as introduction of normal human chromosome 4 into three
immortal cell lines resulted in loss of proliferation and reversal of
the immortal phenotype [41]. The candidate interval has been
further specified to a region between 4q22-q23 by analysis of
microsatellite markers on the introduced chromosome [42].
Furthermore, a locus on chromosome 4 has been identified by
genome-wide scans for linkage of human exceptional longevity
Replicative Senescence of MSC
PLoS ONE | www.plosone.org 7 May 2008 | Volume 3 | Issue 5 | e2213
and these linkage results indicate the existence of one or more
genes that exert a substantial influence on the ability to achieve
exceptionally old age [43,44]. Thus, our differential gene
expression analysis provides further evidence that this chromo-
somal region plays a central role in senescence and aging.
We have demonstrated for the first time that changes of
senescence-associated gene expression are not restricted to
senescent passages, but increase continuously during in vitro
expansion. This is in line with the continuous changes in
morphology and loss of differentiation potential. These changes
might either be based on the subsequent accumulation of growth
arrested senescent cells or on the continuous up-regulation of a
program involved in senescence. Either way, our results indicate
also on a molecular basis, that replicative senescence is a
continuous process starting at time of initiation of in vitro cultures.
We have analyzed the role of miRNA expression in the
molecular determination of cellular senescence. miRNAs consti-
tute a group of endogenous small, non coding RNAs of
approximately 22 nucleotides in length that exert a post-
transcriptional effect on gene expression [45,46]. These mature
miRNA molecules, cleaved from 70–100 nucleotide hairpin pre-
miRNA precursors [47], are expressed in a tissue- and cell-type
specific manner and play essential roles in development. For the
nematode worm Caenorhabditis elegans it was demonstrated that
over-expression of lin-4 led to extended life span, and an overall
age-related decline in miRNA expression was observed [48,49].
Other authors reported unchanged miRNA expression patterns in
the aging lung of mice [50]. Currently, 556 different human
miRNAs are listed in the miRBase registry (miRBase v10, http://
microrna.sanger.ac.uk/) and 322 of these are represented on our
miCHIP (miRBase v8.0) [29]. We have demonstrated for the first
time that miRNAs (hsa-mir-371, hsa-mir-369-5P, hsa-mir-29c,
hsa-mir-499 and hsa-let-7f) are up-regulated upon replicative
senescence. For target analysis we compared the results from the
Figure 5. QRT-PCR validation of mRNA expression. Differential expression of senescent passage (PX) versus P2 was validated by using QRT-PCRfor 10 genes (A). Results were in line with microarray data for all tested genes, investigating either the same three MSC preparations (donor 1–3) orthree independent donor samples that were isolated in the same culture medium M1 (donor 4–6). Furthermore, differential gene expression was alsoobserved in three MSC preparations isolated under different culture conditions (M2). Differential mRNA expression was not restricted to senescentpassages but increased during the course of replicative senescence (B,C).doi:10.1371/journal.pone.0002213.g005
Replicative Senescence of MSC
PLoS ONE | www.plosone.org 8 May 2008 | Volume 3 | Issue 5 | e2213
three miRNA target databases miRBase (http://microrna.sanger.
ac.uk/), mirTar (http://mirtar.mbc.nctu.edu.tw/index.html) and
Tarbase (http://www.diana.pcbi.upenn.edu/cgi-bin/search.cgi).
Despite the fact that each of these miRNAs has a multitude of
predicted targets hardly any of these are so far validated.
Interestingly it was shown that hsa-mir-29c directly targets
DNA-methyl transferase 3A (DNMT3A) and 3B (DNMT3B) in
lung cancer tissue [51]. In addition hsa-mir-371 is predicted to
target DNMT3A (miRTar), while DNA-methyl transferase 2
(DNMT2) belongs to the predicted targets of hsa-miR-499
(miRTar). Hence, it might be speculated that senescence
associated up-regulation of these miRNAs results in changes in
the methylation pattern. These epigenetic modifications have been
postulated to play a role in senescence [13,52].
Replicative senescence does not necessarily represent an
inevitable fate for all cells, because cellular senescence is not
observed in primitive organisms such as sponges or corrals as well
as in our germline cells. Somatic cells that have divided many
times will have accumulated DNA mutations and would therefore
be in danger of becoming cancerous if cell division continued. This
implies that in somatic cells replicative senescence might be a
purposeful program to protect the organisms rather than a cell
culture artifact. Our results indicate that replicative senescence is
associated with very reproducible changes in gene expression of
MSC from different donors as well as under different culture
conditions. Genes involved in DNA replication and repair are
successively down-regulated. The final existence of a senescence
associated program remains to be proven and specific factors that
would activate or regulate such a program are yet unknown.
However, the parallel nature of the molecular changes described
in this study further indicates that senescence represents a
somehow organized process. It is also striking, that these changes
increase successively with every passage in a continuous fashion
and that they are not restricted to the end of long-term in vitro
culture. The characteristics of MSC change almost undetectably
from the beginning of in vitro culture. Thus, future quality
standards will have to include the senescence state of MSC
preparations. Gene expression profiling and miRNA analysis as
presented in this study pave the way for molecular characteriza-
tion of cell preparations including their state of senescence.
Materials and Methods
Isolation of MSCHuman bone marrow (BM) samples were taken after written
consent using guidelines approved by the Ethic Committee on the
Use of Human Subjects at the University of Heidelberg. In this
study, we have used specimen from 8 healthy donors. The
mononuclear cell (MNC) fraction was isolated by Biocoll density
gradient centrifugation (d = 1.077 g/cm3; Biochrom, Berlin,
Germany). MNC were plated at a density of 105 cells/cm2 in
tissue culture flasks (Nunc, Wiesbaden, Germany) under two
standardized culture conditions as described in our previous work
(MSCM1 and MSCM2) [20,40].
Culture medium M1 has been described by M. Reyes and
colleagues [1]: It consists of 58% Dulbecco’s Modified Eagles
Medium-Low Glucose (DMEM-LG, Cambrex, Apen, Germany)
and 40% MCDB201 (Sigma, Deisenhofen, Germany), 2% FCS
(HyClone, Bonn, Germany), supplemented with 2 mM L-
Glutamine, 100 U/ml Pen/Strep (Cambrex), 1% insulin transfer-
rin selenium, 1% linoleic acid bovine serum albumin, 10 nM
dexamethasone, 0.1 mM L-ascorbic-acid-2-phosphate (Sigma,
Hamburg, Germany), PDGF-bb and EGF (10ng/ml each, R&D
Systems, Wiesbaden, Germany). Tissue culture flasks were coated
with 10 ng/ml fibronectin (Sigma) before use.
Culture medium M2 is the commercially available Poietics
Human Mesenchymal Stem Cell Medium (PT-3001, Cambrex).
MSCM2 were expanded without fibronectin coating following the
manufacturer’s instructions.
Expansion and sampling of MSCMSC were cultured at 37uC in a humidified atmosphere
containing 5% carbon dioxide with medium changes twice a week.
After 7–10 days, initial colonies were photo-documented,
trypsinized and re-plated in a new culture flask (passage 1, P1).
Upon sub-confluent growth at a density of 70%, cells were
harvested according to the standardized protocol and re-plated at
a density of 104 cells/cm2. Photo documentation and cell counting
by using a counting chamber was performed at every passage.
Cumulative population doublings were calculated as previously
described [35]. As cell numbers were first determined at P1, the
Figure 6. miRNA expression changes upon in vitro senescence.miRNA expression in early and senescent passages of three MSCpreparations was determined by microarray analysis (miCHIP) [29]. FivemiRNAs that are up-regulated during senescence are depicted (* =significant by SAM analysis). miRNA expression was also analyzed in thesequential passages of donor 1 and hierarchical cluster analysis revealedthat expression of these miRNAs was overall increased duringsenescence (A). Furthermore, differential miRNA expression wasvalidated by QRT-PCR for hsa-mir-29c, hsa-mir-369-5p and hsa-let-7fin the three MSC preparations that were used for microarray analysis aswell as in three additional samples (B).doi:10.1371/journal.pone.0002213.g006
Replicative Senescence of MSC
PLoS ONE | www.plosone.org 9 May 2008 | Volume 3 | Issue 5 | e2213
cumulative doubling number was first calculated for P2. From P2
onward, there were enough cells for simultaneous expansion of
one fraction and harvesting another fraction for subsequent
analyses: 106 cells were lysed in TRIzol and stored at 280uC for
RNA isolation, 106 cells were pelleted and stored at 280uC for
DNA preparation and the remaining cells were cryopreserved for
immunophenotyping and in vitro differentiation.
Immunophenotypic analysisCryopreserved samples of different MSC passages of the same
donor were simultaneously taken into culture at density of
26104 cells/cm2 and labeled with the following anti-human
antibodies: CD13-allophycocyanin (APC, clone WM15, Becton
Dickinson [BD], San Jose, USA), CD29-fluorescein isothiocyanate
(FITC, MEM-101a, Abcam, Cambridge, UK), CD34-phycoery-
thrin (PE, 8G12, BD), CD44-PE (g44-26, BD), CD45-FITC (2D1,
BD), CD73-PE (AD2, BD), CD90-PE (G7, BD), CD105-PE
(MHCD10504, BD), CD146-PE (P1H12, BD), CD166-PE (3A6,
BD), CD184-PE (12G5, BD). Dead cells were discriminated as PI
positive. More than 56104 labeled cells were acquired and
analyzed using an upgraded 5-color FACScan flow cytometry
system (Cytek Development Inc., Fremont, USA) running
CellQuest 3.3 software (BD).
In vitro differentiationIn vitro differentiation was simultaneously analyzed in different
cryopreserved MSC passages of the same donor. To induce
osteogenic differentiation, cells were re-plated at 26104 cells/cm2
and cultured for three weeks in DMEM with 10% FCS
(Invitrogen), 10 mM b-glycerophosphate, 1027 M dexametha-
sone, and 0.2 mM ascorbic acid and with medium changes every 3
to 4 days as previously described [1,53]. After 21 days, cells were
analyzed by either von Kossa or Alizarin red staining. Alizarin red
staining was semiquantitatively analyzed at l595 nm using a plate
reader (Bio-TEK-instruments Inc., Winooski, VT, USA). For
adipogenic differentiation, cells were plated at 26104 cells/cm2
and cultured in DMEM with 10% FCS, 0.5 mM isobutyl-
methylxanthine (IBMX), 1 mM dexamethasone, 10 mM insulin,
200 mM indomethacin, and Oil Red-O staining was performed
after 21 days [19] and analyzed semiquantitatively at l595 nm as
described above. Chondrogenic differentiation was achieved
through culturing of a pellet of 2.26105 cells in differentiation
medium for three weeks with subsequent assessment of acid
mucopolysaccharides by 1% Alcian blue (Chroma, Kongen,
Germany) for 10–30 min. [54].
Senescence associated b-galactosidase stainingExpression of pH-dependent senescence associated b-galactosi-
dase (SA-b-gal) activity was analyzed simultaneously in different
passages of MSC using the SA-b-gal staining kit (Cell Signaling
Technology, Boston, MA) [24].
RNA isolationTotal RNA was isolated using TRIzol reagent (Invitrogen,
Paisley, Scotland) according to the manufacturer’s instructions.
RNA quality was controlled using the RNA 6000 Pico LabChip kit
(Agilent, Waldbronn, Germany) and quantified with a NanoDrop
ND-1000 Spectrophotometer (Nanodrop Technologies, Wilming-
ton, USA).
Microarray analysisTwo mg total RNA was amplified with GeneChip one-cycle
target labeling kit (Affymetrix, High Wycombe, United Kingdom)
according to the manufacturer’s instructions. Quality of amplified
RNA was controlled by LabChip technology (only the sample of
donor 1 P9 could repeatedly not be amplified). GeneChip Human
Genome U133_Plus_2.0 (Affymetrix) were hybridized with 15 mg
amplified RNA, washed with a fluidics station 450 (Affymetrix),
and scanned with GeneChip scanner 3000 (Affymetrix). The
complete microarray data have been deposited in NCBIs Gene
Expression Omnibus (GEO, http://www.ncbi.nlm.nih.gov/geo/)
and are accessible through GEO Series accession number
GSE9593. For subsequent analyses, only those probe sets were
considered that were detectable in at least 10 of the 13
hybridizations (19,448 ESTs). Microarray data were normalized
to the median and log2ratios were calculated versus P2 of the
corresponding donor sample. Genes that were more than 2-fold
up- or down- regulated in median of all three donor samples were
further classified by GeneOntology analysis using GoMiner
software (http://discover.nci.nih.gov/gominer/) and representa-
tion in functional categories was analyzed by Fischer’s Exact p-
value test (P,0.0001). Lists of regulated genes were assembled
using Significant Analysis of Microarrays (SAM) [55]. Unsuper-
vised hierarchical cluster analysis was performed by Euclidean
distance (average linkage clustering) using the MultiExperiment
Viewer (MeV, TM4) [56]. Chromosomal distribution of differen-
tially regulated genes was analyzed by Chromosomal Co-
Localization probability calculator (ChroCoLoc) [57].
Quantitative real-time PCR analysisQuantification of mRNA expression for candidate genes was
performed by real-time quantitative PCR (QRT-PCR) using the
ABI PRISMH 7700HT Sequence Detection System Instrument
(Applied Biosystems, Applera Deutschland GmbH, Darmstadt,
Germany). Total RNA was reverse transcribed by using the high
capacity cDNA reverse transcription kit (Applied Biosystems).
Primers were obtained from Biospring (Frankfurt, Germany)
(Table 2). QRT-PCR reactions were performed with the power
SYBRH green PCR master mix in a MicroAmp optical 96-well
reaction plate with a ABI PRISMH 7700HT sequence detector
(Applied Biosystems) according to the manufacturer’s instructions.
Relative gene expression levels were normalized to GAPDH
expression, which was used as a housekeeping gene.
miRNA profilingTotal RNA (3 mg) was labeled with a Cy3-conjugated RNA
linker (Biospring, Frankfurt, Germany) and hybridized to miCHIP
as previously described [29,58]. miCHIP is based on locked
nucleic acid (LNA) technology, whereby LNA-modified, Tm-
normalized miRCURY capture probes (Exiqon, Vedbaek, Den-
mark) designed to target 322 unique human miRNAs (miRbase
v8.0, Wellcome Trust Sanger Institute, http://microrna.sanger.ac.
uk/) were printed onto Codelink slides (GE Healthcare, Chalfont
St Giles, United Kingdom). Array images were generated by using
the Genepix 4200AL laser scanner (Molecular Devices, Sunny-
vale, USA) in batches using the Genepix auto PMT (Photo
Multiplayer) algorithm, with pixel saturation tolerance set to 0.2%.
Tiff images generated by the Genepix 4200AL laser scanner were
processed by the Genepix 6 microarray analysis software
(Molecular Devices, Sunnyvale, USA). Artifact-associated spots
were eliminated both by software- and visual-guided flags. Signal
intensities were measured according to the local background
subtraction method. All probes were spotted in quadruplicate and
the median signal intensity of these was calculated. This dataset
has also been deposited in GEO and are accessible through the
series accession number GSE9664. MiCHIP data were median
normalized and the log2ratios of P2 versus the corresponding
Replicative Senescence of MSC
PLoS ONE | www.plosone.org 10 May 2008 | Volume 3 | Issue 5 | e2213
senescent passage was determined. For subsequent analyses, only
those probe sets were considered that were detectable in at least 10
of the 14 hybridizations (264 miRNAs). SAM analysis and
hierarchical cluster analysis was applied using the same parameters
as described for mRNA expression data [55,56].
RT-PCR analysis of miRNA expressionExpression of hsa-mir-29c, hsa-mir-369-5p and hsa-let-7f was
further analyzed using miRNA TaqMan assays according to the
manufacture’s instructions (Applied Biosystems, Foster City, USA).
Ten ng of total RNA was used for each reverse transcription.
QRT experiments were performed by using the ABI 7500 real
time PCR system (Applied Biosystems). Relative miRNA expres-
sion levels were determined in relation to RNU24 abundance.
Acknowledgments
We thank Tomi Ivacevic (EMBL, Heidelberg) for excellent assistance with
RNA amplification and microarray hybridization, Jens Stolte (EMBL,
Heidelberg) for QRT-PCR analysis of miRNAs, Heiner Burgers
(Department of Physiology, University of Heidelberg) for support in
semi-quantitative analysis of in vitro differentiation assays.
Author Contributions
Conceived and designed the experiments: VB WW PH MC SP AH.
Performed the experiments: PH MC AD SB RS VE. Analyzed the data:
WW PH MC SB RS JB SP VE AH. Contributed reagents/materials/
analysis tools: VB MC AD RS JB VE. Wrote the paper: WW AH.
References
1. Reyes M, Lund T, Lenvik T, Aguiar D, Koodie L, et al. (2001) Purification and
ex vivo expansion of postnatal human marrow mesodermal progenitor cells.
Blood 98: 2615–2625.
2. Jiang Y, Jahagirdar BN, Reinhardt RL, Schwartz RE, Keene CD, et al. (2002)
Pluripotency of mesenchymal stem cells derived from adult marrow. Nature 418:
41–49.
3. Petersen BE, Bowen WC, Patrene KD, Mars WM, Sullivan AK, et al. (1999)
Bone marrow as a potential source of hepatic oval cells. Science 284:
1168–1170.
4. Schwartz RE, Reyes M, Koodie L, Jiang Y, Blackstad M, et al. (2002)Multipotent adult progenitor cells from bone marrow differentiate into
functional hepatocyte-like cells. J Clin Invest 109: 1291–1302.
5. Horwitz EM, Le BK, Dominici M, Mueller I, Slaper-Cortenbach I, et al. (2005)
Clarification of the nomenclature for MSC: The International Society for
Cellular Therapy position statement. Cytotherapy 7: 393–395.
6. Dominici M, Le Blanc K, Mueller I, Slaper-Cortenbach I, Marini F, et al. (2006)
Minimal criteria for defining multipotent mesenchymal stromal cells. The
International Society for Cellular Therapy position statement. Cytotherapy 8:
315–317.
7. Wagner W, Ho AD (2007) Mesenchymal stem cell preparations - comparingapples and oranges. Stem Cell Rev 3: 239–248.
8. Hayflick L (1965) The limited in vitro lifetime of human diploid cell strains. Exp
Cell Res 37: 614–636.
9. Ho AD, Wagner W, Mahlknecht U (2005) Stem cells and ageing. The potentialof stem cells to overcome age-related deteriorations of the body in regenerative
medicine. EMBO Rep 6: 35–38.
10. Bonab MM, Alimoghaddam K, Talebian F, Ghaffari SH, Ghavamzadeh A, et
al. (2006) Aging of mesenchymal stem cell in vitro. BMC Cell Biol 7: 14.
11. Baxter MA, Wynn RF, Jowitt SN, Wraith JE, Fairbairn LJ, et al. (2004) Study of
telomere length reveals rapid aging of human marrow stromal cells following in
vitro expansion. Stem Cells 22: 675–682.
12. Banfi A, Muraglia A, Dozin B, Mastrogiacomo M, Cancedda R, et al. (2000)
Proliferation kinetics and differentiation potential of ex vivo expanded human
bone marrow stromal cells: Implications for their use in cell therapy. ExpHematol 28: 707–715.
13. Noer A, Boquest AC, Collas P (2007) Dynamics of adipogenic promoter DNA
methylation during clonal culture of human adipose stem cells to senescence.
BMC Cell Biol 8: 18.
14. Hayflick L (2007) Biological aging is no longer an unsolved problem.
Ann N Y Acad Sci 1100: 1–13.
15. O’Hare MJ, Bond J, Clarke C, Takeuchi Y, Atherton AJ, et al. (2001)
Conditional immortalization of freshly isolated human mammary fibroblasts and
endothelial cells. Proc Natl Acad Sci U S A 98: 646–651.
16. Di Donna S, Mamchaoui K, Cooper RN, Seigneurin-Venin S, Tremblay J, et
al. (2003) Telomerase can extend the proliferative capacity of human myoblasts,
but does not lead to their immortalization. Mol Cancer Res 1: 643–653.
17. Janzen V, Forkert R, Fleming HE, Saito Y, Waring MT, et al. (2006) Stem-cell
ageing modified by the cyclin-dependent kinase inhibitor p16INK4a. Nature
443: 421–426.
18. Kiyono T, Foster SA, Koop JI, McDougall JK, Galloway DA, et al. (1998) Both
Rb/p16INK4a inactivation and telomerase activity are required to immortalize
human epithelial cells. Nature 396: 84–88.
19. Pittenger MF, Mackay AM, Beck SC, Jaiswal RK, Douglas R, et al. (1999)
Multilineage potential of adult human mesenchymal stem cells. Science 284:
143–147.
20. Wagner W, Wein F, Seckinger A, Frankhauser M, Wirkner U, et al. (2005)
Comparative characteristics of mesenchymal stem cells from human bone
marrow, adipose tissue, and umbilical cord blood. Exp Hematol 33: 1402–
1416.
21. Hauner H, Entenmann G, Wabitsch M, Gaillard D, Ailhaud G, et al. (1989)
Promoting effect of glucocorticoids on the differentiation of human adipocyte
precursor cells cultured in a chemically defined medium. J Clin Invest 84:
1663–1670.
22. Kogler G, Sensken S, Airey JA, Trapp T, Muschen M, et al. (2004) A new
human somatic stem cell from placental cord blood with intrinsic pluripotent
differentiation potential. J Exp Med 200: 123–135.
23. Niemeyer P, Krause U, Fellenberg J, Kasten P, Seckinger A, et al. (2004)
Evaluation of mineralized collagen and alpha-tricalcium phosphate as scaffolds
for tissue engineering of bone using human mesenchymal stem cells. Cells
Tissues Organs 177: 68–78.
Table 2. Primer sequences.
Gen amplicon length (bp) Forward Primer Reverse Primer
GAPDH 142 TTCGTCATGGGTGTGAACCA CTGTGGTCATGAGTCCTTCCA
GPNMB 213 GCATGGTCAGAGGACAGTGA GAGTTGAGGCCCAAGTGTCA
RAMP 220 CAGGTTCAGTCAAGGGAGACA TCCACTTCCCAGTCCTCAGA
PERP 187 GTTCCAGATCATCTCCCTGGTA GCCCAGAAGGTCATCTTCGTA
LY96 261 TCTGCAACTCATCCGATGCA CTCCCTTCAGAGCTCTGCAA
STAT1 210 GGGTCCTCTCATCGTTACTGA GGTGGAGTCAGGAAGAAGGA
PRNP 214 GCCTATTACCAGAGAGGATCGA CCTATCCGGGACAAAGAGAGA
HAS1 180 CTGGGTCAGCTTCCTAAGCA GTACAGTGGGTACCCAGGA
ID1 157 GGTAAACGTGCTGCTCTACGA GGATTCCGAGTTCAGCTCCAA
RARRES1 243 ACTTGTACACGGCTCATCGA CCACTGCCTCACACTAGTGA
TNFSF11 219 CAGAGCGCAGATGGATCCTA TCTGCTCTGATGTGCTGTGA
doi:10.1371/journal.pone.0002213.t002
Replicative Senescence of MSC
PLoS ONE | www.plosone.org 11 May 2008 | Volume 3 | Issue 5 | e2213
24. Dimri GP, Lee X, Basile G, Acosta M, Scott G, et al. (1995) A biomarker that
identifies senescent human cells in culture and in aging skin in vivo. Proc NatlAcad Sci U S A 92: 9363–9367.
25. Abdelmagid SM, Barbe MF, Arango-Hisijara I, Owen TA, Popoff SN, et al.
(2007) Osteoactivin acts as downstream mediator of BMP-2 effects on osteoblastfunction. J Cell Physiol 210: 26–37.
26. Ihrie RA, Marques MR, Nguyen BT, Horner JS, Papazoglu C, et al. (2005) Perpis a p63-regulated gene essential for epithelial integrity. Cell 120: 843–856.
27. Schoch G, Seeger H, Bogousslavsky J, Tolnay M, Janzer RC, et al. (2006)
Analysis of prion strains by PrPSc profiling in sporadic Creutzfeldt-Jakobdisease. PLoS Med 3: 14.
28. Lacey DL, Timms E, Tan HL, Kelley MJ, Dunstan CR, et al. (1998)Osteoprotegerin ligand is a cytokine that regulates osteoclast differentiation and
activation. Cell 93: 165–176.29. Castoldi M, Schmidt S, Benes V, Noerholm M, Kulozik AE, et al. (2006) A
sensitive array for microRNA expression profiling (miChip) based on locked
nucleic acids (LNA). RNA 12: 913–920.30. Kern S, Eichler H, Stoeve J, Kluter H, Bieback K (2006) Comparative analysis
of mesenchymal stem cells from bone marrow, umbilical cord blood, or adiposetissue. Stem Cells 24: 1294–1301.
31. Colter DC, Class R, DiGirolamo CM, Prockop DJ (2000) Rapid expansion of
recycling stem cells in cultures of plastic-adherent cells from human bonemarrow. Proc Natl Acad Sci U S A 97: 3213–3218.
32. Fehrer C, Brunauer R, Laschober G, Unterluggauer H, Reitinger S, et al. (2007)Reduced oxygen tension attenuates differentiation capacity of human mesen-
chymal stem cells and prolongs their lifespan. Aging Cell 6: 745–757.33. Wagner W, Roderburg C, Wein F, Diehlmann A, Frankhauser M, et al. (2007)
Molecular and Secretory Profiles of Human Mesenchymal Stromal Cells and
their Abilities to Maintain Primitive Hematopoietic Progenitors. Stem Cells 10:2638–2657.
34. Stenderup K, Justesen J, Clausen C, Kassem M (2003) Aging is associated withdecreased maximal life span and accelerated senescence of bone marrow stromal
cells. Bone 33: 919–926.
35. Cristofalo VJ, Allen RG, Pignolo RJ, Martin BG, Beck JC (1998) Relationshipbetween donor age and the replicative lifespan of human cells in culture: a
reevaluation. Proc Natl Acad Sci U S A 95: 10614–10619.36. Mareschi K, Ferrero I, Rustichelli D, Aschero S, Gammaitoni L, et al. (2006)
Expansion of mesenchymal stem cells isolated from pediatric and adult donorbone marrow. J Cell Biochem 97: 744–754.
37. Fehrer C, Lepperdinger G (2005) Mesenchymal stem cell aging. Exp Gerontol
40: 926–930.38. Shelton DN, Chang E, Whittier PS, Choi D, Funk WD (1999) Microarray
analysis of replicative senescence. Curr Biol 9: 939–945.39. Zhang H, Pan KH, Cohen SN (2003) Senescence-specific gene expression
fingerprints reveal cell-type-dependent physical clustering of up-regulated
chromosomal loci. Proc Natl Acad Sci U S A 100: 3251–3256.40. Wagner W, Feldmann RE Jr, Seckinger A, Maurer MH, Wein F, et al. (2006)
The heterogeneity of human mesenchymal stem cell preparations-Evidence fromsimultaneous analysis of proteomes and transcriptomes. Exp Hematol 34:
536–548.
41. Ning Y, Weber JL, Killary AM, Ledbetter DH, Smith JR, et al. (1991) Genetic
analysis of indefinite division in human cells: evidence for a cell senescence-related gene(s) on human chromosome 4. Proc Natl Acad Sci U S A 88:
5635–5639.
42. Bryce SD, Morrison V, Craig NJ, Forsyth NR, Fitzsimmons SA, et al. (2002) Amortality gene(s) for the human adenocarcinoma line HeLa maps to a 130-kb
region of human chromosome 4q22-q23. Neoplasia 4: 544–550.43. Puca AA, Daly MJ, Brewster SJ, Matise TC, Barrett J, et al. (2001) A genome-
wide scan for linkage to human exceptional longevity identifies a locus on
chromosome 4. Proc Natl Acad Sci U S A 98: 10505–10508.44. Weibel J, Sorensen MD, Kristensen P (2006) Identification of genes involved in
healthy aging and longevity. Ann N Y Acad Sci 1067: 317–322.45. Pillai RS (2005) MicroRNA function: multiple mechanisms for a tiny RNA?
RNA 11: 1753–1761.46. Zamore PD, Haley B (2005) Ribo-gnome: the big world of small RNAs. Science
309: 1519–1524.
47. Bartel DP (2004) MicroRNAs: genomics, biogenesis, mechanism, and function.Cell 116: 281–297.
48. Ibanez-Ventoso C, Yang M, Guo S, Robins H, Padgett RW, et al. (2006)Modulated microRNA expression during adult lifespan in Caenorhabditis
elegans. Aging Cell 5: 235–246.
49. Boehm M, Slack F (2005) A developmental timing microRNA and its targetregulate life span in C. elegans. Science 310: 1954–1957.
50. Williams AE, Perry MM, Moschos SA, Lindsay MA (2007) microRNAexpression in the aging mouse lung. BMC Genomics 8: 172.
51. Fabbri M, Garzon R, Cimmino A, Liu Z, Zanesi N, et al. (2007) MicroRNA-29family reverts aberrant methylation in lung cancer by targeting DNA
methyltransferases 3A and 3B. Proc Natl Acad Sci U S A 104: 15805–15810.
52. Chambers SM, Shaw CA, Gatza C, Fisk CJ, Donehower LA, et al. (2007) Aginghematopoietic stem cells decline in function and exhibit epigenetic dysregulation.
PLoS Biol 5: 201.53. Haynesworth SE, Baber MA, Caplan AI (1992) Cell surface antigens on human
marrow-derived mesenchymal cells are detected by monoclonal antibodies.
Bone 13: 69–80.54. Hennig T, Lorenz H, Thiel A, Goetzke K, Dickhut A, et al. (2007) Reduced
chondrogenic potential of adipose tissue derived stromal cells correlates with analtered TGFbeta receptor and BMP profile and is overcome by BMP-6. J Cell
Physiol 211: 682–691.55. Tusher VG, Tibshirani R, Chu G (2001) Significance analysis of microarrays
applied to the ionizing radiation response. Proc Natl Acad Sci U S A 98:
5116–5121.56. Saeed AI, Sharov V, White J, Li J, Liang W, et al. (2003) TM4: a free, open-
source system for microarray data management and analysis. Biotechniques 34:374–378.
57. Blake J, Schwager C, Kapushesky M, Brazma A (2006) ChroCoLoc: an
application for calculating the probability of co-localization of microarray geneexpression. Bioinformatics 22: 765–767.
58. Castoldi M, Benes V, Hentze MW, Muckenthaler MU (2007) miChip: amicroarray platform for expression profiling of microRNAs based on locked
nucleic acid (LNA) oligonucleotide capture probes. Methods 43: 146–152.
Replicative Senescence of MSC
PLoS ONE | www.plosone.org 12 May 2008 | Volume 3 | Issue 5 | e2213
Related Documents