Reorganization Feasibility Study For Divernon CUSD #13 Pawnee CUSD #11 By Consulting & Resource Group Dr. William H. Phillips Dr. Scott L. Day Mr. John Dee

Welcome message from author
This document is posted to help you gain knowledge. Please leave a comment to let me know what you think about it! Share it to your friends and learn new things together.
Transcript
Reorganization Feasibility Study
For
Divernon CUSD #13 Pawnee CUSD #11
By
Consulting & Resource Group
Dr. William H. Phillips Dr. Scott L. Day Mr. John Dee

2
Table of Contents
Preface……………………………………………………………………………….…………...….3 History of School District Reorganization in Illinois……………………………………....……...4 Historical Considerations and Alternative Strategies……………………………..……..……..10 A Brief Literature Review…………………………………………………………..…….………..18 School District Reorganization in Illinois Since 1985…………………………..……..………..21 How Districts May Be Created……………………………………………………………....……26 Key Dates and Timelines………………………………………………………………………….29 School District Organization in Illinois (An ISBE Study Paper)……………………….…..…..31 The Relationship Between School Size and Achievement in Downstate Elementary Schools (An ISBE Document)………………………………………………………………………..…..…40 The Relationship Between School Size and Achievement in Downstate High Schools (An ISBE Document)……………………………………………………………...….....43 Unit Districts Formed From Dual Systems (An ISBE Document)…………………......…..….47 Reorganization Considerations and Options………………………………………...………….53 Curriculum Considerations and Comparisons……………………………………..…...……….68 School Enrollment History and Forecast……………………………………..……..……….…..95 Transportation Considerations…………………………………………………………….....…100 District Facilities……………………………………………………………………………......…102 Financial Considerations and Comparisons………..…………………………...…………….110 The School District Financial Profile……………………………………………………...…….126 Reorganization and Incentive Payments…………………………………………..………..…142 School District Reorganization History…………………………………………..……………..155 Interviews…………………………………………………………………………………..…...…174 Glossary of Terms………………………………………………………………………...………178

3
Preface
These reports never happen without help. We owe thanks to superintendents, Mr.
Lonny Lemon, and Dr. Mark Spaid, who were most gracious in supplying information
requested by us. We are also certain that thanks go to their secretaries who did the
necessary search through the files to find the information. Special thanks also go to the
Board of Education members and district administrators who gave generously of their time
in order to gain their insight and thoughts concerning this process.
Finally, to the staff members who were interviewed and the general public who took
time from their lives to share with us their perceptions of the two school districts as well as
their feelings about possible reorganization of these schools into one district. Without all of
the aforementioned assistance, this report would have been less than complete.

4
History of School District Reorganization in Illinois
Schooling for the early settlers of Illinois consisted of one-room schools in which the
students were from rural backgrounds. These schools taught predominately the “three R’s”
and the teachers more often than not were “boarded out” to families of the students.
Control of these schools was almost entirely local in nature as they were built and run by
the citizens of the community in which the students lived. Parcels of land were set aside for
the local schools in the Northwest Territory and other states west of the original thirteen
colonies.
The Free School Law was passed in 1825, which established common schools for
all white citizens between the ages of five and twenty-five. Aid for these schools was
provided by the state in the amount of two out of every one hundred state tax dollars
collected.
This period was marked by the influx of immigrants, which began flooding into
Illinois. With these immigrants, came a need for a more modern form of education. The
needs of these immigrants included more than the three R’s, as they required language,
history and political instruction. Schools supported by the public became an accepted part
of the communities and as the school became bigger and more sophisticated, the
intervention of state finances and control became more prevalent in the local schools.
As school districts were developing, a fragmenting of districts began to appear.
Natural boundaries became the district’s borders and districts that were wealthier in
assessed valuation tended to try to restrict their boundaries so as to not conflict with their
neighbors who were not as financially fortunate. Thus began, even at this point historically,
a financial separation in which the wealthy school districts wanted to maintain their
privileged position and exclude their less fortunate neighboring school districts.

5
The one-room schoolhouse was fast becoming an out-moded in Illinois as in other
Midwestern states with the rapid influx of population and the substantial growth of urban
areas. These areas required a higher quality, more diverse educational program than could
be provided by the one-room school with its single teacher.
By 1845, the Office of Superintendent of Public Instruction had been established.
Section 6 of that law stated that the Superintendent “…shall use his influence to reduce to a
system of practical operation the means of common schools in the state…”
The following year, the Board of Trustees was created to authorize the
reorganization of school districts and hold title to all school property. This Board of Trustees
was elected and functioned between the level of the state and the local Board of Education.
In effect, this Board of Trustees could create, alter and/or dissolve school districts if
petitioned by local boards of education. Today, this little known public body, controls
annexation and, detachment petitions that are brought to them by the Regional
Superintendent of Schools from local boards of Education and citizen’s petitions.
With the passage of the 1870 Illinois Constitution, the General Assembly stated that
they “…shall provide a thorough and efficient system of free schools, whereby all the
children of the state may receive a good common school education.” It was this time that
the General Assembly curtailed the formation of Special Charter School Districts with its Act
of 1872.
With the rapid expansion of the population centers in Illinois due to continued waves
of immigration, it became necessary to reorganize school districts into larger
educational units in the urban areas. With this reorganization, changes in administrative
and instructional patterns became necessary to improve the quality of schools.
However, then as now the rural population reluctantly gave way to the reorganization
of larger school districts. The loss of local control of their schools has presented a prevalent

6
historical trend. One of the prime obstacles to the formation of larger school districts was
the problem of widely scattered populations in which the students couldn’t be transported to
larger schools because there was no transportation system in place.
The General Assembly in 1909 started the school consolidation movement when it
allowed school districts to consolidate based upon a majority vote of the citizens in each
affected district. Also, in 1909, the General Assembly passed legislation mandating that
districts which did not have a high school, must pay the tuition for each student whose
parents were unable to pay. By 1915, the enrollment of students in high school had risen
by 15% while the elementary school enrollment had risen by only 1%. With these pieces of
legislation, the concept of consolidating schools to provide a quality education was begun.
By 1917, consolidated and non-high school districts were formed. Tuition was paid
for all eighth grade students who lived in non-high school districts, to the nearest district
where a high school was present.
State aid per child was first legislated in 1927. Every district was eligible for nine
dollars per child in attendance for students in grades one through eight. Less wealthy
districts were given an additional incentive for additional state aid amounting to twenty-five
dollars per student if the district levied the maximum education tax rate allowed without
referendum.
The Depression created an even wider disparity in school ability to generate income
in that state aid was apportioned by the amount of local money generated; thus, wealthier
districts generated more revenue and in turn received more state aid. This wide financial
disparity created indirectly the initial legislation concerning reorganization of school districts
in the early 1940’s.
Transportation remained one of the earliest and largest impediments to the interest
in consolidating school districts in Illinois. Students living in rural areas were so widely

7
scattered that a system for collecting and delivering students to centralized schools became
a necessity for districts considering consolidation. In 1939, the legislature appropriated a
half million dollars for transportation aid to school districts for the first time. With this aid
from the state, the period of largest consolidation was beginning.
Another problem facing school districts that were investigating consolidation was the
financial inequities given to the dual system of districts in the State of Illinois. Illinois
maintains three types of school districts. The first is separate elementary and high school
districts operating autonomously in generally the same district boundaries; however, it is
common for a number of elementary districts to feed into a single high school district. Unit
districts, which encompass both the elementary and high school districts were in existence
but fairly small in number at this time.
Prior to 1945, both type districts were eligible for the same state aid and tax rate
limitations. Thus unit districts were asked to provide an elementary and high school
education on basically the same taxing amounts that a separate elementary or high school
would generate. In 1945, the legislature gave the unit districts equal taxing power to the
dual districts and in addition, unit districts were given a lower qualifying rate for entrance
into state aid reimbursements. In effect, unit districts were now given essentially financial
parity with dual districts and the lower qualifying rate for state aid provided a powerful
incentive for the formation of unit districts. As a result of the aforementioned legislation, the
number of districts declined from 11,000 to 5,000 by 1950.
More recent legislation has further created financial incentives for districts to
consolidate. In 1983, legislation was enacted to guarantee that districts, which consolidated
were insured of state aid that would not be less than would have been generated
separately. This parity was insured for a period of three years.
8
In addition, state incentive money was guaranteed to equalize the salaries of the
certified employees of districts that consolidated. This aid was also in the form of a three-
year guarantee, which theoretically would give a newly formed district time to deal with
staffing problems that would normally accrue in the formation of a new school district and
the combination of employees.
Probably, the most significant incentive legislated in the 1983 package, was the state
incentive aid on a one-time basis that would erase the “operational deficit” of combining
districts. This legislation therefore would bring all districts combining at least to a zero level
and enable the newly formed district to begin operations without a deficit in its main
operating funds.
By 1985, the State Board of Education was investigating not only the financial
aspects of school consolidation but also the educational inequities that were present in
schools of various sizes. A study was commissioned by ISBE that examined the effects of
enrollment size and district type on the quality of the educational program. This study
reported minimal and optimal sizes of effective high schools in Illinois based on the number
of courses available, achievement of students, number of teacher’s preparations required
and educational offerings available in high schools. Highest achievement was found to
occur in high schools of between 494-1279 students. What ensued was legislation in the
Omnibus 1985 reform educational legislation that determined that a minimal size for school
districts and that unit districts were preferred over a dual district format.
Mandated reorganization committees were formed and given the task of studying
reorganization in every region in the State of Illinois. Committee members were appointed
by local boards of education. With few exceptions, these members were sympathetic to the
current district structure and most of these committees resisted ISBE efforts to impose
reorganization. As the political ramifications of school reorganization rose to the top of the

9
political arena, the Governor and the State Superintendent “reinterpreted” their intent of
these reorganization committees and withdrew the minimal size of districts reorganizing and
the preferred status of unit districts. With this, the reorganization committees, by and large,
performed perfunctorily and made reports, which stated that no reorganization was needed
or wanted by most districts in the state.
Legislation since 1983 has removed many of the disincentives discouraging
reorganization. While the mandated avenue of reorganization at the state level has met
with a great deal of resistance by the local school districts, the legislature and ISBE has
attempted to encourage further reorganization by enacting legislation favorable to districts
contemplating reorganization. Currently, there are more alternative methods now available
to districts besides the referendum, which has been the historical model used to reorganize
school districts. This variety of methods has sparked a renewed interest with generally
smaller unit districts in dealing with their sparse high school populations. Also, small
districts in general are looking at reorganization simply because the economy of size has
caught up with their districts and they are finding it increasingly more difficult to fund the
quality education of their students in an equitable and efficient manner. Therefore, the trend
toward consolidation in the State of Illinois should continue as districts explore the various
alternatives now open to them.

10
Historical Considerations and Alternative Strategies
During the last fifty years, many school districts in Illinois have changed in the size of
the geographic area that they serve as well as in their pattern of organization. Although it
seems that Illinois has a large number of school districts (893 in 2001), it was not that long
ago (1940s) that the state had over 12,000 districts.
There has been increasing emphasis in recent years on reducing the total number of
school districts and on increasing the geographic area served by districts in order to
increase both the size of student enrollment and staff. In May of 1985, the State Board of
Education published yet another study on school district organization. This report found
that there was evidence that students:
"In the hundreds of very small school districts were receiving a significant loss in opportunity to learn when the courses available to them are compared with those available to students in high schools with enrollments of over 500 pupils."
This study further concluded that the current system of organization meant that:
"Uniform access to both adequate financial support and reasonable educational quality is not permitted by the present organization of our school districts."
Public Act 84-126 enacted in 1985 made sweeping changes and mandated the
school reorganization of many smaller districts into larger districts through an elaborate set
of procedures. However, within nine months of its enactment, the general assembly
modified the reform bill with the passage of Public Act 84-1115, which effectively eliminated
the mandatory reorganization procedures, which had been created by the earlier law.
Since the passage of PA 84-1115, it appears to some that there is literally an
unannounced plan to bring about school consolidation as a result of additional reform

11
legislation; increased activities by the State Board of Education through more stringent rules
and regulations; and legislative finance policies which place increasing pressure on local
property to support schools. The combination of these factors continues to apply
unrelenting pressure upon small districts to reorganize in some way into larger units of
instruction. Added to these three forces, one must add a fourth and most recent one in the
form of the State Board of Higher Education, high school requirements for admission to
Illinois colleges and universities.
Despite well-researched studies as to the benefits of greater equity, the ability to
attract higher quality teachers, the ability to increase both the depth and breadth of
curricular offerings and a number of other "benefits" to be derived from economies of scale,
those school reorganizations which actually take place are most often brought about by
concern over increasing tax loads at the local level.
Recently, financial equity plans have included a statewide constitution challenge to
the school funding formula. By seeking judicial relief in the form of a court case showcasing
the inequity of school district financing in Illinois, school districts endeavored to change the
current school district funding formula. While this effort was unsuccessful, it can be
assumed that in the future, there will be other judicial or constitutional challenges to the
system of financing Illinois schools, which have precipitated a disparate financing formula
for the school children of Illinois.
Although the primary question in this study relates to the procedures and processes
by which school districts might reorganize, the fact is that there have been less than fifty
consolidations of school districts in the past five years. This translates into a consolidation
figure of about five percent of the state’s school districts. This low percentage is particularly
remarkable when one considers that over half of the high schools in the state have
enrollments of less than five hundred students. Given these realities, this section is

12
intended to address some “alternatives” being practiced in the state to inform the districts
involved in this study.
Legislative Facilitation
Cooperative agreements between school districts or between school districts and
other governmental agencies have provided some viable consolidation alternatives.
Probably more Illinois districts than not, are involved in cooperatives in the areas of special
education, vocational education, or both. What about areas other than these? The broadest
statutory authority supporting such a move is the Intergovernmental Cooperation Act,
(Chapter 127, Sections 741 - 745 (1985). This Act states that:
“Powers, privileges, or authority exercised ... by a public agency of this state may be exercised and enjoyed jointly with any other public agency of this state."
This appears to authorize school districts to cooperate with each other in all of the normal
functions carried on by school districts. Chapter 147, Section 745, further states that:
“One or more public agencies may contract with other public agencies to perform any governmental service, activity, or undertaking, which any of the agencies is authorized by law to perform, provided that such contract is authorized by the governing body of each party."
Also, in 1985, Chapter 122 (School Code) was revised to authorize school districts to permit
students to attend the schools of other districts. One limitation is that every school board
must still maintain at least one elementary school within the district. More recent legislation
took this process a step further. As a result of school code revisions in 1986, school boards
may deactivate and reactivate high school facilities under specific conditions, thus giving
districts some time to thoroughly study the issue of consolidation. High schools may be
deactivated indefinitely, with their students sent to another school in another district. This

13
action may be taken with the approval of the voters in the sending district and the approval,
by proper resolution, of the school board of the receiving district.
Another of the more recent legislative statutes, (P.A. 85-759), is the Cooperative
High School Attendance Centers legislation. This legislation is a natural extension of the
inter-governmental legislation mentioned above. This legislation is one of the approved
methods for school district reorganization in Illinois, but has not yet been utilized by a school
district.
Educational Cooperatives and Programming, Alternative
Taking the cooperative model of Special and Vocational education, some school
districts have entered into the formation of academic cooperatives. The Leland School
District, LaSalle County #1, has been involved in a curriculum cooperative with the
Somonauk School District #432 for many years. Both of the high schools have very small
student enrollments. Yet, under a tuition agreement, students of both schools have access
to courses in foreign languages, art, business, science, and other subjects that might not
have been available without the agreement. The two districts developed a tuition
agreement, which provided a formula for determining how much each district was charged
based upon the “per capita tuition charge.” As an outgrowth of the agreement, similar
calendars, testing schedules, and transportation schedules were arranged cooperatively
between the districts.
The Waterman School District #431 and Shabonna School District #524 share
several high school staff members, course offerings, transportation, and costs related to
these functions. The districts have also combined their music programs that have resulted
in one band and one chorus.
Schools in the area of the Toulon-Lafayette School District, band together to pool
their resources by sharing staff, utilizing the local community colleges, and investing in

14
microwave television hookups. These brief examples only begin to discuss academic
cooperation, which is being carried out between and among many small districts in the
state.
For many years the Hoopeston area school district and Rossville-Alvin school district
have shared their curricular offerings, transporting students between the two high schools
each period of the school day.
Staff Recruitment, Retention, and Development Alternatives
A shortage of teachers, keeping good teachers, and in-service education
opportunities are problems relating to staffing that often force consolidation. Districts may
combat the problem of teacher shortages in the small district through the following
strategies:
• Make all district personnel and board members aware of shortages.
• Print brochures pointing up local advantages.
• Offer part-time additional jobs for qualified teachers.
• Establish cooperative staff development.
• Help teachers procure housing at a reasonable cost.
• Promote the benefits and challenges of a small district.
• Share a teacher among several districts in a technical or low incidence program (advanced math, electronics, physics, and music).
• Give academic credit for experience outside of teaching.
• Provide summer job assistance for teachers.
• Offer extended contracts for teaching on a year-round or near year-round basis.
Others who have worked on this problem suggest making salary and fringe benefits
competitive, but a caution here is that community support is even more essential. Other
approaches include the subsidizing of further education of teachers in small districts,
encouraging churches and civic organizations to include teachers in their activities, and
making recreational programs in the community available to teachers.

15
Staff development is a particularly critical area for recruiting and holding teachers in
small communities. Teacher assistance teams can be established so that teachers may
help other teachers, and visits to nearby districts are always a possibility. The Regional
Office of Education (ROE) should be approached for specific and worthy in-service
programs, which the districts want, not just what the ROE wishes to provide. Federal grants
for staff development are available as are state assistance grants. Teachers can be
reimbursed for college credit and should be encouraged to take as many courses in a new
subject matter as possible. Finally, every district has "experts" living in the surrounding
area that can be called upon to provide valuable in-service training to teachers.
Administrative Alternatives
William Collier, retired superintendent in the Dunlap Unit School District, proposes
that one superintendent be shared by several school districts to reduce costs and gain
greater economy of scale. In an administrative co-op, two small districts can share the
services of one superintendent and a small office staff. Duties and responsibilities
associated with the Superintendent's position would remain much the same. Possible
strengths include the fact that one person would be totally aware of the cooperating districts
strengths and weaknesses and would be able to make adjustments easily. Collier provides
a list of areas where sharing could occur as a result of administrative cooperation: food
service, transportation, gifted education, legal services, guidance programs, driver
education, purchasing, staff development, and staff sharing. Superintendent Collier claims
that,
"Many of the concerns of small districts could be eliminated by' well organized and trusting cooperation."'
16
Several recommendations (from the IASB Journal article entitled, "Tips for Sharing
Administrators" by William H. Phillips) have been developed by a superintendent who had
direct experience with administrative cooperatives. In the article, Dr. Phillips relates his
experience as a superintendent of two school districts and provides suggestions for
superintendents contemplating administrative sharing with two or more school districts:
• Share superintendents but do not share principals.
• Re-define the superintendent's job so that the workload is the equivalent of one position, not two or three.
• Establish one central administrative office.
• Do not have the superintendent wasting time between separate district offices.
• Create continuing communication linkages between participating school boards. Joint informational board meetings enhance economy of time by allowing the superintendent to keep all boards informed with a single report.
Technological Alternatives
A major success story in the area of technology is that of Hall-Spring Valley High
School. At this high school, satellite television in the classroom allows students to
communicate with students in other schools both inside and outside of this country. In this
particular case, government surplus materials were used to build the receiving station. The
Illinois location also permits the use of lower cost receiving equipment. Educational
advantages are numerous and include the capability to tape programs for later playback.
District administrators report that this technology has improved virtually every program in
the school system.
In Carroll County, the Television Cooperative provides the use of a two-way
interactive television system and cable facilities. Curricular advantages include being able
to offer courses that usually attract only a small number of students in one school district

17
such as advanced level mathematics, science, and foreign language. A second important
feature of the system is the opportunity to utilize the best teachers to teach more students.
This arrangement further motivates and challenges students, promotes higher levels of
student achievement, and increases the efficiency of teacher instructional time.
An additional technological means of enhancing the financial and educational
services of the small district is to establish a network linking a mainframe or mini-computer
to terminals housed in several small districts. Districts can share the costs of programming
and maintenance of the single larger computer. The Gillette, Wyoming, school district is a
national show place of connecting far-flung individual schools together through the use of
the computer.
The focus of this section of the study has discussed Alternatives to Reorganization
that school districts may utilize in Illinois. It has focused on the options and alternatives for
high schools. It should be noted for information purposes that elementary districts may also
utilize these same alternatives for their elementary and junior high school programs.
18
A Brief Literature Review
The issue of reorganization has been the focus of several studies throughout the
United States. One of the common themes in the literature has been the "strengths of rural
schools." Stephens (1986) lists several of the commonly accepted attributes of small
schools: smaller classes, individual attention by teachers, low drop-out rates, the
opportunity to develop student leadership, strong family and community support, and good
parental interaction.
Monk and Haller (1986), in a study of rural New York schools, found that substantial
problems exist in small schools and these problems significantly disadvantage students who
attend them. At the same time, Monk and Haller found that small districts provide important
educational advantages to pupils and to the communities they serve. The weaknesses
identified by Monk and Haller included:
• Limited Curricula
• Scheduling difficulties that further limit programs
• Shortage of teachers in some subject areas
• Faculty have heavy and non-specialized teaching loads
• Educational aspirations of the students and community tend to be low.
The strengths identified by Monk and Haller included:
• Schools are the focal point of the community
• Schools are devoid of discipline problems evident in large urban districts
• Students learn the "basics" as well as other students and sometimes better
• Schools provide opportunities to develop leadership potential and non-academic skills
Monk and Haller noted that some problems appear in only the very smallest of schools (i.e., those schools with fewer than 100 students per grade level). It should be noted that Illinois currently has at least 250 school districts that enroll fewer than 100 students per grade level. Regarding school size, Webb (1977) states:

19
‘Studies relating to effective and desirable sizes of school districts indicate that school district size is not an absolute, that the "optimum size" will vary from state to state and that size is but one of many factors related to educational quality and operational efficiency’. (p. 365)
They also noted that in small rural schools, if a student does not relate well to a
teacher, he/she has no other choices. Similarly, many students are pressured into
participating in extra-curricular activities in which they have no interest or may not have the
physical abilities needed. Additionally, students are unable to avoid incompetent teachers.
Monk and Haller note that while small schools give teachers the opportunity to know their
students better, this also provides increased opportunities for harmful mistakes by teachers.
Hughes (1990) studied the 100 smallest schools in Wisconsin from May 1987,
through October 1988. The study identified the same small school attributes and
disadvantages as Monk, Haller and Stephens. Hughes stated that following advantages
selected from the study were verified by the literature: broader student participation, close
personal relationships, student leadership opportunities, community support, better school
climate and student attitudes, fewer discipline problems and greater flexibility. The
constraints identified by Hughes were: limited administrative and supervisory personnel,
teachers spread too thin, lack of cultural diversity, limited offerings for students, difficulty in
recruiting and keeping staff, restricted facilities and higher per pupil costs. Hughes was not
able to show that small schools had higher test scores or that small school graduates had a
higher rate of college completion.
A recurring problem for small rural schools, as identified by Monk, Haller, Stephens and
Hughes is attracting and retaining competent staff. One of the contributing factors could be
salaries paid to beginning and veteran teachers in small rural schools. In a survey of school
administrators in Illinois, Hall and Smith-Dickson (1991) found that 122 of 499 reporting districts
believed their salary schedules were not competitive and hindered the recruitment of qualified

20
teachers. Sher (I986) was commissioned by the North Carolina School Board Association to
critique a 1986 report by the State Board of Public Instruction that called for larger school
districts. In his analysis of the report, Sher concluded that there was no solid foundation for
believing that wholesale elimination of school districts would improve educational opportunities
and stated that reorganization should be strictly voluntary. In his report, Sher made the
following five points:
1. Merger decisions are too complex and far-reaching in their impact to be made any way other than on a case-by-case basis.
2. Good schools and school districts come in all shapes and sizes (as do poor
ones) and therefore, educational policies, which place too much reliance on any rigid size and organizational criteria are likely to be counterproductive.
3. Since directly mandating across-the-board mergers will not advance any
compelling state interest, the state should discontinue all backdoor approaches to the same end.
4. There are a variety of alternatives to consolidation that can expand
educational opportunities and enhance cost-effectiveness without abolishing existing units. Most important, organizational issues like merger are very rarely the key to enhancing the quality and efficiency of public education.
5. Most important, organizational issues like merger are very rarely the key to
enhancing the quality and efficiency of public education. Occasionally, making schools and school districts bigger is helpful, but more often it is merely a diversion away from the greater task of finding new ways to positively influence the lives of children and to increase the effectiveness of those who work in their service.
21
School District Reorganization in Illinois Since 1985
During the last fifty years, many school districts in Illinois have changed the size of
the geographic area that they serve and in the manner in which they are organized.
Although today it seems that Illinois has an extremely large number of school districts, it
should be remembered that a few decades ago this state had an even larger number of
school districts. Before the end of World War II, Illinois had nearly 12,000 school districts.
Through the evolutionary process, the number has decreased to the point where the current
number of school districts in Illinois is 893.
There has been increased emphasis in recent years on reducing the total number of
school districts and on increasing the geographic area served by districts in order to
increase districts student enrollment, high school course offerings, assessed valuation, and
staff size. In May of 1985, the Illinois State Board of Education published a study on school
district reorganization. The report found that there was evidence that students "in the
hundreds of very small districts were receiving a significant loss in opportunity with those
available to students in high schools with enrollments over 500 students." That study
concluded that the current system of organization meant that, "uniform access to both
adequate financial support and reasonable educational quality is not permitted by the
present organization of our school districts.
Part of the education reform legislation that became effective on August 1, 1985,
provided for school district reorganization. Public Act 84-126 made sweeping changes and
mandated the school reorganization of many smaller districts into larger districts through an
elaborate set of Procedures. However, shortly after enactment of that law, the General
Assembly modified the law by Public Act 84-1115. That law effectively eliminated the
mandatory reorganization procedures, which had been created by the earlier law.

22
Notwithstanding, the General Assembly’s action, which caused Illinois to step back
from mandated reorganization, there still exists strong interest and concern about what has
come to be called "school consolidation." School consolidation is the general term, which
covers many of the different methods for school districts to be combined, deactivated,
dissolved, annexed or otherwise reorganized.
The reason reorganization proposals have been increasing is based on legislation
that has encouraged consolidations in the state by allowing the various school districts to
choose from an expanded list of methods and procedures to consolidate. In addition, the
financial incentives passed by the General Assembly continue to be a strong impetus to
school districts that are increasingly experiencing financial trouble based upon lowered
assessed valuations and declining student enrollments.
As a clear example of the progress of school district reorganization in Illinois, the
number of school consolidations in the period of 1980-85 was six consolidations.
Additionally, at this period, there were only three authorized methods of school district
consolidation. As a result of numerous State Board of Education studies, there was
adopted in 1983, the first piece of significant legislation that addressed the problem of
school district reorganization "disincentives." In 1983, three financial incentives were
promulgated by the General Assembly. These incentives paid for the operating debt deficits
between consolidating districts from the education, operations, transportation and working
cash fund balances of school districts. Reorganization incentives were based upon prior
year's budget balances, equalizing the salaries of full-time, certified employees from the
newly reorganized districts for a period of three years, and holding harmless the amount of
General State Aid to be received in a newly reorganized district.
In 1985, the Omnibus Education Bill, was enacted which addressed school district
reorganization with its mandatory provisions while the General Assembly repealed the

23
mandatory provisions of the legislation, the required studies were completed and seemed to
initiate interest in the process of reorganization throughout the state. As proof of the
increasing interest in school district reorganization, there were 44 school consolidations in
the period of 1985-90 with 62 additional consolidations in the time period of 1990-98.
Districts are now able to pick from an expanded list of authorized methods of school
district reorganization. There are currently eight authorized methods of school district
reorganization. From this list of authorized methods, two methods, 11A consolidation and
Article 7, annexations have constituted over 90% of the consolidations in the state since
1985.
In addition, another financial incentive was added to the three existing incentives.
This incentive provides for a payment for three years of $4,000.00 per full-time, certified
staff member in a newly reorganized district. The financial incentives paid to school districts
have amounted to over $103,000,000 from the period of 1986-1998. During the 1991-92
school years, the legislature did not allocate enough money to pay all of the incentive claims
made upon the Illinois State Board of Education, and the $4,000 per certified employee
incentive was not paid to some newly consolidated districts until the following year.
However, in 1993 and in all subsequent years, enough funds have been allocated to pay all
of the reorganization incentive claims made by newly consolidated districts.
Among the currently authorized methods of school district reorganization are eight
different legal processes that encompass different kinds of school districts and their legal
consolidation or dismemberment. The names of the appropriate sections from the Illinois
School Code are utilized to identify the separate legal processes in school district
reorganization.
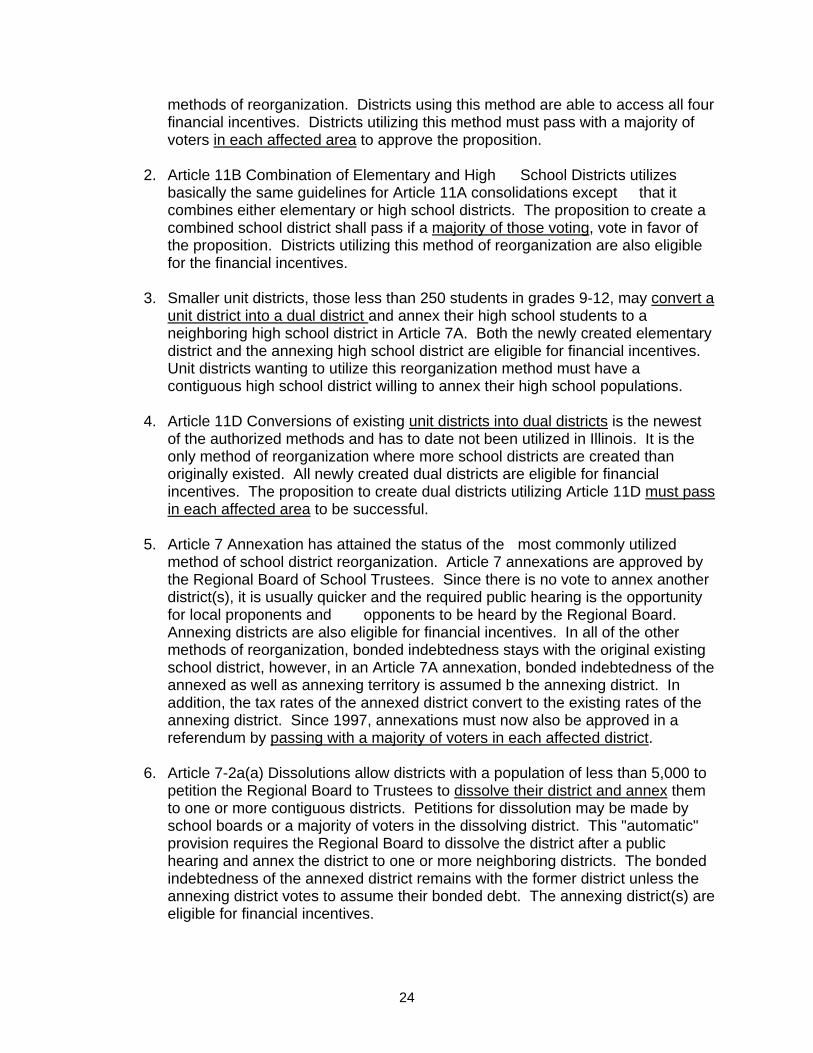
1. Article 11A Unit District formation is the only method by which a new unit district can be formed from currently existing unit districts or a combination of elementary and high school districts. This is one of the more commonly utilized
24
methods of reorganization. Districts using this method are able to access all four financial incentives. Districts utilizing this method must pass with a majority of voters in each affected area to approve the proposition.
2. Article 11B Combination of Elementary and High School Districts utilizes
basically the same guidelines for Article 11A consolidations except that it combines either elementary or high school districts. The proposition to create a combined school district shall pass if a majority of those voting, vote in favor of the proposition. Districts utilizing this method of reorganization are also eligible for the financial incentives.
3. Smaller unit districts, those less than 250 students in grades 9-12, may convert a
unit district into a dual district and annex their high school students to a neighboring high school district in Article 7A. Both the newly created elementary district and the annexing high school district are eligible for financial incentives. Unit districts wanting to utilize this reorganization method must have a contiguous high school district willing to annex their high school populations.
4. Article 11D Conversions of existing unit districts into dual districts is the newest
of the authorized methods and has to date not been utilized in Illinois. It is the only method of reorganization where more school districts are created than originally existed. All newly created dual districts are eligible for financial incentives. The proposition to create dual districts utilizing Article 11D must pass in each affected area to be successful.
5. Article 7 Annexation has attained the status of the most commonly utilized
method of school district reorganization. Article 7 annexations are approved by the Regional Board of School Trustees. Since there is no vote to annex another district(s), it is usually quicker and the required public hearing is the opportunity for local proponents and opponents to be heard by the Regional Board. Annexing districts are also eligible for financial incentives. In all of the other methods of reorganization, bonded indebtedness stays with the original existing school district, however, in an Article 7A annexation, bonded indebtedness of the annexed as well as annexing territory is assumed b the annexing district. In addition, the tax rates of the annexed district convert to the existing rates of the annexing district. Since 1997, annexations must now also be approved in a referendum by passing with a majority of voters in each affected district.
6. Article 7-2a(a) Dissolutions allow districts with a population of less than 5,000 to
petition the Regional Board to Trustees to dissolve their district and annex them to one or more contiguous districts. Petitions for dissolution may be made by school boards or a majority of voters in the dissolving district. This "automatic" provision requires the Regional Board to dissolve the district after a public hearing and annex the district to one or more neighboring districts. The bonded indebtedness of the annexed district remains with the former district unless the annexing district votes to assume their bonded debt. The annexing district(s) are eligible for financial incentives.
25
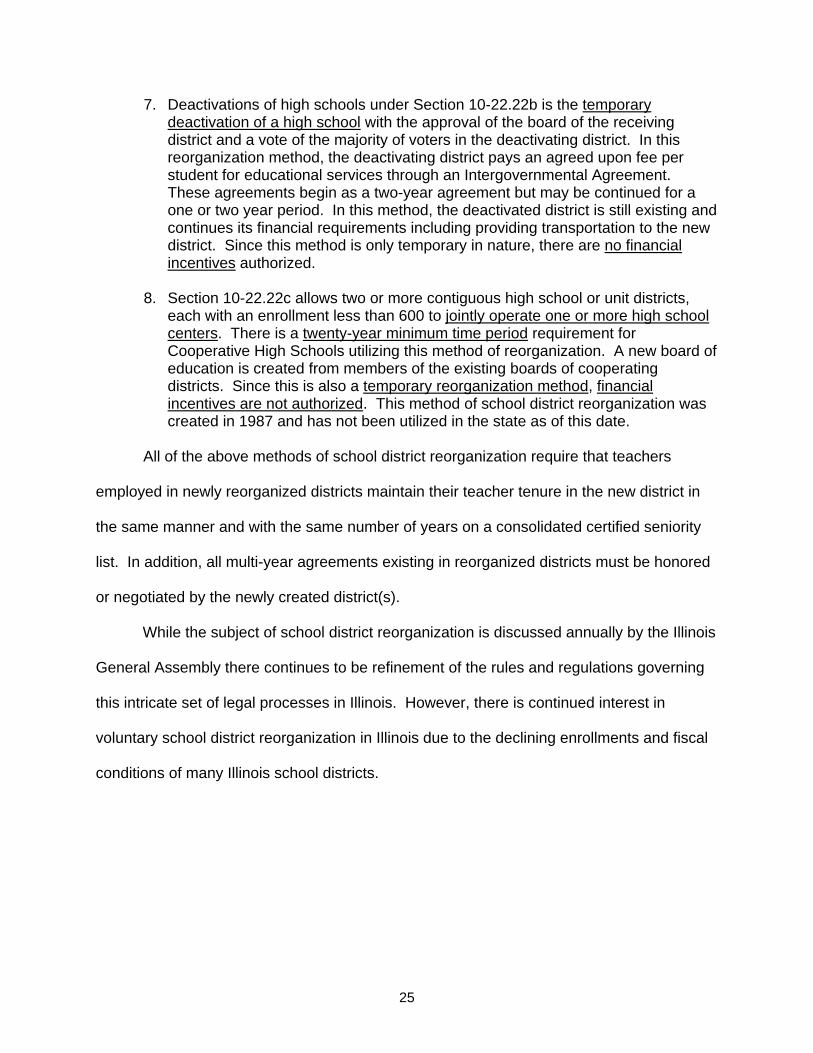
7. Deactivations of high schools under Section 10-22.22b is the temporary deactivation of a high school with the approval of the board of the receiving district and a vote of the majority of voters in the deactivating district. In this reorganization method, the deactivating district pays an agreed upon fee per student for educational services through an Intergovernmental Agreement. These agreements begin as a two-year agreement but may be continued for a one or two year period. In this method, the deactivated district is still existing and continues its financial requirements including providing transportation to the new district. Since this method is only temporary in nature, there are no financial incentives authorized.
8. Section 10-22.22c allows two or more contiguous high school or unit districts,
each with an enrollment less than 600 to jointly operate one or more high school centers. There is a twenty-year minimum time period requirement for Cooperative High Schools utilizing this method of reorganization. A new board of education is created from members of the existing boards of cooperating districts. Since this is also a temporary reorganization method, financial incentives are not authorized. This method of school district reorganization was created in 1987 and has not been utilized in the state as of this date.
All of the above methods of school district reorganization require that teachers
employed in newly reorganized districts maintain their teacher tenure in the new district in
the same manner and with the same number of years on a consolidated certified seniority
list. In addition, all multi-year agreements existing in reorganized districts must be honored
or negotiated by the newly created district(s).
While the subject of school district reorganization is discussed annually by the Illinois
General Assembly there continues to be refinement of the rules and regulations governing
this intricate set of legal processes in Illinois. However, there is continued interest in
voluntary school district reorganization in Illinois due to the declining enrollments and fiscal
conditions of many Illinois school districts.
26
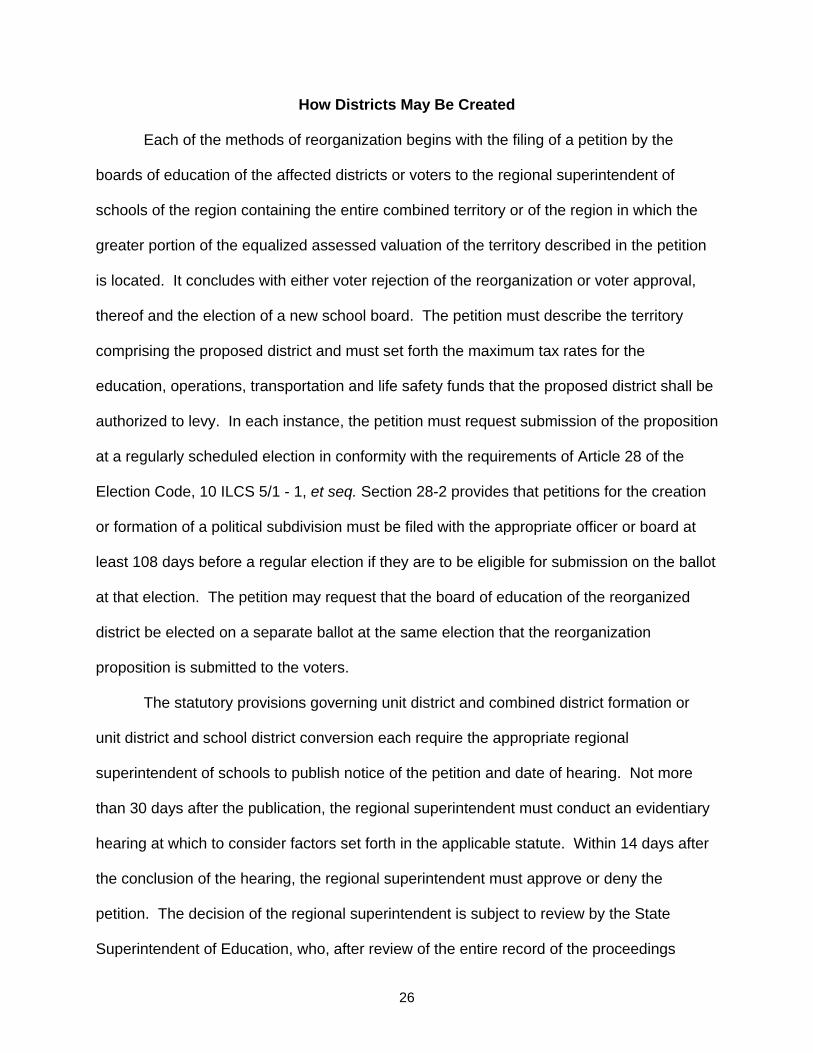
How Districts May Be Created
Each of the methods of reorganization begins with the filing of a petition by the
boards of education of the affected districts or voters to the regional superintendent of
schools of the region containing the entire combined territory or of the region in which the
greater portion of the equalized assessed valuation of the territory described in the petition
is located. It concludes with either voter rejection of the reorganization or voter approval,
thereof and the election of a new school board. The petition must describe the territory
comprising the proposed district and must set forth the maximum tax rates for the
education, operations, transportation and life safety funds that the proposed district shall be
authorized to levy. In each instance, the petition must request submission of the proposition
at a regularly scheduled election in conformity with the requirements of Article 28 of the
Election Code, 10 ILCS 5/1 - 1, et seq. Section 28-2 provides that petitions for the creation
or formation of a political subdivision must be filed with the appropriate officer or board at
least 108 days before a regular election if they are to be eligible for submission on the ballot
at that election. The petition may request that the board of education of the reorganized
district be elected on a separate ballot at the same election that the reorganization
proposition is submitted to the voters.
The statutory provisions governing unit district and combined district formation or
unit district and school district conversion each require the appropriate regional
superintendent of schools to publish notice of the petition and date of hearing. Not more
than 30 days after the publication, the regional superintendent must conduct an evidentiary
hearing at which to consider factors set forth in the applicable statute. Within 14 days after
the conclusion of the hearing, the regional superintendent must approve or deny the
petition. The decision of the regional superintendent is subject to review by the State
Superintendent of Education, who, after review of the entire record of the proceedings
27
below, must render a decision within 30 days pursuant to statutory criteria. If the State
Superintendent approves the reorganization proposal, the appropriate election official,
typically the regional superintendent, must certify to the proper election authority, not less
than 61 days before the regularly scheduled election, the question to be submitted to the
voters, Election Code §28-5. The proposed reorganization must then be ratified at a
referendum election by those entitled to vote under the applicable statute. Pursuant to
§2A-1.1 of the Election Code, such elections might be held up to three times over a
two-year period; they are held in November of even-numbered years and in November and
April of odd-numbered years.
The State Superintendent's order is deemed an administrative decision subject to
judicial review under the Administrative Review Law, 735 ILCS 5/3-101, et seq. Review may
be sought by any resident who appears at the hearing or by any petitioner or board of
education of any district affected. A court action for review of the State Superintendent's
decision must be commenced within 35 days after service of the decision and acts as a
supersedeas prohibiting any further proceedings until final disposition of the review.
In each instance, the applicable statute provides a form of notice for the election and
form of ballot; provides for the effective date of change; and sets forth, specific
requirements for filing a map of the new district, the treatment of existing bond
indebtedness, and the transfer of the positions of tenured teachers to the new district. It is
doubtful the non-tenured teachers and non-certified personnel of the districts participating in
reorganization have a right to continued employment by the newly formed district. Spear v.
Board of Education of North Shore School District No. 112, 291 III.App.3d 117, 683 N.E.2d
218, 225 III. Dec. 274 (2d Dist. 1997).
The board of education of a newly formed district under Article11A, 11B, 7A, or11D,
with the approval of the regional superintendent and boards of the combining districts, may
28
undertake specified activities after the election of the board but before the effective date of
the change in boundaries. Those activities include such matters as establishing the tax levy
for the new district and hiring its superintendent and professional consultants. School Code
§§11A -10, 11B-9, 7A-8, 11D-7. Under limited circumstances, the newly elected board of
education immediately may begin to levy at the tax rates approved as part of the
reorganization referendum. School Code §§11A-9, 11B-8, 7A-7, 11D-13.
If territory is included in an unsuccessful petition filed Pursuant to Articles 11A, 11B,
7A, or11D, such territory may not be included in a subsequent petition for at least two years
after the final determination of the first proceeding. This is unless the later petition is
substantially different than the earlier one or if a school district is placed on the State Board
of Education's academic or financial watch list or is certified as being in financial difficulty
during that two-year period. School Code §§11A-17, 11B-14, 7A-15, 11D-12.

29
Key Dates and Timelines I. Notice to Boards and to Newspapers of Filing Petitions and Dates of Hearings at Least
Once Each Week for Three Successive Weeks Upon receipt of a filed petition, the Regional Superintendent "shall cause a copy of such petition to be given to each board of any district involved in the proposed formation of the new district and shall cause a notice thereof to be published at least once each week for 3 successive weeks in at least one newspaper having general circulation within the area of the territory of the proposed district" (11A-3, 11B-3, 11D-2). (7A-2 has slightly different requirements.) II. Hearings to Follow within 30 Days of Publication of Notice Not more than 30 days after the publication of notice, the regional superintendent shall hold a hearing on the petition (11A-3, 11B-3, 11D-2). (7A-2 has slightly different requirements.) Ill. Boards to Receive Maps and Reports Within 5 Days of Hearings A copy of the reports and maps submitted by the petitioners to the Regional Superintendent shall be sent to the board of each district involved "not less than 5 days prior to the date upon which the hearing is to be held." (11 B-3, 7A-2) IV. Submission of Petition to State Superintendent about 100 Days before the Election The Illinois State Board of Education urges that Regional Superintendents submit petitions and accompanying required information about 100 days prior to the election due to the 30-day and 61-day time frames cited under VI and IX below. V. The Filing of Nomination Papers for School Board Election In cases when the board of education is to be elected at the same election that the proposition to form a new district is presented to the voters, nomination papers for the school board must be filed with the appropriate official within the following time frames:
• Not more than 99 but at least 92 days prior to the day of the election in cases of elections in November of even numbered years.
• Not more than 78 or less than 71 days prior to other elections.
VI. Deadline for Regional Superintendent's Decision Is 14 Days after Hearing Within 14 days after the conclusion of the hearing, the Regional Superintendent shall make a decision either approving or denying the petition (11 A-3, 11 B-3, 11 D-2, 7A-2). VII. 30-Day Period for State Superintendent Decision
30
The State Superintendent shall, within 30 days after the decision of the Regional Superintendent, approve or deny the petition (11 A-3, 11 B-3, 11 D-2, 7A-2). VIII. Court Review of State Superintendent's Decision Can Begin within a 35-Day Period The commencement of any court action for review of the State Superintendent's decision within a 35-day period as defined in the law "shall operate as a supersedeas, and no further proceeding shall be had until final disposition of such review." (Sections 11 A-4, 11 B-4, 11 D-3, 7A-3). IX. Certification of Consolidation Question at Least 61 Days before the Election Upon the approval of the State Superintendent, the regional superintendent shall certify to the proper election authority the question to be submitted to the voters not less than 61 days before the regularly scheduled election (Section 28-5, the Election Code).

31
School District Organization in Illinois (An ISBE Study Paper)
Perspective on School District Organization in Illinois, Past and Present
The organization of school districts has been a matter of discussion in the United
States dating back to the early 1800's. This interest in the organization of public schools
has continued to the present. While the factors considered important to studies of the
organization of school districts have varied during these years, the discussion continues
and invariably includes such major unsolved issues as:
1. What is the optimum school district size for providing a sufficiently broad range of educational opportunities?
2. What is the optimum school district size for providing an adequate tax base to develop and maintain an efficient and economical system for delivery of educational programs?
3. How can you develop the community interest, support and leadership necessary to maintain educational programs?
4. How can the above questions be answered, given the disparities among rural, suburban and urban communities?
Researchers have studied school district organizations and have developed various
objectives for reorganization. Among these researchers, there is a general consensus that
the goals of organization should include, at the minimum, the following:
• To produce improvement in the quality of the educational program.
• To extend the scope of programs to meet individual student needs within an ever-changing society.
• To complement the development of the most efficient and equitable system of financing public education.
While questions of optimum size, structure and procedures for school district
organization are not resolved in a final sense, the historical trend in Illinois and the nation in
terms of the number and size of school districts is clear - the number is diminishing; districts
are larger in area; and they serve more children.
32
Types of Organization/Reorganization
Reorganization may take one of various forms. Internal organization involves the
assignment of students within a district, e.g., K-3, 4-8, 9-12; K-6, 7-9, 10-12; etc. Horizontal
reorganization is the combining of two or more elementary districts, two or more high school
districts, or two or more unit districts. Vertical reorganization is the combining of one or
more elementary districts with one or more high school districts to form a K-12 district with
coterminous boundaries. Statutes provide for reorganization through detachment,
annexation, division, dissolution or consolidation or any combination of these procedures.
Advantages and Disadvantages of Reorganization
During past studies of various types of school district reorganization, some
advantages and disadvantages have been identified, including the following.
Advantages
1. Larger tax base--more flexibility in budgetary process.
2. Potential follow--through on student progress and achievement.
3. Economies of scale in purchasing, staffing, construction, operations, transportation, etc.
4. Flexibility in staffing patterns.
5. Potential for more efficient use of school buildings.
6. Reduced competition for educational dollars between the elementary and secondary structure.
7. Potential consolidation of legal and accounting procedures.
8. More equitable distribution of wealth factors as less wealthy districts consolidate with wealthier districts.
9. Potential opportunity for improved articulation of curricular programs if consolidated into a K through 12 district.
10. Additional students in a district provide opportunities for increased extracurricular activities and may increase efficiency in meeting the special needs of students.
Disadvantages
1. Potential loss of General State Aid dollars due General State Aid formula restrictions.
33
2. Less access to some non-referendum tax rates.
3. Student achievement data (usually expressed in averages) may drop after reorganization due to broadening of the test base.
4. Loss of "community identity” where this has been centered in the local schools.
5. Concern for loss of informality of smaller districts (where immediate contact with administrators and boards of education is available).
These advantages and disadvantages should not be construed as applicable to every
situation, but rather as general comments regarding reorganization.
Review of Research and General Conclusions Related to School District Size and District Organizational Patterns
Much of the recent discussion of school district organization concerns the
educational and economic performance of school districts as they relate to size. There
have also been attempts to identify optimal school and/or district size figures. These
studies, however, have too frequently focused upon one consequence to the exclusion of
others. Numerous factors, e.g., enrollment, geography, transportation, assessed valuation,
etc., are interrelated and play a role in determining optimal size.
Costs and Enrollments in Relation to Size
A number of researchers have discovered a "U-shaped” relationship between per
pupil costs and school district size, typically measured as enrollment. Per pupil costs are
higher for the very large and very small districts than for the mid-sized districts. For
example, Sabulao and Hickrod, in 1971, found that the lowest expenditure per child
occurred at about 700 students for elementary and secondary districts in Illinois, and about
5,000 for unit districts. Districts above and below these enrollments experienced costs as
high as $300 per child over the average per pupil cost at these enrollments. Sabulao and
Hickrod also discovered the same relationship for administrative costs per pupil, although
34
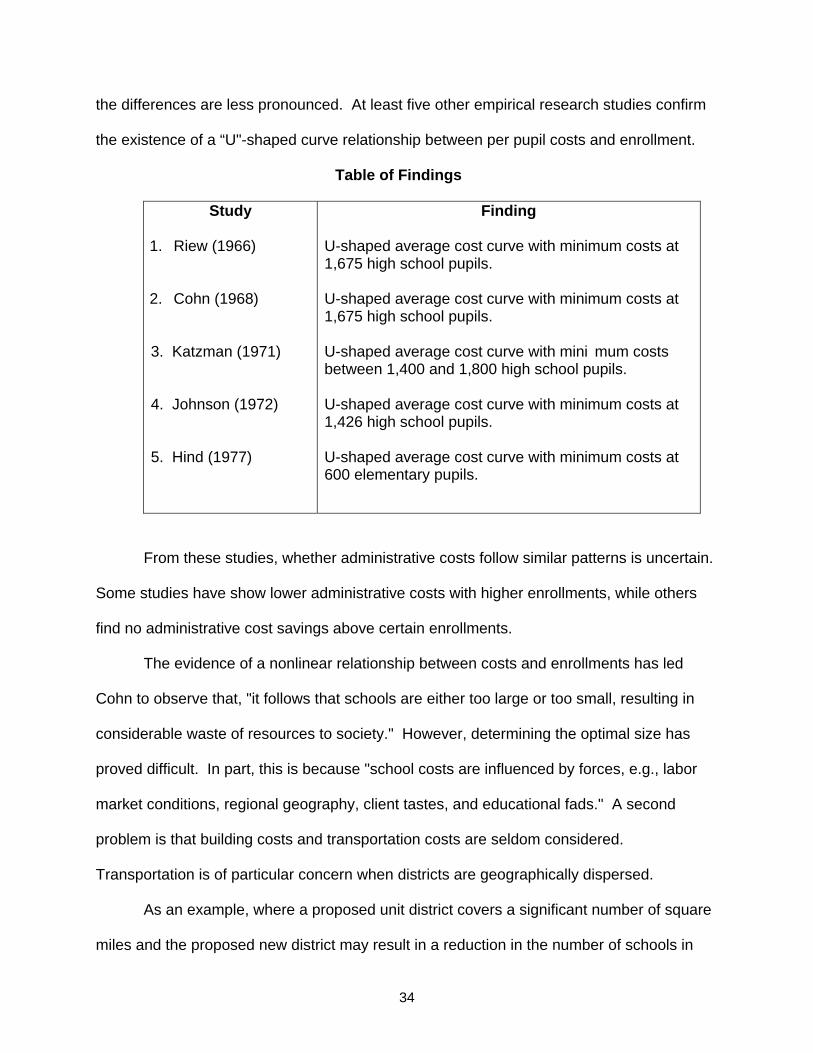
the differences are less pronounced. At least five other empirical research studies confirm
the existence of a “U"-shaped curve relationship between per pupil costs and enrollment.
Table of Findings
Study
1. Riew (1966)
2. Cohn (1968) 3. Katzman (1971) 4. Johnson (1972) 5. Hind (1977)
Finding
U-shaped average cost curve with minimum costs at 1,675 high school pupils. U-shaped average cost curve with minimum costs at 1,675 high school pupils. U-shaped average cost curve with mini mum costs between 1,400 and 1,800 high school pupils. U-shaped average cost curve with minimum costs at 1,426 high school pupils. U-shaped average cost curve with minimum costs at 600 elementary pupils.
From these studies, whether administrative costs follow similar patterns is uncertain.
Some studies have show lower administrative costs with higher enrollments, while others
find no administrative cost savings above certain enrollments.
The evidence of a nonlinear relationship between costs and enrollments has led
Cohn to observe that, "it follows that schools are either too large or too small, resulting in
considerable waste of resources to society." However, determining the optimal size has
proved difficult. In part, this is because "school costs are influenced by forces, e.g., labor
market conditions, regional geography, client tastes, and educational fads." A second
problem is that building costs and transportation costs are seldom considered.
Transportation is of particular concern when districts are geographically dispersed.
As an example, where a proposed unit district covers a significant number of square
miles and the proposed new district may result in a reduction in the number of schools in

35
order to provide upgraded programs and a more efficient operation, increased
transportation costs may outweigh, the proposed advantages.
The above discussion demonstrates that both per pupil expenditures and
administrative costs differ, based on school size. Both extremely small and large schools
spend more per pupil than schools in the middle of size distribution. This finding leads to
the next question: What is an optimal school size?
Optimal School Size
Researchers have tried to identify the most cost-effective size for a school and/or
school district. Some have used attendance centers rather than districts as their unit of
analysis. But quite frequently, the district size is the school size. Also, states differ widely
in their types of school district organization and average school enrollments. While an
attempt has been made to identify these differing factors, it should be recognized that the
findings may not always be applicable to Illinois school districts.
Fox (1981) reviewed more than 30 studies on size economies in education. Citing
consistency in the results of the studies reviewed, Fox claims optimal economies for
elementary education in the range of 300 to 600 pupils per school and for secondary
education in the range of 1,400 to 1,800 pupils per school. Findings for school districts are
less consistent in the studies because the common unit of analysis was school, rather than
district. Although Fox's review indicates economies at certain pupil enrollments for both per
pupil costs and administrative costs, he raises an important qualification. That qualification
is "the impact of school size on the quality of education.” Citing James and Levin, whose
review of the literature found no relationship or a negative one between school size and
educational outcomes, Fox expresses his concern. “The relevant question for analysis is
whether quality declines in larger schools when per pupil resources are held constant.”

36
Instructional and Participation Outcomes and School Size
Researchers have seldom addressed the question of the relationship between
school size and school outcomes. Rather, school size was either one of many school
conditions included by researchers in the quest for variables affecting learning outcomes, or
school size was considered as a cause of such problems as student alienation, dropouts,
and suspensions.
A recent study on student achievement in Illinois indicates slightly different results
than those cited above. The categories used were small (below 500 students), medium
(500 to 1,499 students), and large (1,500 or more students). On mathematics sections of
the IIEP (Illinois Inventory of Educational Progress) test, fourth graders from small schools
scored the highest; while for the eighth and eleventh grades, the highest scores came from
medium-sized schools. Science and reading results followed a somewhat similar pattern.
The strongest performances for fourth and eighth grades were found in small schools, and
the high eleventh grade achievement was found for medium-sized schools. It should be
noted that the size categories were developed in 1975 and may need to be revised as a
reporting variable. Therefore, no cause and effect relations were determined.
The evidence presented by researchers on the effects of school size on
achievement is generally small, insignificant, and contradictory. In short, school size
appears to be neither significantly detrimental nor significantly advantageous to pupil
achievement.
Some research has suggested that a K-12 organizational pattern provides for a
better continuity of transition between elementary school and high school. Curriculum
articulation, smooth pupil tracking, testing programs, and other continuing programs are
indicative of this type of continuity. A Boston College study found that, from a financial
37
viewpoint, a K-12 organizational structure was the most efficient. The researchers further
indicated that K-6 or K-8 districts were the least efficient.
In Illinois, the organizational pattern is further complicated, particularly in urban
areas, where noncoterminous district boundaries result in students from one elementary
district being sent to two different high school districts, or one high school receiving students
from several elementary districts.
As an organizational design, a K-12 district offers a better opportunity for pupil and
cost efficiencies. For dual districts to go to a K-12 pattern, however, results in an immediate
shortfall in access to non-referendum generated tax rates. For example, two districts
covering the same tax base may levy without referendum a total of $.10 per EAV for
health/life safety purposes, but if reorganized as a K-1 2 district may only levy $.05 for this
purpose. Similarly this holds for taxing for transportation ($.20 vs. $.24): working cash ($.05
vs.$.10), and lease levy ($.05 vs. $.10).
School districts, as other governmental units, must compete for tax resources. The
more numerous the taxing bodies, the more difficult it becomes for each individual taxing
body to obtain the resources that it considers necessary. By reducing the number of school
districts covering the same geographic area and tax base, competition for limited resources
is reduced.
General Conclusions From Research
In 1982 the Illinois State Board of Education adopted the topic of school district
organization/consolidation as a policy study. In addition, the Illinois State Senate Education
Committee has requested that the Illinois State Board of Education review the status of
school district organization in the State of Illinois.
The analyses of research and other data elements considered in this paper were
guided by the concern that responses are provided to the following seven questions. The
38
questions are not mutually exclusive. They must be addressed, and then examined,
knowing that they are interrelated.
1. Are there economies of scale? If so, what are they? Are there points of diminishing returns?
The greatest impact of size appears to be on costs, usually specified as per pupil
expenditure. Research indicates that both small and large schools and districts incur higher
per pupil expenditures than schools in the middle of the range. Therefore, it is possible to
determine an enrollment level that may be more economical than another.
2. Are there efficiencies of scale? Does a broader student base affect program offerings?
Research findings indicate that the breadth and scope of curricular offerings are
greater when enrollment 'is increased above a threshold level of enrollment. Analyses of
4-year high schools suggest that, in general, for schools of less than 2,000 enrollments, a
30 to 40% increase in curricular offerings may result when the enrollment is doubled until
reaching 2,000. This finding however, does not apply equally to all academic subjects.
Factors such as urban, suburban, and rural composition play an important role in
determining the breadth and scope of curriculum.
Additional findings indicate a greater student participation in nonacademic and
extracurricular areas in smaller districts. However, these findings are not correlated with the
broader range of activities that may be offered in larger districts.
The conclusion is that a broader student base provides the opportunity for increased
efficiencies in program offerings.
3. Are there inequities or disincentives in Illinois, which relate to any one organizational pattern? Elementary districts? Secondary districts? Unit districts?
A review of the Statutes pertaining to tax levies for different types of districts clearly
shows that elementary and secondary districts seeking to consolidate as a unit district in
39
Illinois will have less access to tax levies in the lease levy fund; transportation fund: working
cash fund and the health/life safety fund. The conclusion is that there are inequities and/or
disincentives that can be identified regarding organizational patterns.
4. Are there organizational patterns, which, by design, provide a better chance for curriculum articulation or services to pupils? (K-4, 5-8, 9-12), (K-12). etc.?
Research in this area is rather limited; however, it suggests that a K-12 pattern may
provide a better continuity of transition between elementary and high school. Curriculum
articulation, smooth pupil tracking, and testing programs are examples of this continuity.
The research supports a K-12 organizational pattern.
5. Do problems exist in educational priority setting or in access to resources when more than one educational district covers the same geographic area (e.g., elementary, secondary community college, regional special districts)?
Research regarding this question is also limited. Observation by numerous
educational administrators in Illinois appears to indicate that the more districts serving the
same community, the greater the competition is for tax resources, e.g., adopting a
referendum resolution prior to competing districts or a secondary district's policy dominating
the underlying elementary district(s). However, as the number of school districts decrease,
there is less competition with other governmental units for tax monies. The conclusion is
that tax resources should be available on an equitable basis to all educational entities.
6. Are there program or student achievement gains in any district type or size that may supersede economies or efficiencies of scale?
Numerous research studies have been undertaken regarding this question. The
answers appear to be inconclusive- school size appears to be neither significantly
detrimental nor significantly advantageous to pupil achievement. Therefore, economies of
scale carry a greater weight in determining optimal school or district size.

40
The Relationship Between School Size and Achievement in Downstate Elementary Schools
This ISBE information presents data regarding the relationship between school size
and student achieve new in Illinois elementary schools outside the city of Chicago. The size
data are categorized with mean achievement data presented within category. It is up to the
reader to discern if school size does make a difference in student achievement.
Table I presents the number of elementary schools by category of enrollment. Data
are for the 1994-95, 1995-96 and 1996-97 school years.
Table I
Number of Downstate Elementary Schools by Category of Enrollment
Enrollment Category 1994-1995 1995-1996 1996-1997
Less than 100 50 46 48
100-200 255 264 256 200-300 345 319 337 300-400 409 404 387 400-500 344 344 321
500-1,000 440 457 481 1,000-2,000 8 11 14
More than 2,000 0 0 0 Total 1,851 1,845 1,844
In all three years, the vast majority of schools enroll between 100 and 1,000
students. Nearly 75% of schools enroll fewer than 500 students.
Table 11 presents mean Illinois Goal Assessment Program (IGAP) data by category of
elementary school enrollment. Data are for the 1994-95, 1995-96 and 1996-97 school years.
Table II Mean Grade 3 Mathematics and Reading IGAP Scores
by Category of Enrollment 1994-1995 1995-1996 1996-1997

41
Enrollment Category Reading Math Reading Math Reading Math Less than 100 278.8 261.7 296.4 267.1 288.5 255.7 100-200 284.9 257.0 296.7 264.5 299.7 260.5 200-300 283.4 255.1 294.5 257.1 295.0 253.0 300-400 286.4 257.2 296.3 259.4 296.3 252.7 400-500 285.1 256.4 300.6 262.8 301.2 260.7 500-1,000 298.6 269.4 305.8 267.9 304.5 265.3 1,000 - 2,000 252.9 235.8 268.5 235.3 289.3 253.1 More than 2,000 NA NA NA NA NA NA A cursory analysis of Table Il shows that school size does not significantly affect either
mathematics or reading scores.
Table III presents mean Illinois Goal Assessment Program (IGAP) data when low-income
percent, limited English percent, mobility rate and attendance rate have been factored out of test
score. The table is again by category of elementary school enrollment. Data are for the 1994-95,
1995-96 and 1996-97 school years.
Table III Mean Grade 3 Mathematics and Reading IGAP
Controlled for Low Income and Limited English Percent and Mobility and Attendance Rates by Category of Enrollment
1994-1995 1995-1996 1996-1997 Enrollment Category Math Reading Math Reading Math Reading Less than 100 295.0 267.6 307.3 271.8 307.0 266.7 100-200 286.4 258.9 298.8 263.2 298.4 257.7 200-300 282.8 255.1 292.8 256.5 293.9 253.2 300-400 282.7 254.3 293.7 257.3 293.0 252.1 400-500 288.0 259.3 301.3 264.3 301.6 261.1 500- 1,000 297.0 267.8 306.2 268.8 306.2 265.8 1,000 - 2,000 280.9 249.9 294.5 255.3 292.4 251.4 More than 2,000 NA NA NA NA NA NA If any conclusion can be reached from Table III, it is that when controlling for selected
socioeconomic variables, students in schools with enrollments less than 100 score higher in
both mathematics and reading than do their counterparts in larger schools.
42
While the only statistics presented here are descriptive in nature and a more
sophisticated analysis may yield different results, it seems fairly clear that, on average,
students in small elementary schools achieve, at comparable levels to their counterparts in
larger schools. Further exploration into this matter in elementary schools should explore the
breadth of the curriculum offered in smaller schools. One positive explanation for the
relatively high scores in small schools is the lack of breadth in the curriculum.

43
The Relationship Between School Size and Achievement in Downstate High Schools
A readily accepted premise is that because of the inability of small high schools to
offer expanded curricula achievement levels of students attending small schools will not be
on par with students attending larger schools. In a rigorous sense, in order to determine if
that is a true statement there must be agreement on certain questions. One such question
would be "What constitutes a small school?" Another would be "What constitutes high
achievement?"
A second premise is that students in small high schools do not have access to the
same level of courses as students in larger schools. The number of course offerings, and
especially advanced classes are limited. One question that naturally arises is "How many
advanced course offerings are necessary?"
This report presents data regarding the relationship between school size and student
achievement and school size and number of course offerings in Illinois high schools outside
the city of Chicago. No attempt is made to answer the above stated questions. Rather, the
size data are categorized with mean achievement data presented within category. It is up
to the reader to discern if school size does make a difference in student achievement.
Table I presents the number of high schools by category of enrollment. Data are for
the 1994-95, 1995-96 and 1996-97 school years.
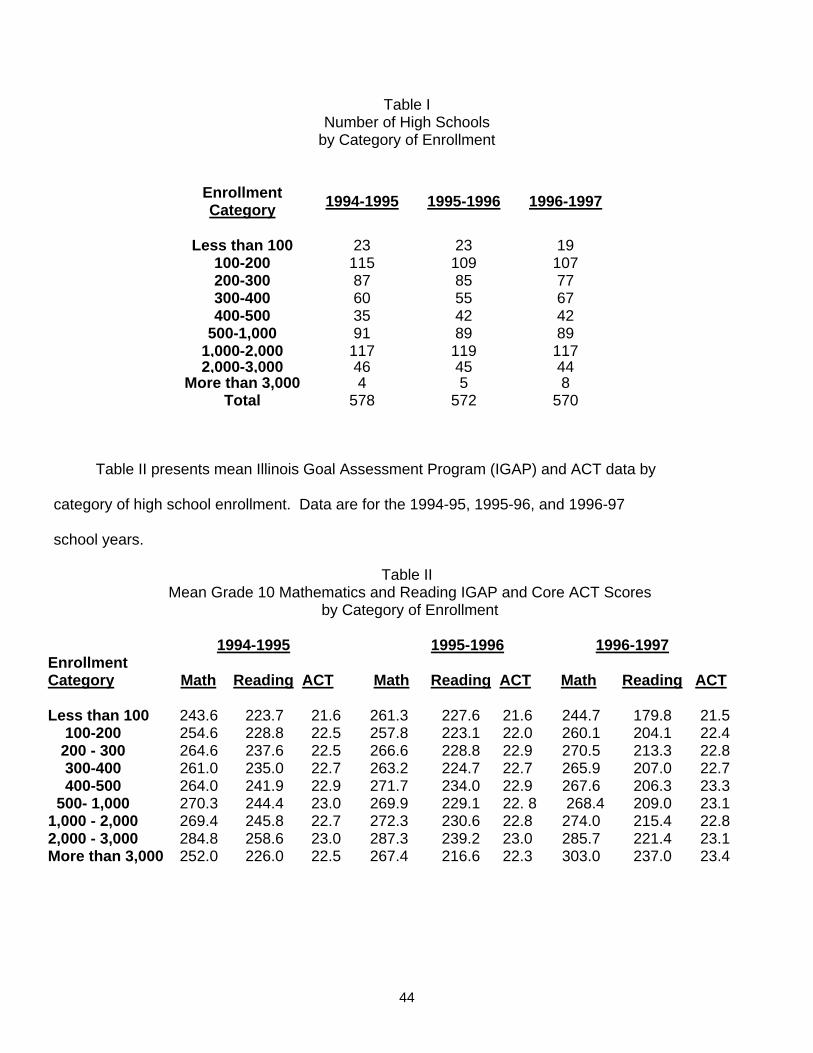
44
Table I Number of High Schools
by Category of Enrollment
Enrollment Category 1994-1995 1995-1996 1996-1997
Less than 100 23 23 19
100-200 115 109 107 200-300 87 85 77 300-400 60 55 67 400-500 35 42 42
500-1,000 91 89 89 1,000-2,000 117 119 117 2,000-3,000 46 45 44
More than 3,000 4 5 8 Total 578 572 570
Table II presents mean Illinois Goal Assessment Program (IGAP) and ACT data by
category of high school enrollment. Data are for the 1994-95, 1995-96, and 1996-97
school years.
Table II Mean Grade 10 Mathematics and Reading IGAP and Core ACT Scores
by Category of Enrollment 1994-1995 1995-1996 1996-1997 Enrollment Category Math Reading ACT Math Reading ACT Math Reading ACT Less than 100 243.6 223.7 21.6 261.3 227.6 21.6 244.7 179.8 21.5 100-200 254.6 228.8 22.5 257.8 223.1 22.0 260.1 204.1 22.4 200 - 300 264.6 237.6 22.5 266.6 228.8 22.9 270.5 213.3 22.8 300-400 261.0 235.0 22.7 263.2 224.7 22.7 265.9 207.0 22.7 400-500 264.0 241.9 22.9 271.7 234.0 22.9 267.6 206.3 23.3 500- 1,000 270.3 244.4 23.0 269.9 229.1 22. 8 268.4 209.0 23.1 1,000 - 2,000 269.4 245.8 22.7 272.3 230.6 22.8 274.0 215.4 22.8 2,000 - 3,000 284.8 258.6 23.0 287.3 239.2 23.0 285.7 221.4 23.1 More than 3,000 252.0 226.0 22.5 267.4 216.6 22.3 303.0 237.0 23.4

45
Table III presents mean Illinois Goal Assessment Program (IGAP) and ACT data when low-income
percent, limited English percent high school dropout rate, mobility rate and attendance rate have been
factored out of test score. The table is again by category of high school enrollment. Data are for the
1994-95, 1995-96 and 1996-97 school years.
Table III
Mean Grade 10 Mathematics and Reading IGAP and Core ACT Scores Controlled for Low Income and Limited English Percent and Dropout Mobility and Attendance Rates
by Category of Enrollment 1994-1995 1995-1996 1996-1997 Enrollment Category Math Reading ACT Math Reading ACT Math Reading ACT Less than 100 252.4 227.7 22.3 260.5 224.3 22.3 260.8 204.8 22.5 100-200 263.9 237.9 22.7 263.5 226.4 22.4 267.2 209.2 22.7 200 - 300 266.4 240.4 22.8 270.0 231.0 22.7 271.6 212.2 22.9 300-400 266.6 240.9 22.8 270.6 231.0 22.7 270.0 211.0 22.9 400-500 266.3 241.0 22.8 270.8 231.0 22.8 270.5 210.9 22.9 500- 1,000 269.1 243.6 22.8 269.0 229.1 22.7 270.9 210.9 22.9 1,000 - 2,000 262.3 238.4 22.6 266.4 225.8 22.7 265.5 207.1 22.7 2,000 - 3,000 269.7 244.5 22.8 273.9 230.0 22.9 275.3 213.8 22.9 More than 3,000 257.4 233.1 22.3 272.1 226.4 22.7 273.5 213.0 22.8
Table IV presents the mean number of course offerings for computer science,
mathematics and science and advanced mathematics and science for the 1994-95 school
year. The table is again by category of high school enrollment.
Table IV
1994-95 Mean Number of Course Offerings in Computer Science, Mathematics and Science* by Category of Enrollment
Enrollment Computer Advanced Advanced Category Science** Math Math Science Science Less than 100 1.2 5.9 3.1 4.2 2.2 100-200 1.4 6.4 3.3 5.5 3.2 200-300 1.6 7.2 3.8 6.1 3.5 300 – 400 1.6 8.2 4.2 7.0 4.3 400-500 1.8 8.5 4.6 7.3 4.7 500- 1.000 1.7 10.5 6.0 8.1 5.0

46
1,000 - 2,000 2.4 13.7 8.5 11.4 7.5 2.000 - 3.000 2.2 15.2 8.9 13.7 9.1 More than 3,000 4.0 21.7 12.7 17.0 9.0 * Data collection is voluntary. Some districts did not report course offerings and have been excluded from this analysis. **Some districts categorized computer science courses as mathematics.
While the only statistics presented here are descriptive in nature and a more
sophisticated analysis may yield different results it seems fairly clear that on average, high
school size does make a difference in both achievement and in the number of courses
available to students.
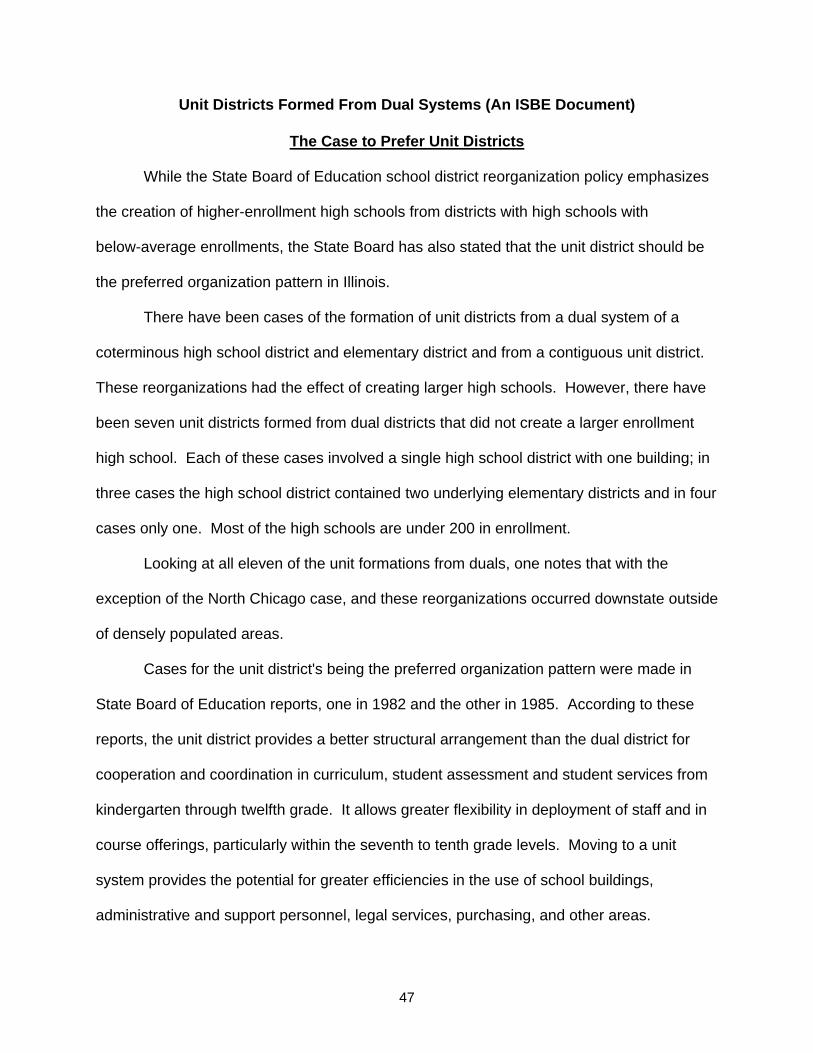
47
Unit Districts Formed From Dual Systems (An ISBE Document)
The Case to Prefer Unit Districts
While the State Board of Education school district reorganization policy emphasizes
the creation of higher-enrollment high schools from districts with high schools with
below-average enrollments, the State Board has also stated that the unit district should be
the preferred organization pattern in Illinois.
There have been cases of the formation of unit districts from a dual system of a
coterminous high school district and elementary district and from a contiguous unit district.
These reorganizations had the effect of creating larger high schools. However, there have
been seven unit districts formed from dual districts that did not create a larger enrollment
high school. Each of these cases involved a single high school district with one building; in
three cases the high school district contained two underlying elementary districts and in four
cases only one. Most of the high schools are under 200 in enrollment.
Looking at all eleven of the unit formations from duals, one notes that with the
exception of the North Chicago case, and these reorganizations occurred downstate outside
of densely populated areas.
Cases for the unit district's being the preferred organization pattern were made in
State Board of Education reports, one in 1982 and the other in 1985. According to these
reports, the unit district provides a better structural arrangement than the dual district for
cooperation and coordination in curriculum, student assessment and student services from
kindergarten through twelfth grade. It allows greater flexibility in deployment of staff and in
course offerings, particularly within the seventh to tenth grade levels. Moving to a unit
system provides the potential for greater efficiencies in the use of school buildings,
administrative and support personnel, legal services, purchasing, and other areas.

48
Varying degrees of organizational complexity are created by the dual system. These
eleven reorganizations were all at the simple end of the simplicity-complexity continuum.
After all, there are 108 high school districts and 400 elementary districts in the State, which
means the typical high school district has four underlying elementary districts. There have
been no cases of a unit formed from a dual of three, or more elementary districts. The most
complex dual systems involve six to ten elementary districts feeding into one multi-building
high school district with one or more of the elementary districts overlapping into other high
school districts. The more complex, the greater the difficulty and the lesser the likelihood of
effective coordination of curriculum and student services. Thus, some degree of
educational efficiency or effectiveness is lost by not having unit districts. At least that is a
conclusion of logic, common sense and experience. However, it may be methodologically
difficult if not impossible to conduct empirical studies measuring degrees of effective
"articulation" between the elementary and secondary level in units, relatively simple duals or
complex duals.
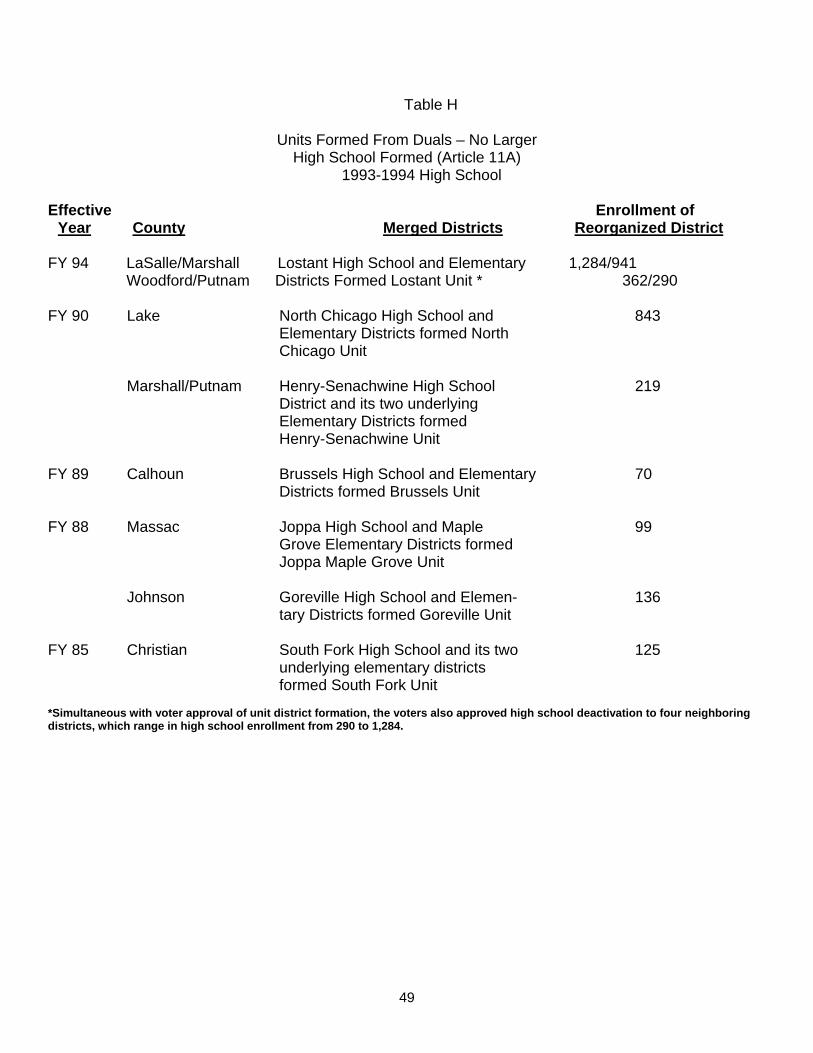
49
Table H
Units Formed From Duals – No Larger High School Formed (Article 11A)
1993-1994 High School
Effective Enrollment of Year County Merged Districts Reorganized District FY 94 LaSalle/Marshall Lostant High School and Elementary 1,284/941 Woodford/Putnam Districts Formed Lostant Unit * 362/290 FY 90 Lake North Chicago High School and 843 Elementary Districts formed North Chicago Unit Marshall/Putnam Henry-Senachwine High School 219 District and its two underlying Elementary Districts formed Henry-Senachwine Unit FY 89 Calhoun Brussels High School and Elementary 70 Districts formed Brussels Unit FY 88 Massac Joppa High School and Maple 99 Grove Elementary Districts formed Joppa Maple Grove Unit Johnson Goreville High School and Elemen- 136 tary Districts formed Goreville Unit FY 85 Christian South Fork High School and its two 125 underlying elementary districts formed South Fork Unit *Simultaneous with voter approval of unit district formation, the voters also approved high school deactivation to four neighboring districts, which range in high school enrollment from 290 to 1,284.

50
Inequities, Inefficiencies and Costs Associated with the Dual System
One obvious consequence of the dual system involving two or more elementary
districts is the tendency for a notable variation among the elementary districts in enrollment,
tax rates, percent of spending from state sources and per-pupil wealth. The formation of a
unit district along the boundaries of the high school district would have the effect of creating
equity of tax rates and per-pupil spending. A unit district provides the structure for rational
distribution of resources where they are needed. Dual systems lack the capacity to
prioritize and properly allocate total resources because of the segregation of local revenue.
Thus, pupils who graduate from certain elementary districts may be at a disadvantage in the
high school in comparison with other graduates of elementary districts within the same high
school district. For example, a poorer elementary district may be unable to pass tax rate
increase referenda and has to cut programs while a neighboring richer elementary district
continues to have adequate revenue to maintain and enhance programs.
Not only does the dual system contribute to the inequities of the Illinois school
system, but also to its costs. Based on research conducted in 1992, the dual system in the
six-county Chicago suburban area in contrast to the unit system in the area is characterized
by higher salary levels for high school teachers in high school districts than high school
teachers in unit districts; by a somewhat higher proportion of total expenditures for "general
administration;” and generally speaking, by higher educational and operational tax rates.
Recent reorganization feasibility studies conducted by the School Organization and
Facilities Section for dual systems clearly demonstrate that the formation of unit districts in
these cases would allow certain efficiencies in the use of resources. Almost all of the
smaller enrollment elementary districts in these studies and a few of the larger elementary
districts have low pupil-teacher ratios. The teacher data in these studies are confirmed by
state-level data, which show that at both the elementary and secondary levels, pupil-teacher
51
ratios in small enrollment districts are well below state-wide averages of about 19 to 1.
Consolidating or annexing such districts provides the opportunity for savings in personnel
costs through a reduction in force and a more efficient and flexible deployment of teachers.
These studies conducted for downstate dual systems compared the dual system
with 10 unit districts in the same general part of the state that had enrollments about the
same as the elementary districts and the high school district combined. The average of the
tax rates and of the number of teachers were notably lower in each set of 10 unit districts
than in each dual system under study. However, forming a unit district would usually incur
the additional cost of bringing up the salaries of the teachers in the former elementary
districts to the level of salaries that prevailed in the high school district.
Impediments to Forming Units from Duals
Recent School Organization and Facilities Section studies for dual systems
contemplating reorganization and the reactions to them have further clarified the
impediments to unit district formation from a high school district and its underlying
elementary districts in all but the organizationally sparsely populated areas of the State.
They include the usual general reasons for school boards and staff, parents and other
district residents to prefer the status quo: the widely held preference to protect local identity
and the existing geographic scope of local control and to defend existing facilities, programs
and boundaries. The following are some specifics to maintain existing dual systems:
1. The fact that the law requires a majority of "yes" votes in each affected district in the
referendum on the unit district formation proposition, rather than a majority overall. Thus, the smallest elementary district can veto the whole proposal by voting "no".
2. Resistance to the loss of a board and superintendent oriented solely to elementary or
high school level programs. 3. The cost of bringing up the salaries of elementary teachers to the level of the high
school teachers. A $10,000 or more difference is not uncommon between the average salary for teachers in the high school district and the average salary for teachers in the elementary districts. The cost of bringing up the elementary salaries to the high school

52
level is paid by the State for a four-year period under the State's program of incentive payments to reorganized districts, but thereafter is strictly a district expense. This cost of raising elementary teacher salaries -- which in the larger dual systems would exceed $1,000,000 a year-could cancel out savings potentially realizable by more efficient facility and staff utilization when a unit district replaces a dual system.
4. The overlap of an elementary district or districts within the high school district into one or
more neighboring high school districts. Forming a unit district in such circumstances necessitates the making of boundary adjustments that generally engender opposition from any district proposed to lose territory and in any event, adds to the complexity of the reorganization process.
5. The fiscal and socioeconomic diversity among the elementary districts within the high
school district. For example, residents of elementary districts with a high equalized assessed valuation per pupil and a below average tax rate are likely to oppose merging their resources and seeing their tax rates go up.
6. The high expense to the State for reorganization incentive payments to a unit district
formed from a high enrollment dual system.
a) The potentially high cost of the teacher salary difference payment has already been cited.
b) A unit district formed from a dual will lead to either- a net gain or loss in General State Aid. Losses could be in the hundreds of thousands of dollars. Any loss is paid for four years under another State payment program to
reorganized districts. A loss in general state aid, like the increased salary costs, would have to be borne by the unit district after the four years of State payments are over.
c) Another State payment to reorganized districts designed to encourage
reorganization is the deficit difference payment. Several recent proposed reorganizations in Chicago suburbia would have generated multi-million dollar payments, not because the districts involved were financially unhealthy, but because they were in counties with early tax distribution and such distributions are not included in the June 30th fund balances used to determine whether there is a payment under this program. Thus, the formula in the law created a deficit.
d) The fourth incentive payment authorized for newly formed unit districts is the $4,000 payment for each of three years for each full-time certified staff member
in the new district. Two hundred and fifty such members in a suburban system is not a high number, yet such a count could generate a $3,000.000 payment by the State over three years.

53
Reorganization Considerations and Options
In reviewing the reorganization options, each individual situation has to be looked at in terms of factors unique to that situation. The goals of a school district organization should include, at minimum, the following:
Goal #1: To produce improvement in the quality of the educational system. Goal #2: To extend the scope of programs to meet individual student needs within
an ever-changing society. Goal #3: To develop an efficient and equitable system of financing public
education. Currently, the State of Illinois allows for school district reorganization to take place
through the implementation of a number of processes. Each of these has its own set of
regulations and is designed to accommodate the different circumstances found throughout
Illinois. The following is a discussion of the feasibility, and probable effect, of those, which
"fit" reorganization considerations if employed by the districts involved in this study.
Community Unit District Formation – Article 11A
This method of reorganization can create a new unit district from two or more
existing unit districts and/or dual district territory. In this type of reorganization, a newly
formed unit district must have at least $12,000,000 in assessed valuation and at least 4,000
residents within the newly reorganized district. These requirements apply only when no unit
districts are included in the petition and when they do apply, the law allows for exceptions.
These qualifications are well within the current assessed valuation and populations
requirements of a newly reorganized unit district encompassing the districts under study.
Districts utilizing this type of consolidation will have their present boards dissolved and a
new Board of Education will be elected at the next subsequent election or in the same
election as the reorganization proposition is submitted.
The process begins with a petition to the Regional Superintendent of Schools either
by the respective Board of Education or the voters. The petition must be signed by at least
54
200 voters and include the signatures of 50 voters or 10% of the voters, whichever is lesser
from each of districts wholly or partially included in the proposal. The Regional
Superintendent is required to publish notice of the petition for three consecutive weeks in a
local newspaper. A description of the proposed district must be included. A Committee of
Ten citizens is formed as an advisory and planning group in the formation of the new
district. This Committee of Ten may be in part made up of Board of Education members
from the affected districts as well as citizens living within the newly planned district. A
hearing is held by the Regional Superintendent to gain input from all parties pro or con on
the reorganization issue. After the hearing, the Regional Superintendent must approve or
deny the petition within 14 days of the conclusion of the hearing. If the Regional
Superintendent approves the petition, the State Superintendent of Schools reviews the
petition and also approves or denies it. In reviewing reorganization petitions, the State
Superintendent will take into account whether:
The proposed district "will have sufficient size and financial resources to provide and maintain a recognized educational program for grades kindergarten through 12." The proposed school district is in the best interests of the schools of the area and the educational welfare of the students.
The territory for the proposed school district is compact and contiguous for school
purposes. If the State Superintendent approves the petition, an election is held at the next
regularly scheduled election date. For approval at the election, a majority of voters in each
affected district is required for passage of the referendum. In addition, the tax rates to be
levied by the newly reorganized district must be on the ballot and must be approved for the
Education, Building, Transportation, and Fire Prevention and Safety funds. Recent
legislation has allowed the election of school board members for a newly reorganized
55
district may be held at the same time as the reorganization issue is voted upon. This would
normally be held in the April election date. Bonds may also be approved at this election if it
is determined to be necessary by the Committee of Ten.
A further consideration in the formation of a new unit district using this method is that
the bonded indebtedness of any previously existing district "stays with the district (territory
within a new district) that incurred the debt." In other words, whatever bonded
indebtedness was present before reorganization will be assessed on those voters only until
that bond issue(s) are paid for completely. In 1994, legislation was passed that the election
petition may also request that bonded indebtedness of each existing district could be
assumed by the entire territory of the new unit district.
The possibilities for school district reorganization utilizing Article 11A include the
following:
1. The requirements for $12,000,000 in assessed valuation for the new district as well as the minimum of 4,000 population are present within the existing districts encompassed in this study.
2. The petition requirements are normally made by the school boards of the districts
contemplating reorganization. However, in the case of the districts included in this study, it is possible that the voters petition requirements of 200 signatures of which 50 or 10%, whichever is lesser from each of the districts, would have to be the method to bring an 11A reorganization proposition to the voters.
3. Some other pertinent factors in school district reorganization include bonded
indebtedness of the newly reorganized district. In the case of an 11A reorganization, the bonded indebtedness of each district will stay with the previous district that incurred the debt. In other words, any bonded debt that each individual district had before reorganization will be paid by only the citizens of the original district.
4. Teachers in both districts will have their tenure merged into a single seniority list in
the newly reorganized district. 5. Multi-year agreements made by the previous districts except multi-year agreements
with certified and non-certified employee groups must be honored with the newly reorganized district. These agreements may include transportation, cafeteria, and individual administrative multi-year agreements.
56
6. As the old boards of education are dissolved after a successful reorganization vote, so are the teachers unions of the previous districts, but normally they merge to form a new union and collective bargaining will commence after the new board of education is formed.
7. Formation of a unit district would undoubtedly result in a more efficient use of
existing facilities and staff. In other words, the administration of a newly formed unit district would be responsible for all of the existing elementary, junior high and high school facilities. In addition, the staff of the new unit district would be placed in a more efficient staffing pattern when using all of the existing programs throughout the new unit district as opposed to those existing in the current separate districts.
8. The tax rate would be the same for all of the taxpayers in the newly formed unit
district. 9. Economies of scale could be more effectively utilized in the business operations of
a unit district. By this, the consultant implies that purchasing of larger quantities of supplies would inherently be cheaper due to the increased volume of the expenditures of a newly reorganized district.
10. Curriculum coordination between the elementary buildings and junior highs would
have a higher degree of coordination of curriculum programs leading into the high school years.
11. A comprehensive junior and senior high program could be developed for all unit
district students. 12. There would undoubtedly be reductions of administrative staff especially in the
central office and areas of superintendent and assistant superintendent positions, in a newly reorganized unit district with concurrent salary savings in this area, as well as central office duplication of staff currently in the districts involved in this study.
13. In any reorganization there are areas of concern. In this reorganization method, one
of the concerns is that the election must pass with a majority of yes votes in each district, or affected area, regardless of the number of voters. In addition, when combining unit districts, districts generally reduce their certified teaching force with economies of scale in the numbers of teachers needed in a larger unit district. Lastly, there is a measure of loss of local control when six school boards and their 14 members are reduced to seven board members of a new unit district. Many or all of these factors relating to a school district reorganization will apply equally in the other methods of reorganization currently approved in Illinois.
For purposes of this study, an 11A consolidation could be utilized by the unit districts in
this study and is in fact the only method in which a new unit district could be created.

57
Consolidation Utilizing Article 11B
In an 11B consolidation, elementary or high school districts may be reorganized
utilizing the same set of regulations and procedures with the exception of one significant
difference. In the election to approve the formation of a larger elementary or high school
district from existing elementary or high school district from existing elementary or high
school districts, the vote will pass if a "majority" of those voting on the proposition vote for
reorganization. Thus, rather than the election being successful if it receives a majority of
votes in each district or affected area, in an 11B proposition, a majority voting overall will be
sufficient to pass the proposition.
In this case, the unit districts making up the districts in the study could not utilize this
method to consolidate, since only an 11A reorganization is permissible to create a new unit
district.
Annexation of School District by Article 7
Annexation of school districts either in part or an entire district is permitted under the
guidelines in Article 7 of the Illinois School Code. This method differs in many respects
from the Article 11A & B requirements.
Districts utilizing annexation processes essentially become a part of an existing
district. In other words, one district annexes another district(s) with one district continuing to
function and the other district(s) going out of existence.
This process may begin in one of two ways. First, the Boards of Education in the
affected district(s) may petition the Regional Board of School Trustees for annexation. The
petition for annexation may also be made by a majority of the registered voters in each
district affected or two-thirds of the registered voters residing in the affected districts.
After a petition is received by the Regional Board of School Trustees, the Regional
Superintendent holds a hearing at which the Regional Superintendent submits maps, report
58
of financial and educational conditions of the districts involved, and the probable effect of
the proposed changes to the regional board. Any resident of the territory in the affected
districts may appear at the hearing and present evidence in support of opposition to the
petition. Within ten days of the hearing, the Regional Superintendent shall meet together
with the Board and a decision shall be forthcoming.
It is important to note that there is now an election for districts using the annexation
method and that the decision on annexation lies with the voters in each “affected district.”
While this method has been utilized by 53 of the 102 school district reorganizations
approved from 1980-1997 and was the most widely utilized method of school district
reorganization, the added requirement of an election after approval by the Regional Board
of School Trustees has significantly diminished the utilization of the annexation method.
Normally, this type of reorganization is approved by boards of education and brought to the
Regional Board of Trustees. If any of the current boards of education do not approve a
resolution to the Regional Board of Trustees, then a majority of voters in each affected
district must sign a petition to approve of the resolution to be made to the Regional Board of
Trustees. In this reorganization option, one board is dissolved and the annexing district
board takes over and utilizes their current tax rate, etc. This option would be unusual in that
many of the positive aspects of reorganization would be maintained by creating one larger
unit district. In this instance, there would only be one unit district rather than the current two
districts. Therefore, an Article 7 annexation is a permissible reorganization method for the
two unit districts involved in this study by either district.
Deactivation of a High School Facility Under Section 10-22B
This type of school district reorganization is a relatively new method and has been
used on ten occasions since its inception in 1987. Essentially, a district "deactivates" its

59
high school, whether it is a separate high school district or a part of a unit district and
"tuitions" its students to a neighboring high school or unit district.
Until June of 1989, deactivation could only occur for a maximum of five years but
legislation has removed that time limit and deactivation may now continue indefinitely with
either a continuation of a one-year or two-year agreement between the districts.
Deactivation requires the approval of the board of the receiving district and of the majority of
those voting upon the deactivation proportion in the sending district. Thus, a two-pronged
approval system is utilized with one part being an approval by a Board of Education and the
other by a vote of the majority of the voters in the sending district.
A board contemplating deactivation shall, by proper resolution, cause the
proposition to deactivate the high school facility to be submitted to the voters at a regularly
scheduled election notice shall be published at least ten days prior to the date of the
election, at least once in a newspaper. A majority of those voting upon the proposition vote
is required for passage.
If the vote is successful, the sending district shall pay an amount to the receiving
district, not to exceed 10% more than the per capita tuition cost of education for each
student who is reassigned. This cost shall be an amount agreed to by the two districts, but
it must not be less than the per capita tuition cost determined by the Illinois State Board of
Education for the preceding year for the high school of the receiving district. The length of
the initial contractual agreement shall be for two years, but the districts may renew the
contract for one- or two-year periods.
Transportation of students remains the responsibility of the sending district. In
addition, tenure rights of teachers in the deactivated high school are maintained and when
the deactivation becomes effective, they are transferred to the receiving district. The
question of transfer of tenure in a deactivation is interesting in that while the high school
60
teachers of the sending district transfer their tenure and salary to the receiving district, the
sending district is technically still in existence and can be reconstituted by the sending
district at the end of the contractual agreement between the districts.
Thus, a school district that deactivates its high school facility is in the position of
temporarily discontinuing its high school program but does not go out of existence as in all
other methods of reorganization except the Cooperative High School. Essentially, the
business functions of the high school continue and the Board of Education in the sending
district(s) must continue to maintain the levy, budget, and other areas as a functioning
district. Districts wishing to reactivate their high schools have a process to do so if they
desire and to begin their high school program again.
Since there is no official reorganization of school districts utilizing high school
deactivation, financial incentives are not available for districts utilizing this process.
For purposes of this study, it would be legal for a combination of districts to utilize
deactivation. . Therefore, high school deactivation is an approvable alternative for the
districts for the purposes of this study for either of the unit districts.
Dissolution of School Districts Under Section 7-2A and 7-11 of Article 7 of the School Code of Illinois
This type of reorganization was possible under Article 7, but new legislation effective
in 1989 now delineates a different format for dissolution of school districts. Essentially,
districts using this method simply go out of existence. Control over these districts passes to
the Regional Board of School Trustees.
Petitions for dissolution are made by the Board of Education or a majority of the
legal voters residing in the district proposed to be dissolved. Only districts with a population
of less than 5,000 can utilize this method of reorganization. The Regional Board will not act
on a petition filed by a board of education, if within 45 days after giving notice of the
61
hearing, a petition in opposition to the petition of the Board to dissolve, signed by a majority
of the registered voters of the affected district, is received.
The Regional Board has no authority to deny dissolution requested in a proper
petition but shall exercise its "discretion" on the Issue of annexing the territory of a district
being dissolved. Tenured teachers of a dissolved district are transferred to the annexing
district in relation to their seniority within the dissolved district and in relation to the seniority
of teachers in the annexing district.
The Regional Board may annex all or part of the dissolved district to one or more
districts. It should be noted here that a review of the legislation and ISBE regulations do not
stipulate that a district may refuse annexing all or part of a dissolved district.
In the dissolution of school districts, if a majority of signatures of the voters in the
district are obtained to dissolve the school district, the Regional Board of School Trustees
cannot deny the petition and must dissolve the district after a public hearing is held to hear
the views of the citizens. Thus, there is a forcible method of school district reorganization,
which can totally bypass a Board of Education.
A hearing will be held not less than 50 days nor more than 70 days after a petition to
dissolve is received. At the hearing, the Regional Board shall hear evidence as to the
school needs and conditions of the territory and the area. Within ten days of the hearing the
regional board will render a decision on the annexation of dissolved district.
Districts utilizing this reorganization format are essentially empowering the Regional
Board with the ultimate authority to decide what is going to happen to the District. Districts
dissolving are eligible for the financial incentives available to the annexing district.
Essentially, the same guidelines for annexing districts apply to districts dissolving and
becoming annexed by the Regional Board of Trustees.
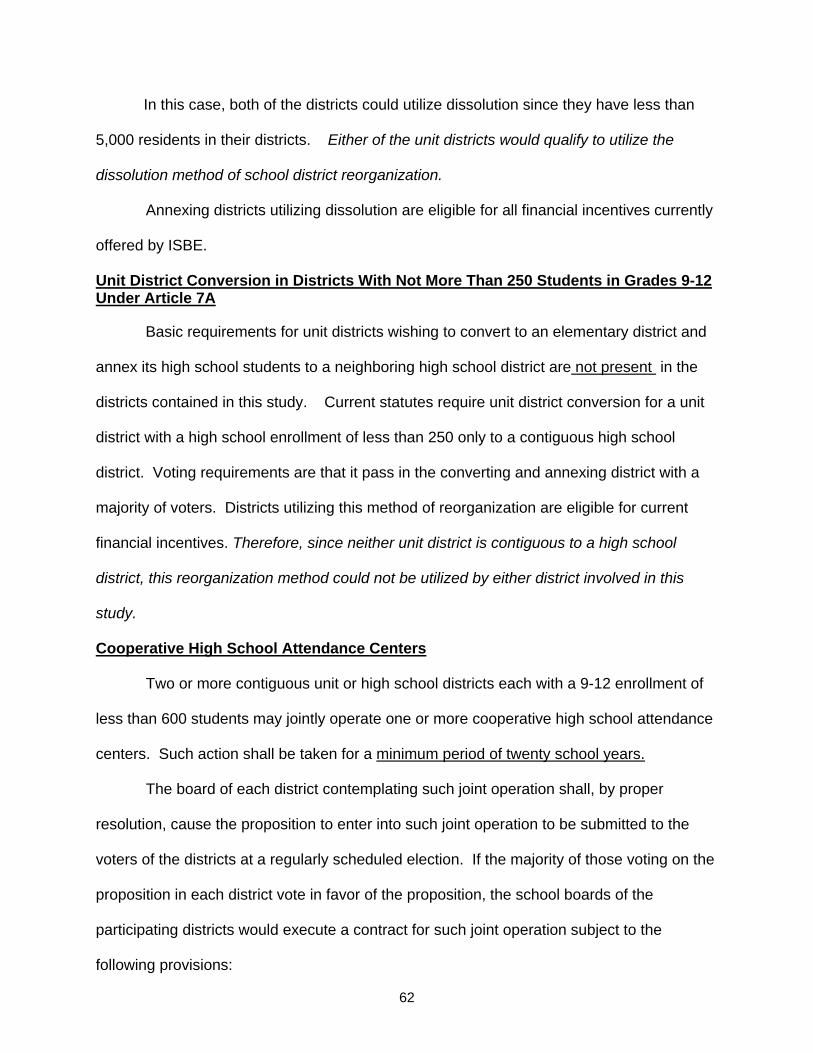
62
In this case, both of the districts could utilize dissolution since they have less than
5,000 residents in their districts. Either of the unit districts would qualify to utilize the
dissolution method of school district reorganization.
Annexing districts utilizing dissolution are eligible for all financial incentives currently
offered by ISBE.
Unit District Conversion in Districts With Not More Than 250 Students in Grades 9-12 Under Article 7A
Basic requirements for unit districts wishing to convert to an elementary district and
annex its high school students to a neighboring high school district are not present in the
districts contained in this study. Current statutes require unit district conversion for a unit
district with a high school enrollment of less than 250 only to a contiguous high school
district. Voting requirements are that it pass in the converting and annexing district with a
majority of voters. Districts utilizing this method of reorganization are eligible for current
financial incentives. Therefore, since neither unit district is contiguous to a high school
district, this reorganization method could not be utilized by either district involved in this
study.
Cooperative High School Attendance Centers
Two or more contiguous unit or high school districts each with a 9-12 enrollment of
less than 600 students may jointly operate one or more cooperative high school attendance
centers. Such action shall be taken for a minimum period of twenty school years.
The board of each district contemplating such joint operation shall, by proper
resolution, cause the proposition to enter into such joint operation to be submitted to the
voters of the districts at a regularly scheduled election. If the majority of those voting on the
proposition in each district vote in favor of the proposition, the school boards of the
participating districts would execute a contract for such joint operation subject to the
following provisions:

63
1. The agreement for joint operation of any such cooperative high school attendance center shall be executed on forms provided by the State Board of Education and shall include, but not limited to, a process to resolve disputes on matters which each participating district cannot agree, provisions for administration, staff, programs, financing and transportation. Even if two or more of the participating district boards approve an extension of the agreement, any other participating district shall, upon failure of its board to approve such extension, disengage from such participation at the end of the then current term.
2. An advisory board, which shall govern the operation of any such cooperative high school attendance center, shall be composed of an equal number of board members from each of the participants, except that where all participating district boards concur, membership on the advisory board may be apportioned to reflect the number of students in each respective district. The membership of this advisory board shall be not less than 6 or more than 10. The school board of each participating district shall select from its membership, its representatives on the advisory board. The advisory board shall prepare and recommend a budget for the cooperative high school attendance center, which must be approved by each of the participating districts.
3. Each participating school district shall provide any necessary transportation for students residing in the district, or enter into an agreement with the other participating districts for transportation of its students.
4. Each participating district shall pay its per capita cost of educating the students residing in its district and attending any such cooperative high school attendance center into the budget for the maintenance and operation of the cooperative high school attendance center or centers. Such per capita cost shall be computed in the following manner. The cost of maintaining and operating such cooperative high school attendance centers shall be first determined by the advisory board and shall include the following expenses applicable only to each attendance center under rules and regulations established by the State Board of Education as follows:
a) Salaries of principals, teachers, professional workers, necessary non-certified
workers, clerks, librarians, custodial employees and any district taxes levied specifically for their pension and retirement benefits.
b) Educational supplies and equipment, including textbooks. c) Administrative costs and communication. d) Operation of physical plant, including heat, light, water repairs, and maintenance. e) Auxiliary service, including up to 20% of non-reimbursed transportation costs. f) Depreciation of physical facilities at a rate not to exceed $200 per pupil.
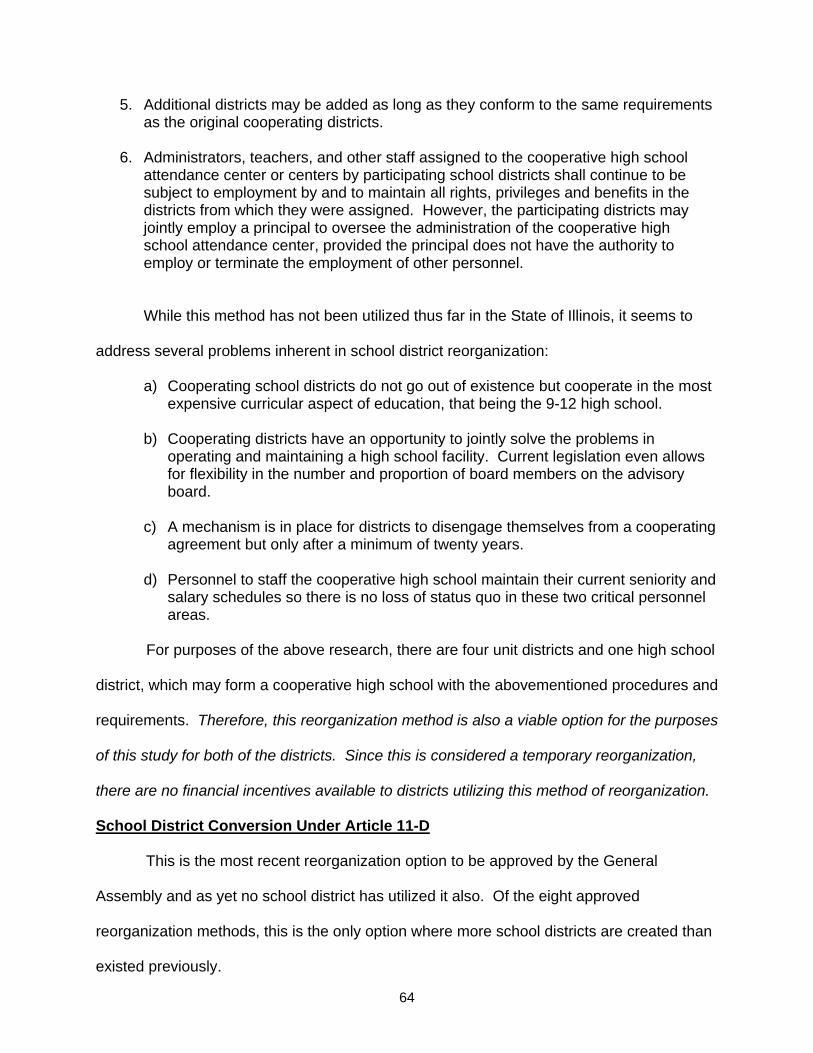
64
5. Additional districts may be added as long as they conform to the same requirements as the original cooperating districts.
6. Administrators, teachers, and other staff assigned to the cooperative high school
attendance center or centers by participating school districts shall continue to be subject to employment by and to maintain all rights, privileges and benefits in the districts from which they were assigned. However, the participating districts may jointly employ a principal to oversee the administration of the cooperative high school attendance center, provided the principal does not have the authority to employ or terminate the employment of other personnel.
While this method has not been utilized thus far in the State of Illinois, it seems to
address several problems inherent in school district reorganization:
a) Cooperating school districts do not go out of existence but cooperate in the most expensive curricular aspect of education, that being the 9-12 high school.
b) Cooperating districts have an opportunity to jointly solve the problems in
operating and maintaining a high school facility. Current legislation even allows for flexibility in the number and proportion of board members on the advisory board.
c) A mechanism is in place for districts to disengage themselves from a cooperating
agreement but only after a minimum of twenty years. d) Personnel to staff the cooperative high school maintain their current seniority and
salary schedules so there is no loss of status quo in these two critical personnel areas.
For purposes of the above research, there are four unit districts and one high school
district, which may form a cooperative high school with the abovementioned procedures and
requirements. Therefore, this reorganization method is also a viable option for the purposes
of this study for both of the districts. Since this is considered a temporary reorganization,
there are no financial incentives available to districts utilizing this method of reorganization.
School District Conversion Under Article 11-D
This is the most recent reorganization option to be approved by the General
Assembly and as yet no school district has utilized it also. Of the eight approved
reorganization methods, this is the only option where more school districts are created than
existed previously.
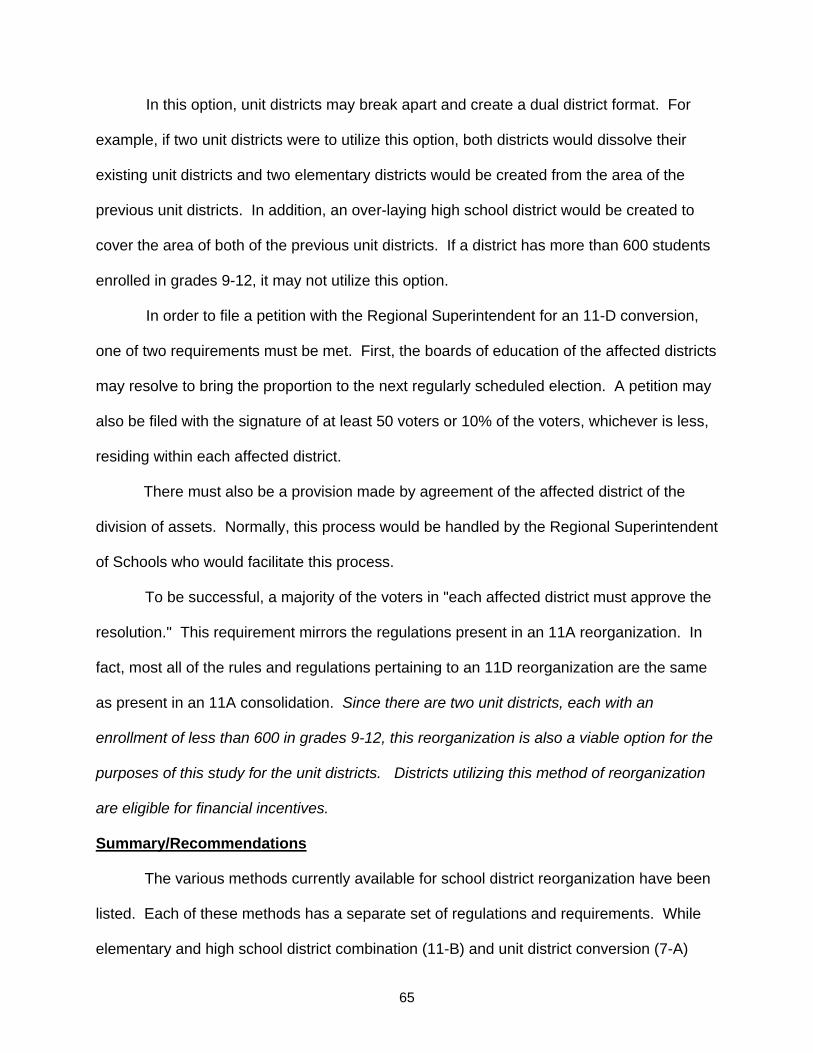
65
In this option, unit districts may break apart and create a dual district format. For
example, if two unit districts were to utilize this option, both districts would dissolve their
existing unit districts and two elementary districts would be created from the area of the
previous unit districts. In addition, an over-laying high school district would be created to
cover the area of both of the previous unit districts. If a district has more than 600 students
enrolled in grades 9-12, it may not utilize this option.
In order to file a petition with the Regional Superintendent for an 11-D conversion,
one of two requirements must be met. First, the boards of education of the affected districts
may resolve to bring the proportion to the next regularly scheduled election. A petition may
also be filed with the signature of at least 50 voters or 10% of the voters, whichever is less,
residing within each affected district.
There must also be a provision made by agreement of the affected district of the
division of assets. Normally, this process would be handled by the Regional Superintendent
of Schools who would facilitate this process.
To be successful, a majority of the voters in "each affected district must approve the
resolution." This requirement mirrors the regulations present in an 11A reorganization. In
fact, most all of the rules and regulations pertaining to an 11D reorganization are the same
as present in an 11A consolidation. Since there are two unit districts, each with an
enrollment of less than 600 in grades 9-12, this reorganization is also a viable option for the
purposes of this study for the unit districts. Districts utilizing this method of reorganization
are eligible for financial incentives.
Summary/Recommendations
The various methods currently available for school district reorganization have been
listed. Each of these methods has a separate set of regulations and requirements. While
elementary and high school district combination (11-B) and unit district conversion (7-A)

66
was found to be legally impossible to utilize, the remaining methods are legally permissible.
It should be noted that only one reorganization method, an 11A consolidation, provides an
option to create a new unit district. An Article 7 annexation could create a larger unit district
from one of the existing unit districts. High school deactivation would allow one or more unit
districts to deactivate its high school and continue in operation for an undetermined period
of time. Any or all of the districts could individually or in tandem dissolve their district and
thus require the Regional Board of School Trustees to annex it in whole or part to
neighboring districts. It would also be permissible for the existing unit districts and high
school district to cooperatively form and administer a high school. A dual system of one
over-laying high school district and two elementary districts could also be legally formed
(11-D) with the current unit districts for the purposes of this study.
For the purposes of this study, the Illinois State Board of Education requires that the
consultants make a recommendation on each phase of the feasibility study. Therefore, it is
the recommendation of the consultants that Divernon CUSD #13 and the Pawnee CUSD
#11 consolidate to utilize the 11-A format to create a new unit district. The rationale for this
recommendation includes the following:
• Both districts are relatively similar in enrollment, Equalized Assessed Valuation,
tax rates. While Divernon faces more current financial problems, the newly
enlarged unit district would generate a higher “critical mass” of students and EAV
needed to create and maintain one comprehensive high school curriculum rather
than two.
• Together the two districts would become more fiscally and financially stable
• Both districts have an excellent prognosis for increased enrollment.
• The current facilities would probably all be required and savings could be
engendered in utilizing the current Pawnee High School facility as a high school

67
and the current Divernon High School facility as a junior high. This would very
likely preclude any necessity for building additional rooms for Pawnee.
• The high school and junior high curriculum would be greatly enhanced by
coalescing the enrollment of the two high schools and avoiding as much as
possible of small enrollment high school courses and most likely an improved
high school curricular offering.
The responsibility of the Consultants has been to bring a higher level of awareness
of the intricacies of school district reorganization in Illinois. Finally, while the various
reorganization methods have been recounted, an additional possibility has not been
mentioned. That possibility is maintaining the status quo for the districts cooperatively
seeking information in this report. It will be the responsibility of the Boards of Education and
interested citizens to sift through the information to determine the best actions for their
individual districts. In this endeavor, the team of consultants stands ready to assist in these
determinations for the future of these two school districts.

68
Curriculum Considerations and Comparisons for Divernon and Pawnee
Part 1: K-12 Organization
Overview of grade configurations K-12
The curriculum of the two districts is organized into Pre-K-6 at Pawnee Elementary
School, 7-8 at the junior high level, and 9-12 at Pawnee High School that includes students
from Pawnee Consolidated Unit School District #11. The Divernon Consolidated Unit
School District # 13 is comprised of Pre-K–5 at Divernon Elementary, grades 6-8 at
Divernon Junior High, and 9-12 at Divernon High School.
Early Childhood, Pre-K through Grade 5
There are Kindergarten programs in all of the participating districts respectively. The
Divernon CUSD offers a Pre-K program (half-day, 4 students) for 3-4 year olds. Divernon
Elementary houses a full day Kindergarten program (1 teacher, 19 students).
Pawnee Elementary also offers similar Early Childhood and Pre-K programs (half-
day, 4 sections) at the Elementary site. Full-day Kindergarten is offered to 2 sections of
students. In a merger, regardless of configuration, all current programs would continue as
they are currently serviced.
The current organization and curriculum programming of grade levels in the two
districts of Divernon Elementary (K-5), Pawnee Elementary (K-6), Divernon Junior High (6-
8), and Pawnee Junior High (7-8) all produce a difference in number of classroom teachers
at each grade level, excluding specialty teachers (PE, Art, Music, etc.). In a merger, if
elementary centers are maintained, the differences among numbers of teachers will need to
be analyzed for efficiency. All of the classrooms are self-contained in the presentation of the
curriculum. There is no tracking of students in the K-5 or K-6 curriculum at either district.
All grades 6-8 or 5-8 schedules accommodate more traveling from room to room and are

69
designed as junior high or middle school schedules. The following table presents data
showing the distribution of classroom teachers across K-8 grades:
Number of Teachers in Early Childhood, Pre K- 8 Grades (2003-2004) (Excluding Specialty Teachers)
Grade Divernon Pawnee EC 1 1
Pre-K 1 2
KG 1 2
1 1 2
2 1 3
3 1 3
4 1 2
5 1 3
6 2
7 4 (6-8) 3
8 2
Junior High
There is not a difference in the organization of the middle grades between the two
school districts. Divernon JH students (6- 8, with 64 students) are taught in a modified
block schedule with 70 minute periods. Pawnee students (7-8, with 110 students) receive
instruction in a Block 8 schedule to mesh with the current high school schedule.
Divernon students receive technology weekly and may choose from special subjects
in Band, Health, Careers, Computers, Speech, and Spanish (8th grade). Extra-Curricular
activities include: Drama, Literary, Boys and Girls Basketball, Track, Softball, Cheerleading,
and Baseball.

70
Pawnee students participate in Art, Band, Chorus, Computers, and Life Skills. Extra-
Curricular activities include: Boys and Girls Basketball, Scholastic Bowl, Track,
Cheerleading, Volleyball, Softball, Baseball, Spelling Bee, Jr. Beta Club, and Literary.
Another consideration in this matter is the special subjects. Because specialists are
shared between levels and buildings, the distribution of specialty subjects across K-12 is
depicted in the following table:
K-12 Specialty Subjects in the Curriculum
Subject Divernon Pawnee
K-8 9-12 K-8 9-12
PE (1) K-4
(1) 5-8
1 (2) K-6
(2) 7-8
1.75
Art
1.25 .75
Band
(1) K-12 (1) 5-12
Chorus
(1) 5-12
General Music
(1) K-5 (1) K-3
Home Economics
1
Industrial Technology
.25
Vocational CACC
Agriculture
Family & Consumer
Science
1
1/2
Computer Science
K-8 1
Foreign Language 1
Spanish 1 Spanish
The strengths of each Districts individual school curriculum include:
K-8 Divernon: • Computer Instruction, K-5.
• Accelerated Reader, 1-8.

71
• Title 1 Reading.
• Math Counts, K-5.
• Reading Assessment program, K-3.
• Latchkey Program, K-8.
• Kaleidoscope Careers, Grades 4& 5.
• Project Alert, grade 6.
• JH Electives in Band, Health, Speech, Spanish (8th), and Technology.
• Extra-curricular programs and sports.
K-6 Pawnee:
• 90 minute block dedicated to Writing and spelling, K-3
• Phonics program, K-2.
• Accelerated Reading K-8.
• Hands-on Science & Social Studies, grades K-2.
• Title 1 Reading, K-4.
• Advisory groups, 1-6.
• Second Step, K-5.
• RISE, grade 6.
• Internet-based Math, 5-6.
• Team oriented core subject instruction, 4.
• Math-a-thon.
• Pawnee Pride Team.
7-8 Pawnee.
• Accelerated Reader, 7 & 8.
• Technology availability to students (lab).
• Community Service projects.
• Computer Re-cycling program.
• Electives in Music, Life Skills, Technology, and Art, plus Physical Education.
• Extra-curricular programs and sports.

72
High School 9-12, Divernon High School
Divernon High School (CUSD 13) has a traditional curriculum with a program to
serve 68 students in grade 9 through 12. Highlights of the curriculum include:
• Business Courses in Intro. to Business, Intro. To Computers, Accounting, Advanced Computers, Business & the Net, and Desktop Publishing.
• Family & Consumer Sciences- Intro. To Family & Consumer Sciences, Child Development/Parenting, Consumer Resource Management, Foods & Nutrition, and Nutrition & Fitness.
• Course options in Mathematics include: Algebra 1 & 2, Geometry, Statistics, Trigonometry, and Adv, Algebra/Calculus.
• Science courses in Intro. To Biology, Biology 1 & 2, Chemistry, Environmental Science, and Physical Science.
• English 1-4, Honors English 4 as well as, three electives in Drama & Film, and Speech and Communication.
• Social Science courses ranging from Geography, World History, U.S. History, Current Events, 1960 to present, and Sociology.
• Foreign Language, Spanish 1-4.
The Divernon HS curriculum is presented in a Block 4 schedule. Classes each day
are 83 minutes long and students typically take 4 classes per day. Teachers teach 3 block
periods and receive one preparation period per day. Graduating seniors must obtain
twenty-six (26) credits in academic core subjects including: 3 credits of English, 2 credits of
Science, 2 credits of Mathematics, 2 credits of History, which includes U.S. History for 1
credit, and World History for 1 credit, 1 credit of Consumer Resource, 1 credit of Health, and
2 credits of physical education. Eleven (11) electives are also required for graduation.
College admissions requirements go beyond the current 26 credits. Admissions will require
an additional year of English, Math, Social Studies, Science/Lab Sciences, and one
additional year of Fine Arts Vocational Education, or Foreign Language.
In-house sports include: Boys Basketball, Girls Volleyball, and Boys Baseball.
Divernon and Pawnee offer Football, Girls Softball, Girls Basketball, and Track
cooperatively.

73
Clubs include: Scholastic Bowl, Student Government Association, National Honor
Society, Family & Consumer Science Club, Spanish Club, Letterman’s Club, and Yearbook
Club.
High School 9-12, Pawnee High School
Pawnee High School (CUSD 11) has a curriculum with traditional programs to 204
students in grade 9 through 12. Examples of these include:
• Several course options at various levels in Consumer Math, Pre-Algebra, Pre-Geometry, Algebra 1 & 2, Geometry, Pre-Calculus, and Calculus.
• Sciences courses in Earth Science, General Biology, CP Biology 1 & 2, Environmental Science, Chemistry, Physics, and Anatomy.
• Two levels of English, General English 1-4, CP English 1-4, Internet Research, Creative Writing, Mythology, and Speech.
• Social Science courses ranging from World History, U. S. History, World Geography, Constitution, Current Events, Practical law, Psychology, Sociology, and The Holocaust.
• Art course include: Art 1-4, Sculpture, and Creative Enhancement.
• Technology courses in Computer technology 1 & 2, Consumer Education, and Computer Accounting, Computer Organization, Webpage Design, and Advanced Computers.
• Industrial Technology offers Intro. To Auto Cad, Intro to Woodworking, Advanced Woods, and Advanced Auto Cad.
• Foreign Language instruction-Spanish 1-4.
• Family & Consumer Science courses in Adult Living and Parenting.
• Band and Chorus are also offered.
The Pawnee HS curriculum is presented in a Block 8 schedule with classes meeting
every-other day. Classes each day are 83 minutes long and students typically take 4
classes per day. Teachers have 3 classes and receive 1 preparation period.
A student must complete 30 credits including the following to be eligible for
graduation: 3 years of Math, 3 years of Science, 4 years of English (including Speech), 3
years of Social Science, 1 credit in Fine Arts, 15 credits of elective courses, Health (1), four

74
years of Physical Education, and passing Drivers’ Education, Health, and Consumer
Education.
College admissions require one additional year in Social Studies and one additional
year in Math. Two years of Foreign Language, Music, Art, or Vocational Education are also
required.
In-house sports include: Football, Volleyball, Boys & Girls Basketball, Baseball,
Softball, and Track. Cooperative sports programs are offered for Boys Golf with Auburn,
Football, Girls Softball, Girls Basketball, and Track with Divernon.
After school clubs include: Scholastic Bowl, Yearbook, Student Council, National
Honor Society, Rotary Club, SADD, Model United Nations, Youth in Government, School
Musical, and Solo and Ensemble Contest.
Special Education Programs, PK- 12
Special Education programs are serviced by Sangamon Area Special Education
Cooperative (SASED)for Divernon and Pawnee. Divernon utilizes 2 teaching staff for 2
resource rooms at each level for K-5 (1) and 6-12 (1). A School Psychologist and Social
Worker are part-time. The district also employs a Speech Therapist and School Counselor
(K-12).
Pawnee also utilizes services from SASED with (4) resource rooms, one teacher at
each level in grades 1-2, 3-4, 5-6, and 7-8. Pawnee HS employs 2 full-time staff for
resource, direct instruction, and inclusion. SASED also supplies a third-time Social Worker,
while the district supplies 2 full-time school counselors (K-12).

75
Summary of Curriculum Organization
• No additional programs would be needed in the consolidation process. The
current PK- 12 programs would offer a solid curriculum to serve the students of all of the communities. However, the grade configuration of buildings and programs may be modified to offer a more comprehensive junior high and senior high school curriculum. (See curriculum enhancement options at the end of this section).
• The curriculum organization in all elementary buildings with five or more total
teachers at K-4 provides the potential for grade level collaboration across the newly formed district. Further exploration of student achievement, assessment, and the analysis of grade level progress over time would be a worthy goal.
• A compilation of the high school curricula (below) will illustrate how all senior high
programs could be combined and allow more electives to be offered at the junior high level. Introductory or survey electives may be added by moving some programs to the 6 -8 grades.
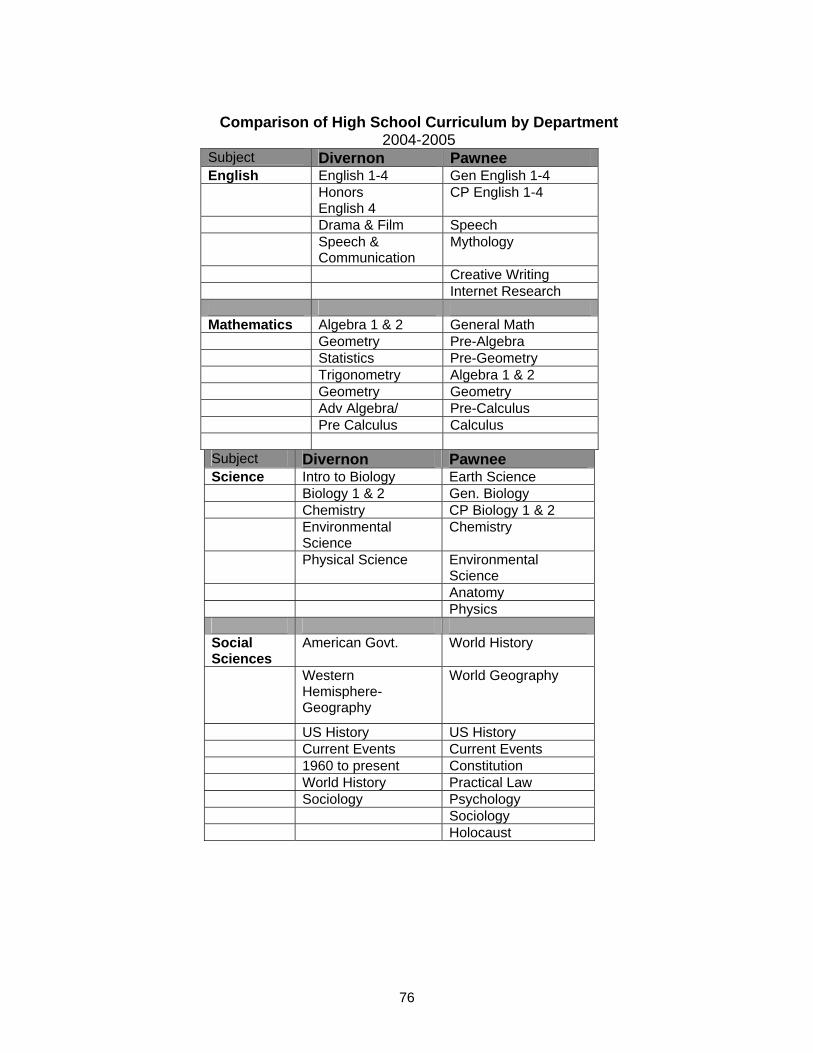
76
Comparison of High School Curriculum by Department 2004-2005
Subject Divernon Pawnee English English 1-4 Gen English 1-4 Honors
English 4 CP English 1-4
Drama & Film Speech Speech &
Communication Mythology
Creative Writing Internet Research Mathematics Algebra 1 & 2 General Math Geometry Pre-Algebra Statistics Pre-Geometry Trigonometry Algebra 1 & 2 Geometry Geometry Adv Algebra/ Pre-Calculus Pre Calculus Calculus Subject Divernon Pawnee Science Intro to Biology Earth Science Biology 1 & 2 Gen. Biology Chemistry CP Biology 1 & 2 Environmental
Science Chemistry
Physical Science Environmental Science
Anatomy Physics Social Sciences
American Govt. World History
Western Hemisphere-Geography
World Geography
US History US History Current Events Current Events 1960 to present Constitution World History Practical Law Sociology Psychology Sociology Holocaust

77
Comparison of High School Curriculum by Department 2004-2005
Subject Divernon Pawnee Foreign Language
Spanish 1-4 Spanish 1-4
Industrial Technology
CACC Intro to Auto Cad
Intro to Woodworking
Adv Woods Adv Auto Cad Physical Development & Health
Physical Education Physical Education Art Art 1-4 Sculpture Creative
Enhancement Business Accounting Computer Tech
1 & 2 Adv Computer Consumer Education
Business & the Net Computer Accounting
Desktop Publishing Intro to Business Intro to Computers Computer Sciences
Computer Organization
Webpage Design Adv Computers Family & Consumer Sciences
Child Development/Parenting
Adult Living
Intro to F & CS Parenting Consumer Resources Food & Nutrition Nutrition & Fitness Music Band Band/Chorus

78
Part 2: Curriculum Alignment History and Purpose
The purpose of the curriculum map/guide is a written document that presents
the content and skills that students should know and be able to do as a result of
learning (outcome or objective). It should be written by district staff in order to match
the local outcomes or objectives with the state goal or learning standard mandated
by the state of Illinois (i.e., alignment). The curriculum maps can serve to focus
teaching, learning activities, assessment, and selection of instructional materials.
Since Illinois state testing currently reflects either the state goals or learning
standards, alignment of local curriculum through curriculum maps can potentially
better prepare district students for these achievement tests.
Beginning in the 1997-98 school year, curriculum development in Illinois
correctly shifted the focus of alignment from the state goals to the then newly
mandated (July, 1997) Illinois Learning Standards. As each district develops
curriculum guides after 1998, the alignment has either focused on standards at the
initial point of the development of a map, or revise existing curriculum guides that
previously had been aligned with state goals to match learning standards. As the
subsequent alignment of subjects or grade levels to the learning standards occurred,
the districts appropriately shifted their focus to learning standards. This, in turn,
prepares students for the Illinois Standards Achievement Tests at grades 3-5-8 and
11 in reading, math, and language arts and grades 4 and 7 in science and social
science. The Prairie State Achievement Exam (PSAE) that is administered at the
high school level to all students.
K-5 Curriculum Development
Although most of the curriculum development efforts in each district have
taken place at various degrees, there is not one complete plan that states the

79
content areas, expected skills, and assessments, at each level or subject. This
could be accomplished by starting a mapping process K-5, 6-8, and 9-12. Much of
the standards alignment work already completed could be used as a starting point.
All districts will need to hold discussions on curriculum articulation, textbook
conversion/articulation, and other special programs that are currently offered at
either district.
Summary of Curriculum Alignment
• Since Illinois State testing currently reflects either the state goals or learning standards, alignment of local curriculum through curriculum maps can potentially better prepare district students for these achievement tests, as well as, localized assessments.
• Both districts have shifted their focus of curriculum alignment to the Illinois learning standards. In a consolidation, this in turn, will help better prepare all students for the Illinois Standards Achievement Tests at grades 3-5-8 in reading, math, and writing, grades 4 and 7 in science and social science, and also the Prairie State Achievement Exam (PSAE) at the high school level.
• The curriculum alignment work is out of sync because districts have not previously worked together in this area of development. As a result, it is expected that there is no complete K- 12 alignment of any subject area with Illinois learning standards. Such an effort could be addressed with K- 12 reorganization because curriculum development could align all subjects across all grade levels at the same time.
• A new K-12 textbook adoption schedule would have to be established
over time in a reorganized district since each district is following a different schedule. Some of the current texts need to be updated to newer versions. When this occurs, curriculum design should precede textbook purchases. This proposed procedure will help teachers and administrators develop more meaningful curricula that are not dictated by curriculum then textbooks by textbook companies.
Part 3: Articulation Among District
Articulation is the opportunity for staff to meet with other teachers with the
same or related responsibilities to discuss topics of mutual interest and concern

80
about teaching and learning. It can be informal such as the talking among teachers
that occurs at lunch, in hallways, and in offices and classrooms of the buildings. Or
it can be formal articulation where specific groups of teachers meet for definite
lengths of time with designated topics and a clearly identified purpose. It is the
formal articulation, facilitated by a curriculum coordinator and the administration,
which is most crucial to the development, improvement and consistent
implementation of the curriculum across the grade levels of a district. Articulation
between the two separate districts has not occurred. There has been little if any
shared course offerings up to this point by the high schools.
Articulation within each of the districts could occur through their own in-service
training held during the year. These can be either early dismissal days (School
Improvement Days) or full day meetings on district institute days. These in-service
meetings focus on curriculum topics and only teachers within that district attend. The
meetings and topics for last year are presented in the following table:
Examples of District In-Service Programs for 2004-2005
Divernon CUSD 13
Pawnee CUSD 11
CPR Certification
Curriculum Alignment K-12
Learning Styles
Gifted Education
Drug Awareness Student Assistance
Special Education Requirements Corey H. Case
Bank at School K-8 Reading Assessment
Writing Assessment K-8 Math Instruction K-8
There are opportunities for articulation within school districts in addition to the
professional development programs. The continued development efforts to align

81
curriculum and develop assessments linked to the Illinois Learning Standards in
each district would provide a well-utilized opportunity for articulation. As a result,
articulation within grade levels occurs when a curriculum alignment is developed and
all teachers in the district work together to align the core subjects, identify
assessment activities, and align all activities to the state standards. Also, articulation
among grade levels could occur during textbook adoption activities. Further,
articulation across grade levels could occur when all teachers in grades K-12 meet
to develop a curriculum maps.
Summary of Articulation Among the Districts
• There are no procedures in place for formal curriculum articulation between the two districts. A K- 12 reorganized district would have many more opportunities for articulation with the existing programs, institute, and school improvement days already in place. A combined merger could provide much more variety and depth in course offerings at the junior high and high school levels.
• Because there is little articulation between the high school, middle school/junior high and elementary levels in the two districts, teachers from all participating districts will need time for training, if a merger occurs, on “new” curricular issues. A plan will need to be developed on how the newly formed district curricula will mesh in this process.
• The institution of curriculum alignment with Illinois learning standards activities in each district is a functional means of grade level articulation. Teachers in all districts need more experience and to become more familiar and comfortable with current district standards from one grade to the next. This would be a useful activity for K- 12 articulation in a reorganized district.
• The "Internal Review" process, whether required or not, provides a clearly defined process of school improvement. It is intended as a forum for articulation about curriculum. The reorganized district would be able to encourage more articulation among buildings through the Internal Review Team of each school. Many districts still understand the value of evaluating academics and programmatic progress over time.

82
Part 4: Student Achievement (ISAT) The performance of students on standardized achievement tests has long
been held to be an important indicator of the quality and impact of a district's
curriculum on learning, although certainly not the only or single most crucial source
of data that a school can consider. In Illinois, there is a set of state tests that have
been given over the past decade which specifically allow comparison between
districts and within a district from year to year. The Illinois Student Achievement
Test (ISAT) measures student performance on state goals for learning in reading,
writing, and math at grade 3, 6, 8, 11, as well as science and social studies at
grades 4, and 7. The use of ISAT to compare districts is appropriate, although not
politically popular, because it is statistically sound and professionally developed.
Because of the intended purpose of ISAT is used in this study to describe how equal
or different the two districts are in the subjects tested. Also, ISAT is designed to
measure student achievement on knowledge and skills related to Illinois state goals
for learning, while the ACT is a standardized test designed to assess student
performance on basic skills as interpreted by national norms. In other words, the
ISAT describes how local students are performing on Illinois priorities for learning.
The following describes ISAT interpretation:
ISAT data of the two districts for the past five years were examined to
establish the degree of similarity and nature of differences in student performance.
The percentages of district students who meet or exceed the state standards in
specific subjects are recorded below. These data are presented in the following
tables and are the basis of conclusions about district achievement. The percentages
displayed here represent the sum of all ratings of “meets” and “exceeds” state
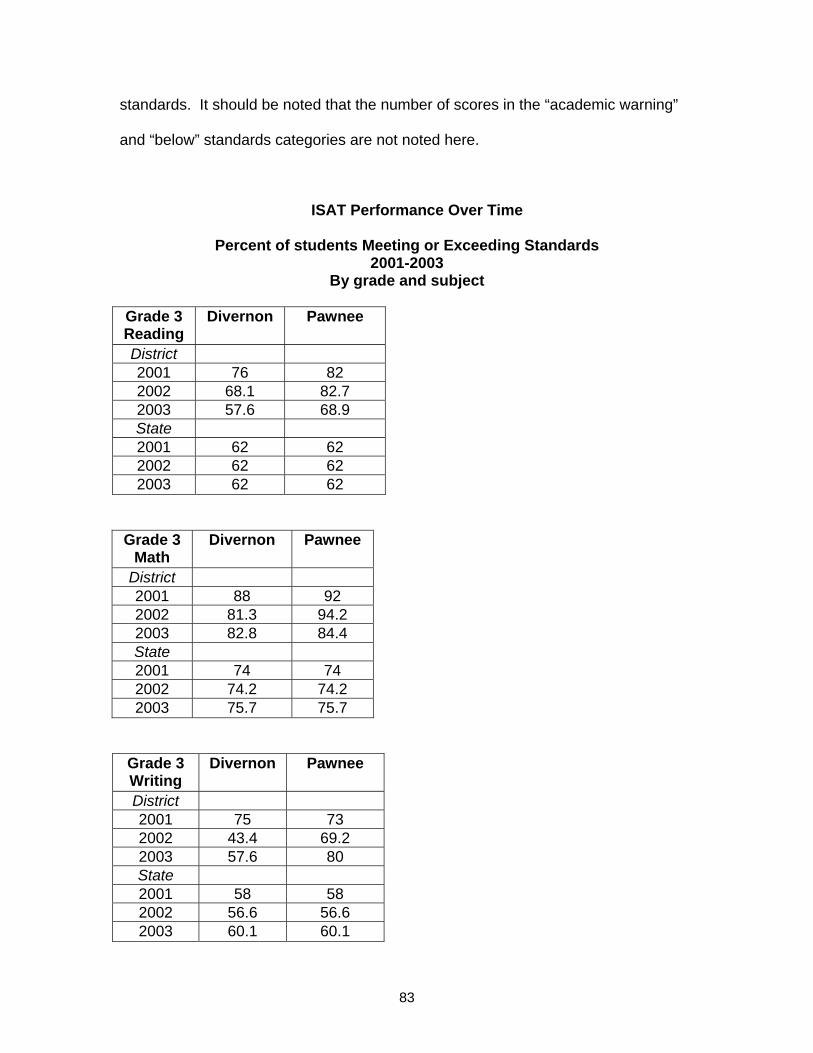
83
standards. It should be noted that the number of scores in the “academic warning”
and “below” standards categories are not noted here.
ISAT Performance Over Time
Percent of students Meeting or Exceeding Standards 2001-2003
By grade and subject Grade 3 Reading
Divernon Pawnee
District 2001 76 82 2002 68.1 82.7 2003 57.6 68.9 State 2001 62 62 2002 62 62 2003 62 62
Grade 3 Math
Divernon Pawnee
District 2001 88 92 2002 81.3 94.2 2003 82.8 84.4 State 2001 74 74 2002 74.2 74.2 2003 75.7 75.7
Grade 3 Writing
Divernon Pawnee
District 2001 75 73 2002 43.4 69.2 2003 57.6 80 State 2001 58 58 2002 56.6 56.6 2003 60.1 60.1

84
Grade 4 ISAT 2000-2002 Science and Social Studies
Grade 4 Science
Divernon Pawnee
District 2001 64 67 2002 62.3 83 2003 78.6 75 State 2001 65 65 2002 67.1 67.1 2003 66.5 66.5
Grade 4 Social
Science
Divernon Pawnee
District 2001 70 73 2002 55.8 79.6 2003 67.3 73.7 State 2001 61 61 2002 59.9 59.9 2003 62.9 62.9
Grade 5 ISAT 2000-2002 Grade 5 Writing
Divernon Pawnee
District 2001 40 59 2002 57.6 51.4 2003 64.4 73.1 State 2001 70 70 2002 58.8 58.8 2003 64.8 64.8
Grade 5 Math
Divernon Pawnee
District 2001 54 74 2002 53.4 65.8

85
2003 57.1 82.7 State 2001 61 61 2002 62.8 62.8 2003 68.3 68.3
Grade 5 Reading
Divernon Pawnee
District 2001 65 73 2002 58.8 71 2003 54.2 73.1 State 2001 59 59 2002 59.1 59.1 2003 60.4 60.4
Grade 7 ISAT Performance Over Time 2000-2002 Grade 7 Science
Divernon Pawnee
District 2001 62 54 2002 77.8 81.3 2003 74 75.7 State 2001 72 72 2002 73.3 73.3 2003 73.7 73.7
Grade 7 Social
Science
Divernon Pawnee
District 2001 57 66 2002 56.7 59.3 2003 69.1 63.9 State 2001 60 60 2002 58.6 58.6 2003 60.4 60.4
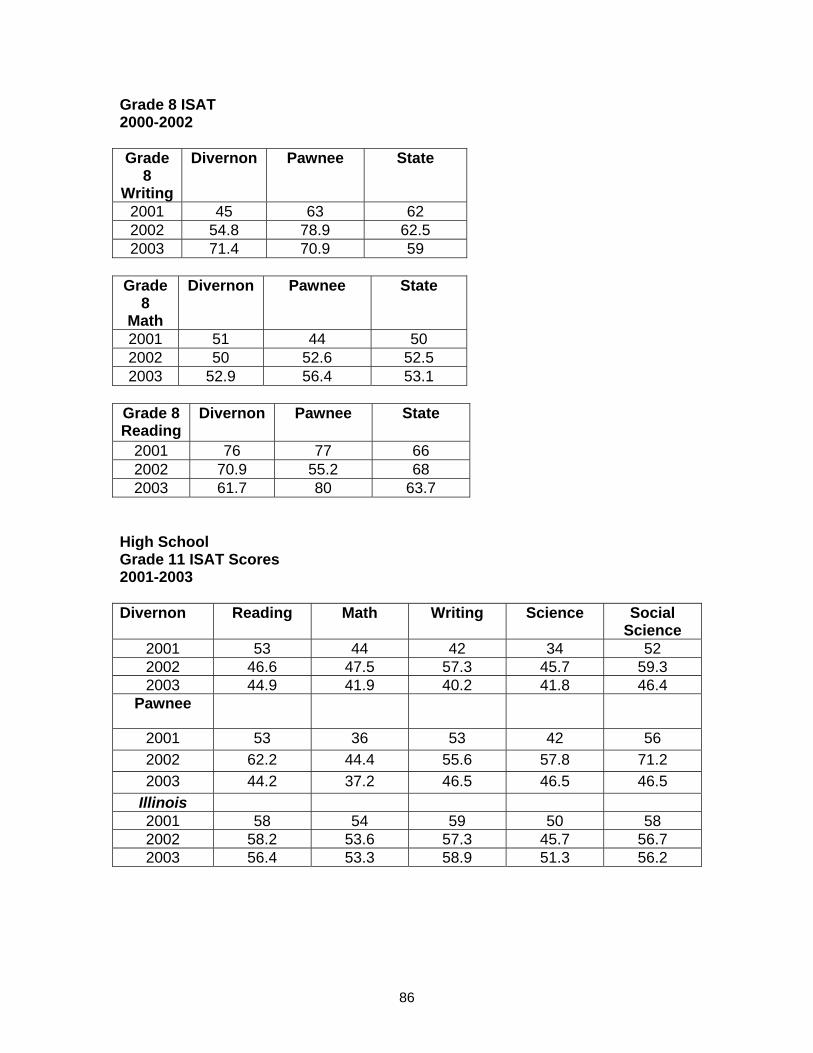
86
Grade 8 ISAT 2000-2002 Grade
8 Writing
Divernon Pawnee State
2001 45 63 62 2002 54.8 78.9 62.5 2003 71.4 70.9 59
Grade
8 Math
Divernon Pawnee State
2001 51 44 50 2002 50 52.6 52.5 2003 52.9 56.4 53.1
Grade 8 Reading
Divernon Pawnee State
2001 76 77 66 2002 70.9 55.2 68 2003 61.7 80 63.7
High School Grade 11 ISAT Scores 2001-2003 Divernon
Reading Math Writing Science Social Science
2001 53 44 42 34 52 2002 46.6 47.5 57.3 45.7 59.3 2003 44.9 41.9 40.2 41.8 46.4
Pawnee
2001 53 36 53 42 56 2002 62.2 44.4 55.6 57.8 71.2 2003 44.2 37.2 46.5 46.5 46.5
Illinois 2001 58 54 59 50 58 2002 58.2 53.6 57.3 45.7 56.7 2003 56.4 53.3 58.9 51.3 56.2
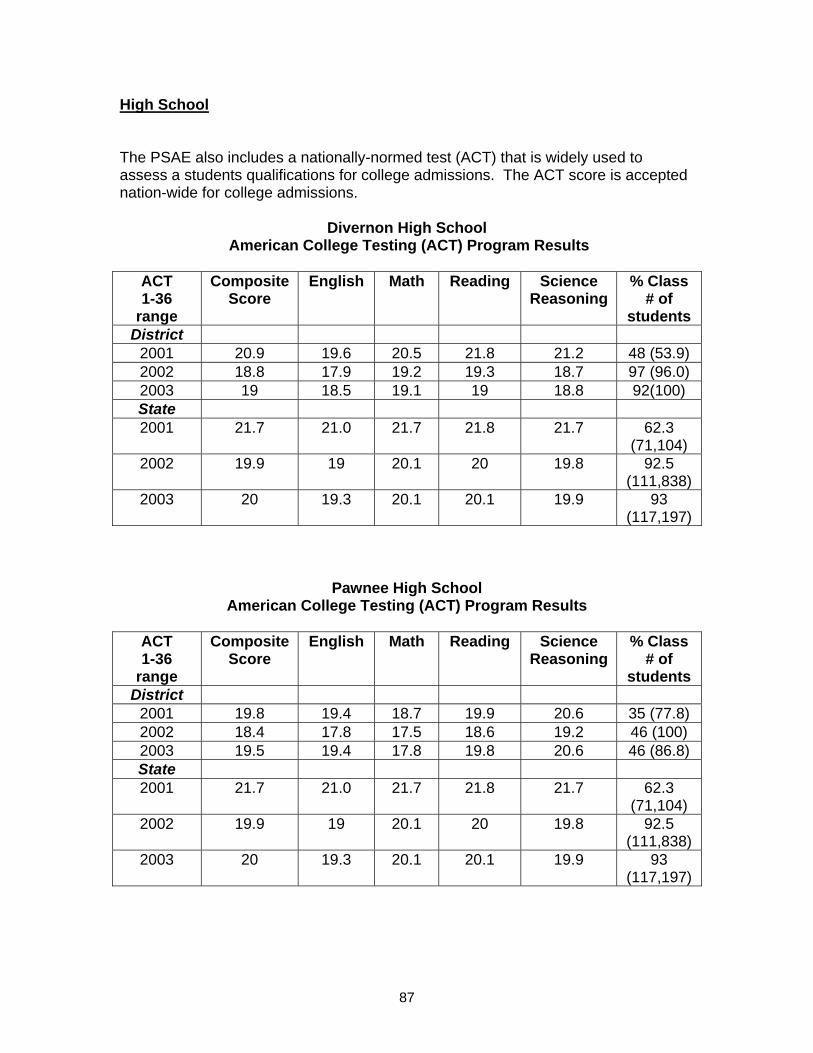
87
High School The PSAE also includes a nationally-normed test (ACT) that is widely used to assess a students qualifications for college admissions. The ACT score is accepted nation-wide for college admissions.
Divernon High School American College Testing (ACT) Program Results
ACT 1-36
range
Composite Score
English Math Reading Science Reasoning
% Class # of
students District
2001 20.9 19.6 20.5 21.8 21.2 48 (53.9) 2002 18.8 17.9 19.2 19.3 18.7 97 (96.0) 2003 19 18.5 19.1 19 18.8 92(100) State 2001 21.7 21.0 21.7 21.8 21.7 62.3
(71,104) 2002 19.9 19 20.1 20 19.8 92.5
(111,838) 2003 20 19.3 20.1 20.1 19.9 93
(117,197)
Pawnee High School American College Testing (ACT) Program Results
ACT 1-36
range
Composite Score
English Math Reading Science Reasoning
% Class # of
students District
2001 19.8 19.4 18.7 19.9 20.6 35 (77.8) 2002 18.4 17.8 17.5 18.6 19.2 46 (100) 2003 19.5 19.4 17.8 19.8 20.6 46 (86.8) State 2001 21.7 21.0 21.7 21.8 21.7 62.3
(71,104) 2002 19.9 19 20.1 20 19.8 92.5
(111,838) 2003 20 19.3 20.1 20.1 19.9 93
(117,197)
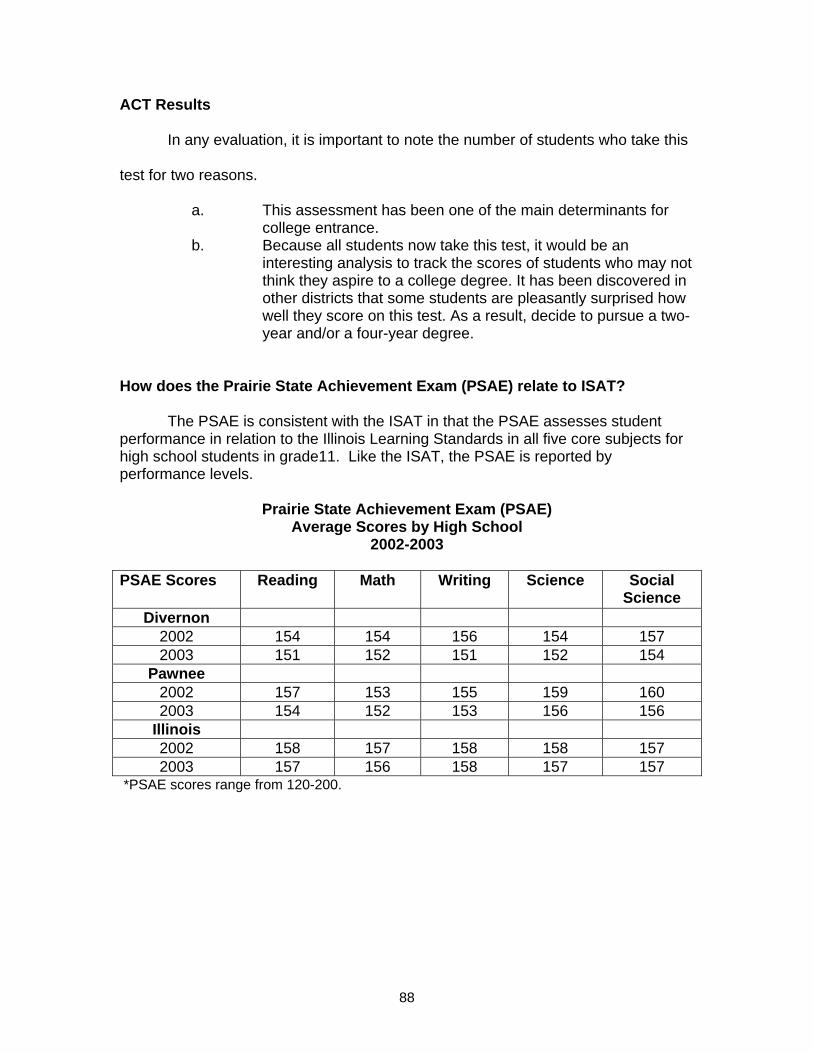
88
ACT Results
In any evaluation, it is important to note the number of students who take this
test for two reasons.
a. This assessment has been one of the main determinants for college entrance.
b. Because all students now take this test, it would be an interesting analysis to track the scores of students who may not think they aspire to a college degree. It has been discovered in other districts that some students are pleasantly surprised how well they score on this test. As a result, decide to pursue a two-year and/or a four-year degree.
How does the Prairie State Achievement Exam (PSAE) relate to ISAT? The PSAE is consistent with the ISAT in that the PSAE assesses student performance in relation to the Illinois Learning Standards in all five core subjects for high school students in grade11. Like the ISAT, the PSAE is reported by performance levels.
Prairie State Achievement Exam (PSAE) Average Scores by High School
2002-2003
PSAE Scores Reading Math Writing Science Social Science
Divernon 2002 154 154 156 154 157 2003 151 152 151 152 154
Pawnee 2002 157 153 155 159 160 2003 154 152 153 156 156
Illinois 2002 158 157 158 158 157 2003 157 156 158 157 157
*PSAE scores range from 120-200.
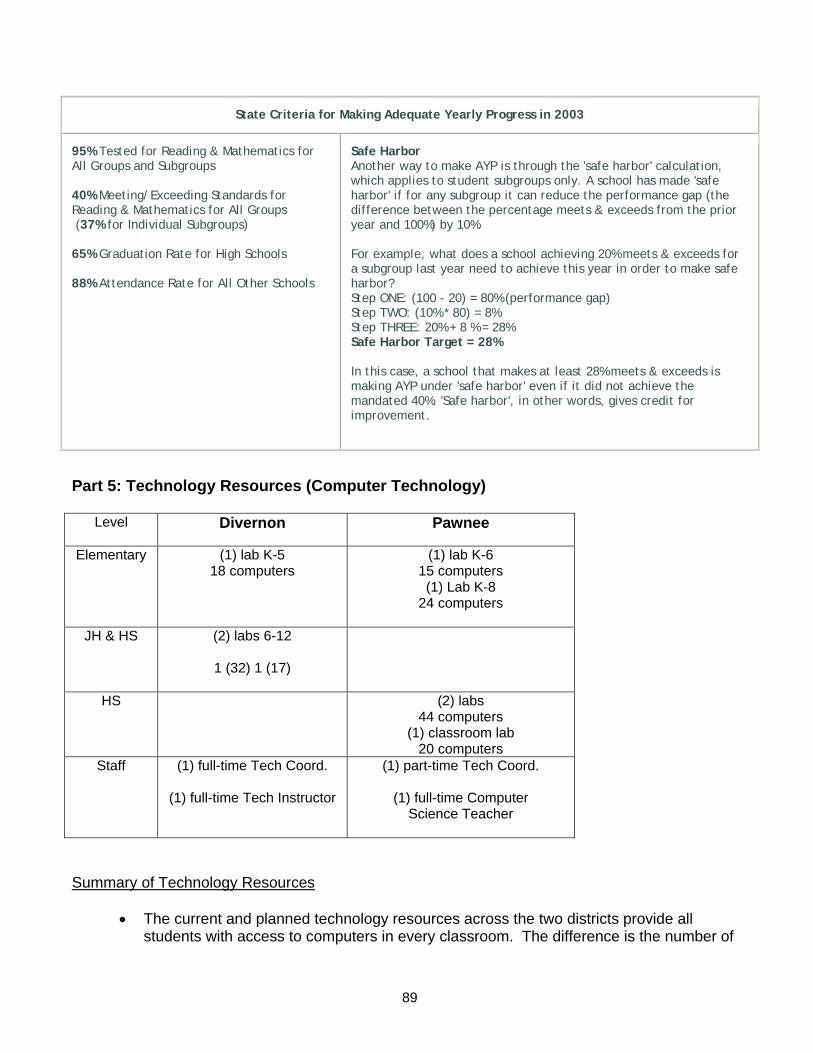
89
State Criteria for Making Adequate Yearly Progress in 2003
95% Tested for Reading & Mathematics for All Groups and Subgroups 40% Meeting/Exceeding Standards for Reading & Mathematics for All Groups (37% for Individual Subgroups) 65% Graduation Rate for High Schools 88% Attendance Rate for All Other Schools
Safe Harbor Another way to make AYP is through the 'safe harbor' calculation, which applies to student subgroups only. A school has made 'safe harbor' if for any subgroup it can reduce the performance gap (the difference between the percentage meets & exceeds from the prior year and 100%) by 10%. For example, what does a school achieving 20% meets & exceeds for a subgroup last year need to achieve this year in order to make safe harbor? Step ONE: (100 - 20) = 80% (performance gap) Step TWO: (10% * 80) = 8% Step THREE: 20% + 8 % = 28% Safe Harbor Target = 28% In this case, a school that makes at least 28% meets & exceeds is making AYP under 'safe harbor' even if it did not achieve the mandated 40%. 'Safe harbor', in other words, gives credit for improvement.
Part 5: Technology Resources (Computer Technology)
Level Divernon Pawnee
Elementary (1) lab K-5 18 computers
(1) lab K-6 15 computers (1) Lab K-8
24 computers
JH & HS (2) labs 6-12
1 (32) 1 (17)
HS (2) labs 44 computers
(1) classroom lab 20 computers
Staff (1) full-time Tech Coord.
(1) full-time Tech Instructor
(1) part-time Tech Coord.
(1) full-time Computer Science Teacher
Summary of Technology Resources
• The current and planned technology resources across the two districts provide all students with access to computers in every classroom. The difference is the number of
90
computers in each classroom (ranging from 1 to 3). A reorganized district would not have to address any inadequacy in classroom computers, but might choose to consider adding labs and computers to some classrooms over time to reach equivalency.
• Add one additional mini-lab to the high school site for greater student access if the
Industrial Technology program is enhanced. Adding technologically enhanced courses in CAD design and CISCO repair would greatly improve and update this course of study. Existing hardware could be utilized for this purpose.
• A reorganized district would be completely connected to the World Wide Web without additional resources. Connections between buildings (longer distances) would have to be addressed.
• Both districts have staff on-board for lab instruction, trouble-shooting, and/or Technology Coordination. A reorganized district could need additional technology assistance/service than currently serve individual schools.
Part 6: Effects of Reorganization on Curriculum Based on the previous discussion and findings of this section, the study suggests three
areas of consideration for the effects on the curriculum which reorganizing the existing two districts
into a single PK- 12 unit district. These considerations should be viewed as possible impact of
reorganization, rather than definite realities of a unit district, and represent solely the interpretation
of research and practice by one external curriculum consultant. The actuality of what a reorganized
district will be rests with the districts themselves.
Changes to Curriculum and Programs
• Grading scale differences will have to be resolved to offer more cohesion in a newly
merged district.
• Graduation requirements for the newly formed high school will have to be discussed, as phasing in a new plan could begin with the newly formed Freshman class. The number of required courses in core subjects will also need to be standardized.
• Textbooks and assessments will have to be phased in to insure instruction in aligned
across the newly merged district.

91
• Existing special education program and services received by students should not be affected by the reorganization. District Special Education staff and SASED employees that work in each district may help this situation. Reorganization of staff assignments and service centers will need to be evaluated.
• The existing early childhood programs could continue to meet the needs of children ages’ 3-5. This would require continued funding of ISBE of a single program in a reorganized unit district.
• The existing overall K-12 organization of grades into K-5, K-6, 6-8, 7-8, and 9-12 among the two districts could be continued in a unit district, although how these grades are housed in the various buildings/sites could be subject to change.
Enhancements to Curriculum
• Add electives to a junior high schedule such as: 6th graders could take Art, Chorus, Band, Computer Technology, Industrial Technology (choose four). 7th and 8th graders could choose from Spanish Survey, Technology, Computer Technology, Art, Band, Chorus, Career Development, and Family & Consumer Sciences (choose four).
• Add a viable second language to offer more variety at the high school level. Add an
introductory sampling of these same languages to the Junior High/Middle School schedule.
• Develop a more substantial Industrial Technology program in which students at the high
school facility could take advantage of added courses in Graphic Design and photography. Other enhanced uses of technologies could also be explored. CISCO training programs could also be added for student certification in computer repair
• Add additional courses in Clothing/Textiles and Merchandising in the Family & Consumer
Sciences program.
• Articulation between K-5, 6-8, and 9-12 teachers would improve with a unit district because the view of curriculum would shift from several segments to a single comprehensive K-12 curriculum. It is typical not only in these districts for separate elementary and high schools to have minimal or non-existent communication among levels. A K-12 unit district affords the important and influential perspective of how children learn from the start of their public school experience in Pre-Kindergarten through high school.
• With the establishment of K- 12 articulation could improve alignment of the curriculum in two ways. First, the curriculum in each subject across K to 12 is sequenced from grade to grade. Second, the focus of the curriculum can be considered from the entire spectrum of state expectations for learning (i.e., Illinois Learning Standards). Thus, K- 12
92
articulation produces a coordinated curriculum within the unit district and a standards-oriented curriculum as mandated by ISBE.
With a K-12 curriculum aligned with the Illinois Learning Standards, students will be taught
the content and skills which are tested by the State of Illinois that are currently on the ISAT and
PSAE test at the high school. The ISAT at elementary and junior high levels ISAT measure student
performance on the Illinois Learning Standards and are more challenging than the IGAP tests. As
noted elsewhere, the districts overall have had successes, but need improvement in some areas of
the ISAT exams. A written curriculum aligned to the Illinois Learning Standards from a
comprehensive, coordinated K-12 perspective would be the single most direct way to improve
achievement on ISAT and PSAE.
Staff Needs Related to the Improvement of Instruction
• Adopt a new teacher evaluation system that will enhance professional growth and development.
• Add a computer lab within existing space for professional development activities. This could be utilized as a district training center for teachers and staff.
• A long-range instructional plan to improve state scores across the new district K-12 will need further consideration for resources in teacher training and on-going student assessment before testing dates occur. Mapping this process along the way would be most beneficial.
• Continue to align all K-12 curricula to the State Standards. The development of updated of curriculum maps (web-based) would assist faculty in meeting the expectations established in alignment of courses with the Illinois Learning Standards.
• Teacher in-service time should be devoted to creating curriculum maps/guides. The previous Standards work could be implemented into this process. Ultimately, unit plans could be standards-based.
• There could be more staff development that would involve the entire K-12 faculty in a reorganized district. Existing opportunities for teacher meetings, such as institute days and school improvement days that already occur in district calendars, could be utilized for improvement in communication, training, articulation, increased awareness of other levels, and staff collaboration beyond that already successfully in place. This K-12 staff development would serve as a crucial means to establish and encourage collegiality and acceptance among the current separate faculties of the participating districts in the combined new unit district faculty.

93
Further Considerations:
• If exploratory subjects are added to a grades 6-8 site, teaching assignments, shop space, lab space, classrooms, and equipment needs will have to be addressed.
Programmatic/Curricular Recommendations
District
• Merge Divernon CUSD # 13 and Pawnee CUSD #11 into one unit district. The new district could be designed to house one high school campus at Pawnee and the elementary centers could remain intact. The current Divernon Junior/Senior High School could conceivably house a very nice junior high program for both communities in a newly formed district at the Divernon campus. This design would allow the school to offer science lab space for instruction, elective courses in foreign language, art, music, technology, industrial technology, and family & consumer sciences. Excellent gym space is also available for sports.
• A long-range instructional plan to improve state scores across all districts K-12 will need
further consideration for resources in teacher training and on-going student assessment before testing dates occur. Mapping this process along the way would be most beneficial.
High School • Add a viable second language to offer more variety for a newly formed district. Add an
introductory sampling of these same languages to the Junior High/Middle School schedule.
• Move the current Family & Consumer Sciences program from Divernon HS to the
Pawnee campus. In addition, courses in Clothing/Textiles and Merchandising are needed to enhance this program.
• CISCO training programs could also be added for student certification in computer repair
in the Industrial Technology program. Additional coursework could be brought back in Graphic Design and Photography as the space and equipment are still in place.
Middle School/Junior High
• Add electives to a junior high schedule such as: 6th graders could take Art, Chorus, Band, Computer Technology, Ag/Industrial Technology (choose four). 7th and 8th graders could choose from among Spanish/French Survey, Agriculture/Technology, Computer Technology, Art, Band, Chorus, Career Development, and Family & Consumer Sciences (choose four).
• If exploratory subjects are added to a grades 6-8 site, teaching assignments, shop
space, lab space, classrooms, and equipment needs will have to be addressed.

94
• Grading scale differences will have to be resolved to offer more cohesion in a newly
merged district. Elementary
• Maintain elementary centers in their current locations. • The existing early childhood programs could continue to meet the needs of children ages’
3-5, since many of the districts share the programs in place with essentially the same services. This would require continued funding of ISBE of a single program in a reorganized unit district. Sharing programs could continue.
• Grading scale differences will have to be resolved to offer more cohesion in a newly merged district.
• Develop an action plan to map existing curriculum K-4 or K-5 across the newly merged
district. This will keep communication open between attendance centers and help ensure consistency across the district.
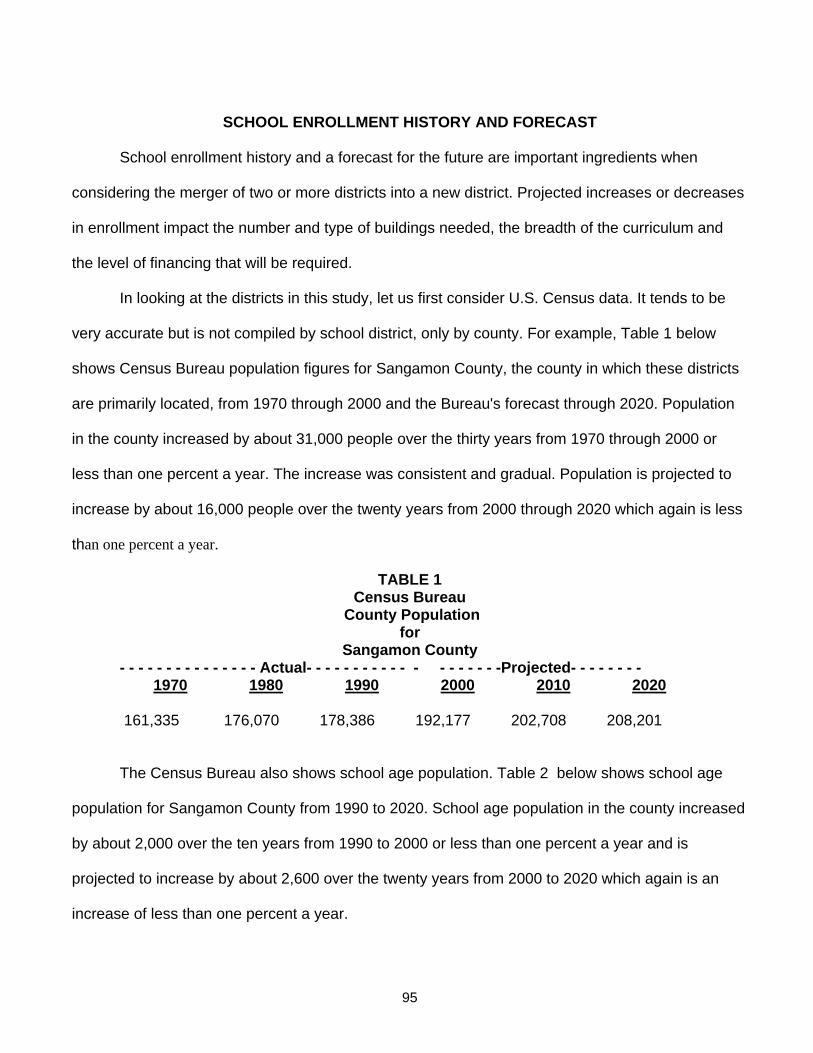
95
SCHOOL ENROLLMENT HISTORY AND FORECAST
School enrollment history and a forecast for the future are important ingredients when
considering the merger of two or more districts into a new district. Projected increases or decreases
in enrollment impact the number and type of buildings needed, the breadth of the curriculum and
the level of financing that will be required.
In looking at the districts in this study, let us first consider U.S. Census data. It tends to be
very accurate but is not compiled by school district, only by county. For example, Table 1 below
shows Census Bureau population figures for Sangamon County, the county in which these districts
are primarily located, from 1970 through 2000 and the Bureau's forecast through 2020. Population
in the county increased by about 31,000 people over the thirty years from 1970 through 2000 or
less than one percent a year. The increase was consistent and gradual. Population is projected to
increase by about 16,000 people over the twenty years from 2000 through 2020 which again is less
than one percent a year.
TABLE 1 Census Bureau
County Population for
Sangamon County - - - - - - - - - - - - - - - Actual- - - - - - - - - - - - - - - - - - -Projected- - - - - - - -
1970 1980 1990 2000 2010 2020 161,335 176,070 178,386 192,177 202,708 208,201
The Census Bureau also shows school age population. Table 2 below shows school age
population for Sangamon County from 1990 to 2020. School age population in the county increased
by about 2,000 over the ten years from 1990 to 2000 or less than one percent a year and is
projected to increase by about 2,600 over the twenty years from 2000 to 2020 which again is an
increase of less than one percent a year.
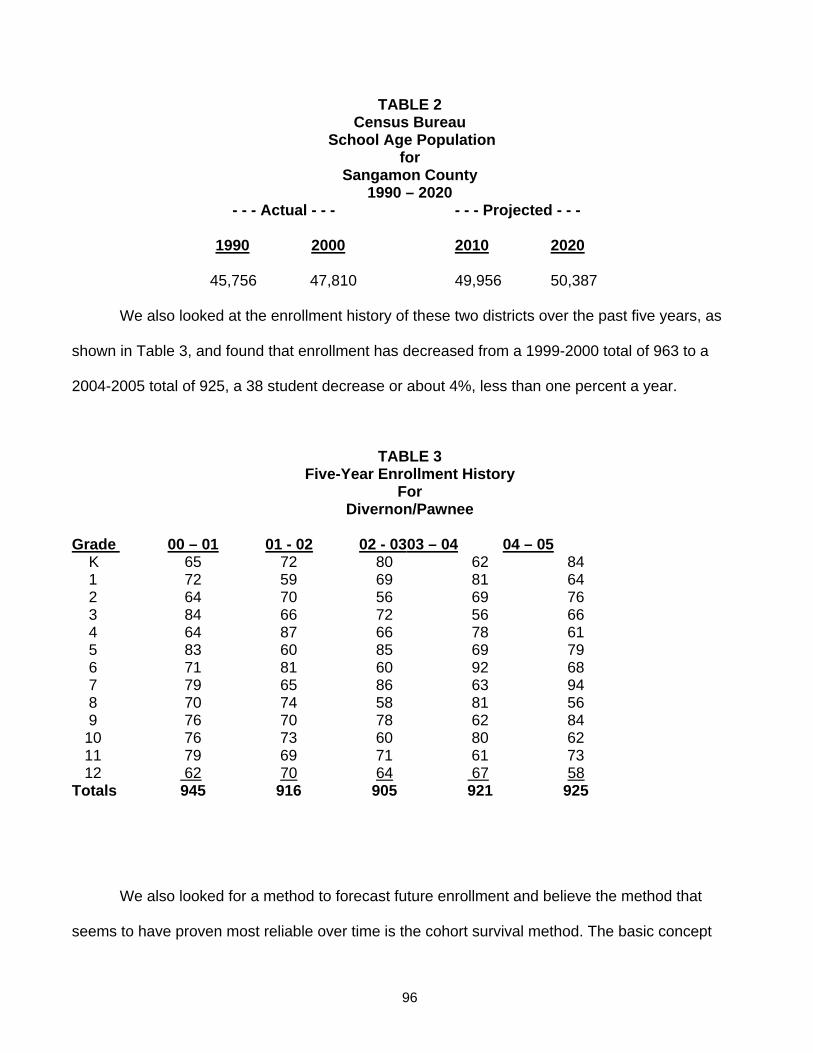
96
TABLE 2 Census Bureau
School Age Population for
Sangamon County 1990 – 2020
- - - Actual - - - - - - Projected - - - 1990 2000 2010 2020 45,756 47,810 49,956 50,387 We also looked at the enrollment history of these two districts over the past five years, as
shown in Table 3, and found that enrollment has decreased from a 1999-2000 total of 963 to a
2004-2005 total of 925, a 38 student decrease or about 4%, less than one percent a year.
TABLE 3 Five-Year Enrollment History
For Divernon/Pawnee
Grade 00 – 01 01 - 02 02 - 03 03 – 04 04 – 05 K 65 72 80 62 84 1 72 59 69 81 64 2 64 70 56 69 76 3 84 66 72 56 66 4 64 87 66 78 61 5 83 60 85 69 79 6 71 81 60 92 68 7 79 65 86 63 94 8 70 74 58 81 56 9 76 70 78 62 84 10 76 73 60 80 62 11 79 69 71 61 73 12 62 70 64 67 58 Totals 945 916 905 921 925
We also looked for a method to forecast future enrollment and believe the method that
seems to have proven most reliable over time is the cohort survival method. The basic concept

97
behind cohort survival is that if we know, from historical records, what percentage (ratio) of students
in a cohort (e.g. first grade) survive or make it to the next cohort (second grade), then we can use
this information to forecast future enrollments. When forecasting kindergarten, we examine birth
data from five years earlier and compare it to the number of those babies that show up in
kindergarten five years later.
How does it work? Using the number of live births, in the townships of Sangamon County in
which these districts are located, with the combined enrollments of the two districts involved in this
study, we found the percentage (ratio) of births to kindergarten, kindergarten to first grade, etc. for
each of the last five years and calculated the five year average ratio for each. Then, we applied
these average ratios first to actual 2004-2005 enrollments to obtain a 2005-2006 projected
enrollment and then to that 2005-2006 projected enrollment to obtain a 2006-2007 projected
enrollment, etc. Even in forecast years, kindergarten enrollment is compared to births five years
earlier. This method is considered more accurate than simply moving students up a grade each
year because it introduces consistency which will give a more stable picture over time. The results,
indicated in table 4 below, show that enrollment is projected to decline by 44 students from the
2004-2005 enrollment of 925 (from Table 3 above) to the 2009-2010 enrollment of 881 (from table 4
below). This is a 5% decline which is similar to the 4% decline that took place between 1999-2000
and 2004-2005. From this manner of measuring, we can see that enrollment will probably continue
to decline by about 1% a year over the next five years.
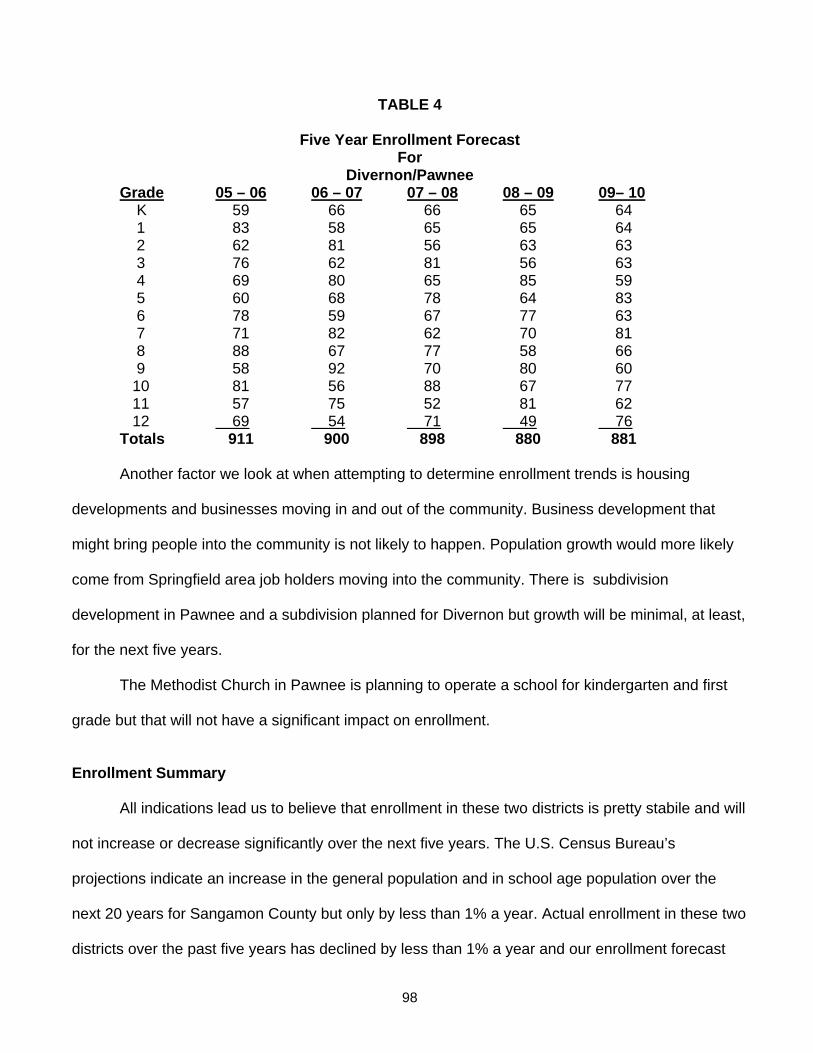
98
TABLE 4
Five Year Enrollment Forecast For
Divernon/Pawnee Grade 05 – 06 06 – 07 07 – 08 08 – 09 09– 10 K 59 66 66 65 64 1 83 58 65 65 64 2 62 81 56 63 63 3 76 62 81 56 63 4 69 80 65 85 59 5 60 68 78 64 83 6 78 59 67 77 63 7 71 82 62 70 81 8 88 67 77 58 66 9 58 92 70 80 60 10 81 56 88 67 77 11 57 75 52 81 62 12 69 54 71 49 76 Totals 911 900 898 880 881 Another factor we look at when attempting to determine enrollment trends is housing
developments and businesses moving in and out of the community. Business development that
might bring people into the community is not likely to happen. Population growth would more likely
come from Springfield area job holders moving into the community. There is subdivision
development in Pawnee and a subdivision planned for Divernon but growth will be minimal, at least,
for the next five years.
The Methodist Church in Pawnee is planning to operate a school for kindergarten and first
grade but that will not have a significant impact on enrollment.
Enrollment Summary All indications lead us to believe that enrollment in these two districts is pretty stabile and will
not increase or decrease significantly over the next five years. The U.S. Census Bureau’s
projections indicate an increase in the general population and in school age population over the
next 20 years for Sangamon County but only by less than 1% a year. Actual enrollment in these two
districts over the past five years has declined by less than 1% a year and our enrollment forecast

99
predicts that enrollment will continue to decline during the next five years by about the same
amount that it has during the past five years. In summary, all signs point to a stable to slightly
declining enrollment during the next five years.
Recommendation
Enrollment should not be a deciding factor in determining whether or not to go forward with a
proposal to merge these two districts.
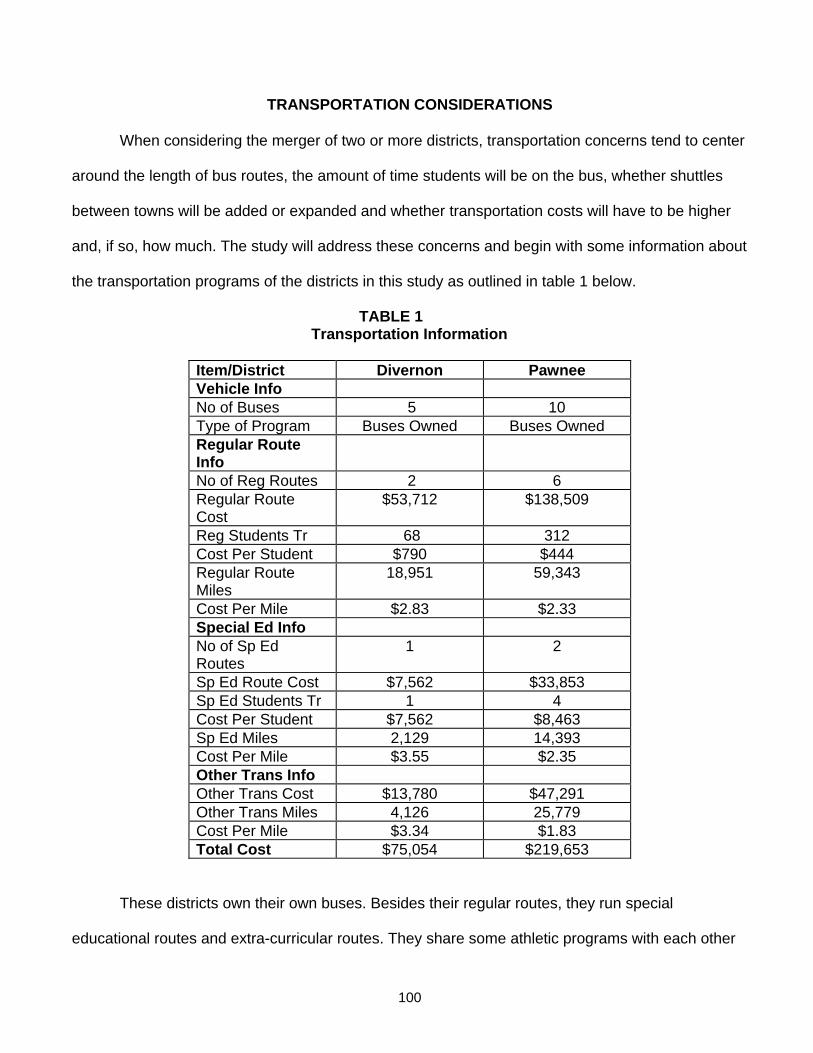
100
TRANSPORTATION CONSIDERATIONS
When considering the merger of two or more districts, transportation concerns tend to center
around the length of bus routes, the amount of time students will be on the bus, whether shuttles
between towns will be added or expanded and whether transportation costs will have to be higher
and, if so, how much. The study will address these concerns and begin with some information about
the transportation programs of the districts in this study as outlined in table 1 below.
TABLE 1 Transportation Information
Item/District Divernon Pawnee Vehicle Info No of Buses 5 10 Type of Program Buses Owned Buses Owned Regular Route Info
No of Reg Routes 2 6 Regular Route Cost
$53,712 $138,509
Reg Students Tr 68 312 Cost Per Student $790 $444 Regular Route Miles
18,951 59,343
Cost Per Mile $2.83 $2.33 Special Ed Info No of Sp Ed Routes
1 2
Sp Ed Route Cost $7,562 $33,853 Sp Ed Students Tr 1 4 Cost Per Student $7,562 $8,463 Sp Ed Miles 2,129 14,393 Cost Per Mile $3.55 $2.35 Other Trans Info Other Trans Cost $13,780 $47,291 Other Trans Miles 4,126 25,779 Cost Per Mile $3.34 $1.83 Total Cost $75,054 $219,653
These districts own their own buses. Besides their regular routes, they run special
educational routes and extra-curricular routes. They share some athletic programs with each other

101
and Pawnee transports the participating students. It is about 5 miles between Divernon and
Pawnee.
Transportation Summary
If these two districts were to merge into one, there would probably be little change in the
transportation program. The bus fleets would be combined and placed on a new procurement
schedule. Depending on the grade configuration (for instance, a high school in one town and a
middle school in the other), there may be shuttle runs between Divernon and Pawnee. There might
be the opportunity to eliminate a regular route by discontinuing any overlapping and by combining
special education routes out of the district.
Recommendation
Student transportation should not stop consideration of the proposed merger. Working out
an acceptable transportation program is quite feasible.

102
DISTRICT FACILITIES
When school officials and the voters of different school districts are considering merger in a
reorganization effort, they need to have as much knowledge as possible about the school buildings that
will be involved in the proposed new district, their condition and usability.
There are currently two classroom buildings operating in the two districts included in this study.
Table 1 below provides information about these buildings as to the grades housed, current enrollment
and the capacity of each building. Capacities are basically theoretical using 25 students in a regular
classroom, 10 students in a special education classroom and in areas such as labs, shops, media
centers, etc., there is no count for elementary use and only fractional count for high school use. Capacity
is illustrated on the floor plans at the end of this section.
TABLE 1 Current Buildings, Use and Capacity
Building Grades Housed Enrollment Capacity Divernon K-12 Complex High School Portion 9 - 12 68 225 Middle School Portion 6 - 8 64 170 Elementary School Portion K - 5 124 180 Total Complex K – 12 256 575 Pawnee K-12 Complex High School Portion 9-12 209 460 Middle School Portion 7-8 101 200 Elementary Portion K-6 359 540 Total Complex K – 12 669 1,200

103
When reviewing the facilities of the two districts, the buildings currently in use will be reviewed as
to:
• Age • Grades housed and enrollment • Capacity • Life safety/Asbestos • Major components and systems • Accessibility to the handicapped • General condition
These two districts house their students in two K – 12 Complexes. Each uses a separate portion of
the building for elementary, Jr High, and high school.
The Divernon K-12 Complex is basically a one story building with portions of it built in
1968, 1978 and 1999. An old gym is situated in a separate structure on the campus. It is sometimes
used for P.E., recess and after school activities. The main complex houses 256 students in grades
K–12. Table 1 illustrates the breakdown of the number of students at each level. Two classrooms
are used to house a Pre K class and an early childhood class in addition to the 256 students in
grades K-12. The capacity of the building has been estimated to be 515 students. Some of the
teaching areas of the building are shared by the various grade levels. The building is in compliance
with life safety and asbestos laws. A ten-year life safety survey was conducted this year. Some
asbestos has been removed. The rest is encapsulated and monitored, as the law requires. The
electrical system was upgraded in 1997 for modern technology. The building has some air-
conditioning in the jr high. The high school is completely air-conditioned and some of the
elementary portion has central air. The building is basically accessible to the handicapped. New
lighting will be installed in the high school this summer. The roof was replaced on the high school in
1991 and on the grade school in 1999. This is a good building, well maintained and quite usable. A
floor plan is included at the end of this section of the study.

104
The Pawnee K-12 Complex is a multi-story building with portions of it built in 1954, 1958,
1969 and 1977. It houses 669 students in grades K-12. It has two brand new science labs. Table 1
illustrates the breakdown of the number of students at each level. Two classrooms are used in the
high school portion of the building to house a Pre K class and an early childhood class in addition to
the 669 students in grades K-12. The capacity of the building is estimated to be about 1200
students. Some of the teaching areas of the building are shared by the various grade levels. The
building is in compliance with life safety and asbestos laws. A ten-year life safety survey is
scheduled for 2005. Asbestos has been encapsulated and is monitored according to law. The
electrical system is currently handling the needs of computers and other technology but an
additional upgrade is planned. The building is basically accessible to the handicapped with
assistance from an elevator and a chair lift. The building has five boilers and all are in good shape
and functional. The roofs are between eight and eighteen years old. They are under warranty and in
good shape. There is new lighting in the elementary and jr high portions of the building and new
lighting is planned for the high school portion this summer. This is a good building. It is well
maintained and kept up to date. A floor plan is included at the end of this section of the study.
Facilities Summary
Each of these districts are currently using a K-12 complex for student instruction. Both
buildings are functional for student use. The high school portion of the Pawnee building is larger
and has more diverse teaching areas than the high school portion of the Divernon complex. When
looking at the feasibility of building use in a merger, we consider program betterment such as a
larger high school or a larger middle school enrollment which tends to increase opportunities for
students and we tend not to include consideration of moving the lower elementary students out of
their home community.
Looking at these buildings and enrollments and, in consideration of improving the program, a
couple of options might be considered as outlined below.
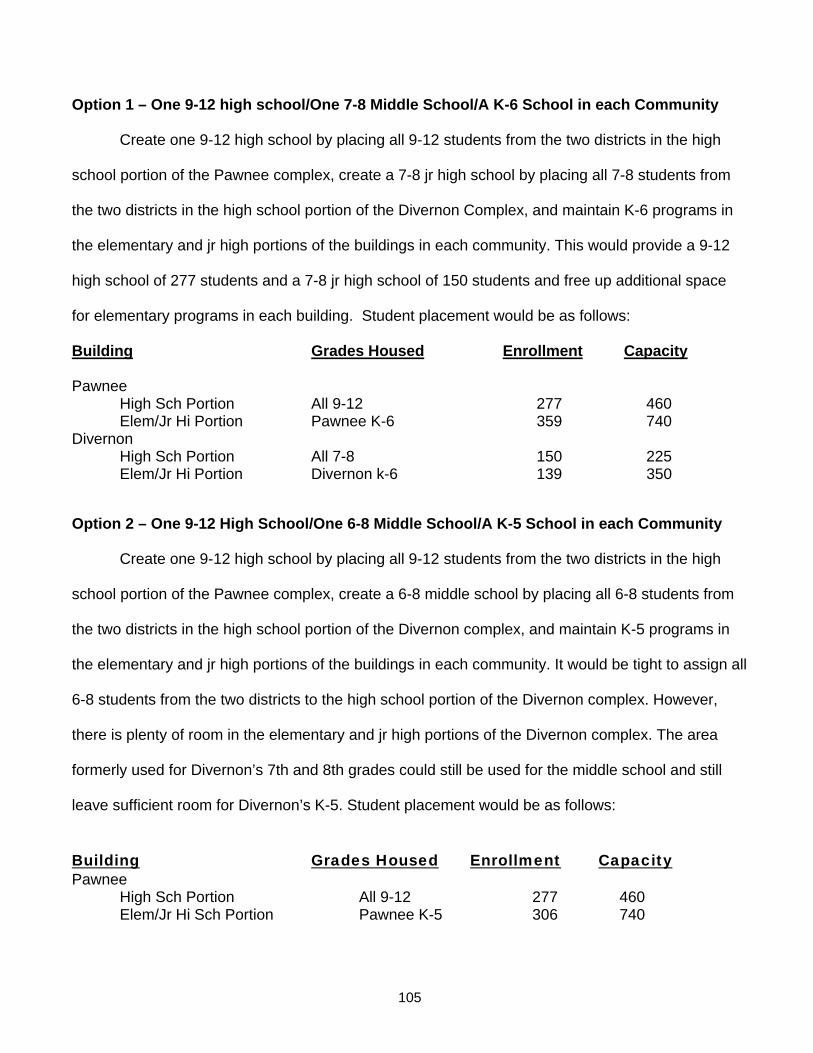
105
Option 1 – One 9-12 high school/One 7-8 Middle School/A K-6 School in each Community
Create one 9-12 high school by placing all 9-12 students from the two districts in the high
school portion of the Pawnee complex, create a 7-8 jr high school by placing all 7-8 students from
the two districts in the high school portion of the Divernon Complex, and maintain K-6 programs in
the elementary and jr high portions of the buildings in each community. This would provide a 9-12
high school of 277 students and a 7-8 jr high school of 150 students and free up additional space
for elementary programs in each building. Student placement would be as follows:
Building Grades Housed Enrollment Capacity
Pawnee High Sch Portion All 9-12 277 460
Elem/Jr Hi Portion Pawnee K-6 359 740 Divernon High Sch Portion All 7-8 150 225 Elem/Jr Hi Portion Divernon k-6 139 350 Option 2 – One 9-12 High School/One 6-8 Middle School/A K-5 School in each Community Create one 9-12 high school by placing all 9-12 students from the two districts in the high
school portion of the Pawnee complex, create a 6-8 middle school by placing all 6-8 students from
the two districts in the high school portion of the Divernon complex, and maintain K-5 programs in
the elementary and jr high portions of the buildings in each community. It would be tight to assign all
6-8 students from the two districts to the high school portion of the Divernon complex. However,
there is plenty of room in the elementary and jr high portions of the Divernon complex. The area
formerly used for Divernon’s 7th and 8th grades could still be used for the middle school and still
leave sufficient room for Divernon’s K-5. Student placement would be as follows:
Building Grades Housed Enrollment Capacity Pawnee High Sch Portion All 9-12 277 460 Elem/Jr Hi Sch Portion Pawnee K-5 306 740

106
Divernon High School Portion All 6-8 218 225 Elem/Jr Hi Sch Portion Divernon K-5 124 350 Either of these options would provide program improvement and greater opportunities for
students by providing a larger, more comprehensive high school program and a combined middle
school or junior high school opportunity for the middle grade students. The buildings are of sufficient
size and condition to house either program. They would also maintain an activity level (e.g.
athletics) in each community and keep the lower elementary children in their home community.
Recommendation
As far as buildings go, a good plan for their use is feasible if these two districts were to merge and
option 1, outlined above, would be the one this study would recommend for consideration.

107
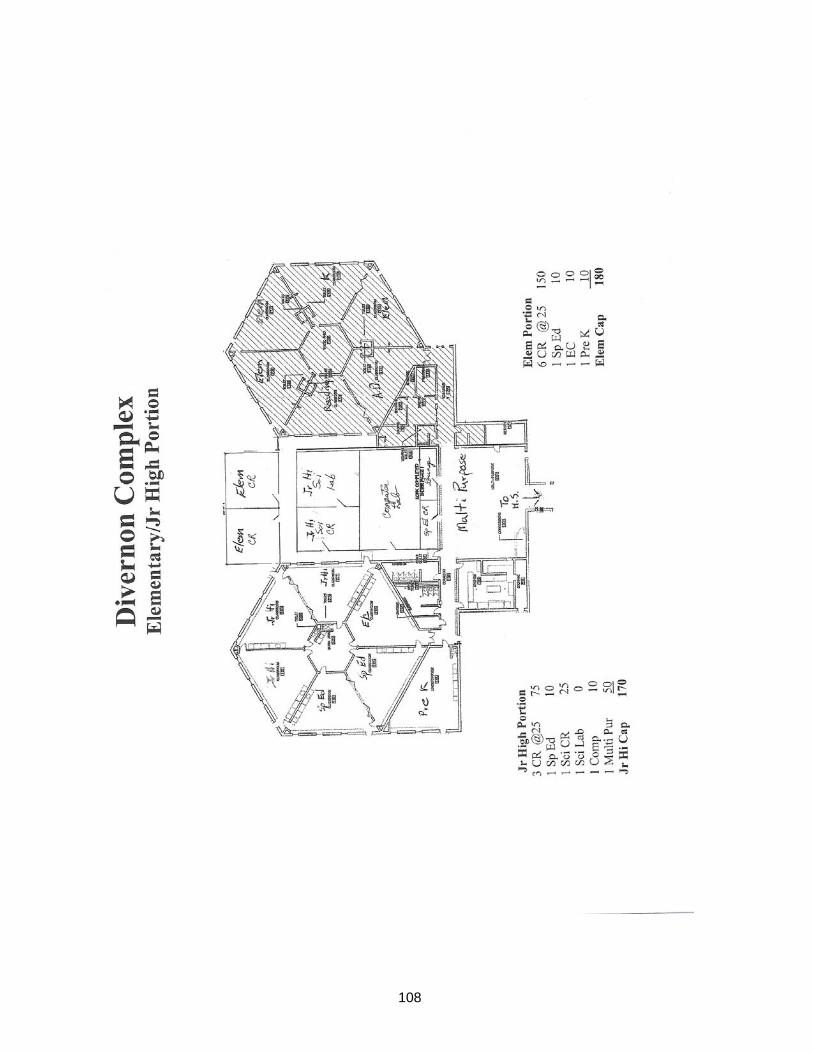
108

109
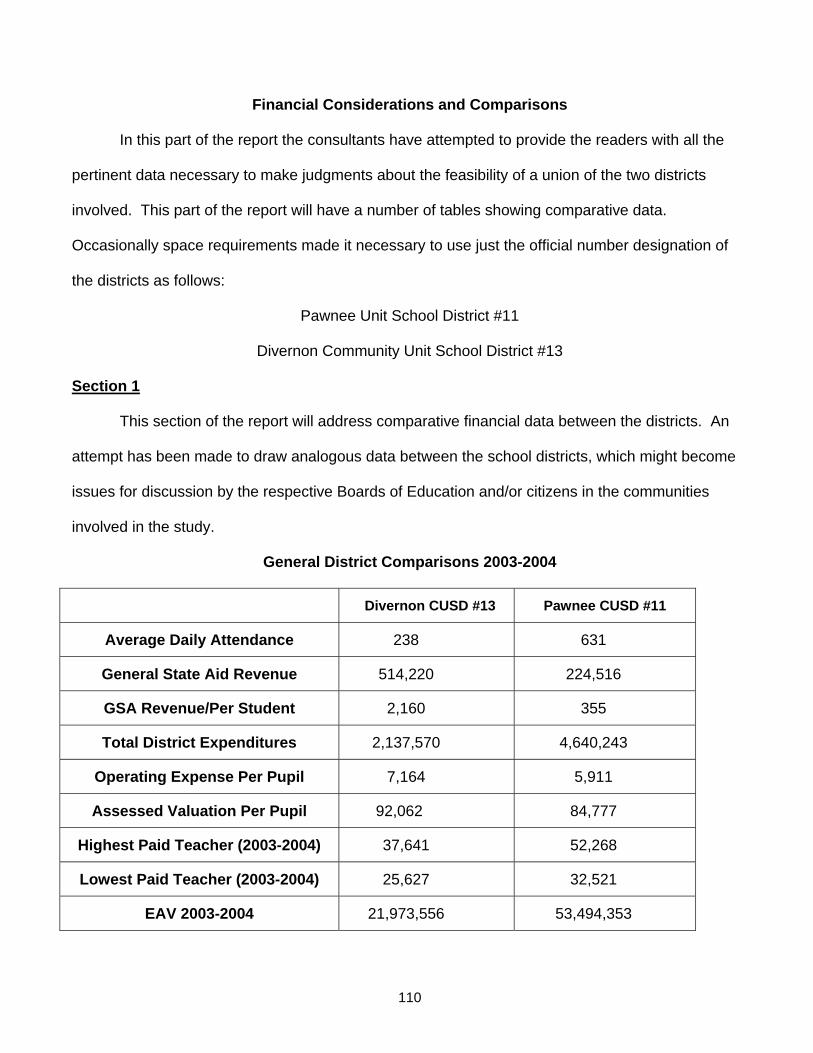
110
Financial Considerations and Comparisons
In this part of the report the consultants have attempted to provide the readers with all the
pertinent data necessary to make judgments about the feasibility of a union of the two districts
involved. This part of the report will have a number of tables showing comparative data.
Occasionally space requirements made it necessary to use just the official number designation of
the districts as follows:
Pawnee Unit School District #11
Divernon Community Unit School District #13
Section 1
This section of the report will address comparative financial data between the districts. An
attempt has been made to draw analogous data between the school districts, which might become
issues for discussion by the respective Boards of Education and/or citizens in the communities
involved in the study.
General District Comparisons 2003-2004
Divernon CUSD #13 Pawnee CUSD #11
Average Daily Attendance 238 631
General State Aid Revenue 514,220 224,516
GSA Revenue/Per Student 2,160 355
Total District Expenditures 2,137,570 4,640,243
Operating Expense Per Pupil 7,164 5,911
Assessed Valuation Per Pupil 92,062 84,777
Highest Paid Teacher (2003-2004) 37,641 52,268
Lowest Paid Teacher (2003-2004) 25,627 32,521
EAV 2003-2004 21,973,556 53,494,353

111
The Operating Expense Per Pupil indicates a higher expense in Divernon than Pawnee. This single number that is derived annually in the Annual Financial Report (Form 50-35) is indicative of the relative costs to educate a student for each Illinois school district. • The Assessed Valuation Per Pupil indicates that Pawnee has a relatively similar EAV/Per Pupil
with Divernon. • In comparing the highest and lowest teacher salaries, it is apparent that Pawnee has a higher
salary schedule than Divernon. This fact will become paramount if a newly negotiated salary schedule with the other districts is instituted in the reorganized district. This difference will be paid in the state incentives for four years, but after that point, a reduced staffing level should be instituted then by attrition, a final determination of staffing levels required, etc. The reduced staffing will become more pronounced in the high school staff in that there are duplications of high school curriculum courses being offered in both district high schools.
• The equalized assessed valuation will be discussed in more detail in a later section of this study.
General State Aid Comparisons (2003-2004)
Divernon CUSD #13 Pawnee CUSD #11
General State Aid 2003-2004 $514,220 $224,516
Average Daily Attendance 2003-2004 238 631
ADA 2002-2003 255 643
ADA 2001-2002 244 636
Personal Property Replacement Tax 2004-2005
56,806 1,245,957
Operating Tax Expense Per Pupil 7,164 5,911
General State Aid/Per Student $2,160 $355
• The student enrollments over the last three years indicate that both districts are in a rather
stable enrollment trend. The current General State Aid formula includes a “hold harmless” provision that allows districts not to receive less GSA than they received in 1997. Therefore, this Hold Harmless provision promises that no district will receive less GSA than they did in 1997-98. ISBE financial records indicates no Hold Harmless GSA payments for Divernon and Pawnee has a HH payment of $136,197. With the serious financial setbacks of the State of Illinois, it can be assumed that this “hold harmless” provision will be removed in the near future. The financial consequence will be a reduction in GSA for Pawnee This enrollment decrease is a

112
common occurrence in central Illinois districts. It should also be noted when school districts decrease in enrollment and increase in equalized assessed valuation, the concurrent decrease in GSA is exacerbated
• Divernon has a moderate amounts of revenue from the Personal Property Replacement Tax and
Pawnee has a significant amount of CPPRT. The following is a definition of Personal Property Replacement Tax; “The Illinois Constitution of 1970 abolished the corporate personal property tax in Illinois as of January 1, 1979, and provided for the replacement of revenues derived from this tax by creation of the Personal Property Replacement Tax. The Department of Revenue certifies each taxing district’s share of the replacement revenues collected by the state at that date. Payments are made eight times per year to approximately 6,700 units of local government and school districts.” To determine the amount that would be allocated to a newly consolidated district, one would have to add together the amounts currently received by the districts. The relative share of the state revenue continues to be the same percentage as allocated in 1979. Therefore districts having a larger allocation at that time will continue to receive that percentage of the annual state revenue regardless of a loss in EAV. Until the State of Illinois changes its formula for this revenue source, these districts will continue to receive the same combined revenue from this source. This annual amount would not be affected by consolidation and should continue to be allocated to the new district in the same amounts as they were allocated individually.
2004 Property Tax Rates/Extensions Divernon #13 Rate Pawnee #11 Rate EAV 21973556 53494353 Fund Ed 483418 2.2 984296 1.84 O&M 115361 0.525 267472 0.5 Trans 43947 0.2 106989 0.2 Sp. Ed. 8789 0.04 21398 0.04 Working Cash 10987 0.05 26747 0.05 IMRF 27994 0.1274 20007 0.0374 Soc. Sec 7998 0.0364 99981 0.1869 Tort 55000 0.2503 299996 0.5608 Lease 10987 0.05 26747 0.05 HLS 10987 0.05 26747 0.05 Bonds 108923 0.4957 189851 0.3549 Total $ 884,392 4.0248 $ 2,070,231 3.870
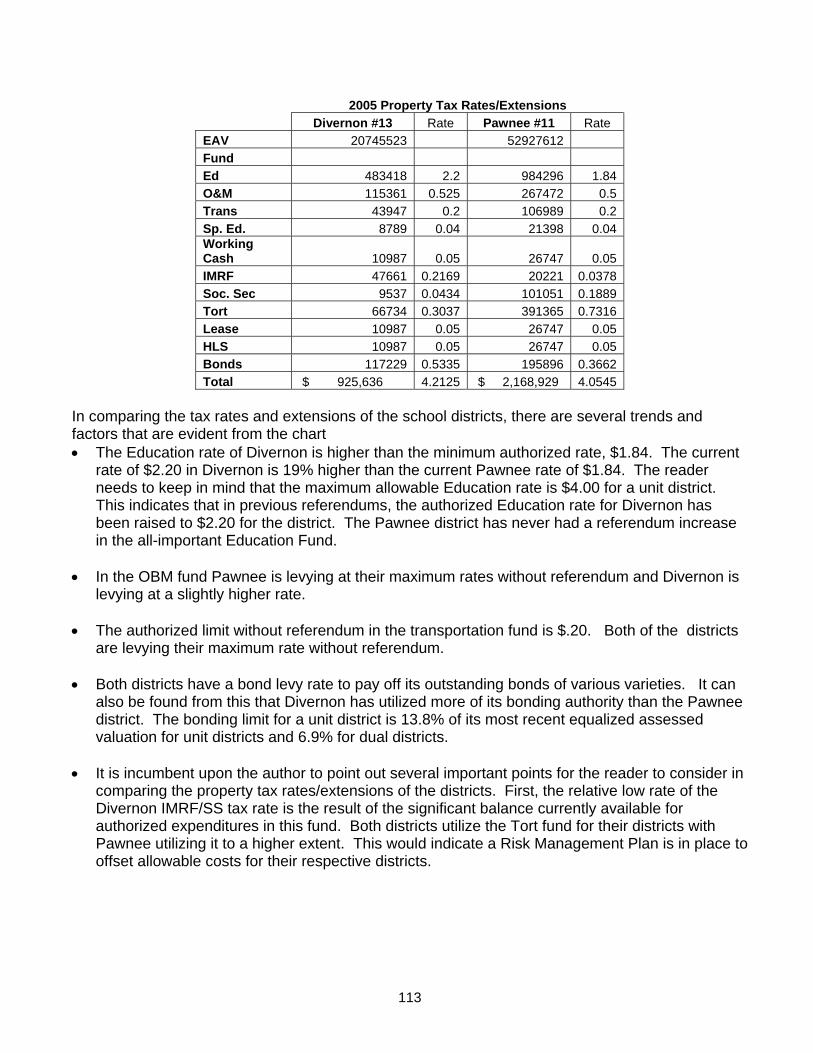
113
2005 Property Tax Rates/Extensions Divernon #13 Rate Pawnee #11 Rate EAV 20745523 52927612 Fund Ed 483418 2.2 984296 1.84 O&M 115361 0.525 267472 0.5 Trans 43947 0.2 106989 0.2 Sp. Ed. 8789 0.04 21398 0.04 Working Cash 10987 0.05 26747 0.05 IMRF 47661 0.2169 20221 0.0378 Soc. Sec 9537 0.0434 101051 0.1889 Tort 66734 0.3037 391365 0.7316 Lease 10987 0.05 26747 0.05 HLS 10987 0.05 26747 0.05 Bonds 117229 0.5335 195896 0.3662 Total $ 925,636 4.2125 $ 2,168,929 4.0545
In comparing the tax rates and extensions of the school districts, there are several trends and factors that are evident from the chart • The Education rate of Divernon is higher than the minimum authorized rate, $1.84. The current
rate of $2.20 in Divernon is 19% higher than the current Pawnee rate of $1.84. The reader needs to keep in mind that the maximum allowable Education rate is $4.00 for a unit district. This indicates that in previous referendums, the authorized Education rate for Divernon has been raised to $2.20 for the district. The Pawnee district has never had a referendum increase in the all-important Education Fund.
• In the OBM fund Pawnee is levying at their maximum rates without referendum and Divernon is
levying at a slightly higher rate. • The authorized limit without referendum in the transportation fund is $.20. Both of the districts
are levying their maximum rate without referendum. • Both districts have a bond levy rate to pay off its outstanding bonds of various varieties. It can
also be found from this that Divernon has utilized more of its bonding authority than the Pawnee district. The bonding limit for a unit district is 13.8% of its most recent equalized assessed valuation for unit districts and 6.9% for dual districts.
• It is incumbent upon the author to point out several important points for the reader to consider in
comparing the property tax rates/extensions of the districts. First, the relative low rate of the Divernon IMRF/SS tax rate is the result of the significant balance currently available for authorized expenditures in this fund. Both districts utilize the Tort fund for their districts with Pawnee utilizing it to a higher extent. This would indicate a Risk Management Plan is in place to offset allowable costs for their respective districts.

114
Audit Comparisons: Education Fund
Pg. 8 AFR 2004-2005 2003-2004 2002-2003 2001-2002
Divernon CUSD #13 ($644,680)($379,743) (229,716) (33,781)
Pawnee CUSD #11 $939,895 $814,937 484,227 1,003,799
This section of the financial report will deal with the audited fund balances of the districts in
all funds for the last four years. These figures should be illustrative of the relative financial strength
of the individual districts by fund.
The education fund is by far the most important of all funds utilized by a school district.
Within this fund are usually up to 80% of the revenue and expenditures for a school district. The
strength of this fund will be of paramount importance in determining the financial stability of a school
district.
• The education fund balances for Pawnee indicates a surplus over four years. This surplus in the education fund indicates while Pawnee enjoys a surplus, unless more state or local revenue is realized this surplus will not last long in the present economy barring any cost-saving measures initiated by the districts. Divernon’s fund balance in the Education fund is a stark contrast to Pawnee in that their deficits are growing significantly over the four year period. This financial measure alone is a very important measuring stick to an overall financial picture for a school district. This deficit represents a “slippery slope” for the Education fund and will need to be corrected with either increased revenue or reduced expenditures in the future.
• This chart indicates a stable to increasing balance for Pawnee and an increasing deficit balance
for Divernon. • Divernon has issued $840,000 in tax anticipation warrants in 2005 payable in 2006.
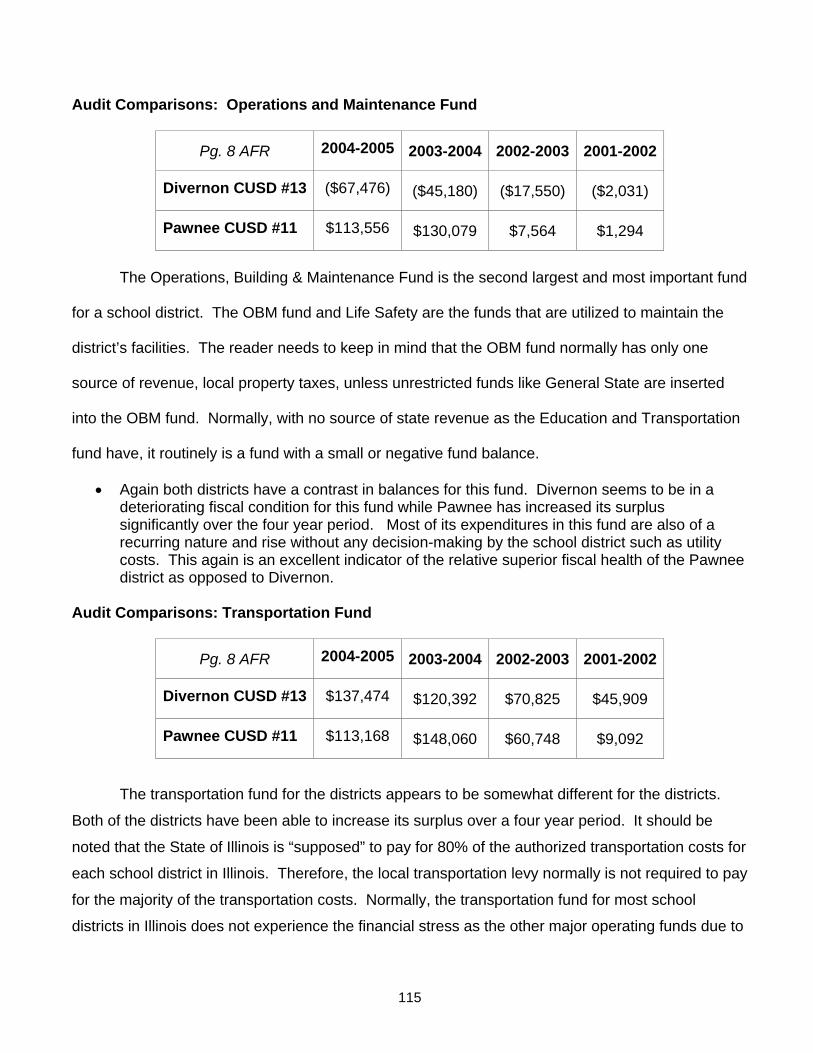
115
Audit Comparisons: Operations and Maintenance Fund
Pg. 8 AFR 2004-2005 2003-2004 2002-2003 2001-2002
Divernon CUSD #13 ($67,476) ($45,180) ($17,550) ($2,031)
Pawnee CUSD #11 $113,556 $130,079 $7,564 $1,294
The Operations, Building & Maintenance Fund is the second largest and most important fund
for a school district. The OBM fund and Life Safety are the funds that are utilized to maintain the
district’s facilities. The reader needs to keep in mind that the OBM fund normally has only one
source of revenue, local property taxes, unless unrestricted funds like General State are inserted
into the OBM fund. Normally, with no source of state revenue as the Education and Transportation
fund have, it routinely is a fund with a small or negative fund balance.
• Again both districts have a contrast in balances for this fund. Divernon seems to be in a deteriorating fiscal condition for this fund while Pawnee has increased its surplus significantly over the four year period. Most of its expenditures in this fund are also of a recurring nature and rise without any decision-making by the school district such as utility costs. This again is an excellent indicator of the relative superior fiscal health of the Pawnee district as opposed to Divernon.
Audit Comparisons: Transportation Fund
Pg. 8 AFR 2004-2005 2003-2004 2002-2003 2001-2002
Divernon CUSD #13 $137,474 $120,392 $70,825 $45,909
Pawnee CUSD #11 $113,168 $148,060 $60,748 $9,092
The transportation fund for the districts appears to be somewhat different for the districts.
Both of the districts have been able to increase its surplus over a four year period. It should be
noted that the State of Illinois is “supposed” to pay for 80% of the authorized transportation costs for
each school district in Illinois. Therefore, the local transportation levy normally is not required to pay
for the majority of the transportation costs. Normally, the transportation fund for most school
districts in Illinois does not experience the financial stress as the other major operating funds due to
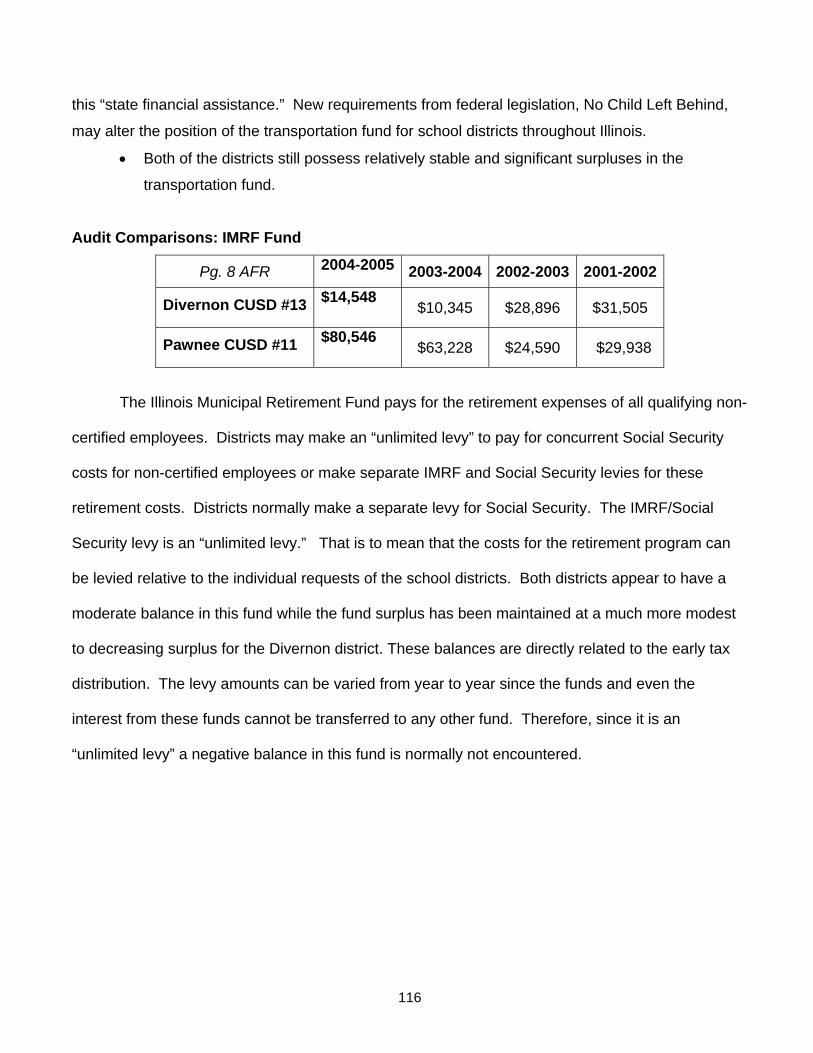
116
this “state financial assistance.” New requirements from federal legislation, No Child Left Behind,
may alter the position of the transportation fund for school districts throughout Illinois.
• Both of the districts still possess relatively stable and significant surpluses in the
transportation fund.
Audit Comparisons: IMRF Fund
Pg. 8 AFR 2004-2005 2003-2004 2002-2003 2001-2002
Divernon CUSD #13 $14,548 $10,345 $28,896 $31,505
Pawnee CUSD #11 $80,546 $63,228 $24,590 $29,938
The Illinois Municipal Retirement Fund pays for the retirement expenses of all qualifying non-
certified employees. Districts may make an “unlimited levy” to pay for concurrent Social Security
costs for non-certified employees or make separate IMRF and Social Security levies for these
retirement costs. Districts normally make a separate levy for Social Security. The IMRF/Social
Security levy is an “unlimited levy.” That is to mean that the costs for the retirement program can
be levied relative to the individual requests of the school districts. Both districts appear to have a
moderate balance in this fund while the fund surplus has been maintained at a much more modest
to decreasing surplus for the Divernon district. These balances are directly related to the early tax
distribution. The levy amounts can be varied from year to year since the funds and even the
interest from these funds cannot be transferred to any other fund. Therefore, since it is an
“unlimited levy” a negative balance in this fund is normally not encountered.
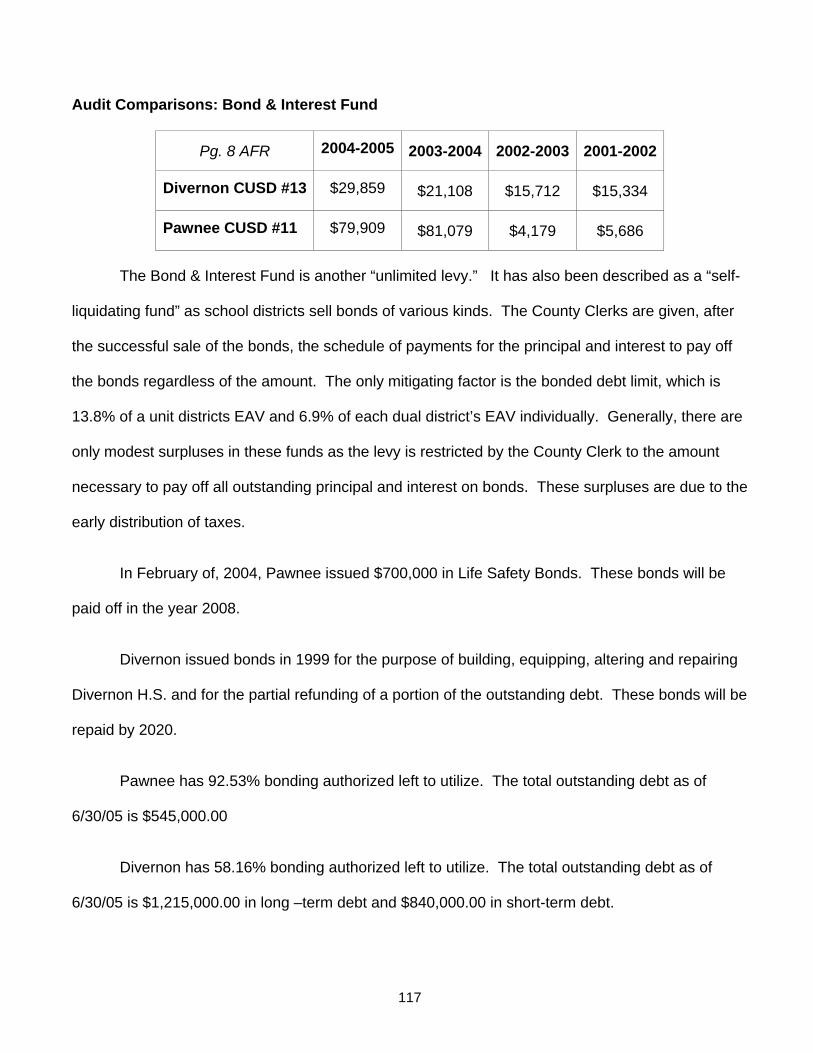
117
Audit Comparisons: Bond & Interest Fund
Pg. 8 AFR 2004-2005 2003-2004 2002-2003 2001-2002
Divernon CUSD #13 $29,859 $21,108 $15,712 $15,334
Pawnee CUSD #11 $79,909 $81,079 $4,179 $5,686
The Bond & Interest Fund is another “unlimited levy.” It has also been described as a “self-
liquidating fund” as school districts sell bonds of various kinds. The County Clerks are given, after
the successful sale of the bonds, the schedule of payments for the principal and interest to pay off
the bonds regardless of the amount. The only mitigating factor is the bonded debt limit, which is
13.8% of a unit districts EAV and 6.9% of each dual district’s EAV individually. Generally, there are
only modest surpluses in these funds as the levy is restricted by the County Clerk to the amount
necessary to pay off all outstanding principal and interest on bonds. These surpluses are due to the
early distribution of taxes.
In February of, 2004, Pawnee issued $700,000 in Life Safety Bonds. These bonds will be
paid off in the year 2008.
Divernon issued bonds in 1999 for the purpose of building, equipping, altering and repairing
Divernon H.S. and for the partial refunding of a portion of the outstanding debt. These bonds will be
repaid by 2020.
Pawnee has 92.53% bonding authorized left to utilize. The total outstanding debt as of
6/30/05 is $545,000.00
Divernon has 58.16% bonding authorized left to utilize. The total outstanding debt as of
6/30/05 is $1,215,000.00 in long –term debt and $840,000.00 in short-term debt.

118
This amount of bonding authority left is also a potential source of new operating funds for a
district, in that working cash and/or funding bonds may be sold to alleviate future budget declines.
Audit Comparisons: Working Cash Fund
Pg. 8 AFR 2004-2005 2003-2004 2002-2003 2001-2002
Divernon CUSD #13 $13,001 $494 $20,656 $9,928
Pawnee CUSD #11 $477,793 $450,242 $412,975 $389,769
The Working Cash Fund enjoys a relatively significant balance in Pawnee, indicating an
annual levy that is allowed to grow or the sale of Working Cash Bonds. Working Cash bonds is a
method of supplementing revenue in Illinois School Districts. Districts may sell Working Cash
Bonds and then “abate” ,which means partially abolish during a fiscal year or totally abolish the fund
and put the balance into the educational fund. The amount of bonds that may be sold is 85% of the
education fund levy plus 85% of the amount received in the personal property replacement tax.
Thus there is a separate bond limit for working cash bonds. In this fund comparison, Divernon
currently abolishes its working cash fund annually to supplement operating revenue and Pawnee is
allowing their annual levy to enrich and maintain a significant positive balance in this fund. The
funds are used to allow the district to make inter-fund loans, thereby alleviating the need to issue
tax anticipation warrants. This dichotomy of the working cash fund is indicative of the relative fiscal
strength of the Pawnee district as opposed to the Divernon district since Pawnee is allowing its
positive balance to grow and Divernon annually abolishes its Working Cash Fund to the Education
Fund to defray operating expenses.

119
Audit Comparisons: Site and Construction Fund
Pg. 8 AFR 2004-2005 2003-2004 2002-2003 2001-2002
Divernon CUSD #13 $192 $192 $10,375 $10,286
Pawnee CUSD #11 -0- -0- -0-
The Site & Construction Fund encompasses bonds sold for the construction/renovation of
school district facilities. Only Pawnee has utilized this fund to construct new facilities and no funds
are currently left from the sale of construction bonds. This fund for Divernon will be reduced as the
facilities are constructed and costs relative to the construction are paid off concurrent with the
construction.
Audit Comparisons: Fire and Safety Prevention Funds
Pg. 8 AFR 2004-2005 2003-2004 2002-2003 2001-2002
Divernon CUSD #13 $2940 $557 $95 $628
Pawnee CUSD #11 $236,965 $769,663 $115,340 $243,825
This fund is maintained by the annual levy of $.05 for all districts or by the sale of bonds up
to an individual district’s bonded debt limit. Both districts appear to have a relatively modest
balance in this fund. Divernon appears to be completing small Life Safety projects with their annual
levy. When the balances are decreasing that normally denotes approved life safety projects
completed. It appears that the Pawnee district recently has utilized this fund to undertake more
significant approvable capital improvement projects.

120
Comparison of Equalized Assessed Valuations
The author will examine the EAV of each of the districts over the last four years. Normally,
the EAV of a school district will not make dramatic increases or decreases without special
circumstances. However, as the author will point out, both districts have realized a moderate
decrease in EAV in the recent past that has caused a decreases in local revenue for each of the
districts. The Divernon district has decreased their EAV over 8.07% in a four year period and
Pawnee has decreased at a concurrent four year rate of 2.04%. Additionally, each of the districts
face a proposed reduction of EAV in the future due to the Farmland Reassessment Act, which is
decreasing the “productivity index” for farmland EAV. Since all districts have moderate to significant
amounts of farmland in their EAV, a decrease in the value of the aforementioned farmland will
cause a decrease in local revenue, unless there is a concurrent increase in residential and
commercial EAV.
Equalized Assessed Valuations
2005 2004 2003 2002
Divernon CUSD #13 20,745,523 21,973,556 21,840,075 22,568,144
Pawnee CUSD #11 52,927,612 53,494,353 53,734,914 54,031,414
Divernon CUSD #13 02-04: cumulative decreases of $1,822,621 -8.07%
Pawnee CUSD #11 02-05: cumulative decreases of $1,103,802 -2.04%
Projected Unit District Tax Rate for the new Sangamon County District
In any discussion of school district reorganization the future tax rate of a new district is
always an issue of importance. At this point, the author will discuss an Article 11A reorganization.
The tax rate of the newly reorganized district as approved in the referendum becomes the tax rate
for three of the largest operating funds, with the exception of the Bond & Interest Fund. As has
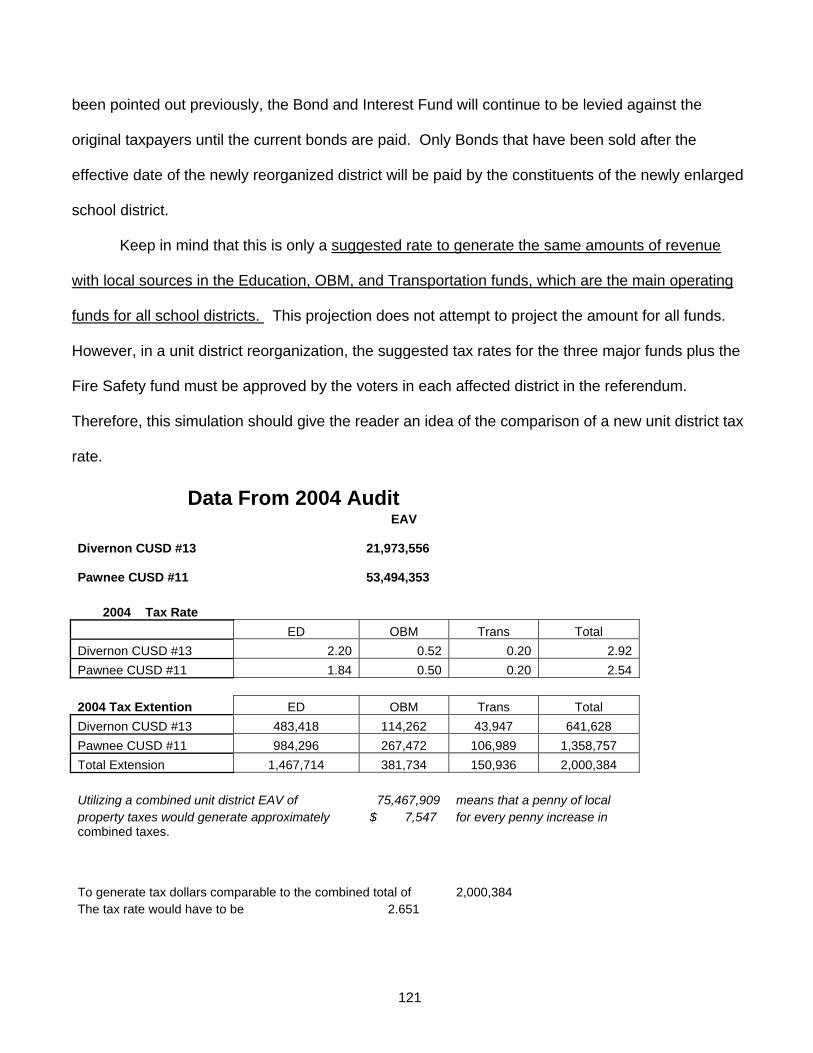
121
been pointed out previously, the Bond and Interest Fund will continue to be levied against the
original taxpayers until the current bonds are paid. Only Bonds that have been sold after the
effective date of the newly reorganized district will be paid by the constituents of the newly enlarged
school district.
Keep in mind that this is only a suggested rate to generate the same amounts of revenue
with local sources in the Education, OBM, and Transportation funds, which are the main operating
funds for all school districts. This projection does not attempt to project the amount for all funds.
However, in a unit district reorganization, the suggested tax rates for the three major funds plus the
Fire Safety fund must be approved by the voters in each affected district in the referendum.
Therefore, this simulation should give the reader an idea of the comparison of a new unit district tax
rate.
Data From 2004 Audit EAV
Divernon CUSD #13 21,973,556
Pawnee CUSD #11 53,494,353
2004 Tax Rate
ED OBM Trans Total Divernon CUSD #13 2.20 0.52 0.20 2.92 Pawnee CUSD #11 1.84 0.50 0.20 2.54 2004 Tax Extention ED OBM Trans Total Divernon CUSD #13 483,418 114,262 43,947 641,628 Pawnee CUSD #11 984,296 267,472 106,989 1,358,757 Total Extension 1,467,714 381,734 150,936 2,000,384 Utilizing a combined unit district EAV of 75,467,909 means that a penny of local property taxes would generate approximately $ 7,547 for every penny increase in combined taxes.
To generate tax dollars comparable to the combined total of 2,000,384
The tax rate would have to be 2.651
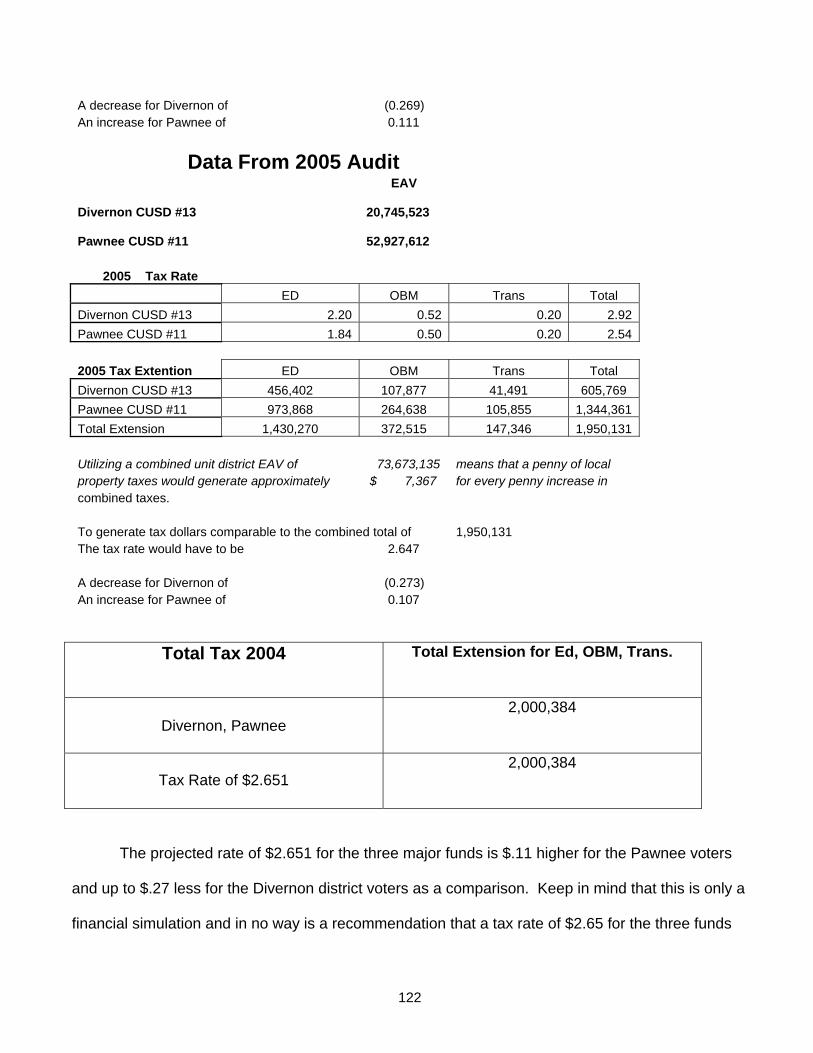
122
A decrease for Divernon of (0.269) An increase for Pawnee of 0.111
Data From 2005 Audit EAV
Divernon CUSD #13 20,745,523
Pawnee CUSD #11 52,927,612
2005 Tax Rate
ED OBM Trans Total Divernon CUSD #13 2.20 0.52 0.20 2.92 Pawnee CUSD #11 1.84 0.50 0.20 2.54 2005 Tax Extention ED OBM Trans Total Divernon CUSD #13 456,402 107,877 41,491 605,769 Pawnee CUSD #11 973,868 264,638 105,855 1,344,361 Total Extension 1,430,270 372,515 147,346 1,950,131 Utilizing a combined unit district EAV of 73,673,135 means that a penny of local property taxes would generate approximately $ 7,367 for every penny increase in combined taxes. To generate tax dollars comparable to the combined total of 1,950,131 The tax rate would have to be 2.647 A decrease for Divernon of (0.273) An increase for Pawnee of 0.107
Total Tax 2004 Total Extension for Ed, OBM, Trans.
Divernon, Pawnee 2,000,384
Tax Rate of $2.651
2,000,384
The projected rate of $2.651 for the three major funds is $.11 higher for the Pawnee voters
and up to $.27 less for the Divernon district voters as a comparison. Keep in mind that this is only a
financial simulation and in no way is a recommendation that a tax rate of $2.65 for the three funds

123
listed, should be utilized by the Committee of Ten in a newly reorganized district encompassing the
current school districts. The 2005 audit figures indicate how a decrease in the EAV negatively
affects all the projections. The total dollars generated decreases and causes the rate to increase.
Other Financial Considerations
Inherent in any successful reorganization proposal are several financial considerations that
are difficult to quantify but should be discussed. Current statutes for all reorganizations require that
all multi-year agreements that are currently in force by any of the reorganizing districts must be
honored by the newly created district. In this case, a newly reorganized district would be obligated
to renegotiate all such contracts. In the case of certified and non-certified union agreements, the
collective bargaining agreement in place in all districts would be abolished and the teachers that are
employed by the original districts on the last day of said district, will be placed upon an appropriate
salary schedule position in the newly negotiated salary schedule. Another area of fiscal
consideration in a possible reorganization is the change of staffing inherent in the creation of a new
district. Certainly, there will only be one superintendent of a new district. However, realistically,
when the size of the newly merged district increases, there is often an addition of central office staff
in the Assistant Supt. position in order to more effectively manage the newly enlarged district. The
central office staff and ancillary central office staff are normally the group of employees that are the
most affected. For example, it would be normal to assume that only one bookkeeper; payroll clerk
and/or superintendent’s secretary would be necessitated. While it would be impossible to
determine at this point what personnel or salaries would be required by the newly enlarged district,
it is also logical to assume there would be financial savings in the personnel required to manage
one central office instead of two. Non-certified staff receives no job protection such as tenure
(contractual continued service) in reorganization. In this reorganization, there will undoubtedly be
certified staff reductions based upon the needs of the newly enlarged district. The certified staff that
will be affected the most will be the high school staff and central office administrators. Currently all

124
districts are offering a duplicated high school curriculum and while the number may not known at
this time, it will certainly entail a reduction of some full-time and possibly part-time certified staff
members as the needs of the new district are determined after a successful referendum.
Another area that needs to be explained is the bonded debt of the two districts currently.
Each of the districts has bonded debt. However, in the case of reorganization, will taxpayers in the
new district be responsible for the debt that has been previously accumulated in the previous
districts? That answer is no. All bonded debt in the new district will be paid by the original
residents of the district that encumbered the debt. The county clerk will continue to levy enough
funds to pay the principal and interest of the previous bonded debt until it is paid in full. Only bonds
sold by the new district will be spread over the entire newly reorganized district.
Conclusions
From the financial reports provided the author, a generalization can be made. Neither district
seems to be significantly increasing in the important local revenue indicator of Equalized Assessed
Valuation. With an increase in EAV comes an increase in local funds from the same tax rate. Both of
these options indicate that for local sources of revenue, Pawnee is in a superior position to withstand
the vicissitudes of state financial reimbursement levels which has caused over 80% of Illinois school
districts to be in a deficit financial position. Divernon has a current declining fund balance in the
Education and OBM funds. Without a reduction in expenditures or an infusion of additional local
revenue, it is expected that these trends will continue for the Divernon district. Divernon is currently
levying in the Education fund at a relatively higher rate than Pawnee. The districts would benefit
immeasurably financially within a newly reorganized district by combining the staff, programs and
closing unneeded facilities and eliminating duplicate high school programs.
Some of my conclusions on financial matters include:
• Tax rates for all districts have generally been at a relatively moderate to low level.

125
• The projected unit tax rate of $2.651 would only generate the same amount of revenue as
the previous year. With the projected rate at $2.651 or any other rate determined by the
Committee of Ten to be included on a reorganization referendum, it is assumed that the
taxpayers of Pawnee and Divernon would realize a tax increase in some measure.
• The fund balances are currently negative, for Divernon in its two major operating funds,
and can only be corrected by an infusion of more state funds or a local referendum rate
increase, or reductions in expenditures, an annual topic of debate in school districts
throughout Illinois. While the reorganization incentives should provide a short-term infusion
of discretionary funds, these funds are provided for the transition period between the
successful reorganization period and its future years.
• Other financial roadblocks to school districts financial success are also possible in future
TIF districts, a reduced poverty count from the 2000 Census, or DHS poverty count which is
currently in the process of phasing in poverty increases and phasing out poverty income
decreases and a stagnant Illinois economy.
My conclusions at this point are based only on financial considerations and school district
reorganization has many facets that should be considered in concert with the other sections of this
study.

126
The School District Financial Profile
Illinois State Board of Education March 2003
Ronald Gidwitz, Chairman Dr. Robert E. Schiller Illinois State Board of Education State Superintendent of Education The Illinois State Board of Education will be utilizing a new system for assessing a school district’s financial health, “The School District Financial Profile”. This system will replace the prior Financial Watch List and Financial Assurance and Accountability System (FAAS) that has been utilized for the assessment of school district’s financial health. The purpose of this document is to explain each component of this new financial assessment system and to inform school districts prior to its public release in the next two months. In the future, this system will also be made available to the public on the ISBE website as is the ILEARN and School Report Card systems. It has always been the ISBE statutory requirement to monitor all school districts pursuant to Section 1A-8 of the School Code and certify those in financial difficulty. This new system will therefore be utilized to identify those school districts which are moving into financial distress. This system has been developed with the invaluable assistance of school superintendents, school business administrators, financial advisors, lawyers, and bond broker throughout the state as well as major interest groups such as IASBO, IASA, ED-RED and LUDA. The prior financial system, FAAS, utilized only one financial indicator, the Fund Balance to Revenue Ratio. This new system utilizes that indicator plus four more to expand our capability to accomplish a truer risk assessment. The five indicators are individually scored and weighted in order to arrive at a composite district financial profile. The following provides a detailed explanation of each set of data elements of this new system. It is the final overall score that we believe best determines a district’s financial strengths or weaknesses. Summary page of the “School District Financial Profile” At the top of this page, you will find the district region-county-district-type-code number, district name, county, type of school district, district superintendent’s name, the district’s accounting method, and whether or not the district is subject to tax caps. The left side of the page shows the district’s calculations for each of the five critical indicators.
1. Fund Balance to Revenue Ratio – This indicator has been utilized in the past as well as in this new financial assessment. It indicates the overall financial strength of the district for the prior year. It is the result of dividing the ending fund balances by the revenues for the four operating funds (e.g., Educational, Operations and Maintenance, Transportation, and Working Cash Funds).
2. Expenditures to Revenue Ratio – This indicator identifies how much a district expended for
each dollar received. It is computed by dividing total expenditures for the Educational, Operations and Maintenance, and Transportation Funds by the revenues for those same funds.
3. Days Cash on Hand – This indicator provides a projected estimate of the number of days a
district could meet operating expenditures provided no additional revenues were received. It
127
is computed by dividing the total expenditures of the Educational, Operations and Maintenance, and Transportation Funds by 360 days to obtain an average expenditure per day. Then the total cash on hand and investments for the same funds are divided by the average expenditures per day.
4. Percent of Short-Term Borrowing Ability Remaining – Districts often incur short-term debt due to several factors (i.e., delays in receipt of local revenues, etc.). For this indicator, the sum of unpaid Tax Anticipation Warrants is divided by 85% of the Equalized Assessed Valuation (EAV) multiplied by the sum of the tax rates for the Educational, Operations and Maintenance, and Transportation Funds.
5. Percent of Long-Term Debt Margin Remaining – A district often incurs long-term debt for
major expenditures such as buildings and equipment. This total is derived by the product of the district’s EAV times its maximum general obligation debt limitation less any outstanding long-term debt.
The “Statewide Comparison to the Other Districts” to the right of each indicator reflects pictorially where the district’s calculated indicator lies in relationship to all other school districts in the state. The extreme left of the slider bar is the lowest score calculated for all school districts and represents the highest risk and the extreme right of the slider bar is the highest score calculated for all school districts and represents the lowest risk. The slider bar represents the district’s calculated score in comparison to the states lowest and highest outliers. The midpoint provides a benchmark to compare between the extremes. In the future, on our website, the slider bar will be divided into quadrants to provide a more comparable measure to all other school districts. Once the website is available, the Financial Profile System will employ graphs as well as numeric data for enhanced user friendliness. For example, at the bottom of the Summary page, there is a graph which represents the district’s Fund Balance to Revenue Ratio for the last five years. District’s Operating Funds Summary for the Last Five Years The operating funds consist of just the Educational, Operations and Maintenance, Transportation, and Working Cash Funds. This summary portrays a trend analysis of the district’s beginning fund balances, the effects of revenues to expenditures (results of operations), other receipts or adjustments, and the ending fund balances. However, to depict the effect the Working Cash Fund has on a district’s Operating Funds Summary, its ending fund balance is also reflected separately below the overall summary of these funds. Once again, the future website plans to graphically portray this financial data. A couple of examples are provided at the bottom of the Historical Trend page, also. Historical Trend Analysis of a District’s Demographics and Financial Characteristics The demographics section includes data on students, teachers, and other important financial comparisons. This information is also available on the agency’s ILEARN System or the School Report Card System but is conveniently presented in one place for easy access and comparison. Five Year History of the Five Financial Indicators This section presents how each indicator is scored in order to obtain a district’s overall School District

128
Financial Profile score. The overall score is computed for the most current year’s financial data, but a five year analysis is provided as well to give a general direction for each indicator. Each indicator is calculated and the results are slotted into a category of a four, three, two, or one with four being the highest and best category possible. Each indictor is weighted and the weighted indicators’ scores are summed to obtain a district’s overall “financial profile score”.
Fund Balance to Revenue Ratio (has a weighting of 35%) Category 4 Greater or equal to 25% [lowest risk] Category 3 Less than 25% but greater or equal to 10% Category 2 Less than 10% but greater or equal to 0% Category 1 Less than 0% [highest risk]
Expenditures to Revenue Ratio (has a weighting of 35%)
Category 4 District is spending $1.00 or less for ever dollar they are receiving [lowest risk] Category 3 District is spending more than $1.00 to $1.10 for every dollar they receive Category 2 District is spending more than $1.10 to $1.20 for every dollar they receive Category 1 District is spending more than $1.20 for every dollar they receive [highest risk]
Days Cash on Hand (has a weighting of 10%)
Category 4 At least 180 days cash on hand [lowest risk] Category 3 Less than 180 days cash on hand to at least 90 days cash on hand Category 2 Less than 90 days cash on hand to at least 30 days cash on hand Category 1 Less than 30 days cash on hand [highest risk]
Percentage of Short-Term Borrowing and Long-Term Borrowing Remaining (Short-term and Long-term Borrowing each has a weighting of 10%)
Category 4 Greater than or equal to 75% debt margin remaining [lowest risk] Category 3 Less than 75% but at least 50% debt margin remaining Category 2 Less than 50% but at least 25% debt margin remaining Category 1 Less than 25% debt margin remaining [highest risk]
The overall score then appears at the bottom of the Five Year History page. This score is the sum of the five weighted scores. The highest score a district may receive is a 4.00 and the lowest score is 1.00. What can a district expect when their composite score is between 1.00 and 4.00?
If a district receives a score of 3.54 - 4.00, they are assigned to the best category of financial strength and that is labeled Financial Recognition. These districts re require little or no review or involvement by ISBE unless requested by the district.
If a district receives a score of 3.08 - 3.53, they are assigned to the next highest financial health category of Financial Review. Districts in this category will be given a limited review by ISBE, but they will be monitored for potential downward trends. Staff will be assessing the next year’s school budget for further negative trends.
If a district receives a score of 2.62 - 3.07, they are assigned to the category of Financial Early Warning. ISBE will be monitoring these districts closely and offering proactive technical assistance (e.g., financial projections and cash flow analysis, etc.) These districts will also be reviewed to determine whether they meet the criteria set forth in Article 1A-8 of the School Code to be certified in financial difficulty and possibly qualify for a Financial Oversight Panel.
If a district receives a score of 1.00 - 2.61, they are in the highest risk category of Financial Watch. As with the Financial Early Warning districts, ISBE will be monitoring these districts very closely and

129
Comparison of Selected Financial Information
District Comments
offering them technical assistance with, but not limited to, financial projections, cash flow analysis, budgeting, personnel inventories, and enrollment projections. These districts will also be reviewed to determine whether they meet criteria set forth in Article 1A-8 of the School Code to be certified in financial difficulty and qualify for a Financial Oversight Panel.
This section will allow district administrators and eventually the public at large, to compare a district’s demographics to other school districts in the same county, like school district types statewide and like size school districts statewide.
This section is provided for school district superintendents or business administrators to comment on their district’s financial affairs. This will allow for the explanation of significant local financial issues such as cash versus accrual accounting implications and timing of revenue receipts verses expenditures incurred for unique circumstances such as school construction projects. ISBE regards this page to be analogous to the Management Discussion and Analysis (MDA) statement required of any district under GASB 34. If district personnel have any questions regarding The School District Financial Profile, they may contact Sally Cray of the School Business and Support Division at the Illinois State Board of Education at (217) 785-8779 or by email at [email protected].

130
DISTRICT FINANCIAL PROFILE
2003/2004 Total Profile Score
Fund Balance to Revenue Ratio
Expenditure to Revenue Ratio
Days Cash on Hand
% of Short-Term Borrowing Maximum Remaining
% of Long-Term Debt Margin Remaining
Divernon CUSD #13 2.3 .17 1.08 54.21 98.9% 58.44%
Pawnee CUSD #11 3.9 .32 .88 128.68 100% 90.37%
Operating Funds Beginning Fund
Balance-7/1/03 Ending Fund Balance-
6/30/04 Working Cash
Balance ISBE Listing
Divernon CUSD #13 ($176,441) ($304,531) $494 2.3l Watch
Pawnee CUSD #11 $540,537 $1,093,076 $450,242 3.9 Recognition
2004/2005 Total Profile Score
Fund Balance to Revenue Ratio
Expenditure to Revenue Ratio
Days Cash on Hand
% of Short-Term Borrowing Maximum Remaining
% of Long-Term Debt Margin Remaining
Divernon CUSD #13 1.65 .291 1.134 45.94 -60.47% 58.18%
Pawnee CUSD #11 3.9 .365 .978 134.28 100% 92.53%
Operating Funds Beginning Fund
Balance Ending Fund Balance Working Cash
Balance ISBE Listing
Divernon CUSD #13 (304,531) ($674,682) 13,001 1.65 Watch
Pawnee CUSD #11 $1,093,076 $1,166,619 $477,793 3.9 Recognition
The information provided by the School Profile is a snapshot of variables for schools to give the reader a
quick estimate of the fiscal stability of a school district. The charts above have been compiled from the last
two School Financial Profiles available from the Illinois State Board of Education.
The following generalizations can be made from the “financial profiles”:
• Pawnee has been given its Recognition designation for fiscal stability with the Divernon district given
its Financial Watch designation.
• Given the information available from ISBE such as listed above, Pawnee has a superior current
financial position between the districts.
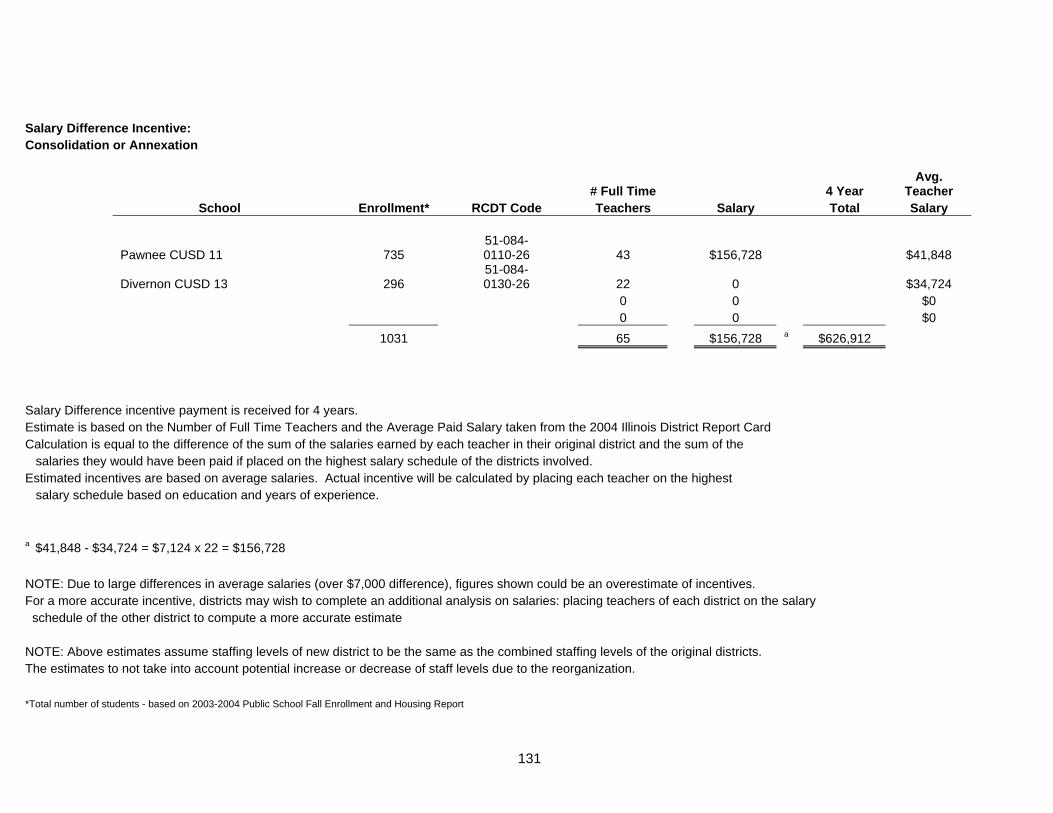
131
Salary Difference Incentive: Consolidation or Annexation
# Full Time 4 Year Avg.
Teacher School Enrollment* RCDT Code Teachers Salary Total Salary
Pawnee CUSD 11 735 51-084-0110-26 43 $156,728 $41,848
Divernon CUSD 13 296 51-084-0130-26 22 0 $34,724
0 0 $0 0 0 $0 1031 65 $156,728 a $626,912 Salary Difference incentive payment is received for 4 years. Estimate is based on the Number of Full Time Teachers and the Average Paid Salary taken from the 2004 Illinois District Report Card Calculation is equal to the difference of the sum of the salaries earned by each teacher in their original district and the sum of the salaries they would have been paid if placed on the highest salary schedule of the districts involved. Estimated incentives are based on average salaries. Actual incentive will be calculated by placing each teacher on the highest salary schedule based on education and years of experience. a $41,848 - $34,724 = $7,124 x 22 = $156,728 NOTE: Due to large differences in average salaries (over $7,000 difference), figures shown could be an overestimate of incentives. For a more accurate incentive, districts may wish to complete an additional analysis on salaries: placing teachers of each district on the salary schedule of the other district to compute a more accurate estimate NOTE: Above estimates assume staffing levels of new district to be the same as the combined staffing levels of the original districts. The estimates to not take into account potential increase or decrease of staff levels due to the reorganization. *Total number of students - based on 2003-2004 Public School Fall Enrollment and Housing Report

132
$4000/Certified Staff Incentive: Consolidation or Annexation # Certified Certified Grand School Enrollment* RCDT Code Staff Staff Total
Pawnee CUSD 11 735 51-084-0110-26 48
Divernon CUSD 13 296 51-084-0130-26 26
1031 74 $296,000 a $592,000 $4,000/Certified Staff incentive payment is received 1, 2, or 3 years based on the reorganized district's rank in EAV/Pupil and ADA. Payment(s) start after the first complete year of reorganization and is flexible from year to year depending on the number of certified staff employed. Incentive is based on the number of full-time, certified staff employed in the reorganized district. Estimate is based on the 2003-04 Certificated Staff Count from the 2003-04 Teacher Service Record No annexing or resulting district shall be entitled to this payment unless such district acquires at least 30% of the ADA of the district being annexed. Based on estimated rank in EAV/Pupil and ADA, this reorganization estimated to receive incentive payment(s) for 2 years. a74 x $4,000 NOTE: Above estimates assume staffing levels of new district to be the same as the combined staffing levels of the original districts. The estimates to not take into account potential increase or decrease of staff levels due to the reorganization. *Total number of students - based on 2003-2004 Public School Fall Enrollment and Housing Report
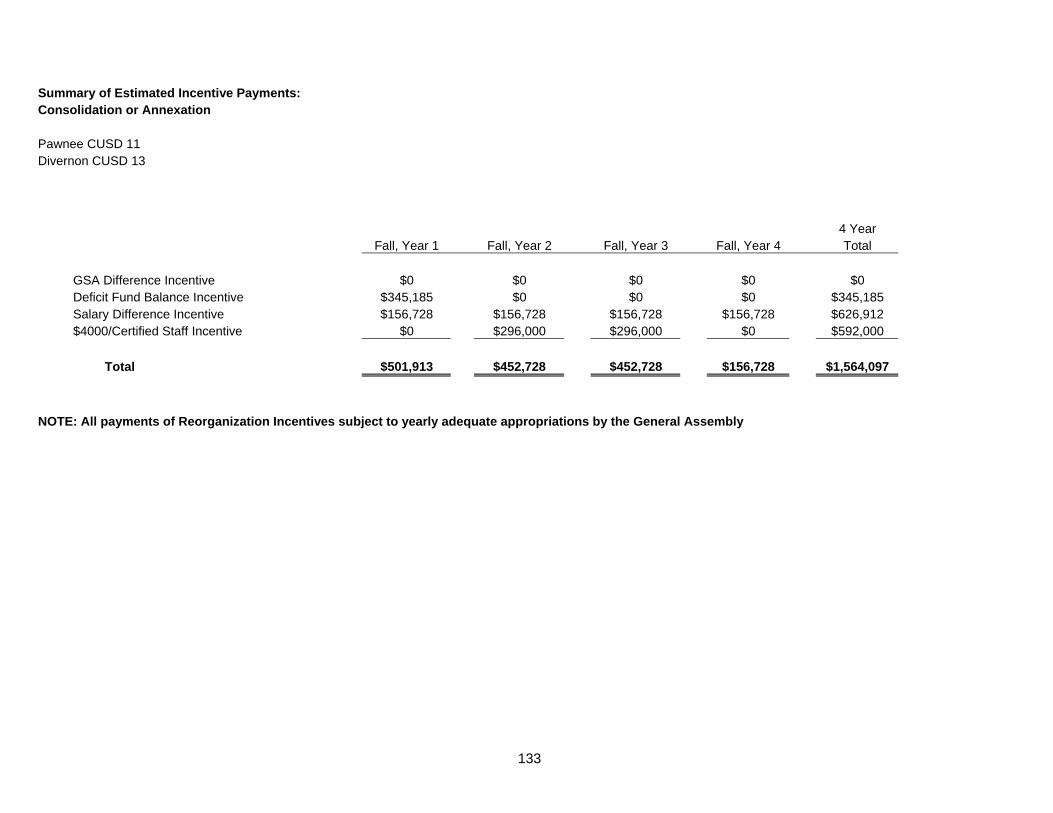
133
Summary of Estimated Incentive Payments: Consolidation or Annexation Pawnee CUSD 11 Divernon CUSD 13 4 Year Fall, Year 1 Fall, Year 2 Fall, Year 3 Fall, Year 4 Total GSA Difference Incentive $0 $0 $0 $0 $0 Deficit Fund Balance Incentive $345,185 $0 $0 $0 $345,185 Salary Difference Incentive $156,728 $156,728 $156,728 $156,728 $626,912 $4000/Certified Staff Incentive $0 $296,000 $296,000 $0 $592,000 Total $501,913 $452,728 $452,728 $156,728 $1,564,097 NOTE: All payments of Reorganization Incentives subject to yearly adequate appropriations by the General Assembly
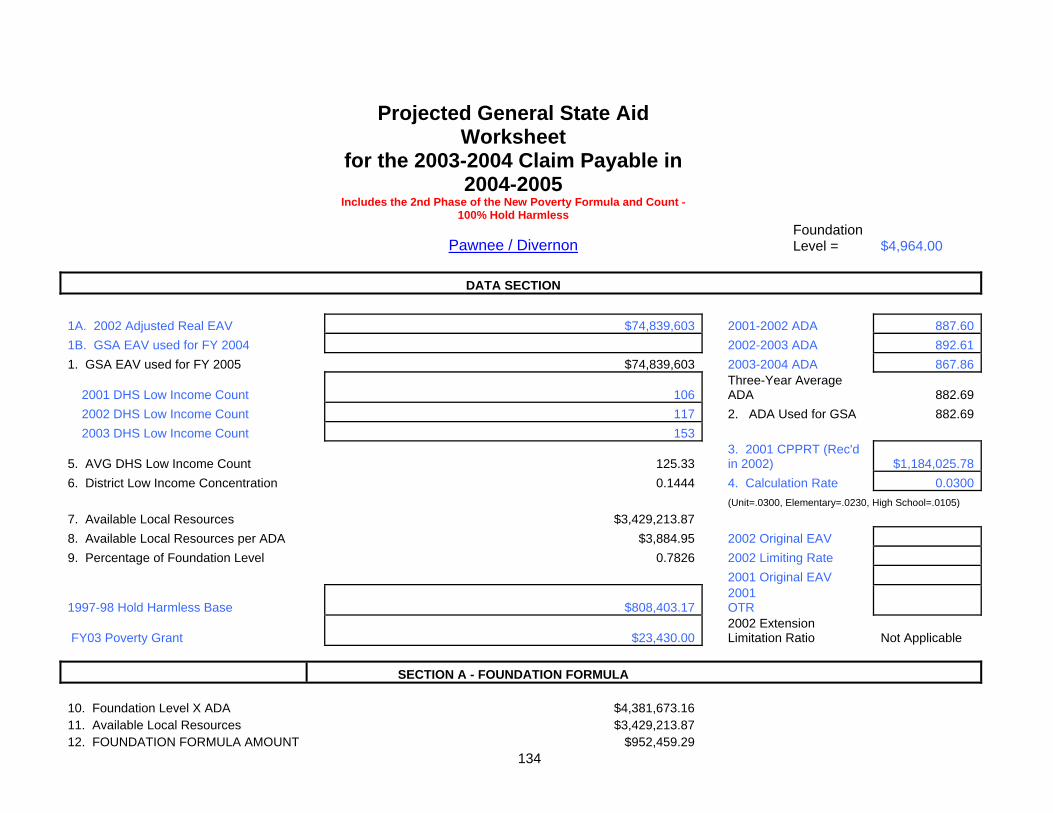
134
Projected General State Aid Worksheet
for the 2003-2004 Claim Payable in 2004-2005
Includes the 2nd Phase of the New Poverty Formula and Count -
100% Hold Harmless
Pawnee / Divernon Foundation Level = $4,964.00
DATA SECTION 1A. 2002 Adjusted Real EAV $74,839,603 2001-2002 ADA 887.601B. GSA EAV used for FY 2004 2002-2003 ADA 892.611. GSA EAV used for FY 2005 $74,839,603 2003-2004 ADA 867.86
2001 DHS Low Income Count 106 Three-Year Average ADA 882.69
2002 DHS Low Income Count 117 2. ADA Used for GSA 882.69 2003 DHS Low Income Count 153
5. AVG DHS Low Income Count 125.33 3. 2001 CPPRT (Rec'd in 2002) $1,184,025.78
6. District Low Income Concentration 0.1444 4. Calculation Rate 0.0300 (Unit=.0300, Elementary=.0230, High School=.0105)
7. Available Local Resources $3,429,213.87 8. Available Local Resources per ADA $3,884.95 2002 Original EAV 9. Percentage of Foundation Level 0.7826 2002 Limiting Rate 2001 Original EAV
1997-98 Hold Harmless Base $808,403.17 2001 OTR
FY03 Poverty Grant $23,430.00 2002 Extension Limitation Ratio Not Applicable
SECTION A - FOUNDATION FORMULA 10. Foundation Level X ADA $4,381,673.16 11. Available Local Resources $3,429,213.87 12. FOUNDATION FORMULA AMOUNT $952,459.29

135
SECTION B - ALTERNATE FORMULA
13. Line 9 minus .93 0.0000 14. Line 13 divided by .82 0.0000
15. Line 14 times .02 0.0000 16. .07 minus Line 15 0.0000 17. Amount per ADA $0.00 18. ALTERNATE FORMULA AMOUNT $0.00 SECTION C - FLAT GRANT FORMULA 19. FLAT GRANT FORMULA AMOUNT $0.00 ($218 x ADA) SECTION D - POVERTY GRANT
If Line 6 < .15 then Poverty Grant = $355 x Line5 Else Poverty Grant = (294.25 + (2700 x (Line 6 x Line 6))) x Line 5
20. Amount per Low Income Count $355.00
FY05 Calculation $44,492.15
Hold Harmless Base $808,403.17
21. FY05 POVERTY GRANT Phase-in $33,961.07
22. GROSS GSA ENTITLEMENT $952,459.29 Hold Harmless $0.00
23. GENERAL STATE AID $986,420.36 GSA + HH $986,420.36 (Gross GSA Entitlement + Poverty)
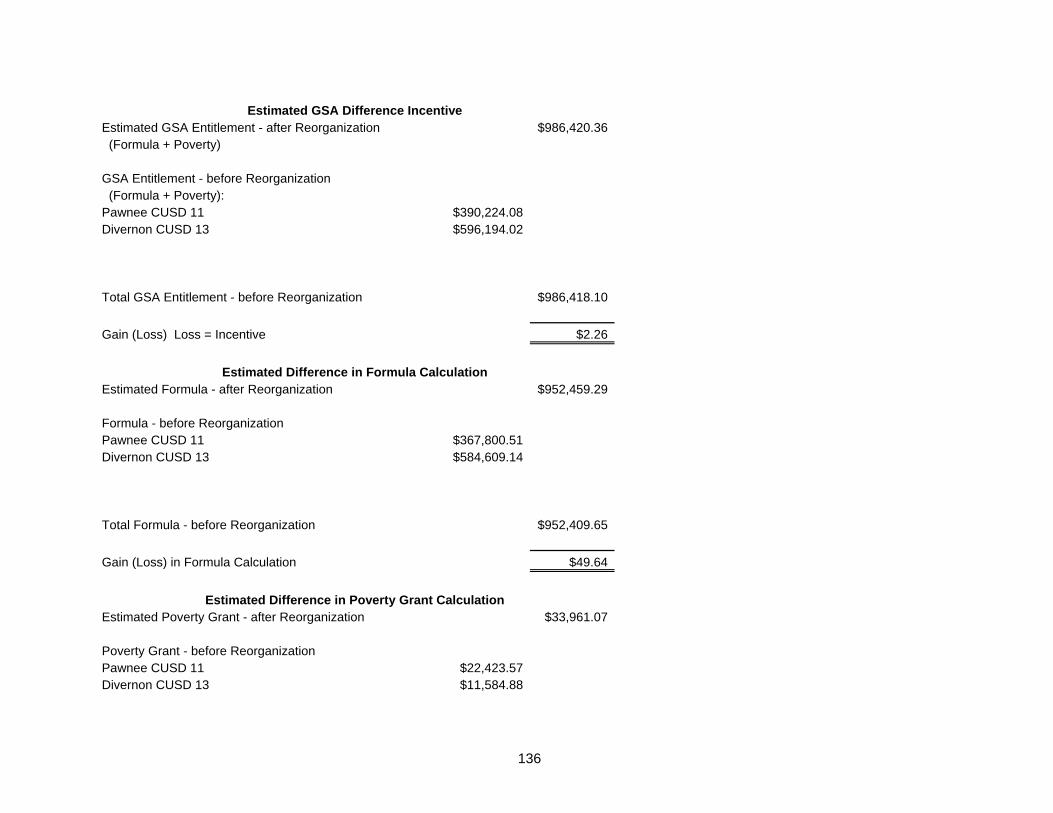
136
Estimated GSA Difference Incentive Estimated GSA Entitlement - after Reorganization $986,420.36 (Formula + Poverty) GSA Entitlement - before Reorganization (Formula + Poverty): Pawnee CUSD 11 $390,224.08 Divernon CUSD 13 $596,194.02 Total GSA Entitlement - before Reorganization $986,418.10 Gain (Loss) Loss = Incentive $2.26
Estimated Difference in Formula Calculation Estimated Formula - after Reorganization $952,459.29 Formula - before Reorganization Pawnee CUSD 11 $367,800.51 Divernon CUSD 13 $584,609.14 Total Formula - before Reorganization $952,409.65 Gain (Loss) in Formula Calculation $49.64
Estimated Difference in Poverty Grant Calculation Estimated Poverty Grant - after Reorganization $33,961.07 Poverty Grant - before Reorganization Pawnee CUSD 11 $22,423.57 Divernon CUSD 13 $11,584.88

137
Total Poverty Grant - before Reorganization $34,008.45 Gain (Loss) in Poverty Grant Calculation ($47.38)
Estimated Difference in General State Aid Receipts Estimated GSA + Hold Harmless - after Reorganization $986,420.36 GSA + Hold Harmless - before Reorganization: Pawnee CUSD 11 ($0 Hold Harmless) $390,224.08 Divernon CUSD 13 ($6,199.56 Hold Harmless) $602,393.58 Total GSA + Hold Harmless - before Reorganization $992,617.66 Gain (Loss) in GSA Receipts ($6,197.30)
Unreserved Fund Balance
6/30/04 and 6/30/05
Pawnee CUSD #11 and Divernon CUSD #13 Transpor- Working Educational O & M tation Cash Fund Fund Fund Fund Total Pawnee CUSD 11 Cash 714,278 130,079 148,060 450,252 1,442,669 Less 2003 taxes rec'd prior to 6-30-04 399,618 108,592 43,437 10,859 562,506 Adj. Fund Balance 314,660 21,487 104,623 439,393 880,163
Divernon CUSD 13 Cash (460,533) (45,180) 120,392 494 (384,827) Less 2003 taxes rec'd prior to 6-30-04 21,736 5,187 1,976 494 29,393 Adj. Fund Balance (482,269) (50,367) 118,416 0 (414,220)
Unreserved Fund Balance from Page 5 of the 2004 AFR; Early Taxes from Page 26 of the 2004 AFR The unreserved Fund Balance does not include the restricted Tort. Dollars Additionally the early tax amount does not include the Tort,

138
Special Educatio, or Lease levy dollars. Transpor- Working Educational O & M tation Cash Fund Fund Fund Fund Total Pawnee CUSD 11 Cash 835,977 113,556 113,168 477,793 1,540,494 Less 2004 taxes rec'd prior to 6-30-05 388,824 105,659 42,263 10,566 547,312 Adj. Fund Balance 447,153 7,897 70,905 467,227 993,182
Divernon CUSD 13 Cash (723,739) (67,476) 137,474 13,001 (640,740) Less 2004 taxes rec'd prior to 6-30-05 55,620 13,273 5,056 1,264 75,213 Adj. Fund Balance (779,359) (80,749) 132,418 11,737 (715,953)
Unreserved Fund Balance from Page 5 of the 2005 AFR; Early Taxes from Page 26 of the 2005 AFR The unreserved Fund Balance does not include the restricted Tort. Dollars Additionally the early tax amount does not include the Tort, Special Educatio, or Lease levy dollars.

139
Sangamon County Divernon CUSD 13 Purchased Supplies & Capital Services Materials Outlay Total
Fiscal Year 2001 Educational Fund (Page 28) $275,907 $118,729 $2,273 $396,909 O & M Fund (Page 30) $91,190 $7,195 $0 $98,385 Transportation Fund (Page 33) $22,829 $8,358 $6,767 $37,954 Total $389,926 $134,282 $9,040 $533,248 Fiscal Year 2002 Educational Fund (Page 28) $263,701 $110,550 $4,035 $378,286 O & M Fund (Page 30) $79,195 $10,219 $0 $89,414 Transportation Fund (Page 33) $22,109 $7,567 $5,910 $35,586 Total $365,005 $128,336 $9,945 $503,286 Fiscal Year 2003 Educational Fund (Page 23) $299,395 $108,917 $19,019 $427,331 O & M Fund (Page 25) $88,439 $14,656 $1,000 $104,095 Transportation Fund (Page 28) $16,774 $6,855 $985 $24,614 Total $404,608 $130,428 $21,004 $556,040 Prior 3-Year Average Educational Fund $400,842 O & M Fund $97,298 Transportation Fund $32,718 Total $530,858
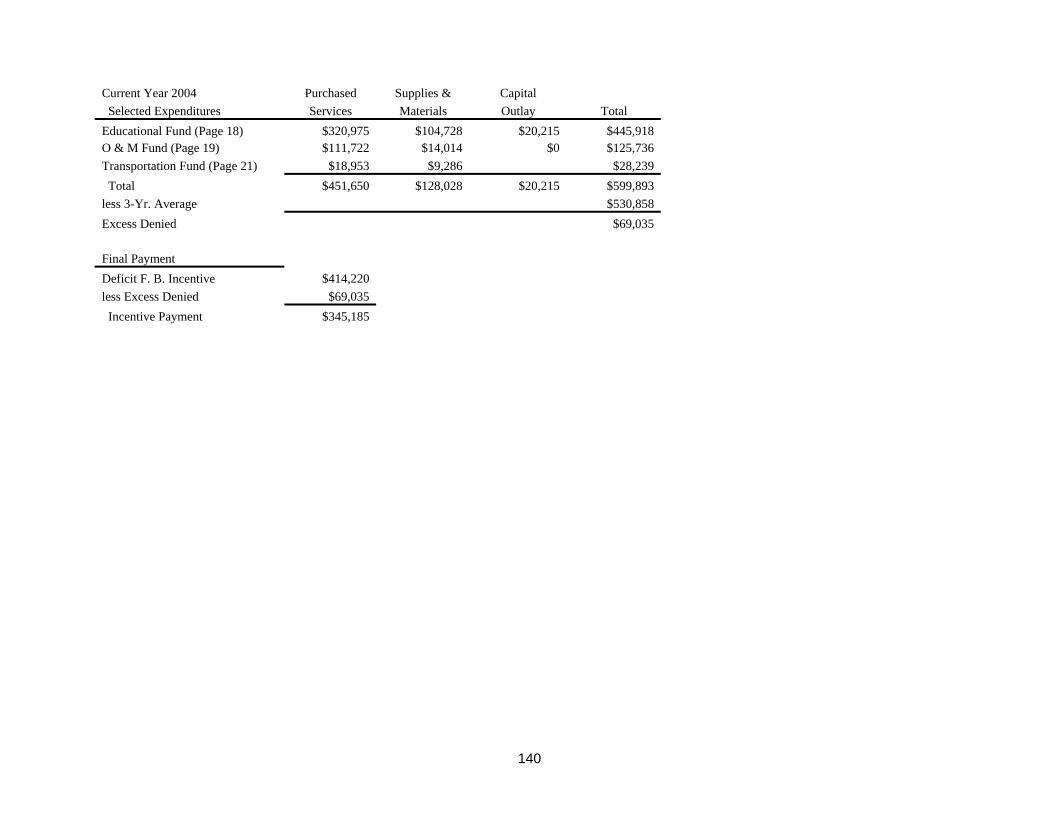
140
Current Year 2004 Purchased Supplies & Capital Selected Expenditures Services Materials Outlay Total Educational Fund (Page 18) $320,975 $104,728 $20,215 $445,918 O & M Fund (Page 19) $111,722 $14,014 $0 $125,736 Transportation Fund (Page 21) $18,953 $9,286 $28,239 Total $451,650 $128,028 $20,215 $599,893 less 3-Yr. Average $530,858 Excess Denied $69,035 Final Payment Deficit F. B. Incentive $414,220 less Excess Denied $69,035 Incentive Payment $345,185
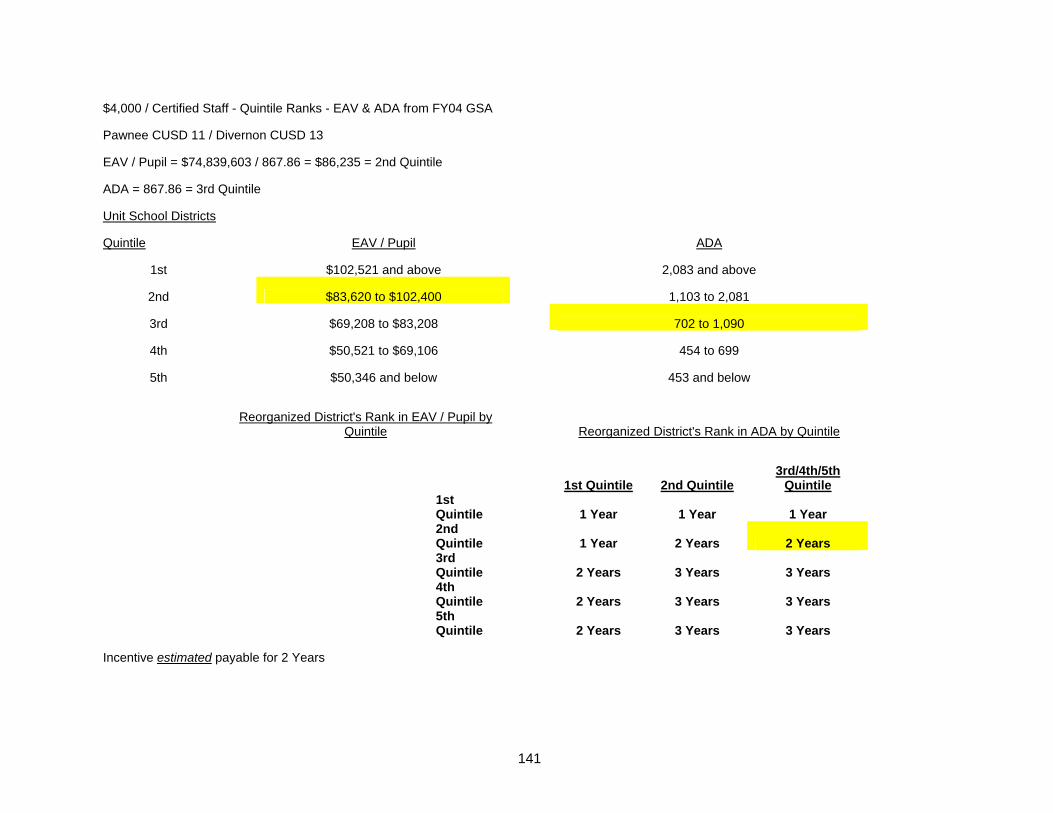
141
$4,000 / Certified Staff - Quintile Ranks - EAV & ADA from FY04 GSA
Pawnee CUSD 11 / Divernon CUSD 13
EAV / Pupil = $74,839,603 / 867.86 = $86,235 = 2nd Quintile
ADA = 867.86 = 3rd Quintile
Unit School Districts
Quintile EAV / Pupil ADA
1st $102,521 and above 2,083 and above
2nd $83,620 to $102,400 1,103 to 2,081
3rd $69,208 to $83,208 702 to 1,090
4th $50,521 to $69,106 454 to 699
5th $50,346 and below 453 and below
Reorganized District's Rank in EAV / Pupil by
Quintile Reorganized District's Rank in ADA by Quintile
1st Quintile 2nd Quintile 3rd/4th/5th
Quintile
1st Quintile 1 Year 1 Year 1 Year
2nd Quintile 1 Year 2 Years 2 Years
3rd Quintile 2 Years 3 Years 3 Years
4th Quintile 2 Years 3 Years 3 Years
5th Quintile 2 Years 3 Years 3 Years
Incentive estimated payable for 2 Years
142
Reorganization and Incentive Payments
General State Aid Difference Payment (Section 18-8(A)(5)(m) of the School Code)
Qualifying for this payment are new school districts formed by combining property within two or
more previously existing districts under Article 11A or 11B and school districts which annex all of the
territory of one or more other school districts under Article 7 or 7A. For example, if the general state aid
is less for the newly consolidated district in the first year than the general state aid would have been that
same year on the basis of the previously existing districts, a supplementary payment equal to the
difference shall be made for the first four years to the new district. For reorganizations, if the state aid is
less for the reorganized district or for the first year in which reorganization is effective than in that same
year on the basis of the original districts as constituted prior to the reorganization, then a supplementary
payment equal to the difference shall be made for the first four years to the reorganized district. Also
eligible for this payment are the new elementary districts and the new high school district formed under
Article 11D, if these new districts qualify for less state aid than would have been payable to the
previously existing districts.
For an 11A consolidation, an Article 7 annexation, dissolution from Article 7-2a, or an Article 11-
D unit district conversion formed from the existing districts. The newly consolidated district would
receive $-0- in additional General State Aid over the next four school years if the reorganization had
been passed by a majority of voters in each affected district. This figure has been received from the
Department of Finance from the Illinois State Board of Education. While the actual state aid would
change from year to year, it is reasonable to assume that an increasing amount would be received from
the combined state aid each year for the existence of the new school district. However, because the
newly reorganized school district is receiving a incentive for the equalization of General State Aid, this
indicates that after the period of the four years of the GSA equalization a newly reorganized district
would receive less GSA notwithstanding any increases in the Foundation Level as approved annually
the Illinois General Assembly. ISBE estimates that $2.26 is the amount of GSA increased annually by
the new district. This amount of GSA will be received by the newly reorganized district for four years.

143
Teacher Salary Difference Payment (Section 18-8.2 of the School Code)
The state will make a supplementary payment for four years to the district formed under Article
11A or 11B, equal to the difference between the sum of the salaries earned by each certified member of
the new district while employed in one of the previously existing districts, and the sum of the salaries
those certified members would have been paid if placed on the salary schedule of the previously
existing district with the highest salary schedule. The salaries used in these calculations are those in
effect in each of the previously existing districts on June 30, prior to the creation of the new district. The
state will make a supplementary payment for four years to newly reorganized districts, equal to the
difference between the sums of the salaries earned by each certified member of the previous district, as
they would have been paid if placed on the salary schedule of the newly enlarged district. The salaries
used in these calculations are those in effect in the previous districts on June 30 prior to the effective
date of the reorganization.
By calculating the average salaries of current certified staff members in the new district, an
estimate of $156,728 per year is calculated. Therefore, over a four-year period approximately $626,912
should be received in the certified salary differential from ISBE. It should be noted that these figures are
based upon “average” salaries prior to a successful reorganization. The “actual” salary figures are
based upon a teacher-by-teacher comparison with salaries from previous and current school district
salary schedule placement in a newly reorganized district.
Deficit Difference Payment (Section 18-8 8.3 of the School Code)
Eligible for this payment are new school districts formed by combining property within two or
more previously existing districts under Article 11A or 11B and school districts which annex all of the
territory of one or more entire other districts under Article 7 or 7A. The payment is made once and is
equal to the difference between the larger and smaller deficits. If more than two districts are involved,
the payment is equal to the sum of the differences between the smallest deficit and each of the other
deficits. Based on the method set forth in Section 18-8.3(c), deficits are calculated by totaling the

144
audited fund balances in the educational fund, the working cash fund, the operations and maintenance
fund, and the transportation fund for each previously existing district or each of the annexing and
annexed districts, as the case may be. A district with a combined fund balance that is positive will be
considered to have a deficit of zero. The calculation is based on the year ending June 30 prior to the
referendum for the creation of the new district, or in the case of annexation under Article &, the June 30
prior to the date that the annexation is approved by the regional board of school trustees. New
elementary and high school districts formed under Article 11D are also eligible for the deficit difference
payment and the payment shall be allocated among these newly formed districts, as provided for in the
petition for the formation of such districts. House Bill 2638, passed in the summer legislative session of
1994 has altered the formula for Deficit Difference Payments in the following manner:
“For purposes of determining each district’s audited fund balances, a calculation
shall be made for each fund to determine the average for the three years prior to the
specified year ending June 30 in subsections (a), (b), (c) of the district’s expenditures in
the categories: purchased services, supplies and materials, and capital outlay as those
categories are defined by the Illinois State Board of Education. If the three-year
average is less than the district’s expenditures in these categories for the specified year
ending June 30 as provided in subsection (a), (b), (c), then the three-year average shall
be used in calculating the amounts payable under this Section in place of the amounts
shown in these categories for the specified year ending June 30 as provided in
subsections (a), (b), and (c).”
For purposes of calculating an approximate incentive for a newly formed district encompassing
the districts involved in this study, fund balances were taken from the 2004 Annual Financial Report for
the following funds: Education, Operations, Building and Maintenance, Transportation, and Working
Cash. All six districts involved in the estimates had positive combined Fund Balances for the year
ended 6/30/04. Therefore, since one of these districts, Divernon, has a negative overall balance, there
would be a deficit balance reorganization incentive payment of $345,185.

145
$4,000 Payment for Certified Employee (Section 18-8.5)
At the end of the first three school years, an annual supplementary state aid reimbursement shall
be paid to a reorganized district equal to the sum of $4,000 for each certified employee who is employed
by the new District on a full-time basis for the regular term of such school year. The state payment shall
be made within 60 days after the end of the first, second, and third year of the reorganized district.
Reorganized districts qualifying for this payment include: new school districts formed under Article 11A
and 11B, new elementary districts formed under Article 7A, one or more annexing districts following the
annexation of all the territory of one or more entire school districts, but only if an annexing district
acquires at least 30 percent of the Average Daily Attendance of the district being dissolved, school
districts formed under Article11D.
HB2638 also changed the formula for a newly reorganized district to receive this incentive in the
following manner: "The State Board of Education will make a one-time calculation of a reorganized
district Quintile Ranks. The average daily attendance used in this calculation shall be the best three
months' average daily attendance for the district's first year. The equalized assessed value per pupil
shall be the district's real property equalized assessed value used in calculating the district's first year
General State Aid Claim divided by the best 3 months average daily attendance.
Therefore, since this calculation will now be made during the newly reorganized district's first
year of existence, it is impossible to predict before the consolidation. However, based upon the current
district quintile ranks in 2004-2005, a newly consolidated district would be eligible for two payments of
$4,000 per certified teacher at the end of the first two years of the newly consolidated district’s
existence. Certified staff of a newly consolidated district would be approximately 74 certified staff x
$4,000 per year = $296,000 in a two year period following the successful reorganization.
Summary of Reorganization Incentives
The General State Aid incentive would result in $-0- increase of GSA. This amount is based
upon estimated calculations of General State Aid. These incentive payments are payable to the new
district for the first four years of their reorganization. General State for the six districts AFTER
146
reorganization = $986,420.36. Sum of General State Aid for the two districts as INDIVIDUAL districts =
$986,418.10. The reorganized district is estimated to receive $49.64, MORE GSA and $47.38 LESS in
the GSA Supplemental Poverty Grant than as individual districts. Therefore, the combined GSA
represents a net gain of $2.26 in less state aid annually after the period of the state incentives ends after
the initial four years of the newly reorganized district.
The certified staff salary difference payment would depend upon the staff of the newly
reorganized district. Essentially, the certified staff of the two unit districts would be placed upon a new
collectively bargained salary schedule. The estimated amount the newly reorganized district would
receive for the four years is $626.912. These numbers are taken from the Fall 2005 Public Certified
Staff in full-time equivalents with pupil/staff ratios. In this incentive, theoretically all of the districts
participating in the study would be increasing staff salaries to bring them to the level of the highest
salary schedule, that of Pawnee. Please keep in mind that all collective bargaining agreements are
dissolved in a newly reorganized district and must be renegotiated with the new certified/non-certified
staff. However, it is hard to conceptualize any eventuality that would preclude the other district from
beginning at the point of the most current Pawnee salary schedule for their negotiations. Individual
costs to bring the teachers to the Pawnee salary schedule are listed on the ISBE estimates which are
included at the end of this chapter. It must be remembered that after four years, the newly reorganized
district would have to be ready to absorb the increased labor costs for their certified and non-certified
employees. There are no estimates of the costs for non-certified employees from ISBE but it can only
be concluded that their salaries would also escalate to the point of the Pawnee non-certified staff level.
Having listed the costs of the salary differential, there would be savings incurred by the newly
reorganized district in coalescing the certified and non-certified staff of the districts. Certainly, there
would be substantial savings in the central office staff and administration of the districts. There will
undoubtedly be other staff reductions, especially in the high school staff, as both districts are providing a
duplicated high school program. It is the opinion of the consultant that staff salary savings by
duplication can make up or exceed the differences necessary to bring certified and non-certified staff to

147
the Pawnee salary level. It will be up to the new Board of Education to make these determinations for
staffing levels for the newly reorganized district.
The $4,000 per certified staff members (74) of the districts would be approximately $592,000.
This incentive may be paid for up to three years based on the reorganized districts rank in EAV Per
Pupil and ADA. Payment(s) will start after the first year of reorganization and is flexible from year to
year depending on the number of certified staff. The newly reorganized district is eligible for two of
these incentive payments. These funds that are received are unrestricted and may be utilized as the
newly reorganized district feels is in their best interests.
There would be a debt difference payment based upon the audited fund balances of 2004-2005
and an average of certain expenditures in the funds utilized in the debt difference calculation.
Reorganization Incentives
• General State Aid Difference = $-0- over the first four years of the new district
• Certified Staff Salary Difference = $626,912 over the first four
years of the new district
• $4,000 per Certified Staff Member = $592,000 at the end of the first year and second year of the newly consolidated district ($296,000 each year).
• Debt Difference = 345,185 to be received immediately after the
creation of the newly consolidated district.
• Total Over Four Years: $1,564,097
Impact on School Finances Through Differential in District’s Taxing Authority: Dual Districts to Units
A major deterrent to school district reorganization for dual districts is inequity of permissive
taxing authority applicable to the different types of school districts in Illinois. These permissive rates
are established by state law and limit certain taxes that a school district can levy without passage of a
referendum. The permissive tax rates for elementary and high school districts are the same but when
added together exceed the permissive tax rates of unit districts.
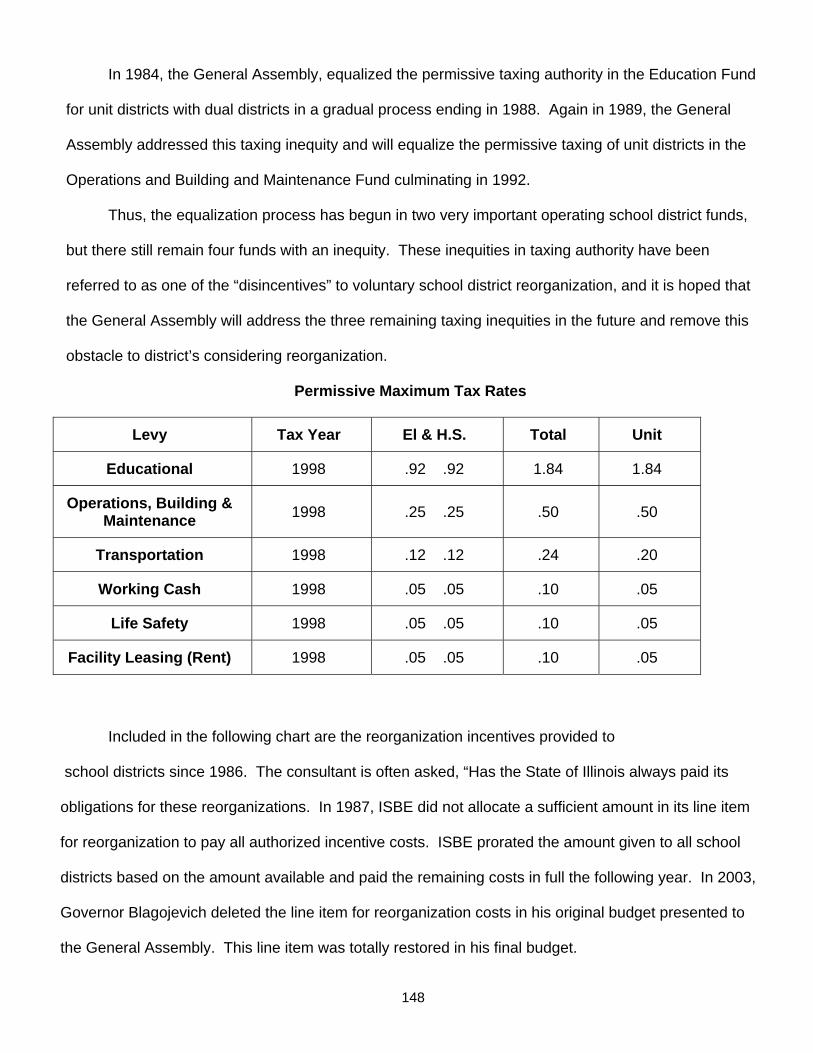
148
In 1984, the General Assembly, equalized the permissive taxing authority in the Education Fund
for unit districts with dual districts in a gradual process ending in 1988. Again in 1989, the General
Assembly addressed this taxing inequity and will equalize the permissive taxing of unit districts in the
Operations and Building and Maintenance Fund culminating in 1992.
Thus, the equalization process has begun in two very important operating school district funds,
but there still remain four funds with an inequity. These inequities in taxing authority have been
referred to as one of the “disincentives” to voluntary school district reorganization, and it is hoped that
the General Assembly will address the three remaining taxing inequities in the future and remove this
obstacle to district’s considering reorganization.
Permissive Maximum Tax Rates
Levy Tax Year El & H.S. Total Unit
Educational 1998 .92 .92 1.84 1.84
Operations, Building & Maintenance 1998 .25 .25 .50 .50
Transportation 1998 .12 .12 .24 .20
Working Cash 1998 .05 .05 .10 .05
Life Safety 1998 .05 .05 .10 .05
Facility Leasing (Rent) 1998 .05 .05 .10 .05
Included in the following chart are the reorganization incentives provided to
school districts since 1986. The consultant is often asked, “Has the State of Illinois always paid its
obligations for these reorganizations. In 1987, ISBE did not allocate a sufficient amount in its line item
for reorganization to pay all authorized incentive costs. ISBE prorated the amount given to all school
districts based on the amount available and paid the remaining costs in full the following year. In 2003,
Governor Blagojevich deleted the line item for reorganization costs in his original budget presented to
the General Assembly. This line item was totally restored in his final budget.

149
Reorganization Incentives:
FY 1986 $1,361,511
FY 1987 $859,764
FY 1988 $1,767,794
FY 1989 $8,144,705
FY 1990 $9,531,341
FY 1991 $6,000,000
FY 1992 $6,000,000
FY 1993 $8,400,000
FY 1994 $17,669,000
FY 1995 $14,785,497
FY 1996 $14,075,596
FY 1997 $9,116,918
FY 1998 $6,030,925
FY 1999 $3,970,770
FY 2000 $3,608,208
FY 2001 $3,177,269
FY 2002 $3,484,142
FY 2003 $1,522,906
FY 2004 $880,027
Totals $120,386,373

150
Projections for Five Years
Five-year financial projections for K12 education are known to be, at best, a guess after the first
year but the projections are necessary to see trends based on certain assumptions. The five-year
assumptions that are made are based on local, state, and federal information received at the time of this
study. The author would recommend that readers of this study view projections as an intelligent
estimate of future fund balances based upon past fund balances notwithstanding a myriad of factors
which could in effect change the projections.
Districts/Fund Balance History Included in this projection, is the history of the past three years of budget
balances and the percent and amount of increase/decrease over this three year span. This percent and
amount is then utilized to project future budget balances based upon the budget history of the Districts.
DISTRICTS FUND BALANCE HISTORY
2001/2002 Pawnee CUSD #11
Educ Fund O & B Transp.
Fund Working Cash Total Fund Balance 1003799 1294 9092 389769 1403954 Divernon CUSD #13
Educ Fund O & B Transp.
Fund Working Cash Total Fund Balance -33781 -2031 45909 9928 20025Fund Balance-Pg 8 970,018 (737) $ 55,001 $ 399,697 $ 1,423,979
2002/2003 Pawnee CUSD #11
Educ Fund O & B Transp.
Fund Working Cash Total Fund Balance 484227 7564 60748 412975 965514 Divernon CUSD #13
Educ Fund O & B Transp.
Fund Working Cash Total Fund Balance -229716 -17550 70825 20656 -155785Fund Balance-Pg 8 254,511 (9,986) $ 131,573 433,631 $ 809,729

151
2003/2004 Pawnee CUSD #11
Educ Fund O & B Transp.
Fund Working Cash Total Fund Balance 814937 130079 148060 450242 1543318 Divernon CUSD #13
Educ Fund O & B Transp.
Fund Working Cash Total Fund Balance -379743 -45180 120392 494 -304037Fund Balance-Pg 8 $ 435,194 84,899 $ 268,452 450,736 $ 1,239,281
2004/2005 Pawnee CUSD #11
Educ Fund O & B Transp.
Fund Working Cash Total Fund Balance 939895 113556 113168 477793 1644412 Divernon CUSD #13
Educ Fund O & B Transp.
Fund Working Cash Total Fund Balance -644680 -67476 137474 13001 -561681Fund Balance-Pg 8 $ 295,215 46,080 $ 250,642 490,794 $ 1,082,731 Amount of Incr/Decr $ (674,803)
46,817 $ 195,641 91,097 $ (341,248)
% Incr/Decr -70% 6352% 356% 23% -24% The above numbers have not been adjusted for change in tax distribution that began in 03/04.
PROJECTION Educ Fund O & B Transp. Fund Working Cash Total 25% -5% -5% -3% 2003/2004 $ 435,194 $ 84,899 $ 268,452 $ 450,736 $ 1,239,281 2004/2005 $ 295,215 $ 46,080 $ 250,642 $ 490,794 $ 1,082,731 2005/2006 $ 221,411 $ 48,384 $ 263,174 $ 505,518 $ 1,038,487 2006/2007 $ 166,058 $ 50,803 $ 276,333 $ 520,683 $ 1,013,878 2007/2008 $ 124,544 $ 53,343 $ 290,149 $ 536,304 $ 1,004,340 2008/2009 $ 93,408 $ 56,011 $ 304,657 $ 552,393 $ 1,006,468

152
Comments on Projections from previous balances
At this point, the consultant should make some comments on these projections for the reader.
• The education fund for the districts as a whole is currently very static annually. In fact,
both are in a slight downward mode as far as these balances. Nevertheless, this all-
important fund, which constitutes normally, 75% of revenue and expenditures overall, is
expected to reduce its balances annually. The reader needs to keep in mind that
immediately after a successful reorganization, there will be an influx of new revenue in the
form of state incentives which are temporary and not to be considered permanent.
• Both of the districts in this study appear to have more fiscal stress in the OBM fund than
the other major operating funds. There appears to be moderate to significant reductions
in budget balances in this fund. The OBM fund has only one source of revenue, that
being, the local levy. Therefore, the OBM fund is normally the fund that has the most
trouble generating enough revenue to pay its normal expenditures. Many districts utilize
unrestricted General State Aid to supplement local levies to maintain positive budget
balances. Successful local referenda rate increases in the OBM are inconsistent and
rarely successful statistically.
• In the Transportation fund, the budget balances are currently moderate and in a more or
less stable budget balance position historically. The districts studied have balances and
are slightly decreased annually and the balances accrued should keep the districts in a
positive position for the near future. In the transportation fund, the state reimbursement
allows almost all districts in Illinois to remain in a relatively stable position. However, the
State of Illinois, has in the recent past “pro-rated” its required reimbursement level of 80%
for many of the recent years or failed to reimburse districts for authorized expenditures in
the proper fiscal year.

153
• The Working Cash Fund is different in that it has two sources of revenue. An annual $.05
levy and the sale of bonds up to the limit of 85% of the Education Fund extension plus
85% of a district’s CPPRT. Of the districts in this study, Pawnee levies for Working Cash
and allows the balance to accumulate with the interest transferred annually. Divernon
also levies for Working Cash and abolishes the balance into the Education Fund annually.
Tax Rates Necessary to Maintain Current Tax Revenue for Sangamon County District
TAX RATES NECESSARY TO MAINTAIN CURRENT TAX REVENUE Combined
EAV Maintained Tax Rate
Using Projected Tax Rate
(Ed. OBM, TR)
Resulting Combined
Tax Revenue
Estimated Combined EAV
(repeated)
Necessary Tax Rate of Combin
ed District
To Achieve Maintained Combined
Tax Revenue as Reported for
FY2004
2001-2002 $75,968,067 2.6506 $2,013,642 75968067 2.651 $2,013,642 2002-2003 $74,872,171 2.6506 $1,984,594 74872171 2.651 $1,984,594 2003-2004 $75,467,909 2.6506 $2,000,384 75467909 2.6506 $2,000,384 2004-2005 $73,673,135 2.6506 $1,952,811 73673135 2.715 $2,000,384 Estimated 2005-2006 $72,936,404 2.6506 $1,933,283 72936404 2.743 $2,000,384 2006-2007 $73,665,768 2.6506 $1,952,616 73665768 2.715 $2,000,384 2007-2008 $74,402,425 2.6506 $1,972,142 74402425 2.689 $2,000,384 2008-2009 $75,146,450 2.6506 $1,991,864 75146450 2.662 $2,000,384
EAV figures a 1% reduction for 2005-06. 2006 to 2009 figures a 1% annual EAV increase This is due to the cyclical nature of farm land valuation. This chart depicts the necessary combined rate to generate the same dollars generated in 2003/2004. As you can see the rate would have had to increase in 2004/2005 to 2.715 because the EAV decreased. Presently, Pawnee levies 1.84 in Education, .50 in O&M, and .20 in Transportation, which is the maximum without referendum, for a total of 2.54. Divernon levies 2.20 in Education, .525 in O&B, and .20 in Transportation for a total rate of 2.925. Divernon has passed a referendum, which allowed them to levy above the maximum and even with these higher rates, they have been unable to balance their budget. Pawnee has had to increase class sizes, decrease supply purchases, and have been unable to expand course offerings in order to balance their budget.

154
In summary, maintaining the same dollars generated in 03/04 will not be enough to allow either district to meet the needs of their students.
Comments about tax rates, EAV, estimations
This chart will look at local revenue and the taxes necessary to generate the same
amount of revenue. The tax rate utilized is the Projected Tax Rate determined in this study to generate
similar amounts of revenue in the Education, OBM, and Transportation funds.
• The EAV of the Sangamon County districts studied are rising at a moderate rate of
approximately 4.9%. This moderate increase in EAV is a normal occurrence in Central
Illinois.
• Concurrent with the moderate increase in EAV is the increase in local funds generated by
the increase in EAV. Therefore, with the increase in EAV a decreased tax rate is
necessary to generate the same amount of revenue. It is assumed however, that the
school districts will annually utilize its authorized rates to raise increased amounts of
revenue.
155
SCHOOL DISTRICT REORGANIZATION HISTORY 1983-84 TO 2003-04
During the last twenty years, many school districts in Illinois have changed the size
of the geographic area that they serve and in the manner in which they are organized.
Although today, it seems that Illinois has an extremely large number of districts, it should be
remembered that a few decades ago, this state had an even larger number of districts.
Before the end of the Second World War, Illinois had nearly 12,000 school districts.
Through an evolutionary process, that number has decreased to the point where the current
number of school district in Illinois is 889.
During the early 1980’s the concept and problems dealing with school district
reorganization were extensively studied by ISBE and others not only in Illinois but
throughout the USA. In 1983, the first three “financial incentives” were offered to school
districts that reorganized. They included incentive money that guaranteed the equalization
of salaries of all full-time certified staff of a newly reorganized district for three (now four)
years. General State Aid was “held harmless”, in that a duplicate calculation was made by
ISBE for the initial three (now four) years of a newly reorganized district. If General State
Aid was calculated to be a higher amount separately than a newly reorganized district, the
best of the calculations were given to the district for three (now four) years. The third
incentive was a one-time payment to a newly reorganized district to erase the “operational
deficit” of combining districts. Over the years this has evolved into a complicated formula
that essentially allows combining districts to start with at least a “zero deficit” in its major
operating funds. Lastly, in 1985, the so-called $4,000 incentive was enacted by the General
Assembly. This incentive guaranteed an annual payment of $4,000 per full-time certified
staff member for a period of from one to three years based upon a formula called the
156
“quintile system” which essentially gives more payments to smaller, poorer in EAV per
student districts that reorganize.
There has been increasing emphasis in recent years on reducing the total number of
school districts and on increasing the geographic area served by districts in order to
increase district’s student enrollment and gain economic efficiency. In May of 1985, the
State Board of Education published a study on school district organization. The report
found that there was evidence that student’s “in the hundreds of very small districts were
receiving a significant loss in opportunity to learn when the courses available to them are
compared with those available in students in high schools with enrollments of over 500
pupils.” That study concluded that the current system of organization meant that “uniform
access to both adequate financial support and reasonable educational quality is not
permitted by the present organization of our school districts.”
Public Act 84-126 made sweeping changes and mandated the school reorganization
of many smaller districts into larger districts through an elaborate set of procedures.
However, due in no small part to tremendous political pressure, shortly after that law was
passed, the General Assembly modified the law by Public Act 84-115 which became
effective, March 20, 1986. That law effectively eliminated the mandatory reorganization
procedures which had been created by the earlier law. One of the requirements of the
original law however was that each Regional Office of Education conduct a “required study
of reorganization.” It is with this beginning that currently ISBE awards districts interested in
studying reorganization a payment for a feasibility study.
Notwithstanding the General Assembly amendment which caused Illinois to step back
from mandated reorganization, there still exists strong interest and concern about what has
come to be called “school consolidation.” This article will deal briefly with some of the major
issues involved in reorganization, how it has evolved in Illinois since 1983 and to highlight

157
some of the issues to be analyzed and the strategies which can be developed when the
opportunity and challenge of school district reorganization arises in Illinois. As a consultant
that discusses consolidation with a great many school boards, I am often asked about the
financial incentives and their reliability. With two exceptions, one in 1996 in which the ISBE
line item was not sufficient to pay all of the incentives for that year and last year in which the
incentives were entirely eliminated by the Governor then later restored, the financial
incentives have played a significant role in districts considering consolidation. The following
chart indicates that since 1986, $120, 376, 373 were spent as incentives for school district
reorganization. *
Legislation since 1983 has removed many of the “disincentives” discouraging
reorganization. Included in those disincentives are the equalization of taxing power of dual
districts in the education and building fund. However, “disincentives” continue to exist in the
transportation, working cash, life safety and lease fund authorized levies for dual districts as
compared to a unit district. The following chart will illuminate some of the existing taxing
“disincentives.” **
While the mandated avenue of reorganization at the state level has met with a great
deal of resistance by the local school districts, the legislature and ISBE has attempted to
encourage further reorganization by enacting legislation favorable to districts contemplating
reorganization and increasing the time that financial incentives are available for newly
combined districts. This variety of methods has sparked a renewed interest with generally
smaller unit districts in dealing with their sparse high school populations and also small
districts in general are looking at reorganization simply because the “economy of size” has
caught up with their districts and they are finding it increasingly more difficult to fund the
quality education of their students in an equitable and efficient manner. The following chart

158
indicates the general requirements and allowable methods for school district reorganization
currently. ***
In any discussion of the variety of methods that are currently available in Illinois for
consolidation, the methods have shown a continued strong interest and support by ISBE
and the General Assembly to encourage school district to consider school district
consolidation. Over the last twenty years, there have several task forces discussing
reorganization culminating with EFAB of 2003 in which sweeping changes were
recommended. With this variety of methods, there exists a veritable “potpourri” of allowable
methods for all three kinds of school districts. The following chart indicates the pace and
choices for reorganization in Illinois since 1983. ****
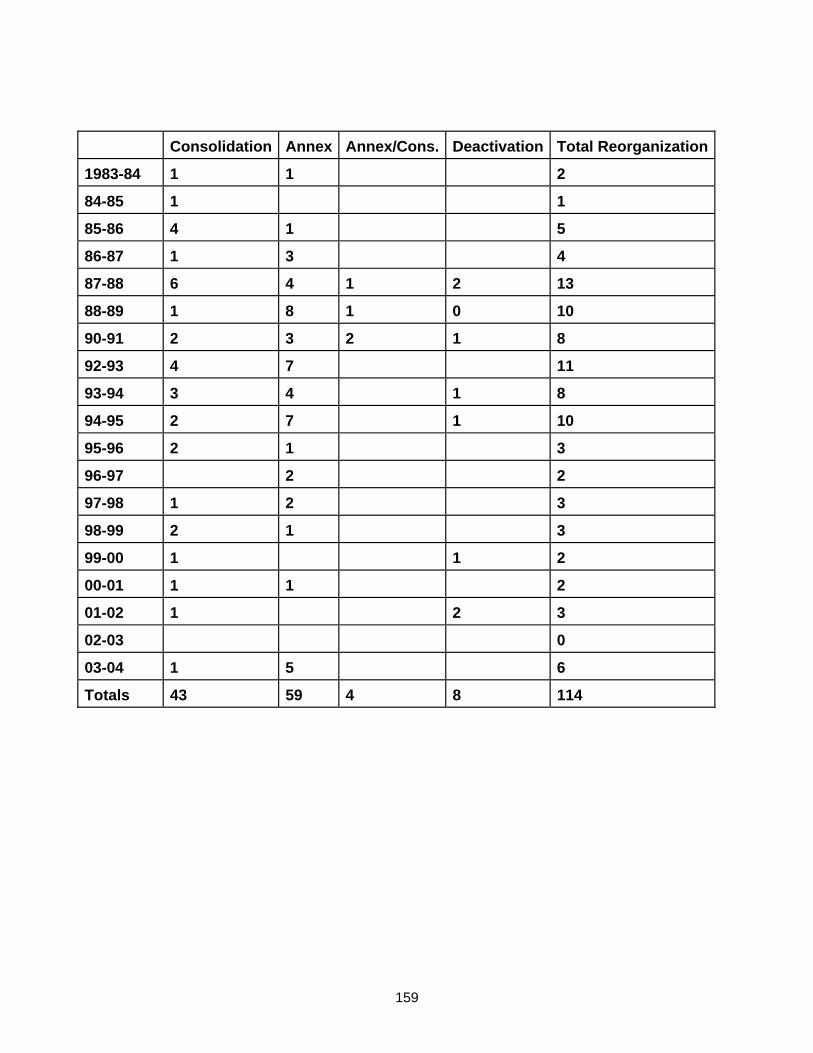
159
Consolidation Annex Annex/Cons. Deactivation Total Reorganization
1983-84 1 1 2
84-85 1 1
85-86 4 1 5
86-87 1 3 4
87-88 6 4 1 2 13
88-89 1 8 1 0 10
90-91 2 3 2 1 8
92-93 4 7 11
93-94 3 4 1 8
94-95 2 7 1 10
95-96 2 1 3
96-97 2 2
97-98 1 2 3
98-99 2 1 3
99-00 1 1 2
00-01 1 1 2
01-02 1 2 3
02-03 0
03-04 1 5 6
Totals 43 59 4 8 114

160
Effective Type of Annexed To or New School District Dissolved Date County Reorganization School District Formed or Deactivated
7-1-83 Iroquois Consolidation Iroquois West CUSD 10 Onarga CUSD 1
Gilman-Danforth CUSD 2
8-1-83 Bureau Annexation Princeton Twp HSD 500 Malden HSD 511
Number of Reorganizations Number of School Districts Consolidation……………. 1 Elementary………….. 435 1983-84 Totals: Annexation………………. 1 Secondary……………. 125 Annexation/Conversion…. 0 Unit…………………… 447 Deactivation…………….. 0 DOC………………….. 1 Total…………………….. 2 Total………………….. 1,008 7-1-84 Christian Consolidation South Fork SD 14 Kincaid SD 182
Tovey SD 183
South Fork 310 Number of Reorganizations Number of School Districts Consolidation……………. 1 Elementary………….. 433 1984-85 Totals: Annexation………………. 0 Secondary……………. 124 Annexation/Conversion…. 0 Unit…………………… 448 Deactivation…………….. 0 DOC………………….. 1 Total…………………….. 1 Total………………….. 1,006 7-1-85 JoDaviess Consolidation River Ridge CUSD 210 Elizabeth CUSD 208
Hanover CUSD 212
7-1-85 DeWitt/ Consolidation Blue Ridge CUSD 18 Farmer City/Mansfield CUSD 17
McLean Bellflower CCSD 88
Bellflower Twp HSD 311
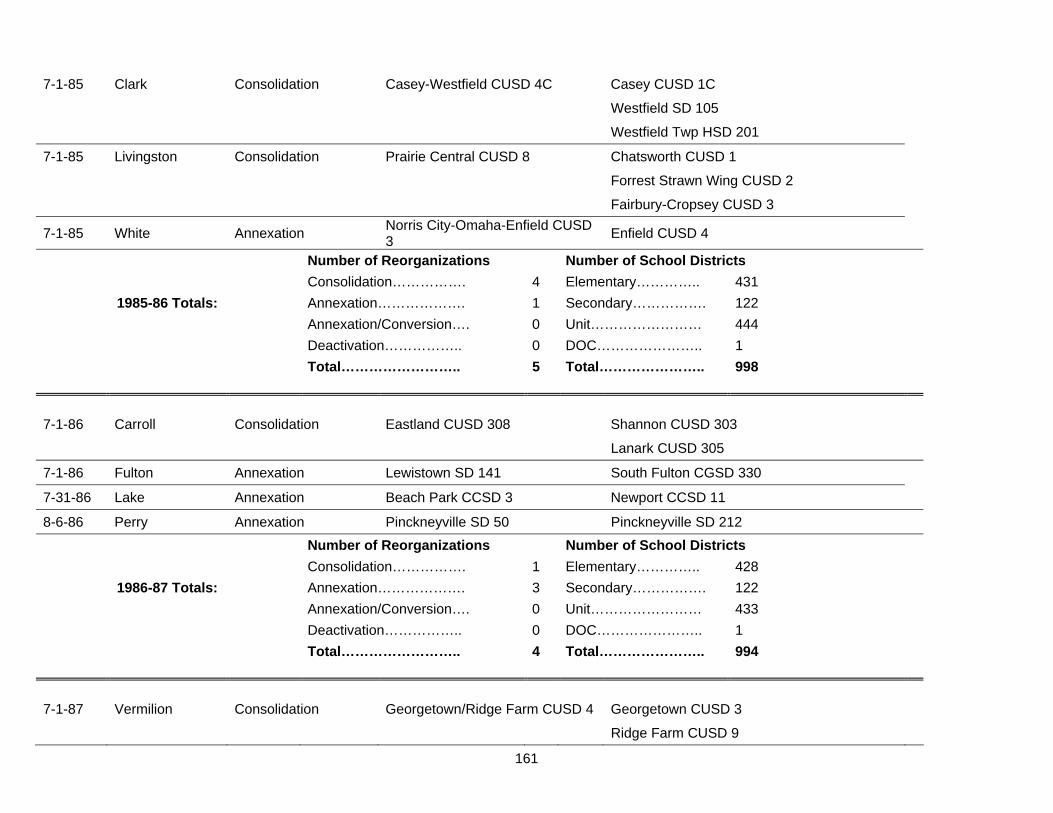
161
7-1-85 Clark Consolidation Casey-Westfield CUSD 4C Casey CUSD 1C
Westfield SD 105
Westfield Twp HSD 201
7-1-85 Livingston Consolidation Prairie Central CUSD 8 Chatsworth CUSD 1
Forrest Strawn Wing CUSD 2
Fairbury-Cropsey CUSD 3
7-1-85 White Annexation Norris City-Omaha-Enfield CUSD 3 Enfield CUSD 4
Number of Reorganizations Number of School Districts Consolidation……………. 4 Elementary………….. 431 1985-86 Totals: Annexation………………. 1 Secondary……………. 122 Annexation/Conversion…. 0 Unit…………………… 444 Deactivation…………….. 0 DOC………………….. 1 Total…………………….. 5 Total………………….. 998 7-1-86 Carroll Consolidation Eastland CUSD 308 Shannon CUSD 303
Lanark CUSD 305
7-1-86 Fulton Annexation Lewistown SD 141 South Fulton CGSD 330
7-31-86 Lake Annexation Beach Park CCSD 3 Newport CCSD 11
8-6-86 Perry Annexation Pinckneyville SD 50 Pinckneyville SD 212 Number of Reorganizations Number of School Districts Consolidation……………. 1 Elementary………….. 428 1986-87 Totals: Annexation………………. 3 Secondary……………. 122 Annexation/Conversion…. 0 Unit…………………… 433 Deactivation…………….. 0 DOC………………….. 1 Total…………………….. 4 Total………………….. 994 7-1-87 Vermilion Consolidation Georgetown/Ridge Farm CUSD 4 Georgetown CUSD 3
Ridge Farm CUSD 9
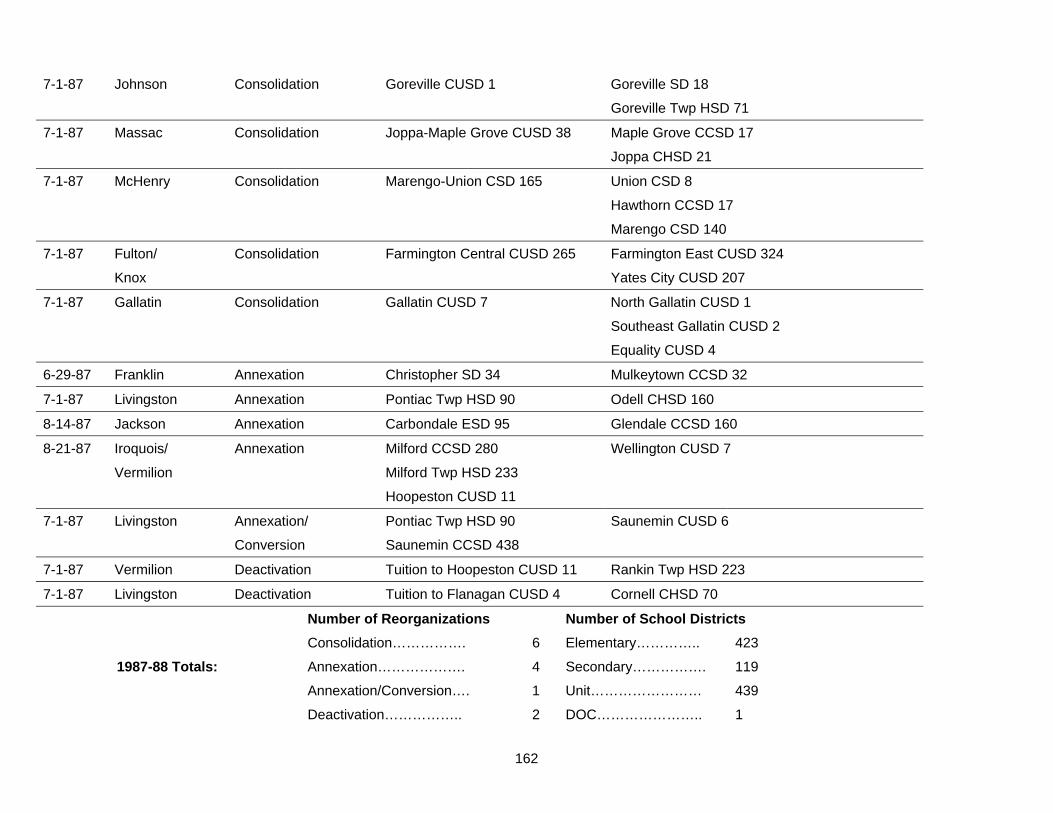
162
7-1-87 Johnson Consolidation Goreville CUSD 1 Goreville SD 18
Goreville Twp HSD 71
7-1-87 Massac Consolidation Joppa-Maple Grove CUSD 38 Maple Grove CCSD 17
Joppa CHSD 21
7-1-87 McHenry Consolidation Marengo-Union CSD 165 Union CSD 8
Hawthorn CCSD 17
Marengo CSD 140
7-1-87 Fulton/ Consolidation Farmington Central CUSD 265 Farmington East CUSD 324
Knox Yates City CUSD 207
7-1-87 Gallatin Consolidation Gallatin CUSD 7 North Gallatin CUSD 1
Southeast Gallatin CUSD 2
Equality CUSD 4
6-29-87 Franklin Annexation Christopher SD 34 Mulkeytown CCSD 32
7-1-87 Livingston Annexation Pontiac Twp HSD 90 Odell CHSD 160
8-14-87 Jackson Annexation Carbondale ESD 95 Glendale CCSD 160
8-21-87 Iroquois/ Annexation Milford CCSD 280 Wellington CUSD 7
Vermilion Milford Twp HSD 233
Hoopeston CUSD 11
7-1-87 Livingston Annexation/ Pontiac Twp HSD 90 Saunemin CUSD 6
Conversion Saunemin CCSD 438
7-1-87 Vermilion Deactivation Tuition to Hoopeston CUSD 11 Rankin Twp HSD 223
7-1-87 Livingston Deactivation Tuition to Flanagan CUSD 4 Cornell CHSD 70
Number of Reorganizations Number of School Districts
Consolidation……………. 6 Elementary………….. 423
1987-88 Totals: Annexation………………. 4 Secondary……………. 119
Annexation/Conversion…. 1 Unit…………………… 439
Deactivation…………….. 2 DOC………………….. 1
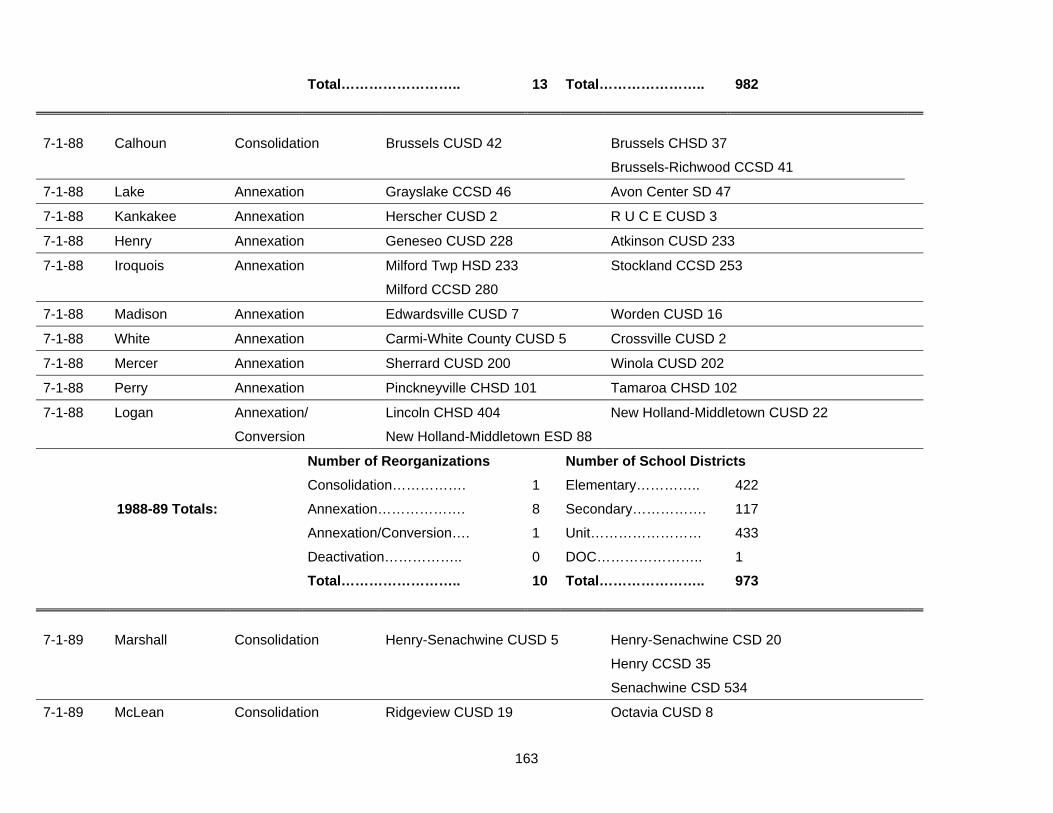
163
Total…………………….. 13 Total………………….. 982 7-1-88 Calhoun Consolidation Brussels CUSD 42 Brussels CHSD 37
Brussels-Richwood CCSD 41
7-1-88 Lake Annexation Grayslake CCSD 46 Avon Center SD 47
7-1-88 Kankakee Annexation Herscher CUSD 2 R U C E CUSD 3
7-1-88 Henry Annexation Geneseo CUSD 228 Atkinson CUSD 233
7-1-88 Iroquois Annexation Milford Twp HSD 233 Stockland CCSD 253
Milford CCSD 280
7-1-88 Madison Annexation Edwardsville CUSD 7 Worden CUSD 16
7-1-88 White Annexation Carmi-White County CUSD 5 Crossville CUSD 2
7-1-88 Mercer Annexation Sherrard CUSD 200 Winola CUSD 202
7-1-88 Perry Annexation Pinckneyville CHSD 101 Tamaroa CHSD 102
7-1-88 Logan Annexation/ Lincoln CHSD 404 New Holland-Middletown CUSD 22
Conversion New Holland-Middletown ESD 88
Number of Reorganizations Number of School Districts
Consolidation……………. 1 Elementary………….. 422
1988-89 Totals: Annexation………………. 8 Secondary……………. 117
Annexation/Conversion…. 1 Unit…………………… 433
Deactivation…………….. 0 DOC………………….. 1
Total…………………….. 10 Total………………….. 973 7-1-89 Marshall Consolidation Henry-Senachwine CUSD 5 Henry-Senachwine CSD 20
Henry CCSD 35
Senachwine CSD 534
7-1-89 McLean Consolidation Ridgeview CUSD 19 Octavia CUSD 8

164
Saybrook-Arrowsmith CUSD 11
7-1-89 Mason Consolidation Illini Central CUSD 189 Easton CUSD 121
San Jose CUSD 122
Mason City CUSD 123
7-1-89 Champaign Consolidation Heritage CUSD 8 ABL CUSD 6
Homer CCSD 208
7-1-89 Marion Consolidation South Central CUSD 401 Kinmundy Alma CUSD 301
LaGrove CUSD 206
8-7-89 Lake Consolidation North Chicago CUSD 187 North Chicago HSD 123
North Chicago Elem 64
####### LaSalle Consolidation Streator ESD 44 Eagle ESD 43
Streator ESD 45
####### Cass Consolidation Ashland-Chandlerville CUSD 262 Chandlerville CUSD 62
Ashland CUSD 212
7-1-89 Carroll Annexation Chadwick CUSD 399 Milledgeville CUSD 312
7-7-89 Ogle Annexation Forrestville Valley CUSD 221 Leaf River CUSD 270
####### Randolph Annexation Chester CUSD 139 Kaskaskia CSD 124
1-1-90 Peoria Annexation Norwood Elem SD 63 Bellevue ESD 152
Number of Reorganizations Number of School Districts
Consolidation……………. 8 Elementary………….. 416
1989-90 Totals: Annexation………………. 4 Secondary……………. 115
Annexation/Conversion…. 0 Unit…………………… 427
Deactivation…………….. 0 DOC………………….. 1
Total…………………….. 12 Total………………….. 959 7-1-90 Ford Consolidation Paxton-Buckley-Loda CUSD 10 Buckley-Loda CUSD 8
Paxton CUSD 2

165
7-1-90 Cook/ Consolidation Lemont-Bromberek CSD 113A Lemont CCSD 113
DuPage Bromberek SD 65
8-6-90 LaSalle Annexation LaSalle-Peru Twp HSD 120 Tonica HSD 360
8-6-90 Grundy/ Annexation Dwight CSD 232 Goodfarm CCSD 35C
Livingston
####### Lake Annexation Fox Lake SD 114 Lotus SD 10
7-1-90 Grundy/ Annexation/ Seneca Twp HSD 160 Mazon-Verona-Kinsman CUSD 2
LaSalle Conversion Mazon-Verona-Kinsman ESD 2C
7-1-90 LaSalle Annexation/ Ottawa Twp HSD 140 Marseilles CUSD 155
Conversion Marseilles ESD 150
7-1-90 Christian Deactivation Tuition to Taylorville CUSD 3 Mt. Auburn CUSD 5 (HS portion)
Number of Reorganizations Number of School Districts
Consolidation……………. 2 Elementary………….. 415
1990-91 Totals: Annexation………………. 3 Secondary……………. 114
Annexation/Conversion…. 2 Unit…………………… 424
Deactivation…………….. 1 DOC………………….. 1
Total…………………….. 8 Total………………….. 954 7-1-91 Mason Consolidation Midwest Central CUSD 191 Forman CUSD 124
Green Valley CCSD 695
Green Valley CHSD 306
6-22-91 Livingston Annexation Allen Twp CCSD 65 Sunbury CCSD 431
Cornell CCSD 426
Dwight CCSD 232
Odell CCSD 435
7-13-91 Stark Annexation Wyoming CCSD 27 Valley CCSD 45
8-9-91 Champaign Annexation Gifford CCSD 188 Penfield CCSD 224

166
Armstrong Ellis CSD 61
Prairieview CCD 192
8-13-91 Wayne/ Annexation New Hope CCSD 6 Mill Shoals CCSD 18
White
8-21-91 Jackson Annexation Trico CUSD 176 Mississippi Valley CUSD 166
Murphysboro CUSD 186
Number of Reorganizations Number of School Districts
Consolidation……………. 1 Elementary………….. 410
1991-92 Totals: Annexation………………. 5 Secondary……………. 113
Annexation/Conversion…. 0 Unit…………………… 423
Deactivation…………….. 0 DOC………………….. 1
Total…………………….. 6 Total………………….. 947 6-1-92 Logan Consolidation West Lincoln-Broadwell CCSD 92 Broadwell CCSD 68
West Lincoln CCSD 72
7-1-92 Christian/ Consolidation Central A & M CUSD 21 Assumption CUSD 9
Shelby Moweaqua CUSD 6A
7-1-92 Marshall/ Consolidation Fieldcrest CUSD 6 Minonk-Dana-Rutland CUSD 108
Woodford Wenona CUSD 1
Toluca CUSD 2
7-1-92 Stark Consolidation Stark County CUSD 100 Toulon-LaFayette CUSD 2
Wyoming CCSD 27
Wyoming CHSD 71
7-1-92 DuPage Annexation West Chicago SD 33 McAuley ESD 27
7-1-92 Mason Annexation Havana CUSD 126 Balyki CUSD 125
7-16-92 Ford Annexation Tri-Point CUSD 6J Ford Central CUSD 8
Iroquois West CUSD 10
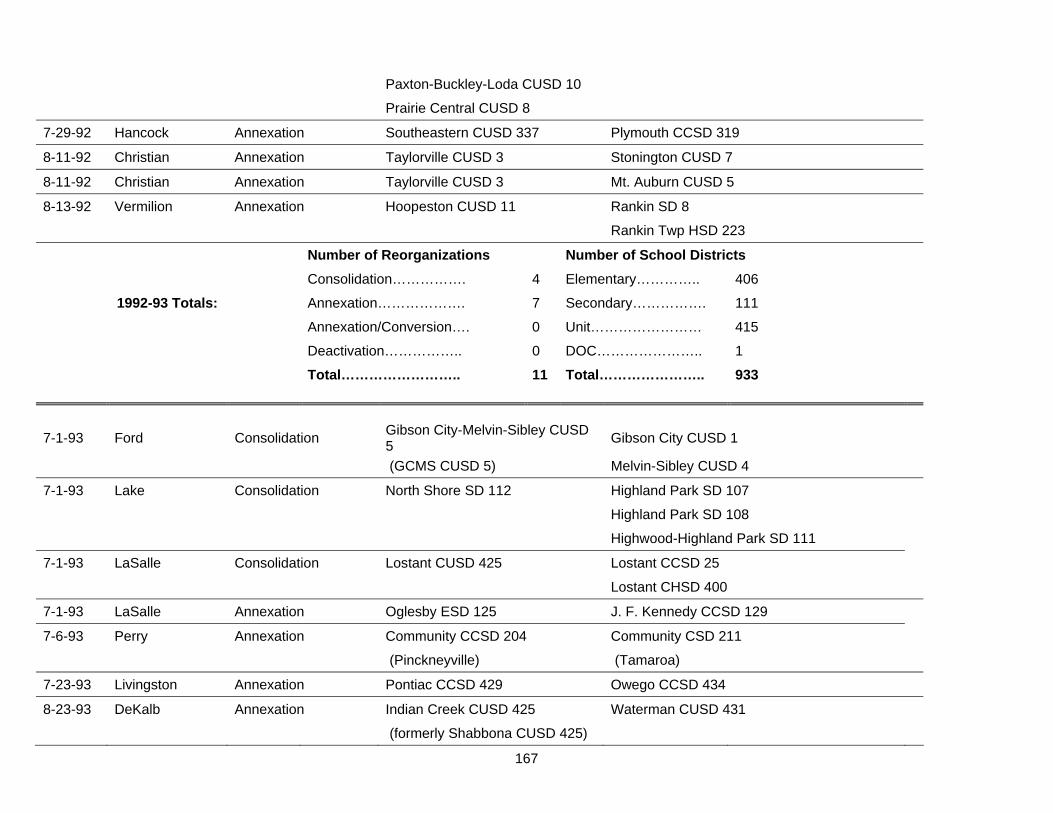
167
Paxton-Buckley-Loda CUSD 10
Prairie Central CUSD 8
7-29-92 Hancock Annexation Southeastern CUSD 337 Plymouth CCSD 319
8-11-92 Christian Annexation Taylorville CUSD 3 Stonington CUSD 7
8-11-92 Christian Annexation Taylorville CUSD 3 Mt. Auburn CUSD 5
8-13-92 Vermilion Annexation Hoopeston CUSD 11 Rankin SD 8
Rankin Twp HSD 223
Number of Reorganizations Number of School Districts
Consolidation……………. 4 Elementary………….. 406
1992-93 Totals: Annexation………………. 7 Secondary……………. 111
Annexation/Conversion…. 0 Unit…………………… 415
Deactivation…………….. 0 DOC………………….. 1
Total…………………….. 11 Total………………….. 933
7-1-93 Ford Consolidation Gibson City-Melvin-Sibley CUSD 5 Gibson City CUSD 1
(GCMS CUSD 5) Melvin-Sibley CUSD 4
7-1-93 Lake Consolidation North Shore SD 112 Highland Park SD 107
Highland Park SD 108
Highwood-Highland Park SD 111
7-1-93 LaSalle Consolidation Lostant CUSD 425 Lostant CCSD 25
Lostant CHSD 400
7-1-93 LaSalle Annexation Oglesby ESD 125 J. F. Kennedy CCSD 129
7-6-93 Perry Annexation Community CCSD 204 Community CSD 211
(Pinckneyville) (Tamaroa)
7-23-93 Livingston Annexation Pontiac CCSD 429 Owego CCSD 434
8-23-93 DeKalb Annexation Indian Creek CUSD 425 Waterman CUSD 431
(formerly Shabbona CUSD 425)

168
7-1-93 LaSalle Deactivation Tuition to: Lostant CUSD 425 (HS portion)
LaSalle-Peru Twp HSD 120
Streator Twp HSD 40
Fieldcrest CUSD 6
Putnam County CUSD 535
Number of Reorganizations Number of School Districts
Consolidation……………. 3 Elementary………….. 400
1993-94 Totals: Annexation………………. 4 Secondary……………. 110
Annexation/Conversion…. 0 Unit…………………… 414
Deactivation…………….. 1 DOC………………….. 1
Total…………………….. 8 Total………………….. 925 7-1-94 Macon Consolidation Meridian CUSD 15 Macon CUSD 5
Blue Mound-Boody CUSD 10
7-1-94 Edgar/ Consolidation Shiloh CUSD 1 Shiloh SD 2
Douglas Newman CUSD 303
7-1-94 DeWitt Annexation Clinton CUSD 15 Wapella CUSD 5
7-1-94 Ogle Annexation Oregon CUSD 220 Mt. Morris CUSD 261
8-9-94 Bureau Annexation Princeton ESD 115 Kasbeer CSD 23
8-12-94 Tazewell Annexation Washington SD 52 Pleasant View CSD 622
8-15-94 Fulton Annexation Canton-Union SD 66 Dunfermline SD 88
8-17-94 Iroquois Annexation Milford CCSD 280 Bryce-Ash Grove CCSD 284
8-17-94 Logan Annexation Chester-E. Lincoln CCSD 61 Beason CCSD 17
7-1-94 Vermilion Deactivation Tuition to Armstrong Twp HSD 225 Potomac CUSD 10 (HS portion)
Number of Reorganizations Number of School Districts
Consolidation……………. 2 Elementary………….. 395
1994-95 Totals: Annexation………………. 7 Secondary……………. 110

169
Annexation/Conversion…. 0 Unit…………………… 410
Deactivation…………….. 1 DOC………………….. 1
Total…………………….. 10 Total………………….. 916 7-1-95 Bureau Consolidation Bureau Valley CUSD 340 Manlius Unit 305
Western Unit 306
Wyanet Elementary 126
Wyanet High School 510
Walnut Elementary 285
Walnut High School 508
7-1-95 Marshall Consolidation Midland CUSD 7 Sparland Unit 3
Mid-County Unit 4
7-1-95 Pike Annexation Griggsville CUSD 4 Perry CHSD 172
Perry SD 57
Number of Reorganizations Number of School Districts
Consolidation……………. 2 Elementary………….. 392
1995-96 Totals: Annexation………………. 1 Secondary……………. 107
Annexation/Conversion…. 0 Unit…………………… 408
Deactivation…………….. 0 DOC………………….. 1
Total…………………….. 3 Total………………….. 908 7-1-96 Bureau Annexation Princeton ESD 115 Tiskilwa CUSD 300
Princeton Twp HSD 500
8-7-96 Whiteside Annexation Prophetstown-Lyndon CUSD 3 Tampico CUSD 4
Number of Reorganizations Number of School Districts
Consolidation……………. 0 Elementary………….. 392
1996-97 Totals: Annexation………………. 2 Secondary……………. 107

170
Annexation/Conversion…. 0 Unit…………………… 406
Deactivation…………….. 0 DOC………………….. 1
Total…………………….. 2 Total………………….. 906 7-1-97 Fulton Consolidation Lewistown CUSD 97 St. David SD 87
Lewistown SD 141
Prichard Clark CESD 340
Lewistown CHSD 341
7-1-97 Montgomery Annexation Hillsboro CUSD 3 Witt CUSD 66
7-1-97 Livingston Annexation Pontiac CCSD 429 Pontiac Esmen CCSD 430
Number of Reorganizations Number of School Districts
Consolidation……………. 1 Elementary………….. 388
1997-98 Totals: Annexation………………. 2 Secondary……………. 106
Annexation/Conversion…. 0 Unit…………………… 406
Deactivation…………….. 0 DOC………………….. 1
Total…………………….. 3 Total………………….. 901 7-1-98 Shelby Consolidation Cowden-Herrick CUSD 3A Cowden-Herrick CCD 11
Cowden-Herrick CHSD 188
7-1-98 Shelby Consolidation Tower Hill CUSD 6 Tower Hill CCSD 10
Tower Hill CHSD 185
7-1-98 LaSalle Annexation Mendota CCSD 289 Ophir CCSD 235
Number of Reorganizations Number of School Districts
Consolidation……………. 2 Elementary………….. 385
1998-99 Totals: Annexation………………. 1 Secondary……………. 104
Annexation/Conversion…. 0 Unit…………………… 408
Deactivation…………….. 0 DOC………………….. 1

171
Total…………………….. 3 Total………………….. 898 7-1-99 Franklin Consolidation Christopher CUD 99 Christopher SD 34
Christopher CHSD 38
7-1-99 Bureau Deactivation Tuition to: Neponset CCD 307 (HS portion)
Bradford CUSD 1
Bureau Valley CUSD 340
Annawan CUSD 226
Kewanee CUSD 229
Wethersfield CUSD 230
Number of Reorganizations Number of School Districts
Consolidation……………. 1 Elementary………….. 384
1999-00 Totals: Annexation………………. 0 Secondary……………. 103
Annexation/Conversion…. 0 Unit…………………… 409
Deactivation…………….. 1 DOC………………….. 1
Total…………………….. 2 Total………………….. 897 7-1-00 McHenry Consolidation Nippersink SD 2 Spring Grove SD 11
Richmond CSD 13
7-1-00 DeKalb Annexation DeKalb CUD 428 Malta CUD 433
Number of Reorganizations Number of School Districts
Consolidation……………. 1 Elementary………….. 383
2000-01 Totals: Annexation………………. 1 Secondary……………. 103
Annexation/Conversion…. 0 Unit…………………… 408
Deactivation…………….. 0 DOC………………….. 1
Total…………………….. 2 Total………………….. 895
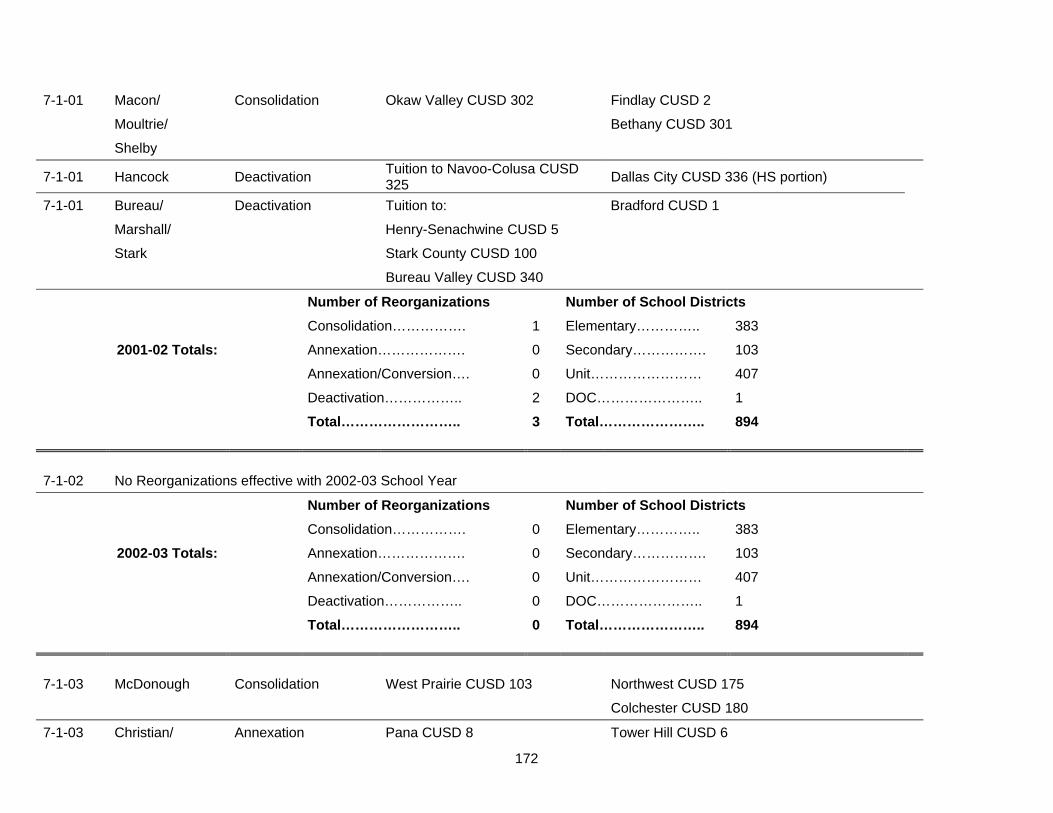
172
7-1-01 Macon/ Consolidation Okaw Valley CUSD 302 Findlay CUSD 2
Moultrie/ Bethany CUSD 301
Shelby
7-1-01 Hancock Deactivation Tuition to Navoo-Colusa CUSD 325 Dallas City CUSD 336 (HS portion)
7-1-01 Bureau/ Deactivation Tuition to: Bradford CUSD 1
Marshall/ Henry-Senachwine CUSD 5
Stark Stark County CUSD 100
Bureau Valley CUSD 340
Number of Reorganizations Number of School Districts
Consolidation……………. 1 Elementary………….. 383
2001-02 Totals: Annexation………………. 0 Secondary……………. 103
Annexation/Conversion…. 0 Unit…………………… 407
Deactivation…………….. 2 DOC………………….. 1
Total…………………….. 3 Total………………….. 894 7-1-02 No Reorganizations effective with 2002-03 School Year
Number of Reorganizations Number of School Districts
Consolidation……………. 0 Elementary………….. 383
2002-03 Totals: Annexation………………. 0 Secondary……………. 103
Annexation/Conversion…. 0 Unit…………………… 407
Deactivation…………….. 0 DOC………………….. 1
Total…………………….. 0 Total………………….. 894 7-1-03 McDonough Consolidation West Prairie CUSD 103 Northwest CUSD 175
Colchester CUSD 180
7-1-03 Christian/ Annexation Pana CUSD 8 Tower Hill CUSD 6

173
Shelby
7-1-03 LaSalle Annexation Waltham CCSD 185 Utica SD 135
7-1-03 LaSalle Annexation Allen Twp CCSD 65 Otter Creek-Hyatt SD 56
7-1-03 Iroquois Annexation Milford CCSD 280 Sheldon CUSD 5
(7-2a(b) Dissolution) Milford Twp HSD 233
Number of Reorganizations Number of School Districts
Consolidation……………. 1 Elementary………….. 381
2003-04 Totals: Annexation………………. 5 Secondary……………. 103
Annexation/Conversion…. 0 Unit…………………… 404
Deactivation…………….. 0 DOC………………….. 1
Total…………………….. 6 Total………………….. 889

174
Interviews
Interviews were conducted with board members from the participating school districts. While a
variety of individuals were interviewed, no effort was made to assure the randomness of the groups or
their representative nature. All interviews were conducted at the school site and by telephone. Each
group was asked similar questions concerning their perceptions and opinions. Individuals within each
group were encouraged to participate and share their opinion. No attempts were made to gain
consensus among the groups’, instead individual opinions were encouraged. Representatives were
asked for their overall impression of their schools, major concerns facing the schools, possible
solutions to the problems, and general thoughts. They were also questioned about their opinions of
the other school district, the advantages or disadvantages of the proposed annexation or
consolidation.
Pawnee Community Unit School District #1
Five school board representatives were interviewed from the Pawnee CUSD #1.
The school board is in support of discussing options on the proposed consolidation with
Divernon. They also offered a solid insight into program and course offerings that make up a
successful school district. While there are some areas of curricular offerings that they would like to see
expanded, they feel that students are being offered a solid program, that students are doing well both
in school and after they graduate, and that students are taking advantage of the opportunities already
offered to them. They are confident in the education students are receiving and are proud of student
accomplishments. Because of the size of the district, students needs can be met individually. Board
members emphasized that a cohesive, supportive community has been a strength for the schools.
Students and members of the community feel a sense of ownership in what is happening in the school
district.

175
When asked about the perceptions of a merger, this question was addressed by discussing
community perceptions and their own personal interpretation. Some board members commented that
“selling” the merger to the community is a concern. In a past survey it was reported that the community
responses were fairly evenly divided when looking at consolidation or raising taxes to maintain the
current district. Others commented that some community members fear the loss of control in the two
towns that make up the current district. Board members stated that if the merger is presented to the
community as the best plan for the students, it will be more successful.
Based on their personal interpretation of the issue, four members stated that they could vote in
support of a merger with the following reason: if the merger benefits students and is the best for the
district, they are supportive. One board member is open to considering a merger option and feels more
information is needed and will wait until the report is given. The issue of what is best for the
communities and students surfaced several times in the conversation. This group appears to be more
determined to make the decision based on the improvement of academic programs in a merger with
Divernon.
Throughout their discussion, this board felt they need specific information on the following
items:
1. Will a merger improve curricular offerings?
2. How will transportation issues be resolved?
3. How will School Board representation be handled?
4. How will the Balanced-Calendar issue be handled?
5. How will past debt be addressed? Who is responsible?

176
Divernon Community Unit School District # 13
A total of seven representatives from the school board were interviewed at the school site and by
telephone.
The seven board members interviewed agreed with most of the comments made by others in
regard to the strengths of the district. Strong support was expressed for their school district, staff, and
programs being currently offered. They believe that they are providing a solid curriculum to their
students. Perceived strengths included financial stability, well-maintained facilities, strong community
support, and good working relationship among teachers, administrators, and school board.
Board members perceptions of a merger were again framed by discussing community
perceptions and personal interpretation. Some members predicted that convincing the community of
the benefits of a merger may not be easy because they feel that some community members may not
want the town to grow. Again, board members believed that if the merger were presented to the
community as the most positive plan for the students, it would be more successful. They also felt that
economic benefits would be positive for all communities involved. The possibility of further housing
development could more readily occur with land availability in a newly formed school district.
Five board members stated that, in general, they could vote in support of a merger as long as it
benefits students and is the best for the district. The issue of what is best for the communities and
students came out several times in the conversation. This group appears to understand the need for
future economic growth in order to maintain and improve programs, facilities, and curricular offerings.
This board would like consideration given to the high school programs being offered in
Divernon.
Summary
As you can see, there are varying opinions on the merger issue, but many common points as
well. From the consultants viewpoint, based on the curriculum analysis and test scores from both

177
communities, the compatibility would be very high in bringing very good students together from both
communities. All students would benefit, as more students will help secure the number of students
needed to continue and “grow” academic programs necessary in preparing youth for future study at
colleges and universities and the world of work.
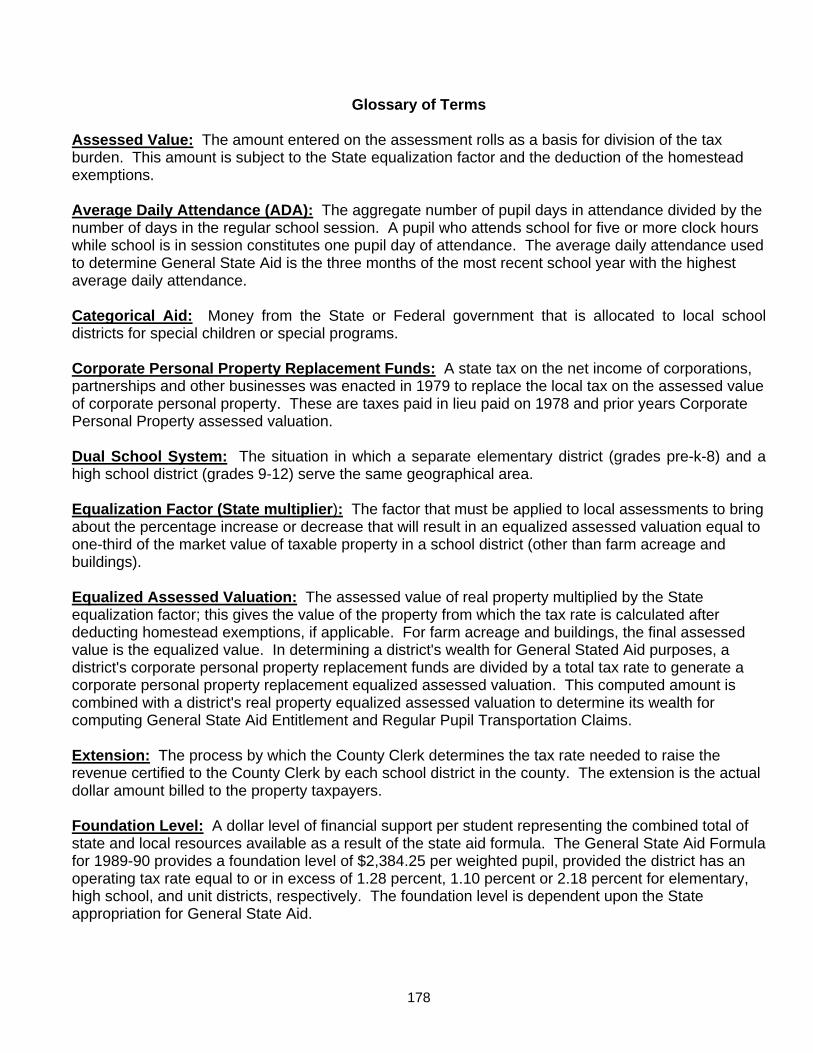
178
Glossary of Terms
Assessed Value: The amount entered on the assessment rolls as a basis for division of the tax burden. This amount is subject to the State equalization factor and the deduction of the homestead exemptions. Average Daily Attendance (ADA): The aggregate number of pupil days in attendance divided by the number of days in the regular school session. A pupil who attends school for five or more clock hours while school is in session constitutes one pupil day of attendance. The average daily attendance used to determine General State Aid is the three months of the most recent school year with the highest average daily attendance. Categorical Aid: Money from the State or Federal government that is allocated to local school districts for special children or special programs. Corporate Personal Property Replacement Funds: A state tax on the net income of corporations, partnerships and other businesses was enacted in 1979 to replace the local tax on the assessed value of corporate personal property. These are taxes paid in lieu paid on 1978 and prior years Corporate Personal Property assessed valuation. Dual School System: The situation in which a separate elementary district (grades pre-k-8) and a high school district (grades 9-12) serve the same geographical area. Equalization Factor (State multiplier): The factor that must be applied to local assessments to bring about the percentage increase or decrease that will result in an equalized assessed valuation equal to one-third of the market value of taxable property in a school district (other than farm acreage and buildings). Equalized Assessed Valuation: The assessed value of real property multiplied by the State equalization factor; this gives the value of the property from which the tax rate is calculated after deducting homestead exemptions, if applicable. For farm acreage and buildings, the final assessed value is the equalized value. In determining a district's wealth for General Stated Aid purposes, a district's corporate personal property replacement funds are divided by a total tax rate to generate a corporate personal property replacement equalized assessed valuation. This computed amount is combined with a district's real property equalized assessed valuation to determine its wealth for computing General State Aid Entitlement and Regular Pupil Transportation Claims. Extension: The process by which the County Clerk determines the tax rate needed to raise the revenue certified to the County Clerk by each school district in the county. The extension is the actual dollar amount billed to the property taxpayers. Foundation Level: A dollar level of financial support per student representing the combined total of state and local resources available as a result of the state aid formula. The General State Aid Formula for 1989-90 provides a foundation level of $2,384.25 per weighted pupil, provided the district has an operating tax rate equal to or in excess of 1.28 percent, 1.10 percent or 2.18 percent for elementary, high school, and unit districts, respectively. The foundation level is dependent upon the State appropriation for General State Aid.

179
Joint Agreement and/or Cooperative: An educational program or programs in which two or more local education agencies and/or eligible institutions of higher education agree to participate by uniting efforts in accordance with a written agreement and by designating a fiscal and legal agent. Levy: The amount of money a school district certifies to be raised from the property tax. Operating Expense Per Pupil: The gross operating cost of a school district (excepting summer school, adult education, bond principal retired, and capital expenditures) divided by the average daily attendance for the regular school term, Operating Tax Rate: A school district's total tax rate less the tax rates for bond and interest, rent, and vocational and junior colleges. Districts may include tax rates extended for the payment of principal and interest on bonds issued for Fire Prevention, Safety, Environmental, Energy, and Working Cash at the rate of .05 percent per year for each purpose or the actual tax rate extended, whichever is less. Per Capita Tuition Charge: The amount of local school district charges as tuition to nonresident students as defined by Section 18-3 of The School Code of Illinois. This amount represents expenditures from local taxes and common school fund monies and is generated by deducting revenues for various state categorical programs, local user fees, and federal receipts from the operating expenses. The divisor is the average daily attendance during the regular school term. Regional Superintendent: The chief school officer for the county or counties that comprise an educational service region. The Regional Superintendent exercises supervision and control over school districts and cooperatives within that region. There are 57 Regional Superintendents in Illinois. State Aid Formulas: The formulas legislated by the General Assembly for apportioning General State Aid and certain categorical aids. Tax Effort: The extent to which a local school district levies local taxes for schools. Tax-Rate Limit: The tax-rate limit is the maximum tax rate that the county clerk may extend. Illinois law authorizes maximum tax rates without referendum, but districts may increase tax rates, within limits, subject to voter approval. A limited number of tax rates exist without a tax-rate limit. Unit District: A school district that encompasses all grade level (Pre-K-12). A term used interchangeably with a 12-grade district. Weighted Pupils: General State Aid is provided to districts in Illinois based upon average day attendance (ADA). The ADA figure used is subject to the use of weights and adjustments designed to enhance funding levels for pupils with varying educational needs. In the General State Aid law, grade Pre-K-6 pupils are weighted 1.00, grade 7-8 pupils are weighted 1.05, and grade 9-12 pupils are weighted 1.25. These weightings provide a Weighted Average Daily Attendance (WADA) figure. Pupils from families with low incomes provide an additional type of weighting to attendance, one that adjusts average attendance upwards. The additional formula adjustment for low-income pupils in a district ranges from zero to a maximum of .625. In combination, the grade-level weighting and the poverty count adjustment create a district's "CWADA" or Chapter I Weighted Average Daily Attendance figure.
Related Documents